sensing data quality in sensor-based data - a department ... · • example 1: – the mdot sha...
TRANSCRIPT

Sensing Data Quality in Sensor-Based Data- A Department of Transportation
Perspective
Subrat MahapatraMaryland DOT State Highway Administration
Bureau of Labor StatisticsData Quality for Statistical Products Workshop
December 1, 2017

21st Century Transportation Trends Changing Customer Needs
and Expectations Focus on Operations,
Efficiency & Reliability Freight Movement/ Economy Technological Innovations
(CV/AV, Ridesharing Apps) Transportation/ Environment/
Economy/ Health Linkages Performance Management &
Communicating Performance Big Data Innovations
22
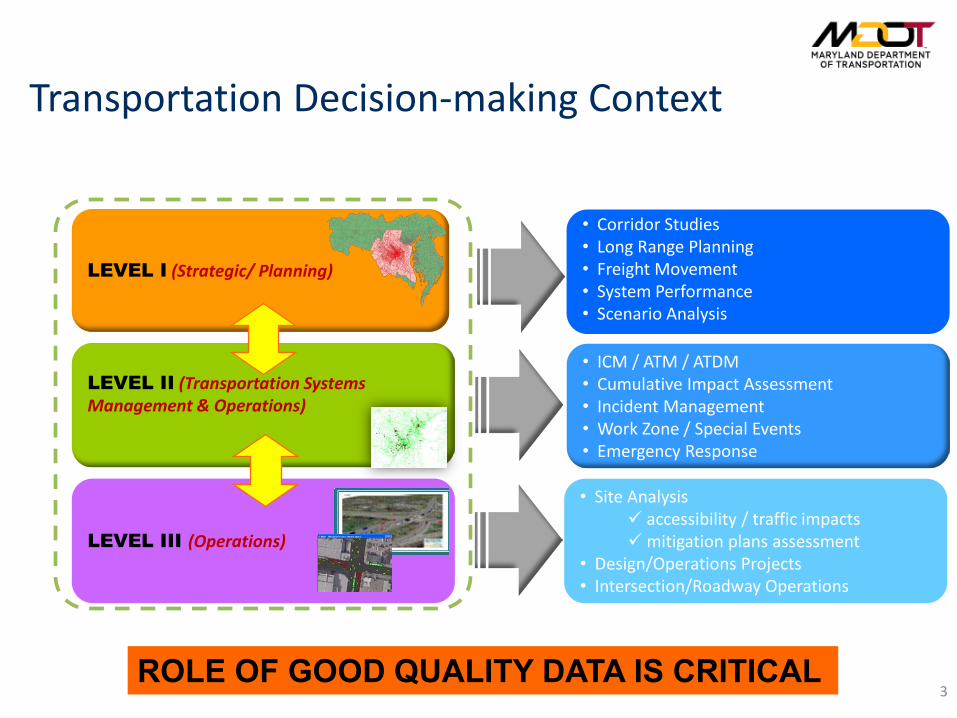
Transportation Decision-making Context
LEVEL III (Operations)
LEVEL II (Transportation Systems Management & Operations)
LEVEL I (Strategic/ Planning)
• Corridor Studies• Long Range Planning• Freight Movement• System Performance• Scenario Analysis
• ICM / ATM / ATDM• Cumulative Impact Assessment• Incident Management• Work Zone / Special Events• Emergency Response
• Site Analysis accessibility / traffic impactsmitigation plans assessment
• Design/Operations Projects• Intersection/Roadway Operations
33
ROLE OF GOOD QUALITY DATA IS CRITICAL

Data Shaping Transportation Decision-making
4
DATA GOVERNANCE PRINCIPLES
ACCURACY, RELEVANCY, TIMELINESS, ACCESSIBILITY, COHERENCE & COMPATIBILITY

Structured vs. Unstructured Data• >90% of the data used at MDOT – (planning, design &
operations) is highly structured, meaning…
– It is machine-readable– It can be easily stored in relational databases– It is standardized in some format– It follows agreed upon rules
5
Sherpasoftware.com

Data Quality/ Architecture & Governance for Mobility Data
6
Source: FHWA Data Business Plan – MDOT PilotStructured Data Realm
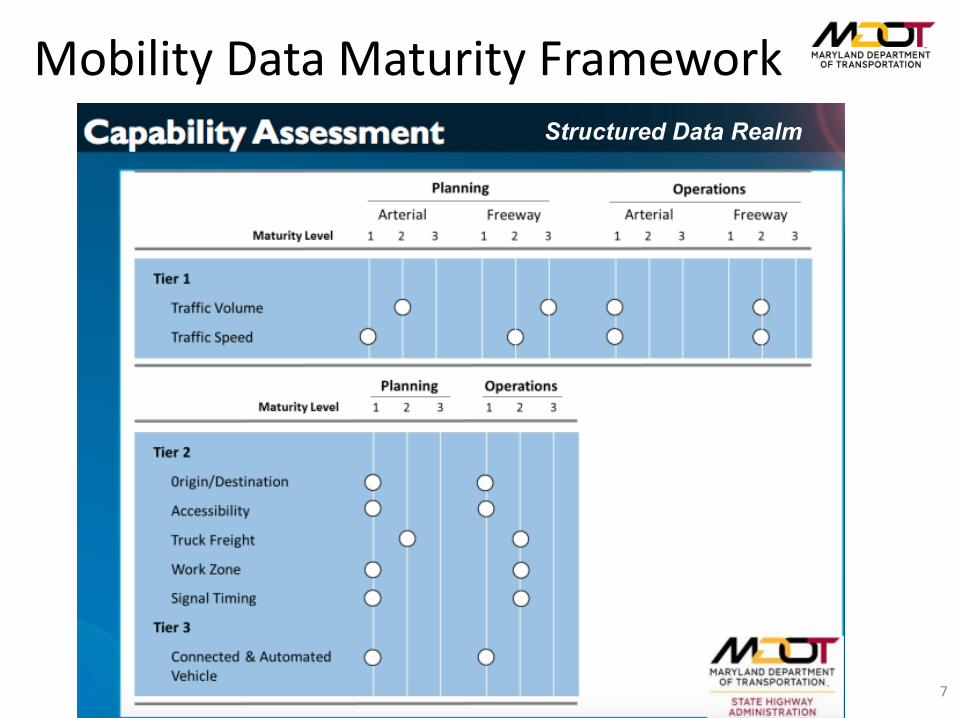
Mobility Data Maturity Framework
7
Structured Data Realm

Portable Sensors: Vehicular Volumes
Type:• Intersection Turning Movements
(includes bike/ped)• Mainline Traffic Volumes• Truck Percentages (Vehicle Class)Source:• Manual• Pneumatic Tube counts• Radar-based counts• Infrared Sensors• Video-based counts
Infrared
Induction Loops
Microwave Radar
Video Image Processing
STRUCTURED DATA MOSTLY USED FOR PLANNING/ DESIGN
8

Portable Sensors: Travel Times and Speeds
Type:• Vehicle Travel Times & Speeds
by Segment• Point SpeedsSource:• Floating Car Travel Runs• Bluetooth & Wi-Fi O/D• Hi-Def Signals• ATRs/ Roadside sensors (e.g.
side-fire)• Private Sector Vehicle Probe
Data
STRUCTURED DATA MOSTLY USED FOR PLANNING/ OPERATIONS
9

Fixed Point ITS Infrastructure/ Sensors
• CCTV Cameras:307 – controllable by CHART800+ accessible to CHART asview-only
• Dynamic Message Signs(DMS): 218
• Remote Traffic MicrowaveSensor (RTMS): 234
• Automatic Traffic Recorder(ATR): 90
• 90% State owned signalshave video and remoteaccess to video feed
STRUCTURED/ UNSTRUCTURED DATA MOSTLY USED FOR OPERATIONS
10

87 Permanent Automatic Traffic Recorders (ATRs)
8800+ Program (Coverage) Counts on 3 & 6 year cycle
1400 Special Project Counts per year
Fixed Point/ Portable Sensors for Traffic CountsSTRUCTURED DATA MOSTLY USED FOR PLANNING/ DESIGN
11

Maintaining Data Quality of Structured Data
• Data polled over-night
Data Collection
• Daily• Automated validation rules• TMS review of failing sites
• Monthly• Class and speed data variation by lane by week
• Annual• Evaluate seasonal variation• Compare the data to portable count
Validation• Verify data collected for accuracy• Onsite review and resolve, of issues identified in
the office• Speed checks• Visual inspections road condition in and around
sensors• Test and inspect sensors for proper functionality
Quality Control
• Upkeep Sensors• Reconstruct ATRs infrastructure• Contracts
Maintenance
RULE NUMBER RULE NAME
Rule 1 Consecutive Hours Rule 2 Directional Split Rule 3 Standard DeviationRule 4 Standard hours of collection
Rule 5 Lane Volume of zero
DESCRIPTIONConsecutive Hours should not have the same volume, especially 0 volumesThe directional volumes should be within a 60%-40% range
should be within a 60%-40% rangeEach data file should have complete day (24 Hours) of dataInterstate and Primary Arterial Routes should not have zero volumes for any given hour
Automated Rule based Validations
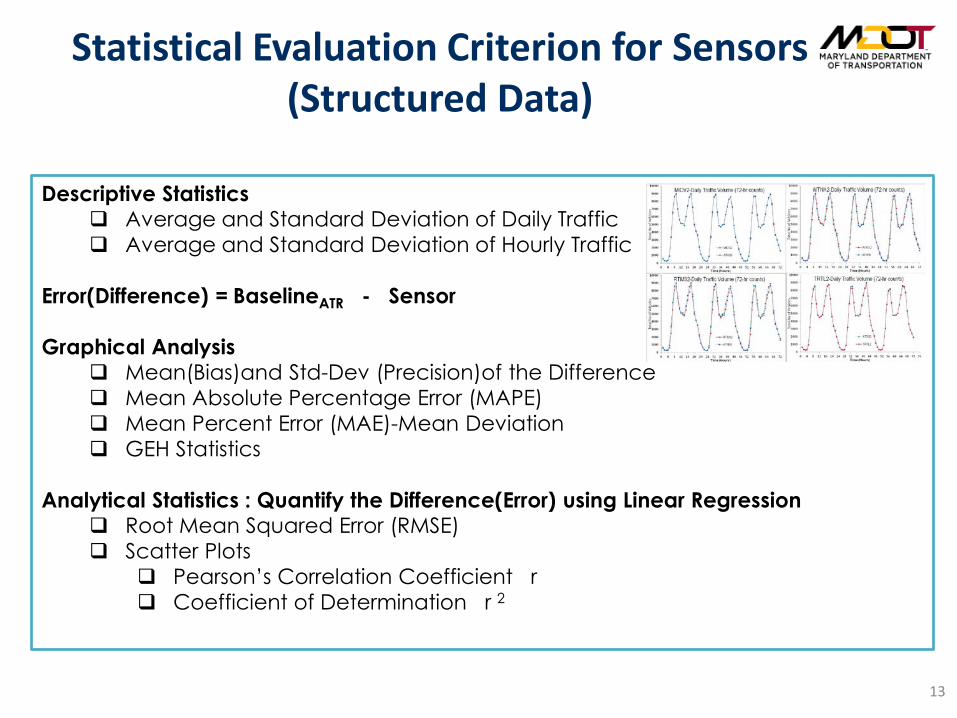
Descriptive Statistics Average and Standard Deviation of Daily Traffic Average and Standard Deviation of Hourly Traffic
Error(Difference) = BaselineATR - Sensor
Graphical Analysis Mean(Bias)and Std-Dev (Precision)of the Difference Mean Absolute Percentage Error (MAPE) Mean Percent Error (MAE)-Mean Deviation GEH Statistics
Analytical Statistics : Quantify the Difference(Error) using Linear Regression Root Mean Squared Error (RMSE) Scatter Plots
Pearson’s Correlation Coefficient r Coefficient of Determination r 2
Statistical Evaluation Criterion for Sensors(Structured Data)
13
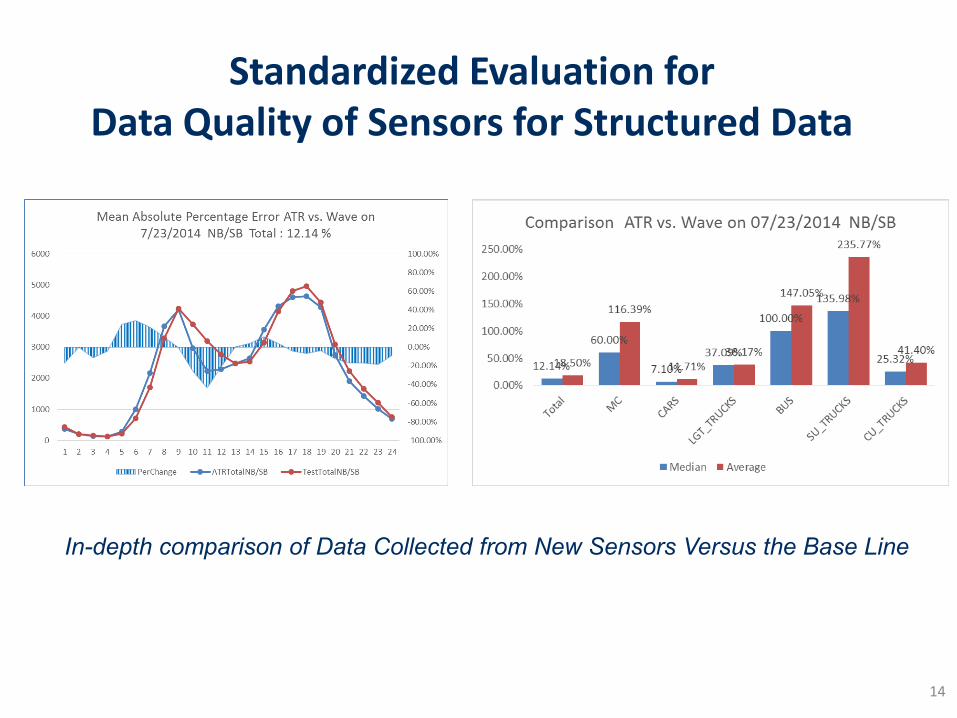
Standardized Evaluation forData Quality of Sensors for Structured Data
In-depth comparison of Data Collected from New Sensors Versus the Base Line
14
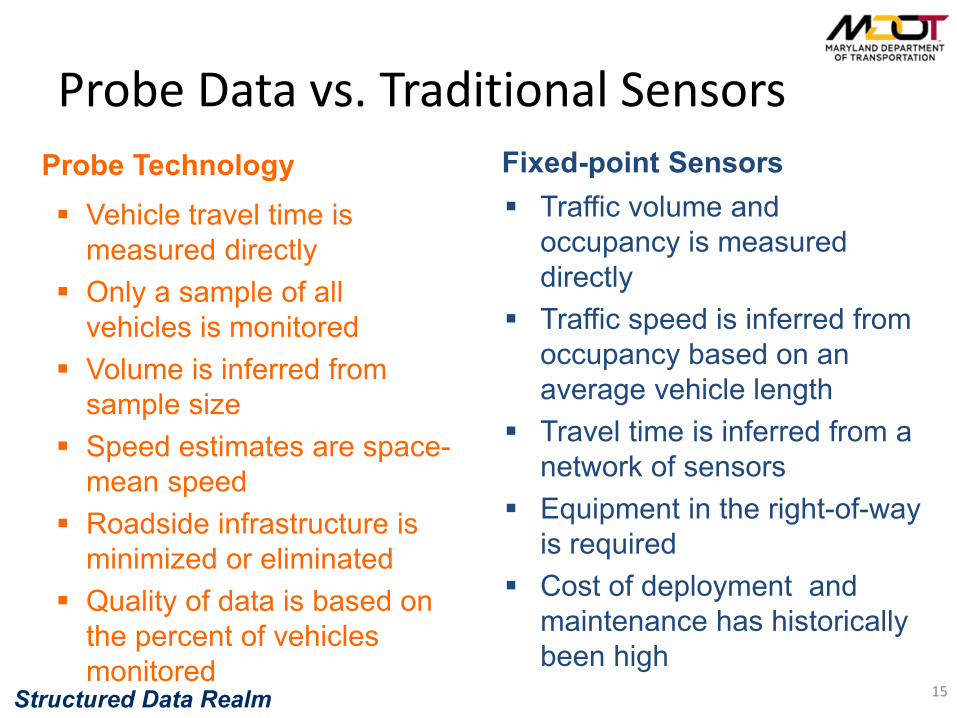
Probe Data vs. Traditional SensorsProbe Technology Vehicle travel time is
measured directly Only a sample of all
vehicles is monitored Volume is inferred from
sample size Speed estimates are space-
mean speed Roadside infrastructure is
minimized or eliminated Quality of data is based on
the percent of vehicles monitored
Fixed-point Sensors Traffic volume and
occupancy is measured directly
Traffic speed is inferred from occupancy based on an average vehicle length
Travel time is inferred from a network of sensors
Equipment in the right-of-way is required
Cost of deployment and maintenance has historically been high
15Structured Data Realm

Outsourced Freeway Probe Data Quality• Accuracy of probe data on freeways for all major
vendors has been extensively tested. • Probe data can be safely used for real-time applications,
planning and performance measurement on freeway network.
• Freeway validation studies show that probe data exhibits latency– Average latency is 4.4 minutes and varies by vendor– Latency may impact real-time applications
16Structured Data Realm

Outsourced Arterial Probe Data Quality
• Unlike freeways, quality of probe data varies by number of lanes, AADT, signal density, access points, speed limit, median access, and major junctions are important factors.
• Probe data quality most correlated to signal density• Accuracy is anticipated to improve with increased probe
density
17Structured Data Realm

Emerging Performance Measures
• High-resolution probe and Smart Signals– Percent Arrivals on Green– Capacity Utilization at
Intersections– Travel Time Reliability
• Origin/ Destination Data – Cellular Data– Vehicle Probes/ OEM Data– Smart Phone/ Wi-fi/ Bluetooth
• Connected/ Automated Data18Structured Data Realm

Informing Transportation Investment DecisionsIntegration of Geo-spatial Analysis and Trend Analysis of various data layers:- Safety- Mobility- Asset Conditions- Environmental- Accessibility & Economic Opportunities
With Analytical Tools and Applications to inform decisions at multiple levels:- Strategic- Long range planning- Corridor Studies and Project Level decisions
What are the trends?
What is MDOT doing?
What is the outcome?
19Structured Data Realm

Unstructured Data
20
http://www.c1-partners.com/blog/

Examples of Unstructured Data (not just in Transportation)
1. Writing– reports, emails, meeting minutes, narrative weather
reports, etc.2. Social Media
– Scanning streams to detect real time information such as incidents or public sentiment about MDOT.
3. Natural Language– Any form of audio recordings—like voicemail, interviews,
radio communications, etc. 4. Photographs & Video
– Photographs of MDOT assets, real-time CCTV video, etc.
5. Communications– Scanning communications such as emails to detect
spam.6. Science
– Looking for patterns in interstellar radio messages in order to discover intelligent life.
7. Health– Analysis of x-ray images for signs of disease.
21
http://bigdata.black/
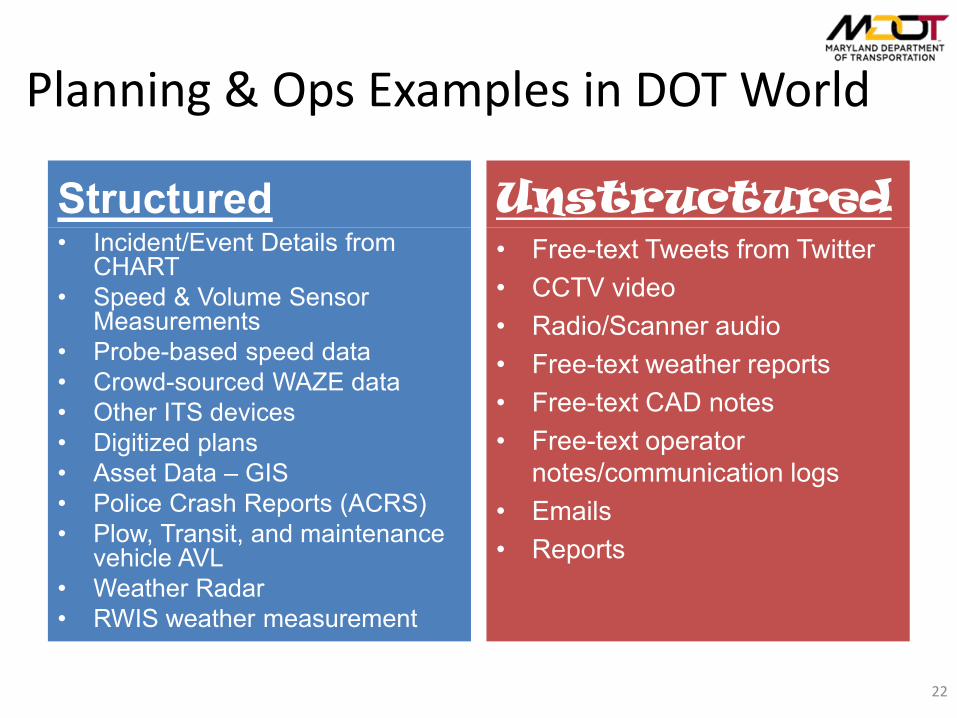
Planning & Ops Examples in DOT World
Structured• Incident/Event Details from
CHART• Speed & Volume Sensor
Measurements• Probe-based speed data• Crowd-sourced WAZE data• Other ITS devices• Digitized plans• Asset Data – GIS• Police Crash Reports (ACRS)• Plow, Transit, and maintenance
vehicle AVL• Weather Radar• RWIS weather measurement
Unstructured• Free-text Tweets from Twitter• CCTV video• Radio/Scanner audio• Free-text weather reports• Free-text CAD notes• Free-text operator
notes/communication logs• Emails• Reports
22

Unstructured is Decreasing in DOT Ops
• Example 1:– The MDOT SHA CHART system used to include MANY free-text
fields about • The location of an incident
– Exit 23 vs. X-23 vs. Ex. 23 vs Ext twenty-three vs. Exit near McDonald’s• The type of incident
– Disabled Vehicle vs. Dsbld vhcl vs DV vs. Disabled• Which responders were notified and/or responded
– Fire Company 23 vs. Howard County Fire vs. Ladder Truck 23 vs. F23• Which Lanes are closed
– Ln 1 vs Lane 1 vs. Right lane vs. rt. Ln. – Today, nearly every field is automated or populated with drop-
downs—making it extremely easy to run performance reports that analyze the effectiveness of CHART
23

Unstructured is Decreasing in DOT Ops
• Example 2:– Maryland Police Crash Reports used to be hand-written field
reports that were later painstakingly digitized by data entry personnel.
• This led to significant data entry errors due to misinterpretation of notes, bad hand-writing, etc.
• This also meant that data availability and analysis were delayed by a year or more due to the amount of time it took to manually digitize all of the reports
– The transition over to digital police crash reports with drop-down field entry through the ACRS platform has significantly reduced data lag and errors.
24

Some Unstructured Data Persists
• CAD notes can still contain significant text
• CHART continues to deploy fixed and mobile CCTV cameras that provide valuable insights in the moment, but are difficult to query and/or analyze by machines
• Lengthy research reports are still produced
• Audio “data” from radio systems persists
25

The Impact?
• Unstructured data in transportation is largely ignored for reporting and analysis purposes because of the time and cost needed to make lasting sense of it.
• Unstructured data may still be useful “in the moment” for operations and other decision making, but it is rarely archived in a meaningful/useful way.
• Structured data has been leveraged significantly by planning and operations communities for performance reporting and decision making because it is easier to work with and less prone to errors.
26
27
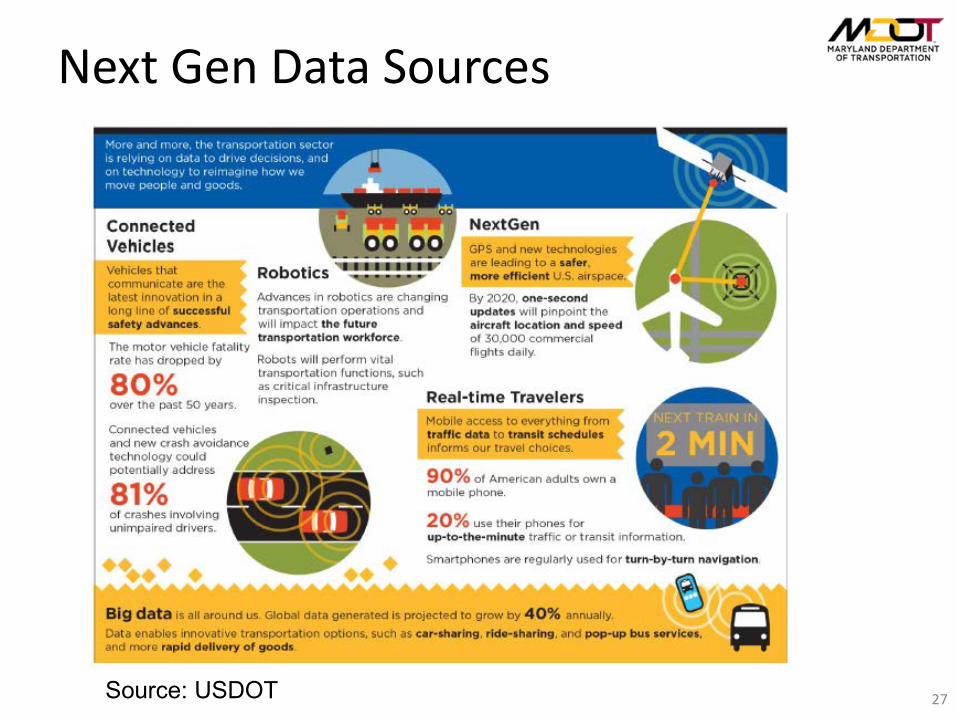
Next Gen Data Sources
Source: USDOT
28
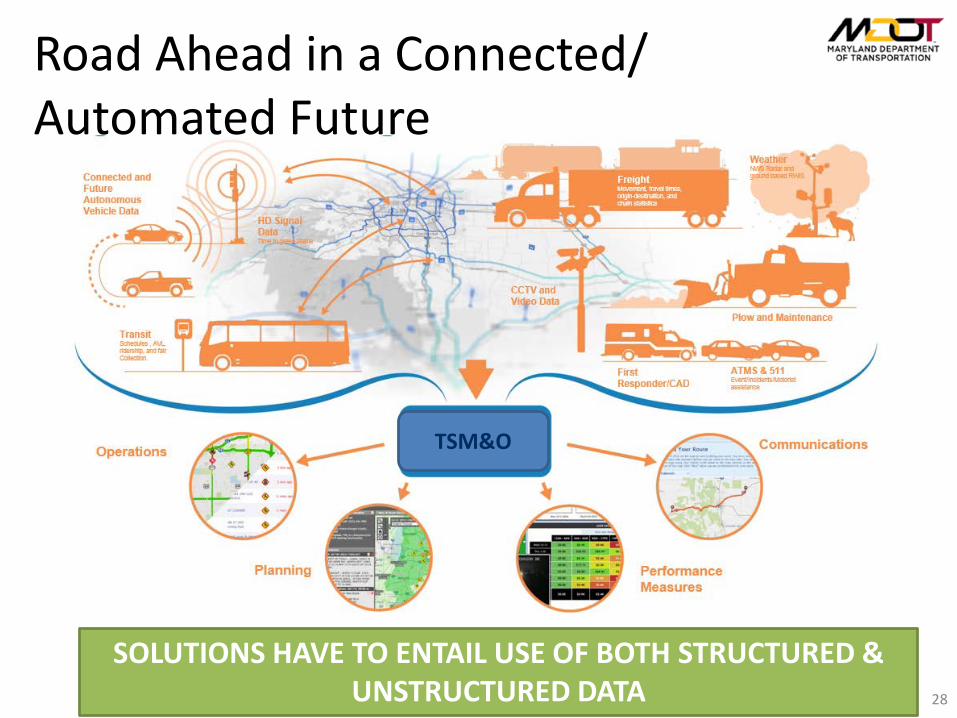
TSM&O
Road Ahead in a Connected/ Automated Future
SOLUTIONS HAVE TO ENTAIL USE OF BOTH STRUCTURED & UNSTRUCTURED DATA

Role of Unstructured Data in DOT
• DOTs recognize the value but mainstreaming use is stillin infancy
• Planning and Communications team have startedlayering social media feeds in Story Maps
• Most of the use of Unstructured Data is ad-hoc
29
HUGE FOCUS ON CUSTOMER EXPERIENCE !!
UNSTRUCTURED DATA USE IS SEEN AS A KEY TO UNDERSTANDING THE CUSTOMER PERSPECTIVE.
IN SUMMARY…• It has taken a long time but we are witnessing traction
towards standardizing structured data for planning, operations and TSM&O.
• Data quality, collection procedures are getting better and agencies are considering data as an asset with multi-faceted uses.
• Focus has been on converting unstructured data to structured data for better decision-making
• DOTs recognize the value of UNSTRUCTURED DATA, but this remains an UNTAPPED OPPORTUNITY AREA !!
30
ROLE OF QUALITY DATA IS CRITICAL

Contact Information
31
Subrat MahapatraChief, Innovative Performance Planning DivisionOffice of Planning & Preliminary EngineeringMaryland DOT State Highway Administration
707 North Calvert StreetBaltimore, Maryland [email protected]