sensing and feedback for epidemiological modeling · sensing and feedback for epidemiological...
TRANSCRIPT
Sensing and Feedback for Epidemiological Modeling
Cross-Leveraging Sensors & Systems Models Kevin Stanley1
Nathaniel Osgood1,2
1Computer Science
2Associate Faculty Community Health & Epidemiology
and School of Public Health
University of Saskatchewan
Institute for Systems Science & Health 2011

Sensing and Feedback for Epidemiological Modeling
Cross-Leveraging Sensors & Systems Models Kevin Stanley1
Nathaniel Osgood1,2
1Computer Science
2Associate Faculty Community Health & Epidemiology
and School of Public Health
University of Saskatchewan
Institute for Systems Science & Health 2011
Outline • Motivations
• Sensor Platforms
• “Greater than the sum of its parts”: Synergizing models & sensor data
• Vignettes – The role of contact characteristics in the spread of pandemic
influenza (ABM & sensor data)
– “Self-correcting” models: Synergizing models & ongoing measurement data (SD & sensor data)
– Inferring pathways of infection spread over contact networks (SNA & sensor data)
• Conclusions

Motivating Observations • Many uses of computational models involving
human health and behavior require copious data
• Effective selection, throttling, fusion, filtering, interpretation of sensor data is aided by models
• Rich sensor platforms are increasingly embedded in commodity consumer electronic devices – These sensors are predominantly designed for usability
(e.g. to change screen orientation, adjusting volume, transferring data), but can often be repurposed
– Cross-linking of sensor data is readily accomplished
• We are immersed in a growing cacophony of wireless communication signals – WiFi, Bluetooth, GPS, GPRS/GSM, Infrared, RFID, etc.
Outline
Motivations • Sensor Platforms • “Greater than the sum of its parts”: Synergizing models
& sensor data • Vignettes
– The role of contact characteristics in the spread of pandemic influenza (ABM & sensor data)
– “Self-correcting” models: Synergizing models & ongoing measurement data (SD & sensor data)
– Inferring pathways of infection spread over contact networks (SNA & sensor data)
• Conclusions
iEpi
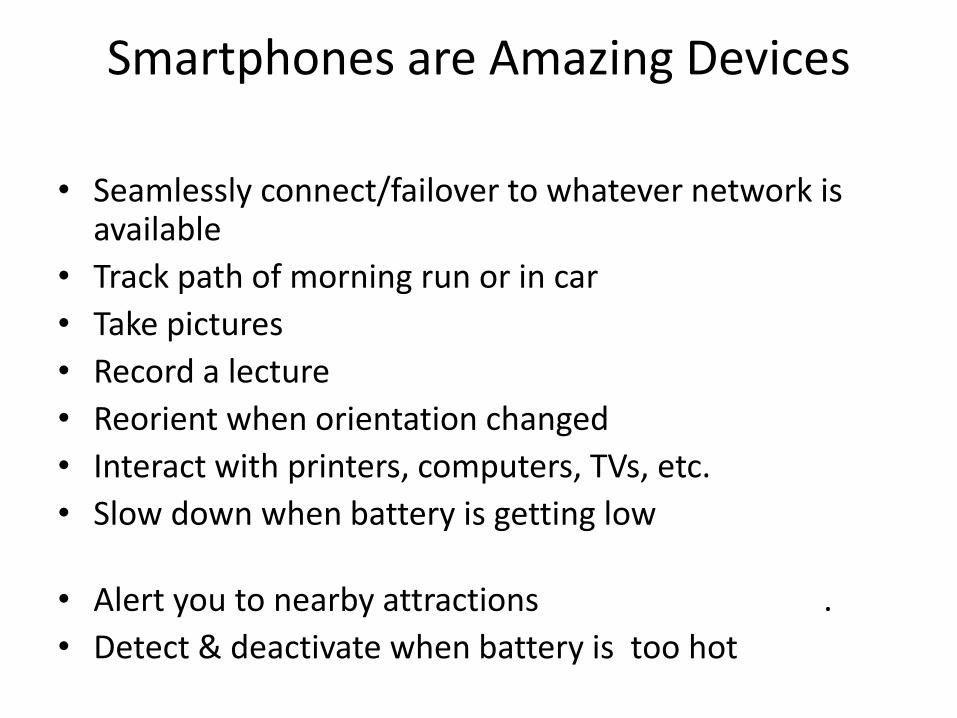
Smartphones are Amazing Devices
• Seamlessly connect/failover to whatever network is available
• Track path of morning run or in car
• Take pictures
• Record a lecture
• Reorient when orientation changed
• Interact with printers, computers, TVs, etc.
• Slow down when battery is getting low
• Alert you to nearby attractions .
• Detect & deactivate when battery is too hot

Smartphones are Amazing Devices (Key Enabling Technology: Sensors)
• Seamlessly connect/failover to whatever network is available (WiFi/GPRS/GSM receivers)
• Track path of morning run or in car (GPS)
• Take pictures (Camera)
• Record a lecture (Microphone)
• Reorient when orientation changed (Accelerometers)
• Interact with printers, computers, TVs, etc. (Bluetooth)
• Slow down when battery is getting low (battery voltage)
• Alert you to nearby attractions (GPS & Internet access)
• Detect & deactivate when battery is too hot (battery temperature)

Generation 2 Platform: iEpi • Google Android Smartphone
– Customized version of Android 2.1
– Commodity hardware (HTC) => Lower price
• Multiple sensor modalities (including surveys)
• Episodic bursts of data collection optimize battery life
• Richly functional smartphone – external incentives to carry &
chart device
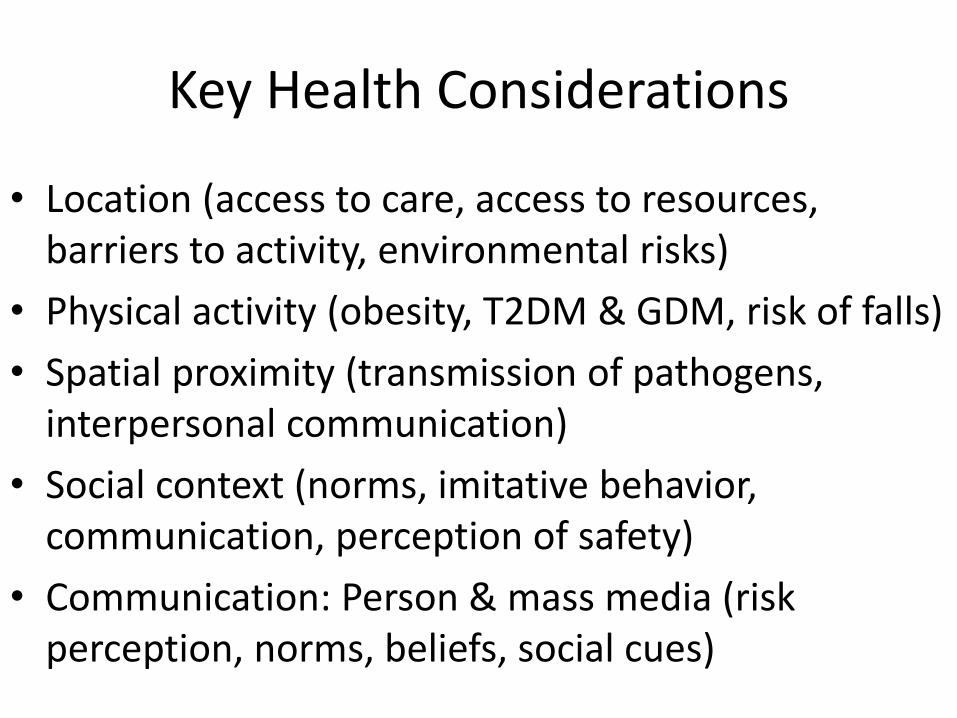
Key Health Considerations
• Location (access to care, access to resources, barriers to activity, environmental risks)
• Physical activity (obesity, T2DM & GDM, risk of falls)
• Spatial proximity (transmission of pathogens, interpersonal communication)
• Social context (norms, imitative behavior, communication, perception of safety)
• Communication: Person & mass media (risk perception, norms, beliefs, social cues)
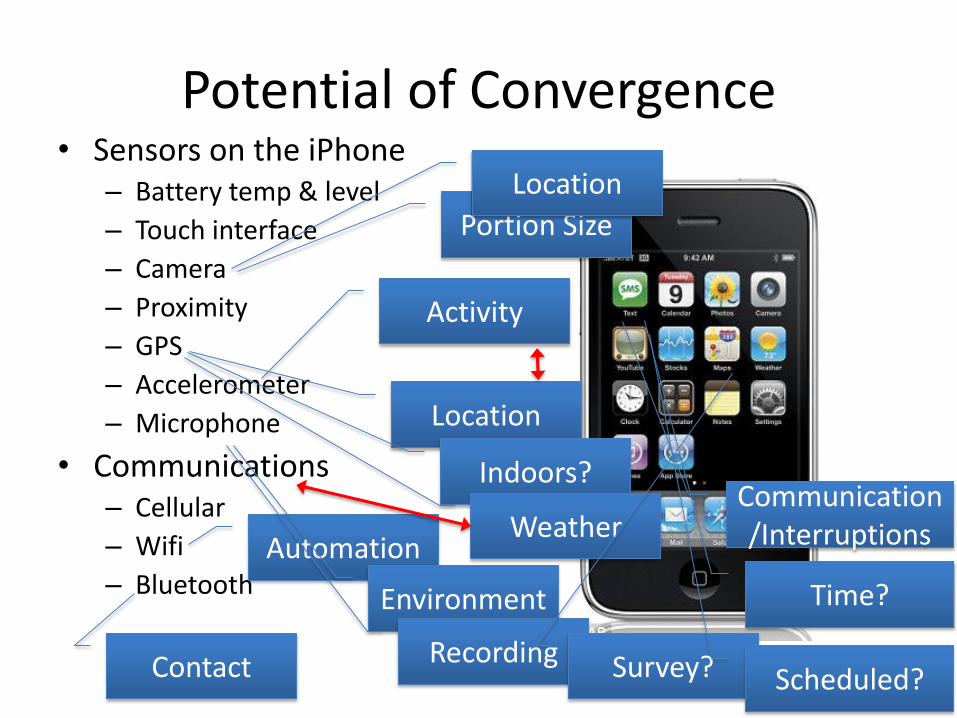
Potential of Convergence • Sensors on the iPhone
– Battery temp & level
– Touch interface
– Camera
– Proximity
– GPS
– Accelerometer
– Microphone
• Communications – Cellular
– Wifi
– Bluetooth
Activity
Portion Size
Location
Automation
Location
Indoors?
Weather
Environment
Recording Survey?
Communication/Interruptions
Time?
Scheduled? Contact
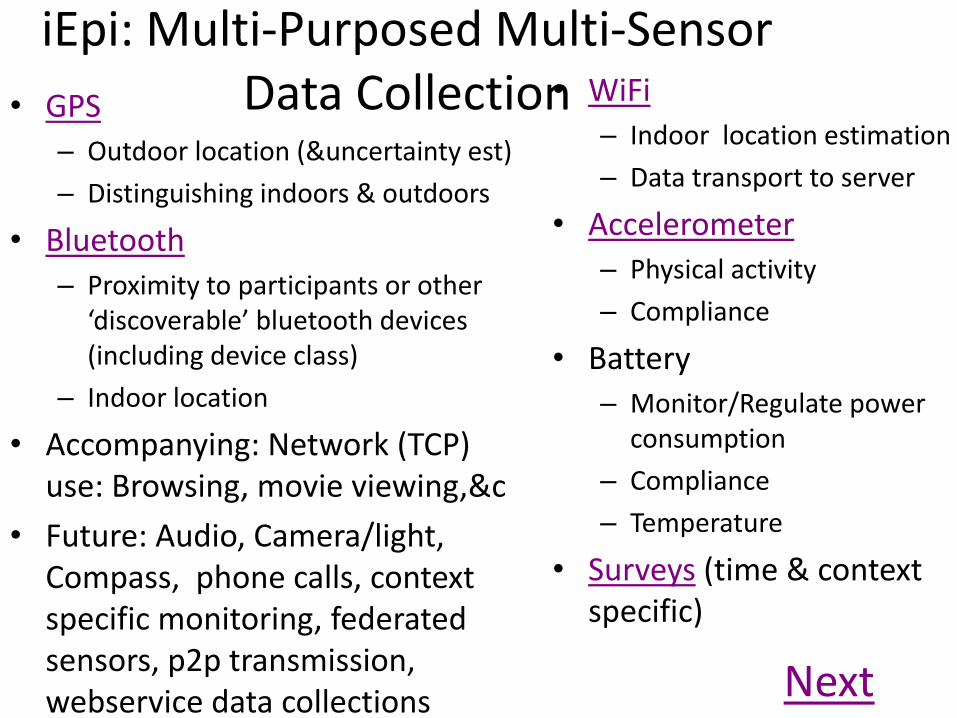
iEpi: Multi-Purposed Multi-Sensor Data Collection • GPS
– Outdoor location (&uncertainty est)
– Distinguishing indoors & outdoors
• Bluetooth
– Proximity to participants or other ‘discoverable’ bluetooth devices (including device class)
– Indoor location
• Accompanying: Network (TCP) use: Browsing, movie viewing,&c
• Future: Audio, Camera/light, Compass, phone calls, context specific monitoring, federated sensors, p2p transmission, webservice data collections
• WiFi
– Indoor location estimation
– Data transport to server
• Accelerometer
– Physical activity
– Compliance
• Battery
– Monitor/Regulate power consumption
– Compliance
– Temperature
• Surveys (time & context specific)
Next

Example of GPS Data Sequence
Back

Daily Average Distinct Bluetooth Devices Encountered by Participants
0
5
10
15
20
25
30
35
40
1 3 5 7 9 11 13 15 17 19 21 23 25 27 29 31 33 35 37 39 41
Participants (Ordered by Count)
Co
un
t o
f D
evic
es
(Dis
tin
ct o
ver
Stu
dy
Pe
rio
d)

Bluetooth Contacts by Hour of Day
0
20000
40000
60000
80000
100000
120000
140000
160000
180000
1 2 3 4 5 6 7 8 9 10 11 12 13 14 15 16 17 18 19 20 21 22 23 24
Tota
l BT
Co
un
ts o
ver
Stu
dy
Hour of Day
Hour of Day

Participants (Red) contacts with All Bluetooth Contacts (Blue) over 1 day

All Bluetooth Contacts over 1 Week
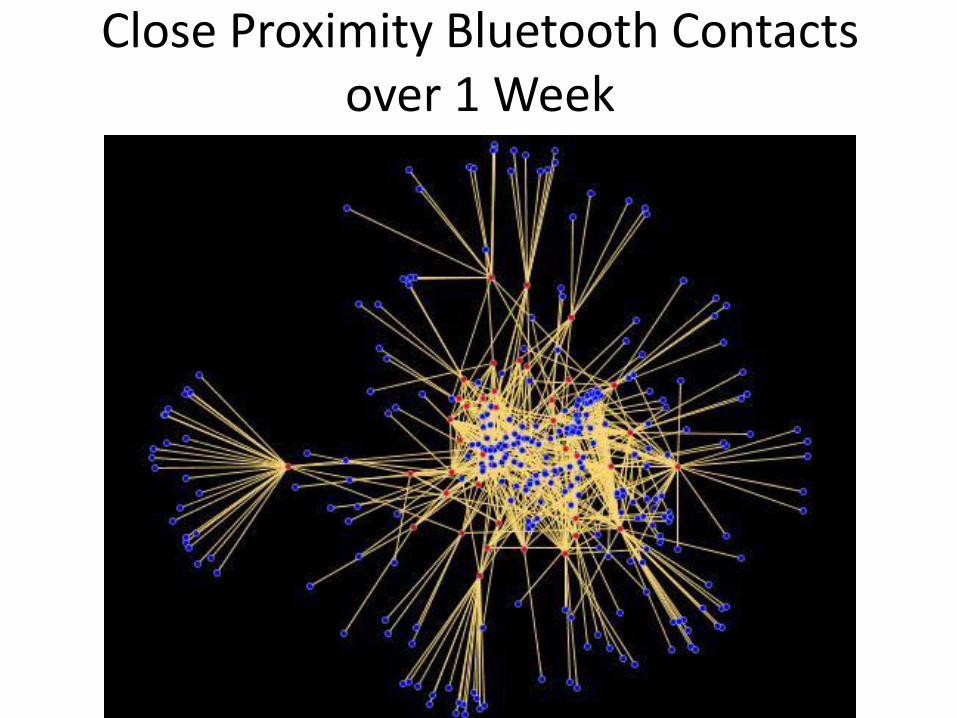
Close Proximity Bluetooth Contacts over 1 Week
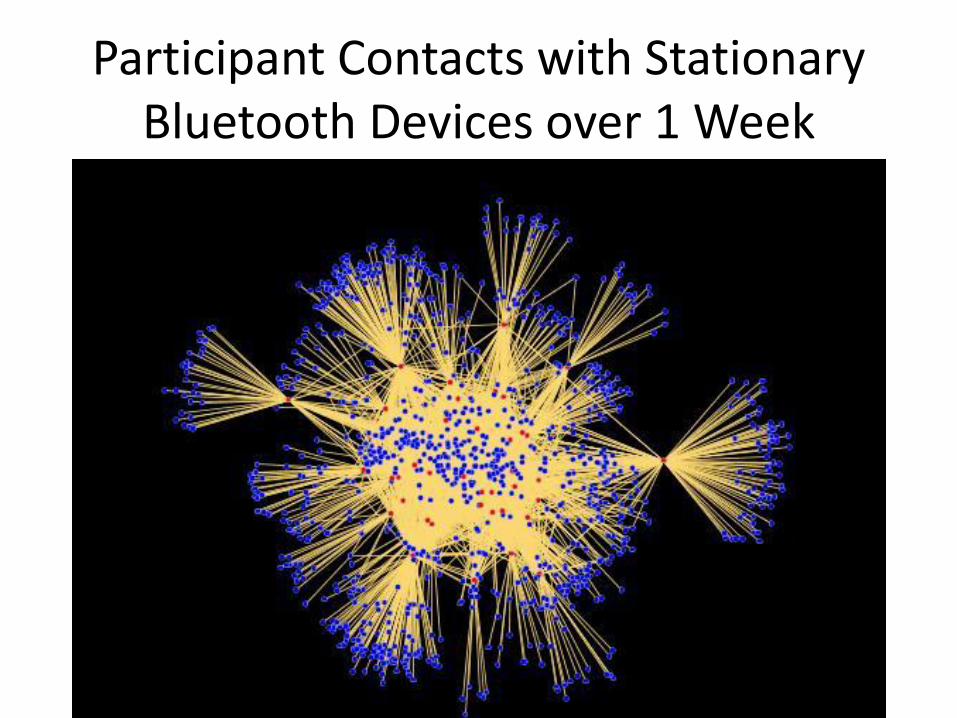
Participant Contacts with Stationary Bluetooth Devices over 1 Week
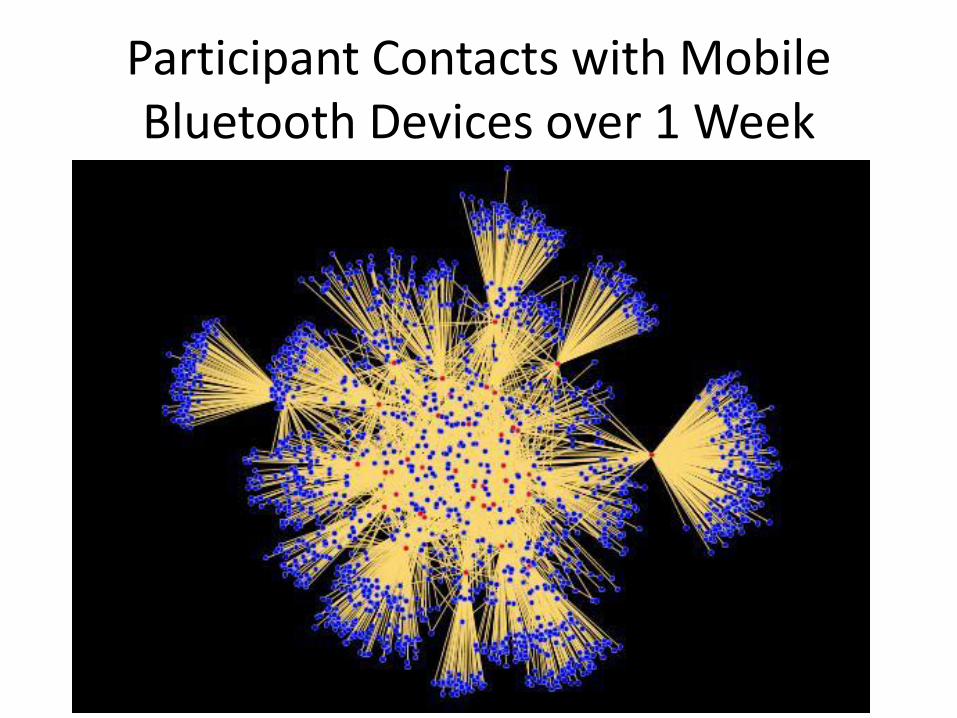
Participant Contacts with Mobile Bluetooth Devices over 1 Week
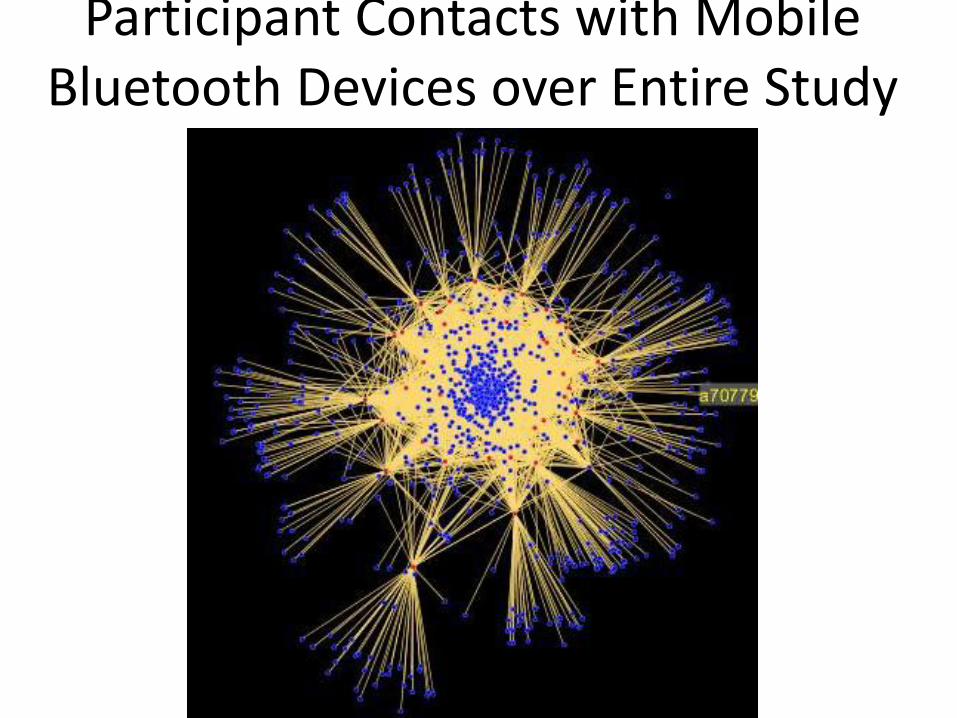
Participant Contacts with Mobile Bluetooth Devices over Entire Study

Bluetooth Contacts
Histogram: Contact count with different devices
Histogram: Signal Strength
Weaker Signal => More distant
Back Distinct Bluetooth Devices

Daily Contact with Distinct WiFi Routers
0
20
40
60
80
100
120
140
160
1 2 3 4 5 6 7 8 9 101112131415161718192021222324252627282930
Average Distinct WiFi MAC Addresses Encountered by Participant per Day
Distinct devices

WiFi/Bluetooth As a Location Marker
• Presence & strength of one or more WiFi or bluetooth signal can indicate location (cf Skyhook)
– “Trilateration” can identify location from these signal strengths
• Participants in a study will commonly pass through signals of hundreds of WiFi routers and discoverable Bluetooth devices e.g. in 1 month study in Saskatoon, participants saw approximately
– 19,000 distinct routers (range 554-4393/participant)
– 9700 distinct BT devices (range 242-1129/participant)

Indoor Localization
• Where am I (inside)?
– GPS unreliable
– Data exists from WiFi and BT devices • How do we use it?
• Sensor fusion techniques for managing error
Back

Accelerometer
Back

Surveys
Key Use: Disambiguation, Affect
Back

Cross-Linking of Sensor Data: Metcalf’s Law • Opportunities for cross-linking of sensor data =>
values rises as square of number of sensors
• Example cross linking (BT=Bluetooth): – Accelerometer/GPS (with GIS)/BT (how does physical
activity level change near parks? In high crime areas? How do these change around other people? weather?)
– BT/GPS/Wifi (estimates of contact location, understanding of social context/capacity of contacts)
– BT/Wifi/GPS (indoor & outdoor positioning)
– GPS & Accelerometer: Triggering more rapid measurement of accelerometer if moving quickly
– Triggered surveys and any sensor: Disambiguation

Potential of Convergence
• Sensors on the iPhone – Touch interface
– Camera
– Proximity
– GPS
– Accelerometer
– Microphone
• Communications – Cellular
– Wifi
– Bluetooth
Activity
Portion Size
Location
Automation
Location
Indoors? Weather/Fluwatch/etc.
Environment
Recording Survey?
Communication/Interruptions
Time?
Scheduled? Contact
Example: Importance of Place
• Incorporating place can lend understanding of
– Transmission of norms (cf Madan et al 2009/2010)
– Mobility patterns giving rise to contacts
– Resources that may be exploited by visitors
– Impact of environment
• On Risks (surface accumulation of pathogens)
• On behavior
– Character/capacity of interaction
– Status of users
– External parties

Density of Contact Durations Between Study Participants During a 1 Month Study

Finer Spatial Resolution

Example Questions that Can be Investigated Now: Epidemiology
• How do physical activity levels vary by proximity to parks? By social context? By neighborhood safety index?
• Which grocery stores do participants visit? And how often? How do they get there? With whom?
• How much time do particular family members spend together? Where do they spend this time?
• How (quickly) does a change in physical activity by parents affect kids’ activity levels?
• How (long) do socialization, mobility and eating patterns of newcomers differ from established residents?
• How often do participants visit restaurants? Which restaurants? With others, or alone?
• Where do participants get info (browsing/youtubing/skyping)

Example Questions that Can be Investigated Now: Health Services Delivery • How much time are nurses able to spend with
patients? How does this vary by shift?
• Is proper time being taken for handwashing?
• Where are nurses kept waiting in a facility?
• What sets of staff need to meet most frequently?
• Are patients being visited according to schedule?
• What areas are requiring most of the time of nurses & doctors?
Short-Term Extensions • Surveys triggered based on current & past context
• Calling behavior
• More flexible interface
• Data from peered bluetooth devices
– Weight, respiration & pulse sensors, galvanic skin response, etc.
• Proximity to an ‘on’ TV
• Barcode scanning
• Third-party opt-in
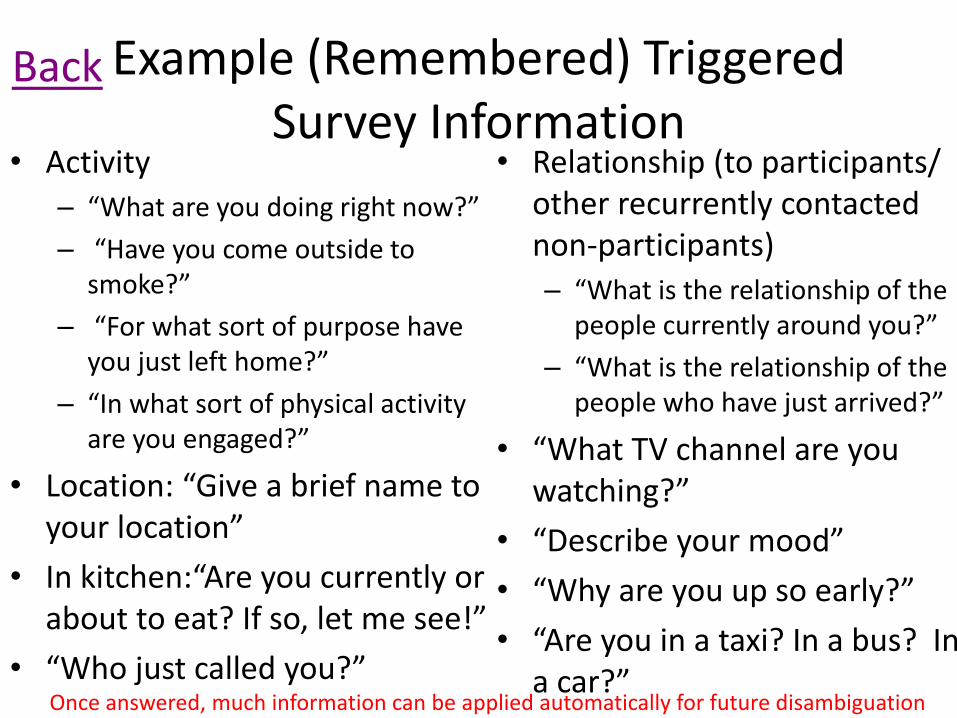
Example (Remembered) Triggered Survey Information
• Activity
– “What are you doing right now?”
– “Have you come outside to smoke?”
– “For what sort of purpose have you just left home?”
– “In what sort of physical activity are you engaged?”
• Location: “Give a brief name to your location”
• In kitchen:“Are you currently or about to eat? If so, let me see!”
• “Who just called you?”
• Relationship (to participants/ other recurrently contacted non-participants)
– “What is the relationship of the people currently around you?”
– “What is the relationship of the people who have just arrived?”
• “What TV channel are you watching?”
• “Describe your mood”
• “Why are you up so early?”
• “Are you in a taxi? In a bus? In a car?”
Once answered, much information can be applied automatically for future disambiguation
Back

Long Term Possibilities • Detailed stochastic mobility, activity, interaction models • Affect detection (voice/touch/keyboard) • Greater flexibility in query rates
– Contingent data collection – Model-informed adaptive sensor sample rate adjustment
• Monitoring environmental risk (cough/sneeze, mosquito frequency classification detection)
• Link to point-of-sale data • Bar code scanning (e.g. food ingredient information) • Automatic cross-device overdetermined trilaterialization & from arbitrarily placed
WiFi/BT locations • Measurement from federated devices (BT scales, respiration & heart rate sensors,
galvanic skin response, etc.) • Convenient food photodiarying • Automatic activity classification • Study of risk perception via controlled experiments ‘health games’ w/info feedback • Richer “self-calibrating” predictive models • Closer integration of communication monitoring • Environmental risk inference

Outline
Motivations Sensor Platforms • “Greater than the sum of its parts”: Synergizing models
& sensor data • Vignettes
– The role of contact characteristics in the spread of pandemic influenza (ABM & sensor data)
– “Self-correcting” models: Synergizing models & ongoing measurement data (SD & sensor data)
– Inferring pathways of infection spread over contact networks (SNA & sensor data)
• Conclusions

Limitations of Sensor Data
• Taken in isolation, sensor data offers limited insight
– Limited generalizability
– Unclear implications for decision making or future behavior
– Unclear what “happens between” the sensor measurements
– Noise data obscure analyses

Limitations of Models
• For certain questions, gluttonous need for data
• Fragility due to assumptions
– Dependence on assumptions regarding exogenous factors
– Systematic errors
– In even best models, risk of rapid obsolescence & divergence from actual situation
• Overconfidence in anticipated state

Modelers as Buzzards: Lofty Goals

Modelers as Buzzards: Lowly Meals of Data

Ubiquitous Sensors and Dynamic Models: A Natural Synergy
Sensor Data
• Rich grounding in observations
• Providing databases for model parameterization & calibration
• Stimulating dynamic hypotheses
Dynamic Models
• “Filling the gaps” between sensor data
• Capturing regularities that underlie sensor data
• “Filtering” of noisy sensor data – Arriving at “consensus” estimates
combining measured data & model predictions
• Generalizing observed behavioral patterns
• Understanding proximal & distal implications of observed behavior
• Determining adaptive sampling rates
Uninfected People
Low-Risk Latently Infected People
Active UnDx Non-Infectious TB
Latent
Infection
Reactivation of
LR Latents
Latently Infected
Immigrants
Non-TB Death of
Uninfected
Non-TB Death of
Low-Risk Latents
Non-TB Death of Active
Undiagnosed People
Death Due to TB ofNon-infectious Actives
Latently Infected People Protected Via TLTBI
Waning of
Protection
Mean Time Until Waning of
TLTBI Immunity
LTBI Treatment Count
For Current Time
Historical Dynamic Non-TB
Death Rate For Current Time
<Historical DynamicNon-TB Death Rate For
Current Time>
<Historical DynamicNon-TB Death Rate For
Current Time>
Historical Dynamic TBDeath Rate For Current
Time
Non-TB Death of
TLTBI Protected
People
<Historical DynamicNon-TB Death Rate For
Current Time>
Uninfected
Immigrants
<Rate of New
Infection>
Natural
Recovery RateProportion Infected
Prior to Entry
Rate of Progression from
Infection to Active TB
Rate of
Reactivation
Active TB Cases Under Treatment
Treatment Default
with Active TB
Mean TimeUnder Treatment
Annual Likelihood
Density of Default
BCG Vaccinated People by Ethnicity
Vaccination
Mean Time Until
Waning of ImmunityNon-TB Death of
Vaccinated People
<Historical DynamicNon-TB Death Rate For
Current Time>
Non-TB Death of Active
Cases Under Treatment
<Historical DynamicNon-TB Death Rate For
Current Time>
Mean Time UntilDiscovery of UnDx
Infectious TB
New Births
Default Rate Anytime
During Treatment
Annual Likelihood Density
of Treatment Completion
Latently Infected People With Previous TreatmentActive Undiagnosed Non-Infectious TB Cases With
Previous Treatment
Relapses
Natural Recovery
of PT
Diagnosis ofNon-InfectiousRelapsed Cases
Treatment
Completion
Death Due To TB of
Previously Treated
Undiagnosed Active
Cases
Non-TB Death of
PT Latents
Mean Time Until Discovery ofNon-Infectious UnDxPreviously Treated TB
<Natural Recovery
Rate>
<Historical DynamicNon-TB Death Rate For
Current Time>
Natural
Recovery
Historical NetInmigration For SK By
Ethnicity
Historical NetInmigration for Current
Time
<Time>
Historical Birth Count
For Current Time
<Time>
Historical SK Birth
Count For Year
Non-TB Death of
PT Active
<Historical DynamicNon-TB Death Rate For
Current Time>
Historical Dynamic
TB Death Rate
<Time>
Historical Total Annual
TLTBI Administered
Total Historical BCG
Vaccination Count For Year
Total Historical BCG
Count For Current Time
<Time>
Historical Dynamic
Non-TB Death Rate
<Time>
Active UnDx Infectious TB
Diagnosis of
Infectious CasesDevelopment of
InfectiousnessMean Time Until
Becoming Infectious
Death Due To TB of
UnDx Infectious Cases
High-Risk Latently Infected PeopleLTBI Treatment
Decrease in Risk
for Disease
Development of Primary TB
Disease in High-Risk Latent
Individuals
Mean Time until
Lowering of Risk
Non-TB Death of
High-Risk Latents
Diagnosis of Non-Infectious Cases
Mean Time Until Discovery
of Non-infectious Cases
<Historical NetInmigration for Current
Time>
<Proportion Infected
Prior to Entry>
Historical Dynamic
Default Rate
Historical DynamicDefault Rate For Current
Time
<Time>
Historical Dynamic
Fraction of BCG
Vaccinations that
Went to RI
Historical Fraction of BCGDelivery going to Ethnicity for
Current Time
Development of Primary TB
in Protected Individuals with
LTBI
Protected People with
LTBI at Risk for Active
Disease
<Rate of Progression from
Infection to Active TB>
<Rate of New
Infection>
Proportion of Protected LTBI
at Risk for Primary Disease
High-Risk LatentsSusceptible to Exogenous
Reinfection
<Historical Dynamic TBDeath Rate For Current
Time>
Proportion of PeopleCompleting TLTBI for
Current Time
Estimated Proportion
Completing TLTBI in 1975
Proportion of PeopleCompleting TLTBI for
Year
Starting Year of Historicdata for Completion of
TLTBI
Time Elapsed
from 1975
Slope of Interpolation Line
between 1975 and 1985
<Proportion of Contacts
in Each Ethnicity>
Historical Total Annual TLTBIAdministered To Each Ethnicity
for Current Time
Historical Total AnnualTLTBI Administered for
Current Time
<Historical DynamicNon-TB Death Rate For
Current Time>
TLTBI
Intervention
BCG Intervention
Immigration
Intervention
<Time> <Immigration
Intervention>
Use Calibrated
Relapse Rate?
Calibrated
Relapse Rate
Previously Treated
Death Rate Coefficient
Death Due To TB of
Dx Infectious Cases
<HistoricalDynamic TB
Death Rate ForCurrent Time>
Treatment Default
with Latent TB
Fraction of TreatmentDefault Occuring with
Active TB
Treatment Default
Rate by Ethnicity
Exogenous Reinfection
of LR Latents
<Low-Risk Latents at
Risk of Reinfection>
Reinfection of
Previously Treated
<Proportion of Latently InfectedIndividuals Susceptible toExogenous Reinfection>
<Rate of New
Infection>
Fraction of New InfectionsLeading to Primary
Progression
<Previously Treated
Death Rate Coefficient>
Mean time till discovery
of infec TB intervention
Mean time till discovery of
non-infec TB intervention
<Time>
Mean time till
waning of BCG
Mean time till waning of
TLTBI intervention
Infection of BCG
Protected People
RR for Infection
Conferred by BCG
<Rate of New
Infection>
Waning of
Immunity
<Time>
Active Undiagnosed Infectious TB Cases
With Previous Treatment
Development ofInfectiousness Among
Previously Treated Actives
Diagnosis of Infectious
Relapsed Cases
Mean Time Until Discovery ofUnDx Infectious TB for
Current Time
<Time>
Death Due to TB of Previously Treated Undiagnosed Infectious TB Cases
Non-TB Death ofInfectious Previously
Treated Actives
Non-TB Death of Active
UnDx Infectious TB Cases
Diagnosis of both Infectiousand Non-Infectious Relapsed
Cases
Coefficient for Mean Time UntilDiscovery of Non-Infectious UnDx
TB for Previously Treated
Mean Time Until Discovery ofUnDx Infectious TB for Previously
Treated for Current Time
Coefficient for Mean Time UntilDiscovery of Infectious UnDx TB
for Previously Treated
Coefficient for Mean Time UntilDiscovery of All UnDx TB forPreviously Treated by Ethnicity
Coefficient for Mean Time UntilDiscovery of All UnDx TB for
Previously Treated
Mean Time Until Discovery ofNon-infectious Cases for
Current Time
<Time>
<Mean Time Until Discoveryof Non-infectious Cases for
Current Time>
<Mean Time Until
Becoming Infectious>
<Historical DynamicNon-TB Death Rate For
Current Time>

Motivation
Replacing… By… Or…
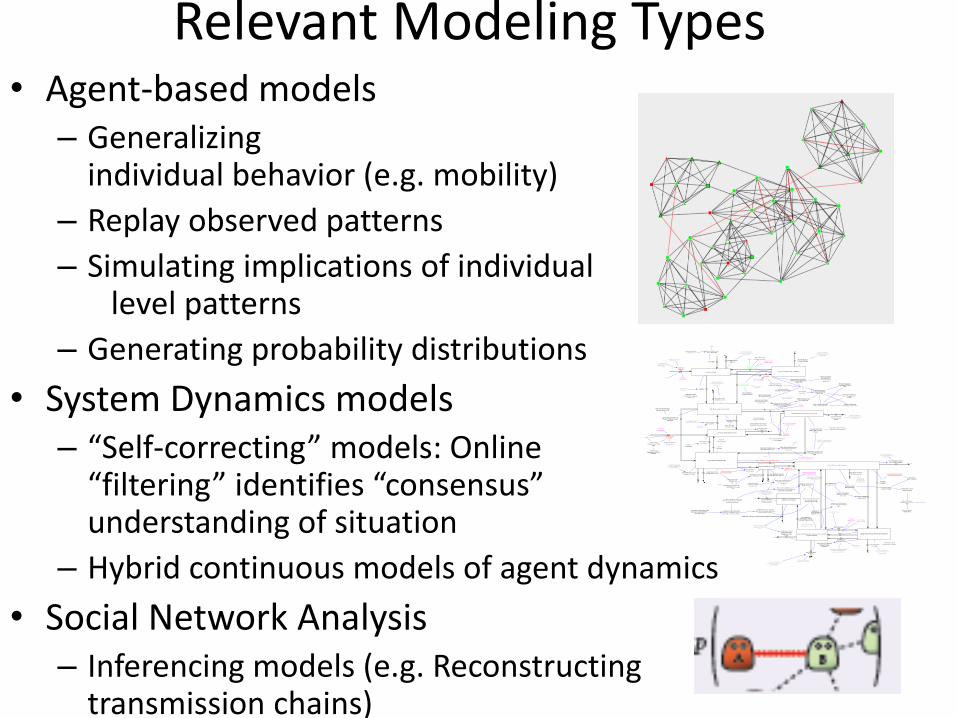
Relevant Modeling Types • Agent-based models
– Generalizing individual behavior (e.g. mobility)
– Replay observed patterns
– Simulating implications of individual level patterns
– Generating probability distributions
• System Dynamics models – “Self-correcting” models: Online
“filtering” identifies “consensus” understanding of situation
– Hybrid continuous models of agent dynamics
• Social Network Analysis – Inferencing models (e.g. Reconstructing
transmission chains)
Uninfected People
Low-Risk Latently Infected People
Active UnDx Non-Infectious TB
Latent
Infection
Reactivation of
LR Latents
Latently Infected
Immigrants
Non-TB Death of
Uninfected
Non-TB Death of
Low-Risk Latents
Non-TB Death of Active
Undiagnosed People
Death Due to TB ofNon-infectious Actives
Latently Infected People Protected Via TLTBI
Waning of
Protection
Mean Time Until Waning of
TLTBI Immunity
LTBI Treatment Count
For Current Time
Historical Dynamic Non-TB
Death Rate For Current Time
<Historical DynamicNon-TB Death Rate For
Current Time>
<Historical DynamicNon-TB Death Rate For
Current Time>
Historical Dynamic TBDeath Rate For Current
Time
Non-TB Death of
TLTBI Protected
People
<Historical DynamicNon-TB Death Rate For
Current Time>
Uninfected
Immigrants
<Rate of New
Infection>
Natural
Recovery RateProportion Infected
Prior to Entry
Rate of Progression from
Infection to Active TB
Rate of
Reactivation
Active TB Cases Under Treatment
Treatment Default
with Active TB
Mean TimeUnder Treatment
Annual Likelihood
Density of Default
BCG Vaccinated People by Ethnicity
Vaccination
Mean Time Until
Waning of ImmunityNon-TB Death of
Vaccinated People
<Historical DynamicNon-TB Death Rate For
Current Time>
Non-TB Death of Active
Cases Under Treatment
<Historical DynamicNon-TB Death Rate For
Current Time>
Mean Time UntilDiscovery of UnDx
Infectious TB
New Births
Default Rate Anytime
During Treatment
Annual Likelihood Density
of Treatment Completion
Latently Infected People With Previous TreatmentActive Undiagnosed Non-Infectious TB Cases With
Previous Treatment
Relapses
Natural Recovery
of PT
Diagnosis ofNon-InfectiousRelapsed Cases
Treatment
Completion
Death Due To TB of
Previously Treated
Undiagnosed Active
Cases
Non-TB Death of
PT Latents
Mean Time Until Discovery ofNon-Infectious UnDxPreviously Treated TB
<Natural Recovery
Rate>
<Historical DynamicNon-TB Death Rate For
Current Time>
Natural
Recovery
Historical NetInmigration For SK By
Ethnicity
Historical NetInmigration for Current
Time
<Time>
Historical Birth Count
For Current Time
<Time>
Historical SK Birth
Count For Year
Non-TB Death of
PT Active
<Historical DynamicNon-TB Death Rate For
Current Time>
Historical Dynamic
TB Death Rate
<Time>
Historical Total Annual
TLTBI Administered
Total Historical BCG
Vaccination Count For Year
Total Historical BCG
Count For Current Time
<Time>
Historical Dynamic
Non-TB Death Rate
<Time>
Active UnDx Infectious TB
Diagnosis of
Infectious CasesDevelopment of
InfectiousnessMean Time Until
Becoming Infectious
Death Due To TB of
UnDx Infectious Cases
High-Risk Latently Infected PeopleLTBI Treatment
Decrease in Risk
for Disease
Development of Primary TB
Disease in High-Risk Latent
Individuals
Mean Time until
Lowering of Risk
Non-TB Death of
High-Risk Latents
Diagnosis of Non-Infectious Cases
Mean Time Until Discovery
of Non-infectious Cases
<Historical NetInmigration for Current
Time>
<Proportion Infected
Prior to Entry>
Historical Dynamic
Default Rate
Historical DynamicDefault Rate For Current
Time
<Time>
Historical Dynamic
Fraction of BCG
Vaccinations that
Went to RI
Historical Fraction of BCGDelivery going to Ethnicity for
Current Time
Development of Primary TB
in Protected Individuals with
LTBI
Protected People with
LTBI at Risk for Active
Disease
<Rate of Progression from
Infection to Active TB>
<Rate of New
Infection>
Proportion of Protected LTBI
at Risk for Primary Disease
High-Risk LatentsSusceptible to Exogenous
Reinfection
<Historical Dynamic TBDeath Rate For Current
Time>
Proportion of PeopleCompleting TLTBI for
Current Time
Estimated Proportion
Completing TLTBI in 1975
Proportion of PeopleCompleting TLTBI for
Year
Starting Year of Historicdata for Completion of
TLTBI
Time Elapsed
from 1975
Slope of Interpolation Line
between 1975 and 1985
<Proportion of Contacts
in Each Ethnicity>
Historical Total Annual TLTBIAdministered To Each Ethnicity
for Current Time
Historical Total AnnualTLTBI Administered for
Current Time
<Historical DynamicNon-TB Death Rate For
Current Time>
TLTBI
Intervention
BCG Intervention
Immigration
Intervention
<Time> <Immigration
Intervention>
Use Calibrated
Relapse Rate?
Calibrated
Relapse Rate
Previously Treated
Death Rate Coefficient
Death Due To TB of
Dx Infectious Cases
<HistoricalDynamic TB
Death Rate ForCurrent Time>
Treatment Default
with Latent TB
Fraction of TreatmentDefault Occuring with
Active TB
Treatment Default
Rate by Ethnicity
Exogenous Reinfection
of LR Latents
<Low-Risk Latents at
Risk of Reinfection>
Reinfection of
Previously Treated
<Proportion of Latently InfectedIndividuals Susceptible toExogenous Reinfection>
<Rate of New
Infection>
Fraction of New InfectionsLeading to Primary
Progression
<Previously Treated
Death Rate Coefficient>
Mean time till discovery
of infec TB intervention
Mean time till discovery of
non-infec TB intervention
<Time>
Mean time till
waning of BCG
Mean time till waning of
TLTBI intervention
Infection of BCG
Protected People
RR for Infection
Conferred by BCG
<Rate of New
Infection>
Waning of
Immunity
<Time>
Active Undiagnosed Infectious TB Cases
With Previous Treatment
Development ofInfectiousness Among
Previously Treated Actives
Diagnosis of Infectious
Relapsed Cases
Mean Time Until Discovery ofUnDx Infectious TB for
Current Time
<Time>
Death Due to TB of Previously Treated Undiagnosed Infectious TB Cases
Non-TB Death ofInfectious Previously
Treated Actives
Non-TB Death of Active
UnDx Infectious TB Cases
Diagnosis of both Infectiousand Non-Infectious Relapsed
Cases
Coefficient for Mean Time UntilDiscovery of Non-Infectious UnDx
TB for Previously Treated
Mean Time Until Discovery ofUnDx Infectious TB for Previously
Treated for Current Time
Coefficient for Mean Time UntilDiscovery of Infectious UnDx TB
for Previously Treated
Coefficient for Mean Time UntilDiscovery of All UnDx TB forPreviously Treated by Ethnicity
Coefficient for Mean Time UntilDiscovery of All UnDx TB for
Previously Treated
Mean Time Until Discovery ofNon-infectious Cases for
Current Time
<Time>
<Mean Time Until Discoveryof Non-infectious Cases for
Current Time>
<Mean Time Until
Becoming Infectious>
<Historical DynamicNon-TB Death Rate For
Current Time>

Outline
Motivations Sensor Platforms “Greater than the sum of its parts”: Synergizing models
& sensor data • Vignettes
– The role of contact characteristics in the spread of pandemic influenza (ABM & sensor data)
– “Self-correcting” models: Synergizing models & ongoing measurement data (SD & sensor data)
– Inferring pathways of infection spread over contact networks (SNA & sensor data)
• Conclusions

Flunet Study • Small scale study
– People: 36 participants
– Places: 9 “beacons” at fixed locations
• Information collected – Proximity
• Each sensor recorded every 30 seconds
• 3 RSSI proximity categories: Close (<5m), Medium (5-15m), far (>15m)
• Proximity resolution 1-2 minutes
– Cross-linked health survey data
• Time: 13 weeks during 2009 pandemic influenza season – Study duration: November 9, 2009 – February 9, 2010
– Approximately 262K 30-second timeslot samples
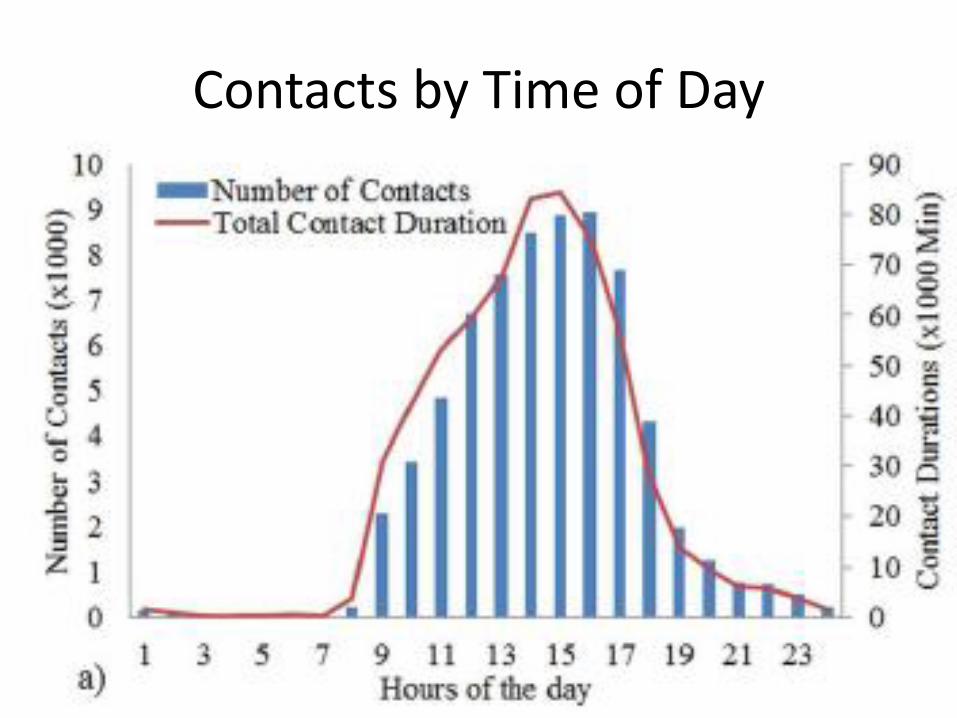
Contacts by Time of Day
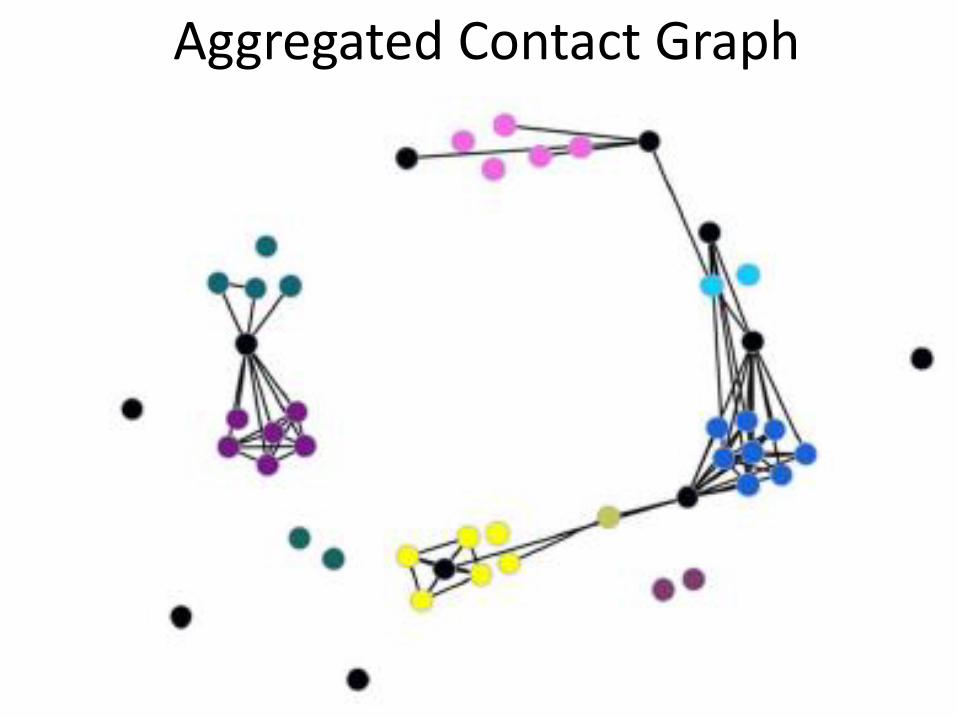
Aggregated Contact Graph


Reported Contacts:
0
1000
2000
3000
4000
5000
6000
7000
8000
9000
10000
0
100
200
300
400
500
600
700
800
0 2 4 6 8 10 12 14 16 18 20 22 24 26 28 30 32 34 36
No
of
Co
nta
cts
Co
nta
ct D
ura
tio
ns
(Ho
urs
)
Node ID (sorted by contact duration)
Contact Duration Total Contact Duration Med. RSSI
Contact Duration Close RSSI No of Contacts Total
No of Contacts Med. RSSI No of Contacts Close RSSI
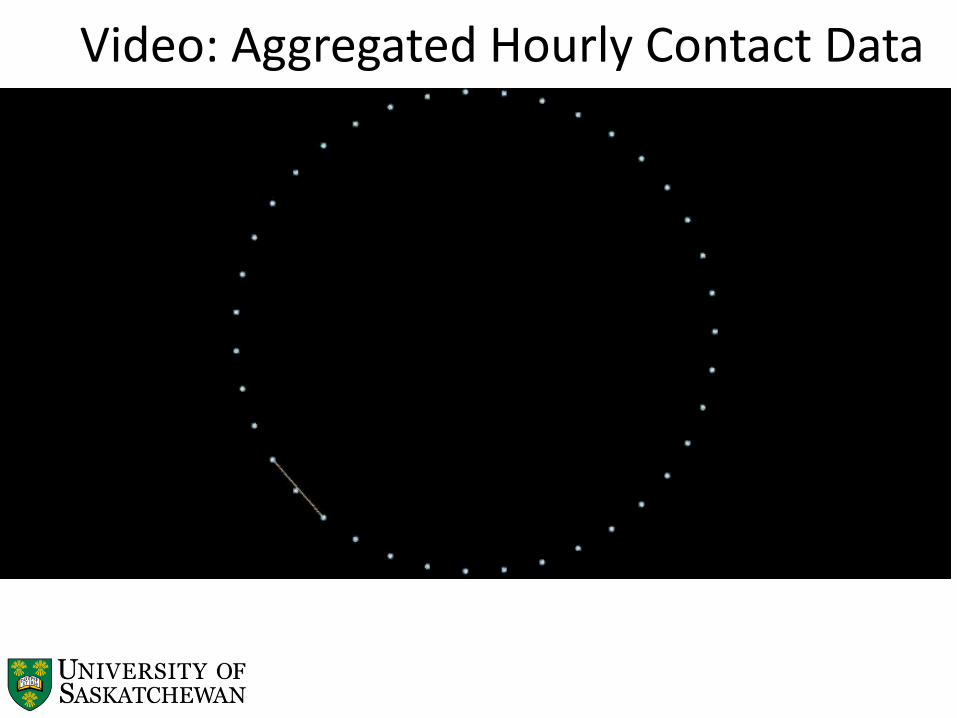
Video: Aggregated Hourly Contact Data
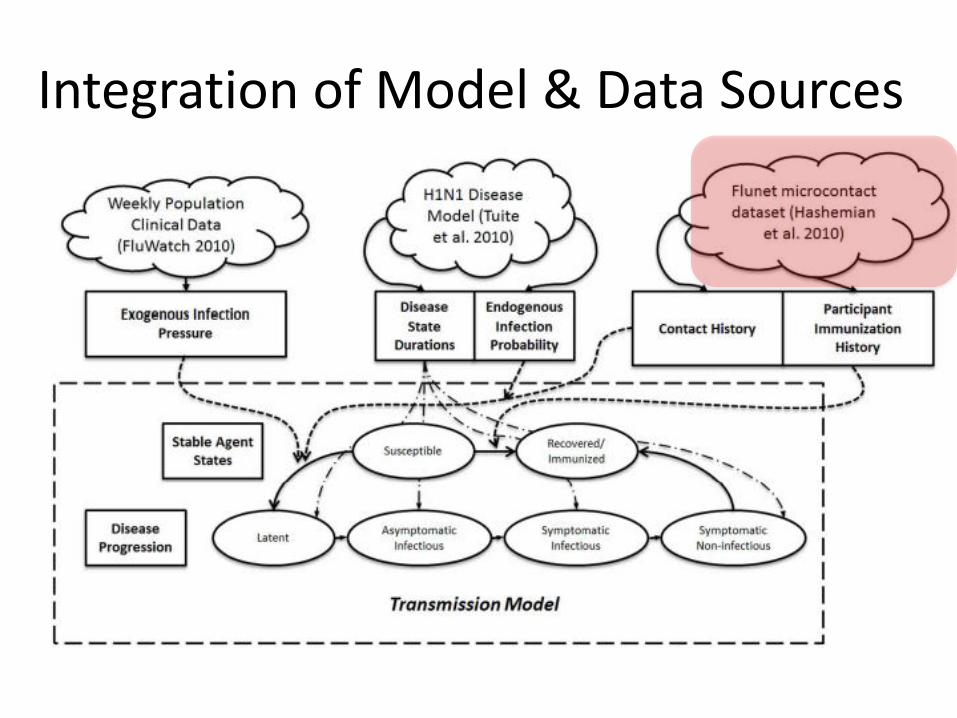
Integration of Model & Data Sources

Dealing with Stochastics • Uncertainties many “Groundhog Day” like
realizations required
• Ensemble size
– Baseline scenarios: 100,000 realizations
– Alternative scenarios for different parameter values: 2,500 realization
• Sensitivity analyses: Different ensembles carried out for
– With and without considering vaccination
– Closeness of proximity required to transmit
– With and without behavioral removal

Results
Transmission possible even for longer range (e.g. 10-15m) contacts
Close distance required for transmission
Results consistent with count of self-reports of symptoms of influenza-like illness

Number of Infections
Infections spread over 100,000 realizations

Results
Correlation between centrality measures & model-derived likelihood of infection

Outline
Motivations Sensor Platforms “Greater than the sum of its parts”: Synergizing models
& sensor data • Vignettes The role of contact characteristics in the spread of pandemic
influenza (ABM & sensor data) – “Self-correcting” models: Synergizing models & ongoing
measurement data (SD & sensor data) – Inferring pathways of infection spread over contact networks
(SNA & sensor data)
• Conclusions
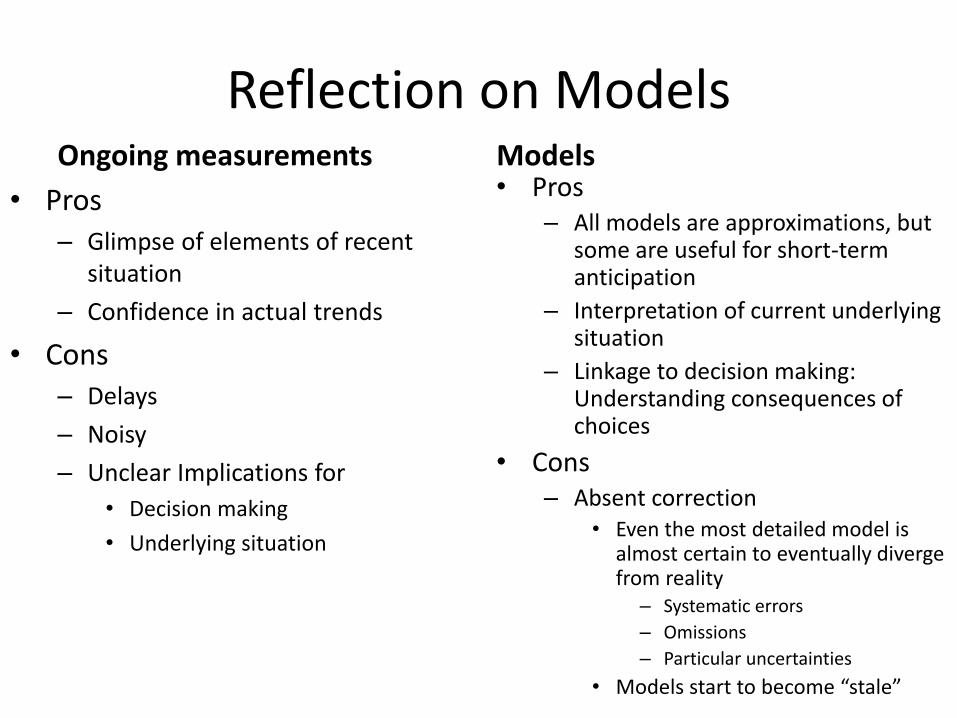
Reflection on Models Ongoing measurements
• Pros – Glimpse of elements of recent
situation
– Confidence in actual trends
• Cons – Delays
– Noisy
– Unclear Implications for
• Decision making
• Underlying situation
Models • Pros
– All models are approximations, but some are useful for short-term anticipation
– Interpretation of current underlying situation
– Linkage to decision making: Understanding consequences of choices
• Cons – Absent correction
• Even the most detailed model is almost certain to eventually diverge from reality
– Systematic errors
– Omissions
– Particular uncertainties
• Models start to become “stale”
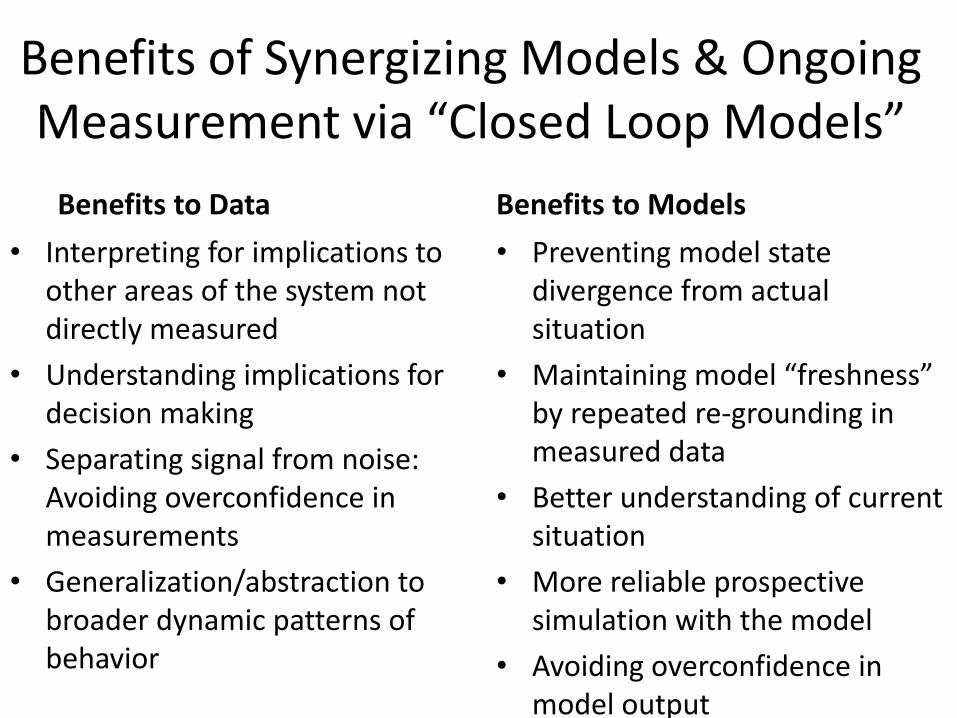
Benefits of Synergizing Models & Ongoing Measurement via “Closed Loop Models”
Benefits to Data
• Interpreting for implications to other areas of the system not directly measured
• Understanding implications for decision making
• Separating signal from noise: Avoiding overconfidence in measurements
• Generalization/abstraction to broader dynamic patterns of behavior
Benefits to Models
• Preventing model state divergence from actual situation
• Maintaining model “freshness” by repeated re-grounding in measured data
• Better understanding of current situation
• More reliable prospective simulation with the model
• Avoiding overconfidence in model output

Rudolf Emil Kalman (1930-)
The Kalman Filter (R. E. Kalman 1960)
The ongoing discrete Kalman filter cycle. The time update projects the current state estimate ahead in time. The measurement update adjusts the projected estimate by an actual measurement at that time. (Welch, G. and Bishop, G. 2006)
Slide courtesy of Weicheng Qian
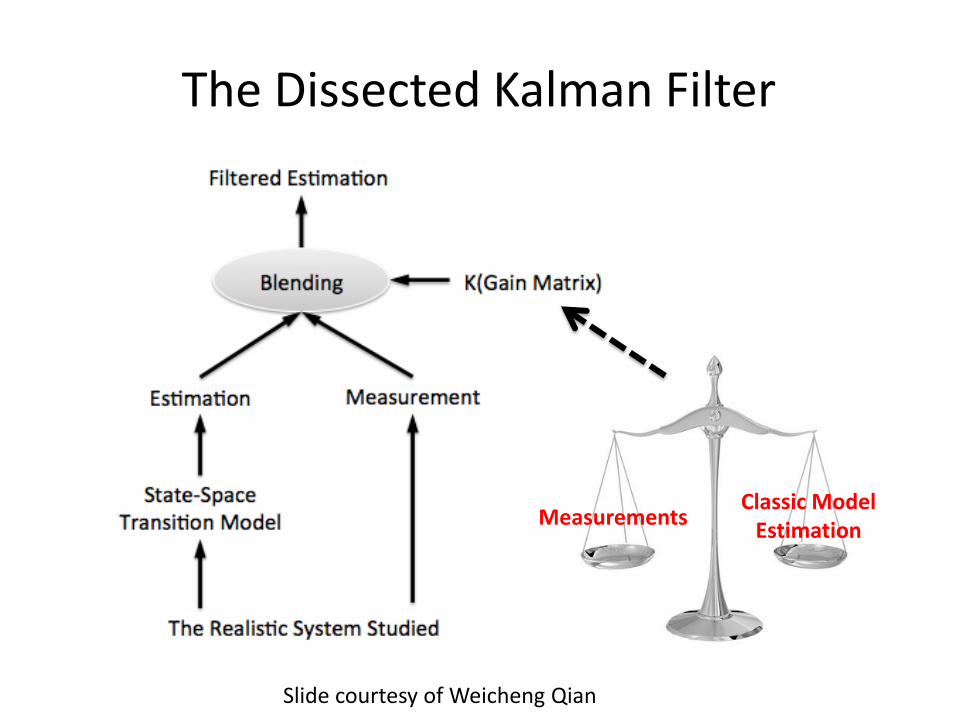
The Dissected Kalman Filter
Measurements Classic Model
Estimation
Slide courtesy of Weicheng Qian
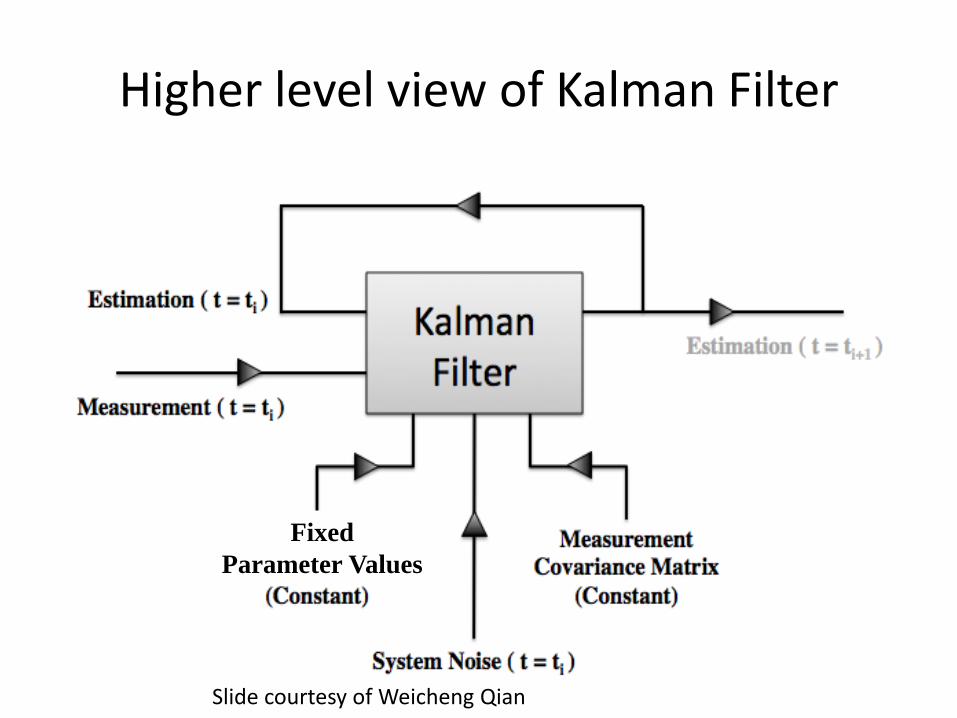
Higher level view of Kalman Filter
Fixed
Parameter Values
Slide courtesy of Weicheng Qian
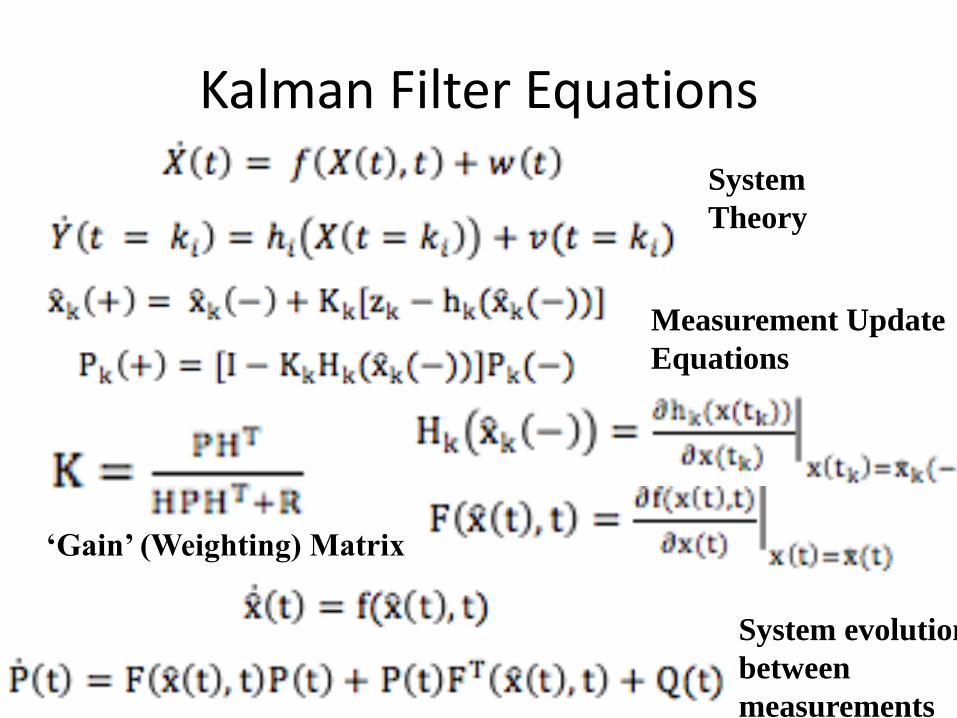
Kalman Filter Equations
Measurement Update
Equations
System
Theory
‘Gain’ (Weighting) Matrix
System evolution
between
measurements

Evaluating Using a Synthetic Population
• Analytic approaches (and study designs) are often challenging and costly to test in the real world – Expensive to establish study
– Time consuming
– Ethical barriers
– Lack of definitive knowledge of how conclusions compare to some “ground truth”
• We can often evaluate such approaches using “synthetic populations” drawn from simulation models – Here, the simulation model helps to identify potential
weaknesses of study designs & analysis approaches
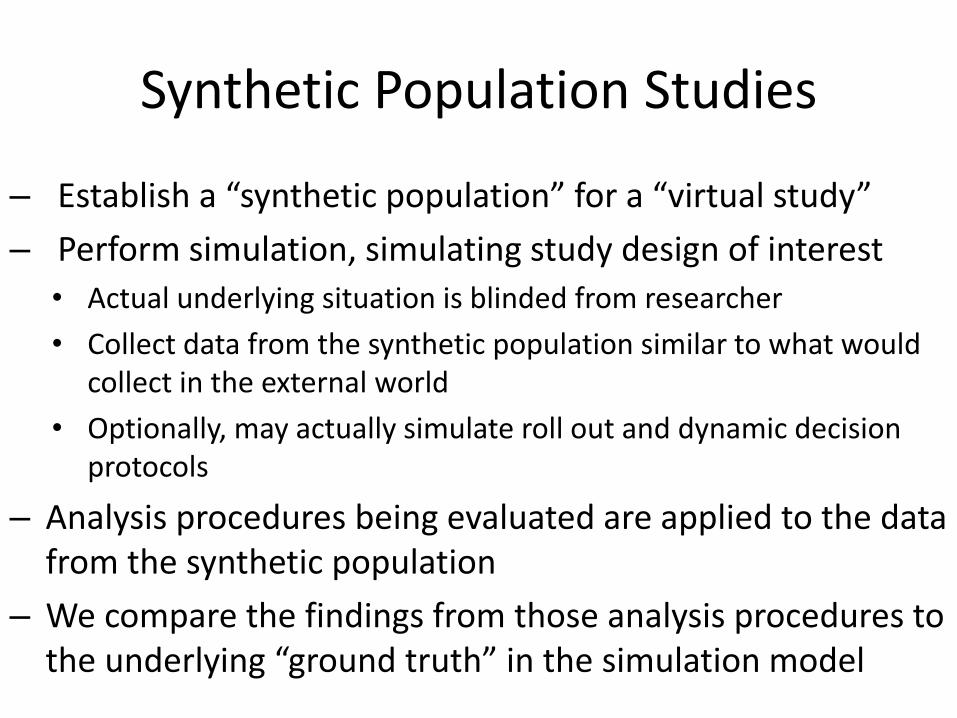
Synthetic Population Studies
– Establish a “synthetic population” for a “virtual study”
– Perform simulation, simulating study design of interest
• Actual underlying situation is blinded from researcher
• Collect data from the synthetic population similar to what would collect in the external world
• Optionally, may actually simulate roll out and dynamic decision protocols
– Analysis procedures being evaluated are applied to the data from the synthetic population
– We compare the findings from those analysis procedures to the underlying “ground truth” in the simulation model
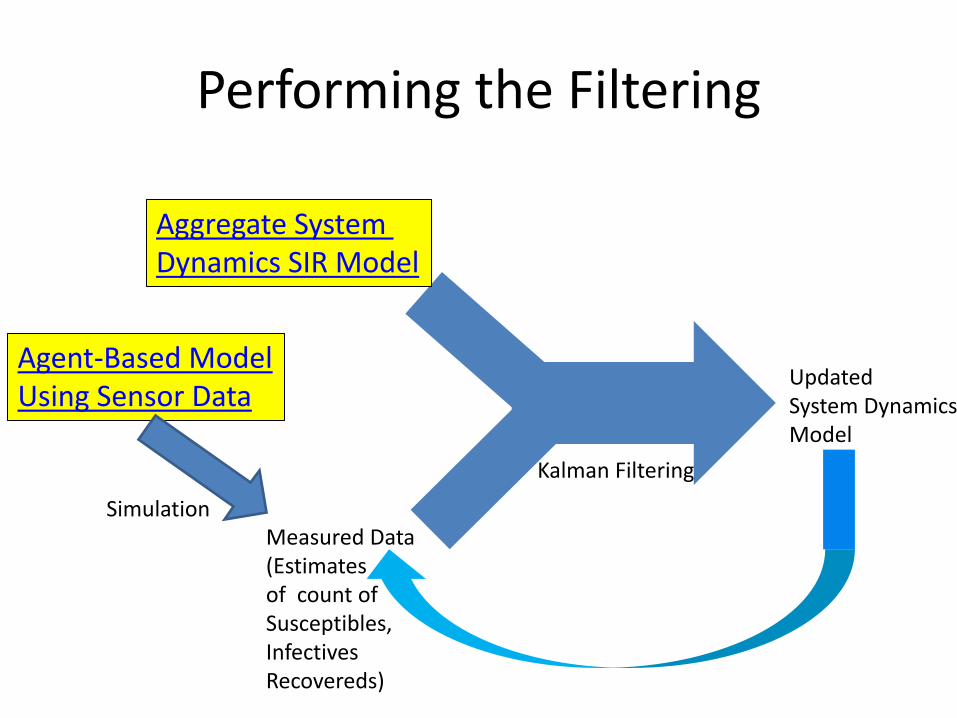
Performing the Filtering
Agent-Based Model Using Sensor Data
Simulation Measured Data (Estimates of count of Susceptibles, Infectives Recovereds)
Kalman Filtering
Aggregate System Dynamics SIR Model
Updated System Dynamics Model

The Underlying Transmission Model (Modified)
Back

Aggregate System Dynamics SIR Model
Susceptible Infectives Recovered
New Infections Recoveries
Contacts per
Day c
Likelihood of InfectionTransmission Given
Exposure Beta
Total Population
Size
Prevalence of
Infection
Mean Time Until
Recovery
Force of Infection
Simpification & Systematically in error
Simplification: “Random mixing” assumed
Simplifications: Many stages omitted (assumes that all Infected individuals are Infective)
Back
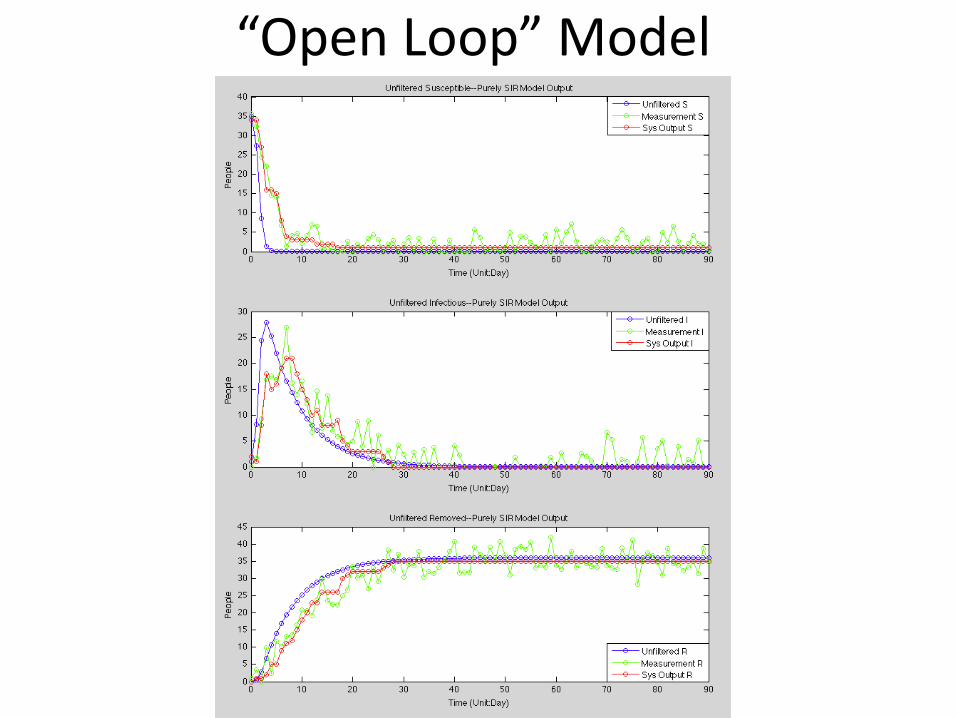
“Open Loop” Model

4 Days Between “Regroundings”

Simplest Case: Only State Updates Measurement Every Other Day
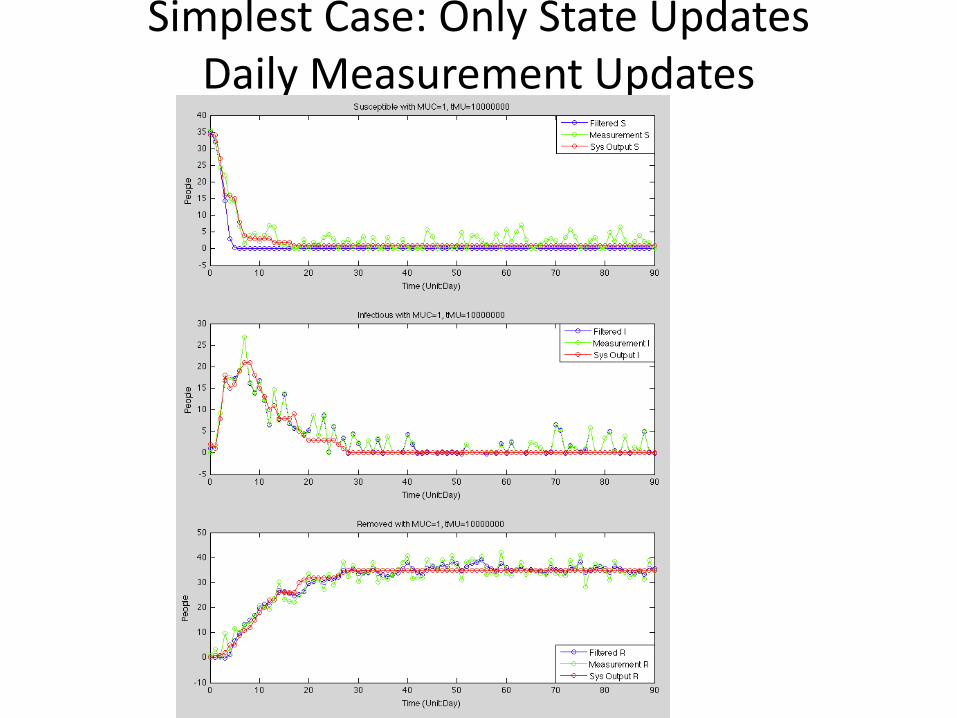
Simplest Case: Only State Updates Daily Measurement Updates

Projecting Forward from Updates
Prevalence of infectives Estimated by “open loop” model
Actual underlying prevalence of infectives in Underlying ABM (incorporating sensed contact patterns)
Prevalence of infection estimated by successively “closed loop” model incorporating measurement data

Why Aggregate Models?
• Typically the state in dynamic models involve both observable & non-observable elements
• We can make limited inference on non-observable components from observable
• Many observations are often required to “triangulate” non-observables
• Inferring non-observables is far easier if there are fewer of them => more aggregate models – Almost always required for aggregate measurement
• Ubiquitous sensing does raise the intriguing potential for inferring state at the individual level

Not Shown Here
• Updating parameters
• Updating estimates of non-observables
• Finer-grained data updates

Outline
Motivations Sensor Platforms “Greater than the sum of its parts”: Synergizing models
& sensor data • Vignettes The role of contact characteristics in the spread of pandemic
influenza (ABM & sensor data) “Self-correcting” models: Synergizing models & ongoing
measurement data (SD & sensor data) – Inferring pathways of infection spread over contact networks
(SNA & sensor data)
• Conclusions

Contact Data can Permit Static or Dynamic Network Reconstruction
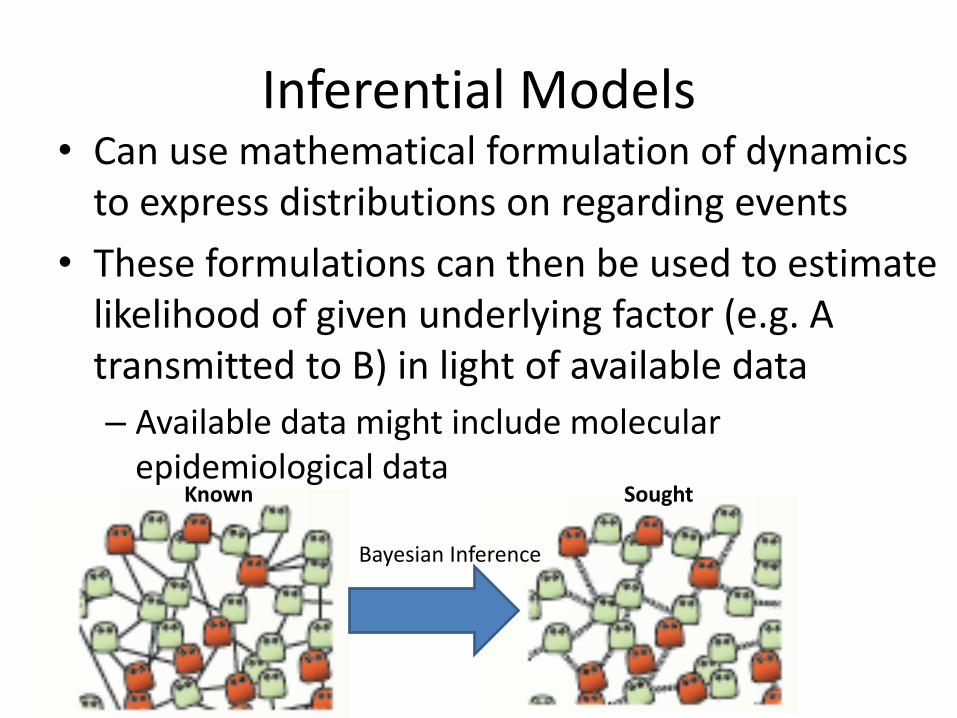
Inferential Models • Can use mathematical formulation of dynamics
to express distributions on regarding events
• These formulations can then be used to estimate likelihood of given underlying factor (e.g. A transmitted to B) in light of available data
– Available data might include molecular epidemiological data
Known Sought
Bayesian Inference

Sensing and Feedback for Epidemiological Modeling to help
Evaluate Analysis Strategies

A Simple Contact Network (e.g.Gathered via Sensed proximity)
Presentation time: day 10
Presentation time: day 5
Presentation time: day 3
Presentation time: day 4
Presentation time: day 2
Presentation time: day 3

A Hypothesis for Pathways of Infection Spread
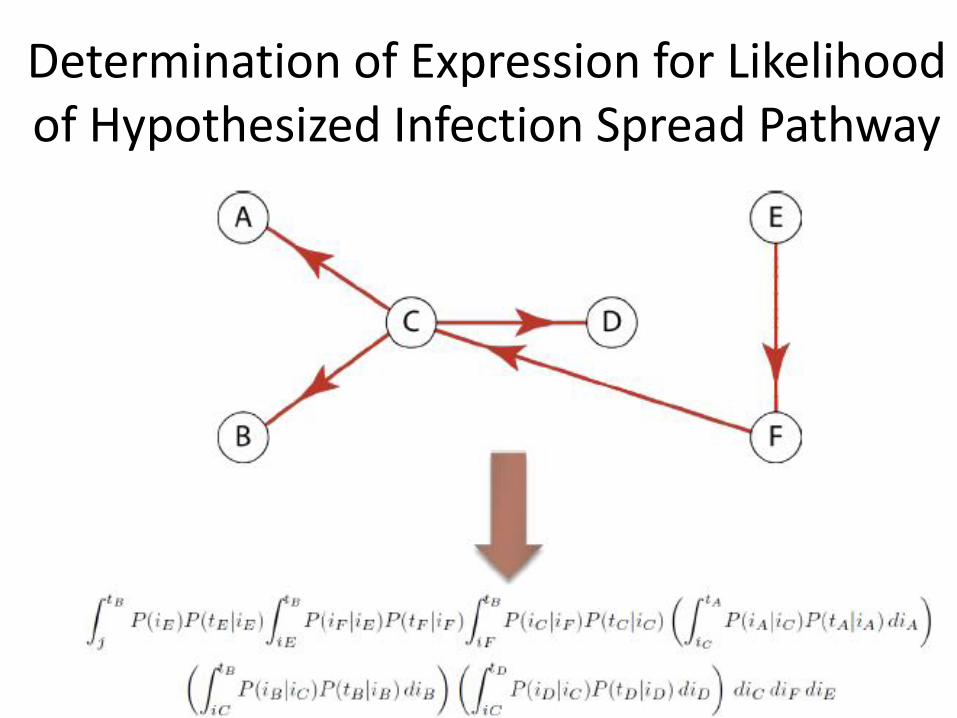
Determination of Expression for Likelihood of Hypothesized Infection Spread Pathway
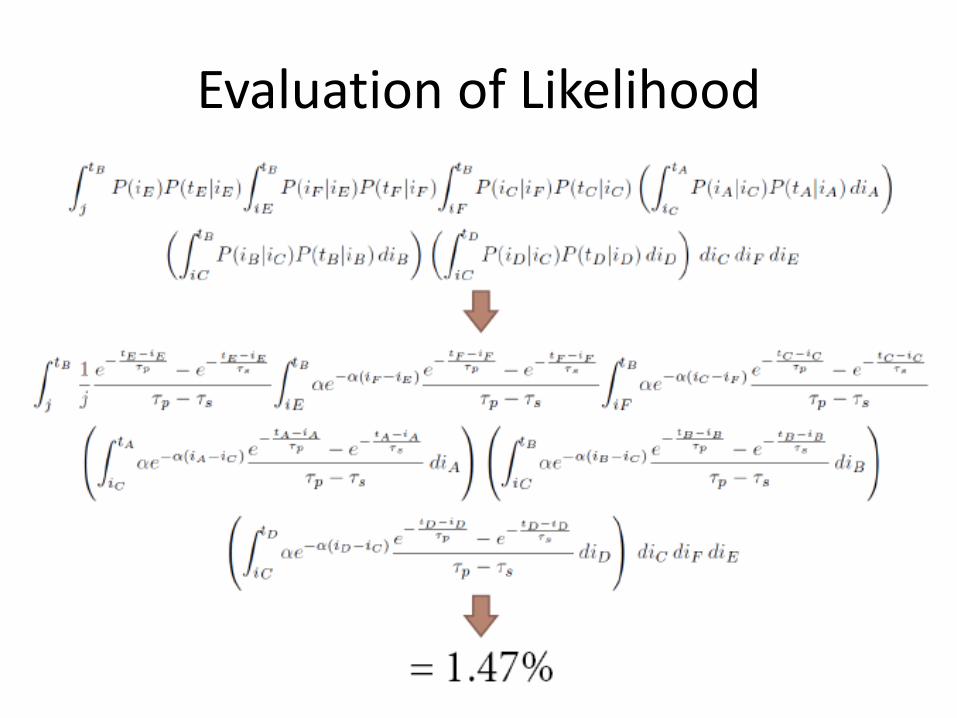
Evaluation of Likelihood

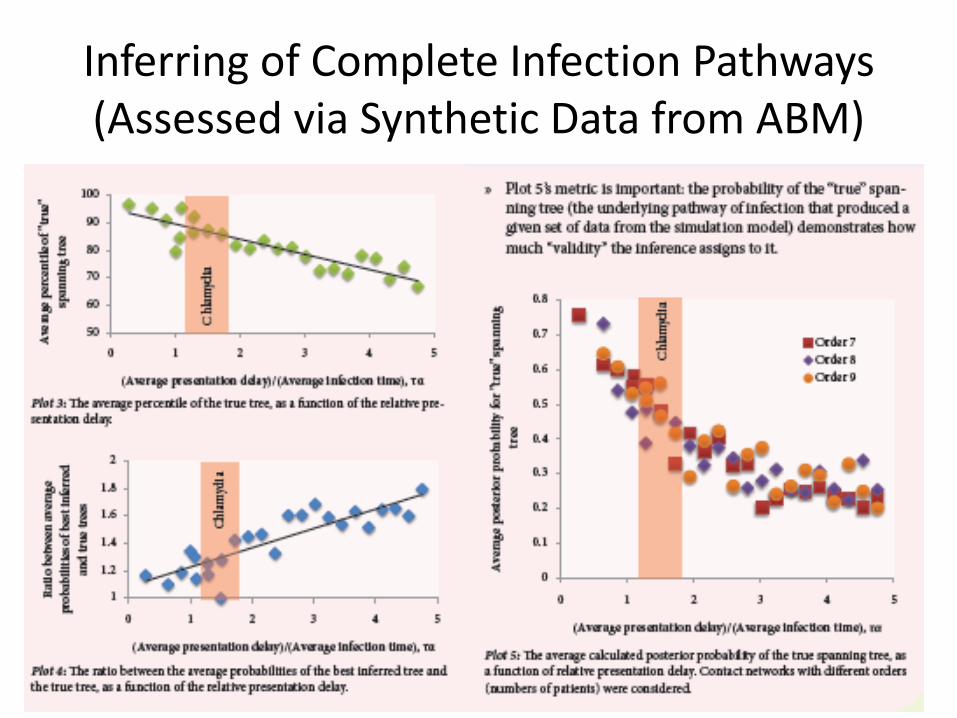
Inferring of Complete Infection Pathways (Assessed via Synthetic Data from ABM)

Outline
Motivations Sensor Platforms “Greater than the sum of its parts”: Synergizing models
& sensor data • Vignettes The role of contact characteristics in the spread of pandemic
influenza (ABM & sensor data) “Self-correcting” models: Synergizing models & ongoing
measurement data (SD & sensor data) Inferring pathways of infection spread over contact networks
(SNA & sensor data)
• Conclusions
Conclusions • Sensors are increasingly ubiquitous
• Commodity sensor-bearing devices can serve a dual use as versatile sensor platforms
• Diverse communication signals permit creative repurposing
• Coupled with models, sensor data can offer significant and complementary health insights
• Each systems science modeling type presented at ISSH can support compelling – and often unique – insights when coupled with sensed data

Questions?
Thank You!