senior design final report (fin)
TRANSCRIPT

Improved Design and Implementation of Heat Sink
for Platform Controller Hub
Final Report Submitted to
Dr. Robert Woods
By
ThermaFlow
The University of Texas at Arlington
August 11, 2016

2
Improved Design and Implementation of Heat
Sink for Platform Controller Hub
ABSTRACT
Data servers consume nearly two percent of all electricity used worldwide. To cope
with the world's increasing demands for data processing and storage, energy
efficiency of data servers must see continuous improvement. Energy efficiency of
the Intel-based 2OU Open Compute server was improved by optimizing the heat
sink used for cooling the Platform Controller Hub (PCH). The metric used to
evaluate the success of the design was a decrease in the maximum temperature of
the PCH observed at maximum CPU power utilization. To accomplish this, the
existing, extruded fin heat sink was replaced using a cross-cut fin configuration to
accommodate the turbulent flow regime within the server. A model of the existing
server was constructed using SolidWorks modeling software. Research was
performed to identify the critical components of the server model. The model was
tested within the computational fluid dynamics (CFD) software, ANSYS Icepak,
for various heat sink configurations. Experimental testing was performed for the
existing heat sink design to verify the accuracy of the CFD model. In addition to
this, further CFD studies were performed incorporating a vapor chamber and flow
restriction to the model. The final, cross-cut fin design resulted in a reduction of
4°C for the maximum PCH temperature from the existing heat sink design.
McAvene, Adam
Hart, Ryan
Norwood, Damone
Jacobs, Erik
Tran, Binh
August 11, 2016
Special Thanks to:
Dr. Dereje Agonafer
Malekkul Islam
Manasa Sahini

3
Table of Contents 1. INTRODUCTION ............................................................................................................................... 4
2. TECHNICAL ...................................................................................................................................... 5
2.1 INTRODUCTION ....................................................................................................................... 5
2.2 BACKGROUND ......................................................................................................................... 5
2.3 MODEL DESIGN ....................................................................................................................... 6
2.4 CFD SIMULATION ................................................................................................................... 9
2.5 EXPERIMENTAL TESTING SETUP ................................................................................... 12
2.6 SIMULATION RESULTS ....................................................................................................... 14
2.7 EXPERIMENTAL TESTING RESULTS .............................................................................. 15
3. CONCLUSION ................................................................................................................................. 17
3.1 FURTHER WORK ................................................................................................................... 18
REFERENCES .......................................................................................................................................... 19
APPENDIX A ICEPAK .................................................................................................................... 20
APPENDIX B HEAT SINK DESIGNS ........................................................................................... 21
B.1 EXTRUDED FIN ............................................................................................................................ 21
B.2 CROSS CUT FIN: Z54 .................................................................................................................. 22
B.3 SQUARE PIN: S1555 ..................................................................................................................... 23
B.4 ELLIPITICAL PIN: W54.............................................................................................................. 24
B.5 HEXAGONAL PIN: N54 ............................................................................................................... 25
APPENDIX C SERVER COMPONENTS ...................................................................................... 26
C.1 SERVER ASSEMBLY .................................................................................................................. 26
C.2 CHASSIS ........................................................................................................................................ 27
C.3 CHASSIS TOP ............................................................................................................................... 28
C.4 FAN CASING ................................................................................................................................. 29
C.5 HARD DRIVE ................................................................................................................................ 30
C.6 MOTHERBOARD A ..................................................................................................................... 31
C.7 MOTHERBOARD B ..................................................................................................................... 32
C.8 PARTITION ................................................................................................................................... 33
C.9 PCH ................................................................................................................................................. 34
C.10 RADIATOR .................................................................................................................................. 35
C.11 RAM STICK ................................................................................................................................. 36

4
1. INTRODUCTION
Servers are the backbone of advanced digital networks, and the need for complex networks
continues to grow. From 2005 to 2010, electricity consumed by servers rose from about 1.5% to
2.2% of the United States’ total energy consumption [1] However, as servers work to meet higher
demands, their efficiency decreases. According to a report by Digital Reality Trust, the average
Power Usage Effectiveness (PUE) for servers in the United States was 2.9 [2]. In other words, for
every watt used to power a server, nearly two watts are used to keep it running through cooling
and other means of overhead. To combat this, a number of computer technology firms have come
together to work on the OpenCompute Project. According to their official website, “The Open
Compute Project Foundation is a rapidly growing, global community whose mission is to design,
use, and enable mainstream delivery of the most efficient designs for scalable computing” [3].
Our goal is to redesign the heat sink used in the OpenCompute server. The server is a
modified version of the OpenCompute 2OU server that implements a combined cooling system of
liquid and air flow cooling. Liquid cooling is used for the two central processing units (CPUs) in
the server, while all of the other components rely on forced air flow for cooling. The main heat
generating components contained in the server are two Intel Xeon E5-2600 CPU chips, up to 16
Dual In-line Memory modules for DDR3 memory, and an Intel C602 Platform Controller Hub
(PCH). The PCH is a computer chip designed to control data paths and support functions used in
conjunction with Intel CPUs.
The heat sink rests directly above the Platform Controller Hub (PCH), and is currently
utilizing an extruded fin heat sink, which will be replaced by a pin-finned design. An extruded fin
design is effective for airflow that is oriented parallel to the fins and flows through them. Due to
the fan placement within the server, and the geometries of the server components, the air flow
through the heat sink is coming from many different directions which decreases the effectiveness
of the extruded fin heat sink design. By replacing the extruded fin design (Fig 1.1) with a multi-
directional design (Fig 1.2), efficiency of the heat sink is improved by removing any directional
dependency on the airflow. This should both decrease the maximum temperature of the PCH and
increase the server’s energy efficiency.
Figure 1.1 Extruded fin heat sink Figure 1.2 Cross-cut fin heat sin

5
2. TECHNICAL
2.1 INTRODUCTION
The primary objective of this project was to improve the energy efficiency of the server by
designing a more efficient heat sink in effort to minimize the maximum PCH temperature. The
method followed to accomplish this task was as follows: First, a digital model of the system was
created and imported into ANSYS Icepak to perform CFD simulations. A procedure was
developed for experimental testing of the physical model. Experimental tests verified the accuracy
of the CFD model within 5% accuracy.
A heat sink operates by transferring heat from the heat generating component to the heat
sink via conduction, and to the air in the system via convection. Material and geometric properties
of the heat sink, as well as fluid properties and flow characteristics all have an effect on the
efficiency of these two heat transfer processes. Both of these processes were analyzed under steady
state conditions.
2.2 BACKGROUND
Previous research has been conducted in the design and optimization of heat sinks and
other heat exchangers. Divya [4] conducted research into the effects of flow bypass and thermal
shadowing on the performance of heat sinks and improvements in ducting. Dvinsky et al [5]
studied the comparative performance of in-line and staggered square pin arrays on heat sinks. Their
study showed that with the exception of a fully shrouded flow path, in-line arrays outperformed
staggered ones due to higher flow resistance and pressure drop in staggered pin arrays. Chapman
et al [6] studied the thermal performance of an elliptical pin finned heat sink compared to a square
pin and extruded fin (plate fin) heat sinks of similar volumes and surface areas in both confined
and free flow conditions. Their results showed that the elliptical fin outperformed the cross cut
square pin heat sink, neither heat sink outperformed the extruded fin design in confined and free
flow conditions, which can be attributed to the effects of flow bypass and the extruded fin’s
superior lengthwise conduction. Dewan et al [7] studied the effects of both fin spacing and material
choice on the performance of a staggered circular pin fin heat sink in a confined configuration.
This study found that of the studied fin spacing configurations, a ratio of streamwise fin spacing
to fin diameter (S/D) of 2.3 provided the best heat transfer results in a compact heat exchanger.
Jonsson and Moshfegh [8] studied the effective performance of a range of heat sinks, finding that
pin fin heat sinks incur higher pressure drops at high Reynolds number than strip fin heat sinks,
and do not significantly improve upon their heat transfer. All of these research results operate on
different assumptions for the airflow’s entry and exit behavior for the heat sink, which may not be
directly applicable for a given heat sink, especially for our recirculating air flow system.

6
Patil [9] created a CFD model for a vapor chamber and observed its performance
as a heat spreader, and used parametric testing to determine the most efficient design choices for
each vapor chamber element. Patil found that vapor chambers could offer improvements in
performance over bulk copper heat spreaders when the cross sectional area of the heat spreader
was larger than 15x15 mm. In addition to this, the wick was found to be the limiting factor for a
vapor chamber’s thermal conductivity. Ranjan et al [10] studied the performance of an ultra-thin
(1 mm) vapor chamber, and created a numerical model to reliably predict its behavior. They found
that for ultra-thin vapor chambers, the thinnest wick structures (0.05 mm) provided the best
performance when the applied heat flux was lower than 50 W/cm^2, and a thickness of 0.1 mm
performed best at heat fluxes higher than that.
2.3 MODEL DESIGN
In order to perform a computational fluid dynamics (CFD) simulation to determine most
efficient heat sink, a solid model of the server had to be created. To recreate the Winterfell 2OU
hybrid-cooling server as a digital model, the 3D modeling software SolidWorks was used. Critical
components that had a significant effect on both the heat transfer, as well as the air flow within the
server were selected. A server was measured using a set of calipers to determine the required
dimensions. Once modeled, the server was imported into ANSYS Icepak. Initially, only the fans,
PCH, and heat sink design iterations were created in Icepak. The rest of the server was transferred
to Icepak by importing CAD data directly from a STEP file (see Appendix A for more information
on Icepak). There are many other small components to the server, but the components mentioned
previously are the main focus due to having a significant effect on the fluid and thermal flow of
the area surrounding the heat sink.

7
Figure 2.1 Modeled server in SolidWorks
The partition is a thin piece of metal that is connected to the fan and directs the air flow
from the fan to the heat sink. The chassis and partition are made out of extruded aluminum, while
the heat sink is made out of Aluminum 6061-T6. The motherboards are made out of a non-
conducting printed circuit board while the DIMM chips, PCH, and CPUs are made out of a semi-
conducting silicon (Refer to Appendix B for detailed drawings and dimensions of the server and
its components.)
With the model imported into Icepak, as seen in figure 2.2, each component was assigned
specific material and mechanical properties within Icepak. The PCH was set to have a power output
of 8 watts while each of the DIMM chips had a specified power output of 0.8 watts. The CPUs
each supplied a power output of 115 watts, but since they are liquid cooled, their power outputs
were neglected. All power output values were supplied by the data sheets for the Intel components
of the system. Each pin-finned heat sink design was generated within Icepak, taking advantage of
the heat sink feature it has built into the software. The boundary condition of the fan was also
specified through Icepak. Since the two fans also take advantage of a liquid cooling device, the
fan was able to be modeled with a constant inlet temperature value which eliminated the need of
modeling a closed loop system.
Figure 2.2 Server model imported in Icepak

8
After running many different tests with the model seen in figure 2.2, the team decided to rebuild
the model solely from Icepak, see figure 2.3. The reason for this switch was because the old model
was overly complex and redundant, which ultimately slowed down the time that it took for each
test to complete by a large margin. Due to some of the complex geometry from the old model, the
CAD generated parts created issues with Icepak’s meshing procedure. With the simplified model,
the team was able to implement non-conformal meshing to refine the region around the heat sink
and lower the total element count of the CFD simulation. (Refer to Appendix A for more
information on non-conformal meshing.)
Figure 2.3. Simplified Icepak Model with Numbered Components

9
Figure 2.4. Zoomed In View of Heat Sink from Model
Table 2.1. Modeled Components that Correlate to Numbers from Figure 2.3.
Number Component 1 Fan/Input Boundary Condition
2 Partition
3 Motherboard A
4 Motherboard B
5 Ram Sticks x8 A
6 Ram Sticks x8 B
7 CPU 1
8 CPU 2
9 Heat Sink
10 PCH Die
11 PCH
12 Hard Drive
13 Outlet Boundary Conditions
14 Chassis
In addition to running tests on the baseline extruded fin and circular pin fin heat sinks, we
tested a number of sample heat sinks manufactured by Alpha Novatech. These heat sinks were
produced using a proprietary process they refer to as “micro-forging” and are
composed of Aluminum 6063. These heat sinks were modeled in Icepak using the native heat sink
function to approximate their geometry as best as the software was capable of.
2.4 CFD SIMULATION
2.4.1 Meshing
The initial simulations consisted of parametric tests based on pin geometry and spacing to improve
the performance of a circular pin fin heat sink. These CFD simulations utilized conformal meshing
and a low iteration count for each test. Following parametric testing, the components within Icepak
were rebuilt and non-conformal meshing was implemented throughout the server. Non-conformal
meshes were created for each of the power generating components modeled in the server and the

10
partition that directing the internal fan flow. The partition was modeled as two separate Icepak
assemblies (titled “Partition1 and Fan” and “Partition 2”) to simplify the bounding boxes required
by the non-conformal assembly. The heat sink and PCH utilized a nested assembly, with one non-
conformal assembly covering the PCH and heat sink (Titled “Heat Sink B”), and a slightly less
detailed mesh surrounding that assembly and the area surrounding it (titled “Heat Sink”). All these
changes allowed for specific refinements of areas of interest, and reduced the time required to
perform each simulation.
The mesh sensitivity was tested using the baseline extruded fin heat sink by refining the
assemblies containing the heat sink and the area surrounding it. The total nodes counts for the
initial meshing parameters were 238,530 elements for the “Heat Sink” assembly, and 41,140
elements for the “Heat Sink B” assembly. Doubling both of these node counts changed the
temperature output from the CFD model by less than 1˚C, so future CFD was conducted with the
initial meshing parameters. (See Appendix A for more details on non-conformal meshing)
2.4.2 Component/Model Properties
The CFD simulations used the K-Epsilon turbulence equations at double precision to
model the turbulence in the server. The Icepak tests ran for 100 iterations for the parametric tests,
and the number increased to 400 iterations for all subsequent tests. All tests used two SUNON
PF80381B1-Q020-S99 fans arranged in series, doubling the pressure drop in the fan curve to
simulate the placement of two fans in series. The fan speed was set to run at a constant 975 RPM,
while the inlet temperature of the fan was set to 30˚C, to account for temperature changes in the
internal radiator as more energy was applied to the system. Material properties for the components
were the same in both the parametric testing and subsequent tests with the exception of the heat
sink properties. Parametric testing used the extruded fin heat sink made out of Al 6061, while the
sample heat sinks were modeled as Aluminum 6063-T5 to maintain consistency between the model
and the actual sample heat sinks. In addition to this, because Icepak could not fully replicate the
complex geometry of the hexagonal pin (N54) and the elliptical pin (W54) heat sinks, they were
approximated as circular pin and rectangular pins respectively. The configuration used to model
the heat sink and PCH is seen in Figure 2.4 and its material properties are in Table 2.2
.
Table 2.2. Heat Sink and PCH Model Properties
Part Model Material /Thermal
Conductivity (W/mK) Dimensions (mm)
PCH Block Ceramic/ 15 27 x 27 x 1.4
PCH Die Block Silicon/148 11 x 11 x 0.5
Source.1 Thermal Source 8 Watts 11 x 11
Thermal Grease Plate Thermal Paste/6 55 x 55
Heat Sink.1 Heat Sink Dependent on model 55 x 55 x 7
Two additional enhancements were also modeled in CFD: Vapor chambers and heat sink
“ducting”. A vapor chamber was modeled as a heat sink’s “base”, replacing most of the base of
the heat sink with a vapor chamber, and leaving 1 mm of base material attached to the fins of the
heat sink. The vapor chamber model was adapted from Patil’s [9] Icepak model, but making its

11
cross-sectional area the same as the heat sink’s and reducing the thickness of each of its
components by half, as seen in Figure 2.5 and Table 2.3 In addition to the vapor chamber,
experimentation was done using a form of “ducting” which consisted of a 19 x 8 x 1 mm3 and a
55 x 8 x 1 mm3 partition positioned 1 mm away from the heat sink on the positive and negative z
axes respectively. These miniature partitions were placed to block airflow that would otherwise
flow out of the heat sink along the negative z-axis. This forced air to flow through the length of
the heat sink, increasing its effectiveness. The partitions were considered to be composed of
extruded aluminum which is the same material as the server chassis.
Figure 2.5. Patil’s [9] Icepak Vapor Chamber Model
Table 2.3: Vapor Chamber Model Properties
Part Model Material /Thermal
Conductivity (W/m°K) Dimensions (mm)
PCH Block Ceramic/ 15 27 x 27 x 1.4
PCH Die Block Silicon/148 11 x 11 x 0.5
Source.1 Thermal Source 8 Watts 11 x 11
Thermal Grease Plate Thermal Paste/6 55 x 55
Vapor Chamber Wall 1 Block Copper/387.6 55 x 55 x 0.75
Vapor Chamber Wick Block Sintered Copper Powder/50
55 x 55 x 0.25
Vapor Chamber Vapor Block Water Vapor/ 30,000 55 x 55 x 0.5
Vapor Chamber Wall 2 Block Copper/387.6 55 x 55 x 0.75
Heat Sink 1.1 Heat Sink Dependent on Model 55 x 55 x 5

12
2.5 EXPERIMENTAL TESTING SETUP
In order to confirm results obtained through CFD simulation and ensure accuracy in the model,
experimental testing was performed using the existing heat sink within the Winterfell 2OU hybrid
cooling server. The experimental setup is located in Woolf Hall 109, also known as the airflow
bench lab, and may be seen in Figure 2.6 below. A series of scripts designed for the Winterfell
server were used to stress the server components and record their temperatures using built in
temperature sensors for each component. The experimental testing setup consisted of the server
(Right), a liquid cooling system (Top) with breadboard circuit control, and data acquisition (DAQ)
system (Top) consisting of an Agilent 34972A device.
The server is powered by a Corsair CS series external power source, CS750M (Bottom Right).
Within the server, the extruded fin heat sink used for was attached to the PCH using a z-clamp
attached to the motherboard to apply a downward force between the PCH and heat sink. The heat
sink assembly within the server may be seen in Figure 2.7. Before applying the z-clamp
connection, a thermal interface material (Shin-Etsu X23-7783D thermal grease) was applied to the
PCH to ensure adequate conduction between the surface of the PCH and the heat sink base.
Figure 2.6 Experimental testing setup
The liquid cooling system consisted of two hoses carrying water as the cooling fluid into and out
of the cold plates cooling each CPU. The heated fluid passes through the cold plates located

13
beneath the CPUs and carries the liquid to an external radiator to be cooled. The radiator as seen
in Figure 2.6 contains a fan operating at maximum capacity to ensure that the internal fan’s inlet
temperature remained as consistent as possible. Once cooled, the fluid is then directed back into
the server to complete the cycle.
Figure 2.7. Heat sink assembly with z-clamp attachment to motherboard
To collect data, the server was connected to a computer using a standard Ethernet connection to
collect temperature data from the PCH and CPUs, as well as the RPM of the fan located inside the
server. Additional data was collected for the inlet and outlet temperature of the air flowing on
either side of the internal fan. This was done using two type J thermocouples connected to an
Agilent 34972A device connected to the PC and operated using Agilent Device Manager. Since
the PCH cannot be stressed independently, and is based off the CPU and memory utilization, a
series of scripts were run from the computer which would stress the server’s CPUs and DIMMs at
specific intervals. This generated varying levels of heat within the server for each component. The
temperature data for each interval was collected overtime for both the PCH and CPUs using
another set of scripts. Overall, the testing procedure consists of temperatures being recorded at
three second intervals over the course of six hours. Temperature data was recorded at system stress
levels of 40, 60, 80, and 100% CPU utilization as well as the CPU + MEM utilization.

14
2.6 SIMULATION RESULTS
The simulation results displayed some notable trends. The maximum PCH temperatures
from the base, “ducting”, and vapor chamber testing can be seen in figure 2.8. The baseline case
outperformed both the square pin (S1555) and the hexagonal pin (N54) heat sinks, and had
equivalent performance with the elliptical (W54) and circular pin fin (22x22) design. The square
pin design was outperformed by the strip fin (Z54) design. The introduction of the partition
lowered the PCH temperatures of the square, elliptical, and strip fin designs, but was most effective
for the square pin design.. These improvements are likely due to air being reintroduced to the heat
sink, but may also be due to additional convection of the miniature partition. While this partition
is not connected to the heat sink, hot air flowing from the heat sink may cool on contact with the
partition before flowing back into the heat sink, acting as a “pseudo-fin”. The introduction of the
miniature partitions increased the temperature of the hexagonal and circular pin heat sinks. A
possible reason for this is that the partition interferes with the air flow mixing resulting from
circular pin designs.
Figure 2.8. Maximum PCH Temperatures of various heat sink arrangements
The results for a “combined” heat sink, utilizing both the miniature partition, as well as the
vapor chamber base, can be seen in Figure 2.9. Since the extruded fin heat sink does not have an
air flow path in the direction of the miniature partition, the data from the vapor chamber test was
utilized instead. The maximum PCH temperature of the hexagonal pin and square pin heat sinks
were higher than the extruded fin’s, the elliptical fins and circular pins were comparable, and the
strip fin heat sinks were 2 ˚C lower. Overall, the strip fin heat sink (Z54) with miniature partition
and vapor chamber base experienced the greatest temperature reduction from the baseline case at
4.5˚C.
64
65
66
67
68
69
70
71
72
73
74
Base Ducted Vapor Chamber
Max
imu
m P
CH
Tem
per
atu
re (
°C)
Heat Sink Modification
Maximum PCH Temperatures
Extruded Fin
W54
N54
S1555
Z54
22x22

15
Figure 2.9. Combined “ducting” and vapor chamber heat sinks
2.7 EXPERIMENTAL TESTING RESULTS
Once experimental testing for the extruded fin heat sink was complete, the fan intake and output
temperatures for the internal fan recorded by the thermocouples were plotted over time as seen in
Figure 2.10. Each peak in this temperature data represents the server operating at different CPU
utilization levels with the troughs representing the system returning to Idling temperatures between
different stress intervals. These range from 29.5 °C at 40% CPU utilization to 32 °C at 100% CPU
+ MEM utilization.
Figure 2.10 Baseline Case: Internal Fan Inlet & Outlet Temperatures
64
65
66
67
68
69
70
71
72
Combined
Max
imu
m P
CH
Tem
per
atu
re (
°C)
Heat Sink Modification
Maximum PCH Temperatures
Extruded Fin
W54
N54
S1555
Z54
22x22
26
27
28
29
30
31
32
33
0 5000 10000 15000 20000 25000
Tem
per
atu
re (°C
)
Time (Seconds)
Internal Fan Inlet & Outlet Temperatures
Fan Intake
Fan Output
16
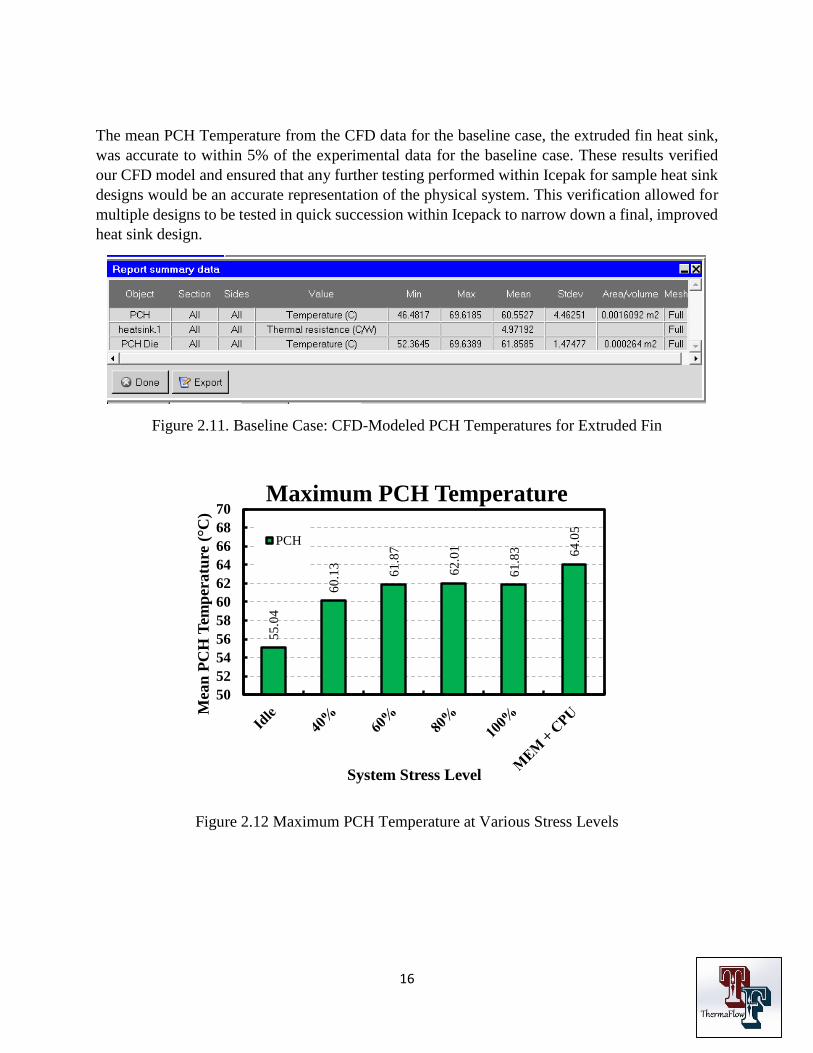
The mean PCH Temperature from the CFD data for the baseline case, the extruded fin heat sink,
was accurate to within 5% of the experimental data for the baseline case. These results verified
our CFD model and ensured that any further testing performed within Icepak for sample heat sink
designs would be an accurate representation of the physical system. This verification allowed for
multiple designs to be tested in quick succession within Icepack to narrow down a final, improved
heat sink design.
Figure 2.11. Baseline Case: CFD-Modeled PCH Temperatures for Extruded Fin
Figure 2.12 Maximum PCH Temperature at Various Stress Levels
55
.04
60
.13
61
.87
62
.01
61
.83 64
.05
50
52
54
56
58
60
62
64
66
68
70
Mea
n P
CH
Tem
per
atu
re (°C
)
System Stress Level
Maximum PCH Temperature
PCH

17
3. CONCLUSION
Due to design modifications of the 2OU Open Compute Server, the current cooling system is
allowing the PCH temperature to reach inefficient levels. Modifying the heat sink to reduce the
PCH temperature was needed in order to increase the energy efficiency of the server. By
developing a solid model of the server and its components, the team was able to perform CFD
simulation. Performing experimental testing at various CPU and memory stress levels for the
existing heat sink design ensured that each simulation for prospective heat sink designs would be
an accurate representation of the physical system and established a baseline PCH temperature for
new designs to be compared to.
Once the baseline temperature values were established, a series of simulations were performed
for various heat sink designs. The general assumption made when selecting new designs was that,
by increasing the ability for air to flow through the heat sink by changing pin and fin geometries,
that the PCH temperature would be reduced. Incorporating a vapor chamber, and adding
components restricting airflow to a preferred orientation along the heat sink also improved heat
dissipation from the PCH. A comparison of each design and the corresponding PCH temperatures
relative to the experimental data for the extruded fin heat sink was performed. The results from
this comparison indicated that a cross cut fin design seen in Figure 3.1, incorporating a vapor
chamber and airflow restriction along preferred orientations would decrease the maximum PCH
temperature by 4 ºC. Dimensions for this design may be found in appendix B.2.
Figure 3.1 Cross cut fin heat sink

18
3.1 FURTHER WORK
Some possible future experimentation may be experimentally verifying the pressure and
volumetric flow rate of our CFD. In order to do this, we would need to determine a method of
measuring the pressure and volumetric flow of a recirculating server. In addition to this, the PCH
heat flux was limited by the utilization of other components in the server. Further testing could be
conducted for alternate heat fluxes to test heat sink performance under higher stress conditions. As
our physical testing was limited to the baseline case, we could not verify the power savings that
alternate heat sink designs would have offered. As such, a possible future experiment could
investigate the power savings from both the internal and external fans.

19
REFERENCES
[1] Koomey, J.G., 2011, “Growth in Data Center Electricity Use, 2005 to 2010” Analytics Press,
Oakland, CA.
[2] Lacey, Stephen, 2013, "Data Center Efficiency May Be Getting Worse." n.d. from
http://www.greentechmedia.com/articles/read/are-data-centers-getting-less-energy-efficient
[3] OpenCompute Project, 2016, from http://www.opencompute.org/
[4] Mani, Divya, “Improving Ducting to Increase Cooling Performance of High-End Web
Servers Subjected to Significant Thermal Shadowing – an Experimental and Computational
Study,” Master’s Dissertation, Department of Mechanical Engineering, University of Texas at
Arlington, Arlington, TX, 2014.
[5] A. Dvinsky, A. Bar-Cohen and M. Strelets, "Thermofluid analysis of staggered and inline pin
fin heat sinks," Thermal and Thermomechanical Phenomena in Electronic Systems, 2000.
ITHERM 2000. The Seventh Intersociety Conference on, Las Vegas, NV, 2000, pp. 164.
[6] C. L. Chapman, S. Lee and B. L. Schmidt, "Thermal performance of an elliptical pin fin heat
sink," Semiconductor Thermal Measurement and Management Symposium, 1994. SEMI-THERM
X., Proceedings of 1994 IEEE/CPMT 10th, San Jose, CA, 1994, pp. 24-31.
[7] A. Dewan, P. Patro, I. Khan and P. Mahanta, “ The effect of fin spacing and material on the
performance of a heat sink with circular pin fins,” Department of Mechanical Engineering,
Indian Institute of Technology Guwahati, Guwahati, India, 2009.
[8] H. Jonsson and B. Moshfegh, "Modeling of the thermal and hydraulic performance of plate
fin, strip fin, and pin fin heat sinks-influence of flow bypass," in IEEE Transactions on
Components and Packaging Technologies, vol. 24, no. 2, pp. 142-149, Jun 2001.
[9] Patil, Dhanraj Arun. “CFD Modeling and Parametric Study of Vapor Chambers as Heat
Spreaders for High-Power Electronic Devices” Master’s Dissertation, Department of Mechanical
Engineering, University of Texas at Arlington, Arlington, TX, 2015.
[10] R. Ranjan, J. Y. Murthy, S. V. Garimella, D. H. Altman, and M. T. North, “Modeling and
Design Optimization of Ultra-Thin Vapor Chambers for High Heat Flux Applications,” IEEE
Transactions on Components, Packaging and Manufacturing Technology, Vol 2(9), pp. 1465-
1479, 2012.

20
APPENDIX A ICEPAK
ANSYS Icepak is the CFD software utilized in this project due to its analytic capability.
Many features in Icepak allow for quick creation and simulation of a range of electronic models.
One of the most useful features of Icepak is its vast library of electronic components, which allow
for rapid creation and variation in a cooling model. This includes fans, heat sinks, thermal
interfaces, and filters. In addition, Icepak has a robust CAD model import feature, which allows
models created in software such as SolidWorks or Creo to be imported into Icepak models as both
individual parts and assemblies. Icepak has a number of pre and post-processing tools that are utilized in this project. For
pre-processing, Icepak has a built in optimization feature which allows for both parametric trials
and optimization functions. For post-processing, individual features in the model can be analyzed
for thermal or fluid properties, and summary reports can be generated for each test. In Icepak, one often only requires information about a specific section of their cabinet, and
the rest of the server is often of minimal importance. However, increasing the precision of an entire
cabinet can raise its element and node counts to egregious levels. To avoid this issue, non-
conformal meshing can be used. Non-conformal meshing is the use of specific refinements in a
cubic volume surrounding one or more components in an Icepak cabinet. Non-conformal meshing
is accomplished in Icepak by the use of assemblies, which contain one or more Icepak-native
objects and a specified slack region around them. Non-conformal meshing is particularly useful
for thin objects that can increase the element count throughout a cabinet, as seen in Figures R and
T.
Figure A.1 Object with conformal meshing
Figure A.2 Object with non-conformal meshing

21
APPENDIX B HEAT SINK DESIGNS
B.1 EXTRUDED FIN

22
B.2 CROSS CUT FIN: Z54

23
B.3 SQUARE PIN: S1555

24
B.4 ELLIPITICAL PIN: W54

25
B.5 HEXAGONAL PIN: N54

26
APPENDIX C SERVER COMPONENTS
C.1 SERVER ASSEMBLY

27
C.2 CHASSIS

28
C.3 CHASSIS TOP

29
C.4 FAN CASING

30
C.5 HARD DRIVE

31
C.6 MOTHERBOARD A
32
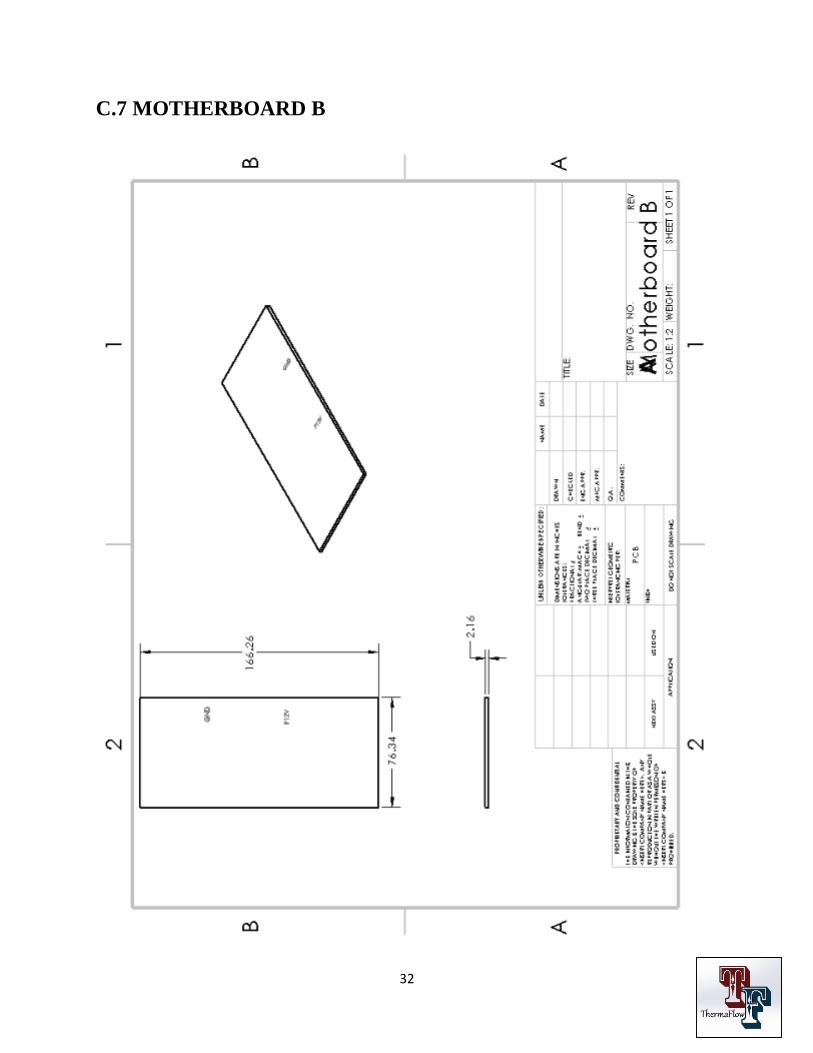
C.7 MOTHERBOARD B

33
C.8 PARTITION

34
C.9 PCH
35
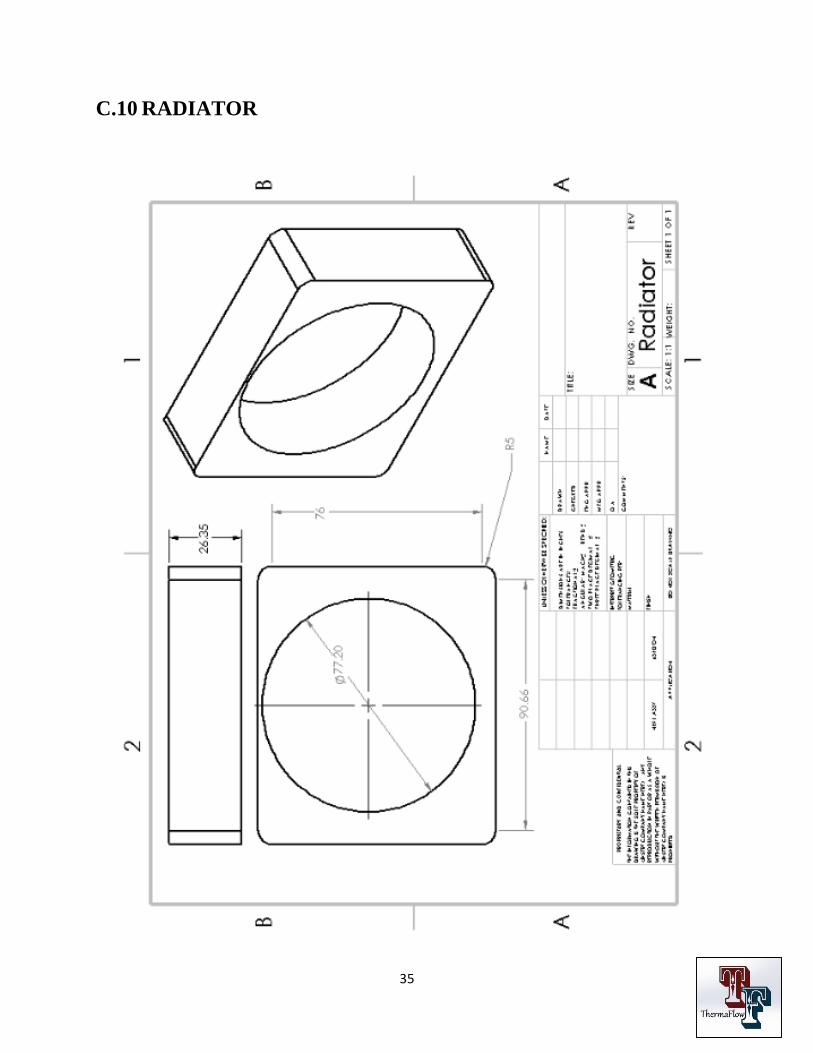
C.10 RADIATOR

36
C.11 RAM STICK