seneca niagara casino: fiscal & economic impact on niagara falls, ny
TRANSCRIPT

SENECA NIAGARA CASINO
FISCAL & ECONOMIC IMPACT ON NIAGARA
FALLS, NY
In partnership with Gaming & Resort Development, Inc.
Prepared for: USA Niagara Development Corporation
Kent Gardner, PhD
Project Director One South Washington Street
Suite 400 Rochester, NY 14614
Phone: (585) 325-6360 Fax: (585) 325-2612
100 State Street Suite 930
Albany, NY 12207 Phone: (518) 432-9428
Fax: (518) 432-9489 www.cgr.org
June 2005
© Copyright CGR Inc. 2005 All Rights Reserved
Research to drive informed decisions. Expertise to create effective solutions.

i
SENECA NIAGARA CASINO
FISCAL & ECONOMIC IMPACT ON NIAGARA FALLS, NY
June 2005
The Center for Governmental Research and Gaming and Resort Development were pleased to respond to USA Niagara’s request for a 2003-2004 fiscal and economic analysis of the Casino’s impact on Niagara Falls, New York and to submit this report of our findings.
The story is a developing one. The Casino is operating in the renovated former Convention
Center, with net gaming revenue for the 2004 calendar year of $295 million. Net gaming revenue for the most recent quarter (ending 3/31/05) was $70.2 million, down 5% from $74.1 million
in the same quarter of 2004.* The Seneca Gaming Corporation’s 8-K report for the fiscal year ended 9/30/04 indicated total visitation for both Seneca Niagara and Seneca Allegany casinos at 7.3 million.
Planned expansion continues. The steel frame of a planned 26 floor luxury spa hotel expansion is completed with the
*As the decline was primarily in table game revenue, this should not negatively affect the exclusivity payment. http://www.senecagamingcorporation.com/pressReleases.html
SUMMARY
Seneca Niagara Casino Gaming Revenue
$0.0$10.0$20.0$30.0$40.0$50.0$60.0$70.0$80.0
03Q1 03Q2 03Q3 03Q4 04Q1 04Q2 04Q3 04Q4 05Q1
Calendar Yr Quarters
Mill
ions
Source: Seneca Gaming Corporation

ii
opening of the public spaces planned for November, 2005. Expanded offerings in the first phase of opening will include 35,000 square feet of gaming, including an additional 950 slot machines, a full service salon and spa, a 35,500 square foot multi purpose room, three restaurants and 300 hotel rooms with an additional 300 rooms opening in 2006. Final hotel completion is expected in early 2006 at a total cost of approximately $200 million.*
The economic impact of the Casino, both primary (through employment at the Casino) and secondary (through the spending of Casino employees and the Casino itself) is substantial. Available data coupled with anecdotal information from community members indicates that the Casino attracts principally “day trippers” and that these visitors patronize businesses outside the Casino only infrequently.
Onsite jobs total about 2,100 with wages of more than $60 million. Adjusted for displacement of other spending within the regional economy, net employment is estimated at 1,500 with payroll of about $45 million. CGR estimates that “spillover” employment in the region (defined as Erie and Niagara counties) exceeds 1,000 positions earning about $30 million in payroll.
Secondary wages are expected to more than double by the end of the Compact term along with expansion of total gaming revenue at the Casino.
The fiscal impact of onsite and spillover employment is also significant.
Personal income tax revenue to the State of New York for 2004 is estimated at about $2.5 million.
We estimate that sales tax payments for 2004 totaled nearly $7 million annually with $3.5 million flowing to New York State and $3.1 million received by local governments in the region.
* http://www.senecagamingcorporation.com/secFilings.html
Key Findings

iii
While the development and operation of the Casino may have reduced revenue to the City of Niagara Falls and other taxing jurisdictions, these losses are modest and likely to disappear as the casino expands and the community develops attractions and services that will appeal to the Casino visitors.
The taxable assessed value of lands to be taken into trust (thus removed from the tax rolls) totals $14.6 million. Adding properties (other than the Casino itself) presently owned by the Seneca Nation that are not currently taxable brings this total to $17.5 million*. While the annual tax liability on these properties is about $1.1 million ($0.5 million to the City of Niagara Falls), actual property tax payments made to all jurisdictions in 2004 was about half this amount with the City of Niagara Falls receiving $175,562.
The closure of the Convention Center appears to have reduced the number of large groups visiting Niagara Falls, thus the number of room nights and consequent hotel/motel occupancy tax. Confounding trends and limited data make it impossible to quantify this impact. In fact, hotel/motel occupancy tax receipts for 2004 ($1.2 million) are comparable to sums received in the years immediately preceding the development of the Casino. A shortfall in receipts during 2003 can be attributed to a number of unrelated factors. The Conference Center, completion of the Casino’s hotel and renovation of other lodging facilities in the City should add to the number of groups visiting Niagara Falls and create spillover revenues for Niagara Falls businesses and government.
Costs imposed on the City of Niagara Falls as a consequence of the Casino are also small. While additional traffic for Casino-sponsored events has increased the burden on the Niagara Falls Police Department, a substantial portion of additional staffing costs is reimbursed through an agreement with the Seneca Gaming Corporation. The City appears to be earning offsetting revenue from parking violations, however.
* This excludes properties that were not taxable prior to the establishment of the Casino.

iv
Future economic growth is likely to come from expansion of the Casino itself and improved connections between the Casino and complementary businesses in the City of Niagara Falls. Strategic investment in the immediate vicinity, including beautification efforts along City gateways, the renovation of Third Street, new or remodeled lodging and attractions aimed at extending the stay of Casino visitors (such as bingo) would broaden the future impact of the Casino on the community.
The community’s share of exclusivity payments can be a powerful tool for economic expansion. While a portion of these revenues should be devoted to investments that help ensure the Casino’s continued success, other investments can be used to strengthen the community’s competitiveness in unrelated sectors.
The Casino has affected the City of Niagara Falls in a number of ways. The success of the Casino itself highlights the fact that total traffic into the community has increased substantially. Overall, the Casino complements the Falls and other community attractions, broadening the appeal of the community.
The most demonstrable economic impact in the community is the increased employment. Net new employment at the Casino (net of displacement) is estimated at about 1,500 with employees earning more than $45 million. Indirect and induced employment brings the total to nearly 2,600 with total earnings of about $76 million.
NYS personal income tax earned from these taxpayers reached about $2.5 million in 2004. Sales tax earnings were an estimated $3.1 million to local government with $3.5 million flowing to the State of New York.
Exclusivity payments flowing to New York State and to Niagara Falls respectively were $39.0 million and $9.8 million in 2003 and $44.8 million and $11.2 million in 2004. Over the fourteen year projection period, casino revenues are forecast to grow from the estimated 2003 level of $252.2 million to $483.2 million by 2016;
The Casino’s Impact on Niagara Falls
Economic & Fiscal Impacts of Casino Employment

v
with the local portion of the exclusivity fee increasing from $9.8 million to $30.2 million.
The share of sales tax revenue distributed among Erie and Niagara counties and their individual municipalities (including the City of Niagara Falls) depends on where workers live and where retail dollars are actually being spent. As a substantial share of the county sales tax is distributed among municipalities according to population, and because the Casino’s impact on the Niagara Falls community will likely include population expansion due to increased direct and indirect employment, we thus eventually anticipate an increase in the City’s share of the County sales tax revenue. The retail sector of the City of Niagara Falls has significant growth potential and can be expected to capture retail sales from Niagara Falls, Ontario and Erie County. It is nevertheless difficult to state unequivocally that anticipated growth will in the end offer compensating tax revenue for the City.
The Casino’s plans to expand its retail offerings does challenge this potential as the Seneca Nation will not collect sales tax on behalf of the State and County. At the same time, successful strategies to leverage off-casino spending could greatly enhance sales tax revenues.
Direct evidence of the Casino’s impact on the surrounding neighborhoods and other local businesses is limited. At the same time, the negative impact of SARS on Canadian travel during 2003 has clouded comparative data. It is clear that 2003 was not a good year for Niagara Falls business firms. Whether business would have been better or worse without the Casino is impossible to discern, although any possible positive impact would have been small.
Without growth of taxable activity, the City of Niagara Falls must absorb additional costs without compensating tax revenue. Although tax revenue received by the City of Niagara Falls and other taxing jurisdictions from the 52 acre site was small before the Casino opened (as the Convention Center was owned by the
Catalytic Impacts Have Yet to Materialize
Local Revenue Losses Limited

vi
state’s Urban Development Corporation, thus nontaxable), both the actual receipts and possible future receipts are no longer available to the community.
Additional costs to the City appear to be small. Expenditure records for the City for the past 4 years—and conversations with City officials—have allowed us to consider the actual costs imposed on the City because of the existence of the Casino. City officials anticipate additional needs arising as the permanent casino and hotel open for business. For example, once the hotel opens, it will be the tallest building in the city. The fire department would like the Casino to incorporate the storage of fire safety equipment on higher floors. The impact of the Casino on medical response has been negligible, however, as the Casino provides its own staff to respond to medical emergencies among its patrons.
Because the Casino is located in an existing tourist area, the police department already finds it needs to issue additional citations. The police department has incurred some increased overtime costs because of special events at the Casino, but the Casino hires additional officers at its own expense and assumes the majority of additional costs. Currently the Casino hires state police to provide all presence inside the Casino while Niagara Falls polices the exterior. Moreover, the Seneca Gaming Corporation has its own security department that patrols the parking ramp. The Niagara Falls Police Department has created no new positions as a result of the Casino’s presence and the Superintendent observed that any increases in any sorts of crime (which have yet to be documented) are attributable not to casino traffic per se, but to more traffic in general.
We believe that there remains a substantial opportunity for an expansion of Niagara Falls businesses. Opportunities for the City of Niagara Falls fall into four categories:
First, the community must recognize that the Casino itself is creating new employment opportunities for City residents, which will stimulate neighborhood revitalization, increase sales and
Building on the Casino’s Success

vii
property tax revenue and create new demand for goods and services within the community. It is incumbent upon the community to continue to work with the Seneca Gaming Corporation to make the Seneca Niagara Casino as successful as possible. A prosperous and attractive community is in the interest of the City and the Casino.
Second, the Casino is attracting a very large number of visitors to Niagara Falls, NY. At present, there is little to retain these visitors for a more extended stay. The allure of attractions in Niagara Falls, Ontario is, of course, substantial. Nonetheless, a great deal can be done to improve the physical appearance of the City and to encourage complementary business development. These efforts are already underway (the Third Street project, for example) and should be encouraged.
Third, the combined appeal of the Casino and the Falls, supported by the new Conference Center, make Niagara Falls an attractive destination for conventions of modest size. Additional investments in hotels and motels will be necessary if this potential is to be realized.
Finally, the local share of exclusivity payments to the State of New York can be used to stimulate business expansion and improve the character of the community.
Our research demonstrates that approaches to allocating “windfall” revenues from ventures like casino gambling are as varied as the communities themselves. Clearly local needs vary and the purpose of promoting casino gambling also varies, leading to very different perspectives on the “right” approach to this controversial question.
Our analysis of a number of communities has still provided some guidance. Our research suggests the following principles:
The City of Niagara Falls has a clear claim to a reliable share of the flow of funds generated by the presence of the Casino.
Allocating the Local Share of Exclusivity Payments
Principles for Allocation

viii
The expenditure of these funds is ideally targeted toward complementary investments, e.g. beautification, business and economic development and neighborhood revitalization.
Funds flowing to the local economy from the exclusivity payments are modest relative to the list of possible uses. To have the greatest impact, a careful process of analysis should be put in place, ensuring that scarce dollars are used productively.
Casino impacts, both positive and negative, flow well beyond the borders of the host community. The burden of problem gambling, for example, will be felt by the community in which the problem gambler resides, not the Casino host community. Similarly, the region and the state will benefit from a vibrant and competitive Niagara Falls, NY
Again, there is no objectively correct allocation of the exclusivity payments. We recommend the following model:
The City of Niagara Falls should have exclusive control over a fixed portion of fee revenue, recognizing the inevitable costs imposed on the City by the presence of the Casino and the City’s particular responsibility for maintaining community infrastructure that can influence the relative success of the Casino. We estimate that the current or formerly taxable properties within the 52 acres becoming trust lands (but excluding the former Convention Center in which the Casino is located) would have generated about one-half of a million dollars in property tax revenue to the City were it fully taxable and were the owners of these properties current with their tax obligations. We suggest that a portion of the exclusivity fee to be regarded as a “payment in lieu of taxes” to be spent at the City’s sole discretion. Further, recognizing that economic activity stimulated by the Casino has driven up costs to the City, we propose that this sum be doubled. The one million dollars would increase annually at the rate of general price inflation.
The remaining funds should be dedicated to stimulating the economic development of the Niagara Falls economy and addressing demonstrable negative impacts of casino gambling on the community, beyond the fiscal impacts imposed upon the City of Niagara Falls (see the discussion of social impacts below).
A Recommended Approach

ix
Multiple year allocations of funds could be permitted to make it possible for recipients to bond against these multi-year allocations (although there is some risk involved in bonding against unrealized revenues).
An economic impact assessment tool should be used by applicants for casino funds. Included in the assessment provided in the application should be an evaluation procedure to help determine whether the impacts forecast in the assessment were achieved. This assessment would be advisory only but would be part of the public record.
The assessment form will be prepared by the applicant but reviewed by professional staff or an outside evaluator.
The story of the Casino’s impact on Niagara Falls is just beginning and will be determined, in no small part, by the way funds from the Compact are ultimately used. We commend the community for its willingness to grapple with the challenges it faces, and to learn from the lessons of other communities, as it moves forward.
Contributing Staff
Rebecca Sumner, Ph.D. (CGR)

x
Summary..................................................................................................i Key Findings ....................................................................................................... ii The Casino’s Impact on Niagara Falls ....................................................................iv
Economic & Fiscal Impacts of Casino Employment ..............................................iv Catalytic Impacts Have Yet to Materialize ........................................................... v Local Revenue Losses Limited ........................................................................... v
Building on the Casino’s Success...........................................................................vi Allocating the Local Share of Exclusivity Payments ................................................vii
Principles for Allocation....................................................................................vii A Recommended Approach ............................................................................. viii
Table of Contents....................................................................................x
Acknowledgments ................................................................................ xv
Introduction............................................................................................1
Part I: Economic & Fiscal Impact of Seneca Niagara Casino .................4
Economic Impact ....................................................................................5 Gaming Revenue................................................................................................. 5
Revenue Trends for Seneca Niagara .................................................................. 6 Primary Employment & Payroll.............................................................................. 8
Distribution of Employment by Place of Residence ...................................... 9 Primary Employment & Payroll Displacement ....................................................... 10
Estimating Displacement................................................................................. 10 Economic Impact Off Site................................................................................... 11
Profile of Casino Patrons (NTCC Survey) .................................................. 12 Impact of Casino on Tourism........................................................................... 12 NTCC Survey ................................................................................................. 15 Future Visitor Spending................................................................................... 17
Future Financial Prospects for Casino ..................................................18 National Casino Gaming Trends .......................................................................... 19
TABLE OF CONTENTS
xi
Niagara Falls, New York Regional Market Demand Assessment.............................. 22 Demographics................................................................................................ 23
Demographic Analysis—100 Mile Radius, Rochester, NY ............................ 23 Assessment Model.......................................................................................... 24 Readily Accessible Venues............................................................................... 26
New York State Gaming ..................................................................................... 26 Racetracks, Charitable Gaming, Lottery ............................................................ 27 Indian Gaming ............................................................................................... 28 Ontario Casinos.............................................................................................. 30
Niagara Falls, Ontario Casinos................................................................. 31 Fort Erie Racetrack................................................................................. 32 Casino Niagara (12/96) & Fallsview Casino ( 6/04).................................... 33
Estimated Market Shares & Penetration Rates...................................................... 34 Future Casino Development Projects ................................................................... 37 Competitive Impact of New Casinos .................................................................... 38
Market Share Redistribution Analysis ....................................................... 39 Potential Future Revenue Scenarios .................................................................... 40
Seneca Erie County ........................................................................................ 40 Seneca Niagara Expansion .............................................................................. 40 Market Growth ............................................................................................... 41 New Development .......................................................................................... 41
Seneca Niagara Casino – Forecast of Gaming Revenue & Visitation ............ 43 Seneca Niagara Casino – Forecast of Onsite Jobs & Nongaming Revenue ... 44
Economic & Fiscal Impact of Seneca Niagara Casino ...........................45 Offsite Job Creation ........................................................................................... 45
Seneca Niagara Casino – Forecast of Economic & Fiscal Impact ................. 46 Offsite Visitor Spending .................................................................................. 46
Fiscal Impact .................................................................................................... 47 Sales & Personal Income Tax .......................................................................... 48
Collections from Proposed Trust Lands, 2004 ........................................... 48 Property Tax.................................................................................................. 48
Property Tax Liability 2004: Niagara Falls Trust Lands.............................. 49 Niagara County Impact ...................................................................................... 49
Hotel/Motel Occupancy Tax............................................................................. 50 Expenditures..................................................................................................... 51

xii
Fire Department............................................................................................. 51 Police Department.......................................................................................... 51 Convention Center.......................................................................................... 52 Parking.......................................................................................................... 53
II: Enhancing the Long Term Prosperity of Niagara Falls Through Strategic Use of Casino Revenue ..........................................................55
Spending Casino Revenue in Niagara ...................................................55
Revenue Sharing Agreements at Other Indian Casinos........................56 Individual Casino Revenue Sharing Agreements ................................................... 56
Overview....................................................................................................... 56 Oneida Bingo and Casino, Green Bay, WI ......................................................... 57 Casino of the Sun, Tucson, AZ......................................................................... 58 Seminole Casino of Tampa, Tampa, FL............................................................. 59 Sandia Casino, Albuquerque, NM ..................................................................... 59 Detroit Greektown, Detroit, MI ........................................................................ 60 Grand Casino, Hinckley, MN ............................................................................ 61
Assessing the Relationship Between Casinos and Economic Development.........................................................................................62
Comparison Cities Unemployment Rate Trend .......................................... 62 Ontario, Canada ................................................................................................ 64 Gambling in Detroit, Michigan............................................................................. 65 Gambling in Kansas City..................................................................................... 67 Indian Gaming in Arizona ................................................................................... 68 Elgin, Illinois ..................................................................................................... 69 Biloxi, Mississippi ............................................................................................... 71
Property Tax Payments: Biloxi Casinos (2003) ......................................... 72 Spending ....................................................................................................... 72 Governance ................................................................................................... 72 Implementing it in Niagara.............................................................................. 72
An Approach to Investing Casino Proceeds in Future of Niagara Falls.74 Allocating the Local Share of Exclusivity Payments ............................................... 74
Criteria to Apply to Payments .......................................................................... 74 The Compact &Process of Fund Allocation ........................................................ 75
Investment Criteria: Support Casino Expansion ................................................... 76
xiii
Investment Criteria: Ensuing Proposed Uses..................................................... 76
Social Impacts of Casino Gambling ......................................................78 Analysis of 100 Communities With and Without Casino Gaming ............................. 78 Association Between Problem Gambling & Casino Proximity .................................. 80 Consequences of Problem Gambling ................................................................... 83
Physical and Mental Health ............................................................................. 83 Impact on Families ......................................................................................... 84
Crime ............................................................................................................... 85 Calculating Crime Rates .................................................................................. 85 Prostitution.................................................................................................... 85 Drug Arrests .................................................................................................. 86 Organized Crime ............................................................................................ 86
Applying Findings to Niagara Falls....................................................................... 86 Data From New York ......................................................................................... 87
Gambling Recovery Program: Jewish Family Service in Buffalo ........................... 88 Number of Gamblers Seeking Counseling Services, 2001-2004................... 88
New York Council on Problem Gambling ........................................................... 88
Opportunities for Future Study.............................................................90
Appendix...............................................................................................92
Models of Targeted Economic Development Spending.........................92 Model 1: Metroplex............................................................................................ 92
Spending ....................................................................................................... 93 Governance ................................................................................................... 94 Implementing it in Niagara.............................................................................. 94
Model 2: Tobacco Region Opportunity Fund......................................................... 95 Spending ....................................................................................................... 95 Governance ................................................................................................... 96 Implementing it in Niagara.............................................................................. 97
Model 3: Michigan Life Sciences Corridor ............................................................. 98 Spending ....................................................................................................... 98 Governance ................................................................................................... 99 Implementing it in Niagara.............................................................................100
Model 4: Casino Reinvestment Development Authority (Atlantic City)....................101
xiv
Spending ......................................................................................................102 Governance ..................................................................................................103 Implementing it in Niagara.............................................................................103
xv
In addition to assistance from staff of the USA Niagara Development Corporation (particularly John Risio), we wish to thank many members of the staff of the City of Niagara Falls (particularly Maria Brown) and the many elected officials at other levels and units of government.
Staff Team
Rebecca Sumner ably served as principal staff for this project, coordinating all aspects of the effort from data collection and interviews to analysis and interpretation of gathered data.
ACKNOWLEDGMENTS

1
Under a Class III gaming compact agreement between the Seneca Nation and the State of New York, the Seneca Niagara Casino opened on December 31, 2002 in the converted Niagara Falls Convention Center. As of June 30, 2004, the Casino contained the following:
• 3,238 slot machines • 97 table games • 16 poker tables • Keno lounge & bar • Thunder Falls Buffet (410 seats) • Morrie’s Place (179 seat full service restaurant) • Western Door (175 seat steakhouse & 75 seat bar) • Bear’s Den (468 seat theater) • Club 101 (casino bar) • Two snack bars • 2,400 space parking garage • Surface parking for 550 vehicles
The Seneca Gaming Corporation reports that the Casino attracted 4.3 million patrons during the 2003 calendar year, nearly 12,000 each day. Total visitation through 9/31/2004 reached 7.3 million, although this includes visits to the Seneca Allegany Casino. According to a survey conducted by Niagara University on behalf of the Niagara Tourism and Convention Corporation (NTCC), 39% of visitors to Niagara Falls reported the Casino as the primary reason for their visit (although only 11% selected the Casino as their sole “primary purpose”—respondents were permitted to select up to three of the options).
Net gaming revenue for the 2004 calendar year was $295 million, up from $252.2 million in 2003. Revenue for the most recent quarter (ending 3/31/05) of was $70.2 million, down 5% from $74.1 million in the same quarter of 2004.
Exclusivity payments flowing to New York State and to Niagara Falls respectively were $39.0 million and $9.8 million in 2003 and $44.8 million and $11.2 million in 2004. Over the fourteen year
INTRODUCTION

2
projection period, casino revenues are forecast to grow from the estimated 2003 level of $252.2 million to $483.2 million by 2016; with the local portion of the exclusivity fee increasing from $9.8 million to $30.2 million.
These statistics demonstrate that the Seneca Niagara Casino is an unambiguous success for the Seneca Gaming Corporation and the Seneca Nation. This study asks a different question: How is the Casino affecting Niagara Falls? How is the revenue flowing into the community from the exclusivity payments best spent to improve the regional economy for the long term?
In engaging CGR and Gaming & Resort Development, Inc., USA Niagara Development Corporation seeks to understand the role played by the Seneca Niagara Casino in the economy of the City of Niagara Falls and the region. Some impacts are easily counted; others are more difficult to discern. While the Casino brings obvious benefits, it has also brought costs that are more difficult to sum.
Our study has a number of elements, each of which contributes to the complete picture. The first half of the report assesses the impact of the Casino. Elements include estimates of:
Likely trends in casino revenue at Seneca Niagara as a consequence of changing market conditions and overall demand for casino gaming;
The current economic impact of the Casino on the Buffalo-Niagara Falls metropolitan area, including both primary and secondary employment impacts and estimates of total tax revenue generated as a consequence of the Casino; and
The current fiscal impact on the State of New York and local municipalities, particularly the City of Niagara Falls.
The second half of our report addresses the question of how revenue from the Casino might be used to improve the economy of the region in the long run.

3
Elements include:
Descriptions of the experience of other cities receiving “windfall” revenue from major new developments;
The economic impact experience of other cities with casinos;
Criteria to apply to payments received by the community from the Seneca Gaming Corporation;
A process for allocating funds, including a process for soliciting, reviewing and awarding grants from the economic development pool created for the community by the exclusivity payments; and
A summary of literature reviewing the social impacts of casino gambling.

4
Economic impacts are changes to the size of the regional economy that result from the primary economic event, in this case the Casino. The analysis below focused on the impact of the Casino on total regional payroll and employment. As the economies of Niagara and Erie counties are deeply interdependent, our economic impact forecasts will target the Buffalo-Niagara Falls metropolitan area. The economic impact cannot be calculated simply by observation as a significant proportion of the impact of a major development is secondary to the central development, in this case the Casino. Estimates of these impacts are driven by assumptions about the regional economy, the source of the revenue flowing to the Casino and the nature of the complementary spending stimulated by the presence of the Casino.
Fiscal impacts are those changes to public sector revenue and expenditure that result from the development. One element of the fiscal impact—the exclusivity fee paid to NYS by the Seneca Gaming Corporation and shared with the local communities—is very public and unambiguous. Other revenue impacts are more difficult to firmly attribute to the Casino, e.g. hotel and motel tax, sales tax, property tax and user fees as well as increased personal income tax payments to the State of New York.
There are also costs incurred by the public sector. These include possible costs of additional policing, fire protection, highway maintenance and other forms of public expenditure.
PART I: ECONOMIC & FISCAL IMPACT OF SENECA
NIAGARA CASINO
5
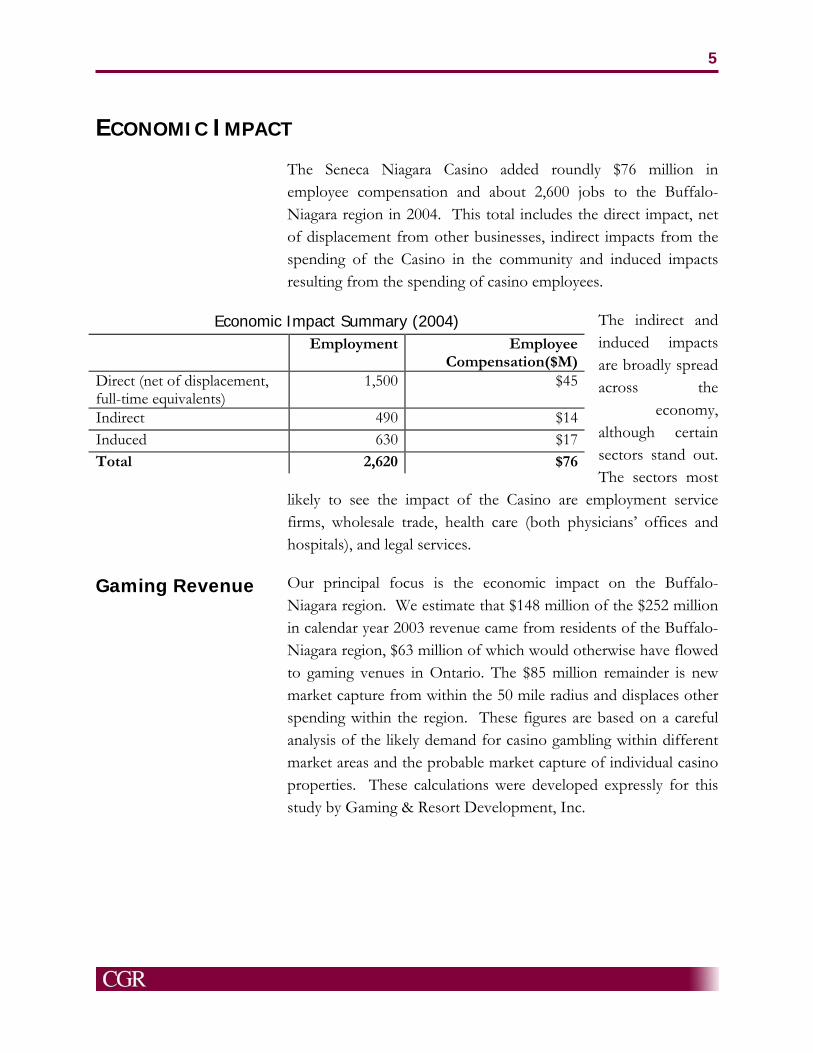
The Seneca Niagara Casino added roundly $76 million in employee compensation and about 2,600 jobs to the Buffalo-Niagara region in 2004. This total includes the direct impact, net of displacement from other businesses, indirect impacts from the spending of the Casino in the community and induced impacts resulting from the spending of casino employees.
The indirect and induced impacts are broadly spread across the
economy, although certain sectors stand out. The sectors most
likely to see the impact of the Casino are employment service firms, wholesale trade, health care (both physicians’ offices and hospitals), and legal services.
Our principal focus is the economic impact on the Buffalo-Niagara region. We estimate that $148 million of the $252 million in calendar year 2003 revenue came from residents of the Buffalo-Niagara region, $63 million of which would otherwise have flowed to gaming venues in Ontario. The $85 million remainder is new market capture from within the 50 mile radius and displaces other spending within the region. These figures are based on a careful analysis of the likely demand for casino gambling within different market areas and the probable market capture of individual casino properties. These calculations were developed expressly for this study by Gaming & Resort Development, Inc.
ECONOMIC IMPACT
Economic Impact Summary (2004) Employment Employee
Compensation($M) Direct (net of displacement, full-time equivalents)
1,500 $45
Indirect 490 $14 Induced 630 $17 Total 2,620 $76
Gaming Revenue
6
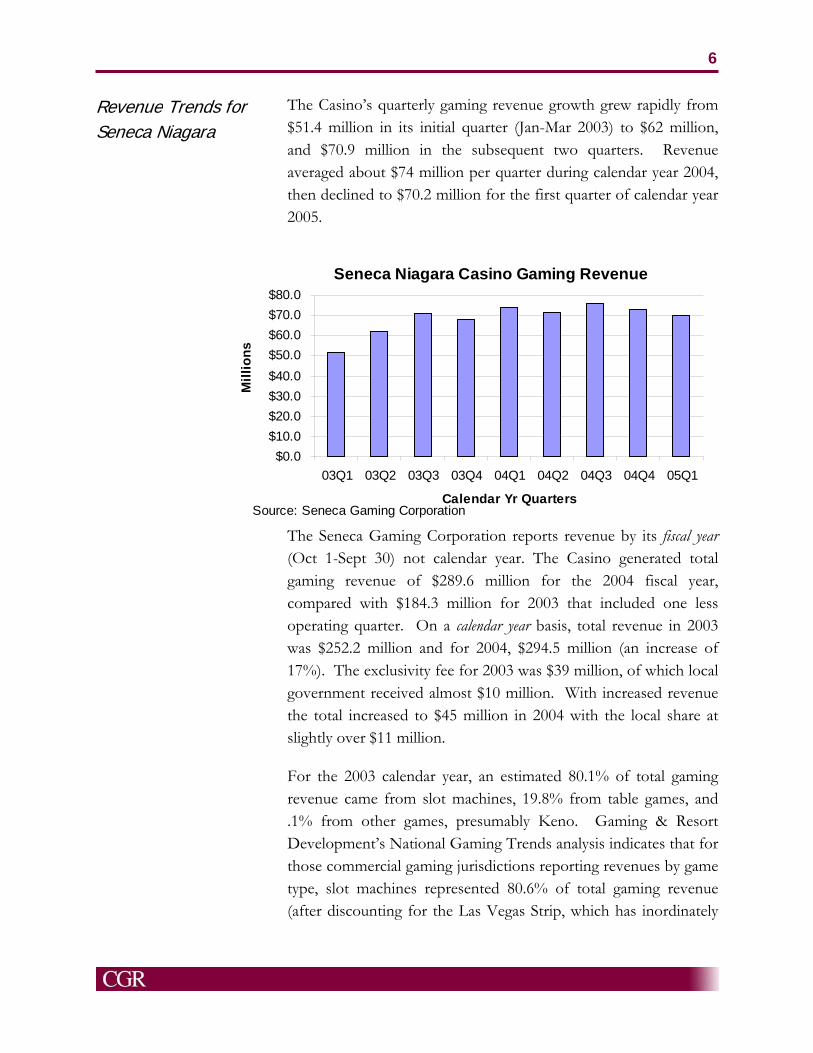
The Casino’s quarterly gaming revenue growth grew rapidly from $51.4 million in its initial quarter (Jan-Mar 2003) to $62 million, and $70.9 million in the subsequent two quarters. Revenue averaged about $74 million per quarter during calendar year 2004, then declined to $70.2 million for the first quarter of calendar year 2005.
The Seneca Gaming Corporation reports revenue by its fiscal year (Oct 1-Sept 30) not calendar year. The Casino generated total gaming revenue of $289.6 million for the 2004 fiscal year, compared with $184.3 million for 2003 that included one less operating quarter. On a calendar year basis, total revenue in 2003 was $252.2 million and for 2004, $294.5 million (an increase of 17%). The exclusivity fee for 2003 was $39 million, of which local government received almost $10 million. With increased revenue the total increased to $45 million in 2004 with the local share at slightly over $11 million.
For the 2003 calendar year, an estimated 80.1% of total gaming revenue came from slot machines, 19.8% from table games, and .1% from other games, presumably Keno. Gaming & Resort Development’s National Gaming Trends analysis indicates that for those commercial gaming jurisdictions reporting revenues by game type, slot machines represented 80.6% of total gaming revenue (after discounting for the Las Vegas Strip, which has inordinately
Revenue Trends for Seneca Niagara
Seneca Niagara Casino Gaming Revenue
$0.0$10.0$20.0$30.0$40.0$50.0$60.0$70.0$80.0
03Q1 03Q2 03Q3 03Q4 04Q1 04Q2 04Q3 04Q4 05Q1
Calendar Yr Quarters
Mill
ions
Source: Seneca Gaming Corporation

7
high table game revenue). This figure closely parallels the estimate for the Casino.
Per game daily win averages, while provided in some of SGC’s reported financial results, are typically calculated based on per-game-unit-days that reflect the impact of adding/subtracting games during the period which are then divided into the revenue for the given period. Since its opening, the Casino has been adding both slot machines and table games. According to SGC’s SEC reports, the Casino experienced a daily average of $227 per slot (2,879) and $1,275 per table game (112) for the twelve months ending March 31, 2004. The daily slot average is up somewhat from the nine month period ending September 30, 2003 (Casino’s fiscal year end), that are reported at $213 per day (2,741), while the table game daily average was $1,291.
The Casino’s June 30, 2004 filed financials combined both Seneca Allegany and Seneca Niagara and did not report the average number of games or segment gaming revenue per game type by location.
However, an extrapolation of the reported absolute number of games at both locations seems to suggest that the Casino’s daily average win per game has slipped somewhat from the previous period. According to the SEC report, the Casino had 3,238 slot machines in operation as of June 30, 2004.
Whereas the Casino reports having added 242 slots during the quarter ending June 30, 2004, it is not uncommon to experience a drop in per unit daily win averages as new units are added,
Seneca Gaming Corporation Reported Financial Results Six Months Ended March 31, FY Ended
Sept. 30, 2003
2003 2004 12 Months
Ended March 31, 2004
Average Number of Slot Machines 2,741 2,609 2,931 2,879Slot Machine Daily Win Per Unit $213 $185 $229 $227Average Number of Table Games 104 93 114 112Table Game Daily Win Per Unit $1,291 $1,368 $1,304 $1,275

8
especially when they accommodate peak demand periods and ultimately increase total gaming revenue. The Casino’s average revenue per game and its revenue distribution among available games are about on par with similar types of operations nationwide.
The Seneca Gaming Corporation reports current employment of 2,141 persons, 80% to 85% of whom are full time, divided into various job categories as illustrated by the following table. SGC projections reported by Buffalo Business First (7/3/03) were for 2003 year end gross payroll to reach $60 million with 36% of employees residing in the City of Niagara Falls, New York. By the beginning of 2004, the Casino’s benefit program cost an additional $18.5 million (Buffalo Business First, 1/5/04).
Based on these estimates the average gross wage per employee is roundly $28,000, plus $8,400 in benefits, equaling a total of over $36,400 in average wages & benefits. Certain staff members also receive gratuities, including some of the slot and table game staff, restaurant & bar servers, and valet parkers.
The Casino’s estimated gross payroll of $60 million for 2003 approximates a payroll cost of 22.2% of the estimated total revenue, with estimated benefits representing 30% of gross wages. Similar grossing casinos (most notably the Las Vegas Strip
Primary Employment & Payroll
Distribution of Employment by Function Department # of Employees %Table Games 651 30.4%Slots 161 7.5%Finance 235 11.0%Marketing 112 5.2%Administration 51 2.4%Information Technology 18 0.8%Food & Beverage 528 24.7%Retail 35 1.6%Property Operations 124 5.8%Transportation 77 3.6%Security 149 7.0%Total Staff 2,141 100.0%Part Time 375 17.5%Full Time 1,766 82.5%

9
properties with net gaming win averaging over $200 million annually) payroll costs for all departments, excluding rooms, ran 36.1% of total revenue; with benefits representing 31% of gross wages.
Given the Casino’s geographic location and the relatively more competitive nature of the Las Vegas labor market, its estimated payroll cost average seems consistent with industry trends.
The Casino averages an estimated .73 employees per playing position. While there are other gaming jurisdictions that report employee totals, most include properties that also offer hotel rooms that skew the averages. A summary of these jurisdictions is shown in the table on the following page.
SGC management indicates that the Casino is expected to hire an additional 500 to 600 employees in conjunction with the completion of the new hotel and related amenities during the latter part of 2005. Assuming that these employees earn salaries similar to those of current employees, this will increase direct employment to between 2,600 to 2,700 and payroll to between $72 million and $75 million.
Distribution of Employment by Place of Residence Place of Residence # %
City of Niagara Falls 719 36.0%City of Buffalo 206 10.3%North Tonawanda 114 5.7%Lewiston 106 5.3%Other Erie & Niagara County
623 31.2%
New York Other 24 1.3%Chautauqua & Cattaraugus 72 3.6%Canada 98 4.9%Not Named 38 1.9%Total 2,000 100.0%

10
While these employment and payroll totals are impressive, only a portion can be assumed to be new to the Buffalo-Niagara region. We estimate that the Seneca Niagara Casino currently captures $148 million from the Buffalo-Niagara region. Were this the first casino in the region, it is likely that most of this expenditure would be a displacement of entertainment dollars from businesses within the region. It seems plausible, however, that a large share of this total represents the “recapture” of gaming dollars formerly flowing to gaming venues over the international border in Ontario.
Ontario casinos did see a significant decline in total revenue between 2002 and 2003. Unfortunately, for analytical purposes it is difficult to determine what share of the loss in revenue is fairly attributed to the opening of Seneca Niagara. Our assumption is that about $104 million (about 40%) of 2003 revenue represents gaming spending that would have otherwise flowed to Canada.
Employment Per Playing Position: Seneca Niagara v. Other Venues Jurisdiction Employees Playing Positions Employees Per Playing
Position Seneca Niagara 2,141 2,931 0.73 Mississippi 34,907 48,463 0.72 Illinois 9,094 11,314 0.80 Indian Gaming Estimate 240,000 264,346 0.91 Atlantic City 46,159 50,598 0.91 Las Vegas Strip 88,801 63,692 1.39 Las Vegas Strip (less rooms) 72,375 63,692 1.14
Primary Employment & Payroll Displacement
Estimating Displacement

11
Revenue at Casino Niagara and Fort Erie declined 9% in 2003 after growing an average of about 7% each of the previous two years. Had the trend continued, total revenue would have increased from C$810 million to C$867 million. Actual 2003 revenue was C$656, a reduction from trend of C$211. The SARS outbreak in Toronto and a general decline in travel during the period is responsible for a portion of the decline, as are less favorable exchange rates for tourists. We estimate that 70% of the loss from trend ($104 million) can be attributed to competition from Seneca Niagara and the remaining to these other causes.
Based on estimates developed by GRD, we assume that about 60% of the $104 million ($63 million) redirected from the Canadian venues was from within the 50 mile radius. Thus of the $148 million in revenue from the 50 mile radius, $85 million is new business from within the Buffalo-Niagara region and is likely displacing other forms of entertainment spending.
Clearly, one goal of permitting the Casino to open in Niagara Falls is to stimulate additional spending in the community as a result of the increased traffic. Existing evidence suggests that the “spillover” impact of the Casino has, so far, been limited.
Effect of Displacement on Impact Assessment Total Casino Revenue (M) $252
Casino Revenue from Erie & Niagara Region (M) $148 Revenue Recaptured From Ontario Venues (M) $104 Erie & Niagara Share of Ontario Transfer 60% Erie & Niagara Recapture (M) $63 Casino Revenue Displacing Other Erie & Niagara Spending (M)
($85)
Total Revenue LESS Displacement (M) $167 Displacement as Share of Total Revenue 31% Current Employment (000) 2.14 Current Payroll (M) $60 Employment Net of Displacement (000) 1.48
Payroll Net of Displacement (M) $41
Economic Impact Off Site

12
That there is potential, is clear, however. The intercept survey conducted by Niagara University under the auspices of NTCC, while of limited value for this study, confirms that a large share of survey respondents (39%) selected the Casino when asked to state their “primary purpose” in visiting Niagara Falls, NY (although as
respondents were permitted to select up to three options in the question asking “primary purpose,” it is difficult to interpret this response. About 11% of respondents selected casino only).
Evidence suggests that the impact of the Casino on Niagara Falls tourism has been slight, although with barely two years experience, the potential synergy between the Casino and traditional tourism venues is in its infancy. It does appear clear that the predominant casino visitor does not spend the night, a fact that is likely to change as the casino hotel is completed. Furthermore, what data are available on local visitation has been influenced by the SARS-driven reduction in Canadian travel during 2003. We present some data for 2004.
We consulted with the NYS Office of Parks, Recreation and Historic Preservation (regarding the Cave of the Winds, Festival
Profile of Casino Patrons (NTCC Survey) Casino Patrons All Survey Respondents/Non
Casino Patrons (where noted) Income <$30,000 13%
$30,000-$49,999 12% $50,000-$74,999 28% $75,000-$99,999 29% >$100,000 15%
<$30,000 12% $30,000-$49,999 19% $50,000-$74,999 25% $75,000-$99,999 24% >$100,000 19%
Median spending per day per person
$200 Individuals visiting for another purpose reported spending $100.
Mean spending per day per person
$253 Individuals visiting for another purpose reported spending $145.
NYS Residents 33% 25% Length of stay One day or less: 51%
Two days: 31% Three days or more: 18%
One day or less: 52% Two days: 35% Three days or more: 13%
Continuing to Canada? Yes: 70% Yes: 59%
Impact of Casino on Tourism

13
Theatre, Niagara Gorge Discovery Center and Niagara Scenic Trolley), the Maid of the Mist, the Niagara Falls Aquarium and Delaware North Parks (which provides all retail and concessions services in Niagara Falls Park).
It is important to highlight, however, that in the opinion of individuals we consulted in the hospitality industry, visitors to the Casino and visitors to the more traditional tourism venues in Niagara Falls are two disparate groups. All were interested in working more closely with the Casino in the future and hope that strengthening ties with the Casino will have the anticipated spillover impact on other venues. The completion of the casino hotel is expected to lengthen the average stay of visitors to Niagara Falls and provide more opportunities for the traditional venues to benefit from the Casino’s obvious ability to draw visitors.
Data from the NYS Office of Parks, Recreation and Historic Preservation on state-operated venues (see table above) initially suggests some casino impact. Clearly the use of the Niagara Scenic Trolley has dramatically increased in the current fiscal year and the Cave of the Winds is experiencing strong growth. Allan James, Director of Public Affairs for the regional office of the NYS Office of Parks, Recreation and Historic Preservation, believes that other influences are driving growth, however. The price of the trolley was cut from $5 adult/$3 children to $2 adult/$1 children, a substantial reduction. Cave of the Winds growth is explained by an operating change: Instead of relying on re-usable raingear, the Cave now hands out disposables. This has significantly reduced processing time, reducing wait times dramatically. Mr. James believes that the strong attendance figures
Visitors 2000-01 2001-02 2002-03 2003-04 2004-05 (est)Festival Theatre 53,298 63,278 66,617 46,866 46,961Niagara Gorge Discovery Center 41,763 35,349 0 27,425 44,475Cave of the Winds 288,177 268,272 313,055 288,045 347,458Niagara Scenic Trolley 113,785 127,369 133,154 120,907 229,568Source: NYS Office of Parks, Recreation and Historic Preservation

14
for 2004-05 can be attributed to this increased throughput capacity.*
Tim Ruddy, Director of Marketing for Maid of the Mist, describes the years from 2001 to 2003 as “turbulent” with business having been impacted by terrorism and the SARS outbreak. 2004 saw an 11% increase in business over 2003, but Ruddy attributes this not to the impact of the Casino but rather to an increase in tourism and travel worldwide after the SARS-induced slowdown in 2003. The Maid of the Mist Corporation saw no measurable impact on business from the Seneca Niagara Casino.
Michael Barnes is General Manager of Delaware North Parks. Mr. Barnes reports that the most successful year in his tenure was 2002. Barnes attributes a downturn the following year (2003) not to the Casino but to SARS. In 2003, they saw a decline in attendance of about 30-35% and a significant drop in revenue. While revenues in 2004 rebounded to 2002 levels, attendance levels did not recover in the same way.
Similarly, the Niagara Falls Aquarium reports no noticeable increase in visitation due to the Casino. Nancy Chapin, Executive Director, also believes that the Casino and the Aquarium serve largely separate markets.
Because of the transition associated with the closing of the old convention center and the subsequent construction of the new conference center, data for years 2003 and 2004 is limited. We would expect increasing numbers of events to be scheduled in Niagara Falls as visitors discover the new conference center.
Smith Travel Research data on hotel/motel occupancy indicates a decline in Niagara Falls occupancy in 2003, although other parts of the county saw growth. Occupancy rebounded in 2004, although remains below earlier levels. Coupled with comments gathered in the NTCC survey plus anecdotal comments about the quality of
* Figures for the Niagara Gorge Discovery Center are due to a renovation that closed the facility for a year.

15
the lodging facilities in the community, it would appear that the Niagara Falls lodging industry has growth potential.
Inadequate lodging will continue to inhibit the ability of the community to attract convention business. Nonetheless, the newly-built conference center is a superb facility, able to complement renovated or new lodging.
The Casino’s own hotel will address its own needs. With an estimated 6 million visit-days per year to the Casino, the 600 rooms planned by the SGC can be easily filled, leaving additional business for other establishments.
The appearance of the community serves as a significant barrier to development. Comments solicited from NTCC survey respondents support this conclusion: The need to address the city’s appearance was the most cited observation. Of respondents choosing to add a comment to their survey, about 1 in 5 cited a need to clean up the city or otherwise improve the city’s appearance. By taking steps to address this problem, the city will spur business development and encourage repeat tourism.
The NTCC’s survey will make an important contribution to the community’s understanding of its market. As a new instrument, there are a number of improvements that must be made to maximize its value, however. Deborah Curtis, the Niagara University faculty member directing the survey effort, indicated that the majority of surveys were obtained from individuals leaving the Maid of the Mist gift shop (although some responses came from other sites). Were all respondents from this site, we could conclude that between 11% and 39% of visitors to the Maid of the Mist would not have been there but for the existence of the Casino. We were unable to secure statistics from the Maid of the Mist, however.
This introduces significant bias into the statistics, when considered from the perspective of the Casino analysis:
This process largely excludes individuals who are in Niagara Falls solely for the purpose of visiting the Casino. We suspect that the survey finding—39% indicating that their principal travel intent is
NTCC Survey

16
to visit the Casino (with 11% selecting only this option)—is biased downward.
Individuals either taking the Maid of the Mist or considering taking the Maid of the Mist are likely to be families with children, again excluding the singles and “empty-nester” demographic, probably a substantial share of casino business.
The bias inherent in the survey is particularly evident in the spending statistic: This figure is very difficult to reconcile with other information obtained both for Seneca Niagara and for other casino properties. Spending per visit at the Casino is reported as $62.57 (note that “visits” are a door count for the Casino, thus are roughly analogous to a “visitor day”). A survey of visitors to Las Vegas reports significantly lower figures*. In 2003, Las Vegas visitors spent $60 per day per person for sightseeing, shopping and food. Given the significantly reduced opportunities for spending in Niagara Falls, NY compared to Las Vegas, we judge the actual value in Niagara Falls, NY to be half this figure. The NTCC survey also reports that two-thirds of individuals coming to Niagara Falls primarily for the Casino indicated that they were spending the night in Niagara Falls, NY. Clearly the community does not have sufficient lodging to accommodate such numbers were this representative of the Casino patron.
As this is the first time the survey has been administered, we would expect that the questions and methodology will be modified, yielding a different perspective on the findings in the future. Continued collection of additional tourism data will be important to building on existing information about the influence of the Casino. In particular, we recommend that
A statistically-significant sample of respondents be solicited from at least two sites, one of which should directly capture casino patrons;
* http://www.lasvegas24hours.com/pdf/VPS-2003LasVegas.pdf

17
Reported spending be divided by purpose, particularly gaming spending, food & drink, lodging, and other;
The wording of the “spending” question be re-cast to capture actual rather than anticipated spending (i.e. “How much have you spent so far today?” or “How much did you spend yesterday?”);
Respondents should be restricted to selecting a single “primary purpose” although a secondary purpose should also be captured; and
The main off-casino intercept site should be of more general interest than the Maid of the Mist, perhaps Goat Island.
We are unable to forecast new visitor spending for the rest of the Compact term. Evidence summarized above indicates that current visitor spending attributable to the Casino is very limited. We are optimistic that this is a short-term phenomenon. As community infrastructure is improved and adapted to the presence of the Casino and the business community begins to focus more directly on the Casino visitor, the off-site spending of casino patrons could increase substantially. A survey of Las Vegas visitors conducted in 2003 indicated that the average daily spending of visitors—lodging and gaming excluded—was $60 per capita. This includes on site and off site spending. In 2003, this would have totaled nearly $260 million in Niagara Falls. Actual on site nongaming spending in 2003 totaled about $33 million (although $24.6 million was a promotional allowance). Off site spending, as indicated above, appeared to have been small.
Future Visitor Spending

18
The future prospects of the Casino in terms of revenue, employment and visitation are contingent upon a variety of factors; chief among these are the extent and characteristics of the competitive gaming supply, and the configuration of the Casinos currently under construction and planned expansion. Moreover, there is a relationship between the Casino’s level of dependence on the City to provide certain services and environments that enhance its ability to attract patronage, and the City’s use of Casino proceeds to adequately address those issues.
In assessing the Casino’s future prospects, we undertake a review of national & regional casino gaming revenue trends to ascertain typical market penetration rates and growth factors. We then seek to measure the potential gaming revenues achievable from the Casino’s effective market radius. This data is interfaced with the extent and characteristics of the current and anticipated competitive supply, to indicate the degree to which certain market segments may be over/under supplied, and the level of overall market shares and penetration rates.
The results of these steps then begin to dictate future revenue prospects and the focus of ways and means by which to impact those trends.
Ongoing improvements including additional parking, restaurant, entertainment and gaming areas seem to have been well-received, designed to further enhance the Casino’s overall ambiance and to stimulate additional revenue. Moreover, the hotel currently under construction is also likely to attract a wider geographic player base.
Data for the commercial casino and racino operations is provided by each state’s regulatory body. Indian gaming revenues are based on estimates, public records and our proprietary data base. Additionally, we referenced various news sources, the Indian Gaming Industry Report, by the Analysis Group, Bear Stearns
FUTURE FINANCIAL PROSPECTS FOR CASINO

19
North American Gaming Almanac, the National Indian Gaming Association, and financial reports submitted to the Security & Exchange Commission. For the most part data is expressed in calendar year totals, although some are only available on a fiscal year basis. Detailed statistics by state and metro region are shown in the Appendix.
Revenue trends for 2004 through the first quarter of 2005 suggest relatively slow growth. Revenue grew very quickly during 2003. Gaming revenues for the quarter ending March 31, 2003, representing operations since the Casino’s opening on December 31, 2002, are reported to equal $51.4 million, growing to $67.9 for the quarter ending December 31, 2003. The strongest quarter during 2004 was July through September as revenue reached nearly $76 million, dropping back to $72.8 million for the quarter ending December 31, 2004 and to $70.2 million for the quarter ending March 31, 2005. We anticipate that growth would again accelerate upon completion of the hotel.
The variables affecting potential future revenues include the impact of the new Seneca Allegany Casino once it has an opportunity to become better known amid a shared market radius, and as it begins to evolve with additional amenities. Furthermore, while the outlook for an Erie County Class III facility is uncertain, once operational it can be expected to usurp some market from the Niagara Falls operation.
In order to fully evaluate these factors, the following sections of this report deal with an analysis of national gaming revenue trends and market growth patterns, as well as an assessment of the measured potential for gaming revenue in the Niagara region in conjunction with the potential competitive mix, market shares and penetration rates.
The casino gaming industry has been growing rapidly throughout the U.S. almost directly in proportion to the number of casino venues and their gaming position capacity. According to Gaming & Resort Development, Inc.’s proprietary compilation,
National Casino Gaming Trends

20
commercial casinos, racinos (race tracks with slot machines) and Indian Class II & III installations, generated total gaming revenues of $44.6 billion in 2003, up slightly more than 5% from the previous year, and 36% over the past five years.
As the chart and subsequent table indicate, the greatest revenue growth stems from both the Indian gaming and racino locations. The commercial sector, comprised of casinos in twelve states, shows a slow decline in annual growth rate, from a high of 10% in 2000 and steadily decreasing to only 1.2% in 2003. Conversely, racinos, due principally to a growing number of installations, doubled gaming revenues over the past five years. Indian gaming net win has grown by some $6.4 billion over the same period.
Fueling these growth rates is an increase in available playing positions stemming from both additional games at existing casinos and new venues, as well as higher consumer spending rates. While the growth in total casino gaming net win outstripped the rate of increase in U.S. personal disposable income and consumption up through 2002, the 2003 data suggests that these indices are now more closely parallel.
According to a report issued by the American Gaming Association (AGA Survey of Casino Entertainment-2004), overall acceptability of casino gaming has remained high during the past five years, ranging between 54% to 57%, yet an annual survey conducted by Harrah’s Entertainment, Profile of the American Casino Gambler, indicates that only 26% of adults actually gambled in 2003. This differential between potential and actual participants is the primary reason why most new jurisdictions are typically so well received; there is a direct link between ‘readily accessible’ gaming products/services and utilization.

21
Statistical Summary: National Casino Gaming Trends (Revenue $Millions) 2003 2002 2001 2000 1999 Commercial Casinos Gaming Revenues 27,331.3 26,994.2 26,228.6 25,358.9 23,057.1# Of Playing Positions 450,173 448,521 453,066 443,254 426,912Average Daily Win Per Position $166.34 $164.89 $158.17 $156.74 $147.97Annual Revenue Growth Rate 1.2% 2.9% 3.4% 10.0%Racinos Slot Revenues 2,208.3 2,006.0 1,596.8 1,337.0 1,070.9# Of Slots 25,017 21,610 18,267 15,826 11,904Average Daily Win Per Slot $241.84 $254.33 $238.84 $231.45 $246.46Annual Revenue Growth Rate 10.1% 25.6% 19.4% 24.8%Indian Gaming (Estimates) Gaming Revenues 15,063.0 13,426.1 11,871.9 9,867.2 8,697.1 # Of Playing Positions 268,868 254,785 238,471 201,697 189,520Average Daily Win Per Position $153.49 $144.37 $136.02 $134.03 $125.73Annual Revenue Growth Rate 12.2% 13.1% 20.3% 13.5%National Summary Gaming Revenues 44,602.6 42,426.3 39,697.2 36,563.2 32,825.0Playing Positions 744,058 724,916 709,804 660,777 628,336Average Daily Win Per Position $164.23 $160.34 $152.81 $151.60 $143.13Annual Revenue Growth Rate 5.1% 6.9% 8.6% 11.4%Source: Gaming & Resort Development, Inc. Compilation of Data U.S. Economic Trends Disposable Personal Income ($billions)
8,159.9 7,827.7 7,486.8 7,194.0 6,695.0
Annual Growth Rate 4.2% 4.6% 4.1% 7.5%Personal Consumption ($billions) 7,760.9 7,376.1 7,055.0 6,739.4 6,282.5Annual Growth Rate 5.2% 4.6% 4.7% 7.3%Source: National Economic Accounts - Bureau of Economic Analysis - U.S. Dept. of Commerce NOTE: Data for the commercial casino and racino operations is provided by each state’s regulatory body. Indian gaming revenues are based on estimates, public records and our proprietary data base. Additionally, we referenced various news sources, the Indian Gaming Industry Report, by the Analysis Group, Bear Stearns North American Gaming Almanac, the National Indian Gaming Association, and financial reports submitted to the Security & Exchange Commission. For the most part data is expressed in calendar year totals, although some are only available on a fiscal year basis. Detailed statistics by state and metro region are shown in the Appendix.

22
The Indian gaming market exemplifies this trend and has grown from 26% of the gaming revenue in 1999 to 34% in 2003. About 54% of the increase in the national net win between 1999 to 2003 stems from the Indian gaming sector, whose supply of playing positions has grown at three times the rate of the commercial casino sector. These national gaming trends show that as new gaming jurisdictions are brought on line they are met with a corresponding growth in market support that far outstrips the rate of incremental growth in playing positions at existing venues. This becomes an important element in determining the ability of the Seneca Niagara Casino to experience further incremental gaming revenue growth, especially within a marketplace that is poised to become more competitive.
Seneca Niagara Casino’s realizable future potential revenues relate to the extent and characteristics of the underlying demand for its products and services and its current market shares and penetration. To assess this market we utilize proprietary formulas and models that are based on current gaming trends, studies and surveys of various jurisdictions across the county.
We measure potential demand based on certain demographic and socioeconomic data that our research indicates has a high likelihood of predicting general casino gaming proclivity, spending and frequency within the measured radius. They also reflect certain ‘lifestyle’ trends that indicate ‘occasioned-use’ preferences among a variety of entertainment and leisure time activities. These factors are critical in determining the nature and configuration of casino gaming facilities and amenities required to best meet the needs of the identified market. Moreover, our models are based on casino utilization rates of a ‘readily accessible’ site, so that we can determine the degree to which the existing competition is penetrating all market segments and that indicate positioning strategies necessary to attract higher revenues.
Such methods differ from ‘gravity modeling’ systems that are typically applied in retail environments where spending patterns are more predictable for ‘non-discretionary’ consumer spending.
Niagara Falls, New York Regional Market Demand Assessment
23
Casino gaming and other leisure time spending patterns are more discretionary and are often ‘impelled’ by the level and ambiance of the facilities themselves, along with their capacities, synergies and critical mass. Therefore, it is a casino’s positioning strategy that can often be a greater predictor of its relative market share than simply its location, especially in highly competitive gaming jurisdictions.
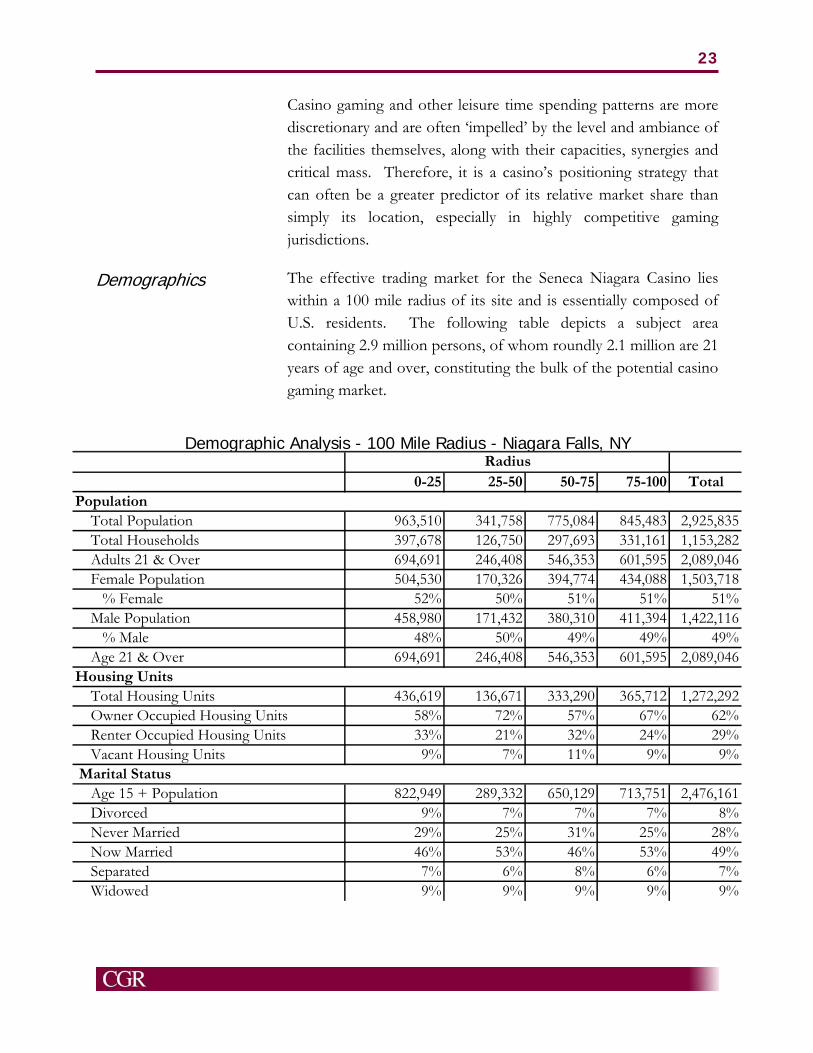
The effective trading market for the Seneca Niagara Casino lies within a 100 mile radius of its site and is essentially composed of U.S. residents. The following table depicts a subject area containing 2.9 million persons, of whom roundly 2.1 million are 21 years of age and over, constituting the bulk of the potential casino gaming market.
Demographic Analysis—100 Mile Radius, Rochester, NY
Demographics
0-25 25-50 50-75 75-100 Total
Total Population 963,510 341,758 775,084 845,483 2,925,835 Total Households 397,678 126,750 297,693 331,161 1,153,282 Adults 21 & Over 694,691 246,408 546,353 601,595 2,089,046 Female Population 504,530 170,326 394,774 434,088 1,503,718 % Female 52% 50% 51% 51% 51% Male Population 458,980 171,432 380,310 411,394 1,422,116 % Male 48% 50% 49% 49% 49% Age 21 & Over 694,691 246,408 546,353 601,595 2,089,046
Total Housing Units 436,619 136,671 333,290 365,712 1,272,292 Owner Occupied Housing Units 58% 72% 57% 67% 62% Renter Occupied Housing Units 33% 21% 32% 24% 29% Vacant Housing Units 9% 7% 11% 9% 9%
Age 15 + Population 822,949 289,332 650,129 713,751 2,476,161 Divorced 9% 7% 7% 7% 8% Never Married 29% 25% 31% 25% 28% Now Married 46% 53% 46% 53% 49% Separated 7% 6% 8% 6% 7% Widowed 9% 9% 9% 9% 9%
Demographic Analysis - 100 Mile Radius - Niagara Falls, NY
Marital Status
Housing Units
Population
Radius
24
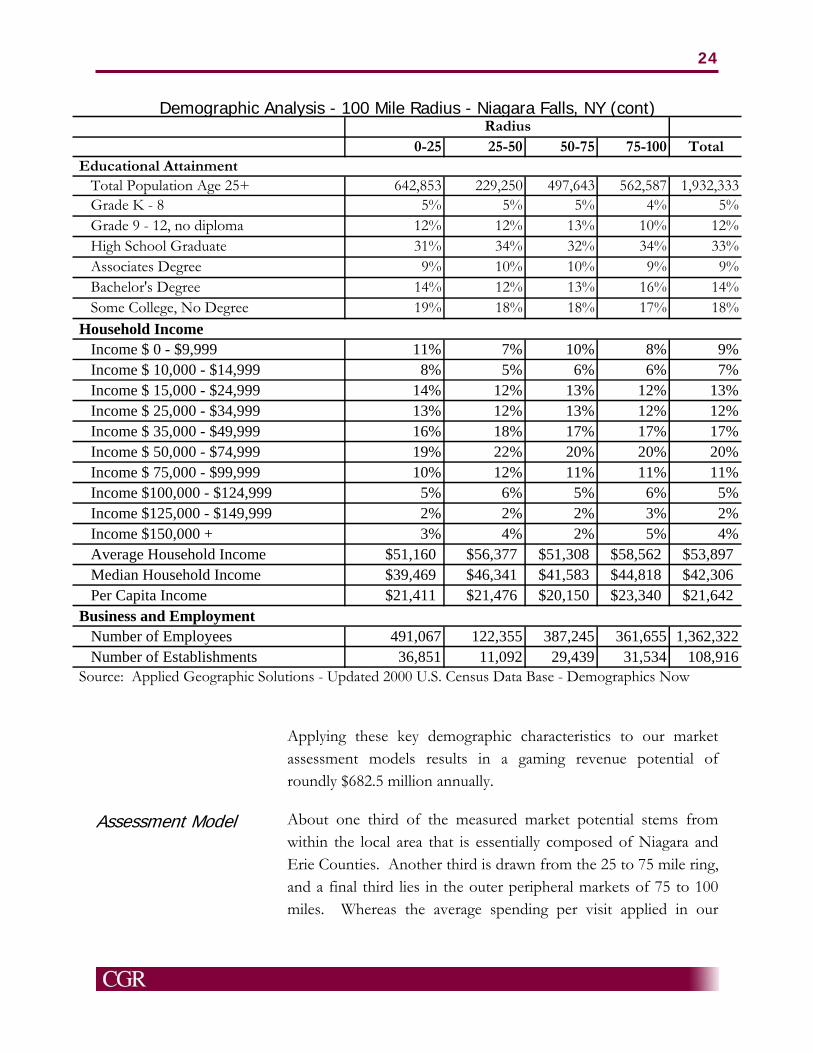
Applying these key demographic characteristics to our market assessment models results in a gaming revenue potential of roundly $682.5 million annually.
About one third of the measured market potential stems from within the local area that is essentially composed of Niagara and Erie Counties. Another third is drawn from the 25 to 75 mile ring, and a final third lies in the outer peripheral markets of 75 to 100 miles. Whereas the average spending per visit applied in our
Assessment Model
0-25 25-50 50-75 75-100 Total
Total Population Age 25+ 642,853 229,250 497,643 562,587 1,932,333 Grade K - 8 5% 5% 5% 4% 5% Grade 9 - 12, no diploma 12% 12% 13% 10% 12% High School Graduate 31% 34% 32% 34% 33% Associates Degree 9% 10% 10% 9% 9% Bachelor's Degree 14% 12% 13% 16% 14% Some College, No Degree 19% 18% 18% 17% 18%
Income $ 0 - $9,999 11% 7% 10% 8% 9% Income $ 10,000 - $14,999 8% 5% 6% 6% 7% Income $ 15,000 - $24,999 14% 12% 13% 12% 13% Income $ 25,000 - $34,999 13% 12% 13% 12% 12% Income $ 35,000 - $49,999 16% 18% 17% 17% 17% Income $ 50,000 - $74,999 19% 22% 20% 20% 20% Income $ 75,000 - $99,999 10% 12% 11% 11% 11% Income $100,000 - $124,999 5% 6% 5% 6% 5% Income $125,000 - $149,999 2% 2% 2% 3% 2% Income $150,000 + 3% 4% 2% 5% 4% Average Household Income $51,160 $56,377 $51,308 $58,562 $53,897 Median Household Income $39,469 $46,341 $41,583 $44,818 $42,306 Per Capita Income $21,411 $21,476 $20,150 $23,340 $21,642
Number of Employees 491,067 122,355 387,245 361,655 1,362,322 Number of Establishments 36,851 11,092 29,439 31,534 108,916 Source: Applied Geographic Solutions - Updated 2000 U.S. Census Data Base - Demographics Now
Educational Attainment
Household Income
Business and Employment
Demographic Analysis - 100 Mile Radius - Niagara Falls, NY (cont)Radius
25
model of roundly $70 differs somewhat from the Casino’s current average of $62.57, it is based on gaming-related patronage and not total visitors that also contain restaurant and entertainment patrons.
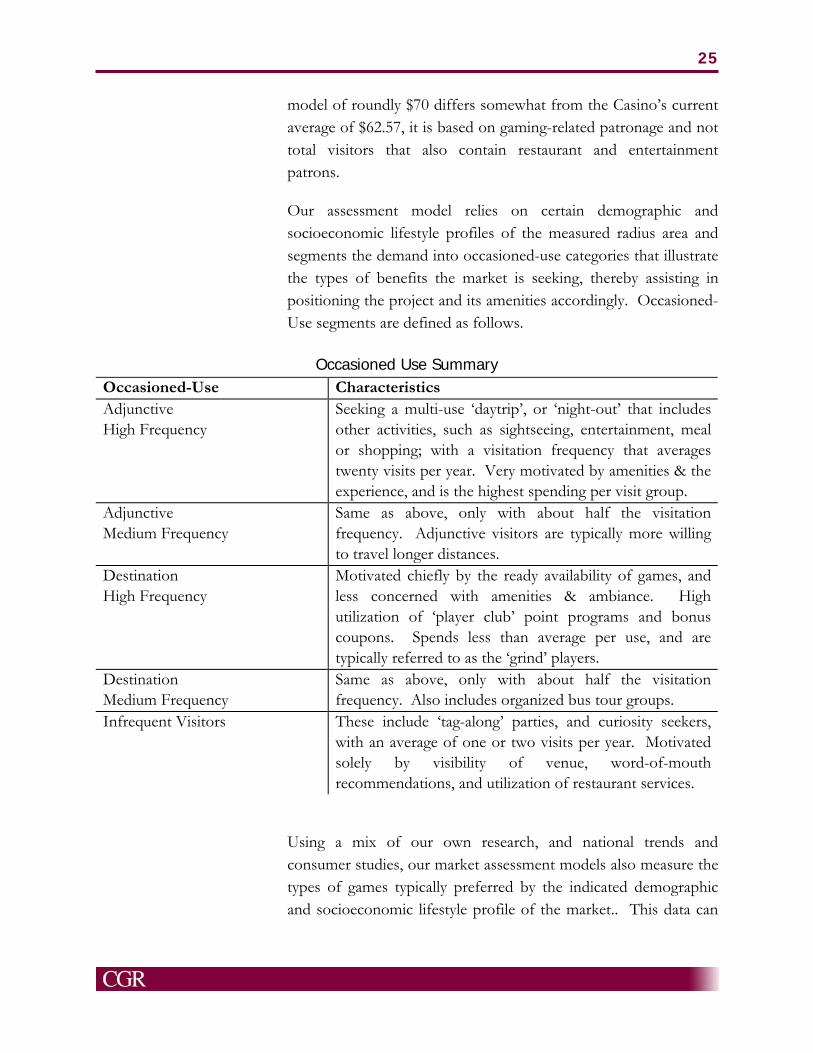
Our assessment model relies on certain demographic and socioeconomic lifestyle profiles of the measured radius area and segments the demand into occasioned-use categories that illustrate the types of benefits the market is seeking, thereby assisting in positioning the project and its amenities accordingly. Occasioned-Use segments are defined as follows.
Using a mix of our own research, and national trends and consumer studies, our market assessment models also measure the types of games typically preferred by the indicated demographic and socioeconomic lifestyle profile of the market.. This data can
Occasioned Use Summary Occasioned-Use Characteristics Adjunctive High Frequency
Seeking a multi-use ‘daytrip’, or ‘night-out’ that includes other activities, such as sightseeing, entertainment, meal or shopping; with a visitation frequency that averages twenty visits per year. Very motivated by amenities & the experience, and is the highest spending per visit group.
Adjunctive Medium Frequency
Same as above, only with about half the visitation frequency. Adjunctive visitors are typically more willing to travel longer distances.
Destination High Frequency
Motivated chiefly by the ready availability of games, and less concerned with amenities & ambiance. High utilization of ‘player club’ point programs and bonus coupons. Spends less than average per use, and are typically referred to as the ‘grind’ players.
Destination Medium Frequency
Same as above, only with about half the visitation frequency. Also includes organized bus tour groups.
Infrequent Visitors These include ‘tag-along’ parties, and curiosity seekers, with an average of one or two visits per year. Motivated solely by visibility of venue, word-of-mouth recommendations, and utilization of restaurant services.

26
provide key insights into determining which games might be under-served in particular markets, especially where there are competing venues that do not offer a full array of games.
Importantly, there are some ‘crossover’ players, who will play multiple game types and others who do not. Bingo patrons are often frequent slot and keno players, however table game players are not always attracted to slots and/or bingo. Poker players will play house-banked table games and utilize satellite wagering facilities, but most do not play slot machines, bingo or keno.
Roughly 80% of the measured market has a preference for slot machines, 16% for table games and 4% for bingo and other games, such as pull tab and keno. The Casino’s financial results indicate that it is generating about 80% of its revenues from slot machines and 20% from table games and keno. The Casino likely attracts a higher proportion of table game play due to the fact that its most direct state-side competition is with the racetrack video gaming machines (VGM) at the Buffalo and the Finger Lakes racetracks which, while satisfying segments of the slot machine market, do not offer table games.
Measured market demand is based on ‘readily accessible’ venues within each of the radius rings, and that player participation and spending rates will vary with the distance traveled. The Casino’s current patronage mix suggests that it is likely attracts about 85% of its market demand from within the identified 100 mile radius, with the bulk coming from 50 miles or less.
An important element in a given casino’s ability to more fully penetrate the available demand, especially from the peripheral market segments, is the extent and configuration of the competitive mix, their relative market shares, and the relevancy of the Casino’s amenities to impel visitation.
Legalized gambling in New York State is currently undergoing major changes, precipitated by recent legislation allowing
Readily Accessible Venues
New York State Gaming

27
additional Class III Indian gaming, video gaming machines (VGM’s) at selected racetracks, and expanded lottery games.
According to the New York State Racing & Wagering Board, pari-mutuel handle at New York racetracks (the amount wagered before pay-outs) has remained somewhat stagnant over the past few years, hovering between $2.7 to $2.8 billion. Charitable gaming (bingo, pull-tabs, raffles, etc.) revenues are declining somewhat, from $460.4 million in ‘02 to $412 million in ‘03. The New York State Lottery reports net revenues of $5.8 billion in fiscal ‘04, compared to $5.4 billion in ‘03.
The racetrack VGM program did not commence until 2004, and there are four racetracks currently operating the games, as summarized below.
Racetracks, Charitable Gaming, Lottery
New York Racino VGM Revenue - 2004 Venue Saratoga Finger Lakes Buffalo Monticello Statewide VG M Units 1,324 1,010 990 1,744 5,068 Date Opened 28-Jan-04 18-Feb-04 17-Mar-04 30-Jun-04 Revenues Qtr. Ending 3/31/04 ($000) 12,600 7,170 2,010 0 21,780 Operating Days 64 43 15 0
Avg. Daily Win Per Device $148.70 $165.09 $135.35 $152.29
Qtr. Ending 6/30/04 ($000) 20,450 15,860 8,910 310 45,530
Operating Days 91 91 91 1
Avg. Daily Win Per Device $169.73 $172.56 $98.90 $177.75 $133.66 Year To Date ($000) 33,050 23,030 10,920 310 67,310 Operating Days 155 134 106 1
Avg. Daily Win Per Device $161.05 $170.16 $104.06 $177.75 $139.17
Qtr. Ending 9/30/04 ($000) 23,820 17,430 8,320 18,150 67,720
Operating Days 92 92 92 92 92 Avg. Daily Win Per Device $195.55 $187.58 $91.35 $113.12 $145.24 Year To Date ($000) 56,870 40,460 19,240 18,430 135,030 Operating Days 247 226 198 93
Avg. Daily Win Per Device $173.90 $177.25 $98.15 $113.82 $147.82
Qtr. Ending 12/31/04 ($000) 20,399 14,938 8,256 13,825 57,418
Operating Days 92 92 92 92 92 Avg. Daily Win Per Device $167.47 $160.76 $90.65 $86.16 $123.15 Year To Date ($000) 77,269 55,398 27,496 32,285 192,448
Operating Days 339 318 290 185
Avg. Daily Win Per Dev ice $172.15 $172.48 $95.77 $100.07 $139.48

28
Additional racetracks are authorized to install the VGM devices, including Batavia Downs, in Batavia and Vernon Downs both east of Niagara Falls, and Yonkers Raceway and Aqueduct in the New York metro area. Batavia Downs has announced a Spring 2005 opening date. Details for the remaining VLT venues have not been released.
Class III Indian gaming is showing a far more aggressive growth rate. Presently the State has three compact agreements with as many as three more anticipated over the next few years. The Oneida Indian Nation of New York signed an agreement in 1993 allowing it to operate house-banked style table games. The facility also offers Class II video lottery terminals and Class II games. (While a recent court ruling has invalidated this agreement, appeals are pending.) The Oneida’s Turning Stone Casino Resort, located southeast of Syracuse at the Verona exit of I-90, has become a major destination, featuring 2,400 slot devices, 100 table games, a large Bingo hall, nine restaurants, four hotels, three 18 hole golf courses, two 9 hole golf courses, a spa & salon, and an RV park. Additionally, the complex includes over 100,000 square feet of convention/exhibition space that attracts numerous large groups. The facility does not report financial results, but according to our most recent analysis of available data, we estimate that it currently generates gaming revenues of roundly $200 million annually.
The Saint Regis Mohawk Tribe opened their Akwesasne Mohawk Casino in 1999 and operate about 24 house-banked table games and 600 slot devices. The facility is situated at the far northern tip of the State near Hoganburg, and just east of the Seaway International Bridge from Cornwall, Ontario. Gaming revenues are not reported for this facility either, and we estimate, based on its somewhat remote location, that is generates annual gaming revenue of around $20 million annually.
In 2002, the third compact was entered into with the Seneca Nation for Class III casinos in Niagara Falls, Buffalo or Erie
Indian Gaming
29
County, and on their Southern Tier reserve lands. The Nation opened the Seneca Niagara Casino* on December 31, 2002, in Niagara Falls, and it presently contains 3,084 slot machines and 96 table games, along with ancillary amenities. Gaming revenues for 2003 (calendar year) were $252.2 million, rising to $294.5 million in 2004.
The hotel currently under construction and adjacent to the Casino, will eventually offer 600 rooms. Scheduled to open in December, 2005 and be completed in early 2006, the new facility will also include two restaurants, an additional 35,000 square feet of gaming space featuring 1,000 slot machines, a 19,000 square foot spa, a multi-purpose function area, and 550 additional parking spaces.†
The Seneca Allegany Casino in Salamanca opened in May, 2004, and contains 1,700 slot devices and 21 table games in addition to restaurant services, with a 1,850 space parking garage and 225 room hotel planned/under construction. Gaming revenues for the quarter ending 6/30/04 were $17 million; increasing to $30.3 million for the quarter ending 03/31/05.
Previous to the opening of its Class III venues, the Nation operated two Class II bingo style casinos in Irving and Salamanca. No revenues are reported for these units, and based our most recent analysis we estimate that these facilities generated gaming revenue of approximately $30 million in 2002.
The Cayuga Nation opened a small Class II gaming facility in a converted Napa auto parts store in Union Springs in June, 2004. We estimate, based on its size and location that the facility can expect to generate gaming revenues of about $5 million annually.
* Data pertaining to the Seneca Nation casino operations is taken from the U.S. Security & Exchange Commission (SEC) filings made by Seneca Gaming Corporation (SGC).
† For more details on Seneca Niagara hotel, see www.senecaniagaracasino.com.

30
There are currently three gaming operations in the Niagara Falls, Ontario region of Canada that attract some market support from the northwestern section of upstate New York. Casino Niagara, situated almost directly across the Rainbow Bridge, in Niagara Falls opened in December, 1996. The casino contains 2,840 slot machines and 140 table games, along with ancillary amenities including a Hard Rock Café and a Planet Hollywood restaurant.
The Niagara Fallsview Casino Resort opened in June, 2004, and features, a 368 room Hyatt hotel, and ten food & beverage outlets and an array of retail shops. The facility is of a much higher caliber than Casino Niagara in terms of ambiance; it provides a commanding view of the falls. Additional amenities are planned for the site, which is part of the Gateway project and include a theme park and people mover system. Collectively, these casinos offer 5,574 slot machines and 250 table games. Although Casino Niagara was initially conceived as a temporary facility until a permanent location was built, there are no announced plans to close this facility.
Fort Erie Racetrack is situated in Fort Erie, Ontario, nearby to the Peace Bridge that connects Buffalo to Canada. While the racetrack operates from late April through October, its 1,200 slot machines that were installed in 1999, and off-track satellite wagering facility are open all year.
Gaming revenues as provided by the Ontario Lottery Commission, at both Fort Erie and Casino Niagara had been climbing steadily through 2002, as the tables shown below indicate. However, revenues declined 8.5% in 2003, due to a combination of the opening of Seneca Niagara and the threat of the SARS epidemic that sharply reduced travel to and within Ontario.
Ontario Casinos

31
Through the first nine months of 2004, gross gaming revenues are up some 8.7% from the previous year, seemingly due to the June 10 opening of the new Fallsview facility, whose gaming revenue is included in the Casino Niagara 2004 year-to-date totals. Gaming revenues at Fort Erie, however, are still declining, likely because of continuing pressure from Seneca Niagara and the Fallsview opening.
Whereas overnight visitors to Niagara Falls, Ontario represent over 9 million person-nights according to 2003 data provided by the Niagara Falls Economic and Tourism Corporation and Statistics Canada, they are not a strong contributor to casino gaming revenues. This conclusion is based on a comparison of gaming revenues and occupancy rates by quarter. While quarterly casino revenues remain relatively constant throughout the year, hotel occupancy levels during the summer months in the third quarter are almost double the rates during other parts of the year.
Niagara Falls, Ontario Casinos
Niagara & Fallsview
Fort Erie Combined
(Millions Canadian C$)
% Change
2000 590.4 115.2 705.6 2001 604.0 147.8 751.8 +6.6% 2002 638.1 171.4 809.5 +7.7% 2003 525.9 130.4 656.3 -8.9% 2000 (9/30 YTD) 446.1 88.2 534.3 2001 (9/30 YTD) 464.1 112.2 576.3 +7.9% 2002 (9/30 YTD) 483.5 131.8 615.4 +6.8% 2003(9/30 YTD) 395.4 100.1 495.5 -19.5% 2004 (9/30 YTD) 454.1 84.6 538.7 +8.7%

32
If overnight visitors represented a significant portion of the Casino market demand, their impact would be reflected in higher casino revenue during the summer quarter.
Border crossing counts provided by Statistics Canada provide further evidence of the significance of U.S. daytrippers. The rate at which Americans entered Canada by automobile at the four local area bridges (Rainbow, Queenston, Whirlpool and Peace) for a same day visit fell 4.4% in 2002 vs. 2001; 20% in 2003 vs. 2002; and 6% through June, 2004 compared to the same period the previous year to date.
Moreover, the value of the U.S. dollar has been falling in recent years, from an average of C$1.58 in ’02 to C$1.44 in ’03, and C$1.25 through October, ’04. Therefore, visitors from the U.S.
Fort Erie Racetrack Average Win (C$)
Gaming (C$Mils)
# Of Patrons # Of Slots Per Slot/Day Patron
2000 Jan-Feb-Mar 25.1 312,570 1,200 232.41 80.30
April-May June 29.8 440,895 1,200 272.68 67.54July-Aug-Sept 33.3 569,940 1,200 301.45 58.39Oct-Nov-Dec 27.0 336,260 1,200 244.57 80.30
Total 115.2 1,659,665 1,200 262.92 69.392001
Jan-Feb-Mar 33.1 365,638 1,200 303.11 90.53April-May June 38.2 481,117 1,200 349.82 79.40
July-Aug-Sept 40.9 580,704 1,200 370.47 70.43Oct-Nov-Dec 35.6 379,224 1,200 322.46 93.88
Total 147.8 1,806,683 1,200 336.52 81.812002
Jan-Feb-Mar 41.5 409,410 1,200 384.26 101.37April-May June 45.0 505,050 1,200 412.09 89.10
July-Aug-Sept 45.3 562,304 1,206 408.56 80.62Oct-Nov-Dec 39.5 386,032 1,206 356.38 102.43
Total 171.4 1,862,796 1,206 389.31 92.002003
Jan-Feb-Mar 33.2 335,250 1,204 306.21 98.97April-May June 34.5 426,335 1,204 314.64 80.86
July-Aug-Sept 32.5 478,952 1,207 292.34 67.78Oct-Nov-Dec 30.3 354,568 1,207 272.65 85.39
Total 130.4 1,595,105 1,207 295.97 81.752004
Jan-Feb-Mar 29.0 297,297 1,217 261.86 97.55April-May June 28.3 336,791 1,203 258.51 84.03
July-Aug-Sept 27.3 350,888 1,203 246.67 77.80

33
with a fixed gaming budget are effectively spending fewer Canadian dollars. These trends closely parallel the loss of gaming revenues at the Niagara Falls, Ontario casino and racino operations.
The roughly C$150 (US$ 112.5) million drop in the gaming revenues experienced by the two Niagara Falls, Ontario region casinos in 2003, represents about 42% of the gaming revenues reported by Seneca Niagara Casino for the same period; and that about 41% of those players registered in the Seneca Link Player’s Club are from the Buffalo, Niagara Falls and Rochester areas.
An analysis of the prevailing market conditions prior to the opening of Seneca Niagara indicates that such a facility had the
Casino Niagara (12/96) & Fallsview Casino ( 6/04) Gaming # Of # Of # Of Total * Average Win (C$) Per (C$Mils) Patrons Slots Tables Positions Position/Day Patron
2000 Jan-Feb-Mar 143.1 1,727,460 2,782 137 3,604 441.18 82.84 April-May June 144.3 2,123,030 2,779 137 3,601 440.35 67.97 July-Aug-Sept 158.7 2,671,956 2,776 137 3,598 479.43 59.39 Oct-Nov-Dec 144.3 1,884,988 2,776 138 3,604 435.20 76.55 Total 590.4 8,407,434 2,778 137 3,602 449.10 70.22 2001 Jan-Feb-Mar 149.1 1,854,398 2,776 138 3,604 454.62 80.40 April-May June 154.5 2,285,374 2,788 139 3,622 468.75 67.60 July-Aug-Sept 160.5 2,546,744 2,797 139 3,631 480.46 63.02 Oct-Nov-Dec 139.9 1,814,148 2,828 139 3,662 415.25 77.12 Total 604.0 8,500,664 2,797 139 3,630 454.65 71.05 2002 Jan-Feb-Mar 154.3 1,793,970 2,841 139 3,675 466.52 86.01 April-May June 160.8 1,937,572 2,837 140 3,677 480.56 82.99 July-Aug-Sept 168.4 2,357,500 2,839 141 3,685 496.83 71.45 Oct-Nov-Dec 154.6 1,750,760 2,844 141 3,690 455.32 88.29 Total 638.1 7,839,802 2,840 140 3,682 474.84 81.39 2003 Jan-Feb-Mar 129.9 1,430,820 2,845 142 3,697 390.26 90.75 April-May June 129.6 1,417,962 2,865 142 3,717 383.23 91.42 July-Aug-Sept 135.9 1,966,684 2,865 142 3,717 397.50 69.12 Oct-Nov-Dec 130.5 1,596,200 2,865 142 3,717 381.70 81.77 Total 525.9 6,411,666 2,860 142 3,712 388.18 82.03 2004 Jan-Feb-Mar 120.5 1,408,498 2,865 142 3,717 356.25 85.55 April-May June 147.2 2,157,155 5,453 229 4,476 361.43 68.24

34
capability of redirecting about 23% of the gaming revenues generated by the two Niagara Falls, Ontario casinos, thereby representing almost half of their U.S. market share. Based on ‘02 revenues (C$638.1 million) and exchange rates (US$1.00 = C$1.58), this is equivalent to $92 million.
Based solely on this data and as seasonally and exchange rate adjusted, these venues are presently on track to generate total gaming revenues of roundly C$850 million annually, of which about C$88 million is estimated to stem from the U.S. market, with 90% of this amount originating from within the measured 100 mile radius U.S. market.
Seneca Niagara gaming revenue totals for the quarter ending December 31, 2004 suggest that the Casino may have lost some business to the new Fallsview project. Given that only about 6% of Seneca Niagara’s player club roster is comprised of Canadians, as discussed in Section II, the Ontario gaming venues are likely attracting more U.S. residents than Seneca Niagara is attracting Canadians.
To ascertain the degree to which the identified competitive operations lying within the subject radius market are attracting the measured demand potential, we utilize their known/estimated revenues, relative distance within each ring segment, type of games offered, amenities and ambiance. Based on the weights of each of these factors, our formula calculates that the existing casino operations are experiencing about a 68% market penetration rate, as indicated by the table shown on the following page.
As the table indicates, the Seneca Niagara facility, while currently trending to generate about $300 million in gaming revenue annually, approximately 80% of that generated by slots, is estimated to be attracting about 85% of its revenue from within the measured radius, equaling a 55% market share. Its next nearest competitors are the three Ontario casinos, followed by Seneca Allegany. The Casino’s other 15% of revenue is likely being
Estimated Market Shares & Penetration Rates
35
generated by a combination of Canadians and overnight tourists/commercial visitors to the region.
In similar gaming jurisdictions, we have noted that casinos tend to more easily attract “destination” occasioned-use type visitors, who are less driven by the ambiance and amenity mix, than the “adjunctive” user who combines gambling with other purposes. The destination player represents about 36% of the measured demand, with almost 50% of demand stemming from the “adjunctive” types, who tend to combine a casino visit with other activities such as dining, entertainment and/or sightseeing & shopping. It therefore appears that the Casino is not more fully penetrating this market segment, nor is it achieving as much penetration from the 50 mile ring and beyond. Given that Niagara Falls is already a destination for many visitors to the state and nation, the market combining casino gambling with other pursuits is particularly important.
Since its opening, the Casino has added amenities including a specialty restaurant and entertainment venue. Revenue trends through September 30, 2004 seem to indicate that these changes have had some impact on gaming revenues. Moreover, while the hotel element will provide a convenience that is apt to increase penetration rates from the peripheral markets, even at 100% occupancy it will only be generating a maximum of another 600 persons per day, or about 5% of its current daily average attendance of almost 12,000 visitors.
Our studies indicate that the net win amount from overnight casino visitors can be two to three times the average of daytrip visitors, their impact on overall revenue is largely an exercise in determining how many would have otherwise stayed at nearby lodging units and/or are already daytrip patrons.

36
Competitive Casino Market Shares & Penetration Ratestitive Casino Market Shares & Penetration Rates
Niagara Falls, New York0-25 ($M) 25-50 ($M) 50-75 ($M) 75-100 ($M) Total ($M)
Gross Spending Potential $211.3 $83.4 $156.8 $231.0 $682.5
Seneca Niagara $111.5 $32.7 $50.9 $57.2 $252.2 Seneca Allegany $5.0 $8.5 $16.5 $20.0 $50.0 Finger Lakes Racetrack $2.3 $6.6 $13.1 $10.8 $32.9 Buffalo Downs Racetrack $18.3 $3.7 $11.0 $3.7 $36.5 Seneca Class II $3.0 $3.3 $2.5 $1.2 $10.0 Niagara Falls, Ontario (US$) $36.0 $13.6 $18.4 $12.0 $80.0 Total Competitive Absorption $176.0 $68.3 $112.4 $104.9 $461.6 Net Unmet Demand $35.3 $15.1 $44.4 $126.1 $220.9 % Unmet by Market Radius 17% 18% 28% 55% 32%
Seneca Niagara 44% 13% 20% 23% 100% Seneca Allegany 10% 17% 33% 40% 100% Finger Lakes Racetrack 7% 20% 40% 33% 100% Buffalo Downs Racetrack 50% 10% 30% 10% 100% Seneca Class II 30% 33% 25% 12% 100% Niagara Falls, Ontario (US$) 45% 17% 23% 15% 100%
Seneca Niagara 53% 39% 32% 25% 37% Seneca Allegany 2% 10% 11% 9% 7% Finger Lakes Racetrack 1% 8% 8% 5% 5% Buffalo Downs Racetrack 9% 4% 7% 2% 5% Seneca Class II 1% 4% 2% 1% 1% Niagara Falls, Ontario (US$) 17% 16% 12% 5% 12% Total 83% 82% 72% 45% 68%
Seneca Niagara 63% 48% 45% 55% 55% Seneca Allegany 3% 12% 15% 19% 11% Finger Lakes Racetrack 1% 10% 12% 10% 7% Buffalo Downs Racetrack 10% 5% 10% 3% 8% Seneca Class II 2% 5% 2% 1% 2% Niagara Falls, Ontario (US$) 20% 20% 16% 11% 17% Total 100% 100% 100% 100% 100%
By Market Radius Absorption
By Market Share
Competitive Casino Market Shares & Penetration RatesRADIUS RINGS
By Market Distribution
Competitive Absorption

37
A lack of additional activities in the local environs also limits the Casino’s ability to attract players whose principal motivation is not gaming. Just as importantly, the prospect of added competition, most notably a third Seneca Class III facility in neighboring Erie County, could impact the Casino’s ability to draw this adjunctive market.
The Seneca Nation has announced plans to open its Erie County Class III casino in Cheektowaga, close to Buffalo-Niagara International Airport. However the development is presently mired in a court battle that questions the legality of the location, with the plaintiffs arguing for a Buffalo site. SGC management states that the facility is being designed with an emphasis on slot machines and to cater essentially to the Buffalo/Erie County market.
Governor Pataki continues to explore the introduction of casino gambling to the Catskills Region, although the details are still in negotiation.
Batavia Downs, located within the 50 mile ring from the Casino, is in the process of installing 580 VGM devices that are projected to be operational by early spring 2005. Given the relatively low reception these devices have had at the Buffalo Downs venue, we do not view this installation as representative of any significant proportion of market share.
The most consequential competitive gaming venues to the future revenue trends of the Seneca Niagara Casino is the Erie County project. Its proximity to the Casino, whether in Buffalo or Cheektowaga, can be expected to usurp significant portions of its market shares from all radius segments.
Although no definitive plans have been announced relating to the configuration of either of these facilities, based on the relative size of the market and the competitive environment, we estimate that a Class III facility in Buffalo/Erie County could contain as many as 2,500 slot machines and perhaps only 50 table games. In personal
Future Casino Development Projects

38
communication with Seneca Gaming Corporation officials, we were informed that the plan for a Buffalo-area facility would focus more heavily on slots.
To calculate the impact these potential new venues would have on the estimated market shares and penetration rates among the existing competitive mix, we redistributed the amounts shown in the previous analysis based on the same parameters of location, configuration, and amenities. According to these formulae, as shown on the following page, the existing casinos are expected to lose about 26% of their current market shares ($122 million) to the new venues, with about half of this amount coming from the Seneca Niagara facility. The estimates shown in the table do not include revenues from outside the geographic zone.
The two new venues, as a result of their presence and configurations, are projected to further penetrate a significant portion of the measured unmet demand, bringing total penetration from 68% to 91%, representing an additional $150 million in total gaming revenue. In total, the Seneca Buffalo/Erie County facility is projected to attract total gaming revenue of $251 million from within the measured radius, and an additional 10% stemming from both the Canadian market and from overnight visitors to the area, bringing its estimated total revenue to roundly $276 million annually. The VGM operation at Batavia Downs is projected to attract roundly $21 million from within the measured radius area, with average daily win per machine closely paralleling that of Buffalo Downs.
Competitive Impact of New Casinos

39
Market Share Redistribution Analysis
Niagara Falls, New York0-25 ($M) 25-50 ($M) 50-75 ($M) 75-100 ($M) Total ($M)
Measured Market Demand $211.3 $83.4 $156.8 $231.0 $682.5
Seneca Niagara $111.5 $32.7 $50.9 $57.2 $252.2 Seneca Allegany $5.0 $8.5 $16.5 $20.0 $50.0 Finger Lakes Racetrack $2.3 $6.6 $13.1 $10.8 $32.9 Buffalo Downs Racetrack $18.3 $3.7 $11.0 $3.7 $36.5 Seneca Class II $3.0 $3.3 $2.5 $1.2 $10.0 Niagara Falls, Ontario (US$) $36.0 $13.6 $18.4 $12.0 $80.0 Total Competitive Absorption $176.0 $68.3 $112.4 $104.9 $461.6 Net Unmet Demand $35.3 $15.1 $44.4 $126.1 $220.9% Of Market Penetration 83% 82% 72% 45% 68%
Seneca Niagara ($21.7) ($6.0) ($19.5) ($2.8) ($50.1) Seneca Allegany ($1.1) ($1.7) ($7.3) ($1.1) ($11.2) Finger Lakes Racetrack ($0.6) ($1.6) ($7.7) ($0.6) ($10.5) Buffalo Downs Racetrack ($7.7) ($1.3) ($7.3) ($0.2) ($16.5) Seneca Class II ($0.9) ($1.0) ($1.5) ($0.1) ($3.5) Niagara Falls, Ontario (US$) ($12.1) ($4.3) ($12.6) ($1.0) ($30.0) Market Gained by New Venues from Old $44.1 $15.9 $55.8 $5.9 $121.8 Additional Market Penetration $25.0 $13.3 $38.1 $73.7 $150.1 Total Potential Market for New Venues Seneca Erie County - Class III $65.0 $25.5 $86.7 $73.9 $251.1 Batavia Downs $4.2 $3.7 $7.3 $5.6 $20.8 Total $69.1 $29.2 $94.0 $79.6 $271.9
Seneca Niagara $89.7 $26.7 $31.3 $54.4 $202.1 Seneca Allegany $3.9 $6.8 $9.2 $18.9 $38.8 Finger Lakes Racetrack $1.7 $5.0 $5.5 $10.2 $22.4 Buffalo Downs Racetrack $10.6 $2.4 $3.7 $3.4 $20.0 Seneca Class II $2.1 $2.3 $1.0 $1.1 $6.5 Niagara Falls, Ontario (US$) $23.9 $9.3 $5.8 $11.0 $50.0 Seneca Erie County - Class III $65.0 $25.5 $86.7 $73.9 $251.1 Batavia Downs $4.2 $3.7 $7.3 $5.6 $20.8 Total Revised Market Absorption $201.0 $82.1 $150.6 $177.5 $618.4 % Of Market Penetration 95% 98% 96% 77% 91%
Revised Net Market Redistribution
Market Share Redistribution AnalysisRADIUS RINGS
Estimated Current Market Distribution
Estimated Market Segment Losses w/New Venues

40
The Seneca Niagara Casino is projected to lose market shares largely in the 0 to 25 mile and 50 to 75 mile radii. It is also projected to share portions of its local overnight and Canadian markets with the Erie County facility. Thus, we would see a decline in Seneca Niagara gaming revenue of about one-fifth once the two new venues are operational.
This estimate is based on the Casino’s current revenue trend and does not reflect the potential impact of the new hotel and added amenities that are expected to be operational in 2005, nor does it contemplate how changes in the area’s socioeconomic demographics (i.e. average income growth, etc.) may affect future revenues. These variables are discussed more fully in the following section.
Our analysis suggests that four distinct factors will influence the future gaming revenues for the Seneca Niagara Casino.
Whether this facility is located in Cheektowaga or another part of the county, its proximity to the extensive Buffalo market and other points east will divert significant portions of Seneca Niagara’s underlying local area market. According to our interpretation of SGC’s plans, this facility will serve as more of a ‘slot house’, with major emphasis on the local market. While this strategy seems designed to protect Seneca Niagara revenues, it is likely to attract away more slot players than table game players; thereby having a greater impact on the Exclusivity Fee, which is based only on slot revenue. As agreed to in the Compact between NYS and the Seneca Nation, NYS will receive revenue from this facility throughout the life of the Compact.
The extent and configuration of the currently under construction expansion is likely to widen the Casino’s effective trading radius and improve ‘adjunctive’ occasioned-use; both of which can be expected to increase gaming revenues. It is important to note however, that, given SGC’s emphasis on creating a ‘high-end’ hotel/spa environment, its patronage base, as evidenced by other
Potential Future Revenue Scenarios
Seneca Erie County
Seneca Niagara Expansion

41
similar installations, is likely to attract a higher percentage of table game players than slot patrons.
As noted in the national gaming trends section of this report, casino gaming revenues tend to increase in almost direct proportion to the growth of consumer income and spending. Although the general economic climate in the identified radius has been flat, demographic projections indicate about a 3% annual growth rate in average household income over the next five year period, which has the potential to be reflected in additional casino revenues.
Both the Seneca Nation and the City of Niagara Falls have plans to further develop the area with additional new ‘destination’ style products, services, amenities and attractions. In the absence of any specific details or timeframes, these are factors that are too vague to project their future impact. It is, however, significant to note that, based on the 2003 exclusivity fee payment of roundly $39 million paid to the state, the 25% local apportionment averages to $2.26 per casino visitor (based on the attendance estimates provided by SGC). This amount of net income would be the equivalent to the proceeds from a taxable retail purchase of roundly $53 based on the County’s current 4.25% sales tax rate. The point being, that new project development aimed at increasing attendance at Seneca Niagara is likely to have greater impact on local governmental income than attempting to leverage the visitation base by encouraging patronage to the local businesses. It would therefore appear that the order of priority should be to seek development opportunities that are first designed to enhance casino visitation to the point of market saturation, and then develop projects designed to further leverage those visitors, for example:
Visual enhancements in the Casino vicinity and major gateways;
Possible bingo facilities;
Upgrading of existing hotels, possibly new hotel construction;
Market Growth
New Development

42
Opening of restaurants proximate to casino (particularly for casino patrons who may want smoke-free dining options);
Introduction of retail facilities within walking distance from casino; and
Other forms of entertainment consistent with the demographic profile of the Casino visitor.
New projects should be undertaken mindful of the following:
Bolstered by visitation from the Casino, has an opportunity to expand its capture of the hospitality market in New York State and the Northeast.
As the community continuously works to improve the quality of the “product” it offers prospective visitors, it can move “upscale” and create more jobs at higher levels of pay.
Near term, job growth will continue to be strongest in lower skilled and lower paid professions in the hospitality sector.
Strategic use of the exclusivity fee can also help stimulate growth in other sectors, particularly logistics. Positioned on the active Canadian border, support for key assets (e.g. the airport) will facilitate the expansion of jobs in the transportation industry.
Based on these factors we have prepared a forecast model that factors for the current Casino revenue trends, the anticipated 4th quarter of 2005 opening of the hotel and amenity expansion, and the opening of a Seneca Erie County Class III casino by the 1st quarter of 2007. The table, as shown on the following pages, forecasts gaming revenues to increase by about 3% annually based on the projected economic growth in the region that is reflected in both higher spending per visit and additional market penetration. Staff requirements and gross payroll amounts are predicated on SGC’s stated employee requirements for the new addition, and utilize current gross wage averages, portions of which are adjusted by the same economic growth factors.
The share of casino revenues flowing to New York State and to Niagara Falls respectively were $39.0 million and $9.8 million in

43
2003 and $44.8 million and $11.2 in 2004. Over the fourteen year projection period, Casino revenues are forecast to grow from the 2003 level of $252.2 million to $612.9 million by 2016; with the local portion of the exclusivity fee increasing from $9.8 million to $30.2 million.*
Gross wages are expected to nearly double by 2016 from about $60 million currently to about $113 million in the final year of the compact. Spending onsite on food, beverage, retail and lodging is based on the historic relationship between these expenditures and total gaming revenue. Net spending on food and beverage subtracts the total reported by Seneca Gaming Corporation as being covered by the Casino as a “promotional allowance.”
* Forecasting completed prior to the release of 2004 preliminary financials. Moreover, forecasting data is based on calendar years of the Compact rather than fiscal year as reported by SGC.
Seneca Niagara Casino – Forecast of Gaming Revenue & Visitation Gaming Revenues ($million) Exclusivity Fee ($million) Visitors Year of
Compact Year
Slots Tables Other Total % Rate State $ Local $ 000 1 2003 $216.7 $53.5 $0.3 $252.2 18% $39.0 $9.8 4.32 2004 $248.9 $54.2 $0.3 $294.5 18% $44.8 $11.2 4.43 2005 $249.2 $62.2 $0.3 $311.7 18% $44.9 $11.2 4.84 2006 $281.6 $72.0 $0.4 $353.9 18% $50.7 $12.7 5.05 2007 $242.9 $66.2 $0.4 $309.4 22% $53.4 $13.4 4.36 2008 $254.7 $69.4 $0.4 $324.5 22% $56.0 $14.0 4.47 2009 $267.2 $72.8 $0.4 $340.4 22% $58.8 $14.7 4.58 2110 $362.9 $96.8 $0.5 $460.3 25% $90.7 $22.7 4.89 2011 $380.7 $101.6 $0.6 $482.8 25% $95.2 $23.8 4.9
10 2012 $399.3 $106.5 $0.6 $506.4 25% $99.8 $25.0 5.011 2013 $418.8 $111.7 $0.6 $531.1 25% $104.7 $26.2 5.112 2014 $439.3 $117.2 $0.6 $557.1 25% $109.8 $27.5 5.213 2015 $460.7 $122.9 $0.7 $584.3 25% $115.2 $28.8 5.414 2016 $483.2 $128.9 $0.7 $612.9 25% $120.8 $30.2 5.5

44
Statistics for the hotel assume 85% occupancy over the year in the first full year. This estimate is net of assumed promotional allowances for frequent visitors. The share of hotel revenue offset by promotional allowances is equal to the share reported by Seneca Gaming Corporation for food and beverage.
*
* For simplicity of forecasting purposed, given late 2005 for Seneca Niagara Hotel facility, we estimate 2005 hotel revenues at $0.
Seneca Niagara Casino – Forecast of Onsite Jobs & Nongaming Revenue Onsite F&B ($million)
Onsite Retail &
Other
Onsite Hotel
Gross Onsite Jobs
Gross WagesYear of Compact
Year
Total Net $million $million 000 $million 1 2003 $24.6 $7.1 $8.6 $0.0 2.0 $60.02 2004 $24.9 $7.2 $8.7 $0.0 2.1 $64.23 2005 $28.4 $8.2 $9.9 $0.0 2.3 $69.74 2006 $32.2 $9.3 $11.3 $6.4 2.8 $81.05 2007 $28.2 $8.1 $9.9 $6.5 2.4 $73.56 2008 $29.6 $8.5 $10.3 $6.6 2.5 $76.27 2009 $31.0 $8.9 $10.8 $6.8 2.5 $79.68 2110 $41.9 $12.1 $14.7 $6.9 2.7 $87.09 2011 $44.0 $12.7 $15.4 $7.1 2.7 $90.9
10 2012 $46.1 $13.3 $16.1 $7.3 2.8 $95.011 2013 $48.4 $13.9 $16.9 $7.5 2.8 $99.212 2014 $50.7 $14.6 $17.7 $7.6 2.9 $103.613 2015 $53.2 $15.3 $18.6 $7.8 3.0 $108.214 2016 $55.8 $16.1 $19.5 $8.0 3.0 $113.0

45
Economic impacts estimate net new job creation resulting from the Casino, both job creation at the Casino net of displacement and secondary job creation off-site stimulated by spending both from the Casino (often described as “indirect” impacts) and the spending of casino employees (often described as “induced” impacts).
Fiscal impacts involve estimates of the total increase in tax receipts as a result of the Casino operation. This study does not attempt to capture all tax receipts, but instead focuses on the personal income tax and the state and local sales taxes.
Off-site employment and wages stimulated by the Casino is forecast in the table following. This estimate is for the Buffalo-Niagara Falls Metropolitan Statistical Area (MSA). What share of these jobs will be in Niagara Falls will depend on the response of the Niagara Falls business community to the opportunities presented by casino visitors.
ECONOMIC & FISCAL IMPACT OF SENECA NIAGARA
CASINO
Offsite Job Creation

46
We believe that Niagara Falls, bolstered by visitation from the Casino, has an opportunity to expand its capture of the hospitality market in New York State and the Northeast. Armed with a world-recognized “brand,” the community’s best prospects for future growth rest in the expansion of tourism. As the community continuously works to improve the quality of the “product” it offers prospective visitors, it can move “upscale” and create more jobs at higher levels of pay. Near term we believe that job growth will continue to be strongest in lower skilled and lower paid professions in the hospitality sector.
The estimates presented above are a straightforward consequence of increased visitation at the Casino itself. We believe that any catalytic impact driven by offsite spending of casino visitors is very small at present. Without any data supporting a measurable catalytic impact, the secondary economic impacts are all driven by the primary economic activity at the Casino.
Seneca Niagara Casino – Forecast of Economic & Fiscal Impact Net New
Onsite Jobs
Net New Primary Wages
Secondary Jobs
Secondary Wages
NYS PIT
State Sales Tax
Local Sales Tax
Year of Compact
Year
000 $mill 000 $mill $mill $mill $mill 1 2003 1.4 $41.5 1.0 $28.3 $2.3 $3.1 $2.82 2004 1.5 $45.7 1.1 $31.1 $2.5 $3.5 $3.13 2005 1.7 $51.2 1.3 $34.9 $2.8 $3.9 $3.44 2006 2.1 $62.5 1.6 $42.6 $3.5 $4.7 $4.25 2007 1.8 $55.0 1.3 $37.4 $3.0 $4.2 $3.76 2008 1.8 $57.7 1.4 $39.3 $3.2 $4.4 $3.97 2009 1.9 $61.1 1.4 $41.6 $3.4 $4.6 $4.18 2110 2.0 $68.5 1.5 $46.7 $3.8 $5.2 $4.69 2011 2.1 $72.4 1.6 $49.3 $4.0 $5.5 $4.9
10 2012 2.1 $76.5 1.6 $52.1 $4.2 $5.8 $5.111 2013 2.2 $80.7 1.7 $55.0 $4.5 $6.1 $5.412 2014 2.3 $85.1 1.7 $58.0 $4.7 $6.4 $5.713 2015 2.3 $89.7 1.7 $61.1 $5.0 $6.8 $6.014 2016 2.4 $94.5 1.8 $64.4 $5.2 $7.1 $6.4
Offsite Visitor Spending

47
Strategic use of the exclusivity fee can stimulate a catalytic impact by enhancing the appeal of the community to casino visitors, thus extending the stay of future visitors and helping the Casino expand its market capture. These efforts would broaden the scope of the Casino visitor’s economic impact.
Clearly the exclusivity fee could also be used to stimulate growth in sectors unrelated to the Casino, particularly logistics. Positioned on the active Canadian border, support for key assets (e.g. the airport) will facilitate the expansion of jobs in the transportation industry.
The question of the magnitude of offsite impacts is critical. We recommend that future surveys of visitors conducted or sponsored by NTCC focus on this issue. Future surveys must gather better information on the relationship between casino visitation and the rest of the Niagara Falls economy. Several changes would be appropriate:
NTCC should selecting survey collection sites that are likely to capture individuals whose sole purpose in visiting is to attend the Casino. The survey reviewed for this study was dominated by the “Maid of the Mist” collection point.
Questions about spending patterns should be revised. Instead of asking about total spending for the duration of the visit, it would be more effective to ask about spending “within the previous 24 hours” or some other tangible, recent time period.
Clearly, many efforts underway—revitalization of the Third Street Entertainment District, the creation of the Conference Center of Niagara Falls and others—are intended to promote increased visitation and broaden the economic impact of the Casino. Given the success of the Casino, we believe that investments that are complementary to the Casino are likely to receive the highest rate of return.
As the Casino itself is tax exempt, the fiscal impact of the Casino flows through payroll to employees. These figures are all derived from payroll flows to casino employees. Estimates of casino
Fiscal Impact

48
employment have been adjusted for calculated displacement of casino earnings for earnings from other sectors in the metropolitan area.
NYS personal income tax earned from these taxpayers is estimated at about $2.5 million in 2004. Sales tax earnings are an estimated $3.1 million to local government with $3.5 million flowing to the State of New York. As the Casino expands and spurs additional employment, the fiscal impact will also increase. The estimate above suggests that annual state tax receipts could exceed $12 million and the local sales tax, $6 million.
The share of sales tax revenue distributed among Erie and Niagara counties and their individual municipalities (including the City of Niagara Falls) depends on where workers live and where retail dollars are actually being spent. As a substantial share of the county sales tax is distributed among municipalities according to
population, the Casino’s impact on the Niagara Falls community will likely expand population due to increased direct and indirect employment, thus eventually increasing the City’s share of the
County sales tax revenue. The retail sector of the City of Niagara Falls has significant
growth potential and can be expected to capture retail sales from Niagara Falls, Ontario and Erie County. An effective economic development program aimed at expanding taxable sales would add to total revenue. With a quarter of the county’s population living in the City of Niagara Falls, this is another path by which the City will benefit from the success of the Casino, particularly as offsite spending increases.
Within the Compact is an agreement that about 52 acres will eventually be transferred to the Seneca Nation and become trust lands. The assessed value of this property is currently $133 million, although the bulk of the value consists of the Casino itself, valued at $100 million. Currently, taxable assessed value is $17.5
Sales & Personal Income Tax
Collections from Proposed Trust Lands, 2004 Taxing Jurisdiction 2004 Tax
Collections Niagara Falls School District $329,457City of Niagara Falls $175,562Niagara County $39,427TOTAL $544,446
Property Tax

49
million, if the Seneca Nation properties (except the Casino itself) are included. These bring a collective property tax liability of just over one million dollars. Adding back the lands currently under Seneca ownership and exempt from taxation, total property tax liability would rise to $8.4 million annually. As the convention center was state owned prior to construction of the Casino, however, no property tax payments were being made on the parcel.
Using tax records provided by the City of Niagara Falls (with the assistance of USA Niagara Development Corporation), the properties within the 52 acre property that will become part of the Seneca Nation’s trust lands paid just over half million dollars in 2004. The City of Niagara Falls received $175,562. This amount represents taxes actually paid, not tax liability.
It is impossible to determine the net impact of the Casino specifically on Niagara County. Increased payroll and employment for county residents will increase sales of taxable goods and services throughout the county. While there are specific property tax losses for lands taken into trust for the Seneca Nation, the surrounding properties can also be expected to rise in value if the combination of casino traffic plus the investments of the State of New York through the USA Niagara Development Corporation (e.g. the Third Street project) and development spending funded by the exclusivity payments generated by the Casino have a catalytic impact on Niagara Falls and Niagara County development.
Property Tax Liability 2004: Niagara Falls Trust Lands Taxable + SGC Property (except
Casino)Taxable Plus All SGC
PropertyCity of Niagara Falls $531,115 $4,034,361Niagara County $153,817 $1,168,400Niagara Falls School District $426,009 $3,235,977TOTAL $1,110,942 $8,438,738
Niagara County Impact

50
Receipts from the hotel/motel occupancy tax fell 13% to $0.9 million in 2003, then rebounded in 2004 to $1.2 million, a 21% increase. This is still below the $1.3 million earned in 2000. As Smith Travel Research reports an increase in total lodging revenue for the county (albeit a small increase), the 2003 loss appeared to be a result of SARS-related declines in Niagara tourism plus competitive pressure from lodging outside Niagara Falls. We also note that based on discussions with NTCC, local business leaders, including those affiliated with the Casino, perceive a decline in the quality of the hotel/motel offerings in Niagara Falls. Specifically, the Casino has started providing lodging for its best customers not in Niagara Falls, but in Buffalo, Erie County. Indeed, casino developers maintain that they anticipate being able to meet unsatisfied local demand for higher end hotel/motel rooms once the Casino’s hotel opens for business. Because casino business is now funneled to Erie County enterprises, NTCC visitation data, even in its disaggregated form, cannot fully address the matter.
Another factor is the loss of the Convention Center. Data from the Convention & Visitors Bureau (reported by Hunter Interests in its report to USA Niagara Development Corporation) indicates that the number of room nights generated by major events was 23,454 in 2002 (from a total of 35,825 guests). NTCC records show far fewer for 2003—about 4,500 guests. Given the transition between the CVB and the NTCC occurred between these two years, it is not clear that the difference is wholly attributable to the convention center rather than a difference in record-keeping. It seems likely that a portion of the shortfall in lodging revenue can be attributed to the loss of major events.
We do not have sufficient information to presume to accurately estimate the net loss in sales tax or hotel/motel occupancy tax as a result of the Casino. We are confident, however, that added visitation, coupled with infrastructure improvements outside the Casino proper, will increase both occupancy and sales tax revenue in the future. The magnitude of this improvement will be determined by the response of the community to the opportunity
Hotel/Motel Occupancy Tax

51
afforded by the Casino. We are encouraged by the Third Street project and plans to improve the appearance of the City of Niagara Falls. New private investment in lodging facilities is also desirable and would certainly benefit the community.
The fact that revenue recovered in 2004—but remained below 2000 levels—strongly suggests that business generated by the Casino has not offset reductions from these other changes.
We have reviewed Niagara Falls expenditure records for the past 4 years and have spoken with City officials as a means of ascertaining the actual costs imposed on the City because of the existence of the Casino.
In some instances, costs are real and measurable. In others, officials anticipate additional needs arising as the permanent casino and hotel open for business.
Currently the Casino has on staff its own EMS professionals and has purchased an ambulance. It can thus respond internally to medical emergencies and transport those who need additional care. The 26 story hotel is recognized as a possible additional burden by the Fire Department, although the fact that the building is being constructed according to current fire codes is encouraging. The Department has asked the Seneca Gaming Corporation to accommodate equipment storage on the higher floors to improve the Department’s ability to respond in the event of an emergency.
The Casino is located in an existing tourist area close to the Falls so the police department already finds it needs to issue parking tickets and the like. Nevertheless, Superintendent John Chella does report a “dramatic spike” in parking violations from 2002-2003. While CGR has heard concerns over the increased overtime costs incurred by the department because of special events at the Casino, the Superintendent noted that the Casino hires additional offers at Casino expense and assumes the “vast majority” of additional costs.
Expenditures
Fire Department
Police Department

52
During 2002, parking violations revenue totaled $318,117. This grew to $888,624 in 2003, an increase of more than $570,000*. The Police Department has not added staff to accommodate this increase in violations.
Seneca Niagara pays officers $25.00/hour while, by contract, off duty officers are required to be paid time-and-half. The total additional cost to the department on an annual basis for uncompensated overtime as mandated by contract is approximately $7,500.
At times, special events can tax departmental resources but the Superintendent notes that in the case of the Labor Day Beach Boys Concert, it was less an issue of resources than it was timing and Labor Day traffic at the Rainbow Bridge. Indeed, the Superintendent noted that the Department would have incurred overtime costs regardless of the concert.
The Casino has contracted with State Police to provide a presence inside the Casino. The City of Niagara Falls polices the exterior. Moreover, the Seneca Gaming Corporation has its own security department that patrols the parking ramp. The Niagara Falls Police Department has filled no new positions as a result of the Casino’s presence and the Superintendent observed that any increase in any sorts of crime (which have yet to be documented) are attributable not to casino traffic per se, but to more traffic in general.
Prior to the construction of the Casino, the City’s General Fund made an annual transfer to the Convention Center Fund to finance a recurring deficit. In 2000 and 2001, the deficit averaged about $1.3 million. The deficit was lower in 2002, presumably because the Convention Center closed to permit construction of the Casino. According to City of Niagara Falls 2003 audited
* Source: City of Niagara Falls.
Convention Center

53
financials regarding the Capital Lease Payable between the City and NYS Urban Development Corp. (UDC):
The City entered into an agreement dated March 15, 1971 with the New York State Urban Development Corp. (UDC) for the purpose of financing and constructing a Convention Center. Under the terms of the agreement (as subsequently amended) the UC leased the Convention Center to the City for the period January 1, 1974 through December 31, 2013. Future minimum lease payments as of December 31, 2003 in the aggregate are $31,255,296. Interest included in lease payments is $9,382,502. The present value of lease payments is $21,872,794.
The payment the City makes each year to UDC is in the amount of $3,103,386. The revenue the City receives each year from UDC is in the amount of $3,341,661. When the State gave the Convention Center to the Seneca Nation, a Memorandum of Understanding was written between the Empire State Development Corp. and the City dated 9/20/02 explaining the continuance of the lease agreement.
The City of Niagara Falls, while losing some revenue as a consequence of the transfer of the Convention Center to the Seneca Nation, also saves the cost of the annual debt payment to the Urban Development Corporation.
The City owned two parking ramps. The parking ramp closest to the Casino (on Third Street) had a small deficit in the three years prior to the opening of the Casino—an average of just under $200,000. As the second parking ramp still has outstanding debt, the cost to the city is greater, an average of about $1.5 million for 2000-2002. Net revenue improved in 2003; the deficit declined to $1.1 million (perhaps as a result of the Casino).
While the City’s police force has written fewer parking tickets in 2004 than in 2003 (perhaps due in part to the new parking available at the Casino parking garage), a recent report in the Niagara Gazette (1/10/05) explains that because of increased collections, parking revenues were greater than expected. Faced
Parking

54
with unpaid parking fines that totaled $1.3 million in the last quarter of 2004, the city’s police department stepped up collection efforts. Police Superintendent John Chella attributes success to the efforts of warrant officers.
55
The 2002 compact between New York State and the Seneca Nation of Indians requires that revenues shared with the locality “be available for purposes including but not limited to…reimbursements or payments to municipal governments…for costs incurred in connection with services provided to such casinos or arising as a result thereof (or) for economic development opportunities and job expansion programs authorized by executive law…” With local casino funds being appropriated on an annual basis through the New York State Budget and with no specific mandate to place shared revenues in the hands of a non-governmental authority, establishing a spending approach similar to those profiled in this report will require a carefully negotiated compromise among the stakeholders.
Fee-for-service agreements have been used in other communities to underwrite the direct municipal service costs of casino gaming facilities. In Niagara, some form of “isolating” those municipal costs while allocating the remainder to economic development is likely to be the most feasible way of establishing a model along the lines of the Schenectady Metroplex, the Casino Reinvestment Development Authority of New York or others (see Appendix for summaries).
II: ENHANCING THE LONG TERM PROSPERITY OF
NIAGARA FALLS THROUGH STRATEGIC USE OF CASINO
REVENUE
SPENDING CASINO REVENUE IN NIAGARA

56
After reviewing the Native American-run casinos across the country, CGR has profiled those casinos that are most comparable to Niagara Falls. Even these were not exactly similar, however, due to differences in the sizes of the municipalities, sizes of the Casinos, and different revenue sharing agreements. The six casinos and their revenue sharing agreements are summarized in this next section of the report.
Of the six casinos, only four actually have agreements where funds flow directly to local municipalities. There does not appear to be any one way funds are spent that is common to all municipalities involved. The most common use of casino revenues is to pay directly for police and fire services. Several of the municipalities use the revenues for their general funds. Several of them use funds for one-time capital costs. In a few cases funds go into economic or community redevelopment funds.
These findings suggest that the Seneca Niagara casino revenues could be used for several different objectives. Dedicating some of the funds to public safety, economic development and infrastructure improvements would be most consistent with how funds are spent in other communities.
Casino-generated revenues from the six comparable communities are being spent in a variety of ways. This portion of our report examines individual casino agreements, summarizing how funds from the Casino are allocated among the geographic units in which they are located.
The Detroit Greektown Casino has a revenue sharing agreement that includes both the State of Michigan and the City of Detroit. In addition, the City of Detroit has negotiated a separate service agreement with the Casino. The revenue sharing agreement stipulates that 20% of the total revenue share is reserved for the
REVENUE SHARING AGREEMENTS AT OTHER INDIAN
CASINOS
Individual Casino Revenue Sharing Agreements
Overview

57
City of Detroit. The City of Detroit, in turn, uses 2.5% of net winnings for a Community Redevelopment Fund, and 6.5% of net winnings for general operating expenses for the city. The City also receives $25 million to cover direct and indirect costs associated with the Casino and $6 million to upgrade the transportation infrastructure. The separate service agreement provides $3 million for police services, $100,000 for fire protection and a one-time payment of $3 million for a new fire station.
The Casino San Pablo in California has a separate agreement with the City of San Pablo in which the Casino agrees to pay the city $1.5 million to offset lost property tax revenues and to pay the cost of an increase in the police force. In addition, the agreement requires the Casino to pay $3.5 million to the general fund and make an annual $25,000 contribution to the San Pablo Community Foundation.
The Oneida Bingo and Casino in Green Bay, Wisconsin has a separate agreement with the County and local municipalities to contribute toward general government expenses and to supplement costs associated with emergency services.
The Grand Casino in Hinckley, Minnesota has a separate service agreement with the county to reimburse the local government for added police and utility services associated with the Casino.
What follows is a more extensive summary of the background behind each of the six casinos used for this comparison study.
The State of Wisconsin signed a gaming compact with the Oneida Indians in 1991, and the 125,000 square foot Oneida Bingo and Casino opened outside of Green Bay in 1993. Per a 1998 amendment to the original casino gaming compact, the tribe is required to make annual payments to the state in the amount of $5.4 million. This amendment was enacted for five years, and after review in 2003, the Oneidas agreed to pay Wisconsin $58 million over three years beginning in 2004 in exchange for a permanent gaming compact with more games and higher betting
Oneida Bingo and Casino, Green Bay, WI

58
limits. The Oneidas also agreed to a supplemental plan whereby they would develop a revenue sharing arrangement for other Indian nations within the state, directing dollars to tribes that have lower gaming revenues. Aside from this revenue sharing plan with the state, there are no other direct local revenue sharing arrangements.
As for services, there are agreements in place with localities. In 1997, the Casino negotiated with the City of Green Bay to pay for select general services, while still providing its own police services on-site. The Oneidas contracted for wastewater treatment, for example, and paid infrastructure costs of connecting the facility to the Green Bay Metropolitan Sewage District. A supplemental agreement was negotiated with the Village of Ashwaubenon, in which the Casino is located. Ashwaubenon receives $150,000 annually to defray the cost of services provided to the Casino, and has a reciprocal mutual aid agreement with the municipality for police, ambulance and other emergency services. Finally, the tribe made a one-time $120,000 contribution to defray the cost of additional fire equipment made necessary by it in the local community. Brown County negotiated a separate agreement with the Casino to be paid an annual fee for services of $500,000 to cover casino-related expenses, including emergency services and libraries.
Arizona signed its compact with the Pascua Yaqui in 1993, and the tribe’s first casino, the Casino of the Sun, opened in March 1994. The 40,000 square foot facility is located 15 miles outside of Tucson on the Pascua Yaqui reservation. The original compact between the tribe and the state did not establish a revenue sharing agreement, though negotiations have recently resulted in an agreement that will direct some of the Casino’s take to the state. Under the new agreement, Indian casinos in Arizona will be permitted to expand their numbers of slot machines by 75 percent over five years, in exchange for revenue sharing that will net the state an estimated $90-$100 million annually. The state receives 1-to-8 percent of casino revenue on a sliding scale; 1 percent of
Casino of the Sun, Tucson, AZ

59
gaming revenue under $25 million; 3 percent on revenues between $25 and $75 million; 6 percent up to $100 million; and 8 percent on revenues in excess of $100 million per tribe.
The Pascua Yaqui provide their own police, fire and emergency services on-site, and do not have contractual arrangements with the local community.
Florida’s tribal casino arrangement is significantly different from the others profiled in this report. The five Indian gaming facilities operate in the absence of a state compact, and the state has expressed its displeasure at the current arrangement. Since tribal gaming began in Florida, the lack of a compact has been a bone of contention for both sides. In 1991, in fact, the Seminoles sued the state and governor in federal court for what they alleged was a refusal to enter into “good faith” compact negotiations. The Seminoles were seeking a compact that would enable them to offer Vegas-style gaming at their facilities. As long as the tribal casinos are operated without a compact, there is no revenue sharing requirement. Thus, this 47,000 square foot gaming center turns no profits over to the state or local communities. Neither does it have service contracts with its municipal neighbors.
The Sandia Casino is owned and operated by the Pueblo of Sandia tribe. Opened in 1995, the 210,000 square foot facility operates in accordance with a state compact signed in 1995 and revised in both 1997 and 2001. The original compact included a provision whereby tribes would pay 16 percent of their slot machine revenue to the state annually. The compact was renegotiated in 2001 to halve that amount in exchange for an expansion of casino gaming in the state. The current revenue sharing arrangement is a sliding scale based on total gaming revenues, ranging from 3-to-8 percent. The Sandia provide their own services on-site, including police and emergency. There are currently no contractual agreements for services in place with other localities.
Seminole Casino of Tampa, Tampa, FL
Sandia Casino, Albuquerque, NM
60
Detroit Greektown, a 75,000 square foot gaming facility operated by the Sault Ste. Marie Tribe of Chippewas, opened in late 2000. Under a 1993 compact with the State of Michigan, tribal governments retain exclusive rights to establish and operate gaming facilities both on and off Indian reservations. Michigan’s compact was somewhat unique from others in that it spelled out a specific state- and local-level revenue sharing agreement with tribal casinos from the beginning. Under the 1993 agreement, ten percent of all video gaming machine revenues would be paid to the government – 80 percent of those dollars went into the state’s strategic economic development fund, with the remaining 20 percent going to local governments where casinos were located. The Chippewas’ venture in Detroit followed the city’s 1996 referendum approval of gaming.
The current arrangement between the City of Detroit and the Casino involves both revenue sharing and service arrangements. Regarding revenue, 2.5 percent of net winnings are used to fund a Community Redevelopment Fund aimed at economic development and revitalization of the city. An additional $25 million was paid to Detroit to cover direct and indirect costs associated with the construction of the facility, with final payment occurring 18 months after opening day.
6.5 percent of net winnings are paid annually by the Casino to the city to help fund general operations. Specifically, the tribe pays $200,000 annually for a gamblers’ counseling program in the city; water and ewer charges are billed to the Casino by the city at normal rates, and the Casino paid for all connection costs related to its construction; and $6 million is provided to the city to upgrade transportation infrastructure for the Casino.
Additional police and fire services agreements exist between the Casino and city. The tribal police force works in concert with the city’s, providing primary coverage to the Casino. The city provides supplemental coverage (50 officers) at an annual rate of $3 million. The city provides comprehensive fire protection to the
Detroit Greektown, Detroit, MI
61
facility for $100,000 per year, and the tribe funded construction of a new fire station near the Casino for $3 million.
The State of Minnesota negotiated 22 casino gaming compacts with its Native American tribes in 1989. The 55,000 square foot Grand Casino was opened by the Mille Lacs Band of Ojibwe three years later. Like all tribal casinos in the state, it is located on an Indian reservation. There is no formal revenue sharing arrangement between Minnesota and its tribal casinos, although the original compact signed with the tribes requires them to pay minimal costs to the state annually to defray “administrative costs.” No local revenue sharing plan is in place, either.
Regarding services, the tribe is generally self-sufficient on-site, but supplements police protection and utilities with payments to the local community. The tribe does not have a nearby police station, but does provide its own police protection services on-site. To accommodate periods of additional need and backup, it pays the County Sheriff’s Department $92,000 annually (as of 2001) for supplemental service. Further, it has paid for specific upgrades to the community’s utility and sewer systems, including a $1 million upgrade to Hinckley’s wastewater treatment plant. It also contributed $20,000 for the purchase of a new ambulance for the township.
Grand Casino, Hinckley, MN

62
Across the nation, both state and local governments have come to rely on gambling taxes to support spending. With adjusted gambling revenues taxed at rates ranging from a low of 6.75% in Nevada to rates in excess of 50% in Illinois, commercial casinos paid taxes of approximately $4.3 billion dollars in 2003 according to the American Gaming Association.
The impact of casino gambling on their local economies is unclear. CGR’s summary in its analysis of casino gambling impacts on Rochester, NY is instructive.* As the literature summarized in this report makes clear, a careful study of economic impact takes a significant investment of effort and inevitably depends on a number of assumptions. As a complement to the textual analysis below, we report the change in unemployment rates relative to the national average for the metro areas explored in the section. The findings are inconclusive. In five of these communities the unemployment rate worsened relative to the national average after the introduction of casino gambling. Peoria’s relative position did not change; Chicago’s position improved. The unanswerable
* http://cgr.org/Data/CGR/Articles/Files/9_Social%20&%20Econ%20Impacts%20of%20Casino.pdf
ASSESSING THE RELATIONSHIP BETWEEN CASINOS AND
ECONOMIC DEVELOPMENT
Comparison Cities Unemployment Rate Trend (NOTE: 100% denotes metro rate = US rate) BASELINE: Avg of year
casinos opened & prior year (share of US average)
Baseline Years
Share of US Average in Years 3 & 4 following casino opening
Benchmark Year(s)
Trend (benchmark – baseline)
Chicago 101% 91/92 92% 95/96 +9%Detroit 81% 98/99 114% 02/03 -34%Peoria 96% 95/96 96% 99/00 0%Shreveport 120% 93/94 143% 97/98 -23%Kansas City 76% 93/94 80% 97/98 -4%Biloxi 101% 91/92 104% 95/96 -3%Niagara County 125% 02/03 132% 04 -6%Source, US Dept. Of Labor

63
question is whether the employment situation would have been even more tenuous without the presence of the Casino.
A recent study released by the Rappaport Institute for Greater Boston at Harvard* confirms the findings of older studies: Counties in the United States with casinos grew slightly faster than non-casino counties although unemployment rates were essentially the same. Total reported crimes grew but fell on a per capita basis. There was a modest increase in bankruptcies while median home values grew slightly more in casino counties. Nor did the study find that public sector spending was influenced by the presence of a casino; in fact, as population grew, spending per capita fell slightly in casino counties. In conclusion, the study “suggests that economic, fiscal or public-safety factors are insufficient to either deny or invite casinos into Massachusetts.”
Even for those states where commercial casino gambling has not been legalized, Indian gaming is nevertheless responsible for injections of money into both the local and state economies in the form of wage taxes, local goods and services purchased by the Casinos among other factors. We will consider several examples of casino gambling that speak to the developing impact of the Seneca Niagara Casino. Niagara Falls, Ontario, is an example of publicly-owned casino gambling. The State of Michigan combines Indian casinos with commercial casinos. We focus on Detroit, which contains both. Kansas City, Missouri; Elgin, Illinois; and Biloxi, Mississippi have benefited from commercial casino gambling and the ensuing tax revenues. The state of Arizona is home to Indian gaming whose the revenues, direct and indirect, have generated significant economic activity.
* Baxandall, Phineas and Bruce Sacerdote, The Casino Gamble in Massachusetts. Rappaport Institute for Greater Boston, Harvard University, January 13, 2005.

64
The key agency governing gaming in the province of Ontario is the Ontario Lottery and Gaming Corporation, a provincial crown corporation reporting to the Minister of Economic Development and Trade. *
The Ontario Lottery and Gaming Corporation (OLGC) owns and maintains authority over four commercial casinos in Ontario - Casino Windsor, Casino Niagara, Casino Rama (on Chippewas of Mnjikaning First Nation land, located in Ramara Township of Orillia) and Niagara Fallsview Casino Resort. The day-to-day operations of these casinos are contracted to the private sector. With the exception of Casino Rama, 100% of net revenue and 20% of gross gaming revenue from commercial casinos go to the Province of Ontario's general revenue fund. Of that, a portion is earmarked for programs to combat gambling addiction. $100 million annually goes to the Ontario Trillium Foundation, another provincial government agency, to be distributed for a wide variety of charitable projects across Ontario. Net revenue from Casino Rama is shared among Ontario's 134 First Nations to assist with community and economic development.
Most commercial casinos pay a grant in lieu of property taxes to the local and regional municipalities in which they are located, a common practice for a variety of federal and provincial government facilities which are legally exempt from paying local taxes. In addition, the Province has agreements with the City of Windsor (commencing in 1998) and the City of Niagara Falls (commencing in 2000) to pay each of them $2.6 million annually for the first 10 years of the agreement, increasing to $3 million annually for the second 10 years.
In the case of Niagara Falls, the $3 million during the second 10 years will be adjusted for inflation. These funds are used at the municipalities' discretion. The City of Niagara Falls also received a
* For more on the OLGC, see http://corporate.olgc.ca/index.jsp
Ontario, Canada

65
one time payment of $3.3 million to cover the cost of municipal infrastructure serving the Niagara Fallsview Casino Resort.
OLGC operates five charity casinos in Ontario: Casino Sault Ste. Marie; Brantford Charity Casino; Point Edward Charity Casino; Thunder Bay Charity Casino and Thousand Islands Charity Casino. OLGC also owns and maintains authority over the slot operation at the Great Blue Heron Charity Casino, an aboriginal casino owned by the Mississaugas of Scugog Island First Nation, situated just east of Port Perry. Host municipalities of charity casinos receive 5% of gross slot revenue on all machines located in that facility. These funds are used at the municipalities' discretion. Finally, OLGC also operates 16 slot machine facilities at racetracks across
Ontario. Municipalities receive 5% of the gross revenues on the first 450 slot machines and 2% of gross revenues for any additional machines, with the monies to be used at the municipalities' discretion. Moreover, OLGC sponsors a variety of local projects as owner of the Casinos and a local corporate citizen, including, for example, contributions to the construction of local hospitals. There are no specific provincial programs to target casino funds for economic development purposes. Generally, governments in Canada try to avoid earmarking specific revenue streams to specific expenditures. Instead, most revenues flow into the consolidated revenue fund and are spent in accordance with annual budget approvals by the legislature.
When Michigan voters approved Proposal E in November, 1996, they authorized the construction of three licensed casinos to be built in Detroit. In 1997, the proposal was modified and signed into law as the Michigan Gaming Control and Revenue Act. The Act allows for the licensing of no more than three casinos at any one time in a city with a population over 80,000. Michigan also grants gaming licenses to Native American casinos under compacts of 1993 or 1998 as long as the casinos are located at least 150 miles outside of Detroit. Exceptions are granted if a tribe has a land agreement—as is the case with Detroit’s
Gambling in Detroit, Michigan

66
Greektown Casino—signed by the governor, for property within the 150 mile radius. Currently 17 tribal casinos operate within the central and northern parts of the state.
When Public Act 306 went into effect on September 1, 2004, commercial casinos were required to pay 24% of gross revenues to both the City of Detroit and to the State’s School Aid Fund in addition to a municipal service fee of either 1.25% of AGR or $4 million (whichever is greater.) This represents an increase from the initial rate of 18% that casinos had paid since 1998. Native American casinos are required to pay 8% of AGR and 2% to local municipalities. Moreover, they are also subject to the same municipal service fee paid by commercial casinos. Finally, commercial casinos pay an Annual State Services Fee to underwrite the daily operating expenses of the Michigan Gaming Control Board. Each casinos pays one-third of $25 million annually. Of this $25 million, $2 million is spent annually on Michigan Department of Community Health’s compulsive gambling treatment programs.
The 12.1% of the State Wagering Tax is deposited into the School Aid Fund for K-12 education statewide. The City Wagering Tax may be used by the City of Detroit for the “hiring, training, and deployment of street patrol officers; neighborhood and downtown economic development programs designed to create local jobs; public safety programs such as emergency medical services, fire department programs, and street lighting; anti-gang and youth development programs, other programs that are designed to contribute to the improvement of the quality of life in the City; relief to the taxpayers of the City from one or more taxes or fees imposed by the City; the costs of capital improvements; and road repairs and improvements.” (Michigan Gaming Control Board, www.michigan.gov.home)

67
In 1992, Missouri voters approved a referendum allowing riverboat gambling for the purpose of “produc[ing] increased General Revenue.” Riverboats must float in water within 1,000 feet of the river’s edge but not necessarily in river water. In fact, only two casinos currently float in river waters; the other 9 casinos in the State of Missouri float in pools. Each casino pays a $2 admission tax per patron which is split between the State and the home dock city. In addition, casinos pay the State 18% of AGR and 2% of AGR to the home dock city.
Responding to the fact that several Iowa riverboat operators had sailed south out of Iowa and into Missouri as a way of taking advantage of the latter State’s more favorable regulatory conditions, legislators clarified the “continuous docking provision” of the legislation and added language that required the Gaming Commission to “consider economic feasibility or impact that would benefit land based development and permanent job creation” as part of the decision making process. In St. Louis, however, where local officials believed that riverfront development was already adequate, locals opted to keep the issue of continuously docked boats separate from added infrastructure requirements. Thus, corresponding language was added to the Bill.
When riverboat Casinos first opened, however, they were not permitted to offer “games of chance”, i.e. slot machines. Instead, they could only offer “games of skill”. As a result, Missouri casinos lost business to their competitors in East St. Louis and Alton, Illinois. When Missouri casinos began offering games of chance in the first quarter of 1996, revenues doubled relative to the first quarter of 1995.
Monies collected from casinos are channeled into a number of programs. The $2 per person admission tax funds the Missouri Gaming Association at a cost of $16 million. Residual funds from the admission tax support $3 million in veterans programs, $3 million in National Guard scholarships $22-25 million in the Early
Gambling in Kansas City

68
Childhood Education Fund and $4.5 million to the Missouri College Guarantee Program.
The State’s 18% AGR tax supports the School Foundation Formula, a mathematical equation used to allocate state funds among the state's 524 public school districts. Local jurisdictions are not required by law to use funds in any particular way. Finally, Missouri riverboats reimburse the State for the full cost of the highway patrol officers assigned to the State’s gaming regulatory agency. The annual cost for the reimbursement is approximately $6 million.
According to the Arizona Indian Gaming Association (AIGA) Arizona is home to 16 Indian casinos. The Indian Gaming Regulatory Act (IGRA) requires both tribal ownership of casino operations and prescribes the uses of casino net income. Moreover, the IGRA prevents states from demanding that tribes remit revenues as part of compact negotiations beyond reimbursement of regulatory costs that the state incurs to regulate Indian gaming. Nevertheless, an analysis of the impact of Indian casinos in Arizona demonstrates that the effect of these casinos is both significant and positive. Most notably, Stephen Cornell and Jonathan Taylor of the University of Arizona have found the following:
In the spring of 2001, the total number of jobs directly related to gaming was 9,324.
Jobs in casinos are held by both Indians and non-Indians. In the spring of 2001, non-Indians held 57% of all casino and tribal regulatory jobs.
In 2000, Indian nations withheld more than $28 million in federal and state payroll taxes in Arizona.
Indian casinos in Arizona generated an additional $40 million in indirect state and local taxes collected on profits, purchases and incomes stemming from casino vendor expenditures and employment.
Indian Gaming in Arizona

69
Cornell and Taylor estimate a significant multiplier effect from Indian gaming as well. They posit that in 2000, a minimum of 14,784 in-state jobs were attributable to casino operations and, furthermore, that casino operations generated—directly and indirectly—at least $468 million in economic activity within the state of Arizona.
Indian gaming has had other impacts which, while significant, are more difficult to quantify. Other studies, including the National Opinion Research Center’s report to the National Gambling Impact Study Commission, have documented that many Indian gaming facilities nationwide employ large numbers of former recipients of public assistance. Indeed some tribal gaming establishments have been associated with reductions in the number of those on public assistance in counties where the Casinos are located. (NGISC, 71). Clearly such movement to the workforce reduces taxpayer burdens.
The economic impact of casinos in Arizona is significant, and measurable, but not necessarily targeted at specific economic development initiatives. We include it in our discussion, however, as evidence of the fact that even in the absence of standard tax revenues, communities where Indian casinos operate still reap notable benefits.
The Illinois Riverboat Gambling Act was enacted in February, 1990 and authorized the state Gaming Board to grant up to 10 casino licenses and to tax casinos on both wagers and admissions. In October, 1994, the Grand Victoria Riverboat Casino took its first cruise up and down the Fox River in Elgin, Illinois and helped initiate what many see as that city’s turnaround.
The initial legislation required that the Casino pay an admissions tax of $2.00 per person and a flat wagering tax of 20% on annual adjusted gross revenues (gross revenues minus the amount paid to winners, but before expenses.) In 1998, legislators authorized an increase in the admissions tax to $3.00 per person and a five-tiered wagering tax. In 2003, the admission tax was increased to $4.00 per person for those casinos that had admitted more than 2.3
Elgin, Illinois

70
million people in the previous calendar years. The most publicized, and controversial amendment in that year, however, stemmed from the following 7-tiered wagering tax structure related to adjusted gross revenues (AGR) in each of the state’s 9 casinos:
15% of AGR up to and including $25 million;
27.5% of AGR in excess of $25 million but not exceeding $37.5 million;
32.5% of AGR in excess of $37.5 million but not exceeding $50 million;
37.5% of AGR in excess of $50 million but not exceeding $75 million;
45% of AGR in excess of $75 million but not exceeding $100 million;
50% of AGR in excess of $100 million but not exceeding $250 million; and
70% of AGR in excess of $250 million.
The higher tax rate will remain in effect either for two years or once the 10th casino opens, whichever comes first. While nearly Byzantine in its complexity, this code of regulations has generated windfall revenues for much of the state, including Elgin.
In the years since its doors opened, the City of Elgin has collected $176 million in casino taxes while Kane County has collected $69 million since 1997 and the Grand Victoria Foundation, founded in 1996, funding social service agencies and assisting low-income residents throughout Illinois, has received more than $120 million in contributions from the Casino.
City leaders in Elgin made initial commitments to using casino money for capital revenue projects and contributions to special events and nonprofits. Officials wanted systems in place that would ensure that monies not be used for basic services because of the volatile nature of the revenue stream. As such, taxes have funded road replacements, a new fire station, and two parks along

71
with major projects including a $40 million Centre of Elgin family fitness center, a police station, golf course, expanded highway interchange and rehabilitation of dozens of older homes for neighborhood renewal. At the county level, casino revenues have funded farmland protection programs, construction of a stormwater management system and forest preservation.
The Grand Victoria Foundation has invested over $37 million of the funds it has received since 1996 and has contributed toward Elgin’s Community Crisis Center, the United Way and the Elgin Child and Family Resource Center. Nearly one-third of the Foundation’s money has stayed in Elgin; the remainder has gone to surrounding towns and throughout the state.
Gambling in Illinois appeals to day-trippers. The Gulf Coast, including Biloxi, Mississippi, is the site of destination gaming that is second only to Las Vegas in terms of visitations per year. Yet both Elgin, Illinois and Biloxi, Mississippi represent cities whose decline has been reversed through the injection of revenues from casino gambling. In 1992, Mississippi residents legalized casino gambling at dockside locations with 60% of citizens in favor of the measure. The State taxes gross gambling revenues according to a sliding scale; Harrison County and the city of Biloxi receive 4 to 8% and the tax is divided so that the county receives 72% while Biloxi receives 28% according to population demographics from the last census. Moreover, the city of Biloxi levies an additional 3.2% on gross gaming revenues which is distributed so that 60% goes to general funds (of this, 20% is designated for public safety) and 20% is designated for Biloxi Public Schools, 10% for Harrison County Public Safety and 10% for Harrison County Schools. In 1994, the Mississippi Gaming Commission began requiring that all casinos reinvest 25% of their value into land-based improvements.
Additionally, the Casinos pay property taxes. Real Property Taxes paid by Biloxi casinos in 2003 are as follows:
Biloxi, Mississippi

72
The money is significant. Casino funds account for 7% of Biloxi’s school district budget and 22% of the city’s operating budget. In 2000, Biloxi’s City Administrator declared that the Casinos had spared the city from financial disaster by enabling them to channel funds into “law enforcement and basic infrastructure, such as water, sewer and roads.” In many ways, Biloxi’s experience of casino gaming is comparable to that of Atlantic City’s. The cities depended initially on the infusion of revenues from casinos simply to stabilize and update neglected infrastructures.
In all of these models, Ontario, Arizona, Elgin and Biloxi, spending is done largely by the jurisdiction in question, with the exception of the Grand Victoria and Ontario Trillium Foundations, not-for-profits whose mission targets their expenditures. Apart from these foundations, however, casino revenues are either remitted directly to specified entities like public schools or divisions of public safety, or they are directed by elected officials into capital improvement projects, or they are funneled into environmental/infrastructure improvements.
Again, with the exception of the Grand Victoria and Ontario Trillium Foundations, monies are received and spent, directly or indirectly, by local leaders.
Because the Grand Victoria Casino is a commercial enterprise, it receives tax benefits from the funds it directs to the Grand Victoria Foundation. We found no precedents for Indian casinos establishing their own charitable foundations. Thus, given the dictates of the compact, we would expect that after offsetting direct costs incurred by the city as a result of the Casino, community leaders would work to build consensus for spending
Property Tax Payments: Biloxi Casinos (2003)
Beau Rivage $6,900,000Boomtown $153,000Casino Magic $875,000Grand Casino Biloxi $1,900,000Imperial Palace $1,900,000Isle of Capri $779,000Palace Casino $549,000President $323,000Treasure Bay $80,000
Spending
Governance
Implementing it in Niagara

73
that will have the greatest potential for long-term impact in Niagara Falls and in Niagara County.
For those casinos located in urban settings, there is little evidence that these operations destroy other sectors in the leisure industry. In fact, casinos in urban areas have lower revenues when consumers have access to a greater selection of other forms of leisure spending. Moreover, a recent study on the effect of Indian gaming on non-Indian communities by Taylor, Krepps, and Wang determined that in rural settings, Indian casinos in particular, rather than exercising a competitive effect on the local economy, instead have a destination effect. Their ability to attract consumers to a given region supersedes any competitive effect that may cause visitors to forgo spending in other leisure activities.*
Niagara Falls can plan proactively and learn from the experience of other localities. With forethought and planning, the City will profit from the strategic advantage to be gained from leveraging funds in the early years of the compact. Elgin’s intentional targeting of revenues to capital projects, community reinvestment and economic development stands as a model that we believe will better serve Niagara Falls’ interest than simply funneling revenues into subsidizing existing operating expenses.
After considering the different ways that localities have used gambling revenues, even those that are not directly taxed as is the case with Arizona, we move on to a summary of uses proposed for casino funds in Niagara Falls.
* For more on these factors, see “Evart, Candace, and Matthew B. Krepps, “Competition for the Gaming Dollar and the Urban Casino Puzzle” and Taylor, Jonathan, Matthew B. Krepps, and Patrick Wang, “The National Evidence on the Socioeconomic Impacts of American Indian Gaming on Non-Indian Communities,. Both discussed in “An Analysis of the Economic Impacts of Indian Gaming in the State of Arizona”, Stephen Cornell and Jonathan B. Taylor, June 2001.

74
Our research demonstrates that approaches to allocating revenues from ventures like casino gambling are as varied as the communities themselves. Clearly local needs vary and the purpose of promoting casino gambling also varies, leading to very different perspectives on the “right” approach to this controversial question.
Our analysis of a number of communities has still provided some guidance. Our research suggests the following principles:
The host community—in this case, the City of Niagara Falls—has a clear claim to a reliable share of the flow of funds generated by the presence of the Casino.
The expenditure of these funds is ideally targeted toward complementary investments, e.g. beautification, business and economic development and neighborhood revitalization.
Funds flowing to the local economy from the exclusivity payments are modest relative to the list of possible uses. To have the greatest impact, a careful process of analysis should be put in place, ensuring that scarce dollars are used productively.
Casino impacts, both positive and negative, flow well beyond the borders of the host community. The burden of problem gambling, for example, will be felt by the community in which the problem gambler resides, not the Casino host community. Similarly, the benefits of economic resurgence spill over into the larger region. Niagara Falls, NY is unique among the communities we studied as it is a gateway for international tourism. Citizens at the statewide and regional levels are appropriately interested in the economic vitality of the City.
AN APPROACH TO INVESTING CASINO PROCEEDS IN
FUTURE OF NIAGARA FALLS
Allocating the Local Share of Exclusivity Payments
Criteria to Apply to Payments

75
The 2002 compact between New York State and the Seneca Nation of Indians requires that revenues shared with the locality
“be available for purposes including but not limited to…reimbursements or payments to municipal governments…for costs incurred in connection with services provided to such casinos or arising as a result thereof (or) for economic development opportunities and job expansion programs authorized by executive law…”
Again, there is no objectively correct allocation of the exclusivity payments. We recommend the following model:
The City of Niagara Falls should have exclusive control over a fixed portion of fee revenue, recognizing the inevitable costs imposed on the City by the presence of the Casino. We estimate that the current or formerly taxable properties within the acres becoming trust lands (but excluding the former Convention Center in which the Casino is located) would have generated about one-half of a million dollars in property tax revenue to the City were it fully taxable and were the owners of these properties current with their tax obligations. We suggest that a portion of the exclusivity fee to be regarded as a “payment in lieu of taxes” to be spent at the City’s sole discretion. Further, recognizing that economic activity stimulated by the Casino has driven up costs to the City, we propose that this sum be doubled. The one million dollars would increase annually at the rate of general price inflation.
The remaining funds should be dedicated to stimulating the economic development of the Niagara Falls economy and addressing demonstrable negative impacts of casino gambling on the community, beyond the fiscal impacts imposed upon the City of Niagara Falls (see the discussion of social impacts below).
Consideration should be given to certain projects for multi-year bonding. To make it possible for recipients to bond against these multi-year allocations, these allocations could be guaranteed by the State of New York for the life of the Compact. Given the pending increase in the exclusivity fee, such a guarantee would pose a minimal risk to the State’s taxpayers.
The Compact &Process of Fund Allocation
76
An economic impact assessment tool should be created for those who might apply for funding. Included in the assessment must be an evaluation procedure to help determine whether the impacts forecast in the assessment were achieved. This assessment shall be advisory only but will be part of the public record.
The assessment form will be prepared by the applicant but reviewed by professional staff or an outside evaluator.
Our analysis suggests that the City has entered a new era in which its primary “draw” (in terms of revenue potential) is now the Casino and not the Falls. The Niagara Falls economy in general and the City of Niagara Falls in particular stand to benefit from the revenue stream specified in the Compact. Increased revenues at the Casino mean increased monies for the municipality. From a gaming-related perspective, the city may wish to focus on improvements to the streetscape, to the condition of roads, to the appearance of areas surrounding the Casino and, eventually, to linkages between the Casino and the Falls.
We suggest considering the following criteria for investments of the local share of exclusivity payments:
Consideration should be given to uses that assure that the Casino’s existing customer base is satisfied with their experience. This includes facilitating usage with easy and convenient ingress/egress, free convenient parking between the Casino and the downtown attractions, elimination of any “eye-sores”, highly visible police presence, and well-lit streets, malls, parks, and sidewalks.
The community should cooperate with the Casino in its need to attract a larger segment of the “adjunctive” demand segment by encouraging development of non-competitive amenities. The Casino now/soon will contain a full array of bar & restaurant choices; however additional activities are needed, especially designed for daytime and weekday visitors. These could include a more cohesive development plan for boutique-style shopping areas with street vendors & performers, museums and tourist attractions that are easily accessed from the Casino. Key to this aspect is to provide some form of “weather-friendly’ transportation system that links the Casino with the downtown
Investment Criteria: Support Casino Expansion
Investment Criteria: Ensuing Proposed Uses

77
district and the Falls. As we have mentioned above, new project development aimed at increasing attendance at Seneca Niagara is likely to have greater impact on local governmental income than attempting to leverage the visitation base by encouraging patronage to the local businesses. The priority could be first to promote development opportunities that enhance casino visitation to the point of market saturation, and then to develop projects designed to further leverage those visitors.
Projects that leverage Casino visitors should be given positive consideration. For example, introducing a Bingo operation is one such strategy, as would be the development of additional and upgraded overnight accommodations. With Casino visitation peaking on the weekends, the City should encourage the promotion of special events during these time periods that include: street fairs, flea markets, food & wine tasting, free concerts, sports competitions, and so on. Part and parcel of this endeavor could be the development of an Activity Park that features both indoor and outdoor elements that include an ice skating rink (a la Rockefeller Center/Central Park) that also conducts ice shows, hockey and curling exhibitions.

78
Relatively recent research has confirmed the significance of the social impacts of casino gambling. Given these findings, programs addressing these issues should be eligible for funding from exclusivity payment pool.
A study commissioned by NGISC, the National Opinion Research Center (NORC) of the University of Chicago (along with the Lewin Group and Gemini Research) conducted a statistical analysis of 100 communities with and without casinos over the period 1980-1997. On average across the communities and this extended time frame, the presence of a casino increased net employment and reduced economic dependency. *
Five communities were within 50 miles of a casino at the beginning of the study period; a casino opened nearby during the study period in an additional 40 communities. The study communities had a combined population of 42 million persons, 46% of which were in the 45 communities in close proximity to a casino in 1997. The study examines selected economic and social indicators in communities within and without casino proximity and the set of casino-proximate communities before and after the Casino began operation.
The statistical procedure was designed to determine whether differences among communities across set of social and economic indicators could be explained by the existence of the Casino†. The researchers conducted their analysis in two stages. Initially, they
* Gerstein, D., Murphy, S., Toce, M., Hoffmann, J., Palmer, A., Johnson, R., Larison, C., Chuchro, L., Bard, A., Engelman, L., Hill, M. A., Buie, T., Volberg, R., Harwood, H., Tucker, A., Christiansen, E., Cummings, W., & Sinclair, S. (1999). Gambling Impact and Behavior Study: Report to the National Gambling Impact Study Commission. Chicago: National Opinion Research Center.
† Outcome measures included three indicators of bankruptcy, seven crime indicators, five employment indicators, one health indicator and a number of income and earnings indicators.
SOCIAL IMPACTS OF CASINO GAMBLING
Analysis of 100 Communities With and Without Casino Gaming

79
tested for a simple association between the presence of a casino and the outcomes measured in the study, finding that casinos and negative social and economic outcomes were indeed statistically associated. The NORC/Lewin/Gemini researchers acknowledged, however, that a simple association did not sufficiently control for general social trends over time. The second statistical test applied a procedure to control for changes over time that were common to communities with and without casinos (e.g. broad trends in the crime rate or bankruptcy filings).
They discovered that many of the differences between communities that had been attributed to the presence of the Casinos were instead explained by the different years in which the Casinos had opened. After adjusting for general social trends, a statistically significant association was present between communities with and without casinos for the following outcome measures:
Employment
The unemployment rate was 12% lower in communities with casinos.
The share of employment in local government and retail trade declined 2% and 3%, respectively, in communities with casinos.
The share of employment in construction was 1% higher in casino communities.
Income and earnings
Income maintenance (public assistance), unemployment insurance and transfer payments fell 13%, 3% and 17%, respectively, in casino communities (on a per capita basis).
Private earnings in construction, hotels and lodging, and recreation and amusement rose 18%, 43% and 22%, respectively, in casino communities.
Private earnings in restaurants and bars fell 19% in casino communities.
As the authors emphasize, that there was no statistically significant association between the proximity of a casino and the remaining

80
indicators does not mean that the relationship does not exist, but that the change is not large enough to be distinguishable from changes in other measures or that negative effects have been mitigated by policy or program changes put in place at the time the Casino opened. Other possible impacts were either unmeasurable for these communities or simply excluded by the decision of the researchers.
In the public mind, gaming has long been associated with a host of social ills including organized crime, prostitution, substance abuse, family dissolution, bankruptcy and others. The truth or falsity of these historic associations aside, the relevant question is whether casinos typically and inevitably bring with them other problems. Even if these problems prove to be modest, any costs associated with social impacts should be weighed against estimated benefits.
Many studies have explored whether social dysfunction has been caused by casinos or if the decision to welcome casino gaming was prompted by weak economic conditions and pre-existing strain on a community’s social fabric. Unfortunately, discerning causation is more difficult than measuring simple association. In 1998, the National Academy of Science, in its study of pathological gambling conducted at the behest of NGISC, stated “Overall…much of the available research on all aspects of pathological gambling is of limited scientific value.”* (p. 7)
Much of the research solicited by the Commission and performed subsequent to 1998 has attempted to address this deficiency. As the gaming industry has matured and expanded, the diversity and longevity of casino gambling has provided researchers with more robust data. For the purposes of the present analysis, other components of the previously-cited NORC/Lewin/Gemini study
*Committee on the Social and Economic Impact of Pathological Gambling, Committee on Law and Justice, Commission on Behavioral and Social Sciences and Education, National Research Council. Pathological Gambling: A Critical Review. National Academy Press, Washington, D.C. 1999
Association Between Problem Gambling & Casino Proximity

81
are probably the most important*. This study identified a consistent and statistically valid association between the rates of problem and pathological gambling and the proximity of casino gambling.
Although the NORC/Lewin/Gemini study found a statistically valid association between proximity to a casino and the prevalence of problem and pathological gambling among individuals, the actual percentage of cases remains very small. In fact, NORC/Lewin/Gemini was unable to detect a statistically significant association between the presence of a casino and community-wide indicators of social dysfunction, e.g. divorce rates, health impacts, and others. Thus while these problems are real and costly for individuals, the number of problem and pathological gamblers is not large enough to be detectable at a community level of aggregation.
The NORC/Lewin/Gemini study of the social impacts on individual gamblers was based on the combination of a random telephone questionnaire and an in-person enumeration of casino patrons. The study estimated the prevalence of problem and pathological gambling based on proximity to a casino. According to the NORC/Lewin/Gemini report, approximately 2.5% of the U.S. population is classified as pathological gamblers or problem gamblers (i.e. people who gamble excessively, but whose behavior does not meet the definition of a mental illness.) Living within 50 miles of a casino increases the lifetime prevalence of problem gambling from 1.2% of the population to 2.3% and of pathological gambling from 0.9% to 2.1% (NORC, p.27). For the Buffalo-Niagara Falls Metropolitan Statistical Area, this implies perhaps about 26,000 problem gamblers and 25,000 pathological gamblers, although the prior existence of Casino Niagara would
* Gerstein, D., Murphy, S., Toce, M., Hoffmann, J., Palmer, A., Johnson, R., Larison, C., Chuchro, L., Bard, A., Engelman, L., Hill, M. A., Buie, T., Volberg, R., Harwood, H., Tucker, A., Christiansen, E., Cummings, W., & Sinclair, S. (1999). Gambling Impact and Behavior Study: Report to the National Gambling Impact Study Commission. Chicago: National Opinion Research Center.

82
suggest that the Seneca Niagara Casino would not be directly responsible for these totals.. In addition, the same proximity to a casino is associated with a 40% rate of past year gaming among adults compared to a 23% rate of gaming among those living farther from the Casino. (NORC, p. ix).
The same study estimated annual and lifetime costs associated with problem and pathological gambling. Society can expect annual costs of $715 per problem gambler and almost $1,200 per pathological gambler (NORC, p.52). The researchers estimate the total cost of other events found more likely to occur within the lifetime of the problem gambler, a sum totaling just over $5,000 for the problem gambler and twice this amount for the pathological gambler. The researchers acknowledge that other costs are real but nonmonetary:
[M]any of the human burdens of pathological and problem gambling are not so readily quantifiable into dollars, for conceptual and practical reasons. For example, we calculated the cost of divorce in terms of the legal fees generated to complete divorce actions through the court system. The cost in legal fees hardly begins to capture all of the social and psychological meaning of divorce for the partners and families directly involved, and for society as a whole. The economic costs that we calculated are a lower bound. Without a substantially greater research base on the characteristics and consequences of pathological and problem gambling, it is impossible to say with precision where the upper bound or midpoint of economic impact would lie. (NORC, p.54-55).
More recently, the June 2004 issue of Psychology of Addictive Behaviors published a study that modeled addictive gambling much like contact with toxic substances in terms of dose, potency and exposure. The index they constructed showed that higher contact (in terms of the number of gambling establishments, types of legal gambling available and the length of time gambling has been

83
available) is associated with higher rates of problem and pathological gambling*. A study conducted at Creighton University and also published in June 2004 identified a statistically significant association between an increase in personal bankruptcies and the existence of a casino.†
Similarly, the Creighton study observed that while personal bankruptcy rates doubled in counties with casinos, business bankruptcies actually fell by more than one third. Apparently casinos have an ambiguous impact on the economic landscape.
Problem gambling has been associated with a number of serious health effects. For example, problem gamblers are at greater risk for such mental health conditions as major depression, anti-social personality disorder and phobias. They are also more likely to abuse alcohol, nicotine, and other drugs. Pathological gamblers report ever having experienced a “depressive episode” at a rate of nearly 20 times that of their non-gaming counterparts (NORC, p.30). While gamblers are not any more likely than the general population to commit suicide, they face other physical health risks, including a greater risk for cardiac arrest due to higher levels of stress and high blood pressure.
Problem gamblers were more likely to report financial and relationship problems. In addition, problem gamblers suffered higher levels of alcohol dependence, stress, emotional distress, past depression and suicide contemplation compared with non-gamblers and low-risk gamblers.
* Shaffer, H. J., LaBrie, R. A., & LaPlante, D. (2004). Laying the foundation for quantifying regional exposure to social phenomena: considering the case of legalized gambling as a public health toxin. Psychology of Addictive Behaviors, 18(1), 40-48.
† Goss, E.; Morse, E. (2004). The Impact of Casino Gambling on Bankruptcy Rates: A County Level Analysis, Creighton University.
Consequences of Problem Gambling
Physical and Mental Health

84
Problem and pathological gambling can have a negative effect on family and social relationships. Fifty-four percent of identified pathological gamblers report having been divorced compared with 18 percent of non-gamblers. Divorce has financial consequences for mothers and their children; by one estimate, women with minor children experience a 73% decline in their standard of living the first year after divorce (NORC, p.49). Other studies have found that children from divorced households have lower academic and occupational achievement. Such costs last a lifetime and yet no study has been able to quantify the expense relative to the divorce rate of gamblers. Children of problem gamblers report higher rates of certain negative behaviors*. These children were more likely than children of non-problem gamblers to report using tobacco, alcohol and other drugs, except marijuana. Children of problem gamblers are more likely to gamble than are children of non-problem gamblers. Problem and pathological gamblers are more likely than their non-gaming counterparts to have declared bankruptcy. (NORC, p.58)
The General Accounting Office (GAO) conducted a study of gambling outcomes in Atlantic City, New Jersey.† Although Atlantic City, as a well-established destination gaming venue, is not comparable to the Seneca Niagara facility in many ways, the GAO report places in perspective many statistics that have been cited from Atlantic City and are presumed to apply to other gaming venues.
Although the GAO reports that incidents of domestic violence in Atlantic County (home to Atlantic City) have generally been higher than those for the rest of New Jersey, although data reporting
* Jacobs, D.F., Marston, A.R, Singer, R.D., Widaman, K., Little, T., &Veizades, J. (1989). “Children of Problem Gamblers”, Journal of Gaming Behavior, 5, 261-267. as cited in The Wager 1(16), “Elevated Substance Use & Gaming Among Children of Problem Gamblers”, www.thewager.org accessed on February 10, 2004.
† Ungar, Bernard & John Baldwin, Impact of Gambling: Economic Effects More Measurable Than Social Effects. United States General Accounting Office, April 2000.
Impact on Families
85
incidents of domestic violence from pre-casino years (prior to 1978) are not available (GAO, p.28), making causation difficult to determine. Statistics that are available on domestic violence, child abuse, divorce and the frequency of single-parent households followed no consistent pattern after the introduction of casino gaming in Atlantic City. In some years, rates rose; in others, they fell. Reports of child abuse or neglect related to casino gaming are often linked to cases of children who have been left alone in cars while parents or guardians gamble. The GAO was unable to report on specific, substantiated cases of child abuse in Atlantic City because national reporting of child abuse commenced in 1990, is done on a voluntary basis, and data on Atlantic City was not “readily available” (GAO, p.30) Nevertheless, while reports of substantiated child abuse or neglect in Atlantic County reached a high of 47 in 1987, over the 14 years from 1982 to 1996, they went from 19 in 1982 to 18 in 1996. (GAO, p.30)
As Atlantic City is a destination-style gaming locality, the majority of gamblers live outside the area. Thus, the locality in question reaps most of the economic benefits while most of the social costs are exported to the home communities of the gamblers. Moreover, because of its status as a destination for gamblers, crime rates should account for the numerous daily visitors to the locality who are themselves potential victims or perpetrators of crime. The GAO analyzed data from the FBI’s Uniform Crime Report (UCR) and calculated changes in total crime rates based both on adjusted and unadjusted population since casinos began operating in Atlantic City. According to both measures, total crime rate increased initially once casinos opened for business. While the overall incidence of crime increased, there were also increases in the size of the police force, the average daily population and the national crime rate.
According to the GAO, Atlantic City and Atlantic County officials report that casinos had a significant impact on prostitution, which, by one report, is now decreasing. FBI UCR prostitution data over
Crime
Calculating Crime Rates
Prostitution

86
the 20 years from 1977 to 1997 demonstrates that the arrest rate for prostitution-related crimes for the unadjusted population increased in certain years during these two decades and continued to remain higher than rates for both New Jersey and the nation. Calculating the prostitution arrest rate for the adjusted population for Atlantic City, however, reveals that the rate more closely resembles state and national levels during the same twenty year time period (GAO, p.39-40).
Calculated with unadjusted population data, Atlantic City’s drug arrests per 10,000 increased overall and, when compared to state and national rates, was approximately five times greater in some years from 1980 to 1997. Yet using adjusted population data brings the drug arrest rate closer in line with state and national levels and, in some years, lower than the rates elsewhere. The GAO maintains that determining the drug arrest rate based on the adjusted population (and thus including visitors to casinos) is the more appropriate means of calculation (GAO, p.41).
The New Jersey Attorney General’s office states that they have had “no major scandal or organized crime influence in the Casino industry.” They credit their success in this regard to stringent controls and regulations used by the state to control the Casino industry and maintain that theirs is the best casino gaming regulatory system in the nation. (GAO, p.41)
A simplistic application of the NORC/Lewin/Gemini findings to Niagara Falls would suggest a doubling of problem and pathological gambling incidence as a consequence of establishing the new casino within the 50 mile perimeter identified in the study. We believes that such a direct application to Niagara Falls would be inappropriate for the following reasons:
Both Casino Niagara and Fallsview are far closer to Seneca Niagara than the 50 mile boundary. The data presented in the study are not precise enough to allow finer distinctions.
Drug Arrests
Organized Crime
Applying Findings to Niagara Falls

87
The NORC/Lewin/Gemini researchers did not adjust for the presence of a state lottery, another opportunity for potential problem or pathological gamblers to get into trouble.
Because of these concerns and because of the fact that casino patrons who live in Niagara Falls have already had access to gaming facilities in Niagara Falls, Ontario, we estimate that any increased costs will be born not by the City of Niagara falls, but either by Niagara County or by other Western New York counties including Erie and Monroe counties.
A 1996 gambling prevalence study commissioned by the New York Council on Problem Gambling looked at the increase in gambling behaviors in New York State during the time from 1986-1996 (Report to the New York Council on Problem Gambling, Gambling and Problem Gambling in New York: A Ten-Year Replication Study, 1986-1996.) The study found a tripling in the prevalence rate of problem and pathological gambling during that ten year period. Moreover, in 1996, the lifetime prevalence rate for problem and pathological gambling in New York State was higher than in any other state, and the current prevalence rate (in 1996) was higher than any other state with the exception of Louisiana.
As the research indicates, it is early to expect a significant change in social measures of impact. There are, however, two sources of information to draw upon, both of which confirm the findings of national studies, that proximity of casino gambling has the effect of increasing the prevalence of problem gambling.
CGR contacted both the Niagara County Sheriff’s Department and the Niagara County Department of Social Services. Neither indicated that they had evidence of an increase in social dysfunction as a result of the opening of the Seneca Niagara Casino, although our contact in the Sheriff’s Department believes that some increase in white collar crime coincided with the establishment of casino gambling across the river in Ontario.
Data From New York

88
Renee Wert, Ph.D., Director of the Gambling Recovery Program at the Jewish Family Service in Buffalo, NY, reports that her agency has seen an increase in calls from troubled gamblers looking for counseling services since 2001. While total numbers remain small, the increase is substantial: The average number of calls after the opening of Seneca Niagara is 2/3 higher than it was for the preceding two years.
Dr. Wert notes that during the 1990s, her agency saw gamblers who reported problems with a variety of gambling behavior, including lottery, sports, horse racing and bingo. Now her agency finds that approximately 70-75% of clients they serve report problems only with casinos (namely, slot machines) or with the lottery. The agency has also seen a shift in the demographic it has served. In the past, clients were predominantly white,
middle-aged, middle-class males. She reports that problem gambling is spread across the demographic spectrum.
Additionally, the agency finds that clients are reporting both higher total gambling losses and higher losses per gaming occasion.
The New York Council on Problem Gambling tracks calls to its 24 hour Helpline. The Council reports that Helpline calls in the Erie and Niagara counties (the Buffalo-Niagara Falls metropolitan area) more than doubled from 2002 to 2003 (from 94 to 198). Moreover, the number of crisis calls to the Helpline increased from 14 to 28. Call volumes continued to increase in 2004.
In 2004, the number of problem gambling calls as a share of population—both total calls and crisis calls—was higher in the Buffalo-Niagara Falls MSA than in any other metro in NYS. Total calls were 35% higher than the rest of the state; crisis calls were 56% higher. Total calls to the Hotline from the Buffalo-Niagara Falls region rose to 240 in 2004. Of these, 36 were classified as “crisis” calls by the Council.
Gambling Recovery Program: Jewish Family Service in Buffalo
Number of Gamblers Seeking Counseling Services, 2001-2004 2001 158 2002 175 2003 268 2004 286 Source: Gambling Recovery Program, Jewish Family Service
New York Council on Problem Gambling

89
Trends in calls to the Helpline would appear to show the impact of the Seneca Niagara Casino. Fastest growing sources of calls to the Helpline were the Buffalo-Niagara Falls and Rochester MSAs. As a share of population, total calls increased 186% and 73%, respectively. The crisis call rate doubled in Rochester and quadrupled in Buffalo-Niagara Falls.
These figures are, admittedly, difficult to interpret. The proximity of Syracuse and Utica-Rome to Turning Stone does not seem to have had the same impact. It is possible that it is the combined access resulting from Seneca Niagara, Casino Niagara and Fort Erie Raceway. Nonetheless, it is difficult to conclude that the 2003 opening of Seneca Niagara is not in some way related.
While measuring the cost of problem gambling to a community is still difficult, these statistics suggest that the presence of the Casino has increased the incidence of problem gambling in communities closest to Seneca Niagara.
2004 Crisis Calls to Problem Gambling Helpline
(per 100,000 population)
- 1.0 2.0 3.0 4.0
BUFFALO-NF
Syracuse
New York State
Rochester
New York City
Utica-Rome
2004 Total Calls to Problem Gambling Helpline
(per 100,000 population)
- 5.0 10.0 15.0 20.0 25.0
BUFFALO-NF
Syracuse
New York State
Rochester
New York City
Utica-Rome
Total Calls to Problem Gambling Helpline (per 100,000 population)
-
5.0
10.0
15.0
20.0
25.0
2001 2002 2003 2004
Utica-Rome New York City SyracuseRochester BUFFALO-NF
Crisis Calls to Problem Gambling Helpline (per 100,000 population)
-
0.5
1.0
1.5
2.0
2.5
3.0
3.5
2001 2002 2003 2004
Utica-Rome New York City SyracuseRochester BUFFALO-NF

90
We applaud the decision of USA Niagara Development Corporation to conduct this study. The Casino has already become an important part of the Niagara Falls economy with community impacts that are broad and varied, as described above. It is important to recognize, however, that the Casino has only been operating since 2003. Complete information on 2004 impacts is still fragmentary, forcing the analysis to rely on two years of data for some aspects of the study and even less information for others. It is impossible to draw firm conclusions about the long term impacts of such a significant development on so little information.
It also takes time for a major new tourism asset to become integrated into the economy. Our study indicates that the off-site impacts of the Casino remain small. Representatives of specific attractions indicate an interest in improving ties with the Casino and increasing the prevalence of joint visitation. We would also expect that the large number of Casino visitors would encourage the development of business ventures designed to meet the needs of Niagara Falls’ new visitors. Ties between the Casino and the Niagara Falls economy will strengthen over time.
In addition, there are a number of changes occurring that will alter the relationship between the casino and Niagara Falls, NY. Most significantly, the Seneca Gaming Corporation’s new facility in Erie County will divert a portion of the trade from Seneca Niagara Casino. Conversely, the new hotel and expanded gaming areas will increase the appeal of the Niagara Falls facility. It will take time to learn how these changes will influence the Casino and, therefore, its relationship to the community.
Anticipating a future study—perhaps a five year retrospective in 2009—we recommend that its foundation be built on careful data collection during ensuing years. We have already recommended changes to the survey of Niagara Falls tourists. This becomes
OPPORTUNITIES FOR FUTURE STUDY

91
even more important as new businesses are founded to take advantage of Casino visitation. A collaborative data collection process involving the Casino, the City of Niagara Falls, USA Niagara Development Corporation and the Niagara Tourism and Convention Corporation could help all entities better serve current and prospective visitors to the community. The well-being of Niagara Falls residents will be enhanced if both the number of visitors and the average length of stay increase.
92
The following case studies provide examples of how governments across the country have spent windfall revenues on economic development initiatives and include revenue allocation models for casino revenue, sales tax and the 1999 Master Tobacco Settlement.
There does not appear to be one single way funds are spent that is common to all municipalities and states. In terms of services, the most common use of casino revenues involves direct payment for police and fire services. Municipalities also use revenues for their general funds, one-time capital costs and economic or community redevelopment funds.
Further, the sample models reviewed in this document are not necessarily representative, since the cases were pre-selected because of their emphasis on economic development spending.
The Schenectady (New York) Metroplex Development Authority is perhaps the leading example of a regional economic development entity funded through recurring windfall revenues. Created by state legislation in 1998, it is funded primarily through a dedicated share of the county sales tax. One-half of one percent of the sales tax is allocated exclusively to economic development, and 70 percent of that total is placed in the hands of Metroplex.
Metroplex’s service district originally covered roughly 24 square miles of Schenectady County, centered on downtown. Since the program’s inception, several neighboring communities have opted to join, effectively expanding the Authority’s jurisdiction to more than 80 square miles.
APPENDIX
MODELS OF TARGETED ECONOMIC DEVELOPMENT
SPENDING
Model 1: Metroplex
93
Metroplex’s self-defined mission is “to enhance the long-term economic vitality and quality of life in Schenectady County by cooperative, purposeful actions and investments within its corridor, with a particular emphasis on downtown.” Alongside its spending capabilities, New York state law also granted Metroplex authority to design, plan, site, construct, administer, operate, manage and maintain facilities within its now-84 square mile service district.
While itself a major player in the region’s economic development, Metroplex regularly teams with other development entities in Schenectady County to initiate and fund major development projects. Metroplex boasts a series of recent successes, including the launching of a downtown master plan, expansion of the Downtown Schenectady Improvement Corporation, construction of a $34 million downtown headquarters by one of the region’s leading health care companies and infrastructure extensions necessary for development of a $13 million technology headquarters in the region.
The enabling legislation that created Metroplex identifies its major areas of focus as trade exhibition facilities, public show facilities, public entertainment facilities, parks, hotels, transportation and parking facilities, historic preservation, tourism facilities, sporting event facilities, educational facilities, infrastructure, industrial or manufacturing facilities, and business/commercial/retail office space.
The 1998 state legislation enabling Metroplex called for the imposition of an additional 0.5 percent sales and compensating use tax for a thirty-year period (through 2028). Those funds are required to be deposited in the Authority’s support fund, with 70 percent of those funds transferred to Metroplex’s general operating budget. The remainder goes to the Schenectady County Real Property Tax Abatement and Economic Development Fund for supplemental countywide economic development initiatives (primarily, to reduce city, town and village real property taxes). Metroplex is also able to receive private donations.
Spending

94
In its first four years, Metroplex’s budget from sales tax receipts was roughly $6.5 million per year. Project distributions have risen substantially each year, to a total of $12 million in 2002. Since its inception, Metroplex has been financially involved in fifteen “economic development” projects – renovations, expansions, relocations and job creation – ranging from $125,000 to $11.7 million in financial commitment. It has also funded ten “community-building” projects – infrastructure improvements, neighborhood revitalization and streetscape planning – ranging from $180,000 to $4 million. Finally, Metroplex has also contributed to three “capacity-building” initiatives totaling $650,000, including a downtown improvement district; a local development corporation loan fund; and development of the county’s on-line planning database.
Three criteria guide the selection of projects for Metroplex involvement and awarding of grant monies: expanding the county’s property tax base; expanding its sales tax base; and creating and/or retaining jobs in the greater Schenectady region. Projects are selected through its Board of Directors as well as public input, since Metroplex is subject to the Open Meetings Law.
Metroplex is governed by an eleven-member board, and maintains a staff of 5 – including an executive director, finance director and director of project administration. The enabling state legislation directed that the board be unpaid, and selected by a majority of the county legislature from nominations submitted by city and town officers (for 4-year terms) and the county legislature (for 5-year terms). The county legislature designates one member as chairman, and the chairman in turn appoints the executive director.
If a portion of Niagara’s casino revenue were allocated strictly to economic development, the Metroplex model is arguably the most directly applicable. First, its regional geographic focus reflects what a countywide entity would administer in Niagara.
Governance
Implementing it in Niagara
95
Second, its annual financial distribution capabilities are not an unrealistic comparable to revenue sharing estimates that have already been projected for Niagara.
Third, Metroplex retains several characteristics that the Niagara Chamber has indicated a keen interest in exploring – a non-governmental authority responsible for fund allocation; a dedicated focus on economic development initiatives; and the flexibility to assist infrastructure and neighborhood improvement projects that help build community capacity and enhance the area’s economic climate.
Another factor of note is that Metroplex is a creature of New York State law. Within the same statutory context, Niagara could likely establish a similar model, though the issue of dedicating a portion of the Casino-generated revenue to a Niagara Metroplex would likely still have to be resolved at the local level.
Virginia’s Tobacco Region Opportunity Fund, initiated in 2001 under the state’s Tobacco Indemnification and Community Revitalization Commission, provides grants and loans to local areas in Virginia’s tobacco-producing regions for the purposes of industrial diversification and economic growth. Under the Master Settlement Agreement, Virginia was awarded a 25-year endowment totaling $4.1 billion. Half of those funds were dedicated for tobacco farmers and communities that depended on tobacco crops, given the reliance of the state’s economy on tobacco cultivation. Within that portion of the revenues, the state has developed a regional opportunity fund to encourage new investment and job creation through business attraction and expansion. Recognizing its dependence on tobacco-related industries, Virginia has dedicated a significant share of the windfall to accelerating growth in other industries. The Tobacco Region Opportunity Fund is at the core of that effort.
The Commission is responsible for determining how monies in the Regional Opportunity Fund are distributed, and authorizes all grants and loans through a competitive application process. Its
Model 2: Tobacco Region Opportunity Fund
Spending

96
enabling legislation lists as a criterion for funding the promotion of “economic growth and development in tobacco dependent communities in an equitable manner, throughout the southside and southwest regions of the (state), in order to assist such communities in reducing their dependency on tobacco and tobacco-related business.”
Grants and loans are for use at the discretion of the Commission to attract locations or expansions that require incentives greater than those available to any individual locality. According to the Fund’s own description, these incentives “are targeted for larger competitive projects with a regional impact due to the magnitude of the new employment and investment, and the possibility of economic spin-off and related economic multiplier effect. (Fund) monies are granted or loaned only with reference to a specific project, which will diversify the economy and attract or encourage immediate growth in the affected communities.”
Projects are eligible for Opportunity Fund grants if they include private capital investment of at least $1 million and create at least 25 jobs. Given the Commission’s interest in diversifying economies across the state, single communities are not eligible for more than 2 grant awards in any one year.
In its first two years, the Fund has awarded approximately $5 million to eligible job creation programs, through 25 grants. The Fund reports its assistance has resulted in the creation of 4,500 jobs and leveraged more than $250 million in additional private investment in its target regions of the state.
The Commission considers Opportunity Fund requests for utility extension, transportation access, site acquisition, construction preparation costs, and grants to local Industrial Development Authorities, among other initiatives.
The Opportunity Fund resides under the authority of the Tobacco Indemnification and Community Revitalization Commission, a 31-member body established by the state legislature in 1999 to
Governance
97
oversee programs compensating communities for the decline in tobacco production. To that end, one of its major emphases has become promoting economic growth in non-tobacco industries. Diversification of the economic base in those communities has come to rely heavily on the Opportunity Fund.
The commission’s membership includes 6 appointees of the state’s Speaker of the House; 4 state senatorial appointees; representatives from the state’s commerce, finance and agriculture departments; private sector leaders; and executive appointees. Under the auspices of the state commission, the Opportunity Fund is administered by 3 commissioners and an executive director.
Though a state-level model, aspects of Virginia’s Regional Opportunity Fund lend themselves well to consideration for Niagara primarily on the basis of the program’s objective: to diversify the economic base while encouraging job creation.
The downturn in the nation’s tobacco industry was undoubtedly going to have significant negative consequences for the economies of southern Virginia. As a result, industrial diversification coupled with the leveraging of private investment (objectives certainly shared by Niagara’s business community) were paramount reasons for the Fund’s creation.
By placing job growth and private investment requirements on grant awards, the Opportunity Fund ensures that its awards will have an immediate economic impact in its target regions. It also ensures that grants are awarded to “shovel ready” initiatives where public stimulus dollars are going to generate the greatest (and most rapid) “bang for the buck.” A similar Niagara fund would be advised to establish job/investment requirements in the same way, though more in line with investment and job expectations in Niagara County (e.g. $50,000 to $100,000 in investment and 15-25 new positions).
Implementing it in Niagara

98
Another aspect of the Virginia model that lends itself to a regional analog is its geographic focus. Unlike the Michigan model presented later in this report, Virginia’s is tailored to the economic investment needs of its southern region in particular. Though larger than Niagara County, the geographic limitation on the Opportunity Fund’s target area is closer to the perspective a Niagara region fund would most likely have. Unlike the traditional state economic development program, Virginia’s is more regionally-based, making it fairly comparable to how the model could likely be established in Niagara.
The 1999 tobacco settlement created a significant windfall revenue opportunity for the State of Michigan. Thirty-one percent of its $8.5 billion in tobacco settlement revenues are directed into a “research and education” fund. A significant component of that fund is the Michigan Life Sciences Corridor (MLSC), a $1 billion initiative with a 20-year endowment to stimulate economic growth through biomedical discovery and commercialization of research in the coming decades. Michigan was one of the first states to allocate a share of its windfall settlement to energize its life sciences industry for the twofold benefit of investing in citizens’ health and the growth of life sciences employment statewide.
Michigan is among the states that have found that the settlement agreement’s provision that funds be spent on health issues could be beneficial not only for their health futures, but also economic growth. With annual spending authority of over $50 million, the MLSC has already begun to leverage growth in the state’s health-related industries. Its 2001 annual report points to nearly two-dozen life sciences startups, roughly $3 billion in aggregate investment and creation of more than 2,000 life sciences jobs.
The Life Sciences Corridor awards grants in five basic categories: basic and applied research, development grants, development ventures and commercial services. The competitive application process for grants operates with the primary goals of advancing biomedical discovery and developing a comprehensive network for commercializing research done in Michigan in the areas of
Model 3: Michigan Life Sciences Corridor
Spending

99
genomics, structural biology and bioinformatics, among other specialties.
As of 2002, the MLSC has invested nearly $150 million through nearly 80 grants, with an emphasis on disease and diagnosing technologies.
Much of the investment revolves around the state’s higher education network and institutions at the heart of its burgeoning life sciences industry. Stimulating university investment in R&D alongside private sector and venture investment in life sciences has been the driving force behind the MLSC’s early success.
Ten percent of the Corridor’s $50 million in annual investments is dedicated to commercialization, with the goal of manufacturing and bringing to market in Michigan life sciences discoveries made in Michigan.
Within these parameters, the MLSC identifies the following guidelines for funding awards:
An initiative’s potential to position the state as a major center in life sciences research and business development;
The degree to which it enhances the state’s scientific stature and commercialization capabilities in Michigan’s higher education and research institutions; and
The extent to which an initiative is likely to leverage further state investment to attract private, federal and philanthropic resources.
The Corridor thus maintains rather broad criteria on which to make grant awards as it sees fit, provided those initiatives are consistent with the state’s goal of leveraging further life sciences investment and job growth in the coming years.
Primary authority for the Life Sciences Corridor resides in the state’s economic development arm, the Michigan Economic Development Corporation. A steering committee appointed
Governance
100
directly by the Governor meets twice a year to determine grant allocations. The steering committee has a significant private sector membership, including 8 chief executives from the state’s health science industry.
Indicative of the fund’s intention to build partnerships between business and academic research, the presidents of the state’s 3 major research universities are also on the steering committee. The committee’s membership is rounded out by venture capital representatives and the executive director of the Life Sciences Corridor.
States that were party to the Master Tobacco Agreement agreed to spend windfall revenues to improve the general health of their citizens. The NYS compact for spending the local share of the Casino revenue contains similar restrictions. The compact mandates funds be spent on either
a) Reimbursements to municipal governments for costs incurred or for economic development opportunities and job expansion programs therein, or
b) Support services for gambling treatment programs.
Any funds not used in either fashion “shall be transferred to the general fund for the support of government during the fiscal year in which they are received.”
Translating the Michigan model to Niagara could entail allocating shares of the money to cover immediate municipal costs resulting from the gaming facility (as Michigan covers some primary tobacco health-related costs), but reserving a larger proportion for investment in the long-term diversification of the surrounding county’s economic base.
The Michigan model suggests investment in higher education institutions, for example, can leverage broader job growth possibilities, while encouraging networks of academic institutions and the private sector may also prove promising. In order to
Implementing it in Niagara

101
avoid the lion’s share of revenues ending up in municipal general fund coffers, however, Niagara would likely have to establish a casino revenue steering committee comparable to Michigan’s Life Science Corridor.
To guarantee reservation of funds for investment in long-term economic initiatives, a non-governmental mechanism would likely need to be put in place to distribute funds. That entity could be responsible for distributing reimbursement payments to municipal governments, while ensuring some of the windfall revenue is reserved for specific initiatives targeting the city and county’s economic vitality. While granting complete authority over gaming revenues to the municipal government itself does not necessarily preclude it being spent on specific economic development initiatives, it increases the likelihood that a greater share of revenues will end up in the local general fund.
The New Jersey Casino Reinvestment Development Authority was established in 1984 by the State of New Jersey. Under the law, casinos in the state are required to either i) pay 2.5 percent of their gross revenues or ii) invest 1.25 percent of gross revenues in obligation deposits to the Development Authority. Through direct investments, bond funding and donations for Authority-approved projects, CRDA helps reinvest a portion of gaming revenues in housing, community service/recreational facilities and economic development projects in Atlantic City and across the state.
The CRDA identifies its mission as eleven-fold:
To maintain public confidence in the gaming industry as a tool for economic development and urban redevelopment in the City of Atlantic City and the rest of the state;
To provide casinos a mechanism for encouraging new capital investment in the city;
To promote tourist industries in the rest of Atlantic County;
Model 4: Casino Reinvestment Development Authority (Atlantic City)
102
To administer loans and other financial assistance for planning, acquisition, construction, rehabilitation or repair of low income housing in the city;
To enhance the attractiveness and meeting/ accommodation capabilities of convention halls in the county;
To help fund public transportation and related costs;
To make loans and assist in the financing of the construction, reconstruction, rehabilitation, or repair of infrastructure projects including roads, highways, bridges, water and sewage facilities;
To assist in the funding of manufacturing, industrial and other commercial ventures to induce employment growth, particularly opportunities for underemployed and unemployed residents of the area;
To supplement local government economic incentive financing;
To encourage investment in projects that directly address social and economic needs in the community; and
To encourage projects that help revitalize and redevelop blighted neighborhoods.
The CRDA funds projects consistent with three priority criteria: that the initiative directly address the impact of casino gambling on housing, community development and community services; develop regional tourism; and/or create economic development opportunities. Projects are funded through a competitive application process, with a minimum project size of $350,000. Since 1984, CRDA has invested more than $225 million in construction of new residential housing in Atlantic City, funding and completing construction on over 1,800 housing units. CRDA alone is responsible for expanding the city’s housing stock more than 12 percent since its inception.
Among its housing and loan incentive programs are HOPE (a first-time homebuyer program); Police 3-2-1 (integrating police and community-oriented approaches in city neighborhoods); and resident discount programs (which offer mortgage incentives to
Spending

103
individuals and families who opt to live in CRDA-financed developments in Atlantic City).
CRDA has contributed community-building funds to senior citizens facilities, ambulatory care centers, boys and girls clubs, housing, retail and entertainment venues, sports draws and attraction/tourism initiatives in Atlantic City and statewide.
The CRDA is governed by a board of 15 directors. Six public members are appointed by the governor (with approval of the state senate); one member is appointed by the governor on the recommendation of the senate leader; one member is appointed by the governor on the recommendation of the assembly speaker; two casino representatives are appointed by the governor; one member of the Casino control commission is appointed by the governor; the Mayor of Atlantic City; the state treasurer; the state attorney general; and either the commissioner of economic development, commissioner of community affairs or another member of the state’s casino control commission. Members sit on the board for four-year teams, with the exception of the Mayor of Atlantic City, the state treasurer and state attorney general (who are appointed to the board for their entire tenure in that office).
The CRDA’s day-to-day operations are overseen by a senior staff of eight, including an executive director, deputy director, director of project development, director of economic development, director of housing, director of finance, director of housing, and in-house counsel.
While many aspects of the Atlantic City experience do not apply to Niagara Falls, the structure of CRDA is instructive. The breadth of participation in CRDA and the focus of its target initiatives are both desirable. Like Atlantic City, Niagara Falls must focus the resources generated by the exclusivity fee for the general benefit of the community and to strengthen the local economy.
Governance
Implementing it in Niagara

104
We believe that the governance mechanism is also applicable to Niagara Falls. CRDA’s membership acknowledges that its decisions have significance that extends beyond Atlantic City.