senate education committee - vermont general...
TRANSCRIPT

Senate Education Committee
January 22, 2015
Sec. Rebecca Holcombe

Demographic Projections
(not predictions, but we need to pay attention)

We are not just losing students.
0
10,000
20,000
30,000
40,000
50,000
60,000
<5
5-9
10-
14
15-
19
20-
24
25-
29
30-
34
35-
39
40-
44
45-
49
50-
54
55-
59
60-
64
65-
69
70-
74
75-
79
80-
84
85+
Vermont Population Projections. 2010 Census, 2020, 2030
Ken Jones, Ph.D., Economic Research Analyst
Vermont Agency of Commerce and Community Development
2010
2020
2030

We are not just losing students.
0
10,000
20,000
30,000
40,000
50,000
60,000
<5 5-9 10-14 15-19 20-24 25-29 30-34 35-39 40-44 45-49 50-54 55-59 60-64 65-69 70-74 75-79 80-84 85+
Vermont Population Projections. 2010 Census, 2020, 2030
Ken Jones, Ph.D., Economic Research Analyst
Vermont Agency of Commerce and Community Development
2010
2020
2030

We are not just losing students.
0
10,000
20,000
30,000
40,000
50,000
60,000
<5
5-9
10-
14
15-
19
20-
24
25-
29
30-
34
35-
39
40-
44
45-
49
50-
54
55-
59
60-
64
65-
69
70-
74
75-
79
80-
84
85+
Vermont Population Projections. 2010 Census, 2020, 2030
Ken Jones, Ph.D., Economic Research Analyst
Vermont Agency of Commerce and Community Development
2010
2020
2030

People are the driver of economicvitality:
Our job:
• Getting people to come
• Getting people to stay
• Educating the people we have
– All of them
– To much higher levels

Solve unstructuredproblems
Work with newinformation and reasonfrom evidence
Complete non-routinetasks
Communicate andpersuade
Collaborate oncomplex tasks
Exercise judgment
The New Basic Skillsa.k.a. what computers can’t do [yet]

Flexible pathways, project-based learning and a focuson application:
“I realized people used to dothe work machines like this do.Now people write programsthat make the machines do thework people used to do.”
-boy at North Country Careerand Technical Center
http://vimeo.com/100144145
Mechatronics at North Country CTE

Education Quality Standards
• Focus on proficiency (not seat time)
• Emphasis on personalization and purpose
• Emphasis on transferable skills
• Systems to support continuous professionalgrowth and learning of educators

How are Vermont students doing?
260
265
270
275
280
285
290
295
300
305
310
2007 2009 2011 2013
US -- More affluentstudents
VT --More affluentstudents
US --Students eligiblefor Free or ReducedLunch
VT --Students eligiblefor Free or ReducedLunch
NAEP 8th grade math scores for students eligible andineligible for free or reduced lunch


Act 77 –
provides HSstudents with
college credits toencourage post
secondary success.
Grades K-12Post
SecondaryAccess
Education is no longer just grades K-12
Indicator Low High
Class of 2012 post secondary enrollment(includes students from historicalacademies)
36.7% 77.3%
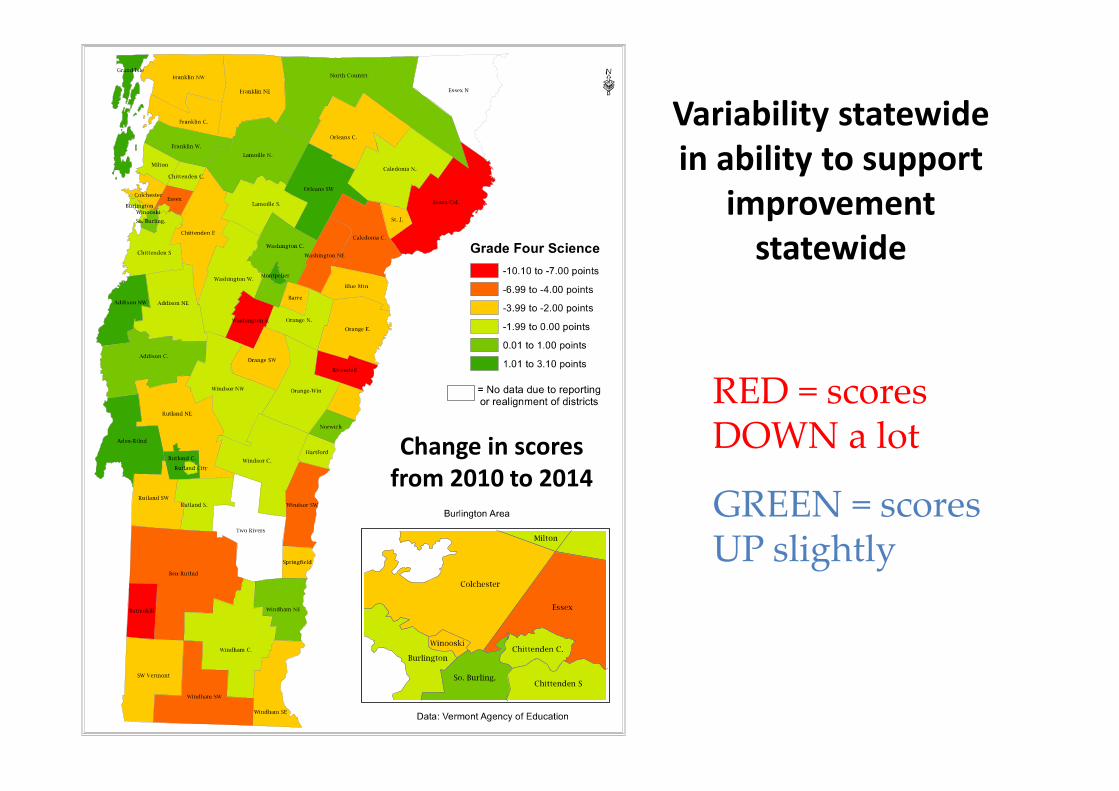
RED = scoresDOWN a lot
GREEN = scoresUP slightly
Variability statewidein ability to support
improvementstatewide
Change in scoresfrom 2010 to 2014

EDEN-2%
STOWE12.9%
DERBY-34.9%
MILTON-14.1%
LOWELL27.2%
FAIRFIELD-25.7%
PERU28.6%
RIPTON-25%
JAY-5.4%
DANVILLE-24.8%
GROTON-9.4%
LEWIS0%
NEWBURY-22.5%
DANBY-15.5%
BETHEL-30%
CHESTER-34.1%
HIGHGATE-27%ALBURG
-7.7%TROY-26.9%
CHITTENDEN-21.8%
JAMAICA-14.7%
DORSET-16.5%
ORWELL-27.9%
CABOT-29.9%
RUPERT-22.9%
CALAIS-34.2%
POWNAL-29.4%
PAWLET3.3%
BARNET-18.8%
CORINTH-51%
LINCOLN14.6%
BOLTON-5.3%
CAMBRIDGE-6.6%
BENSON-22%
ESSEX-10.7%
BRIGHTON-54.1%
CONCORD-4.4%
BERLIN-21.1%
DOVER-32.7%
WINHALL105.8%
TOPSHAM-18%
BARNARD-43.8%
SWANTON-12.7%
ALBANY-23.4%
FAIRFAX20.4%
BURKE-13.1%
BARTON-31.4%
VICTORY18.2%
LYNDON-30.7%
HALIFAX-25.9%
BRISTOL-32.2%
PEACHAM-36.4%
ADDISON-16.5%
AVERILL0%
SHARON-5%
SUTTON-30.1%
ELMORE-17.1%
JOHNSON-15.6%
GLOVER23.1%
WALDEN-0.7%
GRANBY-43.8%
NORWICH-12.2%
WARREN0.2%
ROCHESTER-52.5%
FERDINAND0%
GRANVILLE-63.1%
READING-5.1%
NORTON-56.8%
ORANGE-12.6%
PLYMOUTH9.8%
STRATTON113.3%
DUXBURY-13.7%
RANDOLPH-28.1%
GEORGIA-5.3%
CHELSEA-33.1%BRIDPORT
-29.1%
UNDERHILL-18.3%
NEWARK-27.4%
MENDON-21.9%
LUDLOW-47.5%
ROXBURY-49.7%
HARTLAND-29.2%
HARTFORD-17.9%
FRANKLIN-7.6%
KIRBY18.2%
POULTNEY-31.8%
HOLLAND0.7%
RICHFORD-17.8%
WESTON0%
SHELDON-20.6%
THETFORD-10.3%
NEWFANE-30.8%
POMFRET-34%
KILLINGTON-42.5%
BRANDON-31.2%
FAYSTON6.9%
WATERBURY-8.7%
CANAAN-44.4%
WOLCOTT-4.6%
RYEGATE-40.6%
WOODFORD-34.4%
GRAFTON-17.5%
IRASBURG-5.9%
SANDGATE-27.8%
HANCOCK-33.3%
PITTSFORD-31.8%
GUILFORD-47.1%
MONTGOMERY4.6%
ROYALTON-36.2%
TUNBRIDGE-22.5%
MORGAN-23.1%
SHOREHAM-42.4%
ENOSBURGH-17.9%
SPRINGFIELD-33.5%
MORRISTOWN-15.6%
FLETCHER4.3%
ARLINGTON-23%
BERKSHIRE-12.1%
STRAFFORD-16.2%
LUNENBURG-38.1%
STAMFORD-21.4%
MONKTON-4.8%
MARLBORO-22.2%
HARDWICK-26.4%
CASTLETON-34.5%
VERSHIRE-39.6%
JERICHO-2.8%
IRA-47.9%
NORTHFIELD-37.7%
WHEELOCK-19.3%
WESTFIELD-25.1%
SHREWSBURY-52.6%
SOUTH HERO-37.1%
FERRISBURGH-5.9%
NEW HAVEN-11.2%
CHARLOTTE-4.2%
MIDDLESEX-15.2%
CAVENDISH-14.4%
NORTH HERO-36.1%
WELLS-26.9%
WESTFORD-26.2%
HYDE PARK-15.4%
MOUNT HOLLY-35.1%
MARSHFIELD-12%
BRIDGEWATER-43.2%
BRAINTREE-35.6%
HINESBURG-11.6%
WOODSTOCK-42.3%
MORETOWN-28%
STARKSBORO-13.2%
SUNDERLAND-15%
WOODBURY-42.2%
PUTNEY-33.5%
WILMINGTON-36.3%
TOWNSHEND-12.7%
BELVIDERE7.2%
BROOKFIELD-48.5%
WESTMORE-36.6%
STOCKBRIDGE-18.6%
WATERFORD-1.5%
BLOOMFIELD-50.9%
BAKERSFIELD-8.3%
SHAFTSBURY-28.5%
ROCKINGHAM-31.2%
WESTMINSTER-41.5%
MOUNT TABOR-18.1%
BENNINGTON-27.3%
MIDDLEBURY-26.3%
MANCHESTER-10.5%
RICHMOND-8.2%
GLASTENBURY0%
EAST HAVEN-29.8%
WHITINGHAM-14.9%
SHEFFIELD-23.1%
WORCESTER-41.9%
LEMINGTON-34.5%
GUILDHALL-55.7%
WALLINGFORD-41.9%
CRAFTSBURY-27.6%
ANDOVER-7.4%
WILLISTON32.6%
GRAND ISLE-5%
HUNTINGTON0.2%
WASHINGTON-42.3%
READSBORO-49.2%
CHARLESTON-22.8%
GREENSBORO-13.5%
COLCHESTER-11.2%
TINMOUTH-29.7%
SALISBURY-24.1%
MAIDSTONE-33.3%
WINDHAM-44.5%
BRADFORD-24%
WEATHERSFIELD-18.5%
NEWPORT TOWN-29%
WILLIAMSTOWN-3.2%
CORNWALL-14.6%
FAIRLEE-41%
CLARENDON-35.8%
COVENTRY-14.1%
SOMERSET0%
GOSHEN-70.3%
ST. JOHNSBURY-29.7%
LONDONDERRY-11.8%
VERNON-20%
BARRE TOWN-24.6%
SUDBURY-43.9%
BRATTLEBORO-21.6%
WARDSBORO-17.3%
WAITSFIELD-6.8%
DUMMERSTON-26.3%
SHELBURNE8.2%
WEST HAVEN-49.1%
E. MONTPELIER-14.3%
BRUNSWICK-68.7%
HUBBARDTON-14.3%
WINDSOR-26.1%
PANTON-20.4%
LEICESTER-32.9%
PLAINFIELD-37%
BROWNINGTON-3.8%
PITTSFIELD50%
ATHENS17.1%
SEARSBURG83.3%
WEYBRIDGE-9.2%
ST. ALBANS TOWN11.7%
RUTLAND TOWN-18.9%
WHITING-33.8%
WEST FAIRLEE-13.2%
WEST WINDSOR-19.3%
FAIR HAVEN-25.3%
W. RUTLAND-28.4%
WATERVILLE-25.1%
ISLE LA MOTTE-27.6%
AVERY'S GORE0%
STANNARD-9.2%
BROOKLINE-10.4%
So. BURLINGTON6.8%
MIDDLETOWN SPRINGS-15.3%
WALTHAM-35.3%
BURLINGTON-1.9%
MONTPELIER-28.4%
PROCTOR-12.3%
LANDGROVE-20.8%
WARREN's GORE0%
RUTLAND CITY-16.9%
UNDERHILL ID-18.3%
NEWPORT CITY-23.7%
BALTIMORE34.5%
BUELS GORE400%
ESSEX JCT ID2.7%
BARRE CITY-11.4%
ORLEANS ID-31.7%
ST. GEORGE-22.5%
N. BENNINGTON ID-20.2%
VERGENNES-24.3%
WARNER'S GRANT0%
WELLS RIVER-38.3%
WINOOSKI-11.4%
ST. ALBANS CITY-19.7%
Change in ADM
Over 20 years
<-50%
-49.9% to -40%
-39.9% to -30%
-29.9% to -20%
-19.9% to -10%
-9.9% to 0%
0.01% to 10%
10.1% to 20%
20.1% to 30%
30.1% to 40%
40.1% to 50%
Student DECLINE >50% Student-to-Teacher Ratio 7.5-9.0

Teacher : student ratios are lower in smallerschools, on average
Note: Teacher:student ratios are not the same as class sizes

Opportunity Cost to Equity: Which do we want?Classes of 2-9 students or summer learning?
Source: Entwisle, Alexander, and Olson (1997), Table 3.1
Note: From “Summer learning and its implications: Insights from the Beginning School Study,” by K. L. Alexander, D. R. Entwisle, and L. S. Olson, 2007b, New Directionsfor Youth Development, 114, p. 18. Copyright 2007. Reprinted with permission of John Wiley & Sons, Inc.
Cumulative gains onCalifornia Achievement Testin reading:
• During the school year,children in poverty learnas much as their affluentpeers.
• Over the summer, theskills of children inpoverty do not improve,but the skills of moreaffluent students do.

How do we provide high qualityopportunities to learn in the most equitable
and affordable way possible, given ourcurrent structure and demographic
challenges?
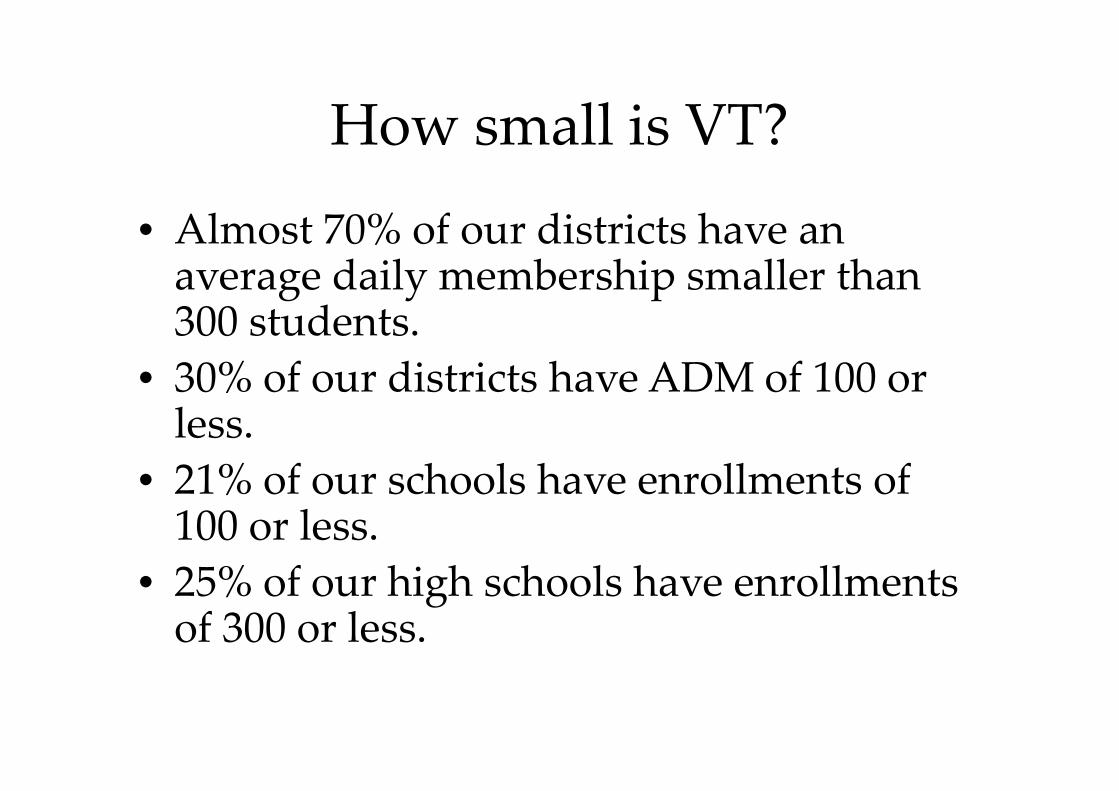
How small is VT?
• Almost 70% of our districts have anaverage daily membership smaller than300 students.
• 30% of our districts have ADM of 100 orless.
• 21% of our schools have enrollments of100 or less.
• 25% of our high schools have enrollmentsof 300 or less.

Effects of School Size on Achievement Gains inHigh Schools?
Lee, Valerie E.; Smith, Julia B. High School Size: Which Works Best and for Whom? Educational Evaluation and Policy Analysis, v19 n3 p205-27Fall 1997.
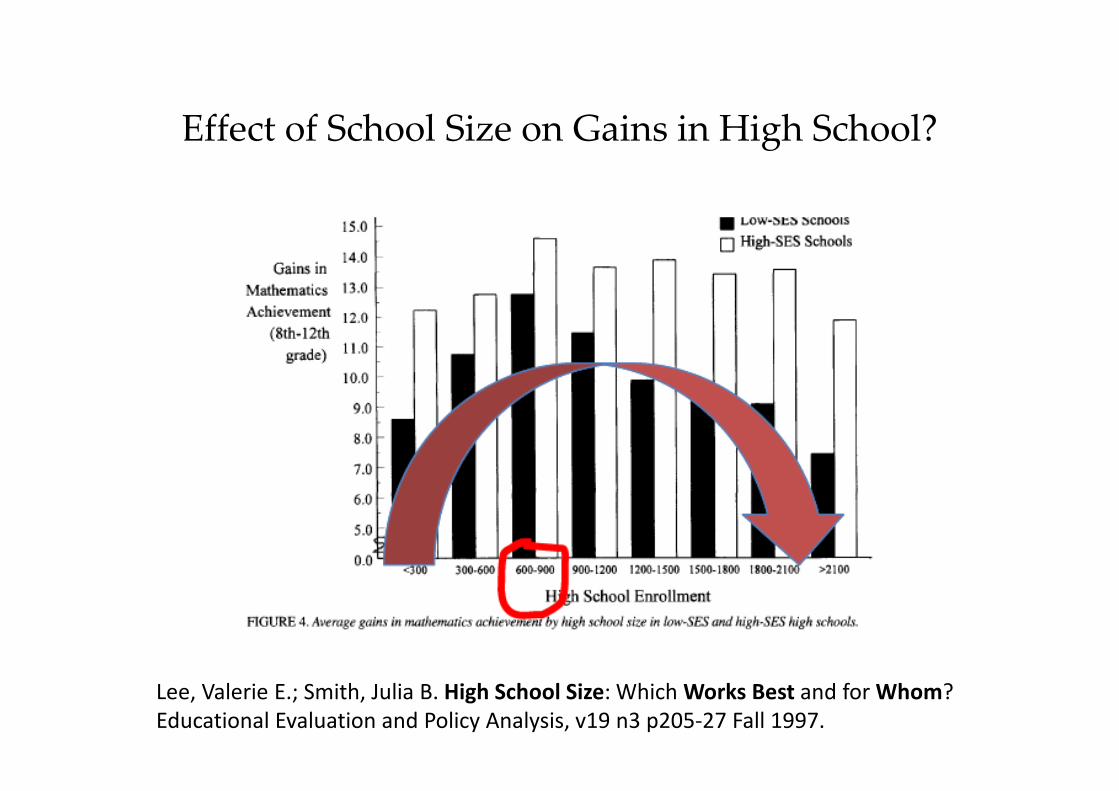
Effect of School Size on Gains in High School?
Lee, Valerie E.; Smith, Julia B. High School Size: Which Works Best and for Whom?Educational Evaluation and Policy Analysis, v19 n3 p205-27 Fall 1997.

DOUGLAS D. READY AND VALERIE E. LEE . Optimal Context Size in Elementary Schools: Disentangling the Effects ofClass Size and School Size. Brookings Papers on Education Policy: 2006/2007
Effect of School Size on Learning inElementary Schools?

Effect of scale on the breadth of opportunities you canprovide onsite?
Course offerings in two middle schools which feed into the same high school:
School A: School B:
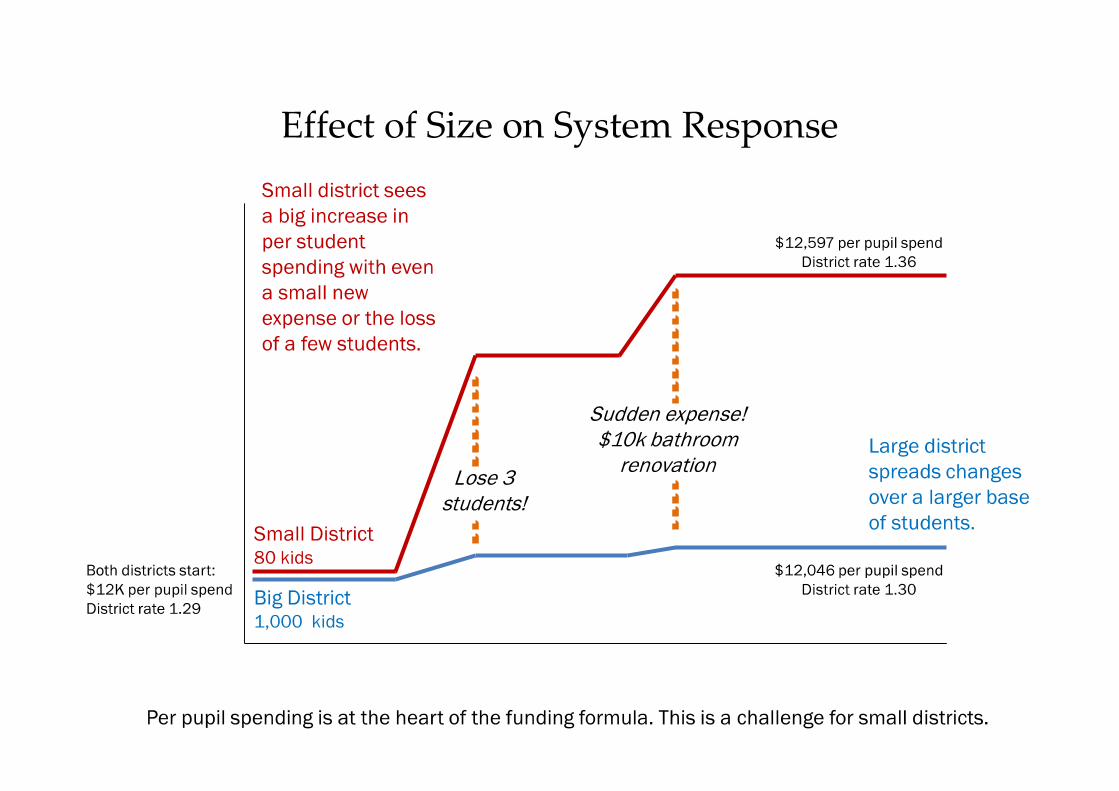
Effect of Size on System Response

NY experience: merging districts can yieldsubstantial cost savings for very small districts
Duncombe, W., & Yinger, J. (2007). Does schooldistrict consolidation cut costs? Education, 2(4),341-375.
Two districts,300 pupils each
= 31% cost savings
Two districts,1500 pupils each
= 14% cost savings

13 Current Forms of SchoolGovernance in VT
Nonoperating
Operatingelementary
K-12No
Elementary
Union HighSchool
Tution at HS Gores
Union HSDistrict
UnionElementary
District
ModifiedUnifiedUnion
InterstateSchoolDistrict
UnifiedUnion
UnionHigh
School

Jay, Morgan, Holland, Derby,Newport City, Troy, Newport
Town, Westfield, Lowell,Charleston, Brighton
Jay, Morgan,Holland, Derby,
Newport City
Jay K-6(One Town)
North CountryJunior UHS(Five Towns)
North CountrySenior UHS
(Ten Towns)Vermont does not have uniformpreK-12 districts. Instead, wehave a large number ofconfigurations that includesmall preK-12 districts, largepreK-12 districts, distinctlower school districts, uniondistricts, etc.
One home can belong to anumber of districts, all ofwhich contribute to a home’slocal tax rate. It can be dizzyingfor a voter to decipher how variousbudget choices add up in theirrates.
What is Local Control?

Incoherence of Governance?
PreK
(public orprivate
provider)
Grades K-6 (1Town School
Board)
Grades 7-8 (5Town Boardfor a Junior
High School)
Grades 9-12(10 Town
School Boardfor HighSchools)
Early CollegeGrades 11, 12
(CollegeSystem)

This is our delivery system.
