semi-annual report march 31, 2017 - etfmg funds · semi-annual report march 31, 2017 ......
TRANSCRIPT
Semi-Annual ReportMarch 31, 2018
ETFMG Prime Junior Silver ETFTicker: SILJ
ETFMG Prime Cyber Security ETFTicker: HACK
ETFMG Prime Mobile Payments ETFTicker: IPAY
ETFMG Drone Economy Strategy ETFTicker: IFLY
ETFMG Video Game Tech ETFTicker: GAMR
The funds are a series of ETF Managers Trust.
1
ETFMG™ ETFs
TABLE OF CONTENTS March 31, 2018
PageShareholders’ Letter 2 Growth of $10,000 Investment and Top Ten Holdings 4 Important Disclosures and Key Risk Factors 14 Portfolio Allocations 17 Schedules of Investments 18 Statements of Assets and Liabilities 33 Statements of Operations 34 Statements of Changes in Net Assets 35 Financial Highlights 40 Notes to the Financial Statements 45 Approval of Advisory Agreements and Board Considerations 57 Expense Examples 60 Supplementary Information 61
2
ETFMG™ ETFs
Shareholders’ Letter On behalf of the entire team, we want to express our appreciation for the confidence you have placed in these ETFs. We continue to strive to deliver thematic technology ETFs that focus on major areas of technological advancement in business and life. Below is a discussion of performance for each of the funds. Performance Overview During the 6-month period from October 1, 2017 to March 31, 2018, the S&P 500 Information Technology Sector Index, a broad measure of US listed technology companies, returned 12.85%. During the same period, the S&P Global 1200 Information Technology Sector Index, a broad measure of global technology companies, returned 11.79%. For all of the funds, the primary difference between fund returns and index returns were the expenses of the funds, which are not part of the indexes that each of the funds track. ETFMG Prime Junior Silver ETF (SILJ) The ETFMG Prime Junior Silver ETF (the “Fund”) seeks to provide investment results that, before fees and expenses, correspond generally to the price and yield performance of the Prime Junior Silver Miners & Explorers Index (the “Index”). The Index was down - 8.98% during the period while the NAV return for the Fund was down -10.26%, in line with the return of the Index. The best performers in the Fund were SilverCrest Metals (up 65.26%) and Maya Gold & Silver (up 41.51%). The worst performers were Cautivo Mining (down -49.33%) and Santacruz Silver Mining (down - 45.29%). ETFMG Prime Cyber Security ETF (HACK) The ETFMG Prime Cyber Security ETF (the “Fund”) seeks to provide investment results that, before fees and expenses, correspond generally to the price and yield performance of the Prime Cyber Defense Index (the “Index”). Over the period, the Index returned 16.72% while the NAV return for the Fund was 13.83%, in line with the return of the Index. The best performers in the Fund were Anhlab (up 100.12%) and Fortinet (up 49.50%). The worst performers were SecureWorks (down - 34.57%) and A10 Networks (down -23.02%). ETFMG Prime Mobile Payments ETF (IPAY) The ETFMG Prime Mobile Payments ETF (the “Fund”) seeks to provide investment results that, before fees and expenses, correspond generally to the price and yield performance of the Prime Mobile Payments Index (the “Index”). Over the period, the Index returned 11.65% while the NAV return for the Fund was 11.26%, in line with the return of the Index. The best performers in the Fund were Square (up 70.77%) and USA Technologies (up 41.06%). The worst performers were MoneyGram International (down - 31.04%) and VeriFone Systems (down - 25.33%). ETFMG Drone Economy Strategy ETF (IFLY) The ETFMG Drone Economy Strategy ETF (“the Fund”) seeks to provide investment results that, before fees and expenses, correspond generally to the price and yield performance of the Reality Shares Drone Index (“the Index”).
3
ETFMG™ ETFs
ETFMG Video Game Tech ETF (GAMR) Over the period, the Index returned 3.61% while the NAV return for IFLY was -3.93%, in line with the return of the Index. The best performers in the Fund were Vestel (up 40.71%) and Intel (up 38.48%). The worst performers were GoPro (down - 56.49%) and Parrot SA (down - 46.54%). The ETFMG Video Game Tech ETF (the “Fund”) seeks to provide investment results that, before fees and expenses, correspond generally to the price and yield performance of the EEFund Video Game Tech Index (the “Index”). Over the period, the Index returned 9.56% while the NAV return for the Fund was 9.24%, in line with the return of the Index. The best performers in the Fund were Neowiz (up 102.90%) and Capcom (up 86.29%). The worst performers were Rovio Entertainment (down - 47.43%) and GameStop (down - 36.19%). On behalf of ETFMG and our industry leading partners, I would like to thank you for your continued interest in our unique suite of ETFs. We endeavor to provide our investors with new and innovative products and look forward to continuing this for years to come. You can find further details about SILJ, HACK, IPAY, IFLY and GAMR by visiting www.etfmgfunds.com, or by calling 1-844-383-6477. Sincerely,
Samuel Masucci III Chairman of the Board Samuel Masucci III is a registered representative of ETFMG Financial, LLC.
4
Average Annual Returns 6 Months 1 Year 3 Year 5 Year Since
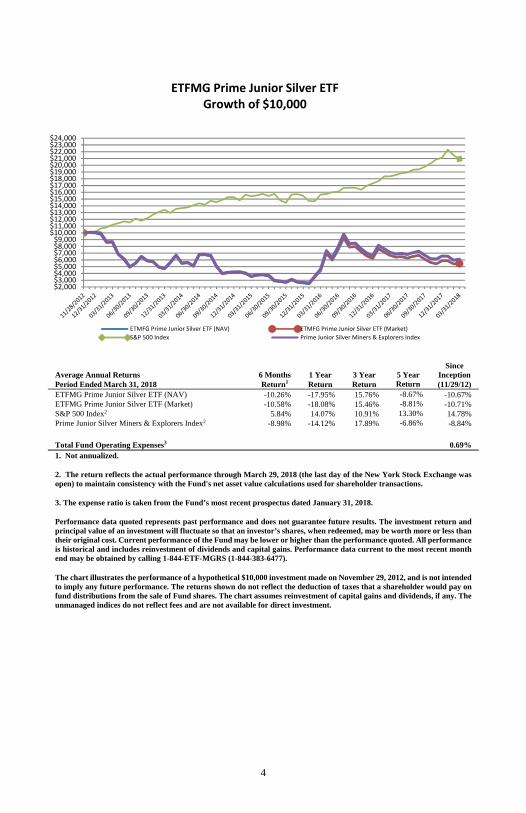
Inception Period Ended March 31, 2018 Return1 Return Return Return (11/29/12) ETFMG Prime Junior Silver ETF (NAV) -10.26% -17.95% 15.76% -8.67% -10.67%ETFMG Prime Junior Silver ETF (Market) -10.58% -18.08% 15.46% -8.81% -10.71%S&P 500 Index2 5.84% 14.07% 10.91% 13.30% 14.78%Prime Junior Silver Miners & Explorers Index2 -8.98% -14.12% 17.89% -6.86% -8.84%
Total Fund Operating Expenses3 0.69% 1. Not annualized.
2. The return reflects the actual performance through March 29, 2018 (the last day of the New York Stock Exchange was open) to maintain consistency with the Fund's net asset value calculations used for shareholder transactions.
3. The expense ratio is taken from the Fund’s most recent prospectus dated January 31, 2018. Performance data quoted represents past performance and does not guarantee future results. The investment return and principal value of an investment will fluctuate so that an investor’s shares, when redeemed, may be worth more or less than their original cost. Current performance of the Fund may be lower or higher than the performance quoted. All performance is historical and includes reinvestment of dividends and capital gains. Performance data current to the most recent month end may be obtained by calling 1-844-ETF-MGRS (1-844-383-6477).
The chart illustrates the performance of a hypothetical $10,000 investment made on November 29, 2012, and is not intended to imply any future performance. The returns shown do not reflect the deduction of taxes that a shareholder would pay on fund distributions from the sale of Fund shares. The chart assumes reinvestment of capital gains and dividends, if any. The unmanaged indices do not reflect fees and are not available for direct investment.
$2,000$3,000$4,000$5,000$6,000$7,000$8,000$9,000
$10,000$11,000$12,000$13,000$14,000$15,000$16,000$17,000$18,000$19,000$20,000$21,000$22,000$23,000$24,000
ETFMG Prime Junior Silver ETFGrowth of $10,000
ETMFG Prime Junior Silver ETF (NAV) ETMFG Prime Junior Silver ETF (Market)
S&P 500 Index Prime Junior Silver Miners & Explorers Index
5
ETFMG Prime Junior Silver ETF
Top Ten Holdings*
Security % of Total
Investments† 1 Pan American Silver Corporation 12.15%2 Coeur Mining, Inc. 11.43%3 Hecla Mining Co. 11.20%4 Hochschild Mining PLC 11.18%5 Yamana Gold, Inc. 4.73%6 First Majestic Silver Corp. 4.71%7 MAG Silver Corporation 4.42%8 Hudbay Minerals, Inc. 4.11%9 Tahoe Resources, Inc. 3.83%
10 Silvercorp Metals, Inc. 3.60%
Top Ten Holdings = 71.37% of Total Investments† * Current portfolio holdings may not be indicative of future Fund holdings. † Percentage of total investments less cash.
6
Average Annual Returns 6 Months 1 Year 3 Year Since
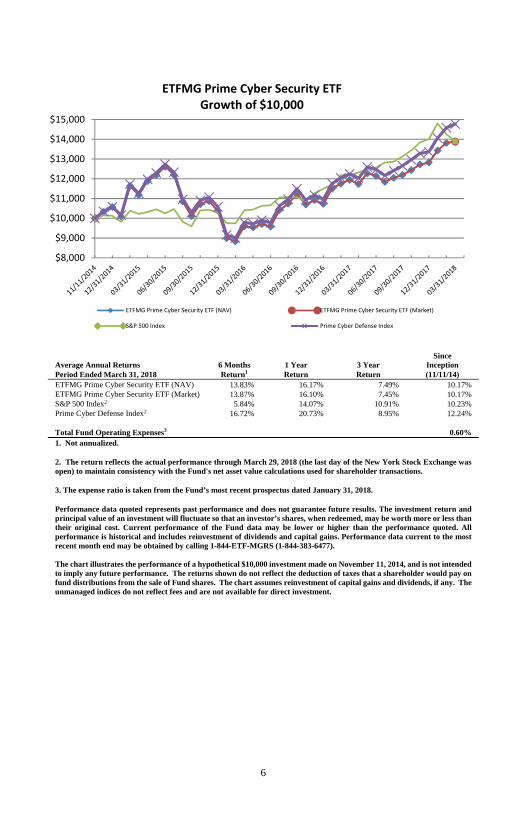
Inception Period Ended March 31, 2018 Return1 Return Return (11/11/14) ETFMG Prime Cyber Security ETF (NAV) 13.83% 16.17% 7.49% 10.17%ETFMG Prime Cyber Security ETF (Market) 13.87% 16.10% 7.45% 10.17%S&P 500 Index2 5.84% 14.07% 10.91% 10.23%Prime Cyber Defense Index2 16.72% 20.73% 8.95% 12.24%
Total Fund Operating Expenses3 0.60% 1. Not annualized.
2. The return reflects the actual performance through March 29, 2018 (the last day of the New York Stock Exchange was open) to maintain consistency with the Fund's net asset value calculations used for shareholder transactions.
3. The expense ratio is taken from the Fund’s most recent prospectus dated January 31, 2018.
Performance data quoted represents past performance and does not guarantee future results. The investment return and principal value of an investment will fluctuate so that an investor’s shares, when redeemed, may be worth more or less than their original cost. Current performance of the Fund data may be lower or higher than the performance quoted. All performance is historical and includes reinvestment of dividends and capital gains. Performance data current to the most recent month end may be obtained by calling 1-844-ETF-MGRS (1-844-383-6477). The chart illustrates the performance of a hypothetical $10,000 investment made on November 11, 2014, and is not intended to imply any future performance. The returns shown do not reflect the deduction of taxes that a shareholder would pay on fund distributions from the sale of Fund shares. The chart assumes reinvestment of capital gains and dividends, if any. The unmanaged indices do not reflect fees and are not available for direct investment.
$8,000
$9,000
$10,000
$11,000
$12,000
$13,000
$14,000
$15,000
ETFMG Prime Cyber Security ETFGrowth of $10,000
ETFMG Prime Cyber Security ETF (NAV) ETFMG Prime Cyber Security ETF (Market)
S&P 500 Index Prime Cyber Defense Index

7
ETFMG Prime Cyber Security ETF
Top Ten Holdings*
Security % of Total
Investments† 1 Trend Micro, Inc. 4.06%2 CommVault Systems, Inc. 3.92%3 Cisco Systems, Inc. 3.81%4 Palo Alto Networks, Inc. 3.80%5 CyberArk Software Ltd. 3.78%6 Science Applications International Corp. 3.77%7 Fortinet, Inc. 3.76%8 Carbonite, Inc. 3.70%9 CACI International, Inc. 3.65%
10 Proofpoint, Inc. 3.64%
Top Ten Holdings = 37.88% of Total Investments† * Current portfolio holdings may not be indicative of future Fund holdings. † Percentage of total investments less cash.
8
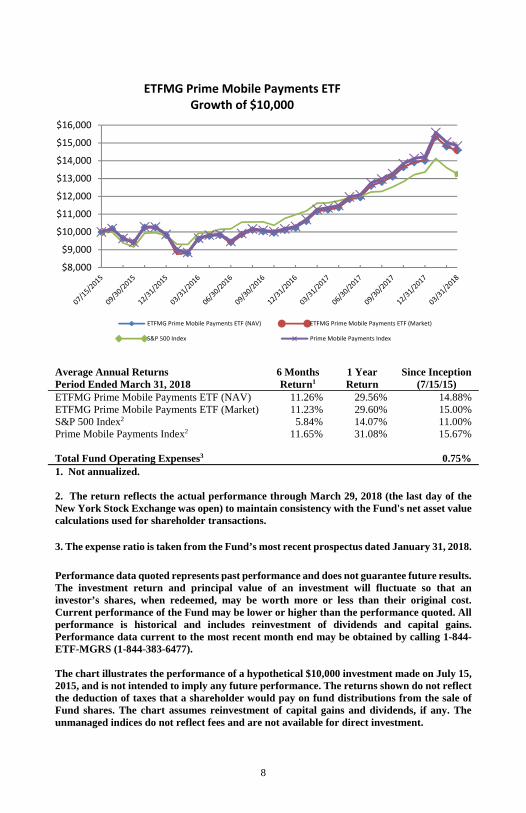
Average Annual Returns 6 Months 1 Year Since Inception Period Ended March 31, 2018 Return1 Return (7/15/15) ETFMG Prime Mobile Payments ETF (NAV) 11.26% 29.56% 14.88%ETFMG Prime Mobile Payments ETF (Market) 11.23% 29.60% 15.00%S&P 500 Index2 5.84% 14.07% 11.00%Prime Mobile Payments Index2 11.65% 31.08% 15.67%
Total Fund Operating Expenses3 0.75% 1. Not annualized.
2. The return reflects the actual performance through March 29, 2018 (the last day of the New York Stock Exchange was open) to maintain consistency with the Fund's net asset value calculations used for shareholder transactions. 3. The expense ratio is taken from the Fund’s most recent prospectus dated January 31, 2018.
Performance data quoted represents past performance and does not guarantee future results. The investment return and principal value of an investment will fluctuate so that an investor’s shares, when redeemed, may be worth more or less than their original cost. Current performance of the Fund may be lower or higher than the performance quoted. All performance is historical and includes reinvestment of dividends and capital gains. Performance data current to the most recent month end may be obtained by calling 1-844-ETF-MGRS (1-844-383-6477). The chart illustrates the performance of a hypothetical $10,000 investment made on July 15, 2015, and is not intended to imply any future performance. The returns shown do not reflect the deduction of taxes that a shareholder would pay on fund distributions from the sale of Fund shares. The chart assumes reinvestment of capital gains and dividends, if any. The unmanaged indices do not reflect fees and are not available for direct investment.
$8,000
$9,000
$10,000
$11,000
$12,000
$13,000
$14,000
$15,000
$16,000
ETFMG Prime Mobile Payments ETFGrowth of $10,000
ETFMG Prime Mobile Payments ETF (NAV) ETFMG Prime Mobile Payments ETF (Market)
S&P 500 Index Prime Mobile Payments Index
9
ETFMG Prime Mobile Payments ETF
Top Ten Holdings*
Security % of Total
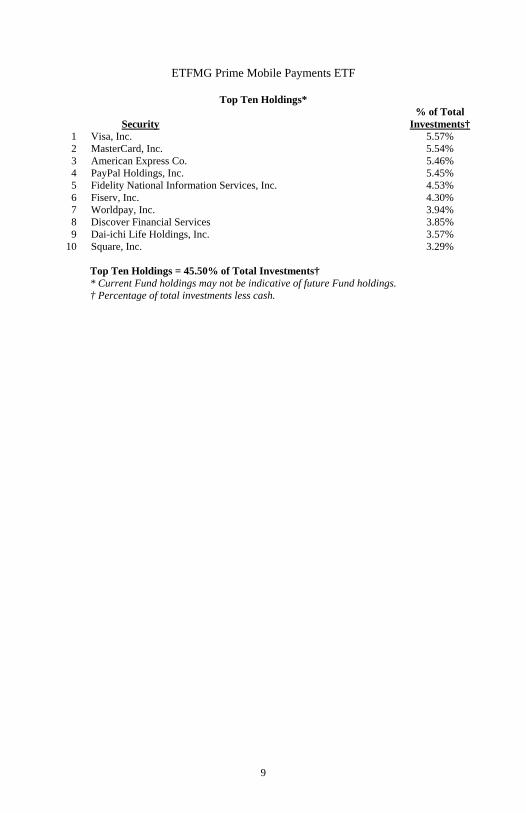
Investments† 1 Visa, Inc. 5.57%2 MasterCard, Inc. 5.54%3 American Express Co. 5.46%4 PayPal Holdings, Inc. 5.45%5 Fidelity National Information Services, Inc. 4.53%6 Fiserv, Inc. 4.30%7 Worldpay, Inc. 3.94%8 Discover Financial Services 3.85%9 Dai-ichi Life Holdings, Inc. 3.57%
10 Square, Inc. 3.29%
Top Ten Holdings = 45.50% of Total Investments†
* Current Fund holdings may not be indicative of future Fund holdings. † Percentage of total investments less cash.
10
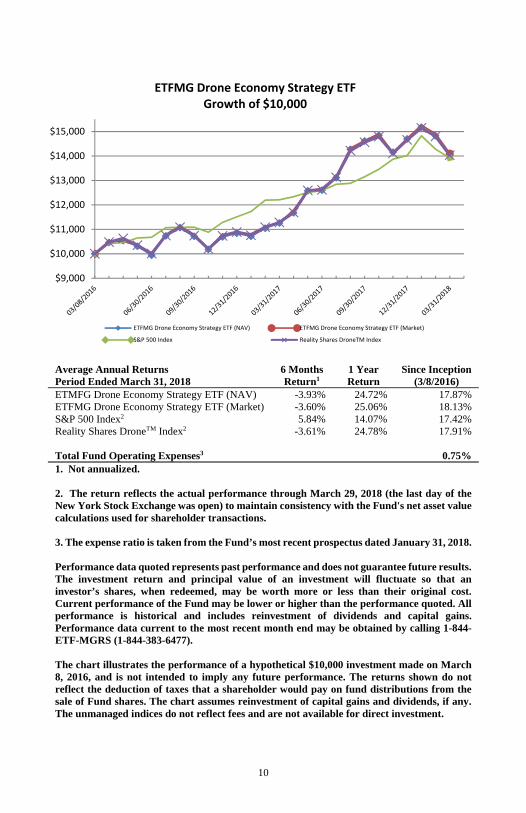
Average Annual Returns 6 Months 1 Year Since Inception Period Ended March 31, 2018 Return1 Return (3/8/2016) ETMFG Drone Economy Strategy ETF (NAV) -3.93% 24.72% 17.87%ETFMG Drone Economy Strategy ETF (Market) -3.60% 25.06% 18.13%S&P 500 Index2 5.84% 14.07% 17.42%Reality Shares DroneTM Index2 -3.61% 24.78% 17.91%
Total Fund Operating Expenses3 0.75% 1. Not annualized.
2. The return reflects the actual performance through March 29, 2018 (the last day of the New York Stock Exchange was open) to maintain consistency with the Fund's net asset value calculations used for shareholder transactions. 3. The expense ratio is taken from the Fund’s most recent prospectus dated January 31, 2018. Performance data quoted represents past performance and does not guarantee future results. The investment return and principal value of an investment will fluctuate so that an investor’s shares, when redeemed, may be worth more or less than their original cost. Current performance of the Fund may be lower or higher than the performance quoted. All performance is historical and includes reinvestment of dividends and capital gains. Performance data current to the most recent month end may be obtained by calling 1-844-ETF-MGRS (1-844-383-6477).
The chart illustrates the performance of a hypothetical $10,000 investment made on March 8, 2016, and is not intended to imply any future performance. The returns shown do not reflect the deduction of taxes that a shareholder would pay on fund distributions from the sale of Fund shares. The chart assumes reinvestment of capital gains and dividends, if any. The unmanaged indices do not reflect fees and are not available for direct investment.
$9,000
$10,000
$11,000
$12,000
$13,000
$14,000
$15,000
ETFMG Drone Economy Strategy ETFGrowth of $10,000
ETFMG Drone Economy Strategy ETF (NAV) ETFMG Drone Economy Strategy ETF (Market)
S&P 500 Index Reality Shares DroneTM Index
11
ETFMG Drone Economy Strategy ETF
Top Ten Holdings*
Security % of Total
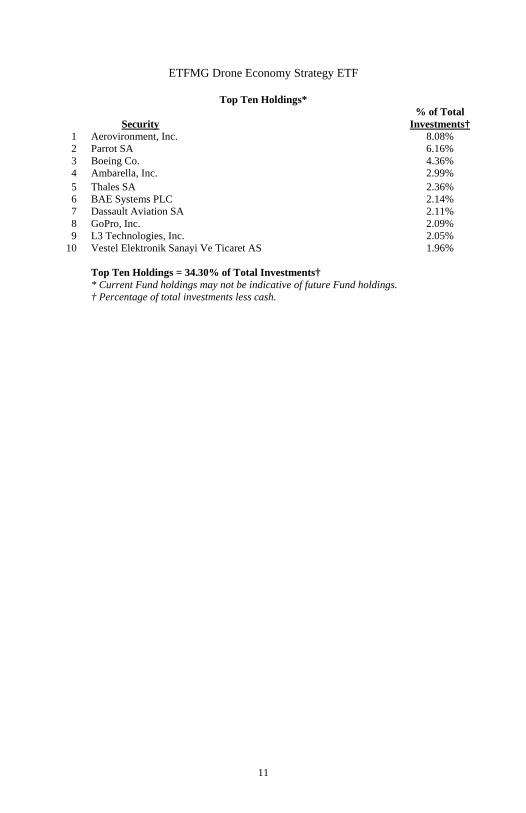
Investments† 1 Aerovironment, Inc. 8.08%2 Parrot SA 6.16%3 Boeing Co. 4.36%4 Ambarella, Inc. 2.99%5 Thales SA 2.36%6 BAE Systems PLC 2.14%7 Dassault Aviation SA 2.11%8 GoPro, Inc. 2.09%9 L3 Technologies, Inc. 2.05%
10 Vestel Elektronik Sanayi Ve Ticaret AS 1.96%
Top Ten Holdings = 34.30% of Total Investments† * Current Fund holdings may not be indicative of future Fund holdings.
† Percentage of total investments less cash.
12
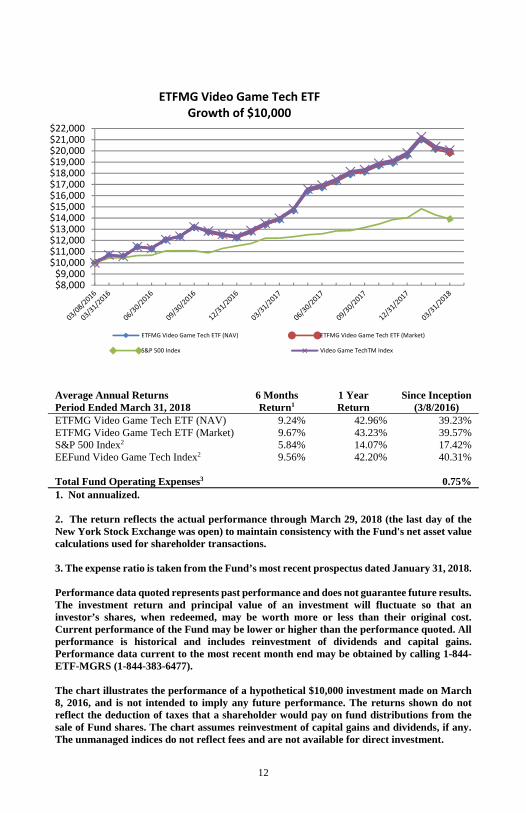
Average Annual Returns 6 Months 1 Year Since Inception Period Ended March 31, 2018 Return1 Return (3/8/2016) ETFMG Video Game Tech ETF (NAV) 9.24% 42.96% 39.23%ETFMG Video Game Tech ETF (Market) 9.67% 43.23% 39.57%S&P 500 Index2 5.84% 14.07% 17.42%EEFund Video Game Tech Index2 9.56% 42.20% 40.31%
Total Fund Operating Expenses3 0.75% 1. Not annualized.
2. The return reflects the actual performance through March 29, 2018 (the last day of the New York Stock Exchange was open) to maintain consistency with the Fund's net asset value calculations used for shareholder transactions.
3. The expense ratio is taken from the Fund’s most recent prospectus dated January 31, 2018. Performance data quoted represents past performance and does not guarantee future results. The investment return and principal value of an investment will fluctuate so that an investor’s shares, when redeemed, may be worth more or less than their original cost. Current performance of the Fund may be lower or higher than the performance quoted. All performance is historical and includes reinvestment of dividends and capital gains. Performance data current to the most recent month end may be obtained by calling 1-844-ETF-MGRS (1-844-383-6477). The chart illustrates the performance of a hypothetical $10,000 investment made on March 8, 2016, and is not intended to imply any future performance. The returns shown do not reflect the deduction of taxes that a shareholder would pay on fund distributions from the sale of Fund shares. The chart assumes reinvestment of capital gains and dividends, if any. The unmanaged indices do not reflect fees and are not available for direct investment.
$8,000$9,000
$10,000$11,000$12,000$13,000$14,000$15,000$16,000$17,000$18,000$19,000$20,000$21,000$22,000
ETFMG Video Game Tech ETFGrowth of $10,000
ETFMG Video Game Tech ETF (NAV) ETFMG Video Game Tech ETF (Market)
S&P 500 Index Video Game TechTM Index
13
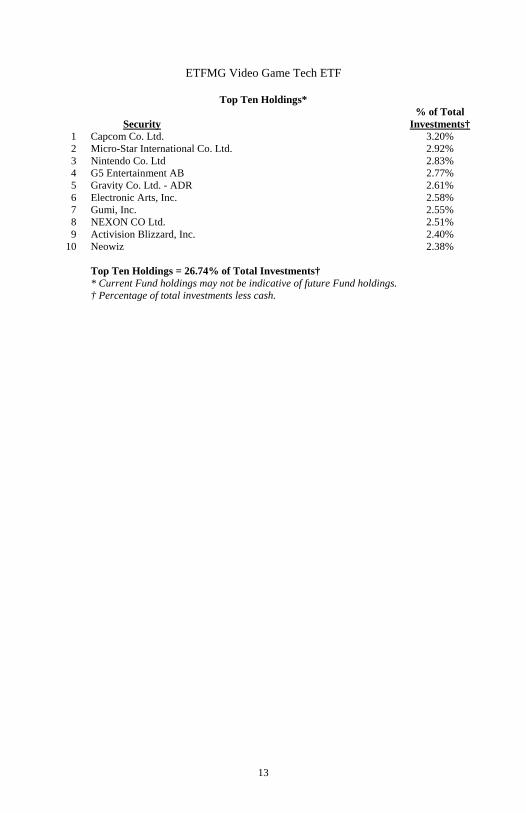
ETFMG Video Game Tech ETF
Top Ten Holdings*
Security % of Total
Investments† 1 Capcom Co. Ltd. 3.20%2 Micro-Star International Co. Ltd. 2.92%3 Nintendo Co. Ltd 2.83%4 G5 Entertainment AB 2.77%5 Gravity Co. Ltd. - ADR 2.61%6 Electronic Arts, Inc. 2.58%7 Gumi, Inc. 2.55%8 NEXON CO Ltd. 2.51%9 Activision Blizzard, Inc. 2.40%
10 Neowiz 2.38%
Top Ten Holdings = 26.74% of Total Investments† * Current Fund holdings may not be indicative of future Fund holdings.
† Percentage of total investments less cash.
14
ETFMG™ ETFs
Important Disclosures and Key Risk Factors Investing involves risk, including the possible loss of principal. Shares of any ETF are bought and sold at market price (not NAV), may trade at a discount or premium to NAV and are not individually redeemed from the Fund. Brokerage commissions will reduce returns. Narrowly focused investments typically exhibit higher volatility. Past performance is no indicative of future return. A fund’s performance for very short time periods may not be indicative of future performance. SILJ The ETFMG Prime Junior Silver ETF (the “Fund” or the “Junior Silver ETF”) seeks to provide investment results that, before fees and expenses, correspond generally to the price and yield performance of the Prime Junior Silver Miners & Explorers Index (the “Index”). Investments in foreign securities involve political, economic and currency risks, greater volatility and differences in accounting methods. These risks are greater for investments in emerging markets. The Fund is non-diversified, meaning it may concentrate its assets in fewer individual holdings than a diversified fund. Therefore, the Fund is more exposed to individual issuer volatility than a diversified fund. Funds that are less diversified across countries or geographic regions are generally riskier than more geographically diversified funds and risks associated with such countries or geographic regions may negatively affect a Fund. Investments in small capitalization companies tend to have limited liquidity and greater price volatility than large-capitalization companies. The ETFMG Prime Junior Silver ETF is subject to risks associated with the worldwide price of silver and the costs of extraction and production. Worldwide silver prices may fluctuate substantially over short periods of time, so the Fund’s share price may be more volatile than other types of economic conditions, tax treatment, government regulation and intervention, and world events in the regions in which the companies operation. Several foreign countries have begun a process of privatizing certain entities and industries. Privatized entities may lose money or be renationalized. The Fund invests in some economies that are heavily dependent upon trading with key partners. Any reduction in this trading may cause an adverse impact on the economy in which the Fund invests. The Fund’s return may not match or achieve a high degree of correlation with the return of the Prime Junior Silver Miners & Explorers Index . To the extent the Fund utilizes a sampling approach, it may experience tracking error to a greater extent than if the Fund had sought to replicate the Prime Junior Silver Miners & Explorers Index. IOPV or indicative optimized portfolio value is an estimated intraday fair value of one share of an ETF determined by the last trade price of the fund’s underlying securities. The Prime Junior Silver Miners & Explorers Index is designed to provide a benchmark for investors interested in tracking public, small-cap companies that are active in silver mining exploration and production industry. The stocks are screened for liquidity and weighted according to modified free-float market capitalization. The Index generally is comprised of 25-35 securities. An investment cannot be made directly in an index. HACK The Fund seeks to provide investment results that, before fees and expenses, correspond generally to the price and yield performance of the Prime Cyber Defense Index (the “Index”). The ETFMG Prime Cyber Security ETF (The “Fund”) or the “Cyber Security ETF” is concentrated in technology-related companies face intense competition, both domestically and internationally, which may have an adverse effect on profit margins. Such companies may have limited product lines, markets, financial resources or personnel. The products of such companies may face obsolescence
15
ETFMG™ ETFs
due to rapid technological developments, frequent new product introduction, unpredictable changes in growth rates, competition for the services of qualified personnel, and competition from foreign competitors with lower production costs. Technology companies are heavily dependent on patent and intellectual property rights. The loss or impairment of these rights may adversely affect the profitability of these companies. Investments in foreign securities involve political, economic and currency risks, greater volatility and differences in accounting methods. The Funds are non-diversified, meaning they may concentrate its assets in fewer individual holdings than a diversified fund. Investments in smaller companies tend to have limited liquidity and greater price volatility than large-capitalization companies. Diversification does not assure a profit or protect against a loss in a declining market. The Fund’s return may not match or achieve a high degree of correlation with the return of the Prime Cyber Defense Index . To the extent the Fund utilizes a sampling approach, it may experience tracking error to a greater extent than if the Fund had sought to replicate the Prime Cyber Defense Index. The Prime Cyber Defense Index provides a benchmark for investors interested in tracking companies actively involved in providing cyber security technology and services. The Index uses a market capitalization weighted allocation across the infrastructure provider and service provider categorizations as well as an equal weighted allocation methodology for all components within each sector allocation. Index components are reviewed semi-annually for eligibility, and the weights are re-set accordingly. An investment cannot be made directly in an index. IPAY The ETFMG Prime Mobile Payments ETF (the “Fund” or the “Mobile Payments ETF”) seeks to provide investment results that, before fees and expenses, correspond generally to the price and yield performance of the Prime Mobile Payments Index (the “Index”). Mobile Payment Companies face intense competition, both domestically and internationally, and are subject to increasing regulatory constraints, particularly with respect to fees, competition and anti-trust matters, cybersecurity and privacy. Mobile Payment Companies may be highly dependent on their ability to enter into agreements with merchants and other third parties to utilize a particular payment method, system, software or service, and such agreements may be subject to increased regulatory scrutiny. Additionally, certain Mobile Payment Companies have recently faced increased costs related to class-action litigation challenging such agreements. Such factors may adversely affect the profitability and value of such companies. The Fund is non-diversified, meaning it may concentrate its assets in fewer individual holdings than a diversified fund. Investments in smaller companies tend to have limited liquidity and greater price volatility than large-capitalization companies. The Fund’s return may not match or achieve a high degree of correlation with the return of the Prime Mobile Payments Index. To the extent the Fund utilizes a sampling approach, it may experience tracking error to a greater extent than if the Fund had sought to replicate the Index. Diversification does not guarantee a profit, nor does it protect against a loss in a declining market. The Prime Mobile Payments Index is designed to provide a benchmark for investors interested in tracking the mobile and electronic payments industry. The stocks are screened for liquidity and weighted according to a modified linear-based capitalization-weighted methodology. The Index generally is comprised of 25-40 securities. An investment cannot be made directly in an index. IFLY The ETFMG Drone Economy Strategy ETF (the “Fund” or the “Drone Economy ETF”) seeks to provide investment results that, before fees and expenses, correspond generally to the price and yield performance of the Reality Shares Drone Index (the “Index”). Drone Economy Companies face intense competition, both domestically and internationally and are heavily dependent on the protection of patent and intellectual property rights. In addition, Drone
16
ETFMG™ ETFs
Economy Companies may be dependent on the U.S. government and its agencies for a significant portion of their sales, and their success and growth may be affected by budgetary constraints, spending reductions, congressional appropriations, and administrative allocations of funds that affect the U.S. government and its agencies. Such factors may adversely affect the profitability and value of such companies. Investments in foreign securities involve political, economic and currency risks, greater volatility and differences in accounting methods. The Fund is non-diversified, meaning it may concentrate its assets in fewer individual holdings than a diversified fund. Investments in smaller companies tend to have limited liquidity and greater price volatility than large-capitalization companies. The Fund’s return may not match or achieve a high degree of correlation with the return of the Reality Shares Drone™ Index. To the extent the Fund utilizes a sampling approach, it may experience tracking error to a greater extent than if the Fund had sought to replicate the Index. Diversification does not guarantee a profit, nor does it protect against a loss in a declining market. The Reality Shares Drone™ Index provides a benchmark for investors interested in tracking companies actively involved in drone technology and services. The Index uses Modified Equal Weight capitalization-weighted methodology. The index was created and is maintained by Reality Shares Index Committee. You cannot invest directly in an index. GAMR The ETFMG Video Game Tech ETF (the “Fund” or the “Video Game Tech ETF”) seeks to provide investment results that, before fees and expenses, correspond generally to the price and yield performance of the EEFund Video Game Tech Index (the “Index”). Investing involves risk, including the possible loss of principal. The fund is new with limited operating history. Shares of any ETF are bought and sold at market price (not NAV), may trade at a discount or premium to NAV and are not individually redeemed from the Fund. Brokerage commissions will reduce returns. Narrowly focused investments typically exhibit higher volatility. Video Game Tech Companies face intense competition, both domestically and internationally, may have limited product lines, markets, financial resources or personnel, may have products that face rapid obsolescence, and are heavily dependent on the protection of patent and intellectual property rights. Video Game Tech Companies are also subject to increasing regulatory constraints, particularly with respect to cybersecurity and privacy. Such factors may adversely affect the profitability and value of such companies. Investments in foreign securities involve political, economic and currency risks, greater volatility and differences in accounting methods. The Fund is non-diversified, meaning it may concentrate its assets in fewer individual holdings than a diversified fund. Investments in smaller companies tend to have limited liquidity and greater price volatility than large-capitalization companies. The Fund’s return may not match or achieve a high degree of correlation with the return of the EEFund Video Game Tech Index. To the extent the Fund utilizes a sampling approach, it may experience tracking error to a greater extent than if the Fund had sought to replicate the Index. Diversification does not guarantee a profit, nor does it protect against a loss in a declining market. The EEFund Video Game Tech™ Index provides a benchmark for investors interested in tracking companies actively involved in the electronic gaming industry including the entertainment, education and simulation segments. The Index uses a market capitalization weighted allocation across the pure play and non-pure play sectors and a set weight for the conglomerate sector as well as an equal weighted allocation methodology for all components within each sector allocation. The index was created and is maintained by EEFund Management. You cannot invest directly in an index.
17
ETFMG™ ETFs
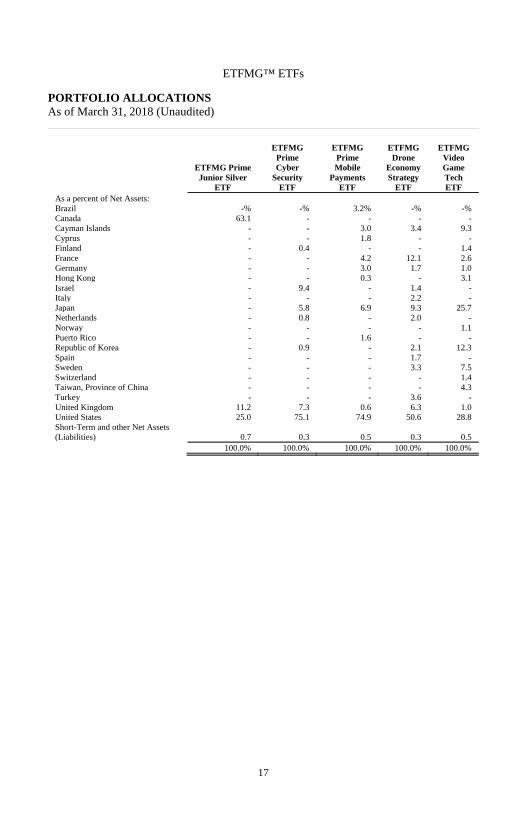
PORTFOLIO ALLOCATIONS As of March 31, 2018 (Unaudited)
ETFMG Prime Junior Silver
ETF
ETFMG Prime Cyber
Security ETF
ETFMG Prime Mobile
Payments ETF
ETFMG Drone
Economy Strategy
ETF
ETFMG Video Game Tech ETF
As a percent of Net Assets: Brazil -% -% 3.2% -% -%Canada 63.1 - - - -Cayman Islands - - 3.0 3.4 9.3Cyprus - - 1.8 - -Finland - 0.4 - - 1.4France - - 4.2 12.1 2.6Germany - - 3.0 1.7 1.0Hong Kong - - 0.3 - 3.1Israel - 9.4 - 1.4 -Italy - - - 2.2 -Japan - 5.8 6.9 9.3 25.7Netherlands - 0.8 - 2.0 -Norway - - - - 1.1Puerto Rico - - 1.6 - -Republic of Korea - 0.9 - 2.1 12.3Spain - - - 1.7 -Sweden - - - 3.3 7.5Switzerland - - - - 1.4Taiwan, Province of China - - - - 4.3Turkey - - - 3.6 -United Kingdom 11.2 7.3 0.6 6.3 1.0United States 25.0 75.1 74.9 50.6 28.8Short-Term and other Net Assets (Liabilities) 0.7 0.3 0.5 0.3 0.5
100.0% 100.0% 100.0% 100.0% 100.0%
18
ETFMG™ ETFs
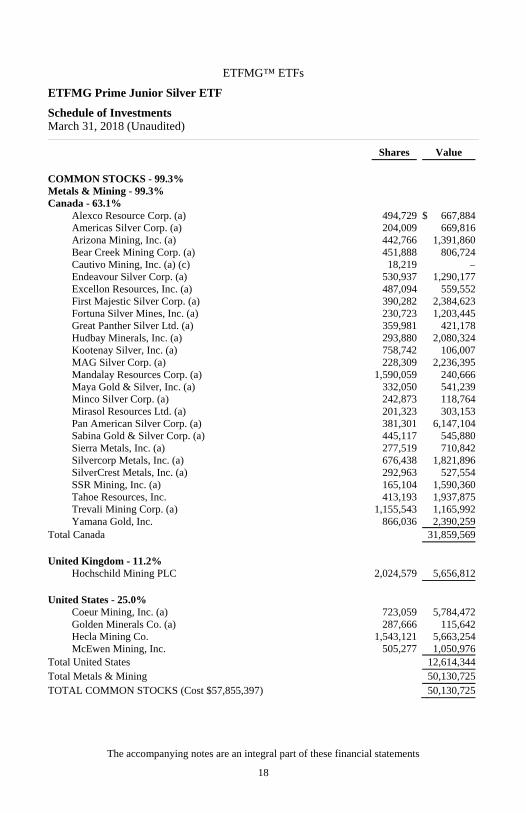
ETFMG Prime Junior Silver ETF
Schedule of Investments March 31, 2018 (Unaudited)
Shares Value COMMON STOCKS - 99.3%Metals & Mining - 99.3%Canada - 63.1%
Alexco Resource Corp. (a) 494,729 $ 667,884Americas Silver Corp. (a) 204,009 669,816Arizona Mining, Inc. (a) 442,766 1,391,860Bear Creek Mining Corp. (a) 451,888 806,724Cautivo Mining, Inc. (a) (c) 18,219 –Endeavour Silver Corp. (a) 530,937 1,290,177Excellon Resources, Inc. (a) 487,094 559,552First Majestic Silver Corp. (a) 390,282 2,384,623Fortuna Silver Mines, Inc. (a) 230,723 1,203,445Great Panther Silver Ltd. (a) 359,981 421,178Hudbay Minerals, Inc. (a) 293,880 2,080,324Kootenay Silver, Inc. (a) 758,742 106,007MAG Silver Corp. (a) 228,309 2,236,395Mandalay Resources Corp. (a) 1,590,059 240,666Maya Gold & Silver, Inc. (a) 332,050 541,239Minco Silver Corp. (a) 242,873 118,764Mirasol Resources Ltd. (a) 201,323 303,153Pan American Silver Corp. (a) 381,301 6,147,104Sabina Gold & Silver Corp. (a) 445,117 545,880Sierra Metals, Inc. (a) 277,519 710,842Silvercorp Metals, Inc. (a) 676,438 1,821,896SilverCrest Metals, Inc. (a) 292,963 527,554SSR Mining, Inc. (a) 165,104 1,590,360Tahoe Resources, Inc. 413,193 1,937,875Trevali Mining Corp. (a) 1,155,543 1,165,992Yamana Gold, Inc. 866,036 2,390,259
Total Canada 31,859,569 United Kingdom - 11.2%
Hochschild Mining PLC 2,024,579 5,656,812 United States - 25.0%
Coeur Mining, Inc. (a) 723,059 5,784,472Golden Minerals Co. (a) 287,666 115,642Hecla Mining Co. 1,543,121 5,663,254McEwen Mining, Inc. 505,277 1,050,976
Total United States 12,614,344Total Metals & Mining 50,130,725TOTAL COMMON STOCKS (Cost $57,855,397) 50,130,725
The accompanying notes are an integral part of these financial statements
19
ETFMG™ ETFs
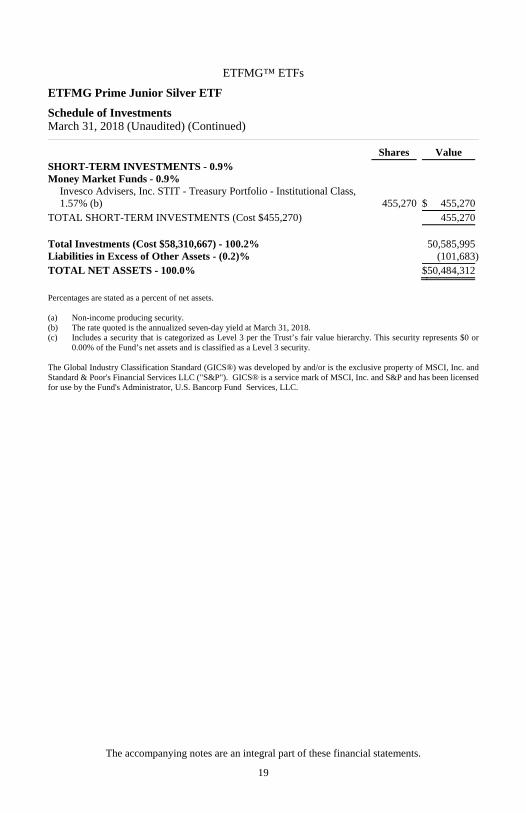
ETFMG Prime Junior Silver ETF
Schedule of Investments March 31, 2018 (Unaudited) (Continued)
Shares Value SHORT-TERM INVESTMENTS - 0.9%Money Market Funds - 0.9%
Invesco Advisers, Inc. STIT - Treasury Portfolio - Institutional Class, 1.57% (b) 455,270 $ 455,270
TOTAL SHORT-TERM INVESTMENTS (Cost $455,270) 455,270 Total Investments (Cost $58,310,667) - 100.2% 50,585,995Liabilities in Excess of Other Assets - (0.2)% (101,683)TOTAL NET ASSETS - 100.0% $50,484,312
Percentages are stated as a percent of net assets. (a) Non-income producing security. (b) The rate quoted is the annualized seven-day yield at March 31, 2018. (c) Includes a security that is categorized as Level 3 per the Trust’s fair value hierarchy. This security represents $0 or
0.00% of the Fund’s net assets and is classified as a Level 3 security. The Global Industry Classification Standard (GICS®) was developed by and/or is the exclusive property of MSCI, Inc. and Standard & Poor's Financial Services LLC ("S&P"). GICS® is a service mark of MSCI, Inc. and S&P and has been licensed for use by the Fund's Administrator, U.S. Bancorp Fund Services, LLC.
The accompanying notes are an integral part of these financial statements.
20
ETFMG™ ETFs
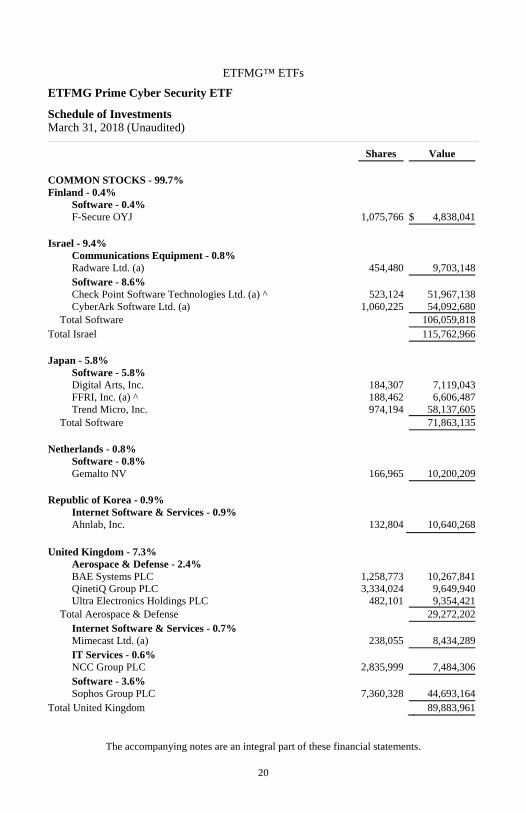
ETFMG Prime Cyber Security ETF
Schedule of Investments March 31, 2018 (Unaudited)
Shares Value COMMON STOCKS - 99.7%Finland - 0.4%
Software - 0.4% F-Secure OYJ 1,075,766 $ 4,838,041
Israel - 9.4%
Communications Equipment - 0.8%Radware Ltd. (a) 454,480 9,703,148Software - 8.6% Check Point Software Technologies Ltd. (a) ^ 523,124 51,967,138CyberArk Software Ltd. (a) 1,060,225 54,092,680
Total Software 106,059,818Total Israel 115,762,966 Japan - 5.8%
Software - 5.8% Digital Arts, Inc. 184,307 7,119,043FFRI, Inc. (a) ^ 188,462 6,606,487Trend Micro, Inc. 974,194 58,137,605
Total Software 71,863,135 Netherlands - 0.8%
Software - 0.8% Gemalto NV 166,965 10,200,209
Republic of Korea - 0.9%
Internet Software & Services - 0.9%Ahnlab, Inc. 132,804 10,640,268
United Kingdom - 7.3%
Aerospace & Defense - 2.4%BAE Systems PLC 1,258,773 10,267,841QinetiQ Group PLC 3,334,024 9,649,940Ultra Electronics Holdings PLC 482,101 9,354,421
Total Aerospace & Defense 29,272,202Internet Software & Services - 0.7%Mimecast Ltd. (a) 238,055 8,434,289IT Services - 0.6% NCC Group PLC 2,835,999 7,484,306Software - 3.6% Sophos Group PLC 7,360,328 44,693,164
Total United Kingdom 89,883,961
The accompanying notes are an integral part of these financial statements.
21
ETFMG™ ETFs
ETFMG Prime Cyber Security ETF
Schedule of Investments March 31, 2018 (Unaudited) (Continued)
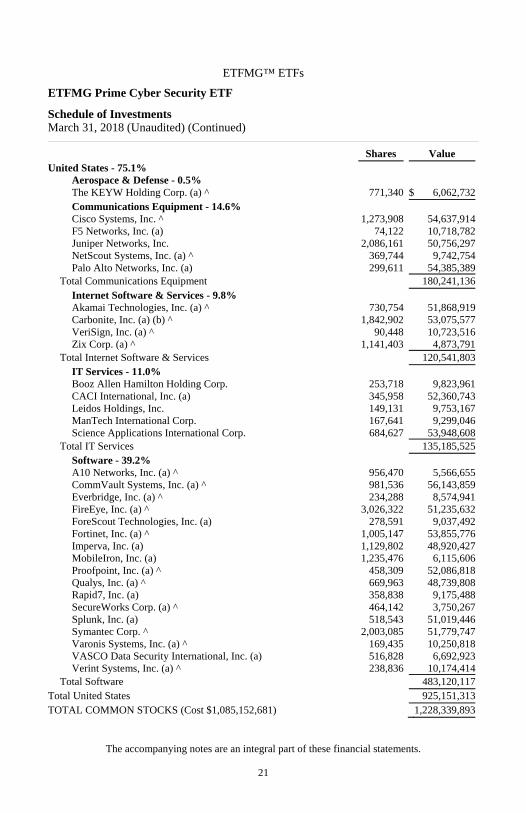
Shares Value United States - 75.1%
Aerospace & Defense - 0.5%The KEYW Holding Corp. (a) ^ 771,340 $ 6,062,732Communications Equipment - 14.6%Cisco Systems, Inc. ^ 1,273,908 54,637,914F5 Networks, Inc. (a) 74,122 10,718,782Juniper Networks, Inc. 2,086,161 50,756,297NetScout Systems, Inc. (a) ^ 369,744 9,742,754Palo Alto Networks, Inc. (a) 299,611 54,385,389
Total Communications Equipment 180,241,136Internet Software & Services - 9.8%Akamai Technologies, Inc. (a) ^ 730,754 51,868,919Carbonite, Inc. (a) (b) ^ 1,842,902 53,075,577VeriSign, Inc. (a) ^ 90,448 10,723,516Zix Corp. (a) ^ 1,141,403 4,873,791
Total Internet Software & Services 120,541,803IT Services - 11.0% Booz Allen Hamilton Holding Corp. 253,718 9,823,961CACI International, Inc. (a) 345,958 52,360,743Leidos Holdings, Inc. 149,131 9,753,167ManTech International Corp. 167,641 9,299,046Science Applications International Corp. 684,627 53,948,608
Total IT Services 135,185,525Software - 39.2% A10 Networks, Inc. (a) ^ 956,470 5,566,655CommVault Systems, Inc. (a) ^ 981,536 56,143,859Everbridge, Inc. (a) ^ 234,288 8,574,941FireEye, Inc. (a) ^ 3,026,322 51,235,632ForeScout Technologies, Inc. (a) 278,591 9,037,492Fortinet, Inc. (a) ^ 1,005,147 53,855,776Imperva, Inc. (a) 1,129,802 48,920,427MobileIron, Inc. (a) 1,235,476 6,115,606Proofpoint, Inc. (a) ^ 458,309 52,086,818Qualys, Inc. (a) ^ 669,963 48,739,808Rapid7, Inc. (a) 358,838 9,175,488SecureWorks Corp. (a) ^ 464,142 3,750,267Splunk, Inc. (a) 518,543 51,019,446Symantec Corp. ^ 2,003,085 51,779,747Varonis Systems, Inc. (a) ^ 169,435 10,250,818VASCO Data Security International, Inc. (a) 516,828 6,692,923Verint Systems, Inc. (a) ^ 238,836 10,174,414
Total Software 483,120,117Total United States 925,151,313TOTAL COMMON STOCKS (Cost $1,085,152,681) 1,228,339,893
The accompanying notes are an integral part of these financial statements.
22
ETFMG™ ETFs
ETFMG Prime Cyber Security ETF
Schedule of Investments March 31, 2018 (Unaudited) (Continued)
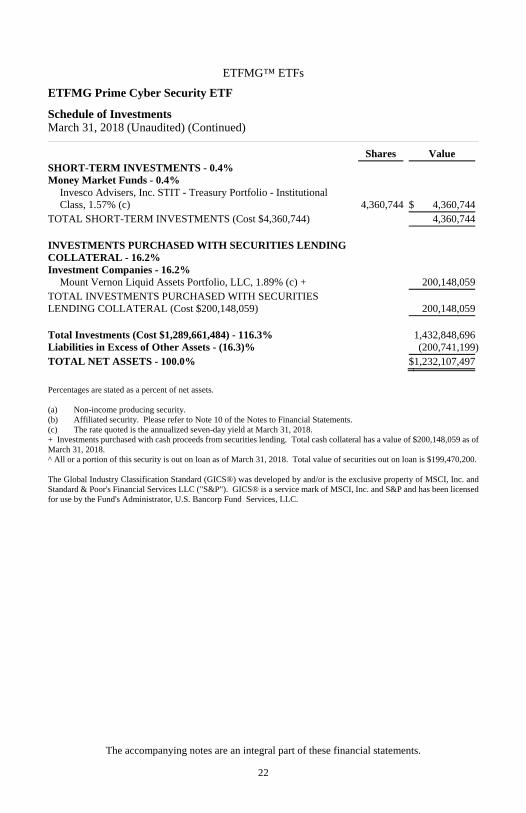
Shares Value SHORT-TERM INVESTMENTS - 0.4%Money Market Funds - 0.4%
Invesco Advisers, Inc. STIT - Treasury Portfolio - Institutional Class, 1.57% (c) 4,360,744 $ 4,360,744
TOTAL SHORT-TERM INVESTMENTS (Cost $4,360,744) 4,360,744 INVESTMENTS PURCHASED WITH SECURITIES LENDING COLLATERAL - 16.2% Investment Companies - 16.2%
Mount Vernon Liquid Assets Portfolio, LLC, 1.89% (c) + 200,148,059TOTAL INVESTMENTS PURCHASED WITH SECURITIES LENDING COLLATERAL (Cost $200,148,059) 200,148,059 Total Investments (Cost $1,289,661,484) - 116.3% 1,432,848,696Liabilities in Excess of Other Assets - (16.3)% (200,741,199)TOTAL NET ASSETS - 100.0% $1,232,107,497
Percentages are stated as a percent of net assets. (a) Non-income producing security. (b) Affiliated security. Please refer to Note 10 of the Notes to Financial Statements. (c) The rate quoted is the annualized seven-day yield at March 31, 2018. + Investments purchased with cash proceeds from securities lending. Total cash collateral has a value of $200,148,059 as of March 31, 2018. ^ All or a portion of this security is out on loan as of March 31, 2018. Total value of securities out on loan is $199,470,200. The Global Industry Classification Standard (GICS®) was developed by and/or is the exclusive property of MSCI, Inc. and Standard & Poor's Financial Services LLC ("S&P"). GICS® is a service mark of MSCI, Inc. and S&P and has been licensed for use by the Fund's Administrator, U.S. Bancorp Fund Services, LLC.
The accompanying notes are an integral part of these financial statements.
23
ETFMG™ ETFs
ETFMG Prime Mobile Payments ETF
Schedule of Investments March 31, 2018 (Unaudited)
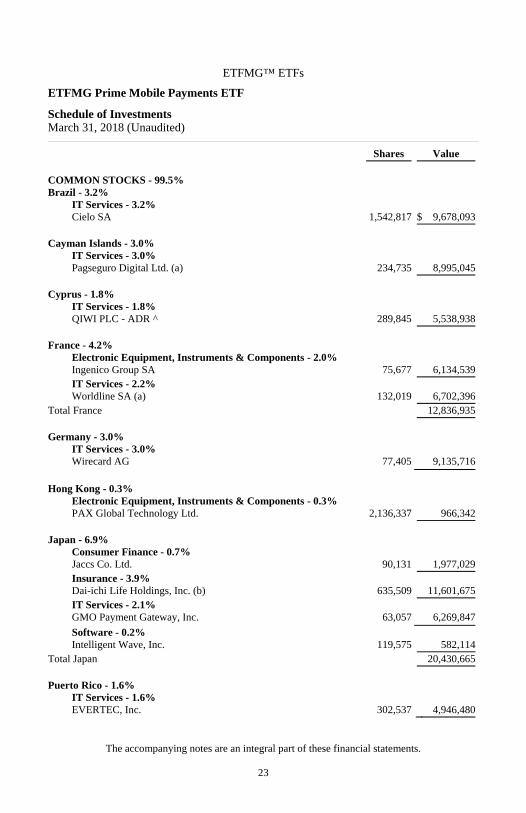
Shares Value COMMON STOCKS - 99.5%Brazil - 3.2%
IT Services - 3.2% Cielo SA 1,542,817 $ 9,678,093
Cayman Islands - 3.0%
IT Services - 3.0% Pagseguro Digital Ltd. (a) 234,735 8,995,045
Cyprus - 1.8%
IT Services - 1.8% QIWI PLC - ADR ^ 289,845 5,538,938
France - 4.2%
Electronic Equipment, Instruments & Components - 2.0%Ingenico Group SA 75,677 6,134,539IT Services - 2.2% Worldline SA (a) 132,019 6,702,396
Total France 12,836,935 Germany - 3.0%
IT Services - 3.0% Wirecard AG 77,405 9,135,716
Hong Kong - 0.3%
Electronic Equipment, Instruments & Components - 0.3%PAX Global Technology Ltd. 2,136,337 966,342
Japan - 6.9%
Consumer Finance - 0.7%Jaccs Co. Ltd. 90,131 1,977,029Insurance - 3.9% Dai-ichi Life Holdings, Inc. (b) 635,509 11,601,675IT Services - 2.1% GMO Payment Gateway, Inc. 63,057 6,269,847
Software - 0.2% Intelligent Wave, Inc. 119,575 582,114
Total Japan 20,430,665 Puerto Rico - 1.6%
IT Services - 1.6% EVERTEC, Inc. 302,537 4,946,480
The accompanying notes are an integral part of these financial statements.
24
ETFMG™ ETFs
ETFMG Prime Mobile Payments ETF
Schedule of Investments March 31, 2018 (Unaudited) (Continued)
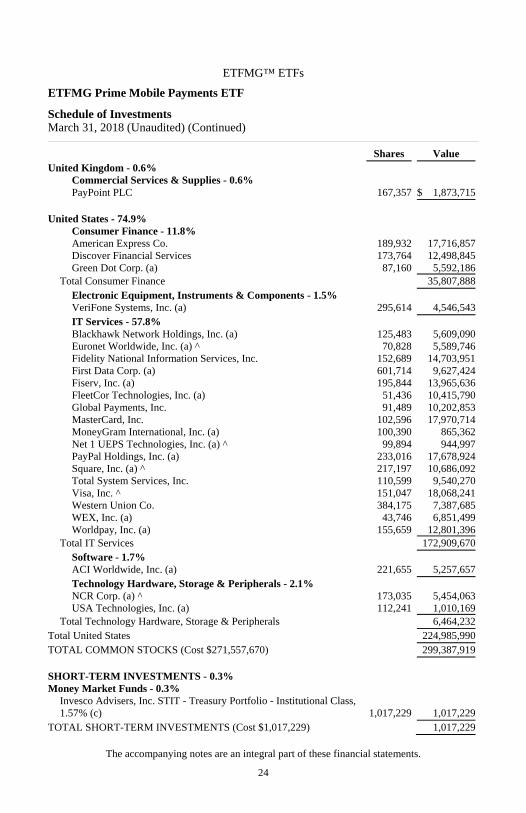
Shares Value United Kingdom - 0.6%
Commercial Services & Supplies - 0.6%PayPoint PLC 167,357 $ 1,873,715
United States - 74.9%
Consumer Finance - 11.8%American Express Co. 189,932 17,716,857Discover Financial Services 173,764 12,498,845Green Dot Corp. (a) 87,160 5,592,186
Total Consumer Finance 35,807,888Electronic Equipment, Instruments & Components - 1.5%VeriFone Systems, Inc. (a) 295,614 4,546,543IT Services - 57.8% Blackhawk Network Holdings, Inc. (a) 125,483 5,609,090Euronet Worldwide, Inc. (a) ^ 70,828 5,589,746Fidelity National Information Services, Inc. 152,689 14,703,951First Data Corp. (a) 601,714 9,627,424Fiserv, Inc. (a) 195,844 13,965,636FleetCor Technologies, Inc. (a) 51,436 10,415,790Global Payments, Inc. 91,489 10,202,853MasterCard, Inc. 102,596 17,970,714MoneyGram International, Inc. (a) 100,390 865,362Net 1 UEPS Technologies, Inc. (a) ^ 99,894 944,997PayPal Holdings, Inc. (a) 233,016 17,678,924Square, Inc. (a) ^ 217,197 10,686,092Total System Services, Inc. 110,599 9,540,270Visa, Inc. ^ 151,047 18,068,241Western Union Co. 384,175 7,387,685WEX, Inc. (a) 43,746 6,851,499Worldpay, Inc. (a) 155,659 12,801,396
Total IT Services 172,909,670Software - 1.7% ACI Worldwide, Inc. (a) 221,655 5,257,657Technology Hardware, Storage & Peripherals - 2.1% NCR Corp. (a) ^ 173,035 5,454,063USA Technologies, Inc. (a) 112,241 1,010,169
Total Technology Hardware, Storage & Peripherals 6,464,232Total United States 224,985,990TOTAL COMMON STOCKS (Cost $271,557,670) 299,387,919 SHORT-TERM INVESTMENTS - 0.3%Money Market Funds - 0.3%
Invesco Advisers, Inc. STIT - Treasury Portfolio - Institutional Class, 1.57% (c) 1,017,229 1,017,229
TOTAL SHORT-TERM INVESTMENTS (Cost $1,017,229) 1,017,229
The accompanying notes are an integral part of these financial statements.
25
ETFMG™ ETFs
ETFMG Prime Mobile Payments ETF
Schedule of Investments March 31, 2018 (Unaudited) (Continued)
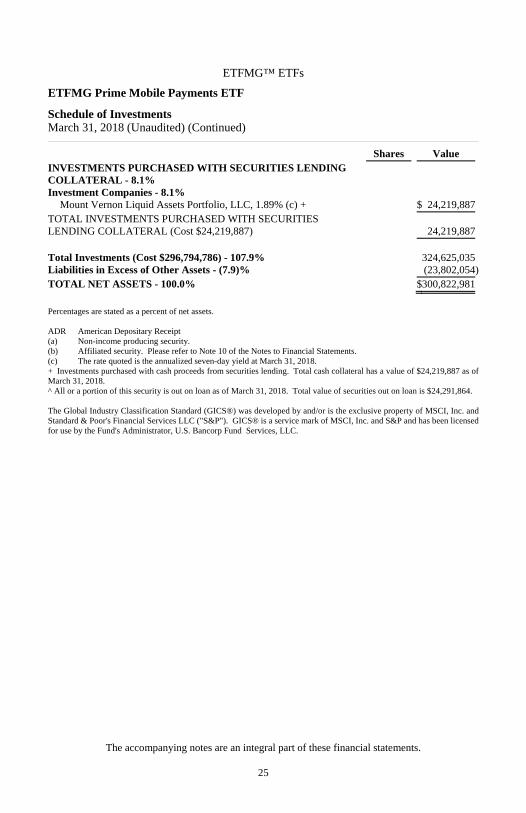
Shares Value INVESTMENTS PURCHASED WITH SECURITIES LENDING COLLATERAL - 8.1% Investment Companies - 8.1%
Mount Vernon Liquid Assets Portfolio, LLC, 1.89% (c) + $ 24,219,887TOTAL INVESTMENTS PURCHASED WITH SECURITIES LENDING COLLATERAL (Cost $24,219,887) 24,219,887 Total Investments (Cost $296,794,786) - 107.9% 324,625,035Liabilities in Excess of Other Assets - (7.9)% (23,802,054)TOTAL NET ASSETS - 100.0% $300,822,981
Percentages are stated as a percent of net assets. ADR American Depositary Receipt (a) Non-income producing security. (b) Affiliated security. Please refer to Note 10 of the Notes to Financial Statements. (c) The rate quoted is the annualized seven-day yield at March 31, 2018. + Investments purchased with cash proceeds from securities lending. Total cash collateral has a value of $24,219,887 as of March 31, 2018. ^ All or a portion of this security is out on loan as of March 31, 2018. Total value of securities out on loan is $24,291,864. The Global Industry Classification Standard (GICS®) was developed by and/or is the exclusive property of MSCI, Inc. and Standard & Poor's Financial Services LLC ("S&P"). GICS® is a service mark of MSCI, Inc. and S&P and has been licensed for use by the Fund's Administrator, U.S. Bancorp Fund Services, LLC.
The accompanying notes are an integral part of these financial statements.
26
ETFMG™ ETFs
ETFMG Drone Economy Strategy ETF
Schedule of Investments March 31, 2018 (Unaudited)
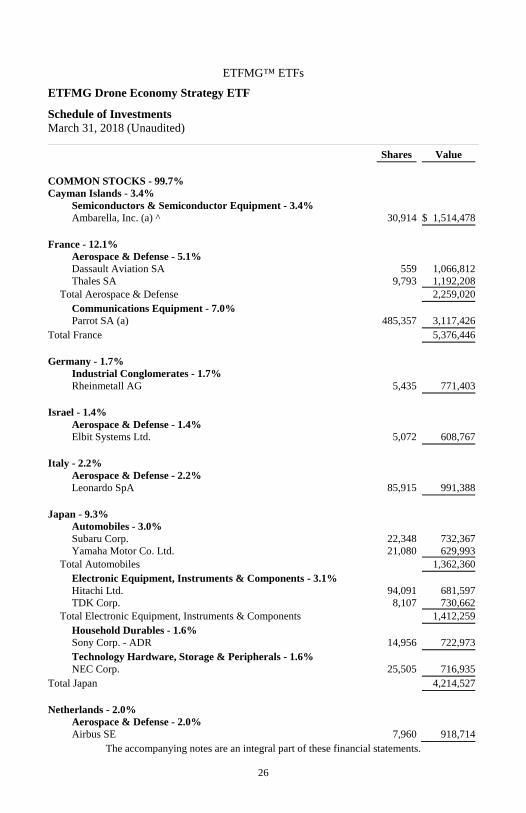
Shares Value COMMON STOCKS - 99.7%Cayman Islands - 3.4%
Semiconductors & Semiconductor Equipment - 3.4% Ambarella, Inc. (a) ^ 30,914 $ 1,514,478
France - 12.1%
Aerospace & Defense - 5.1%Dassault Aviation SA 559 1,066,812Thales SA 9,793 1,192,208
Total Aerospace & Defense 2,259,020Communications Equipment - 7.0%Parrot SA (a) 485,357 3,117,426
Total France 5,376,446 Germany - 1.7%
Industrial Conglomerates - 1.7%Rheinmetall AG 5,435 771,403
Israel - 1.4%
Aerospace & Defense - 1.4%Elbit Systems Ltd. 5,072 608,767
Italy - 2.2%
Aerospace & Defense - 2.2%Leonardo SpA 85,915 991,388
Japan - 9.3%
Automobiles - 3.0% Subaru Corp. 22,348 732,367Yamaha Motor Co. Ltd. 21,080 629,993
Total Automobiles 1,362,360Electronic Equipment, Instruments & Components - 3.1%Hitachi Ltd. 94,091 681,597TDK Corp. 8,107 730,662
Total Electronic Equipment, Instruments & Components 1,412,259Household Durables - 1.6%Sony Corp. - ADR 14,956 722,973Technology Hardware, Storage & Peripherals - 1.6% NEC Corp. 25,505 716,935
Total Japan 4,214,527 Netherlands - 2.0%
Aerospace & Defense - 2.0%Airbus SE 7,960 918,714
The accompanying notes are an integral part of these financial statements.
27
ETFMG™ ETFs
ETFMG Drone Economy Strategy ETF
Schedule of Investments March 31, 2018 (Unaudited) (Continued)
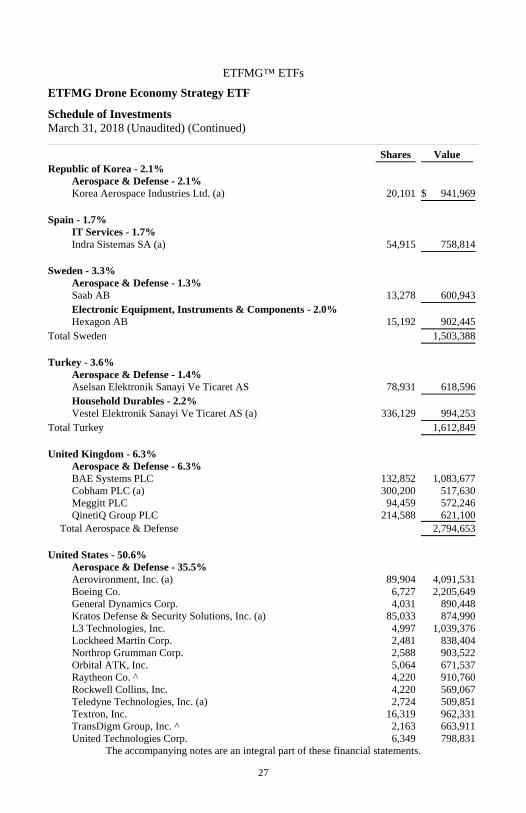
Shares Value Republic of Korea - 2.1%
Aerospace & Defense - 2.1%Korea Aerospace Industries Ltd. (a) 20,101 $ 941,969
Spain - 1.7%
IT Services - 1.7% Indra Sistemas SA (a) 54,915 758,814
Sweden - 3.3%
Aerospace & Defense - 1.3%Saab AB 13,278 600,943Electronic Equipment, Instruments & Components - 2.0%Hexagon AB 15,192 902,445
Total Sweden 1,503,388 Turkey - 3.6%
Aerospace & Defense - 1.4%Aselsan Elektronik Sanayi Ve Ticaret AS 78,931 618,596Household Durables - 2.2%Vestel Elektronik Sanayi Ve Ticaret AS (a) 336,129 994,253
Total Turkey 1,612,849 United Kingdom - 6.3%
Aerospace & Defense - 6.3%BAE Systems PLC 132,852 1,083,677Cobham PLC (a) 300,200 517,630Meggitt PLC 94,459 572,246QinetiQ Group PLC 214,588 621,100
Total Aerospace & Defense 2,794,653 United States - 50.6%
Aerospace & Defense - 35.5%Aerovironment, Inc. (a) 89,904 4,091,531Boeing Co. 6,727 2,205,649General Dynamics Corp. 4,031 890,448Kratos Defense & Security Solutions, Inc. (a) 85,033 874,990L3 Technologies, Inc. 4,997 1,039,376Lockheed Martin Corp. 2,481 838,404Northrop Grumman Corp. 2,588 903,522Orbital ATK, Inc. 5,064 671,537Raytheon Co. ^ 4,220 910,760Rockwell Collins, Inc. 4,220 569,067Teledyne Technologies, Inc. (a) 2,724 509,851Textron, Inc. 16,319 962,331TransDigm Group, Inc. ^ 2,163 663,911United Technologies Corp. 6,349 798,831
The accompanying notes are an integral part of these financial statements.

28
ETFMG™ ETFs
ETFMG Drone Economy Strategy ETF
Schedule of Investments March 31, 2018 (Unaudited) (Continued)
Shares Value
Total Aerospace & Defense 15,930,208Electronic Equipment, Instruments & Components - 5.7%FLIR Systems, Inc. 9,946 $ 497,399Jabil, Inc. ^ 27,627 793,724Littelfuse, Inc. 3,438 715,723Trimble, Inc. (a) 15,591 559,405
Total Electronic Equipment, Instruments & Components 2,566,251Household Durables - 2.4%GoPro, Inc. (a) ^ 221,174 1,059,424Industrial Conglomerates - 2.0%Honeywell International, Inc. 6,244 902,321Semiconductors & Semiconductor Equipment - 5.0% Intel Corp. ^ 15,731 819,270NVIDIA Corp. ^ 3,658 847,156QUALCOMM, Inc. 10,793 598,040
Total Semiconductors & Semiconductor Equipment 2,264,466Total United States 22,722,670TOTAL COMMON STOCKS (Cost $44,574,828) 44,730,066 SHORT-TERM INVESTMENTS - 0.3%Money Market Funds - 0.3%
Invesco Advisers, Inc. STIT - Treasury Portfolio - Institutional Class, 1.57% (b) 125,376 125,376
TOTAL SHORT-TERM INVESTMENTS (Cost $125,376) 125,376 INVESTMENTS PURCHASED WITH SECURITIES LENDING COLLATERAL - 12.8% Investment Companies - 12.8%
Mount Vernon Liquid Assets Portfolio, LLC, 1.89% (b) + 5,763,924TOTAL INVESTMENTS PURCHASED WITH SECURITIES LENDING COLLATERAL (Cost $5,763,924) 5,763,924 Total Investments (Cost $50,464,128) - 112.8% 50,619,366Liabilities in Excess of Other Assets - (12.8)% (5,726,628)TOTAL NET ASSETS - 100.0% $ 44,892,738
Percentages are stated as a percent of net assets. ADR American Depositary Receipt (a) Non-income producing security. (b) The rate quoted is the annualized seven-day yield at March 31, 2018. + Investments purchased with cash proceeds from securities lending. Total cash collateral has a value of $5,763,924 as of March 31, 2018. ^ All or a portion of this security is out on loan as of March 31, 2018. Total value of securities out on loan is $5,694,006. The Global Industry Classification Standard (GICS®) was developed by and/or is the exclusive property of MSCI, Inc. and Standard & Poor's Financial Services LLC ("S&P"). GICS® is a service mark of MSCI, Inc. and S&P and has been licensed for use by the Fund's Administrator, U.S. Bancorp Fund Services, LLC.
The accompanying notes are an integral part of these financial statements.
29
ETFMG™ ETFs
ETFMG Video Game Tech ETF
Schedule of Investments March 31, 2018 (Unaudited)
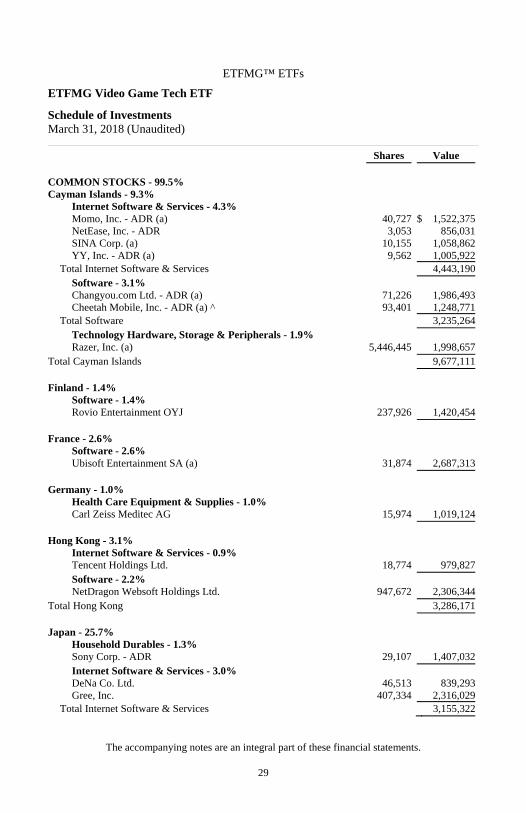
Shares Value COMMON STOCKS - 99.5%Cayman Islands - 9.3%
Internet Software & Services - 4.3%Momo, Inc. - ADR (a) 40,727 $ 1,522,375NetEase, Inc. - ADR 3,053 856,031SINA Corp. (a) 10,155 1,058,862YY, Inc. - ADR (a) 9,562 1,005,922
Total Internet Software & Services 4,443,190Software - 3.1% Changyou.com Ltd. - ADR (a) 71,226 1,986,493Cheetah Mobile, Inc. - ADR (a) ^ 93,401 1,248,771
Total Software 3,235,264Technology Hardware, Storage & Peripherals - 1.9% Razer, Inc. (a) 5,446,445 1,998,657
Total Cayman Islands 9,677,111 Finland - 1.4%
Software - 1.4% Rovio Entertainment OYJ 237,926 1,420,454
France - 2.6%
Software - 2.6% Ubisoft Entertainment SA (a) 31,874 2,687,313
Germany - 1.0%
Health Care Equipment & Supplies - 1.0%Carl Zeiss Meditec AG 15,974 1,019,124
Hong Kong - 3.1%
Internet Software & Services - 0.9%Tencent Holdings Ltd. 18,774 979,827Software - 2.2% NetDragon Websoft Holdings Ltd. 947,672 2,306,344
Total Hong Kong 3,286,171 Japan - 25.7%
Household Durables - 1.3%Sony Corp. - ADR 29,107 1,407,032Internet Software & Services - 3.0%DeNa Co. Ltd. 46,513 839,293Gree, Inc. 407,334 2,316,029
Total Internet Software & Services 3,155,322
The accompanying notes are an integral part of these financial statements.

30
ETFMG™ ETFs
ETFMG Video Game Tech ETF
Schedule of Investments March 31, 2018 (Unaudited) (Continued)
Shares Value
Leisure Products - 2.2%Bandai Namco Holdings, Inc. 30,169 $ 990,937Sega Sammy Holdings, Inc. 80,539 1,275,393
Total Leisure Products 2,266,330Software - 19.2% Capcom Co. Ltd. 170,066 3,674,468Gumi, Inc. (a) ^ 289,085 2,917,883GungHo Online Entertainment, Inc. ^ 387,709 1,319,023Koei Tecmo Holdings Co. Ltd. 50,307 982,453Konami Holdings Corp. 47,431 2,491,794NEXON CO Ltd. (a) 174,216 2,881,633Nintendo Co. Ltd. 7,355 3,239,089Square Enix Holdings Co. Ltd. 54,807 2,508,436
Total Software 20,014,779Total Japan 26,843,463 Norway - 1.1%
Semiconductors & Semiconductor Equipment - 1.1% Nordic Semiconductor ASA (a) 199,626 1,188,007
Republic of Korea - 12.3%
Software - 12.3% Gravity Co. Ltd. - ADR (a) ^ 35,142 2,990,584NCSoft Corp. 5,655 2,228,258Neowiz (a) 146,694 2,731,847Netmarble Games Corp. 15,325 2,199,761Webzen, Inc. (a) 90,778 2,699,749
Total Software 12,850,199 Sweden - 7.5%
Software - 7.5% G5 Entertainment AB 86,739 3,170,465Paradox Interactive AB 52,422 788,546Starbreeze AB (a) 1,877,959 2,146,772THQ Nordic AB (a) 93,787 1,594,979
Total Software 7,700,762 Switzerland - 1.4%
Technology Hardware, Storage & Peripherals - 1.4% Logitech International SA 40,732 1,496,086
Taiwan, Province of China - 4.3%
Technology Hardware, Storage & Peripherals - 4.3% Asustek Computer, Inc. 113,621 1,069,691Micro-Star International Co. Ltd. 1,021,912 3,350,646
Total Technology Hardware, Storage & Peripherals 4,420,337The accompanying notes are an integral part of these financial statements.
31
ETFMG™ ETFs
ETFMG Video Game Tech ETF
Schedule of Investments March 31, 2018 (Unaudited) (Continued)
Shares Value United Kingdom - 1.0%
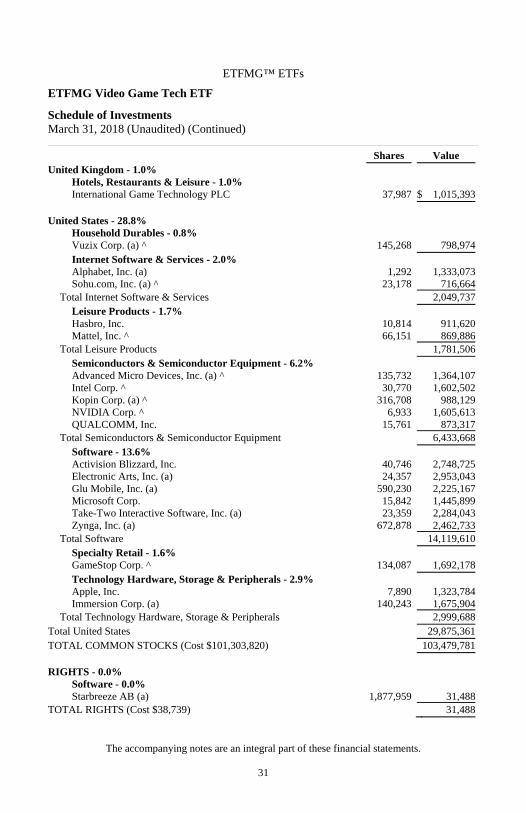
Hotels, Restaurants & Leisure - 1.0%International Game Technology PLC 37,987 $ 1,015,393
United States - 28.8%
Household Durables - 0.8%Vuzix Corp. (a) ^ 145,268 798,974Internet Software & Services - 2.0%Alphabet, Inc. (a) 1,292 1,333,073Sohu.com, Inc. (a) ^ 23,178 716,664
Total Internet Software & Services 2,049,737Leisure Products - 1.7%Hasbro, Inc. 10,814 911,620Mattel, Inc. ^ 66,151 869,886
Total Leisure Products 1,781,506Semiconductors & Semiconductor Equipment - 6.2% Advanced Micro Devices, Inc. (a) ^ 135,732 1,364,107Intel Corp. ^ 30,770 1,602,502Kopin Corp. (a) ^ 316,708 988,129NVIDIA Corp. ^ 6,933 1,605,613QUALCOMM, Inc. 15,761 873,317
Total Semiconductors & Semiconductor Equipment 6,433,668Software - 13.6% Activision Blizzard, Inc. 40,746 2,748,725Electronic Arts, Inc. (a) 24,357 2,953,043Glu Mobile, Inc. (a) 590,230 2,225,167Microsoft Corp. 15,842 1,445,899Take-Two Interactive Software, Inc. (a) 23,359 2,284,043Zynga, Inc. (a) 672,878 2,462,733
Total Software 14,119,610Specialty Retail - 1.6%GameStop Corp. ^ 134,087 1,692,178Technology Hardware, Storage & Peripherals - 2.9% Apple, Inc. 7,890 1,323,784Immersion Corp. (a) 140,243 1,675,904
Total Technology Hardware, Storage & Peripherals 2,999,688Total United States 29,875,361TOTAL COMMON STOCKS (Cost $101,303,820) 103,479,781 RIGHTS - 0.0%
Software - 0.0% Starbreeze AB (a) 1,877,959 31,488
TOTAL RIGHTS (Cost $38,739) 31,488
The accompanying notes are an integral part of these financial statements.
32
ETFMG™ ETFs
ETFMG Video Game Tech ETF
Schedule of Investments March 31, 2018 (Unaudited) (Continued)
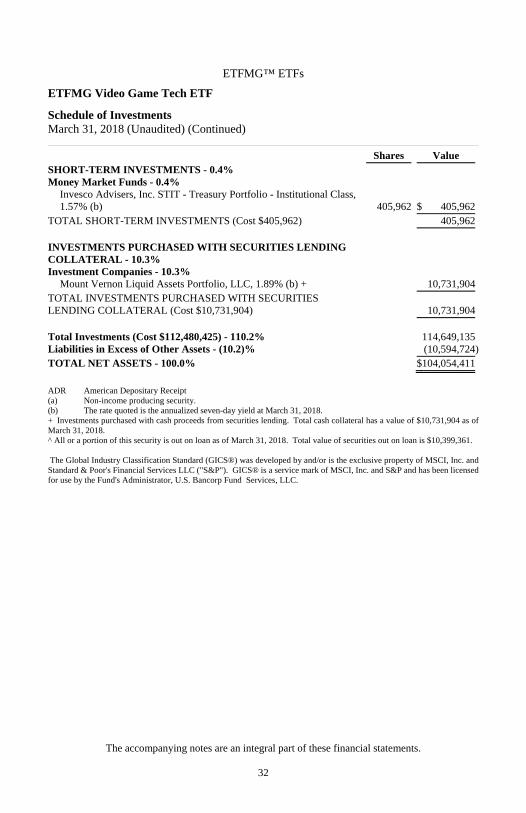
Shares Value SHORT-TERM INVESTMENTS - 0.4%Money Market Funds - 0.4%
Invesco Advisers, Inc. STIT - Treasury Portfolio - Institutional Class, 1.57% (b) 405,962 $ 405,962
TOTAL SHORT-TERM INVESTMENTS (Cost $405,962) 405,962 INVESTMENTS PURCHASED WITH SECURITIES LENDING COLLATERAL - 10.3% Investment Companies - 10.3%
Mount Vernon Liquid Assets Portfolio, LLC, 1.89% (b) + 10,731,904TOTAL INVESTMENTS PURCHASED WITH SECURITIES LENDING COLLATERAL (Cost $10,731,904) 10,731,904 Total Investments (Cost $112,480,425) - 110.2% 114,649,135Liabilities in Excess of Other Assets - (10.2)% (10,594,724)TOTAL NET ASSETS - 100.0% $104,054,411
ADR American Depositary Receipt (a) Non-income producing security. (b) The rate quoted is the annualized seven-day yield at March 31, 2018. + Investments purchased with cash proceeds from securities lending. Total cash collateral has a value of $10,731,904 as of March 31, 2018. ^ All or a portion of this security is out on loan as of March 31, 2018. Total value of securities out on loan is $10,399,361. The Global Industry Classification Standard (GICS®) was developed by and/or is the exclusive property of MSCI, Inc. and Standard & Poor's Financial Services LLC ("S&P"). GICS® is a service mark of MSCI, Inc. and S&P and has been licensed for use by the Fund's Administrator, U.S. Bancorp Fund Services, LLC.
The accompanying notes are an integral part of these financial statements.
33
ETFMG™ ETFs
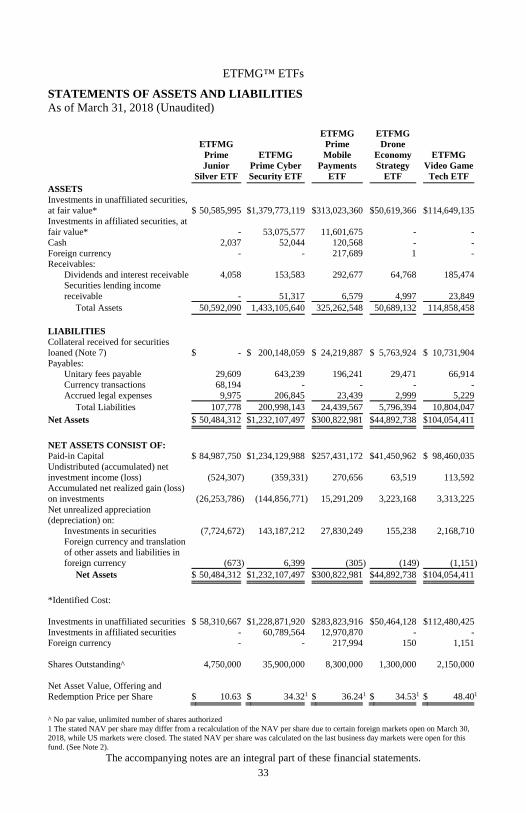
STATEMENTS OF ASSETS AND LIABILITIES As of March 31, 2018 (Unaudited)
ETFMG Prime Junior
Silver ETF
ETFMG Prime Cyber Security ETF
ETFMG Prime Mobile
Payments ETF
ETFMG Drone
Economy Strategy
ETF
ETFMG Video Game
Tech ETFASSETS Investments in unaffiliated securities, at fair value* $ 50,585,995 $1,379,773,119 $313,023,360 $50,619,366 $114,649,135Investments in affiliated securities, at fair value* - 53,075,577 11,601,675 - -Cash 2,037 52,044 120,568 - -Foreign currency - - 217,689 1 -Receivables:
Dividends and interest receivable 4,058 153,583 292,677 64,768 185,474Securities lending income receivable - 51,317 6,579 4,997 23,849
Total Assets 50,592,090 1,433,105,640 325,262,548 50,689,132 114,858,458 LIABILITIES Collateral received for securities loaned (Note 7) $ - $ 200,148,059 $ 24,219,887 $ 5,763,924 $ 10,731,904Payables:
Unitary fees payable 29,609 643,239 196,241 29,471 66,914Currency transactions 68,194 - - - -Accrued legal expenses 9,975 206,845 23,439 2,999 5,229
Total Liabilities 107,778 200,998,143 24,439,567 5,796,394 10,804,047Net Assets $ 50,484,312 $1,232,107,497 $300,822,981 $44,892,738 $104,054,411
NET ASSETS CONSIST OF: Paid-in Capital $ 84,987,750 $1,234,129,988 $257,431,172 $41,450,962 $ 98,460,035Undistributed (accumulated) net investment income (loss) (524,307) (359,331) 270,656 63,519 113,592Accumulated net realized gain (loss) on investments (26,253,786) (144,856,771) 15,291,209 3,223,168 3,313,225Net unrealized appreciation (depreciation) on:
Investments in securities (7,724,672) 143,187,212 27,830,249 155,238 2,168,710Foreign currency and translation of other assets and liabilities in foreign currency (673) 6,399 (305) (149) (1,151)
Net Assets $ 50,484,312 $1,232,107,497 $300,822,981 $44,892,738 $104,054,411
*Identified Cost: Investments in unaffiliated securities $ 58,310,667 $1,228,871,920 $283,823,916 $50,464,128 $112,480,425Investments in affiliated securities - 60,789,564 12,970,870 - -Foreign currency - - 217,994 150 1,151 Shares Outstanding^ 4,750,000 35,900,000 8,300,000 1,300,000 2,150,000 Net Asset Value, Offering and Redemption Price per Share $ 10.63 $ 34.321 $ 36.241 $ 34.531 $ 48.401
^ No par value, unlimited number of shares authorized 1 The stated NAV per share may differ from a recalculation of the NAV per share due to certain foreign markets open on March 30, 2018, while US markets were closed. The stated NAV per share was calculated on the last business day markets were open for this fund. (See Note 2).
The accompanying notes are an integral part of these financial statements.
34
ETFMG™ ETFs
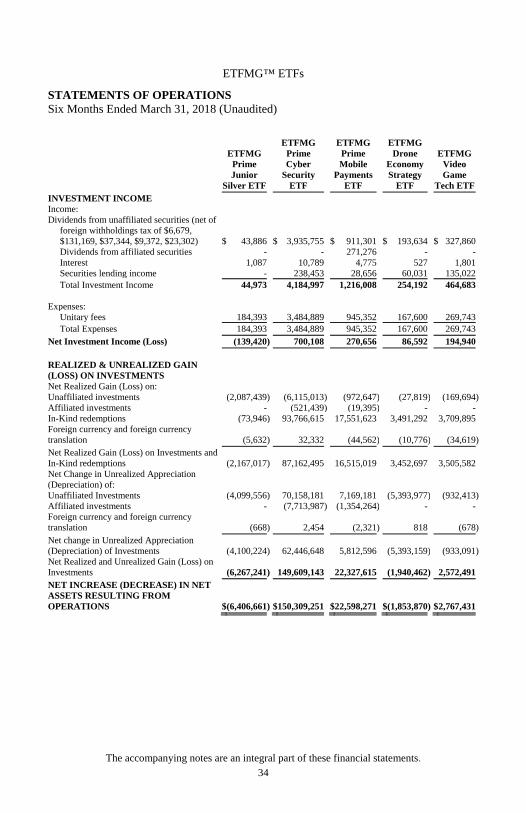
STATEMENTS OF OPERATIONS Six Months Ended March 31, 2018 (Unaudited)
ETFMG Prime Junior
Silver ETF
ETFMG Prime Cyber
Security ETF
ETFMG Prime Mobile
Payments ETF
ETFMG Drone
Economy Strategy
ETF
ETFMG Video Game
Tech ETFINVESTMENT INCOME Income: Dividends from unaffiliated securities (net of
foreign withholdings tax of $6,679, $131,169, $37,344, $9,372, $23,302) $ 43,886 $ 3,935,755 $ 911,301 $ 193,634 $ 327,860Dividends from affiliated securities - - 271,276 - -Interest 1,087 10,789 4,775 527 1,801Securities lending income - 238,453 28,656 60,031 135,022Total Investment Income 44,973 4,184,997 1,216,008 254,192 464,683
Expenses:
Unitary fees 184,393 3,484,889 945,352 167,600 269,743Total Expenses 184,393 3,484,889 945,352 167,600 269,743
Net Investment Income (Loss) (139,420) 700,108 270,656 86,592 194,940 REALIZED & UNREALIZED GAIN (LOSS) ON INVESTMENTS Net Realized Gain (Loss) on: Unaffiliated investments (2,087,439) (6,115,013 ) (972,647) (27,819) (169,694)Affiliated investments - (521,439 ) (19,395) - -In-Kind redemptions (73,946) 93,766,615 17,551,623 3,491,292 3,709,895Foreign currency and foreign currency translation (5,632) 32,332 (44,562) (10,776) (34,619)Net Realized Gain (Loss) on Investments and In-Kind redemptions (2,167,017) 87,162,495 16,515,019 3,452,697 3,505,582Net Change in Unrealized Appreciation (Depreciation) of: Unaffiliated Investments (4,099,556) 70,158,181 7,169,181 (5,393,977) (932,413)Affiliated investments - (7,713,987 ) (1,354,264) - -Foreign currency and foreign currency translation (668) 2,454 (2,321) 818 (678)Net change in Unrealized Appreciation (Depreciation) of Investments (4,100,224) 62,446,648 5,812,596 (5,393,159) (933,091)Net Realized and Unrealized Gain (Loss) on Investments (6,267,241) 149,609,143 22,327,615 (1,940,462) 2,572,491NET INCREASE (DECREASE) IN NET ASSETS RESULTING FROM OPERATIONS $(6,406,661) $150,309,251 $22,598,271 $(1,853,870) $2,767,431
The accompanying notes are an integral part of these financial statements.
35
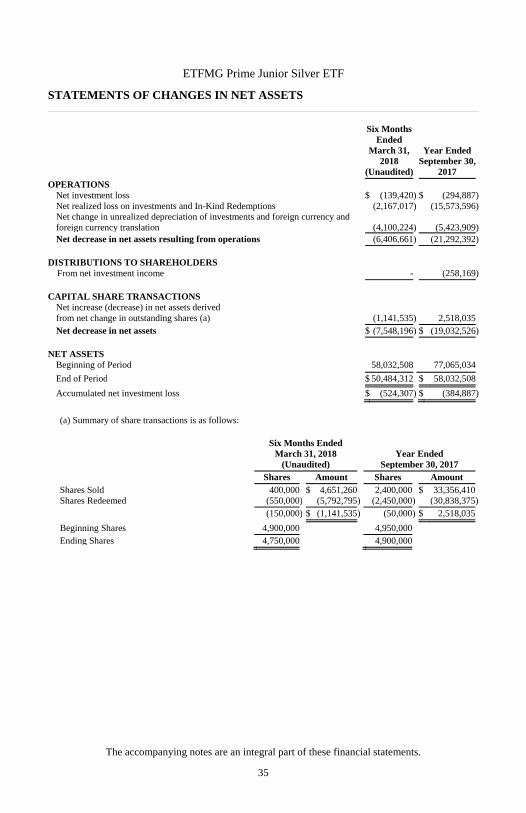
ETFMG Prime Junior Silver ETF
STATEMENTS OF CHANGES IN NET ASSETS
Six Months
Ended
March 31, 2018
(Unaudited)
Year Ended September 30,
2017OPERATIONS
Net investment loss $ (139,420) $ (294,887)Net realized loss on investments and In-Kind Redemptions (2,167,017) (15,573,596)Net change in unrealized depreciation of investments and foreign currency and foreign currency translation (4,100,224) (5,423,909)Net decrease in net assets resulting from operations (6,406,661) (21,292,392)
DISTRIBUTIONS TO SHAREHOLDERS From net investment income - (258,169) CAPITAL SHARE TRANSACTIONS
Net increase (decrease) in net assets derived from net change in outstanding shares (a) (1,141,535) 2,518,035Net decrease in net assets $ (7,548,196) $ (19,032,526)
NET ASSETS
Beginning of Period 58,032,508 77,065,034
End of Period $ 50,484,312 $ 58,032,508
Accumulated net investment loss $ (524,307) $ (384,887)
(a) Summary of share transactions is as follows:
Six Months Ended
March 31, 2018
(Unaudited)Year Ended
September 30, 2017 Shares Amount Shares Amount Shares Sold 400,000 $ 4,651,260 2,400,000 $ 33,356,410Shares Redeemed (550,000) (5,792,795) (2,450,000) (30,838,375) (150,000) $ (1,141,535) (50,000) $ 2,518,035
Beginning Shares 4,900,000 4,950,000Ending Shares 4,750,000 4,900,000
The accompanying notes are an integral part of these financial statements.
36
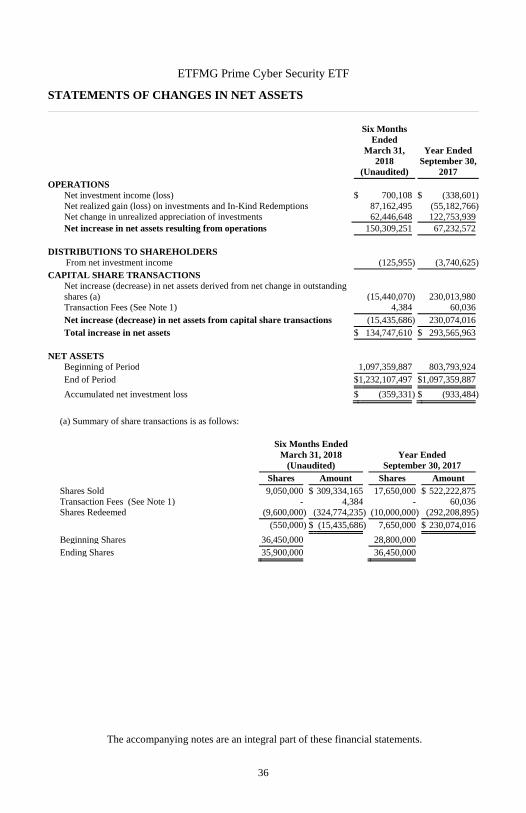
ETFMG Prime Cyber Security ETF
STATEMENTS OF CHANGES IN NET ASSETS
Six Months
Ended
March 31, 2018
(Unaudited)
Year Ended September 30,
2017OPERATIONS
Net investment income (loss) $ 700,108 $ (338,601)Net realized gain (loss) on investments and In-Kind Redemptions 87,162,495 (55,182,766)Net change in unrealized appreciation of investments 62,446,648 122,753,939Net increase in net assets resulting from operations 150,309,251 67,232,572
DISTRIBUTIONS TO SHAREHOLDERS
From net investment income (125,955) (3,740,625)CAPITAL SHARE TRANSACTIONS
Net increase (decrease) in net assets derived from net change in outstanding shares (a) (15,440,070) 230,013,980Transaction Fees (See Note 1) 4,384 60,036Net increase (decrease) in net assets from capital share transactions (15,435,686) 230,074,016Total increase in net assets $ 134,747,610 $ 293,565,963
NET ASSETS
Beginning of Period 1,097,359,887 803,793,924End of Period $1,232,107,497 $1,097,359,887
Accumulated net investment loss $ (359,331) $ (933,484)
(a) Summary of share transactions is as follows:
Six Months Ended
March 31, 2018
(Unaudited)Year Ended
September 30, 2017 Shares Amount Shares AmountShares Sold 9,050,000 $ 309,334,165 17,650,000 $ 522,222,875Transaction Fees (See Note 1) - 4,384 - 60,036Shares Redeemed (9,600,000) (324,774,235) (10,000,000) (292,208,895) (550,000) $ (15,435,686) 7,650,000 $ 230,074,016
Beginning Shares 36,450,000 28,800,000Ending Shares 35,900,000 36,450,000
The accompanying notes are an integral part of these financial statements.
37
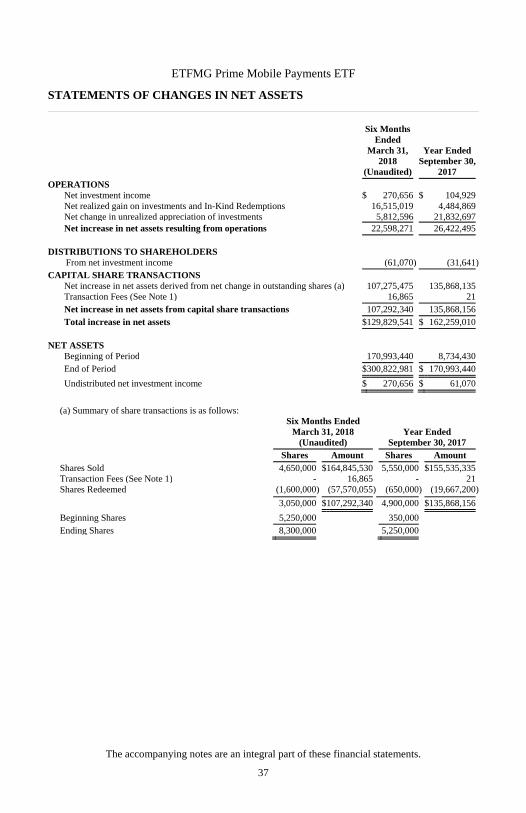
ETFMG Prime Mobile Payments ETF
STATEMENTS OF CHANGES IN NET ASSETS
Six Months
Ended
March 31, 2018
(Unaudited)
Year Ended September 30,
2017OPERATIONS
Net investment income $ 270,656 $ 104,929Net realized gain on investments and In-Kind Redemptions 16,515,019 4,484,869Net change in unrealized appreciation of investments 5,812,596 21,832,697Net increase in net assets resulting from operations 22,598,271 26,422,495
DISTRIBUTIONS TO SHAREHOLDERS
From net investment income (61,070) (31,641)CAPITAL SHARE TRANSACTIONS
Net increase in net assets derived from net change in outstanding shares (a) 107,275,475 135,868,135Transaction Fees (See Note 1) 16,865 21Net increase in net assets from capital share transactions 107,292,340 135,868,156Total increase in net assets $129,829,541 $ 162,259,010
NET ASSETS
Beginning of Period 170,993,440 8,734,430End of Period $300,822,981 $ 170,993,440
Undistributed net investment income $ 270,656 $ 61,070
(a) Summary of share transactions is as follows: Six Months Ended
March 31, 2018
(Unaudited)Year Ended
September 30, 2017 Shares Amount Shares Amount Shares Sold 4,650,000 $164,845,530 5,550,000 $155,535,335Transaction Fees (See Note 1) - 16,865 - 21Shares Redeemed (1,600,000) (57,570,055) (650,000) (19,667,200)
3,050,000 $107,292,340 4,900,000 $135,868,156
Beginning Shares 5,250,000 350,000Ending Shares 8,300,000 5,250,000
The accompanying notes are an integral part of these financial statements.

38
ETFMG Drone Economy Strategy ETF
STATEMENTS OF CHANGES IN NET ASSETS
Six Months
Ended March 31,
2018 (Unaudited)
Year Ended September 30,
2017OPERATIONS
Net investment income $ 86,592 $ 120,642Net realized gain on investments and In-Kind Redemptions 3,452,697 271,606Net change in unrealized appreciation (depreciation) of investments (5,393,159) 5,251,260Net increase (decrease) in net assets resulting from operations (1,853,870) 5,643,508
DISTRIBUTIONS TO SHAREHOLDERS
From net investment income (44,402) (101,055)From net realized gain (242,738) (28,851)Total Distributions to Shareholders (287,140) (129,906)
CAPITAL SHARE TRANSACTIONSNet increase in net assets derived from net change in outstanding shares (a) 9,079,925 25,745,485Transaction Fees (See Note 1) 5,629 2,630Net increase in net assets from capital share transactions 9,085,554 25,748,115Total increase in net assets $ 6,944,544 $ 31,261,717
NET ASSETS
Beginning of Period 37,948,194 6,686,477End of Period $ 44,892,738 $ 37,948,194
Undistributed net investment income $ 63,519 $ 21,329
(a) Summary of share transactions is as follows: Six Months Ended
March 31, 2018
(Unaudited)Year Ended
September 30, 2017 Shares Amount Shares AmountShares Sold 500,000 $18,174,525 850,000 $27,286,680Transaction Fees (See Note 1) - 5,629 - 2,630Shares Redeemed (250,000) (9,094,600) (50,000) (1,541,195) 250,000 $ 9,085,554 800,000 $25,748,115
Beginning Shares 1,050,000 250,000Ending Shares 1,300,000 1,050,000
The accompanying notes are an integral part of these financial statements.
39
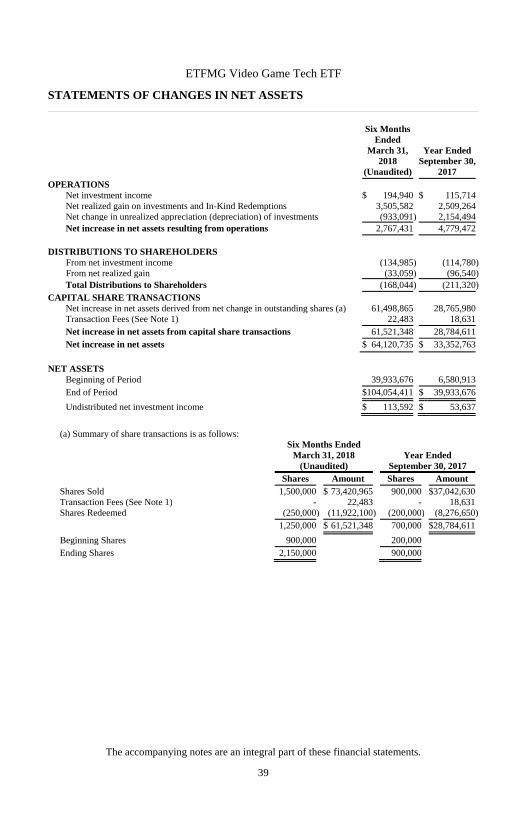
ETFMG Video Game Tech ETF
STATEMENTS OF CHANGES IN NET ASSETS
Six Months
Ended March 31,
2018 (Unaudited)
Year Ended September 30,
2017OPERATIONS
Net investment income $ 194,940 $ 115,714Net realized gain on investments and In-Kind Redemptions 3,505,582 2,509,264Net change in unrealized appreciation (depreciation) of investments (933,091) 2,154,494Net increase in net assets resulting from operations 2,767,431 4,779,472
DISTRIBUTIONS TO SHAREHOLDERS
From net investment income (134,985) (114,780)From net realized gain (33,059) (96,540)Total Distributions to Shareholders (168,044) (211,320)
CAPITAL SHARE TRANSACTIONSNet increase in net assets derived from net change in outstanding shares (a) 61,498,865 28,765,980Transaction Fees (See Note 1) 22,483 18,631Net increase in net assets from capital share transactions 61,521,348 28,784,611Net increase in net assets $ 64,120,735 $ 33,352,763
NET ASSETS
Beginning of Period 39,933,676 6,580,913End of Period $104,054,411 $ 39,933,676
Undistributed net investment income $ 113,592 $ 53,637
(a) Summary of share transactions is as follows: Six Months Ended
March 31, 2018
(Unaudited)Year Ended
September 30, 2017 Shares Amount Shares AmountShares Sold 1,500,000 $ 73,420,965 900,000 $37,042,630Transaction Fees (See Note 1) - 22,483 - 18,631Shares Redeemed (250,000) (11,922,100) (200,000) (8,276,650) 1,250,000 $ 61,521,348 700,000 $28,784,611
Beginning Shares 900,000 200,000Ending Shares 2,150,000 900,000
The accompanying notes are an integral part of these financial statements.
40
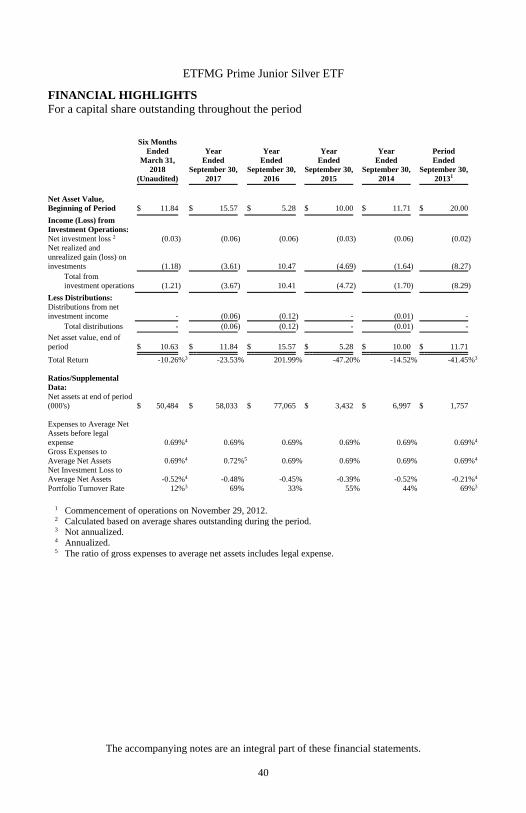
ETFMG Prime Junior Silver ETF
FINANCIAL HIGHLIGHTS For a capital share outstanding throughout the period
Six Months
Ended Year Year Year Year Period
March 31, 2018
(Unaudited)
Ended September 30,
2017
Ended September 30,
2016
Ended September 30,
2015
Ended September 30,
2014
Ended September 30,
20131
Net Asset Value, Beginning of Period $ 11.84 $ 15.57 $ 5.28 $ 10.00 $ 11.71 $ 20.00
Income (Loss) from Investment Operations:
Net investment loss 2 (0.03) (0.06) (0.06) (0.03) (0.06) (0.02)
Net realized and unrealized gain (loss) on investments (1.18) (3.61) 10.47 (4.69) (1.64) (8.27)
Total from investment operations (1.21) (3.67) 10.41 (4.72) (1.70) (8.29)
Less Distributions:
Distributions from net investment income - (0.06) (0.12) - (0.01) -
Total distributions - (0.06) (0.12) - (0.01) -
Net asset value, end of period $ 10.63 $ 11.84 $ 15.57 $ 5.28 $ 10.00 $ 11.71
Total Return -10.26%3 -23.53% 201.99% -47.20% -14.52% -41.45%3
Ratios/Supplemental Data:
Net assets at end of period (000's) $ 50,484 $ 58,033 $ 77,065 $ 3,432 $ 6,997 $ 1,757
Expenses to Average Net Assets before legal expense 0.69%4 0.69% 0.69% 0.69% 0.69% 0.69%4
Gross Expenses to Average Net Assets 0.69%4 0.72%5 0.69% 0.69% 0.69% 0.69%4
Net Investment Loss to Average Net Assets -0.52%4 -0.48% -0.45% -0.39% -0.52% -0.21%4
Portfolio Turnover Rate 12%3 69% 33% 55% 44% 69%3
1 Commencement of operations on November 29, 2012.2 Calculated based on average shares outstanding during the period. 3 Not annualized. 4 Annualized. 5 The ratio of gross expenses to average net assets includes legal expense.
The accompanying notes are an integral part of these financial statements.
41
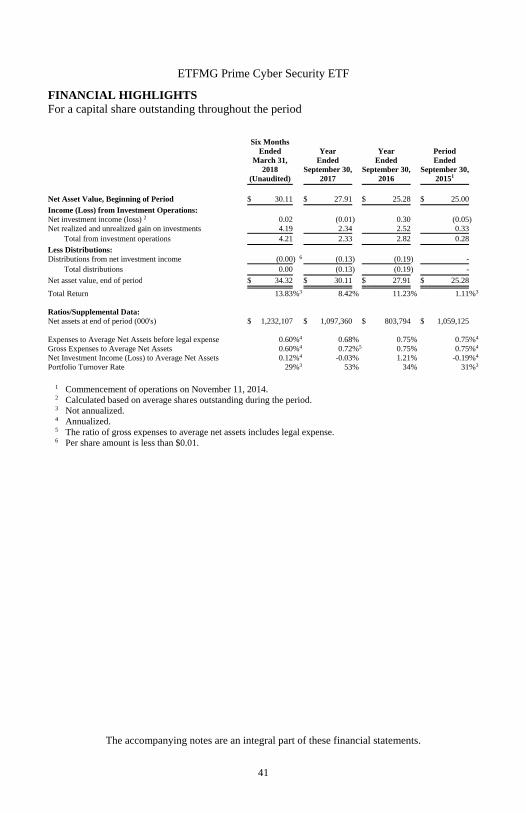
ETFMG Prime Cyber Security ETF
FINANCIAL HIGHLIGHTS For a capital share outstanding throughout the period
Six Months
Ended Year Year Period
March 31, 2018
(Unaudited)
Ended September 30,
2017
Ended September 30,
2016
Ended September 30,
20151
Net Asset Value, Beginning of Period $ 30.11 $ 27.91 $ 25.28 $ 25.00
Income (Loss) from Investment Operations: Net investment income (loss) 2 0.02 (0.01) 0.30 (0.05)Net realized and unrealized gain on investments 4.19 2.34 2.52 0.33
Total from investment operations 4.21 2.33 2.82 0.28
Less Distributions: Distributions from net investment income (0.00) 6 (0.13) (0.19) -
Total distributions 0.00 (0.13) (0.19) -
Net asset value, end of period $ 34.32 $ 30.11 $ 27.91 $ 25.28
Total Return 13.83%3 8.42% 11.23% 1.11%3
Ratios/Supplemental Data:
Net assets at end of period (000's) $ 1,232,107 $ 1,097,360 $ 803,794 $ 1,059,125
Expenses to Average Net Assets before legal expense 0.60%4 0.68% 0.75% 0.75%4
Gross Expenses to Average Net Assets 0.60%4 0.72%5 0.75% 0.75%4
Net Investment Income (Loss) to Average Net Assets 0.12%4 -0.03% 1.21% -0.19%4
Portfolio Turnover Rate 29%3 53% 34% 31%3
1 Commencement of operations on November 11, 2014.2 Calculated based on average shares outstanding during the period. 3 Not annualized. 4 Annualized. 5 The ratio of gross expenses to average net assets includes legal expense. 6 Per share amount is less than $0.01.
The accompanying notes are an integral part of these financial statements.
42
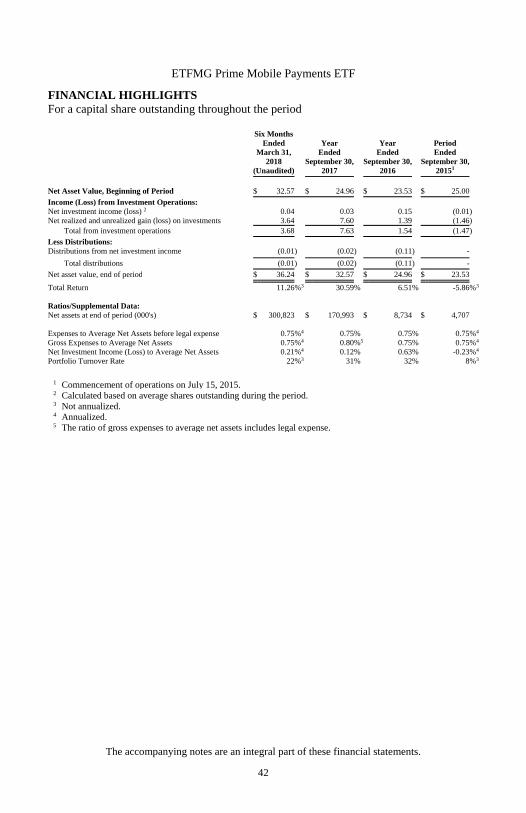
ETFMG Prime Mobile Payments ETF
FINANCIAL HIGHLIGHTS For a capital share outstanding throughout the period
Six Months
Ended Year Year Period
March 31, 2018
(Unaudited)
Ended September 30,
2017
Ended September 30,
2016
Ended September 30,
20151
Net Asset Value, Beginning of Period $ 32.57 $ 24.96 $ 23.53 $ 25.00
Income (Loss) from Investment Operations: Net investment income (loss) 2 0.04 0.03 0.15 (0.01)Net realized and unrealized gain (loss) on investments 3.64 7.60 1.39 (1.46)
Total from investment operations 3.68 7.63 1.54 (1.47)
Less Distributions: Distributions from net investment income (0.01) (0.02) (0.11) -
Total distributions (0.01) (0.02) (0.11) -
Net asset value, end of period $ 36.24 $ 32.57 $ 24.96 $ 23.53
Total Return 11.26%3 30.59% 6.51% -5.86%3
Ratios/Supplemental Data:
Net assets at end of period (000's) $ 300,823 $ 170,993 $ 8,734 $ 4,707
Expenses to Average Net Assets before legal expense 0.75%4 0.75% 0.75% 0.75%4
Gross Expenses to Average Net Assets 0.75%4 0.80%5 0.75% 0.75%4
Net Investment Income (Loss) to Average Net Assets 0.21%4 0.12% 0.63% -0.23%4
Portfolio Turnover Rate 22%3 31% 32% 8%3
1 Commencement of operations on July 15, 2015.2 Calculated based on average shares outstanding during the period. 3 Not annualized. 4 Annualized. 5 The ratio of gross expenses to average net assets includes legal expense.
The accompanying notes are an integral part of these financial statements.

43
ETFMG Drone Economy Strategy ETF
FINANCIAL HIGHLIGHTS For a capital share outstanding throughout the period
Six Months
Ended Year Period
March 31, 2018
(Unaudited)
Ended September 30,
2017
Ended September 30,
20161
Net Asset Value, Beginning of Period $ 36.14 $ 26.75 $ 25.00
Income from Investment Operations:
Net investment income 2 0.07 0.27 0.11
Net realized and unrealized gain (loss) on investments (1.45) 9.26 1.68
Total from investment operations (1.38) 9.53 1.79
Less Distributions:
Distributions from net investment income (0.04) (0.04) (0.04)
Distributions from net realized gain (0.19) (0.10) -
Total distributions (0.23) (0.14) (0.04)
Net asset value, end of period $ 34.53 $ 36.14 $ 26.75
Total Return -3.93%3 36.39% 7.15%3
Ratios/Supplemental Data:
Net assets at end of period (000's) $ 44,893 $ 37,948 $ 6,686
Expenses to Average Net Assets before legal expense 0.75%4 0.75% 0.75%4
Gross Expenses to Average Net Assets 0.75%4 0.79% 5 0.75%4
Net Investment Income to Average Net Assets 0.41%4 0.87% 0.68%4
Portfolio Turnover Rate 8%3 21% 13%3
1 Commencement of operations on March 8, 2016.2 Calculated based on average shares outstanding during the period. 3 Not annualized. 4 Annualized. 5 The ratio of gross expenses to average net assets includes legal expense.
The accompanying notes are an integral part of these financial statements.
44
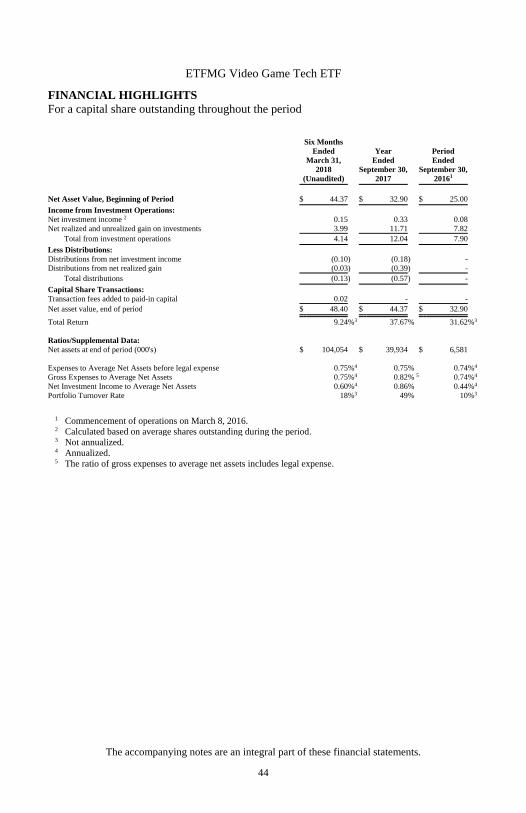
ETFMG Video Game Tech ETF
FINANCIAL HIGHLIGHTS For a capital share outstanding throughout the period
Six Months
Ended Year Period
March 31, 2018
(Unaudited)
Ended September 30,
2017
Ended September 30,
20161
Net Asset Value, Beginning of Period $ 44.37 $ 32.90 $ 25.00
Income from Investment Operations:
Net investment income 2 0.15 0.33 0.08
Net realized and unrealized gain on investments 3.99 11.71 7.82
Total from investment operations 4.14 12.04 7.90
Less Distributions:
Distributions from net investment income (0.10) (0.18) -
Distributions from net realized gain (0.03) (0.39) -
Total distributions (0.13) (0.57) -
Capital Share Transactions:
Transaction fees added to paid-in capital 0.02 - -
Net asset value, end of period $ 48.40 $ 44.37 $ 32.90
Total Return 9.24%3 37.67% 31.62%3
Ratios/Supplemental Data:
Net assets at end of period (000's) $ 104,054 $ 39,934 $ 6,581
Expenses to Average Net Assets before legal expense 0.75%4 0.75% 0.74%4
Gross Expenses to Average Net Assets 0.75%4 0.82% 5 0.74%4
Net Investment Income to Average Net Assets 0.60%4 0.86% 0.44%4
Portfolio Turnover Rate 18%3 49% 10%3
1 Commencement of operations on March 8, 2016. 2 Calculated based on average shares outstanding during the period. 3 Not annualized. 4 Annualized. 5 The ratio of gross expenses to average net assets includes legal expense.
The accompanying notes are an integral part of these financial statements.

45
ETFMG™ ETFs
NOTES TO FINANCIAL STATEMENTS March 31, 2018 (Unaudited)
NOTE 1 – ORGANIZATION
ETFMG Prime Junior Silver ETF (“SILJ”), ETFMG Prime Cyber Security ETF (“HACK”), ETFMG Prime Mobile Payments ETF (“IPAY”), ETFMG Drone Economy Strategy ETF (“IFLY”), and ETFMG Video Game Tech ETF (“GAMR”) (each a “Fund”, or collectively the “Funds”) are series of ETF Managers Trust (the “Trust”), an open-end management investment company consisting of multiple investment series, organized as a Delaware statutory trust on July 1, 2009. The Trust is registered with the SEC under the Investment Company Act of 1940, as amended (the “1940 Act”), as an open-end management investment company and the offering of the Funds’ shares (“Shares”) is registered under the Securities Act of 1933, as amended (the “Securities Act”).
The following table is a summary of the Strategy Commencement Date and Strategy of the Funds:
Fund Ticker Strategy Commencement
Date
Strategy
SILJ 8/1/2017 Seeks to provide investment results that, before fees and expenses, correspond generally to the price and yield performance of the Prime Junior Silver Miners & Explorers Index (“Prime Silver Index”).
HACK 8/1/2017 Seeks to provide investment results that, before fees and expenses, correspond generally to the price and yield of the Prime Cyber Defense Index (“Prime Cyber Index”).
IPAY 8/1/2017 Seeks to provide investment results that, before fees and expenses, correspond generally to the price and yield performance of the Prime Mobile Payments Index (“Prime Mobile Index”).
IFLY 3/8/2016 Seeks to provide investment results that, before fees and expenses, correspond generally to the price and yield performance of the Reality Shares Drone™ Index.
GAMR 3/8/2016 Seeks to provide investment results that, before fees and expenses, correspond generally to the price and yield performance of the EEFund Video Game Tech™ Index.
The Funds each currently offer one class of shares, which have no front end sales load, no deferred sales charges, and no redemption fees. The Funds may issue an unlimited number of shares of beneficial interest, with no par value. All shares of each Fund have equal rights and privileges.
Shares of the Funds are listed and traded on the NYSE Arca, Inc. Market prices for the Shares may be different from their net asset value (“NAV”). Each Fund issues and redeems Shares on a continuous basis at NAV only in blocks of 50,000 shares, called “Creation Units.” Creation Units are issued and redeemed principally in-kind for securities included in a specified Index. Once created, Shares generally trade in the secondary market at market prices that change throughout the day in quantities less than a Creation Unit. Except when aggregated in Creation Units, Shares are not redeemable securities of a Fund. Shares of a Fund may only be purchased or redeemed by certain financial institutions (“Authorized Participants”). An Authorized Participant is either (i) a broker-dealer or other participant in the clearing process through the Continuous Net Settlement System of the National Securities Clearing Corporation or (ii) a DTC participant and, in each case, must have executed a Participant Agreement with the Distributor. Most retail investors do not qualify as Authorized Participants nor have the resources to buy and sell whole Creation Units. Therefore, they are unable to purchase or redeem the Shares directly from a Fund. Rather, most retail investors may purchase Shares in the secondary market with the assistance of a broker and may be subject to customary brokerage commissions or fees.
46
ETFMG™ ETFs
NOTES TO FINANCIAL STATEMENTS March 31, 2018 (Unaudited)
Authorized Participants transacting in Creation Units for cash may pay an additional variable charge to compensate the relevant Fund for certain transaction costs (i.e., brokerage costs) and market impact expenses relating to investing in portfolio securities. Such variable charges, if any, are included in “Transaction Fees” in the Statements of Changes in net assets. NOTE 2 – SIGNIFICANT ACCOUNTING POLICIES The following is a summary of significant accounting policies consistently followed by the Funds. These policies are in conformity with accounting principles generally accepted in the United States ofAmerica (“U.S. GAAP”). The Fund follows the investment company accounting and reporting guidance of the FinancialAccounting Standards Board Accounting Standard Codification Topic 946 Financial Services –Investment Companies. The Fund may invest in certain other investment companies (underlying funds). For specificinvestments in underlying funds, please refer to the complete schedule of portfolio holdings on FormN-CSR(S) for this reporting period, which is filed with the U.S. Securities and Exchange Commission(SEC). For more information about the underlying Fund’s operations and policies, please refer to thoseFund’s semiannual and annual reports, which are filed with the SEC. A. Security Valuation. Securities listed on a securities exchange, market or automated quotation
system for which quotations are readily available (except for securities traded on NASDAQ),including securities traded over the counter, are valued at the last quoted sale price on theprimary exchange or market (foreign or domestic) on which they are traded on the valuationdate (or at approximately 4:00 pm Eastern Time if a security’s primary exchange is normally open at that time), or, if there is no such reported sale on the valuation date, at the most recentquoted bid price. For securities traded on NASDAQ, the NASDAQ Official Closing Price willbe used.
Securities for which quotations are not readily available are valued at their respective fair values
as determined in good faith by the Board of Trustees (the “Board”). When a security is “fairvalued,” consideration is given to the facts and circumstances relevant to the particular situation, including a review of various factors set forth in the pricing procedures adopted by the Funds’Board. The use of fair value pricing by a Fund may cause the net asset value of its shares todiffer significantly from the net asset value that would be calculated without regard to such considerations. As of March 31, 2018, ETFMG Prime Junior Silver ETF held one fair valuedsecurity. More detail on this security can be found in the Schedule of Investments. ETFMGPrime Cyber Security ETF, ETFMG Prime Mobile Payments ETF, ETFMG Drone EconomyStrategy ETF, and ETFMG Video Game Tech did not hold any fair valued securities.
As described above, the Funds utilize various methods to measure the fair value of theirinvestments on a recurring basis. U.S. GAAP establishes a hierarchy that prioritizes inputs tovaluation methods. The three levels of inputs are:
Level 1 Unadjusted quoted prices in active markets for identical assets or liabilities that
the Funds have the ability to access.
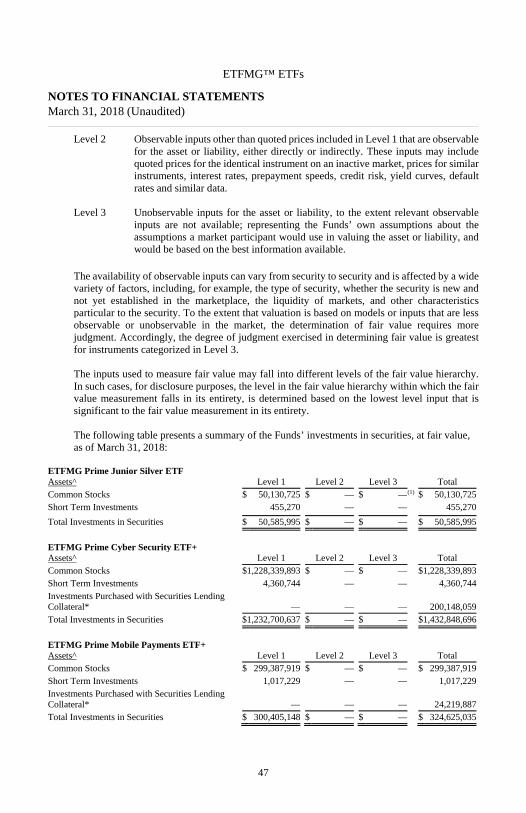
47
ETFMG™ ETFs
NOTES TO FINANCIAL STATEMENTS March 31, 2018 (Unaudited)
Level 2 Observable inputs other than quoted prices included in Level 1 that are observable
for the asset or liability, either directly or indirectly. These inputs may includequoted prices for the identical instrument on an inactive market, prices for similarinstruments, interest rates, prepayment speeds, credit risk, yield curves, defaultrates and similar data.
Level 3 Unobservable inputs for the asset or liability, to the extent relevant observable inputs are not available; representing the Funds’ own assumptions about theassumptions a market participant would use in valuing the asset or liability, andwould be based on the best information available.
The availability of observable inputs can vary from security to security and is affected by a widevariety of factors, including, for example, the type of security, whether the security is new andnot yet established in the marketplace, the liquidity of markets, and other characteristics particular to the security. To the extent that valuation is based on models or inputs that are lessobservable or unobservable in the market, the determination of fair value requires morejudgment. Accordingly, the degree of judgment exercised in determining fair value is greatest for instruments categorized in Level 3.
The inputs used to measure fair value may fall into different levels of the fair value hierarchy.
In such cases, for disclosure purposes, the level in the fair value hierarchy within which the fair value measurement falls in its entirety, is determined based on the lowest level input that issignificant to the fair value measurement in its entirety.
The following table presents a summary of the Funds’ investments in securities, at fair value, as of March 31, 2018:
ETFMG Prime Junior Silver ETF Assets^ Level 1 Level 2 Level 3 TotalCommon Stocks $ 50,130,725 $ — $ —(1) $ 50,130,725 Short Term Investments 455,270 — — 455,270
Total Investments in Securities $ 50,585,995 $ — $ — $ 50,585,995
ETFMG Prime Cyber Security ETF+ Assets^ Level 1 Level 2 Level 3 TotalCommon Stocks $1,228,339,893 $ — $ — $1,228,339,893 Short Term Investments 4,360,744 — — 4,360,744 Investments Purchased with Securities Lending Collateral* — — — 200,148,059 Total Investments in Securities $1,232,700,637 $ — $ — $1,432,848,696
ETFMG Prime Mobile Payments ETF+ Assets^ Level 1 Level 2 Level 3 TotalCommon Stocks $ 299,387,919 $ — $ — $ 299,387,919 Short Term Investments 1,017,229 — — 1,017,229 Investments Purchased with Securities Lending Collateral* — — — 24,219,887 Total Investments in Securities $ 300,405,148 $ — $ — $ 324,625,035
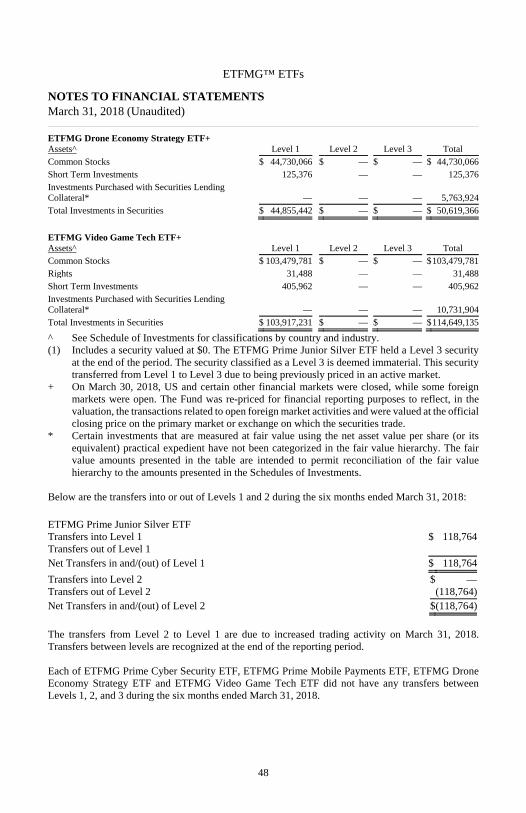
48
ETFMG™ ETFs
NOTES TO FINANCIAL STATEMENTS March 31, 2018 (Unaudited)
ETFMG Drone Economy Strategy ETF+ Assets^ Level 1 Level 2 Level 3 TotalCommon Stocks $ 44,730,066 $ — $ — $ 44,730,066Short Term Investments 125,376 — — 125,376 Investments Purchased with Securities Lending Collateral* — — — 5,763,924 Total Investments in Securities $ 44,855,442 $ — $ — $ 50,619,366
ETFMG Video Game Tech ETF+ Assets^ Level 1 Level 2 Level 3 TotalCommon Stocks $ 103,479,781 $ — $ — $103,479,781 Rights 31,488 — — 31,488 Short Term Investments 405,962 — — 405,962 Investments Purchased with Securities Lending Collateral* — — — 10,731,904 Total Investments in Securities $ 103,917,231 $ — $ — $114,649,135
^ See Schedule of Investments for classifications by country and industry. (1) Includes a security valued at $0. The ETFMG Prime Junior Silver ETF held a Level 3 security
at the end of the period. The security classified as a Level 3 is deemed immaterial. This security transferred from Level 1 to Level 3 due to being previously priced in an active market.
+ On March 30, 2018, US and certain other financial markets were closed, while some foreign markets were open. The Fund was re-priced for financial reporting purposes to reflect, in the valuation, the transactions related to open foreign market activities and were valued at the official closing price on the primary market or exchange on which the securities trade.
* Certain investments that are measured at fair value using the net asset value per share (or its equivalent) practical expedient have not been categorized in the fair value hierarchy. The fair value amounts presented in the table are intended to permit reconciliation of the fair value hierarchy to the amounts presented in the Schedules of Investments.
Below are the transfers into or out of Levels 1 and 2 during the six months ended March 31, 2018:
ETFMG Prime Junior Silver ETF Transfers into Level 1 $ 118,764Transfers out of Level 1 Net Transfers in and/(out) of Level 1 $ 118,764
Transfers into Level 2 $ —Transfers out of Level 2 (118,764)Net Transfers in and/(out) of Level 2 $(118,764)
The transfers from Level 2 to Level 1 are due to increased trading activity on March 31, 2018. Transfers between levels are recognized at the end of the reporting period. Each of ETFMG Prime Cyber Security ETF, ETFMG Prime Mobile Payments ETF, ETFMG Drone Economy Strategy ETF and ETFMG Video Game Tech ETF did not have any transfers between Levels 1, 2, and 3 during the six months ended March 31, 2018.
49
ETFMG™ ETFs
NOTES TO FINANCIAL STATEMENTS March 31, 2018 (Unaudited)
B. Federal Income Taxes. The Funds have each elected to be taxed as a “regulated investment
company” and intend to distribute substantially all taxable income to their shareholders andotherwise comply with the provisions of the Internal Revenue Code applicable to regulatedinvestment companies. Therefore, no provisions for federal income taxes or excise taxes havebeen made.
To avoid imposition of the excise tax applicable to regulated investment companies, each Fund
intends to declare each year as dividends, in each calendar year, at least 98.0% of its netinvestment income (earned during the calendar year) and 98.2% of its net realized capital gains(earned during the twelve months ended October 31) plus undistributed amounts, if any, fromprior years.
Net capital losses incurred after October 31, within the taxable year are deemed to arise on the
first business day of each Fund’s next taxable year. Each Fund recognizes the tax benefits of uncertain tax positions only where the position is “more
likely than not” to be sustained assuming examination by tax authorities. Each Fund hasanalyzed its tax position and has concluded that no liability for unrecognized tax benefits should be recorded related to uncertain tax positions expected to be taken in the Funds’ 2017 tax returns.The Funds identify their major tax jurisdictions as U.S. Federal, the State of New Jersey, andthe State of Delaware; however the Funds are not aware of any tax positions for which it isreasonably possible that the total amounts of unrecognized tax benefits will change materiallyin the next twelve months. Management has reviewed the tax positions for open periods (for Federal purposes, three years from the date of filing and for state purposes, four years from the date of filing), as applicable to the Funds, and has determined that no provision for income tax is required in the Funds’ financial statements.
C. Security Transactions and Investment Income. Investment securities transactions are accounted
for on the trade date. Gains and losses realized on sales of securities are determined on a specificidentification basis. Discounts/premiums on debt securities purchased are accreted/amortized over the life of the respective securities using the effective interest method. Dividend income isrecorded on the ex-dividend date. Interest income is recorded on an accrual basis. Income,including gains, from investments in foreign securities received by the Funds may be subject toincome, withholding or other taxes imposed by foreign countries.
D. Foreign Currency Translations and Transactions. The Funds may engage in foreign currency
transactions. Foreign currency transactions are translated into U.S. dollars on the followingbasis: (i) market value of investment securities, assets and liabilities at the daily rates ofexchange, and (ii) purchases and sales of investment securities, dividend and interest income and certain expenses at the rates of exchange prevailing on the respective dates of suchtransactions. For financial reporting purposes, the Funds do not isolate changes in the exchangerate of investment securities from the fluctuations arising from changes in the market prices of securities for unrealized gains and losses. However, for federal income tax purposes, the Fundsdo isolate and treat as ordinary income the effect of changes in foreign exchange rates on realizedgains or losses from the sale of investment securities and payables and receivables arising fromtrade-date and settlement-date differences.
50
ETFMG™ ETFs
NOTES TO FINANCIAL STATEMENTS March 31, 2018 (Unaudited)
E. Distributions to Shareholders. Distributions to shareholders from net investment income are
generally declared and paid by each of the Funds on a quarterly basis. Distributions to shareholders from realized gains on securities for each Fund normally are declared and paid onan annual basis. Distributions are recorded on the ex-dividend date.
F. Use of Estimates. The preparation of financial statements in conformity with U.S. GAAP
requires management to make estimates and assumptions that affect the reported amounts ofassets and liabilities at the date of the financial statements, as well as the reported amounts ofrevenues and expenses during the reporting period. Actual results could differ from thoseestimates.
G. Share Valuation. The net asset value (“NAV”) per share of each Fund is calculated by dividing
the sum of the value of the securities held by the Fund, plus cash and other assets, minus allliabilities (including estimated accrued expenses) by the total number of shares outstanding forthe Fund, rounded to the nearest cent. The Funds’ shares will not be priced on the days on whichthe NYSE is closed for trading. For Authorized Participants, the offering and redemption priceper share for the Funds are equal to the Funds’ respective net asset value per share.
H. Guarantees and Indemnifications. In the normal course of business, the Funds enter into
contracts with service providers that contain general indemnification clauses. The Funds’maximum exposure under these arrangements is unknown as this would involve future claims that may be made against the Funds that have not yet occurred. However, based on experience,the Funds expect the risk of loss to be remote.
NOTE 3 – RISK FACTORS Investing in the Funds may involve certain risks, as discussed in the Funds’ prospectus, including, but not limited to, those described below. Any of these risks could cause an investor to lose money. Market Risk. Financial markets rise and fall in response to a variety of factors, sometimes rapidly and unpredictably. As with any investment whose performance is tied to these markets, the value of an investment in a Fund will fluctuate, which means that an investor could lose money over short or long periods. Investment Style Risk. The Funds are not actively managed. Therefore, the Funds follow the securities included in its respective index during upturns as well as downturns. Because of their indexing strategies, the Funds do not take steps to reduce market exposure or to lessen the effects of a declining market. In addition, because of the Funds' expenses, the Funds' performance may be below that of their respective index. Equity Risk. The prices of equity securities rise and fall daily. These price movements may result from factors affecting individual companies, industries or the securities market as a whole. In addition, equity markets tend to move in cycles which may cause stock prices to fall over short or extended periods of time. Securities Lending Risk. Securities lending involves the risk of loss of rights in, or delay in recovery of, the loaned securities if the borrower fails to return the security loaned or becomes insolvent.
51
ETFMG™ ETFs
NOTES TO FINANCIAL STATEMENTS March 31, 2018 (Unaudited)
Concentration Risk. To the extent that a Fund's or an index's portfolio is concentrated in the securities of issuers in a particular market, industry, group of industries, sector or asset class, the fund may be adversely affected by the performance of those securities, may be subject to increased price volatility and may be more vulnerable to adverse economic, market, political or regulatory occurrences affecting that market, industry, group of industries, sector or asset class. NOTE 4 – COMMITMENTS AND OTHER RELATED PARTY TRANSACTIONS. ETF Managers Group, LLC (the “Advisor”), serves as the investment advisor to the Funds. Pursuant to an Investment Advisory Agreement (“Advisory Agreement”) between the Trust, on behalf of the Funds, and the Advisor, the Advisor provides investment advice to the Funds and oversees the day-to-day operations of the Funds, subject to the direction and control of the Board and the officers of the Trust. Under the Advisory Agreement, the Advisor is also responsible for arranging transfer agency, custody, fund administration and accounting, and other non-distribution related services necessary for the Funds to operate. Under the Investment Advisory Agreement the Advisor has overall responsibility for the general management and administration of the Funds and arranges for sub-advisory, transfer agency, custody, fund administration, securities lending, and all other non-distribution related services necessary for the Funds to operate. The Funds unitary fees are accrued daily and paid monthly. The Advisor bears the costs of all advisory and non-advisory services required to operate the Funds, in exchange for a single unitary fee at the following annual rates: ETFMG Prime Junior Silver ETF 0.69%ETFMG Prime Cyber Security ETF 0.60%ETFMG Prime Mobile Payments ETF 0.75%ETFMG Drone Economy Strategy ETF 0.75%ETFMG Video Game Tech ETF 0.75% The Advisor has an agreement with, and is dependent on, a third party to pay the Funds’ expenses in excess of the annual expense rates of each Funds’ average daily net assets. Additionally, under the Investment Advisory Agreement, the Advisor has agreed to pay all expenses of the Funds, except for: the fee paid to the Advisor pursuant to the Investment Advisory Agreement, interest charges on any borrowings, taxes, brokerage commissions and other expenses incurred in placing orders for the purchase and sale of securities and other investment instruments, acquired fund fees and expenses, accrued deferred tax liability, extraordinary expenses, and distribution (12b-1) fees and expenses (collectively, “Excluded Expenses”). The Sponsor provides marketing support for the Funds, including distributing marketing materials related to the Funds. The Advisor has entered into an agreement with ETFMG Financial, LLC (“the Sponsor”). The Sponsor provides marketing support for the Funds, including distributing marketing materials related to the Funds. Level ETF Ventures, LLC serves as the index provider for SILJ, HACK, IPAY, and GAMR. Reality Shares, LLC serves as the index provider for IFLY. U.S. Bancorp Fund Services, LLC (the “Administrator”) provides fund accounting, fund administration, and transfer agency services to the Funds. The Advisor compensates the Administrator for these services under an administration agreement between the two parties.

52
ETFMG™ ETFs
NOTES TO FINANCIAL STATEMENTS March 31, 2018 (Unaudited)
The Advisor pays each independent Trustee a quarterly fee for service to the Funds. Each Trustee is also reimbursed by the Advisor for all reasonable out-of-pocket expenses incurred in connection with his duties as Trustee, including travel and related expenses incurred in attending Board meetings. NOTE 5 – DISTRIBUTION PLAN The Funds have each adopted a Plan of Distribution pursuant to Rule 12b-1 under the 1940 Act. Under the Plan, each Fund may pay compensation to the Distributor or any other distributor or financial institution with which the Trust has an agreement with respect to each Fund, with the amount of such compensation not to exceed an annual rate of 0.25% of each Fund’s average daily net assets. During the six months ended March 31, 2018, the Funds did not incur any 12b-1 expenses. NOTE 6 - PURCHASES AND SALES OF SECURITIES The costs of purchases and sales of securities, excluding short-term securities and in-kind transactions, during the six months ended March 31, 2018: Purchases SalesETFMG Prime Junior Silver ETF $ 6,417,530 $ 6,856,775ETFMG Prime Cyber Security ETF 369,155,383 331,026,631ETFMG Prime Mobile Payments ETF 61,053,062 55,428,391ETFMG Drone Economy Strategy ETF 3,642,787 3,441,486ETFMG Video Game Tech ETF 22,924,954 13,001,677 The costs of purchases and sales of in-kind transactions associated with creations and redemptions during the six months ended March 31, 2018. Purchases Sales In-Kind In-Kind ETFMG Prime Junior Silver ETF $ 4,638,131 $ 5,785,445ETFMG Prime Cyber Security ETF 306,005,548 312,776,456ETFMG Prime Mobile Payments ETF 161,762,488 54,753,822ETFMG Drone Economy Strategy ETF 17,451,431 8,841,122ETFMG Video Game Tech ETF 63,477,869 12,064,704 Purchases in-kind are the aggregate of all in-kind purchases and sales in-kind are the aggregate of all proceeds from in-kind sales. Net capital gains or losses resulting from in-kind redemptions are excluded from the Funds’ determination of taxable gains and are not distributed to shareholders. There were no purchases or sales of U.S. Government obligations during the six months ended March 31, 2018. NOTE 7 — SECURITIES LENDING The Funds, except for ETFMG Prime Junior Silver ETF, may lend up to 33 1⁄3% of the value of the securities in their portfolios to brokers, dealers and financial institutions (but not individuals) under terms of participation in a securities lending program administered by U.S. Bank N.A. (“the Custodian”). The securities lending agreement requires that loans are collateralized at all times in an amount equal to at least 102% of the value of any loaned securities at the time of the loan, plus accrued interest. The Funds receive compensation in the form of fees and earn interest on the cash collateral.
53
ETFMG™ ETFs
NOTES TO FINANCIAL STATEMENTS March 31, 2018 (Unaudited)
The amount of fees depends on a number of factors including the type of security and length of the loan. The Funds continue to receive interest payments or dividends on the securities loaned during the borrowing period. Gain or loss on the fair value of securities loaned that may occur during the term of the loan will be for the account of the Funds. The Funds have the right under the terms of the securities lending agreement to recall the securities from the borrower on demand. During the six months ended March 31, 2018, Funds had loaned securities and received cash collateral for the loans. The cash collateral is invested by the Custodian in accordance with approved investment guidelines. Those guidelines require the cash collateral to be invested in readily marketable, high quality, short-term obligations; however, such investments are subject to risk of payment delays or default on the part of the issuer or counterparty or otherwise may not generate sufficient interest to support the costs associated with securities lending. The Funds could also experience delays in recovering their securities and possible loss of income or value if the borrower fails to return the borrowed securities, although the Fund is indemnified from this risk by contract with the securities lending agent. As of the six months ended March 31, 2018, the value of the securities on loan and payable for collateral due to broker were as follows: Value of Securities on Loan Collateral Received
Fund
Values of Securities on
Loan
Fund Collateral Received*
ETFMG Prime Cyber Security ETF $199,470,200 $200,148,059ETFMG Prime Mobile Payments ETF 24,291,864 24,219,887ETFMG Drone Economy Strategy ETF 5,694,006 5,763,924ETFMG Video Game Tech ETF 10,399,361 10,731,904
* The cash collateral received was invested in the Mount Vernon Prime Portfolio as shown on the Schedule of Investments, a money market fund with an overnight and continuous maturity, as shown on the Schedule of Investments. Net interest income earned on collateral investments and recognized by the Funds during the six months ended March 31, 2018, were as follows: Fees and Interest Income Earned
Fund
Interest income earned
including applicable fees
ETFMG Prime Cyber Security ETF $238,453ETFMG Prime Mobile Payments ETF 28,656ETFMG Drone Economy Strategy ETF 60,031ETFMG Video Game Tech ETF 135,022
54
ETFMG™ ETFs
NOTES TO FINANCIAL STATEMENTS March 31, 2018 (Unaudited)
NOTE 8 – FEDERAL INCOME TAXES The components of distributable earnings (losses) and cost basis of investments for federal income tax purposes at September 30, 2017 were as follows: Net Gross Gross Unrealized Unrealized Unrealized Appreciation Cost Appreciation Depreciation (Depreciation)SILJ $ 67,360,521 $ 1,412,448 $ (10,692,092) $ (9,279,644)HACK 1,292,858,769 116,813,291 (72,036,210) 44,777,081IPAY 183,951,975 23,481,359 (2,515,418) 20,965,941IFLY 37,964,549 6,150,972 (833,945) 5,317,027GAMR 40,456,291 4,257,663 (1,430,711) 2,826,952 The difference between the tax cost of investments and the cost of investments for GAAP purposes is primarily due to the tax treatment of wash sale losses. As of September 30, 2017, the components of distributable earnings (loss) on a tax basis were as follows:
Undistributed Ordinary Income
Undistributed Long-term
Gain
Total Distributable
Earnings
Other Accumulated
Loss
Undistributed Long-term
Gain
Total Accumulated Gain (Loss)
SILJ $ — $ — $ — $ (18,817,133) $ — $28,096,777HACK — — — (196,892,868) — (152,205,787)IPAY 61,070 — 61,070 (173,403) — 20,854,608IFLY 263,376 2,383 265,759 — — 5,582,786GAMR 168,037 — 168,037 — — 2,994,989 The difference between the tax cost of investments and the cost of investments for GAAP purposes is primarily due to the tax treatment of wash sale losses. As of September 30, 2017, the Funds had accumulated capital loss carryovers of:
Capital LossCarryover Expires
SILJ $ 18,738,756 IndefiniteHACK 196,049,384 IndefiniteIPAY 172,403 IndefiniteIFLY — IndefiniteGAMR — Indefinite

55
ETFMG™ ETFs
NOTES TO FINANCIAL STATEMENTS March 31, 2018 (Unaudited)
Under current tax law, capital and currency losses realized after October 31 of a Fund’s fiscal year may be deferred and treated as occurring on the first business day of the following fiscal year for tax purposes. The following Funds had deferred post-October capital and currency losses, which will be treated as arising on the first business day of the year ending September 30, 2017.
Late YearOrdinary
Loss
Post- October Capital
LossSILJ $ 78,377 $ -HACK 933,484 -IPAY - -IFLY - -GAMR - - U.S. GAAP requires that certain components of net assets relating to permanent differences be reclassified between financial and tax reporting. These reclassifications have no effect on net assets or net asset value per share. For the fiscal year ended September 30, 2017, the following table shows the reclassifications made: Undistributed Accumulated Accumulated Net Investment Net Realized Paid-In Income/(Loss) Loss CapitalSILJ $ 289,106 $ (3,535,059) $ 3,245,953HACK (41,251) (60,487,918) 60,529,169IPAY (21,624) (5,557,187) 5,578,811IFLY (5,567) (246,956) 252,523GAMR 45,831 (2,668,537) 2,622,706 NOTE 9 – DISTRIBUTIONS TO SHAREHOLDERS The tax character of distributions paid by the Funds during the fiscal years are as follows: Year Ended September 30, 2017 Year Ended September 30, 2016
From Ordinary
IncomeFrom Capital
Gains From Ordinary
IncomeFrom Capital
GainsSILJ $ 258,169 $ - $ 87,131 $ -HACK 3,740,625 - 5,498,499 -IPAY 31,641 - 40,000 -IFLY 101,055 28,851 4,000 -GAMR 114,780 96,540 - -
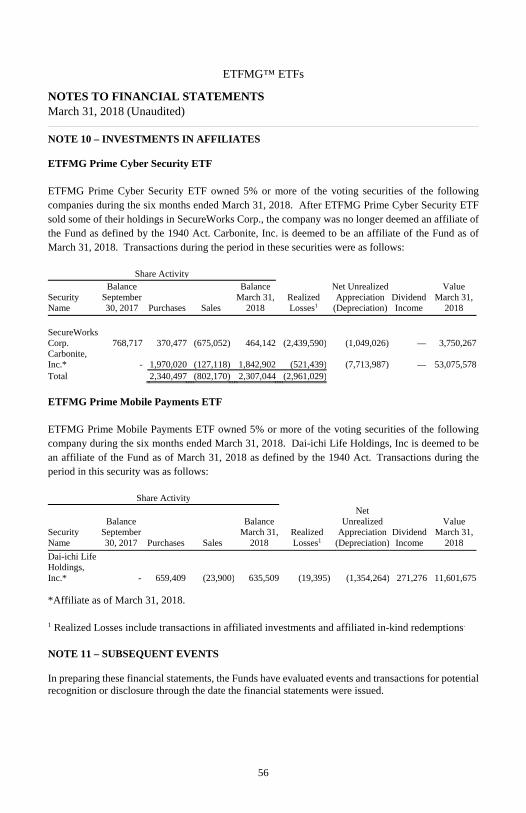
56
ETFMG™ ETFs
NOTES TO FINANCIAL STATEMENTS March 31, 2018 (Unaudited)
NOTE 10 – INVESTMENTS IN AFFILIATES ETFMG Prime Cyber Security ETF
ETFMG Prime Cyber Security ETF owned 5% or more of the voting securities of the following companies during the six months ended March 31, 2018. After ETFMG Prime Cyber Security ETF sold some of their holdings in SecureWorks Corp., the company was no longer deemed an affiliate of the Fund as defined by the 1940 Act. Carbonite, Inc. is deemed to be an affiliate of the Fund as of March 31, 2018. Transactions during the period in these securities were as follows:
Share Activity
Security Name
Balance September 30, 2017 Purchases Sales
Balance March 31,
2018Realized Losses1
Net Unrealized Appreciation
(Depreciation)Dividend Income
Value March 31,
2018
SecureWorks Corp. 768,717 370,477 (675,052) 464,142 (2,439,590) (1,049,026) — 3,750,267 Carbonite, Inc.* - 1,970,020 (127,118) 1,842,902 (521,439) (7,713,987) — 53,075,578 Total 2,340,497 (802,170) 2,307,044 (2,961,029)
ETFMG Prime Mobile Payments ETF
ETFMG Prime Mobile Payments ETF owned 5% or more of the voting securities of the following company during the six months ended March 31, 2018. Dai-ichi Life Holdings, Inc is deemed to be an affiliate of the Fund as of March 31, 2018 as defined by the 1940 Act. Transactions during the period in this security was as follows:
Share Activity
Security Name
Balance September 30, 2017 Purchases Sales
Balance March 31,
2018Realized Losses1
Net Unrealized
Appreciation (Depreciation)
Dividend Income
Value March 31,
2018
Dai-ichi Life Holdings, Inc.* - 659,409 (23,900) 635,509 (19,395) (1,354,264) 271,276 11,601,675 *Affiliate as of March 31, 2018.
1 Realized Losses include transactions in affiliated investments and affiliated in-kind redemptions.
NOTE 11 – SUBSEQUENT EVENTS In preparing these financial statements, the Funds have evaluated events and transactions for potential recognition or disclosure through the date the financial statements were issued.
57
ETFMG™ ETFs
APPROVAL OF ADVISORY AGREEMENTS AND BOARD CONSIDERATIONS For the Period Ended March 31, 2018 (Unaudited)
Pursuant to Section 15(c) of the Investment Company Act of 1940 (the “1940 Act”), at a meeting held on March 28, 2018, the Board of Trustees (the “Board”) of ETF Managers Trust (the “Trust”) considered the renewal of the Investment Advisory Agreement (the “Advisory Agreement”) between ETF Managers Group LLC (the “Adviser”) and the Trust, on behalf of each of ETFMG Prime Junior Silver ETF (“SILJ”), ETFMG Prime Cyber Security ETF (“HACK”), ETFMG Prime Mobile Payments ETF (“IPAY”), ETFMG Drone Economy Strategy ETF (“IFLY”) and ETFMG Video Game Tech ETF (“GAMR”) (each a “Fund” and collectively, the “Funds”).
Pursuant to Section 15(c) of the 1940 Act, the Board must annually review and approve the Advisory Agreement after its initial two-year term: (i) by the vote of the Trustees or by a vote of the shareholders of the Fund; and (ii) by the vote of a majority of the Trustees who are not parties to the Advisory Agreement or “interested persons” of any party thereto, as defined in the 1940 Act (the “Independent Trustees”), cast in person at a meeting called for the purpose of voting on such approval. Each year, the Board calls and holds a meeting to decide whether to renew the Advisory Agreement for an additional one-year term. In preparation for such meeting, the Board requests and reviews a wide variety of information from the Adviser. In reaching its decision, the Board, including the Independent Trustees, considered all factors it believed relevant, including: (i) the nature, extent and quality of the services provided to the Funds’ shareholders by the Adviser; (ii) the investment performance of the Funds; (iii) the Adviser’s costs and profits realized in providing services to the Funds, including any fall-out benefits enjoyed by the Adviser; (iv) comparative fee and expense data for the Funds in relation to other similar investment companies; (v) the extent to which economies of scale would be realized as the Funds grow and whether the advisory fees for the Funds reflect these economies of scale for the benefit of the Funds; and (vi) other financial benefits to the Adviser and its affiliates resulting from services rendered to the Funds. The Board’s review included written and oral information furnished to the Board prior to and at the meeting held on March 28, 2018, and throughout the year. Among other things, the Adviser provided responses to a detailed series of questions, which included information about the Adviser’s operations, service offerings, personnel, compliance program and financial condition. The Board then discussed the written and oral information that it received before the meeting and throughout the year, and the Adviser’s oral presentations and any other information that the Board received at the meeting, and deliberated on the renewal of the Advisory Agreement in light of this information. The Independent Trustees were assisted throughout the contract review process by independent legal counsel. The Independent Trustees relied upon the advice of such counsel and their own business judgment in determining the material factors to be considered in evaluating the renewal of the Advisory Agreement, and the weight to be given to each such factor. The conclusions reached with respect to the Advisory Agreement were based on a comprehensive evaluation of all the information provided and not any single factor. Moreover, each Trustee may have placed varying emphasis on particular factors in reaching conclusions with respect to each Fund. The matters discussed were also considered separately by the Independent Trustees in executive session with independent legal counsel, at which no representatives of management were present.
Nature, Extent and Quality of Services Provided by the Adviser The Trustees considered the scope of services provided under the Advisory Agreement, noting that the Adviser provides investment management services to the Funds. The Board discussed the responsibilities of the Adviser, including: responsibility for the general management of the day-to-day investment and reinvestment of the assets of the Funds; determining the daily baskets of deposit securities and cash components; executing portfolio security trades for purchases and redemptions of Fund shares conducted on a cash-in-lieu basis; responsibility for daily monitoring of tracking error and quarterly reporting to the Board; and implementation of Board directives as they relate to the

58
ETFMG™ ETFs
APPROVAL OF ADVISORY AGREEMENTS AND BOARD CONSIDERATIONS For the Period Ended March 31, 2018 (Unaudited) (Continued)
Funds. In considering the nature, extent and quality of the services provided by the Adviser, the Board considered the qualifications, experience and responsibilities of the Adviser’s investment personnel, the quality of the Adviser’s compliance infrastructure, and the determination of the Trust’s Chief Compliance Officer that the Adviser has appropriate compliance policies and procedures in place. The Board also considered the Adviser’s experience managing exchange-traded funds (“ETFs”). The Board also considered other services provided to the Funds, such as overseeing the Funds’ service providers, monitoring adherence to the Funds’ investment restrictions, and monitoring compliance with various policies and procedures and with applicable securities laws. Based on the factors above, as well as those discussed below, the Board concluded that it was satisfied with the nature, extent and quality of the services provided to the Funds by the Adviser. Historical Performance The Board then considered the past performance of the Funds. The Board reviewed information regarding the performance history of the Funds over various time periods, including the year-to-date period, the most recent one-year period and the period since each Fund’s inception. The Board noted management’s explanation that analysis of investment performance, in absolute terms, is less relevant for the Funds than it is for actively managed funds, given the Funds’ index-based investment objectives. The Board also noted management’s further explanation that it is more relevant to review the performance of the Funds by focusing on the extent to which each Fund tracked its underlying index. The Board reviewed information regarding each Fund’s index tracking during the time it was managed by the Adviser, discussing, as applicable, factors which contributed to each Fund’s tracking error over certain periods of time. The Board noted that the Funds had underperformed their underlying indexes over certain periods, but that such underperformance was, at least in part, a result of costs incurred by the Funds not incurred by their underlying indexes. The Board considered other factors that contributed to the Funds’ tracking error, including the cash drag, the effect of trading stocks denominated in foreign currencies and the effects of rebalancing index components. The Board noted that the Funds’ performance was nonetheless generally in line with that of their underlying indexes. The Board concluded that, after taking these factors into account, each of the Funds satisfactorily tracked its underlying index. The Board further noted that it had received and would continue to receive regular reports regarding each Fund’s performance at its quarterly meetings. Cost of Services Provided and Economies of Scale The Board reviewed the advisory fees for the Funds and compared them to the total operating expenses of comparable ETFs, as determined by an independent third party. Among other information, the Board noted that the advisory fee for each of the Funds was higher than the average and median expense ratios for its comparable ETFs. The Board took into consideration management’s discussion of the fees, including that the Funds have niche investment strategies and limited comparable ETFs. The Board also noted the importance of the fact that the advisory fee for each Fund is a “unified fee,” meaning that the shareholders of the Funds pay no expenses other than the advisory fee and certain other costs such as interest, brokerage and extraordinary expenses and, to the extent it is implemented, fees pursuant to a Distribution and/or Shareholder Servicing (12b-1) Plan. The Board further noted that the Adviser was responsible for compensating the Trust’s other service providers and paying the Funds’ other expenses out of its own fees and resources. The Board also evaluated the compensation and benefits received by the Adviser from its relationship with the Funds, taking into account an analysis of the Adviser’s profitability provided at the meeting. The Board concluded that the advisory fee for each of the Funds was reasonable in light of the factors considered.

59
ETFMG™ ETFs
APPROVAL OF ADVISORY AGREEMENTS AND BOARD CONSIDERATIONS For the Period Ended March 31, 2018 (Unaudited) (Continued)
In addition, the Board considered whether economies of scale may be realized for the Funds. The Board noted that the Adviser regularly considers whether fee reductions are appropriate as the Funds grow in size. The Board noted that a unitary fee provides a level of certainty in expenses for the Funds. The Trustees concluded that the flat advisory fee was reasonable. Based on the Board’s deliberations and its evaluation of the information described above, the Board, including the Independent Trustees, unanimously: (a) concluded that the terms of the Advisory Agreement are fair and reasonable; (b) concluded that the Adviser’s fees are reasonable in light of the services that the Adviser provides to the Funds; and (c) approved the renewal of the Advisory Agreement for another year.
60
ETFMG™ ETFs
EXPENSE EXAMPLES For the Six Months Ended March 31, 2018 (Unaudited)
As a shareholder of ETFMG Prime Junior Silver ETF, ETFMG Prime Cyber Security ETF, ETFMG Prime Mobile Payments ETF, ETFMG Drone Economy Strategy ETF, and ETFMG Video Game Tech ETF (the “Funds”) you incur two types of costs: (1) transaction costs, including brokerage commissions on purchases and sales of Fund shares, and (2) ongoing costs, including unitary fees and other Fund expenses. These examples are intended to help you understand your ongoing costs (in dollars) of investing in the Funds and to compare these costs with the ongoing costs of investing in other funds. The examples are based on an investment of $1,000 invested at the beginning of the period and held for the entire period (October 1, 2017 to March 31, 2018). Actual Expenses The first line of the table provides information about actual account values based on actual returns and actual expenses. You may use the information in this line, together with the amount you invested, to estimate the expenses that you paid over the period. Simply divide your account value by $1,000 (for example, an $8,600 account value divided by $1,000 = 8.6), then, multiply the result by the number in the first line under the heading entitled "Expenses Paid During Period'' to estimate the expenses you paid on your account during this period. Hypothetical Example for Comparison Purposes The second line of the table provides information about hypothetical account values based on a hypothetical return and hypothetical expenses based on the Fund's actual expense ratio and an assumed rate of return of 5% per year before expenses, which is not the Fund's actual return. The hypothetical account values and expenses may not be used to estimate the actual ending account balance or expenses you paid for the period. You may use this information to compare the ongoing costs of investing in the Fund and other funds. To do so, compare this 5% hypothetical example with the 5% hypothetical examples that appear in the shareholder reports of the other funds. Please note that the expenses shown in the table are meant to highlight your ongoing costs only and do not reflect any transactional costs, such as brokerage commissions paid on purchases and sales of Fund shares. Therefore, the second line of the table is useful in comparing ongoing costs only and will not help you determine the relative total costs of owning different funds. If these transactional costs were included, your costs would have been higher.
Fund Name Beginning Account
Value October 1, 2017 Ending Account Value
March 31, 2018 Expenses Paid During
the Period ^
ETFMG Prime Junior Silver ETF
Actual $ 1,000.00 $ 897.40 $ 3.26
Hypothetical (5% annual) 1,000.00 1,021.49 3.48
ETFMG Prime Cyber Security ETF
Actual 1,000.00 1,138.30 3.20
Hypothetical (5% annual) 1,000.00 1,021.94 3.02
ETFMG Prime Mobile Payments ETF
Actual 1,000.00 1,112.60 3.95
Hypothetical (5% annual) 1,000.00 1,021.19 3.78
ETFMG Drone Economy Strategy ETF
Actual 1,000.00 960.70 3.67
Hypothetical (5% annual) 1,000.00 1,021.19 3.78
ETFMG Video Game Tech ETF
Actual 1,000.00 1,092.40 3.91
Hypothetical (5% annual) 1,000.00 1,021.19 3.78
^ The dollar amounts shown as expenses paid during the period are equal to the annualized six-month expense ratio multiplied by the average account value during the period, multiplied by 182/365 (to reflect the period from October 1, 2017 to March 31, 2018).
61
ETFMG™ ETFs
SUPPLEMENTARY INFORMATION March 31, 2018
INFORMATION ABOUT PORTFOLIO HOLDINGS Each Fund files its Form N-Q with the Securities and Exchange Commission (the ‘‘SEC’’) no more than sixty days after the Funds’ first and third fiscal quarters. For each Fund, this would be for the fiscal quarters ending June 30 and December 31. Form N-Q includes a complete schedule of the Funds’ portfolio holdings as of the end of those fiscal quarters. The Funds’ N-Q filings can be found free of charge on the SEC’s website at http://www.sec.gov, or they may be reviewed and copied at the SEC’s Public Reference Room in Washington, D.C. (call 800-SEC-0330 for information on the operation of the Public Reference Room). The Funds’ portfolio holdings are posted on the Funds’ website at www.ETFMG.com daily. INFORMATION ABOUT PROXY VOTING A description of the policies and procedures the Funds use to determine how to vote proxies relating to portfolio securities is provided in the Statement of Additional Information (“SAI”). The SAI is available without charge upon request by calling toll-free at (877) 756-7873, by accessing the SEC’s website at www.sec.gov, or by accessing the Funds’ website at www.etfmgfunds.com. Information regarding how the Funds voted proxies relating to portfolio securities during the period ending June 30 is available by calling toll-free at (877) 756-7873 or by accessing the SEC’s website at www.sec.gov. Carefully consider the Fund’s investment objectives, risk factors, charges, and expenses before investing. This and additional information can be found in the Fund’s prospectus, which may be obtained by calling 1-844-ETF-MGRS (1-844-383-6477) or by visiting www.etfmgfunds.com. Read the prospectus carefully before investing.

(This page intentionally left blank)

Advisor ETF Managers Group, LLC
30 Maple Street, Suite 2, Summit, NJ 07901
Distributor ETFMG Financial, Inc.
30 Maple Street, Suite 2, Summit, NJ 07901
Custodian U.S. Bank National Association
Custody Operations 1555 North River Center Drive, Suite 302, Milwaukee, Wisconsin 53212
Transfer Agent
U.S. Bancorp Fund Services, LLC 615 East Michigan Street, Milwaukee, Wisconsin 53202
Securities Lending Agent
U.S Bank, National Association Securities Lending 800 Nicolet Mall
Minneapolis, MN 55402-7020
Independent Registered Public Accounting Firm WithumSmith + Brown, PC
1411 Broadway, 9th Floor, New York, NY 10018
Legal Counsel Sullivan & Worcester LLP
1666 K Street NW, Washington, DC 20006