semi-annual report for the period ended 30 june...
TRANSCRIPT

Phillip Investment Funds
Semi-Annual Report
For the period ended 30 June 2016
PHILLIP INVESTMENT FUNDS ___________________________________________________________________________
1
CONTENTS Page
Directory 2
Manager’s Investment Report 4
Statements of Total Return 22
Statements of Financial Position 23
Statements of Movements of Unitholders’ Funds 24
Statements of Portfolio 26
Important information 38

PHILLIP INVESTMENT FUNDS ___________________________________________________________________________
2
DIRECTORY
MANAGER
Phillip Capital Management (S) Ltd
250 North Bridge Road #06-00
Raffles City Tower
Singapore 179101
DIRECTORS OF THE MANAGER
Lim Hua Min
Jeffrey Lee Chay Khiong
Linus Lim Wen Sheong
Lee Ken Hoon
Lim Wai Sai
Louis Wong Wai Kit
TRUSTEE
Citicorp Trustee (Singapore) Limited
5 Changi Business Park Crescent
Level 5
Singapore 486027
With effect from 1 July 2016:
BNP Paribas Trust Services Singapore Limited
20 Collyer Quay, #01-01
Singapore 049319
Company Registration Number: 200800851W
CUSTODIAN
Citibank N.A. Singapore Branch
5 Changi Business Park Cresecent
Level 5
Singapore 486027
With effect from 1 July 2016:
BNP Paribas Securities Services Singapore Branch
20 Collyer Quay, #01-01
Singapore 049319
Company Registration No. T08FC7287D
REGISTRAR
Boardroom Corporate & Advisory Services Pte Ltd
50 Raffles Place #32-01
Singapore Land Tower
Singapore 048623

PHILLIP INVESTMENT FUNDS ___________________________________________________________________________
3
REGISTRAR (cont’d)
With effect from 1 July 2016:
BNP Paribas Trust Services Singapore Limited
20 Collyer Quay, #01-01
Singapore 049319
Company Registration Number: 200800851W
AUDITORS
KPMG LLP
16 Raffles Quay #22-00
Hong Leong Building
Singapore 048581

PHILLIP INVESTMENT FUNDS
________________________________________________________________________
4
Phillip Money Market Fund
MANAGER’S REPORT
For the half year ended 30 June 2016, the fund generated a net return of 0.46% and 0.87%
for the 6-month and 1-year period respectively.
As of 30 June 2016, the portfolio’s Weighted Average Maturity (“WAM”) stood at 108
days while liquidity profile remains strong with a one-month liquidity of 27%. The bond
portfolio’s credit ratings generally have a minimum rating of A, and remains well-diversified in terms of sector and geographical holdings.
Based on data from the Ministry of Trade & Industry (“MTI”) for first quarter 2016, the
Singapore economy expanded 2.1% year-on-year. Economic growth was supported by the
construction and services sector, while manufacturing continued to drag, with output
decline from the transport engineering, precision engineering and electronics clusters. The
construction sector was boosted by higher public and private sector construction activities,
growing 4.5% year-on-year, while the services sector’s growth came in at 1.7% year-on-year, supported by the wholesale & retail, and finance & insurance sectors.
According to the Monetary Authority of Singapore (“MAS”), core inflation for the first
quarter came in at 0.5% year-on-year following a smaller decline in global oil prices and
the diminishing disinflationary impact of budgetary measures of medical subsidies and
foreign worker levy concessions. In response to the SGD’s strength and concerns on the
growth prospects for the domestic economy, MAS eased its monetary policy with the
adoption of a neutral appreciation stance for the Singapore dollar nominal effective
exchange rate (“SGD NEER”) slope.
Short-term domestic interest rates declined over the first half of the year, primarily
induced by the market pricing in a more benign US Federal Reserve monetary policy and
MAS’ decision to implement a zero percent appreciation stance for the SGD NEER.The 1
month and 3 months’yields of SGD Singapore Swap Offer Rate (“SOR”) decreased from
1.41% and 1.66% in January 2016 to 0.59% and 0.81% respectively as of end June 2016, a
by-product of a weaker domestic currency. Similarly, the 1-month and 3-month rates of
the SGD Inter-Bank Offer Rate (“SIBOR”) also declined by 0.36 bps and 0.26 bps over the same period.
OUTLOOK
According to MTI, the Singapore economy remains on track to achieve its growth forecast
of 1-2% for 2016 despite lacklustre global growth prospects and downside risks attached
to key macroeconomic events such as the Brexit vote, US economic growth and a softer
Chinese economy. Core inflation is likely to average 1% for the year, constrained by
weaker external prices and softer labour market conditions. A gradual pick up in the
inflation data towards its long-term average of 2.0% in 2017 is expected to be supported
by firmer global energy prices and growth in domestically-oriented sectors. As such, we
expect the outlook on the interest rate environment to remain stable given the declining
need for MAS to conduct further monetary policy easing.

PHILLIP INVESTMENT FUNDS
________________________________________________________________________
5
We maintain our strategy of keeping a strong liquidity profile with one-month liquidity of
20%, prudent management of interest rate risk through staggered maturities, and
maintaining a target portfolio WAM of within 120 days.

PHILLIP INVESTMENT FUNDS
________________________________________________________________________
6
a) I Investment Classified by Geography
Fair Value
as at
Percentage of
Net Assets
Attributable to
Unitholders as at
30/06/2016 30/06/2016
S$ %
By Geography (Summary)
Cayman Islands 9,004,500 1.42
China 56,308,697 8.88
Japan 45,039,900 7.11
Luxembourg 9,845,000 1.55
Malaysia 30,005,250 4.73
Singapore
South Korea
89,170,980
28,045,500
14.07
4.42
United Arab Emirates 19,820,000 3.13
United Kingdom 10,001,000 1.58
Accrued interest on debt securities 1,576,476 0.25
Portfolio of investments 298,817,303 47.14
Other net assets 335,010,911 52.86
Net assets attributable to unitholders 633,828,214 100.00
a) II Investment Classified by Industry
Fair Value
as at
Percentage of
Net Assets
Attributable to
Unitholders as
at
30/06/2016 30/06/2016
S$ %
By Industry (Summary)
Banks & financials 216,040,793 34.09
Government agency 19,550,393 3.08
Real estate 51,051,708 8.05
REITS 7,105,770 1.12
Transportation 3,492,163 0.55
Accrued interest on debt securities 1,576,476 0.25
Portfolio of investments 298,817,303 47.14
Other net assets 335,010,911 52.86
Net assets attributable to unitholders 633,828,214 100.00
PHILLIP INVESTMENT FUNDS
________________________________________________________________________
7
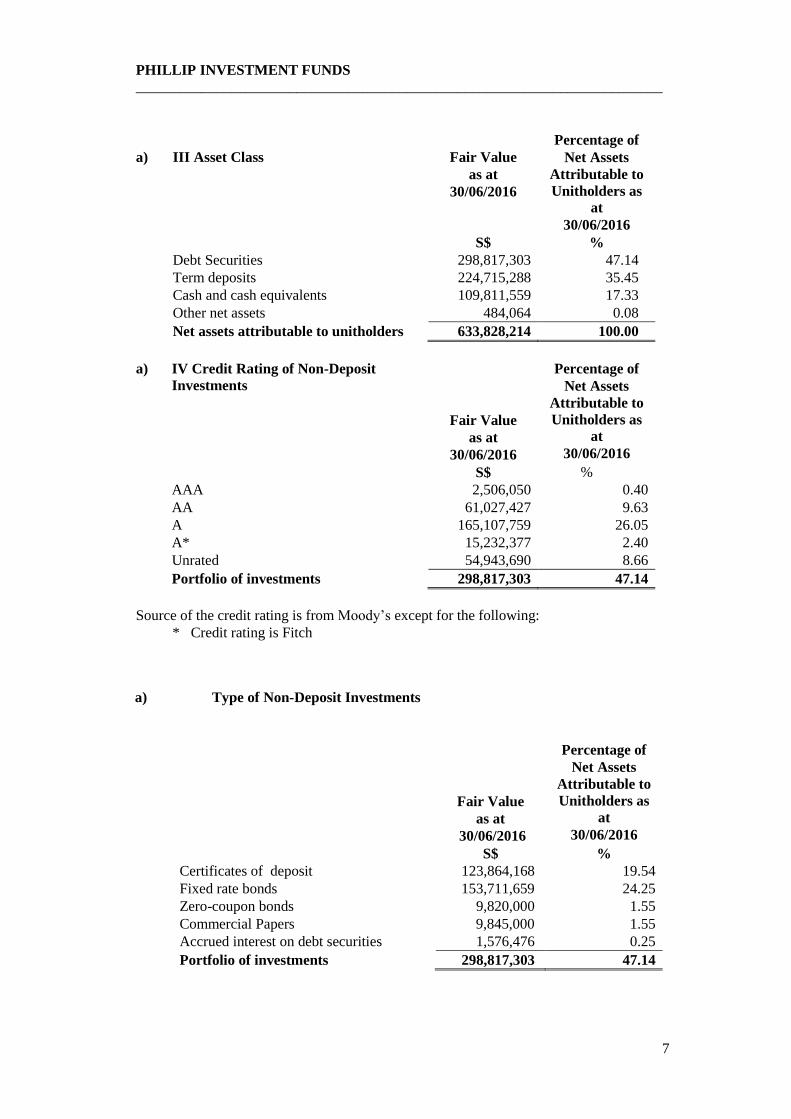
a)
III Asset Class
Fair Value
as at
30/06/2016
Percentage of
Net Assets
Attributable to
Unitholders as
at
30/06/2016
S$ %
Debt Securities 298,817,303 47.14
Term deposits 224,715,288 35.45
Cash and cash equivalents 109,811,559 17.33
Other net assets 484,064 0.08
Net assets attributable to unitholders 633,828,214 100.00
a) IV Credit Rating of Non-Deposit
Investments
Fair Value
as at
30/06/2016
Percentage of
Net Assets
Attributable to
Unitholders as
at
30/06/2016
S$ %
AAA 2,506,050 0.40
AA 61,027,427 9.63
A 165,107,759 26.05
A* 15,232,377 2.40
Unrated 54,943,690 8.66
Portfolio of investments 298,817,303 47.14
Source of the credit rating is from Moody’s except for the following:
* Credit rating is Fitch
a) Type of Non-Deposit Investments
Fair Value
as at
30/06/2016
Percentage of
Net Assets
Attributable to
Unitholders as
at
30/06/2016
S$ %
Certificates of deposit 123,864,168 19.54
Fixed rate bonds 153,711,659 24.25
Zero-coupon bonds 9,820,000 1.55
Commercial Papers 9,845,000 1.55
Accrued interest on debt securities 1,576,476 0.25
Portfolio of investments 298,817,303 47.14

PHILLIP INVESTMENT FUNDS
________________________________________________________________________
8
a) Maturity Profile of Underlying
Investments
Fair Value
as at
30/06/2016
Percentage of
Net Assets
Attributable to
Unitholders as at
30/06/2016
S$ %
Up to 30 days 61,459,537 9.70
31 to 60 days 74,167,752 11.70
61 to 90 days 86,123,913 13.59
91 to 120 days 50,138,007 7.91
121 to 180 days 105,656,609 16.67
181 to 365 days 89,135,163 14.06
366 to 732 days 55,275,134 8.72
Accrued interest on debt securities 1,576,476 0.25
523,532,591 82.60
b) Top Ten Holdings
10 Largest Holdings as at 30
June 2016
Fair Value
as at
30/06/2016
S$
Percentage of
Net Assets
Attributable to
Unitholders as at
30/06/2016
%
Ascott Capital 3.8% Due
11/10/16 27,704,325 4.37
Industrial & Commercial Bank
of China/Sydney 1.74% Due
06/06/17 15,018,750 2.37
Lloyds Bank PLC 1.90% Due
09/16/16 15,007,500 2.37
Sumitomo Mitsui Bank SG
1.25% Due 08/11/16 15,000,000 2.37
Industrial & Commercial Bank
of China/Sydney 0% Due
05/18/17 14,767,500 2.33
Capitamalls Asia 3.95% Due
08/24/17 12,775,125 2.02
Bank of Communication Hong
Kong 2.1% Due 07/24/17 12,500,875 1.97
Export-Import Bank of Korea
2.07% Due 04/06/17 10,049,000 1.58
Industrial & Commercial Bank
China Sydney 1.8% Due
09/15/16 10,019,000 1.58
ICICI Bank UK 1.6% Due
08/05/16 10,001,000 1.58
PHILLIP INVESTMENT FUNDS
________________________________________________________________________
9
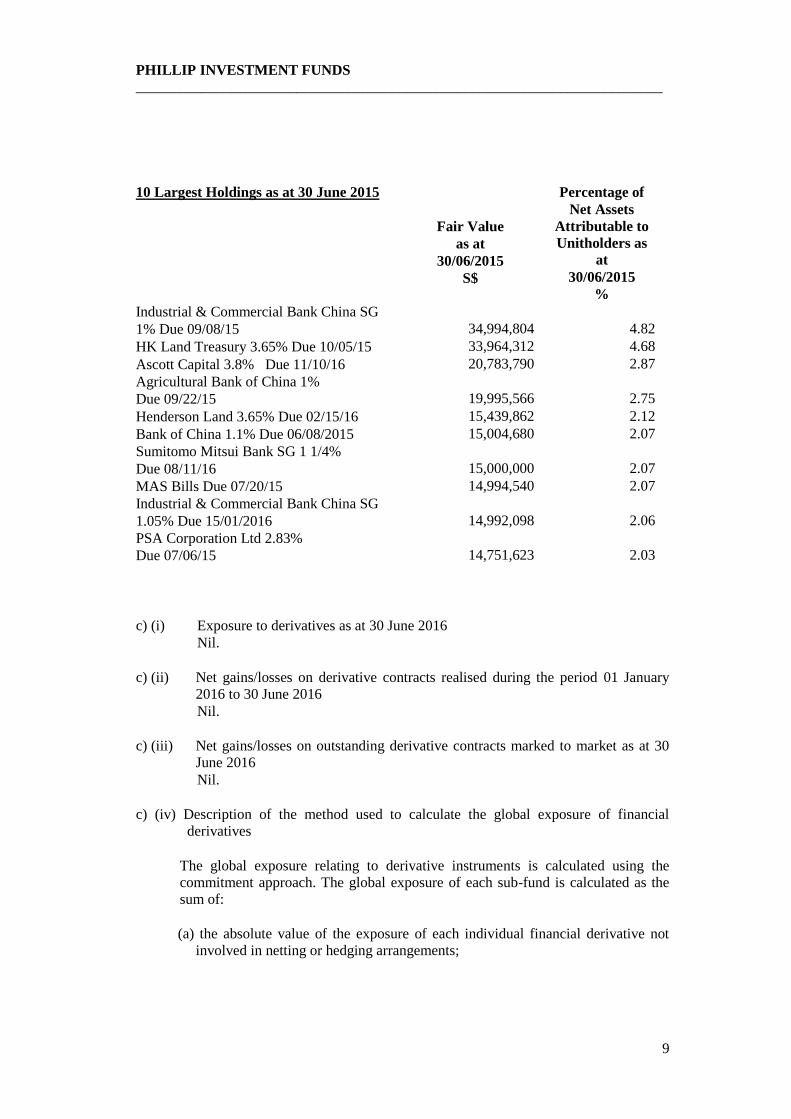
10 Largest Holdings as at 30 June 2015
Fair Value
as at
30/06/2015
S$
Percentage of
Net Assets
Attributable to
Unitholders as
at
30/06/2015
%
Industrial & Commercial Bank China SG
1% Due 09/08/15 34,994,804 4.82
HK Land Treasury 3.65% Due 10/05/15 33,964,312 4.68
Ascott Capital 3.8% Due 11/10/16 20,783,790 2.87
Agricultural Bank of China 1%
Due 09/22/15 19,995,566 2.75
Henderson Land 3.65% Due 02/15/16 15,439,862 2.12
Bank of China 1.1% Due 06/08/2015 15,004,680 2.07
Sumitomo Mitsui Bank SG 1 1/4%
Due 08/11/16 15,000,000 2.07
MAS Bills Due 07/20/15 14,994,540 2.07
Industrial & Commercial Bank China SG
1.05% Due 15/01/2016 14,992,098 2.06
PSA Corporation Ltd 2.83%
Due 07/06/15 14,751,623 2.03
c) (i) Exposure to derivatives as at 30 June 2016
Nil.
c) (ii) Net gains/losses on derivative contracts realised during the period 01 January
2016 to 30 June 2016
Nil.
c) (iii) Net gains/losses on outstanding derivative contracts marked to market as at 30
June 2016
Nil.
c) (iv) Description of the method used to calculate the global exposure of financial
derivatives
The global exposure relating to derivative instruments is calculated using the
commitment approach. The global exposure of each sub-fund is calculated as the
sum of:
(a) the absolute value of the exposure of each individual financial derivative not
involved in netting or hedging arrangements;

PHILLIP INVESTMENT FUNDS
________________________________________________________________________
10
(b) the absolute value of the net exposure of each individual financial derivative
after netting or hedging arrangements; and
(c) the sum of the values of cash collateral received pursuant to:
(i) the reduction of exposure to counterparties of OTC financial derivatives;
and
(ii) efficient portfolio management techniques relating to securities lending and repurchase transactions,
and that are reinvested.
d) Amount and percentage of total fund size invested in other unit trusts, mutual funds and collective investment schemes as at 30 June 2016
Nil
e) Amount and percentage of borrowings of total fund size as at 30 June 2016
Nil
f) Amount of redemptions and subscriptions for the period 01 January 2016 to 30 June 2016.
Total amount of redemptions S$ 954,929,148
Total amount of subscriptions S$ 936,072,301
g) Amount of related party transactions for the period 1 January 2016 to 30 June 2016
Bank balances held with related parties of the trustee S$57,128,291
h) Performance of the Fund as at 30 June 2016
3
months
6
months
1
year
3
years
5
years
10
years
Inception
(on 16 Apr 2001)
Cumulative
returns (%)
0.22 0.46 0.87 1.82 2.91 10.31 17.65
Annualised
returns (%)
- - 0.87 0.60 0.58 0.99 1.07
Benchmark
cumulative
(%)
0.04 0.07 0.14 0.37
0.60
1.62 3.85
Benchmark
annualised
(%)
- - 0.14 0.12 0.12 0.16 0.25
Note: Returns are calculated in Singapore dollars on a bid to bid basis, with net dividends
reinvested.
Source: Bloomberg
Benchmark: Bank savings deposit.
PHILLIP INVESTMENT FUNDS
________________________________________________________________________
11
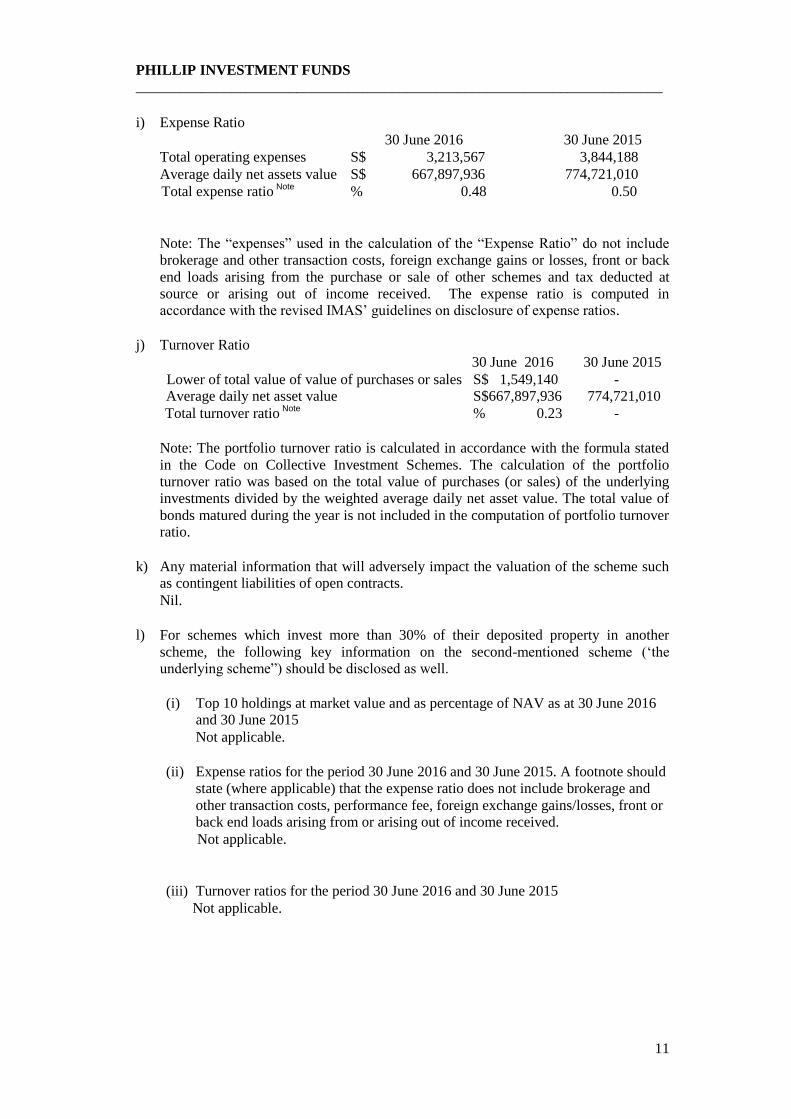
i) Expense Ratio
30 June 2016 30 June 2015
Total operating expenses S$ 3,213,567 3,844,188
Average daily net assets value S$ 667,897,936 774,721,010
Total expense ratio Note
% 0.48 0.50
Note: The “expenses” used in the calculation of the “Expense Ratio” do not include
brokerage and other transaction costs, foreign exchange gains or losses, front or back
end loads arising from the purchase or sale of other schemes and tax deducted at
source or arising out of income received. The expense ratio is computed in accordance with the revised IMAS’ guidelines on disclosure of expense ratios.
j) Turnover Ratio
30 June 2016 30 June 2015
Lower of total value of value of purchases or sales S$ 1,549,140 - Average daily net asset value S$667,897,936 774,721,010
Total turnover ratio Note
% 0.23 -
Note: The portfolio turnover ratio is calculated in accordance with the formula stated
in the Code on Collective Investment Schemes. The calculation of the portfolio
turnover ratio was based on the total value of purchases (or sales) of the underlying
investments divided by the weighted average daily net asset value. The total value of
bonds matured during the year is not included in the computation of portfolio turnover ratio.
k) Any material information that will adversely impact the valuation of the scheme such as contingent liabilities of open contracts.
Nil.
l) For schemes which invest more than 30% of their deposited property in another
scheme, the following key information on the second-mentioned scheme (‘the underlying scheme”) should be disclosed as well.
(i) Top 10 holdings at market value and as percentage of NAV as at 30 June 2016 and 30 June 2015
Not applicable.
(ii) Expense ratios for the period 30 June 2016 and 30 June 2015. A footnote should
state (where applicable) that the expense ratio does not include brokerage and
other transaction costs, performance fee, foreign exchange gains/losses, front or back end loads arising from or arising out of income received.
Not applicable.
(iii) Turnover ratios for the period 30 June 2016 and 30 June 2015
Not applicable.

PHILLIP INVESTMENT FUNDS
________________________________________________________________________
12
m) Soft dollar arrangements
The Manager is entitled to and intends to receive or enter into soft-dollar commissions
or arrangements. The Manager will comply with applicable regulatory and industry
standards on soft-dollars. The soft-dollar commissions which The Manager may
receive include research and advisory services, economic and political analyses,
portfolio analyses including valuation and performance measurements, market
analyses, data and quotation services, computer hardware and software or any other
information facilities to the extent that they are used to support the investment
decision making process, the giving of advice, or the conduct of research or analysis in
relation to the investments managed for clients. The soft dollar credits utilised are not
allocated on a specific client basis. The brokers also execute trades for other funds managed by the Manager.
The Manager will not accept or enter into soft dollar commissions or arrangements
unless such soft-dollar commissions or arrangements would, in the opinion of the
Manager, assist the Manager in its management of clients’ funds, provided that the
Manager shall ensure at all times that transactions are executed on the best available
terms taking into account the relevant market at the time for transactions of the kind
and size concerned, and that no unnecessary trades are entered into in order to qualify
for such soft-dollar commissions or arrangements.
The Manager does not, and is not entitled to retain cash rebates for its own account in
respect of rebates earned when transacting in securities for account of clients’ funds.
The Manager did not receive any soft dollar services in respect of the Fund during the period.

PHILLIP INVESTMENT FUNDS
________________________________________________________________________
13
Phillip Income Fund
MANAGER’S REPORT
First half of 2016 has been a volatile period. The year started with a bumpy Chinese
equity market; then the US Federal Reserve talked of policy normalization, but it
subsequently backtracked due to China’s growth slowdown. In June a key event came
from the United Kingdom, when on 23rd June, its population voted to exit the European
Union by a thin majority.
The Fund YTD’s return was -1% (on a bid-to-bid basis). For the period under review, the
Fund’s return attributions from equity and fixed income portfolios were -1.2% and +1.24%
respectively. For the same period, the MSCI World Total Return Index fell 4.18% and the
iBoxx Asian Bond Fund Pan-Asia Index was up 1.34%. (All returns are in SGD terms).
As of 30 June 2016, the Fund’s asset allocation comprises 48% equities, 10% REITS, 31%
fixed income securities and 11% cash. During the period under review, the Fund took
profits on equity positions as markets rebounded from February’s lows. S-Reits was a
strong performer, up 10%. Equity allocation was reduced from 57% to 48% while REITS
allocation remained at 10%.
Bonds were generally positive. Asian credits continued to offer attractive spreads with
good corporate fundamentals. The Fund has a weighted portfolio duration of 5.4 years,
which is at the sweet spot of the yield curve. The portfolio is also over-weight on Asian
bonds which enjoy credit spreads tightening as chasing yields remained the main focus of
investors. As a result of the Brexit referendum, the major currencies GBP, USD and
Chinese Yuan depreciated against safe-haven currencies such as the Singapore Dollar and
Japanese Yen.
OUTLOOK
We believe the economic impact on global growth from Brexit will be fairly modest but
will take time to play out. Markets have recovered sharply post the initial sell-off from the
UK referendum on June 23. Equity markets (MSCI global index) ended June just 1.1%
lower month-on-month.
With markets anticipating that the US Federal Reserve will delay rate hikes due to
economic uncertainty arising from Brexit, benchmark rates plunged, with 10 year US
Treasury yields falling 38bps to 1.47%, 10 year Bunds yields turning negative at -0.13%
and 10 year Japan Government Bond yields ending 11bps lower at -0.22% through the
month of June. Consequently, Singapore’s 10-year government bond yields fell 20 basis
points and is expected to remain below 2%.
At current yield levels, Singapore REIT valuations look attractive with forward yields of
6.4% and a corresponding yield spread of 4.7%. We will increase focus on REITS and
high yield stocks for the equity portfolio, which will also be well supported by dividend
income.

PHILLIP INVESTMENT FUNDS
________________________________________________________________________
14
The Fund will retain a global market allocation for diversification benefits. The Fund’s
strategy of multi-asset investing will remain, with a bias towards dividend yielding
equities, as these are anticipated to perform better in a global environment with low
inflation and modest economic growth. However, the Fund will maintain a core bond
position of up to 30% in its portfolio. The Manager may also include hedging strategies in
currencies and derivatives for the portfolio.
PHILLIP INVESTMENT FUNDS
________________________________________________________________________
15
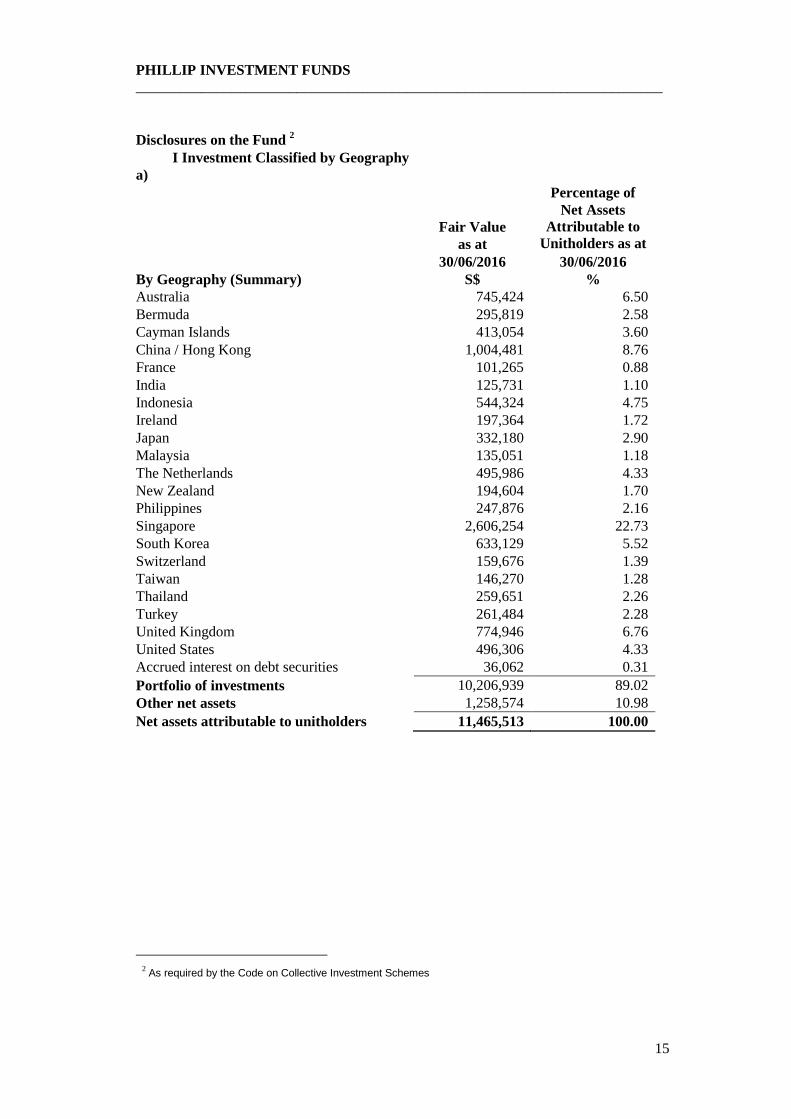
Disclosures on the Fund 2
a)
I Investment Classified by Geography
Fair Value
as at
Percentage of
Net Assets
Attributable to
Unitholders as at
30/06/2016 30/06/2016
By Geography (Summary) S$ %
Australia 745,424 6.50
Bermuda 295,819 2.58
Cayman Islands 413,054 3.60
China / Hong Kong 1,004,481 8.76
France 101,265 0.88
India 125,731 1.10
Indonesia 544,324 4.75
Ireland 197,364 1.72
Japan 332,180 2.90
Malaysia 135,051 1.18
The Netherlands 495,986 4.33
New Zealand 194,604 1.70
Philippines 247,876 2.16
Singapore 2,606,254 22.73
South Korea 633,129 5.52
Switzerland 159,676 1.39
Taiwan 146,270 1.28
Thailand 259,651 2.26
Turkey 261,484 2.28
United Kingdom 774,946 6.76
United States 496,306 4.33
Accrued interest on debt securities 36,062 0.31
Portfolio of investments 10,206,939 89.02
Other net assets 1,258,574 10.98
Net assets attributable to unitholders 11,465,513 100.00
2 As required by the Code on Collective Investment Schemes
PHILLIP INVESTMENT FUNDS
________________________________________________________________________
16
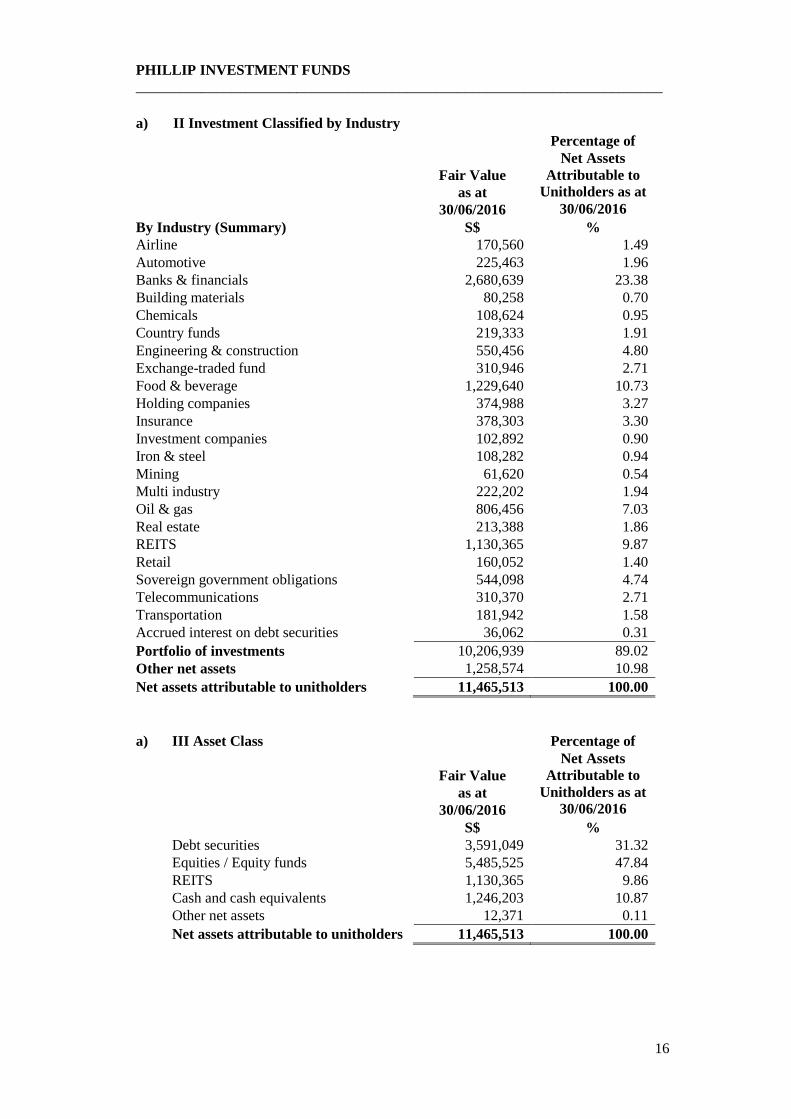
a) II Investment Classified by Industry
Fair Value
as at
30/06/2016
Percentage of
Net Assets
Attributable to
Unitholders as at
30/06/2016
By Industry (Summary) S$ %
Airline 170,560 1.49
Automotive 225,463 1.96
Banks & financials 2,680,639 23.38
Building materials 80,258 0.70
Chemicals 108,624 0.95
Country funds 219,333 1.91
Engineering & construction 550,456 4.80
Exchange-traded fund 310,946 2.71
Food & beverage 1,229,640 10.73
Holding companies 374,988 3.27
Insurance 378,303 3.30
Investment companies 102,892 0.90
Iron & steel 108,282 0.94
Mining 61,620 0.54
Multi industry 222,202 1.94
Oil & gas 806,456 7.03
Real estate 213,388 1.86
REITS 1,130,365 9.87
Retail 160,052 1.40
Sovereign government obligations 544,098 4.74
Telecommunications 310,370 2.71
Transportation 181,942 1.58
Accrued interest on debt securities 36,062 0.31
Portfolio of investments 10,206,939 89.02
Other net assets 1,258,574 10.98
Net assets attributable to unitholders 11,465,513 100.00
a) III Asset Class
Fair Value
as at
30/06/2016
Percentage of
Net Assets
Attributable to
Unitholders as at
30/06/2016
S$ %
Debt securities 3,591,049 31.32
Equities / Equity funds 5,485,525 47.84
REITS 1,130,365 9.86
Cash and cash equivalents 1,246,203 10.87
Other net assets 12,371 0.11
Net assets attributable to unitholders 11,465,513 100.00

PHILLIP INVESTMENT FUNDS
________________________________________________________________________
17
a)
IV Credit Rating of Debt Securities
Fair Value
as at
30/06/2016
Percentage of
Net Assets
Attributable to
Unitholders as at
30/06/2016
S$ %
AA 196,686 1.72
A 843,009 7.35
BBB 1,516,399 13.23
BB 549,113 4.79
Baa* 263,847 2.30
Unrated 221,995 1.94
3,591,049 31.33
Source of the credit rating is from Standard & Poor’s except for the following:
* Credit rating is from Moody’s
b) Top Ten Holdings
10 Largest Holdings as at 30 June 2016
Fair Value
as at
30/06/2016
Percentage of
Net Assets
Attributable to
Unitholders as at
30/06/2016
S$ %
Unilever 2.95% Due 02/27/17 403,296 3.52
Lendlease Group 4.5% Due 5/26/26 337,876 2.95
CSOP FTSE China A50 ETF 310,946 2.71
BP PLC 285,203 2.49
Perusahaan Penerbit SBSN Indo III
4.55% Due 03/29/26
282,613 2.46
BOC Aviation 3.875% Due 04/27/26 276,376 2.41
CNOOC Finance 3.5% Due 05/05/25 274,104 2.39
Standard Chartered 4.05% Due 04/12/26 270,641 2.36
Pertamina Persero PT 5.625% Due
05/20/43
261,711 2.28
Republic of Turkey 3.25% 03/23/23 261,484 2.28

PHILLIP INVESTMENT FUNDS
________________________________________________________________________
18
b)
Top Ten Holdings
10 Largest Holdings as at 30 June 2015
Fair Value
as at
30/06/2015
Percentage of
Net Assets
Attributable to
Unitholders as at
30/06/2015
S$ %
Societe Generale Due 02/04/16 582,355 4.73
Astra Sedaya Finance 2.875% Due
01/04/2018
268,663
2.18
Garuda ID Sukuk 5.95% Due 06/03/20 268,114 2.18
Turk Telekom 4 7/8% Due 06/19/24 266,702 2.16
Bei Jing State Asset 1/8% Due 05/26/25 262,091 2.13
US Treasury 2% Due 02/15/25 260,785 2.12
Alibaba Group 3.6% Due 11/28/24 258,341 2.10
Singapore Government 3% Due 09/01/24 257,500 2.09
Century Sunshine 7.2% Due 06/04/18 252,501 2.05
Rickmers Trust 8.45% Due 05/15/17 243,315 1.98
c) (i) Exposure to derivatives as at 30 June 2016:
S$51,577
c) (ii) Net losses on derivative contracts realized for the period from 1 January 2016 to 30 June 2016
(S$81,308)
c) (iii) Net gains on outstanding derivative contracts marked to market as at 30 June 2016
S$39,801
c) (iv) Description of the method used to calculate the global exposure of financial derivatives
The global exposure relating to derivative instruments is calculated using the
commitment approach. The global exposure of each sub-fund is calculated as the sum of:
(a) the absolute value of the exposure of each individual financial derivative not involved in netting or hedging arrangements;
(b) the absolute value of the net exposure of each individual financial derivative
after netting or hedging arrangements; and
(c) the sum of the values of cash collateral received pursuant to:
PHILLIP INVESTMENT FUNDS
________________________________________________________________________
19
(i) the reduction of exposure to counterparties of OTC financial derivatives;
and
(ii) efficient portfolio management techniques relating to securities lending and repurchase transactions,
and that are reinvested.
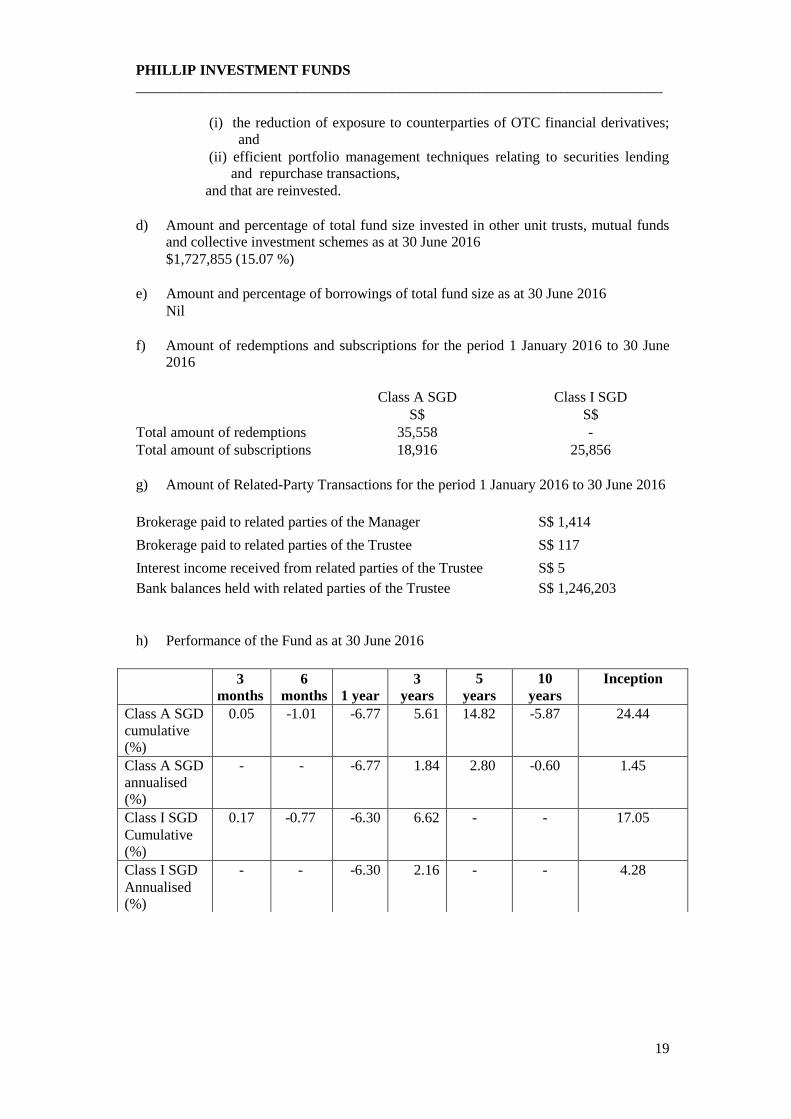
d) Amount and percentage of total fund size invested in other unit trusts, mutual funds and collective investment schemes as at 30 June 2016
$1,727,855 (15.07 %)
e) Amount and percentage of borrowings of total fund size as at 30 June 2016
Nil
f) Amount of redemptions and subscriptions for the period 1 January 2016 to 30 June 2016
Class A SGD Class I SGD
S$ S$
Total amount of redemptions 35,558 -
Total amount of subscriptions 18,916 25,856
g) Amount of Related-Party Transactions for the period 1 January 2016 to 30 June 2016
Brokerage paid to related parties of the Manager S$ 1,414
Brokerage paid to related parties of the Trustee S$ 117
Interest income received from related parties of the Trustee S$ 5
Bank balances held with related parties of the Trustee S$ 1,246,203
h) Performance of the Fund as at 30 June 2016
3
months
6
months 1 year
3
years
5
years
10
years
Inception
Class A SGD
cumulative (%)
0.05 -1.01 -6.77 5.61 14.82 -5.87 24.44
Class A SGD
annualised
(%)
- - -6.77 1.84 2.80 -0.60 1.45
Class I SGD
Cumulative
(%)
0.17 -0.77 -6.30 6.62 - - 17.05
Class I SGD
Annualised (%)
- - -6.30 2.16 - - 4.28

PHILLIP INVESTMENT FUNDS
________________________________________________________________________
20
Returns are calculated in Singapore dollars on a bid to bid basis, with net dividends
reinvested. Inception dates for Class A SGD and Class I SGD were 16 April 2001 and 28 September 2012 respectively.
Source: Bloomberg
i) Expense Ratio
30 June 2016 30 June 2015
Class A Class I Class A Class I
Total operating expenses S$ 28,612 162,850 27,543 174,316
Average daily net asset value S$ 1,393,587 10,388,810 1,455,502 10,537,085
Total expense ratio Note
% 2.05 1.57 1.89 1.65
Note: The “expenses” used in the calculation of the “Expense Ratio” do not include
brokerage and other transaction costs, performance fee (where applicable), foreign
exchange gains or losses, front or back end loads arising from the purchase or sale of
other schemes and tax deducted at source or arising out of income received. The
expense ratio is computed in accordance with the revised IMAS’ guidelines on disclosure of expense ratios.
j) Turnover Ratio
30 June 2016 30 June 2015
Lower of total value of value of purchases or sales S$14,251,172 25,388,461 Average daily net asset value S$11,782,397 11,992,587
Total turnover ratio Note
% 120.95 211.70
Note: The portfolio turnover ratio is calculated in accordance with the formula stated
in the Code on Collective Investment Schemes. The calculation of the portfolio
turnover ratio was based on the total value of purchases (or sales) of the underlying
investments divided by the weighted average daily net asset value. The total value of
bonds matured during the year is not included in the computation of portfolio turnover
ratio.
k) Any material information that will adversely impact the valuation of the scheme such as contingent liabilities of open contracts.
Nil
l) For schemes which invest more than 30% of their deposited property in another
scheme, the following key information on the second-mentioned scheme (‘the
underlying scheme”) should be disclosed as well.
(i) Top 10 holdings at market value and as percentage of NAV as at 30 June 2016
and 30 June 2015.
Not applicable.

PHILLIP INVESTMENT FUNDS
________________________________________________________________________
21
(ii) Expense ratios for the period 30 June 2016 and 30 June 2015. A footnote should
state (where applicable) that the expense ratio does not include brokerage and
other transaction costs, performance fee, foreign exchange gains/losses, front or
back end loads arising from or arising out of income received.
Not applicable.
(iii) Turnover ratios for the period 30 June 2016 and 30 June 2015
Not applicable.
m) Soft dollar arrangements
The Manager is entitled to and intends to receive or enter into soft-dollar commissions
or arrangements. The Manager will comply with applicable regulatory and industry
standards on soft-dollars. The soft-dollar commissions which the Manager may
receive include research and advisory services, economic and political analyses,
portfolio analyses including valuation and performance measurements, market
analyses, data and quotation services, computer hardware and software or any other
information facilities to the extent that they are used to support the investment
decision making process, the giving of advice, or the conduct of research or analysis
and custodial services in relation to the investments managed for clients. The soft
dollar credits utilised are not allocated on a specific client basis. The brokers also
execute trades for other funds managed by the Manager.
The Manager will not accept or enter into soft dollar commissions or arrangements
unless such soft-dollar commissions or arrangements would, in the opinion of the
Manager, assist the Manager in its management of clients’ funds, provided that the
Manager shall ensure at all times that transactions are executed on the best available
terms taking into account the relevant market at the time for transactions of the kind
and size concerned, and that no unnecessary trades are entered into in order to qualify for such soft-dollar commissions or arrangements.
The Manager does not, and is not entitled to retain cash rebates for its own account in respect of rebates earned when transacting in securities for account of clients’ funds.
During the period, soft dollar services received from each broker were investment
research and publications, data and quotation services. Soft dollars were received from
the Manager’s panel of brokers which executed transactions for the Fund and other funds managed by the Manager.

PHILLIP INVESTMENT FUNDS
________________________________________________________________________
22
Statements of Total Return
For the period ended 30 June 2016 (Unaudited)
Phillip Money
Market Fund
Phillip Income Fund
30 June
2016
30 June
2015
30 June
2016
30 June
2015
S$ S$ S$ S$
Income
Dividends - - 170,137 131,284
Interest 5,113,052 5,783,487 70,133 95,722
5,113,052 5,783,487 240,270 227,006
Less:
Expenses
Management fees 1,441,308 1,598,868 48,425 50,945
Management fees rebate - - - (540)
Trustee fees 64,068 71,929 2,715 2,582
Custody fees 21,985 27,334 8,219 8,174
Audit fees 8,169 10,188 8,169 10,188
Transaction costs - - 6,618 25,673
Other 48,083 198,591 28,710 33,862
1,583,613 1,906,910 102,856 130,884
Net income 3,529,439 3,876,577 137,414 96,122
Net gain or losses on
value of investments
and financial
derivatives
Net gains/(losses) on
investments
131,821 (1,421,562) (181,662) 500,713
Net (losses) on financial
derivatives
- - (41,507) (27,383)
131,821 (1,421,562) (223,169) 473,330
Total return for the
period before
income tax
3,661,260 2,455,015 (85,755) 569,452
Less: Income tax - - (17,788) (11,150)
Total return for the
period after income
tax before
distribution
3,661,260 2,455,015 (103,543) 558,302

PHILLIP INVESTMENT FUNDS
________________________________________________________________________
23
Statements of Financial Position
As at 30 June 2016 (Unaudited)
Phillip Money
Market Fund
Phillip Income Fund
30 June
2016
31
December
2015
30 June
2016
31
December
2015
S$ S$ S$ S$
Assets
Portfolio of investments
298,817,303 334,485,122 10,206,939 11,575,432
Receivables 1,434,303 1,311,035 22,382 228,040
Cash and cash
equivalents
334,526,847
314,405,618
1,246,203
349,318
Financial derivatives at
fair value
-
-
51,577
-
Total assets 634,778,453 650,201,775 11,527,101 12,152,790
Liabilities
Purchases awaiting
settlement
- 1,177,974 - 286,252
Payables 950,239 - 61,588 -
Financial derivatives at
fair value
- - - 20,707
Total liabilities 950,239 1,177,974 61,588 306,959
Equity
Net assets
attributable to
unitholders
633,828,214
649,023,801
11,465,513
11,845,016

PHILLIP INVESTMENT FUNDS
________________________________________________________________________
24
Statements of Movements of Unitholders’ Funds
For the period ended 30 June 2016 (Unaudited)
Phillip Money Market Fund
30 June 2016 31 December 2015
S$ S$
Net assets attributable to
unitholders at the beginning of
financial period/year
649,023,801 794,964,581
Operations
Changes in net assets attributable to
unitholders resulting from operations during the period/year
3,661,260 4,846,650
Unitholders’ contributions/
(withdrawals) during the
period/year
Creation of units 936,072,301 2,233,298,514
Cancellation of units (954,929,148) (2,384,085,944)
Change in net assets attributable to
unitholders resulting from net
creation and cancellation of units
(18,856,847) (150,787,430)
Distribution - -
Total (decrease)/increase in net assets
attributable to unitholders
(15,195,587) (145,940,780)
Net assets attributable to
unitholders at end of the financial
period/year
633,828,214 649,023,801
Units in issue 538,626,474 554,680,925
Net assets attributable to
unitholders per unit
1.1767 1.1701
PHILLIP INVESTMENT FUNDS
___________________________________________________________________________________________________________________________
25
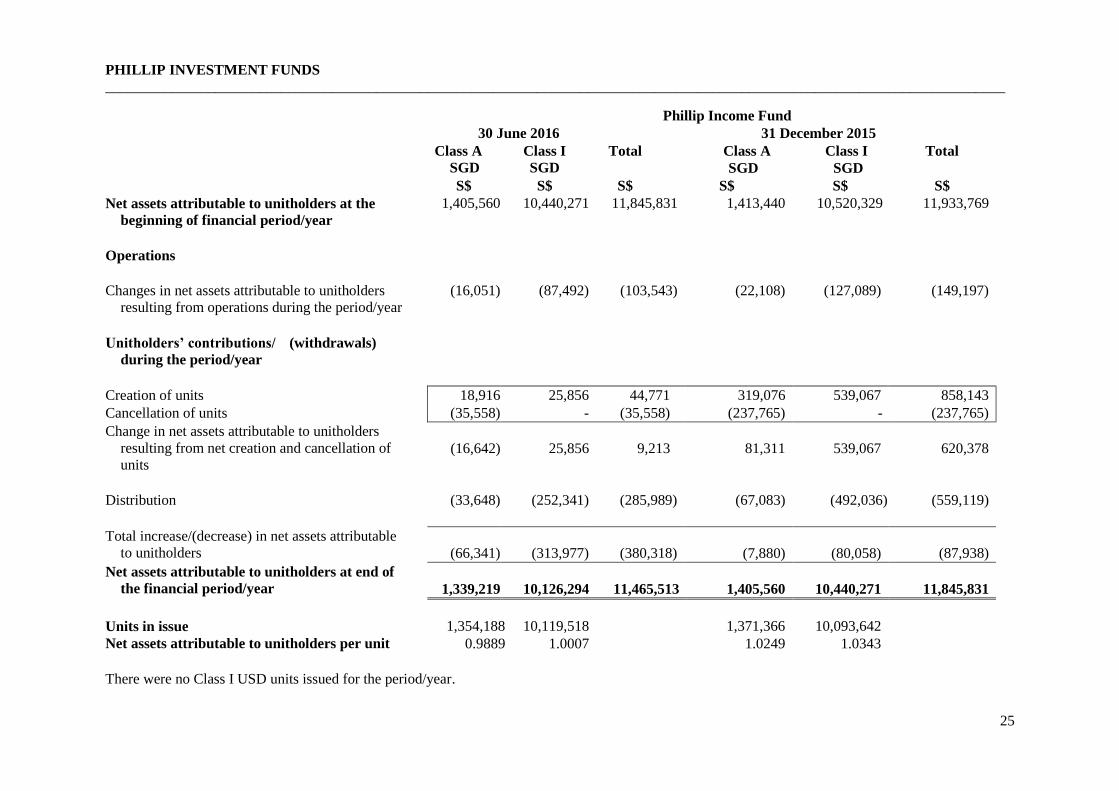
Phillip Income Fund
30 June 2016 31 December 2015
Class A
SGD
Class I
SGD
Total Class A
SGD
Class I
SGD
Total
S$ S$ S$ S$ S$ S$
Net assets attributable to unitholders at the
beginning of financial period/year
1,405,560 10,440,271 11,845,831 1,413,440 10,520,329 11,933,769
Operations
Changes in net assets attributable to unitholders
resulting from operations during the period/year
(16,051) (87,492) (103,543) (22,108) (127,089) (149,197)
Unitholders’ contributions/ (withdrawals)
during the period/year
Creation of units 18,916 25,856 44,771 319,076 539,067 858,143
Cancellation of units (35,558) - (35,558) (237,765) - (237,765)
Change in net assets attributable to unitholders
resulting from net creation and cancellation of
units
(16,642)
25,856
9,213
81,311
539,067
620,378
Distribution (33,648) (252,341) (285,989) (67,083) (492,036) (559,119)
Total increase/(decrease) in net assets attributable
to unitholders
(66,341)
(313,977)
(380,318) (7,880) (80,058)
(87,938)
Net assets attributable to unitholders at end of
the financial period/year
1,339,219
10,126,294
11,465,513
1,405,560
10,440,271
11,845,831
Units in issue
Net assets attributable to unitholders per unit
1,354,188 10,119,518 1,371,366 10,093,642
0.9889 1.0007 1.0249 1.0343
There were no Class I USD units issued for the period/year.

PHILLIP INVESTMENT FUNDS
________________________________________________________________________________
26
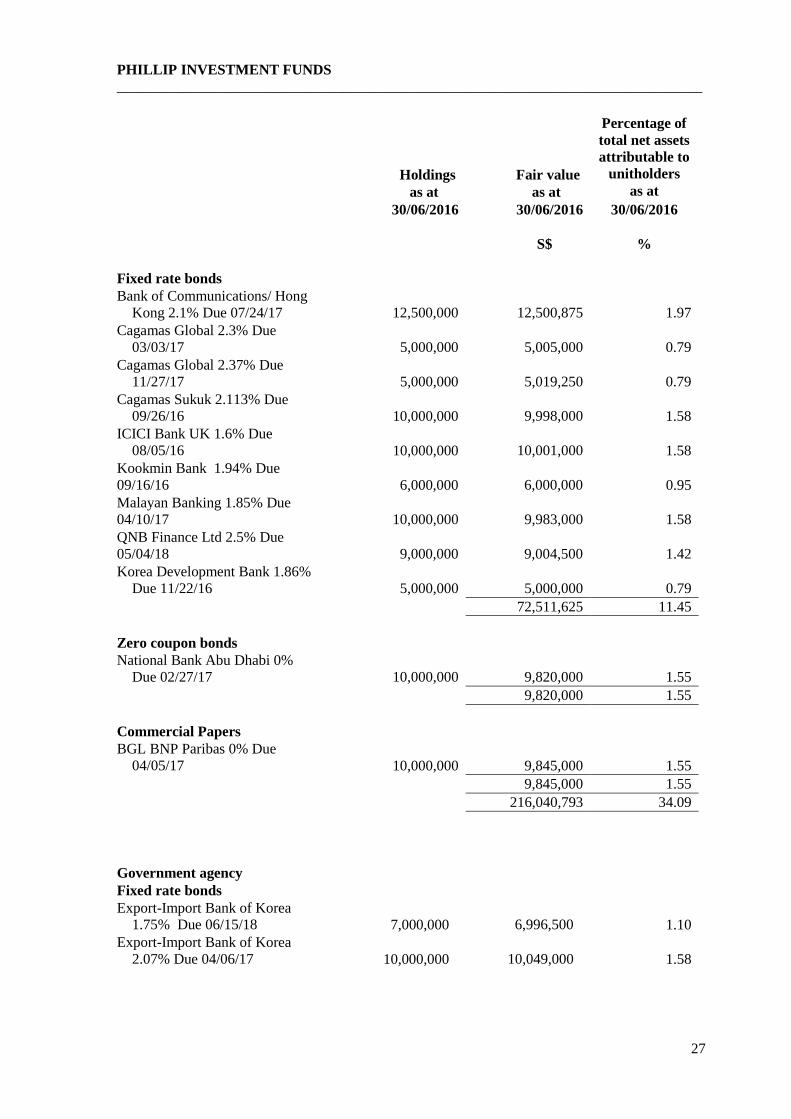
Statements of Portfolio
As at 30 June 2016
(Unaudited)
Holdings
as at
Fair value
as at
Percentage of
total net assets
attributable to
unitholders
as at
30/06/2016 30/06/2016 30/06/2016
S$ %
Phillip Money Market Fund
By Industry (Primary)
Banks & financials
Certificates of deposit
Industrial & Commercial Bank
of China Ltd/ Sydney 0% Due 05/18/17 15,000,000 14,767,500 2.33
Industrial & Commercial Bank
of China Ltd/ Sydney 1.70% Due 10/28/16 4,000,000 4,002,572 0.63
Industrial & Commercial Bank
of China Ltd/Sydney 1.8% Due 09/15/16 10,000,000 10,019,000 1.58
Industrial & Commercial Bank
of China Ltd/Sydney 1.74%
Due 06/06/17 15,000,000 15,018,750 2.37
National Bank Abu Dhabi 1.63% Due 04/28/17 10,000,000 10,000,000 1.58
Lloyds Bank PLC 1.90%
Due 09/16/16 15,000,000 15,007,500 2.37
Standard Chartered Bank 1.3%
Due 10/26/16 10,000,000 10,008,946 1.58
Sumitomo Mitsui Banking SG
1.25% Due 08/11/16 15,000,000 15,000,000 2.37
Sumitomo Mitsui Banking SG
1.45% Due 11/07/16 10,000,000 10,010,000 1.58
Sumitomo Mitsui Banking SG
1.58% Due 09/12/16 10,000,000 10,016,000 1.58
Sumitomo Mitsui Banking SG
1.62% Due 11/14/16 10,000,000 10,013,900 1.58
123,864,168 19.55
PHILLIP INVESTMENT FUNDS
________________________________________________________________________________
27
Holdings
as at
Fair value
as at
Percentage of
total net assets
attributable to
unitholders
as at
Fixed rate bonds
30/06/2016 30/06/2016
S$
30/06/2016
%
Bank of Communications/ Hong
Kong 2.1% Due 07/24/17 12,500,000 12,500,875 1.97
Cagamas Global 2.3% Due
03/03/17 5,000,000
5,005,000 0.79
Cagamas Global 2.37% Due
11/27/17 5,000,000
5,019,250 0.79
Cagamas Sukuk 2.113% Due 09/26/16 10,000,000
9,998,000 1.58
ICICI Bank UK 1.6% Due
08/05/16 10,000,000
10,001,000 1.58
Kookmin Bank 1.94% Due
09/16/16 6,000,000
6,000,000 0.95
Malayan Banking 1.85% Due
04/10/17 10,000,000 9,983,000 1.58
QNB Finance Ltd 2.5% Due
05/04/18 9,000,000
9,004,500 1.42
Korea Development Bank 1.86%
Due 11/22/16 5,000,000 5,000,000 0.79
72,511,625 11.45
Zero coupon bonds
National Bank Abu Dhabi 0%
Due 02/27/17 10,000,000 9,820,000 1.55
9,820,000 1.55
Commercial Papers
BGL BNP Paribas 0% Due
04/05/17 10,000,000 9,845,000 1.55
9,845,000 1.55
216,040,793 34.09
Government agency
Fixed rate bonds
Export-Import Bank of Korea 1.75% Due 06/15/18 7,000,000
6,996,500 1.10
Export-Import Bank of Korea
2.07% Due 04/06/17 10,000,000
10,049,000 1.58

PHILLIP INVESTMENT FUNDS
________________________________________________________________________________
28
Holdings
as at
Fair value
as at
Percentage of
total net assets
attributable to
unitholders
as at
30/6/2016 30/06/2016
S$
30/06/2016
%
Government agency
(continued)
Fixed rate bonds
Singapore Labour Foundation
1.3% Due 06/08/17
2,500,000
2,504,893
0.40
19,550,393 3.08
Fixed Rate Bonds
Ascott Capital 3.8%
Due 11/10/16 27,500,000
27,704,325 4.37
Capitaland Treasury 3.5%
Due 07/17/17 500,000
507,970 0.08
Capitamall Asia 3.95%
Due 08/24/17 12,500,000 12,775,125 2.02
Henderson Land 3.865%
Due 11/11/16 8,750,000
8,814,050 1.39
Joynote Ltd 2.585%
Due 07/20/16 1,250,000
1,250,238 0.19
51,051,708 8.05
REITS
Fixed rate bonds
CMT MTN Pte Ltd 3.85%
Due 03/15/17 7,000,000 7,105,770 1.12
7,105,770 1.12
Transportation
Fixed rate bonds
Singapore Bus Services 1.8%
Due 09/12/17 1,000,000 993,219 0.15
SMRT Capital Pte Ltd 1.2%
Due 10/05/17 1,000,000 998,000 0.16
SMRT Capital Pte Ltd 1.388%
Due 10/16/17 1,500,000 1,500,945 0.24
3,492,164 0.55
Accrued interest on debt
securities 1,576,476 0.25
Portfolio of investments 298,817,304 47.14
Other net assets 335,010,910 52.86
Net assets attributable to
unitholderss 633,828,214 100.00

PHILLIP INVESTMENT FUNDS
________________________________________________________________________________
29
Fair value
as at
Percentage of
total net assets
attributable to
unitholders
as at
Percentage of
total net assets
attributable to
unitholders
as at
30/06/2016 30/06/2016 31/12/2015
S$ % %
Phillip Money Market Fund
By Industry (Summary)
Banks & financials 216,040,793 34.09 31.48
Government agency 19,550,393 3.08 9.28
Real estate 51,051,708 8.05 8.83
Oil & gas - - 0.77
REITS 7,105,770 1.12 0.86
Transportation 3,492,164 0.55 -
Accrued interest on debt securities 1,576,476 0.25 0.32
Portfolio of investments 298,817,304 47.14 51.54
Other net assets 335,010,910 52.86 48.46
Net assets attributable to unitholders 633,828,214 100.00 100.00
Phillip Money Market Fund
By Geography (Secondary)
Australia - - 0.62
Cayman Islands 9,004,500 1.42 -
China 56,308,697 8.88 9.78
Japan 45,039,900 7.11 8.47
Luxembourg 9,845,000 1.55 -
Malaysia 30,005,250 4.73 2.30
Singapore 89,170,980 14.07 19.73
South Korea 28,045,500 4.42 8.04
United Arab Emirates 19,820,000 3.13 -
United Kingdom 10,001,000 1.58 1.53
United States - - 0.75
Accrued interest on debt securities 1,576,476 0.25 0.32
Portfolio of investments 298,817,304 47.14 51.54
Other net assets 335,010,910 52.86 48.46
Net assets attributable to unitholders 633,828,214 100.00 100.00

PHILLIP INVESTMENT FUNDS
________________________________________________________________________________
30
Holdings
as at
Fair value
as at
Percentage
of total net
assets
attributable
to
unitholders
as at
30/06/2016 30/06/2016 30/06/2016
S$ %
Phillip Income Fund
By Industry (Primary)
Quoted securities
Airlines
Equities
Singapore Airlines Ltd 16,000 170,560 1.49
Automotive
Equities
Bridgestone Corporation 3,000 128,663 1.12
Hyundai Motor Co 610 96,800 0.84
225,463 1.96
Banks & financials
Equities
Agricultural Bank China 'H'
208,000
101,973
0.89
BNP Paribas S.A. 1,700 101,265 0.88
BP PLC 35,788 285,203 2.49
DBS Group Holdings Ltd 8,300 130,808 1.14
Fubon Financial Holding Co 42,000 66,012 0.58
Hana Financial Holdings 4,100 111,638 0.97
HSBC Holdings PLC 14,918 122,801 1.07
ICICI Bank Ltd
Industrial Bank of Korea
13,000
7,000
125,731
91,407
1.10
0.80
KB Financial Group INC 3,000 114,185 1.00
Oversea-Chinese Banking Corp 22,000 190,960 1.67
Shinhan Financial Group Ltd 2,500 110,818 0.97
Standard Chartered PLC 9,642 96,301 0.84
Sumitomo Mitsui Financial Group 5,300 203,517 1.78
1,852,619 16.18
Fixed rate bonds
ANZ Bank NZ Ltd 4%
Due 03/22/21
200,000
194,604
1.70
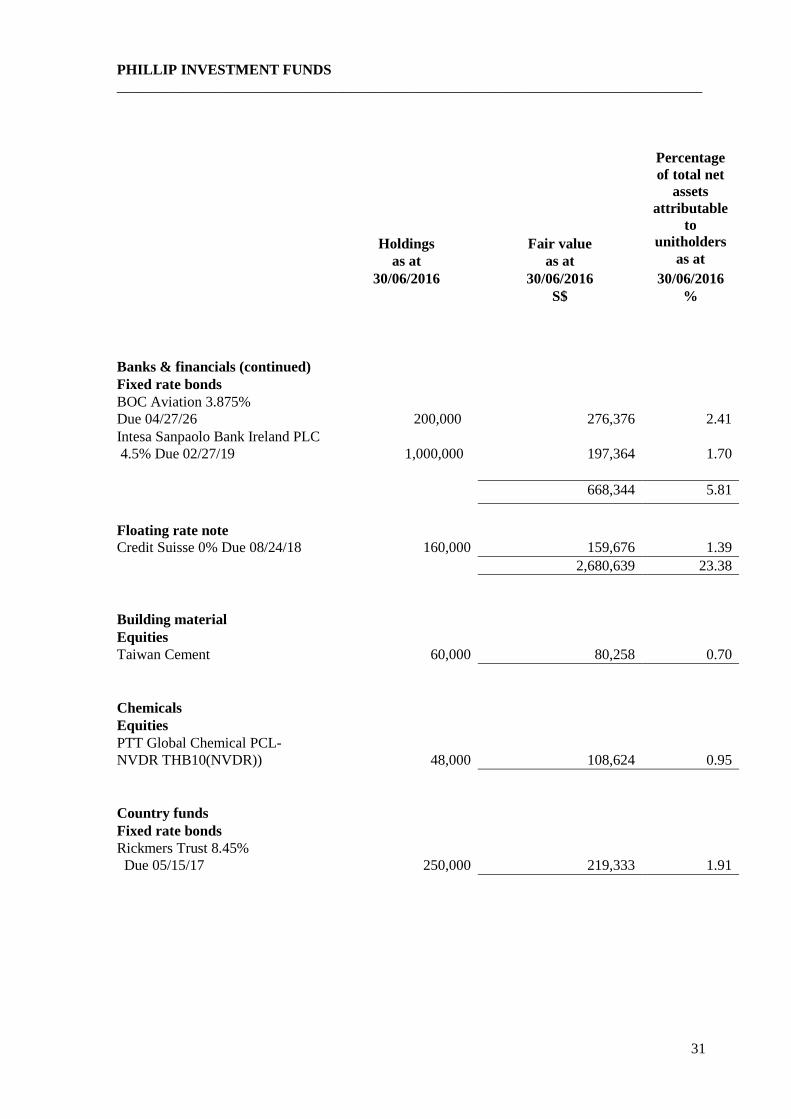
PHILLIP INVESTMENT FUNDS
________________________________________________________________________________
31
Holdings
as at
Fair value
as at
Percentage
of total net
assets
attributable
to
unitholders
as at
30/06/2016 30/06/2016 30/06/2016
S$ %
Banks & financials (continued)
Fixed rate bonds
BOC Aviation 3.875%
Due 04/27/26
200,000
276,376
2.41
Intesa Sanpaolo Bank Ireland PLC
4.5% Due 02/27/19
1,000,000
197,364
1.70
668,344 5.81
Floating rate note
Credit Suisse 0% Due 08/24/18
160,000
159,676
1.39
2,680,639 23.38
Building material
Equities
Taiwan Cement 60,000 80,258 0.70
Chemicals
Equities
PTT Global Chemical PCL-
NVDR THB10(NVDR))
48,000
108,624
0.95
Country funds
Fixed rate bonds
Rickmers Trust 8.45%
Due 05/15/17
250,000
219,333
1.91

PHILLIP INVESTMENT FUNDS
________________________________________________________________________________
32
Engineering & Construction
Holdings as at
30/6/2016
Fair value
as at
30/6/2016
S$
Percentage
of total net
assets
attributable
to
unitholders
as at
30/6/2016
%
Equities
Sembcorp Industries Ltd
United Engineers Ltd
35,000
52,000
98,700
113,880
0.86
0.99
212,580 1.85
Fixed rate bonds
Lendlease Group 4.5%
Due 05/26/26
250,000 337,876 2.95
550,456 4.80
Exchange Traded Funds
Investment/Mutual Funds
CSOP FTSE China A50 ETF 165,000 310,946 2.71
Food & Beverage
Equities
China Mengniu Dairy Co 46,000 107,640 0.94
Dairy Farm International Holdings 15,000 135,767 1.18
Pepsi-Cola Products Philippines 969,000 91,377 0.80
San Miguel Pure Foods Co 26,000 156,499 1.36
Wesfarmers Limited 3,300 132,540 1.16
623,823 5.44
Fixed rate bonds
Tingyi (CI) Holdings 4.375%
Due 08/06/18
Unilever 2.95% Due 02/27/17
1,000,000
2,000,000
202,521
403,296
1.77
3.52
605,817 5.29
1,229,640
10.73

PHILLIP INVESTMENT FUNDS
________________________________________________________________________________
33
Holding companies
Equities
Keppel Corporation Ltd
Wharf Holdings
Holdings
as at
30/6/2016
17,000
18,000
Fair value
as at
30/6/2016
S$
93,330
146,607
Percentage
of total net
assets
attributable
to
unitholders
as at
30/6/2016
%
0.81
1.28
YTL Corporation Bhd 243,000 135,051 1.18
374,988 3.27
Insurance
Equities
Aegon NV Fortis 17,500 92,690 0.81
China Life Insurance Co 26,000 74,943 0.65
China Pacific Insurance Group 23,000 103,962 0.91
Ping An Insurance Group Co 18,000 106,708 0.93
378,303 3.30
Investment Companies
Equities
CK Hutchison Holdings Ltd 7,000 102,892 0.90
Iron & Steel
Equities
POSCO
460
108,282
0.94
Mining
Equities
BHP Ltd Ord 3,300 61,620 0.54

PHILLIP INVESTMENT FUNDS
________________________________________________________________________________
34
Holdings
as at
30/6/2016
Fair value
as at
30/6/2016
S$
Percentage
of
total net
assets
attributable
to
unitholders
as at
30/6/2016
%
Multi Industries
Investment funds/Mutual funds
ISHARES MSCI India ETF 5,900 222,201 1.94
Oil & gas
Fixed rate bonds
CNOOC Finance 3.5%
Due 05/05/25
200,000 274,104 2.39
Pertamina Persero 5.625%
Due 05/20/43
Standard Chartered PLC 4.05%
Due 04/12/26
200,000
200,000
261,711
270,641
2.28
2.36
806,456 7.03
Real Estate
Fixed rate bonds
Lend Lease Finance Ltd 6% Due
05/13/20
200,000
213,388
1.86
REITS
REITS
Ascendas Real Estate Investment
Trust 62,000 153,140
1.34
Ascott Residence Trust 101,000 110,090 0.96
CapitaCommercial Trust 97,000 143,075 1.25
CDL Hospitality Trust 140,000 197,400 1.72
Frasers Hospitality Trust 150,000 114,750 1.00
Frasers Logistics & Industrial Trust 28,000 26,460 0.23
Keppel Reit 124,000 130,200 1.14
Mapletree Greater China
Commercial Trust 145,000 146,450
1.28
Soilbuild Business Space Reit 160,000 108,800 0.95
1,130,365 9.87

PHILLIP INVESTMENT FUNDS
________________________________________________________________________________
35
Holdings
as at
30/6/2016
Fair value
as at
30/6/2016
S$
Percentage
of
total net
assets
attributable
to
unitholders
as at
30/6/2016
%
Retail
Equities
Bossini International Holdings 1,112,000 94,727 0.83
Chow Sang Sang Holdings 28,000 65,325 0.57
160,052 1.40
Sovereign Government
Obligations
Fixed rate bonds
Republic of Turkey 3.25%
Due 03/23/23
200,000 261,484 2.28
Perusahaan Penerbit SBSN
Indonesia III 4.55% Due 03/29/26
200,000
282,613 2.46
544,097 4.74
Telecommunications
Equities
Advanced Info Service NVDR 25,000 151,027 1.32
China Communications Service 228,000 159,343 1.39
310,370 2.71
Transportation
Equities
Singapore Post Ltd 80,000 117,600 1.03
Investment funds/Mutual Funds
Hutchison Port Holdings
106,000 64,342 0.55
181,942 1.58
Accrued interest on debt
securities
36,062 0.31
Portfolio of investments 10,206,939 89.02
Other net assets 1,258,574 10.98
Net assets attributable to
unitholders
11,465,513
100.00

PHILLIP INVESTMENT FUNDS
________________________________________________________________________________
36
Fair value
as at
Percentage of
total net assets
attributable to
unitholders
as at
Percentage of
total net assets
attributable to
unitholders
as at
30/06/2016 30/06/2016 31/12/2015
S$ % %
Phillip Income Fund
By Industry (Primary)
Airline 170,560 1.49 -
Automotive 225,463 1.96 2.16
Banks & financials 2,680,639 23.38 24.55
Building material 80,258 0.70 0.59
Chemicals 108,624 0.95 0.79
Country funds 219,333 1.91 1.98
Distribution & wholesale - - 1.47
Engineering & construction 550,456 4.80 0.90
Exchange-traded fund 310,946 2.71 -
Food & beverage 1,229,640 10.73 7.68
Government agency - - 10.74
Holding companies 374,988 3.27 3.17
Insurance 378,303 3.30 4.50
Internet - - 2.32
Investment companies 102,892 0.90 3.51
Iron & steel 108,282 0.94 1.23
Mining 61,620 0.54 0.51
Multi industry 222,202 1.94 2.95
Oil & gas 806,456 7.03 4.12
Pharmaceuticals - - 1.70
Real estate 213,388 1.86 10.91
REITS 1,130,365 9.87 3.25
Retail 160,052 1.40 2.38
Semiconductors - - 1.19
Sovereign government obligations 544,098 4.74 -
Telecommunications 310,370 2.71 1.95
Transportation 181,942 1.58 2.96
Accrued interest on debt securities 36,062 0.31 0.21
Portfolio of investments 10,206,939 89.02 97.72
Other net assets 1,258,574 10.98 2.28
Net assets attributable to unitholders 11,465,513 100.00 100.00

PHILLIP INVESTMENT FUNDS
________________________________________________________________________________
37
Fair value
as at
Percentage of
total net assets
attributable to
unitholders
as at
Percentage of
total net assets
attributable to
unitholders
as at
30/06/2016 30/06/2016 31/12/2015
S$ % %
Phillip Income Fund
By Geography (Secondary)
Australia 745,424 6.50 3.97
Bermuda 295,819 2.58 2.64
Cayman Islands 413,054 3.60 7.43
China / Hong Kong 1,004,481 8.76 8.91
France 101,265 0.88 8.31
Germany - - 1.18
India 125,731 1.10 1.21
Indonesia 544,324 4.75 4.69
Ireland 197,364 1.72 1.74
Japan 332,180 2.90 6.79
Malaysia 135,051 1.18 3.78
The Netherlands 495,986 4.33 1.19
New Zealand 194,604 1.70 2.31
Philippines 247,876 2.16 1.75
Singapore 2,606,254 22.73 22.30
South Korea 633,129 5.52 5.58
Switzerland 159,676 1.39 1.39
Taiwan 146,270 1.28 3.29
Thailand 259,651 2.26 0.79
Turkey 261,484 2.28 -
United Kingdom 774,946 6.76 6.33
United States 496,306 4.33 1.93
Accrued interest on debt securities 36,062 0.31 0.21
Portfolio of investments 10,206,939 89.02 97.72
Other net assets 1,258,574 10.98 2.28
Net assets attributable to unitholders 11,465,513 100.00 100.00

PHILLIP INVESTMENT FUNDS
________________________________________________________________________________
38
IMPORTANT INFORMATION
Phillip Money Market Fund and Phillip Income Fund (the "Sub-Funds”) are sub-funds of Phillip
Investment Funds (the "Fund"), an open-ended umbrella unit trust authorised under the Securities
and Futures Act, Chapter 289, by the Monetary Authority of Singapore.
This document is published by Phillip Capital Management (S) Ltd, the manager of the Fund (the
“Manager”), for information only and it does not constitute a prospectus nor form part of any offer
or invitation to subscribe for or to purchase, or solicitation of any offer to subscribe for or to
purchase, any units in the Sub-Funds. All applications for units in the Sub-Funds must be made on the application forms accompanying the latest prospectus of the Fund (the “Prospectus”).
The information and opinions contained in this document have been obtained from public sources
which the Manager believes to be reliable and accurate. However, no representation or warranty,
express or implied, is made as to the fairness, accuracy, completeness or correctness of the
information and it should not be relied upon as such. Opinions included herein constitute the
judgement of the Manager at the time specified and may be subject to change without notice, they
are not to be relied upon as authoritative or taken in substitution for the exercise of judgment by any
recipient and are not intended to provide the sole basis of evaluation of any investment. Neither the
Manager nor the Fund, nor any of their respective associates, directors, officers or employees,
accepts any liability whatsoever for any loss arising directly or indirectly from any use of this document or any information contained herein.
Given the economic and market risks, there can be no assurance that the Sub-Funds will achieve
their investment objectives. Investments in the Sub-Funds are not deposits or other obligations of, or
guaranteed, or insured by the Manager or the distributors or their affiliates and are subject to
investment risks, including the possible loss of the full principal amount invested. Returns may be
affected by, among other things, the investment strategies or objectives of the Sub-Funds and
material market and economic conditions. The value of the units and the income from them can fall
as well as rise. Past performance is not necessarily indicative of the future performance of the Sub-
Funds.
This document should not be taken as a recommendation to buy or sell since it does not take into
account the specific investment objectives, financial situation and the particular needs of any
particular recipient of this document. Investors should seek advice from a financial advisor before
purchasing units in the Sub-Funds. In any case, investors should read the Prospectus and consider
the risks as well as suitability of the Sub-Funds before deciding whether to subscribe for units in the Sub-Funds. Copies of the Prospectus are available and may be obtained from the Manager.

PHILLIP INVESTMENT FUNDS
________________________________________________________________________________
39