semi-annual report ab fcp i - alliancebernstein...ab fcp i is a mutual investment fund (fonds commun...
TRANSCRIPT
Multi-Asset/Asset Allocation+ DYNAMIC DIVERSIFIED PORTFOLIO
Equity+ GLOBAL EQUITY BLEND PORTFOLIO+ GLOBAL VALUE PORTFOLIO+ EMERGING MARKETS GROWTH
PORTFOLIO+ SUSTAINABLE US THEMATIC
PORTFOLIO+ ASIA EX-JAPAN EQUITY PORTFOLIO+ JAPAN STRATEGIC VALUE PORTFOLIO+ CHINA OPPORTUNITY PORTFOLIO
Fixed Income+ GLOBAL BOND PORTFOLIO+ GLOBAL HIGH YIELD PORTFOLIO+ AMERICAN INCOME PORTFOLIO+ EUROPEAN INCOME PORTFOLIO+ EMERGING MARKETS DEBT PORTFOLIO+ MORTGAGE INCOME PORTFOLIO+ GLOBAL BOND II PORTFOLIO
SEMI-ANNUAL REPORT
AB FCP I
(unaudited) FEB 02.28.19
AB FCP I is a mutual investment fund (fonds commun de placement) organized under the laws of the Grand Duchy of Luxembourg.
RCS: K217

No subscriptions can be received on the basis of financial reports. Subscriptions are only valid if made on the basis of the Key Investor Information Document (“KIID”) and the current prospectus accompanied by the annual report or the most recent semi-annual report, if published thereafter.
As of February 28, 2019 the following portfolio of the Fund is not authorized in Hong Kong and not available to Hong Kong residents: Global Bond II Portfolio.
No notification pursuant to Sec. 310 of the German Capital Investment Code (Kapitalanlagegesetzbuch) has been filed for the fol-lowing portfolio and the shares in this portfolio may not be marketed to investors in the Federal Republic of Germany:
– Global Bond II Portfolio
ODDO BHF Aktiengesellschaft, Bockenheimer Landstrasse 10, 60323 Frankfurt am Main, Germany, acts as Paying and Informa-tion Agent (the “German Paying and Information Agent”) of the Fund in the Federal Republic of Germany.
The latest prospectus as well as the KIIDs of the Fund, the Management Regulations and the most recent annual and semi-annual reports - each in paper form - may be obtained free of charge at the office of the German Paying and Information Agent. The net asset value per share, the issue and redemption prices and any conversion prices as well as any notices to the Shareholders are avail-able free of charge at the office of the German Paying and Information Agent.
The following portfolio is not offered for public distribution in Austria:
- Global Bond II Portfolio.
The [A/B] logo is a service mark of AllianceBernstein and AllianceBernstein® is a registered trademark used by permission from the owner, AllianceBernstein L.P.
AB FCP I
1
Letter to SharehoLderS
March 20, 2019
Dear Shareholders,
This report provides an update of AB FCP I (the “Fund”) for the semi-annual reporting period ended February 28, 2019.
During the six-month period ended February 28, 2019, US and non-US equities declined, although emerging-market equities posted modest gains. In the US, growth-style stocks outperformed value-style stocks, and small-cap stocks outperformed their large-cap peers.
Global trade tensions and rising interest rates weighed on stock market performance. In Europe, Brexit uncertainty, Italian budget issues and German economic woes persisted. Slowing global growth was an increasing concern more broadly. Global equities plummeted at the end of 2018 amid increased volatility, but recouped some losses in January and February, as corporate earnings were above analyst estimates and many central banks shared more dovish monetary policy outlooks.
Fixed-income markets had generally positive returns. Global high yield, developed-market treasuries and investment-grade
securities rallied. Emerging-market debt sectors rallied, amid positive idiosyncratic developments and a more favorable macro backdrop, particularly a more patient US Federal Reserve (the “Fed”). Developed-market treasury yield curves moved in different directions (bond yields move inversely to price).
The Fed increased interest rates quarterly in 2018 and began to formally reduce its balance sheet before surprising markets with a more dovish tone at the beginning of 2019. Although the European Central Bank formally ended its bond-buying program, the bank also turned more dovish in 2019, putting credit-easing measures back on the table. Meanwhile, the People’s Bank of China started the new year by cutting its reserve requirement ratio.
We appreciate your investment in the Fund.
Sincerely,
AllianceBernstein (Luxembourg) S.à r.l., the Management Company of the Fund
AB FCP I
2
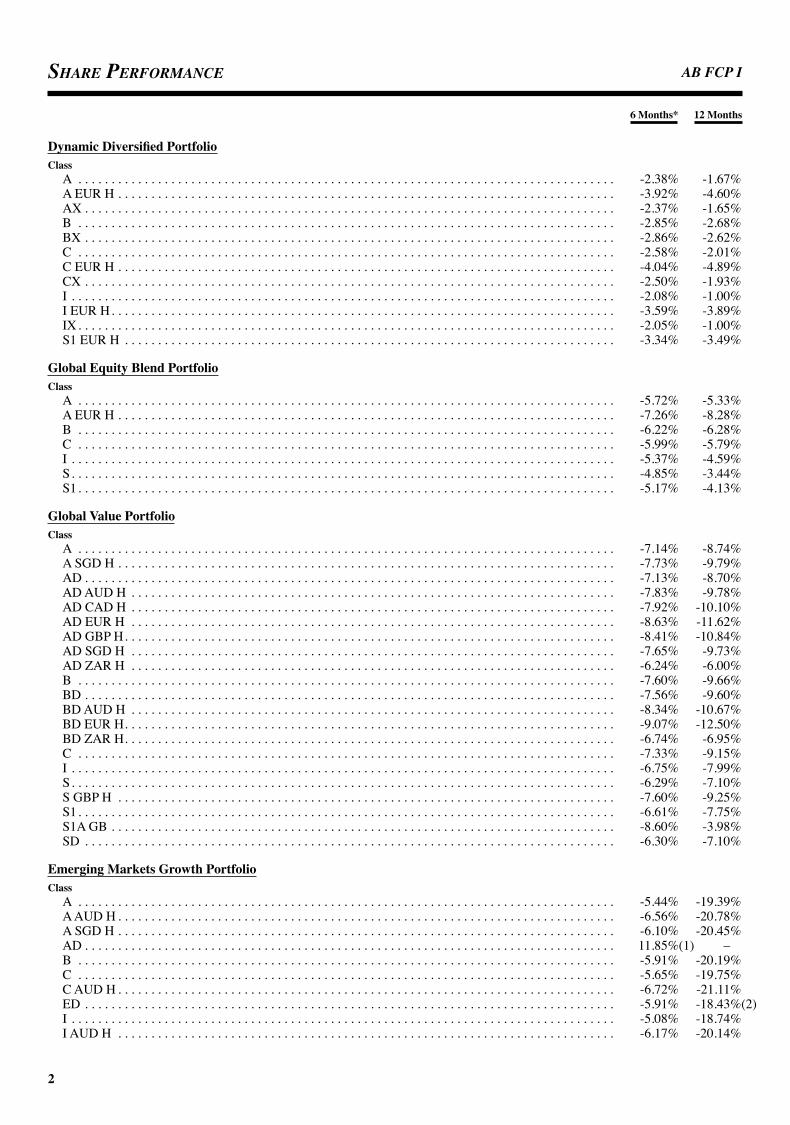
Share Performance
6 Months* 12 Months
Dynamic Diversified PortfolioClass
A . . . . . . . . . . . . . . . . . . . . . . . . . . . . . . . . . . . . . . . . . . . . . . . . . . . . . . . . . . . . . . . . . . . . . . . . . . . . . . . . . -2.38% -1.67%A EUR H . . . . . . . . . . . . . . . . . . . . . . . . . . . . . . . . . . . . . . . . . . . . . . . . . . . . . . . . . . . . . . . . . . . . . . . . . . . -3.92% -4.60%AX . . . . . . . . . . . . . . . . . . . . . . . . . . . . . . . . . . . . . . . . . . . . . . . . . . . . . . . . . . . . . . . . . . . . . . . . . . . . . . . . -2.37% -1.65%B . . . . . . . . . . . . . . . . . . . . . . . . . . . . . . . . . . . . . . . . . . . . . . . . . . . . . . . . . . . . . . . . . . . . . . . . . . . . . . . . . -2.85% -2.68%BX . . . . . . . . . . . . . . . . . . . . . . . . . . . . . . . . . . . . . . . . . . . . . . . . . . . . . . . . . . . . . . . . . . . . . . . . . . . . . . . . -2.86% -2.62%C . . . . . . . . . . . . . . . . . . . . . . . . . . . . . . . . . . . . . . . . . . . . . . . . . . . . . . . . . . . . . . . . . . . . . . . . . . . . . . . . . -2.58% -2.01%C EUR H . . . . . . . . . . . . . . . . . . . . . . . . . . . . . . . . . . . . . . . . . . . . . . . . . . . . . . . . . . . . . . . . . . . . . . . . . . . -4.04% -4.89%CX . . . . . . . . . . . . . . . . . . . . . . . . . . . . . . . . . . . . . . . . . . . . . . . . . . . . . . . . . . . . . . . . . . . . . . . . . . . . . . . . -2.50% -1.93%I . . . . . . . . . . . . . . . . . . . . . . . . . . . . . . . . . . . . . . . . . . . . . . . . . . . . . . . . . . . . . . . . . . . . . . . . . . . . . . . . . . -2.08% -1.00%I EUR H. . . . . . . . . . . . . . . . . . . . . . . . . . . . . . . . . . . . . . . . . . . . . . . . . . . . . . . . . . . . . . . . . . . . . . . . . . . . -3.59% -3.89%IX . . . . . . . . . . . . . . . . . . . . . . . . . . . . . . . . . . . . . . . . . . . . . . . . . . . . . . . . . . . . . . . . . . . . . . . . . . . . . . . . . -2.05% -1.00%S1 EUR H . . . . . . . . . . . . . . . . . . . . . . . . . . . . . . . . . . . . . . . . . . . . . . . . . . . . . . . . . . . . . . . . . . . . . . . . . . -3.34% -3.49%
Global Equity Blend PortfolioClass
A . . . . . . . . . . . . . . . . . . . . . . . . . . . . . . . . . . . . . . . . . . . . . . . . . . . . . . . . . . . . . . . . . . . . . . . . . . . . . . . . . -5.72% -5.33%A EUR H . . . . . . . . . . . . . . . . . . . . . . . . . . . . . . . . . . . . . . . . . . . . . . . . . . . . . . . . . . . . . . . . . . . . . . . . . . . -7.26% -8.28%B . . . . . . . . . . . . . . . . . . . . . . . . . . . . . . . . . . . . . . . . . . . . . . . . . . . . . . . . . . . . . . . . . . . . . . . . . . . . . . . . . -6.22% -6.28%C . . . . . . . . . . . . . . . . . . . . . . . . . . . . . . . . . . . . . . . . . . . . . . . . . . . . . . . . . . . . . . . . . . . . . . . . . . . . . . . . . -5.99% -5.79%I . . . . . . . . . . . . . . . . . . . . . . . . . . . . . . . . . . . . . . . . . . . . . . . . . . . . . . . . . . . . . . . . . . . . . . . . . . . . . . . . . . -5.37% -4.59%S. . . . . . . . . . . . . . . . . . . . . . . . . . . . . . . . . . . . . . . . . . . . . . . . . . . . . . . . . . . . . . . . . . . . . . . . . . . . . . . . . . -4.85% -3.44%S1. . . . . . . . . . . . . . . . . . . . . . . . . . . . . . . . . . . . . . . . . . . . . . . . . . . . . . . . . . . . . . . . . . . . . . . . . . . . . . . . . -5.17% -4.13%
Global Value PortfolioClass
A . . . . . . . . . . . . . . . . . . . . . . . . . . . . . . . . . . . . . . . . . . . . . . . . . . . . . . . . . . . . . . . . . . . . . . . . . . . . . . . . . -7.14% -8.74%A SGD H . . . . . . . . . . . . . . . . . . . . . . . . . . . . . . . . . . . . . . . . . . . . . . . . . . . . . . . . . . . . . . . . . . . . . . . . . . . -7.73% -9.79%AD . . . . . . . . . . . . . . . . . . . . . . . . . . . . . . . . . . . . . . . . . . . . . . . . . . . . . . . . . . . . . . . . . . . . . . . . . . . . . . . . -7.13% -8.70%AD AUD H . . . . . . . . . . . . . . . . . . . . . . . . . . . . . . . . . . . . . . . . . . . . . . . . . . . . . . . . . . . . . . . . . . . . . . . . . -7.83% -9.78%AD CAD H . . . . . . . . . . . . . . . . . . . . . . . . . . . . . . . . . . . . . . . . . . . . . . . . . . . . . . . . . . . . . . . . . . . . . . . . . -7.92% -10.10%AD EUR H . . . . . . . . . . . . . . . . . . . . . . . . . . . . . . . . . . . . . . . . . . . . . . . . . . . . . . . . . . . . . . . . . . . . . . . . . -8.63% -11.62%AD GBP H. . . . . . . . . . . . . . . . . . . . . . . . . . . . . . . . . . . . . . . . . . . . . . . . . . . . . . . . . . . . . . . . . . . . . . . . . . -8.41% -10.84%AD SGD H . . . . . . . . . . . . . . . . . . . . . . . . . . . . . . . . . . . . . . . . . . . . . . . . . . . . . . . . . . . . . . . . . . . . . . . . . -7.65% -9.73%AD ZAR H . . . . . . . . . . . . . . . . . . . . . . . . . . . . . . . . . . . . . . . . . . . . . . . . . . . . . . . . . . . . . . . . . . . . . . . . . -6.24% -6.00%B . . . . . . . . . . . . . . . . . . . . . . . . . . . . . . . . . . . . . . . . . . . . . . . . . . . . . . . . . . . . . . . . . . . . . . . . . . . . . . . . . -7.60% -9.66%BD . . . . . . . . . . . . . . . . . . . . . . . . . . . . . . . . . . . . . . . . . . . . . . . . . . . . . . . . . . . . . . . . . . . . . . . . . . . . . . . . -7.56% -9.60%BD AUD H . . . . . . . . . . . . . . . . . . . . . . . . . . . . . . . . . . . . . . . . . . . . . . . . . . . . . . . . . . . . . . . . . . . . . . . . . -8.34% -10.67%BD EUR H. . . . . . . . . . . . . . . . . . . . . . . . . . . . . . . . . . . . . . . . . . . . . . . . . . . . . . . . . . . . . . . . . . . . . . . . . . -9.07% -12.50%BD ZAR H. . . . . . . . . . . . . . . . . . . . . . . . . . . . . . . . . . . . . . . . . . . . . . . . . . . . . . . . . . . . . . . . . . . . . . . . . . -6.74% -6.95%C . . . . . . . . . . . . . . . . . . . . . . . . . . . . . . . . . . . . . . . . . . . . . . . . . . . . . . . . . . . . . . . . . . . . . . . . . . . . . . . . . -7.33% -9.15%I . . . . . . . . . . . . . . . . . . . . . . . . . . . . . . . . . . . . . . . . . . . . . . . . . . . . . . . . . . . . . . . . . . . . . . . . . . . . . . . . . . -6.75% -7.99%S. . . . . . . . . . . . . . . . . . . . . . . . . . . . . . . . . . . . . . . . . . . . . . . . . . . . . . . . . . . . . . . . . . . . . . . . . . . . . . . . . . -6.29% -7.10%S GBP H . . . . . . . . . . . . . . . . . . . . . . . . . . . . . . . . . . . . . . . . . . . . . . . . . . . . . . . . . . . . . . . . . . . . . . . . . . . -7.60% -9.25%S1. . . . . . . . . . . . . . . . . . . . . . . . . . . . . . . . . . . . . . . . . . . . . . . . . . . . . . . . . . . . . . . . . . . . . . . . . . . . . . . . . -6.61% -7.75%S1A GB . . . . . . . . . . . . . . . . . . . . . . . . . . . . . . . . . . . . . . . . . . . . . . . . . . . . . . . . . . . . . . . . . . . . . . . . . . . . -8.60% -3.98%SD . . . . . . . . . . . . . . . . . . . . . . . . . . . . . . . . . . . . . . . . . . . . . . . . . . . . . . . . . . . . . . . . . . . . . . . . . . . . . . . . -6.30% -7.10%
Emerging Markets Growth PortfolioClass
A . . . . . . . . . . . . . . . . . . . . . . . . . . . . . . . . . . . . . . . . . . . . . . . . . . . . . . . . . . . . . . . . . . . . . . . . . . . . . . . . . -5.44% -19.39%A AUD H . . . . . . . . . . . . . . . . . . . . . . . . . . . . . . . . . . . . . . . . . . . . . . . . . . . . . . . . . . . . . . . . . . . . . . . . . . . -6.56% -20.78%A SGD H . . . . . . . . . . . . . . . . . . . . . . . . . . . . . . . . . . . . . . . . . . . . . . . . . . . . . . . . . . . . . . . . . . . . . . . . . . . -6.10% -20.45%AD . . . . . . . . . . . . . . . . . . . . . . . . . . . . . . . . . . . . . . . . . . . . . . . . . . . . . . . . . . . . . . . . . . . . . . . . . . . . . . . . 11.85%(1) –B . . . . . . . . . . . . . . . . . . . . . . . . . . . . . . . . . . . . . . . . . . . . . . . . . . . . . . . . . . . . . . . . . . . . . . . . . . . . . . . . . -5.91% -20.19%C . . . . . . . . . . . . . . . . . . . . . . . . . . . . . . . . . . . . . . . . . . . . . . . . . . . . . . . . . . . . . . . . . . . . . . . . . . . . . . . . . -5.65% -19.75%C AUD H . . . . . . . . . . . . . . . . . . . . . . . . . . . . . . . . . . . . . . . . . . . . . . . . . . . . . . . . . . . . . . . . . . . . . . . . . . . -6.72% -21.11%ED . . . . . . . . . . . . . . . . . . . . . . . . . . . . . . . . . . . . . . . . . . . . . . . . . . . . . . . . . . . . . . . . . . . . . . . . . . . . . . . . -5.91% -18.43%(2)I . . . . . . . . . . . . . . . . . . . . . . . . . . . . . . . . . . . . . . . . . . . . . . . . . . . . . . . . . . . . . . . . . . . . . . . . . . . . . . . . . . -5.08% -18.74%I AUD H . . . . . . . . . . . . . . . . . . . . . . . . . . . . . . . . . . . . . . . . . . . . . . . . . . . . . . . . . . . . . . . . . . . . . . . . . . . -6.17% -20.14%

AB FCP I
3
6 Months* 12 Months
Emerging Markets Growth Portfolio (continued)Class
I CHF H . . . . . . . . . . . . . . . . . . . . . . . . . . . . . . . . . . . . . . . . . . . . . . . . . . . . . . . . . . . . . . . . . . . . . . . . . . . . -6.64% -17.53%(3)N . . . . . . . . . . . . . . . . . . . . . . . . . . . . . . . . . . . . . . . . . . . . . . . . . . . . . . . . . . . . . . . . . . . . . . . . . . . . . . . . . -5.62% -19.73%S. . . . . . . . . . . . . . . . . . . . . . . . . . . . . . . . . . . . . . . . . . . . . . . . . . . . . . . . . . . . . . . . . . . . . . . . . . . . . . . . . . -4.56% -17.83%S1. . . . . . . . . . . . . . . . . . . . . . . . . . . . . . . . . . . . . . . . . . . . . . . . . . . . . . . . . . . . . . . . . . . . . . . . . . . . . . . . . -4.97% -18.58%
Sustainable US Thematic PortfolioClass
A . . . . . . . . . . . . . . . . . . . . . . . . . . . . . . . . . . . . . . . . . . . . . . . . . . . . . . . . . . . . . . . . . . . . . . . . . . . . . . . . . -3.11% 5.12%A AUD H . . . . . . . . . . . . . . . . . . . . . . . . . . . . . . . . . . . . . . . . . . . . . . . . . . . . . . . . . . . . . . . . . . . . . . . . . . . -4.04% 3.82%A CAD H . . . . . . . . . . . . . . . . . . . . . . . . . . . . . . . . . . . . . . . . . . . . . . . . . . . . . . . . . . . . . . . . . . . . . . . . . . . -4.08% 3.52%A EUR H . . . . . . . . . . . . . . . . . . . . . . . . . . . . . . . . . . . . . . . . . . . . . . . . . . . . . . . . . . . . . . . . . . . . . . . . . . . -4.61% 2.04%A GBP H . . . . . . . . . . . . . . . . . . . . . . . . . . . . . . . . . . . . . . . . . . . . . . . . . . . . . . . . . . . . . . . . . . . . . . . . . . . -4.34% 3.10%A SGD H . . . . . . . . . . . . . . . . . . . . . . . . . . . . . . . . . . . . . . . . . . . . . . . . . . . . . . . . . . . . . . . . . . . . . . . . . . . -3.75% 3.98%AN . . . . . . . . . . . . . . . . . . . . . . . . . . . . . . . . . . . . . . . . . . . . . . . . . . . . . . . . . . . . . . . . . . . . . . . . . . . . . . . . -3.09% 5.13%B . . . . . . . . . . . . . . . . . . . . . . . . . . . . . . . . . . . . . . . . . . . . . . . . . . . . . . . . . . . . . . . . . . . . . . . . . . . . . . . . . -3.58% 4.08%B CAD H . . . . . . . . . . . . . . . . . . . . . . . . . . . . . . . . . . . . . . . . . . . . . . . . . . . . . . . . . . . . . . . . . . . . . . . . . . . -4.52% 2.48%C . . . . . . . . . . . . . . . . . . . . . . . . . . . . . . . . . . . . . . . . . . . . . . . . . . . . . . . . . . . . . . . . . . . . . . . . . . . . . . . . . -3.32% 4.66%C EUR H . . . . . . . . . . . . . . . . . . . . . . . . . . . . . . . . . . . . . . . . . . . . . . . . . . . . . . . . . . . . . . . . . . . . . . . . . . . -4.80% 1.61%I . . . . . . . . . . . . . . . . . . . . . . . . . . . . . . . . . . . . . . . . . . . . . . . . . . . . . . . . . . . . . . . . . . . . . . . . . . . . . . . . . . -2.69% 5.94%I EUR H. . . . . . . . . . . . . . . . . . . . . . . . . . . . . . . . . . . . . . . . . . . . . . . . . . . . . . . . . . . . . . . . . . . . . . . . . . . . -4.25% 2.81%IN . . . . . . . . . . . . . . . . . . . . . . . . . . . . . . . . . . . . . . . . . . . . . . . . . . . . . . . . . . . . . . . . . . . . . . . . . . . . . . . . . -2.70% 5.98%S. . . . . . . . . . . . . . . . . . . . . . . . . . . . . . . . . . . . . . . . . . . . . . . . . . . . . . . . . . . . . . . . . . . . . . . . . . . . . . . . . . -2.27% 7.05%S1. . . . . . . . . . . . . . . . . . . . . . . . . . . . . . . . . . . . . . . . . . . . . . . . . . . . . . . . . . . . . . . . . . . . . . . . . . . . . . . . . -2.57% 6.35%S1 JPY H . . . . . . . . . . . . . . . . . . . . . . . . . . . . . . . . . . . . . . . . . . . . . . . . . . . . . . . . . . . . . . . . . . . . . . . . . . . -3.86% 3.79%
Asia Ex-Japan Equity PortfolioClass
A . . . . . . . . . . . . . . . . . . . . . . . . . . . . . . . . . . . . . . . . . . . . . . . . . . . . . . . . . . . . . . . . . . . . . . . . . . . . . . . . . -4.43% -12.47%A AUD H . . . . . . . . . . . . . . . . . . . . . . . . . . . . . . . . . . . . . . . . . . . . . . . . . . . . . . . . . . . . . . . . . . . . . . . . . . . -5.25% -13.77%A SGD H . . . . . . . . . . . . . . . . . . . . . . . . . . . . . . . . . . . . . . . . . . . . . . . . . . . . . . . . . . . . . . . . . . . . . . . . . . . -5.00% -13.54%AD . . . . . . . . . . . . . . . . . . . . . . . . . . . . . . . . . . . . . . . . . . . . . . . . . . . . . . . . . . . . . . . . . . . . . . . . . . . . . . . . -4.37% -12.41%AD AUD H . . . . . . . . . . . . . . . . . . . . . . . . . . . . . . . . . . . . . . . . . . . . . . . . . . . . . . . . . . . . . . . . . . . . . . . . . -5.24% -13.76%AD CAD H . . . . . . . . . . . . . . . . . . . . . . . . . . . . . . . . . . . . . . . . . . . . . . . . . . . . . . . . . . . . . . . . . . . . . . . . . -5.13% -13.80%AD EUR H . . . . . . . . . . . . . . . . . . . . . . . . . . . . . . . . . . . . . . . . . . . . . . . . . . . . . . . . . . . . . . . . . . . . . . . . . -5.88% -15.21%AD GBP H. . . . . . . . . . . . . . . . . . . . . . . . . . . . . . . . . . . . . . . . . . . . . . . . . . . . . . . . . . . . . . . . . . . . . . . . . . -5.69% -14.48%AD NZD H . . . . . . . . . . . . . . . . . . . . . . . . . . . . . . . . . . . . . . . . . . . . . . . . . . . . . . . . . . . . . . . . . . . . . . . . . -5.17% -13.47%AD RMB H . . . . . . . . . . . . . . . . . . . . . . . . . . . . . . . . . . . . . . . . . . . . . . . . . . . . . . . . . . . . . . . . . . . . . . . . . -4.35% -12.11%AD SGD H . . . . . . . . . . . . . . . . . . . . . . . . . . . . . . . . . . . . . . . . . . . . . . . . . . . . . . . . . . . . . . . . . . . . . . . . . -5.04% -13.51%AD ZAR H . . . . . . . . . . . . . . . . . . . . . . . . . . . . . . . . . . . . . . . . . . . . . . . . . . . . . . . . . . . . . . . . . . . . . . . . . -3.51% -10.12%AY JPY . . . . . . . . . . . . . . . . . . . . . . . . . . . . . . . . . . . . . . . . . . . . . . . . . . . . . . . . . . . . . . . . . . . . . . . . . . . . -4.12% -8.54%B . . . . . . . . . . . . . . . . . . . . . . . . . . . . . . . . . . . . . . . . . . . . . . . . . . . . . . . . . . . . . . . . . . . . . . . . . . . . . . . . . -4.88% -13.30%BD . . . . . . . . . . . . . . . . . . . . . . . . . . . . . . . . . . . . . . . . . . . . . . . . . . . . . . . . . . . . . . . . . . . . . . . . . . . . . . . . -4.88% -13.33%BD AUD H . . . . . . . . . . . . . . . . . . . . . . . . . . . . . . . . . . . . . . . . . . . . . . . . . . . . . . . . . . . . . . . . . . . . . . . . . -5.64% -14.53%BD CAD H . . . . . . . . . . . . . . . . . . . . . . . . . . . . . . . . . . . . . . . . . . . . . . . . . . . . . . . . . . . . . . . . . . . . . . . . . -5.66% -14.69%BD GBP H . . . . . . . . . . . . . . . . . . . . . . . . . . . . . . . . . . . . . . . . . . . . . . . . . . . . . . . . . . . . . . . . . . . . . . . . . . -6.10% -15.28%BD NZD H . . . . . . . . . . . . . . . . . . . . . . . . . . . . . . . . . . . . . . . . . . . . . . . . . . . . . . . . . . . . . . . . . . . . . . . . . -5.68% -14.34%BD ZAR H. . . . . . . . . . . . . . . . . . . . . . . . . . . . . . . . . . . . . . . . . . . . . . . . . . . . . . . . . . . . . . . . . . . . . . . . . . -3.88% -10.88%BY JPY . . . . . . . . . . . . . . . . . . . . . . . . . . . . . . . . . . . . . . . . . . . . . . . . . . . . . . . . . . . . . . . . . . . . . . . . . . . . -4.34% -8.96%C . . . . . . . . . . . . . . . . . . . . . . . . . . . . . . . . . . . . . . . . . . . . . . . . . . . . . . . . . . . . . . . . . . . . . . . . . . . . . . . . . -4.66% -12.86%C AUD H . . . . . . . . . . . . . . . . . . . . . . . . . . . . . . . . . . . . . . . . . . . . . . . . . . . . . . . . . . . . . . . . . . . . . . . . . . . -5.43% -14.14%ED . . . . . . . . . . . . . . . . . . . . . . . . . . . . . . . . . . . . . . . . . . . . . . . . . . . . . . . . . . . . . . . . . . . . . . . . . . . . . . . . -4.91% -12.97%(2)I . . . . . . . . . . . . . . . . . . . . . . . . . . . . . . . . . . . . . . . . . . . . . . . . . . . . . . . . . . . . . . . . . . . . . . . . . . . . . . . . . . -4.05% -11.75%I AUD H . . . . . . . . . . . . . . . . . . . . . . . . . . . . . . . . . . . . . . . . . . . . . . . . . . . . . . . . . . . . . . . . . . . . . . . . . . . -4.87% -13.06%I GBP. . . . . . . . . . . . . . . . . . . . . . . . . . . . . . . . . . . . . . . . . . . . . . . . . . . . . . . . . . . . . . . . . . . . . . . . . . . . . . -6.23% -8.41%ID. . . . . . . . . . . . . . . . . . . . . . . . . . . . . . . . . . . . . . . . . . . . . . . . . . . . . . . . . . . . . . . . . . . . . . . . . . . . . . . . . -4.07% -11.74%ID AUD H . . . . . . . . . . . . . . . . . . . . . . . . . . . . . . . . . . . . . . . . . . . . . . . . . . . . . . . . . . . . . . . . . . . . . . . . . . -4.89% -13.06%S. . . . . . . . . . . . . . . . . . . . . . . . . . . . . . . . . . . . . . . . . . . . . . . . . . . . . . . . . . . . . . . . . . . . . . . . . . . . . . . . . . -3.53% -10.74%S1. . . . . . . . . . . . . . . . . . . . . . . . . . . . . . . . . . . . . . . . . . . . . . . . . . . . . . . . . . . . . . . . . . . . . . . . . . . . . . . . . -3.95% -11.56%SD . . . . . . . . . . . . . . . . . . . . . . . . . . . . . . . . . . . . . . . . . . . . . . . . . . . . . . . . . . . . . . . . . . . . . . . . . . . . . . . . -3.52% -10.75%

AB FCP I
4
Share Performance (continued)
6 Months* 12 Months
Japan Strategic Value PortfolioClass
2 . . . . . . . . . . . . . . . . . . . . . . . . . . . . . . . . . . . . . . . . . . . . . . . . . . . . . . . . . . . . . . . . . . . . . . . . . . . . . . . . . . -9.92% -14.45%A . . . . . . . . . . . . . . . . . . . . . . . . . . . . . . . . . . . . . . . . . . . . . . . . . . . . . . . . . . . . . . . . . . . . . . . . . . . . . . . . . -10.24% -15.03%A AUD H . . . . . . . . . . . . . . . . . . . . . . . . . . . . . . . . . . . . . . . . . . . . . . . . . . . . . . . . . . . . . . . . . . . . . . . . . . . -9.87% -14.20%A EUR H . . . . . . . . . . . . . . . . . . . . . . . . . . . . . . . . . . . . . . . . . . . . . . . . . . . . . . . . . . . . . . . . . . . . . . . . . . . -10.56% -15.95%A CZK H . . . . . . . . . . . . . . . . . . . . . . . . . . . . . . . . . . . . . . . . . . . . . . . . . . . . . . . . . . . . . . . . . . . . . . . . . . . -10.15% -14.92%(4)A NZD H . . . . . . . . . . . . . . . . . . . . . . . . . . . . . . . . . . . . . . . . . . . . . . . . . . . . . . . . . . . . . . . . . . . . . . . . . . . -9.61% -13.75%A SGD H . . . . . . . . . . . . . . . . . . . . . . . . . . . . . . . . . . . . . . . . . . . . . . . . . . . . . . . . . . . . . . . . . . . . . . . . . . . -9.71% -14.14%A USD H . . . . . . . . . . . . . . . . . . . . . . . . . . . . . . . . . . . . . . . . . . . . . . . . . . . . . . . . . . . . . . . . . . . . . . . . . . . -9.19% -13.13%AD . . . . . . . . . . . . . . . . . . . . . . . . . . . . . . . . . . . . . . . . . . . . . . . . . . . . . . . . . . . . . . . . . . . . . . . . . . . . . . . . -10.23% -15.02%AD AUD H . . . . . . . . . . . . . . . . . . . . . . . . . . . . . . . . . . . . . . . . . . . . . . . . . . . . . . . . . . . . . . . . . . . . . . . . . -9.80% -14.13%AD NZD H . . . . . . . . . . . . . . . . . . . . . . . . . . . . . . . . . . . . . . . . . . . . . . . . . . . . . . . . . . . . . . . . . . . . . . . . . -9.58% -13.73%AD USD H . . . . . . . . . . . . . . . . . . . . . . . . . . . . . . . . . . . . . . . . . . . . . . . . . . . . . . . . . . . . . . . . . . . . . . . . . -9.18% -13.10%AD ZAR H . . . . . . . . . . . . . . . . . . . . . . . . . . . . . . . . . . . . . . . . . . . . . . . . . . . . . . . . . . . . . . . . . . . . . . . . . -8.00% -10.33%B . . . . . . . . . . . . . . . . . . . . . . . . . . . . . . . . . . . . . . . . . . . . . . . . . . . . . . . . . . . . . . . . . . . . . . . . . . . . . . . . . -10.68% -15.87%BD . . . . . . . . . . . . . . . . . . . . . . . . . . . . . . . . . . . . . . . . . . . . . . . . . . . . . . . . . . . . . . . . . . . . . . . . . . . . . . . . -10.67% -15.86%BD AUD H . . . . . . . . . . . . . . . . . . . . . . . . . . . . . . . . . . . . . . . . . . . . . . . . . . . . . . . . . . . . . . . . . . . . . . . . . -10.30% -15.03%BD USD H. . . . . . . . . . . . . . . . . . . . . . . . . . . . . . . . . . . . . . . . . . . . . . . . . . . . . . . . . . . . . . . . . . . . . . . . . . -9.65% -13.97%BD ZAR H. . . . . . . . . . . . . . . . . . . . . . . . . . . . . . . . . . . . . . . . . . . . . . . . . . . . . . . . . . . . . . . . . . . . . . . . . . -8.46% -11.30%C . . . . . . . . . . . . . . . . . . . . . . . . . . . . . . . . . . . . . . . . . . . . . . . . . . . . . . . . . . . . . . . . . . . . . . . . . . . . . . . . . -10.43% -15.41%C EUR H . . . . . . . . . . . . . . . . . . . . . . . . . . . . . . . . . . . . . . . . . . . . . . . . . . . . . . . . . . . . . . . . . . . . . . . . . . . -10.84% -16.29%I . . . . . . . . . . . . . . . . . . . . . . . . . . . . . . . . . . . . . . . . . . . . . . . . . . . . . . . . . . . . . . . . . . . . . . . . . . . . . . . . . . -9.88% -14.34%I EUR H. . . . . . . . . . . . . . . . . . . . . . . . . . . . . . . . . . . . . . . . . . . . . . . . . . . . . . . . . . . . . . . . . . . . . . . . . . . . -10.27% -15.23%I USD H. . . . . . . . . . . . . . . . . . . . . . . . . . . . . . . . . . . . . . . . . . . . . . . . . . . . . . . . . . . . . . . . . . . . . . . . . . . . -8.82% -12.45%S EUR H . . . . . . . . . . . . . . . . . . . . . . . . . . . . . . . . . . . . . . . . . . . . . . . . . . . . . . . . . . . . . . . . . . . . . . . . . . . -9.77% -14.28%S1. . . . . . . . . . . . . . . . . . . . . . . . . . . . . . . . . . . . . . . . . . . . . . . . . . . . . . . . . . . . . . . . . . . . . . . . . . . . . . . . . -9.66% -13.94%S1 USD H . . . . . . . . . . . . . . . . . . . . . . . . . . . . . . . . . . . . . . . . . . . . . . . . . . . . . . . . . . . . . . . . . . . . . . . . . . -8.59% -12.01%SD . . . . . . . . . . . . . . . . . . . . . . . . . . . . . . . . . . . . . . . . . . . . . . . . . . . . . . . . . . . . . . . . . . . . . . . . . . . . . . . . -9.36% -13.38%
China Opportunity PortfolioClass
A . . . . . . . . . . . . . . . . . . . . . . . . . . . . . . . . . . . . . . . . . . . . . . . . . . . . . . . . . . . . . . . . . . . . . . . . . . . . . . . . . -1.53% -9.84%AD . . . . . . . . . . . . . . . . . . . . . . . . . . . . . . . . . . . . . . . . . . . . . . . . . . . . . . . . . . . . . . . . . . . . . . . . . . . . . . . . -1.54% -9.86%AD AUD H . . . . . . . . . . . . . . . . . . . . . . . . . . . . . . . . . . . . . . . . . . . . . . . . . . . . . . . . . . . . . . . . . . . . . . . . . -2.67% -11.40%AD CAD H . . . . . . . . . . . . . . . . . . . . . . . . . . . . . . . . . . . . . . . . . . . . . . . . . . . . . . . . . . . . . . . . . . . . . . . . . -2.50% -11.28%AD EUR H . . . . . . . . . . . . . . . . . . . . . . . . . . . . . . . . . . . . . . . . . . . . . . . . . . . . . . . . . . . . . . . . . . . . . . . . . -3.24% -12.79%AD GBP H. . . . . . . . . . . . . . . . . . . . . . . . . . . . . . . . . . . . . . . . . . . . . . . . . . . . . . . . . . . . . . . . . . . . . . . . . . -3.05% -12.14%AD NZD H . . . . . . . . . . . . . . . . . . . . . . . . . . . . . . . . . . . . . . . . . . . . . . . . . . . . . . . . . . . . . . . . . . . . . . . . . -2.52% -11.10%AD RMB H . . . . . . . . . . . . . . . . . . . . . . . . . . . . . . . . . . . . . . . . . . . . . . . . . . . . . . . . . . . . . . . . . . . . . . . . . -1.54% -9.69%AD SGD H . . . . . . . . . . . . . . . . . . . . . . . . . . . . . . . . . . . . . . . . . . . . . . . . . . . . . . . . . . . . . . . . . . . . . . . . . -2.28% -11.04%AD ZAR H . . . . . . . . . . . . . . . . . . . . . . . . . . . . . . . . . . . . . . . . . . . . . . . . . . . . . . . . . . . . . . . . . . . . . . . . . -1.24% -7.84%B . . . . . . . . . . . . . . . . . . . . . . . . . . . . . . . . . . . . . . . . . . . . . . . . . . . . . . . . . . . . . . . . . . . . . . . . . . . . . . . . . -2.02% -10.69%BD . . . . . . . . . . . . . . . . . . . . . . . . . . . . . . . . . . . . . . . . . . . . . . . . . . . . . . . . . . . . . . . . . . . . . . . . . . . . . . . . -2.03% -10.72%BD AUD H . . . . . . . . . . . . . . . . . . . . . . . . . . . . . . . . . . . . . . . . . . . . . . . . . . . . . . . . . . . . . . . . . . . . . . . . . -3.16% -12.29%BD EUR H. . . . . . . . . . . . . . . . . . . . . . . . . . . . . . . . . . . . . . . . . . . . . . . . . . . . . . . . . . . . . . . . . . . . . . . . . . -3.71% -13.66%BD NZD H . . . . . . . . . . . . . . . . . . . . . . . . . . . . . . . . . . . . . . . . . . . . . . . . . . . . . . . . . . . . . . . . . . . . . . . . . -3.06% -12.02%BD ZAR H. . . . . . . . . . . . . . . . . . . . . . . . . . . . . . . . . . . . . . . . . . . . . . . . . . . . . . . . . . . . . . . . . . . . . . . . . . -1.72% -8.67%C . . . . . . . . . . . . . . . . . . . . . . . . . . . . . . . . . . . . . . . . . . . . . . . . . . . . . . . . . . . . . . . . . . . . . . . . . . . . . . . . . -1.75% -10.23%I . . . . . . . . . . . . . . . . . . . . . . . . . . . . . . . . . . . . . . . . . . . . . . . . . . . . . . . . . . . . . . . . . . . . . . . . . . . . . . . . . . -1.14% -9.11%S. . . . . . . . . . . . . . . . . . . . . . . . . . . . . . . . . . . . . . . . . . . . . . . . . . . . . . . . . . . . . . . . . . . . . . . . . . . . . . . . . . -0.39% -7.70%S1. . . . . . . . . . . . . . . . . . . . . . . . . . . . . . . . . . . . . . . . . . . . . . . . . . . . . . . . . . . . . . . . . . . . . . . . . . . . . . . . . -0.83% -8.53%
Global Bond PortfolioClass
A . . . . . . . . . . . . . . . . . . . . . . . . . . . . . . . . . . . . . . . . . . . . . . . . . . . . . . . . . . . . . . . . . . . . . . . . . . . . . . . . . 0.76% 1.00%A2 . . . . . . . . . . . . . . . . . . . . . . . . . . . . . . . . . . . . . . . . . . . . . . . . . . . . . . . . . . . . . . . . . . . . . . . . . . . . . . . . 0.79% 1.07%A2 EUR H . . . . . . . . . . . . . . . . . . . . . . . . . . . . . . . . . . . . . . . . . . . . . . . . . . . . . . . . . . . . . . . . . . . . . . . . . . -0.74% -1.80%A2 SGD H . . . . . . . . . . . . . . . . . . . . . . . . . . . . . . . . . . . . . . . . . . . . . . . . . . . . . . . . . . . . . . . . . . . . . . . . . . 0.33% 0.33%AA . . . . . . . . . . . . . . . . . . . . . . . . . . . . . . . . . . . . . . . . . . . . . . . . . . . . . . . . . . . . . . . . . . . . . . . . . . . . . . . . 0.77% 1.05%AA AUD H . . . . . . . . . . . . . . . . . . . . . . . . . . . . . . . . . . . . . . . . . . . . . . . . . . . . . . . . . . . . . . . . . . . . . . . . . 0.52% 0.71%AA CAD H . . . . . . . . . . . . . . . . . . . . . . . . . . . . . . . . . . . . . . . . . . . . . . . . . . . . . . . . . . . . . . . . . . . . . . . . . 0.33% 0.18%

AB FCP I
5
Global Bond Portfolio (continued)Class
AA GBP H . . . . . . . . . . . . . . . . . . . . . . . . . . . . . . . . . . . . . . . . . . . . . . . . . . . . . . . . . . . . . . . . . . . . . . . . . . -0.10% -0.79%AA NZD H . . . . . . . . . . . . . . . . . . . . . . . . . . . . . . . . . . . . . . . . . . . . . . . . . . . . . . . . . . . . . . . . . . . . . . . . . 0.52% 0.88%AA SGD H. . . . . . . . . . . . . . . . . . . . . . . . . . . . . . . . . . . . . . . . . . . . . . . . . . . . . . . . . . . . . . . . . . . . . . . . . . 0.43% 0.25%AJ. . . . . . . . . . . . . . . . . . . . . . . . . . . . . . . . . . . . . . . . . . . . . . . . . . . . . . . . . . . . . . . . . . . . . . . . . . . . . . . . . 0.73% 1.06%AR EUR H. . . . . . . . . . . . . . . . . . . . . . . . . . . . . . . . . . . . . . . . . . . . . . . . . . . . . . . . . . . . . . . . . . . . . . . . . . -0.77% -1.89%AT . . . . . . . . . . . . . . . . . . . . . . . . . . . . . . . . . . . . . . . . . . . . . . . . . . . . . . . . . . . . . . . . . . . . . . . . . . . . . . . . 0.75% 0.98%AT AUD H. . . . . . . . . . . . . . . . . . . . . . . . . . . . . . . . . . . . . . . . . . . . . . . . . . . . . . . . . . . . . . . . . . . . . . . . . . 0.53% 0.73%AT CAD H. . . . . . . . . . . . . . . . . . . . . . . . . . . . . . . . . . . . . . . . . . . . . . . . . . . . . . . . . . . . . . . . . . . . . . . . . . 0.25% 0.09%AT EUR H . . . . . . . . . . . . . . . . . . . . . . . . . . . . . . . . . . . . . . . . . . . . . . . . . . . . . . . . . . . . . . . . . . . . . . . . . . -0.74% -1.93%AT GBP H . . . . . . . . . . . . . . . . . . . . . . . . . . . . . . . . . . . . . . . . . . . . . . . . . . . . . . . . . . . . . . . . . . . . . . . . . . -0.16% -0.85%AT NZD H . . . . . . . . . . . . . . . . . . . . . . . . . . . . . . . . . . . . . . . . . . . . . . . . . . . . . . . . . . . . . . . . . . . . . . . . . . 0.52% 0.80%AT SGD H . . . . . . . . . . . . . . . . . . . . . . . . . . . . . . . . . . . . . . . . . . . . . . . . . . . . . . . . . . . . . . . . . . . . . . . . . . 0.37% 0.23%AX . . . . . . . . . . . . . . . . . . . . . . . . . . . . . . . . . . . . . . . . . . . . . . . . . . . . . . . . . . . . . . . . . . . . . . . . . . . . . . . . 0.92% 1.36%B . . . . . . . . . . . . . . . . . . . . . . . . . . . . . . . . . . . . . . . . . . . . . . . . . . . . . . . . . . . . . . . . . . . . . . . . . . . . . . . . . 0.20% -0.10%B2 . . . . . . . . . . . . . . . . . . . . . . . . . . . . . . . . . . . . . . . . . . . . . . . . . . . . . . . . . . . . . . . . . . . . . . . . . . . . . . . . 0.28% 0.07%BA . . . . . . . . . . . . . . . . . . . . . . . . . . . . . . . . . . . . . . . . . . . . . . . . . . . . . . . . . . . . . . . . . . . . . . . . . . . . . . . . 0.22% 0.02%BA AUD H . . . . . . . . . . . . . . . . . . . . . . . . . . . . . . . . . . . . . . . . . . . . . . . . . . . . . . . . . . . . . . . . . . . . . . . . . -0.04% -0.25%BT . . . . . . . . . . . . . . . . . . . . . . . . . . . . . . . . . . . . . . . . . . . . . . . . . . . . . . . . . . . . . . . . . . . . . . . . . . . . . . . . 0.33% 0.15%BT AUD H. . . . . . . . . . . . . . . . . . . . . . . . . . . . . . . . . . . . . . . . . . . . . . . . . . . . . . . . . . . . . . . . . . . . . . . . . . 0.06% -0.28%BT CAD H. . . . . . . . . . . . . . . . . . . . . . . . . . . . . . . . . . . . . . . . . . . . . . . . . . . . . . . . . . . . . . . . . . . . . . . . . . -0.14% -0.85%BT GBP H . . . . . . . . . . . . . . . . . . . . . . . . . . . . . . . . . . . . . . . . . . . . . . . . . . . . . . . . . . . . . . . . . . . . . . . . . . -0.63% -1.78%BX . . . . . . . . . . . . . . . . . . . . . . . . . . . . . . . . . . . . . . . . . . . . . . . . . . . . . . . . . . . . . . . . . . . . . . . . . . . . . . . . 0.93% 1.21%C . . . . . . . . . . . . . . . . . . . . . . . . . . . . . . . . . . . . . . . . . . . . . . . . . . . . . . . . . . . . . . . . . . . . . . . . . . . . . . . . . 0.51% 0.51%C2 . . . . . . . . . . . . . . . . . . . . . . . . . . . . . . . . . . . . . . . . . . . . . . . . . . . . . . . . . . . . . . . . . . . . . . . . . . . . . . . . 0.54% 0.61%C2 EUR H . . . . . . . . . . . . . . . . . . . . . . . . . . . . . . . . . . . . . . . . . . . . . . . . . . . . . . . . . . . . . . . . . . . . . . . . . . -0.91% -2.29%I . . . . . . . . . . . . . . . . . . . . . . . . . . . . . . . . . . . . . . . . . . . . . . . . . . . . . . . . . . . . . . . . . . . . . . . . . . . . . . . . . . 1.10% 1.68%I2 . . . . . . . . . . . . . . . . . . . . . . . . . . . . . . . . . . . . . . . . . . . . . . . . . . . . . . . . . . . . . . . . . . . . . . . . . . . . . . . . . 1.03% 1.59%I2 AUD H . . . . . . . . . . . . . . . . . . . . . . . . . . . . . . . . . . . . . . . . . . . . . . . . . . . . . . . . . . . . . . . . . . . . . . . . . . 0.82% 1.35%I2 EUR H. . . . . . . . . . . . . . . . . . . . . . . . . . . . . . . . . . . . . . . . . . . . . . . . . . . . . . . . . . . . . . . . . . . . . . . . . . . -0.52% -1.35%IT . . . . . . . . . . . . . . . . . . . . . . . . . . . . . . . . . . . . . . . . . . . . . . . . . . . . . . . . . . . . . . . . . . . . . . . . . . . . . . . . . 1.02% 1.58%IT AUD H . . . . . . . . . . . . . . . . . . . . . . . . . . . . . . . . . . . . . . . . . . . . . . . . . . . . . . . . . . . . . . . . . . . . . . . . . . 0.79% 1.35%N2 . . . . . . . . . . . . . . . . . . . . . . . . . . . . . . . . . . . . . . . . . . . . . . . . . . . . . . . . . . . . . . . . . . . . . . . . . . . . . . . . 0.55% 0.55%NT . . . . . . . . . . . . . . . . . . . . . . . . . . . . . . . . . . . . . . . . . . . . . . . . . . . . . . . . . . . . . . . . . . . . . . . . . . . . . . . . 0.48% 0.49%S EUR H . . . . . . . . . . . . . . . . . . . . . . . . . . . . . . . . . . . . . . . . . . . . . . . . . . . . . . . . . . . . . . . . . . . . . . . . . . . -0.06% -0.49%S SGD H . . . . . . . . . . . . . . . . . . . . . . . . . . . . . . . . . . . . . . . . . . . . . . . . . . . . . . . . . . . . . . . . . . . . . . . . . . . 1.00% 1.66%S1 2 . . . . . . . . . . . . . . . . . . . . . . . . . . . . . . . . . . . . . . . . . . . . . . . . . . . . . . . . . . . . . . . . . . . . . . . . . . . . . . . 1.20% 1.97%S1 EUR H . . . . . . . . . . . . . . . . . . . . . . . . . . . . . . . . . . . . . . . . . . . . . . . . . . . . . . . . . . . . . . . . . . . . . . . . . . -0.64% -1.33%SA . . . . . . . . . . . . . . . . . . . . . . . . . . . . . . . . . . . . . . . . . . . . . . . . . . . . . . . . . . . . . . . . . . . . . . . . . . . . . . . . 1.45% 2.43%
Global High Yield PortfolioClass
A . . . . . . . . . . . . . . . . . . . . . . . . . . . . . . . . . . . . . . . . . . . . . . . . . . . . . . . . . . . . . . . . . . . . . . . . . . . . . . . . . 1.13% -0.71%A2 . . . . . . . . . . . . . . . . . . . . . . . . . . . . . . . . . . . . . . . . . . . . . . . . . . . . . . . . . . . . . . . . . . . . . . . . . . . . . . . . 1.12% -0.58%A2 CHF H . . . . . . . . . . . . . . . . . . . . . . . . . . . . . . . . . . . . . . . . . . . . . . . . . . . . . . . . . . . . . . . . . . . . . . . . . . -0.58% -3.84%A2 EUR H . . . . . . . . . . . . . . . . . . . . . . . . . . . . . . . . . . . . . . . . . . . . . . . . . . . . . . . . . . . . . . . . . . . . . . . . . . -0.38% -3.48%A2 SGD H . . . . . . . . . . . . . . . . . . . . . . . . . . . . . . . . . . . . . . . . . . . . . . . . . . . . . . . . . . . . . . . . . . . . . . . . . . 0.64% -1.45%AA . . . . . . . . . . . . . . . . . . . . . . . . . . . . . . . . . . . . . . . . . . . . . . . . . . . . . . . . . . . . . . . . . . . . . . . . . . . . . . . . 1.11% -0.62%AA AUD H . . . . . . . . . . . . . . . . . . . . . . . . . . . . . . . . . . . . . . . . . . . . . . . . . . . . . . . . . . . . . . . . . . . . . . . . . 0.80% -1.09%AA CAD H . . . . . . . . . . . . . . . . . . . . . . . . . . . . . . . . . . . . . . . . . . . . . . . . . . . . . . . . . . . . . . . . . . . . . . . . . 0.55% -1.59%AA EUR H. . . . . . . . . . . . . . . . . . . . . . . . . . . . . . . . . . . . . . . . . . . . . . . . . . . . . . . . . . . . . . . . . . . . . . . . . . -0.38% -3.50%AA GBP H . . . . . . . . . . . . . . . . . . . . . . . . . . . . . . . . . . . . . . . . . . . . . . . . . . . . . . . . . . . . . . . . . . . . . . . . . . 0.12% -2.53%AA NZD H . . . . . . . . . . . . . . . . . . . . . . . . . . . . . . . . . . . . . . . . . . . . . . . . . . . . . . . . . . . . . . . . . . . . . . . . . 0.76% -0.99%AA RMB H . . . . . . . . . . . . . . . . . . . . . . . . . . . . . . . . . . . . . . . . . . . . . . . . . . . . . . . . . . . . . . . . . . . . . . . . . 1.40% 0.25%AA SGD H. . . . . . . . . . . . . . . . . . . . . . . . . . . . . . . . . . . . . . . . . . . . . . . . . . . . . . . . . . . . . . . . . . . . . . . . . . 0.72% -1.44%AA ZAR H. . . . . . . . . . . . . . . . . . . . . . . . . . . . . . . . . . . . . . . . . . . . . . . . . . . . . . . . . . . . . . . . . . . . . . . . . . 3.07% 3.66%AK . . . . . . . . . . . . . . . . . . . . . . . . . . . . . . . . . . . . . . . . . . . . . . . . . . . . . . . . . . . . . . . . . . . . . . . . . . . . . . . . 1.08% -0.62%AK EUR H . . . . . . . . . . . . . . . . . . . . . . . . . . . . . . . . . . . . . . . . . . . . . . . . . . . . . . . . . . . . . . . . . . . . . . . . . -0.40% -3.54%AR EUR H. . . . . . . . . . . . . . . . . . . . . . . . . . . . . . . . . . . . . . . . . . . . . . . . . . . . . . . . . . . . . . . . . . . . . . . . . . -0.40% -3.52%AT . . . . . . . . . . . . . . . . . . . . . . . . . . . . . . . . . . . . . . . . . . . . . . . . . . . . . . . . . . . . . . . . . . . . . . . . . . . . . . . . 1.13% -0.50%AT AUD H. . . . . . . . . . . . . . . . . . . . . . . . . . . . . . . . . . . . . . . . . . . . . . . . . . . . . . . . . . . . . . . . . . . . . . . . . . 0.87% -1.01%
6 Months* 12 Months

AB FCP I
6
Share Performance (continued)
Global High Yield Portfolio (continued)Class
AT CAD H. . . . . . . . . . . . . . . . . . . . . . . . . . . . . . . . . . . . . . . . . . . . . . . . . . . . . . . . . . . . . . . . . . . . . . . . . . 0.52% -1.63%AT EUR H . . . . . . . . . . . . . . . . . . . . . . . . . . . . . . . . . . . . . . . . . . . . . . . . . . . . . . . . . . . . . . . . . . . . . . . . . . -0.37% -3.46%AT GBP H . . . . . . . . . . . . . . . . . . . . . . . . . . . . . . . . . . . . . . . . . . . . . . . . . . . . . . . . . . . . . . . . . . . . . . . . . . 0.11% -2.45%AT NZD H . . . . . . . . . . . . . . . . . . . . . . . . . . . . . . . . . . . . . . . . . . . . . . . . . . . . . . . . . . . . . . . . . . . . . . . . . . 0.76% -1.01%AT RMB H. . . . . . . . . . . . . . . . . . . . . . . . . . . . . . . . . . . . . . . . . . . . . . . . . . . . . . . . . . . . . . . . . . . . . . . . . . 1.42% 0.25%AT SGD H . . . . . . . . . . . . . . . . . . . . . . . . . . . . . . . . . . . . . . . . . . . . . . . . . . . . . . . . . . . . . . . . . . . . . . . . . . 0.71% -1.43%B . . . . . . . . . . . . . . . . . . . . . . . . . . . . . . . . . . . . . . . . . . . . . . . . . . . . . . . . . . . . . . . . . . . . . . . . . . . . . . . . . 0.58% -1.75%B2 . . . . . . . . . . . . . . . . . . . . . . . . . . . . . . . . . . . . . . . . . . . . . . . . . . . . . . . . . . . . . . . . . . . . . . . . . . . . . . . . 0.63% -1.53%B2 EUR H . . . . . . . . . . . . . . . . . . . . . . . . . . . . . . . . . . . . . . . . . . . . . . . . . . . . . . . . . . . . . . . . . . . . . . . . . . -0.79% -4.37%BA . . . . . . . . . . . . . . . . . . . . . . . . . . . . . . . . . . . . . . . . . . . . . . . . . . . . . . . . . . . . . . . . . . . . . . . . . . . . . . . . 0.67% -1.57%BA AUD H . . . . . . . . . . . . . . . . . . . . . . . . . . . . . . . . . . . . . . . . . . . . . . . . . . . . . . . . . . . . . . . . . . . . . . . . . 0.34% -1.99%BA ZAR H. . . . . . . . . . . . . . . . . . . . . . . . . . . . . . . . . . . . . . . . . . . . . . . . . . . . . . . . . . . . . . . . . . . . . . . . . . 2.52% 2.45%BT . . . . . . . . . . . . . . . . . . . . . . . . . . . . . . . . . . . . . . . . . . . . . . . . . . . . . . . . . . . . . . . . . . . . . . . . . . . . . . . . 0.61% -1.44%BT AUD H. . . . . . . . . . . . . . . . . . . . . . . . . . . . . . . . . . . . . . . . . . . . . . . . . . . . . . . . . . . . . . . . . . . . . . . . . . 0.31% -2.02%BT CAD H. . . . . . . . . . . . . . . . . . . . . . . . . . . . . . . . . . . . . . . . . . . . . . . . . . . . . . . . . . . . . . . . . . . . . . . . . . 0.03% -2.63%BT EUR H . . . . . . . . . . . . . . . . . . . . . . . . . . . . . . . . . . . . . . . . . . . . . . . . . . . . . . . . . . . . . . . . . . . . . . . . . . -0.91% -4.43%BT GBP H . . . . . . . . . . . . . . . . . . . . . . . . . . . . . . . . . . . . . . . . . . . . . . . . . . . . . . . . . . . . . . . . . . . . . . . . . . -0.37% -3.50%BT NZD H. . . . . . . . . . . . . . . . . . . . . . . . . . . . . . . . . . . . . . . . . . . . . . . . . . . . . . . . . . . . . . . . . . . . . . . . . . 0.30% -1.88%C . . . . . . . . . . . . . . . . . . . . . . . . . . . . . . . . . . . . . . . . . . . . . . . . . . . . . . . . . . . . . . . . . . . . . . . . . . . . . . . . . 0.88% -1.17%C2 . . . . . . . . . . . . . . . . . . . . . . . . . . . . . . . . . . . . . . . . . . . . . . . . . . . . . . . . . . . . . . . . . . . . . . . . . . . . . . . . 0.88% -1.04%C2 EUR H . . . . . . . . . . . . . . . . . . . . . . . . . . . . . . . . . . . . . . . . . . . . . . . . . . . . . . . . . . . . . . . . . . . . . . . . . . -0.59% -3.88%CK . . . . . . . . . . . . . . . . . . . . . . . . . . . . . . . . . . . . . . . . . . . . . . . . . . . . . . . . . . . . . . . . . . . . . . . . . . . . . . . . 0.91% -1.05%CK EUR H. . . . . . . . . . . . . . . . . . . . . . . . . . . . . . . . . . . . . . . . . . . . . . . . . . . . . . . . . . . . . . . . . . . . . . . . . . -0.57% -3.94%CT . . . . . . . . . . . . . . . . . . . . . . . . . . . . . . . . . . . . . . . . . . . . . . . . . . . . . . . . . . . . . . . . . . . . . . . . . . . . . . . . 0.91% -1.02%EA . . . . . . . . . . . . . . . . . . . . . . . . . . . . . . . . . . . . . . . . . . . . . . . . . . . . . . . . . . . . . . . . . . . . . . . . . . . . . . . . 0.87% 0.16%(2)I . . . . . . . . . . . . . . . . . . . . . . . . . . . . . . . . . . . . . . . . . . . . . . . . . . . . . . . . . . . . . . . . . . . . . . . . . . . . . . . . . . 1.43% -0.12%I2 . . . . . . . . . . . . . . . . . . . . . . . . . . . . . . . . . . . . . . . . . . . . . . . . . . . . . . . . . . . . . . . . . . . . . . . . . . . . . . . . . 1.47% 0.00%I2 AUD H . . . . . . . . . . . . . . . . . . . . . . . . . . . . . . . . . . . . . . . . . . . . . . . . . . . . . . . . . . . . . . . . . . . . . . . . . . 1.11% -0.47%I2 CHF H . . . . . . . . . . . . . . . . . . . . . . . . . . . . . . . . . . . . . . . . . . . . . . . . . . . . . . . . . . . . . . . . . . . . . . . . . . . -0.31% -3.36%I2 EUR H. . . . . . . . . . . . . . . . . . . . . . . . . . . . . . . . . . . . . . . . . . . . . . . . . . . . . . . . . . . . . . . . . . . . . . . . . . . -0.08% -2.95%I2 SGD H. . . . . . . . . . . . . . . . . . . . . . . . . . . . . . . . . . . . . . . . . . . . . . . . . . . . . . . . . . . . . . . . . . . . . . . . . . . 0.93% -0.91%IA AUD H . . . . . . . . . . . . . . . . . . . . . . . . . . . . . . . . . . . . . . . . . . . . . . . . . . . . . . . . . . . . . . . . . . . . . . . . . . 1.08% -0.47%IQD . . . . . . . . . . . . . . . . . . . . . . . . . . . . . . . . . . . . . . . . . . . . . . . . . . . . . . . . . . . . . . . . . . . . . . . . . . . . . . . 1.39% 0.00%IT . . . . . . . . . . . . . . . . . . . . . . . . . . . . . . . . . . . . . . . . . . . . . . . . . . . . . . . . . . . . . . . . . . . . . . . . . . . . . . . . . 1.46% 0.04%IT AUD H . . . . . . . . . . . . . . . . . . . . . . . . . . . . . . . . . . . . . . . . . . . . . . . . . . . . . . . . . . . . . . . . . . . . . . . . . . 1.04% -0.57%IT CAD H . . . . . . . . . . . . . . . . . . . . . . . . . . . . . . . . . . . . . . . . . . . . . . . . . . . . . . . . . . . . . . . . . . . . . . . . . . 0.89% -1.00%IT EUR H. . . . . . . . . . . . . . . . . . . . . . . . . . . . . . . . . . . . . . . . . . . . . . . . . . . . . . . . . . . . . . . . . . . . . . . . . . . -0.08% -2.94%IT GBP H. . . . . . . . . . . . . . . . . . . . . . . . . . . . . . . . . . . . . . . . . . . . . . . . . . . . . . . . . . . . . . . . . . . . . . . . . . . 0.38% -1.94%IT NZD H . . . . . . . . . . . . . . . . . . . . . . . . . . . . . . . . . . . . . . . . . . . . . . . . . . . . . . . . . . . . . . . . . . . . . . . . . . 1.04% -0.43%IT RMB H . . . . . . . . . . . . . . . . . . . . . . . . . . . . . . . . . . . . . . . . . . . . . . . . . . . . . . . . . . . . . . . . . . . . . . . . . . 1.66% 0.81%J . . . . . . . . . . . . . . . . . . . . . . . . . . . . . . . . . . . . . . . . . . . . . . . . . . . . . . . . . . . . . . . . . . . . . . . . . . . . . . . . . . 0.74% -1.48%N2 . . . . . . . . . . . . . . . . . . . . . . . . . . . . . . . . . . . . . . . . . . . . . . . . . . . . . . . . . . . . . . . . . . . . . . . . . . . . . . . . 0.84% -1.10%NT . . . . . . . . . . . . . . . . . . . . . . . . . . . . . . . . . . . . . . . . . . . . . . . . . . . . . . . . . . . . . . . . . . . . . . . . . . . . . . . . 0.89% -1.07%S EUR H . . . . . . . . . . . . . . . . . . . . . . . . . . . . . . . . . . . . . . . . . . . . . . . . . . . . . . . . . . . . . . . . . . . . . . . . . . . 0.49% -1.77%S1. . . . . . . . . . . . . . . . . . . . . . . . . . . . . . . . . . . . . . . . . . . . . . . . . . . . . . . . . . . . . . . . . . . . . . . . . . . . . . . . . 1.57% 0.27%S1D . . . . . . . . . . . . . . . . . . . . . . . . . . . . . . . . . . . . . . . . . . . . . . . . . . . . . . . . . . . . . . . . . . . . . . . . . . . . . . . 1.54% 0.29%SA . . . . . . . . . . . . . . . . . . . . . . . . . . . . . . . . . . . . . . . . . . . . . . . . . . . . . . . . . . . . . . . . . . . . . . . . . . . . . . . . 2.02% 1.19%SHK . . . . . . . . . . . . . . . . . . . . . . . . . . . . . . . . . . . . . . . . . . . . . . . . . . . . . . . . . . . . . . . . . . . . . . . . . . . . . . . 2.02% 1.19%SK . . . . . . . . . . . . . . . . . . . . . . . . . . . . . . . . . . . . . . . . . . . . . . . . . . . . . . . . . . . . . . . . . . . . . . . . . . . . . . . . 1.68% 0.52%SQ . . . . . . . . . . . . . . . . . . . . . . . . . . . . . . . . . . . . . . . . . . . . . . . . . . . . . . . . . . . . . . . . . . . . . . . . . . . . . . . . 5.54%(5) –W2 . . . . . . . . . . . . . . . . . . . . . . . . . . . . . . . . . . . . . . . . . . . . . . . . . . . . . . . . . . . . . . . . . . . . . . . . . . . . . . . . 1.57% 0.27%W2 CHF H. . . . . . . . . . . . . . . . . . . . . . . . . . . . . . . . . . . . . . . . . . . . . . . . . . . . . . . . . . . . . . . . . . . . . . . . . . -0.21% -3.10%WT . . . . . . . . . . . . . . . . . . . . . . . . . . . . . . . . . . . . . . . . . . . . . . . . . . . . . . . . . . . . . . . . . . . . . . . . . . . . . . . . 1.50% 0.24%WT AUD H . . . . . . . . . . . . . . . . . . . . . . . . . . . . . . . . . . . . . . . . . . . . . . . . . . . . . . . . . . . . . . . . . . . . . . . . . 1.21% -0.20%WT EUR H . . . . . . . . . . . . . . . . . . . . . . . . . . . . . . . . . . . . . . . . . . . . . . . . . . . . . . . . . . . . . . . . . . . . . . . . . 0.05% -2.67%
6 Months* 12 Months
AB FCP I
7
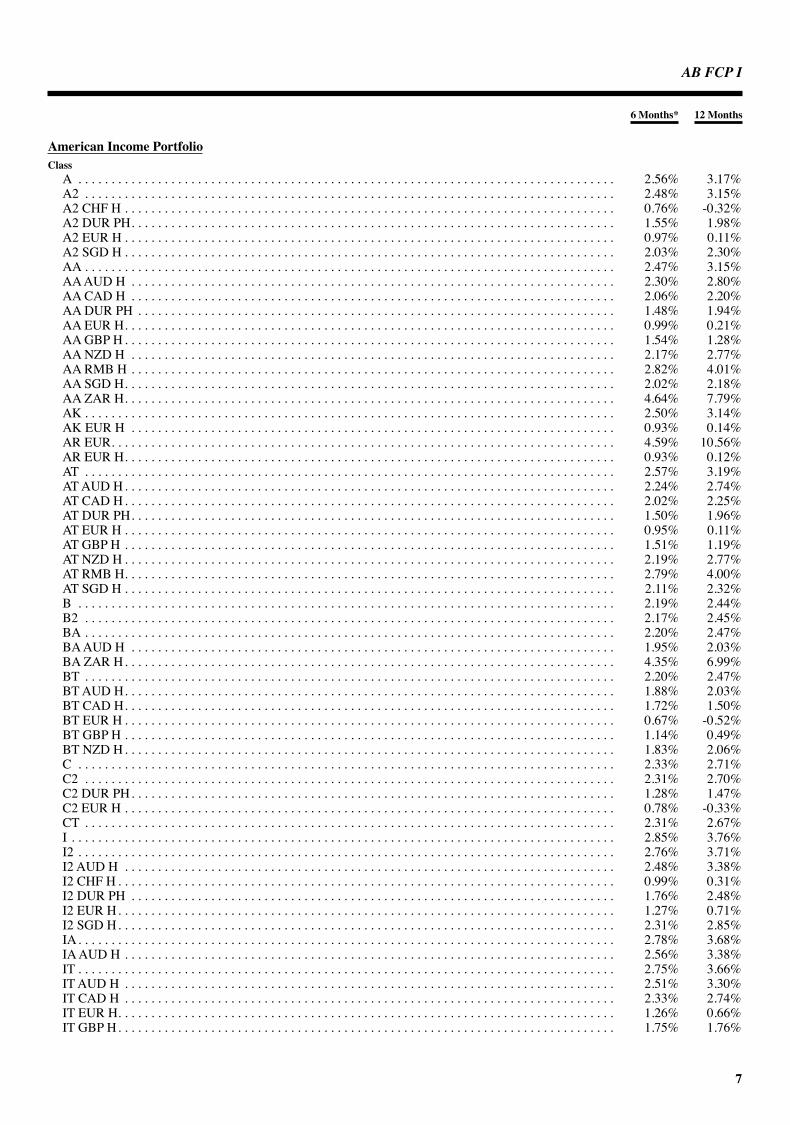
American Income PortfolioClass
A . . . . . . . . . . . . . . . . . . . . . . . . . . . . . . . . . . . . . . . . . . . . . . . . . . . . . . . . . . . . . . . . . . . . . . . . . . . . . . . . . 2.56% 3.17%A2 . . . . . . . . . . . . . . . . . . . . . . . . . . . . . . . . . . . . . . . . . . . . . . . . . . . . . . . . . . . . . . . . . . . . . . . . . . . . . . . . 2.48% 3.15%A2 CHF H . . . . . . . . . . . . . . . . . . . . . . . . . . . . . . . . . . . . . . . . . . . . . . . . . . . . . . . . . . . . . . . . . . . . . . . . . . 0.76% -0.32%A2 DUR PH. . . . . . . . . . . . . . . . . . . . . . . . . . . . . . . . . . . . . . . . . . . . . . . . . . . . . . . . . . . . . . . . . . . . . . . . . 1.55% 1.98%A2 EUR H . . . . . . . . . . . . . . . . . . . . . . . . . . . . . . . . . . . . . . . . . . . . . . . . . . . . . . . . . . . . . . . . . . . . . . . . . . 0.97% 0.11%A2 SGD H . . . . . . . . . . . . . . . . . . . . . . . . . . . . . . . . . . . . . . . . . . . . . . . . . . . . . . . . . . . . . . . . . . . . . . . . . . 2.03% 2.30%AA . . . . . . . . . . . . . . . . . . . . . . . . . . . . . . . . . . . . . . . . . . . . . . . . . . . . . . . . . . . . . . . . . . . . . . . . . . . . . . . . 2.47% 3.15%AA AUD H . . . . . . . . . . . . . . . . . . . . . . . . . . . . . . . . . . . . . . . . . . . . . . . . . . . . . . . . . . . . . . . . . . . . . . . . . 2.30% 2.80%AA CAD H . . . . . . . . . . . . . . . . . . . . . . . . . . . . . . . . . . . . . . . . . . . . . . . . . . . . . . . . . . . . . . . . . . . . . . . . . 2.06% 2.20%AA DUR PH . . . . . . . . . . . . . . . . . . . . . . . . . . . . . . . . . . . . . . . . . . . . . . . . . . . . . . . . . . . . . . . . . . . . . . . . 1.48% 1.94%AA EUR H. . . . . . . . . . . . . . . . . . . . . . . . . . . . . . . . . . . . . . . . . . . . . . . . . . . . . . . . . . . . . . . . . . . . . . . . . . 0.99% 0.21%AA GBP H . . . . . . . . . . . . . . . . . . . . . . . . . . . . . . . . . . . . . . . . . . . . . . . . . . . . . . . . . . . . . . . . . . . . . . . . . . 1.54% 1.28%AA NZD H . . . . . . . . . . . . . . . . . . . . . . . . . . . . . . . . . . . . . . . . . . . . . . . . . . . . . . . . . . . . . . . . . . . . . . . . . 2.17% 2.77%AA RMB H . . . . . . . . . . . . . . . . . . . . . . . . . . . . . . . . . . . . . . . . . . . . . . . . . . . . . . . . . . . . . . . . . . . . . . . . . 2.82% 4.01%AA SGD H. . . . . . . . . . . . . . . . . . . . . . . . . . . . . . . . . . . . . . . . . . . . . . . . . . . . . . . . . . . . . . . . . . . . . . . . . . 2.02% 2.18%AA ZAR H. . . . . . . . . . . . . . . . . . . . . . . . . . . . . . . . . . . . . . . . . . . . . . . . . . . . . . . . . . . . . . . . . . . . . . . . . . 4.64% 7.79%AK . . . . . . . . . . . . . . . . . . . . . . . . . . . . . . . . . . . . . . . . . . . . . . . . . . . . . . . . . . . . . . . . . . . . . . . . . . . . . . . . 2.50% 3.14%AK EUR H . . . . . . . . . . . . . . . . . . . . . . . . . . . . . . . . . . . . . . . . . . . . . . . . . . . . . . . . . . . . . . . . . . . . . . . . . 0.93% 0.14%AR EUR. . . . . . . . . . . . . . . . . . . . . . . . . . . . . . . . . . . . . . . . . . . . . . . . . . . . . . . . . . . . . . . . . . . . . . . . . . . . 4.59% 10.56%AR EUR H. . . . . . . . . . . . . . . . . . . . . . . . . . . . . . . . . . . . . . . . . . . . . . . . . . . . . . . . . . . . . . . . . . . . . . . . . . 0.93% 0.12%AT . . . . . . . . . . . . . . . . . . . . . . . . . . . . . . . . . . . . . . . . . . . . . . . . . . . . . . . . . . . . . . . . . . . . . . . . . . . . . . . . 2.57% 3.19%AT AUD H. . . . . . . . . . . . . . . . . . . . . . . . . . . . . . . . . . . . . . . . . . . . . . . . . . . . . . . . . . . . . . . . . . . . . . . . . . 2.24% 2.74%AT CAD H. . . . . . . . . . . . . . . . . . . . . . . . . . . . . . . . . . . . . . . . . . . . . . . . . . . . . . . . . . . . . . . . . . . . . . . . . . 2.02% 2.25%AT DUR PH. . . . . . . . . . . . . . . . . . . . . . . . . . . . . . . . . . . . . . . . . . . . . . . . . . . . . . . . . . . . . . . . . . . . . . . . . 1.50% 1.96%AT EUR H . . . . . . . . . . . . . . . . . . . . . . . . . . . . . . . . . . . . . . . . . . . . . . . . . . . . . . . . . . . . . . . . . . . . . . . . . . 0.95% 0.11%AT GBP H . . . . . . . . . . . . . . . . . . . . . . . . . . . . . . . . . . . . . . . . . . . . . . . . . . . . . . . . . . . . . . . . . . . . . . . . . . 1.51% 1.19%AT NZD H . . . . . . . . . . . . . . . . . . . . . . . . . . . . . . . . . . . . . . . . . . . . . . . . . . . . . . . . . . . . . . . . . . . . . . . . . . 2.19% 2.77%AT RMB H. . . . . . . . . . . . . . . . . . . . . . . . . . . . . . . . . . . . . . . . . . . . . . . . . . . . . . . . . . . . . . . . . . . . . . . . . . 2.79% 4.00%AT SGD H . . . . . . . . . . . . . . . . . . . . . . . . . . . . . . . . . . . . . . . . . . . . . . . . . . . . . . . . . . . . . . . . . . . . . . . . . . 2.11% 2.32%B . . . . . . . . . . . . . . . . . . . . . . . . . . . . . . . . . . . . . . . . . . . . . . . . . . . . . . . . . . . . . . . . . . . . . . . . . . . . . . . . . 2.19% 2.44%B2 . . . . . . . . . . . . . . . . . . . . . . . . . . . . . . . . . . . . . . . . . . . . . . . . . . . . . . . . . . . . . . . . . . . . . . . . . . . . . . . . 2.17% 2.45%BA . . . . . . . . . . . . . . . . . . . . . . . . . . . . . . . . . . . . . . . . . . . . . . . . . . . . . . . . . . . . . . . . . . . . . . . . . . . . . . . . 2.20% 2.47%BA AUD H . . . . . . . . . . . . . . . . . . . . . . . . . . . . . . . . . . . . . . . . . . . . . . . . . . . . . . . . . . . . . . . . . . . . . . . . . 1.95% 2.03%BA ZAR H. . . . . . . . . . . . . . . . . . . . . . . . . . . . . . . . . . . . . . . . . . . . . . . . . . . . . . . . . . . . . . . . . . . . . . . . . . 4.35% 6.99%BT . . . . . . . . . . . . . . . . . . . . . . . . . . . . . . . . . . . . . . . . . . . . . . . . . . . . . . . . . . . . . . . . . . . . . . . . . . . . . . . . 2.20% 2.47%BT AUD H. . . . . . . . . . . . . . . . . . . . . . . . . . . . . . . . . . . . . . . . . . . . . . . . . . . . . . . . . . . . . . . . . . . . . . . . . . 1.88% 2.03%BT CAD H. . . . . . . . . . . . . . . . . . . . . . . . . . . . . . . . . . . . . . . . . . . . . . . . . . . . . . . . . . . . . . . . . . . . . . . . . . 1.72% 1.50%BT EUR H . . . . . . . . . . . . . . . . . . . . . . . . . . . . . . . . . . . . . . . . . . . . . . . . . . . . . . . . . . . . . . . . . . . . . . . . . . 0.67% -0.52%BT GBP H . . . . . . . . . . . . . . . . . . . . . . . . . . . . . . . . . . . . . . . . . . . . . . . . . . . . . . . . . . . . . . . . . . . . . . . . . . 1.14% 0.49%BT NZD H. . . . . . . . . . . . . . . . . . . . . . . . . . . . . . . . . . . . . . . . . . . . . . . . . . . . . . . . . . . . . . . . . . . . . . . . . . 1.83% 2.06%C . . . . . . . . . . . . . . . . . . . . . . . . . . . . . . . . . . . . . . . . . . . . . . . . . . . . . . . . . . . . . . . . . . . . . . . . . . . . . . . . . 2.33% 2.71%C2 . . . . . . . . . . . . . . . . . . . . . . . . . . . . . . . . . . . . . . . . . . . . . . . . . . . . . . . . . . . . . . . . . . . . . . . . . . . . . . . . 2.31% 2.70%C2 DUR PH. . . . . . . . . . . . . . . . . . . . . . . . . . . . . . . . . . . . . . . . . . . . . . . . . . . . . . . . . . . . . . . . . . . . . . . . . 1.28% 1.47%C2 EUR H . . . . . . . . . . . . . . . . . . . . . . . . . . . . . . . . . . . . . . . . . . . . . . . . . . . . . . . . . . . . . . . . . . . . . . . . . . 0.78% -0.33%CT . . . . . . . . . . . . . . . . . . . . . . . . . . . . . . . . . . . . . . . . . . . . . . . . . . . . . . . . . . . . . . . . . . . . . . . . . . . . . . . . 2.31% 2.67%I . . . . . . . . . . . . . . . . . . . . . . . . . . . . . . . . . . . . . . . . . . . . . . . . . . . . . . . . . . . . . . . . . . . . . . . . . . . . . . . . . . 2.85% 3.76%I2 . . . . . . . . . . . . . . . . . . . . . . . . . . . . . . . . . . . . . . . . . . . . . . . . . . . . . . . . . . . . . . . . . . . . . . . . . . . . . . . . . 2.76% 3.71%I2 AUD H . . . . . . . . . . . . . . . . . . . . . . . . . . . . . . . . . . . . . . . . . . . . . . . . . . . . . . . . . . . . . . . . . . . . . . . . . . 2.48% 3.38%I2 CHF H . . . . . . . . . . . . . . . . . . . . . . . . . . . . . . . . . . . . . . . . . . . . . . . . . . . . . . . . . . . . . . . . . . . . . . . . . . . 0.99% 0.31%I2 DUR PH . . . . . . . . . . . . . . . . . . . . . . . . . . . . . . . . . . . . . . . . . . . . . . . . . . . . . . . . . . . . . . . . . . . . . . . . . 1.76% 2.48%I2 EUR H. . . . . . . . . . . . . . . . . . . . . . . . . . . . . . . . . . . . . . . . . . . . . . . . . . . . . . . . . . . . . . . . . . . . . . . . . . . 1.27% 0.71%I2 SGD H. . . . . . . . . . . . . . . . . . . . . . . . . . . . . . . . . . . . . . . . . . . . . . . . . . . . . . . . . . . . . . . . . . . . . . . . . . . 2.31% 2.85%IA . . . . . . . . . . . . . . . . . . . . . . . . . . . . . . . . . . . . . . . . . . . . . . . . . . . . . . . . . . . . . . . . . . . . . . . . . . . . . . . . . 2.78% 3.68%IA AUD H . . . . . . . . . . . . . . . . . . . . . . . . . . . . . . . . . . . . . . . . . . . . . . . . . . . . . . . . . . . . . . . . . . . . . . . . . . 2.56% 3.38%IT . . . . . . . . . . . . . . . . . . . . . . . . . . . . . . . . . . . . . . . . . . . . . . . . . . . . . . . . . . . . . . . . . . . . . . . . . . . . . . . . . 2.75% 3.66%IT AUD H . . . . . . . . . . . . . . . . . . . . . . . . . . . . . . . . . . . . . . . . . . . . . . . . . . . . . . . . . . . . . . . . . . . . . . . . . . 2.51% 3.30%IT CAD H . . . . . . . . . . . . . . . . . . . . . . . . . . . . . . . . . . . . . . . . . . . . . . . . . . . . . . . . . . . . . . . . . . . . . . . . . . 2.33% 2.74%IT EUR H. . . . . . . . . . . . . . . . . . . . . . . . . . . . . . . . . . . . . . . . . . . . . . . . . . . . . . . . . . . . . . . . . . . . . . . . . . . 1.26% 0.66%IT GBP H. . . . . . . . . . . . . . . . . . . . . . . . . . . . . . . . . . . . . . . . . . . . . . . . . . . . . . . . . . . . . . . . . . . . . . . . . . . 1.75% 1.76%
6 Months* 12 Months
AB FCP I
8
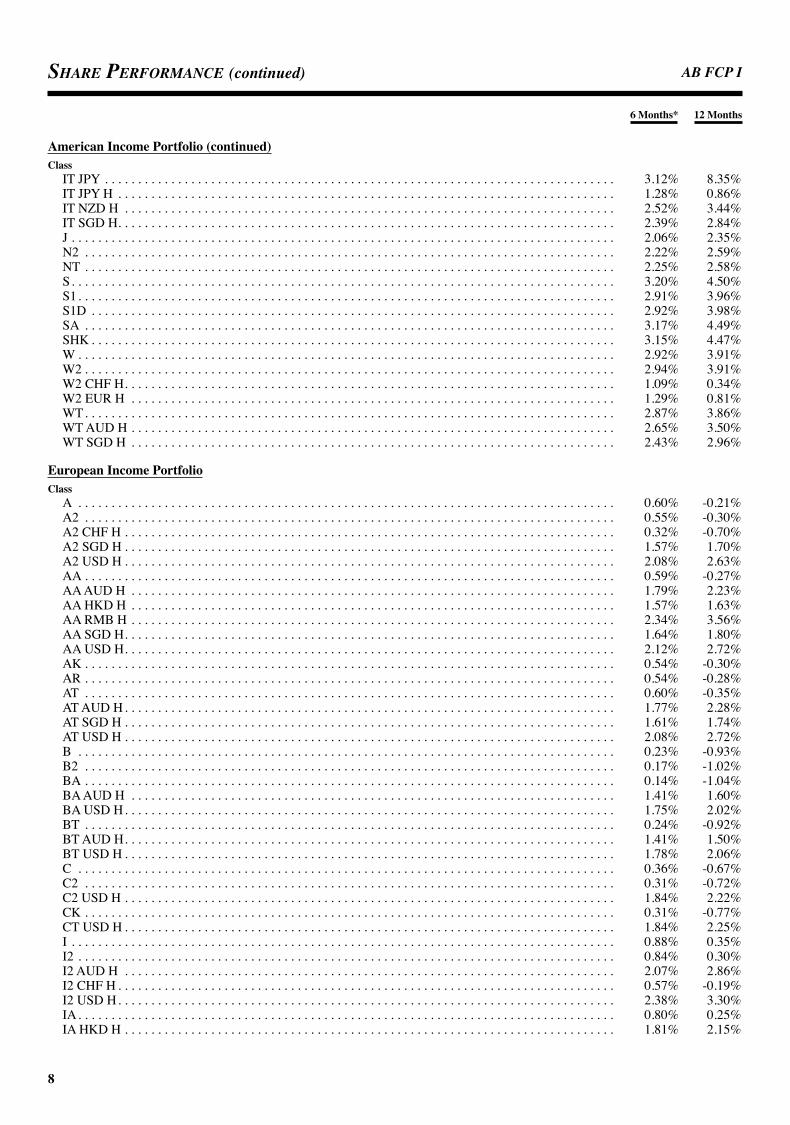
Share Performance (continued)
American Income Portfolio (continued)Class
IT JPY . . . . . . . . . . . . . . . . . . . . . . . . . . . . . . . . . . . . . . . . . . . . . . . . . . . . . . . . . . . . . . . . . . . . . . . . . . . . . 3.12% 8.35%IT JPY H . . . . . . . . . . . . . . . . . . . . . . . . . . . . . . . . . . . . . . . . . . . . . . . . . . . . . . . . . . . . . . . . . . . . . . . . . . . 1.28% 0.86%IT NZD H . . . . . . . . . . . . . . . . . . . . . . . . . . . . . . . . . . . . . . . . . . . . . . . . . . . . . . . . . . . . . . . . . . . . . . . . . . 2.52% 3.44%IT SGD H. . . . . . . . . . . . . . . . . . . . . . . . . . . . . . . . . . . . . . . . . . . . . . . . . . . . . . . . . . . . . . . . . . . . . . . . . . . 2.39% 2.84%J . . . . . . . . . . . . . . . . . . . . . . . . . . . . . . . . . . . . . . . . . . . . . . . . . . . . . . . . . . . . . . . . . . . . . . . . . . . . . . . . . . 2.06% 2.35%N2 . . . . . . . . . . . . . . . . . . . . . . . . . . . . . . . . . . . . . . . . . . . . . . . . . . . . . . . . . . . . . . . . . . . . . . . . . . . . . . . . 2.22% 2.59%NT . . . . . . . . . . . . . . . . . . . . . . . . . . . . . . . . . . . . . . . . . . . . . . . . . . . . . . . . . . . . . . . . . . . . . . . . . . . . . . . . 2.25% 2.58%S. . . . . . . . . . . . . . . . . . . . . . . . . . . . . . . . . . . . . . . . . . . . . . . . . . . . . . . . . . . . . . . . . . . . . . . . . . . . . . . . . . 3.20% 4.50%S1. . . . . . . . . . . . . . . . . . . . . . . . . . . . . . . . . . . . . . . . . . . . . . . . . . . . . . . . . . . . . . . . . . . . . . . . . . . . . . . . . 2.91% 3.96%S1D . . . . . . . . . . . . . . . . . . . . . . . . . . . . . . . . . . . . . . . . . . . . . . . . . . . . . . . . . . . . . . . . . . . . . . . . . . . . . . . 2.92% 3.98%SA . . . . . . . . . . . . . . . . . . . . . . . . . . . . . . . . . . . . . . . . . . . . . . . . . . . . . . . . . . . . . . . . . . . . . . . . . . . . . . . . 3.17% 4.49%SHK . . . . . . . . . . . . . . . . . . . . . . . . . . . . . . . . . . . . . . . . . . . . . . . . . . . . . . . . . . . . . . . . . . . . . . . . . . . . . . . 3.15% 4.47%W . . . . . . . . . . . . . . . . . . . . . . . . . . . . . . . . . . . . . . . . . . . . . . . . . . . . . . . . . . . . . . . . . . . . . . . . . . . . . . . . . 2.92% 3.91%W2 . . . . . . . . . . . . . . . . . . . . . . . . . . . . . . . . . . . . . . . . . . . . . . . . . . . . . . . . . . . . . . . . . . . . . . . . . . . . . . . . 2.94% 3.91%W2 CHF H. . . . . . . . . . . . . . . . . . . . . . . . . . . . . . . . . . . . . . . . . . . . . . . . . . . . . . . . . . . . . . . . . . . . . . . . . . 1.09% 0.34%W2 EUR H . . . . . . . . . . . . . . . . . . . . . . . . . . . . . . . . . . . . . . . . . . . . . . . . . . . . . . . . . . . . . . . . . . . . . . . . . 1.29% 0.81%WT . . . . . . . . . . . . . . . . . . . . . . . . . . . . . . . . . . . . . . . . . . . . . . . . . . . . . . . . . . . . . . . . . . . . . . . . . . . . . . . . 2.87% 3.86%WT AUD H . . . . . . . . . . . . . . . . . . . . . . . . . . . . . . . . . . . . . . . . . . . . . . . . . . . . . . . . . . . . . . . . . . . . . . . . . 2.65% 3.50%WT SGD H . . . . . . . . . . . . . . . . . . . . . . . . . . . . . . . . . . . . . . . . . . . . . . . . . . . . . . . . . . . . . . . . . . . . . . . . . 2.43% 2.96%
European Income PortfolioClass
A . . . . . . . . . . . . . . . . . . . . . . . . . . . . . . . . . . . . . . . . . . . . . . . . . . . . . . . . . . . . . . . . . . . . . . . . . . . . . . . . . 0.60% -0.21%A2 . . . . . . . . . . . . . . . . . . . . . . . . . . . . . . . . . . . . . . . . . . . . . . . . . . . . . . . . . . . . . . . . . . . . . . . . . . . . . . . . 0.55% -0.30%A2 CHF H . . . . . . . . . . . . . . . . . . . . . . . . . . . . . . . . . . . . . . . . . . . . . . . . . . . . . . . . . . . . . . . . . . . . . . . . . . 0.32% -0.70%A2 SGD H . . . . . . . . . . . . . . . . . . . . . . . . . . . . . . . . . . . . . . . . . . . . . . . . . . . . . . . . . . . . . . . . . . . . . . . . . . 1.57% 1.70%A2 USD H . . . . . . . . . . . . . . . . . . . . . . . . . . . . . . . . . . . . . . . . . . . . . . . . . . . . . . . . . . . . . . . . . . . . . . . . . . 2.08% 2.63%AA . . . . . . . . . . . . . . . . . . . . . . . . . . . . . . . . . . . . . . . . . . . . . . . . . . . . . . . . . . . . . . . . . . . . . . . . . . . . . . . . 0.59% -0.27%AA AUD H . . . . . . . . . . . . . . . . . . . . . . . . . . . . . . . . . . . . . . . . . . . . . . . . . . . . . . . . . . . . . . . . . . . . . . . . . 1.79% 2.23%AA HKD H . . . . . . . . . . . . . . . . . . . . . . . . . . . . . . . . . . . . . . . . . . . . . . . . . . . . . . . . . . . . . . . . . . . . . . . . . 1.57% 1.63%AA RMB H . . . . . . . . . . . . . . . . . . . . . . . . . . . . . . . . . . . . . . . . . . . . . . . . . . . . . . . . . . . . . . . . . . . . . . . . . 2.34% 3.56%AA SGD H. . . . . . . . . . . . . . . . . . . . . . . . . . . . . . . . . . . . . . . . . . . . . . . . . . . . . . . . . . . . . . . . . . . . . . . . . . 1.64% 1.80%AA USD H. . . . . . . . . . . . . . . . . . . . . . . . . . . . . . . . . . . . . . . . . . . . . . . . . . . . . . . . . . . . . . . . . . . . . . . . . . 2.12% 2.72%AK . . . . . . . . . . . . . . . . . . . . . . . . . . . . . . . . . . . . . . . . . . . . . . . . . . . . . . . . . . . . . . . . . . . . . . . . . . . . . . . . 0.54% -0.30%AR . . . . . . . . . . . . . . . . . . . . . . . . . . . . . . . . . . . . . . . . . . . . . . . . . . . . . . . . . . . . . . . . . . . . . . . . . . . . . . . . 0.54% -0.28%AT . . . . . . . . . . . . . . . . . . . . . . . . . . . . . . . . . . . . . . . . . . . . . . . . . . . . . . . . . . . . . . . . . . . . . . . . . . . . . . . . 0.60% -0.35%AT AUD H. . . . . . . . . . . . . . . . . . . . . . . . . . . . . . . . . . . . . . . . . . . . . . . . . . . . . . . . . . . . . . . . . . . . . . . . . . 1.77% 2.28%AT SGD H . . . . . . . . . . . . . . . . . . . . . . . . . . . . . . . . . . . . . . . . . . . . . . . . . . . . . . . . . . . . . . . . . . . . . . . . . . 1.61% 1.74%AT USD H . . . . . . . . . . . . . . . . . . . . . . . . . . . . . . . . . . . . . . . . . . . . . . . . . . . . . . . . . . . . . . . . . . . . . . . . . . 2.08% 2.72%B . . . . . . . . . . . . . . . . . . . . . . . . . . . . . . . . . . . . . . . . . . . . . . . . . . . . . . . . . . . . . . . . . . . . . . . . . . . . . . . . . 0.23% -0.93%B2 . . . . . . . . . . . . . . . . . . . . . . . . . . . . . . . . . . . . . . . . . . . . . . . . . . . . . . . . . . . . . . . . . . . . . . . . . . . . . . . . 0.17% -1.02%BA . . . . . . . . . . . . . . . . . . . . . . . . . . . . . . . . . . . . . . . . . . . . . . . . . . . . . . . . . . . . . . . . . . . . . . . . . . . . . . . . 0.14% -1.04%BA AUD H . . . . . . . . . . . . . . . . . . . . . . . . . . . . . . . . . . . . . . . . . . . . . . . . . . . . . . . . . . . . . . . . . . . . . . . . . 1.41% 1.60%BA USD H. . . . . . . . . . . . . . . . . . . . . . . . . . . . . . . . . . . . . . . . . . . . . . . . . . . . . . . . . . . . . . . . . . . . . . . . . . 1.75% 2.02%BT . . . . . . . . . . . . . . . . . . . . . . . . . . . . . . . . . . . . . . . . . . . . . . . . . . . . . . . . . . . . . . . . . . . . . . . . . . . . . . . . 0.24% -0.92%BT AUD H. . . . . . . . . . . . . . . . . . . . . . . . . . . . . . . . . . . . . . . . . . . . . . . . . . . . . . . . . . . . . . . . . . . . . . . . . . 1.41% 1.50%BT USD H . . . . . . . . . . . . . . . . . . . . . . . . . . . . . . . . . . . . . . . . . . . . . . . . . . . . . . . . . . . . . . . . . . . . . . . . . . 1.78% 2.06%C . . . . . . . . . . . . . . . . . . . . . . . . . . . . . . . . . . . . . . . . . . . . . . . . . . . . . . . . . . . . . . . . . . . . . . . . . . . . . . . . . 0.36% -0.67%C2 . . . . . . . . . . . . . . . . . . . . . . . . . . . . . . . . . . . . . . . . . . . . . . . . . . . . . . . . . . . . . . . . . . . . . . . . . . . . . . . . 0.31% -0.72%C2 USD H . . . . . . . . . . . . . . . . . . . . . . . . . . . . . . . . . . . . . . . . . . . . . . . . . . . . . . . . . . . . . . . . . . . . . . . . . . 1.84% 2.22%CK . . . . . . . . . . . . . . . . . . . . . . . . . . . . . . . . . . . . . . . . . . . . . . . . . . . . . . . . . . . . . . . . . . . . . . . . . . . . . . . . 0.31% -0.77%CT USD H . . . . . . . . . . . . . . . . . . . . . . . . . . . . . . . . . . . . . . . . . . . . . . . . . . . . . . . . . . . . . . . . . . . . . . . . . . 1.84% 2.25%I . . . . . . . . . . . . . . . . . . . . . . . . . . . . . . . . . . . . . . . . . . . . . . . . . . . . . . . . . . . . . . . . . . . . . . . . . . . . . . . . . . 0.88% 0.35%I2 . . . . . . . . . . . . . . . . . . . . . . . . . . . . . . . . . . . . . . . . . . . . . . . . . . . . . . . . . . . . . . . . . . . . . . . . . . . . . . . . . 0.84% 0.30%I2 AUD H . . . . . . . . . . . . . . . . . . . . . . . . . . . . . . . . . . . . . . . . . . . . . . . . . . . . . . . . . . . . . . . . . . . . . . . . . . 2.07% 2.86%I2 CHF H . . . . . . . . . . . . . . . . . . . . . . . . . . . . . . . . . . . . . . . . . . . . . . . . . . . . . . . . . . . . . . . . . . . . . . . . . . . 0.57% -0.19%I2 USD H. . . . . . . . . . . . . . . . . . . . . . . . . . . . . . . . . . . . . . . . . . . . . . . . . . . . . . . . . . . . . . . . . . . . . . . . . . . 2.38% 3.30%IA . . . . . . . . . . . . . . . . . . . . . . . . . . . . . . . . . . . . . . . . . . . . . . . . . . . . . . . . . . . . . . . . . . . . . . . . . . . . . . . . . 0.80% 0.25%IA HKD H . . . . . . . . . . . . . . . . . . . . . . . . . . . . . . . . . . . . . . . . . . . . . . . . . . . . . . . . . . . . . . . . . . . . . . . . . . 1.81% 2.15%
6 Months* 12 Months
AB FCP I
9
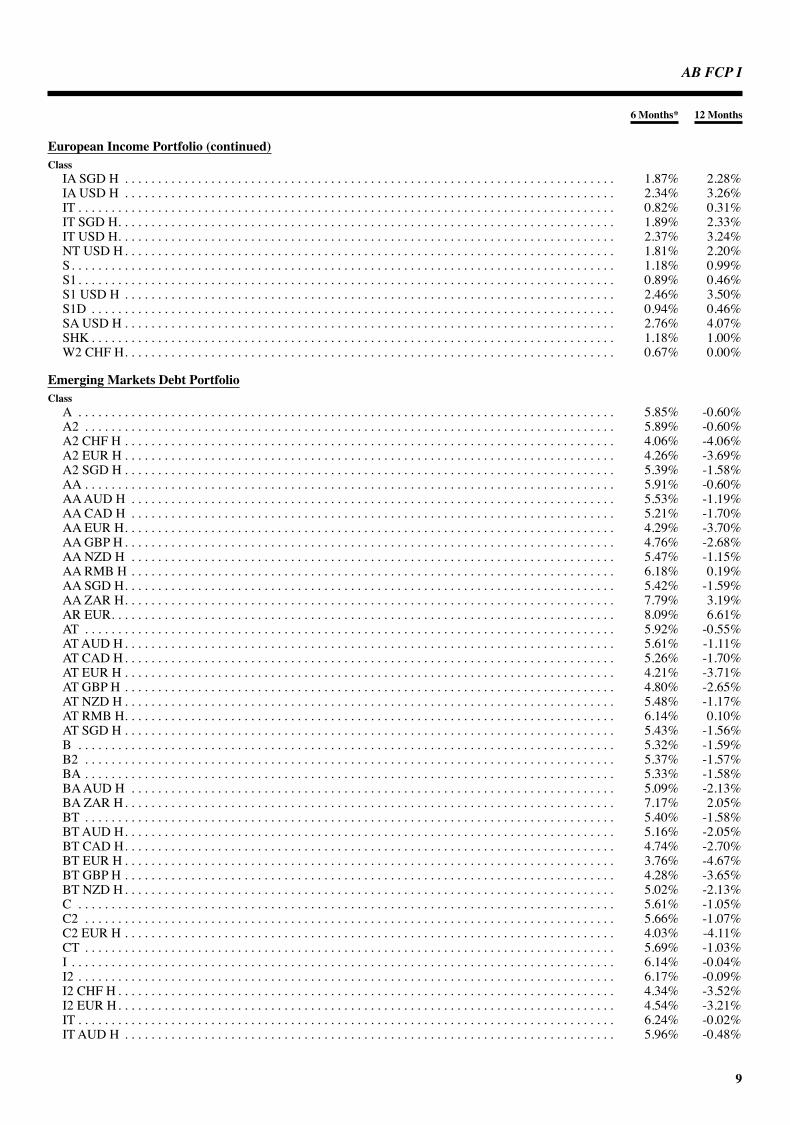
European Income Portfolio (continued)Class
IA SGD H . . . . . . . . . . . . . . . . . . . . . . . . . . . . . . . . . . . . . . . . . . . . . . . . . . . . . . . . . . . . . . . . . . . . . . . . . . 1.87% 2.28%IA USD H . . . . . . . . . . . . . . . . . . . . . . . . . . . . . . . . . . . . . . . . . . . . . . . . . . . . . . . . . . . . . . . . . . . . . . . . . . 2.34% 3.26%IT . . . . . . . . . . . . . . . . . . . . . . . . . . . . . . . . . . . . . . . . . . . . . . . . . . . . . . . . . . . . . . . . . . . . . . . . . . . . . . . . . 0.82% 0.31%IT SGD H. . . . . . . . . . . . . . . . . . . . . . . . . . . . . . . . . . . . . . . . . . . . . . . . . . . . . . . . . . . . . . . . . . . . . . . . . . . 1.89% 2.33%IT USD H. . . . . . . . . . . . . . . . . . . . . . . . . . . . . . . . . . . . . . . . . . . . . . . . . . . . . . . . . . . . . . . . . . . . . . . . . . . 2.37% 3.24%NT USD H. . . . . . . . . . . . . . . . . . . . . . . . . . . . . . . . . . . . . . . . . . . . . . . . . . . . . . . . . . . . . . . . . . . . . . . . . . 1.81% 2.20%S. . . . . . . . . . . . . . . . . . . . . . . . . . . . . . . . . . . . . . . . . . . . . . . . . . . . . . . . . . . . . . . . . . . . . . . . . . . . . . . . . . 1.18% 0.99%S1. . . . . . . . . . . . . . . . . . . . . . . . . . . . . . . . . . . . . . . . . . . . . . . . . . . . . . . . . . . . . . . . . . . . . . . . . . . . . . . . . 0.89% 0.46%S1 USD H . . . . . . . . . . . . . . . . . . . . . . . . . . . . . . . . . . . . . . . . . . . . . . . . . . . . . . . . . . . . . . . . . . . . . . . . . . 2.46% 3.50%S1D . . . . . . . . . . . . . . . . . . . . . . . . . . . . . . . . . . . . . . . . . . . . . . . . . . . . . . . . . . . . . . . . . . . . . . . . . . . . . . . 0.94% 0.46%SA USD H . . . . . . . . . . . . . . . . . . . . . . . . . . . . . . . . . . . . . . . . . . . . . . . . . . . . . . . . . . . . . . . . . . . . . . . . . . 2.76% 4.07%SHK . . . . . . . . . . . . . . . . . . . . . . . . . . . . . . . . . . . . . . . . . . . . . . . . . . . . . . . . . . . . . . . . . . . . . . . . . . . . . . . 1.18% 1.00%W2 CHF H. . . . . . . . . . . . . . . . . . . . . . . . . . . . . . . . . . . . . . . . . . . . . . . . . . . . . . . . . . . . . . . . . . . . . . . . . . 0.67% 0.00%
Emerging Markets Debt PortfolioClass
A . . . . . . . . . . . . . . . . . . . . . . . . . . . . . . . . . . . . . . . . . . . . . . . . . . . . . . . . . . . . . . . . . . . . . . . . . . . . . . . . . 5.85% -0.60%A2 . . . . . . . . . . . . . . . . . . . . . . . . . . . . . . . . . . . . . . . . . . . . . . . . . . . . . . . . . . . . . . . . . . . . . . . . . . . . . . . . 5.89% -0.60%A2 CHF H . . . . . . . . . . . . . . . . . . . . . . . . . . . . . . . . . . . . . . . . . . . . . . . . . . . . . . . . . . . . . . . . . . . . . . . . . . 4.06% -4.06%A2 EUR H . . . . . . . . . . . . . . . . . . . . . . . . . . . . . . . . . . . . . . . . . . . . . . . . . . . . . . . . . . . . . . . . . . . . . . . . . . 4.26% -3.69%A2 SGD H . . . . . . . . . . . . . . . . . . . . . . . . . . . . . . . . . . . . . . . . . . . . . . . . . . . . . . . . . . . . . . . . . . . . . . . . . . 5.39% -1.58%AA . . . . . . . . . . . . . . . . . . . . . . . . . . . . . . . . . . . . . . . . . . . . . . . . . . . . . . . . . . . . . . . . . . . . . . . . . . . . . . . . 5.91% -0.60%AA AUD H . . . . . . . . . . . . . . . . . . . . . . . . . . . . . . . . . . . . . . . . . . . . . . . . . . . . . . . . . . . . . . . . . . . . . . . . . 5.53% -1.19%AA CAD H . . . . . . . . . . . . . . . . . . . . . . . . . . . . . . . . . . . . . . . . . . . . . . . . . . . . . . . . . . . . . . . . . . . . . . . . . 5.21% -1.70%AA EUR H. . . . . . . . . . . . . . . . . . . . . . . . . . . . . . . . . . . . . . . . . . . . . . . . . . . . . . . . . . . . . . . . . . . . . . . . . . 4.29% -3.70%AA GBP H . . . . . . . . . . . . . . . . . . . . . . . . . . . . . . . . . . . . . . . . . . . . . . . . . . . . . . . . . . . . . . . . . . . . . . . . . . 4.76% -2.68%AA NZD H . . . . . . . . . . . . . . . . . . . . . . . . . . . . . . . . . . . . . . . . . . . . . . . . . . . . . . . . . . . . . . . . . . . . . . . . . 5.47% -1.15%AA RMB H . . . . . . . . . . . . . . . . . . . . . . . . . . . . . . . . . . . . . . . . . . . . . . . . . . . . . . . . . . . . . . . . . . . . . . . . . 6.18% 0.19%AA SGD H. . . . . . . . . . . . . . . . . . . . . . . . . . . . . . . . . . . . . . . . . . . . . . . . . . . . . . . . . . . . . . . . . . . . . . . . . . 5.42% -1.59%AA ZAR H. . . . . . . . . . . . . . . . . . . . . . . . . . . . . . . . . . . . . . . . . . . . . . . . . . . . . . . . . . . . . . . . . . . . . . . . . . 7.79% 3.19%AR EUR. . . . . . . . . . . . . . . . . . . . . . . . . . . . . . . . . . . . . . . . . . . . . . . . . . . . . . . . . . . . . . . . . . . . . . . . . . . . 8.09% 6.61%AT . . . . . . . . . . . . . . . . . . . . . . . . . . . . . . . . . . . . . . . . . . . . . . . . . . . . . . . . . . . . . . . . . . . . . . . . . . . . . . . . 5.92% -0.55%AT AUD H. . . . . . . . . . . . . . . . . . . . . . . . . . . . . . . . . . . . . . . . . . . . . . . . . . . . . . . . . . . . . . . . . . . . . . . . . . 5.61% -1.11%AT CAD H. . . . . . . . . . . . . . . . . . . . . . . . . . . . . . . . . . . . . . . . . . . . . . . . . . . . . . . . . . . . . . . . . . . . . . . . . . 5.26% -1.70%AT EUR H . . . . . . . . . . . . . . . . . . . . . . . . . . . . . . . . . . . . . . . . . . . . . . . . . . . . . . . . . . . . . . . . . . . . . . . . . . 4.21% -3.71%AT GBP H . . . . . . . . . . . . . . . . . . . . . . . . . . . . . . . . . . . . . . . . . . . . . . . . . . . . . . . . . . . . . . . . . . . . . . . . . . 4.80% -2.65%AT NZD H . . . . . . . . . . . . . . . . . . . . . . . . . . . . . . . . . . . . . . . . . . . . . . . . . . . . . . . . . . . . . . . . . . . . . . . . . . 5.48% -1.17%AT RMB H. . . . . . . . . . . . . . . . . . . . . . . . . . . . . . . . . . . . . . . . . . . . . . . . . . . . . . . . . . . . . . . . . . . . . . . . . . 6.14% 0.10%AT SGD H . . . . . . . . . . . . . . . . . . . . . . . . . . . . . . . . . . . . . . . . . . . . . . . . . . . . . . . . . . . . . . . . . . . . . . . . . . 5.43% -1.56%B . . . . . . . . . . . . . . . . . . . . . . . . . . . . . . . . . . . . . . . . . . . . . . . . . . . . . . . . . . . . . . . . . . . . . . . . . . . . . . . . . 5.32% -1.59%B2 . . . . . . . . . . . . . . . . . . . . . . . . . . . . . . . . . . . . . . . . . . . . . . . . . . . . . . . . . . . . . . . . . . . . . . . . . . . . . . . . 5.37% -1.57%BA . . . . . . . . . . . . . . . . . . . . . . . . . . . . . . . . . . . . . . . . . . . . . . . . . . . . . . . . . . . . . . . . . . . . . . . . . . . . . . . . 5.33% -1.58%BA AUD H . . . . . . . . . . . . . . . . . . . . . . . . . . . . . . . . . . . . . . . . . . . . . . . . . . . . . . . . . . . . . . . . . . . . . . . . . 5.09% -2.13%BA ZAR H. . . . . . . . . . . . . . . . . . . . . . . . . . . . . . . . . . . . . . . . . . . . . . . . . . . . . . . . . . . . . . . . . . . . . . . . . . 7.17% 2.05%BT . . . . . . . . . . . . . . . . . . . . . . . . . . . . . . . . . . . . . . . . . . . . . . . . . . . . . . . . . . . . . . . . . . . . . . . . . . . . . . . . 5.40% -1.58%BT AUD H. . . . . . . . . . . . . . . . . . . . . . . . . . . . . . . . . . . . . . . . . . . . . . . . . . . . . . . . . . . . . . . . . . . . . . . . . . 5.16% -2.05%BT CAD H. . . . . . . . . . . . . . . . . . . . . . . . . . . . . . . . . . . . . . . . . . . . . . . . . . . . . . . . . . . . . . . . . . . . . . . . . . 4.74% -2.70%BT EUR H . . . . . . . . . . . . . . . . . . . . . . . . . . . . . . . . . . . . . . . . . . . . . . . . . . . . . . . . . . . . . . . . . . . . . . . . . . 3.76% -4.67%BT GBP H . . . . . . . . . . . . . . . . . . . . . . . . . . . . . . . . . . . . . . . . . . . . . . . . . . . . . . . . . . . . . . . . . . . . . . . . . . 4.28% -3.65%BT NZD H. . . . . . . . . . . . . . . . . . . . . . . . . . . . . . . . . . . . . . . . . . . . . . . . . . . . . . . . . . . . . . . . . . . . . . . . . . 5.02% -2.13%C . . . . . . . . . . . . . . . . . . . . . . . . . . . . . . . . . . . . . . . . . . . . . . . . . . . . . . . . . . . . . . . . . . . . . . . . . . . . . . . . . 5.61% -1.05%C2 . . . . . . . . . . . . . . . . . . . . . . . . . . . . . . . . . . . . . . . . . . . . . . . . . . . . . . . . . . . . . . . . . . . . . . . . . . . . . . . . 5.66% -1.07%C2 EUR H . . . . . . . . . . . . . . . . . . . . . . . . . . . . . . . . . . . . . . . . . . . . . . . . . . . . . . . . . . . . . . . . . . . . . . . . . . 4.03% -4.11%CT . . . . . . . . . . . . . . . . . . . . . . . . . . . . . . . . . . . . . . . . . . . . . . . . . . . . . . . . . . . . . . . . . . . . . . . . . . . . . . . . 5.69% -1.03%I . . . . . . . . . . . . . . . . . . . . . . . . . . . . . . . . . . . . . . . . . . . . . . . . . . . . . . . . . . . . . . . . . . . . . . . . . . . . . . . . . . 6.14% -0.04%I2 . . . . . . . . . . . . . . . . . . . . . . . . . . . . . . . . . . . . . . . . . . . . . . . . . . . . . . . . . . . . . . . . . . . . . . . . . . . . . . . . . 6.17% -0.09%I2 CHF H . . . . . . . . . . . . . . . . . . . . . . . . . . . . . . . . . . . . . . . . . . . . . . . . . . . . . . . . . . . . . . . . . . . . . . . . . . . 4.34% -3.52%I2 EUR H. . . . . . . . . . . . . . . . . . . . . . . . . . . . . . . . . . . . . . . . . . . . . . . . . . . . . . . . . . . . . . . . . . . . . . . . . . . 4.54% -3.21%IT . . . . . . . . . . . . . . . . . . . . . . . . . . . . . . . . . . . . . . . . . . . . . . . . . . . . . . . . . . . . . . . . . . . . . . . . . . . . . . . . . 6.24% -0.02%IT AUD H . . . . . . . . . . . . . . . . . . . . . . . . . . . . . . . . . . . . . . . . . . . . . . . . . . . . . . . . . . . . . . . . . . . . . . . . . . 5.96% -0.48%
6 Months* 12 Months

AB FCP I
10
Share Performance (continued)
Emerging Markets Debt Portfolio (continued)Class
IT EUR H. . . . . . . . . . . . . . . . . . . . . . . . . . . . . . . . . . . . . . . . . . . . . . . . . . . . . . . . . . . . . . . . . . . . . . . . . . . 4.54% -3.12%IT SGD H. . . . . . . . . . . . . . . . . . . . . . . . . . . . . . . . . . . . . . . . . . . . . . . . . . . . . . . . . . . . . . . . . . . . . . . . . . . 5.66% -1.00%N2 . . . . . . . . . . . . . . . . . . . . . . . . . . . . . . . . . . . . . . . . . . . . . . . . . . . . . . . . . . . . . . . . . . . . . . . . . . . . . . . . 5.61% -1.15%NT . . . . . . . . . . . . . . . . . . . . . . . . . . . . . . . . . . . . . . . . . . . . . . . . . . . . . . . . . . . . . . . . . . . . . . . . . . . . . . . . 5.54% -1.24%S. . . . . . . . . . . . . . . . . . . . . . . . . . . . . . . . . . . . . . . . . . . . . . . . . . . . . . . . . . . . . . . . . . . . . . . . . . . . . . . . . . 6.58% 0.68%S EUR H . . . . . . . . . . . . . . . . . . . . . . . . . . . . . . . . . . . . . . . . . . . . . . . . . . . . . . . . . . . . . . . . . . . . . . . . . . . 4.95% -2.44%S GBP H . . . . . . . . . . . . . . . . . . . . . . . . . . . . . . . . . . . . . . . . . . . . . . . . . . . . . . . . . . . . . . . . . . . . . . . . . . . 5.44% -1.44%S1 2 . . . . . . . . . . . . . . . . . . . . . . . . . . . . . . . . . . . . . . . . . . . . . . . . . . . . . . . . . . . . . . . . . . . . . . . . . . . . . . . 6.30% 0.13%S1 EUR H . . . . . . . . . . . . . . . . . . . . . . . . . . . . . . . . . . . . . . . . . . . . . . . . . . . . . . . . . . . . . . . . . . . . . . . . . . 4.67% -2.92%S1 GBP H . . . . . . . . . . . . . . . . . . . . . . . . . . . . . . . . . . . . . . . . . . . . . . . . . . . . . . . . . . . . . . . . . . . . . . . . . . 5.16% -1.95%SA . . . . . . . . . . . . . . . . . . . . . . . . . . . . . . . . . . . . . . . . . . . . . . . . . . . . . . . . . . . . . . . . . . . . . . . . . . . . . . . . 6.56% 0.68%
Mortgage Income PortfolioClass
A . . . . . . . . . . . . . . . . . . . . . . . . . . . . . . . . . . . . . . . . . . . . . . . . . . . . . . . . . . . . . . . . . . . . . . . . . . . . . . . . . 0.97% 2.36%A2 . . . . . . . . . . . . . . . . . . . . . . . . . . . . . . . . . . . . . . . . . . . . . . . . . . . . . . . . . . . . . . . . . . . . . . . . . . . . . . . . 1.02% 2.41%A2X . . . . . . . . . . . . . . . . . . . . . . . . . . . . . . . . . . . . . . . . . . . . . . . . . . . . . . . . . . . . . . . . . . . . . . . . . . . . . . . 1.03% 2.49%AA . . . . . . . . . . . . . . . . . . . . . . . . . . . . . . . . . . . . . . . . . . . . . . . . . . . . . . . . . . . . . . . . . . . . . . . . . . . . . . . . 1.03% 2.42%AA AUD H . . . . . . . . . . . . . . . . . . . . . . . . . . . . . . . . . . . . . . . . . . . . . . . . . . . . . . . . . . . . . . . . . . . . . . . . . 0.70% 2.00%AA RMB H . . . . . . . . . . . . . . . . . . . . . . . . . . . . . . . . . . . . . . . . . . . . . . . . . . . . . . . . . . . . . . . . . . . . . . . . . 1.29% 3.31%AA SGD H. . . . . . . . . . . . . . . . . . . . . . . . . . . . . . . . . . . . . . . . . . . . . . . . . . . . . . . . . . . . . . . . . . . . . . . . . . 0.59% 1.59%AA ZAR H. . . . . . . . . . . . . . . . . . . . . . . . . . . . . . . . . . . . . . . . . . . . . . . . . . . . . . . . . . . . . . . . . . . . . . . . . . 3.10% 6.90%AR EUR H. . . . . . . . . . . . . . . . . . . . . . . . . . . . . . . . . . . . . . . . . . . . . . . . . . . . . . . . . . . . . . . . . . . . . . . . . . -0.52% -0.56%AT . . . . . . . . . . . . . . . . . . . . . . . . . . . . . . . . . . . . . . . . . . . . . . . . . . . . . . . . . . . . . . . . . . . . . . . . . . . . . . . . 0.98% 2.38%AT AUD H. . . . . . . . . . . . . . . . . . . . . . . . . . . . . . . . . . . . . . . . . . . . . . . . . . . . . . . . . . . . . . . . . . . . . . . . . . 0.68% 2.00%AT GBP H . . . . . . . . . . . . . . . . . . . . . . . . . . . . . . . . . . . . . . . . . . . . . . . . . . . . . . . . . . . . . . . . . . . . . . . . . . 0.02% 0.39%(6)AT SGD H . . . . . . . . . . . . . . . . . . . . . . . . . . . . . . . . . . . . . . . . . . . . . . . . . . . . . . . . . . . . . . . . . . . . . . . . . . 0.54% 1.48%AX . . . . . . . . . . . . . . . . . . . . . . . . . . . . . . . . . . . . . . . . . . . . . . . . . . . . . . . . . . . . . . . . . . . . . . . . . . . . . . . . 1.06% 2.56%B2X . . . . . . . . . . . . . . . . . . . . . . . . . . . . . . . . . . . . . . . . . . . . . . . . . . . . . . . . . . . . . . . . . . . . . . . . . . . . . . . 0.83% 2.01%BA . . . . . . . . . . . . . . . . . . . . . . . . . . . . . . . . . . . . . . . . . . . . . . . . . . . . . . . . . . . . . . . . . . . . . . . . . . . . . . . . 0.51% 1.45%BA AUD H . . . . . . . . . . . . . . . . . . . . . . . . . . . . . . . . . . . . . . . . . . . . . . . . . . . . . . . . . . . . . . . . . . . . . . . . . 0.16% 0.92%BA ZAR H. . . . . . . . . . . . . . . . . . . . . . . . . . . . . . . . . . . . . . . . . . . . . . . . . . . . . . . . . . . . . . . . . . . . . . . . . . 2.62% 6.04%BX . . . . . . . . . . . . . . . . . . . . . . . . . . . . . . . . . . . . . . . . . . . . . . . . . . . . . . . . . . . . . . . . . . . . . . . . . . . . . . . . 0.84% 1.95%C . . . . . . . . . . . . . . . . . . . . . . . . . . . . . . . . . . . . . . . . . . . . . . . . . . . . . . . . . . . . . . . . . . . . . . . . . . . . . . . . . 0.74% 1.90%C2 . . . . . . . . . . . . . . . . . . . . . . . . . . . . . . . . . . . . . . . . . . . . . . . . . . . . . . . . . . . . . . . . . . . . . . . . . . . . . . . . 0.75% 1.93%C2X . . . . . . . . . . . . . . . . . . . . . . . . . . . . . . . . . . . . . . . . . . . . . . . . . . . . . . . . . . . . . . . . . . . . . . . . . . . . . . . 0.76% 2.02%CX . . . . . . . . . . . . . . . . . . . . . . . . . . . . . . . . . . . . . . . . . . . . . . . . . . . . . . . . . . . . . . . . . . . . . . . . . . . . . . . . 0.84% 1.95%I . . . . . . . . . . . . . . . . . . . . . . . . . . . . . . . . . . . . . . . . . . . . . . . . . . . . . . . . . . . . . . . . . . . . . . . . . . . . . . . . . . 1.25% 2.93%I2 . . . . . . . . . . . . . . . . . . . . . . . . . . . . . . . . . . . . . . . . . . . . . . . . . . . . . . . . . . . . . . . . . . . . . . . . . . . . . . . . . 1.27% 2.92%I2 EUR H. . . . . . . . . . . . . . . . . . . . . . . . . . . . . . . . . . . . . . . . . . . . . . . . . . . . . . . . . . . . . . . . . . . . . . . . . . . -0.26% -0.07%I2X. . . . . . . . . . . . . . . . . . . . . . . . . . . . . . . . . . . . . . . . . . . . . . . . . . . . . . . . . . . . . . . . . . . . . . . . . . . . . . . . 1.26% 3.02%IT EUR H. . . . . . . . . . . . . . . . . . . . . . . . . . . . . . . . . . . . . . . . . . . . . . . . . . . . . . . . . . . . . . . . . . . . . . . . . . . -0.25% -0.05%(7)IX . . . . . . . . . . . . . . . . . . . . . . . . . . . . . . . . . . . . . . . . . . . . . . . . . . . . . . . . . . . . . . . . . . . . . . . . . . . . . . . . . 1.34% 2.97%N2 . . . . . . . . . . . . . . . . . . . . . . . . . . . . . . . . . . . . . . . . . . . . . . . . . . . . . . . . . . . . . . . . . . . . . . . . . . . . . . . . 0.73% 1.33%(8)NT . . . . . . . . . . . . . . . . . . . . . . . . . . . . . . . . . . . . . . . . . . . . . . . . . . . . . . . . . . . . . . . . . . . . . . . . . . . . . . . . 0.67% 1.42%(8)S. . . . . . . . . . . . . . . . . . . . . . . . . . . . . . . . . . . . . . . . . . . . . . . . . . . . . . . . . . . . . . . . . . . . . . . . . . . . . . . . . . 1.63% 3.70%S1. . . . . . . . . . . . . . . . . . . . . . . . . . . . . . . . . . . . . . . . . . . . . . . . . . . . . . . . . . . . . . . . . . . . . . . . . . . . . . . . . 1.38% 3.16%S1 JPY . . . . . . . . . . . . . . . . . . . . . . . . . . . . . . . . . . . . . . . . . . . . . . . . . . . . . . . . . . . . . . . . . . . . . . . . . . . . . -0.46%(9) –S1X . . . . . . . . . . . . . . . . . . . . . . . . . . . . . . . . . . . . . . . . . . . . . . . . . . . . . . . . . . . . . . . . . . . . . . . . . . . . . . . 1.47% 3.23%SA . . . . . . . . . . . . . . . . . . . . . . . . . . . . . . . . . . . . . . . . . . . . . . . . . . . . . . . . . . . . . . . . . . . . . . . . . . . . . . . . 1.61% 3.68%
Global Bond II PortfolioClass
S1. . . . . . . . . . . . . . . . . . . . . . . . . . . . . . . . . . . . . . . . . . . . . . . . . . . . . . . . . . . . . . . . . . . . . . . . . . . . . . . . . 2.63% 3.39%
6 Months* 12 Months

AB FCP I
11
The share class performance of each Portfolio is based on the net asset value incorporating the impact of expenses reimbursed or waived by the Management Company as of February 28, 2019. No adjustment has been made for sales charges that may apply when shares are purchased or redeemed. Performance for distributing share classes includes the reinvestment of distributions paid during the period. Past performance is no guarantee of future results. Investment return and principal value may fluctuate so that an inves-tor’s shares, when redeemed, may be worth more or less than their original cost.
* 6 month period ending February 28, 2019.Return calculated from inception date on:(1) November 26, 2018(2) May 15, 2018(3) May 4, 2018(4) March 13, 2018(5) December 28, 2018(6) June 26, 2018(7) July 5, 2018(8) May 18, 2018(9) November 30, 2018

AB FCP I
12
Portfolio of investmentsFebruary 28, 2019 (unaudited) DynamicDiversifiedPortfolio
Shares Value Net Assets (USD) %
TRANSFERABLE SECURITIES QUOTED ON A STOCK EXCHANGE OR DEALT IN ON ANOTHER REGULATED MARKETCOMMON STOCKSCOMMUNICATION SERVICESDIVERSIFIED TELECOMMUNICATION SERVICES
China Unicom Hong Kong Ltd. . . . . . . . . . . . . . . . . . . . . . . . . . . . . . . . . . . . . . . . . . . . . . . . . 118,000 $ 139,414 0.2%Nippon Telegraph & Telephone Corp. . . . . . . . . . . . . . . . . . . . . . . . . . . . . . . . . . . . . . . . . . . . 2,000 86,445 0.2PCCW Ltd. . . . . . . . . . . . . . . . . . . . . . . . . . . . . . . . . . . . . . . . . . . . . . . . . . . . . . . . . . . . . . . . . 26,000 15,634 0.0Spark New Zealand Ltd. . . . . . . . . . . . . . . . . . . . . . . . . . . . . . . . . . . . . . . . . . . . . . . . . . . . . . . 12,000 30,463 0.1Telenor ASA . . . . . . . . . . . . . . . . . . . . . . . . . . . . . . . . . . . . . . . . . . . . . . . . . . . . . . . . . . . . . . . 2,240 43,684 0.1TPG Telecom Ltd. . . . . . . . . . . . . . . . . . . . . . . . . . . . . . . . . . . . . . . . . . . . . . . . . . . . . . . . . . . . 5,880 27,769 0.0Verizon Communications, Inc. . . . . . . . . . . . . . . . . . . . . . . . . . . . . . . . . . . . . . . . . . . . . . . . . . 680 38,706 0.1 382,115 0.7
ENTERTAINMENTLive Nation Entertainment, Inc. . . . . . . . . . . . . . . . . . . . . . . . . . . . . . . . . . . . . . . . . . . . . . . . . 1,430 80,881 0.1Nintendo Co., Ltd. . . . . . . . . . . . . . . . . . . . . . . . . . . . . . . . . . . . . . . . . . . . . . . . . . . . . . . . . . . 300 82,272 0.2Viacom, Inc. - Class B . . . . . . . . . . . . . . . . . . . . . . . . . . . . . . . . . . . . . . . . . . . . . . . . . . . . . . . 2,630 76,848 0.1 240,001 0.4
INTERACTIVE MEDIA & SERVICESAlphabet, Inc. - Class A . . . . . . . . . . . . . . . . . . . . . . . . . . . . . . . . . . . . . . . . . . . . . . . . . . . . . . 87 98,010 0.2Alphabet, Inc. - Class C . . . . . . . . . . . . . . . . . . . . . . . . . . . . . . . . . . . . . . . . . . . . . . . . . . . . . . 375 419,970 0.7Facebook, Inc. - Class A . . . . . . . . . . . . . . . . . . . . . . . . . . . . . . . . . . . . . . . . . . . . . . . . . . . . . . 1,666 268,976 0.5Tencent Holdings Ltd. . . . . . . . . . . . . . . . . . . . . . . . . . . . . . . . . . . . . . . . . . . . . . . . . . . . . . . . . 5,400 231,245 0.4 1,018,201 1.8
MEDIAComcast Corp. - Class A . . . . . . . . . . . . . . . . . . . . . . . . . . . . . . . . . . . . . . . . . . . . . . . . . . . . . . 4,650 179,815 0.3Multichoice Group Ltd. . . . . . . . . . . . . . . . . . . . . . . . . . . . . . . . . . . . . . . . . . . . . . . . . . . . . . . 1,020 7,603 0.0Omnicom Group, Inc. . . . . . . . . . . . . . . . . . . . . . . . . . . . . . . . . . . . . . . . . . . . . . . . . . . . . . . . . 1,040 78,728 0.2 266,146 0.5
WIRELESS TELECOMMUNICATION SERVICESChina Mobile Ltd. . . . . . . . . . . . . . . . . . . . . . . . . . . . . . . . . . . . . . . . . . . . . . . . . . . . . . . . . . . . 9,500 100,344 0.2KDDI Corp. . . . . . . . . . . . . . . . . . . . . . . . . . . . . . . . . . . . . . . . . . . . . . . . . . . . . . . . . . . . . . . . . 7,900 190,941 0.3SoftBank Group Corp. . . . . . . . . . . . . . . . . . . . . . . . . . . . . . . . . . . . . . . . . . . . . . . . . . . . . . . . 2,250 208,787 0.4T-Mobile US, Inc. . . . . . . . . . . . . . . . . . . . . . . . . . . . . . . . . . . . . . . . . . . . . . . . . . . . . . . . . . . . 2,010 145,142 0.3 645,214 1.2 2,551,677 4.6
CONSUMER DISCRETIONARYAUTO COMPONENTS
Aptiv PLC . . . . . . . . . . . . . . . . . . . . . . . . . . . . . . . . . . . . . . . . . . . . . . . . . . . . . . . . . . . . . . . . . 1,890 157,078 0.3Hankook Tire Co., Ltd. . . . . . . . . . . . . . . . . . . . . . . . . . . . . . . . . . . . . . . . . . . . . . . . . . . . . . . . 1,700 64,557 0.1Magna International, Inc. - Class A . . . . . . . . . . . . . . . . . . . . . . . . . . . . . . . . . . . . . . . . . . . . . 2,090 110,206 0.2NGK Spark Plug Co., Ltd. . . . . . . . . . . . . . . . . . . . . . . . . . . . . . . . . . . . . . . . . . . . . . . . . . . . . 3,800 81,076 0.1Toyo Tire Corp. . . . . . . . . . . . . . . . . . . . . . . . . . . . . . . . . . . . . . . . . . . . . . . . . . . . . . . . . . . . . . 4,600 58,791 0.1 471,708 0.8
AUTOMOBILESNissan Motor Co., Ltd. . . . . . . . . . . . . . . . . . . . . . . . . . . . . . . . . . . . . . . . . . . . . . . . . . . . . . . . 3,700 32,062 0.1Peugeot SA . . . . . . . . . . . . . . . . . . . . . . . . . . . . . . . . . . . . . . . . . . . . . . . . . . . . . . . . . . . . . . . . 3,050 77,549 0.1Subaru Corp. . . . . . . . . . . . . . . . . . . . . . . . . . . . . . . . . . . . . . . . . . . . . . . . . . . . . . . . . . . . . . . . 3,500 89,177 0.2 198,788 0.4
DIVERSIFIED CONSUMER SERVICESService Corp. International/US . . . . . . . . . . . . . . . . . . . . . . . . . . . . . . . . . . . . . . . . . . . . . . . . . 7,118 294,258 0.5Sotheby’s . . . . . . . . . . . . . . . . . . . . . . . . . . . . . . . . . . . . . . . . . . . . . . . . . . . . . . . . . . . . . . . . . . 2,130 93,443 0.2 387,701 0.7
HOTELS, RESTAURANTS & LEISUREChoice Hotels International, Inc. . . . . . . . . . . . . . . . . . . . . . . . . . . . . . . . . . . . . . . . . . . . . . . . 539 43,034 0.1Compass Group PLC . . . . . . . . . . . . . . . . . . . . . . . . . . . . . . . . . . . . . . . . . . . . . . . . . . . . . . . . 10,750 237,414 0.4GVC Holdings PLC . . . . . . . . . . . . . . . . . . . . . . . . . . . . . . . . . . . . . . . . . . . . . . . . . . . . . . . . . 12,090 105,169 0.2Las Vegas Sands Corp. . . . . . . . . . . . . . . . . . . . . . . . . . . . . . . . . . . . . . . . . . . . . . . . . . . . . . . . 2,167 133,119 0.2Starbucks Corp. . . . . . . . . . . . . . . . . . . . . . . . . . . . . . . . . . . . . . . . . . . . . . . . . . . . . . . . . . . . . . 4,508 316,732 0.6Telepizza Group SA . . . . . . . . . . . . . . . . . . . . . . . . . . . . . . . . . . . . . . . . . . . . . . . . . . . . . . . . . 8,753 62,026 0.1 897,494 1.6
HOUSEHOLD DURABLESPanasonic Corp. . . . . . . . . . . . . . . . . . . . . . . . . . . . . . . . . . . . . . . . . . . . . . . . . . . . . . . . . . . . . 9,600 88,721 0.2
INTERNET & DIRECT MARKETING RETAILAlibaba Group Holding Ltd. (ADR) . . . . . . . . . . . . . . . . . . . . . . . . . . . . . . . . . . . . . . . . . . . . . 1,526 279,304 0.5Amazon.com, Inc. . . . . . . . . . . . . . . . . . . . . . . . . . . . . . . . . . . . . . . . . . . . . . . . . . . . . . . . . . . . 110 180,381 0.3Booking Holdings, Inc. . . . . . . . . . . . . . . . . . . . . . . . . . . . . . . . . . . . . . . . . . . . . . . . . . . . . . . . 177 300,376 0.6 760,061 1.4
LEISURE PRODUCTSSankyo Co., Ltd. . . . . . . . . . . . . . . . . . . . . . . . . . . . . . . . . . . . . . . . . . . . . . . . . . . . . . . . . . . . . 700 25,815 0.0

AB FCP I
13
DynamicDiversifiedPortfolio
Shares Value Net Assets (USD) %
MEDIAInterpublic Group of Cos., Inc. (The) . . . . . . . . . . . . . . . . . . . . . . . . . . . . . . . . . . . . . . . . . . . . 3,370 $ 77,611 0.1%Naspers Ltd. - Class N . . . . . . . . . . . . . . . . . . . . . . . . . . . . . . . . . . . . . . . . . . . . . . . . . . . . . . . 1,020 219,983 0.4Twenty-First Century Fox, Inc. - Class B . . . . . . . . . . . . . . . . . . . . . . . . . . . . . . . . . . . . . . . . . 1,660 83,265 0.2Walt Disney Co. (The) . . . . . . . . . . . . . . . . . . . . . . . . . . . . . . . . . . . . . . . . . . . . . . . . . . . . . . . 100 11,284 0.0 392,143 0.7
MULTILINE RETAILNext PLC . . . . . . . . . . . . . . . . . . . . . . . . . . . . . . . . . . . . . . . . . . . . . . . . . . . . . . . . . . . . . . . . . 300 20,233 0.0
SPECIALTY RETAILGap, Inc. (The) . . . . . . . . . . . . . . . . . . . . . . . . . . . . . . . . . . . . . . . . . . . . . . . . . . . . . . . . . . . . . 2,450 62,230 0.1Hikari Tsushin, Inc. . . . . . . . . . . . . . . . . . . . . . . . . . . . . . . . . . . . . . . . . . . . . . . . . . . . . . . . . . . 200 35,866 0.1Home Depot, Inc. (The) . . . . . . . . . . . . . . . . . . . . . . . . . . . . . . . . . . . . . . . . . . . . . . . . . . . . . . 700 129,598 0.2Michaels Cos., Inc. (The) . . . . . . . . . . . . . . . . . . . . . . . . . . . . . . . . . . . . . . . . . . . . . . . . . . . . . 4,920 69,569 0.1O’Reilly Automotive, Inc. . . . . . . . . . . . . . . . . . . . . . . . . . . . . . . . . . . . . . . . . . . . . . . . . . . . . . 230 85,551 0.2Signet Jewelers Ltd. . . . . . . . . . . . . . . . . . . . . . . . . . . . . . . . . . . . . . . . . . . . . . . . . . . . . . . . . . 1,140 32,045 0.1Ulta Salon Cosmetics & Fragrance, Inc. . . . . . . . . . . . . . . . . . . . . . . . . . . . . . . . . . . . . . . . . . . 945 295,303 0.5 710,162 1.3
TEXTILES, APPAREL & LUXURY GOODSPandora A/S . . . . . . . . . . . . . . . . . . . . . . . . . . . . . . . . . . . . . . . . . . . . . . . . . . . . . . . . . . . . . . . 1,330 69,791 0.1Samsonite International SA . . . . . . . . . . . . . . . . . . . . . . . . . . . . . . . . . . . . . . . . . . . . . . . . . . . . 48,900 145,321 0.3 215,112 0.4 4,167,938 7.5
CONSUMER STAPLESBEVERAGES
Ambev SA . . . . . . . . . . . . . . . . . . . . . . . . . . . . . . . . . . . . . . . . . . . . . . . . . . . . . . . . . . . . . . . . . 8,900 40,825 0.1Coca-Cola Amatil Ltd. . . . . . . . . . . . . . . . . . . . . . . . . . . . . . . . . . . . . . . . . . . . . . . . . . . . . . . . 4,840 27,368 0.1Coca-Cola Bottlers Japan Holdings, Inc. . . . . . . . . . . . . . . . . . . . . . . . . . . . . . . . . . . . . . . . . . 1,900 49,030 0.1Coca-Cola European Partners PLC . . . . . . . . . . . . . . . . . . . . . . . . . . . . . . . . . . . . . . . . . . . . . . 1,520 71,653 0.1Kirin Holdings Co., Ltd. . . . . . . . . . . . . . . . . . . . . . . . . . . . . . . . . . . . . . . . . . . . . . . . . . . . . . . 800 17,925 0.0Treasury Wine Estates Ltd. . . . . . . . . . . . . . . . . . . . . . . . . . . . . . . . . . . . . . . . . . . . . . . . . . . . . 17,052 181,139 0.3Wuliangye Yibin Co., Ltd. - Class A . . . . . . . . . . . . . . . . . . . . . . . . . . . . . . . . . . . . . . . . . . . . . 5,530 58,936 0.1 446,876 0.8
FOOD & STAPLES RETAILINGAeon Co., Ltd. . . . . . . . . . . . . . . . . . . . . . . . . . . . . . . . . . . . . . . . . . . . . . . . . . . . . . . . . . . . . . . 1,300 27,429 0.0Colruyt SA . . . . . . . . . . . . . . . . . . . . . . . . . . . . . . . . . . . . . . . . . . . . . . . . . . . . . . . . . . . . . . . . 590 42,082 0.1CVS Health Corp. . . . . . . . . . . . . . . . . . . . . . . . . . . . . . . . . . . . . . . . . . . . . . . . . . . . . . . . . . . . 402 23,248 0.0J Sainsbury PLC . . . . . . . . . . . . . . . . . . . . . . . . . . . . . . . . . . . . . . . . . . . . . . . . . . . . . . . . . . . . 15,400 46,796 0.1Koninklijke Ahold Delhaize NV . . . . . . . . . . . . . . . . . . . . . . . . . . . . . . . . . . . . . . . . . . . . . . . . 1,890 48,709 0.1Kroger Co. (The) . . . . . . . . . . . . . . . . . . . . . . . . . . . . . . . . . . . . . . . . . . . . . . . . . . . . . . . . . . . . 2,761 80,980 0.1Sysco Corp. . . . . . . . . . . . . . . . . . . . . . . . . . . . . . . . . . . . . . . . . . . . . . . . . . . . . . . . . . . . . . . . . 560 37,828 0.1US Foods Holding Corp. . . . . . . . . . . . . . . . . . . . . . . . . . . . . . . . . . . . . . . . . . . . . . . . . . . . . . . 2,430 85,633 0.2Walgreens Boots Alliance, Inc. . . . . . . . . . . . . . . . . . . . . . . . . . . . . . . . . . . . . . . . . . . . . . . . . . 90 6,407 0.0 399,112 0.7
FOOD PRODUCTSArcher-Daniels-Midland Co. . . . . . . . . . . . . . . . . . . . . . . . . . . . . . . . . . . . . . . . . . . . . . . . . . . 563 23,928 0.0Bunge Ltd. . . . . . . . . . . . . . . . . . . . . . . . . . . . . . . . . . . . . . . . . . . . . . . . . . . . . . . . . . . . . . . . . . 1,460 77,497 0.1Danone SA . . . . . . . . . . . . . . . . . . . . . . . . . . . . . . . . . . . . . . . . . . . . . . . . . . . . . . . . . . . . . . . . 752 56,798 0.1Kellogg Co. . . . . . . . . . . . . . . . . . . . . . . . . . . . . . . . . . . . . . . . . . . . . . . . . . . . . . . . . . . . . . . . . 1,200 67,512 0.1Marine Harvest ASA . . . . . . . . . . . . . . . . . . . . . . . . . . . . . . . . . . . . . . . . . . . . . . . . . . . . . . . . . 1,870 43,154 0.1Nestle SA (REG) . . . . . . . . . . . . . . . . . . . . . . . . . . . . . . . . . . . . . . . . . . . . . . . . . . . . . . . . . . . . 4,880 441,415 0.8Nissin Foods Holdings Co., Ltd. . . . . . . . . . . . . . . . . . . . . . . . . . . . . . . . . . . . . . . . . . . . . . . . . 400 27,825 0.1 738,129 1.3
HOUSEHOLD PRODUCTSHenkel AG & Co. KGaA (Preference Shares) . . . . . . . . . . . . . . . . . . . . . . . . . . . . . . . . . . . . . 860 85,940 0.1Lion Corp. . . . . . . . . . . . . . . . . . . . . . . . . . . . . . . . . . . . . . . . . . . . . . . . . . . . . . . . . . . . . . . . . . 1,400 28,719 0.1Procter & Gamble Co. (The) . . . . . . . . . . . . . . . . . . . . . . . . . . . . . . . . . . . . . . . . . . . . . . . . . . . 1,240 122,202 0.2 236,861 0.4
PERSONAL PRODUCTSL’Oreal SA . . . . . . . . . . . . . . . . . . . . . . . . . . . . . . . . . . . . . . . . . . . . . . . . . . . . . . . . . . . . . . . . 379 95,587 0.2Unilever PLC . . . . . . . . . . . . . . . . . . . . . . . . . . . . . . . . . . . . . . . . . . . . . . . . . . . . . . . . . . . . . . 500 26,619 0.0 122,206 0.2
TOBACCOAltria Group, Inc. . . . . . . . . . . . . . . . . . . . . . . . . . . . . . . . . . . . . . . . . . . . . . . . . . . . . . . . . . . . 690 36,163 0.1British American Tobacco PLC . . . . . . . . . . . . . . . . . . . . . . . . . . . . . . . . . . . . . . . . . . . . . . . . 2,810 103,024 0.2Japan Tobacco, Inc. . . . . . . . . . . . . . . . . . . . . . . . . . . . . . . . . . . . . . . . . . . . . . . . . . . . . . . . . . . 4,300 109,512 0.2Philip Morris International, Inc. . . . . . . . . . . . . . . . . . . . . . . . . . . . . . . . . . . . . . . . . . . . . . . . . 2,000 173,880 0.3 422,579 0.8 2,365,763 4.2
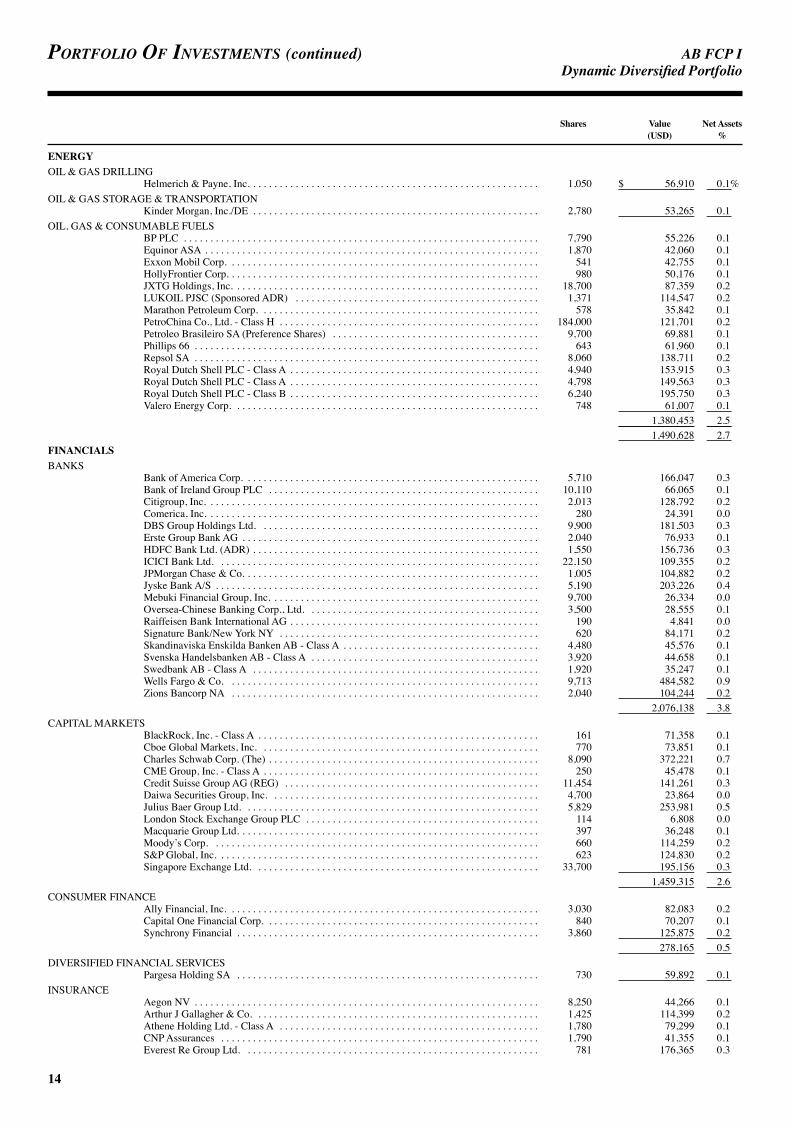
AB FCP I
14
Portfolio of investments (continued) DynamicDiversifiedPortfolio
Shares Value Net Assets (USD) %
ENERGYOIL & GAS DRILLING
Helmerich & Payne, Inc. . . . . . . . . . . . . . . . . . . . . . . . . . . . . . . . . . . . . . . . . . . . . . . . . . . . . . . 1,050 $ 56,910 0.1%OIL & GAS STORAGE & TRANSPORTATION
Kinder Morgan, Inc./DE . . . . . . . . . . . . . . . . . . . . . . . . . . . . . . . . . . . . . . . . . . . . . . . . . . . . . . 2,780 53,265 0.1OIL, GAS & CONSUMABLE FUELS
BP PLC . . . . . . . . . . . . . . . . . . . . . . . . . . . . . . . . . . . . . . . . . . . . . . . . . . . . . . . . . . . . . . . . . . . 7,790 55,226 0.1Equinor ASA . . . . . . . . . . . . . . . . . . . . . . . . . . . . . . . . . . . . . . . . . . . . . . . . . . . . . . . . . . . . . . . 1,870 42,060 0.1Exxon Mobil Corp. . . . . . . . . . . . . . . . . . . . . . . . . . . . . . . . . . . . . . . . . . . . . . . . . . . . . . . . . . . 541 42,755 0.1HollyFrontier Corp. . . . . . . . . . . . . . . . . . . . . . . . . . . . . . . . . . . . . . . . . . . . . . . . . . . . . . . . . . . 980 50,176 0.1JXTG Holdings, Inc. . . . . . . . . . . . . . . . . . . . . . . . . . . . . . . . . . . . . . . . . . . . . . . . . . . . . . . . . . 18,700 87,359 0.2LUKOIL PJSC (Sponsored ADR) . . . . . . . . . . . . . . . . . . . . . . . . . . . . . . . . . . . . . . . . . . . . . . 1,371 114,547 0.2Marathon Petroleum Corp. . . . . . . . . . . . . . . . . . . . . . . . . . . . . . . . . . . . . . . . . . . . . . . . . . . . . 578 35,842 0.1PetroChina Co., Ltd. - Class H . . . . . . . . . . . . . . . . . . . . . . . . . . . . . . . . . . . . . . . . . . . . . . . . . 184,000 121,701 0.2Petroleo Brasileiro SA (Preference Shares) . . . . . . . . . . . . . . . . . . . . . . . . . . . . . . . . . . . . . . . 9,700 69,881 0.1Phillips 66 . . . . . . . . . . . . . . . . . . . . . . . . . . . . . . . . . . . . . . . . . . . . . . . . . . . . . . . . . . . . . . . . . 643 61,960 0.1Repsol SA . . . . . . . . . . . . . . . . . . . . . . . . . . . . . . . . . . . . . . . . . . . . . . . . . . . . . . . . . . . . . . . . . 8,060 138,711 0.2Royal Dutch Shell PLC - Class A . . . . . . . . . . . . . . . . . . . . . . . . . . . . . . . . . . . . . . . . . . . . . . . 4,940 153,915 0.3Royal Dutch Shell PLC - Class A . . . . . . . . . . . . . . . . . . . . . . . . . . . . . . . . . . . . . . . . . . . . . . . 4,798 149,563 0.3Royal Dutch Shell PLC - Class B . . . . . . . . . . . . . . . . . . . . . . . . . . . . . . . . . . . . . . . . . . . . . . . 6,240 195,750 0.3Valero Energy Corp. . . . . . . . . . . . . . . . . . . . . . . . . . . . . . . . . . . . . . . . . . . . . . . . . . . . . . . . . . 748 61,007 0.1 1,380,453 2.5 1,490,628 2.7
FINANCIALSBANKS
Bank of America Corp. . . . . . . . . . . . . . . . . . . . . . . . . . . . . . . . . . . . . . . . . . . . . . . . . . . . . . . . 5,710 166,047 0.3Bank of Ireland Group PLC . . . . . . . . . . . . . . . . . . . . . . . . . . . . . . . . . . . . . . . . . . . . . . . . . . . 10,110 66,065 0.1Citigroup, Inc. . . . . . . . . . . . . . . . . . . . . . . . . . . . . . . . . . . . . . . . . . . . . . . . . . . . . . . . . . . . . . . 2,013 128,792 0.2Comerica, Inc. . . . . . . . . . . . . . . . . . . . . . . . . . . . . . . . . . . . . . . . . . . . . . . . . . . . . . . . . . . . . . . 280 24,391 0.0DBS Group Holdings Ltd. . . . . . . . . . . . . . . . . . . . . . . . . . . . . . . . . . . . . . . . . . . . . . . . . . . . . 9,900 181,503 0.3Erste Group Bank AG . . . . . . . . . . . . . . . . . . . . . . . . . . . . . . . . . . . . . . . . . . . . . . . . . . . . . . . . 2,040 76,933 0.1HDFC Bank Ltd. (ADR) . . . . . . . . . . . . . . . . . . . . . . . . . . . . . . . . . . . . . . . . . . . . . . . . . . . . . . 1,550 156,736 0.3ICICI Bank Ltd. . . . . . . . . . . . . . . . . . . . . . . . . . . . . . . . . . . . . . . . . . . . . . . . . . . . . . . . . . . . . 22,150 109,355 0.2JPMorgan Chase & Co. . . . . . . . . . . . . . . . . . . . . . . . . . . . . . . . . . . . . . . . . . . . . . . . . . . . . . . . 1,005 104,882 0.2Jyske Bank A/S . . . . . . . . . . . . . . . . . . . . . . . . . . . . . . . . . . . . . . . . . . . . . . . . . . . . . . . . . . . . . 5,190 203,226 0.4Mebuki Financial Group, Inc. . . . . . . . . . . . . . . . . . . . . . . . . . . . . . . . . . . . . . . . . . . . . . . . . . . 9,700 26,334 0.0Oversea-Chinese Banking Corp., Ltd. . . . . . . . . . . . . . . . . . . . . . . . . . . . . . . . . . . . . . . . . . . . 3,500 28,555 0.1Raiffeisen Bank International AG . . . . . . . . . . . . . . . . . . . . . . . . . . . . . . . . . . . . . . . . . . . . . . . 190 4,841 0.0Signature Bank/New York NY . . . . . . . . . . . . . . . . . . . . . . . . . . . . . . . . . . . . . . . . . . . . . . . . . 620 84,171 0.2Skandinaviska Enskilda Banken AB - Class A . . . . . . . . . . . . . . . . . . . . . . . . . . . . . . . . . . . . . 4,480 45,576 0.1Svenska Handelsbanken AB - Class A . . . . . . . . . . . . . . . . . . . . . . . . . . . . . . . . . . . . . . . . . . . 3,920 44,658 0.1Swedbank AB - Class A . . . . . . . . . . . . . . . . . . . . . . . . . . . . . . . . . . . . . . . . . . . . . . . . . . . . . . 1,920 35,247 0.1Wells Fargo & Co. . . . . . . . . . . . . . . . . . . . . . . . . . . . . . . . . . . . . . . . . . . . . . . . . . . . . . . . . . . 9,713 484,582 0.9Zions Bancorp NA . . . . . . . . . . . . . . . . . . . . . . . . . . . . . . . . . . . . . . . . . . . . . . . . . . . . . . . . . . 2,040 104,244 0.2 2,076,138 3.8
CAPITAL MARKETSBlackRock, Inc. - Class A . . . . . . . . . . . . . . . . . . . . . . . . . . . . . . . . . . . . . . . . . . . . . . . . . . . . . 161 71,358 0.1Cboe Global Markets, Inc. . . . . . . . . . . . . . . . . . . . . . . . . . . . . . . . . . . . . . . . . . . . . . . . . . . . . 770 73,851 0.1Charles Schwab Corp. (The) . . . . . . . . . . . . . . . . . . . . . . . . . . . . . . . . . . . . . . . . . . . . . . . . . . . 8,090 372,221 0.7CME Group, Inc. - Class A . . . . . . . . . . . . . . . . . . . . . . . . . . . . . . . . . . . . . . . . . . . . . . . . . . . . 250 45,478 0.1Credit Suisse Group AG (REG) . . . . . . . . . . . . . . . . . . . . . . . . . . . . . . . . . . . . . . . . . . . . . . . . 11,454 141,261 0.3Daiwa Securities Group, Inc. . . . . . . . . . . . . . . . . . . . . . . . . . . . . . . . . . . . . . . . . . . . . . . . . . . 4,700 23,864 0.0Julius Baer Group Ltd. . . . . . . . . . . . . . . . . . . . . . . . . . . . . . . . . . . . . . . . . . . . . . . . . . . . . . . . 5,829 253,981 0.5London Stock Exchange Group PLC . . . . . . . . . . . . . . . . . . . . . . . . . . . . . . . . . . . . . . . . . . . . 114 6,808 0.0Macquarie Group Ltd. . . . . . . . . . . . . . . . . . . . . . . . . . . . . . . . . . . . . . . . . . . . . . . . . . . . . . . . . 397 36,248 0.1Moody’s Corp. . . . . . . . . . . . . . . . . . . . . . . . . . . . . . . . . . . . . . . . . . . . . . . . . . . . . . . . . . . . . . 660 114,259 0.2S&P Global, Inc. . . . . . . . . . . . . . . . . . . . . . . . . . . . . . . . . . . . . . . . . . . . . . . . . . . . . . . . . . . . . 623 124,830 0.2Singapore Exchange Ltd. . . . . . . . . . . . . . . . . . . . . . . . . . . . . . . . . . . . . . . . . . . . . . . . . . . . . . 33,700 195,156 0.3 1,459,315 2.6
CONSUMER FINANCEAlly Financial, Inc. . . . . . . . . . . . . . . . . . . . . . . . . . . . . . . . . . . . . . . . . . . . . . . . . . . . . . . . . . . 3,030 82,083 0.2Capital One Financial Corp. . . . . . . . . . . . . . . . . . . . . . . . . . . . . . . . . . . . . . . . . . . . . . . . . . . . 840 70,207 0.1Synchrony Financial . . . . . . . . . . . . . . . . . . . . . . . . . . . . . . . . . . . . . . . . . . . . . . . . . . . . . . . . . 3,860 125,875 0.2 278,165 0.5
DIVERSIFIED FINANCIAL SERVICESPargesa Holding SA . . . . . . . . . . . . . . . . . . . . . . . . . . . . . . . . . . . . . . . . . . . . . . . . . . . . . . . . . 730 59,892 0.1
INSURANCEAegon NV . . . . . . . . . . . . . . . . . . . . . . . . . . . . . . . . . . . . . . . . . . . . . . . . . . . . . . . . . . . . . . . . . 8,250 44,266 0.1Arthur J Gallagher & Co. . . . . . . . . . . . . . . . . . . . . . . . . . . . . . . . . . . . . . . . . . . . . . . . . . . . . . 1,425 114,399 0.2Athene Holding Ltd. - Class A . . . . . . . . . . . . . . . . . . . . . . . . . . . . . . . . . . . . . . . . . . . . . . . . . 1,780 79,299 0.1CNP Assurances . . . . . . . . . . . . . . . . . . . . . . . . . . . . . . . . . . . . . . . . . . . . . . . . . . . . . . . . . . . . 1,790 41,355 0.1Everest Re Group Ltd. . . . . . . . . . . . . . . . . . . . . . . . . . . . . . . . . . . . . . . . . . . . . . . . . . . . . . . . 781 176,365 0.3
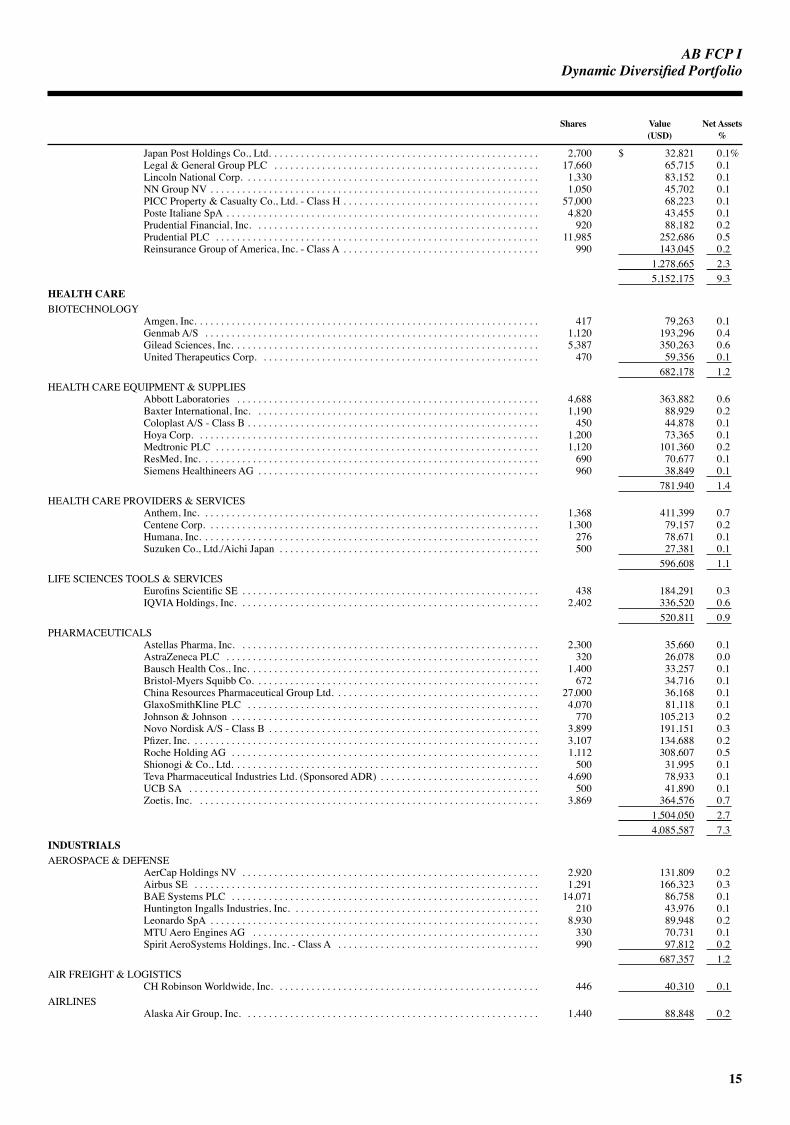
AB FCP I
15
DynamicDiversifiedPortfolio
Shares Value Net Assets (USD) %
Japan Post Holdings Co., Ltd. . . . . . . . . . . . . . . . . . . . . . . . . . . . . . . . . . . . . . . . . . . . . . . . . . . 2,700 $ 32,821 0.1%Legal & General Group PLC . . . . . . . . . . . . . . . . . . . . . . . . . . . . . . . . . . . . . . . . . . . . . . . . . . 17,660 65,715 0.1Lincoln National Corp. . . . . . . . . . . . . . . . . . . . . . . . . . . . . . . . . . . . . . . . . . . . . . . . . . . . . . . . 1,330 83,152 0.1NN Group NV . . . . . . . . . . . . . . . . . . . . . . . . . . . . . . . . . . . . . . . . . . . . . . . . . . . . . . . . . . . . . . 1,050 45,702 0.1PICC Property & Casualty Co., Ltd. - Class H . . . . . . . . . . . . . . . . . . . . . . . . . . . . . . . . . . . . . 57,000 68,223 0.1Poste Italiane SpA . . . . . . . . . . . . . . . . . . . . . . . . . . . . . . . . . . . . . . . . . . . . . . . . . . . . . . . . . . . 4,820 43,455 0.1Prudential Financial, Inc. . . . . . . . . . . . . . . . . . . . . . . . . . . . . . . . . . . . . . . . . . . . . . . . . . . . . . 920 88,182 0.2Prudential PLC . . . . . . . . . . . . . . . . . . . . . . . . . . . . . . . . . . . . . . . . . . . . . . . . . . . . . . . . . . . . . 11,985 252,686 0.5Reinsurance Group of America, Inc. - Class A . . . . . . . . . . . . . . . . . . . . . . . . . . . . . . . . . . . . . 990 143,045 0.2 1,278,665 2.3 5,152,175 9.3
HEALTH CAREBIOTECHNOLOGY
Amgen, Inc. . . . . . . . . . . . . . . . . . . . . . . . . . . . . . . . . . . . . . . . . . . . . . . . . . . . . . . . . . . . . . . . . 417 79,263 0.1Genmab A/S . . . . . . . . . . . . . . . . . . . . . . . . . . . . . . . . . . . . . . . . . . . . . . . . . . . . . . . . . . . . . . . 1,120 193,296 0.4Gilead Sciences, Inc. . . . . . . . . . . . . . . . . . . . . . . . . . . . . . . . . . . . . . . . . . . . . . . . . . . . . . . . . . 5,387 350,263 0.6United Therapeutics Corp. . . . . . . . . . . . . . . . . . . . . . . . . . . . . . . . . . . . . . . . . . . . . . . . . . . . . 470 59,356 0.1 682,178 1.2
HEALTH CARE EQUIPMENT & SUPPLIESAbbott Laboratories . . . . . . . . . . . . . . . . . . . . . . . . . . . . . . . . . . . . . . . . . . . . . . . . . . . . . . . . . 4,688 363,882 0.6Baxter International, Inc. . . . . . . . . . . . . . . . . . . . . . . . . . . . . . . . . . . . . . . . . . . . . . . . . . . . . . 1,190 88,929 0.2Coloplast A/S - Class B . . . . . . . . . . . . . . . . . . . . . . . . . . . . . . . . . . . . . . . . . . . . . . . . . . . . . . . 450 44,878 0.1Hoya Corp. . . . . . . . . . . . . . . . . . . . . . . . . . . . . . . . . . . . . . . . . . . . . . . . . . . . . . . . . . . . . . . . . 1,200 73,365 0.1Medtronic PLC . . . . . . . . . . . . . . . . . . . . . . . . . . . . . . . . . . . . . . . . . . . . . . . . . . . . . . . . . . . . . 1,120 101,360 0.2ResMed, Inc. . . . . . . . . . . . . . . . . . . . . . . . . . . . . . . . . . . . . . . . . . . . . . . . . . . . . . . . . . . . . . . . 690 70,677 0.1Siemens Healthineers AG . . . . . . . . . . . . . . . . . . . . . . . . . . . . . . . . . . . . . . . . . . . . . . . . . . . . . 960 38,849 0.1 781,940 1.4
HEALTH CARE PROVIDERS & SERVICESAnthem, Inc. . . . . . . . . . . . . . . . . . . . . . . . . . . . . . . . . . . . . . . . . . . . . . . . . . . . . . . . . . . . . . . . 1,368 411,399 0.7Centene Corp. . . . . . . . . . . . . . . . . . . . . . . . . . . . . . . . . . . . . . . . . . . . . . . . . . . . . . . . . . . . . . . 1,300 79,157 0.2Humana, Inc. . . . . . . . . . . . . . . . . . . . . . . . . . . . . . . . . . . . . . . . . . . . . . . . . . . . . . . . . . . . . . . . 276 78,671 0.1Suzuken Co., Ltd./Aichi Japan . . . . . . . . . . . . . . . . . . . . . . . . . . . . . . . . . . . . . . . . . . . . . . . . . 500 27,381 0.1 596,608 1.1
LIFE SCIENCES TOOLS & SERVICESEurofins Scientific SE . . . . . . . . . . . . . . . . . . . . . . . . . . . . . . . . . . . . . . . . . . . . . . . . . . . . . . . . 438 184,291 0.3IQVIA Holdings, Inc. . . . . . . . . . . . . . . . . . . . . . . . . . . . . . . . . . . . . . . . . . . . . . . . . . . . . . . . . 2,402 336,520 0.6 520,811 0.9
PHARMACEUTICALSAstellas Pharma, Inc. . . . . . . . . . . . . . . . . . . . . . . . . . . . . . . . . . . . . . . . . . . . . . . . . . . . . . . . . 2,300 35,660 0.1AstraZeneca PLC . . . . . . . . . . . . . . . . . . . . . . . . . . . . . . . . . . . . . . . . . . . . . . . . . . . . . . . . . . . 320 26,078 0.0Bausch Health Cos., Inc. . . . . . . . . . . . . . . . . . . . . . . . . . . . . . . . . . . . . . . . . . . . . . . . . . . . . . . 1,400 33,257 0.1Bristol-Myers Squibb Co. . . . . . . . . . . . . . . . . . . . . . . . . . . . . . . . . . . . . . . . . . . . . . . . . . . . . . 672 34,716 0.1China Resources Pharmaceutical Group Ltd. . . . . . . . . . . . . . . . . . . . . . . . . . . . . . . . . . . . . . . 27,000 36,168 0.1GlaxoSmithKline PLC . . . . . . . . . . . . . . . . . . . . . . . . . . . . . . . . . . . . . . . . . . . . . . . . . . . . . . . 4,070 81,118 0.1Johnson & Johnson . . . . . . . . . . . . . . . . . . . . . . . . . . . . . . . . . . . . . . . . . . . . . . . . . . . . . . . . . . 770 105,213 0.2Novo Nordisk A/S - Class B . . . . . . . . . . . . . . . . . . . . . . . . . . . . . . . . . . . . . . . . . . . . . . . . . . . 3,899 191,151 0.3Pfizer, Inc. . . . . . . . . . . . . . . . . . . . . . . . . . . . . . . . . . . . . . . . . . . . . . . . . . . . . . . . . . . . . . . . . . 3,107 134,688 0.2Roche Holding AG . . . . . . . . . . . . . . . . . . . . . . . . . . . . . . . . . . . . . . . . . . . . . . . . . . . . . . . . . . 1,112 308,607 0.5Shionogi & Co., Ltd. . . . . . . . . . . . . . . . . . . . . . . . . . . . . . . . . . . . . . . . . . . . . . . . . . . . . . . . . . 500 31,995 0.1Teva Pharmaceutical Industries Ltd. (Sponsored ADR) . . . . . . . . . . . . . . . . . . . . . . . . . . . . . . 4,690 78,933 0.1UCB SA . . . . . . . . . . . . . . . . . . . . . . . . . . . . . . . . . . . . . . . . . . . . . . . . . . . . . . . . . . . . . . . . . . 500 41,890 0.1Zoetis, Inc. . . . . . . . . . . . . . . . . . . . . . . . . . . . . . . . . . . . . . . . . . . . . . . . . . . . . . . . . . . . . . . . . 3,869 364,576 0.7 1,504,050 2.7 4,085,587 7.3
INDUSTRIALSAEROSPACE & DEFENSE
AerCap Holdings NV . . . . . . . . . . . . . . . . . . . . . . . . . . . . . . . . . . . . . . . . . . . . . . . . . . . . . . . . 2,920 131,809 0.2Airbus SE . . . . . . . . . . . . . . . . . . . . . . . . . . . . . . . . . . . . . . . . . . . . . . . . . . . . . . . . . . . . . . . . . 1,291 166,323 0.3BAE Systems PLC . . . . . . . . . . . . . . . . . . . . . . . . . . . . . . . . . . . . . . . . . . . . . . . . . . . . . . . . . . 14,071 86,758 0.1Huntington Ingalls Industries, Inc. . . . . . . . . . . . . . . . . . . . . . . . . . . . . . . . . . . . . . . . . . . . . . . 210 43,976 0.1Leonardo SpA . . . . . . . . . . . . . . . . . . . . . . . . . . . . . . . . . . . . . . . . . . . . . . . . . . . . . . . . . . . . . . 8,930 89,948 0.2MTU Aero Engines AG . . . . . . . . . . . . . . . . . . . . . . . . . . . . . . . . . . . . . . . . . . . . . . . . . . . . . . 330 70,731 0.1Spirit AeroSystems Holdings, Inc. - Class A . . . . . . . . . . . . . . . . . . . . . . . . . . . . . . . . . . . . . . 990 97,812 0.2 687,357 1.2
AIR FREIGHT & LOGISTICSCH Robinson Worldwide, Inc. . . . . . . . . . . . . . . . . . . . . . . . . . . . . . . . . . . . . . . . . . . . . . . . . . 446 40,310 0.1
AIRLINESAlaska Air Group, Inc. . . . . . . . . . . . . . . . . . . . . . . . . . . . . . . . . . . . . . . . . . . . . . . . . . . . . . . . 1,440 88,848 0.2

AB FCP I
16
Portfolio of investments (continued) DynamicDiversifiedPortfolio
Shares Value Net Assets (USD) %
BUILDING PRODUCTSAllegion PLC . . . . . . . . . . . . . . . . . . . . . . . . . . . . . . . . . . . . . . . . . . . . . . . . . . . . . . . . . . . . . . 2,160 $ 194,314 0.4%LIXIL Group Corp. . . . . . . . . . . . . . . . . . . . . . . . . . . . . . . . . . . . . . . . . . . . . . . . . . . . . . . . . . . 2,000 27,095 0.0 221,409 0.4
COMMERCIAL SERVICES & SUPPLIESSecom Co., Ltd. . . . . . . . . . . . . . . . . . . . . . . . . . . . . . . . . . . . . . . . . . . . . . . . . . . . . . . . . . . . . 2,100 181,649 0.3Taiwan Secom Co., Ltd. . . . . . . . . . . . . . . . . . . . . . . . . . . . . . . . . . . . . . . . . . . . . . . . . . . . . . . 16,000 44,853 0.1Toppan Printing Co., Ltd. . . . . . . . . . . . . . . . . . . . . . . . . . . . . . . . . . . . . . . . . . . . . . . . . . . . . . 1,700 27,079 0.1 253,581 0.5
CONSTRUCTION & ENGINEERINGACS Actividades de Construccion y Servicios SA . . . . . . . . . . . . . . . . . . . . . . . . . . . . . . . . . . 1,120 49,620 0.1Obayashi Corp. . . . . . . . . . . . . . . . . . . . . . . . . . . . . . . . . . . . . . . . . . . . . . . . . . . . . . . . . . . . . . 3,000 29,242 0.0 78,862 0.1
ELECTRICAL EQUIPMENTNidec Corp. . . . . . . . . . . . . . . . . . . . . . . . . . . . . . . . . . . . . . . . . . . . . . . . . . . . . . . . . . . . . . . . . 1,450 175,856 0.3
INDUSTRIAL CONGLOMERATESKeihan Holdings Co., Ltd. . . . . . . . . . . . . . . . . . . . . . . . . . . . . . . . . . . . . . . . . . . . . . . . . . . . . 700 28,995 0.1
MACHINERYCummins, Inc. . . . . . . . . . . . . . . . . . . . . . . . . . . . . . . . . . . . . . . . . . . . . . . . . . . . . . . . . . . . . . . 550 84,750 0.1Dover Corp. . . . . . . . . . . . . . . . . . . . . . . . . . . . . . . . . . . . . . . . . . . . . . . . . . . . . . . . . . . . . . . . . 2,890 261,632 0.5Kone Oyj - Class B . . . . . . . . . . . . . . . . . . . . . . . . . . . . . . . . . . . . . . . . . . . . . . . . . . . . . . . . . . 2,009 98,157 0.2Mitsubishi Heavy Industries Ltd. . . . . . . . . . . . . . . . . . . . . . . . . . . . . . . . . . . . . . . . . . . . . . . . 800 32,624 0.1Pentair PLC . . . . . . . . . . . . . . . . . . . . . . . . . . . . . . . . . . . . . . . . . . . . . . . . . . . . . . . . . . . . . . . . 1,876 79,805 0.1Stanley Black & Decker, Inc. . . . . . . . . . . . . . . . . . . . . . . . . . . . . . . . . . . . . . . . . . . . . . . . . . . 422 55,885 0.1Volvo AB - Class B . . . . . . . . . . . . . . . . . . . . . . . . . . . . . . . . . . . . . . . . . . . . . . . . . . . . . . . . . . 1,510 22,209 0.0 635,062 1.1
PROFESSIONAL SERVICESRecruit Holdings Co., Ltd. . . . . . . . . . . . . . . . . . . . . . . . . . . . . . . . . . . . . . . . . . . . . . . . . . . . . 7,800 218,674 0.4RELX PLC . . . . . . . . . . . . . . . . . . . . . . . . . . . . . . . . . . . . . . . . . . . . . . . . . . . . . . . . . . . . . . . . 16,087 369,269 0.6Verisk Analytics, Inc. - Class A . . . . . . . . . . . . . . . . . . . . . . . . . . . . . . . . . . . . . . . . . . . . . . . . . 2,562 323,913 0.6 911,856 1.6
ROAD & RAILALD SA . . . . . . . . . . . . . . . . . . . . . . . . . . . . . . . . . . . . . . . . . . . . . . . . . . . . . . . . . . . . . . . . . . 3,418 49,318 0.1Central Japan Railway Co. . . . . . . . . . . . . . . . . . . . . . . . . . . . . . . . . . . . . . . . . . . . . . . . . . . . . 200 44,880 0.1Union Pacific Corp. . . . . . . . . . . . . . . . . . . . . . . . . . . . . . . . . . . . . . . . . . . . . . . . . . . . . . . . . . . 660 110,682 0.2 204,880 0.4
TRADING COMPANIES & DISTRIBUTORSITOCHU Corp. . . . . . . . . . . . . . . . . . . . . . . . . . . . . . . . . . . . . . . . . . . . . . . . . . . . . . . . . . . . . . 1,900 34,130 0.1Mitsui & Co., Ltd. . . . . . . . . . . . . . . . . . . . . . . . . . . . . . . . . . . . . . . . . . . . . . . . . . . . . . . . . . . . 2,100 33,052 0.0 67,182 0.1
TRANSPORTATION INFRASTRUCTUREFlughafen Zurich AG . . . . . . . . . . . . . . . . . . . . . . . . . . . . . . . . . . . . . . . . . . . . . . . . . . . . . . . . 422 75,131 0.1 3,469,329 6.2
INFORMATION TECHNOLOGYCOMMUNICATIONS EQUIPMENT
F5 Networks, Inc. . . . . . . . . . . . . . . . . . . . . . . . . . . . . . . . . . . . . . . . . . . . . . . . . . . . . . . . . . . . 500 84,070 0.1Juniper Networks, Inc. . . . . . . . . . . . . . . . . . . . . . . . . . . . . . . . . . . . . . . . . . . . . . . . . . . . . . . . 7,100 192,268 0.3Nokia Oyj . . . . . . . . . . . . . . . . . . . . . . . . . . . . . . . . . . . . . . . . . . . . . . . . . . . . . . . . . . . . . . . . . 23,840 144,167 0.3Palo Alto Networks, Inc. . . . . . . . . . . . . . . . . . . . . . . . . . . . . . . . . . . . . . . . . . . . . . . . . . . . . . . 140 34,478 0.1Telefonaktiebolaget LM Ericsson - Class B . . . . . . . . . . . . . . . . . . . . . . . . . . . . . . . . . . . . . . . 5,149 46,935 0.1 501,918 0.9
ELECTRONIC EQUIPMENT, INSTRUMENTS & COMPONENTSAmphenol Corp. - Class A . . . . . . . . . . . . . . . . . . . . . . . . . . . . . . . . . . . . . . . . . . . . . . . . . . . . 2,579 242,349 0.4Arrow Electronics, Inc. . . . . . . . . . . . . . . . . . . . . . . . . . . . . . . . . . . . . . . . . . . . . . . . . . . . . . . . 1,030 82,091 0.2Hitachi Ltd. . . . . . . . . . . . . . . . . . . . . . . . . . . . . . . . . . . . . . . . . . . . . . . . . . . . . . . . . . . . . . . . . 700 21,042 0.0IPG Photonics Corp. . . . . . . . . . . . . . . . . . . . . . . . . . . . . . . . . . . . . . . . . . . . . . . . . . . . . . . . . . 417 64,648 0.1Keyence Corp. . . . . . . . . . . . . . . . . . . . . . . . . . . . . . . . . . . . . . . . . . . . . . . . . . . . . . . . . . . . . . . 330 192,972 0.4 603,102 1.1
IT SERVICESAlliance Data Systems Corp. . . . . . . . . . . . . . . . . . . . . . . . . . . . . . . . . . . . . . . . . . . . . . . . . . . 290 50,170 0.1Amadeus IT Group SA - Class A . . . . . . . . . . . . . . . . . . . . . . . . . . . . . . . . . . . . . . . . . . . . . . . 598 44,983 0.1Automatic Data Processing, Inc. . . . . . . . . . . . . . . . . . . . . . . . . . . . . . . . . . . . . . . . . . . . . . . . . 520 79,575 0.1Broadridge Financial Solutions, Inc. . . . . . . . . . . . . . . . . . . . . . . . . . . . . . . . . . . . . . . . . . . . . 720 72,900 0.1Capgemini SE . . . . . . . . . . . . . . . . . . . . . . . . . . . . . . . . . . . . . . . . . . . . . . . . . . . . . . . . . . . . . . 2,143 256,149 0.5Cognizant Technology Solutions Corp. - Class A . . . . . . . . . . . . . . . . . . . . . . . . . . . . . . . . . . . 2,629 186,606 0.3Computershare Ltd. . . . . . . . . . . . . . . . . . . . . . . . . . . . . . . . . . . . . . . . . . . . . . . . . . . . . . . . . . . 2,470 30,216 0.1Fujitsu Ltd. . . . . . . . . . . . . . . . . . . . . . . . . . . . . . . . . . . . . . . . . . . . . . . . . . . . . . . . . . . . . . . . . 500 33,744 0.1Mastercard, Inc. - Class A . . . . . . . . . . . . . . . . . . . . . . . . . . . . . . . . . . . . . . . . . . . . . . . . . . . . . 2,048 460,329 0.8Visa, Inc. - Class A . . . . . . . . . . . . . . . . . . . . . . . . . . . . . . . . . . . . . . . . . . . . . . . . . . . . . . . . . . 1,627 240,992 0.4 1,455,664 2.6

AB FCP I
17
DynamicDiversifiedPortfolio
Shares Value Net Assets (USD) %
SEMICONDUCTORS & SEMICONDUCTOR EQUIPMENTASML Holding NV . . . . . . . . . . . . . . . . . . . . . . . . . . . . . . . . . . . . . . . . . . . . . . . . . . . . . . . . . . 1,739 $ 318,127 0.6%Intel Corp. . . . . . . . . . . . . . . . . . . . . . . . . . . . . . . . . . . . . . . . . . . . . . . . . . . . . . . . . . . . . . . . . . 3,612 191,291 0.4NXP Semiconductors NV . . . . . . . . . . . . . . . . . . . . . . . . . . . . . . . . . . . . . . . . . . . . . . . . . . . . . 690 63,011 0.1Realtek Semiconductor Corp. . . . . . . . . . . . . . . . . . . . . . . . . . . . . . . . . . . . . . . . . . . . . . . . . . . 10,000 57,381 0.1Taiwan Semiconductor Manufacturing Co., Ltd. . . . . . . . . . . . . . . . . . . . . . . . . . . . . . . . . . . . 10,000 76,737 0.1 706,547 1.3
SOFTWARECitrix Systems, Inc. - Class C . . . . . . . . . . . . . . . . . . . . . . . . . . . . . . . . . . . . . . . . . . . . . . . . . . 720 75,960 0.1Dell Technologies, Inc. - Class C . . . . . . . . . . . . . . . . . . . . . . . . . . . . . . . . . . . . . . . . . . . . . . . 1,391 77,646 0.1Fortinet, Inc. . . . . . . . . . . . . . . . . . . . . . . . . . . . . . . . . . . . . . . . . . . . . . . . . . . . . . . . . . . . . . . . 1,124 97,552 0.2Microsoft Corp. . . . . . . . . . . . . . . . . . . . . . . . . . . . . . . . . . . . . . . . . . . . . . . . . . . . . . . . . . . . . . 7,688 861,286 1.5Oracle Corp. . . . . . . . . . . . . . . . . . . . . . . . . . . . . . . . . . . . . . . . . . . . . . . . . . . . . . . . . . . . . . . . 5,889 307,046 0.5SAP SE . . . . . . . . . . . . . . . . . . . . . . . . . . . . . . . . . . . . . . . . . . . . . . . . . . . . . . . . . . . . . . . . . . . 530 56,724 0.1Symantec Corp. . . . . . . . . . . . . . . . . . . . . . . . . . . . . . . . . . . . . . . . . . . . . . . . . . . . . . . . . . . . . . 3,720 83,663 0.2Synopsys, Inc. . . . . . . . . . . . . . . . . . . . . . . . . . . . . . . . . . . . . . . . . . . . . . . . . . . . . . . . . . . . . . . 890 90,495 0.2Temenos AG . . . . . . . . . . . . . . . . . . . . . . . . . . . . . . . . . . . . . . . . . . . . . . . . . . . . . . . . . . . . . . . 841 121,584 0.2VMware, Inc. - Class A . . . . . . . . . . . . . . . . . . . . . . . . . . . . . . . . . . . . . . . . . . . . . . . . . . . . . . . 540 92,777 0.2 1,864,733 3.3
TECHNOLOGY HARDWARE, STORAGE & PERIPHERALSApple, Inc. . . . . . . . . . . . . . . . . . . . . . . . . . . . . . . . . . . . . . . . . . . . . . . . . . . . . . . . . . . . . . . . . . 2,664 461,271 0.8Konica Minolta, Inc. . . . . . . . . . . . . . . . . . . . . . . . . . . . . . . . . . . . . . . . . . . . . . . . . . . . . . . . . . 2,900 28,204 0.1NCR Corp. . . . . . . . . . . . . . . . . . . . . . . . . . . . . . . . . . . . . . . . . . . . . . . . . . . . . . . . . . . . . . . . . 2,640 73,973 0.1Samsung Electronics Co., Ltd. . . . . . . . . . . . . . . . . . . . . . . . . . . . . . . . . . . . . . . . . . . . . . . . . . 7,245 289,958 0.5 853,406 1.5 5,985,370 10.7
MATERIALSCHEMICALS
Air Liquide SA . . . . . . . . . . . . . . . . . . . . . . . . . . . . . . . . . . . . . . . . . . . . . . . . . . . . . . . . . . . . . 430 53,599 0.1BASF SE . . . . . . . . . . . . . . . . . . . . . . . . . . . . . . . . . . . . . . . . . . . . . . . . . . . . . . . . . . . . . . . . . . 2,604 198,209 0.4Ecolab, Inc. . . . . . . . . . . . . . . . . . . . . . . . . . . . . . . . . . . . . . . . . . . . . . . . . . . . . . . . . . . . . . . . . 1,535 259,277 0.5Johnson Matthey PLC . . . . . . . . . . . . . . . . . . . . . . . . . . . . . . . . . . . . . . . . . . . . . . . . . . . . . . . . 2,800 114,901 0.2Methanex Corp. . . . . . . . . . . . . . . . . . . . . . . . . . . . . . . . . . . . . . . . . . . . . . . . . . . . . . . . . . . . . . 190 10,694 0.0Mitsubishi Chemical Holdings Corp. . . . . . . . . . . . . . . . . . . . . . . . . . . . . . . . . . . . . . . . . . . . . 3,400 25,144 0.0Mosaic Co. (The) . . . . . . . . . . . . . . . . . . . . . . . . . . . . . . . . . . . . . . . . . . . . . . . . . . . . . . . . . . . 2,910 90,996 0.2Sumitomo Chemical Co., Ltd. . . . . . . . . . . . . . . . . . . . . . . . . . . . . . . . . . . . . . . . . . . . . . . . . . 5,700 28,342 0.1Teijin Ltd. . . . . . . . . . . . . . . . . . . . . . . . . . . . . . . . . . . . . . . . . . . . . . . . . . . . . . . . . . . . . . . . . . 1,300 21,830 0.0Tosoh Corp. . . . . . . . . . . . . . . . . . . . . . . . . . . . . . . . . . . . . . . . . . . . . . . . . . . . . . . . . . . . . . . . . 4,800 70,970 0.1Westlake Chemical Corp. . . . . . . . . . . . . . . . . . . . . . . . . . . . . . . . . . . . . . . . . . . . . . . . . . . . . . 893 62,394 0.1 936,356 1.7
CONSTRUCTION MATERIALSCRH PLC (London) . . . . . . . . . . . . . . . . . . . . . . . . . . . . . . . . . . . . . . . . . . . . . . . . . . . . . . . . . 7,921 250,751 0.5
METALS & MININGAlcoa Corp. . . . . . . . . . . . . . . . . . . . . . . . . . . . . . . . . . . . . . . . . . . . . . . . . . . . . . . . . . . . . . . . . 2,720 80,240 0.1First Quantum Minerals Ltd. . . . . . . . . . . . . . . . . . . . . . . . . . . . . . . . . . . . . . . . . . . . . . . . . . . . 4,790 54,927 0.1 135,167 0.2
PAPER & FOREST PRODUCTSMondi PLC . . . . . . . . . . . . . . . . . . . . . . . . . . . . . . . . . . . . . . . . . . . . . . . . . . . . . . . . . . . . . . . . 1,900 43,496 0.1 1,365,770 2.5
REAL ESTATEDIVERSIFIED REITS
Covivio . . . . . . . . . . . . . . . . . . . . . . . . . . . . . . . . . . . . . . . . . . . . . . . . . . . . . . . . . . . . . . . . . . . 430 43,530 0.1ICADE . . . . . . . . . . . . . . . . . . . . . . . . . . . . . . . . . . . . . . . . . . . . . . . . . . . . . . . . . . . . . . . . . . . 510 43,421 0.1Mirvac Group . . . . . . . . . . . . . . . . . . . . . . . . . . . . . . . . . . . . . . . . . . . . . . . . . . . . . . . . . . . . . . 20,010 36,569 0.0 123,520 0.2
EQUITY REAL ESTATE INVESTMENT TRUSTS (REITS)Host Hotels & Resorts, Inc. . . . . . . . . . . . . . . . . . . . . . . . . . . . . . . . . . . . . . . . . . . . . . . . . . . . 4,540 89,029 0.1Mid-America Apartment Communities, Inc. . . . . . . . . . . . . . . . . . . . . . . . . . . . . . . . . . . . . . . 970 100,473 0.2Stockland . . . . . . . . . . . . . . . . . . . . . . . . . . . . . . . . . . . . . . . . . . . . . . . . . . . . . . . . . . . . . . . . . . 12,160 30,243 0.1 219,745 0.4
REAL ESTATE MANAGEMENT & DEVELOPMENTAroundtown SA . . . . . . . . . . . . . . . . . . . . . . . . . . . . . . . . . . . . . . . . . . . . . . . . . . . . . . . . . . . . 16,340 137,206 0.3CBRE Group, Inc. - Class A . . . . . . . . . . . . . . . . . . . . . . . . . . . . . . . . . . . . . . . . . . . . . . . . . . . 3,036 151,071 0.2Nomura Real Estate Holdings, Inc. . . . . . . . . . . . . . . . . . . . . . . . . . . . . . . . . . . . . . . . . . . . . . . 1,500 28,427 0.1 316,704 0.6
RETAIL REITSJapan Retail Fund Investment Corp. . . . . . . . . . . . . . . . . . . . . . . . . . . . . . . . . . . . . . . . . . . . . . 12 24,207 0.0Link REIT . . . . . . . . . . . . . . . . . . . . . . . . . . . . . . . . . . . . . . . . . . . . . . . . . . . . . . . . . . . . . . . . . 2,500 28,278 0.1
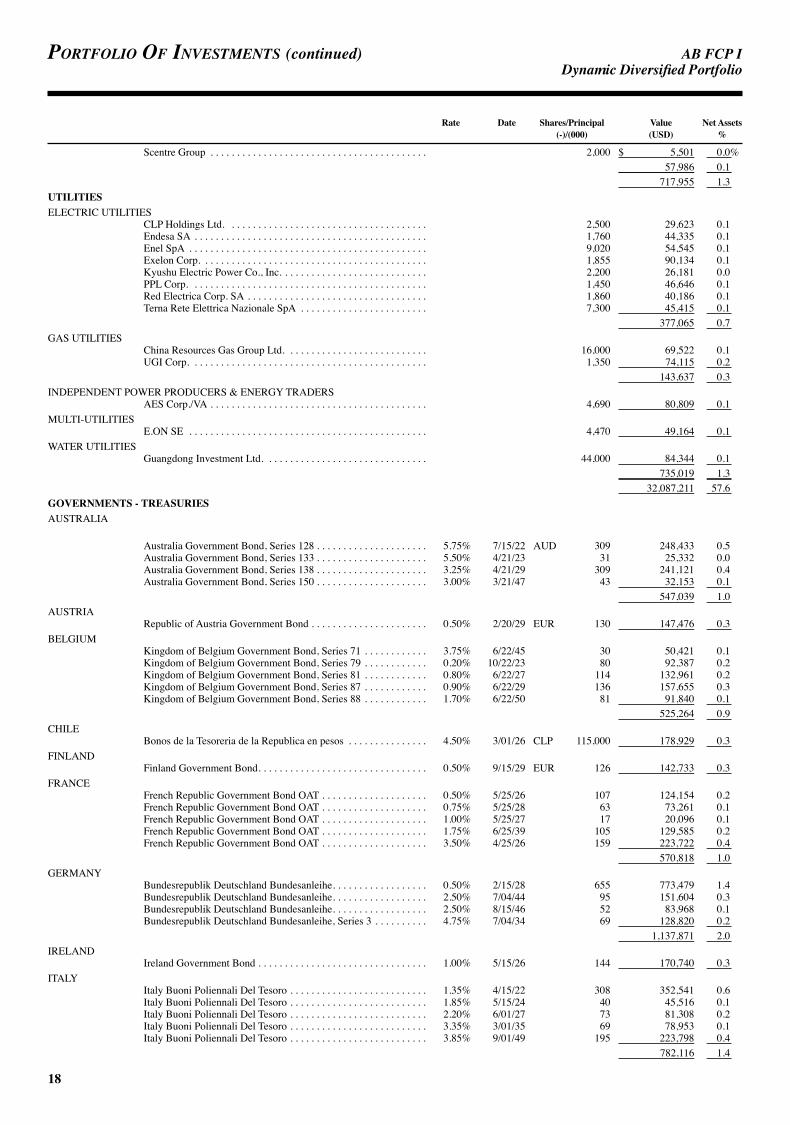
AB FCP I
18
Portfolio of investments (continued) DynamicDiversifiedPortfolio
Rate Date Shares/Principal Value Net Assets (-)/(000) (USD) %
Scentre Group . . . . . . . . . . . . . . . . . . . . . . . . . . . . . . . . . . . . . . . . . 2,000 $ 5,501 0.0% 57,986 0.1 717,955 1.3
UTILITIESELECTRIC UTILITIES
CLP Holdings Ltd. . . . . . . . . . . . . . . . . . . . . . . . . . . . . . . . . . . . . . 2,500 29,623 0.1Endesa SA . . . . . . . . . . . . . . . . . . . . . . . . . . . . . . . . . . . . . . . . . . . . 1,760 44,335 0.1Enel SpA . . . . . . . . . . . . . . . . . . . . . . . . . . . . . . . . . . . . . . . . . . . . . 9,020 54,545 0.1Exelon Corp. . . . . . . . . . . . . . . . . . . . . . . . . . . . . . . . . . . . . . . . . . . 1,855 90,134 0.1Kyushu Electric Power Co., Inc. . . . . . . . . . . . . . . . . . . . . . . . . . . . 2,200 26,181 0.0PPL Corp. . . . . . . . . . . . . . . . . . . . . . . . . . . . . . . . . . . . . . . . . . . . . 1,450 46,646 0.1Red Electrica Corp. SA . . . . . . . . . . . . . . . . . . . . . . . . . . . . . . . . . . 1,860 40,186 0.1Terna Rete Elettrica Nazionale SpA . . . . . . . . . . . . . . . . . . . . . . . . 7,300 45,415 0.1 377,065 0.7
GAS UTILITIESChina Resources Gas Group Ltd. . . . . . . . . . . . . . . . . . . . . . . . . . . 16,000 69,522 0.1UGI Corp. . . . . . . . . . . . . . . . . . . . . . . . . . . . . . . . . . . . . . . . . . . . . 1,350 74,115 0.2 143,637 0.3
INDEPENDENT POWER PRODUCERS & ENERGY TRADERSAES Corp./VA . . . . . . . . . . . . . . . . . . . . . . . . . . . . . . . . . . . . . . . . . 4,690 80,809 0.1
MULTI-UTILITIESE.ON SE . . . . . . . . . . . . . . . . . . . . . . . . . . . . . . . . . . . . . . . . . . . . . 4,470 49,164 0.1
WATER UTILITIESGuangdong Investment Ltd. . . . . . . . . . . . . . . . . . . . . . . . . . . . . . . 44,000 84,344 0.1 735,019 1.3 32,087,211 57.6
GOVERNMENTS - TREASURIESAUSTRALIA
Australia Government Bond, Series 128 . . . . . . . . . . . . . . . . . . . . . 5.75% 7/15/22 AUD 309 248,433 0.5Australia Government Bond, Series 133 . . . . . . . . . . . . . . . . . . . . . 5.50% 4/21/23 31 25,332 0.0Australia Government Bond, Series 138 . . . . . . . . . . . . . . . . . . . . . 3.25% 4/21/29 309 241,121 0.4Australia Government Bond, Series 150 . . . . . . . . . . . . . . . . . . . . . 3.00% 3/21/47 43 32,153 0.1 547,039 1.0
AUSTRIARepublic of Austria Government Bond . . . . . . . . . . . . . . . . . . . . . . 0.50% 2/20/29 EUR 130 147,476 0.3
BELGIUMKingdom of Belgium Government Bond, Series 71 . . . . . . . . . . . . 3.75% 6/22/45 30 50,421 0.1Kingdom of Belgium Government Bond, Series 79 . . . . . . . . . . . . 0.20% 10/22/23 80 92,387 0.2Kingdom of Belgium Government Bond, Series 81 . . . . . . . . . . . . 0.80% 6/22/27 114 132,961 0.2Kingdom of Belgium Government Bond, Series 87 . . . . . . . . . . . . 0.90% 6/22/29 136 157,655 0.3Kingdom of Belgium Government Bond, Series 88 . . . . . . . . . . . . 1.70% 6/22/50 81 91,840 0.1 525,264 0.9
CHILEBonos de la Tesoreria de la Republica en pesos . . . . . . . . . . . . . . . 4.50% 3/01/26 CLP 115,000 178,929 0.3
FINLANDFinland Government Bond. . . . . . . . . . . . . . . . . . . . . . . . . . . . . . . . 0.50% 9/15/29 EUR 126 142,733 0.3
FRANCEFrench Republic Government Bond OAT . . . . . . . . . . . . . . . . . . . . 0.50% 5/25/26 107 124,154 0.2French Republic Government Bond OAT . . . . . . . . . . . . . . . . . . . . 0.75% 5/25/28 63 73,261 0.1French Republic Government Bond OAT . . . . . . . . . . . . . . . . . . . . 1.00% 5/25/27 17 20,096 0.1French Republic Government Bond OAT . . . . . . . . . . . . . . . . . . . . 1.75% 6/25/39 105 129,585 0.2French Republic Government Bond OAT . . . . . . . . . . . . . . . . . . . . 3.50% 4/25/26 159 223,722 0.4 570,818 1.0
GERMANYBundesrepublik Deutschland Bundesanleihe. . . . . . . . . . . . . . . . . . 0.50% 2/15/28 655 773,479 1.4Bundesrepublik Deutschland Bundesanleihe. . . . . . . . . . . . . . . . . . 2.50% 7/04/44 95 151,604 0.3Bundesrepublik Deutschland Bundesanleihe. . . . . . . . . . . . . . . . . . 2.50% 8/15/46 52 83,968 0.1Bundesrepublik Deutschland Bundesanleihe, Series 3 . . . . . . . . . . 4.75% 7/04/34 69 128,820 0.2 1,137,871 2.0
IRELANDIreland Government Bond . . . . . . . . . . . . . . . . . . . . . . . . . . . . . . . . 1.00% 5/15/26 144 170,740 0.3
ITALYItaly Buoni Poliennali Del Tesoro . . . . . . . . . . . . . . . . . . . . . . . . . . 1.35% 4/15/22 308 352,541 0.6Italy Buoni Poliennali Del Tesoro . . . . . . . . . . . . . . . . . . . . . . . . . . 1.85% 5/15/24 40 45,516 0.1Italy Buoni Poliennali Del Tesoro . . . . . . . . . . . . . . . . . . . . . . . . . . 2.20% 6/01/27 73 81,308 0.2Italy Buoni Poliennali Del Tesoro . . . . . . . . . . . . . . . . . . . . . . . . . . 3.35% 3/01/35 69 78,953 0.1Italy Buoni Poliennali Del Tesoro . . . . . . . . . . . . . . . . . . . . . . . . . . 3.85% 9/01/49 195 223,798 0.4 782,116 1.4

AB FCP I
19
DynamicDiversifiedPortfolio
Rate Date Principal Value Net Assets (000) (USD) %
JAPANJapan Government Twenty Year Bond, Series 158 . . . . . . . . . . . . . 0.50% 9/20/36 JPY 14,200 $ 130,834 0.3%Japan Government Twenty Year Bond, Series 159 . . . . . . . . . . . . . 0.60% 12/20/36 13,900 130,255 0.2 261,089 0.5
MALAYSIAMalaysia Government Bond, Series 0114 . . . . . . . . . . . . . . . . . . . . 4.18% 7/15/24 MYR 206 51,421 0.1Malaysia Government Bond, Series 0217 . . . . . . . . . . . . . . . . . . . . 4.06% 9/30/24 207 51,363 0.1Malaysia Government Bond, Series 0218 . . . . . . . . . . . . . . . . . . . . 3.76% 4/20/23 377 92,854 0.2 195,638 0.4
NETHERLANDSNetherlands Government Bond . . . . . . . . . . . . . . . . . . . . . . . . . . . . 0.75% 7/15/27 EUR 230 273,832 0.5
SINGAPORESingapore Government Bond. . . . . . . . . . . . . . . . . . . . . . . . . . . . . . 2.75% 3/01/46 SGD 185 138,666 0.3Singapore Government Bond. . . . . . . . . . . . . . . . . . . . . . . . . . . . . . 3.38% 9/01/33 23 18,804 0.0 157,470 0.3
SPAINSpain Government Bond . . . . . . . . . . . . . . . . . . . . . . . . . . . . . . . . . 1.95% 4/30/26 EUR 99 121,789 0.2Spain Government Bond . . . . . . . . . . . . . . . . . . . . . . . . . . . . . . . . . 2.35% 7/30/33 270 331,272 0.6Spain Government Bond . . . . . . . . . . . . . . . . . . . . . . . . . . . . . . . . . 2.90% 10/31/46 28 35,412 0.1Spain Government Bond . . . . . . . . . . . . . . . . . . . . . . . . . . . . . . . . . 4.40% 10/31/23 50 67,828 0.1 556,301 1.0
UNITED KINGDOMUnited Kingdom Gilt . . . . . . . . . . . . . . . . . . . . . . . . . . . . . . . . . . . . 1.50% 7/22/47 GBP 83 102,212 0.2United Kingdom Gilt . . . . . . . . . . . . . . . . . . . . . . . . . . . . . . . . . . . . 1.63% 10/22/28 275 375,328 0.6United Kingdom Gilt . . . . . . . . . . . . . . . . . . . . . . . . . . . . . . . . . . . . 2.00% 9/07/25 74 104,250 0.2 581,790 1.0
UNITED STATESU.S. Treasury Bonds . . . . . . . . . . . . . . . . . . . . . . . . . . . . . . . . . . . . 2.50% 2/15/46 USD 625 557,324 1.0U.S. Treasury Bonds . . . . . . . . . . . . . . . . . . . . . . . . . . . . . . . . . . . . 4.50% 8/15/39 155 191,788 0.3U.S. Treasury Bonds . . . . . . . . . . . . . . . . . . . . . . . . . . . . . . . . . . . . 5.38% 2/15/31 15 18,977 0.0U.S. Treasury Bonds . . . . . . . . . . . . . . . . . . . . . . . . . . . . . . . . . . . . 6.25% 5/15/30 25 33,399 0.1U.S. Treasury Notes . . . . . . . . . . . . . . . . . . . . . . . . . . . . . . . . . . . . . 1.50% 8/15/26 210 193,922 0.4U.S. Treasury Notes . . . . . . . . . . . . . . . . . . . . . . . . . . . . . . . . . . . . . 1.63% 2/15/26 215 201,428 0.4U.S. Treasury Notes . . . . . . . . . . . . . . . . . . . . . . . . . . . . . . . . . . . . . 1.88% 7/31/22 164 160,669 0.3U.S. Treasury Notes . . . . . . . . . . . . . . . . . . . . . . . . . . . . . . . . . . . . . 2.00% 8/15/25 288 277,309 0.5U.S. Treasury Notes . . . . . . . . . . . . . . . . . . . . . . . . . . . . . . . . . . . . . 2.13% 5/15/25 195 189,759 0.3U.S. Treasury Notes . . . . . . . . . . . . . . . . . . . . . . . . . . . . . . . . . . . . . 2.25% 8/15/27 26 25,454 0.0 1,850,029 3.3
URUGUAYUruguay Government International Bond . . . . . . . . . . . . . . . . . . . . 8.50% 3/15/28 UYU 695 18,732 0.0 8,097,867 14.5
CORPORATES - INVESTMENT GRADEFINANCIAL INSTITUTIONSBANKING
ABN AMRO Bank NV, Series E . . . . . . . . . . . . . . . . . . . . . . . . . . . 7.13% 7/06/22 EUR 100 136,570 0.3Bank of America Corp. . . . . . . . . . . . . . . . . . . . . . . . . . . . . . . . . . . 1.38% 2/07/25 100 116,418 0.2Bank of America Corp. . . . . . . . . . . . . . . . . . . . . . . . . . . . . . . . . . . 3.12% 1/20/23 USD 25 24,891 0.0BNP Paribas SA. . . . . . . . . . . . . . . . . . . . . . . . . . . . . . . . . . . . . . . . 2.38% 2/17/25 EUR 105 124,627 0.2Credit Agricole Corporate & Investment Bank SA(a). . . . . . . . . . . 3.43% 10/03/21 USD 84 83,597 0.2Credit Agricole SA/London . . . . . . . . . . . . . . . . . . . . . . . . . . . . . . . 1.88% 12/20/26 EUR 100 118,248 0.2Danske Bank A/S . . . . . . . . . . . . . . . . . . . . . . . . . . . . . . . . . . . . . . . 1.38% 5/24/22 100 113,869 0.2Goldman Sachs Group, Inc. (The) . . . . . . . . . . . . . . . . . . . . . . . . . . 1.63% 7/27/26 30 34,185 0.1Goldman Sachs Group, Inc. (The) . . . . . . . . . . . . . . . . . . . . . . . . . . 2.00% 3/22/28 42 48,519 0.1Goldman Sachs Group, Inc. (The) . . . . . . . . . . . . . . . . . . . . . . . . . . 3.31% 10/31/25 CAD 80 60,221 0.1HSBC Holdings PLC . . . . . . . . . . . . . . . . . . . . . . . . . . . . . . . . . . . . 1.50% 12/04/24 EUR 100 116,506 0.2Lloyds Bank PLC. . . . . . . . . . . . . . . . . . . . . . . . . . . . . . . . . . . . . . . 6.50% 9/14/20 USD 100 104,156 0.2Mitsubishi UFJ Financial Group, Inc. . . . . . . . . . . . . . . . . . . . . . . . 0.87% 9/07/24 EUR 100 114,242 0.2Morgan Stanley . . . . . . . . . . . . . . . . . . . . . . . . . . . . . . . . . . . . . . . . 3.00% 2/07/24 CAD 100 75,412 0.1Morgan Stanley, Series G. . . . . . . . . . . . . . . . . . . . . . . . . . . . . . . . . 1.38% 10/27/26 EUR 100 113,565 0.2Natwest Markets PLC . . . . . . . . . . . . . . . . . . . . . . . . . . . . . . . . . . . 0.63% 3/02/22 110 123,221 0.2Santander Holdings USA, Inc.. . . . . . . . . . . . . . . . . . . . . . . . . . . . . 4.40% 7/13/27 USD 65 63,478 0.1US Bancorp . . . . . . . . . . . . . . . . . . . . . . . . . . . . . . . . . . . . . . . . . . . 0.85% 6/07/24 EUR 100 114,704 0.2US Bancorp, Series J(b). . . . . . . . . . . . . . . . . . . . . . . . . . . . . . . . . . 5.30% 4/15/27 USD 27 27,063 0.1Wells Fargo & Co. . . . . . . . . . . . . . . . . . . . . . . . . . . . . . . . . . . . . . . 2.13% 6/04/24 EUR 100 121,765 0.2Wells Fargo & Co. . . . . . . . . . . . . . . . . . . . . . . . . . . . . . . . . . . . . . . 4.13% 8/15/23 USD 50 51,436 0.1 1,886,693 3.4
BROKERAGESURA Asset Management SA . . . . . . . . . . . . . . . . . . . . . . . . . . . . . 4.88% 4/17/24 100 102,750 0.2
FINANCESynchrony Financial . . . . . . . . . . . . . . . . . . . . . . . . . . . . . . . . . . . . 4.50% 7/23/25 48 46,951 0.1
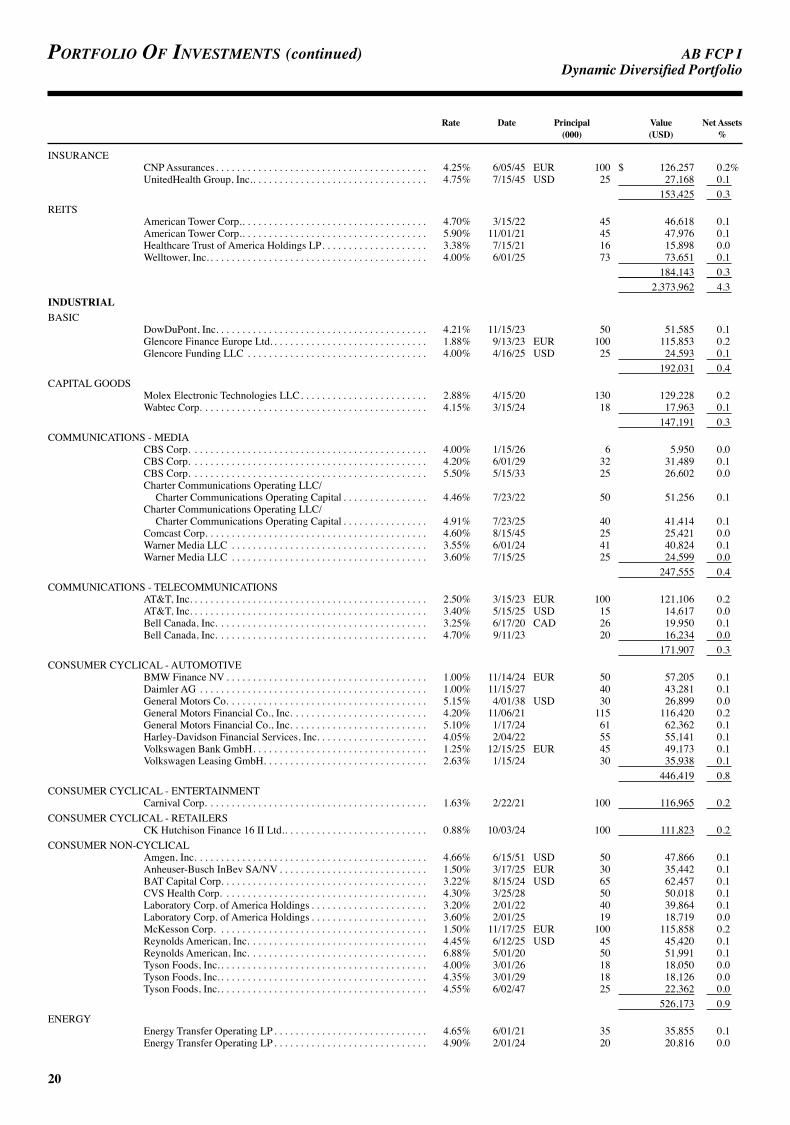
AB FCP I
20
Portfolio of investments (continued) DynamicDiversifiedPortfolio
Rate Date Principal Value Net Assets (000) (USD) %
INSURANCECNP Assurances. . . . . . . . . . . . . . . . . . . . . . . . . . . . . . . . . . . . . . . . 4.25% 6/05/45 EUR 100 $ 126,257 0.2%UnitedHealth Group, Inc.. . . . . . . . . . . . . . . . . . . . . . . . . . . . . . . . . 4.75% 7/15/45 USD 25 27,168 0.1 153,425 0.3
REITSAmerican Tower Corp.. . . . . . . . . . . . . . . . . . . . . . . . . . . . . . . . . . . 4.70% 3/15/22 45 46,618 0.1American Tower Corp.. . . . . . . . . . . . . . . . . . . . . . . . . . . . . . . . . . . 5.90% 11/01/21 45 47,976 0.1Healthcare Trust of America Holdings LP. . . . . . . . . . . . . . . . . . . . 3.38% 7/15/21 16 15,898 0.0Welltower, Inc. . . . . . . . . . . . . . . . . . . . . . . . . . . . . . . . . . . . . . . . . . 4.00% 6/01/25 73 73,651 0.1 184,143 0.3 2,373,962 4.3
INDUSTRIALBASIC
DowDuPont, Inc. . . . . . . . . . . . . . . . . . . . . . . . . . . . . . . . . . . . . . . . 4.21% 11/15/23 50 51,585 0.1Glencore Finance Europe Ltd. . . . . . . . . . . . . . . . . . . . . . . . . . . . . . 1.88% 9/13/23 EUR 100 115,853 0.2Glencore Funding LLC . . . . . . . . . . . . . . . . . . . . . . . . . . . . . . . . . . 4.00% 4/16/25 USD 25 24,593 0.1 192,031 0.4
CAPITAL GOODSMolex Electronic Technologies LLC. . . . . . . . . . . . . . . . . . . . . . . . 2.88% 4/15/20 130 129,228 0.2Wabtec Corp. . . . . . . . . . . . . . . . . . . . . . . . . . . . . . . . . . . . . . . . . . . 4.15% 3/15/24 18 17,963 0.1 147,191 0.3
COMMUNICATIONS - MEDIACBS Corp. . . . . . . . . . . . . . . . . . . . . . . . . . . . . . . . . . . . . . . . . . . . . 4.00% 1/15/26 6 5,950 0.0CBS Corp. . . . . . . . . . . . . . . . . . . . . . . . . . . . . . . . . . . . . . . . . . . . . 4.20% 6/01/29 32 31,489 0.1CBS Corp. . . . . . . . . . . . . . . . . . . . . . . . . . . . . . . . . . . . . . . . . . . . . 5.50% 5/15/33 25 26,602 0.0Charter Communications Operating LLC/
Charter Communications Operating Capital . . . . . . . . . . . . . . . . 4.46% 7/23/22 50 51,256 0.1Charter Communications Operating LLC/
Charter Communications Operating Capital . . . . . . . . . . . . . . . . 4.91% 7/23/25 40 41,414 0.1Comcast Corp. . . . . . . . . . . . . . . . . . . . . . . . . . . . . . . . . . . . . . . . . . 4.60% 8/15/45 25 25,421 0.0Warner Media LLC . . . . . . . . . . . . . . . . . . . . . . . . . . . . . . . . . . . . . 3.55% 6/01/24 41 40,824 0.1Warner Media LLC . . . . . . . . . . . . . . . . . . . . . . . . . . . . . . . . . . . . . 3.60% 7/15/25 25 24,599 0.0 247,555 0.4
COMMUNICATIONS - TELECOMMUNICATIONSAT&T, Inc. . . . . . . . . . . . . . . . . . . . . . . . . . . . . . . . . . . . . . . . . . . . . 2.50% 3/15/23 EUR 100 121,106 0.2AT&T, Inc. . . . . . . . . . . . . . . . . . . . . . . . . . . . . . . . . . . . . . . . . . . . . 3.40% 5/15/25 USD 15 14,617 0.0Bell Canada, Inc. . . . . . . . . . . . . . . . . . . . . . . . . . . . . . . . . . . . . . . . 3.25% 6/17/20 CAD 26 19,950 0.1Bell Canada, Inc. . . . . . . . . . . . . . . . . . . . . . . . . . . . . . . . . . . . . . . . 4.70% 9/11/23 20 16,234 0.0 171,907 0.3
CONSUMER CYCLICAL - AUTOMOTIVEBMW Finance NV . . . . . . . . . . . . . . . . . . . . . . . . . . . . . . . . . . . . . . 1.00% 11/14/24 EUR 50 57,205 0.1Daimler AG . . . . . . . . . . . . . . . . . . . . . . . . . . . . . . . . . . . . . . . . . . . 1.00% 11/15/27 40 43,281 0.1General Motors Co. . . . . . . . . . . . . . . . . . . . . . . . . . . . . . . . . . . . . . 5.15% 4/01/38 USD 30 26,899 0.0General Motors Financial Co., Inc. . . . . . . . . . . . . . . . . . . . . . . . . . 4.20% 11/06/21 115 116,420 0.2General Motors Financial Co., Inc. . . . . . . . . . . . . . . . . . . . . . . . . . 5.10% 1/17/24 61 62,362 0.1Harley-Davidson Financial Services, Inc. . . . . . . . . . . . . . . . . . . . . 4.05% 2/04/22 55 55,141 0.1Volkswagen Bank GmbH. . . . . . . . . . . . . . . . . . . . . . . . . . . . . . . . . 1.25% 12/15/25 EUR 45 49,173 0.1Volkswagen Leasing GmbH. . . . . . . . . . . . . . . . . . . . . . . . . . . . . . . 2.63% 1/15/24 30 35,938 0.1 446,419 0.8
CONSUMER CYCLICAL - ENTERTAINMENTCarnival Corp. . . . . . . . . . . . . . . . . . . . . . . . . . . . . . . . . . . . . . . . . . 1.63% 2/22/21 100 116,965 0.2
CONSUMER CYCLICAL - RETAILERSCK Hutchison Finance 16 II Ltd.. . . . . . . . . . . . . . . . . . . . . . . . . . . 0.88% 10/03/24 100 111,823 0.2
CONSUMER NON-CYCLICALAmgen, Inc. . . . . . . . . . . . . . . . . . . . . . . . . . . . . . . . . . . . . . . . . . . . 4.66% 6/15/51 USD 50 47,866 0.1Anheuser-Busch InBev SA/NV . . . . . . . . . . . . . . . . . . . . . . . . . . . . 1.50% 3/17/25 EUR 30 35,442 0.1BAT Capital Corp. . . . . . . . . . . . . . . . . . . . . . . . . . . . . . . . . . . . . . . 3.22% 8/15/24 USD 65 62,457 0.1CVS Health Corp. . . . . . . . . . . . . . . . . . . . . . . . . . . . . . . . . . . . . . . 4.30% 3/25/28 50 50,018 0.1Laboratory Corp. of America Holdings . . . . . . . . . . . . . . . . . . . . . . 3.20% 2/01/22 40 39,864 0.1Laboratory Corp. of America Holdings . . . . . . . . . . . . . . . . . . . . . . 3.60% 2/01/25 19 18,719 0.0McKesson Corp. . . . . . . . . . . . . . . . . . . . . . . . . . . . . . . . . . . . . . . . 1.50% 11/17/25 EUR 100 115,858 0.2Reynolds American, Inc. . . . . . . . . . . . . . . . . . . . . . . . . . . . . . . . . . 4.45% 6/12/25 USD 45 45,420 0.1Reynolds American, Inc. . . . . . . . . . . . . . . . . . . . . . . . . . . . . . . . . . 6.88% 5/01/20 50 51,991 0.1Tyson Foods, Inc. . . . . . . . . . . . . . . . . . . . . . . . . . . . . . . . . . . . . . . . 4.00% 3/01/26 18 18,050 0.0Tyson Foods, Inc. . . . . . . . . . . . . . . . . . . . . . . . . . . . . . . . . . . . . . . . 4.35% 3/01/29 18 18,126 0.0Tyson Foods, Inc. . . . . . . . . . . . . . . . . . . . . . . . . . . . . . . . . . . . . . . . 4.55% 6/02/47 25 22,362 0.0 526,173 0.9
ENERGYEnergy Transfer Operating LP . . . . . . . . . . . . . . . . . . . . . . . . . . . . . 4.65% 6/01/21 35 35,855 0.1Energy Transfer Operating LP . . . . . . . . . . . . . . . . . . . . . . . . . . . . . 4.90% 2/01/24 20 20,816 0.0

AB FCP I
21
DynamicDiversifiedPortfolio
Rate Date Shares/Principal Value Net Assets (-)/(000) (USD) %
Hess Corp. . . . . . . . . . . . . . . . . . . . . . . . . . . . . . . . . . . . . . . . . . . . . 4.30% 4/01/27 USD 47 $ 45,458 0.1%Kinder Morgan Energy Partners LP. . . . . . . . . . . . . . . . . . . . . . . . . 3.95% 9/01/22 13 13,223 0.0Marathon Petroleum Corp.. . . . . . . . . . . . . . . . . . . . . . . . . . . . . . . . 4.75% 9/15/44 25 23,937 0.0Occidental Petroleum Corp.. . . . . . . . . . . . . . . . . . . . . . . . . . . . . . . 4.20% 3/15/48 25 25,077 0.1Plains All American Pipeline LP/PAA Finance Corp. . . . . . . . . . . . 3.60% 11/01/24 49 47,783 0.1Williams Cos., Inc. (The). . . . . . . . . . . . . . . . . . . . . . . . . . . . . . . . . 3.90% 1/15/25 21 21,109 0.0Williams Cos., Inc. (The). . . . . . . . . . . . . . . . . . . . . . . . . . . . . . . . . 4.00% 11/15/21 19 19,353 0.0Williams Cos., Inc. (The). . . . . . . . . . . . . . . . . . . . . . . . . . . . . . . . . 4.50% 11/15/23 35 36,158 0.1 288,769 0.5
SERVICESEquifax, Inc.. . . . . . . . . . . . . . . . . . . . . . . . . . . . . . . . . . . . . . . . . . . 3.30% 12/15/22 90 88,866 0.2S&P Global, Inc. . . . . . . . . . . . . . . . . . . . . . . . . . . . . . . . . . . . . . . . 4.40% 2/15/26 20 20,946 0.0 109,812 0.2
TECHNOLOGYApple, Inc. . . . . . . . . . . . . . . . . . . . . . . . . . . . . . . . . . . . . . . . . . . . . 2.51% 8/19/24 CAD 65 48,885 0.1Apple, Inc. . . . . . . . . . . . . . . . . . . . . . . . . . . . . . . . . . . . . . . . . . . . . 4.65% 2/23/46 USD 25 26,897 0.1Broadcom Corp./Broadcom Cayman Finance Ltd. . . . . . . . . . . . . . 3.63% 1/15/24 11 10,684 0.0Broadcom Corp./Broadcom Cayman Finance Ltd. . . . . . . . . . . . . . 3.88% 1/15/27 27 25,014 0.0KLA-Tencor Corp. . . . . . . . . . . . . . . . . . . . . . . . . . . . . . . . . . . . . . . 4.65% 11/01/24 50 52,346 0.1Seagate HDD Cayman . . . . . . . . . . . . . . . . . . . . . . . . . . . . . . . . . . . 4.75% 1/01/25 34 32,737 0.1 196,563 0.4
TRANSPORTATION - SERVICESPacific National Finance Pty Ltd. . . . . . . . . . . . . . . . . . . . . . . . . . . 4.63% 9/23/20 21 21,255 0.0 2,576,463 4.6
UTILITYELECTRIC
Exelon Corp. . . . . . . . . . . . . . . . . . . . . . . . . . . . . . . . . . . . . . . . . . . 5.15% 12/01/20 12 12,316 0.0Iberdrola Finanzas SA . . . . . . . . . . . . . . . . . . . . . . . . . . . . . . . . . . . 7.38% 1/29/24 GBP 50 82,193 0.1Orsted A/S(b) . . . . . . . . . . . . . . . . . . . . . . . . . . . . . . . . . . . . . . . . . . 6.25% 6/26/13 EUR 30 39,336 0.1 133,845 0.2
OTHER UTILITYYorkshire Water Finance PLC . . . . . . . . . . . . . . . . . . . . . . . . . . . . . 6.59% 2/21/23 GBP 50 78,280 0.2 212,125 0.4 5,162,550 9.3
MORTGAGE PASS-THROUGHSAGENCY FIXED RATE 30-YEAR
Federal Home Loan Mortgage Corp. Gold, Series 2018 . . . . . . . . . 4.00% 12/01/48 USD 120 122,722 0.2Federal Home Loan Mortgage Corp. Gold, Series 2018 . . . . . . . . . 4.50% 11/01/48 116 121,438 0.2Federal Home Loan Mortgage Corp. Gold, Series 2019 . . . . . . . . . 4.50% 2/01/49 80 83,989 0.2Federal National Mortgage Association, Series 2018 . . . . . . . . . . . 4.00% 8/01/48 65 67,066 0.1Federal National Mortgage Association, Series 2018 . . . . . . . . . . . 4.00% 9/01/48 261 267,634 0.5Federal National Mortgage Association, Series 2018 . . . . . . . . . . . 4.50% 9/01/48 367 384,132 0.7Federal National Mortgage Association, Series 2019, TBA . . . . . . 3.50% 3/01/49 408 408,205 0.7Federal National Mortgage Association, Series 2019, TBA . . . . . . 4.00% 3/01/49 37 37,723 0.1Federal National Mortgage Association, Series 2019, TBA . . . . . . 4.50% 3/01/49 545 563,990 1.0Federal National Mortgage Association, Series 2019, TBA . . . . . . 5.00% 3/01/49 555 581,970 1.0 2,638,869 4.7
INFLATION-LINKED SECURITIESJAPAN
Japanese Government CPI Linked Bond, Series 21 . . . . . . . . . . . . 0.10% 3/10/26 JPY 66,863 620,328 1.1Japanese Government CPI Linked Bond, Series 23 . . . . . . . . . . . . 0.10% 3/10/28 64,848 602,245 1.1 1,222,573 2.2
NEW ZEALANDNew Zealand Government Inflation Linked Bond,
Series 925 . . . . . . . . . . . . . . . . . . . . . . . . . . . . . . . . . . . . . . . . . . 2.00% 9/20/25 NZD 82 64,132 0.1UNITED STATES
U.S. Treasury Inflation Index. . . . . . . . . . . . . . . . . . . . . . . . . . . . . . 0.13% 4/15/21 USD 179 176,742 0.3U.S. Treasury Inflation Index. . . . . . . . . . . . . . . . . . . . . . . . . . . . . . 0.13% 7/15/22 262 259,183 0.5U.S. Treasury Inflation Index. . . . . . . . . . . . . . . . . . . . . . . . . . . . . . 0.13% 7/15/26 192 185,085 0.3 621,010 1.1 1,907,715 3.4
INVESTMENT COMPANIESFUNDS AND INVESTMENT TRUSTS
AB SICAV I - Low Volatility Equity Portfolio . . . . . . . . . . . . . . . . 38,003 1,122,997 2.0GOVERNMENTS - SOVEREIGN AGENCIESCANADA
Canada Housing Trust No. 1 . . . . . . . . . . . . . . . . . . . . . . . . . . . . . . 1.25% 6/15/21 CAD 620 464,174 0.8
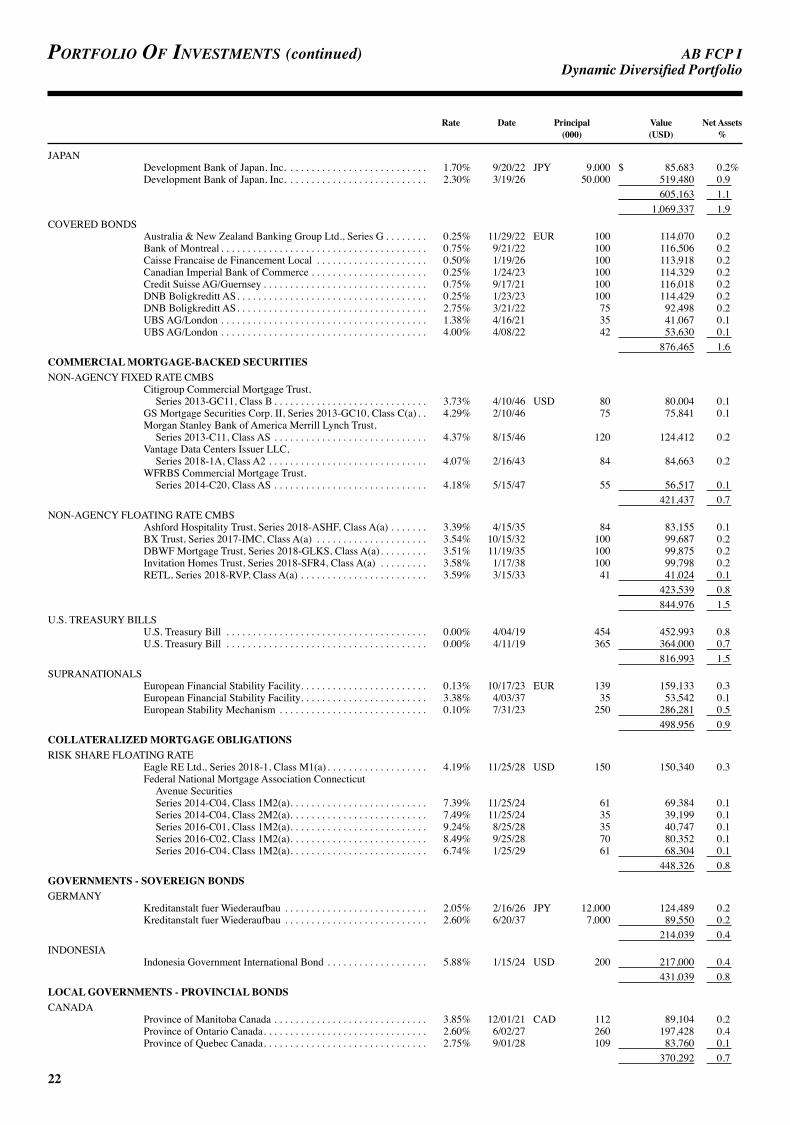
AB FCP I
22
Portfolio of investments (continued) DynamicDiversifiedPortfolio
Rate Date Principal Value Net Assets (000) (USD) %
JAPANDevelopment Bank of Japan, Inc. . . . . . . . . . . . . . . . . . . . . . . . . . . 1.70% 9/20/22 JPY 9,000 $ 85,683 0.2%Development Bank of Japan, Inc. . . . . . . . . . . . . . . . . . . . . . . . . . . 2.30% 3/19/26 50,000 519,480 0.9 605,163 1.1 1,069,337 1.9
COVERED BONDSAustralia & New Zealand Banking Group Ltd., Series G . . . . . . . . 0.25% 11/29/22 EUR 100 114,070 0.2Bank of Montreal . . . . . . . . . . . . . . . . . . . . . . . . . . . . . . . . . . . . . . . 0.75% 9/21/22 100 116,506 0.2Caisse Francaise de Financement Local . . . . . . . . . . . . . . . . . . . . . 0.50% 1/19/26 100 113,918 0.2Canadian Imperial Bank of Commerce . . . . . . . . . . . . . . . . . . . . . . 0.25% 1/24/23 100 114,329 0.2Credit Suisse AG/Guernsey . . . . . . . . . . . . . . . . . . . . . . . . . . . . . . . 0.75% 9/17/21 100 116,018 0.2DNB Boligkreditt AS. . . . . . . . . . . . . . . . . . . . . . . . . . . . . . . . . . . . 0.25% 1/23/23 100 114,429 0.2DNB Boligkreditt AS. . . . . . . . . . . . . . . . . . . . . . . . . . . . . . . . . . . . 2.75% 3/21/22 75 92,498 0.2UBS AG/London . . . . . . . . . . . . . . . . . . . . . . . . . . . . . . . . . . . . . . . 1.38% 4/16/21 35 41,067 0.1UBS AG/London . . . . . . . . . . . . . . . . . . . . . . . . . . . . . . . . . . . . . . . 4.00% 4/08/22 42 53,630 0.1 876,465 1.6
COMMERCIAL MORTGAGE-BACKED SECURITIESNON-AGENCY FIXED RATE CMBS
Citigroup Commercial Mortgage Trust, Series 2013-GC11, Class B . . . . . . . . . . . . . . . . . . . . . . . . . . . . . 3.73% 4/10/46 USD 80 80,004 0.1
GS Mortgage Securities Corp. II, Series 2013-GC10, Class C(a) . . 4.29% 2/10/46 75 75,841 0.1Morgan Stanley Bank of America Merrill Lynch Trust,
Series 2013-C11, Class AS . . . . . . . . . . . . . . . . . . . . . . . . . . . . . 4.37% 8/15/46 120 124,412 0.2Vantage Data Centers Issuer LLC,
Series 2018-1A, Class A2 . . . . . . . . . . . . . . . . . . . . . . . . . . . . . . 4.07% 2/16/43 84 84,663 0.2WFRBS Commercial Mortgage Trust,
Series 2014-C20, Class AS . . . . . . . . . . . . . . . . . . . . . . . . . . . . . 4.18% 5/15/47 55 56,517 0.1 421,437 0.7
NON-AGENCY FLOATING RATE CMBSAshford Hospitality Trust, Series 2018-ASHF, Class A(a) . . . . . . . 3.39% 4/15/35 84 83,155 0.1BX Trust, Series 2017-IMC, Class A(a) . . . . . . . . . . . . . . . . . . . . . 3.54% 10/15/32 100 99,687 0.2DBWF Mortgage Trust, Series 2018-GLKS, Class A(a). . . . . . . . . 3.51% 11/19/35 100 99,875 0.2Invitation Homes Trust, Series 2018-SFR4, Class A(a) . . . . . . . . . 3.58% 1/17/38 100 99,798 0.2RETL, Series 2018-RVP, Class A(a) . . . . . . . . . . . . . . . . . . . . . . . . 3.59% 3/15/33 41 41,024 0.1 423,539 0.8 844,976 1.5
U.S. TREASURY BILLSU.S. Treasury Bill . . . . . . . . . . . . . . . . . . . . . . . . . . . . . . . . . . . . . . 0.00% 4/04/19 454 452,993 0.8U.S. Treasury Bill . . . . . . . . . . . . . . . . . . . . . . . . . . . . . . . . . . . . . . 0.00% 4/11/19 365 364,000 0.7 816,993 1.5
SUPRANATIONALSEuropean Financial Stability Facility. . . . . . . . . . . . . . . . . . . . . . . . 0.13% 10/17/23 EUR 139 159,133 0.3European Financial Stability Facility. . . . . . . . . . . . . . . . . . . . . . . . 3.38% 4/03/37 35 53,542 0.1European Stability Mechanism . . . . . . . . . . . . . . . . . . . . . . . . . . . . 0.10% 7/31/23 250 286,281 0.5 498,956 0.9
COLLATERALIZED MORTGAGE OBLIGATIONSRISK SHARE FLOATING RATE
Eagle RE Ltd., Series 2018-1, Class M1(a) . . . . . . . . . . . . . . . . . . . 4.19% 11/25/28 USD 150 150,340 0.3Federal National Mortgage Association Connecticut
Avenue SecuritiesSeries 2014-C04, Class 1M2(a). . . . . . . . . . . . . . . . . . . . . . . . . . 7.39% 11/25/24 61 69,384 0.1Series 2014-C04, Class 2M2(a). . . . . . . . . . . . . . . . . . . . . . . . . . 7.49% 11/25/24 35 39,199 0.1Series 2016-C01, Class 1M2(a). . . . . . . . . . . . . . . . . . . . . . . . . . 9.24% 8/25/28 35 40,747 0.1Series 2016-C02, Class 1M2(a). . . . . . . . . . . . . . . . . . . . . . . . . . 8.49% 9/25/28 70 80,352 0.1Series 2016-C04, Class 1M2(a). . . . . . . . . . . . . . . . . . . . . . . . . . 6.74% 1/25/29 61 68,304 0.1
448,326 0.8GOVERNMENTS - SOVEREIGN BONDSGERMANY
Kreditanstalt fuer Wiederaufbau . . . . . . . . . . . . . . . . . . . . . . . . . . . 2.05% 2/16/26 JPY 12,000 124,489 0.2Kreditanstalt fuer Wiederaufbau . . . . . . . . . . . . . . . . . . . . . . . . . . . 2.60% 6/20/37 7,000 89,550 0.2 214,039 0.4
INDONESIAIndonesia Government International Bond . . . . . . . . . . . . . . . . . . . 5.88% 1/15/24 USD 200 217,000 0.4 431,039 0.8
LOCAL GOVERNMENTS - PROVINCIAL BONDSCANADA
Province of Manitoba Canada . . . . . . . . . . . . . . . . . . . . . . . . . . . . . 3.85% 12/01/21 CAD 112 89,104 0.2Province of Ontario Canada. . . . . . . . . . . . . . . . . . . . . . . . . . . . . . . 2.60% 6/02/27 260 197,428 0.4Province of Quebec Canada. . . . . . . . . . . . . . . . . . . . . . . . . . . . . . . 2.75% 9/01/28 109 83,760 0.1 370,292 0.7

AB FCP I
23
DynamicDiversifiedPortfolio
Rate Date Principal Value Net Assets (000) (USD) %
CORPORATES - NON-INVESTMENT GRADEFINANCIAL INSTITUTIONSBANKING
Barclays PLC . . . . . . . . . . . . . . . . . . . . . . . . . . . . . . . . . . . . . . . . . . 2.00% 2/07/28 EUR 105 $ 113,825 0.2%INDUSTRIALENERGY
EnLink Midstream Partners LP . . . . . . . . . . . . . . . . . . . . . . . . . . . . 4.15% 6/01/25 USD 60 57,430 0.1 171,255 0.3
ASSET-BACKED SECURITIESAUTOS - FIXED RATE
DT Auto Owner Trust, Series 2018-1A, Class A . . . . . . . . . . . . . . . 2.59% 5/17/21 4 4,013 0.0Flagship Credit Auto Trust, Series 2018-3, Class D . . . . . . . . . . . . 4.15% 12/16/24 39 39,483 0.1 43,496 0.1
OTHER ABS - FIXED RATECLUB Credit Trust, Series 2018-P3, Class B . . . . . . . . . . . . . . . . . 4.32% 1/15/26 100 100,713 0.2 144,209 0.3
QUASI-SOVEREIGNSQUASI-SOVEREIGN BONDSCHINA
State Grid Overseas Investment 2016 Ltd. . . . . . . . . . . . . . . . . . . . 1.25% 5/19/22 EUR 100 115,279 0.2AGENCIESAGENCY DEBENTURES
Federal Home Loan Mortgage Corp. . . . . . . . . . . . . . . . . . . . . . . . . 6.25% 7/15/32 USD 83 110,346 0.2 56,914,682 102.2
OTHER TRANSFERABLE SECURITIESCORPORATES - INVESTMENT GRADEINDUSTRIALCOMMUNICATIONS - TELECOMMUNICATIONS
Rogers Communications, Inc. . . . . . . . . . . . . . . . . . . . . . . . . . . . . . 4.00% 6/06/22 25 19,750 0.0CONSUMER CYCLICAL - AUTOMOTIVE
Nissan Motor Acceptance Corp. . . . . . . . . . . . . . . . . . . . . . . . . . . . 2.35% 3/04/19 55 55,000 0.1ENERGY
Marathon Petroleum Corp.. . . . . . . . . . . . . . . . . . . . . . . . . . . . . . . . 4.75% 12/15/23 60 62,317 0.1TRANSPORTATION - AIRLINES
Southwest Airlines Co. Pass-Through Trust, Series 07-1 . . . . . . . . 6.15% 8/01/22 37 38,878 0.1TRANSPORTATION - SERVICES
Penske Truck Leasing Co. Lp/PTL Finance Corp. . . . . . . . . . . . . . 3.38% 2/01/22 60 59,270 0.1 235,215 0.4
FINANCIAL INSTITUTIONSBANKING
Fifth Third Bancorp . . . . . . . . . . . . . . . . . . . . . . . . . . . . . . . . . . . . . 2.30% 3/01/19 24 24,000 0.1UTILITYELECTRIC
Monongahela Power Co. . . . . . . . . . . . . . . . . . . . . . . . . . . . . . . . . . 4.10% 4/15/24 23 23,710 0.0 282,925 0.5
Total Investments(cost $53,326,831) . . . . . . . . . . . . . . . . . . . . . . . . . . . . . . . . . . . . . . $ 57,197,607 102.7%
Time DepositsANZ, London(c) . . . . . . . . . . . . . . . . . . . . . . . . . . . . . . . . . . . . . . . 1.76 % – 42,585 0.1BBH, Grand Cayman(c). . . . . . . . . . . . . . . . . . . . . . . . . . . . . . . . . . (1.40)% – 3,392 0.0BBH, Grand Cayman(c). . . . . . . . . . . . . . . . . . . . . . . . . . . . . . . . . . (0.85)% – 3,757 0.0BBH, Grand Cayman(c). . . . . . . . . . . . . . . . . . . . . . . . . . . . . . . . . . (0.57)% – 703 0.0BBH, Grand Cayman(c). . . . . . . . . . . . . . . . . . . . . . . . . . . . . . . . . . (0.49)% – 865 0.0BBH, Grand Cayman(c). . . . . . . . . . . . . . . . . . . . . . . . . . . . . . . . . . (0.26)% – 18,662 0.0BBH, Grand Cayman(c). . . . . . . . . . . . . . . . . . . . . . . . . . . . . . . . . . 0.16 % – 3,196 0.0BBH, Grand Cayman(c). . . . . . . . . . . . . . . . . . . . . . . . . . . . . . . . . . 0.35 % – 904 0.0BBH, Grand Cayman(c). . . . . . . . . . . . . . . . . . . . . . . . . . . . . . . . . . 0.36 % – 15,174 0.0BBH, Grand Cayman(c). . . . . . . . . . . . . . . . . . . . . . . . . . . . . . . . . . 0.67 % – 3,509 0.0BBH, Grand Cayman(c). . . . . . . . . . . . . . . . . . . . . . . . . . . . . . . . . . 0.76 % – 3,306 0.0BBH, Grand Cayman(c). . . . . . . . . . . . . . . . . . . . . . . . . . . . . . . . . . 0.82 % – 4,455 0.0BBH, Grand Cayman(c). . . . . . . . . . . . . . . . . . . . . . . . . . . . . . . . . . 1.40 % – 931 0.0BBH, Grand Cayman(c). . . . . . . . . . . . . . . . . . . . . . . . . . . . . . . . . . 1.76 % – 3,900 0.0BBH, Grand Cayman(c). . . . . . . . . . . . . . . . . . . . . . . . . . . . . . . . . . 5.12 % – 1,255 0.0JPMorgan Chase, New York(c) . . . . . . . . . . . . . . . . . . . . . . . . . . . . 1.76 % – 28,469 0.1Sumitomo, Tokyo(c) . . . . . . . . . . . . . . . . . . . . . . . . . . . . . . . . . . . . (0.57)% – 139,075 0.3
Total Time Deposits . . . . . . . . . . . . . . . . . . . . . . . . . . . . . . . . . . . . . . . . . . . . . . . . . . . . . . 274,138 0.5Other assets less liabilities . . . . . . . . . . . . . . . . . . . . . . . . . . . . . . . . . . . . . . . . . . . . . . . . . (1,768,251) (3.2)Net Assets . . . . . . . . . . . . . . . . . . . . . . . . . . . . . . . . . . . . . . . . . . . . . . . . . . . . . . . . . . . . . . $ 55,703,494 100.0%
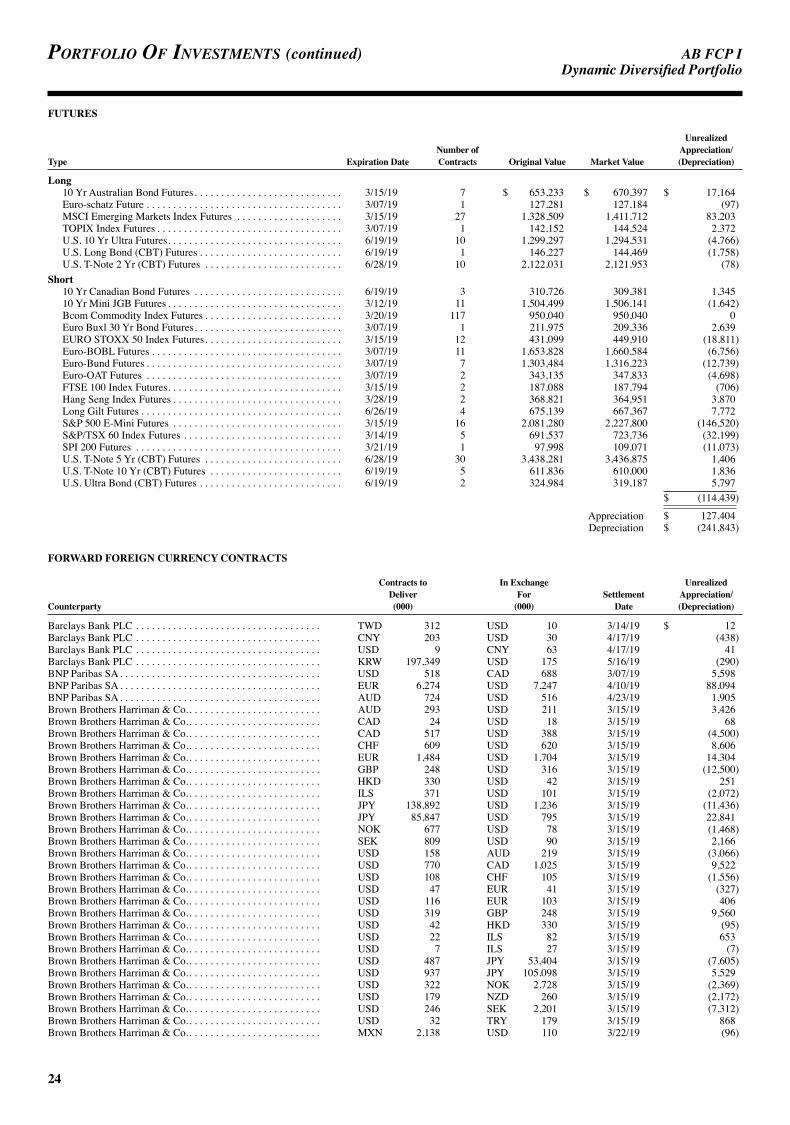
AB FCP I
24
Portfolio of investments (continued) DynamicDiversifiedPortfolio
FUTURES
Unrealized Number of Appreciation/ Type Expiration Date Contracts Original Value Market Value (Depreciation)
Long10 Yr Australian Bond Futures. . . . . . . . . . . . . . . . . . . . . . . . . . . . 3/15/19 7 $ 653,233 $ 670,397 $ 17,164Euro-schatz Future . . . . . . . . . . . . . . . . . . . . . . . . . . . . . . . . . . . . . 3/07/19 1 127,281 127,184 (97)MSCI Emerging Markets Index Futures . . . . . . . . . . . . . . . . . . . . 3/15/19 27 1,328,509 1,411,712 83,203TOPIX Index Futures . . . . . . . . . . . . . . . . . . . . . . . . . . . . . . . . . . . 3/07/19 1 142,152 144,524 2,372U.S. 10 Yr Ultra Futures. . . . . . . . . . . . . . . . . . . . . . . . . . . . . . . . . 6/19/19 10 1,299,297 1,294,531 (4,766)U.S. Long Bond (CBT) Futures . . . . . . . . . . . . . . . . . . . . . . . . . . . 6/19/19 1 146,227 144,469 (1,758)U.S. T-Note 2 Yr (CBT) Futures . . . . . . . . . . . . . . . . . . . . . . . . . . 6/28/19 10 2,122,031 2,121,953 (78)
Short10 Yr Canadian Bond Futures . . . . . . . . . . . . . . . . . . . . . . . . . . . . 6/19/19 3 310,726 309,381 1,34510 Yr Mini JGB Futures . . . . . . . . . . . . . . . . . . . . . . . . . . . . . . . . . 3/12/19 11 1,504,499 1,506,141 (1,642)Bcom Commodity Index Futures . . . . . . . . . . . . . . . . . . . . . . . . . . 3/20/19 117 950,040 950,040 0Euro Buxl 30 Yr Bond Futures. . . . . . . . . . . . . . . . . . . . . . . . . . . . 3/07/19 1 211,975 209,336 2,639EURO STOXX 50 Index Futures. . . . . . . . . . . . . . . . . . . . . . . . . . 3/15/19 12 431,099 449,910 (18,811)Euro-BOBL Futures . . . . . . . . . . . . . . . . . . . . . . . . . . . . . . . . . . . . 3/07/19 11 1,653,828 1,660,584 (6,756)Euro-Bund Futures . . . . . . . . . . . . . . . . . . . . . . . . . . . . . . . . . . . . . 3/07/19 7 1,303,484 1,316,223 (12,739)Euro-OAT Futures . . . . . . . . . . . . . . . . . . . . . . . . . . . . . . . . . . . . . 3/07/19 2 343,135 347,833 (4,698)FTSE 100 Index Futures. . . . . . . . . . . . . . . . . . . . . . . . . . . . . . . . . 3/15/19 2 187,088 187,794 (706)Hang Seng Index Futures . . . . . . . . . . . . . . . . . . . . . . . . . . . . . . . . 3/28/19 2 368,821 364,951 3,870Long Gilt Futures . . . . . . . . . . . . . . . . . . . . . . . . . . . . . . . . . . . . . . 6/26/19 4 675,139 667,367 7,772S&P 500 E-Mini Futures . . . . . . . . . . . . . . . . . . . . . . . . . . . . . . . . 3/15/19 16 2,081,280 2,227,800 (146,520)S&P/TSX 60 Index Futures . . . . . . . . . . . . . . . . . . . . . . . . . . . . . . 3/14/19 5 691,537 723,736 (32,199)SPI 200 Futures . . . . . . . . . . . . . . . . . . . . . . . . . . . . . . . . . . . . . . . 3/21/19 1 97,998 109,071 (11,073)U.S. T-Note 5 Yr (CBT) Futures . . . . . . . . . . . . . . . . . . . . . . . . . . 6/28/19 30 3,438,281 3,436,875 1,406U.S. T-Note 10 Yr (CBT) Futures . . . . . . . . . . . . . . . . . . . . . . . . . 6/19/19 5 611,836 610,000 1,836U.S. Ultra Bond (CBT) Futures . . . . . . . . . . . . . . . . . . . . . . . . . . . 6/19/19 2 324,984 319,187 5,797 $ (114,439)
Appreciation $ 127,404 Depreciation $ (241,843)
FORWARD FOREIGN CURRENCY CONTRACTS
Contracts to In Exchange Unrealized Deliver For Settlement Appreciation/ Counterparty (000) (000) Date (Depreciation)
Barclays Bank PLC . . . . . . . . . . . . . . . . . . . . . . . . . . . . . . . . . . . TWD 312 USD 10 3/14/19 $ 12Barclays Bank PLC . . . . . . . . . . . . . . . . . . . . . . . . . . . . . . . . . . . CNY 203 USD 30 4/17/19 (438)Barclays Bank PLC . . . . . . . . . . . . . . . . . . . . . . . . . . . . . . . . . . . USD 9 CNY 63 4/17/19 41Barclays Bank PLC . . . . . . . . . . . . . . . . . . . . . . . . . . . . . . . . . . . KRW 197,349 USD 175 5/16/19 (290)BNP Paribas SA. . . . . . . . . . . . . . . . . . . . . . . . . . . . . . . . . . . . . . USD 518 CAD 688 3/07/19 5,598BNP Paribas SA. . . . . . . . . . . . . . . . . . . . . . . . . . . . . . . . . . . . . . EUR 6,274 USD 7,247 4/10/19 88,094BNP Paribas SA. . . . . . . . . . . . . . . . . . . . . . . . . . . . . . . . . . . . . . AUD 724 USD 516 4/23/19 1,905Brown Brothers Harriman & Co.. . . . . . . . . . . . . . . . . . . . . . . . . AUD 293 USD 211 3/15/19 3,426Brown Brothers Harriman & Co.. . . . . . . . . . . . . . . . . . . . . . . . . CAD 24 USD 18 3/15/19 68Brown Brothers Harriman & Co.. . . . . . . . . . . . . . . . . . . . . . . . . CAD 517 USD 388 3/15/19 (4,500)Brown Brothers Harriman & Co.. . . . . . . . . . . . . . . . . . . . . . . . . CHF 609 USD 620 3/15/19 8,606Brown Brothers Harriman & Co.. . . . . . . . . . . . . . . . . . . . . . . . . EUR 1,484 USD 1,704 3/15/19 14,304Brown Brothers Harriman & Co.. . . . . . . . . . . . . . . . . . . . . . . . . GBP 248 USD 316 3/15/19 (12,500)Brown Brothers Harriman & Co.. . . . . . . . . . . . . . . . . . . . . . . . . HKD 330 USD 42 3/15/19 251Brown Brothers Harriman & Co.. . . . . . . . . . . . . . . . . . . . . . . . . ILS 371 USD 101 3/15/19 (2,072)Brown Brothers Harriman & Co.. . . . . . . . . . . . . . . . . . . . . . . . . JPY 138,892 USD 1,236 3/15/19 (11,436)Brown Brothers Harriman & Co.. . . . . . . . . . . . . . . . . . . . . . . . . JPY 85,847 USD 795 3/15/19 22,841Brown Brothers Harriman & Co.. . . . . . . . . . . . . . . . . . . . . . . . . NOK 677 USD 78 3/15/19 (1,468)Brown Brothers Harriman & Co.. . . . . . . . . . . . . . . . . . . . . . . . . SEK 809 USD 90 3/15/19 2,166Brown Brothers Harriman & Co.. . . . . . . . . . . . . . . . . . . . . . . . . USD 158 AUD 219 3/15/19 (3,066)Brown Brothers Harriman & Co.. . . . . . . . . . . . . . . . . . . . . . . . . USD 770 CAD 1,025 3/15/19 9,522Brown Brothers Harriman & Co.. . . . . . . . . . . . . . . . . . . . . . . . . USD 108 CHF 105 3/15/19 (1,556)Brown Brothers Harriman & Co.. . . . . . . . . . . . . . . . . . . . . . . . . USD 47 EUR 41 3/15/19 (327)Brown Brothers Harriman & Co.. . . . . . . . . . . . . . . . . . . . . . . . . USD 116 EUR 103 3/15/19 406Brown Brothers Harriman & Co.. . . . . . . . . . . . . . . . . . . . . . . . . USD 319 GBP 248 3/15/19 9,560Brown Brothers Harriman & Co.. . . . . . . . . . . . . . . . . . . . . . . . . USD 42 HKD 330 3/15/19 (95)Brown Brothers Harriman & Co.. . . . . . . . . . . . . . . . . . . . . . . . . USD 22 ILS 82 3/15/19 653Brown Brothers Harriman & Co.. . . . . . . . . . . . . . . . . . . . . . . . . USD 7 ILS 27 3/15/19 (7)Brown Brothers Harriman & Co.. . . . . . . . . . . . . . . . . . . . . . . . . USD 487 JPY 53,404 3/15/19 (7,605)Brown Brothers Harriman & Co.. . . . . . . . . . . . . . . . . . . . . . . . . USD 937 JPY 105,098 3/15/19 5,529Brown Brothers Harriman & Co.. . . . . . . . . . . . . . . . . . . . . . . . . USD 322 NOK 2,728 3/15/19 (2,369)Brown Brothers Harriman & Co.. . . . . . . . . . . . . . . . . . . . . . . . . USD 179 NZD 260 3/15/19 (2,172)Brown Brothers Harriman & Co.. . . . . . . . . . . . . . . . . . . . . . . . . USD 246 SEK 2,201 3/15/19 (7,312)Brown Brothers Harriman & Co.. . . . . . . . . . . . . . . . . . . . . . . . . USD 32 TRY 179 3/15/19 868Brown Brothers Harriman & Co.. . . . . . . . . . . . . . . . . . . . . . . . . MXN 2,138 USD 110 3/22/19 (96)

AB FCP I
25
DynamicDiversifiedPortfolio
Contracts to In Exchange Unrealized Deliver For Settlement Appreciation/ Counterparty (000) (000) Date (Depreciation)
Brown Brothers Harriman & Co.. . . . . . . . . . . . . . . . . . . . . . . . . USD 112 MXN 2,147 3/22/19 (586)Brown Brothers Harriman & Co.. . . . . . . . . . . . . . . . . . . . . . . . . EUR 437 USD 501 4/10/19 2,601Brown Brothers Harriman & Co.. . . . . . . . . . . . . . . . . . . . . . . . . EUR 781 USD 890 4/10/19 (1,199)Brown Brothers Harriman & Co.. . . . . . . . . . . . . . . . . . . . . . . . . USD 160 EUR 140 4/10/19 (592)Brown Brothers Harriman & Co.. . . . . . . . . . . . . . . . . . . . . . . . . JPY 29,126 USD 264 4/11/19 1,758Brown Brothers Harriman & Co.. . . . . . . . . . . . . . . . . . . . . . . . . USD 233 NOK 1,977 4/12/19 (1,252)Brown Brothers Harriman & Co.. . . . . . . . . . . . . . . . . . . . . . . . . USD 242 SEK 2,159 4/12/19 (7,157)Brown Brothers Harriman & Co.. . . . . . . . . . . . . . . . . . . . . . . . . SGD 175 USD 129 4/17/19 (600)Brown Brothers Harriman & Co.. . . . . . . . . . . . . . . . . . . . . . . . . NZD 74 USD 51 4/26/19 318Brown Brothers Harriman & Co.. . . . . . . . . . . . . . . . . . . . . . . . . EUR 199 USD 229 6/17/19 272Brown Brothers Harriman & Co.. . . . . . . . . . . . . . . . . . . . . . . . . EUR 19 USD 22 6/17/19 (13)Brown Brothers Harriman & Co.. . . . . . . . . . . . . . . . . . . . . . . . . GBP 269 USD 353 6/17/19 (5,835)Brown Brothers Harriman & Co.. . . . . . . . . . . . . . . . . . . . . . . . . USD 94 AUD 130 6/17/19 (1,673)Brown Brothers Harriman & Co.. . . . . . . . . . . . . . . . . . . . . . . . . USD 50 GBP 38 6/17/19 771Brown Brothers Harriman & Co.. . . . . . . . . . . . . . . . . . . . . . . . . USD 60 HKD 473 6/17/19 (53)Brown Brothers Harriman & Co.. . . . . . . . . . . . . . . . . . . . . . . . . USD 125 NZD 181 6/17/19 (1,312)Brown Brothers Harriman & Co.+. . . . . . . . . . . . . . . . . . . . . . . . USD 4,747 EUR 4,146 3/06/19 (30,890)Citibank, NA . . . . . . . . . . . . . . . . . . . . . . . . . . . . . . . . . . . . . . . . BRL 122 USD 33 3/06/19 220Citibank, NA . . . . . . . . . . . . . . . . . . . . . . . . . . . . . . . . . . . . . . . . CLP 37,988 USD 57 3/15/19 (1,107)Citibank, NA . . . . . . . . . . . . . . . . . . . . . . . . . . . . . . . . . . . . . . . . GBP 537 USD 709 4/09/19 (4,905)Citibank, NA . . . . . . . . . . . . . . . . . . . . . . . . . . . . . . . . . . . . . . . . SEK 1,038 USD 113 4/12/19 (238)Credit Suisse International. . . . . . . . . . . . . . . . . . . . . . . . . . . . . . USD 393 AUD 548 3/15/19 (4,356)Credit Suisse International. . . . . . . . . . . . . . . . . . . . . . . . . . . . . . USD 168 NZD 245 3/15/19 (1,443)Credit Suisse International. . . . . . . . . . . . . . . . . . . . . . . . . . . . . . NOK 965 USD 112 4/12/19 (483)Deutsche Bank AG. . . . . . . . . . . . . . . . . . . . . . . . . . . . . . . . . . . . INR 11,303 USD 156 3/18/19 (3,476)Deutsche Bank AG. . . . . . . . . . . . . . . . . . . . . . . . . . . . . . . . . . . . USD 119 INR 8,479 3/18/19 664Goldman Sachs Bank USA . . . . . . . . . . . . . . . . . . . . . . . . . . . . . USD 66 BRL 251 3/06/19 447HSBC Bank USA. . . . . . . . . . . . . . . . . . . . . . . . . . . . . . . . . . . . . JPY 232,712 USD 2,109 4/11/19 14,126HSBC Bank USA. . . . . . . . . . . . . . . . . . . . . . . . . . . . . . . . . . . . . USD 223 KRW 250,083 5/16/19 (677)JPMorgan Chase Bank, NA . . . . . . . . . . . . . . . . . . . . . . . . . . . . . JPY 14,426 USD 132 3/15/19 2,844Morgan Stanley Capital Services LLC . . . . . . . . . . . . . . . . . . . . TWD 1,595 USD 53 3/14/19 736Morgan Stanley Capital Services LLC . . . . . . . . . . . . . . . . . . . . CAD 155 USD 115 3/15/19 (2,385)Royal Bank of Scotland PLC. . . . . . . . . . . . . . . . . . . . . . . . . . . . BRL 129 USD 35 3/06/19 209Royal Bank of Scotland PLC. . . . . . . . . . . . . . . . . . . . . . . . . . . . USD 102 CLP 66,511 3/15/19 (245)Standard Chartered Bank . . . . . . . . . . . . . . . . . . . . . . . . . . . . . . . CAD 2,104 USD 1,590 3/07/19 (8,296)Standard Chartered Bank . . . . . . . . . . . . . . . . . . . . . . . . . . . . . . . INR 4,319 USD 59 3/18/19 (1,556)Standard Chartered Bank . . . . . . . . . . . . . . . . . . . . . . . . . . . . . . . USD 283 EUR 247 4/10/19 (426)Standard Chartered Bank . . . . . . . . . . . . . . . . . . . . . . . . . . . . . . . CNY 2,757 USD 406 4/17/19 (5,654)UBS AG . . . . . . . . . . . . . . . . . . . . . . . . . . . . . . . . . . . . . . . . . . . . USD 205 EUR 179 3/15/19 (1,790)UBS AG . . . . . . . . . . . . . . . . . . . . . . . . . . . . . . . . . . . . . . . . . . . . USD 66 NZD 97 3/15/19 511
$ 53,819
Appreciation $ 199,327 Depreciation $ (145,508)
+ Used for share class hedging purposes.
CENTRALLY CLEARED CREDIT DEFAULT SWAPS Notional Unrealized Termination Amount Market Appreciation/ Clearing Broker/(Exchange) Referenced Obligation Date (000) Value (Depreciation)
Buy ContractsCredit Suisse Securities (USA) LLC/
(INTRCONX) iTraxx-Australia Series 30, 5 Year Index 12/20/23 USD 600 $ (8,350) $ (2,152)Sale ContractsCredit Suisse Securities (USA) LLC/
(INTRCONX) CDX-NAIG Series 31, 5 Year Index 12/20/23 600 10,697 578Total $ 2,347 $ (1,574)
Appreciation $ 578 Depreciation $ (2,152)
CENTRALLY CLEARED INTEREST RATE SWAPS
Rate Type Notional Unrealized Amount Termination Payments Made Payments Received Appreciation/ Clearing Broker/(Exchange) (000) Date By the Fund By the Fund (Depreciation)
Credit Suisse Securities (USA) LLC/(LCH Group) USD 470 9/10/48 2.980% 3 Month LIBOR $ (10,171)Credit Suisse Securities (USA) LLC/(LCH Group) EUR 780 1/15/24 6 Month EURIBOR 0.201% 2,256
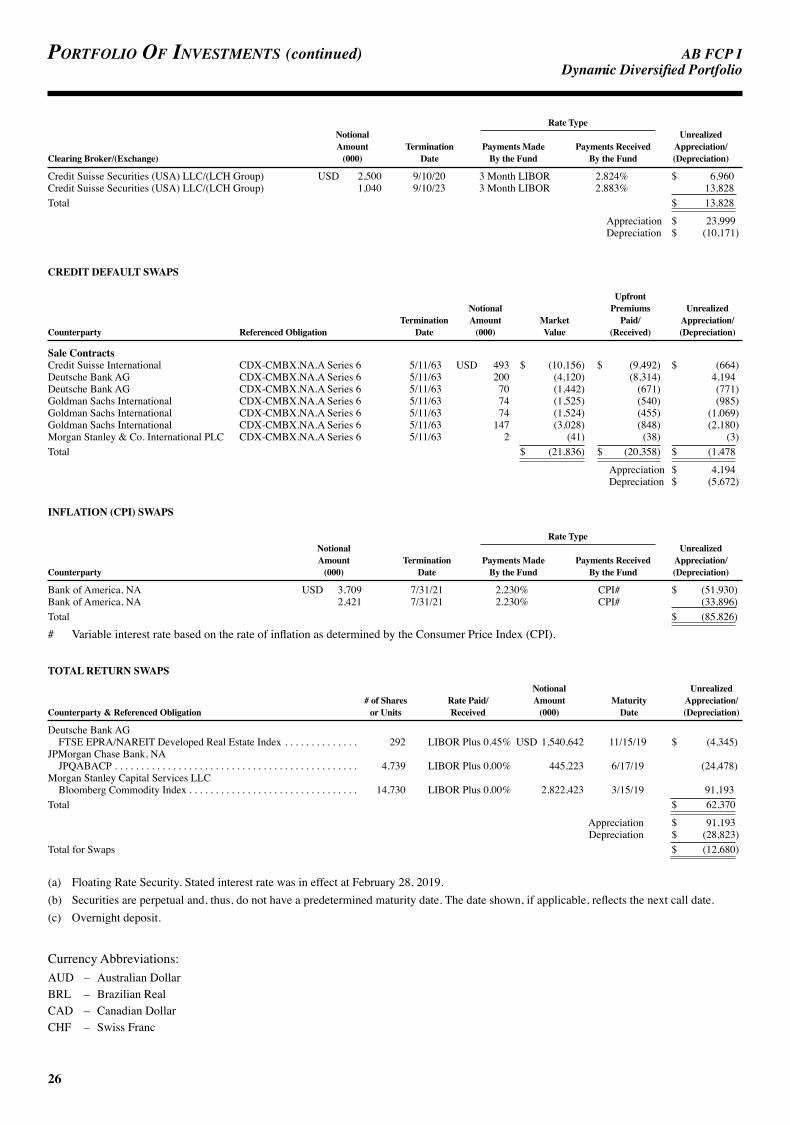
AB FCP I
26
Portfolio of investments (continued) DynamicDiversifiedPortfolio
Rate Type Notional Unrealized Amount Termination Payments Made Payments Received Appreciation/ Clearing Broker/(Exchange) (000) Date By the Fund By the Fund (Depreciation)
Credit Suisse Securities (USA) LLC/(LCH Group) USD 2,500 9/10/20 3 Month LIBOR 2.824% $ 6,960Credit Suisse Securities (USA) LLC/(LCH Group) 1,040 9/10/23 3 Month LIBOR 2.883% 13,828Total $ 13,828
Appreciation $ 23,999 Depreciation $ (10,171)
CREDIT DEFAULT SWAPS
Upfront Notional Premiums Unrealized Termination Amount Market Paid/ Appreciation/ Counterparty Referenced Obligation Date (000) Value (Received) (Depreciation)
Sale ContractsCredit Suisse International CDX-CMBX.NA.A Series 6 5/11/63 USD 493 $ (10,156) $ (9,492) $ (664)Deutsche Bank AG CDX-CMBX.NA.A Series 6 5/11/63 200 (4,120) (8,314) 4,194Deutsche Bank AG CDX-CMBX.NA.A Series 6 5/11/63 70 (1,442) (671) (771)Goldman Sachs International CDX-CMBX.NA.A Series 6 5/11/63 74 (1,525) (540) (985)Goldman Sachs International CDX-CMBX.NA.A Series 6 5/11/63 74 (1,524) (455) (1,069)Goldman Sachs International CDX-CMBX.NA.A Series 6 5/11/63 147 (3,028) (848) (2,180)Morgan Stanley & Co. International PLC CDX-CMBX.NA.A Series 6 5/11/63 2 (41) (38) (3)Total $ (21,836) $ (20,358) $ (1,478
Appreciation $ 4,194 Depreciation $ (5,672)
INFLATION (CPI) SWAPS
Rate Type Notional Unrealized Amount Termination Payments Made Payments Received Appreciation/ Counterparty (000) Date By the Fund By the Fund (Depreciation)
Bank of America, NA USD 3,709 7/31/21 2.230% CPI# $ (51,930)Bank of America, NA 2,421 7/31/21 2.230% CPI# (33,896)Total $ (85,826)
# Variable interest rate based on the rate of inflation as determined by the Consumer Price Index (CPI).
TOTAL RETURN SWAPS Notional Unrealized # of Shares Rate Paid/ Amount Maturity Appreciation/ Counterparty & Referenced Obligation or Units Received (000) Date (Depreciation)
Deutsche Bank AG FTSE EPRA/NAREIT Developed Real Estate Index . . . . . . . . . . . . . . 292 LIBOR Plus 0.45% USD 1,540,642 11/15/19 $ (4,345)JPMorgan Chase Bank, NA JPQABACP . . . . . . . . . . . . . . . . . . . . . . . . . . . . . . . . . . . . . . . . . . . . . . 4,739 LIBOR Plus 0.00% 445,223 6/17/19 (24,478)Morgan Stanley Capital Services LLC Bloomberg Commodity Index . . . . . . . . . . . . . . . . . . . . . . . . . . . . . . . . 14,730 LIBOR Plus 0.00% 2,822,423 3/15/19 91,193Total $ 62,370
Appreciation $ 91,193 Depreciation $ (28,823)
Total for Swaps $ (12,680)
(a) Floating Rate Security. Stated interest rate was in effect at February 28, 2019.(b) Securities are perpetual and, thus, do not have a predetermined maturity date. The date shown, if applicable, reflects the next call date.(c) Overnight deposit.
Currency Abbreviations:AUD – Australian DollarBRL – Brazilian RealCAD – Canadian DollarCHF – Swiss Franc

AB FCP I
27
DynamicDiversifiedPortfolio
CLP – Chilean PesoCNY – Chinese Yuan RenminbiEUR – EuroGBP – Great British PoundHKD – Hong Kong DollarILS – Israeli ShekelINR – Indian RupeeJPY – Japanese YenKRW – South Korean WonMXN – Mexican PesoMYR – Malaysian RinggitNOK – Norwegian KroneNZD – New Zealand DollarSEK – Swedish KronaSGD – Singapore DollarTRY – Turkish LiraTWD – New Taiwan DollarUSD – United States DollarUYU – Uruguayan Peso
Glossary:ADR – American Depositary ReceiptBOBL – BundesobligationenCBT – Chicago Board of TradeCDX-CMBX.NA – North American Commercial Mortgage-Backed IndexCMBS – Commercial Mortgage-Backed SecuritiesCME – Chicago Mercantile ExchangeCPI – Consumer Price IndexEPRA – European Public Real Estate AssociationEURIBOR – Euro Interbank Offered RateFTSE – Financial Times Stock ExchangeINTRCONX – Inter-Continental ExchangeLCH – London Clearing HouseLIBOR – London Interbank Offered RatesMSCI – Morgan Stanley Capital InternationalNAREIT – National Association of Real Estate Investment TrustsOAT – Obligations Assimilables du TrésorPJSC – Public Joint Stock CompanyREG – Registered SharesSPI – Share Price IndexTBA – To Be AnnouncedTOPIX – Tokyo Price IndexTSX – Toronto Stock Exchange
See notes to financial statements.
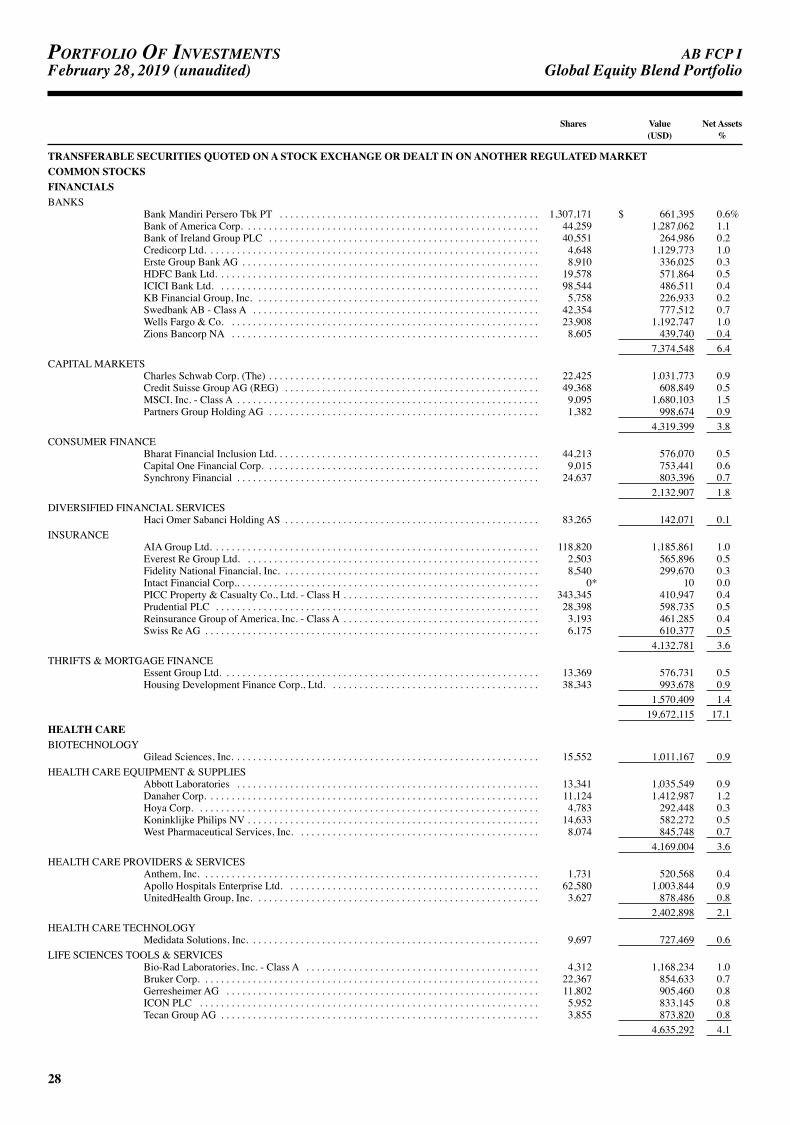
AB FCP I
28
Portfolio of investmentsFebruary28,2019(unaudited) GlobalEquityBlendPortfolio
Shares Value Net Assets (USD) %
TRANSFERABLE SECURITIES QUOTED ON A STOCK EXCHANGE OR DEALT IN ON ANOTHER REGULATED MARKETCOMMON STOCKSFINANCIALSBANKS
Bank Mandiri Persero Tbk PT . . . . . . . . . . . . . . . . . . . . . . . . . . . . . . . . . . . . . . . . . . . . . . . . . 1,307,171 $ 661,395 0.6%Bank of America Corp. . . . . . . . . . . . . . . . . . . . . . . . . . . . . . . . . . . . . . . . . . . . . . . . . . . . . . . . 44,259 1,287,062 1.1Bank of Ireland Group PLC . . . . . . . . . . . . . . . . . . . . . . . . . . . . . . . . . . . . . . . . . . . . . . . . . . . 40,551 264,986 0.2Credicorp Ltd. . . . . . . . . . . . . . . . . . . . . . . . . . . . . . . . . . . . . . . . . . . . . . . . . . . . . . . . . . . . . . . 4,648 1,129,773 1.0Erste Group Bank AG . . . . . . . . . . . . . . . . . . . . . . . . . . . . . . . . . . . . . . . . . . . . . . . . . . . . . . . . 8,910 336,025 0.3HDFC Bank Ltd. . . . . . . . . . . . . . . . . . . . . . . . . . . . . . . . . . . . . . . . . . . . . . . . . . . . . . . . . . . . . 19,578 571,864 0.5ICICI Bank Ltd. . . . . . . . . . . . . . . . . . . . . . . . . . . . . . . . . . . . . . . . . . . . . . . . . . . . . . . . . . . . . 98,544 486,511 0.4KB Financial Group, Inc. . . . . . . . . . . . . . . . . . . . . . . . . . . . . . . . . . . . . . . . . . . . . . . . . . . . . . 5,758 226,933 0.2Swedbank AB - Class A . . . . . . . . . . . . . . . . . . . . . . . . . . . . . . . . . . . . . . . . . . . . . . . . . . . . . . 42,354 777,512 0.7Wells Fargo & Co. . . . . . . . . . . . . . . . . . . . . . . . . . . . . . . . . . . . . . . . . . . . . . . . . . . . . . . . . . . 23,908 1,192,747 1.0Zions Bancorp NA . . . . . . . . . . . . . . . . . . . . . . . . . . . . . . . . . . . . . . . . . . . . . . . . . . . . . . . . . . 8,605 439,740 0.4 7,374,548 6.4
CAPITAL MARKETSCharles Schwab Corp. (The) . . . . . . . . . . . . . . . . . . . . . . . . . . . . . . . . . . . . . . . . . . . . . . . . . . . 22,425 1,031,773 0.9Credit Suisse Group AG (REG) . . . . . . . . . . . . . . . . . . . . . . . . . . . . . . . . . . . . . . . . . . . . . . . . 49,368 608,849 0.5MSCI, Inc. - Class A . . . . . . . . . . . . . . . . . . . . . . . . . . . . . . . . . . . . . . . . . . . . . . . . . . . . . . . . . 9,095 1,680,103 1.5Partners Group Holding AG . . . . . . . . . . . . . . . . . . . . . . . . . . . . . . . . . . . . . . . . . . . . . . . . . . . 1,382 998,674 0.9 4,319,399 3.8
CONSUMER FINANCEBharat Financial Inclusion Ltd. . . . . . . . . . . . . . . . . . . . . . . . . . . . . . . . . . . . . . . . . . . . . . . . . . 44,213 576,070 0.5Capital One Financial Corp. . . . . . . . . . . . . . . . . . . . . . . . . . . . . . . . . . . . . . . . . . . . . . . . . . . . 9,015 753,441 0.6Synchrony Financial . . . . . . . . . . . . . . . . . . . . . . . . . . . . . . . . . . . . . . . . . . . . . . . . . . . . . . . . . 24,637 803,396 0.7 2,132,907 1.8
DIVERSIFIED FINANCIAL SERVICESHaci Omer Sabanci Holding AS . . . . . . . . . . . . . . . . . . . . . . . . . . . . . . . . . . . . . . . . . . . . . . . . 83,265 142,071 0.1
INSURANCEAIA Group Ltd. . . . . . . . . . . . . . . . . . . . . . . . . . . . . . . . . . . . . . . . . . . . . . . . . . . . . . . . . . . . . . 118,820 1,185,861 1.0Everest Re Group Ltd. . . . . . . . . . . . . . . . . . . . . . . . . . . . . . . . . . . . . . . . . . . . . . . . . . . . . . . . 2,503 565,896 0.5Fidelity National Financial, Inc. . . . . . . . . . . . . . . . . . . . . . . . . . . . . . . . . . . . . . . . . . . . . . . . . 8,540 299,670 0.3Intact Financial Corp.. . . . . . . . . . . . . . . . . . . . . . . . . . . . . . . . . . . . . . . . . . . . . . . . . . . . . . . . . 0* 10 0.0PICC Property & Casualty Co., Ltd. - Class H . . . . . . . . . . . . . . . . . . . . . . . . . . . . . . . . . . . . . 343,345 410,947 0.4Prudential PLC . . . . . . . . . . . . . . . . . . . . . . . . . . . . . . . . . . . . . . . . . . . . . . . . . . . . . . . . . . . . . 28,398 598,735 0.5Reinsurance Group of America, Inc. - Class A . . . . . . . . . . . . . . . . . . . . . . . . . . . . . . . . . . . . . 3,193 461,285 0.4Swiss Re AG . . . . . . . . . . . . . . . . . . . . . . . . . . . . . . . . . . . . . . . . . . . . . . . . . . . . . . . . . . . . . . . 6,175 610,377 0.5 4,132,781 3.6
THRIFTS & MORTGAGE FINANCEEssent Group Ltd. . . . . . . . . . . . . . . . . . . . . . . . . . . . . . . . . . . . . . . . . . . . . . . . . . . . . . . . . . . . 13,369 576,731 0.5Housing Development Finance Corp., Ltd. . . . . . . . . . . . . . . . . . . . . . . . . . . . . . . . . . . . . . . . 38,343 993,678 0.9 1,570,409 1.4 19,672,115 17.1
HEALTH CAREBIOTECHNOLOGY
Gilead Sciences, Inc. . . . . . . . . . . . . . . . . . . . . . . . . . . . . . . . . . . . . . . . . . . . . . . . . . . . . . . . . . 15,552 1,011,167 0.9HEALTH CARE EQUIPMENT & SUPPLIES
Abbott Laboratories . . . . . . . . . . . . . . . . . . . . . . . . . . . . . . . . . . . . . . . . . . . . . . . . . . . . . . . . . 13,341 1,035,549 0.9Danaher Corp. . . . . . . . . . . . . . . . . . . . . . . . . . . . . . . . . . . . . . . . . . . . . . . . . . . . . . . . . . . . . . . 11,124 1,412,987 1.2Hoya Corp. . . . . . . . . . . . . . . . . . . . . . . . . . . . . . . . . . . . . . . . . . . . . . . . . . . . . . . . . . . . . . . . . 4,783 292,448 0.3Koninklijke Philips NV . . . . . . . . . . . . . . . . . . . . . . . . . . . . . . . . . . . . . . . . . . . . . . . . . . . . . . . 14,633 582,272 0.5West Pharmaceutical Services, Inc. . . . . . . . . . . . . . . . . . . . . . . . . . . . . . . . . . . . . . . . . . . . . . 8,074 845,748 0.7 4,169,004 3.6
HEALTH CARE PROVIDERS & SERVICESAnthem, Inc. . . . . . . . . . . . . . . . . . . . . . . . . . . . . . . . . . . . . . . . . . . . . . . . . . . . . . . . . . . . . . . . 1,731 520,568 0.4Apollo Hospitals Enterprise Ltd. . . . . . . . . . . . . . . . . . . . . . . . . . . . . . . . . . . . . . . . . . . . . . . . 62,580 1,003,844 0.9UnitedHealth Group, Inc. . . . . . . . . . . . . . . . . . . . . . . . . . . . . . . . . . . . . . . . . . . . . . . . . . . . . . 3,627 878,486 0.8 2,402,898 2.1
HEALTH CARE TECHNOLOGYMedidata Solutions, Inc. . . . . . . . . . . . . . . . . . . . . . . . . . . . . . . . . . . . . . . . . . . . . . . . . . . . . . . 9,697 727,469 0.6
LIFE SCIENCES TOOLS & SERVICESBio-Rad Laboratories, Inc. - Class A . . . . . . . . . . . . . . . . . . . . . . . . . . . . . . . . . . . . . . . . . . . . 4,312 1,168,234 1.0Bruker Corp. . . . . . . . . . . . . . . . . . . . . . . . . . . . . . . . . . . . . . . . . . . . . . . . . . . . . . . . . . . . . . . . 22,367 854,633 0.7Gerresheimer AG . . . . . . . . . . . . . . . . . . . . . . . . . . . . . . . . . . . . . . . . . . . . . . . . . . . . . . . . . . . 11,802 905,460 0.8ICON PLC . . . . . . . . . . . . . . . . . . . . . . . . . . . . . . . . . . . . . . . . . . . . . . . . . . . . . . . . . . . . . . . . 5,952 833,145 0.8Tecan Group AG . . . . . . . . . . . . . . . . . . . . . . . . . . . . . . . . . . . . . . . . . . . . . . . . . . . . . . . . . . . . 3,855 873,820 0.8 4,635,292 4.1

AB FCP I
29
GlobalEquityBlendPortfolio
Shares Value Net Assets (USD) %
PHARMACEUTICALSChina Resources Pharmaceutical Group Ltd. . . . . . . . . . . . . . . . . . . . . . . . . . . . . . . . . . . . . . . 106,771 $ 143,028 0.1%Merck & Co., Inc. . . . . . . . . . . . . . . . . . . . . . . . . . . . . . . . . . . . . . . . . . . . . . . . . . . . . . . . . . . . 8,447 686,673 0.6Novo Nordisk A/S - Class B . . . . . . . . . . . . . . . . . . . . . . . . . . . . . . . . . . . . . . . . . . . . . . . . . . . 22,339 1,095,197 1.0Pfizer, Inc. . . . . . . . . . . . . . . . . . . . . . . . . . . . . . . . . . . . . . . . . . . . . . . . . . . . . . . . . . . . . . . . . . 19,107 828,287 0.7Roche Holding AG . . . . . . . . . . . . . . . . . . . . . . . . . . . . . . . . . . . . . . . . . . . . . . . . . . . . . . . . . . 2,731 757,834 0.7Teva Pharmaceutical Industries Ltd. (Sponsored ADR) . . . . . . . . . . . . . . . . . . . . . . . . . . . . . . 22,322 375,678 0.3Vectura Group PLC . . . . . . . . . . . . . . . . . . . . . . . . . . . . . . . . . . . . . . . . . . . . . . . . . . . . . . . . . . 227,475 234,982 0.2 4,121,679 3.6 17,067,509 14.9
INFORMATION TECHNOLOGYCOMMUNICATIONS EQUIPMENT
Juniper Networks, Inc. . . . . . . . . . . . . . . . . . . . . . . . . . . . . . . . . . . . . . . . . . . . . . . . . . . . . . . . 30,661 830,307 0.7NetScout Systems, Inc. . . . . . . . . . . . . . . . . . . . . . . . . . . . . . . . . . . . . . . . . . . . . . . . . . . . . . . . 9,507 260,204 0.2Nokia Oyj . . . . . . . . . . . . . . . . . . . . . . . . . . . . . . . . . . . . . . . . . . . . . . . . . . . . . . . . . . . . . . . . . 147,670 893,001 0.8 1,983,512 1.7
ELECTRONIC EQUIPMENT, INSTRUMENTS & COMPONENTSHoriba Ltd. . . . . . . . . . . . . . . . . . . . . . . . . . . . . . . . . . . . . . . . . . . . . . . . . . . . . . . . . . . . . . . . . 3,426 174,132 0.2Keyence Corp. . . . . . . . . . . . . . . . . . . . . . . . . . . . . . . . . . . . . . . . . . . . . . . . . . . . . . . . . . . . . . . 1,065 622,786 0.5 796,918 0.7
IT SERVICESAmdocs Ltd. . . . . . . . . . . . . . . . . . . . . . . . . . . . . . . . . . . . . . . . . . . . . . . . . . . . . . . . . . . . . . . . 5,695 316,492 0.3Booz Allen Hamilton Holding Corp. . . . . . . . . . . . . . . . . . . . . . . . . . . . . . . . . . . . . . . . . . . . . 8,461 447,268 0.4Genpact Ltd. . . . . . . . . . . . . . . . . . . . . . . . . . . . . . . . . . . . . . . . . . . . . . . . . . . . . . . . . . . . . . . . 8,686 288,550 0.2Visa, Inc. - Class A . . . . . . . . . . . . . . . . . . . . . . . . . . . . . . . . . . . . . . . . . . . . . . . . . . . . . . . . . . 9,919 1,469,188 1.3Wirecard AG . . . . . . . . . . . . . . . . . . . . . . . . . . . . . . . . . . . . . . . . . . . . . . . . . . . . . . . . . . . . . . . 3,383 462,694 0.4 2,984,192 2.6
SEMICONDUCTORS & SEMICONDUCTOR EQUIPMENTInfineon Technologies AG . . . . . . . . . . . . . . . . . . . . . . . . . . . . . . . . . . . . . . . . . . . . . . . . . . . . 47,215 1,037,648 0.9Intel Corp. . . . . . . . . . . . . . . . . . . . . . . . . . . . . . . . . . . . . . . . . . . . . . . . . . . . . . . . . . . . . . . . . . 6,497 344,092 0.3NVIDIA Corp. . . . . . . . . . . . . . . . . . . . . . . . . . . . . . . . . . . . . . . . . . . . . . . . . . . . . . . . . . . . . . . 4,420 681,782 0.6Realtek Semiconductor Corp. . . . . . . . . . . . . . . . . . . . . . . . . . . . . . . . . . . . . . . . . . . . . . . . . . . 57,047 327,341 0.3 2,390,863 2.1
SOFTWAREDassault Systemes SE . . . . . . . . . . . . . . . . . . . . . . . . . . . . . . . . . . . . . . . . . . . . . . . . . . . . . . . . 7,033 1,028,265 0.9Microsoft Corp. . . . . . . . . . . . . . . . . . . . . . . . . . . . . . . . . . . . . . . . . . . . . . . . . . . . . . . . . . . . . . 15,179 1,700,543 1.5Oracle Corp. . . . . . . . . . . . . . . . . . . . . . . . . . . . . . . . . . . . . . . . . . . . . . . . . . . . . . . . . . . . . . . . 22,850 1,191,175 1.0SailPoint Technologies Holding, Inc. . . . . . . . . . . . . . . . . . . . . . . . . . . . . . . . . . . . . . . . . . . . . 21,804 672,434 0.6 4,592,417 4.0
TECHNOLOGY HARDWARE, STORAGE & PERIPHERALSApple, Inc. . . . . . . . . . . . . . . . . . . . . . . . . . . . . . . . . . . . . . . . . . . . . . . . . . . . . . . . . . . . . . . . . . 10,612 1,837,387 1.6NCR Corp. . . . . . . . . . . . . . . . . . . . . . . . . . . . . . . . . . . . . . . . . . . . . . . . . . . . . . . . . . . . . . . . . 11,544 323,468 0.3Samsung Electronics Co., Ltd. . . . . . . . . . . . . . . . . . . . . . . . . . . . . . . . . . . . . . . . . . . . . . . . . . 16,245 650,147 0.6Xerox Corp. . . . . . . . . . . . . . . . . . . . . . . . . . . . . . . . . . . . . . . . . . . . . . . . . . . . . . . . . . . . . . . . . 11,116 343,470 0.3 3,154,472 2.8 15,902,374 13.9
CONSUMER DISCRETIONARYAUTO COMPONENTS
Aptiv PLC . . . . . . . . . . . . . . . . . . . . . . . . . . . . . . . . . . . . . . . . . . . . . . . . . . . . . . . . . . . . . . . . . 14,335 1,191,343 1.1Hankook Tire Co., Ltd. . . . . . . . . . . . . . . . . . . . . . . . . . . . . . . . . . . . . . . . . . . . . . . . . . . . . . . . 7,570 287,455 0.3Magna International, Inc. - Class A . . . . . . . . . . . . . . . . . . . . . . . . . . . . . . . . . . . . . . . . . . . . . 15,857 836,149 0.7NGK Spark Plug Co., Ltd. . . . . . . . . . . . . . . . . . . . . . . . . . . . . . . . . . . . . . . . . . . . . . . . . . . . . 17,527 373,962 0.3Toyo Tire Corp. . . . . . . . . . . . . . . . . . . . . . . . . . . . . . . . . . . . . . . . . . . . . . . . . . . . . . . . . . . . . . 19,075 243,789 0.2 2,932,698 2.6
AUTOMOBILESHonda Motor Co., Ltd. . . . . . . . . . . . . . . . . . . . . . . . . . . . . . . . . . . . . . . . . . . . . . . . . . . . . . . . 12,732 359,559 0.3Peugeot SA . . . . . . . . . . . . . . . . . . . . . . . . . . . . . . . . . . . . . . . . . . . . . . . . . . . . . . . . . . . . . . . . 25,951 659,828 0.6Subaru Corp. . . . . . . . . . . . . . . . . . . . . . . . . . . . . . . . . . . . . . . . . . . . . . . . . . . . . . . . . . . . . . . . 17,917 456,517 0.4 1,475,904 1.3
DIVERSIFIED CONSUMER SERVICESBright Horizons Family Solutions, Inc. . . . . . . . . . . . . . . . . . . . . . . . . . . . . . . . . . . . . . . . . . . 7,987 990,329 0.9Estacio Participacoes SA . . . . . . . . . . . . . . . . . . . . . . . . . . . . . . . . . . . . . . . . . . . . . . . . . . . . . . 30,779 225,756 0.2 1,216,085 1.1
HOTELS, RESTAURANTS & LEISUREBloomin’ Brands, Inc. . . . . . . . . . . . . . . . . . . . . . . . . . . . . . . . . . . . . . . . . . . . . . . . . . . . . . . . . 16,702 345,387 0.3GVC Holdings PLC . . . . . . . . . . . . . . . . . . . . . . . . . . . . . . . . . . . . . . . . . . . . . . . . . . . . . . . . . 51,784 450,459 0.4 795,846 0.7

AB FCP I
30
Portfolio of investments (continued) GlobalEquityBlendPortfolio
Shares Value Net Assets (USD) %
HOUSEHOLD DURABLESNikon Corp. . . . . . . . . . . . . . . . . . . . . . . . . . . . . . . . . . . . . . . . . . . . . . . . . . . . . . . . . . . . . . . . . 30,083 $ 456,072 0.4%Panasonic Corp. . . . . . . . . . . . . . . . . . . . . . . . . . . . . . . . . . . . . . . . . . . . . . . . . . . . . . . . . . . . . 42,236 390,333 0.3 846,405 0.7
INTERNET & DIRECT MARKETING RETAILAlibaba Group Holding Ltd. (Sponsored ADR) . . . . . . . . . . . . . . . . . . . . . . . . . . . . . . . . . . . . 5,493 1,005,380 0.9Amazon.com, Inc. . . . . . . . . . . . . . . . . . . . . . . . . . . . . . . . . . . . . . . . . . . . . . . . . . . . . . . . . . . . 711 1,165,526 1.0Etsy, Inc. . . . . . . . . . . . . . . . . . . . . . . . . . . . . . . . . . . . . . . . . . . . . . . . . . . . . . . . . . . . . . . . . . . 10,180 725,507 0.6 2,896,413 2.5
SPECIALTY RETAILGap, Inc. (The) . . . . . . . . . . . . . . . . . . . . . . . . . . . . . . . . . . . . . . . . . . . . . . . . . . . . . . . . . . . . . 11,344 288,149 0.2Michaels Cos., Inc. (The) (a) . . . . . . . . . . . . . . . . . . . . . . . . . . . . . . . . . . . . . . . . . . . . . . . . . . . 24,353 344,354 0.3Ross Stores, Inc. . . . . . . . . . . . . . . . . . . . . . . . . . . . . . . . . . . . . . . . . . . . . . . . . . . . . . . . . . . . . 6,066 575,249 0.5Signet Jewelers Ltd. . . . . . . . . . . . . . . . . . . . . . . . . . . . . . . . . . . . . . . . . . . . . . . . . . . . . . . . . . 9,255 260,160 0.2TJX Cos., Inc. (The) . . . . . . . . . . . . . . . . . . . . . . . . . . . . . . . . . . . . . . . . . . . . . . . . . . . . . . . . . 12,367 634,317 0.6 2,102,229 1.8
TEXTILES, APPAREL & LUXURY GOODSDeckers Outdoor Corp. . . . . . . . . . . . . . . . . . . . . . . . . . . . . . . . . . . . . . . . . . . . . . . . . . . . . . . . 2,641 390,726 0.3EssilorLuxottica SA . . . . . . . . . . . . . . . . . . . . . . . . . . . . . . . . . . . . . . . . . . . . . . . . . . . . . . . . . 5,241 634,242 0.6Pandora A/S . . . . . . . . . . . . . . . . . . . . . . . . . . . . . . . . . . . . . . . . . . . . . . . . . . . . . . . . . . . . . . . 6,235 327,180 0.3 1,352,148 1.2 13,617,728 11.9
INDUSTRIALSAEROSPACE & DEFENSE
AerCap Holdings NV . . . . . . . . . . . . . . . . . . . . . . . . . . . . . . . . . . . . . . . . . . . . . . . . . . . . . . . . 5,160 232,927 0.2Airbus SE . . . . . . . . . . . . . . . . . . . . . . . . . . . . . . . . . . . . . . . . . . . . . . . . . . . . . . . . . . . . . . . . . 5,125 660,269 0.6BAE Systems PLC . . . . . . . . . . . . . . . . . . . . . . . . . . . . . . . . . . . . . . . . . . . . . . . . . . . . . . . . . . 63,007 388,483 0.4Boeing Co. (The) . . . . . . . . . . . . . . . . . . . . . . . . . . . . . . . . . . . . . . . . . . . . . . . . . . . . . . . . . . . 2,124 934,304 0.8Hexcel Corp. . . . . . . . . . . . . . . . . . . . . . . . . . . . . . . . . . . . . . . . . . . . . . . . . . . . . . . . . . . . . . . . 19,023 1,372,304 1.2Leonardo SpA . . . . . . . . . . . . . . . . . . . . . . . . . . . . . . . . . . . . . . . . . . . . . . . . . . . . . . . . . . . . . . 36,176 364,385 0.3MTU Aero Engines AG . . . . . . . . . . . . . . . . . . . . . . . . . . . . . . . . . . . . . . . . . . . . . . . . . . . . . . 1,623 347,833 0.3 4,300,505 3.8
AIRLINESAlaska Air Group, Inc. . . . . . . . . . . . . . . . . . . . . . . . . . . . . . . . . . . . . . . . . . . . . . . . . . . . . . . . 6,463 398,765 0.3Qantas Airways Ltd. . . . . . . . . . . . . . . . . . . . . . . . . . . . . . . . . . . . . . . . . . . . . . . . . . . . . . . . . . 98,851 401,886 0.4 800,651 0.7
BUILDING PRODUCTSKingspan Group PLC . . . . . . . . . . . . . . . . . . . . . . . . . . . . . . . . . . . . . . . . . . . . . . . . . . . . . . . . 688 32,503 0.0Kingspan Group PLC (London) . . . . . . . . . . . . . . . . . . . . . . . . . . . . . . . . . . . . . . . . . . . . . . . . 28,497 1,327,205 1.2 1,359,708 1.2
COMMERCIAL SERVICES & SUPPLIESChina Everbright International Ltd. . . . . . . . . . . . . . . . . . . . . . . . . . . . . . . . . . . . . . . . . . . . . . 846,968 828,016 0.7Republic Services, Inc. - Class A . . . . . . . . . . . . . . . . . . . . . . . . . . . . . . . . . . . . . . . . . . . . . . . 5,653 443,344 0.4 1,271,360 1.1
ELECTRICAL EQUIPMENTRegal Beloit Corp. . . . . . . . . . . . . . . . . . . . . . . . . . . . . . . . . . . . . . . . . . . . . . . . . . . . . . . . . . . 3,494 292,651 0.3Schneider Electric SE (Paris) . . . . . . . . . . . . . . . . . . . . . . . . . . . . . . . . . . . . . . . . . . . . . . . . . . 11,975 930,523 0.8Signify NV . . . . . . . . . . . . . . . . . . . . . . . . . . . . . . . . . . . . . . . . . . . . . . . . . . . . . . . . . . . . . . . . 10,612 281,859 0.2Vestas Wind Systems A/S . . . . . . . . . . . . . . . . . . . . . . . . . . . . . . . . . . . . . . . . . . . . . . . . . . . . . 15,180 1,264,692 1.1 2,769,725 2.4
INDUSTRIAL CONGLOMERATESSiemens AG (REG) . . . . . . . . . . . . . . . . . . . . . . . . . . . . . . . . . . . . . . . . . . . . . . . . . . . . . . . . . . 7,328 800,562 0.7
MACHINERYOshkosh Corp. . . . . . . . . . . . . . . . . . . . . . . . . . . . . . . . . . . . . . . . . . . . . . . . . . . . . . . . . . . . . . . 4,918 382,695 0.3Xylem, Inc./NY . . . . . . . . . . . . . . . . . . . . . . . . . . . . . . . . . . . . . . . . . . . . . . . . . . . . . . . . . . . . . 19,204 1,450,871 1.3 1,833,566 1.6 13,136,077 11.5
CONSUMER STAPLESBEVERAGES
Coca-Cola Bottlers Japan Holdings, Inc. . . . . . . . . . . . . . . . . . . . . . . . . . . . . . . . . . . . . . . . . . 10,972 283,148 0.2Diageo PLC . . . . . . . . . . . . . . . . . . . . . . . . . . . . . . . . . . . . . . . . . . . . . . . . . . . . . . . . . . . . . . . . 11,360 439,899 0.4 723,047 0.6
FOOD & STAPLES RETAILINGKoninklijke Ahold Delhaize NV . . . . . . . . . . . . . . . . . . . . . . . . . . . . . . . . . . . . . . . . . . . . . . . . 21,746 560,452 0.5US Foods Holding Corp. . . . . . . . . . . . . . . . . . . . . . . . . . . . . . . . . . . . . . . . . . . . . . . . . . . . . . . 14,380 506,746 0.4Walmart, Inc. . . . . . . . . . . . . . . . . . . . . . . . . . . . . . . . . . . . . . . . . . . . . . . . . . . . . . . . . . . . . . . . 4,838 478,891 0.4 1,546,089 1.3
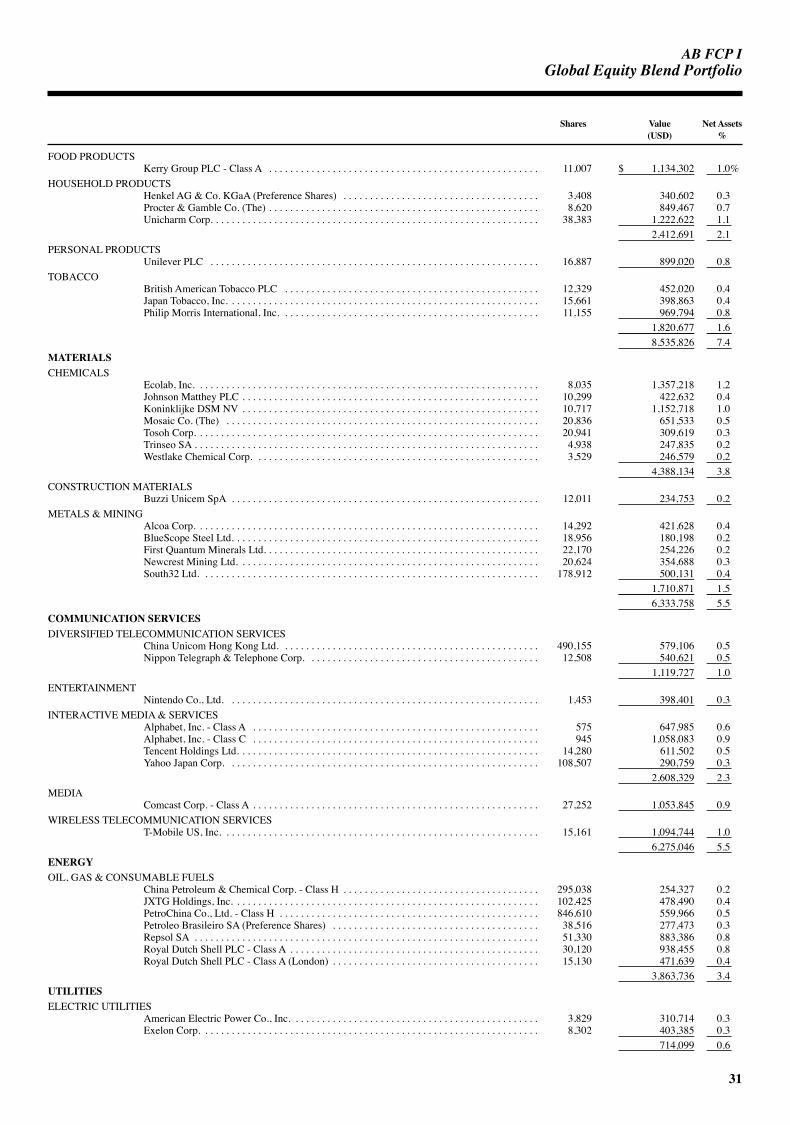
AB FCP I
31
GlobalEquityBlendPortfolio
Shares Value Net Assets (USD) %
FOOD PRODUCTSKerry Group PLC - Class A . . . . . . . . . . . . . . . . . . . . . . . . . . . . . . . . . . . . . . . . . . . . . . . . . . . 11,007 $ 1,134,302 1.0%
HOUSEHOLD PRODUCTSHenkel AG & Co. KGaA (Preference Shares) . . . . . . . . . . . . . . . . . . . . . . . . . . . . . . . . . . . . . 3,408 340,602 0.3Procter & Gamble Co. (The) . . . . . . . . . . . . . . . . . . . . . . . . . . . . . . . . . . . . . . . . . . . . . . . . . . . 8,620 849,467 0.7Unicharm Corp. . . . . . . . . . . . . . . . . . . . . . . . . . . . . . . . . . . . . . . . . . . . . . . . . . . . . . . . . . . . . . 38,383 1,222,622 1.1 2,412,691 2.1
PERSONAL PRODUCTSUnilever PLC . . . . . . . . . . . . . . . . . . . . . . . . . . . . . . . . . . . . . . . . . . . . . . . . . . . . . . . . . . . . . . 16,887 899,020 0.8
TOBACCOBritish American Tobacco PLC . . . . . . . . . . . . . . . . . . . . . . . . . . . . . . . . . . . . . . . . . . . . . . . . 12,329 452,020 0.4Japan Tobacco, Inc. . . . . . . . . . . . . . . . . . . . . . . . . . . . . . . . . . . . . . . . . . . . . . . . . . . . . . . . . . . 15,661 398,863 0.4Philip Morris International, Inc. . . . . . . . . . . . . . . . . . . . . . . . . . . . . . . . . . . . . . . . . . . . . . . . . 11,155 969,794 0.8 1,820,677 1.6 8,535,826 7.4
MATERIALSCHEMICALS
Ecolab, Inc. . . . . . . . . . . . . . . . . . . . . . . . . . . . . . . . . . . . . . . . . . . . . . . . . . . . . . . . . . . . . . . . . 8,035 1,357,218 1.2Johnson Matthey PLC . . . . . . . . . . . . . . . . . . . . . . . . . . . . . . . . . . . . . . . . . . . . . . . . . . . . . . . . 10,299 422,632 0.4Koninklijke DSM NV . . . . . . . . . . . . . . . . . . . . . . . . . . . . . . . . . . . . . . . . . . . . . . . . . . . . . . . . 10,717 1,152,718 1.0Mosaic Co. (The) . . . . . . . . . . . . . . . . . . . . . . . . . . . . . . . . . . . . . . . . . . . . . . . . . . . . . . . . . . . 20,836 651,533 0.5Tosoh Corp. . . . . . . . . . . . . . . . . . . . . . . . . . . . . . . . . . . . . . . . . . . . . . . . . . . . . . . . . . . . . . . . . 20,941 309,619 0.3Trinseo SA . . . . . . . . . . . . . . . . . . . . . . . . . . . . . . . . . . . . . . . . . . . . . . . . . . . . . . . . . . . . . . . . . 4,938 247,835 0.2Westlake Chemical Corp. . . . . . . . . . . . . . . . . . . . . . . . . . . . . . . . . . . . . . . . . . . . . . . . . . . . . . 3,529 246,579 0.2 4,388,134 3.8
CONSTRUCTION MATERIALSBuzzi Unicem SpA . . . . . . . . . . . . . . . . . . . . . . . . . . . . . . . . . . . . . . . . . . . . . . . . . . . . . . . . . . 12,011 234,753 0.2
METALS & MININGAlcoa Corp. . . . . . . . . . . . . . . . . . . . . . . . . . . . . . . . . . . . . . . . . . . . . . . . . . . . . . . . . . . . . . . . . 14,292 421,628 0.4BlueScope Steel Ltd. . . . . . . . . . . . . . . . . . . . . . . . . . . . . . . . . . . . . . . . . . . . . . . . . . . . . . . . . . 18,956 180,198 0.2First Quantum Minerals Ltd. . . . . . . . . . . . . . . . . . . . . . . . . . . . . . . . . . . . . . . . . . . . . . . . . . . . 22,170 254,226 0.2Newcrest Mining Ltd. . . . . . . . . . . . . . . . . . . . . . . . . . . . . . . . . . . . . . . . . . . . . . . . . . . . . . . . . 20,624 354,688 0.3South32 Ltd. . . . . . . . . . . . . . . . . . . . . . . . . . . . . . . . . . . . . . . . . . . . . . . . . . . . . . . . . . . . . . . . 178,912 500,131 0.4 1,710,871 1.5 6,333,758 5.5
COMMUNICATION SERVICESDIVERSIFIED TELECOMMUNICATION SERVICES
China Unicom Hong Kong Ltd. . . . . . . . . . . . . . . . . . . . . . . . . . . . . . . . . . . . . . . . . . . . . . . . . 490,155 579,106 0.5Nippon Telegraph & Telephone Corp. . . . . . . . . . . . . . . . . . . . . . . . . . . . . . . . . . . . . . . . . . . . 12,508 540,621 0.5 1,119,727 1.0
ENTERTAINMENTNintendo Co., Ltd. . . . . . . . . . . . . . . . . . . . . . . . . . . . . . . . . . . . . . . . . . . . . . . . . . . . . . . . . . . 1,453 398,401 0.3
INTERACTIVE MEDIA & SERVICESAlphabet, Inc. - Class A . . . . . . . . . . . . . . . . . . . . . . . . . . . . . . . . . . . . . . . . . . . . . . . . . . . . . . 575 647,985 0.6Alphabet, Inc. - Class C . . . . . . . . . . . . . . . . . . . . . . . . . . . . . . . . . . . . . . . . . . . . . . . . . . . . . . 945 1,058,083 0.9Tencent Holdings Ltd. . . . . . . . . . . . . . . . . . . . . . . . . . . . . . . . . . . . . . . . . . . . . . . . . . . . . . . . . 14,280 611,502 0.5Yahoo Japan Corp. . . . . . . . . . . . . . . . . . . . . . . . . . . . . . . . . . . . . . . . . . . . . . . . . . . . . . . . . . . 108,507 290,759 0.3 2,608,329 2.3
MEDIAComcast Corp. - Class A . . . . . . . . . . . . . . . . . . . . . . . . . . . . . . . . . . . . . . . . . . . . . . . . . . . . . . 27,252 1,053,845 0.9
WIRELESS TELECOMMUNICATION SERVICEST-Mobile US, Inc. . . . . . . . . . . . . . . . . . . . . . . . . . . . . . . . . . . . . . . . . . . . . . . . . . . . . . . . . . . . 15,161 1,094,744 1.0 6,275,046 5.5
ENERGYOIL, GAS & CONSUMABLE FUELS
China Petroleum & Chemical Corp. - Class H . . . . . . . . . . . . . . . . . . . . . . . . . . . . . . . . . . . . . 295,038 254,327 0.2JXTG Holdings, Inc. . . . . . . . . . . . . . . . . . . . . . . . . . . . . . . . . . . . . . . . . . . . . . . . . . . . . . . . . . 102,425 478,490 0.4PetroChina Co., Ltd. - Class H . . . . . . . . . . . . . . . . . . . . . . . . . . . . . . . . . . . . . . . . . . . . . . . . . 846,610 559,966 0.5Petroleo Brasileiro SA (Preference Shares) . . . . . . . . . . . . . . . . . . . . . . . . . . . . . . . . . . . . . . . 38,516 277,473 0.3Repsol SA . . . . . . . . . . . . . . . . . . . . . . . . . . . . . . . . . . . . . . . . . . . . . . . . . . . . . . . . . . . . . . . . . 51,330 883,386 0.8Royal Dutch Shell PLC - Class A . . . . . . . . . . . . . . . . . . . . . . . . . . . . . . . . . . . . . . . . . . . . . . . 30,120 938,455 0.8Royal Dutch Shell PLC - Class A (London) . . . . . . . . . . . . . . . . . . . . . . . . . . . . . . . . . . . . . . . 15,130 471,639 0.4 3,863,736 3.4
UTILITIESELECTRIC UTILITIES
American Electric Power Co., Inc. . . . . . . . . . . . . . . . . . . . . . . . . . . . . . . . . . . . . . . . . . . . . . . 3,829 310,714 0.3Exelon Corp. . . . . . . . . . . . . . . . . . . . . . . . . . . . . . . . . . . . . . . . . . . . . . . . . . . . . . . . . . . . . . . . 8,302 403,385 0.3 714,099 0.6

AB FCP I
32
Portfolio of investments (continued) GlobalEquityBlendPortfolio
Rate Date Shares Value Net Assets (USD) %
GAS UTILITIESChina Resources Gas Group Ltd. . . . . . . . . . . . . . . . . . . . . . . . . . . 68,267 $ 296,633 0.3%
MULTI-UTILITIESSuez . . . . . . . . . . . . . . . . . . . . . . . . . . . . . . . . . . . . . . . . . . . . . . . . . 46,783 597,853 0.5
WATER UTILITIESAmerican Water Works Co., Inc. . . . . . . . . . . . . . . . . . . . . . . . . . . 13,942 1,416,766 1.2Beijing Enterprises Water Group Ltd. . . . . . . . . . . . . . . . . . . . . . . . 1,336,319 800,047 0.7 2,216,813 1.9 3,825,398 3.3
REAL ESTATEEQUITY REAL ESTATE INVESTMENT TRUSTS (REITS)
Empire State Realty Trust, Inc. - Class A . . . . . . . . . . . . . . . . . . . . 15,059 229,203 0.2Medical Properties Trust, Inc. . . . . . . . . . . . . . . . . . . . . . . . . . . . . . 30,692 559,515 0.5Mid-America Apartment Communities, Inc. . . . . . . . . . . . . . . . . . 4,031 417,540 0.4Omega Healthcare Investors, Inc. . . . . . . . . . . . . . . . . . . . . . . . . . . 10,461 375,549 0.3SBA Communications Corp. . . . . . . . . . . . . . . . . . . . . . . . . . . . . . . 5,167 932,908 0.8 2,514,715 2.2
REAL ESTATE MANAGEMENT & DEVELOPMENTAroundtown SA . . . . . . . . . . . . . . . . . . . . . . . . . . . . . . . . . . . . . . . 52,191 438,242 0.4Vonovia SE . . . . . . . . . . . . . . . . . . . . . . . . . . . . . . . . . . . . . . . . . . . 5,434 263,030 0.2 701,272 0.6 3,215,987 2.8
Total Investments(cost $97,009,190) . . . . . . . . . . . . . . . . . . . . . . . . . . . . . . . . . . . . . . $ 111,445,554 97.2%
Time DepositsBBH, Grand Cayman(b) . . . . . . . . . . . . . . . . . . . . . . . . . . . . . . . . . (0.85)% – 11,259 0.0BBH, Grand Cayman(b) . . . . . . . . . . . . . . . . . . . . . . . . . . . . . . . . . 0.16 % – 11,288 0.0BBH, Grand Cayman(b) . . . . . . . . . . . . . . . . . . . . . . . . . . . . . . . . . 1.76 % – 698 0.0BBH, Grand Cayman(b) . . . . . . . . . . . . . . . . . . . . . . . . . . . . . . . . . 5.12 % – 10 0.0Citibank, New York(b). . . . . . . . . . . . . . . . . . . . . . . . . . . . . . . . . . . 1.76 % – 803,105 0.7Credit Suisse AG, Zurich(b) . . . . . . . . . . . . . . . . . . . . . . . . . . . . . . (1.40)% – 11,292 0.0Deutsche Bank, Frankfurt(b) . . . . . . . . . . . . . . . . . . . . . . . . . . . . . . (0.57)% – 64,269 0.1Hong Kong & Shanghai Bank, Singapore(b) . . . . . . . . . . . . . . . . . 0.67 % – 5,874 0.0HSBC Bank PLC, London(b) . . . . . . . . . . . . . . . . . . . . . . . . . . . . . 0.36 % – 5,817 0.0JPMorgan Chase, New York(b) . . . . . . . . . . . . . . . . . . . . . . . . . . . . 1.76 % – 2,574,881 2.2National Australia Bank, London(b) . . . . . . . . . . . . . . . . . . . . . . . . 0.76 % – 11,046 0.0Royal Bank of Canada, Toronto(b) . . . . . . . . . . . . . . . . . . . . . . . . . 0.82 % – 6,372 0.0SEB, Stockholm(b) . . . . . . . . . . . . . . . . . . . . . . . . . . . . . . . . . . . . . (0.49)% – 11,678 0.0SEB, Stockholm(b) . . . . . . . . . . . . . . . . . . . . . . . . . . . . . . . . . . . . . (0.26)% – 11,127 0.0SEB, Stockholm(b) . . . . . . . . . . . . . . . . . . . . . . . . . . . . . . . . . . . . . 0.36 % – 5,919 0.0Sumitomo, Tokyo(b) . . . . . . . . . . . . . . . . . . . . . . . . . . . . . . . . . . . . (0.57)% – 5,292 0.0
Total Time Deposits . . . . . . . . . . . . . . . . . . . . . . . . . . . . . . . . . . . . . . . . . . . . . . . . . . . . . . 3,539,927 3.0Other assets less liabilities . . . . . . . . . . . . . . . . . . . . . . . . . . . . . . . . . . . . . . . . . . . . . . . . . (284,124) (0.2)Net Assets . . . . . . . . . . . . . . . . . . . . . . . . . . . . . . . . . . . . . . . . . . . . . . . . . . . . . . . . . . . . . . $ 114,701,357 100.0%
FORWARD FOREIGN CURRENCY CONTRACTS
Contracts to In Exchange Unrealized Deliver For Settlement Appreciation/ Counterparty (000) (000) Date (Depreciation)
Bank of America, NA. . . . . . . . . . . . . . . . . . . . . . . . . . . . . . . . . . USD 325 EUR 285 3/15/19 $ (764)Barclays Bank PLC . . . . . . . . . . . . . . . . . . . . . . . . . . . . . . . . . . . BRL 1,855 USD 497 3/06/19 3,535Barclays Bank PLC . . . . . . . . . . . . . . . . . . . . . . . . . . . . . . . . . . . USD 170 BRL 633 3/06/19 (1,207)Barclays Bank PLC . . . . . . . . . . . . . . . . . . . . . . . . . . . . . . . . . . . CHF 161 USD 162 3/15/19 249Barclays Bank PLC . . . . . . . . . . . . . . . . . . . . . . . . . . . . . . . . . . . EUR 4,817 USD 5,542 3/15/19 58,443Barclays Bank PLC . . . . . . . . . . . . . . . . . . . . . . . . . . . . . . . . . . . SEK 1,250 USD 140 3/15/19 4,980Barclays Bank PLC . . . . . . . . . . . . . . . . . . . . . . . . . . . . . . . . . . . USD 89 AUD 125 3/15/19 (255)Barclays Bank PLC . . . . . . . . . . . . . . . . . . . . . . . . . . . . . . . . . . . USD 1,552 CAD 2,065 3/15/19 17,673Barclays Bank PLC . . . . . . . . . . . . . . . . . . . . . . . . . . . . . . . . . . . USD 1,185 GBP 935 3/15/19 55,471Barclays Bank PLC . . . . . . . . . . . . . . . . . . . . . . . . . . . . . . . . . . . USD 160 MXN 3,297 3/15/19 10,426Barclays Bank PLC . . . . . . . . . . . . . . . . . . . . . . . . . . . . . . . . . . . USD 109 NOK 921 3/15/19 (1,054)Barclays Bank PLC . . . . . . . . . . . . . . . . . . . . . . . . . . . . . . . . . . . USD 135 INR 9,659 3/18/19 1,122Barclays Bank PLC . . . . . . . . . . . . . . . . . . . . . . . . . . . . . . . . . . . BRL 633 USD 169 4/02/19 1,200Barclays Bank PLC . . . . . . . . . . . . . . . . . . . . . . . . . . . . . . . . . . . USD 496 BRL 1,855 4/02/19 (3,515)Barclays Bank PLC . . . . . . . . . . . . . . . . . . . . . . . . . . . . . . . . . . . USD 177 CNY 1,196 4/17/19 1,859Barclays Bank PLC . . . . . . . . . . . . . . . . . . . . . . . . . . . . . . . . . . . KRW 1,164,987 USD 1,036 5/16/19 (1,711)Barclays Bank PLC . . . . . . . . . . . . . . . . . . . . . . . . . . . . . . . . . . . USD 778 KRW 874,541 5/16/19 1,284Barclays Bank PLC . . . . . . . . . . . . . . . . . . . . . . . . . . . . . . . . . . . EUR 389 USD 443 6/17/19 (3,401)BNP Paribas SA. . . . . . . . . . . . . . . . . . . . . . . . . . . . . . . . . . . . . . USD 209 SEK 1,873 3/15/19 (5,558)

AB FCP I
33
GlobalEquityBlendPortfolio
Contracts to In Exchange Unrealized Deliver For Settlement Appreciation/ Counterparty (000) (000) Date (Depreciation)
Brown Brothers Harriman & Co.. . . . . . . . . . . . . . . . . . . . . . . . . EUR 414 USD 474 3/15/19 $ 2,815Brown Brothers Harriman & Co.. . . . . . . . . . . . . . . . . . . . . . . . . JPY 39,648 USD 358 3/15/19 2,800Brown Brothers Harriman & Co.. . . . . . . . . . . . . . . . . . . . . . . . . USD 1,217 CHF 1,200 3/15/19 (13,648)Brown Brothers Harriman & Co.. . . . . . . . . . . . . . . . . . . . . . . . . USD 108 EUR 94 3/15/19 (578)Brown Brothers Harriman & Co. + . . . . . . . . . . . . . . . . . . . . . . . USD 5,501 EUR 4,805 3/06/19 (35,062)Citibank, NA . . . . . . . . . . . . . . . . . . . . . . . . . . . . . . . . . . . . . . . . BRL 633 USD 168 3/06/19 (941)Citibank, NA . . . . . . . . . . . . . . . . . . . . . . . . . . . . . . . . . . . . . . . . EUR 961 USD 1,111 3/15/19 16,360Citibank, NA . . . . . . . . . . . . . . . . . . . . . . . . . . . . . . . . . . . . . . . . JPY 26,724 USD 242 3/15/19 2,410Citibank, NA . . . . . . . . . . . . . . . . . . . . . . . . . . . . . . . . . . . . . . . . USD 1,267 AUD 1,761 3/15/19 (17,853)Citibank, NA . . . . . . . . . . . . . . . . . . . . . . . . . . . . . . . . . . . . . . . . USD 148 EUR 128 3/15/19 (1,808)Citibank, NA . . . . . . . . . . . . . . . . . . . . . . . . . . . . . . . . . . . . . . . . USD 123 HKD 961 3/15/19 (685)Citibank, NA . . . . . . . . . . . . . . . . . . . . . . . . . . . . . . . . . . . . . . . . USD 198 JPY 21,817 3/15/19 (1,818)Credit Suisse International. . . . . . . . . . . . . . . . . . . . . . . . . . . . . . USD 233 JPY 25,559 3/15/19 (3,317)Deutsche Bank AG. . . . . . . . . . . . . . . . . . . . . . . . . . . . . . . . . . . . EUR 156 USD 180 3/15/19 1,862Deutsche Bank AG. . . . . . . . . . . . . . . . . . . . . . . . . . . . . . . . . . . . INR 155,937 USD 2,185 3/18/19 (12,211)Goldman Sachs Bank USA . . . . . . . . . . . . . . . . . . . . . . . . . . . . . USD 490 BRL 1,855 3/06/19 3,302Goldman Sachs Bank USA . . . . . . . . . . . . . . . . . . . . . . . . . . . . . USD 232 RUB 15,500 3/07/19 2,883Goldman Sachs Bank USA . . . . . . . . . . . . . . . . . . . . . . . . . . . . . JPY 30,016 USD 267 3/15/19 (2,486)JPMorgan Chase Bank, NA . . . . . . . . . . . . . . . . . . . . . . . . . . . . . EUR 108 USD 124 3/15/19 727JPMorgan Chase Bank, NA . . . . . . . . . . . . . . . . . . . . . . . . . . . . . USD 203 JPY 22,255 3/15/19 (3,382)JPMorgan Chase Bank, NA . . . . . . . . . . . . . . . . . . . . . . . . . . . . . USD 397 ZAR 5,624 3/15/19 1,925Morgan Stanley & Co. LLC. . . . . . . . . . . . . . . . . . . . . . . . . . . . . EUR 349 USD 402 3/15/19 4,610Morgan Stanley Capital Services LLC . . . . . . . . . . . . . . . . . . . . USD 710 TWD 21,555 3/14/19 (9,951)Morgan Stanley Capital Services LLC . . . . . . . . . . . . . . . . . . . . AUD 431 USD 311 3/15/19 4,861Morgan Stanley Capital Services LLC . . . . . . . . . . . . . . . . . . . . CHF 150 USD 152 3/15/19 1,647Morgan Stanley Capital Services LLC . . . . . . . . . . . . . . . . . . . . EUR 465 USD 535 3/15/19 4,432Morgan Stanley Capital Services LLC . . . . . . . . . . . . . . . . . . . . JPY 130,697 USD 1,167 3/15/19 (6,411)Morgan Stanley Capital Services LLC . . . . . . . . . . . . . . . . . . . . JPY 18,142 USD 168 3/15/19 4,684Morgan Stanley Capital Services LLC . . . . . . . . . . . . . . . . . . . . SEK 3,130 USD 349 3/15/19 9,521Morgan Stanley Capital Services LLC . . . . . . . . . . . . . . . . . . . . USD 497 EUR 433 3/15/19 (3,058)Morgan Stanley Capital Services LLC . . . . . . . . . . . . . . . . . . . . USD 2,292 JPY 256,680 3/15/19 12,590Morgan Stanley Capital Services LLC . . . . . . . . . . . . . . . . . . . . INR 18,292 USD 255 3/18/19 (2,639)Royal Bank of Scotland PLC. . . . . . . . . . . . . . . . . . . . . . . . . . . . EUR 129 USD 148 3/15/19 1,008Royal Bank of Scotland PLC. . . . . . . . . . . . . . . . . . . . . . . . . . . . PEN 3,006 USD 904 3/15/19 (7,090)Royal Bank of Scotland PLC. . . . . . . . . . . . . . . . . . . . . . . . . . . . USD 221 JPY 24,229 3/15/19 (3,821)Royal Bank of Scotland PLC. . . . . . . . . . . . . . . . . . . . . . . . . . . . INR 8,891 USD 127 3/18/19 1,589Royal Bank of Scotland PLC. . . . . . . . . . . . . . . . . . . . . . . . . . . . JPY 15,225 USD 139 6/17/19 1,461Standard Chartered Bank . . . . . . . . . . . . . . . . . . . . . . . . . . . . . . . USD 581 JPY 63,008 3/15/19 (15,210)Standard Chartered Bank . . . . . . . . . . . . . . . . . . . . . . . . . . . . . . . USD 195 JPY 21,730 3/15/19 272Standard Chartered Bank . . . . . . . . . . . . . . . . . . . . . . . . . . . . . . . USD 231 INR 16,908 3/18/19 7,454Standard Chartered Bank . . . . . . . . . . . . . . . . . . . . . . . . . . . . . . . CNY 17,504 USD 2,576 4/17/19 (35,899)State Street Bank & Trust Co. . . . . . . . . . . . . . . . . . . . . . . . . . . . CHF 984 USD 1,004 3/15/19 16,665State Street Bank & Trust Co. . . . . . . . . . . . . . . . . . . . . . . . . . . . HKD 2,772 USD 355 3/15/19 2,115UBS AG . . . . . . . . . . . . . . . . . . . . . . . . . . . . . . . . . . . . . . . . . . . . JPY 25,524 USD 227 3/15/19 (1,938)
$ 66,964
Appreciation $ 264,235 Depreciation $ (197,271)
+ Used for share class hedging purposes.* Amount less than 0.50.(a) Represents entire or partial securities out on loan. See Note N for securities lending information.(b) Overnight deposit.
Currency Abbreviations:AUD – Australian DollarBRL – Brazilian RealCAD – Canadian DollarCHF – Swiss FrancCNY – Chinese Yuan RenminbiEUR – EuroGBP – Great British PoundHKD – Hong Kong DollarINR – Indian RupeeJPY – Japanese YenKRW – South Korean Won
AB FCP I
34
Portfolio of investments (continued) GlobalEquityBlendPortfolio
MXN – Mexican PesoNOK – Norwegian KronePEN – Peruvian SolRUB – Russian RubleSEK – Swedish KronaTWD – New Taiwan DollarUSD – United States DollarZAR – South African Rand
Glossary:ADR – American Depositary ReceiptREG – Registered Shares
See notes to financial statements.
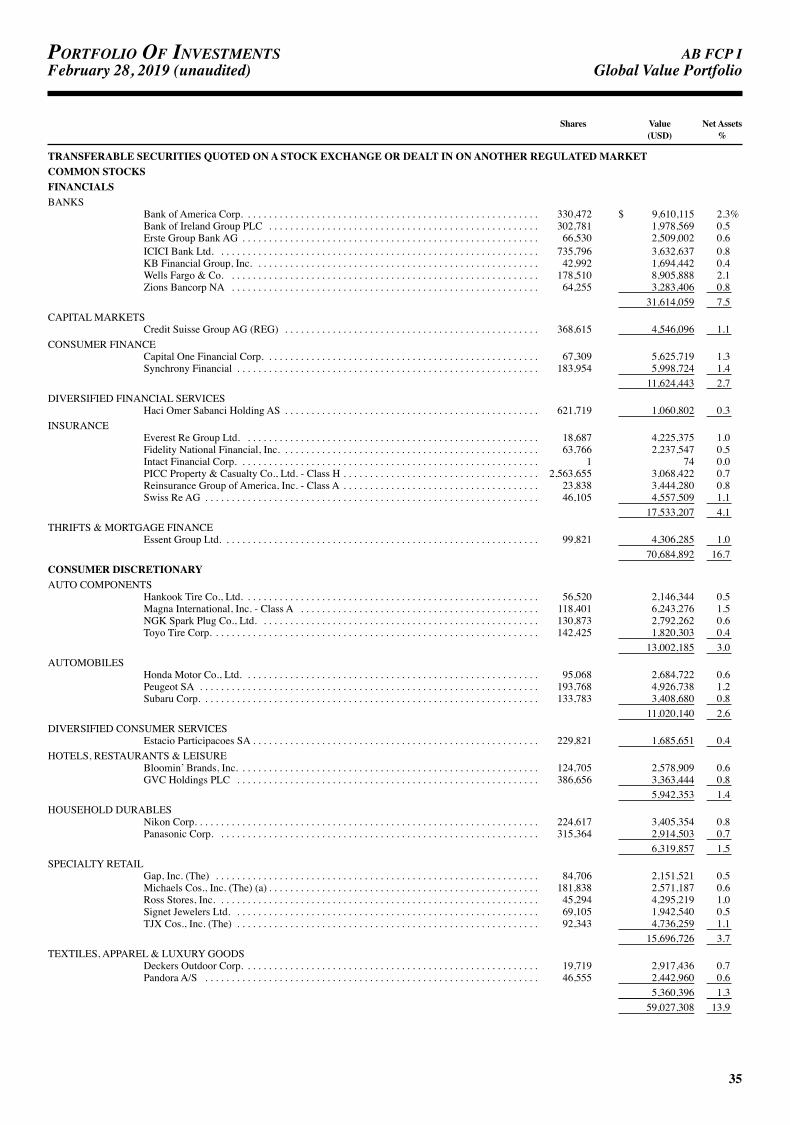
AB FCP I
35
Portfolio of investmentsFebruary28,2019(unaudited) GlobalValuePortfolio
Shares Value Net Assets (USD) %
TRANSFERABLE SECURITIES QUOTED ON A STOCK EXCHANGE OR DEALT IN ON ANOTHER REGULATED MARKETCOMMON STOCKSFINANCIALSBANKS
Bank of America Corp. . . . . . . . . . . . . . . . . . . . . . . . . . . . . . . . . . . . . . . . . . . . . . . . . . . . . . . . 330,472 $ 9,610,115 2.3%Bank of Ireland Group PLC . . . . . . . . . . . . . . . . . . . . . . . . . . . . . . . . . . . . . . . . . . . . . . . . . . . 302,781 1,978,569 0.5Erste Group Bank AG . . . . . . . . . . . . . . . . . . . . . . . . . . . . . . . . . . . . . . . . . . . . . . . . . . . . . . . . 66,530 2,509,002 0.6ICICI Bank Ltd. . . . . . . . . . . . . . . . . . . . . . . . . . . . . . . . . . . . . . . . . . . . . . . . . . . . . . . . . . . . . 735,796 3,632,637 0.8KB Financial Group, Inc. . . . . . . . . . . . . . . . . . . . . . . . . . . . . . . . . . . . . . . . . . . . . . . . . . . . . . 42,992 1,694,442 0.4Wells Fargo & Co. . . . . . . . . . . . . . . . . . . . . . . . . . . . . . . . . . . . . . . . . . . . . . . . . . . . . . . . . . . 178,510 8,905,888 2.1Zions Bancorp NA . . . . . . . . . . . . . . . . . . . . . . . . . . . . . . . . . . . . . . . . . . . . . . . . . . . . . . . . . . 64,255 3,283,406 0.8 31,614,059 7.5
CAPITAL MARKETSCredit Suisse Group AG (REG) . . . . . . . . . . . . . . . . . . . . . . . . . . . . . . . . . . . . . . . . . . . . . . . . 368,615 4,546,096 1.1
CONSUMER FINANCECapital One Financial Corp. . . . . . . . . . . . . . . . . . . . . . . . . . . . . . . . . . . . . . . . . . . . . . . . . . . . 67,309 5,625,719 1.3Synchrony Financial . . . . . . . . . . . . . . . . . . . . . . . . . . . . . . . . . . . . . . . . . . . . . . . . . . . . . . . . . 183,954 5,998,724 1.4 11,624,443 2.7
DIVERSIFIED FINANCIAL SERVICESHaci Omer Sabanci Holding AS . . . . . . . . . . . . . . . . . . . . . . . . . . . . . . . . . . . . . . . . . . . . . . . . 621,719 1,060,802 0.3
INSURANCEEverest Re Group Ltd. . . . . . . . . . . . . . . . . . . . . . . . . . . . . . . . . . . . . . . . . . . . . . . . . . . . . . . . 18,687 4,225,375 1.0Fidelity National Financial, Inc. . . . . . . . . . . . . . . . . . . . . . . . . . . . . . . . . . . . . . . . . . . . . . . . . 63,766 2,237,547 0.5Intact Financial Corp. . . . . . . . . . . . . . . . . . . . . . . . . . . . . . . . . . . . . . . . . . . . . . . . . . . . . . . . . 1 74 0.0PICC Property & Casualty Co., Ltd. - Class H . . . . . . . . . . . . . . . . . . . . . . . . . . . . . . . . . . . . . 2,563,655 3,068,422 0.7Reinsurance Group of America, Inc. - Class A . . . . . . . . . . . . . . . . . . . . . . . . . . . . . . . . . . . . . 23,838 3,444,280 0.8Swiss Re AG . . . . . . . . . . . . . . . . . . . . . . . . . . . . . . . . . . . . . . . . . . . . . . . . . . . . . . . . . . . . . . . 46,105 4,557,509 1.1 17,533,207 4.1
THRIFTS & MORTGAGE FINANCEEssent Group Ltd. . . . . . . . . . . . . . . . . . . . . . . . . . . . . . . . . . . . . . . . . . . . . . . . . . . . . . . . . . . . 99,821 4,306,285 1.0 70,684,892 16.7
CONSUMER DISCRETIONARYAUTO COMPONENTS
Hankook Tire Co., Ltd. . . . . . . . . . . . . . . . . . . . . . . . . . . . . . . . . . . . . . . . . . . . . . . . . . . . . . . . 56,520 2,146,344 0.5Magna International, Inc. - Class A . . . . . . . . . . . . . . . . . . . . . . . . . . . . . . . . . . . . . . . . . . . . . 118,401 6,243,276 1.5NGK Spark Plug Co., Ltd. . . . . . . . . . . . . . . . . . . . . . . . . . . . . . . . . . . . . . . . . . . . . . . . . . . . . 130,873 2,792,262 0.6Toyo Tire Corp. . . . . . . . . . . . . . . . . . . . . . . . . . . . . . . . . . . . . . . . . . . . . . . . . . . . . . . . . . . . . . 142,425 1,820,303 0.4 13,002,185 3.0
AUTOMOBILESHonda Motor Co., Ltd. . . . . . . . . . . . . . . . . . . . . . . . . . . . . . . . . . . . . . . . . . . . . . . . . . . . . . . . 95,068 2,684,722 0.6Peugeot SA . . . . . . . . . . . . . . . . . . . . . . . . . . . . . . . . . . . . . . . . . . . . . . . . . . . . . . . . . . . . . . . . 193,768 4,926,738 1.2Subaru Corp. . . . . . . . . . . . . . . . . . . . . . . . . . . . . . . . . . . . . . . . . . . . . . . . . . . . . . . . . . . . . . . . 133,783 3,408,680 0.8 11,020,140 2.6
DIVERSIFIED CONSUMER SERVICESEstacio Participacoes SA . . . . . . . . . . . . . . . . . . . . . . . . . . . . . . . . . . . . . . . . . . . . . . . . . . . . . . 229,821 1,685,651 0.4
HOTELS, RESTAURANTS & LEISUREBloomin’ Brands, Inc. . . . . . . . . . . . . . . . . . . . . . . . . . . . . . . . . . . . . . . . . . . . . . . . . . . . . . . . . 124,705 2,578,909 0.6GVC Holdings PLC . . . . . . . . . . . . . . . . . . . . . . . . . . . . . . . . . . . . . . . . . . . . . . . . . . . . . . . . . 386,656 3,363,444 0.8 5,942,353 1.4
HOUSEHOLD DURABLESNikon Corp. . . . . . . . . . . . . . . . . . . . . . . . . . . . . . . . . . . . . . . . . . . . . . . . . . . . . . . . . . . . . . . . . 224,617 3,405,354 0.8Panasonic Corp. . . . . . . . . . . . . . . . . . . . . . . . . . . . . . . . . . . . . . . . . . . . . . . . . . . . . . . . . . . . . 315,364 2,914,503 0.7 6,319,857 1.5
SPECIALTY RETAILGap, Inc. (The) . . . . . . . . . . . . . . . . . . . . . . . . . . . . . . . . . . . . . . . . . . . . . . . . . . . . . . . . . . . . . 84,706 2,151,521 0.5Michaels Cos., Inc. (The) (a) . . . . . . . . . . . . . . . . . . . . . . . . . . . . . . . . . . . . . . . . . . . . . . . . . . . 181,838 2,571,187 0.6Ross Stores, Inc. . . . . . . . . . . . . . . . . . . . . . . . . . . . . . . . . . . . . . . . . . . . . . . . . . . . . . . . . . . . . 45,294 4,295,219 1.0Signet Jewelers Ltd. . . . . . . . . . . . . . . . . . . . . . . . . . . . . . . . . . . . . . . . . . . . . . . . . . . . . . . . . . 69,105 1,942,540 0.5TJX Cos., Inc. (The) . . . . . . . . . . . . . . . . . . . . . . . . . . . . . . . . . . . . . . . . . . . . . . . . . . . . . . . . . 92,343 4,736,259 1.1 15,696,726 3.7
TEXTILES, APPAREL & LUXURY GOODSDeckers Outdoor Corp. . . . . . . . . . . . . . . . . . . . . . . . . . . . . . . . . . . . . . . . . . . . . . . . . . . . . . . . 19,719 2,917,436 0.7Pandora A/S . . . . . . . . . . . . . . . . . . . . . . . . . . . . . . . . . . . . . . . . . . . . . . . . . . . . . . . . . . . . . . . 46,555 2,442,960 0.6 5,360,396 1.3 59,027,308 13.9
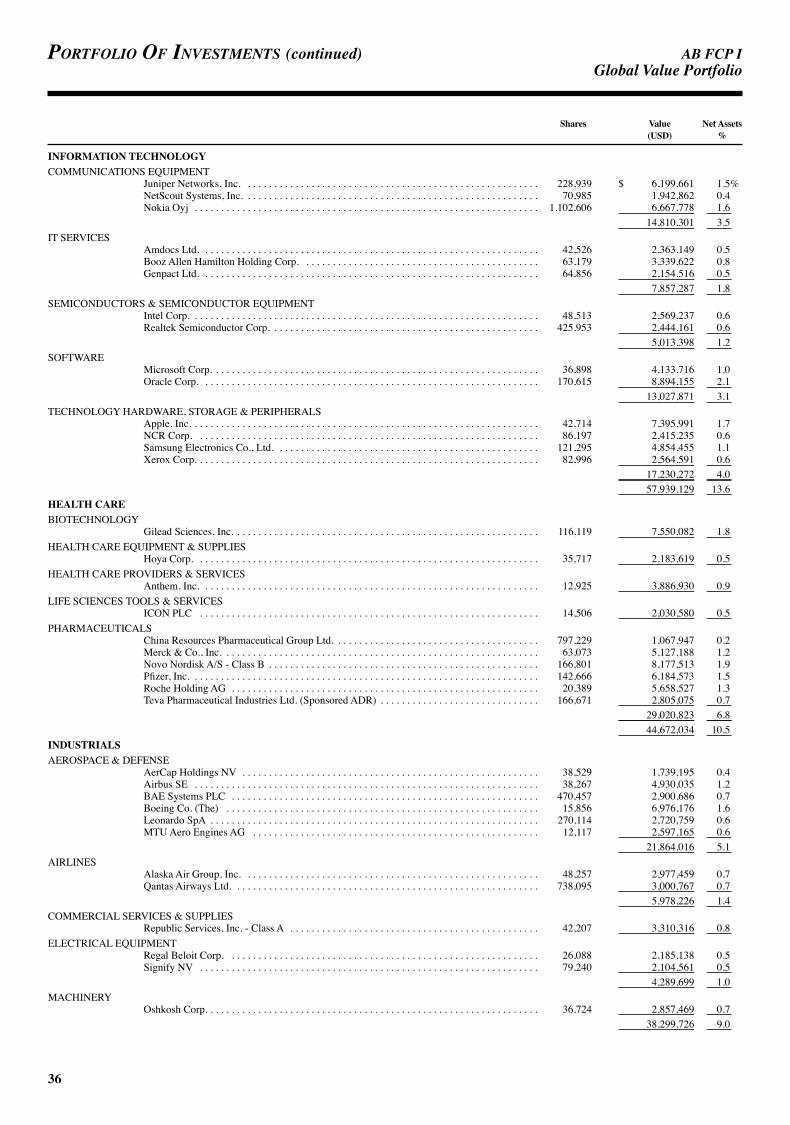
AB FCP I
36
Portfolio of investments (continued) GlobalValuePortfolio
Shares Value Net Assets (USD) %
INFORMATION TECHNOLOGYCOMMUNICATIONS EQUIPMENT
Juniper Networks, Inc. . . . . . . . . . . . . . . . . . . . . . . . . . . . . . . . . . . . . . . . . . . . . . . . . . . . . . . . 228,939 $ 6,199,661 1.5%NetScout Systems, Inc. . . . . . . . . . . . . . . . . . . . . . . . . . . . . . . . . . . . . . . . . . . . . . . . . . . . . . . . 70,985 1,942,862 0.4Nokia Oyj . . . . . . . . . . . . . . . . . . . . . . . . . . . . . . . . . . . . . . . . . . . . . . . . . . . . . . . . . . . . . . . . . 1,102,606 6,667,778 1.6 14,810,301 3.5
IT SERVICESAmdocs Ltd. . . . . . . . . . . . . . . . . . . . . . . . . . . . . . . . . . . . . . . . . . . . . . . . . . . . . . . . . . . . . . . . 42,526 2,363,149 0.5Booz Allen Hamilton Holding Corp. . . . . . . . . . . . . . . . . . . . . . . . . . . . . . . . . . . . . . . . . . . . . 63,179 3,339,622 0.8Genpact Ltd. . . . . . . . . . . . . . . . . . . . . . . . . . . . . . . . . . . . . . . . . . . . . . . . . . . . . . . . . . . . . . . . 64,856 2,154,516 0.5 7,857,287 1.8
SEMICONDUCTORS & SEMICONDUCTOR EQUIPMENTIntel Corp. . . . . . . . . . . . . . . . . . . . . . . . . . . . . . . . . . . . . . . . . . . . . . . . . . . . . . . . . . . . . . . . . . 48,513 2,569,237 0.6Realtek Semiconductor Corp. . . . . . . . . . . . . . . . . . . . . . . . . . . . . . . . . . . . . . . . . . . . . . . . . . . 425,953 2,444,161 0.6 5,013,398 1.2
SOFTWAREMicrosoft Corp. . . . . . . . . . . . . . . . . . . . . . . . . . . . . . . . . . . . . . . . . . . . . . . . . . . . . . . . . . . . . . 36,898 4,133,716 1.0Oracle Corp. . . . . . . . . . . . . . . . . . . . . . . . . . . . . . . . . . . . . . . . . . . . . . . . . . . . . . . . . . . . . . . . 170,615 8,894,155 2.1 13,027,871 3.1
TECHNOLOGY HARDWARE, STORAGE & PERIPHERALSApple, Inc. . . . . . . . . . . . . . . . . . . . . . . . . . . . . . . . . . . . . . . . . . . . . . . . . . . . . . . . . . . . . . . . . . 42,714 7,395,991 1.7NCR Corp. . . . . . . . . . . . . . . . . . . . . . . . . . . . . . . . . . . . . . . . . . . . . . . . . . . . . . . . . . . . . . . . . 86,197 2,415,235 0.6Samsung Electronics Co., Ltd. . . . . . . . . . . . . . . . . . . . . . . . . . . . . . . . . . . . . . . . . . . . . . . . . . 121,295 4,854,455 1.1Xerox Corp. . . . . . . . . . . . . . . . . . . . . . . . . . . . . . . . . . . . . . . . . . . . . . . . . . . . . . . . . . . . . . . . . 82,996 2,564,591 0.6 17,230,272 4.0 57,939,129 13.6
HEALTH CAREBIOTECHNOLOGY
Gilead Sciences, Inc. . . . . . . . . . . . . . . . . . . . . . . . . . . . . . . . . . . . . . . . . . . . . . . . . . . . . . . . . . 116,119 7,550,082 1.8HEALTH CARE EQUIPMENT & SUPPLIES
Hoya Corp. . . . . . . . . . . . . . . . . . . . . . . . . . . . . . . . . . . . . . . . . . . . . . . . . . . . . . . . . . . . . . . . . 35,717 2,183,619 0.5HEALTH CARE PROVIDERS & SERVICES
Anthem, Inc. . . . . . . . . . . . . . . . . . . . . . . . . . . . . . . . . . . . . . . . . . . . . . . . . . . . . . . . . . . . . . . . 12,925 3,886,930 0.9LIFE SCIENCES TOOLS & SERVICES
ICON PLC . . . . . . . . . . . . . . . . . . . . . . . . . . . . . . . . . . . . . . . . . . . . . . . . . . . . . . . . . . . . . . . . 14,506 2,030,580 0.5PHARMACEUTICALS
China Resources Pharmaceutical Group Ltd. . . . . . . . . . . . . . . . . . . . . . . . . . . . . . . . . . . . . . . 797,229 1,067,947 0.2Merck & Co., Inc. . . . . . . . . . . . . . . . . . . . . . . . . . . . . . . . . . . . . . . . . . . . . . . . . . . . . . . . . . . . 63,073 5,127,188 1.2Novo Nordisk A/S - Class B . . . . . . . . . . . . . . . . . . . . . . . . . . . . . . . . . . . . . . . . . . . . . . . . . . . 166,801 8,177,513 1.9Pfizer, Inc. . . . . . . . . . . . . . . . . . . . . . . . . . . . . . . . . . . . . . . . . . . . . . . . . . . . . . . . . . . . . . . . . . 142,666 6,184,573 1.5Roche Holding AG . . . . . . . . . . . . . . . . . . . . . . . . . . . . . . . . . . . . . . . . . . . . . . . . . . . . . . . . . . 20,389 5,658,527 1.3Teva Pharmaceutical Industries Ltd. (Sponsored ADR) . . . . . . . . . . . . . . . . . . . . . . . . . . . . . . 166,671 2,805,075 0.7 29,020,823 6.8 44,672,034 10.5
INDUSTRIALSAEROSPACE & DEFENSE
AerCap Holdings NV . . . . . . . . . . . . . . . . . . . . . . . . . . . . . . . . . . . . . . . . . . . . . . . . . . . . . . . . 38,529 1,739,195 0.4Airbus SE . . . . . . . . . . . . . . . . . . . . . . . . . . . . . . . . . . . . . . . . . . . . . . . . . . . . . . . . . . . . . . . . . 38,267 4,930,035 1.2BAE Systems PLC . . . . . . . . . . . . . . . . . . . . . . . . . . . . . . . . . . . . . . . . . . . . . . . . . . . . . . . . . . 470,457 2,900,686 0.7Boeing Co. (The) . . . . . . . . . . . . . . . . . . . . . . . . . . . . . . . . . . . . . . . . . . . . . . . . . . . . . . . . . . . 15,856 6,976,176 1.6Leonardo SpA . . . . . . . . . . . . . . . . . . . . . . . . . . . . . . . . . . . . . . . . . . . . . . . . . . . . . . . . . . . . . . 270,114 2,720,759 0.6MTU Aero Engines AG . . . . . . . . . . . . . . . . . . . . . . . . . . . . . . . . . . . . . . . . . . . . . . . . . . . . . . 12,117 2,597,165 0.6 21,864,016 5.1
AIRLINESAlaska Air Group, Inc. . . . . . . . . . . . . . . . . . . . . . . . . . . . . . . . . . . . . . . . . . . . . . . . . . . . . . . . 48,257 2,977,459 0.7Qantas Airways Ltd. . . . . . . . . . . . . . . . . . . . . . . . . . . . . . . . . . . . . . . . . . . . . . . . . . . . . . . . . . 738,095 3,000,767 0.7 5,978,226 1.4
COMMERCIAL SERVICES & SUPPLIESRepublic Services, Inc. - Class A . . . . . . . . . . . . . . . . . . . . . . . . . . . . . . . . . . . . . . . . . . . . . . . 42,207 3,310,316 0.8
ELECTRICAL EQUIPMENTRegal Beloit Corp. . . . . . . . . . . . . . . . . . . . . . . . . . . . . . . . . . . . . . . . . . . . . . . . . . . . . . . . . . . 26,088 2,185,138 0.5Signify NV . . . . . . . . . . . . . . . . . . . . . . . . . . . . . . . . . . . . . . . . . . . . . . . . . . . . . . . . . . . . . . . . 79,240 2,104,561 0.5 4,289,699 1.0
MACHINERYOshkosh Corp. . . . . . . . . . . . . . . . . . . . . . . . . . . . . . . . . . . . . . . . . . . . . . . . . . . . . . . . . . . . . . . 36,724 2,857,469 0.7 38,299,726 9.0

AB FCP I
37
GlobalValuePortfolio
Shares Value Net Assets (USD) %
COMMUNICATION SERVICESDIVERSIFIED TELECOMMUNICATION SERVICES
China Unicom Hong Kong Ltd. . . . . . . . . . . . . . . . . . . . . . . . . . . . . . . . . . . . . . . . . . . . . . . . . 3,659,845 $ 4,324,013 1.0%Nippon Telegraph & Telephone Corp. . . . . . . . . . . . . . . . . . . . . . . . . . . . . . . . . . . . . . . . . . . . 93,392 4,036,659 1.0 8,360,672 2.0
ENTERTAINMENTNintendo Co., Ltd. . . . . . . . . . . . . . . . . . . . . . . . . . . . . . . . . . . . . . . . . . . . . . . . . . . . . . . . . . . 10,847 2,974,742 0.7
INTERACTIVE MEDIA & SERVICESAlphabet, Inc. - Class A . . . . . . . . . . . . . . . . . . . . . . . . . . . . . . . . . . . . . . . . . . . . . . . . . . . . . . 4,295 4,838,314 1.1Yahoo Japan Corp. . . . . . . . . . . . . . . . . . . . . . . . . . . . . . . . . . . . . . . . . . . . . . . . . . . . . . . . . . . 810,193 2,171,008 0.5 7,009,322 1.6
MEDIAComcast Corp. - Class A . . . . . . . . . . . . . . . . . . . . . . . . . . . . . . . . . . . . . . . . . . . . . . . . . . . . . . 203,485 7,868,754 1.9
WIRELESS TELECOMMUNICATION SERVICEST-Mobile US, Inc. . . . . . . . . . . . . . . . . . . . . . . . . . . . . . . . . . . . . . . . . . . . . . . . . . . . . . . . . . . . 113,199 8,174,131 1.9 34,387,621 8.1
CONSUMER STAPLESBEVERAGES
Coca-Cola Bottlers Japan Holdings, Inc. . . . . . . . . . . . . . . . . . . . . . . . . . . . . . . . . . . . . . . . . . 81,928 2,114,182 0.5Diageo PLC . . . . . . . . . . . . . . . . . . . . . . . . . . . . . . . . . . . . . . . . . . . . . . . . . . . . . . . . . . . . . . . . 84,820 3,284,597 0.8 5,398,779 1.3
FOOD & STAPLES RETAILINGKoninklijke Ahold Delhaize NV . . . . . . . . . . . . . . . . . . . . . . . . . . . . . . . . . . . . . . . . . . . . . . . . 162,374 4,184,731 1.0US Foods Holding Corp. . . . . . . . . . . . . . . . . . . . . . . . . . . . . . . . . . . . . . . . . . . . . . . . . . . . . . . 107,370 3,783,724 0.9Walmart, Inc. . . . . . . . . . . . . . . . . . . . . . . . . . . . . . . . . . . . . . . . . . . . . . . . . . . . . . . . . . . . . . . . 36,122 3,575,739 0.8 11,544,194 2.7
HOUSEHOLD PRODUCTSHenkel AG & Co. KGaA (Preference Shares) . . . . . . . . . . . . . . . . . . . . . . . . . . . . . . . . . . . . . 25,450 2,543,173 0.6
TOBACCOBritish American Tobacco PLC . . . . . . . . . . . . . . . . . . . . . . . . . . . . . . . . . . . . . . . . . . . . . . . . 92,057 3,375,098 0.8Japan Tobacco, Inc. . . . . . . . . . . . . . . . . . . . . . . . . . . . . . . . . . . . . . . . . . . . . . . . . . . . . . . . . . . 116,939 2,978,194 0.7Philip Morris International, Inc. . . . . . . . . . . . . . . . . . . . . . . . . . . . . . . . . . . . . . . . . . . . . . . . . 83,289 7,241,167 1.7 13,594,459 3.2 33,080,605 7.8
ENERGYOIL, GAS & CONSUMABLE FUELS
China Petroleum & Chemical Corp. - Class H . . . . . . . . . . . . . . . . . . . . . . . . . . . . . . . . . . . . . 2,202,962 1,898,990 0.4JXTG Holdings, Inc. . . . . . . . . . . . . . . . . . . . . . . . . . . . . . . . . . . . . . . . . . . . . . . . . . . . . . . . . . 764,775 3,572,743 0.8PetroChina Co., Ltd. - Class H . . . . . . . . . . . . . . . . . . . . . . . . . . . . . . . . . . . . . . . . . . . . . . . . . 6,321,390 4,181,100 1.0Petroleo Brasileiro SA (Preference Shares) . . . . . . . . . . . . . . . . . . . . . . . . . . . . . . . . . . . . . . . 287,584 2,071,811 0.5Repsol SA . . . . . . . . . . . . . . . . . . . . . . . . . . . . . . . . . . . . . . . . . . . . . . . . . . . . . . . . . . . . . . . . . 383,269 6,595,983 1.6Royal Dutch Shell PLC - Class A . . . . . . . . . . . . . . . . . . . . . . . . . . . . . . . . . . . . . . . . . . . . . . . 224,900 7,007,166 1.7Royal Dutch Shell PLC - Class A (London) . . . . . . . . . . . . . . . . . . . . . . . . . . . . . . . . . . . . . . . 112,973 3,521,590 0.8 28,849,383 6.8
MATERIALSCHEMICALS
Johnson Matthey PLC . . . . . . . . . . . . . . . . . . . . . . . . . . . . . . . . . . . . . . . . . . . . . . . . . . . . . . . . 76,900 3,155,671 0.7Mosaic Co. (The) . . . . . . . . . . . . . . . . . . . . . . . . . . . . . . . . . . . . . . . . . . . . . . . . . . . . . . . . . . . 155,574 4,864,808 1.2Tosoh Corp. . . . . . . . . . . . . . . . . . . . . . . . . . . . . . . . . . . . . . . . . . . . . . . . . . . . . . . . . . . . . . . . . 156,359 2,311,835 0.6Trinseo SA . . . . . . . . . . . . . . . . . . . . . . . . . . . . . . . . . . . . . . . . . . . . . . . . . . . . . . . . . . . . . . . . . 36,870 1,850,509 0.4Westlake Chemical Corp. . . . . . . . . . . . . . . . . . . . . . . . . . . . . . . . . . . . . . . . . . . . . . . . . . . . . . 26,351 1,841,136 0.4 14,023,959 3.3
CONSTRUCTION MATERIALSBuzzi Unicem SpA . . . . . . . . . . . . . . . . . . . . . . . . . . . . . . . . . . . . . . . . . . . . . . . . . . . . . . . . . . 89,679 1,752,832 0.4
METALS & MININGAlcoa Corp. . . . . . . . . . . . . . . . . . . . . . . . . . . . . . . . . . . . . . . . . . . . . . . . . . . . . . . . . . . . . . . . . 106,718 3,148,168 0.7BlueScope Steel Ltd. . . . . . . . . . . . . . . . . . . . . . . . . . . . . . . . . . . . . . . . . . . . . . . . . . . . . . . . . . 141,539 1,345,483 0.3First Quantum Minerals Ltd. . . . . . . . . . . . . . . . . . . . . . . . . . . . . . . . . . . . . . . . . . . . . . . . . . . . 165,539 1,898,233 0.5Newcrest Mining Ltd. . . . . . . . . . . . . . . . . . . . . . . . . . . . . . . . . . . . . . . . . . . . . . . . . . . . . . . . . 153,996 2,648,350 0.6South32 Ltd. . . . . . . . . . . . . . . . . . . . . . . . . . . . . . . . . . . . . . . . . . . . . . . . . . . . . . . . . . . . . . . . 1,335,882 3,734,333 0.9 12,774,567 3.0 28,551,358 6.7
REAL ESTATEEQUITY REAL ESTATE INVESTMENT TRUSTS (REITS)
Empire State Realty Trust, Inc. - Class A . . . . . . . . . . . . . . . . . . . . . . . . . . . . . . . . . . . . . . . . . 112,444 1,711,392 0.4Medical Properties Trust, Inc. . . . . . . . . . . . . . . . . . . . . . . . . . . . . . . . . . . . . . . . . . . . . . . . . . . 229,168 4,177,733 1.0Mid-America Apartment Communities, Inc. . . . . . . . . . . . . . . . . . . . . . . . . . . . . . . . . . . . . . . 30,099 3,117,646 0.7
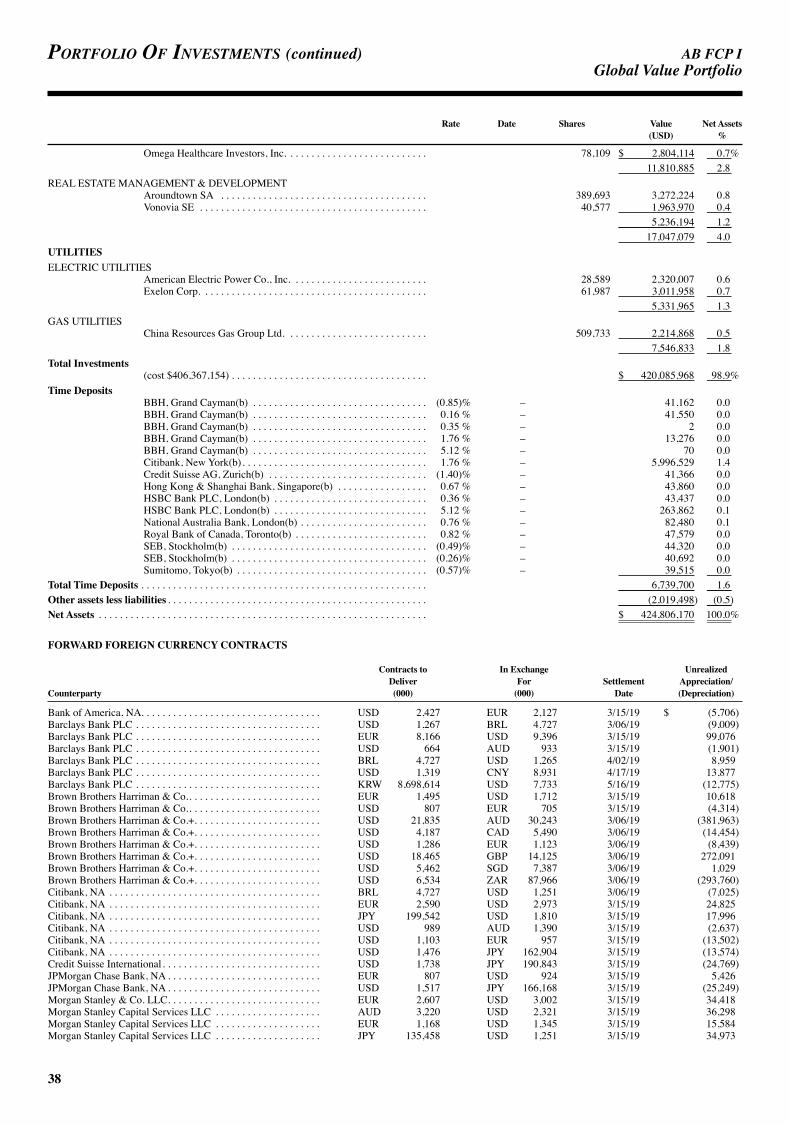
AB FCP I
38
Portfolio of investments (continued) GlobalValuePortfolio
Rate Date Shares Value Net Assets (USD) %
Omega Healthcare Investors, Inc. . . . . . . . . . . . . . . . . . . . . . . . . . . 78,109 $ 2,804,114 0.7% 11,810,885 2.8
REAL ESTATE MANAGEMENT & DEVELOPMENTAroundtown SA . . . . . . . . . . . . . . . . . . . . . . . . . . . . . . . . . . . . . . . 389,693 3,272,224 0.8Vonovia SE . . . . . . . . . . . . . . . . . . . . . . . . . . . . . . . . . . . . . . . . . . . 40,577 1,963,970 0.4 5,236,194 1.2 17,047,079 4.0
UTILITIESELECTRIC UTILITIES
American Electric Power Co., Inc. . . . . . . . . . . . . . . . . . . . . . . . . . 28,589 2,320,007 0.6Exelon Corp. . . . . . . . . . . . . . . . . . . . . . . . . . . . . . . . . . . . . . . . . . . 61,987 3,011,958 0.7 5,331,965 1.3
GAS UTILITIESChina Resources Gas Group Ltd. . . . . . . . . . . . . . . . . . . . . . . . . . . 509,733 2,214,868 0.5 7,546,833 1.8
Total Investments(cost $406,367,154) . . . . . . . . . . . . . . . . . . . . . . . . . . . . . . . . . . . . . $ 420,085,968 98.9%
Time DepositsBBH, Grand Cayman(b) . . . . . . . . . . . . . . . . . . . . . . . . . . . . . . . . . (0.85)% – 41,162 0.0BBH, Grand Cayman(b) . . . . . . . . . . . . . . . . . . . . . . . . . . . . . . . . . 0.16 % – 41,550 0.0BBH, Grand Cayman(b) . . . . . . . . . . . . . . . . . . . . . . . . . . . . . . . . . 0.35 % – 2 0.0BBH, Grand Cayman(b) . . . . . . . . . . . . . . . . . . . . . . . . . . . . . . . . . 1.76 % – 13,276 0.0BBH, Grand Cayman(b) . . . . . . . . . . . . . . . . . . . . . . . . . . . . . . . . . 5.12 % – 70 0.0Citibank, New York(b). . . . . . . . . . . . . . . . . . . . . . . . . . . . . . . . . . . 1.76 % – 5,996,529 1.4Credit Suisse AG, Zurich(b) . . . . . . . . . . . . . . . . . . . . . . . . . . . . . . (1.40)% – 41,366 0.0Hong Kong & Shanghai Bank, Singapore(b) . . . . . . . . . . . . . . . . . 0.67 % – 43,860 0.0HSBC Bank PLC, London(b) . . . . . . . . . . . . . . . . . . . . . . . . . . . . . 0.36 % – 43,437 0.0HSBC Bank PLC, London(b) . . . . . . . . . . . . . . . . . . . . . . . . . . . . . 5.12 % – 263,862 0.1National Australia Bank, London(b) . . . . . . . . . . . . . . . . . . . . . . . . 0.76 % – 82,480 0.1Royal Bank of Canada, Toronto(b) . . . . . . . . . . . . . . . . . . . . . . . . . 0.82 % – 47,579 0.0SEB, Stockholm(b) . . . . . . . . . . . . . . . . . . . . . . . . . . . . . . . . . . . . . (0.49)% – 44,320 0.0SEB, Stockholm(b) . . . . . . . . . . . . . . . . . . . . . . . . . . . . . . . . . . . . . (0.26)% – 40,692 0.0Sumitomo, Tokyo(b) . . . . . . . . . . . . . . . . . . . . . . . . . . . . . . . . . . . . (0.57)% – 39,515 0.0
Total Time Deposits . . . . . . . . . . . . . . . . . . . . . . . . . . . . . . . . . . . . . . . . . . . . . . . . . . . . . . 6,739,700 1.6Other assets less liabilities . . . . . . . . . . . . . . . . . . . . . . . . . . . . . . . . . . . . . . . . . . . . . . . . . (2,019,498) (0.5)Net Assets . . . . . . . . . . . . . . . . . . . . . . . . . . . . . . . . . . . . . . . . . . . . . . . . . . . . . . . . . . . . . . $ 424,806,170 100.0%
FORWARD FOREIGN CURRENCY CONTRACTS
Contracts to In Exchange Unrealized Deliver For Settlement Appreciation/ Counterparty (000) (000) Date (Depreciation)
Bank of America, NA. . . . . . . . . . . . . . . . . . . . . . . . . . . . . . . . . . USD 2,427 EUR 2,127 3/15/19 $ (5,706)Barclays Bank PLC . . . . . . . . . . . . . . . . . . . . . . . . . . . . . . . . . . . USD 1,267 BRL 4,727 3/06/19 (9,009)Barclays Bank PLC . . . . . . . . . . . . . . . . . . . . . . . . . . . . . . . . . . . EUR 8,166 USD 9,396 3/15/19 99,076Barclays Bank PLC . . . . . . . . . . . . . . . . . . . . . . . . . . . . . . . . . . . USD 664 AUD 933 3/15/19 (1,901)Barclays Bank PLC . . . . . . . . . . . . . . . . . . . . . . . . . . . . . . . . . . . BRL 4,727 USD 1,265 4/02/19 8,959Barclays Bank PLC . . . . . . . . . . . . . . . . . . . . . . . . . . . . . . . . . . . USD 1,319 CNY 8,931 4/17/19 13,877Barclays Bank PLC . . . . . . . . . . . . . . . . . . . . . . . . . . . . . . . . . . . KRW 8,698,614 USD 7,733 5/16/19 (12,775)Brown Brothers Harriman & Co.. . . . . . . . . . . . . . . . . . . . . . . . . EUR 1,495 USD 1,712 3/15/19 10,618Brown Brothers Harriman & Co.. . . . . . . . . . . . . . . . . . . . . . . . . USD 807 EUR 705 3/15/19 (4,314)Brown Brothers Harriman & Co.+. . . . . . . . . . . . . . . . . . . . . . . . USD 21,835 AUD 30,243 3/06/19 (381,963)Brown Brothers Harriman & Co.+. . . . . . . . . . . . . . . . . . . . . . . . USD 4,187 CAD 5,490 3/06/19 (14,454)Brown Brothers Harriman & Co.+. . . . . . . . . . . . . . . . . . . . . . . . USD 1,286 EUR 1,123 3/06/19 (8,439)Brown Brothers Harriman & Co.+. . . . . . . . . . . . . . . . . . . . . . . . USD 18,465 GBP 14,125 3/06/19 272,091Brown Brothers Harriman & Co.+. . . . . . . . . . . . . . . . . . . . . . . . USD 5,462 SGD 7,387 3/06/19 1,029Brown Brothers Harriman & Co.+. . . . . . . . . . . . . . . . . . . . . . . . USD 6,534 ZAR 87,966 3/06/19 (293,760)Citibank, NA . . . . . . . . . . . . . . . . . . . . . . . . . . . . . . . . . . . . . . . . BRL 4,727 USD 1,251 3/06/19 (7,025)Citibank, NA . . . . . . . . . . . . . . . . . . . . . . . . . . . . . . . . . . . . . . . . EUR 2,590 USD 2,973 3/15/19 24,825Citibank, NA . . . . . . . . . . . . . . . . . . . . . . . . . . . . . . . . . . . . . . . . JPY 199,542 USD 1,810 3/15/19 17,996Citibank, NA . . . . . . . . . . . . . . . . . . . . . . . . . . . . . . . . . . . . . . . . USD 989 AUD 1,390 3/15/19 (2,637)Citibank, NA . . . . . . . . . . . . . . . . . . . . . . . . . . . . . . . . . . . . . . . . USD 1,103 EUR 957 3/15/19 (13,502)Citibank, NA . . . . . . . . . . . . . . . . . . . . . . . . . . . . . . . . . . . . . . . . USD 1,476 JPY 162,904 3/15/19 (13,574)Credit Suisse International. . . . . . . . . . . . . . . . . . . . . . . . . . . . . . USD 1,738 JPY 190,843 3/15/19 (24,769)JPMorgan Chase Bank, NA . . . . . . . . . . . . . . . . . . . . . . . . . . . . . EUR 807 USD 924 3/15/19 5,426JPMorgan Chase Bank, NA . . . . . . . . . . . . . . . . . . . . . . . . . . . . . USD 1,517 JPY 166,168 3/15/19 (25,249)Morgan Stanley & Co. LLC. . . . . . . . . . . . . . . . . . . . . . . . . . . . . EUR 2,607 USD 3,002 3/15/19 34,418Morgan Stanley Capital Services LLC . . . . . . . . . . . . . . . . . . . . AUD 3,220 USD 2,321 3/15/19 36,298Morgan Stanley Capital Services LLC . . . . . . . . . . . . . . . . . . . . EUR 1,168 USD 1,345 3/15/19 15,584Morgan Stanley Capital Services LLC . . . . . . . . . . . . . . . . . . . . JPY 135,458 USD 1,251 3/15/19 34,973
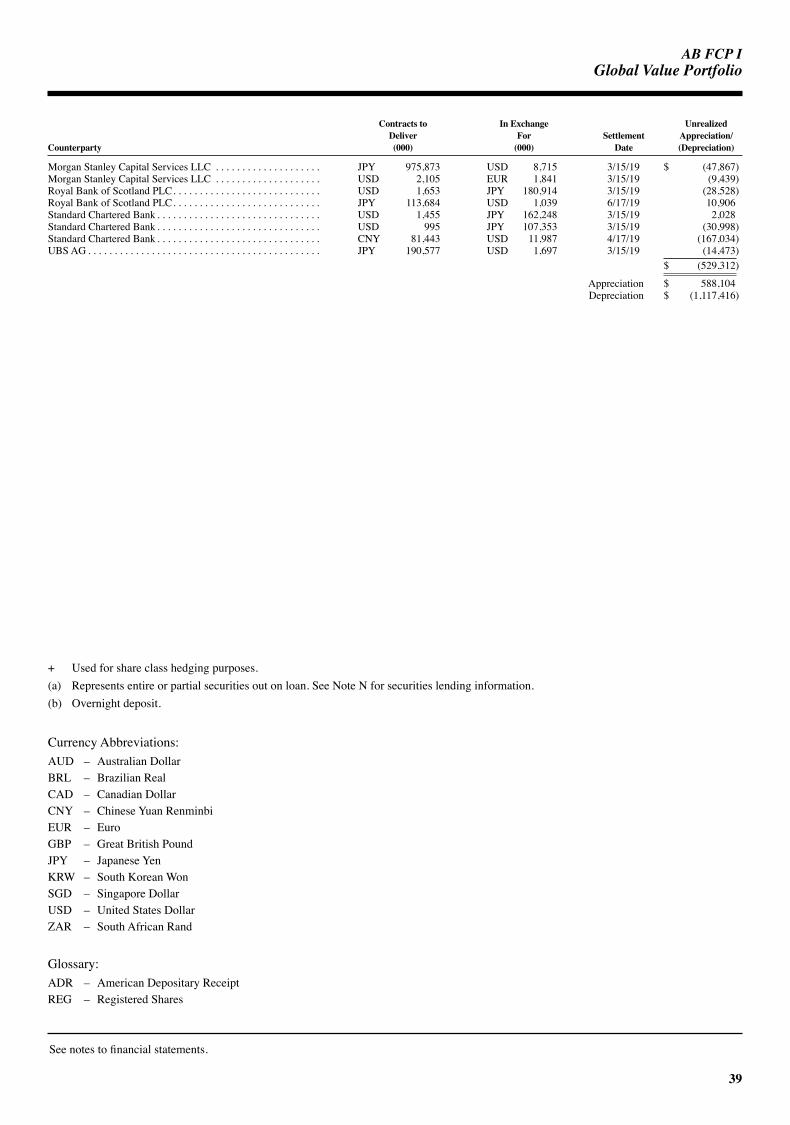
AB FCP I
39
GlobalValuePortfolio
Contracts to In Exchange Unrealized Deliver For Settlement Appreciation/ Counterparty (000) (000) Date (Depreciation)
Morgan Stanley Capital Services LLC . . . . . . . . . . . . . . . . . . . . JPY 975,873 USD 8,715 3/15/19 $ (47,867)Morgan Stanley Capital Services LLC . . . . . . . . . . . . . . . . . . . . USD 2,105 EUR 1,841 3/15/19 (9,439)Royal Bank of Scotland PLC. . . . . . . . . . . . . . . . . . . . . . . . . . . . USD 1,653 JPY 180,914 3/15/19 (28,528)Royal Bank of Scotland PLC. . . . . . . . . . . . . . . . . . . . . . . . . . . . JPY 113,684 USD 1,039 6/17/19 10,906Standard Chartered Bank . . . . . . . . . . . . . . . . . . . . . . . . . . . . . . . USD 1,455 JPY 162,248 3/15/19 2,028Standard Chartered Bank . . . . . . . . . . . . . . . . . . . . . . . . . . . . . . . USD 995 JPY 107,353 3/15/19 (30,998)Standard Chartered Bank . . . . . . . . . . . . . . . . . . . . . . . . . . . . . . . CNY 81,443 USD 11,987 4/17/19 (167,034)UBS AG . . . . . . . . . . . . . . . . . . . . . . . . . . . . . . . . . . . . . . . . . . . . JPY 190,577 USD 1,697 3/15/19 (14,473)
$ (529,312)
Appreciation $ 588,104 Depreciation $ (1,117,416)
+ Used for share class hedging purposes.(a) Represents entire or partial securities out on loan. See Note N for securities lending information.(b) Overnight deposit.
Currency Abbreviations:AUD – Australian DollarBRL – Brazilian RealCAD – Canadian DollarCNY – Chinese Yuan RenminbiEUR – EuroGBP – Great British PoundJPY – Japanese YenKRW – South Korean WonSGD – Singapore DollarUSD – United States DollarZAR – South African Rand
Glossary:ADR – American Depositary ReceiptREG – Registered Shares
See notes to financial statements.
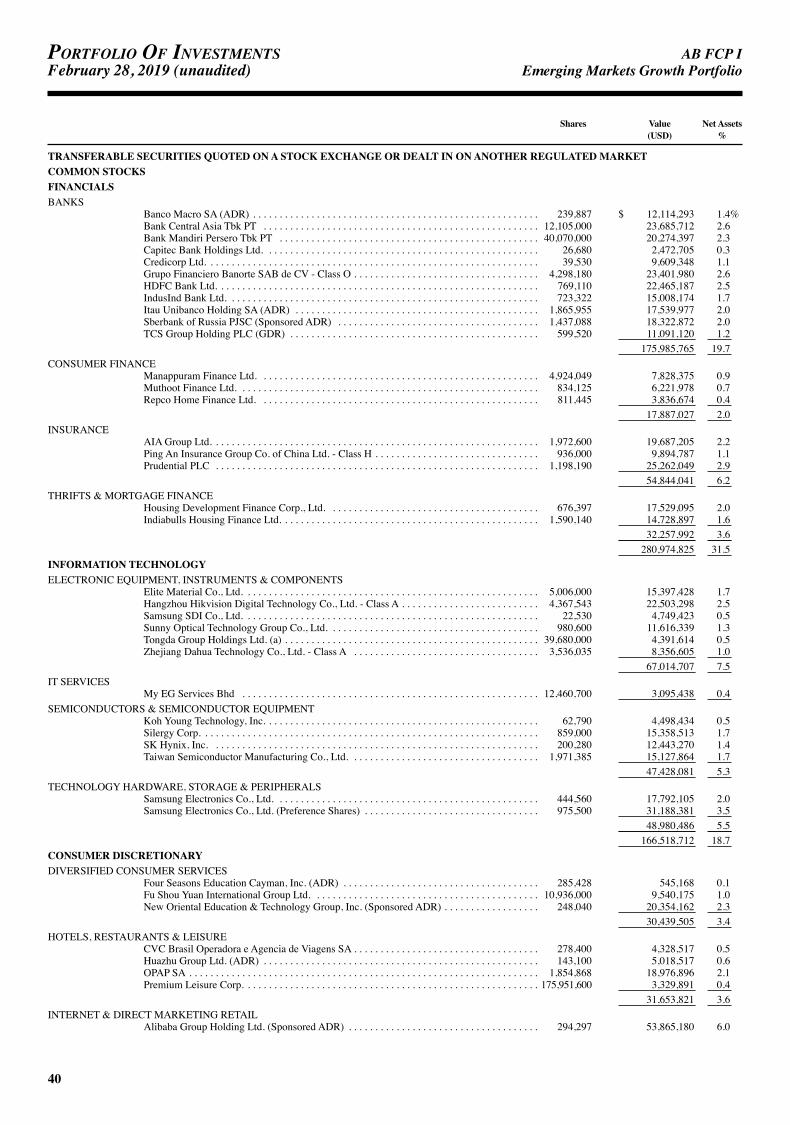
AB FCP I
40
Portfolio of investmentsFebruary 28, 2019 (unaudited) EmergingMarketsGrowthPortfolio
Shares Value Net Assets (USD) %
TRANSFERABLE SECURITIES QUOTED ON A STOCK EXCHANGE OR DEALT IN ON ANOTHER REGULATED MARKETCOMMON STOCKSFINANCIALSBANKS
Banco Macro SA (ADR) . . . . . . . . . . . . . . . . . . . . . . . . . . . . . . . . . . . . . . . . . . . . . . . . . . . . . . 239,887 $ 12,114,293 1.4%Bank Central Asia Tbk PT . . . . . . . . . . . . . . . . . . . . . . . . . . . . . . . . . . . . . . . . . . . . . . . . . . . . 12,105,000 23,685,712 2.6Bank Mandiri Persero Tbk PT . . . . . . . . . . . . . . . . . . . . . . . . . . . . . . . . . . . . . . . . . . . . . . . . . 40,070,000 20,274,397 2.3Capitec Bank Holdings Ltd. . . . . . . . . . . . . . . . . . . . . . . . . . . . . . . . . . . . . . . . . . . . . . . . . . . . 26,680 2,472,705 0.3Credicorp Ltd. . . . . . . . . . . . . . . . . . . . . . . . . . . . . . . . . . . . . . . . . . . . . . . . . . . . . . . . . . . . . . . 39,530 9,609,348 1.1Grupo Financiero Banorte SAB de CV - Class O . . . . . . . . . . . . . . . . . . . . . . . . . . . . . . . . . . . 4,298,180 23,401,980 2.6HDFC Bank Ltd. . . . . . . . . . . . . . . . . . . . . . . . . . . . . . . . . . . . . . . . . . . . . . . . . . . . . . . . . . . . . 769,110 22,465,187 2.5IndusInd Bank Ltd. . . . . . . . . . . . . . . . . . . . . . . . . . . . . . . . . . . . . . . . . . . . . . . . . . . . . . . . . . . 723,322 15,008,174 1.7Itau Unibanco Holding SA (ADR) . . . . . . . . . . . . . . . . . . . . . . . . . . . . . . . . . . . . . . . . . . . . . . 1,865,955 17,539,977 2.0Sberbank of Russia PJSC (Sponsored ADR) . . . . . . . . . . . . . . . . . . . . . . . . . . . . . . . . . . . . . . 1,437,088 18,322,872 2.0TCS Group Holding PLC (GDR) . . . . . . . . . . . . . . . . . . . . . . . . . . . . . . . . . . . . . . . . . . . . . . . 599,520 11,091,120 1.2 175,985,765 19.7
CONSUMER FINANCEManappuram Finance Ltd. . . . . . . . . . . . . . . . . . . . . . . . . . . . . . . . . . . . . . . . . . . . . . . . . . . . . 4,924,049 7,828,375 0.9Muthoot Finance Ltd. . . . . . . . . . . . . . . . . . . . . . . . . . . . . . . . . . . . . . . . . . . . . . . . . . . . . . . . . 834,125 6,221,978 0.7Repco Home Finance Ltd. . . . . . . . . . . . . . . . . . . . . . . . . . . . . . . . . . . . . . . . . . . . . . . . . . . . . 811,445 3,836,674 0.4 17,887,027 2.0
INSURANCEAIA Group Ltd. . . . . . . . . . . . . . . . . . . . . . . . . . . . . . . . . . . . . . . . . . . . . . . . . . . . . . . . . . . . . . 1,972,600 19,687,205 2.2Ping An Insurance Group Co. of China Ltd. - Class H . . . . . . . . . . . . . . . . . . . . . . . . . . . . . . . 936,000 9,894,787 1.1Prudential PLC . . . . . . . . . . . . . . . . . . . . . . . . . . . . . . . . . . . . . . . . . . . . . . . . . . . . . . . . . . . . . 1,198,190 25,262,049 2.9 54,844,041 6.2
THRIFTS & MORTGAGE FINANCEHousing Development Finance Corp., Ltd. . . . . . . . . . . . . . . . . . . . . . . . . . . . . . . . . . . . . . . . 676,397 17,529,095 2.0Indiabulls Housing Finance Ltd. . . . . . . . . . . . . . . . . . . . . . . . . . . . . . . . . . . . . . . . . . . . . . . . . 1,590,140 14,728,897 1.6 32,257,992 3.6 280,974,825 31.5
INFORMATION TECHNOLOGYELECTRONIC EQUIPMENT, INSTRUMENTS & COMPONENTS
Elite Material Co., Ltd. . . . . . . . . . . . . . . . . . . . . . . . . . . . . . . . . . . . . . . . . . . . . . . . . . . . . . . . 5,006,000 15,397,428 1.7Hangzhou Hikvision Digital Technology Co., Ltd. - Class A . . . . . . . . . . . . . . . . . . . . . . . . . . 4,367,543 22,503,298 2.5Samsung SDI Co., Ltd. . . . . . . . . . . . . . . . . . . . . . . . . . . . . . . . . . . . . . . . . . . . . . . . . . . . . . . . 22,530 4,749,423 0.5Sunny Optical Technology Group Co., Ltd. . . . . . . . . . . . . . . . . . . . . . . . . . . . . . . . . . . . . . . . 980,600 11,616,339 1.3Tongda Group Holdings Ltd. (a) . . . . . . . . . . . . . . . . . . . . . . . . . . . . . . . . . . . . . . . . . . . . . . . . 39,680,000 4,391,614 0.5Zhejiang Dahua Technology Co., Ltd. - Class A . . . . . . . . . . . . . . . . . . . . . . . . . . . . . . . . . . . 3,536,035 8,356,605 1.0 67,014,707 7.5
IT SERVICESMy EG Services Bhd . . . . . . . . . . . . . . . . . . . . . . . . . . . . . . . . . . . . . . . . . . . . . . . . . . . . . . . . 12,460,700 3,095,438 0.4
SEMICONDUCTORS & SEMICONDUCTOR EQUIPMENTKoh Young Technology, Inc. . . . . . . . . . . . . . . . . . . . . . . . . . . . . . . . . . . . . . . . . . . . . . . . . . . . 62,790 4,498,434 0.5Silergy Corp. . . . . . . . . . . . . . . . . . . . . . . . . . . . . . . . . . . . . . . . . . . . . . . . . . . . . . . . . . . . . . . . 859,000 15,358,513 1.7SK Hynix, Inc. . . . . . . . . . . . . . . . . . . . . . . . . . . . . . . . . . . . . . . . . . . . . . . . . . . . . . . . . . . . . . 200,280 12,443,270 1.4Taiwan Semiconductor Manufacturing Co., Ltd. . . . . . . . . . . . . . . . . . . . . . . . . . . . . . . . . . . . 1,971,385 15,127,864 1.7 47,428,081 5.3
TECHNOLOGY HARDWARE, STORAGE & PERIPHERALSSamsung Electronics Co., Ltd. . . . . . . . . . . . . . . . . . . . . . . . . . . . . . . . . . . . . . . . . . . . . . . . . . 444,560 17,792,105 2.0Samsung Electronics Co., Ltd. (Preference Shares) . . . . . . . . . . . . . . . . . . . . . . . . . . . . . . . . . 975,500 31,188,381 3.5 48,980,486 5.5 166,518,712 18.7
CONSUMER DISCRETIONARYDIVERSIFIED CONSUMER SERVICES
Four Seasons Education Cayman, Inc. (ADR) . . . . . . . . . . . . . . . . . . . . . . . . . . . . . . . . . . . . . 285,428 545,168 0.1Fu Shou Yuan International Group Ltd. . . . . . . . . . . . . . . . . . . . . . . . . . . . . . . . . . . . . . . . . . . 10,936,000 9,540,175 1.0New Oriental Education & Technology Group, Inc. (Sponsored ADR) . . . . . . . . . . . . . . . . . . 248,040 20,354,162 2.3 30,439,505 3.4
HOTELS, RESTAURANTS & LEISURECVC Brasil Operadora e Agencia de Viagens SA . . . . . . . . . . . . . . . . . . . . . . . . . . . . . . . . . . . 278,400 4,328,517 0.5Huazhu Group Ltd. (ADR) . . . . . . . . . . . . . . . . . . . . . . . . . . . . . . . . . . . . . . . . . . . . . . . . . . . . 143,100 5,018,517 0.6OPAP SA . . . . . . . . . . . . . . . . . . . . . . . . . . . . . . . . . . . . . . . . . . . . . . . . . . . . . . . . . . . . . . . . . . 1,854,868 18,976,896 2.1Premium Leisure Corp. . . . . . . . . . . . . . . . . . . . . . . . . . . . . . . . . . . . . . . . . . . . . . . . . . . . . . . . 175,951,600 3,329,891 0.4 31,653,821 3.6
INTERNET & DIRECT MARKETING RETAILAlibaba Group Holding Ltd. (Sponsored ADR) . . . . . . . . . . . . . . . . . . . . . . . . . . . . . . . . . . . . 294,297 53,865,180 6.0

AB FCP I
41
EmergingMarketsGrowthPortfolio
Shares Value Net Assets (USD) %
Baozun, Inc. (Sponsored ADR) (a) . . . . . . . . . . . . . . . . . . . . . . . . . . . . . . . . . . . . . . . . . . . . . . 531,588 $ 19,907,970 2.2%Ctrip.com International Ltd. (ADR) . . . . . . . . . . . . . . . . . . . . . . . . . . . . . . . . . . . . . . . . . . . . . 405,646 13,844,698 1.6MakeMyTrip Ltd. . . . . . . . . . . . . . . . . . . . . . . . . . . . . . . . . . . . . . . . . . . . . . . . . . . . . . . . . . . . 314,508 8,878,561 1.0 96,496,409 10.8
MULTILINE RETAILLojas Renner SA . . . . . . . . . . . . . . . . . . . . . . . . . . . . . . . . . . . . . . . . . . . . . . . . . . . . . . . . . . . . 189,800 2,186,959 0.2 160,776,694 18.0
COMMUNICATION SERVICESDIVERSIFIED TELECOMMUNICATION SERVICES
Tower Bersama Infrastructure Tbk PT . . . . . . . . . . . . . . . . . . . . . . . . . . . . . . . . . . . . . . . . . . . 13,289,900 3,752,087 0.4ENTERTAINMENT
IMAX China Holding, Inc. (a). . . . . . . . . . . . . . . . . . . . . . . . . . . . . . . . . . . . . . . . . . . . . . . . . . 1,244,800 3,250,855 0.4INTERACTIVE MEDIA & SERVICES
58.com, Inc. (ADR) . . . . . . . . . . . . . . . . . . . . . . . . . . . . . . . . . . . . . . . . . . . . . . . . . . . . . . . . . 281,700 20,538,747 2.3Momo, Inc. (Sponsored ADR) . . . . . . . . . . . . . . . . . . . . . . . . . . . . . . . . . . . . . . . . . . . . . . . . . 29,490 978,183 0.1Tencent Holdings Ltd. . . . . . . . . . . . . . . . . . . . . . . . . . . . . . . . . . . . . . . . . . . . . . . . . . . . . . . . . 1,079,100 46,210,571 5.2Yandex NV - Class A . . . . . . . . . . . . . . . . . . . . . . . . . . . . . . . . . . . . . . . . . . . . . . . . . . . . . . . . 429,340 14,769,296 1.6 82,496,797 9.2
MEDIAMultichoice Group Ltd. . . . . . . . . . . . . . . . . . . . . . . . . . . . . . . . . . . . . . . . . . . . . . . . . . . . . . . 60,957 454,353 0.1Naspers Ltd. - Class N . . . . . . . . . . . . . . . . . . . . . . . . . . . . . . . . . . . . . . . . . . . . . . . . . . . . . . . 60,957 13,146,549 1.4 13,600,902 1.5 103,100,641 11.5
CONSUMER STAPLESBEVERAGES
Coca-Cola HBC AG . . . . . . . . . . . . . . . . . . . . . . . . . . . . . . . . . . . . . . . . . . . . . . . . . . . . . . . . . 96,064 3,231,031 0.4Kweichow Moutai Co., Ltd. - Class A . . . . . . . . . . . . . . . . . . . . . . . . . . . . . . . . . . . . . . . . . . . 249,332 28,076,769 3.1Wuliangye Yibin Co., Ltd. - Class A . . . . . . . . . . . . . . . . . . . . . . . . . . . . . . . . . . . . . . . . . . . . . 1,808,339 19,272,291 2.2 50,580,091 5.7
FOOD & STAPLES RETAILINGDino Polska SA . . . . . . . . . . . . . . . . . . . . . . . . . . . . . . . . . . . . . . . . . . . . . . . . . . . . . . . . . . . . . 76,763 2,172,812 0.2
PERSONAL PRODUCTSTCI Co., Ltd. . . . . . . . . . . . . . . . . . . . . . . . . . . . . . . . . . . . . . . . . . . . . . . . . . . . . . . . . . . . . . . . 115,000 1,744,372 0.2
TOBACCOITC Ltd. . . . . . . . . . . . . . . . . . . . . . . . . . . . . . . . . . . . . . . . . . . . . . . . . . . . . . . . . . . . . . . . . . . . 520,281 2,024,160 0.2 56,521,435 6.3
INDUSTRIALSCOMMERCIAL SERVICES & SUPPLIES
Sunny Friend Environmental Technology Co., Ltd. . . . . . . . . . . . . . . . . . . . . . . . . . . . . . . . . . 401,000 3,204,988 0.3PROFESSIONAL SERVICES
51job, Inc. (ADR) . . . . . . . . . . . . . . . . . . . . . . . . . . . . . . . . . . . . . . . . . . . . . . . . . . . . . . . . . . . 160,293 11,582,772 1.3ROAD & RAIL
Globaltrans Investment PLC (Sponsored GDR) . . . . . . . . . . . . . . . . . . . . . . . . . . . . . . . . . . . . 1,782,111 17,732,005 2.0Localiza Rent a Car SA . . . . . . . . . . . . . . . . . . . . . . . . . . . . . . . . . . . . . . . . . . . . . . . . . . . . . . . 534,500 4,916,464 0.5Rumo SA . . . . . . . . . . . . . . . . . . . . . . . . . . . . . . . . . . . . . . . . . . . . . . . . . . . . . . . . . . . . . . . . . . 466,400 2,416,342 0.3 25,064,811 2.8
TRANSPORTATION INFRASTRUCTUREAdani Ports & Special Economic Zone Ltd. . . . . . . . . . . . . . . . . . . . . . . . . . . . . . . . . . . . . . . . 2,081,610 9,561,109 1.1 49,413,680 5.5
ENERGYOIL, GAS & CONSUMABLE FUELS
Petroleo Brasileiro SA (Preference Shares) . . . . . . . . . . . . . . . . . . . . . . . . . . . . . . . . . . . . . . . 2,553,400 18,395,166 2.1UTILITIESELECTRIC UTILITIES
Equatorial Energia SA . . . . . . . . . . . . . . . . . . . . . . . . . . . . . . . . . . . . . . . . . . . . . . . . . . . . . . . . 592,100 12,946,547 1.4REAL ESTATEREAL ESTATE MANAGEMENT & DEVELOPMENT
Vincom Retail JSC . . . . . . . . . . . . . . . . . . . . . . . . . . . . . . . . . . . . . . . . . . . . . . . . . . . . . . . . . . 6,646,264 9,456,007 1.1HEALTH CAREHEALTH CARE EQUIPMENT & SUPPLIES
Yestar Healthcare Holdings Co., Ltd. (a). . . . . . . . . . . . . . . . . . . . . . . . . . . . . . . . . . . . . . . . . . 7,767,500 1,721,768 0.2HEALTH CARE PROVIDERS & SERVICES
NMC Health PLC . . . . . . . . . . . . . . . . . . . . . . . . . . . . . . . . . . . . . . . . . . . . . . . . . . . . . . . . . . . 124,348 4,457,268 0.5 6,179,036 0.7 864,282,743 96.8

AB FCP I
42
Portfolio of investments (continued) EmergingMarketsGrowthPortfolio
Rate Date Shares Value Net Assets (USD) %
EQUITY LINKED NOTESCONSUMER DISCRETIONARYSPECIALTY RETAIL
Mobile World Investment Corp., Macquarie Bank Ltd., expiring 3/31/20 . . . . . . . . . . . . . . . . . . . . . . . . . . . . . . . . . . . . . 577,293 $ 2,159,872 0.3%
866,442,615 97.1OTHER TRANSFERABLE SECURITIESCOMMON STOCKSCOMMUNICATION SERVICESWIRELESS TELECOMMUNICATION SERVICES
Safaricom PLC . . . . . . . . . . . . . . . . . . . . . . . . . . . . . . . . . . . . . . . . 61,206,100 15,897,688 1.8Total Investments
(cost $903,675,960) . . . . . . . . . . . . . . . . . . . . . . . . . . . . . . . . . . . . . $ 882,340,303 98.9%Time Deposits
BBH, Grand Cayman(b) . . . . . . . . . . . . . . . . . . . . . . . . . . . . . . . . . (1.40)% – 1,104 0.0BBH, Grand Cayman(b) . . . . . . . . . . . . . . . . . . . . . . . . . . . . . . . . . (0.49)% – 99 0.0BBH, Grand Cayman(b) . . . . . . . . . . . . . . . . . . . . . . . . . . . . . . . . . 0.16 % – 90,251 0.0BBH, Grand Cayman(b) . . . . . . . . . . . . . . . . . . . . . . . . . . . . . . . . . 0.76 % – 2,289 0.0BBH, Grand Cayman(b) . . . . . . . . . . . . . . . . . . . . . . . . . . . . . . . . . 0.82 % – 108 0.0Hong Kong & Shanghai Bank, Singapore(b) . . . . . . . . . . . . . . . . . 0.67 % – 50,388 0.0HSBC Bank PLC, London(b) . . . . . . . . . . . . . . . . . . . . . . . . . . . . . (0.57)% – 90,544 0.0HSBC Bank PLC, London(b) . . . . . . . . . . . . . . . . . . . . . . . . . . . . . 5.12 % – 92,569 0.0JPMorgan Chase, New York(b) . . . . . . . . . . . . . . . . . . . . . . . . . . . . 1.76 % – 141,207 0.0SEB, Stockholm(b) . . . . . . . . . . . . . . . . . . . . . . . . . . . . . . . . . . . . . 0.36 % – 91,650 0.0
Total Time Deposits . . . . . . . . . . . . . . . . . . . . . . . . . . . . . . . . . . . . . . . . . . . . . . . . . . . . . . 560,209 0.0Other assets less liabilities . . . . . . . . . . . . . . . . . . . . . . . . . . . . . . . . . . . . . . . . . . . . . . . . . 9,700,271 1.1Net Assets . . . . . . . . . . . . . . . . . . . . . . . . . . . . . . . . . . . . . . . . . . . . . . . . . . . . . . . . . . . . . . $ 892,600,783 100.0%
FUTURES Unrealized Number of Appreciation/ Type Expiration Date Contracts Original Value Market Value (Depreciation)
LongMSCI Emerging Markets Index Futures . . . . . . . . . . . . . . . . . . . . 3/15/19 102 $ 5,336,702 $ 5,333,137 $ (3,565)
FORWARD FOREIGN CURRENCY CONTRACTS
Contracts to In Exchange Unrealized Deliver For Settlement Appreciation/ Counterparty (000) (000) Date (Depreciation)
Brown Brothers Harriman & Co.+. . . . . . . . . . . . . . . . . . . . . . . . USD 4,397 AUD 6,091 3/06/19 $ (75,159)Brown Brothers Harriman & Co.+. . . . . . . . . . . . . . . . . . . . . . . . USD 1,683 CHF 1,676 3/06/19 (3,739)Brown Brothers Harriman & Co.+. . . . . . . . . . . . . . . . . . . . . . . . USD 25 SGD 34 3/06/19 3
$ (78,895)
Appreciation $ 3 Depreciation $ (78,898)
+ Used for share class hedging purposes.(a) Represents entire or partial securities out on loan. See Note N for securities lending information.(b) Overnight deposit.
Currency Abbreviations:AUD – Australian DollarCHF – Swiss FrancSGD – Singapore DollarUSD – United States Dollar

AB FCP I
43
EmergingMarketsGrowthPortfolio
Glossary:ADR – American Depositary ReceiptGDR – Global Depositary ReceiptJSC – Joint Stock CompanyMSCI – Morgan Stanley Capital International PJSC – Public Joint Stock Company
See notes to financial statements.

AB FCP I
44
Portfolio of investmentsFebruary 28, 2019 (unaudited) SustainableUSThematicPortfolio
Shares Value Net Assets (USD) %
TRANSFERABLE SECURITIES QUOTED ON A STOCK EXCHANGE OR DEALT IN ON ANOTHER REGULATED MARKETCOMMON STOCKSINFORMATION TECHNOLOGYIT SERVICES
Visa, Inc. - Class A . . . . . . . . . . . . . . . . . . . . . . . . . . . . . . . . . . . . . . . . . . . . . . . . . . . . . . . . . . 31,068 $ 4,601,792 3.7%SEMICONDUCTORS & SEMICONDUCTOR EQUIPMENT
Monolithic Power Systems, Inc. . . . . . . . . . . . . . . . . . . . . . . . . . . . . . . . . . . . . . . . . . . . . . . . . 16,191 2,171,375 1.8NVIDIA Corp. . . . . . . . . . . . . . . . . . . . . . . . . . . . . . . . . . . . . . . . . . . . . . . . . . . . . . . . . . . . . . . 13,271 2,047,185 1.6 4,218,560 3.4
SOFTWAREANSYS, Inc. . . . . . . . . . . . . . . . . . . . . . . . . . . . . . . . . . . . . . . . . . . . . . . . . . . . . . . . . . . . . . . . 12,562 2,226,740 1.8Microsoft Corp. . . . . . . . . . . . . . . . . . . . . . . . . . . . . . . . . . . . . . . . . . . . . . . . . . . . . . . . . . . . . . 24,472 2,741,598 2.2New Relic, Inc. . . . . . . . . . . . . . . . . . . . . . . . . . . . . . . . . . . . . . . . . . . . . . . . . . . . . . . . . . . . . . 16,236 1,716,957 1.4Proofpoint, Inc. . . . . . . . . . . . . . . . . . . . . . . . . . . . . . . . . . . . . . . . . . . . . . . . . . . . . . . . . . . . . . 9,680 1,143,111 0.9SailPoint Technologies Holding, Inc. . . . . . . . . . . . . . . . . . . . . . . . . . . . . . . . . . . . . . . . . . . . . 57,602 1,776,446 1.5salesforce.com, Inc. . . . . . . . . . . . . . . . . . . . . . . . . . . . . . . . . . . . . . . . . . . . . . . . . . . . . . . . . . . 21,547 3,526,167 2.9 13,131,019 10.7
TECHNOLOGY HARDWARE, STORAGE & PERIPHERALSApple, Inc. . . . . . . . . . . . . . . . . . . . . . . . . . . . . . . . . . . . . . . . . . . . . . . . . . . . . . . . . . . . . . . . . . 15,495 2,682,959 2.2 24,634,330 20.0
HEALTH CAREHEALTH CARE EQUIPMENT & SUPPLIES
Abbott Laboratories . . . . . . . . . . . . . . . . . . . . . . . . . . . . . . . . . . . . . . . . . . . . . . . . . . . . . . . . . 31,590 2,452,016 2.0Danaher Corp. . . . . . . . . . . . . . . . . . . . . . . . . . . . . . . . . . . . . . . . . . . . . . . . . . . . . . . . . . . . . . . 35,237 4,475,803 3.6West Pharmaceutical Services, Inc. . . . . . . . . . . . . . . . . . . . . . . . . . . . . . . . . . . . . . . . . . . . . . 26,357 2,760,896 2.3 9,688,715 7.9
HEALTH CARE PROVIDERS & SERVICESUnitedHealth Group, Inc. . . . . . . . . . . . . . . . . . . . . . . . . . . . . . . . . . . . . . . . . . . . . . . . . . . . . . 10,396 2,518,119 2.0
HEALTH CARE TECHNOLOGYMedidata Solutions, Inc. . . . . . . . . . . . . . . . . . . . . . . . . . . . . . . . . . . . . . . . . . . . . . . . . . . . . . . 26,362 1,977,677 1.6
LIFE SCIENCES TOOLS & SERVICESBio-Rad Laboratories, Inc. - Class A . . . . . . . . . . . . . . . . . . . . . . . . . . . . . . . . . . . . . . . . . . . . 10,269 2,781,872 2.3Bruker Corp. . . . . . . . . . . . . . . . . . . . . . . . . . . . . . . . . . . . . . . . . . . . . . . . . . . . . . . . . . . . . . . . 59,632 2,278,539 1.8ICON PLC . . . . . . . . . . . . . . . . . . . . . . . . . . . . . . . . . . . . . . . . . . . . . . . . . . . . . . . . . . . . . . . . 17,617 2,466,028 2.0 7,526,439 6.1 21,710,950 17.6
CONSUMER DISCRETIONARYAUTO COMPONENTS
Aptiv PLC . . . . . . . . . . . . . . . . . . . . . . . . . . . . . . . . . . . . . . . . . . . . . . . . . . . . . . . . . . . . . . . . . 43,502 3,615,451 2.9DIVERSIFIED CONSUMER SERVICES
Bright Horizons Family Solutions, Inc. . . . . . . . . . . . . . . . . . . . . . . . . . . . . . . . . . . . . . . . . . . 30,396 3,769,104 3.1INTERNET & DIRECT MARKETING RETAIL
Amazon.com, Inc. . . . . . . . . . . . . . . . . . . . . . . . . . . . . . . . . . . . . . . . . . . . . . . . . . . . . . . . . . . . 1,637 2,684,402 2.2Etsy, Inc. . . . . . . . . . . . . . . . . . . . . . . . . . . . . . . . . . . . . . . . . . . . . . . . . . . . . . . . . . . . . . . . . . . 32,323 2,303,660 1.8 4,988,062 4.0
SPECIALTY RETAILHome Depot, Inc. (The) . . . . . . . . . . . . . . . . . . . . . . . . . . . . . . . . . . . . . . . . . . . . . . . . . . . . . . 14,474 2,679,716 2.2
TEXTILES, APPAREL & LUXURY GOODSNIKE, Inc. - Class B . . . . . . . . . . . . . . . . . . . . . . . . . . . . . . . . . . . . . . . . . . . . . . . . . . . . . . . . . 26,560 2,276,989 1.8VF Corp. . . . . . . . . . . . . . . . . . . . . . . . . . . . . . . . . . . . . . . . . . . . . . . . . . . . . . . . . . . . . . . . . . . 30,475 2,662,296 2.2 4,939,285 4.0 19,991,618 16.2
FINANCIALSCAPITAL MARKETS
Charles Schwab Corp. (The) . . . . . . . . . . . . . . . . . . . . . . . . . . . . . . . . . . . . . . . . . . . . . . . . . . . 62,704 2,885,011 2.3Intercontinental Exchange, Inc. . . . . . . . . . . . . . . . . . . . . . . . . . . . . . . . . . . . . . . . . . . . . . . . . 45,413 3,503,613 2.8MSCI, Inc. - Class A . . . . . . . . . . . . . . . . . . . . . . . . . . . . . . . . . . . . . . . . . . . . . . . . . . . . . . . . . 23,683 4,374,724 3.6 10,763,348 8.7
INSURANCEAflac, Inc. . . . . . . . . . . . . . . . . . . . . . . . . . . . . . . . . . . . . . . . . . . . . . . . . . . . . . . . . . . . . . . . . . 54,679 2,686,926 2.2 13,450,274 10.9
INDUSTRIALSAEROSPACE & DEFENSE
Hexcel Corp. . . . . . . . . . . . . . . . . . . . . . . . . . . . . . . . . . . . . . . . . . . . . . . . . . . . . . . . . . . . . . . . 55,393 3,996,051 3.2
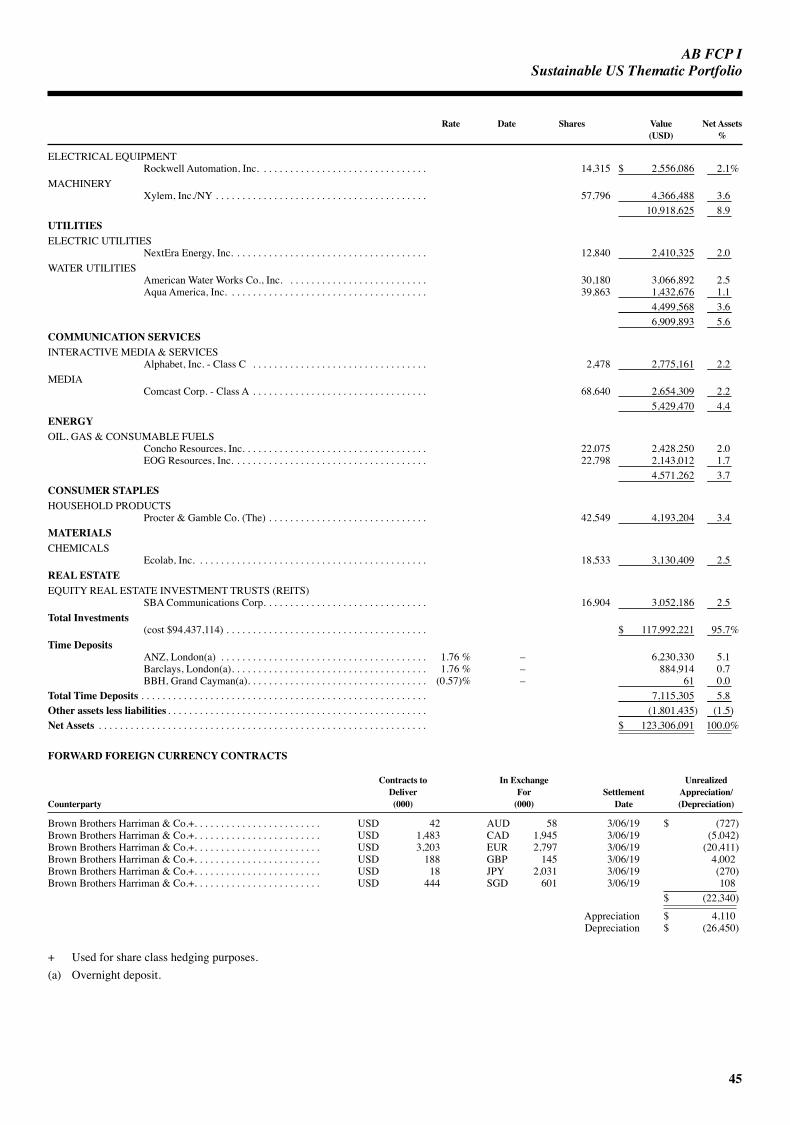
AB FCP I
45
SustainableUSThematicPortfolio
Rate Date Shares Value Net Assets (USD) %
ELECTRICAL EQUIPMENTRockwell Automation, Inc. . . . . . . . . . . . . . . . . . . . . . . . . . . . . . . . 14,315 $ 2,556,086 2.1%
MACHINERYXylem, Inc./NY . . . . . . . . . . . . . . . . . . . . . . . . . . . . . . . . . . . . . . . . 57,796 4,366,488 3.6 10,918,625 8.9
UTILITIESELECTRIC UTILITIES
NextEra Energy, Inc. . . . . . . . . . . . . . . . . . . . . . . . . . . . . . . . . . . . . 12,840 2,410,325 2.0WATER UTILITIES
American Water Works Co., Inc. . . . . . . . . . . . . . . . . . . . . . . . . . . 30,180 3,066,892 2.5Aqua America, Inc. . . . . . . . . . . . . . . . . . . . . . . . . . . . . . . . . . . . . . 39,863 1,432,676 1.1 4,499,568 3.6 6,909,893 5.6
COMMUNICATION SERVICESINTERACTIVE MEDIA & SERVICES
Alphabet, Inc. - Class C . . . . . . . . . . . . . . . . . . . . . . . . . . . . . . . . . 2,478 2,775,161 2.2MEDIA
Comcast Corp. - Class A . . . . . . . . . . . . . . . . . . . . . . . . . . . . . . . . . 68,640 2,654,309 2.2 5,429,470 4.4
ENERGYOIL, GAS & CONSUMABLE FUELS
Concho Resources, Inc. . . . . . . . . . . . . . . . . . . . . . . . . . . . . . . . . . . 22,075 2,428,250 2.0EOG Resources, Inc. . . . . . . . . . . . . . . . . . . . . . . . . . . . . . . . . . . . . 22,798 2,143,012 1.7 4,571,262 3.7
CONSUMER STAPLESHOUSEHOLD PRODUCTS
Procter & Gamble Co. (The) . . . . . . . . . . . . . . . . . . . . . . . . . . . . . . 42,549 4,193,204 3.4MATERIALSCHEMICALS
Ecolab, Inc. . . . . . . . . . . . . . . . . . . . . . . . . . . . . . . . . . . . . . . . . . . . 18,533 3,130,409 2.5REAL ESTATEEQUITY REAL ESTATE INVESTMENT TRUSTS (REITS)
SBA Communications Corp. . . . . . . . . . . . . . . . . . . . . . . . . . . . . . . 16,904 3,052,186 2.5Total Investments
(cost $94,437,114) . . . . . . . . . . . . . . . . . . . . . . . . . . . . . . . . . . . . . . $ 117,992,221 95.7%Time Deposits
ANZ, London(a) . . . . . . . . . . . . . . . . . . . . . . . . . . . . . . . . . . . . . . . 1.76 % – 6,230,330 5.1Barclays, London(a). . . . . . . . . . . . . . . . . . . . . . . . . . . . . . . . . . . . . 1.76 % – 884,914 0.7BBH, Grand Cayman(a). . . . . . . . . . . . . . . . . . . . . . . . . . . . . . . . . . (0.57)% – 61 0.0
Total Time Deposits . . . . . . . . . . . . . . . . . . . . . . . . . . . . . . . . . . . . . . . . . . . . . . . . . . . . . . 7,115,305 5.8Other assets less liabilities . . . . . . . . . . . . . . . . . . . . . . . . . . . . . . . . . . . . . . . . . . . . . . . . . (1,801,435) (1.5)Net Assets . . . . . . . . . . . . . . . . . . . . . . . . . . . . . . . . . . . . . . . . . . . . . . . . . . . . . . . . . . . . . . $ 123,306,091 100.0%
FORWARD FOREIGN CURRENCY CONTRACTS
Contracts to In Exchange Unrealized Deliver For Settlement Appreciation/ Counterparty (000) (000) Date (Depreciation)
Brown Brothers Harriman & Co.+. . . . . . . . . . . . . . . . . . . . . . . . USD 42 AUD 58 3/06/19 $ (727)Brown Brothers Harriman & Co.+. . . . . . . . . . . . . . . . . . . . . . . . USD 1,483 CAD 1,945 3/06/19 (5,042)Brown Brothers Harriman & Co.+. . . . . . . . . . . . . . . . . . . . . . . . USD 3,203 EUR 2,797 3/06/19 (20,411)Brown Brothers Harriman & Co.+. . . . . . . . . . . . . . . . . . . . . . . . USD 188 GBP 145 3/06/19 4,002Brown Brothers Harriman & Co.+. . . . . . . . . . . . . . . . . . . . . . . . USD 18 JPY 2,031 3/06/19 (270)Brown Brothers Harriman & Co.+. . . . . . . . . . . . . . . . . . . . . . . . USD 444 SGD 601 3/06/19 108
$ (22,340)
Appreciation $ 4,110 Depreciation $ (26,450)
+ Used for share class hedging purposes.(a) Overnight deposit.
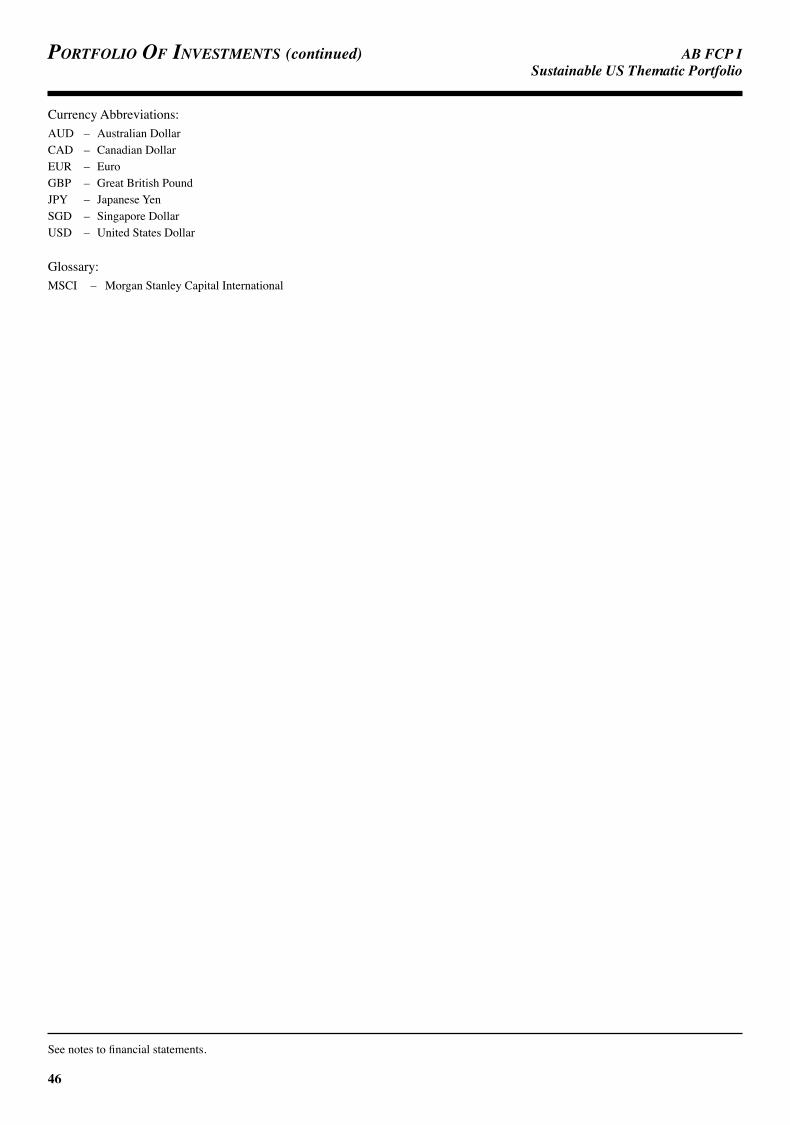
AB FCP I
46
Portfolio of investments (continued) SustainableUSThematicPortfolio
Currency Abbreviations:AUD – Australian DollarCAD – Canadian DollarEUR – EuroGBP – Great British PoundJPY – Japanese YenSGD – Singapore DollarUSD – United States Dollar
Glossary:MSCI – Morgan Stanley Capital International
See notes to financial statements.
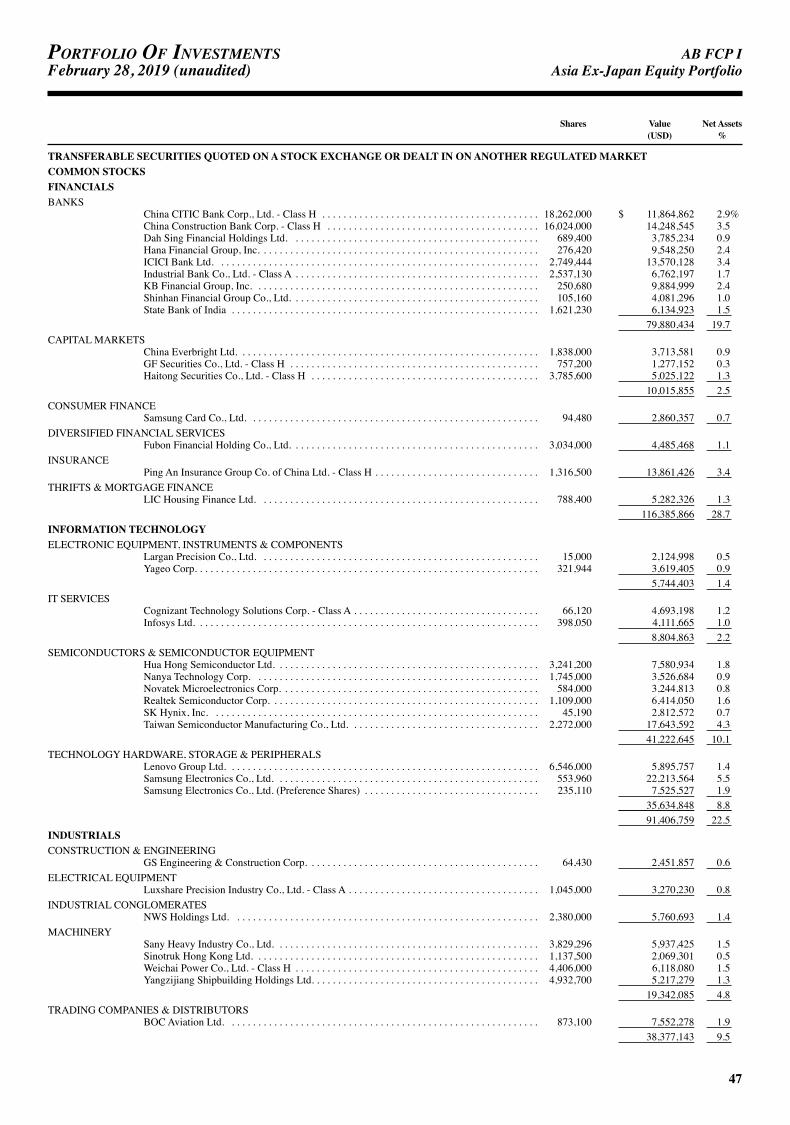
AB FCP I
47
Portfolio of investmentsFebruary 28, 2019 (unaudited) AsiaEx-JapanEquityPortfolio
Shares Value Net Assets (USD) %
TRANSFERABLE SECURITIES QUOTED ON A STOCK EXCHANGE OR DEALT IN ON ANOTHER REGULATED MARKETCOMMON STOCKSFINANCIALSBANKS
China CITIC Bank Corp., Ltd. - Class H . . . . . . . . . . . . . . . . . . . . . . . . . . . . . . . . . . . . . . . . . 18,262,000 $ 11,864,862 2.9%China Construction Bank Corp. - Class H . . . . . . . . . . . . . . . . . . . . . . . . . . . . . . . . . . . . . . . . 16,024,000 14,248,545 3.5Dah Sing Financial Holdings Ltd. . . . . . . . . . . . . . . . . . . . . . . . . . . . . . . . . . . . . . . . . . . . . . . 689,400 3,785,234 0.9Hana Financial Group, Inc. . . . . . . . . . . . . . . . . . . . . . . . . . . . . . . . . . . . . . . . . . . . . . . . . . . . . 276,420 9,548,250 2.4ICICI Bank Ltd. . . . . . . . . . . . . . . . . . . . . . . . . . . . . . . . . . . . . . . . . . . . . . . . . . . . . . . . . . . . . 2,749,444 13,570,128 3.4Industrial Bank Co., Ltd. - Class A . . . . . . . . . . . . . . . . . . . . . . . . . . . . . . . . . . . . . . . . . . . . . . 2,537,130 6,762,197 1.7KB Financial Group, Inc. . . . . . . . . . . . . . . . . . . . . . . . . . . . . . . . . . . . . . . . . . . . . . . . . . . . . . 250,680 9,884,999 2.4Shinhan Financial Group Co., Ltd. . . . . . . . . . . . . . . . . . . . . . . . . . . . . . . . . . . . . . . . . . . . . . . 105,160 4,081,296 1.0State Bank of India . . . . . . . . . . . . . . . . . . . . . . . . . . . . . . . . . . . . . . . . . . . . . . . . . . . . . . . . . . 1,621,230 6,134,923 1.5 79,880,434 19.7
CAPITAL MARKETSChina Everbright Ltd. . . . . . . . . . . . . . . . . . . . . . . . . . . . . . . . . . . . . . . . . . . . . . . . . . . . . . . . . 1,838,000 3,713,581 0.9GF Securities Co., Ltd. - Class H . . . . . . . . . . . . . . . . . . . . . . . . . . . . . . . . . . . . . . . . . . . . . . . 757,200 1,277,152 0.3Haitong Securities Co., Ltd. - Class H . . . . . . . . . . . . . . . . . . . . . . . . . . . . . . . . . . . . . . . . . . . 3,785,600 5,025,122 1.3 10,015,855 2.5
CONSUMER FINANCESamsung Card Co., Ltd. . . . . . . . . . . . . . . . . . . . . . . . . . . . . . . . . . . . . . . . . . . . . . . . . . . . . . . 94,480 2,860,357 0.7
DIVERSIFIED FINANCIAL SERVICESFubon Financial Holding Co., Ltd. . . . . . . . . . . . . . . . . . . . . . . . . . . . . . . . . . . . . . . . . . . . . . . 3,034,000 4,485,468 1.1
INSURANCEPing An Insurance Group Co. of China Ltd. - Class H . . . . . . . . . . . . . . . . . . . . . . . . . . . . . . . 1,316,500 13,861,426 3.4
THRIFTS & MORTGAGE FINANCELIC Housing Finance Ltd. . . . . . . . . . . . . . . . . . . . . . . . . . . . . . . . . . . . . . . . . . . . . . . . . . . . . 788,400 5,282,326 1.3 116,385,866 28.7
INFORMATION TECHNOLOGYELECTRONIC EQUIPMENT, INSTRUMENTS & COMPONENTS
Largan Precision Co., Ltd. . . . . . . . . . . . . . . . . . . . . . . . . . . . . . . . . . . . . . . . . . . . . . . . . . . . . 15,000 2,124,998 0.5Yageo Corp. . . . . . . . . . . . . . . . . . . . . . . . . . . . . . . . . . . . . . . . . . . . . . . . . . . . . . . . . . . . . . . . . 321,944 3,619,405 0.9 5,744,403 1.4
IT SERVICESCognizant Technology Solutions Corp. - Class A . . . . . . . . . . . . . . . . . . . . . . . . . . . . . . . . . . . 66,120 4,693,198 1.2Infosys Ltd. . . . . . . . . . . . . . . . . . . . . . . . . . . . . . . . . . . . . . . . . . . . . . . . . . . . . . . . . . . . . . . . . 398,050 4,111,665 1.0 8,804,863 2.2
SEMICONDUCTORS & SEMICONDUCTOR EQUIPMENTHua Hong Semiconductor Ltd. . . . . . . . . . . . . . . . . . . . . . . . . . . . . . . . . . . . . . . . . . . . . . . . . . 3,241,200 7,580,934 1.8Nanya Technology Corp. . . . . . . . . . . . . . . . . . . . . . . . . . . . . . . . . . . . . . . . . . . . . . . . . . . . . . 1,745,000 3,526,684 0.9Novatek Microelectronics Corp. . . . . . . . . . . . . . . . . . . . . . . . . . . . . . . . . . . . . . . . . . . . . . . . . 584,000 3,244,813 0.8Realtek Semiconductor Corp. . . . . . . . . . . . . . . . . . . . . . . . . . . . . . . . . . . . . . . . . . . . . . . . . . . 1,109,000 6,414,050 1.6SK Hynix, Inc. . . . . . . . . . . . . . . . . . . . . . . . . . . . . . . . . . . . . . . . . . . . . . . . . . . . . . . . . . . . . . 45,190 2,812,572 0.7Taiwan Semiconductor Manufacturing Co., Ltd. . . . . . . . . . . . . . . . . . . . . . . . . . . . . . . . . . . . 2,272,000 17,643,592 4.3 41,222,645 10.1
TECHNOLOGY HARDWARE, STORAGE & PERIPHERALSLenovo Group Ltd. . . . . . . . . . . . . . . . . . . . . . . . . . . . . . . . . . . . . . . . . . . . . . . . . . . . . . . . . . . 6,546,000 5,895,757 1.4Samsung Electronics Co., Ltd. . . . . . . . . . . . . . . . . . . . . . . . . . . . . . . . . . . . . . . . . . . . . . . . . . 553,960 22,213,564 5.5Samsung Electronics Co., Ltd. (Preference Shares) . . . . . . . . . . . . . . . . . . . . . . . . . . . . . . . . . 235,110 7,525,527 1.9 35,634,848 8.8 91,406,759 22.5
INDUSTRIALSCONSTRUCTION & ENGINEERING
GS Engineering & Construction Corp. . . . . . . . . . . . . . . . . . . . . . . . . . . . . . . . . . . . . . . . . . . . 64,430 2,451,857 0.6ELECTRICAL EQUIPMENT
Luxshare Precision Industry Co., Ltd. - Class A . . . . . . . . . . . . . . . . . . . . . . . . . . . . . . . . . . . . 1,045,000 3,270,230 0.8INDUSTRIAL CONGLOMERATES
NWS Holdings Ltd. . . . . . . . . . . . . . . . . . . . . . . . . . . . . . . . . . . . . . . . . . . . . . . . . . . . . . . . . . 2,380,000 5,760,693 1.4MACHINERY
Sany Heavy Industry Co., Ltd. . . . . . . . . . . . . . . . . . . . . . . . . . . . . . . . . . . . . . . . . . . . . . . . . . 3,829,296 5,937,425 1.5Sinotruk Hong Kong Ltd. . . . . . . . . . . . . . . . . . . . . . . . . . . . . . . . . . . . . . . . . . . . . . . . . . . . . . 1,137,500 2,069,301 0.5Weichai Power Co., Ltd. - Class H . . . . . . . . . . . . . . . . . . . . . . . . . . . . . . . . . . . . . . . . . . . . . . 4,406,000 6,118,080 1.5Yangzijiang Shipbuilding Holdings Ltd. . . . . . . . . . . . . . . . . . . . . . . . . . . . . . . . . . . . . . . . . . . 4,932,700 5,217,279 1.3 19,342,085 4.8
TRADING COMPANIES & DISTRIBUTORSBOC Aviation Ltd. . . . . . . . . . . . . . . . . . . . . . . . . . . . . . . . . . . . . . . . . . . . . . . . . . . . . . . . . . . 873,100 7,552,278 1.9 38,377,143 9.5

AB FCP I
48
Portfolio of investments (continued) AsiaEx-JapanEquityPortfolio
Shares Value Net Assets (USD) %
MATERIALSCHEMICALS
Formosa Plastics Corp. . . . . . . . . . . . . . . . . . . . . . . . . . . . . . . . . . . . . . . . . . . . . . . . . . . . . . . . 295,000 $ 982,487 0.2%Kumho Petrochemical Co., Ltd. . . . . . . . . . . . . . . . . . . . . . . . . . . . . . . . . . . . . . . . . . . . . . . . . 71,770 6,106,863 1.5Tosoh Corp. . . . . . . . . . . . . . . . . . . . . . . . . . . . . . . . . . . . . . . . . . . . . . . . . . . . . . . . . . . . . . . . . 205,700 3,032,029 0.8 10,121,379 2.5
CONSTRUCTION MATERIALSAnhui Conch Cement Co., Ltd. - Class A . . . . . . . . . . . . . . . . . . . . . . . . . . . . . . . . . . . . . . . . . 426,087 2,254,126 0.6Anhui Conch Cement Co., Ltd. - Class H . . . . . . . . . . . . . . . . . . . . . . . . . . . . . . . . . . . . . . . . . 1,486,500 8,502,672 2.1Huaxin Cement Co., Ltd. . . . . . . . . . . . . . . . . . . . . . . . . . . . . . . . . . . . . . . . . . . . . . . . . . . . . . 766,385 2,178,741 0.5 12,935,539 3.2
METALS & MININGAluminum Corp. of China Ltd. - Class H (a) . . . . . . . . . . . . . . . . . . . . . . . . . . . . . . . . . . . . . . 9,980,000 4,093,837 1.0POSCO . . . . . . . . . . . . . . . . . . . . . . . . . . . . . . . . . . . . . . . . . . . . . . . . . . . . . . . . . . . . . . . . . . . 28,130 6,577,923 1.6 10,671,760 2.6 33,728,678 8.3
REAL ESTATEREAL ESTATE MANAGEMENT & DEVELOPMENT
CIFI Holdings Group Co., Ltd. . . . . . . . . . . . . . . . . . . . . . . . . . . . . . . . . . . . . . . . . . . . . . . . . . 6,270,000 4,089,608 1.0City Developments Ltd. . . . . . . . . . . . . . . . . . . . . . . . . . . . . . . . . . . . . . . . . . . . . . . . . . . . . . . 371,300 2,449,701 0.6CK Asset Holdings Ltd. . . . . . . . . . . . . . . . . . . . . . . . . . . . . . . . . . . . . . . . . . . . . . . . . . . . . . . 1,008,000 8,366,024 2.1New World Development Co., Ltd. . . . . . . . . . . . . . . . . . . . . . . . . . . . . . . . . . . . . . . . . . . . . . 2,431,000 3,883,530 0.9Sun Hung Kai Properties Ltd. . . . . . . . . . . . . . . . . . . . . . . . . . . . . . . . . . . . . . . . . . . . . . . . . . . 239,000 3,958,088 1.0Times China Holdings Ltd. . . . . . . . . . . . . . . . . . . . . . . . . . . . . . . . . . . . . . . . . . . . . . . . . . . . . 3,381,000 4,393,287 1.1UOL Group Ltd. . . . . . . . . . . . . . . . . . . . . . . . . . . . . . . . . . . . . . . . . . . . . . . . . . . . . . . . . . . . . 579,500 2,841,779 0.7Wharf Real Estate Investment Co., Ltd. . . . . . . . . . . . . . . . . . . . . . . . . . . . . . . . . . . . . . . . . . . 351,000 2,466,021 0.6 32,448,038 8.0
ENERGYOIL, GAS & CONSUMABLE FUELS
China Petroleum & Chemical Corp. - Class H . . . . . . . . . . . . . . . . . . . . . . . . . . . . . . . . . . . . . 7,782,000 6,721,483 1.6PetroChina Co., Ltd. - Class H . . . . . . . . . . . . . . . . . . . . . . . . . . . . . . . . . . . . . . . . . . . . . . . . . 18,768,000 12,408,793 3.1S-Oil Corp. . . . . . . . . . . . . . . . . . . . . . . . . . . . . . . . . . . . . . . . . . . . . . . . . . . . . . . . . . . . . . . . . 27,500 2,445,096 0.6 21,575,372 5.3
COMMUNICATION SERVICESDIVERSIFIED TELECOMMUNICATION SERVICES
China Unicom Hong Kong Ltd. . . . . . . . . . . . . . . . . . . . . . . . . . . . . . . . . . . . . . . . . . . . . . . . . 9,930,000 11,777,229 2.9ENTERTAINMENT
NetEase, Inc. (ADR) . . . . . . . . . . . . . . . . . . . . . . . . . . . . . . . . . . . . . . . . . . . . . . . . . . . . . . . . . 5,850 1,305,837 0.3INTERACTIVE MEDIA & SERVICES
Tencent Holdings Ltd. . . . . . . . . . . . . . . . . . . . . . . . . . . . . . . . . . . . . . . . . . . . . . . . . . . . . . . . . 102,400 4,380,511 1.1 17,463,577 4.3
CONSUMER DISCRETIONARYAUTO COMPONENTS
Hankook Tire Co., Ltd. . . . . . . . . . . . . . . . . . . . . . . . . . . . . . . . . . . . . . . . . . . . . . . . . . . . . . . . 122,682 4,663,159 1.1Mando Corp. . . . . . . . . . . . . . . . . . . . . . . . . . . . . . . . . . . . . . . . . . . . . . . . . . . . . . . . . . . . . . . . 77,600 2,263,075 0.6 6,926,234 1.7
DIVERSIFIED CONSUMER SERVICESNew Oriental Education & Technology Group, Inc. (Sponsored ADR) . . . . . . . . . . . . . . . . . . 17,310 1,420,459 0.3
INTERNET & DIRECT MARKETING RETAILAlibaba Group Holding Ltd. (Sponsored ADR) . . . . . . . . . . . . . . . . . . . . . . . . . . . . . . . . . . . . 21,140 3,869,254 1.0
TEXTILES, APPAREL & LUXURY GOODSYue Yuen Industrial Holdings Ltd. . . . . . . . . . . . . . . . . . . . . . . . . . . . . . . . . . . . . . . . . . . . . . . 602,500 2,026,307 0.5 14,242,254 3.5
CONSUMER STAPLESFOOD & STAPLES RETAILING
E-MART, Inc. . . . . . . . . . . . . . . . . . . . . . . . . . . . . . . . . . . . . . . . . . . . . . . . . . . . . . . . . . . . . . . 42,260 6,763,404 1.7FOOD PRODUCTS
WH Group Ltd. . . . . . . . . . . . . . . . . . . . . . . . . . . . . . . . . . . . . . . . . . . . . . . . . . . . . . . . . . . . . . 6,011,500 5,337,769 1.3 12,101,173 3.0
UTILITIESGAS UTILITIES
China Resources Gas Group Ltd. . . . . . . . . . . . . . . . . . . . . . . . . . . . . . . . . . . . . . . . . . . . . . . . 960,000 4,170,324 1.1ENN Energy Holdings Ltd. . . . . . . . . . . . . . . . . . . . . . . . . . . . . . . . . . . . . . . . . . . . . . . . . . . . . 430,000 4,437,084 1.1GAIL India Ltd. . . . . . . . . . . . . . . . . . . . . . . . . . . . . . . . . . . . . . . . . . . . . . . . . . . . . . . . . . . . . 440,780 2,125,622 0.5 10,733,030 2.7
HEALTH CAREHEALTH CARE PROVIDERS & SERVICES
Shanghai Pharmaceuticals Holding Co., Ltd. - Class H . . . . . . . . . . . . . . . . . . . . . . . . . . . . . . 2,652,900 5,961,611 1.4

AB FCP I
49
+ Used for share class hedging purposes.(a) Represents entire or partial securities out on loan. See Note N for securities lending information.(b) Overnight deposit.
Currency Abbreviations:AUD – Australian DollarCAD – Canadian DollarCNH – Chinese Yuan Renminbi (Offshore)EUR – EuroGBP – Great British PoundNZD – New Zealand DollarSGD – Singapore DollarUSD – United States DollarZAR – South African Rand
Glossary:ADR – American Depositary Receipt
See notes to financial statements.
AsiaEx-JapanEquityPortfolio
Rate Date Shares Value Net Assets (USD) %
PHARMACEUTICALSChina Resources Pharmaceutical Group Ltd. . . . . . . . . . . . . . . . . . 3,559,700 $ 4,770,603 1.2% 10,732,214 2.6 399,194,104 98.4
EQUITY LINKED NOTESMATERIALSCONSTRUCTION MATERIALS
Huaxin Cement Co., Ltd., UBS AG, expiring 5/06/19 . . . . . . . . . . 1,943,035 5,536,002 1.3Total Investments
(cost $386,315,601) . . . . . . . . . . . . . . . . . . . . . . . . . . . . . . . . . . . . . $ 404,730,106 99.7%Time Deposits
Barclays, London(b) . . . . . . . . . . . . . . . . . . . . . . . . . . . . . . . . . . . . 1.76 % – 4,034,775 1.0BBH, Grand Cayman(b) . . . . . . . . . . . . . . . . . . . . . . . . . . . . . . . . . (0.57) % – 102 0.0BBH, Grand Cayman(b) . . . . . . . . . . . . . . . . . . . . . . . . . . . . . . . . . 0.16 % – 155,773 0.1BBH, Grand Cayman(b) . . . . . . . . . . . . . . . . . . . . . . . . . . . . . . . . . 0.76 % – 124 0.0BBH, Grand Cayman(b) . . . . . . . . . . . . . . . . . . . . . . . . . . . . . . . . . 1.40 % – 1,322 0.0Hong Kong & Shanghai Bank, Singapore(b) . . . . . . . . . . . . . . . . . 0.67 % – 32,818 0.0HSBC Bank PLC, London(b) . . . . . . . . . . . . . . . . . . . . . . . . . . . . . 5.12 % – 211,472 0.1JPMorgan Chase, New York(b) . . . . . . . . . . . . . . . . . . . . . . . . . . . . 1.76 % – 109,735 0.0National Australia Bank, London(b) . . . . . . . . . . . . . . . . . . . . . . . . 0.76 % – 40,916 0.0SEB, Stockholm(b) . . . . . . . . . . . . . . . . . . . . . . . . . . . . . . . . . . . . . (0.26) % – 24,608 0.0
Total Time Deposits . . . . . . . . . . . . . . . . . . . . . . . . . . . . . . . . . . . . . . . . . . . . . . . . . . . . . . 4,611,645 1.2Other assets less liabilities . . . . . . . . . . . . . . . . . . . . . . . . . . . . . . . . . . . . . . . . . . . . . . . . . (3,550,886) (0.9)Net Assets . . . . . . . . . . . . . . . . . . . . . . . . . . . . . . . . . . . . . . . . . . . . . . . . . . . . . . . . . . . . . . $ 405,790,865 100.0%
FORWARD FOREIGN CURRENCY CONTRACTS
Contracts to In Exchange Unrealized Deliver For Settlement Appreciation/ Counterparty (000) (000) Date (Depreciation)
Brown Brothers Harriman & Co.+. . . . . . . . . . . . . . . . . . . . . . . . USD 44,574 AUD 62,695 3/06/19 $ (98,171)Brown Brothers Harriman & Co.+. . . . . . . . . . . . . . . . . . . . . . . . USD 3,596 CAD 4,734 3/06/19 2,886Brown Brothers Harriman & Co.+. . . . . . . . . . . . . . . . . . . . . . . . USD 13 CNH 85 3/06/19 152Brown Brothers Harriman & Co.+. . . . . . . . . . . . . . . . . . . . . . . . USD 12 EUR 10 3/06/19 15Brown Brothers Harriman & Co.+. . . . . . . . . . . . . . . . . . . . . . . . USD 2,328 GBP 1,778 3/06/19 30,679Brown Brothers Harriman & Co.+. . . . . . . . . . . . . . . . . . . . . . . . USD 7,055 NZD 10,338 3/06/19 (14,589)Brown Brothers Harriman & Co.+. . . . . . . . . . . . . . . . . . . . . . . . USD 53 SGD 71 3/06/19 (8)Brown Brothers Harriman & Co.+. . . . . . . . . . . . . . . . . . . . . . . . USD 25,933 ZAR 362,546 3/06/19 (214,655)
$ (293,691)
Appreciation $ 33,732 Depreciation $ (327,423)

AB FCP I
50
Portfolio of investmentsFebruary 28, 2019 (unaudited) JapanStrategicValuePortfolio
Shares Value Net Assets (JPY) %
TRANSFERABLE SECURITIES QUOTED ON A STOCK EXCHANGE OR DEALT IN ON ANOTHER REGULATED MARKETCOMMON STOCKSCONSUMER DISCRETIONARYAUTO COMPONENTS
Bridgestone Corp. . . . . . . . . . . . . . . . . . . . . . . . . . . . . . . . . . . . . . . . . . . . . . . . . . . . . . . . . . . . 66,100 ¥ 290,377,300 1.5NGK Spark Plug Co., Ltd. . . . . . . . . . . . . . . . . . . . . . . . . . . . . . . . . . . . . . . . . . . . . . . . . . . . . 233,100 551,514,600 2.7Toyo Tire Corp. . . . . . . . . . . . . . . . . . . . . . . . . . . . . . . . . . . . . . . . . . . . . . . . . . . . . . . . . . . . . . 297,100 420,990,700 2.1 1,262,882,600 6.3
AUTOMOBILESHonda Motor Co., Ltd. . . . . . . . . . . . . . . . . . . . . . . . . . . . . . . . . . . . . . . . . . . . . . . . . . . . . . . . 174,100 548,937,300 2.7Isuzu Motors Ltd. . . . . . . . . . . . . . . . . . . . . . . . . . . . . . . . . . . . . . . . . . . . . . . . . . . . . . . . . . . . 285,900 456,153,450 2.3Subaru Corp. . . . . . . . . . . . . . . . . . . . . . . . . . . . . . . . . . . . . . . . . . . . . . . . . . . . . . . . . . . . . . . . 245,600 694,188,400 3.4 1,699,279,150 8.4
HOUSEHOLD DURABLESNikon Corp. . . . . . . . . . . . . . . . . . . . . . . . . . . . . . . . . . . . . . . . . . . . . . . . . . . . . . . . . . . . . . . . . 219,000 369,234,000 1.8Panasonic Corp. . . . . . . . . . . . . . . . . . . . . . . . . . . . . . . . . . . . . . . . . . . . . . . . . . . . . . . . . . . . . 613,100 628,427,500 3.1 997,661,500 4.9 3,959,823,250 19.6
MATERIALSCHEMICALS
Air Water, Inc. . . . . . . . . . . . . . . . . . . . . . . . . . . . . . . . . . . . . . . . . . . . . . . . . . . . . . . . . . . . . . . 158,200 280,963,200 1.4Nippon Shokubai Co., Ltd. . . . . . . . . . . . . . . . . . . . . . . . . . . . . . . . . . . . . . . . . . . . . . . . . . . . . 49,300 374,187,000 1.9Toray Industries, Inc. . . . . . . . . . . . . . . . . . . . . . . . . . . . . . . . . . . . . . . . . . . . . . . . . . . . . . . . . 559,500 433,892,250 2.1Tosoh Corp. . . . . . . . . . . . . . . . . . . . . . . . . . . . . . . . . . . . . . . . . . . . . . . . . . . . . . . . . . . . . . . . . 324,600 533,317,800 2.6 1,622,360,250 8.0
CONTAINERS & PACKAGINGRengo Co., Ltd. . . . . . . . . . . . . . . . . . . . . . . . . . . . . . . . . . . . . . . . . . . . . . . . . . . . . . . . . . . . . . 496,000 479,136,000 2.4
METALS & MININGSumitomo Metal Mining Co., Ltd. . . . . . . . . . . . . . . . . . . . . . . . . . . . . . . . . . . . . . . . . . . . . . . 141,400 461,529,600 2.3Yamato Kogyo Co., Ltd. . . . . . . . . . . . . . . . . . . . . . . . . . . . . . . . . . . . . . . . . . . . . . . . . . . . . . . 128,500 395,780,000 1.9 857,309,600 4.2 2,958,805,850 14.6
INDUSTRIALSAIRLINES
Japan Airlines Co., Ltd. . . . . . . . . . . . . . . . . . . . . . . . . . . . . . . . . . . . . . . . . . . . . . . . . . . . . . . . 148,900 605,278,500 3.0MACHINERY
IHI Corp. . . . . . . . . . . . . . . . . . . . . . . . . . . . . . . . . . . . . . . . . . . . . . . . . . . . . . . . . . . . . . . . . . . 209,200 614,211,200 3.0ROAD & RAIL
East Japan Railway Co. . . . . . . . . . . . . . . . . . . . . . . . . . . . . . . . . . . . . . . . . . . . . . . . . . . . . . . . 46,800 498,888,000 2.5TRADING COMPANIES & DISTRIBUTORS
Mitsubishi Corp. . . . . . . . . . . . . . . . . . . . . . . . . . . . . . . . . . . . . . . . . . . . . . . . . . . . . . . . . . . . . 201,700 633,136,300 3.1 2,351,514,000 11.6
COMMUNICATION SERVICESDIVERSIFIED TELECOMMUNICATION SERVICES
Nippon Telegraph & Telephone Corp. . . . . . . . . . . . . . . . . . . . . . . . . . . . . . . . . . . . . . . . . . . . 221,600 1,063,901,600 5.2ENTERTAINMENT
Nintendo Co., Ltd. . . . . . . . . . . . . . . . . . . . . . . . . . . . . . . . . . . . . . . . . . . . . . . . . . . . . . . . . . . 21,100 642,284,000 3.2INTERACTIVE MEDIA & SERVICES
Yahoo Japan Corp. . . . . . . . . . . . . . . . . . . . . . . . . . . . . . . . . . . . . . . . . . . . . . . . . . . . . . . . . . . 924,300 275,441,400 1.4MEDIA
TV Asahi Holdings Corp. . . . . . . . . . . . . . . . . . . . . . . . . . . . . . . . . . . . . . . . . . . . . . . . . . . . . . 100,100 204,204,000 1.0 2,185,831,000 10.8
FINANCIALSBANKS
Mitsubishi UFJ Financial Group, Inc. . . . . . . . . . . . . . . . . . . . . . . . . . . . . . . . . . . . . . . . . . . . . 1,592,700 918,510,090 4.6Sumitomo Mitsui Financial Group, Inc. . . . . . . . . . . . . . . . . . . . . . . . . . . . . . . . . . . . . . . . . . . 139,700 550,697,400 2.7 1,469,207,490 7.3
CONSUMER FINANCEHitachi Capital Corp. . . . . . . . . . . . . . . . . . . . . . . . . . . . . . . . . . . . . . . . . . . . . . . . . . . . . . . . . 147,400 388,841,200 1.9
DIVERSIFIED FINANCIAL SERVICESORIX Corp. . . . . . . . . . . . . . . . . . . . . . . . . . . . . . . . . . . . . . . . . . . . . . . . . . . . . . . . . . . . . . . . . 61,200 98,654,400 0.5 1,956,703,090 9.7
INFORMATION TECHNOLOGYELECTRONIC EQUIPMENT, INSTRUMENTS & COMPONENTS
Hitachi Ltd. . . . . . . . . . . . . . . . . . . . . . . . . . . . . . . . . . . . . . . . . . . . . . . . . . . . . . . . . . . . . . . . . 97,300 324,495,500 1.6IT SERVICES
Fujitsu Ltd. . . . . . . . . . . . . . . . . . . . . . . . . . . . . . . . . . . . . . . . . . . . . . . . . . . . . . . . . . . . . . . . . 100,500 754,654,500 3.7

AB FCP I
51
JapanStrategicValuePortfolio
Rate Date Shares Value Net Assets (JPY) %
SEMICONDUCTORS & SEMICONDUCTOR EQUIPMENTSCREEN Holdings Co., Ltd. . . . . . . . . . . . . . . . . . . . . . . . . . . . . . 17,400 ¥ 77,256,000 0.4%SUMCO Corp. . . . . . . . . . . . . . . . . . . . . . . . . . . . . . . . . . . . . . . . . 158,100 223,395,300 1.1 300,651,300 1.5
SOFTWAREOracle Corp. Japan . . . . . . . . . . . . . . . . . . . . . . . . . . . . . . . . . . . . . 28,800 239,328,000 1.2
TECHNOLOGY HARDWARE, STORAGE & PERIPHERALSMaxell Holdings Ltd. . . . . . . . . . . . . . . . . . . . . . . . . . . . . . . . . . . . 196,800 321,177,600 1.6 1,940,306,900 9.6
CONSUMER STAPLESBEVERAGES
Coca-Cola Bottlers Japan Holdings, Inc. . . . . . . . . . . . . . . . . . . . . 79,600 228,292,800 1.1FOOD & STAPLES RETAILING
Matsumotokiyoshi Holdings Co., Ltd. . . . . . . . . . . . . . . . . . . . . . . 64,900 247,918,000 1.2Seven & i Holdings Co., Ltd. . . . . . . . . . . . . . . . . . . . . . . . . . . . . . 135,700 664,115,800 3.3 912,033,800 4.5
TOBACCOJapan Tobacco, Inc. . . . . . . . . . . . . . . . . . . . . . . . . . . . . . . . . . . . . . 276,100 782,191,300 3.9 1,922,517,900 9.5
HEALTH CAREHEALTH CARE EQUIPMENT & SUPPLIES
Hoya Corp. . . . . . . . . . . . . . . . . . . . . . . . . . . . . . . . . . . . . . . . . . . . 74,200 504,931,000 2.5PHARMACEUTICALS
Astellas Pharma, Inc. . . . . . . . . . . . . . . . . . . . . . . . . . . . . . . . . . . . 202,700 348,339,950 1.7Nippon Shinyaku Co., Ltd. . . . . . . . . . . . . . . . . . . . . . . . . . . . . . . . 49,100 347,137,000 1.7Ono Pharmaceutical Co., Ltd. . . . . . . . . . . . . . . . . . . . . . . . . . . . . . 147,500 337,553,750 1.7 1,033,030,700 5.1 1,537,961,700 7.6
ENERGYOIL, GAS & CONSUMABLE FUELS
JXTG Holdings, Inc. . . . . . . . . . . . . . . . . . . . . . . . . . . . . . . . . . . . . 1,723,400 897,374,380 4.4REAL ESTATEREAL ESTATE MANAGEMENT & DEVELOPMENT
Mitsui Fudosan Co., Ltd. . . . . . . . . . . . . . . . . . . . . . . . . . . . . . . . . 181,700 479,233,750 2.4UTILITIESINDEPENDENT POWER AND RENEWABLE ELECTRICITY PRODUCERS
Electric Power Development Co., Ltd. . . . . . . . . . . . . . . . . . . . . . . 51,900 144,489,600 0.7Total Investments
(cost ¥21,052,873,827) . . . . . . . . . . . . . . . . . . . . . . . . . . . . . . . . . . ¥ 20,334,561,420 100.5%Time Deposits
BBH, Grand Cayman(a). . . . . . . . . . . . . . . . . . . . . . . . . . . . . . . . . . 0.76 % – 72,655 0.0BBH, Grand Cayman(a). . . . . . . . . . . . . . . . . . . . . . . . . . . . . . . . . . 1.40 % – 30,972 0.0BBH, Grand Cayman(a). . . . . . . . . . . . . . . . . . . . . . . . . . . . . . . . . . 5.12 % – 373,641 0.0Citibank, New York(a) . . . . . . . . . . . . . . . . . . . . . . . . . . . . . . . . . . . 1.76 % – 2,707,885 0.0SEB, Stockholm(a) . . . . . . . . . . . . . . . . . . . . . . . . . . . . . . . . . . . . . (0.26)% – 141,987,289 0.7
Total Time Deposits . . . . . . . . . . . . . . . . . . . . . . . . . . . . . . . . . . . . . . . . . . . . . . . . . . . . . . 145,172,442 0.7Other assets less liabilities . . . . . . . . . . . . . . . . . . . . . . . . . . . . . . . . . . . . . . . . . . . . . . . . . (237,752,040) (1.2)Net Assets . . . . . . . . . . . . . . . . . . . . . . . . . . . . . . . . . . . . . . . . . . . . . . . . . . . . . . . . . . . . . . ¥ 20,241,981,822 100.0%
FORWARD FOREIGN CURRENCY CONTRACTS
Contracts to In Exchange Unrealized Deliver For Settlement Appreciation/ Counterparty (000) (000) Date (Depreciation)
Brown Brothers Harriman & Co.+. . . . . . . . . . . . . . . . . . . . . . . . JPY 789,379 AUD 9,967 3/06/19 ¥ (1,382,837)Brown Brothers Harriman & Co.+. . . . . . . . . . . . . . . . . . . . . . . . JPY 13,318 CZK 2,717 3/06/19 121,737Brown Brothers Harriman & Co.+. . . . . . . . . . . . . . . . . . . . . . . . JPY 199,090 EUR 1,582 3/06/19 1,514,973Brown Brothers Harriman & Co.+. . . . . . . . . . . . . . . . . . . . . . . . JPY 64,185 NZD 843 3/06/19 (241,122)Brown Brothers Harriman & Co.+. . . . . . . . . . . . . . . . . . . . . . . . JPY 11,296 SGD 138 3/06/19 51,324Brown Brothers Harriman & Co.+. . . . . . . . . . . . . . . . . . . . . . . . JPY 2,212,694 USD 19,984 3/06/19 14,542,965Brown Brothers Harriman & Co.+. . . . . . . . . . . . . . . . . . . . . . . . JPY 114,340 ZAR 14,308 3/06/19 (1,222,799)
¥ 13,384,241
Appreciation ¥ 16,230,999 Depreciation ¥ (2,846,758)

AB FCP I
52
Portfolio of investments (continued) JapanStrategicValuePortfolio
+ Used for share class hedging purposes.(a) Overnight deposit.
Currency Abbreviations:AUD – Australian DollarCZK – Czech KorunaEUR – EuroJPY – Japanese YenNZD – New Zealand DollarSGD – Singapore DollarUSD – United States DollarZAR – South African Rand
See notes to financial statements.

AB FCP I
53
Portfolio of investmentsFebruary28,2019(unaudited) ChinaOpportunityPortfolio
Shares Value Net Assets (USD) %
TRANSFERABLE SECURITIES QUOTED ON A STOCK EXCHANGE OR DEALT IN ON ANOTHER REGULATED MARKETCOMMON STOCKSFINANCIALSBANKS
Bank of China Ltd. - Class H . . . . . . . . . . . . . . . . . . . . . . . . . . . . . . . . . . . . . . . . . . . . . . . . . . 2,372,000 $ 1,105,961 0.7%China CITIC Bank Corp., Ltd. - Class H . . . . . . . . . . . . . . . . . . . . . . . . . . . . . . . . . . . . . . . . . 5,625,000 3,654,575 2.5China Construction Bank Corp. - Class H . . . . . . . . . . . . . . . . . . . . . . . . . . . . . . . . . . . . . . . . 6,336,100 5,634,062 3.8China Minsheng Banking Corp., Ltd. - Class H . . . . . . . . . . . . . . . . . . . . . . . . . . . . . . . . . . . . 1,905,000 1,470,658 1.0Industrial Bank Co., Ltd. - Class A . . . . . . . . . . . . . . . . . . . . . . . . . . . . . . . . . . . . . . . . . . . . . . 565,700 1,507,757 1.0 13,373,013 9.0
CAPITAL MARKETSChina Everbright Ltd. . . . . . . . . . . . . . . . . . . . . . . . . . . . . . . . . . . . . . . . . . . . . . . . . . . . . . . . . 622,000 1,256,718 0.9GF Securities Co., Ltd. - Class H . . . . . . . . . . . . . . . . . . . . . . . . . . . . . . . . . . . . . . . . . . . . . . . 403,600 680,743 0.5Haitong Securities Co., Ltd. - Class H . . . . . . . . . . . . . . . . . . . . . . . . . . . . . . . . . . . . . . . . . . . 1,245,200 1,652,917 1.1Huatai Securities Co., Ltd. . . . . . . . . . . . . . . . . . . . . . . . . . . . . . . . . . . . . . . . . . . . . . . . . . . . . 493,200 1,693,570 1.1 5,283,948 3.6
INSURANCEPing An Insurance Group Co. of China Ltd. - Class H . . . . . . . . . . . . . . . . . . . . . . . . . . . . . . . 662,000 6,970,197 4.7 25,627,158 17.3
COMMUNICATION SERVICESDIVERSIFIED TELECOMMUNICATION SERVICES
China Telecom Corp., Ltd. - Class H . . . . . . . . . . . . . . . . . . . . . . . . . . . . . . . . . . . . . . . . . . . . 2,630,000 1,423,931 1.0China Unicom Hong Kong Ltd. . . . . . . . . . . . . . . . . . . . . . . . . . . . . . . . . . . . . . . . . . . . . . . . . 1,886,000 2,236,843 1.5 3,660,774 2.5
ENTERTAINMENTNetEase, Inc. (ADR) . . . . . . . . . . . . . . . . . . . . . . . . . . . . . . . . . . . . . . . . . . . . . . . . . . . . . . . . . 12,370 2,761,231 1.8INTERACTIVE MEDIA & SERVICESBaidu, Inc. (Sponsored ADR) . . . . . . . . . . . . . . . . . . . . . . . . . . . . . . . . . . . . . . . . . . . . . . . . . . 20,590 3,346,699 2.3Tencent Holdings Ltd. . . . . . . . . . . . . . . . . . . . . . . . . . . . . . . . . . . . . . . . . . . . . . . . . . . . . . . . . 325,900 13,941,491 9.4 17,288,190 11.7
WIRELESS TELECOMMUNICATION SERVICESSmarTone Telecommunications Holdings Ltd. . . . . . . . . . . . . . . . . . . . . . . . . . . . . . . . . . . . . . 933,000 1,061,396 0.7 24,771,591 16.7
CONSUMER DISCRETIONARYHOTELS, RESTAURANTS & LEISURE
Galaxy Entertainment Group Ltd. . . . . . . . . . . . . . . . . . . . . . . . . . . . . . . . . . . . . . . . . . . . . . . . 105,000 745,724 0.5Melco International Development Ltd. . . . . . . . . . . . . . . . . . . . . . . . . . . . . . . . . . . . . . . . . . . . 299,000 730,574 0.5 1,476,298 1.0
HOUSEHOLD DURABLESHisense Home Appliances Group Co., Ltd. - Class H . . . . . . . . . . . . . . . . . . . . . . . . . . . . . . . 1,181,000 1,227,677 0.8
INTERNET & DIRECT MARKETING RETAILAlibaba Group Holding Ltd. (Sponsored ADR) . . . . . . . . . . . . . . . . . . . . . . . . . . . . . . . . . . . . 84,030 15,380,011 10.4
TEXTILES, APPAREL & LUXURY GOODSLi Ning Co., Ltd. . . . . . . . . . . . . . . . . . . . . . . . . . . . . . . . . . . . . . . . . . . . . . . . . . . . . . . . . . . . . 1,358,000 1,902,991 1.3Xtep International Holdings Ltd. . . . . . . . . . . . . . . . . . . . . . . . . . . . . . . . . . . . . . . . . . . . . . . . 2,302,000 1,510,277 1.0 3,413,268 2.3 21,497,254 14.5
INDUSTRIALSINDUSTRIAL CONGLOMERATES
Guoco Group Ltd. (a). . . . . . . . . . . . . . . . . . . . . . . . . . . . . . . . . . . . . . . . . . . . . . . . . . . . . . . . . 122,000 1,725,151 1.1NWS Holdings Ltd. . . . . . . . . . . . . . . . . . . . . . . . . . . . . . . . . . . . . . . . . . . . . . . . . . . . . . . . . . 473,000 1,144,877 0.8 2,870,028 1.9
MACHINERYSany Heavy Industry Co., Ltd. . . . . . . . . . . . . . . . . . . . . . . . . . . . . . . . . . . . . . . . . . . . . . . . . . 1,659,370 2,572,897 1.7Weichai Power Co., Ltd. - Class H . . . . . . . . . . . . . . . . . . . . . . . . . . . . . . . . . . . . . . . . . . . . . . 1,225,000 1,701,010 1.2 4,273,907 2.9
TRADING COMPANIES & DISTRIBUTORSBOC Aviation Ltd. . . . . . . . . . . . . . . . . . . . . . . . . . . . . . . . . . . . . . . . . . . . . . . . . . . . . . . . . . . 542,300 4,690,872 3.2Mitsubishi Corp. . . . . . . . . . . . . . . . . . . . . . . . . . . . . . . . . . . . . . . . . . . . . . . . . . . . . . . . . . . . . 14,600 411,155 0.3 5,102,027 3.5
TRANSPORTATION INFRASTRUCTUREYuexiu Transport Infrastructure Ltd. . . . . . . . . . . . . . . . . . . . . . . . . . . . . . . . . . . . . . . . . . . . . . 3,424,000 2,665,134 1.8 14,911,096 10.1

AB FCP I
54
Portfolio of investments (continued) ChinaOpportunityPortfolio
Rate Date Shares Value Net Assets (USD) %
ENERGYOIL, GAS & CONSUMABLE FUELS
China Petroleum & Chemical Corp. - Class H . . . . . . . . . . . . . . . . 5,322,000 $ 4,596,727 3.1%China Shenhua Energy Co., Ltd. - Class H . . . . . . . . . . . . . . . . . . . 480,500 1,185,067 0.8CNOOC Ltd. . . . . . . . . . . . . . . . . . . . . . . . . . . . . . . . . . . . . . . . . . . 998,000 1,721,446 1.2PetroChina Co., Ltd. - Class H . . . . . . . . . . . . . . . . . . . . . . . . . . . . 7,080,000 4,681,066 3.1 12,184,306 8.2
INFORMATION TECHNOLOGYCOMMUNICATIONS EQUIPMENT
Nokia Oyj (Sponsored ADR) - Class A . . . . . . . . . . . . . . . . . . . . . . 179,570 1,093,581 0.8ELECTRONIC EQUIPMENT, INSTRUMENTS & COMPONENTS
Universal Scientific Industrial Shanghai Co., Ltd. - Class A . . . . . 639,185 1,224,772 0.8SEMICONDUCTORS & SEMICONDUCTOR EQUIPMENT
Hua Hong Semiconductor Ltd. . . . . . . . . . . . . . . . . . . . . . . . . . . . . 1,675,600 3,919,108 2.6Nanya Technology Corp. . . . . . . . . . . . . . . . . . . . . . . . . . . . . . . . . 711,000 1,436,947 1.0 5,356,055 3.6
TECHNOLOGY HARDWARE, STORAGE & PERIPHERALSLenovo Group Ltd. . . . . . . . . . . . . . . . . . . . . . . . . . . . . . . . . . . . . . 3,728,000 3,357,681 2.3 11,032,089 7.5
REAL ESTATEREAL ESTATE MANAGEMENT & DEVELOPMENT
China Resources Land Ltd. . . . . . . . . . . . . . . . . . . . . . . . . . . . . . . . 608,000 2,269,423 1.5CIFI Holdings Group Co., Ltd. . . . . . . . . . . . . . . . . . . . . . . . . . . . . 3,734,000 2,435,502 1.6CK Asset Holdings Ltd. . . . . . . . . . . . . . . . . . . . . . . . . . . . . . . . . . 158,000 1,311,341 0.9Sun Hung Kai Properties Ltd. . . . . . . . . . . . . . . . . . . . . . . . . . . . . . 83,000 1,374,566 0.9Times China Holdings Ltd. . . . . . . . . . . . . . . . . . . . . . . . . . . . . . . . 2,574,000 3,344,667 2.3 10,735,499 7.2
MATERIALSCONSTRUCTION MATERIALS
Anhui Conch Cement Co., Ltd. - Class A . . . . . . . . . . . . . . . . . . . . 512,450 2,711,012 1.8Asia Cement China Holdings Corp. . . . . . . . . . . . . . . . . . . . . . . . . 775,000 700,978 0.5Huaxin Cement Co., Ltd. . . . . . . . . . . . . . . . . . . . . . . . . . . . . . . . . 2,335,254 4,656,496 3.1 8,068,486 5.4
CONSUMER STAPLESFOOD PRODUCTS
Fujian Sunner Development Co., Ltd. - Class A . . . . . . . . . . . . . . . 460,800 1,810,618 1.2Nestle SA (Sponsored ADR) . . . . . . . . . . . . . . . . . . . . . . . . . . . . . . 15,080 1,362,176 0.9New Hope Liuhe Co., Ltd. - Class A . . . . . . . . . . . . . . . . . . . . . . . 1,152,206 1,822,635 1.2WH Group Ltd. . . . . . . . . . . . . . . . . . . . . . . . . . . . . . . . . . . . . . . . . 1,567,000 1,391,381 1.0 6,386,810 4.3
UTILITIESGAS UTILITIES
China Resources Gas Group Ltd. . . . . . . . . . . . . . . . . . . . . . . . . . . 282,000 1,225,032 0.9ENN Energy Holdings Ltd. . . . . . . . . . . . . . . . . . . . . . . . . . . . . . . . 146,000 1,506,545 1.0 2,731,577 1.9
INDEPENDENT POWER AND RENEWABLE ELECTRICITY PRODUCERSHuadian Power International Corp., Ltd. - Class H . . . . . . . . . . . . 6,792,000 2,976,462 2.0 5,708,039 3.9
HEALTH CAREHEALTH CARE PROVIDERS & SERVICES
Shanghai Pharmaceuticals Holding Co., Ltd. - Class H . . . . . . . . . 936,300 2,104,058 1.4PHARMACEUTICALS
CSPC Pharmaceutical Group Ltd. . . . . . . . . . . . . . . . . . . . . . . . . . 686,000 1,171,044 0.8 3,275,102 2.2 144,197,430 97.3
INVESTMENT COMPANIESFUNDS AND INVESTMENT TRUSTS
AB SICAV I - China Equity Portfolio Class S . . . . . . . . . . . . . . . . 157,776 3,158,599 2.1Total Investments
(cost $125,323,836) . . . . . . . . . . . . . . . . . . . . . . . . . . . . . . . . . . . . . $ 147,356,029 99.4%

AB FCP I
55
ChinaOpportunityPortfolio
Rate Date Value Net Assets (USD) %
Time DepositsBBH, Grand Cayman(b) . . . . . . . . . . . . . . . . . . . . . . . . . . . . . . . . . (0.57)% – $ 10,823 0.0%BBH, Grand Cayman(b) . . . . . . . . . . . . . . . . . . . . . . . . . . . . . . . . . (0.26)% – 7,182 0.0BBH, Grand Cayman(b) . . . . . . . . . . . . . . . . . . . . . . . . . . . . . . . . . 0.16 % – 160,604 0.1BBH, Grand Cayman(b) . . . . . . . . . . . . . . . . . . . . . . . . . . . . . . . . . 0.67 % – 1 0.0BBH, Grand Cayman(b) . . . . . . . . . . . . . . . . . . . . . . . . . . . . . . . . . 0.76 % – 2,146 0.0BBH, Grand Cayman(b) . . . . . . . . . . . . . . . . . . . . . . . . . . . . . . . . . 0.82 % – 76 0.0BBH, Grand Cayman(b) . . . . . . . . . . . . . . . . . . . . . . . . . . . . . . . . . 1.40 % – 2,043 0.0BBH, Grand Cayman(b) . . . . . . . . . . . . . . . . . . . . . . . . . . . . . . . . . 1.76 % – 13,029 0.0Citibank, New York(b). . . . . . . . . . . . . . . . . . . . . . . . . . . . . . . . . . . 1.76 % – 2,842,320 2.0HSBC Bank PLC, London(b) . . . . . . . . . . . . . . . . . . . . . . . . . . . . . 5.12 % – 19,922 0.0
Total Time Deposits . . . . . . . . . . . . . . . . . . . . . . . . . . . . . . . . . . . . . . . . . . . . . . . . . . . . . . 3,058,146 2.1Other assets less liabilities . . . . . . . . . . . . . . . . . . . . . . . . . . . . . . . . . . . . . . . . . . . . . . . . . (2,240,778) (1.5)Net Assets . . . . . . . . . . . . . . . . . . . . . . . . . . . . . . . . . . . . . . . . . . . . . . . . . . . . . . . . . . . . . . $ 148,173,397 100.0%
FORWARD FOREIGN CURRENCY CONTRACTS
Contracts to In Exchange Unrealized Deliver For Settlement Appreciation/ Counterparty (000) (000) Date (Depreciation)
Brown Brothers Harriman & Co.+. . . . . . . . . . . . . . . . . . . . . . . . USD 10,502 AUD 14,777 3/06/19 $ (20,082)Brown Brothers Harriman & Co.+. . . . . . . . . . . . . . . . . . . . . . . . USD 445 CAD 593 3/06/19 5,365Brown Brothers Harriman & Co.+. . . . . . . . . . . . . . . . . . . . . . . . USD 7 CNH 47 3/06/19 82Brown Brothers Harriman & Co.+. . . . . . . . . . . . . . . . . . . . . . . . USD 724 EUR 641 3/06/19 4,817Brown Brothers Harriman & Co.+. . . . . . . . . . . . . . . . . . . . . . . . USD 707 GBP 549 3/06/19 21,456Brown Brothers Harriman & Co.+. . . . . . . . . . . . . . . . . . . . . . . . USD 955 NZD 1,396 3/06/19 (4,495)Brown Brothers Harriman & Co.+. . . . . . . . . . . . . . . . . . . . . . . . USD 21 SGD 29 3/06/19 81Brown Brothers Harriman & Co.+. . . . . . . . . . . . . . . . . . . . . . . . USD 14,741 ZAR 208,790 3/06/19 69,391Brown Brothers Harriman & Co.+. . . . . . . . . . . . . . . . . . . . . . . . USD 7 CNH 48 3/22/19 27
$ 76,642
Appreciation $ 101,219 Depreciation $ (24,577)
+ Used for share class hedging purposes.(a) Represents entire or partial securities out on loan. See Note N for securities lending information.(b) Overnight deposit.
Currency Abbreviations:AUD – Australian DollarCAD – Canadian DollarCNH – Chinese Yuan Renminbi (Offshore)EUR – EuroGBP – Great British PoundNZD – New Zealand DollarSGD – Singapore DollarUSD – United States DollarZAR – South African Rand
Glossary:ADR – American Depositary Receipt
See notes to financial statements.

AB FCP I
56
Portfolio of investmentsFebruary 28, 2019 (unaudited) GlobalBondPortfolio
Rate Date Principal Value Net Assets (000) (USD) %
TRANSFERABLE SECURITIES QUOTED ON A STOCK EXCHANGE OR DEALT IN ON ANOTHER REGULATED MARKETGOVERNMENTS - TREASURIESAUSTRIA
Republic of Austria Government Bond . . . . . . . . . . . . . . . . . . . . . . 3.65% 4/20/22 EUR 6,738 $ 8,626,088 1.5%CANADA
Canadian Government Bond, Series A49 . . . . . . . . . . . . . . . . . . . . 9.25% 6/01/22 CAD 9,095 8,528,694 1.5FRANCE
French Republic Government Bond OAT . . . . . . . . . . . . . . . . . . . . 2.25% 5/25/24 EUR 4,426 5,642,982 1.0ITALY
Italy Buoni Poliennali Del Tesoro . . . . . . . . . . . . . . . . . . . . . . . . . . 3.75% 3/01/21 3,856 4,659,406 0.8Italy Buoni Poliennali Del Tesoro . . . . . . . . . . . . . . . . . . . . . . . . . . 3.75% 5/01/21 4,017 4,867,689 0.8Italy Buoni Poliennali Del Tesoro . . . . . . . . . . . . . . . . . . . . . . . . . . 3.75% 8/01/21 14,436 17,559,697 3.0Italy Buoni Poliennali Del Tesoro . . . . . . . . . . . . . . . . . . . . . . . . . . 4.75% 9/01/21 1,938 2,413,194 0.4Italy Buoni Poliennali Del Tesoro . . . . . . . . . . . . . . . . . . . . . . . . . . 5.00% 3/01/22 4,942 6,260,008 1.1 35,759,994 6.1
MALAYSIAMalaysia Government Bond, Series 0114 . . . . . . . . . . . . . . . . . . . . 4.18% 7/15/24 MYR 6,018 1,502,143 0.3Malaysia Government Bond, Series 0217 . . . . . . . . . . . . . . . . . . . . 4.06% 9/30/24 6,044 1,499,744 0.2Malaysia Government Bond, Series 0218 . . . . . . . . . . . . . . . . . . . . 3.76% 4/20/23 6,939 1,709,063 0.3 4,710,950 0.8
POLANDRepublic of Poland Government Bond, Series 922 . . . . . . . . . . . . . 5.75% 9/23/22 PLN 30,912 9,213,110 1.6
SINGAPORESingapore Government Bond. . . . . . . . . . . . . . . . . . . . . . . . . . . . . . 3.25% 9/01/20 SGD 14,086 10,604,661 1.8
SPAINSpain Government Bond . . . . . . . . . . . . . . . . . . . . . . . . . . . . . . . . . 5.50% 4/30/21 EUR 9,791 12,498,655 2.1
UNITED KINGDOMUnited Kingdom Gilt . . . . . . . . . . . . . . . . . . . . . . . . . . . . . . . . . . . . 8.00% 6/07/21 GBP 1,996 3,076,551 0.5
UNITED STATESU.S. Treasury Bonds . . . . . . . . . . . . . . . . . . . . . . . . . . . . . . . . . . . . 8.13% 8/15/19 USD 5,453 5,591,112 1.0U.S. Treasury Bonds . . . . . . . . . . . . . . . . . . . . . . . . . . . . . . . . . . . . 8.13% 5/15/21 36,984 41,375,371 7.1U.S. Treasury Bonds . . . . . . . . . . . . . . . . . . . . . . . . . . . . . . . . . . . . 8.13% 8/15/21 7,172 8,117,553 1.4U.S. Treasury Bonds . . . . . . . . . . . . . . . . . . . . . . . . . . . . . . . . . . . . 8.75% 8/15/20 57,579 62,625,818 10.8 117,709,854 20.3 216,371,539 37.2
CORPORATES - INVESTMENT GRADEINDUSTRIALBASIC
Air Products & Chemicals, Inc. . . . . . . . . . . . . . . . . . . . . . . . . . . . . 0.38% 6/01/21 EUR 1,940 2,219,263 0.4Anglo American Capital PLC . . . . . . . . . . . . . . . . . . . . . . . . . . . . . 3.50% 3/28/22 487 597,798 0.1Glencore Finance Europe Ltd. . . . . . . . . . . . . . . . . . . . . . . . . . . . . . 1.63% 1/18/22 974 1,129,804 0.2LYB International Finance II BV. . . . . . . . . . . . . . . . . . . . . . . . . . . 1.88% 3/02/22 1,616 1,885,070 0.3 5,831,935 1.0
CAPITAL GOODS3M Co. . . . . . . . . . . . . . . . . . . . . . . . . . . . . . . . . . . . . . . . . . . . . . . . 1.88% 11/15/21 1,577 1,881,932 0.3Caterpillar Financial Services Corp.(a) . . . . . . . . . . . . . . . . . . . . . . 3.02% 3/15/21 USD 1,767 1,764,084 0.3Dover Corp. . . . . . . . . . . . . . . . . . . . . . . . . . . . . . . . . . . . . . . . . . . . 2.13% 12/01/20 EUR 1,900 2,231,576 0.4Johnson Controls International PLC . . . . . . . . . . . . . . . . . . . . . . . . 0.00% 12/04/20 394 446,111 0.1Johnson Controls International PLC . . . . . . . . . . . . . . . . . . . . . . . . 1.00% 9/15/23 1,577 1,795,115 0.3Rolls-Royce PLC . . . . . . . . . . . . . . . . . . . . . . . . . . . . . . . . . . . . . . . 2.13% 6/18/21 1,889 2,249,808 0.4 10,368,626 1.8
COMMUNICATIONS - MEDIASky Ltd. . . . . . . . . . . . . . . . . . . . . . . . . . . . . . . . . . . . . . . . . . . . . . . 2.63% 9/16/19 USD 2,249 2,244,101 0.4
COMMUNICATIONS - TELECOMMUNICATIONSBritish Telecommunications PLC . . . . . . . . . . . . . . . . . . . . . . . . . . 0.50% 6/23/22 EUR 1,694 1,919,853 0.3Deutsche Telekom International Finance BV . . . . . . . . . . . . . . . . . 6.00% 7/08/19 USD 1,123 1,135,033 0.2Orange SA . . . . . . . . . . . . . . . . . . . . . . . . . . . . . . . . . . . . . . . . . . . . 5.38% 7/08/19 1,363 1,374,678 0.3Orange SA . . . . . . . . . . . . . . . . . . . . . . . . . . . . . . . . . . . . . . . . . . . . 7.25% 11/10/20 GBP 404 586,389 0.1 5,015,953 0.9
CONSUMER CYCLICAL - AUTOMOTIVEBMW Finance NV . . . . . . . . . . . . . . . . . . . . . . . . . . . . . . . . . . . . . . 0.25% 1/14/22 EUR 2,069 2,348,647 0.4Daimler AG . . . . . . . . . . . . . . . . . . . . . . . . . . . . . . . . . . . . . . . . . . . 2.25% 1/24/22 472 565,772 0.1Daimler International Finance BV. . . . . . . . . . . . . . . . . . . . . . . . . . 0.25% 8/09/21 1,207 1,371,871 0.2FCE Bank PLC . . . . . . . . . . . . . . . . . . . . . . . . . . . . . . . . . . . . . . . . 3.25% 11/19/20 GBP 1,402 1,866,176 0.3Harley-Davidson Financial Services, Inc. . . . . . . . . . . . . . . . . . . . . 2.85% 1/15/21 USD 1,397 1,371,300 0.2Harley-Davidson Financial Services, Inc.(a) . . . . . . . . . . . . . . . . . . 3.56% 3/02/21 988 985,695 0.2Nissan Motor Acceptance Corp. . . . . . . . . . . . . . . . . . . . . . . . . . . . 2.15% 9/28/20 1,047 1,024,012 0.2RCI Banque SA . . . . . . . . . . . . . . . . . . . . . . . . . . . . . . . . . . . . . . . . 0.25% 7/12/21 EUR 1,558 1,765,063 0.3Toyota Motor Credit Corp.. . . . . . . . . . . . . . . . . . . . . . . . . . . . . . . . 0.00% 7/21/21 1,612 1,835,572 0.3

AB FCP I
57
GlobalBondPortfolio
Rate Date Principal Value Net Assets (000) (USD) %
Volkswagen Financial Services AG . . . . . . . . . . . . . . . . . . . . . . . . . 1.38% 10/16/23 EUR 1,524 $ 1,737,978 0.3%Volkswagen International Finance NV, Series 4Y . . . . . . . . . . . . . . 0.50% 3/30/21 779 885,888 0.2 15,757,974 2.7
CONSUMER CYCLICAL - ENTERTAINMENTCarnival Corp. . . . . . . . . . . . . . . . . . . . . . . . . . . . . . . . . . . . . . . . . . 1.13% 11/06/19 1,047 1,197,397 0.2Carnival Corp. . . . . . . . . . . . . . . . . . . . . . . . . . . . . . . . . . . . . . . . . . 1.63% 2/22/21 925 1,082,013 0.2 2,279,410 0.4
CONSUMER CYCLICAL - OTHERMarriott International, Inc./MD . . . . . . . . . . . . . . . . . . . . . . . . . . . . 2.30% 1/15/22 USD 1,475 1,440,195 0.2
CONSUMER CYCLICAL - RESTAURANTSMcDonald’s Corp. . . . . . . . . . . . . . . . . . . . . . . . . . . . . . . . . . . . . . . 6.38% 2/03/20 GBP 779 1,079,092 0.2McDonald’s Corp., Series G . . . . . . . . . . . . . . . . . . . . . . . . . . . . . . 0.50% 1/15/21 EUR 974 1,117,702 0.2 2,196,794 0.4
CONSUMER CYCLICAL - RETAILERSLVMH Moet Hennessy Louis Vuitton SE . . . . . . . . . . . . . . . . . . . . 0.00% 5/26/20 969 1,102,881 0.2LVMH Moet Hennessy Louis Vuitton SE . . . . . . . . . . . . . . . . . . . . 0.00% 2/28/21 195 221,577 0.0 1,324,458 0.2
CONSUMER NON-CYCLICALAbbott Ireland Financing DAC . . . . . . . . . . . . . . . . . . . . . . . . . . . . 0.00% 9/27/20 2,029 2,305,590 0.4Amgen, Inc. . . . . . . . . . . . . . . . . . . . . . . . . . . . . . . . . . . . . . . . . . . . 1.25% 2/25/22 1,646 1,920,403 0.3AstraZeneca PLC(a). . . . . . . . . . . . . . . . . . . . . . . . . . . . . . . . . . . . . 3.39% 6/10/22 USD 826 816,926 0.1Bayer US Finance LLC . . . . . . . . . . . . . . . . . . . . . . . . . . . . . . . . . . 2.38% 10/08/19 2,259 2,248,726 0.4Coca-Cola Co. (The) . . . . . . . . . . . . . . . . . . . . . . . . . . . . . . . . . . . . 0.00% 3/09/21 EUR 1,928 2,194,944 0.4Coca-Cola European Partners PLC . . . . . . . . . . . . . . . . . . . . . . . . . 0.75% 2/24/22 1,665 1,918,793 0.3DH Europe Finance SA(a) . . . . . . . . . . . . . . . . . . . . . . . . . . . . . . . . 0.00% 6/30/22 2,064 2,324,296 0.4Diageo Finance PLC . . . . . . . . . . . . . . . . . . . . . . . . . . . . . . . . . . . . 0.00% 11/17/20 1,003 1,141,150 0.2Diageo Finance PLC . . . . . . . . . . . . . . . . . . . . . . . . . . . . . . . . . . . . 0.25% 10/22/21 1,229 1,404,048 0.3FBG Finance Pty Ltd.(a) . . . . . . . . . . . . . . . . . . . . . . . . . . . . . . . . . 2.95% 9/06/22 AUD 2,366 1,665,909 0.3GlaxoSmithKline Capital PLC . . . . . . . . . . . . . . . . . . . . . . . . . . . . 0.00% 9/12/20 EUR 1,841 2,093,312 0.4McKesson Corp. . . . . . . . . . . . . . . . . . . . . . . . . . . . . . . . . . . . . . . . 0.63% 8/17/21 1,976 2,264,736 0.4Merck & Co., Inc. . . . . . . . . . . . . . . . . . . . . . . . . . . . . . . . . . . . . . . 1.13% 10/15/21 1,879 2,194,256 0.4PepsiCo, Inc. . . . . . . . . . . . . . . . . . . . . . . . . . . . . . . . . . . . . . . . . . . 1.75% 4/28/21 2,128 2,504,119 0.4Pfizer, Inc. . . . . . . . . . . . . . . . . . . . . . . . . . . . . . . . . . . . . . . . . . . . . 0.00% 3/06/20 1,675 1,907,001 0.3Takeda Pharmaceutical Co., Ltd. . . . . . . . . . . . . . . . . . . . . . . . . . . . 0.38% 11/21/20 1,714 1,953,798 0.3 30,858,007 5.3
ENERGYBP Capital Markets PLC . . . . . . . . . . . . . . . . . . . . . . . . . . . . . . . . . 2.18% 9/28/21 1,879 2,253,348 0.4Dolphin Energy Ltd. LLC . . . . . . . . . . . . . . . . . . . . . . . . . . . . . . . . 5.89% 6/15/19 USD 411 411,577 0.1Korea Gas Corp.. . . . . . . . . . . . . . . . . . . . . . . . . . . . . . . . . . . . . . . . 4.25% 11/02/20 974 991,818 0.2Ras Laffan Liquefied Natural Gas Co., Ltd. 3 . . . . . . . . . . . . . . . . . 6.75% 9/30/19 1,339 1,365,705 0.2Schlumberger Finance Canada Ltd. . . . . . . . . . . . . . . . . . . . . . . . . . 2.20% 11/20/20 399 393,222 0.1Shell International Finance BV . . . . . . . . . . . . . . . . . . . . . . . . . . . . 1.25% 3/15/22 EUR 1,918 2,261,334 0.4TransCanada PipeLines Ltd. . . . . . . . . . . . . . . . . . . . . . . . . . . . . . . 2.13% 11/15/19 USD 2,128 2,117,598 0.3TransCanada PipeLines Ltd. . . . . . . . . . . . . . . . . . . . . . . . . . . . . . . 9.88% 1/01/21 409 455,058 0.1 10,249,660 1.8
SERVICESeBay, Inc. . . . . . . . . . . . . . . . . . . . . . . . . . . . . . . . . . . . . . . . . . . . . . 2.88% 8/01/21 2,702 2,685,934 0.4
TECHNOLOGYDXC Technology Co.. . . . . . . . . . . . . . . . . . . . . . . . . . . . . . . . . . . . 2.88% 3/27/20 1,244 1,238,998 0.2Fidelity National Information Services, Inc. . . . . . . . . . . . . . . . . . . 0.40% 1/15/21 EUR 1,983 2,260,489 0.4Hewlett Packard Enterprise Co.. . . . . . . . . . . . . . . . . . . . . . . . . . . . 2.10% 10/04/19 USD 556 552,855 0.1Honeywell International, Inc. . . . . . . . . . . . . . . . . . . . . . . . . . . . . . 0.65% 2/21/20 EUR 2,658 3,044,006 0.5IBM Corp. . . . . . . . . . . . . . . . . . . . . . . . . . . . . . . . . . . . . . . . . . . . . 0.38% 1/31/23 1,899 2,158,488 0.4IBM Credit LLC(a) . . . . . . . . . . . . . . . . . . . . . . . . . . . . . . . . . . . . . 2.89% 2/05/21 USD 682 679,246 0.1LG Display Co., Ltd. . . . . . . . . . . . . . . . . . . . . . . . . . . . . . . . . . . . . 3.88% 11/15/21 530 535,968 0.1Oracle Corp.. . . . . . . . . . . . . . . . . . . . . . . . . . . . . . . . . . . . . . . . . . . 2.25% 1/10/21 EUR 1,831 2,169,902 0.4 12,639,952 2.2
TRANSPORTATION - SERVICESFedEx Corp. . . . . . . . . . . . . . . . . . . . . . . . . . . . . . . . . . . . . . . . . . . . 0.50% 4/09/20 1,952 2,230,344 0.4Heathrow Funding Ltd. . . . . . . . . . . . . . . . . . . . . . . . . . . . . . . . . . . 1.88% 5/23/22 1,183 1,412,132 0.2Penske Truck Leasing Co. LP/PTL Finance Corp. . . . . . . . . . . . . . 3.65% 7/29/21 USD 1,685 1,688,769 0.3 . . . . . . . . . . . . . . . . . . . . . . . . . . . . . . . . . . . . . . . . . . . . . . . . . . . 5,331,245 0.9 108,224,244 18.6
FINANCIAL INSTITUTIONSBANKING
American Express Credit Corp. . . . . . . . . . . . . . . . . . . . . . . . . . . . . 0.63% 11/22/21 EUR 308 354,311 0.1Banco Santander SA . . . . . . . . . . . . . . . . . . . . . . . . . . . . . . . . . . . . 2.75% 9/12/23 GBP 1,363 1,816,504 0.3Bank of America Corp. . . . . . . . . . . . . . . . . . . . . . . . . . . . . . . . . . . 0.74% 2/07/22 EUR 1,724 1,978,644 0.3Banque Federative du Credit Mutuel SA. . . . . . . . . . . . . . . . . . . . . 0.38% 1/13/22 779 891,608 0.2Banque Federative du Credit Mutuel SA. . . . . . . . . . . . . . . . . . . . . 2.20% 7/20/20 USD 1,003 990,185 0.2Barclays PLC . . . . . . . . . . . . . . . . . . . . . . . . . . . . . . . . . . . . . . . . . . 1.50% 4/01/22 EUR 1,466 1,697,714 0.3
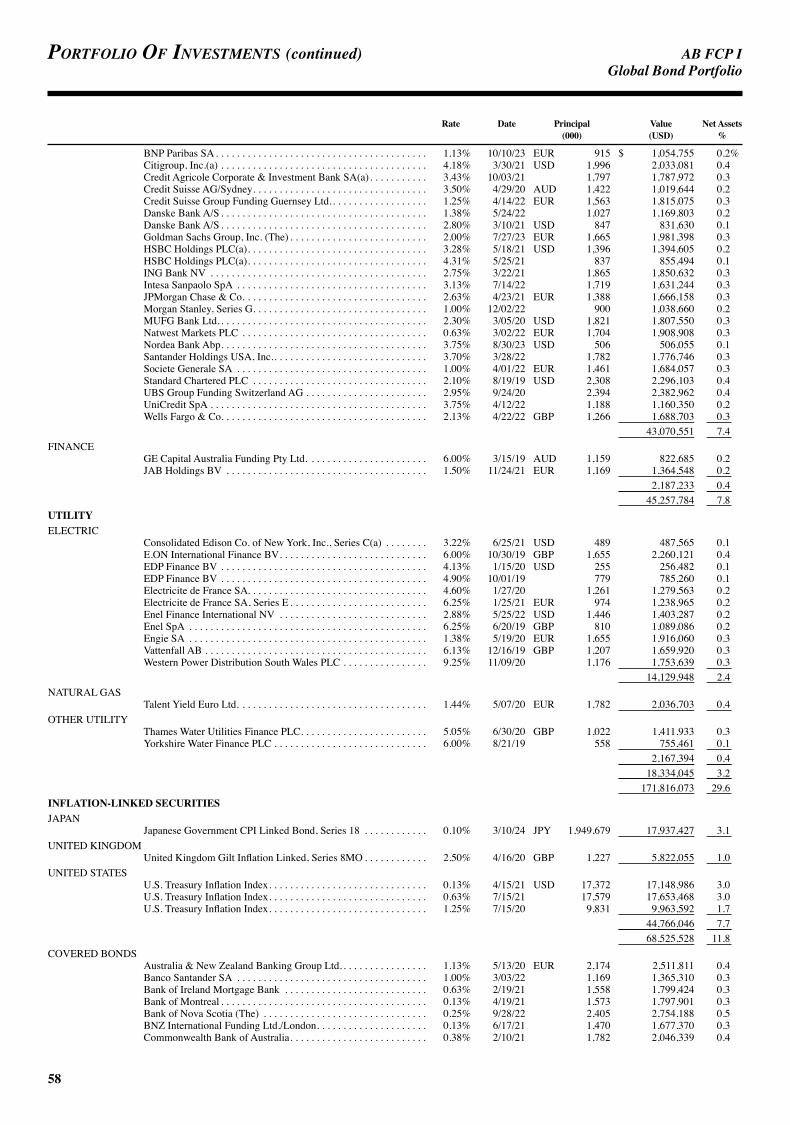
AB FCP I
58
Portfolio of investments (continued) GlobalBondPortfolio
Rate Date Principal Value Net Assets (000) (USD) %
BNP Paribas SA. . . . . . . . . . . . . . . . . . . . . . . . . . . . . . . . . . . . . . . . 1.13% 10/10/23 EUR 915 $ 1,054,755 0.2%Citigroup, Inc.(a) . . . . . . . . . . . . . . . . . . . . . . . . . . . . . . . . . . . . . . . 4.18% 3/30/21 USD 1,996 2,033,081 0.4Credit Agricole Corporate & Investment Bank SA(a). . . . . . . . . . . 3.43% 10/03/21 1,797 1,787,972 0.3Credit Suisse AG/Sydney. . . . . . . . . . . . . . . . . . . . . . . . . . . . . . . . . 3.50% 4/29/20 AUD 1,422 1,019,644 0.2Credit Suisse Group Funding Guernsey Ltd.. . . . . . . . . . . . . . . . . . 1.25% 4/14/22 EUR 1,563 1,815,075 0.3Danske Bank A/S . . . . . . . . . . . . . . . . . . . . . . . . . . . . . . . . . . . . . . . 1.38% 5/24/22 1,027 1,169,803 0.2Danske Bank A/S . . . . . . . . . . . . . . . . . . . . . . . . . . . . . . . . . . . . . . . 2.80% 3/10/21 USD 847 831,630 0.1Goldman Sachs Group, Inc. (The) . . . . . . . . . . . . . . . . . . . . . . . . . . 2.00% 7/27/23 EUR 1,665 1,981,398 0.3HSBC Holdings PLC(a). . . . . . . . . . . . . . . . . . . . . . . . . . . . . . . . . . 3.28% 5/18/21 USD 1,396 1,394,605 0.2HSBC Holdings PLC(a). . . . . . . . . . . . . . . . . . . . . . . . . . . . . . . . . . 4.31% 5/25/21 837 855,494 0.1ING Bank NV . . . . . . . . . . . . . . . . . . . . . . . . . . . . . . . . . . . . . . . . . 2.75% 3/22/21 1,865 1,850,632 0.3Intesa Sanpaolo SpA . . . . . . . . . . . . . . . . . . . . . . . . . . . . . . . . . . . . 3.13% 7/14/22 1,719 1,631,244 0.3JPMorgan Chase & Co. . . . . . . . . . . . . . . . . . . . . . . . . . . . . . . . . . . 2.63% 4/23/21 EUR 1,388 1,666,158 0.3Morgan Stanley, Series G. . . . . . . . . . . . . . . . . . . . . . . . . . . . . . . . . 1.00% 12/02/22 900 1,038,660 0.2MUFG Bank Ltd. . . . . . . . . . . . . . . . . . . . . . . . . . . . . . . . . . . . . . . . 2.30% 3/05/20 USD 1,821 1,807,550 0.3Natwest Markets PLC . . . . . . . . . . . . . . . . . . . . . . . . . . . . . . . . . . . 0.63% 3/02/22 EUR 1,704 1,908,908 0.3Nordea Bank Abp. . . . . . . . . . . . . . . . . . . . . . . . . . . . . . . . . . . . . . . 3.75% 8/30/23 USD 506 506,055 0.1Santander Holdings USA, Inc.. . . . . . . . . . . . . . . . . . . . . . . . . . . . . 3.70% 3/28/22 1,782 1,776,746 0.3Societe Generale SA . . . . . . . . . . . . . . . . . . . . . . . . . . . . . . . . . . . . 1.00% 4/01/22 EUR 1,461 1,684,057 0.3Standard Chartered PLC . . . . . . . . . . . . . . . . . . . . . . . . . . . . . . . . . 2.10% 8/19/19 USD 2,308 2,296,103 0.4UBS Group Funding Switzerland AG . . . . . . . . . . . . . . . . . . . . . . . 2.95% 9/24/20 2,394 2,382,962 0.4UniCredit SpA . . . . . . . . . . . . . . . . . . . . . . . . . . . . . . . . . . . . . . . . . 3.75% 4/12/22 1,188 1,160,350 0.2Wells Fargo & Co. . . . . . . . . . . . . . . . . . . . . . . . . . . . . . . . . . . . . . . 2.13% 4/22/22 GBP 1,266 1,688,703 0.3 43,070,551 7.4
FINANCEGE Capital Australia Funding Pty Ltd. . . . . . . . . . . . . . . . . . . . . . . 6.00% 3/15/19 AUD 1,159 822,685 0.2JAB Holdings BV . . . . . . . . . . . . . . . . . . . . . . . . . . . . . . . . . . . . . . 1.50% 11/24/21 EUR 1,169 1,364,548 0.2 2,187,233 0.4 45,257,784 7.8
UTILITYELECTRIC
Consolidated Edison Co. of New York, Inc., Series C(a) . . . . . . . . 3.22% 6/25/21 USD 489 487,565 0.1E.ON International Finance BV. . . . . . . . . . . . . . . . . . . . . . . . . . . . 6.00% 10/30/19 GBP 1,655 2,260,121 0.4EDP Finance BV . . . . . . . . . . . . . . . . . . . . . . . . . . . . . . . . . . . . . . . 4.13% 1/15/20 USD 255 256,482 0.1EDP Finance BV . . . . . . . . . . . . . . . . . . . . . . . . . . . . . . . . . . . . . . . 4.90% 10/01/19 779 785,260 0.1Electricite de France SA. . . . . . . . . . . . . . . . . . . . . . . . . . . . . . . . . . 4.60% 1/27/20 1,261 1,279,563 0.2Electricite de France SA, Series E . . . . . . . . . . . . . . . . . . . . . . . . . . 6.25% 1/25/21 EUR 974 1,238,965 0.2Enel Finance International NV . . . . . . . . . . . . . . . . . . . . . . . . . . . . 2.88% 5/25/22 USD 1,446 1,403,287 0.2Enel SpA . . . . . . . . . . . . . . . . . . . . . . . . . . . . . . . . . . . . . . . . . . . . . 6.25% 6/20/19 GBP 810 1,089,086 0.2Engie SA . . . . . . . . . . . . . . . . . . . . . . . . . . . . . . . . . . . . . . . . . . . . . 1.38% 5/19/20 EUR 1,655 1,916,060 0.3Vattenfall AB . . . . . . . . . . . . . . . . . . . . . . . . . . . . . . . . . . . . . . . . . . 6.13% 12/16/19 GBP 1,207 1,659,920 0.3Western Power Distribution South Wales PLC . . . . . . . . . . . . . . . . 9.25% 11/09/20 1,176 1,753,639 0.3 14,129,948 2.4
NATURAL GASTalent Yield Euro Ltd. . . . . . . . . . . . . . . . . . . . . . . . . . . . . . . . . . . . 1.44% 5/07/20 EUR 1,782 2,036,703 0.4
OTHER UTILITYThames Water Utilities Finance PLC. . . . . . . . . . . . . . . . . . . . . . . . 5.05% 6/30/20 GBP 1,022 1,411,933 0.3Yorkshire Water Finance PLC . . . . . . . . . . . . . . . . . . . . . . . . . . . . . 6.00% 8/21/19 558 755,461 0.1 2,167,394 0.4 18,334,045 3.2 171,816,073 29.6
INFLATION-LINKED SECURITIESJAPAN
Japanese Government CPI Linked Bond, Series 18 . . . . . . . . . . . . 0.10% 3/10/24 JPY 1,949,679 17,937,427 3.1UNITED KINGDOM
United Kingdom Gilt Inflation Linked, Series 8MO . . . . . . . . . . . . 2.50% 4/16/20 GBP 1,227 5,822,055 1.0UNITED STATES
U.S. Treasury Inflation Index. . . . . . . . . . . . . . . . . . . . . . . . . . . . . . 0.13% 4/15/21 USD 17,372 17,148,986 3.0U.S. Treasury Inflation Index. . . . . . . . . . . . . . . . . . . . . . . . . . . . . . 0.63% 7/15/21 17,579 17,653,468 3.0U.S. Treasury Inflation Index. . . . . . . . . . . . . . . . . . . . . . . . . . . . . . 1.25% 7/15/20 9,831 9,963,592 1.7 44,766,046 7.7 68,525,528 11.8
COVERED BONDSAustralia & New Zealand Banking Group Ltd. . . . . . . . . . . . . . . . . 1.13% 5/13/20 EUR 2,174 2,511,811 0.4Banco Santander SA . . . . . . . . . . . . . . . . . . . . . . . . . . . . . . . . . . . . 1.00% 3/03/22 1,169 1,365,310 0.3Bank of Ireland Mortgage Bank . . . . . . . . . . . . . . . . . . . . . . . . . . . 0.63% 2/19/21 1,558 1,799,424 0.3Bank of Montreal . . . . . . . . . . . . . . . . . . . . . . . . . . . . . . . . . . . . . . . 0.13% 4/19/21 1,573 1,797,901 0.3Bank of Nova Scotia (The) . . . . . . . . . . . . . . . . . . . . . . . . . . . . . . . 0.25% 9/28/22 2,405 2,754,188 0.5BNZ International Funding Ltd./London. . . . . . . . . . . . . . . . . . . . . 0.13% 6/17/21 1,470 1,677,370 0.3Commonwealth Bank of Australia. . . . . . . . . . . . . . . . . . . . . . . . . . 0.38% 2/10/21 1,782 2,046,339 0.4

AB FCP I
59
GlobalBondPortfolio
Rate Date Principal Value Net Assets (000) (USD) %
DNB Boligkreditt AS. . . . . . . . . . . . . . . . . . . . . . . . . . . . . . . . . . . . 2.75% 3/21/22 EUR 1,558 $ 1,921,527 0.3%DNB Boligkreditt AS. . . . . . . . . . . . . . . . . . . . . . . . . . . . . . . . . . . . 3.88% 6/16/21 511 634,696 0.1Korea Housing Finance Corp. . . . . . . . . . . . . . . . . . . . . . . . . . . . . . 2.00% 10/11/21 USD 1,169 1,132,708 0.2National Australia Bank Ltd. . . . . . . . . . . . . . . . . . . . . . . . . . . . . . . 1.38% 5/28/21 EUR 1,524 1,789,595 0.3National Bank of Canada . . . . . . . . . . . . . . . . . . . . . . . . . . . . . . . . . 1.50% 3/25/21 1,568 1,843,348 0.3Royal Bank of Canada . . . . . . . . . . . . . . . . . . . . . . . . . . . . . . . . . . . 1.63% 8/04/20 2,152 2,512,495 0.4Stadshypotek AB . . . . . . . . . . . . . . . . . . . . . . . . . . . . . . . . . . . . . . . 0.63% 11/10/21 1,397 1,620,494 0.3Toronto-Dominion Bank (The) . . . . . . . . . . . . . . . . . . . . . . . . . . . . 0.38% 1/12/21 2,103 2,416,550 0.4Westpac Banking Corp. . . . . . . . . . . . . . . . . . . . . . . . . . . . . . . . . . . 0.75% 7/22/21 1,582 1,832,607 0.3 29,656,363 5.1
LOCAL GOVERNMENTS - PROVINCIAL BONDSCANADA
Hydro-Quebec, Series HL . . . . . . . . . . . . . . . . . . . . . . . . . . . . . . . . 11.00% 8/15/20 CAD 3,598 3,088,242 0.5Hydro-Quebec, Series HX . . . . . . . . . . . . . . . . . . . . . . . . . . . . . . . . 10.50% 10/15/21 7,790 7,185,896 1.2Ontario Electricity Financial Corp., Series DK2 . . . . . . . . . . . . . . . 10.00% 2/06/20 2,824 2,304,275 0.4Province of British Columbia Canada, Series XW . . . . . . . . . . . . . 10.60% 9/05/20 3,992 3,419,644 0.6Province of Ontario Canada, Series HC . . . . . . . . . . . . . . . . . . . . . 9.50% 7/13/22 2,921 2,741,882 0.5 18,739,939 3.2
COLLATERALIZED MORTGAGE OBLIGATIONSRISK SHARE FLOATING RATE
Federal Home Loan Mortgage Corp. Structured Agency Credit Risk Debt Notes Series 2014-DN3, Class M3(a) . . . . . . . . . . . . . . . . . . . . . . . . . . 6.49% 8/25/24 USD 1,046 1,132,016 0.2 Series 2015-DNA3, Class M2(a). . . . . . . . . . . . . . . . . . . . . . . . . 5.34% 4/25/28 1,057 1,083,680 0.2 Series 2015-HQ2, Class M2(a) . . . . . . . . . . . . . . . . . . . . . . . . . . 4.44% 5/25/25 1,299 1,321,459 0.2 Series 2015-HQA1, Class M2(a). . . . . . . . . . . . . . . . . . . . . . . . . 5.14% 3/25/28 524 531,525 0.1Federal National Mortgage Association Connecticut Avenue Securities
Series 2014-C03, Class 2M2(a). . . . . . . . . . . . . . . . . . . . . . . . . . 5.39% 7/25/24 1,860 1,964,447 0.3 Series 2014-C04, Class 1M2(a). . . . . . . . . . . . . . . . . . . . . . . . . . 7.39% 11/25/24 2,185 2,466,072 0.4 Series 2014-C04, Class 2M2(a). . . . . . . . . . . . . . . . . . . . . . . . . . 7.49% 11/25/24 2,115 2,357,019 0.4 Series 2016-C02, Class 1M1(a). . . . . . . . . . . . . . . . . . . . . . . . . . 4.64% 9/25/28 9 8,783 0.0 Series 2016-C02, Class 1M2(a). . . . . . . . . . . . . . . . . . . . . . . . . . 8.49% 9/25/28 721 827,149 0.2 Series 2016-C04, Class 1M1(a). . . . . . . . . . . . . . . . . . . . . . . . . . 3.94% 1/25/29 319 320,135 0.1 Series 2016-C05, Class 2M1(a). . . . . . . . . . . . . . . . . . . . . . . . . . 3.84% 1/25/29 75 75,026 0.0 Series 2016-C06, Class 1M1(a). . . . . . . . . . . . . . . . . . . . . . . . . . 3.79% 4/25/29 1,721 1,728,396 0.3 Series 2016-C07, Class 2M1(a). . . . . . . . . . . . . . . . . . . . . . . . . . 3.79% 5/25/29 130 130,375 0.0 13,946,082 2.4
GOVERNMENTS - SOVEREIGN BONDSFRANCE
Dexia Credit Local SA. . . . . . . . . . . . . . . . . . . . . . . . . . . . . . . . . . . 2.00% 1/22/21 EUR 5,064 5,996,051 1.0GERMANY
Kreditanstalt fuer Wiederaufbau . . . . . . . . . . . . . . . . . . . . . . . . . . . 6.25% 5/19/21 AUD 6,188 4,781,120 0.8JAPAN
Japan Finance Organization for Municipalities . . . . . . . . . . . . . . . . 5.75% 8/09/19 GBP 1,217 1,645,305 0.3 12,422,476 2.1
QUASI-SOVEREIGNSQUASI-SOVEREIGN BONDSCHINA
Export-Import Bank of China (The) . . . . . . . . . . . . . . . . . . . . . . . . 0.75% 6/08/22 EUR 1,767 2,026,964 0.4Sinopec Group Overseas Development 2015 Ltd.. . . . . . . . . . . . . . 1.00% 4/28/22 1,115 1,281,877 0.2State Grid Overseas Investment 2016 Ltd. . . . . . . . . . . . . . . . . . . . 1.25% 5/19/22 1,100 1,268,475 0.2 4,577,316 0.8
SOUTH KOREAExport-Import Bank of Korea . . . . . . . . . . . . . . . . . . . . . . . . . . . . . 4.50% 4/17/19 AUD 2,658 1,890,046 0.3Korea National Oil Corp.(a) . . . . . . . . . . . . . . . . . . . . . . . . . . . . . . 3.14% 10/08/19 3,691 2,620,613 0.5 4,510,659 0.8 9,087,975 1.6
SUPRANATIONALSEuropean Investment Bank . . . . . . . . . . . . . . . . . . . . . . . . . . . . . . . 6.00% 8/06/20 8,170 6,114,164 1.0International Bank for Reconstruction & Development . . . . . . . . . 5.75% 10/01/20 3,768 2,825,560 0.5 8,939,724 1.5
GOVERNMENTS - SOVEREIGN AGENCIESJAPAN
Development Bank of Japan, Inc. . . . . . . . . . . . . . . . . . . . . . . . . . . 1.63% 9/01/21 USD 2,454 2,379,344 0.4NORWAY
Kommunalbanken AS . . . . . . . . . . . . . . . . . . . . . . . . . . . . . . . . . . . 5.13% 5/14/21 NZD 3,199 2,315,929 0.4

AB FCP I
60
Portfolio of investments (continued) GlobalBondPortfolio
Rate Date Principal Value Net Assets (000) (USD) %
SOUTH KOREAKorea South-East Power Co., Ltd.. . . . . . . . . . . . . . . . . . . . . . . . . . 2.38% 4/12/20 USD 438 $ 434,001 0.1%
SPAINFondo De Titulizacion Del Deficit Del Sistema Electrico FTA. . . . 5.90% 3/17/21 EUR 1,266 1,612,250 0.3 6,741,524 1.2
ASSET-BACKED SECURITIESAUTOS - FIXED RATE
Hertz Vehicle Financing II LP Series 2015-1A, Class A . . . . . . . . . . . . . . . . . . . . . . . . . . . . . . . 2.73% 3/25/21 USD 467 465,399 0.1 Series 2016-1A, Class A . . . . . . . . . . . . . . . . . . . . . . . . . . . . . . . 2.32% 3/25/20 997 996,773 0.2 1,462,172 0.3
COMMERCIAL MORTGAGE-BACKED SECURITYNON-AGENCY FLOATING RATE CMBS
MSCG Trust, Series 2018-SELF, Class A(a) . . . . . . . . . . . . . . . . . . 3.39% 10/15/37 1,346 1,341,536 0.2MORTGAGE PASS-THROUGHSAGENCY FIXED RATE 30-YEAR
Federal National Mortgage Association, Series 1999 . . . . . . . . . . . 7.00% 9/01/29 1 1,054 0.0Federal National Mortgage Association, Series 1999 . . . . . . . . . . . 7.00% 10/01/29 6 7,518 0.0Federal National Mortgage Association, Series 2000 . . . . . . . . . . . 7.00% 11/01/30 1 1,198 0.0Federal National Mortgage Association, Series 2000 . . . . . . . . . . . 7.00% 12/01/30 1 1,060 0.0Federal National Mortgage Association, Series 2001 . . . . . . . . . . . 7.00% 2/01/31 3 3,762 0.0Federal National Mortgage Association, Series 2001 . . . . . . . . . . . 7.00% 5/01/31 1 736 0.0Federal National Mortgage Association, Series 2001 . . . . . . . . . . . 7.00% 9/01/31 13 14,836 0.0Federal National Mortgage Association, Series 2001 . . . . . . . . . . . 7.00% 11/01/31 4 4,179 0.0Federal National Mortgage Association, Series 2001 . . . . . . . . . . . 7.00% 12/01/31 36 41,594 0.0Federal National Mortgage Association, Series 2001 . . . . . . . . . . . 7.00% 1/01/32 2 2,460 0.0Federal National Mortgage Association, Series 2002 . . . . . . . . . . . 7.00% 2/01/32 3 3,749 0.0 82,146 0.0 559,133,077 96.2
OTHER TRANSFERABLE SECURITIESCORPORATES - INVESTMENT GRADEFINANCIAL INSTITUTIONSINSURANCE
Metropolitan Life Global Funding I . . . . . . . . . . . . . . . . . . . . . . . . 2.05% 6/12/20 1,948 1,926,270 0.3INDUSTRIALCAPITAL GOODS
Siemens Financieringsmaatschappij NV . . . . . . . . . . . . . . . . . . . . . 2.15% 5/27/20 1,539 1,522,630 0.3COMMUNICATIONS - TELECOMMUNICATIONS
Deutsche Telekom International Finance BV . . . . . . . . . . . . . . . . . 2.23% 1/17/20 774 768,746 0.1CONSUMER CYCLICAL - AUTOMOTIVE
Hyundai Capital America(a) . . . . . . . . . . . . . . . . . . . . . . . . . . . . . . 3.80% 9/18/20 1,860 1,865,767 0.3Toyota Motor Credit Corp.(a) . . . . . . . . . . . . . . . . . . . . . . . . . . . . . 3.03% 4/17/20 351 350,988 0.1 2,216,755 0.4
CONSUMER NON-CYCLICALCigna Corp. . . . . . . . . . . . . . . . . . . . . . . . . . . . . . . . . . . . . . . . . . . . 3.20% 9/17/20 2,678 2,681,012 0.5Tyson Foods, Inc.(a). . . . . . . . . . . . . . . . . . . . . . . . . . . . . . . . . . . . . 3.17% 6/02/20 745 744,305 0.1 3,425,317 0.6 7,933,448 1.4
UTILITYELECTRIC
Iberdrola Finance Ireland DAC . . . . . . . . . . . . . . . . . . . . . . . . . . . . 5.00% 9/11/19 487 491,214 0.1 10,350,932 1.8
Total Investments (cost $584,353,820). . . . . . . . . . . . . . . . . . . . . . . . . . . . . . . . . . . $ 569,484,009 98.0%
Time DepositsANZ, London(b) . . . . . . . . . . . . . . . . . . . . . . . . . . . . . . . . . . . . . . . 1.40 % – 62,403 0.0BBH, Grand Cayman(b) . . . . . . . . . . . . . . . . . . . . . . . . . . . . . . . . . (1.40) % – 4,393 0.0BBH, Grand Cayman(b) . . . . . . . . . . . . . . . . . . . . . . . . . . . . . . . . . (0.26) % – 1 0.0BBH, Grand Cayman(b) . . . . . . . . . . . . . . . . . . . . . . . . . . . . . . . . . 0.76 % – 506 0.0BBH, Grand Cayman(b) . . . . . . . . . . . . . . . . . . . . . . . . . . . . . . . . . 5.12 % – 1 0.0Citibank, New York(b). . . . . . . . . . . . . . . . . . . . . . . . . . . . . . . . . . . 1.76 % – 51,343 0.0Hong Kong & Shanghai Bank, Singapore(b) . . . . . . . . . . . . . . . . . 0.67 % – 1,485,482 0.3HSBC Bank PLC, London(b) . . . . . . . . . . . . . . . . . . . . . . . . . . . . . (0.57) % – 794,947 0.1HSBC Bank PLC, London(b) . . . . . . . . . . . . . . . . . . . . . . . . . . . . . 0.36 % – 142,376 0.0JPMorgan Chase, New York(b) . . . . . . . . . . . . . . . . . . . . . . . . . . . . 1.76 % – 1,023,356 0.2

AB FCP I
61
GlobalBondPortfolio
Rate Date Value Net Assets (USD) %
National Australia Bank, London(b) . . . . . . . . . . . . . . . . . . . . . . . . 0.76 % – $ 57,853 0.0%Nordea Bank Abp, Oslo(b) . . . . . . . . . . . . . . . . . . . . . . . . . . . . . . . 0.35 % – 67,345 0.0Royal Bank of Canada, Toronto(b) . . . . . . . . . . . . . . . . . . . . . . . . . 0.82 % – 315,322 0.1
Total Time Deposits . . . . . . . . . . . . . . . . . . . . . . . . . . . . . . . . . . . . . . . . . . . . . . . . . . . . . . 4,005,328 0.7Other assets less liabilities . . . . . . . . . . . . . . . . . . . . . . . . . . . . . . . . . . . . . . . . . . . . . . . . . 7,361,266 1.3Net Assets . . . . . . . . . . . . . . . . . . . . . . . . . . . . . . . . . . . . . . . . . . . . . . . . . . . . . . . . . . . . . . $ 580,850,603 100.0%
FUTURES Unrealized Number of Appreciation/ Type Expiration Date Contracts Original Value Market Value (Depreciation)
LongKorea 3 Yr Bond Futures . . . . . . . . . . . . . . . . . . . . . . . . . . . . . . . . 3/19/19 93 $ 8,987,091 $ 8,983,446 $ (3,645)U.S. T-Note 2 Yr (CBT) Futures . . . . . . . . . . . . . . . . . . . . . . . . . . 6/28/19 149 31,615,270 31,614,121 (1,149)
ShortEuro-BOBL Futures . . . . . . . . . . . . . . . . . . . . . . . . . . . . . . . . . . . . 3/07/19 193 28,994,537 29,106,350 (111,813)Euro-Schatz Futures . . . . . . . . . . . . . . . . . . . . . . . . . . . . . . . . . . . . 3/07/19 709 90,221,599 90,160,775 60,824Japan 10 Yr Bond (OSE) Futures . . . . . . . . . . . . . . . . . . . . . . . . . . 3/13/19 7 9,286,646 9,340,416 (53,770)U.S. T-Note 5 Yr (CBT) Futures . . . . . . . . . . . . . . . . . . . . . . . . . . 6/28/19 224 25,668,581 25,658,083 10,498 $ (99,055)
Appreciation $ 71,322 Depreciation $ (170,377)
FORWARD FOREIGN CURRENCY CONTRACTS Contracts to In Exchange Unrealized Deliver For Settlement Appreciation/ Counterparty (000) (000) Date (Depreciation)
Australia and New Zealand Banking Group Ltd. . . . . . . . . . . . . EUR 1,621 USD 1,843 4/10/19 $ (6,861)Australia and New Zealand Banking Group Ltd. . . . . . . . . . . . . EUR 5,823 USD 6,728 4/10/19 83,245Australia and New Zealand Banking Group Ltd. . . . . . . . . . . . . USD 23,696 EUR 20,674 4/10/19 (103,579)Australia and New Zealand Banking Group Ltd. . . . . . . . . . . . . USD 3,255 EUR 2,862 4/10/19 10,935Barclays Bank PLC . . . . . . . . . . . . . . . . . . . . . . . . . . . . . . . . . . . USD 10,425 EUR 9,151 4/10/19 17,323BNP Paribas SA. . . . . . . . . . . . . . . . . . . . . . . . . . . . . . . . . . . . . . USD 2,439 CAD 3,253 3/07/19 33,538BNP Paribas SA. . . . . . . . . . . . . . . . . . . . . . . . . . . . . . . . . . . . . . USD 4,189 EUR 3,700 4/10/19 32,812Brown Brothers Harriman & Co.. . . . . . . . . . . . . . . . . . . . . . . . . EUR 3,613 USD 4,168 4/10/19 45,020Brown Brothers Harriman & Co.+. . . . . . . . . . . . . . . . . . . . . . . . USD 29,606 AUD 40,898 3/06/19 (593,583)Brown Brothers Harriman & Co.+. . . . . . . . . . . . . . . . . . . . . . . . USD 8,871 CAD 11,613 3/06/19 (45,782)Brown Brothers Harriman & Co.+. . . . . . . . . . . . . . . . . . . . . . . . USD 3,148 EUR 2,749 3/06/19 (21,035)Brown Brothers Harriman & Co.+. . . . . . . . . . . . . . . . . . . . . . . . USD 3,962 GBP 3,032 3/06/19 60,446Brown Brothers Harriman & Co.+. . . . . . . . . . . . . . . . . . . . . . . . USD 602 NZD 875 3/06/19 (5,911)Brown Brothers Harriman & Co.+. . . . . . . . . . . . . . . . . . . . . . . . USD 1,009 SGD 1,365 3/06/19 164Citibank, NA . . . . . . . . . . . . . . . . . . . . . . . . . . . . . . . . . . . . . . . . EUR 63,059 USD 72,636 3/11/19 867,770Citibank, NA . . . . . . . . . . . . . . . . . . . . . . . . . . . . . . . . . . . . . . . . USD 2,171 TWD 66,107 3/14/19 (25,515)Citibank, NA . . . . . . . . . . . . . . . . . . . . . . . . . . . . . . . . . . . . . . . . EUR 63,062 USD 71,830 3/22/19 (10,483)Citibank, NA . . . . . . . . . . . . . . . . . . . . . . . . . . . . . . . . . . . . . . . . GBP 20,273 USD 26,756 4/09/19 (185,143)Citibank, NA . . . . . . . . . . . . . . . . . . . . . . . . . . . . . . . . . . . . . . . . EUR 1,889 USD 2,172 4/10/19 16,485Citibank, NA . . . . . . . . . . . . . . . . . . . . . . . . . . . . . . . . . . . . . . . . JPY 3,177,784 USD 28,798 4/11/19 197,932Citibank, NA . . . . . . . . . . . . . . . . . . . . . . . . . . . . . . . . . . . . . . . . KRW 1,067,583 USD 953 5/16/19 2,023Goldman Sachs Bank USA . . . . . . . . . . . . . . . . . . . . . . . . . . . . . EUR 726 USD 838 4/10/19 10,547Goldman Sachs Bank USA . . . . . . . . . . . . . . . . . . . . . . . . . . . . . USD 1,247 EUR 1,086 4/10/19 (7,026)Goldman Sachs Bank USA . . . . . . . . . . . . . . . . . . . . . . . . . . . . . USD 3,145 NOK 26,755 4/12/19 (13,116)Goldman Sachs Bank USA . . . . . . . . . . . . . . . . . . . . . . . . . . . . . SGD 13,121 USD 9,660 4/17/19 (51,875)HSBC Bank USA. . . . . . . . . . . . . . . . . . . . . . . . . . . . . . . . . . . . . EUR 3,471 USD 3,932 4/10/19 (29,608)HSBC Bank USA. . . . . . . . . . . . . . . . . . . . . . . . . . . . . . . . . . . . . SGD 5,705 USD 4,212 4/17/19 (10,342)HSBC Bank USA. . . . . . . . . . . . . . . . . . . . . . . . . . . . . . . . . . . . . USD 1,744 SGD 2,367 4/17/19 8,367Morgan Stanley & Co., Inc. . . . . . . . . . . . . . . . . . . . . . . . . . . . . . USD 1,420 CLP 930,576 3/15/19 (1,011)Morgan Stanley & Co., Inc. . . . . . . . . . . . . . . . . . . . . . . . . . . . . . PLN 35,996 USD 9,506 4/08/19 (17,956)Morgan Stanley & Co., Inc. . . . . . . . . . . . . . . . . . . . . . . . . . . . . . EUR 3,009 USD 3,457 4/10/19 24,478Morgan Stanley & Co., Inc. . . . . . . . . . . . . . . . . . . . . . . . . . . . . . USD 9,297 JPY 1,024,976 4/11/19 (71,868)Morgan Stanley & Co., Inc. . . . . . . . . . . . . . . . . . . . . . . . . . . . . . NZD 3,494 USD 2,401 4/26/19 18,896Royal Bank of Scotland PLC. . . . . . . . . . . . . . . . . . . . . . . . . . . . EUR 49,929 USD 57,279 4/10/19 303,774Royal Bank of Scotland PLC. . . . . . . . . . . . . . . . . . . . . . . . . . . . NOK 12,566 SEK 13,591 4/12/19 5,099Royal Bank of Scotland PLC. . . . . . . . . . . . . . . . . . . . . . . . . . . . AUD 37,773 USD 26,893 4/23/19 76,368Royal Bank of Scotland PLC. . . . . . . . . . . . . . . . . . . . . . . . . . . . USD 1,679 AUD 2,339 4/23/19 (18,381)Societe Generale . . . . . . . . . . . . . . . . . . . . . . . . . . . . . . . . . . . . . EUR 23,789 USD 27,487 4/10/19 341,111Standard Chartered Bank . . . . . . . . . . . . . . . . . . . . . . . . . . . . . . . CAD 40,137 USD 30,344 3/07/19 (158,284)Standard Chartered Bank . . . . . . . . . . . . . . . . . . . . . . . . . . . . . . . TWD 66,039 USD 2,166 3/14/19 22,715

AB FCP I
62
Portfolio of investments (continued)
Currency Abbreviations:AUD – Australian DollarCAD – Canadian DollarCLP – Chilean PesoEUR – EuroGBP – Great British PoundJPY – Japanese YenKRW – South Korean WonNOK – Norwegian KroneNZD – New Zealand DollarMYR – Malaysian RinggitPLN – Polish ZlotySEK – Swedish KronaSGD – Singapore DollarTWD – New Taiwan DollarUSD – United States Dollar
Glossary:BOBL – BundesobligationenCBT – Chicago Board of TradeCDX-CMBX.NA – North American Commercial Mortgage-Backed IndexCPI – Consumer Price IndexOAT – Obligations Assimilables du TrésorOSE – Osaka Securities Exchange
See notes to financial statements.
GlobalBondPortfolio
Contracts to In Exchange Unrealized Deliver For Settlement Appreciation/ Counterparty (000) (000) Date (Depreciation)
Standard Chartered Bank . . . . . . . . . . . . . . . . . . . . . . . . . . . . . . . USD 2,250 EUR 1,955 4/10/19 $ (19,405)Standard Chartered Bank . . . . . . . . . . . . . . . . . . . . . . . . . . . . . . . USD 2,942 KRW 3,286,062 5/16/19 (16,043)UBS AG . . . . . . . . . . . . . . . . . . . . . . . . . . . . . . . . . . . . . . . . . . . . CAD 4,413 USD 3,309 3/07/19 (44,812)
$ 721,429
Appreciation $ 2,179,048 Depreciation $ (1,457,619)
+ Used for share class hedging purposes.
CREDIT DEFAULT SWAPS Upfront Notional Premiums Unrealized Termination Amount Market Paid/ Appreciation/ Counterparty Referenced Obligation Date (000) Value (Received) (Depreciation)
Sale ContractsCitigroup Global Markets, Inc. CDX-CMBX.NA.A- Series 6 5/11/63 USD 751 $ (15,466) $ (13,648) $ (1,818)Citigroup Global Markets, Inc. CDX-CMBX.NA.A- Series 6 5/11/63 1,169 (24,071) (44,728) 20,657Citigroup Global Markets, Inc. CDX-CMBX.NA.A- Series 6 5/11/63 1,416 (29,167) (26,101) (3,066)Citigroup Global Markets, Inc. CDX-CMBX.NA.BBB- Series 6 5/11/63 3,194 (387,745) (260,549) (127,196)Morgan Stanley & Co. International PLC CDX-CMBX.NA.A- Series 6 5/11/63 2,337 (48,143) (80,171) 32,028Total $ (504,592) $ (425,197) $ (79,395)
Appreciation $ 52,685 Depreciation $ (132,080)
(a) Floating Rate Security. Stated interest rate was in effect at February 28, 2019.(b) Overnight deposit.
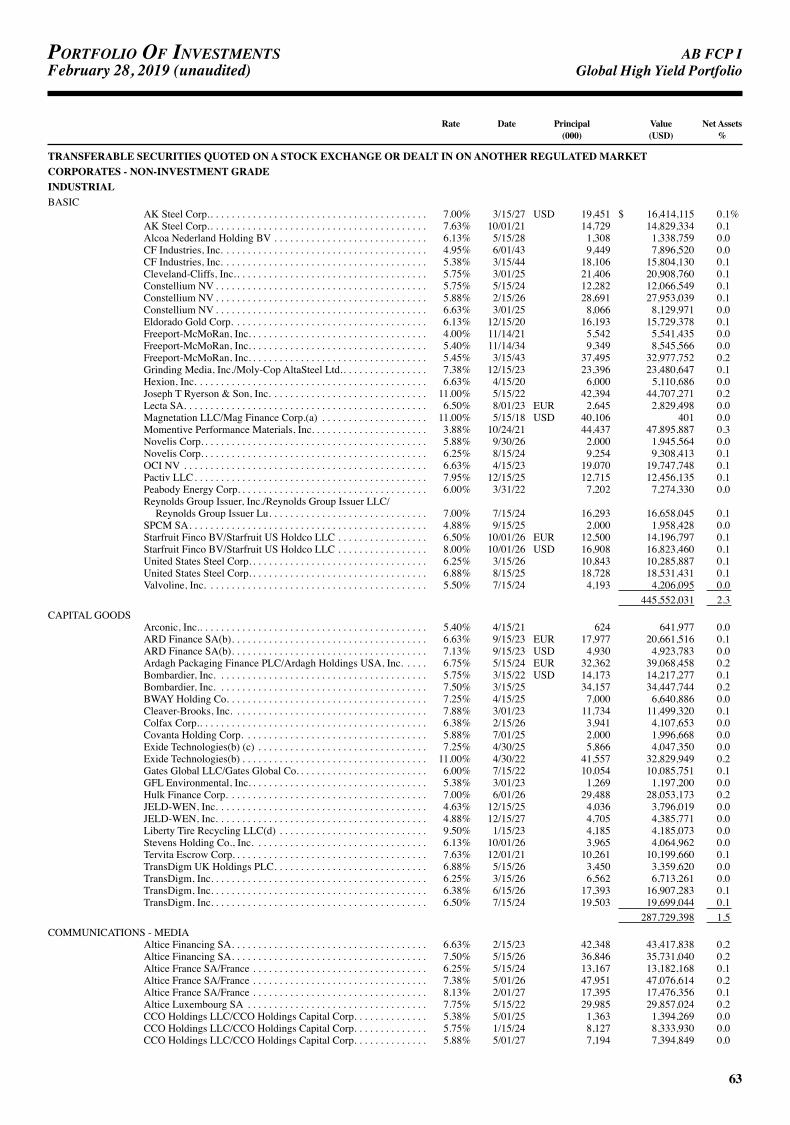
AB FCP I
63
Portfolio of investmentsFebruary 28, 2019 (unaudited) GlobalHighYieldPortfolio
Rate Date Principal Value Net Assets (000) (USD) %
TRANSFERABLE SECURITIES QUOTED ON A STOCK EXCHANGE OR DEALT IN ON ANOTHER REGULATED MARKETCORPORATES - NON-INVESTMENT GRADEINDUSTRIALBASIC
AK Steel Corp.. . . . . . . . . . . . . . . . . . . . . . . . . . . . . . . . . . . . . . . . . 7.00% 3/15/27 USD 19,451 $ 16,414,115 0.1%AK Steel Corp.. . . . . . . . . . . . . . . . . . . . . . . . . . . . . . . . . . . . . . . . . 7.63% 10/01/21 14,729 14,829,334 0.1Alcoa Nederland Holding BV . . . . . . . . . . . . . . . . . . . . . . . . . . . . . 6.13% 5/15/28 1,308 1,338,759 0.0CF Industries, Inc. . . . . . . . . . . . . . . . . . . . . . . . . . . . . . . . . . . . . . . 4.95% 6/01/43 9,449 7,896,520 0.0CF Industries, Inc. . . . . . . . . . . . . . . . . . . . . . . . . . . . . . . . . . . . . . . 5.38% 3/15/44 18,106 15,804,130 0.1Cleveland-Cliffs, Inc.. . . . . . . . . . . . . . . . . . . . . . . . . . . . . . . . . . . . 5.75% 3/01/25 21,406 20,908,760 0.1Constellium NV . . . . . . . . . . . . . . . . . . . . . . . . . . . . . . . . . . . . . . . . 5.75% 5/15/24 12,282 12,066,549 0.1Constellium NV . . . . . . . . . . . . . . . . . . . . . . . . . . . . . . . . . . . . . . . . 5.88% 2/15/26 28,691 27,953,039 0.1Constellium NV . . . . . . . . . . . . . . . . . . . . . . . . . . . . . . . . . . . . . . . . 6.63% 3/01/25 8,066 8,129,971 0.0Eldorado Gold Corp. . . . . . . . . . . . . . . . . . . . . . . . . . . . . . . . . . . . . 6.13% 12/15/20 16,193 15,729,378 0.1Freeport-McMoRan, Inc. . . . . . . . . . . . . . . . . . . . . . . . . . . . . . . . . . 4.00% 11/14/21 5,542 5,541,435 0.0Freeport-McMoRan, Inc. . . . . . . . . . . . . . . . . . . . . . . . . . . . . . . . . . 5.40% 11/14/34 9,349 8,545,566 0.0Freeport-McMoRan, Inc. . . . . . . . . . . . . . . . . . . . . . . . . . . . . . . . . . 5.45% 3/15/43 37,495 32,977,752 0.2Grinding Media, Inc./Moly-Cop AltaSteel Ltd.. . . . . . . . . . . . . . . . 7.38% 12/15/23 23,396 23,480,647 0.1Hexion, Inc. . . . . . . . . . . . . . . . . . . . . . . . . . . . . . . . . . . . . . . . . . . . 6.63% 4/15/20 6,000 5,110,686 0.0Joseph T Ryerson & Son, Inc. . . . . . . . . . . . . . . . . . . . . . . . . . . . . . 11.00% 5/15/22 42,394 44,707,271 0.2Lecta SA. . . . . . . . . . . . . . . . . . . . . . . . . . . . . . . . . . . . . . . . . . . . . . 6.50% 8/01/23 EUR 2,645 2,829,498 0.0Magnetation LLC/Mag Finance Corp.(a) . . . . . . . . . . . . . . . . . . . . 11.00% 5/15/18 USD 40,106 401 0.0Momentive Performance Materials, Inc. . . . . . . . . . . . . . . . . . . . . . 3.88% 10/24/21 44,437 47,895,887 0.3Novelis Corp. . . . . . . . . . . . . . . . . . . . . . . . . . . . . . . . . . . . . . . . . . . 5.88% 9/30/26 2,000 1,945,564 0.0Novelis Corp. . . . . . . . . . . . . . . . . . . . . . . . . . . . . . . . . . . . . . . . . . . 6.25% 8/15/24 9,254 9,308,413 0.1OCI NV . . . . . . . . . . . . . . . . . . . . . . . . . . . . . . . . . . . . . . . . . . . . . . 6.63% 4/15/23 19,070 19,747,748 0.1Pactiv LLC. . . . . . . . . . . . . . . . . . . . . . . . . . . . . . . . . . . . . . . . . . . . 7.95% 12/15/25 12,715 12,456,135 0.1Peabody Energy Corp. . . . . . . . . . . . . . . . . . . . . . . . . . . . . . . . . . . . 6.00% 3/31/22 7,202 7,274,330 0.0Reynolds Group Issuer, Inc./Reynolds Group Issuer LLC/
Reynolds Group Issuer Lu. . . . . . . . . . . . . . . . . . . . . . . . . . . . . . 7.00% 7/15/24 16,293 16,658,045 0.1SPCM SA. . . . . . . . . . . . . . . . . . . . . . . . . . . . . . . . . . . . . . . . . . . . . 4.88% 9/15/25 2,000 1,958,428 0.0Starfruit Finco BV/Starfruit US Holdco LLC . . . . . . . . . . . . . . . . . 6.50% 10/01/26 EUR 12,500 14,196,797 0.1Starfruit Finco BV/Starfruit US Holdco LLC . . . . . . . . . . . . . . . . . 8.00% 10/01/26 USD 16,908 16,823,460 0.1United States Steel Corp. . . . . . . . . . . . . . . . . . . . . . . . . . . . . . . . . . 6.25% 3/15/26 10,843 10,285,887 0.1United States Steel Corp. . . . . . . . . . . . . . . . . . . . . . . . . . . . . . . . . . 6.88% 8/15/25 18,728 18,531,431 0.1Valvoline, Inc. . . . . . . . . . . . . . . . . . . . . . . . . . . . . . . . . . . . . . . . . . 5.50% 7/15/24 4,193 4,206,095 0.0 445,552,031 2.3
CAPITAL GOODSArconic, Inc.. . . . . . . . . . . . . . . . . . . . . . . . . . . . . . . . . . . . . . . . . . . 5.40% 4/15/21 624 641,977 0.0ARD Finance SA(b). . . . . . . . . . . . . . . . . . . . . . . . . . . . . . . . . . . . . 6.63% 9/15/23 EUR 17,977 20,661,516 0.1ARD Finance SA(b). . . . . . . . . . . . . . . . . . . . . . . . . . . . . . . . . . . . . 7.13% 9/15/23 USD 4,930 4,923,783 0.0Ardagh Packaging Finance PLC/Ardagh Holdings USA, Inc. . . . . 6.75% 5/15/24 EUR 32,362 39,068,458 0.2Bombardier, Inc. . . . . . . . . . . . . . . . . . . . . . . . . . . . . . . . . . . . . . . . 5.75% 3/15/22 USD 14,173 14,217,277 0.1Bombardier, Inc. . . . . . . . . . . . . . . . . . . . . . . . . . . . . . . . . . . . . . . . 7.50% 3/15/25 34,157 34,447,744 0.2BWAY Holding Co. . . . . . . . . . . . . . . . . . . . . . . . . . . . . . . . . . . . . . 7.25% 4/15/25 7,000 6,640,886 0.0Cleaver-Brooks, Inc. . . . . . . . . . . . . . . . . . . . . . . . . . . . . . . . . . . . . 7.88% 3/01/23 11,734 11,499,320 0.1Colfax Corp.. . . . . . . . . . . . . . . . . . . . . . . . . . . . . . . . . . . . . . . . . . . 6.38% 2/15/26 3,941 4,107,653 0.0Covanta Holding Corp. . . . . . . . . . . . . . . . . . . . . . . . . . . . . . . . . . . 5.88% 7/01/25 2,000 1,996,668 0.0Exide Technologies(b) (c) . . . . . . . . . . . . . . . . . . . . . . . . . . . . . . . . 7.25% 4/30/25 5,866 4,047,350 0.0Exide Technologies(b) . . . . . . . . . . . . . . . . . . . . . . . . . . . . . . . . . . . 11.00% 4/30/22 41,557 32,829,949 0.2Gates Global LLC/Gates Global Co. . . . . . . . . . . . . . . . . . . . . . . . . 6.00% 7/15/22 10,054 10,085,751 0.1GFL Environmental, Inc. . . . . . . . . . . . . . . . . . . . . . . . . . . . . . . . . . 5.38% 3/01/23 1,269 1,197,200 0.0Hulk Finance Corp. . . . . . . . . . . . . . . . . . . . . . . . . . . . . . . . . . . . . . 7.00% 6/01/26 29,488 28,053,173 0.2JELD-WEN, Inc. . . . . . . . . . . . . . . . . . . . . . . . . . . . . . . . . . . . . . . . 4.63% 12/15/25 4,036 3,796,019 0.0JELD-WEN, Inc. . . . . . . . . . . . . . . . . . . . . . . . . . . . . . . . . . . . . . . . 4.88% 12/15/27 4,705 4,385,771 0.0Liberty Tire Recycling LLC(d) . . . . . . . . . . . . . . . . . . . . . . . . . . . . 9.50% 1/15/23 4,185 4,185,073 0.0Stevens Holding Co., Inc. . . . . . . . . . . . . . . . . . . . . . . . . . . . . . . . . 6.13% 10/01/26 3,965 4,064,962 0.0Tervita Escrow Corp. . . . . . . . . . . . . . . . . . . . . . . . . . . . . . . . . . . . . 7.63% 12/01/21 10,261 10,199,660 0.1TransDigm UK Holdings PLC. . . . . . . . . . . . . . . . . . . . . . . . . . . . . 6.88% 5/15/26 3,450 3,359,620 0.0TransDigm, Inc. . . . . . . . . . . . . . . . . . . . . . . . . . . . . . . . . . . . . . . . . 6.25% 3/15/26 6,562 6,713,261 0.0TransDigm, Inc. . . . . . . . . . . . . . . . . . . . . . . . . . . . . . . . . . . . . . . . . 6.38% 6/15/26 17,393 16,907,283 0.1TransDigm, Inc. . . . . . . . . . . . . . . . . . . . . . . . . . . . . . . . . . . . . . . . . 6.50% 7/15/24 19,503 19,699,044 0.1 287,729,398 1.5
COMMUNICATIONS - MEDIAAltice Financing SA. . . . . . . . . . . . . . . . . . . . . . . . . . . . . . . . . . . . . 6.63% 2/15/23 42,348 43,417,838 0.2Altice Financing SA. . . . . . . . . . . . . . . . . . . . . . . . . . . . . . . . . . . . . 7.50% 5/15/26 36,846 35,731,040 0.2Altice France SA/France . . . . . . . . . . . . . . . . . . . . . . . . . . . . . . . . . 6.25% 5/15/24 13,167 13,182,168 0.1Altice France SA/France . . . . . . . . . . . . . . . . . . . . . . . . . . . . . . . . . 7.38% 5/01/26 47,951 47,076,614 0.2Altice France SA/France . . . . . . . . . . . . . . . . . . . . . . . . . . . . . . . . . 8.13% 2/01/27 17,395 17,476,356 0.1Altice Luxembourg SA . . . . . . . . . . . . . . . . . . . . . . . . . . . . . . . . . . 7.75% 5/15/22 29,985 29,857,024 0.2CCO Holdings LLC/CCO Holdings Capital Corp. . . . . . . . . . . . . . 5.38% 5/01/25 1,363 1,394,269 0.0CCO Holdings LLC/CCO Holdings Capital Corp. . . . . . . . . . . . . . 5.75% 1/15/24 8,127 8,333,930 0.0CCO Holdings LLC/CCO Holdings Capital Corp. . . . . . . . . . . . . . 5.88% 5/01/27 7,194 7,394,849 0.0

AB FCP I
64
Portfolio of investments (continued) GlobalHighYieldPortfolio
Rate Date Principal Value Net Assets (000) (USD) %
Cequel Communications Holdings I LLC/Cequel Capital Corp. . . 7.50% 4/01/28 USD 17,996 $ 19,007,141 0.1%Clear Channel Worldwide Holdings, Inc., Series B. . . . . . . . . . . . . 7.63% 3/15/20 10,000 10,004,130 0.1CSC Holdings LLC . . . . . . . . . . . . . . . . . . . . . . . . . . . . . . . . . . . . . 5.38% 2/01/28 21,612 21,237,702 0.1CSC Holdings LLC . . . . . . . . . . . . . . . . . . . . . . . . . . . . . . . . . . . . . 5.50% 5/15/26 2,000 2,020,108 0.0CSC Holdings LLC . . . . . . . . . . . . . . . . . . . . . . . . . . . . . . . . . . . . . 5.50% 4/15/27 6,197 6,218,869 0.0CSC Holdings LLC . . . . . . . . . . . . . . . . . . . . . . . . . . . . . . . . . . . . . 10.88% 10/15/25 21,895 25,389,486 0.1DISH DBS Corp. . . . . . . . . . . . . . . . . . . . . . . . . . . . . . . . . . . . . . . . 5.00% 3/15/23 33,502 29,754,232 0.2DISH DBS Corp. . . . . . . . . . . . . . . . . . . . . . . . . . . . . . . . . . . . . . . . 5.88% 11/15/24 11,376 9,585,770 0.1DISH DBS Corp. . . . . . . . . . . . . . . . . . . . . . . . . . . . . . . . . . . . . . . . 6.75% 6/01/21 11,330 11,587,338 0.1DISH DBS Corp. . . . . . . . . . . . . . . . . . . . . . . . . . . . . . . . . . . . . . . . 7.75% 7/01/26 10,000 8,660,060 0.1Gray Television, Inc. . . . . . . . . . . . . . . . . . . . . . . . . . . . . . . . . . . . . 5.13% 10/15/24 6,853 6,804,844 0.0Gray Television, Inc. . . . . . . . . . . . . . . . . . . . . . . . . . . . . . . . . . . . . 5.88% 7/15/26 9,833 9,941,763 0.1iHeartCommunications, Inc.(a) . . . . . . . . . . . . . . . . . . . . . . . . . . . . 6.88% 6/15/18 26,774 2,798,659 0.0iHeartCommunications, Inc.(e) . . . . . . . . . . . . . . . . . . . . . . . . . . . . 9.00% 12/15/19 34,349 24,068,276 0.1iHeartCommunications, Inc.(e) . . . . . . . . . . . . . . . . . . . . . . . . . . . . 10.63% 3/15/23 2,952 2,055,253 0.0iHeartCommunications, Inc.(e) . . . . . . . . . . . . . . . . . . . . . . . . . . . . 11.25% 3/01/21 6,591 4,092,009 0.0Liberty Interactive LLC . . . . . . . . . . . . . . . . . . . . . . . . . . . . . . . . . . 8.25% 2/01/30 2,000 2,043,752 0.0Meredith Corp.. . . . . . . . . . . . . . . . . . . . . . . . . . . . . . . . . . . . . . . . . 6.88% 2/01/26 41,702 43,155,773 0.2Netflix, Inc. . . . . . . . . . . . . . . . . . . . . . . . . . . . . . . . . . . . . . . . . . . . 4.88% 4/15/28 5,561 5,425,345 0.0Netflix, Inc. . . . . . . . . . . . . . . . . . . . . . . . . . . . . . . . . . . . . . . . . . . . 5.88% 11/15/28 38,534 40,073,549 0.2Radiate Holdco LLC/Radiate Finance, Inc.. . . . . . . . . . . . . . . . . . . 6.88% 2/15/23 10,263 9,868,326 0.1RR Donnelley & Sons Co. . . . . . . . . . . . . . . . . . . . . . . . . . . . . . . . . 7.88% 3/15/21 4,975 5,110,101 0.0Sinclair Television Group, Inc. . . . . . . . . . . . . . . . . . . . . . . . . . . . . 5.63% 8/01/24 9,032 9,107,950 0.1Sinclair Television Group, Inc. . . . . . . . . . . . . . . . . . . . . . . . . . . . . 6.13% 10/01/22 14,458 14,748,447 0.1Sirius XM Radio, Inc. . . . . . . . . . . . . . . . . . . . . . . . . . . . . . . . . . . . 5.00% 8/01/27 660 645,252 0.0Sirius XM Radio, Inc. . . . . . . . . . . . . . . . . . . . . . . . . . . . . . . . . . . . 6.00% 7/15/24 3,651 3,788,226 0.0TEGNA, Inc. . . . . . . . . . . . . . . . . . . . . . . . . . . . . . . . . . . . . . . . . . . 5.50% 9/15/24 2,967 2,937,808 0.0TEGNA, Inc. . . . . . . . . . . . . . . . . . . . . . . . . . . . . . . . . . . . . . . . . . . 6.38% 10/15/23 32,131 33,180,848 0.2Unitymedia GmbH. . . . . . . . . . . . . . . . . . . . . . . . . . . . . . . . . . . . . . 6.13% 1/15/25 2,956 3,061,612 0.0UPC Holding BV . . . . . . . . . . . . . . . . . . . . . . . . . . . . . . . . . . . . . . . 5.50% 1/15/28 49,738 50,765,488 0.3Virgin Media Finance PLC . . . . . . . . . . . . . . . . . . . . . . . . . . . . . . . 5.75% 1/15/25 5,310 5,260,219 0.0Virgin Media Receivables Financing Notes I DAC. . . . . . . . . . . . . 5.50% 9/15/24 GBP 1,030 1,366,582 0.0Virgin Media Secured Finance PLC . . . . . . . . . . . . . . . . . . . . . . . . 5.25% 1/15/26 USD 2,660 2,662,474 0.0Ziggo Bond Co. BV . . . . . . . . . . . . . . . . . . . . . . . . . . . . . . . . . . . . . 6.00% 1/15/27 2,820 2,648,316 0.0Ziggo Bond Co. BV . . . . . . . . . . . . . . . . . . . . . . . . . . . . . . . . . . . . . 7.13% 5/15/24 EUR 4,876 5,811,298 0.0Ziggo BV . . . . . . . . . . . . . . . . . . . . . . . . . . . . . . . . . . . . . . . . . . . . . 5.50% 1/15/27 USD 27,044 26,072,417 0.1 664,823,511 3.4
COMMUNICATIONS - TELECOMMUNICATIONSArqiva Broadcast Finance PLC . . . . . . . . . . . . . . . . . . . . . . . . . . . . 6.75% 9/30/23 GBP 6,698 9,343,989 0.1C&W Senior Financing DAC . . . . . . . . . . . . . . . . . . . . . . . . . . . . . 6.88% 9/15/27 USD 29,881 29,344,397 0.2C&W Senior Financing DAC . . . . . . . . . . . . . . . . . . . . . . . . . . . . . 7.50% 10/15/26 14,346 14,714,850 0.1CB T-Mobile USA, Inc.(d). . . . . . . . . . . . . . . . . . . . . . . . . . . . . . . . 0.00% 3/01/25 11,185 0* 0.0CenturyLink, Inc. . . . . . . . . . . . . . . . . . . . . . . . . . . . . . . . . . . . . . . . 5.63% 4/01/25 15,530 14,835,918 0.1CenturyLink, Inc., Series P . . . . . . . . . . . . . . . . . . . . . . . . . . . . . . . 7.60% 9/15/39 2,000 1,747,260 0.0CenturyLink, Inc., Series T . . . . . . . . . . . . . . . . . . . . . . . . . . . . . . . 5.80% 3/15/22 1,492 1,535,414 0.0Cincinnati Bell, Inc. . . . . . . . . . . . . . . . . . . . . . . . . . . . . . . . . . . . . . 7.00% 7/15/24 4,000 3,618,412 0.0DKT Finance ApS . . . . . . . . . . . . . . . . . . . . . . . . . . . . . . . . . . . . . . 7.00% 6/17/23 EUR 21,005 25,812,538 0.1Embarq Corp.. . . . . . . . . . . . . . . . . . . . . . . . . . . . . . . . . . . . . . . . . . 8.00% 6/01/36 USD 30,047 29,069,361 0.2Frontier Communications Corp. . . . . . . . . . . . . . . . . . . . . . . . . . . . 6.88% 1/15/25 693 373,836 0.0Frontier Communications Corp. . . . . . . . . . . . . . . . . . . . . . . . . . . . 7.13% 1/15/23 24,333 14,681,559 0.1Frontier Communications Corp. . . . . . . . . . . . . . . . . . . . . . . . . . . . 7.63% 4/15/24 13,386 7,745,635 0.0Frontier Communications Corp. . . . . . . . . . . . . . . . . . . . . . . . . . . . 7.88% 1/15/27 11,388 5,777,873 0.0Frontier Communications Corp. . . . . . . . . . . . . . . . . . . . . . . . . . . . 8.75% 4/15/22 4,755 3,243,200 0.0Hughes Satellite Systems Corp.. . . . . . . . . . . . . . . . . . . . . . . . . . . . 6.63% 8/01/26 7,000 6,855,030 0.0Hughes Satellite Systems Corp.. . . . . . . . . . . . . . . . . . . . . . . . . . . . 7.63% 6/15/21 5,607 6,014,388 0.0Intelsat Jackson Holdings SA. . . . . . . . . . . . . . . . . . . . . . . . . . . . . . 5.50% 8/01/23 33,777 30,943,346 0.2Intelsat Jackson Holdings SA. . . . . . . . . . . . . . . . . . . . . . . . . . . . . . 8.00% 2/15/24 3,433 3,580,640 0.0Intelsat Jackson Holdings SA. . . . . . . . . . . . . . . . . . . . . . . . . . . . . . 9.50% 9/30/22 12,167 14,115,594 0.1Intelsat Jackson Holdings SA. . . . . . . . . . . . . . . . . . . . . . . . . . . . . . 9.75% 7/15/25 27,736 28,872,954 0.2Intelsat Luxembourg SA . . . . . . . . . . . . . . . . . . . . . . . . . . . . . . . . . 8.13% 6/01/23 2,000 1,670,556 0.0Level 3 Financing, Inc. . . . . . . . . . . . . . . . . . . . . . . . . . . . . . . . . . . 5.25% 3/15/26 598 587,540 0.0Level 3 Financing, Inc. . . . . . . . . . . . . . . . . . . . . . . . . . . . . . . . . . . 5.38% 1/15/24 5,018 5,056,483 0.0Level 3 Parent LLC . . . . . . . . . . . . . . . . . . . . . . . . . . . . . . . . . . . . . 5.75% 12/01/22 7,620 7,694,127 0.0Sable International Finance Ltd. . . . . . . . . . . . . . . . . . . . . . . . . . . . 6.88% 8/01/22 4,067 4,231,766 0.0SoftBank Group Corp.(f) . . . . . . . . . . . . . . . . . . . . . . . . . . . . . . . . . 6.00% 7/19/23 17,245 15,481,992 0.1SoftBank Group Corp. . . . . . . . . . . . . . . . . . . . . . . . . . . . . . . . . . . . 6.13% 4/20/25 27,481 28,188,883 0.2SoftBank Group Corp.(f) . . . . . . . . . . . . . . . . . . . . . . . . . . . . . . . . . 6.88% 7/19/27 31,018 27,231,198 0.1Sprint Capital Corp. . . . . . . . . . . . . . . . . . . . . . . . . . . . . . . . . . . . . . 6.88% 11/15/28 16,919 16,723,907 0.1Sprint Capital Corp. . . . . . . . . . . . . . . . . . . . . . . . . . . . . . . . . . . . . . 8.75% 3/15/32 5,314 5,765,015 0.0Sprint Corp. . . . . . . . . . . . . . . . . . . . . . . . . . . . . . . . . . . . . . . . . . . . 7.25% 9/15/21 7,197 7,604,832 0.0Sprint Corp. . . . . . . . . . . . . . . . . . . . . . . . . . . . . . . . . . . . . . . . . . . . 7.63% 3/01/26 10,450 10,900,301 0.1Sprint Corp. . . . . . . . . . . . . . . . . . . . . . . . . . . . . . . . . . . . . . . . . . . . 7.88% 9/15/23 6,095 6,522,217 0.0Telecom Italia Capital SA . . . . . . . . . . . . . . . . . . . . . . . . . . . . . . . . 6.00% 9/30/34 2,000 1,808,504 0.0Telecom Italia Capital SA . . . . . . . . . . . . . . . . . . . . . . . . . . . . . . . . 7.20% 7/18/36 18,991 18,947,473 0.1
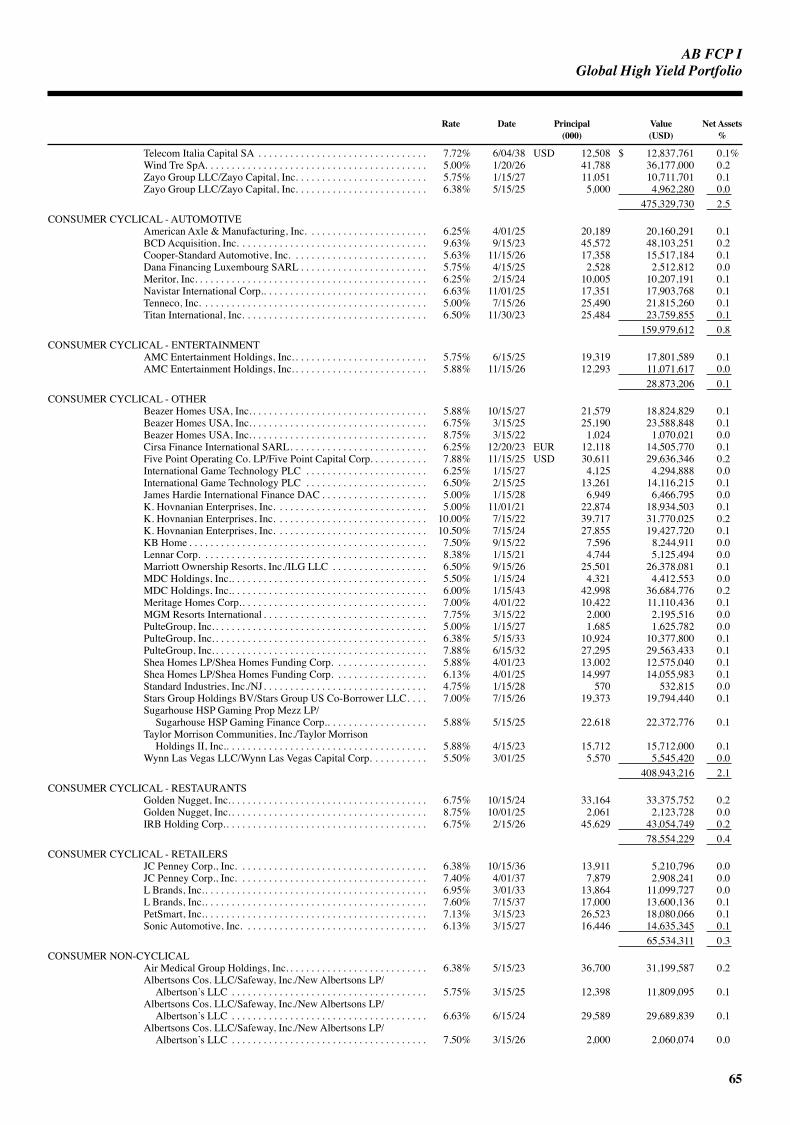
AB FCP I
65
GlobalHighYieldPortfolio
Rate Date Principal Value Net Assets (000) (USD) %
Telecom Italia Capital SA . . . . . . . . . . . . . . . . . . . . . . . . . . . . . . . . 7.72% 6/04/38 USD 12,508 $ 12,837,761 0.1%Wind Tre SpA. . . . . . . . . . . . . . . . . . . . . . . . . . . . . . . . . . . . . . . . . . 5.00% 1/20/26 41,788 36,177,000 0.2Zayo Group LLC/Zayo Capital, Inc. . . . . . . . . . . . . . . . . . . . . . . . . 5.75% 1/15/27 11,051 10,711,701 0.1Zayo Group LLC/Zayo Capital, Inc. . . . . . . . . . . . . . . . . . . . . . . . . 6.38% 5/15/25 5,000 4,962,280 0.0 475,329,730 2.5
CONSUMER CYCLICAL - AUTOMOTIVEAmerican Axle & Manufacturing, Inc. . . . . . . . . . . . . . . . . . . . . . . 6.25% 4/01/25 20,189 20,160,291 0.1BCD Acquisition, Inc. . . . . . . . . . . . . . . . . . . . . . . . . . . . . . . . . . . . 9.63% 9/15/23 45,572 48,103,251 0.2Cooper-Standard Automotive, Inc. . . . . . . . . . . . . . . . . . . . . . . . . . 5.63% 11/15/26 17,358 15,517,184 0.1Dana Financing Luxembourg SARL . . . . . . . . . . . . . . . . . . . . . . . . 5.75% 4/15/25 2,528 2,512,812 0.0Meritor, Inc. . . . . . . . . . . . . . . . . . . . . . . . . . . . . . . . . . . . . . . . . . . . 6.25% 2/15/24 10,005 10,207,191 0.1Navistar International Corp.. . . . . . . . . . . . . . . . . . . . . . . . . . . . . . . 6.63% 11/01/25 17,351 17,903,768 0.1Tenneco, Inc. . . . . . . . . . . . . . . . . . . . . . . . . . . . . . . . . . . . . . . . . . . 5.00% 7/15/26 25,490 21,815,260 0.1Titan International, Inc. . . . . . . . . . . . . . . . . . . . . . . . . . . . . . . . . . . 6.50% 11/30/23 25,484 23,759,855 0.1 159,979,612 0.8
CONSUMER CYCLICAL - ENTERTAINMENTAMC Entertainment Holdings, Inc. . . . . . . . . . . . . . . . . . . . . . . . . . 5.75% 6/15/25 19,319 17,801,589 0.1AMC Entertainment Holdings, Inc. . . . . . . . . . . . . . . . . . . . . . . . . . 5.88% 11/15/26 12,293 11,071,617 0.0 28,873,206 0.1
CONSUMER CYCLICAL - OTHERBeazer Homes USA, Inc. . . . . . . . . . . . . . . . . . . . . . . . . . . . . . . . . . 5.88% 10/15/27 21,579 18,824,829 0.1Beazer Homes USA, Inc. . . . . . . . . . . . . . . . . . . . . . . . . . . . . . . . . . 6.75% 3/15/25 25,190 23,588,848 0.1Beazer Homes USA, Inc. . . . . . . . . . . . . . . . . . . . . . . . . . . . . . . . . . 8.75% 3/15/22 1,024 1,070,021 0.0Cirsa Finance International SARL. . . . . . . . . . . . . . . . . . . . . . . . . . 6.25% 12/20/23 EUR 12,118 14,505,770 0.1Five Point Operating Co. LP/Five Point Capital Corp. . . . . . . . . . . 7.88% 11/15/25 USD 30,611 29,636,346 0.2International Game Technology PLC . . . . . . . . . . . . . . . . . . . . . . . 6.25% 1/15/27 4,125 4,294,888 0.0International Game Technology PLC . . . . . . . . . . . . . . . . . . . . . . . 6.50% 2/15/25 13,261 14,116,215 0.1James Hardie International Finance DAC . . . . . . . . . . . . . . . . . . . . 5.00% 1/15/28 6,949 6,466,795 0.0K. Hovnanian Enterprises, Inc. . . . . . . . . . . . . . . . . . . . . . . . . . . . . 5.00% 11/01/21 22,874 18,934,503 0.1K. Hovnanian Enterprises, Inc. . . . . . . . . . . . . . . . . . . . . . . . . . . . . 10.00% 7/15/22 39,717 31,770,025 0.2K. Hovnanian Enterprises, Inc. . . . . . . . . . . . . . . . . . . . . . . . . . . . . 10.50% 7/15/24 27,855 19,427,720 0.1KB Home . . . . . . . . . . . . . . . . . . . . . . . . . . . . . . . . . . . . . . . . . . . . . 7.50% 9/15/22 7,596 8,244,911 0.0Lennar Corp. . . . . . . . . . . . . . . . . . . . . . . . . . . . . . . . . . . . . . . . . . . 8.38% 1/15/21 4,744 5,125,494 0.0Marriott Ownership Resorts, Inc./ILG LLC . . . . . . . . . . . . . . . . . . 6.50% 9/15/26 25,501 26,378,081 0.1MDC Holdings, Inc.. . . . . . . . . . . . . . . . . . . . . . . . . . . . . . . . . . . . . 5.50% 1/15/24 4,321 4,412,553 0.0MDC Holdings, Inc.. . . . . . . . . . . . . . . . . . . . . . . . . . . . . . . . . . . . . 6.00% 1/15/43 42,998 36,684,776 0.2Meritage Homes Corp.. . . . . . . . . . . . . . . . . . . . . . . . . . . . . . . . . . . 7.00% 4/01/22 10,422 11,110,436 0.1MGM Resorts International . . . . . . . . . . . . . . . . . . . . . . . . . . . . . . . 7.75% 3/15/22 2,000 2,195,516 0.0PulteGroup, Inc. . . . . . . . . . . . . . . . . . . . . . . . . . . . . . . . . . . . . . . . . 5.00% 1/15/27 1,685 1,625,782 0.0PulteGroup, Inc. . . . . . . . . . . . . . . . . . . . . . . . . . . . . . . . . . . . . . . . . 6.38% 5/15/33 10,924 10,377,800 0.1PulteGroup, Inc. . . . . . . . . . . . . . . . . . . . . . . . . . . . . . . . . . . . . . . . . 7.88% 6/15/32 27,295 29,563,433 0.1Shea Homes LP/Shea Homes Funding Corp. . . . . . . . . . . . . . . . . . 5.88% 4/01/23 13,002 12,575,040 0.1Shea Homes LP/Shea Homes Funding Corp. . . . . . . . . . . . . . . . . . 6.13% 4/01/25 14,997 14,055,983 0.1Standard Industries, Inc./NJ. . . . . . . . . . . . . . . . . . . . . . . . . . . . . . . 4.75% 1/15/28 570 532,815 0.0Stars Group Holdings BV/Stars Group US Co-Borrower LLC. . . . 7.00% 7/15/26 19,373 19,794,440 0.1Sugarhouse HSP Gaming Prop Mezz LP/
Sugarhouse HSP Gaming Finance Corp.. . . . . . . . . . . . . . . . . . . 5.88% 5/15/25 22,618 22,372,776 0.1Taylor Morrison Communities, Inc./Taylor Morrison
Holdings II, Inc.. . . . . . . . . . . . . . . . . . . . . . . . . . . . . . . . . . . . . . 5.88% 4/15/23 15,712 15,712,000 0.1Wynn Las Vegas LLC/Wynn Las Vegas Capital Corp. . . . . . . . . . . 5.50% 3/01/25 5,570 5,545,420 0.0 408,943,216 2.1
CONSUMER CYCLICAL - RESTAURANTSGolden Nugget, Inc.. . . . . . . . . . . . . . . . . . . . . . . . . . . . . . . . . . . . . 6.75% 10/15/24 33,164 33,375,752 0.2Golden Nugget, Inc.. . . . . . . . . . . . . . . . . . . . . . . . . . . . . . . . . . . . . 8.75% 10/01/25 2,061 2,123,728 0.0IRB Holding Corp.. . . . . . . . . . . . . . . . . . . . . . . . . . . . . . . . . . . . . . 6.75% 2/15/26 45,629 43,054,749 0.2 78,554,229 0.4
CONSUMER CYCLICAL - RETAILERSJC Penney Corp., Inc. . . . . . . . . . . . . . . . . . . . . . . . . . . . . . . . . . . . 6.38% 10/15/36 13,911 5,210,796 0.0JC Penney Corp., Inc. . . . . . . . . . . . . . . . . . . . . . . . . . . . . . . . . . . . 7.40% 4/01/37 7,879 2,908,241 0.0L Brands, Inc.. . . . . . . . . . . . . . . . . . . . . . . . . . . . . . . . . . . . . . . . . . 6.95% 3/01/33 13,864 11,099,727 0.0L Brands, Inc.. . . . . . . . . . . . . . . . . . . . . . . . . . . . . . . . . . . . . . . . . . 7.60% 7/15/37 17,000 13,600,136 0.1PetSmart, Inc.. . . . . . . . . . . . . . . . . . . . . . . . . . . . . . . . . . . . . . . . . . 7.13% 3/15/23 26,523 18,080,066 0.1Sonic Automotive, Inc. . . . . . . . . . . . . . . . . . . . . . . . . . . . . . . . . . . 6.13% 3/15/27 16,446 14,635,345 0.1 65,534,311 0.3
CONSUMER NON-CYCLICALAir Medical Group Holdings, Inc. . . . . . . . . . . . . . . . . . . . . . . . . . . 6.38% 5/15/23 36,700 31,199,587 0.2Albertsons Cos. LLC/Safeway, Inc./New Albertsons LP/
Albertson’s LLC . . . . . . . . . . . . . . . . . . . . . . . . . . . . . . . . . . . . . 5.75% 3/15/25 12,398 11,809,095 0.1Albertsons Cos. LLC/Safeway, Inc./New Albertsons LP/
Albertson’s LLC . . . . . . . . . . . . . . . . . . . . . . . . . . . . . . . . . . . . . 6.63% 6/15/24 29,589 29,689,839 0.1Albertsons Cos. LLC/Safeway, Inc./New Albertsons LP/
Albertson’s LLC . . . . . . . . . . . . . . . . . . . . . . . . . . . . . . . . . . . . . 7.50% 3/15/26 2,000 2,060,074 0.0
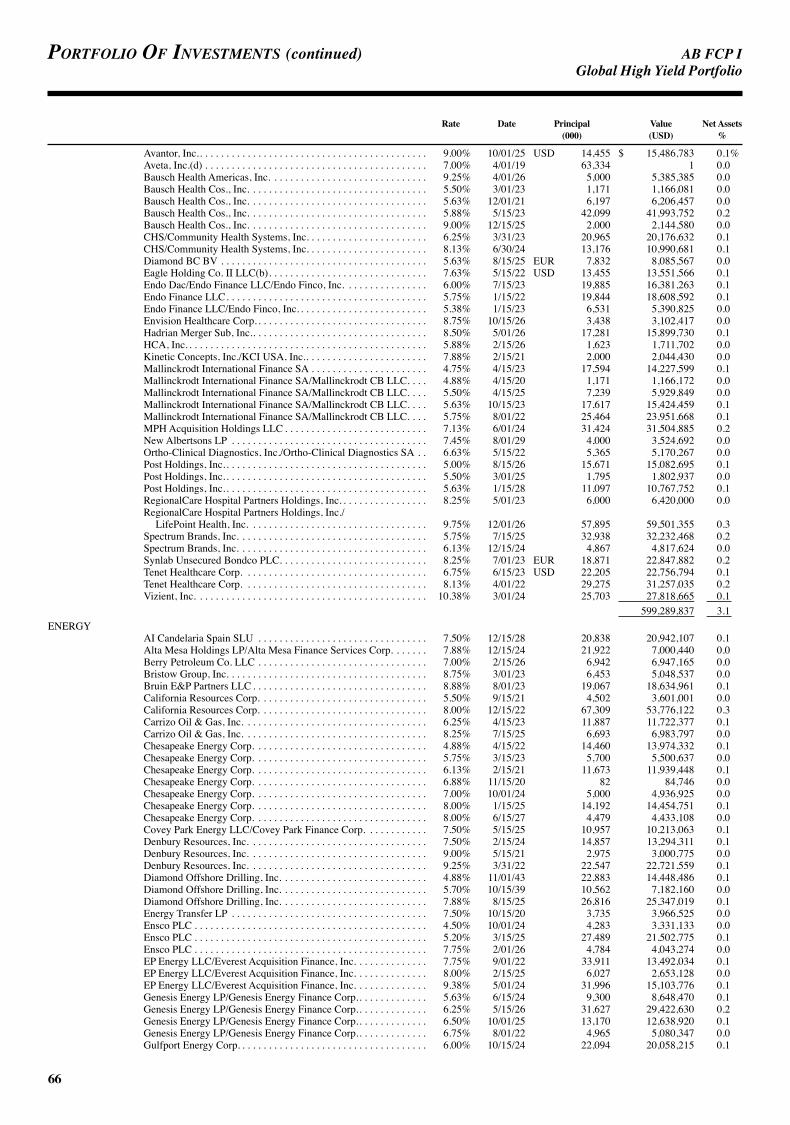
AB FCP I
66
Portfolio of investments (continued) GlobalHighYieldPortfolio
Rate Date Principal Value Net Assets (000) (USD) %
Avantor, Inc.. . . . . . . . . . . . . . . . . . . . . . . . . . . . . . . . . . . . . . . . . . . 9.00% 10/01/25 USD 14,455 $ 15,486,783 0.1%Aveta, Inc.(d) . . . . . . . . . . . . . . . . . . . . . . . . . . . . . . . . . . . . . . . . . . 7.00% 4/01/19 63,334 1 0.0Bausch Health Americas, Inc. . . . . . . . . . . . . . . . . . . . . . . . . . . . . . 9.25% 4/01/26 5,000 5,385,385 0.0Bausch Health Cos., Inc. . . . . . . . . . . . . . . . . . . . . . . . . . . . . . . . . . 5.50% 3/01/23 1,171 1,166,081 0.0Bausch Health Cos., Inc. . . . . . . . . . . . . . . . . . . . . . . . . . . . . . . . . . 5.63% 12/01/21 6,197 6,206,457 0.0Bausch Health Cos., Inc. . . . . . . . . . . . . . . . . . . . . . . . . . . . . . . . . . 5.88% 5/15/23 42,099 41,993,752 0.2Bausch Health Cos., Inc. . . . . . . . . . . . . . . . . . . . . . . . . . . . . . . . . . 9.00% 12/15/25 2,000 2,144,580 0.0CHS/Community Health Systems, Inc. . . . . . . . . . . . . . . . . . . . . . . 6.25% 3/31/23 20,965 20,176,632 0.1CHS/Community Health Systems, Inc. . . . . . . . . . . . . . . . . . . . . . . 8.13% 6/30/24 13,176 10,990,681 0.1Diamond BC BV . . . . . . . . . . . . . . . . . . . . . . . . . . . . . . . . . . . . . . . 5.63% 8/15/25 EUR 7,832 8,085,567 0.0Eagle Holding Co. II LLC(b). . . . . . . . . . . . . . . . . . . . . . . . . . . . . . 7.63% 5/15/22 USD 13,455 13,551,566 0.1Endo Dac/Endo Finance LLC/Endo Finco, Inc. . . . . . . . . . . . . . . . 6.00% 7/15/23 19,885 16,381,263 0.1Endo Finance LLC. . . . . . . . . . . . . . . . . . . . . . . . . . . . . . . . . . . . . . 5.75% 1/15/22 19,844 18,608,592 0.1Endo Finance LLC/Endo Finco, Inc. . . . . . . . . . . . . . . . . . . . . . . . . 5.38% 1/15/23 6,531 5,390,825 0.0Envision Healthcare Corp. . . . . . . . . . . . . . . . . . . . . . . . . . . . . . . . . 8.75% 10/15/26 3,438 3,102,417 0.0Hadrian Merger Sub, Inc.. . . . . . . . . . . . . . . . . . . . . . . . . . . . . . . . . 8.50% 5/01/26 17,281 15,899,730 0.1HCA, Inc. . . . . . . . . . . . . . . . . . . . . . . . . . . . . . . . . . . . . . . . . . . . . . 5.88% 2/15/26 1,623 1,711,702 0.0Kinetic Concepts, Inc./KCI USA, Inc.. . . . . . . . . . . . . . . . . . . . . . . 7.88% 2/15/21 2,000 2,044,430 0.0Mallinckrodt International Finance SA . . . . . . . . . . . . . . . . . . . . . . 4.75% 4/15/23 17,594 14,227,599 0.1Mallinckrodt International Finance SA/Mallinckrodt CB LLC. . . . 4.88% 4/15/20 1,171 1,166,172 0.0Mallinckrodt International Finance SA/Mallinckrodt CB LLC. . . . 5.50% 4/15/25 7,239 5,929,849 0.0Mallinckrodt International Finance SA/Mallinckrodt CB LLC. . . . 5.63% 10/15/23 17,617 15,424,459 0.1Mallinckrodt International Finance SA/Mallinckrodt CB LLC. . . . 5.75% 8/01/22 25,464 23,951,668 0.1MPH Acquisition Holdings LLC . . . . . . . . . . . . . . . . . . . . . . . . . . . 7.13% 6/01/24 31,424 31,504,885 0.2New Albertsons LP . . . . . . . . . . . . . . . . . . . . . . . . . . . . . . . . . . . . . 7.45% 8/01/29 4,000 3,524,692 0.0Ortho-Clinical Diagnostics, Inc./Ortho-Clinical Diagnostics SA . . 6.63% 5/15/22 5,365 5,170,267 0.0Post Holdings, Inc.. . . . . . . . . . . . . . . . . . . . . . . . . . . . . . . . . . . . . . 5.00% 8/15/26 15,671 15,082,695 0.1Post Holdings, Inc.. . . . . . . . . . . . . . . . . . . . . . . . . . . . . . . . . . . . . . 5.50% 3/01/25 1,795 1,802,937 0.0Post Holdings, Inc.. . . . . . . . . . . . . . . . . . . . . . . . . . . . . . . . . . . . . . 5.63% 1/15/28 11,097 10,767,752 0.1RegionalCare Hospital Partners Holdings, Inc. . . . . . . . . . . . . . . . . 8.25% 5/01/23 6,000 6,420,000 0.0RegionalCare Hospital Partners Holdings, Inc./
LifePoint Health, Inc. . . . . . . . . . . . . . . . . . . . . . . . . . . . . . . . . . 9.75% 12/01/26 57,895 59,501,355 0.3Spectrum Brands, Inc. . . . . . . . . . . . . . . . . . . . . . . . . . . . . . . . . . . . 5.75% 7/15/25 32,938 32,232,468 0.2Spectrum Brands, Inc. . . . . . . . . . . . . . . . . . . . . . . . . . . . . . . . . . . . 6.13% 12/15/24 4,867 4,817,624 0.0Synlab Unsecured Bondco PLC. . . . . . . . . . . . . . . . . . . . . . . . . . . . 8.25% 7/01/23 EUR 18,871 22,847,882 0.2Tenet Healthcare Corp. . . . . . . . . . . . . . . . . . . . . . . . . . . . . . . . . . . 6.75% 6/15/23 USD 22,205 22,756,794 0.1Tenet Healthcare Corp. . . . . . . . . . . . . . . . . . . . . . . . . . . . . . . . . . . 8.13% 4/01/22 29,275 31,257,035 0.2Vizient, Inc. . . . . . . . . . . . . . . . . . . . . . . . . . . . . . . . . . . . . . . . . . . . 10.38% 3/01/24 25,703 27,818,665 0.1 599,289,837 3.1
ENERGYAI Candelaria Spain SLU . . . . . . . . . . . . . . . . . . . . . . . . . . . . . . . . 7.50% 12/15/28 20,838 20,942,107 0.1Alta Mesa Holdings LP/Alta Mesa Finance Services Corp. . . . . . . 7.88% 12/15/24 21,922 7,000,440 0.0Berry Petroleum Co. LLC . . . . . . . . . . . . . . . . . . . . . . . . . . . . . . . . 7.00% 2/15/26 6,942 6,947,165 0.0Bristow Group, Inc. . . . . . . . . . . . . . . . . . . . . . . . . . . . . . . . . . . . . . 8.75% 3/01/23 6,453 5,048,537 0.0Bruin E&P Partners LLC . . . . . . . . . . . . . . . . . . . . . . . . . . . . . . . . . 8.88% 8/01/23 19,067 18,634,961 0.1California Resources Corp. . . . . . . . . . . . . . . . . . . . . . . . . . . . . . . . 5.50% 9/15/21 4,502 3,601,001 0.0California Resources Corp. . . . . . . . . . . . . . . . . . . . . . . . . . . . . . . . 8.00% 12/15/22 67,309 53,776,122 0.3Carrizo Oil & Gas, Inc. . . . . . . . . . . . . . . . . . . . . . . . . . . . . . . . . . . 6.25% 4/15/23 11,887 11,722,377 0.1Carrizo Oil & Gas, Inc. . . . . . . . . . . . . . . . . . . . . . . . . . . . . . . . . . . 8.25% 7/15/25 6,693 6,983,797 0.0Chesapeake Energy Corp. . . . . . . . . . . . . . . . . . . . . . . . . . . . . . . . . 4.88% 4/15/22 14,460 13,974,332 0.1Chesapeake Energy Corp. . . . . . . . . . . . . . . . . . . . . . . . . . . . . . . . . 5.75% 3/15/23 5,700 5,500,637 0.0Chesapeake Energy Corp. . . . . . . . . . . . . . . . . . . . . . . . . . . . . . . . . 6.13% 2/15/21 11,673 11,939,448 0.1Chesapeake Energy Corp. . . . . . . . . . . . . . . . . . . . . . . . . . . . . . . . . 6.88% 11/15/20 82 84,746 0.0Chesapeake Energy Corp. . . . . . . . . . . . . . . . . . . . . . . . . . . . . . . . . 7.00% 10/01/24 5,000 4,936,925 0.0Chesapeake Energy Corp. . . . . . . . . . . . . . . . . . . . . . . . . . . . . . . . . 8.00% 1/15/25 14,192 14,454,751 0.1Chesapeake Energy Corp. . . . . . . . . . . . . . . . . . . . . . . . . . . . . . . . . 8.00% 6/15/27 4,479 4,433,108 0.0Covey Park Energy LLC/Covey Park Finance Corp. . . . . . . . . . . . 7.50% 5/15/25 10,957 10,213,063 0.1Denbury Resources, Inc. . . . . . . . . . . . . . . . . . . . . . . . . . . . . . . . . . 7.50% 2/15/24 14,857 13,294,311 0.1Denbury Resources, Inc. . . . . . . . . . . . . . . . . . . . . . . . . . . . . . . . . . 9.00% 5/15/21 2,975 3,000,775 0.0Denbury Resources, Inc. . . . . . . . . . . . . . . . . . . . . . . . . . . . . . . . . . 9.25% 3/31/22 22,547 22,721,559 0.1Diamond Offshore Drilling, Inc. . . . . . . . . . . . . . . . . . . . . . . . . . . . 4.88% 11/01/43 22,883 14,448,486 0.1Diamond Offshore Drilling, Inc. . . . . . . . . . . . . . . . . . . . . . . . . . . . 5.70% 10/15/39 10,562 7,182,160 0.0Diamond Offshore Drilling, Inc. . . . . . . . . . . . . . . . . . . . . . . . . . . . 7.88% 8/15/25 26,816 25,347,019 0.1Energy Transfer LP . . . . . . . . . . . . . . . . . . . . . . . . . . . . . . . . . . . . . 7.50% 10/15/20 3,735 3,966,525 0.0Ensco PLC . . . . . . . . . . . . . . . . . . . . . . . . . . . . . . . . . . . . . . . . . . . . 4.50% 10/01/24 4,283 3,331,133 0.0Ensco PLC . . . . . . . . . . . . . . . . . . . . . . . . . . . . . . . . . . . . . . . . . . . . 5.20% 3/15/25 27,489 21,502,775 0.1Ensco PLC . . . . . . . . . . . . . . . . . . . . . . . . . . . . . . . . . . . . . . . . . . . . 7.75% 2/01/26 4,784 4,043,274 0.0EP Energy LLC/Everest Acquisition Finance, Inc. . . . . . . . . . . . . . 7.75% 9/01/22 33,911 13,492,034 0.1EP Energy LLC/Everest Acquisition Finance, Inc. . . . . . . . . . . . . . 8.00% 2/15/25 6,027 2,653,128 0.0EP Energy LLC/Everest Acquisition Finance, Inc. . . . . . . . . . . . . . 9.38% 5/01/24 31,996 15,103,776 0.1Genesis Energy LP/Genesis Energy Finance Corp.. . . . . . . . . . . . . 5.63% 6/15/24 9,300 8,648,470 0.1Genesis Energy LP/Genesis Energy Finance Corp.. . . . . . . . . . . . . 6.25% 5/15/26 31,627 29,422,630 0.2Genesis Energy LP/Genesis Energy Finance Corp.. . . . . . . . . . . . . 6.50% 10/01/25 13,170 12,638,920 0.1Genesis Energy LP/Genesis Energy Finance Corp.. . . . . . . . . . . . . 6.75% 8/01/22 4,965 5,080,347 0.0Gulfport Energy Corp. . . . . . . . . . . . . . . . . . . . . . . . . . . . . . . . . . . . 6.00% 10/15/24 22,094 20,058,215 0.1

AB FCP I
67
GlobalHighYieldPortfolio
Rate Date Principal Value Net Assets (000) (USD) %
Gulfport Energy Corp. . . . . . . . . . . . . . . . . . . . . . . . . . . . . . . . . . . . 6.38% 5/15/25 USD 17,346 $ 15,645,155 0.1%Gulfport Energy Corp. . . . . . . . . . . . . . . . . . . . . . . . . . . . . . . . . . . . 6.38% 1/15/26 26,100 22,954,245 0.1Hess Infrastructure Partners LP/Hess Infrastructure Partners
Finance Corp. . . . . . . . . . . . . . . . . . . . . . . . . . . . . . . . . . . . . . . . 5.63% 2/15/26 14,394 14,466,042 0.1HighPoint Operating Corp. . . . . . . . . . . . . . . . . . . . . . . . . . . . . . . . 7.00% 10/15/22 14,128 13,544,401 0.1HighPoint Operating Corp. . . . . . . . . . . . . . . . . . . . . . . . . . . . . . . . 8.75% 6/15/25 10,769 10,338,294 0.1Hilcorp Energy I LP/Hilcorp Finance Co. . . . . . . . . . . . . . . . . . . . . 5.00% 12/01/24 6,337 6,090,339 0.0Hilcorp Energy I LP/Hilcorp Finance Co. . . . . . . . . . . . . . . . . . . . . 5.75% 10/01/25 32,804 32,595,268 0.2Indigo Natural Resources LLC . . . . . . . . . . . . . . . . . . . . . . . . . . . . 6.88% 2/15/26 20,506 17,873,727 0.1Laredo Petroleum, Inc.. . . . . . . . . . . . . . . . . . . . . . . . . . . . . . . . . . . 6.25% 3/15/23 25,835 24,166,989 0.1Murphy Oil Corp.. . . . . . . . . . . . . . . . . . . . . . . . . . . . . . . . . . . . . . . 5.75% 8/15/25 5,065 5,149,256 0.0Murphy Oil USA, Inc. . . . . . . . . . . . . . . . . . . . . . . . . . . . . . . . . . . . 5.63% 5/01/27 1,441 1,455,407 0.0Murphy Oil USA, Inc. . . . . . . . . . . . . . . . . . . . . . . . . . . . . . . . . . . . 6.00% 8/15/23 8,944 9,170,382 0.1Nabors Industries, Inc. . . . . . . . . . . . . . . . . . . . . . . . . . . . . . . . . . . . 4.63% 9/15/21 2,744 2,687,380 0.0Nabors Industries, Inc. . . . . . . . . . . . . . . . . . . . . . . . . . . . . . . . . . . . 5.50% 1/15/23 51,637 48,574,358 0.3Nine Energy Service, Inc. . . . . . . . . . . . . . . . . . . . . . . . . . . . . . . . . 8.75% 11/01/23 9,753 9,755,107 0.1Noble Holding International Ltd.. . . . . . . . . . . . . . . . . . . . . . . . . . . 5.25% 3/15/42 2,938 1,833,050 0.0Noble Holding International Ltd.. . . . . . . . . . . . . . . . . . . . . . . . . . . 6.20% 8/01/40 4,800 3,072,000 0.0Noble Holding International Ltd.. . . . . . . . . . . . . . . . . . . . . . . . . . . 7.75% 1/15/24 36,903 33,193,400 0.2Noble Holding International Ltd.. . . . . . . . . . . . . . . . . . . . . . . . . . . 7.95% 4/01/25 7,686 6,785,477 0.0Parkland Fuel Corp. . . . . . . . . . . . . . . . . . . . . . . . . . . . . . . . . . . . . . 6.00% 4/01/26 27,608 27,137,339 0.1PDC Energy, Inc. . . . . . . . . . . . . . . . . . . . . . . . . . . . . . . . . . . . . . . . 5.75% 5/15/26 14,387 13,875,111 0.1PDC Energy, Inc. . . . . . . . . . . . . . . . . . . . . . . . . . . . . . . . . . . . . . . . 6.13% 9/15/24 13,322 13,189,699 0.1Precision Drilling Corp. . . . . . . . . . . . . . . . . . . . . . . . . . . . . . . . . . . 5.25% 11/15/24 2,000 1,850,078 0.0Precision Drilling Corp. . . . . . . . . . . . . . . . . . . . . . . . . . . . . . . . . . . 7.13% 1/15/26 19,113 18,810,632 0.1QEP Resources, Inc.. . . . . . . . . . . . . . . . . . . . . . . . . . . . . . . . . . . . . 5.25% 5/01/23 22,466 21,681,128 0.1Range Resources Corp. . . . . . . . . . . . . . . . . . . . . . . . . . . . . . . . . . . 5.00% 8/15/22 2,492 2,457,518 0.0Range Resources Corp. . . . . . . . . . . . . . . . . . . . . . . . . . . . . . . . . . . 5.00% 3/15/23 16,896 16,313,274 0.1Range Resources Corp. . . . . . . . . . . . . . . . . . . . . . . . . . . . . . . . . . . 5.88% 7/01/22 2,238 2,261,839 0.0Rowan Cos., Inc. . . . . . . . . . . . . . . . . . . . . . . . . . . . . . . . . . . . . . . . 5.85% 1/15/44 12,956 8,490,740 0.0Rowan Cos., Inc. . . . . . . . . . . . . . . . . . . . . . . . . . . . . . . . . . . . . . . . 7.38% 6/15/25 26,209 22,770,641 0.1SemGroup Corp. . . . . . . . . . . . . . . . . . . . . . . . . . . . . . . . . . . . . . . . 6.38% 3/15/25 13,860 13,045,822 0.1SemGroup Corp. . . . . . . . . . . . . . . . . . . . . . . . . . . . . . . . . . . . . . . . 7.25% 3/15/26 7,120 6,889,732 0.0SemGroup Corp./Rose Rock Finance Corp. . . . . . . . . . . . . . . . . . . 5.63% 11/15/23 15,214 14,190,037 0.1SM Energy Co.. . . . . . . . . . . . . . . . . . . . . . . . . . . . . . . . . . . . . . . . . 5.00% 1/15/24 11,945 11,241,129 0.1SM Energy Co.. . . . . . . . . . . . . . . . . . . . . . . . . . . . . . . . . . . . . . . . . 5.63% 6/01/25 26,783 25,176,020 0.1SM Energy Co.. . . . . . . . . . . . . . . . . . . . . . . . . . . . . . . . . . . . . . . . . 6.63% 1/15/27 11,080 10,564,769 0.1SM Energy Co.. . . . . . . . . . . . . . . . . . . . . . . . . . . . . . . . . . . . . . . . . 6.75% 9/15/26 5,986 5,743,932 0.0Southern Star Central Corp.. . . . . . . . . . . . . . . . . . . . . . . . . . . . . . . 5.13% 7/15/22 17,000 16,861,705 0.1SRC Energy, Inc. . . . . . . . . . . . . . . . . . . . . . . . . . . . . . . . . . . . . . . . 6.25% 12/01/25 20,227 18,405,559 0.1Sunoco LP/Sunoco Finance Corp. . . . . . . . . . . . . . . . . . . . . . . . . . . 5.50% 2/15/26 21,585 21,426,178 0.1Sunoco LP/Sunoco Finance Corp. . . . . . . . . . . . . . . . . . . . . . . . . . . 5.88% 3/15/28 27,467 27,172,801 0.1Transocean Phoenix 2 Ltd.. . . . . . . . . . . . . . . . . . . . . . . . . . . . . . . . 7.75% 10/15/24 14,287 15,026,805 0.1Transocean, Inc. . . . . . . . . . . . . . . . . . . . . . . . . . . . . . . . . . . . . . . . . 6.80% 3/15/38 22,240 16,816,331 0.1Transocean, Inc. . . . . . . . . . . . . . . . . . . . . . . . . . . . . . . . . . . . . . . . . 7.50% 1/15/26 24,681 23,767,186 0.1Transocean, Inc. . . . . . . . . . . . . . . . . . . . . . . . . . . . . . . . . . . . . . . . . 9.00% 7/15/23 8,081 8,545,657 0.0Vine Oil & Gas LP/Vine Oil & Gas Finance Corp. . . . . . . . . . . . . . 8.75% 4/15/23 39,494 32,029,634 0.2Weatherford International Ltd.. . . . . . . . . . . . . . . . . . . . . . . . . . . . . 6.50% 8/01/36 11,466 6,892,235 0.0Weatherford International Ltd.. . . . . . . . . . . . . . . . . . . . . . . . . . . . . 6.75% 9/15/40 12,804 7,648,508 0.0Weatherford International Ltd.. . . . . . . . . . . . . . . . . . . . . . . . . . . . . 7.00% 3/15/38 4,509 2,693,217 0.0Weatherford International Ltd.. . . . . . . . . . . . . . . . . . . . . . . . . . . . . 7.75% 6/15/21 4,672 4,168,709 0.0Weatherford International Ltd.. . . . . . . . . . . . . . . . . . . . . . . . . . . . . 9.88% 2/15/24 26,611 19,202,817 0.1Whiting Petroleum Corp. . . . . . . . . . . . . . . . . . . . . . . . . . . . . . . . . . 6.25% 4/01/23 11,330 11,334,793 0.1Whiting Petroleum Corp. . . . . . . . . . . . . . . . . . . . . . . . . . . . . . . . . . 6.63% 1/15/26 31,361 30,727,508 0.2WPX Energy, Inc. . . . . . . . . . . . . . . . . . . . . . . . . . . . . . . . . . . . . . . 5.25% 9/15/24 21,807 21,829,178 0.1WPX Energy, Inc. . . . . . . . . . . . . . . . . . . . . . . . . . . . . . . . . . . . . . . 8.25% 8/01/23 7,381 8,283,135 0.0 1,234,000,727 6.4
OTHER INDUSTRIALAlgeco Global Finance PLC . . . . . . . . . . . . . . . . . . . . . . . . . . . . . . 8.00% 2/15/23 27,923 27,877,206 0.1Global Partners LP/GLP Finance Corp.. . . . . . . . . . . . . . . . . . . . . . 6.25% 7/15/22 42,531 41,907,368 0.2H&E Equipment Services, Inc. . . . . . . . . . . . . . . . . . . . . . . . . . . . . 5.63% 9/01/25 11,900 11,795,482 0.1Laureate Education, Inc. . . . . . . . . . . . . . . . . . . . . . . . . . . . . . . . . . 8.25% 5/01/25 13,714 14,811,710 0.1 96,391,766 0.5
SERVICESADT Security Corp. (The) . . . . . . . . . . . . . . . . . . . . . . . . . . . . . . . . 4.88% 7/15/32 9,000 7,520,958 0.0Aptim Corp. . . . . . . . . . . . . . . . . . . . . . . . . . . . . . . . . . . . . . . . . . . . 7.75% 6/15/25 23,228 18,153,100 0.1APX Group, Inc. . . . . . . . . . . . . . . . . . . . . . . . . . . . . . . . . . . . . . . . 7.63% 9/01/23 12,275 10,808,629 0.1APX Group, Inc. . . . . . . . . . . . . . . . . . . . . . . . . . . . . . . . . . . . . . . . 7.88% 12/01/22 37,417 37,227,445 0.2APX Group, Inc. . . . . . . . . . . . . . . . . . . . . . . . . . . . . . . . . . . . . . . . 8.75% 12/01/20 13,815 13,731,917 0.1Carlson Travel, Inc. . . . . . . . . . . . . . . . . . . . . . . . . . . . . . . . . . . . . . 6.75% 12/15/23 17,815 17,771,157 0.1Carriage Services, Inc. . . . . . . . . . . . . . . . . . . . . . . . . . . . . . . . . . . . 6.63% 6/01/26 15,492 15,882,367 0.1eDreams ODIGEO SA. . . . . . . . . . . . . . . . . . . . . . . . . . . . . . . . . . . 5.50% 9/01/23 EUR 4,540 4,968,647 0.0Gartner, Inc. . . . . . . . . . . . . . . . . . . . . . . . . . . . . . . . . . . . . . . . . . . . 5.13% 4/01/25 USD 4,061 4,091,458 0.0GEO Group, Inc. (The) . . . . . . . . . . . . . . . . . . . . . . . . . . . . . . . . . . 5.13% 4/01/23 4,617 4,373,920 0.0GEO Group, Inc. (The) . . . . . . . . . . . . . . . . . . . . . . . . . . . . . . . . . . 5.88% 1/15/22 8,766 8,706,654 0.0
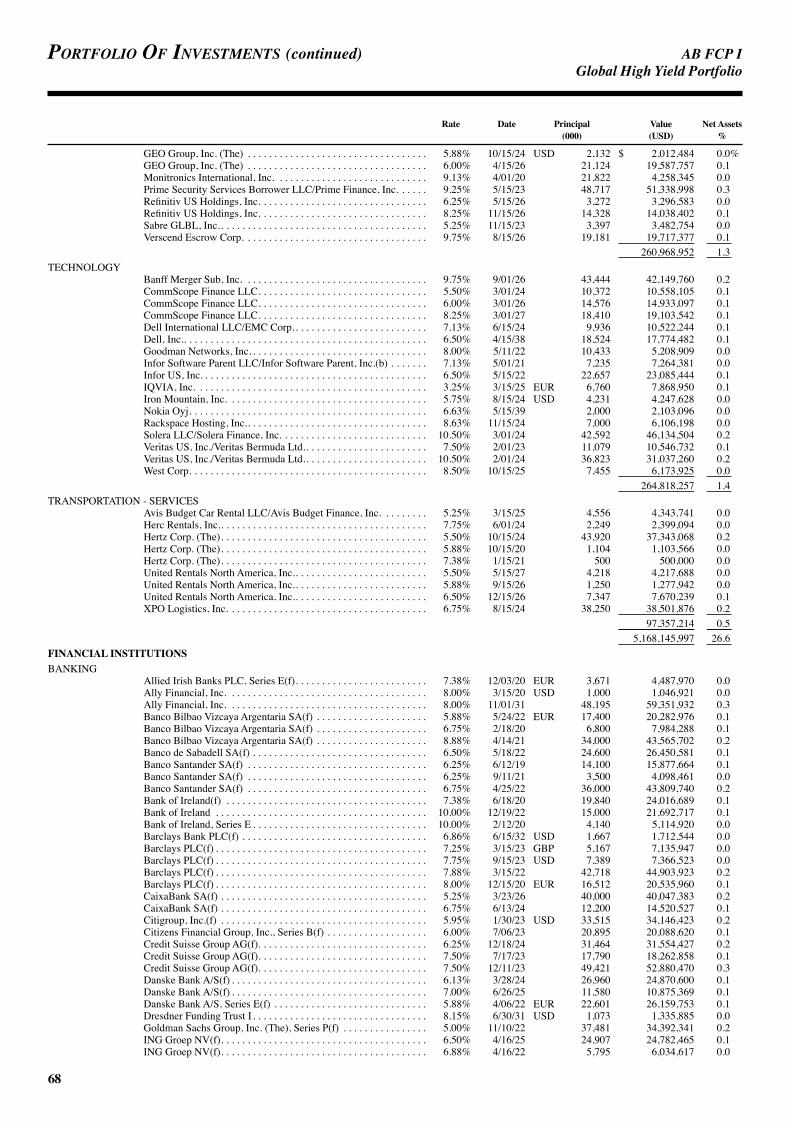
AB FCP I
68
Portfolio of investments (continued) GlobalHighYieldPortfolio
Rate Date Principal Value Net Assets (000) (USD) %
GEO Group, Inc. (The) . . . . . . . . . . . . . . . . . . . . . . . . . . . . . . . . . . 5.88% 10/15/24 USD 2,132 $ 2,012,484 0.0%GEO Group, Inc. (The) . . . . . . . . . . . . . . . . . . . . . . . . . . . . . . . . . . 6.00% 4/15/26 21,124 19,587,757 0.1Monitronics International, Inc. . . . . . . . . . . . . . . . . . . . . . . . . . . . . 9.13% 4/01/20 21,822 4,258,345 0.0Prime Security Services Borrower LLC/Prime Finance, Inc. . . . . . 9.25% 5/15/23 48,717 51,338,998 0.3Refinitiv US Holdings, Inc. . . . . . . . . . . . . . . . . . . . . . . . . . . . . . . . 6.25% 5/15/26 3,272 3,296,583 0.0Refinitiv US Holdings, Inc. . . . . . . . . . . . . . . . . . . . . . . . . . . . . . . . 8.25% 11/15/26 14,328 14,038,402 0.1Sabre GLBL, Inc.. . . . . . . . . . . . . . . . . . . . . . . . . . . . . . . . . . . . . . . 5.25% 11/15/23 3,397 3,482,754 0.0Verscend Escrow Corp. . . . . . . . . . . . . . . . . . . . . . . . . . . . . . . . . . . 9.75% 8/15/26 19,181 19,717,377 0.1 260,968,952 1.3
TECHNOLOGYBanff Merger Sub, Inc. . . . . . . . . . . . . . . . . . . . . . . . . . . . . . . . . . . 9.75% 9/01/26 43,444 42,149,760 0.2CommScope Finance LLC. . . . . . . . . . . . . . . . . . . . . . . . . . . . . . . . 5.50% 3/01/24 10,372 10,558,105 0.1CommScope Finance LLC. . . . . . . . . . . . . . . . . . . . . . . . . . . . . . . . 6.00% 3/01/26 14,576 14,933,097 0.1CommScope Finance LLC. . . . . . . . . . . . . . . . . . . . . . . . . . . . . . . . 8.25% 3/01/27 18,410 19,103,542 0.1Dell International LLC/EMC Corp.. . . . . . . . . . . . . . . . . . . . . . . . . 7.13% 6/15/24 9,936 10,522,244 0.1Dell, Inc.. . . . . . . . . . . . . . . . . . . . . . . . . . . . . . . . . . . . . . . . . . . . . . 6.50% 4/15/38 18,524 17,774,482 0.1Goodman Networks, Inc. . . . . . . . . . . . . . . . . . . . . . . . . . . . . . . . . . 8.00% 5/11/22 10,433 5,208,909 0.0Infor Software Parent LLC/Infor Software Parent, Inc.(b) . . . . . . . 7.13% 5/01/21 7,235 7,264,381 0.0Infor US, Inc. . . . . . . . . . . . . . . . . . . . . . . . . . . . . . . . . . . . . . . . . . . 6.50% 5/15/22 22,657 23,085,444 0.1IQVIA, Inc. . . . . . . . . . . . . . . . . . . . . . . . . . . . . . . . . . . . . . . . . . . . 3.25% 3/15/25 EUR 6,760 7,868,950 0.1Iron Mountain, Inc. . . . . . . . . . . . . . . . . . . . . . . . . . . . . . . . . . . . . . 5.75% 8/15/24 USD 4,231 4,247,628 0.0Nokia Oyj. . . . . . . . . . . . . . . . . . . . . . . . . . . . . . . . . . . . . . . . . . . . . 6.63% 5/15/39 2,000 2,103,096 0.0Rackspace Hosting, Inc.. . . . . . . . . . . . . . . . . . . . . . . . . . . . . . . . . . 8.63% 11/15/24 7,000 6,106,198 0.0Solera LLC/Solera Finance, Inc. . . . . . . . . . . . . . . . . . . . . . . . . . . . 10.50% 3/01/24 42,592 46,134,504 0.2Veritas US, Inc./Veritas Bermuda Ltd.. . . . . . . . . . . . . . . . . . . . . . . 7.50% 2/01/23 11,079 10,546,732 0.1Veritas US, Inc./Veritas Bermuda Ltd.. . . . . . . . . . . . . . . . . . . . . . . 10.50% 2/01/24 36,823 31,037,260 0.2West Corp. . . . . . . . . . . . . . . . . . . . . . . . . . . . . . . . . . . . . . . . . . . . . 8.50% 10/15/25 7,455 6,173,925 0.0 264,818,257 1.4
TRANSPORTATION - SERVICESAvis Budget Car Rental LLC/Avis Budget Finance, Inc. . . . . . . . . 5.25% 3/15/25 4,556 4,343,741 0.0Herc Rentals, Inc.. . . . . . . . . . . . . . . . . . . . . . . . . . . . . . . . . . . . . . . 7.75% 6/01/24 2,249 2,399,094 0.0Hertz Corp. (The). . . . . . . . . . . . . . . . . . . . . . . . . . . . . . . . . . . . . . . 5.50% 10/15/24 43,920 37,343,068 0.2Hertz Corp. (The). . . . . . . . . . . . . . . . . . . . . . . . . . . . . . . . . . . . . . . 5.88% 10/15/20 1,104 1,103,566 0.0Hertz Corp. (The). . . . . . . . . . . . . . . . . . . . . . . . . . . . . . . . . . . . . . . 7.38% 1/15/21 500 500,000 0.0United Rentals North America, Inc.. . . . . . . . . . . . . . . . . . . . . . . . . 5.50% 5/15/27 4,218 4,217,688 0.0United Rentals North America, Inc.. . . . . . . . . . . . . . . . . . . . . . . . . 5.88% 9/15/26 1,250 1,277,942 0.0United Rentals North America, Inc.. . . . . . . . . . . . . . . . . . . . . . . . . 6.50% 12/15/26 7,347 7,670,239 0.1XPO Logistics, Inc. . . . . . . . . . . . . . . . . . . . . . . . . . . . . . . . . . . . . . 6.75% 8/15/24 38,250 38,501,876 0.2 97,357,214 0.5 5,168,145,997 26.6
FINANCIAL INSTITUTIONSBANKING
Allied Irish Banks PLC, Series E(f). . . . . . . . . . . . . . . . . . . . . . . . . 7.38% 12/03/20 EUR 3,671 4,487,970 0.0Ally Financial, Inc. . . . . . . . . . . . . . . . . . . . . . . . . . . . . . . . . . . . . . 8.00% 3/15/20 USD 1,000 1,046,921 0.0Ally Financial, Inc. . . . . . . . . . . . . . . . . . . . . . . . . . . . . . . . . . . . . . 8.00% 11/01/31 48,195 59,351,932 0.3Banco Bilbao Vizcaya Argentaria SA(f) . . . . . . . . . . . . . . . . . . . . . 5.88% 5/24/22 EUR 17,400 20,282,976 0.1Banco Bilbao Vizcaya Argentaria SA(f) . . . . . . . . . . . . . . . . . . . . . 6.75% 2/18/20 6,800 7,984,288 0.1Banco Bilbao Vizcaya Argentaria SA(f) . . . . . . . . . . . . . . . . . . . . . 8.88% 4/14/21 34,000 43,565,702 0.2Banco de Sabadell SA(f) . . . . . . . . . . . . . . . . . . . . . . . . . . . . . . . . . 6.50% 5/18/22 24,600 26,450,581 0.1Banco Santander SA(f) . . . . . . . . . . . . . . . . . . . . . . . . . . . . . . . . . . 6.25% 6/12/19 14,100 15,877,664 0.1Banco Santander SA(f) . . . . . . . . . . . . . . . . . . . . . . . . . . . . . . . . . . 6.25% 9/11/21 3,500 4,098,461 0.0Banco Santander SA(f) . . . . . . . . . . . . . . . . . . . . . . . . . . . . . . . . . . 6.75% 4/25/22 36,000 43,809,740 0.2Bank of Ireland(f) . . . . . . . . . . . . . . . . . . . . . . . . . . . . . . . . . . . . . . 7.38% 6/18/20 19,840 24,016,689 0.1Bank of Ireland . . . . . . . . . . . . . . . . . . . . . . . . . . . . . . . . . . . . . . . . 10.00% 12/19/22 15,000 21,692,717 0.1Bank of Ireland, Series E . . . . . . . . . . . . . . . . . . . . . . . . . . . . . . . . . 10.00% 2/12/20 4,140 5,114,920 0.0Barclays Bank PLC(f) . . . . . . . . . . . . . . . . . . . . . . . . . . . . . . . . . . . 6.86% 6/15/32 USD 1,667 1,712,544 0.0Barclays PLC(f) . . . . . . . . . . . . . . . . . . . . . . . . . . . . . . . . . . . . . . . . 7.25% 3/15/23 GBP 5,167 7,135,947 0.0Barclays PLC(f) . . . . . . . . . . . . . . . . . . . . . . . . . . . . . . . . . . . . . . . . 7.75% 9/15/23 USD 7,389 7,366,523 0.0Barclays PLC(f) . . . . . . . . . . . . . . . . . . . . . . . . . . . . . . . . . . . . . . . . 7.88% 3/15/22 42,718 44,903,923 0.2Barclays PLC(f) . . . . . . . . . . . . . . . . . . . . . . . . . . . . . . . . . . . . . . . . 8.00% 12/15/20 EUR 16,512 20,535,960 0.1CaixaBank SA(f) . . . . . . . . . . . . . . . . . . . . . . . . . . . . . . . . . . . . . . . 5.25% 3/23/26 40,000 40,047,383 0.2CaixaBank SA(f) . . . . . . . . . . . . . . . . . . . . . . . . . . . . . . . . . . . . . . . 6.75% 6/13/24 12,200 14,520,527 0.1Citigroup, Inc.(f) . . . . . . . . . . . . . . . . . . . . . . . . . . . . . . . . . . . . . . . 5.95% 1/30/23 USD 33,515 34,146,423 0.2Citizens Financial Group, Inc., Series B(f) . . . . . . . . . . . . . . . . . . . 6.00% 7/06/23 20,895 20,088,620 0.1Credit Suisse Group AG(f). . . . . . . . . . . . . . . . . . . . . . . . . . . . . . . . 6.25% 12/18/24 31,464 31,554,427 0.2Credit Suisse Group AG(f). . . . . . . . . . . . . . . . . . . . . . . . . . . . . . . . 7.50% 7/17/23 17,790 18,262,858 0.1Credit Suisse Group AG(f). . . . . . . . . . . . . . . . . . . . . . . . . . . . . . . . 7.50% 12/11/23 49,421 52,880,470 0.3Danske Bank A/S(f) . . . . . . . . . . . . . . . . . . . . . . . . . . . . . . . . . . . . . 6.13% 3/28/24 26,960 24,870,600 0.1Danske Bank A/S(f) . . . . . . . . . . . . . . . . . . . . . . . . . . . . . . . . . . . . . 7.00% 6/26/25 11,580 10,875,369 0.1Danske Bank A/S, Series E(f) . . . . . . . . . . . . . . . . . . . . . . . . . . . . . 5.88% 4/06/22 EUR 22,601 26,159,753 0.1Dresdner Funding Trust I . . . . . . . . . . . . . . . . . . . . . . . . . . . . . . . . . 8.15% 6/30/31 USD 1,073 1,335,885 0.0Goldman Sachs Group, Inc. (The), Series P(f) . . . . . . . . . . . . . . . . 5.00% 11/10/22 37,481 34,392,341 0.2ING Groep NV(f). . . . . . . . . . . . . . . . . . . . . . . . . . . . . . . . . . . . . . . 6.50% 4/16/25 24,907 24,782,465 0.1ING Groep NV(f). . . . . . . . . . . . . . . . . . . . . . . . . . . . . . . . . . . . . . . 6.88% 4/16/22 5,795 6,034,617 0.0

AB FCP I
69
GlobalHighYieldPortfolio
Rate Date Principal Value Net Assets (000) (USD) %
Intesa Sanpaolo SpA . . . . . . . . . . . . . . . . . . . . . . . . . . . . . . . . . . . . 3.93% 9/15/26 EUR 2,332 $ 2,729,550 0.0%Intesa Sanpaolo SpA . . . . . . . . . . . . . . . . . . . . . . . . . . . . . . . . . . . . 5.02% 6/26/24 USD 206 190,885 0.0Intesa Sanpaolo SpA . . . . . . . . . . . . . . . . . . . . . . . . . . . . . . . . . . . . 5.71% 1/15/26 11,463 10,737,759 0.1Lloyds Banking Group PLC(f) . . . . . . . . . . . . . . . . . . . . . . . . . . . . 6.38% 6/27/20 EUR 21,606 25,713,183 0.1Lloyds Banking Group PLC(f) . . . . . . . . . . . . . . . . . . . . . . . . . . . . 6.41% 10/01/35 USD 1,976 1,966,889 0.0Lloyds Banking Group PLC(f) . . . . . . . . . . . . . . . . . . . . . . . . . . . . 6.66% 5/21/37 1,067 1,069,988 0.0Lloyds Banking Group PLC(f) . . . . . . . . . . . . . . . . . . . . . . . . . . . . 7.63% 6/27/23 GBP 9,670 13,694,547 0.1Paysafe Holdings UK Ltd.(d) . . . . . . . . . . . . . . . . . . . . . . . . . . . . . 0.00% N/A USD 13,375 13,374,895 0.1Royal Bank of Scotland Group PLC(f) . . . . . . . . . . . . . . . . . . . . . . 8.63% 8/15/21 42,639 45,447,759 0.2Royal Bank of Scotland Group PLC, Series U(f) (g) . . . . . . . . . . . 5.12% 9/30/27 15,100 14,049,131 0.1Santander UK Group Holdings PLC(f) . . . . . . . . . . . . . . . . . . . . . . 6.75% 6/24/24 GBP 21,403 28,728,494 0.2Skandinaviska Enskilda Banken AB(f) . . . . . . . . . . . . . . . . . . . . . . 5.63% 5/13/22 USD 23,400 22,811,490 0.1SNS Bank NV, Series E . . . . . . . . . . . . . . . . . . . . . . . . . . . . . . . . . . 11.25% 12/31/49 EUR 7,579 74,069 0.0Societe Generale SA(f) . . . . . . . . . . . . . . . . . . . . . . . . . . . . . . . . . . 7.38% 9/13/21 USD 17,531 18,154,858 0.1Societe Generale SA(f) . . . . . . . . . . . . . . . . . . . . . . . . . . . . . . . . . . 8.00% 9/29/25 27,054 28,576,311 0.2Standard Chartered PLC(f) (g). . . . . . . . . . . . . . . . . . . . . . . . . . . . . 4.26% 1/30/27 16,000 12,757,104 0.1Standard Chartered PLC(f) . . . . . . . . . . . . . . . . . . . . . . . . . . . . . . . 7.50% 4/02/22 45,824 47,926,405 0.3Standard Chartered PLC(f) . . . . . . . . . . . . . . . . . . . . . . . . . . . . . . . 7.75% 4/02/23 22,770 23,851,416 0.1UBS Group Funding Switzerland AG(f) . . . . . . . . . . . . . . . . . . . . . 6.88% 3/22/21 38,928 40,114,253 0.2UBS Group Funding Switzerland AG(f) . . . . . . . . . . . . . . . . . . . . . 7.00% 2/19/25 20,606 21,822,125 0.1UBS Group Funding Switzerland AG(f) . . . . . . . . . . . . . . . . . . . . . 7.13% 2/19/20 9,083 9,233,741 0.1UBS Group Funding Switzerland AG(f) . . . . . . . . . . . . . . . . . . . . . 7.13% 8/10/21 20,000 20,835,060 0.1UniCredit SpA(f) . . . . . . . . . . . . . . . . . . . . . . . . . . . . . . . . . . . . . . . 9.25% 6/03/22 EUR 21,339 26,881,289 0.1 1,130,128,397 5.8
BROKERAGELPL Holdings, Inc.. . . . . . . . . . . . . . . . . . . . . . . . . . . . . . . . . . . . . . 5.75% 9/15/25 USD 31,685 32,007,838 0.2
FINANCECompass Group Diversified Holdings LLC. . . . . . . . . . . . . . . . . . . 8.00% 5/01/26 19,854 20,624,434 0.1Curo Group Holdings Corp.. . . . . . . . . . . . . . . . . . . . . . . . . . . . . . . 8.25% 9/01/25 37,103 31,816,639 0.2Enova International, Inc. . . . . . . . . . . . . . . . . . . . . . . . . . . . . . . . . . 8.50% 9/01/24 14,235 13,595,123 0.1Enova International, Inc. . . . . . . . . . . . . . . . . . . . . . . . . . . . . . . . . . 8.50% 9/15/25 19,000 18,024,768 0.1goeasy Ltd.. . . . . . . . . . . . . . . . . . . . . . . . . . . . . . . . . . . . . . . . . . . . 7.88% 11/01/22 11,381 11,984,944 0.1ILFC E-Capital Trust I(h) . . . . . . . . . . . . . . . . . . . . . . . . . . . . . . . . 4.55% 12/21/65 9,500 7,233,614 0.0Lincoln Finance Ltd. . . . . . . . . . . . . . . . . . . . . . . . . . . . . . . . . . . . . 6.88% 4/15/21 EUR 16,803 19,598,031 0.1Lincoln Finance Ltd. . . . . . . . . . . . . . . . . . . . . . . . . . . . . . . . . . . . . 7.38% 4/15/21 USD 3,906 3,969,140 0.0Navient Corp.. . . . . . . . . . . . . . . . . . . . . . . . . . . . . . . . . . . . . . . . . . 5.50% 1/25/23 4,566 4,508,455 0.0Navient Corp.. . . . . . . . . . . . . . . . . . . . . . . . . . . . . . . . . . . . . . . . . . 5.88% 3/25/21 14,838 15,209,900 0.1Navient Corp.. . . . . . . . . . . . . . . . . . . . . . . . . . . . . . . . . . . . . . . . . . 6.50% 6/15/22 15,332 15,782,515 0.1Navient Corp.. . . . . . . . . . . . . . . . . . . . . . . . . . . . . . . . . . . . . . . . . . 6.63% 7/26/21 1,580 1,633,301 0.0Navient Corp.. . . . . . . . . . . . . . . . . . . . . . . . . . . . . . . . . . . . . . . . . . 7.25% 1/25/22 11,896 12,525,013 0.1Navient Corp.. . . . . . . . . . . . . . . . . . . . . . . . . . . . . . . . . . . . . . . . . . 7.25% 9/25/23 2,323 2,406,537 0.0Navient Corp.. . . . . . . . . . . . . . . . . . . . . . . . . . . . . . . . . . . . . . . . . . 8.00% 3/25/20 5,877 6,125,638 0.0Springleaf Finance Corp. . . . . . . . . . . . . . . . . . . . . . . . . . . . . . . . . . 6.88% 3/15/25 4,000 4,097,800 0.0TMX Finance LLC/TitleMax Finance Corp. . . . . . . . . . . . . . . . . . . 11.13% 4/01/23 22,117 20,511,173 0.1 209,647,025 1.1
INSURANCEAmbac Assurance Corp.. . . . . . . . . . . . . . . . . . . . . . . . . . . . . . . . . . 5.10% 6/07/20 172 234,028 0.0Genworth Holdings, Inc. . . . . . . . . . . . . . . . . . . . . . . . . . . . . . . . . . 7.63% 9/24/21 11,471 11,288,015 0.1Liberty Mutual Group, Inc. . . . . . . . . . . . . . . . . . . . . . . . . . . . . . . . 7.80% 3/15/37 36,487 41,584,124 0.2Polaris Intermediate Corp.(b). . . . . . . . . . . . . . . . . . . . . . . . . . . . . . 8.50% 12/01/22 61,006 60,297,546 0.3 113,403,713 0.6
OTHER FINANCENVA Holdings, Inc./United States . . . . . . . . . . . . . . . . . . . . . . . . . . 6.88% 4/01/26 18,456 17,824,159 0.1Tempo Acquisition LLC/Tempo Acquisition Finance Corp. . . . . . . 6.75% 6/01/25 45,918 46,431,822 0.2Travelport Corporate Finance PLC . . . . . . . . . . . . . . . . . . . . . . . . . 6.00% 3/15/26 9,659 10,173,226 0.1 74,429,207 0.4
REITSMPT Operating Partnership LP/MPT Finance Corp.. . . . . . . . . . . . 5.00% 10/15/27 1,151 1,145,476 0.0MPT Operating Partnership LP/MPT Finance Corp.. . . . . . . . . . . . 5.25% 8/01/26 1,668 1,692,396 0.0MPT Operating Partnership LP/MPT Finance Corp.. . . . . . . . . . . . 5.50% 5/01/24 4,369 4,474,319 0.0 7,312,191 0.0 1,566,928,371 8.1
UTILITYELECTRIC
Calpine Corp. . . . . . . . . . . . . . . . . . . . . . . . . . . . . . . . . . . . . . . . . . . 5.38% 1/15/23 13,300 13,150,415 0.1Calpine Corp. . . . . . . . . . . . . . . . . . . . . . . . . . . . . . . . . . . . . . . . . . . 5.50% 2/01/24 24,205 23,304,405 0.1Calpine Corp. . . . . . . . . . . . . . . . . . . . . . . . . . . . . . . . . . . . . . . . . . . 5.75% 1/15/25 14,514 13,897,155 0.1NRG Energy, Inc.. . . . . . . . . . . . . . . . . . . . . . . . . . . . . . . . . . . . . . . 5.75% 1/15/28 14,066 14,417,608 0.1NRG Energy, Inc.. . . . . . . . . . . . . . . . . . . . . . . . . . . . . . . . . . . . . . . 6.25% 5/01/24 6,994 7,240,133 0.0NRG Energy, Inc.. . . . . . . . . . . . . . . . . . . . . . . . . . . . . . . . . . . . . . . 7.25% 5/15/26 1,096 1,185,922 0.0Talen Energy Supply LLC . . . . . . . . . . . . . . . . . . . . . . . . . . . . . . . . 4.60% 12/15/21 534 508,399 0.0Talen Energy Supply LLC . . . . . . . . . . . . . . . . . . . . . . . . . . . . . . . . 6.50% 6/01/25 21,251 18,947,732 0.1
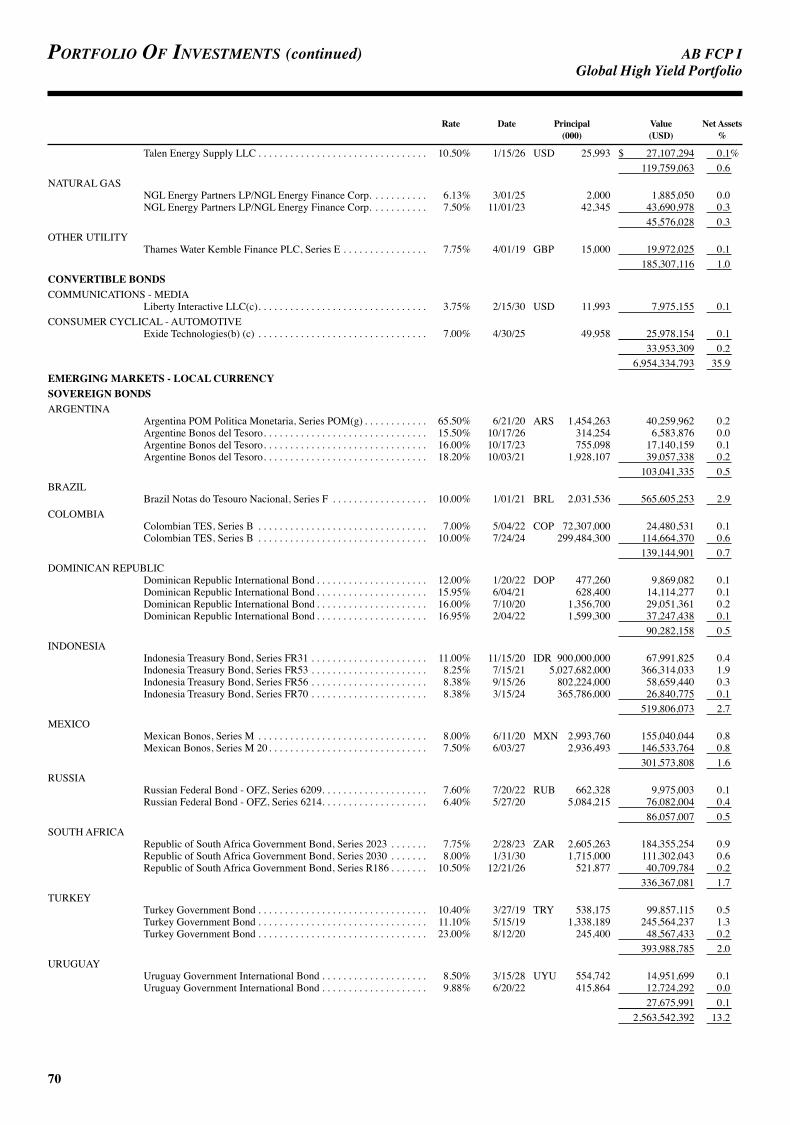
AB FCP I
70
Portfolio of investments (continued) GlobalHighYieldPortfolio
Rate Date Principal Value Net Assets (000) (USD) %
Talen Energy Supply LLC . . . . . . . . . . . . . . . . . . . . . . . . . . . . . . . . 10.50% 1/15/26 USD 25,993 $ 27,107,294 0.1% 119,759,063 0.6
NATURAL GASNGL Energy Partners LP/NGL Energy Finance Corp. . . . . . . . . . . 6.13% 3/01/25 2,000 1,885,050 0.0NGL Energy Partners LP/NGL Energy Finance Corp. . . . . . . . . . . 7.50% 11/01/23 42,345 43,690,978 0.3 45,576,028 0.3
OTHER UTILITYThames Water Kemble Finance PLC, Series E . . . . . . . . . . . . . . . . 7.75% 4/01/19 GBP 15,000 19,972,025 0.1 185,307,116 1.0
CONVERTIBLE BONDSCOMMUNICATIONS - MEDIA
Liberty Interactive LLC(c). . . . . . . . . . . . . . . . . . . . . . . . . . . . . . . . 3.75% 2/15/30 USD 11,993 7,975,155 0.1CONSUMER CYCLICAL - AUTOMOTIVE
Exide Technologies(b) (c) . . . . . . . . . . . . . . . . . . . . . . . . . . . . . . . . 7.00% 4/30/25 49,958 25,978,154 0.1 33,953,309 0.2 6,954,334,793 35.9
EMERGING MARKETS - LOCAL CURRENCYSOVEREIGN BONDSARGENTINA
Argentina POM Politica Monetaria, Series POM(g) . . . . . . . . . . . . 65.50% 6/21/20 ARS 1,454,263 40,259,962 0.2Argentine Bonos del Tesoro. . . . . . . . . . . . . . . . . . . . . . . . . . . . . . . 15.50% 10/17/26 314,254 6,583,876 0.0Argentine Bonos del Tesoro. . . . . . . . . . . . . . . . . . . . . . . . . . . . . . . 16.00% 10/17/23 755,098 17,140,159 0.1Argentine Bonos del Tesoro. . . . . . . . . . . . . . . . . . . . . . . . . . . . . . . 18.20% 10/03/21 1,928,107 39,057,338 0.2 103,041,335 0.5
BRAZILBrazil Notas do Tesouro Nacional, Series F . . . . . . . . . . . . . . . . . . 10.00% 1/01/21 BRL 2,031,536 565,605,253 2.9
COLOMBIAColombian TES, Series B . . . . . . . . . . . . . . . . . . . . . . . . . . . . . . . . 7.00% 5/04/22 COP 72,307,000 24,480,531 0.1Colombian TES, Series B . . . . . . . . . . . . . . . . . . . . . . . . . . . . . . . . 10.00% 7/24/24 299,484,300 114,664,370 0.6 139,144,901 0.7
DOMINICAN REPUBLICDominican Republic International Bond . . . . . . . . . . . . . . . . . . . . . 12.00% 1/20/22 DOP 477,260 9,869,082 0.1Dominican Republic International Bond . . . . . . . . . . . . . . . . . . . . . 15.95% 6/04/21 628,400 14,114,277 0.1Dominican Republic International Bond . . . . . . . . . . . . . . . . . . . . . 16.00% 7/10/20 1,356,700 29,051,361 0.2Dominican Republic International Bond . . . . . . . . . . . . . . . . . . . . . 16.95% 2/04/22 1,599,300 37,247,438 0.1 90,282,158 0.5
INDONESIAIndonesia Treasury Bond, Series FR31 . . . . . . . . . . . . . . . . . . . . . . 11.00% 11/15/20 IDR 900,000,000 67,991,825 0.4Indonesia Treasury Bond, Series FR53 . . . . . . . . . . . . . . . . . . . . . . 8.25% 7/15/21 5,027,682,000 366,314,033 1.9Indonesia Treasury Bond, Series FR56 . . . . . . . . . . . . . . . . . . . . . . 8.38% 9/15/26 802,224,000 58,659,440 0.3Indonesia Treasury Bond, Series FR70 . . . . . . . . . . . . . . . . . . . . . . 8.38% 3/15/24 365,786,000 26,840,775 0.1 519,806,073 2.7
MEXICOMexican Bonos, Series M . . . . . . . . . . . . . . . . . . . . . . . . . . . . . . . . 8.00% 6/11/20 MXN 2,993,760 155,040,044 0.8Mexican Bonos, Series M 20 . . . . . . . . . . . . . . . . . . . . . . . . . . . . . . 7.50% 6/03/27 2,936,493 146,533,764 0.8 301,573,808 1.6
RUSSIARussian Federal Bond - OFZ, Series 6209. . . . . . . . . . . . . . . . . . . . 7.60% 7/20/22 RUB 662,328 9,975,003 0.1Russian Federal Bond - OFZ, Series 6214. . . . . . . . . . . . . . . . . . . . 6.40% 5/27/20 5,084,215 76,082,004 0.4 86,057,007 0.5
SOUTH AFRICARepublic of South Africa Government Bond, Series 2023 . . . . . . . 7.75% 2/28/23 ZAR 2,605,263 184,355,254 0.9Republic of South Africa Government Bond, Series 2030 . . . . . . . 8.00% 1/31/30 1,715,000 111,302,043 0.6Republic of South Africa Government Bond, Series R186 . . . . . . . 10.50% 12/21/26 521,877 40,709,784 0.2 336,367,081 1.7
TURKEYTurkey Government Bond . . . . . . . . . . . . . . . . . . . . . . . . . . . . . . . . 10.40% 3/27/19 TRY 538,175 99,857,115 0.5Turkey Government Bond . . . . . . . . . . . . . . . . . . . . . . . . . . . . . . . . 11.10% 5/15/19 1,338,189 245,564,237 1.3Turkey Government Bond . . . . . . . . . . . . . . . . . . . . . . . . . . . . . . . . 23.00% 8/12/20 245,400 48,567,433 0.2 393,988,785 2.0
URUGUAYUruguay Government International Bond . . . . . . . . . . . . . . . . . . . . 8.50% 3/15/28 UYU 554,742 14,951,699 0.1Uruguay Government International Bond . . . . . . . . . . . . . . . . . . . . 9.88% 6/20/22 415,864 12,724,292 0.0 27,675,991 0.1 2,563,542,392 13.2

AB FCP I
71
GlobalHighYieldPortfolio
Rate Date Principal Value Net Assets (000) (USD) %
INDUSTRIALENERGY
Indian Renewable Energy Development Agency Ltd., Series E . . . 7.13% 10/10/22 INR 2,500,000 $ 33,127,713 0.2%YPF SA . . . . . . . . . . . . . . . . . . . . . . . . . . . . . . . . . . . . . . . . . . . . . . 16.50% 5/09/22 ARS 413,965 6,982,188 0.0 40,109,901 0.2
FINANCIAL INSTITUTIONSBANKING
HDFC Bank Ltd. . . . . . . . . . . . . . . . . . . . . . . . . . . . . . . . . . . . . . . . 8.10% 3/22/25 INR 1,070,000 14,294,422 0.1FINANCE
Housing Development Finance Corp., Ltd., Series G . . . . . . . . . . . 7.88% 8/21/19 1,010,000 14,128,321 0.1Indiabulls Housing Finance Ltd. . . . . . . . . . . . . . . . . . . . . . . . . . . . 8.57% 10/15/19 621,300 8,625,982 0.0 22,754,303 0.1 37,048,725 0.2
TREASURY BONDSINDONESIA
JPMorgan Chase Bank NA . . . . . . . . . . . . . . . . . . . . . . . . . . . . . . . 9.50% 5/17/41 IDR 414,814,000 32,427,117 0.2LOCAL GOVERNMENTS - REGIONAL BONDSARGENTINA
Provincia de Buenos Aires/Argentina(g) . . . . . . . . . . . . . . . . . . . . . 39.64% 5/31/22 ARS 600,000 14,184,376 0.1 2,687,312,511 13.9
EMERGING MARKETS - HARD CURRENCYSOVEREIGN BONDSANGOLA
Angolan Government International Bond . . . . . . . . . . . . . . . . . . . . 8.25% 5/09/28 USD 12,340 12,818,175 0.1Angolan Government International Bond . . . . . . . . . . . . . . . . . . . . 9.50% 11/12/25 47,043 53,335,001 0.3Republic of Angola Via Northern Lights III BV . . . . . . . . . . . . . . . 7.00% 8/17/19 4,060 4,074,974 0.0 70,228,150 0.4
ARGENTINAArgentine Republic Government International Bond . . . . . . . . . . . 7.82% 12/31/33 EUR 20,591 21,116,607 0.1
BRAZILBrazilian Government International Bond. . . . . . . . . . . . . . . . . . . . 4.63% 1/13/28 USD 42,749 42,459,803 0.2
CAMEROONRepublic of Cameroon International Bond . . . . . . . . . . . . . . . . . . . 9.50% 11/19/25 18,610 19,935,962 0.1
COSTA RICACosta Rica Government International Bond . . . . . . . . . . . . . . . . . . 7.00% 4/04/44 12,414 11,777,783 0.1
DOMINICAN REPUBLICDominican Republic International Bond . . . . . . . . . . . . . . . . . . . . . 5.95% 1/25/27 25,349 26,320,754 0.1Dominican Republic International Bond . . . . . . . . . . . . . . . . . . . . . 6.00% 7/19/28 34,000 35,241,170 0.2Dominican Republic International Bond . . . . . . . . . . . . . . . . . . . . . 6.88% 1/29/26 4,546 4,923,113 0.0Dominican Republic International Bond . . . . . . . . . . . . . . . . . . . . . 7.45% 4/30/44 17,877 19,485,930 0.1Dominican Republic International Bond . . . . . . . . . . . . . . . . . . . . . 7.50% 5/06/21 11,000 11,429,000 0.1Dominican Republic International Bond . . . . . . . . . . . . . . . . . . . . . 8.63% 4/20/27 16,359 18,996,889 0.1 116,396,856 0.6
ECUADOREcuador Government International Bond . . . . . . . . . . . . . . . . . . . . 10.50% 3/24/20 33,201 34,686,214 0.2Ecuador Government International Bond . . . . . . . . . . . . . . . . . . . . 10.75% 1/31/29 21,105 22,993,897 0.1 57,680,111 0.3
EGYPTEgypt Government International Bond . . . . . . . . . . . . . . . . . . . . . . 6.13% 1/31/22 61,441 62,439,416 0.3Egypt Government International Bond . . . . . . . . . . . . . . . . . . . . . . 6.20% 3/01/24 41,423 42,002,922 0.2 104,442,338 0.5
EL SALVADOREl Salvador Government International Bond. . . . . . . . . . . . . . . . . . 5.88% 1/30/25 7,588 7,322,420 0.1El Salvador Government International Bond. . . . . . . . . . . . . . . . . . 7.38% 12/01/19 9,611 9,736,087 0.1El Salvador Government International Bond. . . . . . . . . . . . . . . . . . 7.65% 6/15/35 3,301 3,368,456 0.0El Salvador Government International Bond. . . . . . . . . . . . . . . . . . 8.63% 2/28/29 6,513 7,129,879 0.0 27,556,842 0.2
GABONGabon Government International Bond. . . . . . . . . . . . . . . . . . . . . . 6.38% 12/12/24 46,046 44,377,245 0.2Gabon Government International Bond. . . . . . . . . . . . . . . . . . . . . . 6.95% 6/16/25 17,800 17,177,000 0.1 61,554,245 0.3
GHANAGhana Government International Bond . . . . . . . . . . . . . . . . . . . . . . 10.75% 10/14/30 11,717 14,075,046 0.1
HONDURASHonduras Government International Bond . . . . . . . . . . . . . . . . . . . 6.25% 1/19/27 36,976 38,250,378 0.2Honduras Government International Bond . . . . . . . . . . . . . . . . . . . 7.50% 3/15/24 13,637 14,765,666 0.1 53,016,044 0.3
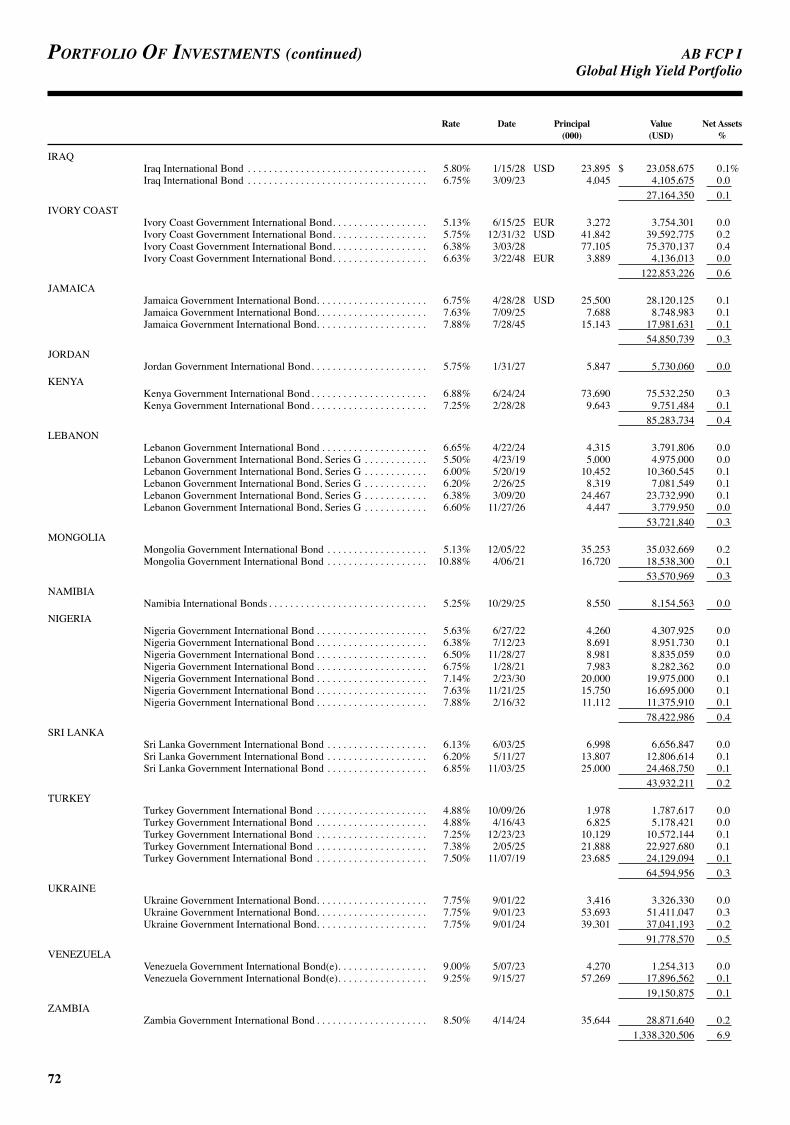
AB FCP I
72
Portfolio of investments (continued) GlobalHighYieldPortfolio
Rate Date Principal Value Net Assets (000) (USD) %
IRAQIraq International Bond . . . . . . . . . . . . . . . . . . . . . . . . . . . . . . . . . . 5.80% 1/15/28 USD 23,895 $ 23,058,675 0.1%Iraq International Bond . . . . . . . . . . . . . . . . . . . . . . . . . . . . . . . . . . 6.75% 3/09/23 4,045 4,105,675 0.0 27,164,350 0.1
IVORY COASTIvory Coast Government International Bond. . . . . . . . . . . . . . . . . . 5.13% 6/15/25 EUR 3,272 3,754,301 0.0Ivory Coast Government International Bond. . . . . . . . . . . . . . . . . . 5.75% 12/31/32 USD 41,842 39,592,775 0.2Ivory Coast Government International Bond. . . . . . . . . . . . . . . . . . 6.38% 3/03/28 77,105 75,370,137 0.4Ivory Coast Government International Bond. . . . . . . . . . . . . . . . . . 6.63% 3/22/48 EUR 3,889 4,136,013 0.0 122,853,226 0.6
JAMAICAJamaica Government International Bond. . . . . . . . . . . . . . . . . . . . . 6.75% 4/28/28 USD 25,500 28,120,125 0.1Jamaica Government International Bond. . . . . . . . . . . . . . . . . . . . . 7.63% 7/09/25 7,688 8,748,983 0.1Jamaica Government International Bond. . . . . . . . . . . . . . . . . . . . . 7.88% 7/28/45 15,143 17,981,631 0.1 54,850,739 0.3
JORDANJordan Government International Bond. . . . . . . . . . . . . . . . . . . . . . 5.75% 1/31/27 5,847 5,730,060 0.0
KENYAKenya Government International Bond . . . . . . . . . . . . . . . . . . . . . . 6.88% 6/24/24 73,690 75,532,250 0.3Kenya Government International Bond . . . . . . . . . . . . . . . . . . . . . . 7.25% 2/28/28 9,643 9,751,484 0.1 85,283,734 0.4
LEBANONLebanon Government International Bond . . . . . . . . . . . . . . . . . . . . 6.65% 4/22/24 4,315 3,791,806 0.0Lebanon Government International Bond, Series G . . . . . . . . . . . . 5.50% 4/23/19 5,000 4,975,000 0.0Lebanon Government International Bond, Series G . . . . . . . . . . . . 6.00% 5/20/19 10,452 10,360,545 0.1Lebanon Government International Bond, Series G . . . . . . . . . . . . 6.20% 2/26/25 8,319 7,081,549 0.1Lebanon Government International Bond, Series G . . . . . . . . . . . . 6.38% 3/09/20 24,467 23,732,990 0.1Lebanon Government International Bond, Series G . . . . . . . . . . . . 6.60% 11/27/26 4,447 3,779,950 0.0 53,721,840 0.3
MONGOLIAMongolia Government International Bond . . . . . . . . . . . . . . . . . . . 5.13% 12/05/22 35,253 35,032,669 0.2Mongolia Government International Bond . . . . . . . . . . . . . . . . . . . 10.88% 4/06/21 16,720 18,538,300 0.1 53,570,969 0.3
NAMIBIANamibia International Bonds . . . . . . . . . . . . . . . . . . . . . . . . . . . . . . 5.25% 10/29/25 8,550 8,154,563 0.0
NIGERIANigeria Government International Bond . . . . . . . . . . . . . . . . . . . . . 5.63% 6/27/22 4,260 4,307,925 0.0Nigeria Government International Bond . . . . . . . . . . . . . . . . . . . . . 6.38% 7/12/23 8,691 8,951,730 0.1Nigeria Government International Bond . . . . . . . . . . . . . . . . . . . . . 6.50% 11/28/27 8,981 8,835,059 0.0Nigeria Government International Bond . . . . . . . . . . . . . . . . . . . . . 6.75% 1/28/21 7,983 8,282,362 0.0Nigeria Government International Bond . . . . . . . . . . . . . . . . . . . . . 7.14% 2/23/30 20,000 19,975,000 0.1Nigeria Government International Bond . . . . . . . . . . . . . . . . . . . . . 7.63% 11/21/25 15,750 16,695,000 0.1Nigeria Government International Bond . . . . . . . . . . . . . . . . . . . . . 7.88% 2/16/32 11,112 11,375,910 0.1 78,422,986 0.4
SRI LANKASri Lanka Government International Bond . . . . . . . . . . . . . . . . . . . 6.13% 6/03/25 6,998 6,656,847 0.0Sri Lanka Government International Bond . . . . . . . . . . . . . . . . . . . 6.20% 5/11/27 13,807 12,806,614 0.1Sri Lanka Government International Bond . . . . . . . . . . . . . . . . . . . 6.85% 11/03/25 25,000 24,468,750 0.1 43,932,211 0.2
TURKEYTurkey Government International Bond . . . . . . . . . . . . . . . . . . . . . 4.88% 10/09/26 1,978 1,787,617 0.0Turkey Government International Bond . . . . . . . . . . . . . . . . . . . . . 4.88% 4/16/43 6,825 5,178,421 0.0Turkey Government International Bond . . . . . . . . . . . . . . . . . . . . . 7.25% 12/23/23 10,129 10,572,144 0.1Turkey Government International Bond . . . . . . . . . . . . . . . . . . . . . 7.38% 2/05/25 21,888 22,927,680 0.1Turkey Government International Bond . . . . . . . . . . . . . . . . . . . . . 7.50% 11/07/19 23,685 24,129,094 0.1 64,594,956 0.3
UKRAINEUkraine Government International Bond. . . . . . . . . . . . . . . . . . . . . 7.75% 9/01/22 3,416 3,326,330 0.0Ukraine Government International Bond. . . . . . . . . . . . . . . . . . . . . 7.75% 9/01/23 53,693 51,411,047 0.3Ukraine Government International Bond. . . . . . . . . . . . . . . . . . . . . 7.75% 9/01/24 39,301 37,041,193 0.2 91,778,570 0.5
VENEZUELAVenezuela Government International Bond(e). . . . . . . . . . . . . . . . . 9.00% 5/07/23 4,270 1,254,313 0.0Venezuela Government International Bond(e). . . . . . . . . . . . . . . . . 9.25% 9/15/27 57,269 17,896,562 0.1 19,150,875 0.1
ZAMBIAZambia Government International Bond . . . . . . . . . . . . . . . . . . . . . 8.50% 4/14/24 35,644 28,871,640 0.2 1,338,320,506 6.9
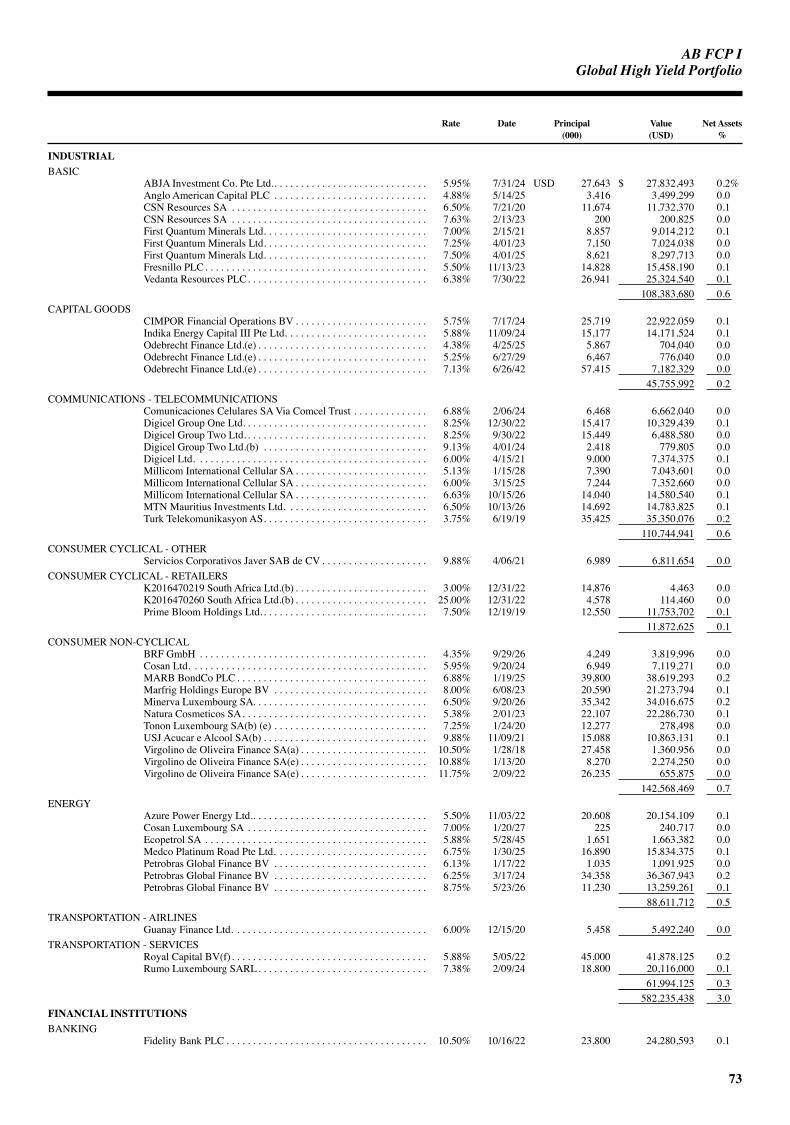
AB FCP I
73
GlobalHighYieldPortfolio
Rate Date Principal Value Net Assets (000) (USD) %
INDUSTRIALBASIC
ABJA Investment Co. Pte Ltd.. . . . . . . . . . . . . . . . . . . . . . . . . . . . . 5.95% 7/31/24 USD 27,643 $ 27,832,493 0.2%Anglo American Capital PLC . . . . . . . . . . . . . . . . . . . . . . . . . . . . . 4.88% 5/14/25 3,416 3,499,299 0.0CSN Resources SA . . . . . . . . . . . . . . . . . . . . . . . . . . . . . . . . . . . . . 6.50% 7/21/20 11,674 11,732,370 0.1CSN Resources SA . . . . . . . . . . . . . . . . . . . . . . . . . . . . . . . . . . . . . 7.63% 2/13/23 200 200,825 0.0First Quantum Minerals Ltd. . . . . . . . . . . . . . . . . . . . . . . . . . . . . . . 7.00% 2/15/21 8,857 9,014,212 0.1First Quantum Minerals Ltd. . . . . . . . . . . . . . . . . . . . . . . . . . . . . . . 7.25% 4/01/23 7,150 7,024,038 0.0First Quantum Minerals Ltd. . . . . . . . . . . . . . . . . . . . . . . . . . . . . . . 7.50% 4/01/25 8,621 8,297,713 0.0Fresnillo PLC. . . . . . . . . . . . . . . . . . . . . . . . . . . . . . . . . . . . . . . . . . 5.50% 11/13/23 14,828 15,458,190 0.1Vedanta Resources PLC. . . . . . . . . . . . . . . . . . . . . . . . . . . . . . . . . . 6.38% 7/30/22 26,941 25,324,540 0.1 108,383,680 0.6
CAPITAL GOODSCIMPOR Financial Operations BV . . . . . . . . . . . . . . . . . . . . . . . . . 5.75% 7/17/24 25,719 22,922,059 0.1Indika Energy Capital III Pte Ltd. . . . . . . . . . . . . . . . . . . . . . . . . . . 5.88% 11/09/24 15,177 14,171,524 0.1Odebrecht Finance Ltd.(e) . . . . . . . . . . . . . . . . . . . . . . . . . . . . . . . . 4.38% 4/25/25 5,867 704,040 0.0Odebrecht Finance Ltd.(e) . . . . . . . . . . . . . . . . . . . . . . . . . . . . . . . . 5.25% 6/27/29 6,467 776,040 0.0Odebrecht Finance Ltd.(e) . . . . . . . . . . . . . . . . . . . . . . . . . . . . . . . . 7.13% 6/26/42 57,415 7,182,329 0.0 45,755,992 0.2
COMMUNICATIONS - TELECOMMUNICATIONSComunicaciones Celulares SA Via Comcel Trust . . . . . . . . . . . . . . 6.88% 2/06/24 6,468 6,662,040 0.0Digicel Group One Ltd. . . . . . . . . . . . . . . . . . . . . . . . . . . . . . . . . . . 8.25% 12/30/22 15,417 10,329,439 0.1Digicel Group Two Ltd. . . . . . . . . . . . . . . . . . . . . . . . . . . . . . . . . . . 8.25% 9/30/22 15,449 6,488,580 0.0Digicel Group Two Ltd.(b) . . . . . . . . . . . . . . . . . . . . . . . . . . . . . . . 9.13% 4/01/24 2,418 779,805 0.0Digicel Ltd. . . . . . . . . . . . . . . . . . . . . . . . . . . . . . . . . . . . . . . . . . . . 6.00% 4/15/21 9,000 7,374,375 0.1Millicom International Cellular SA . . . . . . . . . . . . . . . . . . . . . . . . . 5.13% 1/15/28 7,390 7,043,601 0.0Millicom International Cellular SA . . . . . . . . . . . . . . . . . . . . . . . . . 6.00% 3/15/25 7,244 7,352,660 0.0Millicom International Cellular SA . . . . . . . . . . . . . . . . . . . . . . . . . 6.63% 10/15/26 14,040 14,580,540 0.1MTN Mauritius Investments Ltd. . . . . . . . . . . . . . . . . . . . . . . . . . . 6.50% 10/13/26 14,692 14,783,825 0.1Turk Telekomunikasyon AS. . . . . . . . . . . . . . . . . . . . . . . . . . . . . . . 3.75% 6/19/19 35,425 35,350,076 0.2 110,744,941 0.6
CONSUMER CYCLICAL - OTHERServicios Corporativos Javer SAB de CV . . . . . . . . . . . . . . . . . . . . 9.88% 4/06/21 6,989 6,811,654 0.0
CONSUMER CYCLICAL - RETAILERSK2016470219 South Africa Ltd.(b) . . . . . . . . . . . . . . . . . . . . . . . . . 3.00% 12/31/22 14,876 4,463 0.0K2016470260 South Africa Ltd.(b) . . . . . . . . . . . . . . . . . . . . . . . . . 25.00% 12/31/22 4,578 114,460 0.0Prime Bloom Holdings Ltd.. . . . . . . . . . . . . . . . . . . . . . . . . . . . . . . 7.50% 12/19/19 12,550 11,753,702 0.1 11,872,625 0.1
CONSUMER NON-CYCLICALBRF GmbH . . . . . . . . . . . . . . . . . . . . . . . . . . . . . . . . . . . . . . . . . . . 4.35% 9/29/26 4,249 3,819,996 0.0Cosan Ltd. . . . . . . . . . . . . . . . . . . . . . . . . . . . . . . . . . . . . . . . . . . . . 5.95% 9/20/24 6,949 7,119,271 0.0MARB BondCo PLC . . . . . . . . . . . . . . . . . . . . . . . . . . . . . . . . . . . . 6.88% 1/19/25 39,800 38,619,293 0.2Marfrig Holdings Europe BV . . . . . . . . . . . . . . . . . . . . . . . . . . . . . 8.00% 6/08/23 20,590 21,273,794 0.1Minerva Luxembourg SA. . . . . . . . . . . . . . . . . . . . . . . . . . . . . . . . . 6.50% 9/20/26 35,342 34,016,675 0.2Natura Cosmeticos SA. . . . . . . . . . . . . . . . . . . . . . . . . . . . . . . . . . . 5.38% 2/01/23 22,107 22,286,730 0.1Tonon Luxembourg SA(b) (e) . . . . . . . . . . . . . . . . . . . . . . . . . . . . . 7.25% 1/24/20 12,277 278,498 0.0USJ Acucar e Alcool SA(b) . . . . . . . . . . . . . . . . . . . . . . . . . . . . . . . 9.88% 11/09/21 15,088 10,863,131 0.1Virgolino de Oliveira Finance SA(a) . . . . . . . . . . . . . . . . . . . . . . . . 10.50% 1/28/18 27,458 1,360,956 0.0Virgolino de Oliveira Finance SA(e) . . . . . . . . . . . . . . . . . . . . . . . . 10.88% 1/13/20 8,270 2,274,250 0.0Virgolino de Oliveira Finance SA(e) . . . . . . . . . . . . . . . . . . . . . . . . 11.75% 2/09/22 26,235 655,875 0.0 142,568,469 0.7
ENERGYAzure Power Energy Ltd.. . . . . . . . . . . . . . . . . . . . . . . . . . . . . . . . . 5.50% 11/03/22 20,608 20,154,109 0.1Cosan Luxembourg SA . . . . . . . . . . . . . . . . . . . . . . . . . . . . . . . . . . 7.00% 1/20/27 225 240,717 0.0Ecopetrol SA . . . . . . . . . . . . . . . . . . . . . . . . . . . . . . . . . . . . . . . . . . 5.88% 5/28/45 1,651 1,663,382 0.0Medco Platinum Road Pte Ltd. . . . . . . . . . . . . . . . . . . . . . . . . . . . . 6.75% 1/30/25 16,890 15,834,375 0.1Petrobras Global Finance BV . . . . . . . . . . . . . . . . . . . . . . . . . . . . . 6.13% 1/17/22 1,035 1,091,925 0.0Petrobras Global Finance BV . . . . . . . . . . . . . . . . . . . . . . . . . . . . . 6.25% 3/17/24 34,358 36,367,943 0.2Petrobras Global Finance BV . . . . . . . . . . . . . . . . . . . . . . . . . . . . . 8.75% 5/23/26 11,230 13,259,261 0.1 88,611,712 0.5
TRANSPORTATION - AIRLINESGuanay Finance Ltd. . . . . . . . . . . . . . . . . . . . . . . . . . . . . . . . . . . . . 6.00% 12/15/20 5,458 5,492,240 0.0
TRANSPORTATION - SERVICESRoyal Capital BV(f). . . . . . . . . . . . . . . . . . . . . . . . . . . . . . . . . . . . . 5.88% 5/05/22 45,000 41,878,125 0.2Rumo Luxembourg SARL. . . . . . . . . . . . . . . . . . . . . . . . . . . . . . . . 7.38% 2/09/24 18,800 20,116,000 0.1 61,994,125 0.3 582,235,438 3.0
FINANCIAL INSTITUTIONSBANKING
Fidelity Bank PLC . . . . . . . . . . . . . . . . . . . . . . . . . . . . . . . . . . . . . . 10.50% 10/16/22 23,800 24,280,593 0.1

AB FCP I
74
Portfolio of investments (continued) GlobalHighYieldPortfolio
Rate Date Principal Value Net Assets (000) (USD) %
Itau Unibanco Holding SA/Cayman Island(f) . . . . . . . . . . . . . . . . . 6.13% 12/12/22 USD 14,678 $ 14,399,118 0.1%Turkiye Vakiflar Bankasi TAO. . . . . . . . . . . . . . . . . . . . . . . . . . . . . 5.50% 10/27/21 6,350 6,167,438 0.0Turkiye Vakiflar Bankasi TAO. . . . . . . . . . . . . . . . . . . . . . . . . . . . . 5.75% 1/30/23 27,991 26,136,596 0.1Turkiye Vakiflar Bankasi TAO. . . . . . . . . . . . . . . . . . . . . . . . . . . . . 6.88% 2/03/25 1,129 1,075,373 0.0Yapi ve Kredi Bankasi AS . . . . . . . . . . . . . . . . . . . . . . . . . . . . . . . . 6.10% 3/16/23 8,971 8,556,091 0.1Zenith Bank PLC . . . . . . . . . . . . . . . . . . . . . . . . . . . . . . . . . . . . . . . 6.25% 4/22/19 24,000 24,000,000 0.1 104,615,209 0.5
FINANCEUnifin Financiera SAB de CV SOFOM ENR . . . . . . . . . . . . . . . . . 7.00% 1/15/25 10,010 9,022,013 0.1
OTHER FINANCEMestenio Ltd. for Dominican Republic . . . . . . . . . . . . . . . . . . . . . . 8.50% 1/02/20 14,667 14,937,115 0.1
REITSChina Evergrande Group, Series JAN . . . . . . . . . . . . . . . . . . . . . . . 8.25% 3/23/22 6,644 6,347,100 0.0Country Garden Holdings Co., Ltd.. . . . . . . . . . . . . . . . . . . . . . . . . 7.13% 4/25/22 11,768 12,068,531 0.1Easy Tactic Ltd. . . . . . . . . . . . . . . . . . . . . . . . . . . . . . . . . . . . . . . . . 9.13% 7/28/22 1,491 1,543,185 0.0Yuzhou Properties Co., Ltd.. . . . . . . . . . . . . . . . . . . . . . . . . . . . . . . 8.63% 1/23/22 17,125 17,586,981 0.1 37,545,797 0.2 166,120,134 0.9
UTILITYELECTRIC
AES El Salvador Trust II . . . . . . . . . . . . . . . . . . . . . . . . . . . . . . . . . 6.75% 3/28/23 5,470 5,134,963 0.0Cemig Geracao e Transmissao SA. . . . . . . . . . . . . . . . . . . . . . . . . . 9.25% 12/05/24 4,278 4,750,035 0.0Light Servicos de Eletricidade SA/Light Energia SA . . . . . . . . . . . 7.25% 5/03/23 8,659 8,766,934 0.1Terraform Global Operating LLC . . . . . . . . . . . . . . . . . . . . . . . . . . 6.13% 3/01/26 6,594 6,344,153 0.0 24,996,085 0.1
LOCAL GOVERNMENTS - REGIONAL BONDSARGENTINA
Provincia de Buenos Aires/Argentina . . . . . . . . . . . . . . . . . . . . . . . 9.13% 3/16/24 10,422 9,275,580 0.0Provincia de Cordoba. . . . . . . . . . . . . . . . . . . . . . . . . . . . . . . . . . . . 7.13% 6/10/21 8,442 7,766,640 0.1Provincia de Cordoba. . . . . . . . . . . . . . . . . . . . . . . . . . . . . . . . . . . . 7.45% 9/01/24 7,330 6,193,850 0.0 23,236,070 0.1 2,134,908,233 11.0
COLLATERALIZED MORTGAGE OBLIGATIONSRISK SHARE FLOATING RATE
Bellemeade Re Ltd.Series 2018-3A, Class M2(g) . . . . . . . . . . . . . . . . . . . . . . . . . . . 5.24% 10/25/27 18,830 18,873,426 0.1Series 2015-1A, Class M2(g) . . . . . . . . . . . . . . . . . . . . . . . . . . . 6.79% 7/25/25 1,597 1,600,795 0.0
Connecticut Avenue Securities Trust, Series 2018-R07, Class 1B1(g) . . . . . . . . . . . . . . . . . . . . . . . . . . . . . . . . . . . . . . . . 6.84% 4/25/31 8,645 8,816,019 0.0
Eagle RE Ltd., Series 2018-1, Class M2(g). . . . . . . . . . . . . . . . . . . 5.49% 11/25/28 3,268 3,280,804 0.0Federal Home Loan Mortgage Corp. Structured Agency Credit Risk Debt Notes
Series 2015-DNA1, Class M3(g) . . . . . . . . . . . . . . . . . . . . . . . . 5.79% 10/25/27 4,615 5,060,540 0.0Series 2017-DNA2, Class M2(g) . . . . . . . . . . . . . . . . . . . . . . . . 5.94% 10/25/29 25,702 27,722,948 0.1Series 2014-DN2, Class M3(g) . . . . . . . . . . . . . . . . . . . . . . . . . . 6.09% 4/25/24 16,680 18,064,121 0.1Series 2015-HQ1, Class M3(g) . . . . . . . . . . . . . . . . . . . . . . . . . . 6.29% 3/25/25 5,955 6,292,723 0.0Series 2014-DN3, Class M3(g) . . . . . . . . . . . . . . . . . . . . . . . . . . 6.49% 8/25/24 29,577 32,015,508 0.2Series 2015-DN1, Class M3(g) . . . . . . . . . . . . . . . . . . . . . . . . . . 6.64% 1/25/25 445 478,106 0.0Series 2017-DNA3, Class B1(g) . . . . . . . . . . . . . . . . . . . . . . . . . 6.94% 3/25/30 47,742 51,250,937 0.3Series 2014-DN4, Class M3(g) . . . . . . . . . . . . . . . . . . . . . . . . . . 7.04% 10/25/24 23,099 25,462,579 0.1Series 2016-DNA2, Class M3(g) . . . . . . . . . . . . . . . . . . . . . . . . 7.14% 10/25/28 25,243 28,461,654 0.1Series 2015-HQA1, Class M3(g) . . . . . . . . . . . . . . . . . . . . . . . . 7.19% 3/25/28 44,285 50,098,487 0.3Series 2015-HQA2, Class M3(g) . . . . . . . . . . . . . . . . . . . . . . . . 7.29% 5/25/28 8,706 9,977,522 0.1Series 2017-DNA1, Class B1(g) . . . . . . . . . . . . . . . . . . . . . . . . . 7.44% 7/25/29 5,750 6,476,268 0.0Series 2017-DNA2, Class B1(g) . . . . . . . . . . . . . . . . . . . . . . . . . 7.64% 10/25/29 12,733 14,406,196 0.1Series 2016-DNA1, Class M3(g) . . . . . . . . . . . . . . . . . . . . . . . . 8.04% 7/25/28 20,613 24,470,094 0.1Series 2016-HQA1, Class M3(g) . . . . . . . . . . . . . . . . . . . . . . . . 8.84% 9/25/28 28,344 34,171,675 0.2Series 2013-DN1, Class M2(g) . . . . . . . . . . . . . . . . . . . . . . . . . . 9.64% 7/25/23 18,515 21,783,484 0.1Series 2015-DNA2, Class B(g) . . . . . . . . . . . . . . . . . . . . . . . . . . 10.04% 12/25/27 48,490 57,276,625 0.3Series 2015-HQ2, Class B(g) . . . . . . . . . . . . . . . . . . . . . . . . . . . 10.44% 5/25/25 1,461 1,794,531 0.0Series 2016-DNA4, Class B(g) . . . . . . . . . . . . . . . . . . . . . . . . . . 11.09% 3/25/29 8,770 10,694,015 0.1Series 2015-HQA1, Class B(g) . . . . . . . . . . . . . . . . . . . . . . . . . . 11.29% 3/25/28 17,732 21,556,273 0.1Series 2015-DNA1, Class B(g) . . . . . . . . . . . . . . . . . . . . . . . . . . 11.69% 10/25/27 28,764 35,916,937 0.2Series 2015-DNA3, Class B(g) . . . . . . . . . . . . . . . . . . . . . . . . . . 11.84% 4/25/28 13,499 16,966,794 0.1Series 2015-HQA2, Class B(g) . . . . . . . . . . . . . . . . . . . . . . . . . . 12.99% 5/25/28 10,465 13,769,402 0.1Series 2015-HQ1, Class B(g) . . . . . . . . . . . . . . . . . . . . . . . . . . . 13.24% 3/25/25 11,542 15,611,305 0.1Series 2016-DNA3, Class B(g) . . . . . . . . . . . . . . . . . . . . . . . . . . 13.74% 12/25/28 4,925 6,726,866 0.0Series 2016-HQA2, Class B(g) . . . . . . . . . . . . . . . . . . . . . . . . . . 13.99% 11/25/28 10,352 13,979,495 0.1Series 2016-HQA1, Class B(g) . . . . . . . . . . . . . . . . . . . . . . . . . . 15.24% 9/25/28 16,447 23,398,911 0.1
Federal National Mortgage Association Connecticut Avenue SecuritiesSeries 2018-C01, Class 1B1(g) . . . . . . . . . . . . . . . . . . . . . . . . . . 6.04% 7/25/30 18,544 18,557,906 0.1Series 2017-C02, Class 2M2(g) . . . . . . . . . . . . . . . . . . . . . . . . . 6.14% 9/25/29 21,603 23,346,119 0.1

AB FCP I
75
GlobalHighYieldPortfolio
Rate Date Principal Value Net Assets (000) (USD) %
Series 2015-C02, Class 1M2(g) . . . . . . . . . . . . . . . . . . . . . . . . . 6.49% 5/25/25 USD 27,266 $ 29,660,517 0.2%Series 2015-C02, Class 2M2(g) . . . . . . . . . . . . . . . . . . . . . . . . . 6.49% 5/25/25 28,727 30,798,167 0.2Series 2016-C04, Class 1M2(g) . . . . . . . . . . . . . . . . . . . . . . . . . 6.74% 1/25/29 19,877 22,147,496 0.1Series 2016-C06, Class 1M2(g) . . . . . . . . . . . . . . . . . . . . . . . . . 6.74% 4/25/29 31,238 34,787,371 0.2Series 2015-C01, Class 1M2(g) . . . . . . . . . . . . . . . . . . . . . . . . . 6.79% 2/25/25 38,148 41,668,869 0.2Series 2016-C07, Class 2M2(g) . . . . . . . . . . . . . . . . . . . . . . . . . 6.84% 5/25/29 4,890 5,356,203 0.0Series 2014-C01, Class M2(g) . . . . . . . . . . . . . . . . . . . . . . . . . . 6.89% 1/25/24 8,530 9,550,323 0.1Series 2016-C05, Class 2M2(g) . . . . . . . . . . . . . . . . . . . . . . . . . 6.94% 1/25/29 74,895 82,347,577 0.4Series 2015-C01, Class 2M2(g) . . . . . . . . . . . . . . . . . . . . . . . . . 7.04% 2/25/25 7,034 7,576,485 0.0Series 2017-C03, Class 1B1(g) . . . . . . . . . . . . . . . . . . . . . . . . . . 7.34% 10/25/29 22,555 25,152,141 0.1Series 2014-C04, Class 1M2(g) . . . . . . . . . . . . . . . . . . . . . . . . . 7.39% 11/25/24 46,657 52,654,607 0.3Series 2014-C04, Class 2M2(g) . . . . . . . . . . . . . . . . . . . . . . . . . 7.49% 11/25/24 13,714 15,286,010 0.1Series 2015-C03, Class 1M2(g) . . . . . . . . . . . . . . . . . . . . . . . . . 7.49% 7/25/25 46,585 52,368,828 0.3Series 2015-C03, Class 2M2(g) . . . . . . . . . . . . . . . . . . . . . . . . . 7.49% 7/25/25 45,997 50,950,787 0.3Series 2013-C01, Class M2(g) . . . . . . . . . . . . . . . . . . . . . . . . . . 7.74% 10/25/23 32,197 36,398,518 0.2Series 2016-C03, Class 1M2(g) . . . . . . . . . . . . . . . . . . . . . . . . . 7.79% 10/25/28 6,512 7,520,054 0.0Series 2015-C04, Class 2M2(g) . . . . . . . . . . . . . . . . . . . . . . . . . 8.04% 4/25/28 39,502 44,428,853 0.2Series 2015-C04, Class 1M2(g) . . . . . . . . . . . . . . . . . . . . . . . . . 8.19% 4/25/28 2,883 3,307,445 0.0Series 2017-C01, Class 1B1(g) . . . . . . . . . . . . . . . . . . . . . . . . . . 8.24% 7/25/29 16,341 19,205,611 0.1Series 2016-C03, Class 2M2(g) . . . . . . . . . . . . . . . . . . . . . . . . . 8.39% 10/25/28 66,386 75,499,409 0.4Series 2016-C01, Class 1M2(g) . . . . . . . . . . . . . . . . . . . . . . . . . 9.24% 8/25/28 41,098 48,104,571 0.2Series 2016-C06, Class 1B(g) . . . . . . . . . . . . . . . . . . . . . . . . . . . 11.74% 4/25/29 21,347 26,757,961 0.1Series 2016-C07, Class 2B(g) . . . . . . . . . . . . . . . . . . . . . . . . . . . 11.99% 5/25/29 26,964 32,946,088 0.2Series 2016-C04, Class 1B(g) . . . . . . . . . . . . . . . . . . . . . . . . . . . 12.74% 1/25/29 34,708 45,878,763 0.2Series 2016-C05, Class 2B(g) . . . . . . . . . . . . . . . . . . . . . . . . . . . 13.23% 1/25/29 30,049 37,862,735 0.2Series 2016-C01, Class 1B(g) . . . . . . . . . . . . . . . . . . . . . . . . . . . 14.24% 8/25/28 39,564 56,104,652 0.3Series 2016-C03, Class 1B(g) . . . . . . . . . . . . . . . . . . . . . . . . . . . 14.24% 10/25/28 7,826 11,050,380 0.1Series 2016-C02, Class 1B(g) . . . . . . . . . . . . . . . . . . . . . . . . . . . 14.74% 9/25/28 21,538 30,950,599 0.2Series 2016-C03, Class 2B(g) . . . . . . . . . . . . . . . . . . . . . . . . . . . 15.24% 10/25/28 18,515 25,425,560 0.1
Home Re Ltd., Series 2018-1, Class M2(g). . . . . . . . . . . . . . . . . . . 5.49% 10/25/28 19,338 19,379,804 0.1 1,629,485,449 8.4
AGENCY FLOATING RATEFederal Home Loan Mortgage Corp. REMICs
Series 4248, Class SL(g) (i) . . . . . . . . . . . . . . . . . . . . . . . . . . . . 3.56% 5/15/41 9,698 1,303,190 0.0Series 4121, Class DS(g) (i) . . . . . . . . . . . . . . . . . . . . . . . . . . . . 3.71% 10/15/42 14,971 2,530,175 0.0Series 4736, Class LS(g) (i) . . . . . . . . . . . . . . . . . . . . . . . . . . . . 3.71% 12/15/47 45,265 8,012,638 0.1Series 4736, Class SM(g) (i) . . . . . . . . . . . . . . . . . . . . . . . . . . . . 3.71% 12/15/47 99,750 16,250,445 0.1Series 4774, Class BS(g) (i) . . . . . . . . . . . . . . . . . . . . . . . . . . . . 3.71% 2/15/48 71,207 11,276,897 0.1
Federal National Mortgage Association REMICsSeries 2016-64, Class SP(g) (i) . . . . . . . . . . . . . . . . . . . . . . . . . . 3.51% 9/25/46 33,209 5,790,631 0.0Series 2016-89, Class SH(g) (i). . . . . . . . . . . . . . . . . . . . . . . . . . 3.51% 12/25/46 25,611 4,063,418 0.0Series 2013-15, Class SA(g) (i). . . . . . . . . . . . . . . . . . . . . . . . . . 3.66% 3/25/43 30,838 5,577,845 0.0Series 2016-81, Class SA(g) (i). . . . . . . . . . . . . . . . . . . . . . . . . . 3.66% 11/25/46 44,289 6,638,219 0.1Series 2017-97, Class SW(g) (i) . . . . . . . . . . . . . . . . . . . . . . . . . 3.71% 12/25/47 52,208 9,426,457 0.1Series 2018-43, Class SB(g) (i) . . . . . . . . . . . . . . . . . . . . . . . . . . 3.71% 6/25/48 21,230 3,296,144 0.0Series 2018-36, Class SG(g) (i). . . . . . . . . . . . . . . . . . . . . . . . . . 3.71% 6/25/48 28,271 4,925,633 0.0
Government National Mortgage AssociationSeries 2015-3, Class DS(g) (i). . . . . . . . . . . . . . . . . . . . . . . . . . . 3.12% 11/20/41 57,763 5,562,612 0.0Series 2017-134, Class MS(g) (i) . . . . . . . . . . . . . . . . . . . . . . . . 3.72% 9/20/47 13,064 2,463,157 0.0Series 2017-161, Class CS(g) (i) . . . . . . . . . . . . . . . . . . . . . . . . . 3.77% 10/20/47 35,396 5,425,953 0.0
92,543,414 0.5NON-AGENCY FIXED RATE
Alternative Loan TrustSeries 2005-28CB, Class 2A6 . . . . . . . . . . . . . . . . . . . . . . . . . . . 5.00% 8/25/35 3,578 3,010,840 0.0Series 2006-24CB, Class A16 . . . . . . . . . . . . . . . . . . . . . . . . . . . 5.75% 8/1/36 2,126 1,738,158 0.0Series 2007-15CB, Class A19 . . . . . . . . . . . . . . . . . . . . . . . . . . . 5.75% 7/25/37 2,210 1,851,380 0.0Series 2006-J4, Class 2A9. . . . . . . . . . . . . . . . . . . . . . . . . . . . . . 6.00% 7/25/36 847 699,052 0.0Series 2006-28CB, Class A18 . . . . . . . . . . . . . . . . . . . . . . . . . . . 6.00% 10/25/36 1,188 922,358 0.0Series 2007-16CB, Class 1A7 . . . . . . . . . . . . . . . . . . . . . . . . . . . 6.00% 8/25/37 5,581 5,384,559 0.1Series 2006-42, Class 1A6 . . . . . . . . . . . . . . . . . . . . . . . . . . . . . 6.00% 1/25/47 3,752 3,042,257 0.0Series 2006-26CB, Class A6 . . . . . . . . . . . . . . . . . . . . . . . . . . . . 6.25% 9/25/36 886 690,546 0.0Series 2006-26CB, Class A8 . . . . . . . . . . . . . . . . . . . . . . . . . . . . 6.25% 9/25/36 3,354 2,612,860 0.0Series 2006-28CB, Class A14 . . . . . . . . . . . . . . . . . . . . . . . . . . . 6.25% 10/25/36 3,374 2,681,527 0.0Series 2006-J5, Class 1A1. . . . . . . . . . . . . . . . . . . . . . . . . . . . . . 6.50% 9/25/36 2,968 2,488,503 0.0
Bear Stearns ARM Trust, Series 2007-4, Class 22A1 . . . . . . . . . . . 3.91% 6/25/47 12,795 11,716,524 0.1BNPP Mortgage Securities LLC Trust, Series 2009-1, Class B1 . . 6.00% 8/27/37 14,330 10,962,365 0.1ChaseFlex Trust, Series 2007-1, Class 1A3. . . . . . . . . . . . . . . . . . . 6.50% 2/25/37 5,718 3,383,040 0.0Citigroup Mortgage Loan Trust, Series 2007-AR4, Class 1A1A . . 4.63% 3/25/37 2,874 2,806,217 0.0CitiMortgage Alternative Loan Trust, Series 2007-A3, Class 1A4 5.75% 3/25/37 883 850,344 0.0Countrywide Home Loan Mortgage Pass-Through Trust
Series 2007-HY4, Class 1A1. . . . . . . . . . . . . . . . . . . . . . . . . . . . 4.03% 9/25/47 3,805 3,536,359 0.0Series 2007-3, Class A30. . . . . . . . . . . . . . . . . . . . . . . . . . . . . . . 5.75% 4/25/37 2,082 1,664,099 0.0Series 2006-13, Class 1A19 . . . . . . . . . . . . . . . . . . . . . . . . . . . . 6.25% 9/25/36 1,010 776,452 0.0
First Horizon Alternative Mortgage Securities TrustSeries 2006-AA3, Class A1. . . . . . . . . . . . . . . . . . . . . . . . . . . . . 4.16% 6/25/36 3,584 3,278,460 0.0
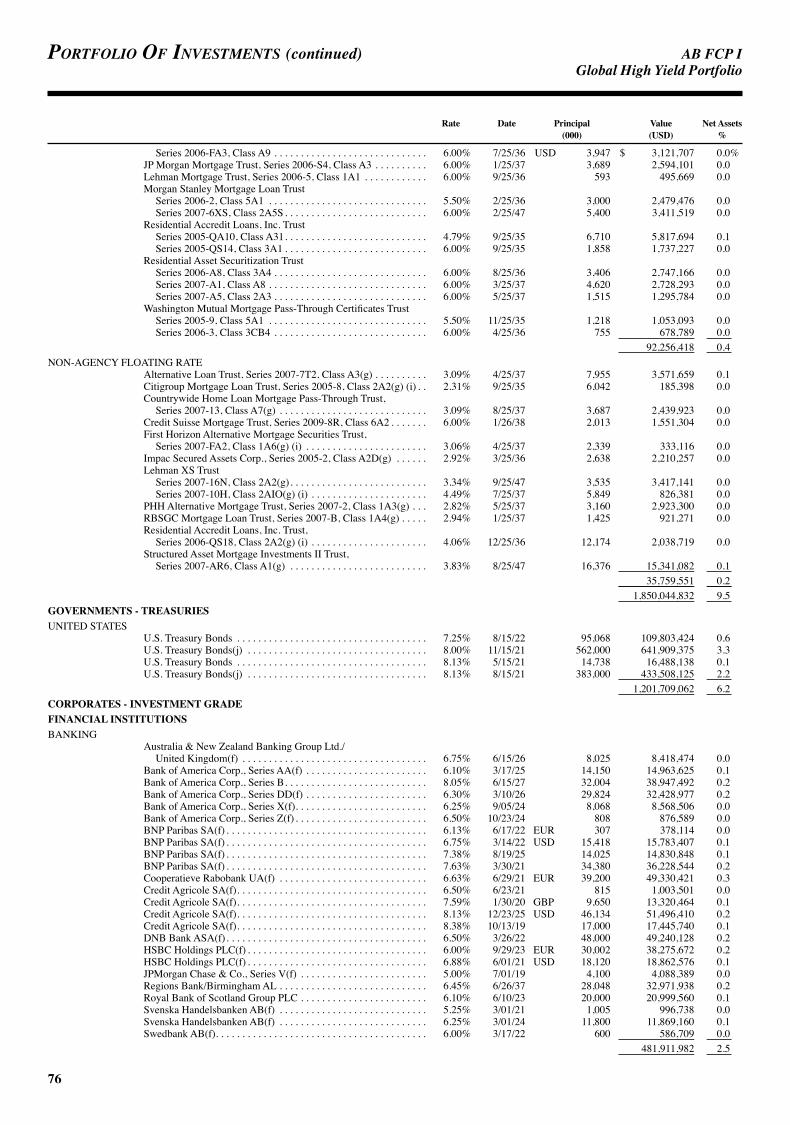
AB FCP I
76
Portfolio of investments (continued) GlobalHighYieldPortfolio
Rate Date Principal Value Net Assets (000) (USD) %
Series 2006-FA3, Class A9 . . . . . . . . . . . . . . . . . . . . . . . . . . . . . 6.00% 7/25/36 USD 3,947 $ 3,121,707 0.0%JP Morgan Mortgage Trust, Series 2006-S4, Class A3 . . . . . . . . . . 6.00% 1/25/37 3,689 2,594,101 0.0Lehman Mortgage Trust, Series 2006-5, Class 1A1 . . . . . . . . . . . . 6.00% 9/25/36 593 495,669 0.0Morgan Stanley Mortgage Loan Trust
Series 2006-2, Class 5A1 . . . . . . . . . . . . . . . . . . . . . . . . . . . . . . 5.50% 2/25/36 3,000 2,479,476 0.0Series 2007-6XS, Class 2A5S . . . . . . . . . . . . . . . . . . . . . . . . . . . 6.00% 2/25/47 5,400 3,411,519 0.0
Residential Accredit Loans, Inc. TrustSeries 2005-QA10, Class A31. . . . . . . . . . . . . . . . . . . . . . . . . . . 4.79% 9/25/35 6,710 5,817,694 0.1Series 2005-QS14, Class 3A1 . . . . . . . . . . . . . . . . . . . . . . . . . . . 6.00% 9/25/35 1,858 1,737,227 0.0
Residential Asset Securitization TrustSeries 2006-A8, Class 3A4 . . . . . . . . . . . . . . . . . . . . . . . . . . . . . 6.00% 8/25/36 3,406 2,747,166 0.0Series 2007-A1, Class A8 . . . . . . . . . . . . . . . . . . . . . . . . . . . . . . 6.00% 3/25/37 4,620 2,728,293 0.0Series 2007-A5, Class 2A3 . . . . . . . . . . . . . . . . . . . . . . . . . . . . . 6.00% 5/25/37 1,515 1,295,784 0.0
Washington Mutual Mortgage Pass-Through Certificates TrustSeries 2005-9, Class 5A1 . . . . . . . . . . . . . . . . . . . . . . . . . . . . . . 5.50% 11/25/35 1,218 1,053,093 0.0Series 2006-3, Class 3CB4 . . . . . . . . . . . . . . . . . . . . . . . . . . . . . 6.00% 4/25/36 755 678,789 0.0
92,256,418 0.4NON-AGENCY FLOATING RATE
Alternative Loan Trust, Series 2007-7T2, Class A3(g) . . . . . . . . . . 3.09% 4/25/37 7,955 3,571,659 0.1Citigroup Mortgage Loan Trust, Series 2005-8, Class 2A2(g) (i) . . 2.31% 9/25/35 6,042 185,398 0.0Countrywide Home Loan Mortgage Pass-Through Trust,
Series 2007-13, Class A7(g) . . . . . . . . . . . . . . . . . . . . . . . . . . . . 3.09% 8/25/37 3,687 2,439,923 0.0Credit Suisse Mortgage Trust, Series 2009-8R, Class 6A2 . . . . . . . 6.00% 1/26/38 2,013 1,551,304 0.0First Horizon Alternative Mortgage Securities Trust,
Series 2007-FA2, Class 1A6(g) (i) . . . . . . . . . . . . . . . . . . . . . . . 3.06% 4/25/37 2,339 333,116 0.0Impac Secured Assets Corp., Series 2005-2, Class A2D(g) . . . . . . 2.92% 3/25/36 2,638 2,210,257 0.0Lehman XS Trust
Series 2007-16N, Class 2A2(g). . . . . . . . . . . . . . . . . . . . . . . . . . 3.34% 9/25/47 3,535 3,417,141 0.0Series 2007-10H, Class 2AIO(g) (i) . . . . . . . . . . . . . . . . . . . . . . 4.49% 7/25/37 5,849 826,381 0.0
PHH Alternative Mortgage Trust, Series 2007-2, Class 1A3(g) . . . 2.82% 5/25/37 3,160 2,923,300 0.0RBSGC Mortgage Loan Trust, Series 2007-B, Class 1A4(g) . . . . . 2.94% 1/25/37 1,425 921,271 0.0Residential Accredit Loans, Inc. Trust,
Series 2006-QS18, Class 2A2(g) (i) . . . . . . . . . . . . . . . . . . . . . . 4.06% 12/25/36 12,174 2,038,719 0.0Structured Asset Mortgage Investments II Trust,
Series 2007-AR6, Class A1(g) . . . . . . . . . . . . . . . . . . . . . . . . . . 3.83% 8/25/47 16,376 15,341,082 0.1 35,759,551 0.2 1,850,044,832 9.5
GOVERNMENTS - TREASURIESUNITED STATES
U.S. Treasury Bonds . . . . . . . . . . . . . . . . . . . . . . . . . . . . . . . . . . . . 7.25% 8/15/22 95,068 109,803,424 0.6U.S. Treasury Bonds(j) . . . . . . . . . . . . . . . . . . . . . . . . . . . . . . . . . . 8.00% 11/15/21 562,000 641,909,375 3.3U.S. Treasury Bonds . . . . . . . . . . . . . . . . . . . . . . . . . . . . . . . . . . . . 8.13% 5/15/21 14,738 16,488,138 0.1U.S. Treasury Bonds(j) . . . . . . . . . . . . . . . . . . . . . . . . . . . . . . . . . . 8.13% 8/15/21 383,000 433,508,125 2.2 1,201,709,062 6.2
CORPORATES - INVESTMENT GRADEFINANCIAL INSTITUTIONSBANKING
Australia & New Zealand Banking Group Ltd./ United Kingdom(f) . . . . . . . . . . . . . . . . . . . . . . . . . . . . . . . . . . . 6.75% 6/15/26 8,025 8,418,474 0.0
Bank of America Corp., Series AA(f) . . . . . . . . . . . . . . . . . . . . . . . 6.10% 3/17/25 14,150 14,963,625 0.1Bank of America Corp., Series B. . . . . . . . . . . . . . . . . . . . . . . . . . . 8.05% 6/15/27 32,004 38,947,492 0.2Bank of America Corp., Series DD(f) . . . . . . . . . . . . . . . . . . . . . . . 6.30% 3/10/26 29,824 32,428,977 0.2Bank of America Corp., Series X(f). . . . . . . . . . . . . . . . . . . . . . . . . 6.25% 9/05/24 8,068 8,568,506 0.0Bank of America Corp., Series Z(f) . . . . . . . . . . . . . . . . . . . . . . . . . 6.50% 10/23/24 808 876,589 0.0BNP Paribas SA(f) . . . . . . . . . . . . . . . . . . . . . . . . . . . . . . . . . . . . . . 6.13% 6/17/22 EUR 307 378,114 0.0BNP Paribas SA(f) . . . . . . . . . . . . . . . . . . . . . . . . . . . . . . . . . . . . . . 6.75% 3/14/22 USD 15,418 15,783,407 0.1BNP Paribas SA(f) . . . . . . . . . . . . . . . . . . . . . . . . . . . . . . . . . . . . . . 7.38% 8/19/25 14,025 14,830,848 0.1BNP Paribas SA(f) . . . . . . . . . . . . . . . . . . . . . . . . . . . . . . . . . . . . . . 7.63% 3/30/21 34,380 36,228,544 0.2Cooperatieve Rabobank UA(f) . . . . . . . . . . . . . . . . . . . . . . . . . . . . 6.63% 6/29/21 EUR 39,200 49,330,421 0.3Credit Agricole SA(f). . . . . . . . . . . . . . . . . . . . . . . . . . . . . . . . . . . . 6.50% 6/23/21 815 1,003,501 0.0Credit Agricole SA(f). . . . . . . . . . . . . . . . . . . . . . . . . . . . . . . . . . . . 7.59% 1/30/20 GBP 9,650 13,320,464 0.1Credit Agricole SA(f). . . . . . . . . . . . . . . . . . . . . . . . . . . . . . . . . . . . 8.13% 12/23/25 USD 46,134 51,496,410 0.2Credit Agricole SA(f). . . . . . . . . . . . . . . . . . . . . . . . . . . . . . . . . . . . 8.38% 10/13/19 17,000 17,445,740 0.1DNB Bank ASA(f). . . . . . . . . . . . . . . . . . . . . . . . . . . . . . . . . . . . . . 6.50% 3/26/22 48,000 49,240,128 0.2HSBC Holdings PLC(f) . . . . . . . . . . . . . . . . . . . . . . . . . . . . . . . . . . 6.00% 9/29/23 EUR 30,002 38,275,672 0.2HSBC Holdings PLC(f) . . . . . . . . . . . . . . . . . . . . . . . . . . . . . . . . . . 6.88% 6/01/21 USD 18,120 18,862,576 0.1JPMorgan Chase & Co., Series V(f) . . . . . . . . . . . . . . . . . . . . . . . . 5.00% 7/01/19 4,100 4,088,389 0.0Regions Bank/Birmingham AL . . . . . . . . . . . . . . . . . . . . . . . . . . . . 6.45% 6/26/37 28,048 32,971,938 0.2Royal Bank of Scotland Group PLC . . . . . . . . . . . . . . . . . . . . . . . . 6.10% 6/10/23 20,000 20,999,560 0.1Svenska Handelsbanken AB(f) . . . . . . . . . . . . . . . . . . . . . . . . . . . . 5.25% 3/01/21 1,005 996,738 0.0Svenska Handelsbanken AB(f) . . . . . . . . . . . . . . . . . . . . . . . . . . . . 6.25% 3/01/24 11,800 11,869,160 0.1Swedbank AB(f). . . . . . . . . . . . . . . . . . . . . . . . . . . . . . . . . . . . . . . . 6.00% 3/17/22 600 586,709 0.0 481,911,982 2.5
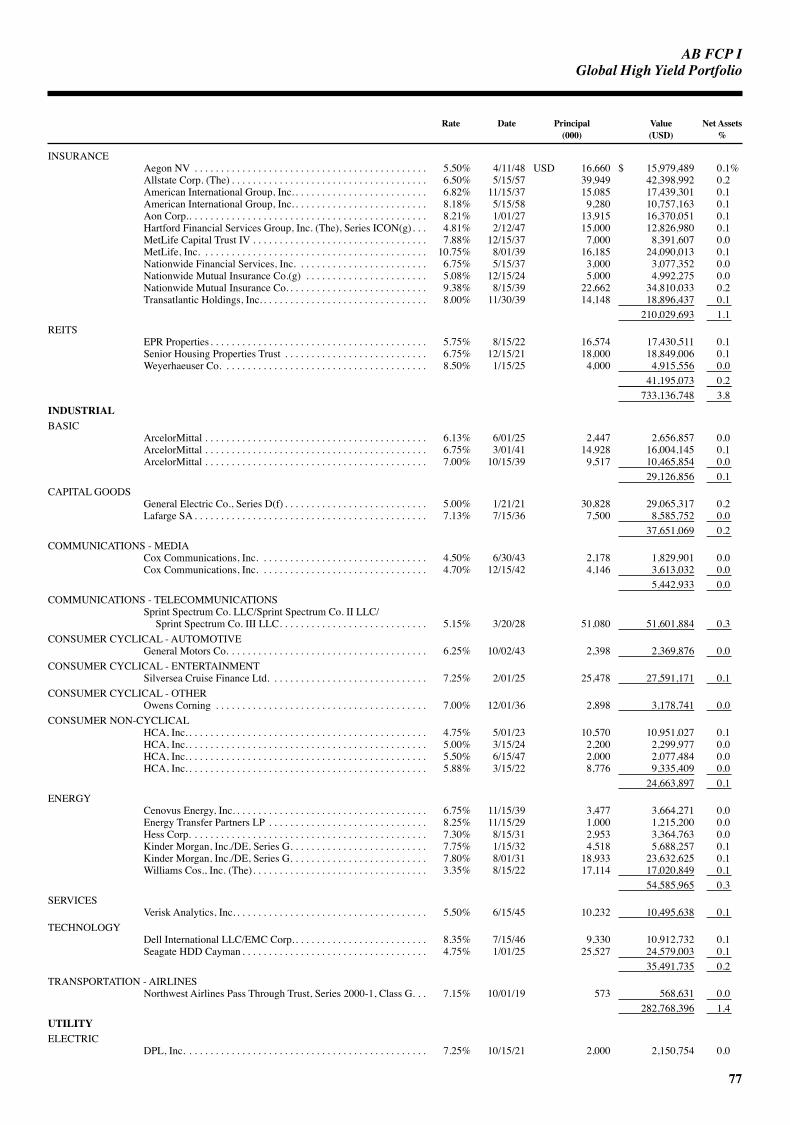
AB FCP I
77
GlobalHighYieldPortfolio
Rate Date Principal Value Net Assets (000) (USD) %
INSURANCEAegon NV . . . . . . . . . . . . . . . . . . . . . . . . . . . . . . . . . . . . . . . . . . . . 5.50% 4/11/48 USD 16,660 $ 15,979,489 0.1%Allstate Corp. (The) . . . . . . . . . . . . . . . . . . . . . . . . . . . . . . . . . . . . . 6.50% 5/15/57 39,949 42,398,992 0.2American International Group, Inc. . . . . . . . . . . . . . . . . . . . . . . . . . 6.82% 11/15/37 15,085 17,439,301 0.1American International Group, Inc. . . . . . . . . . . . . . . . . . . . . . . . . . 8.18% 5/15/58 9,280 10,757,163 0.1Aon Corp.. . . . . . . . . . . . . . . . . . . . . . . . . . . . . . . . . . . . . . . . . . . . . 8.21% 1/01/27 13,915 16,370,051 0.1Hartford Financial Services Group, Inc. (The), Series ICON(g). . . 4.81% 2/12/47 15,000 12,826,980 0.1MetLife Capital Trust IV . . . . . . . . . . . . . . . . . . . . . . . . . . . . . . . . . 7.88% 12/15/37 7,000 8,391,607 0.0MetLife, Inc. . . . . . . . . . . . . . . . . . . . . . . . . . . . . . . . . . . . . . . . . . . 10.75% 8/01/39 16,185 24,090,013 0.1Nationwide Financial Services, Inc. . . . . . . . . . . . . . . . . . . . . . . . . 6.75% 5/15/37 3,000 3,077,352 0.0Nationwide Mutual Insurance Co.(g) . . . . . . . . . . . . . . . . . . . . . . . 5.08% 12/15/24 5,000 4,992,275 0.0Nationwide Mutual Insurance Co. . . . . . . . . . . . . . . . . . . . . . . . . . . 9.38% 8/15/39 22,662 34,810,033 0.2Transatlantic Holdings, Inc. . . . . . . . . . . . . . . . . . . . . . . . . . . . . . . . 8.00% 11/30/39 14,148 18,896,437 0.1 210,029,693 1.1
REITSEPR Properties . . . . . . . . . . . . . . . . . . . . . . . . . . . . . . . . . . . . . . . . . 5.75% 8/15/22 16,574 17,430,511 0.1Senior Housing Properties Trust . . . . . . . . . . . . . . . . . . . . . . . . . . . 6.75% 12/15/21 18,000 18,849,006 0.1Weyerhaeuser Co. . . . . . . . . . . . . . . . . . . . . . . . . . . . . . . . . . . . . . . 8.50% 1/15/25 4,000 4,915,556 0.0 41,195,073 0.2 733,136,748 3.8
INDUSTRIALBASIC
ArcelorMittal . . . . . . . . . . . . . . . . . . . . . . . . . . . . . . . . . . . . . . . . . . 6.13% 6/01/25 2,447 2,656,857 0.0ArcelorMittal . . . . . . . . . . . . . . . . . . . . . . . . . . . . . . . . . . . . . . . . . . 6.75% 3/01/41 14,928 16,004,145 0.1ArcelorMittal . . . . . . . . . . . . . . . . . . . . . . . . . . . . . . . . . . . . . . . . . . 7.00% 10/15/39 9,517 10,465,854 0.0 29,126,856 0.1
CAPITAL GOODSGeneral Electric Co., Series D(f) . . . . . . . . . . . . . . . . . . . . . . . . . . . 5.00% 1/21/21 30,828 29,065,317 0.2Lafarge SA . . . . . . . . . . . . . . . . . . . . . . . . . . . . . . . . . . . . . . . . . . . . 7.13% 7/15/36 7,500 8,585,752 0.0 37,651,069 0.2
COMMUNICATIONS - MEDIACox Communications, Inc. . . . . . . . . . . . . . . . . . . . . . . . . . . . . . . . 4.50% 6/30/43 2,178 1,829,901 0.0Cox Communications, Inc. . . . . . . . . . . . . . . . . . . . . . . . . . . . . . . . 4.70% 12/15/42 4,146 3,613,032 0.0 5,442,933 0.0
COMMUNICATIONS - TELECOMMUNICATIONSSprint Spectrum Co. LLC/Sprint Spectrum Co. II LLC/
Sprint Spectrum Co. III LLC. . . . . . . . . . . . . . . . . . . . . . . . . . . . 5.15% 3/20/28 51,080 51,601,884 0.3CONSUMER CYCLICAL - AUTOMOTIVE
General Motors Co. . . . . . . . . . . . . . . . . . . . . . . . . . . . . . . . . . . . . . 6.25% 10/02/43 2,398 2,369,876 0.0CONSUMER CYCLICAL - ENTERTAINMENT
Silversea Cruise Finance Ltd. . . . . . . . . . . . . . . . . . . . . . . . . . . . . . 7.25% 2/01/25 25,478 27,591,171 0.1CONSUMER CYCLICAL - OTHER
Owens Corning . . . . . . . . . . . . . . . . . . . . . . . . . . . . . . . . . . . . . . . . 7.00% 12/01/36 2,898 3,178,741 0.0CONSUMER NON-CYCLICAL
HCA, Inc. . . . . . . . . . . . . . . . . . . . . . . . . . . . . . . . . . . . . . . . . . . . . . 4.75% 5/01/23 10,570 10,951,027 0.1HCA, Inc. . . . . . . . . . . . . . . . . . . . . . . . . . . . . . . . . . . . . . . . . . . . . . 5.00% 3/15/24 2,200 2,299,977 0.0HCA, Inc. . . . . . . . . . . . . . . . . . . . . . . . . . . . . . . . . . . . . . . . . . . . . . 5.50% 6/15/47 2,000 2,077,484 0.0HCA, Inc. . . . . . . . . . . . . . . . . . . . . . . . . . . . . . . . . . . . . . . . . . . . . . 5.88% 3/15/22 8,776 9,335,409 0.0 24,663,897 0.1
ENERGYCenovus Energy, Inc. . . . . . . . . . . . . . . . . . . . . . . . . . . . . . . . . . . . . 6.75% 11/15/39 3,477 3,664,271 0.0Energy Transfer Partners LP . . . . . . . . . . . . . . . . . . . . . . . . . . . . . . 8.25% 11/15/29 1,000 1,215,200 0.0Hess Corp. . . . . . . . . . . . . . . . . . . . . . . . . . . . . . . . . . . . . . . . . . . . . 7.30% 8/15/31 2,953 3,364,763 0.0Kinder Morgan, Inc./DE, Series G. . . . . . . . . . . . . . . . . . . . . . . . . . 7.75% 1/15/32 4,518 5,688,257 0.1Kinder Morgan, Inc./DE, Series G. . . . . . . . . . . . . . . . . . . . . . . . . . 7.80% 8/01/31 18,933 23,632,625 0.1Williams Cos., Inc. (The). . . . . . . . . . . . . . . . . . . . . . . . . . . . . . . . . 3.35% 8/15/22 17,114 17,020,849 0.1 54,585,965 0.3
SERVICESVerisk Analytics, Inc. . . . . . . . . . . . . . . . . . . . . . . . . . . . . . . . . . . . . 5.50% 6/15/45 10,232 10,495,638 0.1
TECHNOLOGYDell International LLC/EMC Corp.. . . . . . . . . . . . . . . . . . . . . . . . . 8.35% 7/15/46 9,330 10,912,732 0.1Seagate HDD Cayman . . . . . . . . . . . . . . . . . . . . . . . . . . . . . . . . . . . 4.75% 1/01/25 25,527 24,579,003 0.1 35,491,735 0.2
TRANSPORTATION - AIRLINESNorthwest Airlines Pass Through Trust, Series 2000-1, Class G. . . 7.15% 10/01/19 573 568,631 0.0 282,768,396 1.4
UTILITYELECTRIC
DPL, Inc. . . . . . . . . . . . . . . . . . . . . . . . . . . . . . . . . . . . . . . . . . . . . . 7.25% 10/15/21 2,000 2,150,754 0.0

AB FCP I
78
Portfolio of investments (continued) GlobalHighYieldPortfolio
Rate Date Shares/Principal Value Net Assets (-)/(000) (USD) %
Israel Electric Corp., Ltd., Series 6 . . . . . . . . . . . . . . . . . . . . . . . . . 5.00% 11/12/24 USD 11,644 $ 12,095,205 0.1%Southern California Edison Co., Series E(f) . . . . . . . . . . . . . . . . . . 6.25% 2/01/22 17,000 16,490,357 0.1 30,736,316 0.2 1,046,641,460 5.4
INVESTMENT COMPANIESFUNDS AND INVESTMENT TRUSTS
AB FCP I - Mortgage Income Portfolio, - Class SA . . . . . . . . . . . . 1,353,150 122,216,548 0.6AB SICAV I - Asia Income Opportunities Portfolio, Class ZT . . . . 355,179 36,281,493 0.2AB SICAV I - Emerging Market Corporate Debt Portfolio, -
Class S . . . . . . . . . . . . . . . . . . . . . . . . . . . . . . . . . . . . . . . . . . . . . 4,017,647 88,990,880 0.5AB SICAV I - Emerging Market Local Currency Debt Portfolio, -
Class ZT. . . . . . . . . . . . . . . . . . . . . . . . . . . . . . . . . . . . . . . . . . . . 14,131,398 192,752,270 1.0AB SICAV I - Euro High Yield Portfolio, - Class S . . . . . . . . . . . . 3,593,187 116,195,368 0.6AB SICAV I - Financial Credit Portfolio, - Class ZT . . . . . . . . . . . 1,031,607 102,046,594 0.5AB SICAV I - US High Yield Portfolio, - Class ZT . . . . . . . . . . . . 3,677,369 52,476,056 0.3 710,959,209 3.7
COMMERCIAL MORTGAGE-BACKED SECURITIESNON-AGENCY FIXED RATE CMBS
225 Liberty Street Trust, Series 2016-225L, Class E. . . . . . . . . . . . 4.65% 2/10/36 USD 15,394 15,563,930 0.1CGBAM Commercial Mortgage Trust, Series 2015-SMRT,
Class F . . . . . . . . . . . . . . . . . . . . . . . . . . . . . . . . . . . . . . . . . . . . . 3.79% 4/10/28 5,780 5,825,500 0.0Citigroup Commercial Mortgage Trust
Series 2017-P8, Class XA(k). . . . . . . . . . . . . . . . . . . . . . . . . . . . 0.93% 9/15/50 47,833 2,955,691 0.0Series 2013-GC11, Class XA(k) . . . . . . . . . . . . . . . . . . . . . . . . . 1.40% 4/10/46 25,873 1,217,283 0.0Series 2014-GC23, Class D. . . . . . . . . . . . . . . . . . . . . . . . . . . . . 4.50% 7/10/47 15,574 14,468,354 0.1
Commercial Mortgage TrustSeries 2016-DC2, Class XA(k) . . . . . . . . . . . . . . . . . . . . . . . . . . 1.03% 2/10/49 44,493 2,400,093 0.0Series 2014-CR15, Class XA(k) . . . . . . . . . . . . . . . . . . . . . . . . . 1.04% 2/10/47 65,493 2,159,829 0.0Series 2014-CR20, Class XA(k) . . . . . . . . . . . . . . . . . . . . . . . . . 1.12% 11/10/47 59,527 2,605,709 0.0Series 2013-LC6, Class XA(k) . . . . . . . . . . . . . . . . . . . . . . . . . . 1.36% 1/10/46 57,592 2,473,153 0.0Series 2012-CR5, Class XA(k) . . . . . . . . . . . . . . . . . . . . . . . . . . 1.55% 12/10/45 54,332 2,618,321 0.0Series 2012-CR1, Class XA(k) . . . . . . . . . . . . . . . . . . . . . . . . . . 1.87% 5/15/45 60,139 2,990,746 0.0Series 2012-CR3, Class XA(k) . . . . . . . . . . . . . . . . . . . . . . . . . . 1.87% 10/15/45 71,183 3,955,132 0.0Series 2010-C1, Class F . . . . . . . . . . . . . . . . . . . . . . . . . . . . . . . 4.00% 7/10/46 3,049 2,866,383 0.0Series 2014-CR16, Class D . . . . . . . . . . . . . . . . . . . . . . . . . . . . . 4.91% 4/10/47 20,000 18,732,726 0.1
DBUBS Mortgage Trust, Series 2011-LC2A, Class E . . . . . . . . . . 5.53% 7/10/44 7,955 7,864,312 0.1Grantor Trust JPMBB, Series 2014-C24(d). . . . . . . . . . . . . . . . . . . 4.00% 11/15/47 1,109 25,515,986 0.2GS Mortgage Securities Trust
Series 2014-GC22, Class D. . . . . . . . . . . . . . . . . . . . . . . . . . . . . 0.00% 4/10/47 22,159 20,322,506 0.1Series 2014-GC18, Class D. . . . . . . . . . . . . . . . . . . . . . . . . . . . . 0.00% 4/10/47 9,098 8,179,090 0.1
JPMBB Commercial Mortgage Securities TrustSeries 2014-C21, Class XA(k) . . . . . . . . . . . . . . . . . . . . . . . . . . 1.02% 8/15/47 72,932 3,155,205 0.0Series 2013-C15, Class XA(k) . . . . . . . . . . . . . . . . . . . . . . . . . . 1.08% 11/15/45 35,136 1,458,030 0.0Series 2013-C14, Class D . . . . . . . . . . . . . . . . . . . . . . . . . . . . . . 4.57% 8/15/46 3,001 2,746,859 0.0
Morgan Stanley Bank of America Merrill Lynch TrustSeries 2015-C22, Class XA(k) . . . . . . . . . . . . . . . . . . . . . . . . . . 1.10% 4/15/48 74,124 3,548,907 0.0Series 2014-C16, Class XA(k) . . . . . . . . . . . . . . . . . . . . . . . . . . 1.11% 6/15/47 61,051 2,246,008 0.0Series 2016-C30, Class XA(k) . . . . . . . . . . . . . . . . . . . . . . . . . . 1.44% 9/15/49 63,191 5,121,982 0.0Series 2012-C6, Class XA(k) . . . . . . . . . . . . . . . . . . . . . . . . . . . 1.62% 11/15/45 40,373 1,903,672 0.0
Morgan Stanley Capital I Trust, Series 2016-BNK2, Class XA(k) 1.09% 11/15/49 89,668 5,196,167 0.0Wells Fargo Commercial Mortgage Trust
Series 2016-LC24, Class XA(k) . . . . . . . . . . . . . . . . . . . . . . . . . 1.69% 10/15/49 96,626 9,066,156 0.1Series 2016-C33, Class XA(k) . . . . . . . . . . . . . . . . . . . . . . . . . . 1.77% 3/15/59 78,008 6,662,380 0.1
WF-RBS Commercial Mortgage TrustSeries 2013-C11, Class XA(k) . . . . . . . . . . . . . . . . . . . . . . . . . . 1.21% 3/15/45 83,237 3,216,881 0.0Series 2012-C7, Class XA(k) . . . . . . . . . . . . . . . . . . . . . . . . . . . 1.40% 6/15/45 24,686 860,032 0.0Series 2012-C10, Class XA(k) . . . . . . . . . . . . . . . . . . . . . . . . . . 1.56% 12/15/45 104,818 5,113,859 0.0Series 2012-C8, Class XA(k) . . . . . . . . . . . . . . . . . . . . . . . . . . . 1.83% 8/15/45 29,317 1,491,213 0.0Series 2014-C20, Class D . . . . . . . . . . . . . . . . . . . . . . . . . . . . . . 3.99% 5/15/47 4,799 3,688,247 0.0Series 2012-C8, Class F . . . . . . . . . . . . . . . . . . . . . . . . . . . . . . . 4.89% 8/15/45 8,767 7,636,177 0.1
205,826,519 1.1NON-AGENCY FLOATING RATE CMBS
CLNS Trust, Series 2017-IKPR, Class F(g) . . . . . . . . . . . . . . . . . . 7.02% 6/11/32 20,667 20,744,233 0.1CSMC, Series 2016-MFF, Class F(g) . . . . . . . . . . . . . . . . . . . . . . . 9.74% 11/15/33 2,150 2,145,237 0.0DBWF Mortgage Trust, Series 2018-GLKS, Class E(g). . . . . . . . . 5.50% 11/19/35 15,965 16,025,136 0.1 38,914,606 0.2 244,741,125 1.3
COMMON STOCKSAtd New Holdings, Inc. . . . . . . . . . . . . . . . . . . . . . . . . . . . . . . . . . 525,684 9,462,312 0.1Avaya Holdings Corp. . . . . . . . . . . . . . . . . . . . . . . . . . . . . . . . . . . . 1,508,768 23,370,816 0.1Berry Petroleum Corp. . . . . . . . . . . . . . . . . . . . . . . . . . . . . . . . . . . 2,987,112 38,025,936 0.2Denbury Resources, Inc. . . . . . . . . . . . . . . . . . . . . . . . . . . . . . . . . . 783,943 1,505,171 0.0Goodman Networks, Inc. (d) . . . . . . . . . . . . . . . . . . . . . . . . . . . . . . 656,367 1 0.0
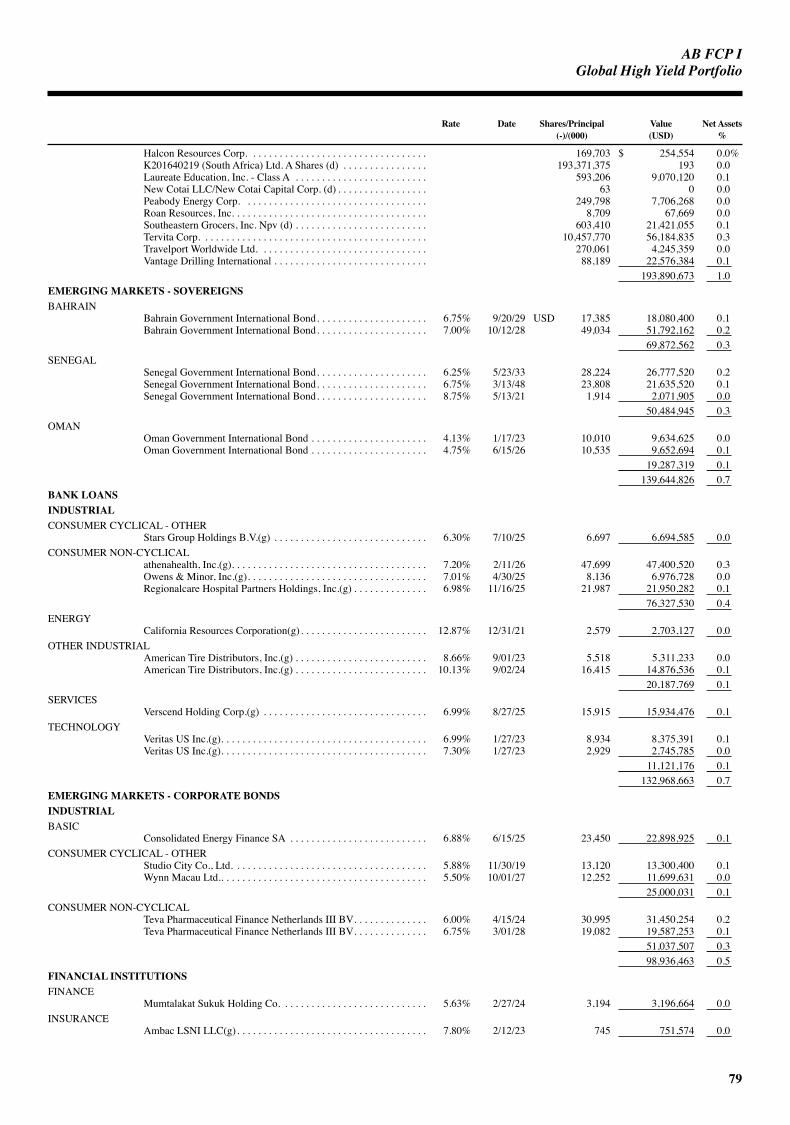
AB FCP I
79
GlobalHighYieldPortfolio
Rate Date Shares/Principal Value Net Assets (-)/(000) (USD) %
Halcon Resources Corp. . . . . . . . . . . . . . . . . . . . . . . . . . . . . . . . . . 169,703 $ 254,554 0.0%K201640219 (South Africa) Ltd. A Shares (d) . . . . . . . . . . . . . . . . 193,371,375 193 0.0Laureate Education, Inc. - Class A . . . . . . . . . . . . . . . . . . . . . . . . . 593,206 9,070,120 0.1New Cotai LLC/New Cotai Capital Corp. (d) . . . . . . . . . . . . . . . . . 63 0 0.0Peabody Energy Corp. . . . . . . . . . . . . . . . . . . . . . . . . . . . . . . . . . . 249,798 7,706,268 0.0Roan Resources, Inc. . . . . . . . . . . . . . . . . . . . . . . . . . . . . . . . . . . . . 8,709 67,669 0.0Southeastern Grocers, Inc. Npv (d) . . . . . . . . . . . . . . . . . . . . . . . . . 603,410 21,421,055 0.1Tervita Corp. . . . . . . . . . . . . . . . . . . . . . . . . . . . . . . . . . . . . . . . . . . 10,457,770 56,184,835 0.3Travelport Worldwide Ltd. . . . . . . . . . . . . . . . . . . . . . . . . . . . . . . . 270,061 4,245,359 0.0Vantage Drilling International . . . . . . . . . . . . . . . . . . . . . . . . . . . . . 88,189 22,576,384 0.1 193,890,673 1.0
EMERGING MARKETS - SOVEREIGNSBAHRAIN
Bahrain Government International Bond. . . . . . . . . . . . . . . . . . . . . 6.75% 9/20/29 USD 17,385 18,080,400 0.1Bahrain Government International Bond. . . . . . . . . . . . . . . . . . . . . 7.00% 10/12/28 49,034 51,792,162 0.2 69,872,562 0.3
SENEGALSenegal Government International Bond. . . . . . . . . . . . . . . . . . . . . 6.25% 5/23/33 28,224 26,777,520 0.2Senegal Government International Bond. . . . . . . . . . . . . . . . . . . . . 6.75% 3/13/48 23,808 21,635,520 0.1Senegal Government International Bond. . . . . . . . . . . . . . . . . . . . . 8.75% 5/13/21 1,914 2,071,905 0.0 50,484,945 0.3
OMANOman Government International Bond . . . . . . . . . . . . . . . . . . . . . . 4.13% 1/17/23 10,010 9,634,625 0.0Oman Government International Bond . . . . . . . . . . . . . . . . . . . . . . 4.75% 6/15/26 10,535 9,652,694 0.1 19,287,319 0.1 139,644,826 0.7
BANK LOANSINDUSTRIALCONSUMER CYCLICAL - OTHER
Stars Group Holdings B.V.(g) . . . . . . . . . . . . . . . . . . . . . . . . . . . . . 6.30% 7/10/25 6,697 6,694,585 0.0CONSUMER NON-CYCLICAL
athenahealth, Inc.(g). . . . . . . . . . . . . . . . . . . . . . . . . . . . . . . . . . . . . 7.20% 2/11/26 47,699 47,400,520 0.3Owens & Minor, Inc.(g). . . . . . . . . . . . . . . . . . . . . . . . . . . . . . . . . . 7.01% 4/30/25 8,136 6,976,728 0.0Regionalcare Hospital Partners Holdings, Inc.(g) . . . . . . . . . . . . . . 6.98% 11/16/25 21,987 21,950,282 0.1 76,327,530 0.4
ENERGYCalifornia Resources Corporation(g). . . . . . . . . . . . . . . . . . . . . . . . 12.87% 12/31/21 2,579 2,703,127 0.0
OTHER INDUSTRIALAmerican Tire Distributors, Inc.(g) . . . . . . . . . . . . . . . . . . . . . . . . . 8.66% 9/01/23 5,518 5,311,233 0.0American Tire Distributors, Inc.(g) . . . . . . . . . . . . . . . . . . . . . . . . . 10.13% 9/02/24 16,415 14,876,536 0.1 20,187,769 0.1
SERVICESVerscend Holding Corp.(g) . . . . . . . . . . . . . . . . . . . . . . . . . . . . . . . 6.99% 8/27/25 15,915 15,934,476 0.1
TECHNOLOGYVeritas US Inc.(g). . . . . . . . . . . . . . . . . . . . . . . . . . . . . . . . . . . . . . . 6.99% 1/27/23 8,934 8,375,391 0.1Veritas US Inc.(g). . . . . . . . . . . . . . . . . . . . . . . . . . . . . . . . . . . . . . . 7.30% 1/27/23 2,929 2,745,785 0.0 11,121,176 0.1 132,968,663 0.7
EMERGING MARKETS - CORPORATE BONDSINDUSTRIALBASIC
Consolidated Energy Finance SA . . . . . . . . . . . . . . . . . . . . . . . . . . 6.88% 6/15/25 23,450 22,898,925 0.1CONSUMER CYCLICAL - OTHER
Studio City Co., Ltd. . . . . . . . . . . . . . . . . . . . . . . . . . . . . . . . . . . . . 5.88% 11/30/19 13,120 13,300,400 0.1Wynn Macau Ltd.. . . . . . . . . . . . . . . . . . . . . . . . . . . . . . . . . . . . . . . 5.50% 10/01/27 12,252 11,699,631 0.0 25,000,031 0.1
CONSUMER NON-CYCLICALTeva Pharmaceutical Finance Netherlands III BV. . . . . . . . . . . . . . 6.00% 4/15/24 30,995 31,450,254 0.2Teva Pharmaceutical Finance Netherlands III BV. . . . . . . . . . . . . . 6.75% 3/01/28 19,082 19,587,253 0.1 51,037,507 0.3 98,936,463 0.5
FINANCIAL INSTITUTIONSFINANCE
Mumtalakat Sukuk Holding Co. . . . . . . . . . . . . . . . . . . . . . . . . . . . 5.63% 2/27/24 3,194 3,196,664 0.0INSURANCE
Ambac LSNI LLC(g). . . . . . . . . . . . . . . . . . . . . . . . . . . . . . . . . . . . 7.80% 2/12/23 745 751,574 0.0

AB FCP I
80
Portfolio of investments (continued) GlobalHighYieldPortfolio
Rate Date Principal Value Net Assets (000) (USD) %
REITSRKPF Overseas 2019 A Ltd. . . . . . . . . . . . . . . . . . . . . . . . . . . . . . . 7.88% 2/01/23 USD 2,085 $ 2,121,488 0.0%Scenery Journey Ltd. . . . . . . . . . . . . . . . . . . . . . . . . . . . . . . . . . . . . 11.00% 11/06/20 4,500 4,671,000 0.1 6,792,488 0.1 10,740,726 0.1 109,677,189 0.6
ASSET-BACKED SECURITIESOTHER ABS - FIXED RATE
Consumer Loan Underlying Bond Certificate Issuer Trust I, Series 2018-20, Class PT. . . . . . . . . . . . . . . . . . . . . . . . . . . . . . . 9.14% 11/16/43 9,957 9,890,918 0.1
Consumer Loan Underlying Bond Club Certificate Issuer Trust ISeries 2018-4, Class PT. . . . . . . . . . . . . . . . . . . . . . . . . . . . . . . . 8.77% 5/15/43 8,001 8,067,634 0.0Series 2018-12, Class PT. . . . . . . . . . . . . . . . . . . . . . . . . . . . . . . 11.08% 6/15/43 8,604 8,655,789 0.1
Consumer Loan Underlying Bond Credit Trust, Series 2018-3, Class PT. . . . . . . . . . . . . . . . . . . . . . . . . . . . . . . . . . . . . . . . . . . . 8.60% 3/16/43 5,104 5,152,346 0.0
SoFi Consumer Loan Program LLC, Series 2016-1, Class R(d). . . 0.00% 8/25/25 25,367 6,978,390 0.0SoFi Consumer Loan Program Trust, Series 2018-1, Class R1(d) . 0.00% 2/25/27 355 29,906,610 0.2 68,651,687 0.4
HOME EQUITY LOANS - FIXED RATECSAB Mortgage-Backed Trust, Series 2006-2, Class A6A. . . . . . . 5.72% 9/25/36 9,177 4,956,011 0.1CWABS Asset-Backed Certificates Trust, Series 2005-7,
Class AF5W. . . . . . . . . . . . . . . . . . . . . . . . . . . . . . . . . . . . . . . . . 5.05% 10/25/35 12,729 12,623,660 0.1GSAA Home Equity TrustSeries 2005-12, Class AF5. . . . . . . . . . . . . . . . . . . . . . . . . . . . . . . . 5.66% 9/25/35 3,523 3,005,981 0.0Series 2006-10, Class AF3. . . . . . . . . . . . . . . . . . . . . . . . . . . . . . . . 5.98% 6/25/36 5,171 2,357,172 0.0Series 2006-6, Class AF4. . . . . . . . . . . . . . . . . . . . . . . . . . . . . . . . . 6.12% 3/25/36 1,116 541,501 0.0Series 2006-6, Class AF5. . . . . . . . . . . . . . . . . . . . . . . . . . . . . . . . . 6.24% 3/25/36 9,497 4,605,747 0.0Morgan Stanley Mortgage Loan Trust, Series 2006-17XS,
Class A6. . . . . . . . . . . . . . . . . . . . . . . . . . . . . . . . . . . . . . . . . . . . 5.58% 10/25/46 7,608 3,136,288 0.0 31,226,360 0.2
AUTOS - FIXED RATECPS Auto Receivables Trust
Series 2017-D, Class E . . . . . . . . . . . . . . . . . . . . . . . . . . . . . . . . 5.30% 6/17/24 2,000 2,003,225 0.0Series 2017-C, Class E . . . . . . . . . . . . . . . . . . . . . . . . . . . . . . . . 5.72% 9/16/24 2,000 2,034,172 0.0
4,037,397 0.0HOME EQUITY LOANS - FLOATING RATE
Lehman XS Trust, Series 2007-6, Class 3A5(g) . . . . . . . . . . . . . . . 4.74% 5/25/37 1,719 1,683,308 0.0 105,598,752 0.6
QUASI-SOVEREIGNSQUASI-SOVEREIGN BONDSKAZAKHSTAN
KazMunayGas National Co. JSC. . . . . . . . . . . . . . . . . . . . . . . . . . . 6.38% 10/24/48 14,629 15,813,949 0.1MEXICO
Petroleos Mexicanos . . . . . . . . . . . . . . . . . . . . . . . . . . . . . . . . . . . . 6.50% 1/23/29 6,213 5,912,291 0.0TURKEY
Export Credit Bank of Turkey . . . . . . . . . . . . . . . . . . . . . . . . . . . . . 6.13% 5/03/24 13,530 12,853,500 0.1TC Ziraat Bankasi AS . . . . . . . . . . . . . . . . . . . . . . . . . . . . . . . . . . . 5.13% 9/29/23 10,552 9,800,170 0.0 22,653,670 0.1
VENEZUELAPetroleos de Venezuela SA(e) . . . . . . . . . . . . . . . . . . . . . . . . . . . . . 5.38% 4/12/27 61,738 13,968,177 0.1 58,348,087 0.3
INDUSTRIALBASIC
Indonesia Asahan Aluminium Persero PT . . . . . . . . . . . . . . . . . . . . 5.71% 11/15/23 4,081 4,308,519 0.0ENERGY
Oil and Gas Holding Co. BSCC (The). . . . . . . . . . . . . . . . . . . . . . . 7.63% 11/07/24 971 1,052,321 0.0Oil and Gas Holding Co. BSCC (The). . . . . . . . . . . . . . . . . . . . . . . 8.38% 11/07/28 14,848 16,184,320 0.1 17,236,641 0.1 21,545,160 0.1 79,893,247 0.4
SUPRANATIONALSSUPRANATIONALS
European Bank for Reconstruction & Development, Series G . . . . 9.25% 12/02/20 IDR 648,670,000 47,100,336 0.2PREFERRED STOCKSFINANCIAL INSTITUTIONSBANKING
GMAC Capital Trust I, Series 2. . . . . . . . . . . . . . . . . . . . . . . . . . . . 8.47% 58,725 1,526,263 0.0
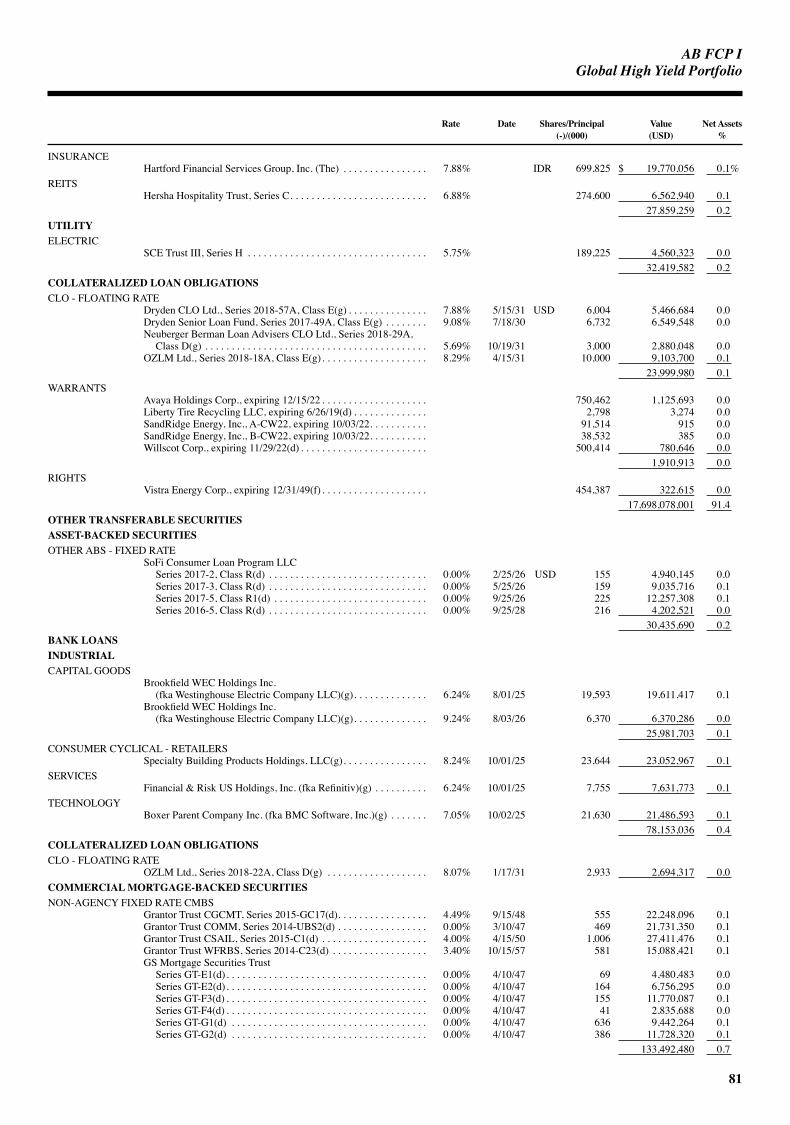
AB FCP I
81
GlobalHighYieldPortfolio
Rate Date Shares/Principal Value Net Assets (-)/(000) (USD) %
INSURANCEHartford Financial Services Group, Inc. (The) . . . . . . . . . . . . . . . . 7.88% IDR 699,825 $ 19,770,056 0.1%
REITSHersha Hospitality Trust, Series C. . . . . . . . . . . . . . . . . . . . . . . . . . 6.88% 274,600 6,562,940 0.1 27,859,259 0.2
UTILITYELECTRIC
SCE Trust III, Series H . . . . . . . . . . . . . . . . . . . . . . . . . . . . . . . . . . 5.75% 189,225 4,560,323 0.0 32,419,582 0.2
COLLATERALIZED LOAN OBLIGATIONSCLO - FLOATING RATE
Dryden CLO Ltd., Series 2018-57A, Class E(g) . . . . . . . . . . . . . . . 7.88% 5/15/31 USD 6,004 5,466,684 0.0Dryden Senior Loan Fund, Series 2017-49A, Class E(g) . . . . . . . . 9.08% 7/18/30 6,732 6,549,548 0.0Neuberger Berman Loan Advisers CLO Ltd., Series 2018-29A,
Class D(g) . . . . . . . . . . . . . . . . . . . . . . . . . . . . . . . . . . . . . . . . . . 5.69% 10/19/31 3,000 2,880,048 0.0OZLM Ltd., Series 2018-18A, Class E(g). . . . . . . . . . . . . . . . . . . . 8.29% 4/15/31 10,000 9,103,700 0.1 23,999,980 0.1
WARRANTSAvaya Holdings Corp., expiring 12/15/22 . . . . . . . . . . . . . . . . . . . . 750,462 1,125,693 0.0Liberty Tire Recycling LLC, expiring 6/26/19(d) . . . . . . . . . . . . . . 2,798 3,274 0.0SandRidge Energy, Inc., A-CW22, expiring 10/03/22. . . . . . . . . . . 91,514 915 0.0SandRidge Energy, Inc., B-CW22, expiring 10/03/22. . . . . . . . . . . 38,532 385 0.0Willscot Corp., expiring 11/29/22(d) . . . . . . . . . . . . . . . . . . . . . . . . 500,414 780,646 0.0 1,910,913 0.0
RIGHTSVistra Energy Corp., expiring 12/31/49(f) . . . . . . . . . . . . . . . . . . . . 454,387 322,615 0.0 17,698,078,001 91.4
OTHER TRANSFERABLE SECURITIESASSET-BACKED SECURITIESOTHER ABS - FIXED RATE
SoFi Consumer Loan Program LLCSeries 2017-2, Class R(d) . . . . . . . . . . . . . . . . . . . . . . . . . . . . . . 0.00% 2/25/26 USD 155 4,940,145 0.0Series 2017-3, Class R(d) . . . . . . . . . . . . . . . . . . . . . . . . . . . . . . 0.00% 5/25/26 159 9,035,716 0.1Series 2017-5, Class R1(d) . . . . . . . . . . . . . . . . . . . . . . . . . . . . . 0.00% 9/25/26 225 12,257,308 0.1Series 2016-5, Class R(d) . . . . . . . . . . . . . . . . . . . . . . . . . . . . . . 0.00% 9/25/28 216 4,202,521 0.0
30,435,690 0.2BANK LOANSINDUSTRIALCAPITAL GOODS
Brookfield WEC Holdings Inc. (fka Westinghouse Electric Company LLC)(g). . . . . . . . . . . . . . 6.24% 8/01/25 19,593 19,611,417 0.1
Brookfield WEC Holdings Inc. (fka Westinghouse Electric Company LLC)(g). . . . . . . . . . . . . . 9.24% 8/03/26 6,370 6,370,286 0.0
25,981,703 0.1CONSUMER CYCLICAL - RETAILERS
Specialty Building Products Holdings, LLC(g). . . . . . . . . . . . . . . . 8.24% 10/01/25 23,644 23,052,967 0.1SERVICES
Financial & Risk US Holdings, Inc. (fka Refinitiv)(g) . . . . . . . . . . 6.24% 10/01/25 7,755 7,631,773 0.1TECHNOLOGY
Boxer Parent Company Inc. (fka BMC Software, Inc.)(g) . . . . . . . 7.05% 10/02/25 21,630 21,486,593 0.1 78,153,036 0.4
COLLATERALIZED LOAN OBLIGATIONSCLO - FLOATING RATE
OZLM Ltd., Series 2018-22A, Class D(g) . . . . . . . . . . . . . . . . . . . 8.07% 1/17/31 2,933 2,694,317 0.0COMMERCIAL MORTGAGE-BACKED SECURITIESNON-AGENCY FIXED RATE CMBS
Grantor Trust CGCMT, Series 2015-GC17(d). . . . . . . . . . . . . . . . . 4.49% 9/15/48 555 22,248,096 0.1Grantor Trust COMM, Series 2014-UBS2(d) . . . . . . . . . . . . . . . . . 0.00% 3/10/47 469 21,731,350 0.1Grantor Trust CSAIL, Series 2015-C1(d) . . . . . . . . . . . . . . . . . . . . 4.00% 4/15/50 1,006 27,411,476 0.1Grantor Trust WFRBS, Series 2014-C23(d) . . . . . . . . . . . . . . . . . . 3.40% 10/15/57 581 15,088,421 0.1GS Mortgage Securities Trust
Series GT-E1(d). . . . . . . . . . . . . . . . . . . . . . . . . . . . . . . . . . . . . . 0.00% 4/10/47 69 4,480,483 0.0Series GT-E2(d). . . . . . . . . . . . . . . . . . . . . . . . . . . . . . . . . . . . . . 0.00% 4/10/47 164 6,756,295 0.0Series GT-F3(d) . . . . . . . . . . . . . . . . . . . . . . . . . . . . . . . . . . . . . . 0.00% 4/10/47 155 11,770,087 0.1Series GT-F4(d) . . . . . . . . . . . . . . . . . . . . . . . . . . . . . . . . . . . . . . 0.00% 4/10/47 41 2,835,688 0.0Series GT-G1(d) . . . . . . . . . . . . . . . . . . . . . . . . . . . . . . . . . . . . . 0.00% 4/10/47 636 9,442,264 0.1Series GT-G2(d) . . . . . . . . . . . . . . . . . . . . . . . . . . . . . . . . . . . . . 0.00% 4/10/47 386 11,728,320 0.1
133,492,480 0.7

AB FCP I
82
Portfolio of investments (continued) GlobalHighYieldPortfolio
Rate Date Shares/Principal Value Net Assets (-)/(000) (USD) %
COMMON STOCKSBIS Industries Holdings Ltd. (d) . . . . . . . . . . . . . . . . . . . . . . . . . . . 10,224,003 $ 153,360 0.0%CHC Group LLC (d) . . . . . . . . . . . . . . . . . . . . . . . . . . . . . . . . . . . . 637,753 31,888 0.0Exide Technologies (d) . . . . . . . . . . . . . . . . . . . . . . . . . . . . . . . . . . 1,272,880 89,102 0.0Exide Technologies (d) . . . . . . . . . . . . . . . . . . . . . . . . . . . . . . . . . . 419,729 29,381 0.0Ion Media Networks - Class A (d) . . . . . . . . . . . . . . . . . . . . . . . . . . 3,938 1,551,611 0.0K201640219 (South Africa) Ltd. B Shares (d) . . . . . . . . . . . . . . . . 30,622,211 31 0.0Liberty Tire Recycling LLC (d). . . . . . . . . . . . . . . . . . . . . . . . . . . . 55,882 5,821,802 0.0Mt. Logan Re Ltd. (Preference Shares) (d) . . . . . . . . . . . . . . . . . . . 21,937 20,996,333 0.1Mt. Logan Re Ltd. (Preference Shares) (d) . . . . . . . . . . . . . . . . . . . 9,480 9,073,494 0.1Mt. Logan Re Ltd. (Preference Shares) (Series 4) (d) . . . . . . . . . . . 8,156 7,957,480 0.0Neenah Enterprises, Inc. (d). . . . . . . . . . . . . . . . . . . . . . . . . . . . . . . 504,400 1,518,244 0.0Paragon Offshore Ltd. - Class A (d). . . . . . . . . . . . . . . . . . . . . . . . . 218,935 177,994 0.0Paragon Offshore Ltd. - Class B (d) . . . . . . . . . . . . . . . . . . . . . . . . 328,403 11,740,407 0.1Paysafe Group Ltd. (d). . . . . . . . . . . . . . . . . . . . . . . . . . . . . . . . . . . 49,843 3,907,193 0.0Willscot Corp. (d) . . . . . . . . . . . . . . . . . . . . . . . . . . . . . . . . . . . . . . 323,192 3,293,326 0.0 66,341,646 0.3
CORPORATES - INVESTMENT GRADEFINANCIAL INSTITUTIONSBANKING
JPMorgan Chase & Co., Series R(f) . . . . . . . . . . . . . . . . . . . . . . . . 6.00% 8/01/23 USD 15,000 15,456,630 0.1INSURANCE
AIG Life Holdings, Inc. . . . . . . . . . . . . . . . . . . . . . . . . . . . . . . . . . . 8.13% 3/15/46 1,472 1,750,519 0.0Aquarius & Investments PLC for Swiss Reinsurance Co., Ltd. . . . 6.38% 9/01/24 11,142 11,267,347 0.0 13,017,866 0.0 28,474,496 0.1
INDUSTRIALBASIC
Glencore Finance Canada Ltd.. . . . . . . . . . . . . . . . . . . . . . . . . . . . . 6.00% 11/15/41 4,277 4,302,794 0.0Glencore Funding LLC . . . . . . . . . . . . . . . . . . . . . . . . . . . . . . . . . . 4.63% 4/29/24 5,000 5,099,635 0.1 9,402,429 0.1
TECHNOLOGYSeagate HDD Cayman . . . . . . . . . . . . . . . . . . . . . . . . . . . . . . . . . . . 4.88% 6/01/27 21,897 20,413,391 0.1 29,815,820 0.2 58,290,316 0.3
CORPORATES - NON-INVESTMENT GRADEFINANCIAL INSTITUTIONSFINANCE
SLM Corp. . . . . . . . . . . . . . . . . . . . . . . . . . . . . . . . . . . . . . . . . . . . . 5.13% 4/05/22 10,162 9,924,870 0.1OTHER FINANCE
Colfax Corp.. . . . . . . . . . . . . . . . . . . . . . . . . . . . . . . . . . . . . . . . . . . 6.00% 2/15/24 3,182 3,291,814 0.0 13,216,684 0.1
INDUSTRIALBASIC
Momentive Performance Materials, Inc.(d). . . . . . . . . . . . . . . . . . . 8.88% 10/15/20 44,437 0* 0.0Smurfit Kappa Treasury Funding DAC . . . . . . . . . . . . . . . . . . . . . . 7.50% 11/20/25 4,264 4,867,480 0.0 4,867,480 0.0
CAPITAL GOODSSealed Air Corp.. . . . . . . . . . . . . . . . . . . . . . . . . . . . . . . . . . . . . . . . 6.88% 7/15/33 30,184 31,462,594 0.2
COMMUNICATIONS - MEDIARadiate Holdco LLC/Radiate Finance, Inc.. . . . . . . . . . . . . . . . . . . 6.63% 2/15/25 29,134 27,471,410 0.1Ziggo Bond Co. BV . . . . . . . . . . . . . . . . . . . . . . . . . . . . . . . . . . . . . 5.88% 1/15/25 18,624 17,923,738 0.1 45,395,148 0.2
COMMUNICATIONS - TELECOMMUNICATIONST-Mobile USA, Inc. . . . . . . . . . . . . . . . . . . . . . . . . . . . . . . . . . . . . . 6.38% 3/01/25 11,185 11,658,696 0.1
CONSUMER CYCLICAL - OTHERCirsa Finance International SARL. . . . . . . . . . . . . . . . . . . . . . . . . . 7.88% 12/20/23 2,000 2,047,398 0.0
CONSUMER NON-CYCLICALAveta, Inc.(d) . . . . . . . . . . . . . . . . . . . . . . . . . . . . . . . . . . . . . . . . . . 10.50% 3/01/21 184,019 2 0.0Sunshine Mid BV. . . . . . . . . . . . . . . . . . . . . . . . . . . . . . . . . . . . . . . 6.50% 5/15/26 EUR 18,558 20,880,589 0.1Team Health Holdings, Inc. . . . . . . . . . . . . . . . . . . . . . . . . . . . . . . . 6.38% 2/01/25 USD 23,582 18,861,190 0.1 39,741,781 0.2
ENERGYBerry Petroleum Co. LLC(d) . . . . . . . . . . . . . . . . . . . . . . . . . . . . . . 6.38% 9/15/22 42,448 1 0.0Sanchez Energy Corp. . . . . . . . . . . . . . . . . . . . . . . . . . . . . . . . . . . . 7.25% 2/15/23 17,924 15,494,348 0.1SandRidge Energy, Inc.(d) . . . . . . . . . . . . . . . . . . . . . . . . . . . . . . . . 7.50% 2/15/23 12,210 0* 0.0SandRidge Energy, Inc.(d) . . . . . . . . . . . . . . . . . . . . . . . . . . . . . . . . 8.13% 10/15/22 34,739 0* 0.0
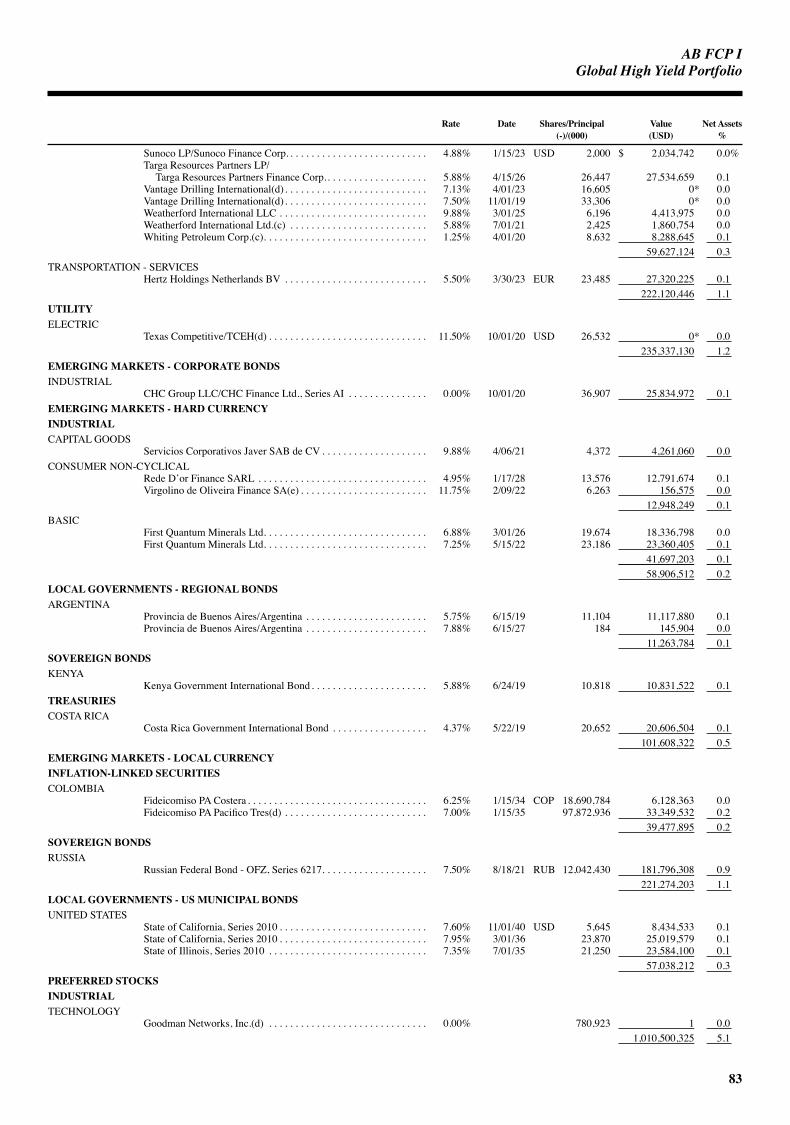
AB FCP I
83
GlobalHighYieldPortfolio
Rate Date Shares/Principal Value Net Assets (-)/(000) (USD) %
Sunoco LP/Sunoco Finance Corp. . . . . . . . . . . . . . . . . . . . . . . . . . . 4.88% 1/15/23 USD 2,000 $ 2,034,742 0.0%Targa Resources Partners LP/
Targa Resources Partners Finance Corp.. . . . . . . . . . . . . . . . . . . 5.88% 4/15/26 26,447 27,534,659 0.1Vantage Drilling International(d). . . . . . . . . . . . . . . . . . . . . . . . . . . 7.13% 4/01/23 16,605 0* 0.0Vantage Drilling International(d). . . . . . . . . . . . . . . . . . . . . . . . . . . 7.50% 11/01/19 33,306 0* 0.0Weatherford International LLC . . . . . . . . . . . . . . . . . . . . . . . . . . . . 9.88% 3/01/25 6,196 4,413,975 0.0Weatherford International Ltd.(c) . . . . . . . . . . . . . . . . . . . . . . . . . . 5.88% 7/01/21 2,425 1,860,754 0.0Whiting Petroleum Corp.(c). . . . . . . . . . . . . . . . . . . . . . . . . . . . . . . 1.25% 4/01/20 8,632 8,288,645 0.1 59,627,124 0.3
TRANSPORTATION - SERVICESHertz Holdings Netherlands BV . . . . . . . . . . . . . . . . . . . . . . . . . . . 5.50% 3/30/23 EUR 23,485 27,320,225 0.1 222,120,446 1.1
UTILITYELECTRIC
Texas Competitive/TCEH(d) . . . . . . . . . . . . . . . . . . . . . . . . . . . . . . 11.50% 10/01/20 USD 26,532 0* 0.0 235,337,130 1.2
EMERGING MARKETS - CORPORATE BONDSINDUSTRIAL
CHC Group LLC/CHC Finance Ltd., Series AI . . . . . . . . . . . . . . . 0.00% 10/01/20 36,907 25,834,972 0.1EMERGING MARKETS - HARD CURRENCYINDUSTRIALCAPITAL GOODS
Servicios Corporativos Javer SAB de CV . . . . . . . . . . . . . . . . . . . . 9.88% 4/06/21 4,372 4,261,060 0.0CONSUMER NON-CYCLICAL
Rede D’or Finance SARL . . . . . . . . . . . . . . . . . . . . . . . . . . . . . . . . 4.95% 1/17/28 13,576 12,791,674 0.1Virgolino de Oliveira Finance SA(e) . . . . . . . . . . . . . . . . . . . . . . . . 11.75% 2/09/22 6,263 156,575 0.0 12,948,249 0.1
BASICFirst Quantum Minerals Ltd. . . . . . . . . . . . . . . . . . . . . . . . . . . . . . . 6.88% 3/01/26 19,674 18,336,798 0.0First Quantum Minerals Ltd. . . . . . . . . . . . . . . . . . . . . . . . . . . . . . . 7.25% 5/15/22 23,186 23,360,405 0.1 41,697,203 0.1 58,906,512 0.2
LOCAL GOVERNMENTS - REGIONAL BONDSARGENTINA
Provincia de Buenos Aires/Argentina . . . . . . . . . . . . . . . . . . . . . . . 5.75% 6/15/19 11,104 11,117,880 0.1Provincia de Buenos Aires/Argentina . . . . . . . . . . . . . . . . . . . . . . . 7.88% 6/15/27 184 145,904 0.0 11,263,784 0.1
SOVEREIGN BONDSKENYA
Kenya Government International Bond . . . . . . . . . . . . . . . . . . . . . . 5.88% 6/24/19 10,818 10,831,522 0.1TREASURIESCOSTA RICA
Costa Rica Government International Bond . . . . . . . . . . . . . . . . . . 4.37% 5/22/19 20,652 20,606,504 0.1 101,608,322 0.5
EMERGING MARKETS - LOCAL CURRENCYINFLATION-LINKED SECURITIESCOLOMBIA
Fideicomiso PA Costera . . . . . . . . . . . . . . . . . . . . . . . . . . . . . . . . . . 6.25% 1/15/34 COP 18,690,784 6,128,363 0.0Fideicomiso PA Pacifico Tres(d) . . . . . . . . . . . . . . . . . . . . . . . . . . . 7.00% 1/15/35 97,872,936 33,349,532 0.2 39,477,895 0.2
SOVEREIGN BONDSRUSSIA
Russian Federal Bond - OFZ, Series 6217. . . . . . . . . . . . . . . . . . . . 7.50% 8/18/21 RUB 12,042,430 181,796,308 0.9 221,274,203 1.1
LOCAL GOVERNMENTS - US MUNICIPAL BONDSUNITED STATES
State of California, Series 2010 . . . . . . . . . . . . . . . . . . . . . . . . . . . . 7.60% 11/01/40 USD 5,645 8,434,533 0.1State of California, Series 2010 . . . . . . . . . . . . . . . . . . . . . . . . . . . . 7.95% 3/01/36 23,870 25,019,579 0.1State of Illinois, Series 2010 . . . . . . . . . . . . . . . . . . . . . . . . . . . . . . 7.35% 7/01/35 21,250 23,584,100 0.1 57,038,212 0.3
PREFERRED STOCKSINDUSTRIALTECHNOLOGY
Goodman Networks, Inc.(d) . . . . . . . . . . . . . . . . . . . . . . . . . . . . . . 0.00% 780,923 1 0.0 1,010,500,325 5.1

AB FCP I
84
Portfolio of investments (continued) GlobalHighYieldPortfolio
Rate Date Value Net Assets (USD) %
Total Investments(cost $19,840,979,365) . . . . . . . . . . . . . . . . . . . . . . . . . . . . . . . . . . $ 18,708,578,326 96.5%
Time DepositsANZ, London(l) . . . . . . . . . . . . . . . . . . . . . . . . . . . . . . . . . . . . . . . . 1.40 % – 39,428 0.0ANZ, London(l) . . . . . . . . . . . . . . . . . . . . . . . . . . . . . . . . . . . . . . . . 1.76 % – 109,889,382 0.6Bank of Nova Scotia, Toronto(l) . . . . . . . . . . . . . . . . . . . . . . . . . . . 1.76 % – 48,966,184 0.3BBH, Grand Cayman(l) . . . . . . . . . . . . . . . . . . . . . . . . . . . . . . . . . . (1.40)% – 3,706 0.0BBH, Grand Cayman(l) . . . . . . . . . . . . . . . . . . . . . . . . . . . . . . . . . . 0.82 % – 5,989 0.0BBH, Grand Cayman(l) . . . . . . . . . . . . . . . . . . . . . . . . . . . . . . . . . . 5.12 % – 16,686,794 0.1DBS Bank Ltd, Singapore(l) . . . . . . . . . . . . . . . . . . . . . . . . . . . . . . 1.76 % – 40,498,032 0.2Deutsche Bank, Frankfurt(l) . . . . . . . . . . . . . . . . . . . . . . . . . . . . . . (0.57) % – 7,011,573 0.0Hong Kong & Shanghai Bank, Singapore(l) . . . . . . . . . . . . . . . . . . 0.67 % – 253,456 0.0HSBC Bank PLC, London(l) . . . . . . . . . . . . . . . . . . . . . . . . . . . . . . 0.36 % – 1,836,183 0.0HSBC Bank PLC, London(l) . . . . . . . . . . . . . . . . . . . . . . . . . . . . . . 5.12 % – 2,177,941 0.0JPMorgan Chase, New York(l) . . . . . . . . . . . . . . . . . . . . . . . . . . . . 1.76 % – 33,093,219 0.2National Australia Bank, London(l). . . . . . . . . . . . . . . . . . . . . . . . . 0.76 % – 5,063,443 0.0SEB, Stockholm(l) . . . . . . . . . . . . . . . . . . . . . . . . . . . . . . . . . . . . . . 1.76 % – 115,976,836 0.6Standard Chartered Bank, London(l). . . . . . . . . . . . . . . . . . . . . . . . 1.76 % – 100,843,005 0.5Standard Chartered Bank, Singapore(l) . . . . . . . . . . . . . . . . . . . . . . 1.76 % – 250,000,000 1.3Sumitomo, London(l). . . . . . . . . . . . . . . . . . . . . . . . . . . . . . . . . . . . 1.76 % – 22,461,970 0.1Sumitomo, Tokyo(l) . . . . . . . . . . . . . . . . . . . . . . . . . . . . . . . . . . . . . 1.76 % – 12,891,182 0.1
Total Time Deposits . . . . . . . . . . . . . . . . . . . . . . . . . . . . . . . . . . . . . . . . . . . . . . . . . . . . . . 767,698,323 4.0Other assets less liabilities . . . . . . . . . . . . . . . . . . . . . . . . . . . . . . . . . . . . . . . . . . . . . . . . . (85,439,046) (0.5)Net Assets . . . . . . . . . . . . . . . . . . . . . . . . . . . . . . . . . . . . . . . . . . . . . . . . . . . . . . . . . . . . . . $ 19,390,837,603 100.0%
FUTURES
Unrealized Number of Appreciation/ Type Expiration Date Contracts Original Value Market Value (Depreciation)
LongU.S. T-Note 10 Yr (CBT) Futures . . . . . . . . . . . . . . . . . . . . . . . . . 6/19/19 20,886 $ 2,559,708,002 $ 2,548,092,000 $ (11,616,002) $ (11,616,002)
FORWARD FOREIGN CURRENCY CONTRACTS Contracts to In Exchange Unrealized Deliver For Settlement Appreciation/ Counterparty (000) (000) Date (Depreciation)
Australia and New Zealand Banking Group Ltd. . . . . . . . . . . . . USD 23,810 CNH 163,889 3/20/19 $ 647,676Bank of America, NA. . . . . . . . . . . . . . . . . . . . . . . . . . . . . . . . . . TRY 483,879 EUR 78,607 3/28/19 231,501Bank of America, NA. . . . . . . . . . . . . . . . . . . . . . . . . . . . . . . . . . EUR 17,000 USD 19,665 4/10/19 265,828Barclays Bank PLC . . . . . . . . . . . . . . . . . . . . . . . . . . . . . . . . . . . USD 338,152 BRL 1,261,306 3/06/19 (2,403,971)Barclays Bank PLC . . . . . . . . . . . . . . . . . . . . . . . . . . . . . . . . . . . USD 55,000 TWD 1,686,186 3/14/19 (275,267)Barclays Bank PLC . . . . . . . . . . . . . . . . . . . . . . . . . . . . . . . . . . . INR 7,326,606 USD 102,641 3/18/19 (610,622)Barclays Bank PLC . . . . . . . . . . . . . . . . . . . . . . . . . . . . . . . . . . . BRL 1,261,306 USD 337,460 4/02/19 2,390,615Barclays Bank PLC . . . . . . . . . . . . . . . . . . . . . . . . . . . . . . . . . . . ILS 688,872 USD 188,343 4/16/19 (2,261,684)Barclays Bank PLC . . . . . . . . . . . . . . . . . . . . . . . . . . . . . . . . . . . IDR 7,315,826,576 USD 506,936 5/09/19 (5,128,552)BNP Paribas SA. . . . . . . . . . . . . . . . . . . . . . . . . . . . . . . . . . . . . . COP 115,194,373 USD 37,095 3/15/19 (268,375)BNP Paribas SA. . . . . . . . . . . . . . . . . . . . . . . . . . . . . . . . . . . . . . TRY 83,586 USD 15,485 3/28/19 48,154BNP Paribas SA. . . . . . . . . . . . . . . . . . . . . . . . . . . . . . . . . . . . . . USD 181,636 TRY 1,005,445 3/28/19 4,058,368BNP Paribas SA. . . . . . . . . . . . . . . . . . . . . . . . . . . . . . . . . . . . . . ZAR 4,880,469 USD 353,094 4/17/19 8,685,348Brown Brothers Harriman & Co.. . . . . . . . . . . . . . . . . . . . . . . . . USD 2,958 EUR 2,606 4/10/19 16,063Brown Brothers Harriman & Co.. . . . . . . . . . . . . . . . . . . . . . . . . AUD 924 USD 660 4/23/19 3,849Brown Brothers Harriman & Co.. . . . . . . . . . . . . . . . . . . . . . . . . NZD 109 USD 74 4/26/19 344Brown Brothers Harriman & Co.+. . . . . . . . . . . . . . . . . . . . . . . . USD 948,098 AUD 1,325,270 3/06/19 (7,975,765)Brown Brothers Harriman & Co.+. . . . . . . . . . . . . . . . . . . . . . . . USD 107,973 CAD 142,882 3/06/19 608,982Brown Brothers Harriman & Co.+. . . . . . . . . . . . . . . . . . . . . . . . USD 644 CHF 644 3/06/19 1,827Brown Brothers Harriman & Co.+. . . . . . . . . . . . . . . . . . . . . . . . USD 27,934 CNH 189,309 3/06/19 342,237Brown Brothers Harriman & Co.+. . . . . . . . . . . . . . . . . . . . . . . . USD 128,572 EUR 113,137 3/06/19 137,470Brown Brothers Harriman & Co.+. . . . . . . . . . . . . . . . . . . . . . . . USD 142,485 GBP 108,154 3/06/19 979,810Brown Brothers Harriman & Co.+. . . . . . . . . . . . . . . . . . . . . . . . USD 104,906 NZD 152,415 3/06/19 (1,107,489)Brown Brothers Harriman & Co.+. . . . . . . . . . . . . . . . . . . . . . . . USD 385,638 ZAR 5,343,247 3/06/19 (6,603,741)Brown Brothers Harriman & Co.+. . . . . . . . . . . . . . . . . . . . . . . . USD 989,370 AUD 1,382,962 3/14/19 (8,170,531)Brown Brothers Harriman & Co.+. . . . . . . . . . . . . . . . . . . . . . . . USD 197,987 SGD 267,084 3/14/19 (409,496)Brown Brothers Harriman & Co.+. . . . . . . . . . . . . . . . . . . . . . . . USD 653,783 ZAR 9,058,497 3/14/19 (11,813,573)Brown Brothers Harriman & Co.+. . . . . . . . . . . . . . . . . . . . . . . . USD 953,196 AUD 1,332,396 3/22/19 (7,746,492)Brown Brothers Harriman & Co.+. . . . . . . . . . . . . . . . . . . . . . . . USD 29,449 CNH 197,920 3/22/19 113,065Brown Brothers Harriman & Co.+. . . . . . . . . . . . . . . . . . . . . . . . USD 114,701 EUR 100,932 3/22/19 280,827Brown Brothers Harriman & Co.+. . . . . . . . . . . . . . . . . . . . . . . . USD 193,176 SGD 260,594 3/22/19 (372,170)Brown Brothers Harriman & Co.+. . . . . . . . . . . . . . . . . . . . . . . . USD 554,900 ZAR 7,688,563 3/22/19 (10,569,433)Citibank, NA . . . . . . . . . . . . . . . . . . . . . . . . . . . . . . . . . . . . . . . . CLP 99,250 USD 148 3/15/19 (2,893)
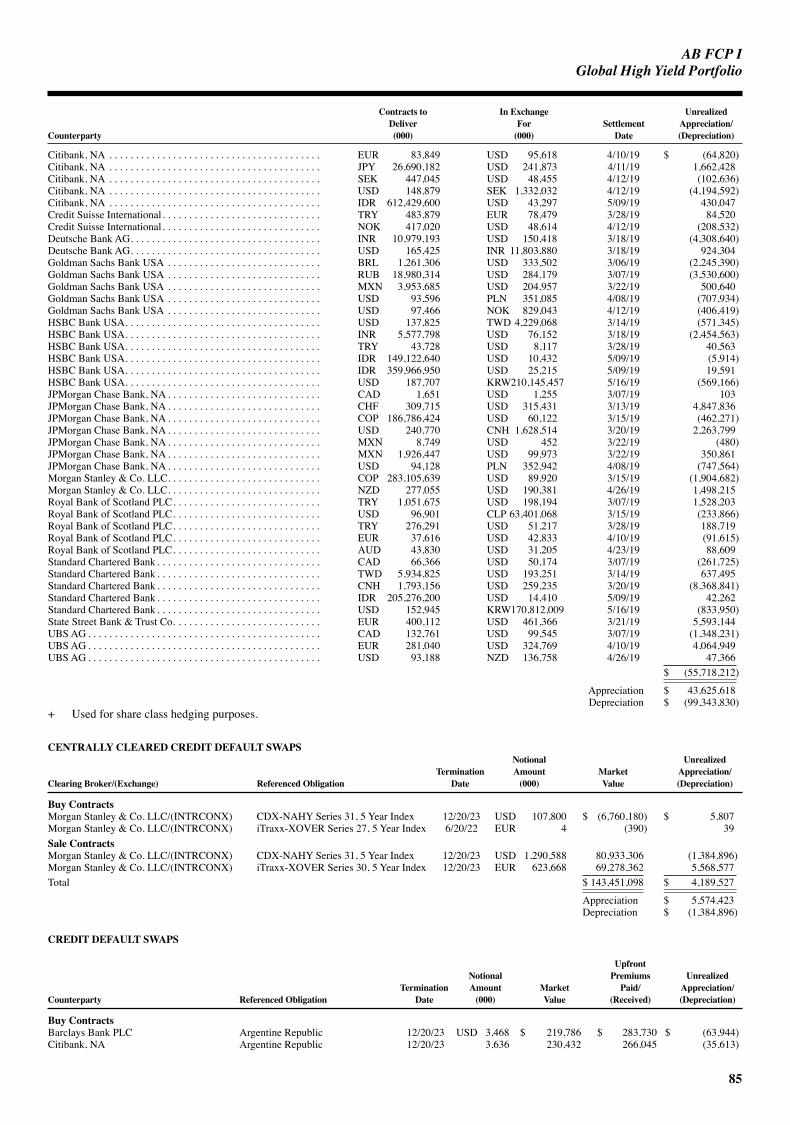
AB FCP I
85
GlobalHighYieldPortfolio
Contracts to In Exchange Unrealized Deliver For Settlement Appreciation/ Counterparty (000) (000) Date (Depreciation)
Citibank, NA . . . . . . . . . . . . . . . . . . . . . . . . . . . . . . . . . . . . . . . . EUR 83,849 USD 95,618 4/10/19 $ (64,820)Citibank, NA . . . . . . . . . . . . . . . . . . . . . . . . . . . . . . . . . . . . . . . . JPY 26,690,182 USD 241,873 4/11/19 1,662,428Citibank, NA . . . . . . . . . . . . . . . . . . . . . . . . . . . . . . . . . . . . . . . . SEK 447,045 USD 48,455 4/12/19 (102,636)Citibank, NA . . . . . . . . . . . . . . . . . . . . . . . . . . . . . . . . . . . . . . . . USD 148,879 SEK 1,332,032 4/12/19 (4,194,592)Citibank, NA . . . . . . . . . . . . . . . . . . . . . . . . . . . . . . . . . . . . . . . . IDR 612,429,600 USD 43,297 5/09/19 430,047Credit Suisse International. . . . . . . . . . . . . . . . . . . . . . . . . . . . . . TRY 483,879 EUR 78,479 3/28/19 84,520Credit Suisse International. . . . . . . . . . . . . . . . . . . . . . . . . . . . . . NOK 417,020 USD 48,614 4/12/19 (208,532)Deutsche Bank AG. . . . . . . . . . . . . . . . . . . . . . . . . . . . . . . . . . . . INR 10,979,193 USD 150,418 3/18/19 (4,308,640)Deutsche Bank AG. . . . . . . . . . . . . . . . . . . . . . . . . . . . . . . . . . . . USD 165,425 INR 11,803,880 3/18/19 924,304Goldman Sachs Bank USA . . . . . . . . . . . . . . . . . . . . . . . . . . . . . BRL 1,261,306 USD 333,502 3/06/19 (2,245,390)Goldman Sachs Bank USA . . . . . . . . . . . . . . . . . . . . . . . . . . . . . RUB 18,980,314 USD 284,179 3/07/19 (3,530,600)Goldman Sachs Bank USA . . . . . . . . . . . . . . . . . . . . . . . . . . . . . MXN 3,953,685 USD 204,957 3/22/19 500,640Goldman Sachs Bank USA . . . . . . . . . . . . . . . . . . . . . . . . . . . . . USD 93,596 PLN 351,085 4/08/19 (707,934)Goldman Sachs Bank USA . . . . . . . . . . . . . . . . . . . . . . . . . . . . . USD 97,466 NOK 829,043 4/12/19 (406,419)HSBC Bank USA. . . . . . . . . . . . . . . . . . . . . . . . . . . . . . . . . . . . . USD 137,825 TWD 4,229,068 3/14/19 (571,345)HSBC Bank USA. . . . . . . . . . . . . . . . . . . . . . . . . . . . . . . . . . . . . INR 5,577,798 USD 76,152 3/18/19 (2,454,563)HSBC Bank USA. . . . . . . . . . . . . . . . . . . . . . . . . . . . . . . . . . . . . TRY 43,728 USD 8,117 3/28/19 40,563HSBC Bank USA. . . . . . . . . . . . . . . . . . . . . . . . . . . . . . . . . . . . . IDR 149,122,640 USD 10,432 5/09/19 (5,914)HSBC Bank USA. . . . . . . . . . . . . . . . . . . . . . . . . . . . . . . . . . . . . IDR 359,966,950 USD 25,215 5/09/19 19,591HSBC Bank USA. . . . . . . . . . . . . . . . . . . . . . . . . . . . . . . . . . . . . USD 187,707 KRW 210,145,457 5/16/19 (569,166)JPMorgan Chase Bank, NA . . . . . . . . . . . . . . . . . . . . . . . . . . . . . CAD 1,651 USD 1,255 3/07/19 103JPMorgan Chase Bank, NA . . . . . . . . . . . . . . . . . . . . . . . . . . . . . CHF 309,715 USD 315,431 3/13/19 4,847,836JPMorgan Chase Bank, NA . . . . . . . . . . . . . . . . . . . . . . . . . . . . . COP 186,786,424 USD 60,122 3/15/19 (462,271)JPMorgan Chase Bank, NA . . . . . . . . . . . . . . . . . . . . . . . . . . . . . USD 240,770 CNH 1,628,514 3/20/19 2,263,799JPMorgan Chase Bank, NA . . . . . . . . . . . . . . . . . . . . . . . . . . . . . MXN 8,749 USD 452 3/22/19 (480)JPMorgan Chase Bank, NA . . . . . . . . . . . . . . . . . . . . . . . . . . . . . MXN 1,926,447 USD 99,973 3/22/19 350,861JPMorgan Chase Bank, NA . . . . . . . . . . . . . . . . . . . . . . . . . . . . . USD 94,128 PLN 352,942 4/08/19 (747,564)Morgan Stanley & Co. LLC. . . . . . . . . . . . . . . . . . . . . . . . . . . . . COP 283,105,639 USD 89,920 3/15/19 (1,904,682)Morgan Stanley & Co. LLC. . . . . . . . . . . . . . . . . . . . . . . . . . . . . NZD 277,055 USD 190,381 4/26/19 1,498,215Royal Bank of Scotland PLC. . . . . . . . . . . . . . . . . . . . . . . . . . . . TRY 1,051,675 USD 198,194 3/07/19 1,528,203Royal Bank of Scotland PLC. . . . . . . . . . . . . . . . . . . . . . . . . . . . USD 96,901 CLP 63,401,068 3/15/19 (233,866)Royal Bank of Scotland PLC. . . . . . . . . . . . . . . . . . . . . . . . . . . . TRY 276,291 USD 51,217 3/28/19 188,719Royal Bank of Scotland PLC. . . . . . . . . . . . . . . . . . . . . . . . . . . . EUR 37,616 USD 42,833 4/10/19 (91,615)Royal Bank of Scotland PLC. . . . . . . . . . . . . . . . . . . . . . . . . . . . AUD 43,830 USD 31,205 4/23/19 88,609Standard Chartered Bank . . . . . . . . . . . . . . . . . . . . . . . . . . . . . . . CAD 66,366 USD 50,174 3/07/19 (261,725)Standard Chartered Bank . . . . . . . . . . . . . . . . . . . . . . . . . . . . . . . TWD 5,934,825 USD 193,251 3/14/19 637,495Standard Chartered Bank . . . . . . . . . . . . . . . . . . . . . . . . . . . . . . . CNH 1,793,156 USD 259,235 3/20/19 (8,368,841)Standard Chartered Bank . . . . . . . . . . . . . . . . . . . . . . . . . . . . . . . IDR 205,276,200 USD 14,410 5/09/19 42,262Standard Chartered Bank . . . . . . . . . . . . . . . . . . . . . . . . . . . . . . . USD 152,945 KRW 170,812,009 5/16/19 (833,950)State Street Bank & Trust Co. . . . . . . . . . . . . . . . . . . . . . . . . . . . EUR 400,112 USD 461,366 3/21/19 5,593,144UBS AG . . . . . . . . . . . . . . . . . . . . . . . . . . . . . . . . . . . . . . . . . . . . CAD 132,761 USD 99,545 3/07/19 (1,348,231)UBS AG . . . . . . . . . . . . . . . . . . . . . . . . . . . . . . . . . . . . . . . . . . . . EUR 281,040 USD 324,769 4/10/19 4,064,949UBS AG . . . . . . . . . . . . . . . . . . . . . . . . . . . . . . . . . . . . . . . . . . . . USD 93,188 NZD 136,758 4/26/19 47,366
$ (55,718,212)
Appreciation $ 43,625,618 Depreciation $ (99,343,830)
+ Used for share class hedging purposes.
CENTRALLY CLEARED CREDIT DEFAULT SWAPS Notional Unrealized Termination Amount Market Appreciation/ Clearing Broker/(Exchange) Referenced Obligation Date (000) Value (Depreciation)
Buy ContractsMorgan Stanley & Co. LLC/(INTRCONX) CDX-NAHY Series 31, 5 Year Index 12/20/23 USD 107,800 $ (6,760,180) $ 5,807Morgan Stanley & Co. LLC/(INTRCONX) iTraxx-XOVER Series 27, 5 Year Index 6/20/22 EUR 4 (390) 39Sale ContractsMorgan Stanley & Co. LLC/(INTRCONX) CDX-NAHY Series 31, 5 Year Index 12/20/23 USD 1,290,588 80,933,306 (1,384,896)Morgan Stanley & Co. LLC/(INTRCONX) iTraxx-XOVER Series 30, 5 Year Index 12/20/23 EUR 623,668 69,278,362 5,568,577Total $ 143,451,098 $ 4,189,527
Appreciation $ 5,574,423 Depreciation $ (1,384,896)
CREDIT DEFAULT SWAPS
Upfront Notional Premiums Unrealized Termination Amount Market Paid/ Appreciation/ Counterparty Referenced Obligation Date (000) Value (Received) (Depreciation)
Buy ContractsBarclays Bank PLC Argentine Republic 12/20/23 USD 3,468 $ 219,786 $ 283,730 $ (63,944)Citibank, NA Argentine Republic 12/20/23 3,636 230,432 266,045 (35,613)

AB FCP I
86
Portfolio of investments (continued) GlobalHighYieldPortfolio
Upfront Notional Premiums Unrealized Termination Amount Market Paid/ Appreciation/ Counterparty Referenced Obligation Date (000) Value (Received) (Depreciation)
Citibank, NA Argentine Republic 12/20/23 USD 5,457 $ 345,840 $ 468,580 $ (122,740)Morgan Stanley & Co. International PLC Argentine Republic 12/20/23 6,902 437,417 516,865 (79,448)Morgan Stanley & Co. International PLC Argentine Republic 12/20/23 3,420 216,744 238,563 (21,819)Morgan Stanley & Co. International PLC Argentine Republic 12/20/23 3,950 250,333 223,104 27,229Morgan Stanley & Co. International PLC Argentine Republic 12/20/23 3,420 216,744 250,365 (33,621)Morgan Stanley & Co. International PLC Argentine Republic 12/20/23 3,420 216,744 250,365 (33,621)Morgan Stanley & Co. International PLC Argentine Republic 12/20/23 6,954 440,712 617,190 (176,478)Sale ContractsBank of America, NA United States Steel Corp. 9/20/19 14,800 391,270 75,731 315,539Barclays Bank PLC Federative Republic of Brazil 6/20/23 29,296 (473,850) (948,822) 474,972Barclays Bank PLC Federative Republic of Brazil 6/20/23 39,434 (637,826) (1,277,751) 639,925Citibank, NA Republic of Turkey 12/20/23 93,160 (7,919,527) (10,158,080) 2,238,553Citigroup Global Markets, Inc. CDX-CMBX.NA.BB Series 6 5/11/63 5,000 (1,164,000) (80,372) (1,083,628)Citigroup Global Markets, Inc. CDX-CMBX.NA.BB Series 6 5/11/63 2,500 (582,000) (336,638) (245,362)Citigroup Global Markets, Inc. CDX-CMBX.NA.BB Series 6 5/11/63 25,000 (5,820,000) (5,764,931) (55,069)Citigroup Global Markets, Inc. CDX-CMBX.NA.BB Series 6 5/11/63 10,000 (2,328,000) 89,189 (2,417,189)Citigroup Global Markets, Inc. CDX-CMBX.NA.BBB- Series 6 5/11/63 7,259 (881,243) (830,917) (50,326)Citigroup Global Markets, Inc. CDX-CMBX.NA.BBB- Series 6 5/11/63 1,200 (145,680) (141,366) (4,314)Citigroup Global Markets, Inc. CDX-CMBX.NA.BBB- Series 6 5/11/63 5,000 (607,000) (676,409) 69,409Citigroup Global Markets, Inc. CDX-CMBX.NA.BBB- Series 6 5/11/63 1,650 (200,310) (239,173) 38,863Credit Suisse International CDX-CMBX.NA.BB Series 6 5/11/63 214,242 (49,875,538) (52,433,646) 2,558,108Credit Suisse International CDX-CMBX.NA.BB Series 6 5/11/63 10,000 (2,328,000) (2,336,742) 8,742Credit Suisse International CDX-CMBX.NA.BBB- Series 6 5/11/63 19,562 (2,374,827) (2,108,362) (266,465)Credit Suisse International CDX-CMBX.NA.BBB- Series 6 5/11/63 3,600 (437,040) (409,568) (27,472)Credit Suisse International CDX-CMBX.NA.BBB- Series 6 5/11/63 119,200 (14,470,880) (12,005,447) (2,465,433)Deutsche Bank AG CDX-CMBX.NA.BBB- Series 6 5/11/63 6,066 (736,412) (724,429) (11,983)Deutsche Bank AG CDX-CMBX.NA.BBB- Series 6 5/11/63 3,000 (364,200) (322,155) (42,045)Deutsche Bank AG CDX-CMBX.NA.BBB- Series 6 5/11/63 4,124 (500,654) (466,386) (34,268)Deutsche Bank AG CDX-CMBX.NA.BBB- Series 6 5/11/63 3,000 (364,200) (320,046) (44,154)Deutsche Bank AG CDX-CMBX.NA.BBB- Series 6 5/11/63 10,000 (1,214,000) (1,264,033) 50,033Goldman Sachs International CDX-CMBX.NA.BB Series 6 5/11/63 304,220 (70,822,416) (60,937,033) (9,885,383)Goldman Sachs International CDX-CMBX.NA.BB Series 6 5/11/63 95,528 (22,238,918) (20,112,312) (2,126,606)Goldman Sachs International CDX-CMBX.NA.BBB- Series 6 5/11/63 17,348 (2,106,047) (1,906,924) (199,123)Goldman Sachs International CDX-CMBX.NA.BBB- Series 6 5/11/63 8,491 (1,030,807) (927,146) (103,661)Goldman Sachs International CDX-CMBX.NA.BBB- Series 6 5/11/63 2,123 (257,732) (233,494) (24,238)Goldman Sachs International CDX-CMBX.NA.BBB- Series 6 5/11/63 5,000 (607,000) (527,951) (79,049)Goldman Sachs International CDX-CMBX.NA.BBB- Series 6 5/11/63 87,751 (10,652,971) (13,875,411) 3,222,440Goldman Sachs International CDX-CMBX.NA.BBB- Series 6 5/11/63 15,000 (1,821,000) (2,201,334) 380,334Goldman Sachs International CDX-CMBX.NA.BBB- Series 6 5/11/63 32 (3,885) (4,639) 754Goldman Sachs International CDX-CMBX.NA.BBB- Series 6 5/11/63 25,000 (3,035,000) (3,622,572) 587,572HSBC Bank USA Republic of Turkey 12/20/23 14,678 (1,247,778) (1,579,541) 331,763HSBC Bank USA Republic of Turkey 12/20/23 14,678 (1,247,778) (1,595,570) 347,792JP Morgan Securities, LLC CDX-CMBX.NA.BBB- Series 6 5/11/63 5,000 (607,000) (551,989) (55,011)JP Morgan Securities, LLC CDX-CMBX.NA.BBB- Series 6 5/11/63 4,862 (590,247) (521,770) (68,477)JP Morgan Securities, LLC CDX-CMBX.NA.BBB- Series 6 5/11/63 10,000 (1,214,000) (1,097,873) (116,127)JP Morgan Securities, LLC CDX-CMBX.NA.BBB- Series 6 5/11/63 50,000 (6,070,000) (7,405,930) 1,335,930JP Morgan Securities, LLC CDX-CMBX.NA.BBB- Series 6 5/11/63 10,000 (1,214,000) (1,463,955) 249,955JP Morgan Securities, LLC CDX-CMBX.NA.BBB- Series 6 5/11/63 15,000 (1,821,000) (2,171,699) 350,699JP Morgan Securities, LLC CDX-CMBX.NA.BBB- Series 6 5/11/63 5,000 (607,000) (723,900) 116,900JP Morgan Securities, LLC CDX-CMBX.NA.BBB- Series 6 5/11/63 20,000 (2,428,000) (2,971,549) 543,549JP Morgan Securities, LLC CDX-CMBX.NA.BBB- Series 6 5/11/63 25,000 (3,035,000) (3,912,264) 877,264JP Morgan Securities, LLC CDX-CMBX.NA.BBB- Series 6 5/11/63 10,000 (1,214,000) (1,564,905) 350,905JP Morgan Securities, LLC CDX-CMBX.NA.BBB- Series 6 5/11/63 15,000 (1,821,000) (2,352,597) 531,597JPMorgan Chase Bank, NA Republic of Turkey 12/20/23 5,871 (499,093) (642,444) 143,351JPMorgan Chase Bank, NA Republic of Turkey 12/20/23 12,104 (1,028,962) (1,307,831) 278,869JPMorgan Chase Bank, NA Republic of Turkey 12/20/23 1,109 (94,276) (119,827) 25,551JPMorgan Chase Bank, NA Republic of Turkey 12/20/23 24,208 (2,057,927) (2,637,215) 579,288JPMorgan Chase Bank, NA Republic of Turkey 12/20/23 14,623 (1,243,101) (1,585,331) 342,230JPMorgan Chase Bank, NA Republic of Turkey 12/20/23 12,104 (1,028,962) (1,422,569) 393,607JPMorgan Chase Bank, NA Republic of Turkey 12/20/23 1,108 (94,192) (130,222) 36,030JPMorgan Chase Bank, NA Republic of Turkey 12/20/23 2,217 (188,467) (241,520) 53,053JPMorgan Chase Bank, NA Republic of Turkey 12/20/23 24,208 (2,057,926) (2,616,464) 558,538JPMorgan Chase Bank, NA Republic of Turkey 12/20/23 2,218 (188,553) (239,728) 51,175JPMorgan Chase Bank, NA Republic of Turkey 12/20/23 14,623 (1,243,101) (1,585,331) 342,230JPMorgan Chase Bank, NA Republic of Turkey 12/20/23 8,807 (748,683) (1,020,656) 271,973JPMorgan Chase Bank, NA Republic of Turkey 12/20/23 5,871 (499,093) (680,399) 181,306JPMorgan Chase Bank, NA Republic of Turkey 12/20/23 5,871 (499,093) (646,919) 147,826JPMorgan Chase Bank, NA Republic of Turkey 12/20/23 5,871 (499,095) (682,491) 183,396Morgan Stanley & Co. International PLC CDX-CMBX.NA.BB Series 6 5/11/63 5,000 (1,164,000) (486,189) (677,811)Morgan Stanley & Co. International PLC CDX-CMBX.NA.BBB- Series 6 5/11/63 1,300 (157,820) (178,107) 20,287Morgan Stanley & Co. International PLC CDX-CMBX.NA.BBB- Series 6 5/11/63 11,552 (1,402,413) (1,224,297) (178,116)Morgan Stanley & Co. International PLC CDX-CMBX.NA.BBB- Series 6 5/11/63 10,000 (1,214,000) (1,452,348) 238,348Morgan Stanley & Co. International PLC CDX-CMBX.NA.BBB- Series 6 5/11/63 25,000 (3,035,000) (3,520,821) 485,821
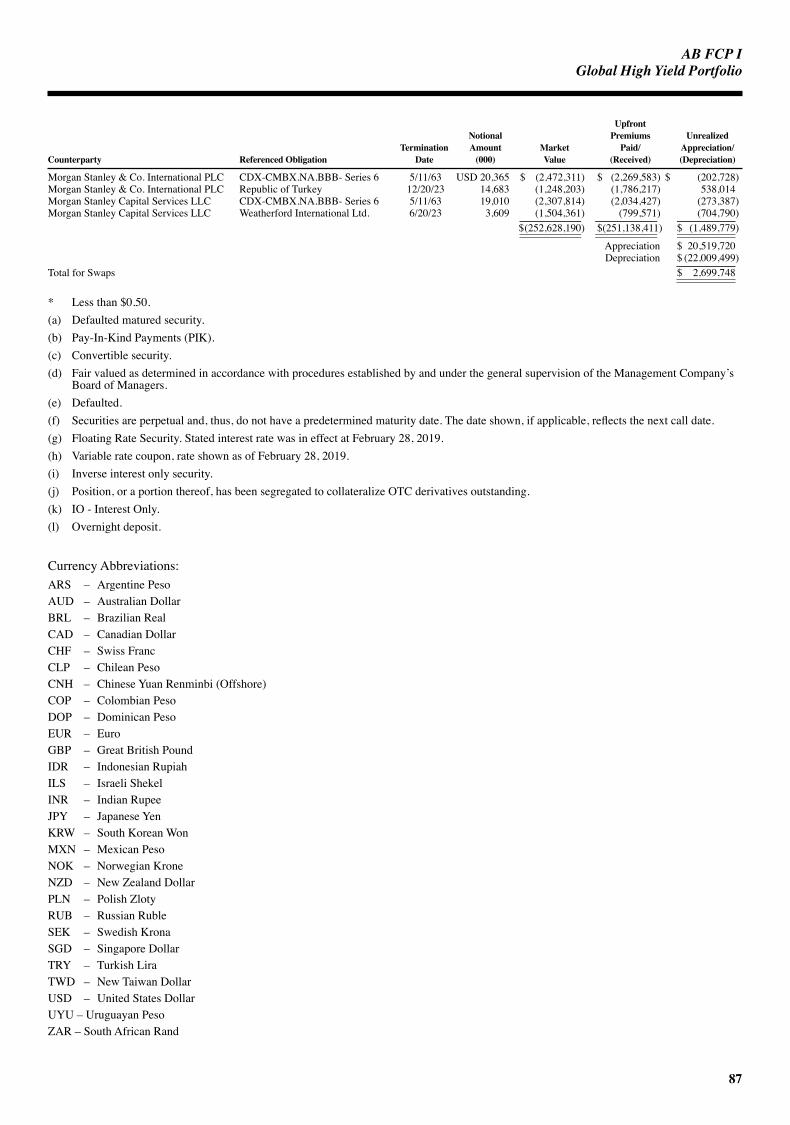
AB FCP I
87
GlobalHighYieldPortfolio
Upfront Notional Premiums Unrealized Termination Amount Market Paid/ Appreciation/ Counterparty Referenced Obligation Date (000) Value (Received) (Depreciation)
Morgan Stanley & Co. International PLC CDX-CMBX.NA.BBB- Series 6 5/11/63 USD 20,365 $ (2,472,311) $ (2,269,583) $ (202,728)Morgan Stanley & Co. International PLC Republic of Turkey 12/20/23 14,683 (1,248,203) (1,786,217) 538,014Morgan Stanley Capital Services LLC CDX-CMBX.NA.BBB- Series 6 5/11/63 19,010 (2,307,814) (2,034,427) (273,387)Morgan Stanley Capital Services LLC Weatherford International Ltd. 6/20/23 3,609 (1,504,361) (799,571) (704,790) $ (252,628,190) $ (251,138,411) $ (1,489,779)
Appreciation $ 20,519,720 Depreciation $ (22,009,499)
Total for Swaps $ 2,699,748
* Less than $0.50.(a) Defaulted matured security.(b) Pay-In-Kind Payments (PIK).(c) Convertible security.(d) Fair valued as determined in accordance with procedures established by and under the general supervision of the Management Company’s
Board of Managers.(e) Defaulted.(f) Securities are perpetual and, thus, do not have a predetermined maturity date. The date shown, if applicable, reflects the next call date.(g) Floating Rate Security. Stated interest rate was in effect at February 28, 2019.(h) Variable rate coupon, rate shown as of February 28, 2019.(i) Inverse interest only security.(j) Position, or a portion thereof, has been segregated to collateralize OTC derivatives outstanding. (k) IO - Interest Only.(l) Overnight deposit.
Currency Abbreviations:ARS – Argentine PesoAUD – Australian DollarBRL – Brazilian RealCAD – Canadian DollarCHF – Swiss FrancCLP – Chilean PesoCNH – Chinese Yuan Renminbi (Offshore)COP – Colombian PesoDOP – Dominican PesoEUR – EuroGBP – Great British PoundIDR – Indonesian RupiahILS – Israeli ShekelINR – Indian RupeeJPY – Japanese YenKRW – South Korean WonMXN – Mexican PesoNOK – Norwegian KroneNZD – New Zealand DollarPLN – Polish ZlotyRUB – Russian RubleSEK – Swedish KronaSGD – Singapore DollarTRY – Turkish LiraTWD – New Taiwan DollarUSD – United States DollarUYU – Uruguayan PesoZAR – South African Rand

AB FCP I
88
Portfolio of investments (continued) GlobalHighYieldPortfolio
Glossary:ABS – Asset-Backed SecuritiesCBT – Chicago Board of TradeCDX-CMBX.NA – North American Commercial Mortgage-Backed IndexCDX-NAHY – North American High Yield Credit Default Swap IndexCMBS – Commercial Mortgage-Backed SecuritiesINTRCONX – Inter-Continental ExchangeJSC – Joint Stock CompanyREIT – Real Estate Investment TrustREMICs – Real Estate Mortgage Investment Conduits
See notes to financial statements.
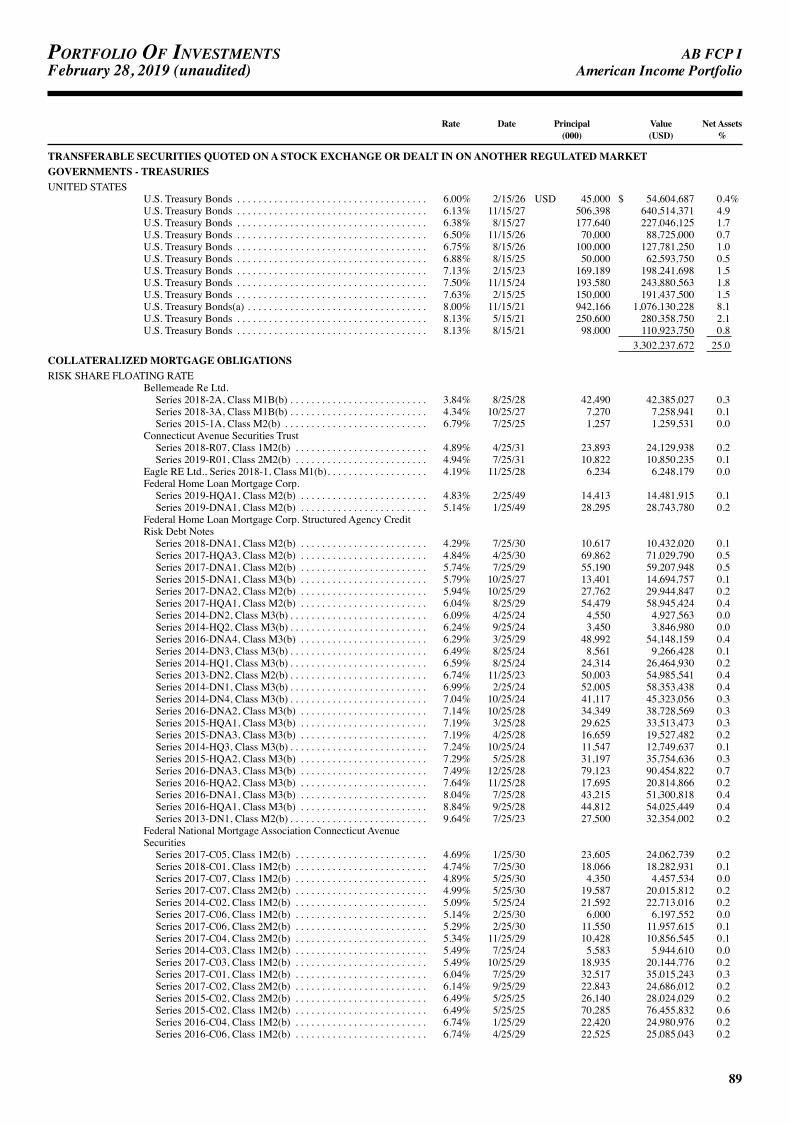
AB FCP I
89
Portfolio of investmentsFebruary 28, 2019 (unaudited) AmericanIncomePortfolio
Rate Date Principal Value Net Assets (000) (USD) %
TRANSFERABLE SECURITIES QUOTED ON A STOCK EXCHANGE OR DEALT IN ON ANOTHER REGULATED MARKETGOVERNMENTS - TREASURIESUNITED STATES
U.S. Treasury Bonds . . . . . . . . . . . . . . . . . . . . . . . . . . . . . . . . . . . . 6.00% 2/15/26 USD 45,000 $ 54,604,687 0.4%U.S. Treasury Bonds . . . . . . . . . . . . . . . . . . . . . . . . . . . . . . . . . . . . 6.13% 11/15/27 506,398 640,514,371 4.9U.S. Treasury Bonds . . . . . . . . . . . . . . . . . . . . . . . . . . . . . . . . . . . . 6.38% 8/15/27 177,640 227,046,125 1.7U.S. Treasury Bonds . . . . . . . . . . . . . . . . . . . . . . . . . . . . . . . . . . . . 6.50% 11/15/26 70,000 88,725,000 0.7U.S. Treasury Bonds . . . . . . . . . . . . . . . . . . . . . . . . . . . . . . . . . . . . 6.75% 8/15/26 100,000 127,781,250 1.0U.S. Treasury Bonds . . . . . . . . . . . . . . . . . . . . . . . . . . . . . . . . . . . . 6.88% 8/15/25 50,000 62,593,750 0.5U.S. Treasury Bonds . . . . . . . . . . . . . . . . . . . . . . . . . . . . . . . . . . . . 7.13% 2/15/23 169,189 198,241,698 1.5U.S. Treasury Bonds . . . . . . . . . . . . . . . . . . . . . . . . . . . . . . . . . . . . 7.50% 11/15/24 193,580 243,880,563 1.8U.S. Treasury Bonds . . . . . . . . . . . . . . . . . . . . . . . . . . . . . . . . . . . . 7.63% 2/15/25 150,000 191,437,500 1.5U.S. Treasury Bonds(a) . . . . . . . . . . . . . . . . . . . . . . . . . . . . . . . . . . 8.00% 11/15/21 942,166 1,076,130,228 8.1U.S. Treasury Bonds . . . . . . . . . . . . . . . . . . . . . . . . . . . . . . . . . . . . 8.13% 5/15/21 250,600 280,358,750 2.1U.S. Treasury Bonds . . . . . . . . . . . . . . . . . . . . . . . . . . . . . . . . . . . . 8.13% 8/15/21 98,000 110,923,750 0.8 3,302,237,672 25.0
COLLATERALIZED MORTGAGE OBLIGATIONSRISK SHARE FLOATING RATE
Bellemeade Re Ltd.Series 2018-2A, Class M1B(b) . . . . . . . . . . . . . . . . . . . . . . . . . . 3.84% 8/25/28 42,490 42,385,027 0.3Series 2018-3A, Class M1B(b) . . . . . . . . . . . . . . . . . . . . . . . . . . 4.34% 10/25/27 7,270 7,258,941 0.1Series 2015-1A, Class M2(b) . . . . . . . . . . . . . . . . . . . . . . . . . . . 6.79% 7/25/25 1,257 1,259,531 0.0
Connecticut Avenue Securities TrustSeries 2018-R07, Class 1M2(b) . . . . . . . . . . . . . . . . . . . . . . . . . 4.89% 4/25/31 23,893 24,129,938 0.2Series 2019-R01, Class 2M2(b) . . . . . . . . . . . . . . . . . . . . . . . . . 4.94% 7/25/31 10,822 10,850,235 0.1
Eagle RE Ltd., Series 2018-1, Class M1(b). . . . . . . . . . . . . . . . . . . 4.19% 11/25/28 6,234 6,248,179 0.0Federal Home Loan Mortgage Corp.
Series 2019-HQA1, Class M2(b) . . . . . . . . . . . . . . . . . . . . . . . . 4.83% 2/25/49 14,413 14,481,915 0.1Series 2019-DNA1, Class M2(b) . . . . . . . . . . . . . . . . . . . . . . . . 5.14% 1/25/49 28,295 28,743,780 0.2
Federal Home Loan Mortgage Corp. Structured Agency Credit Risk Debt Notes
Series 2018-DNA1, Class M2(b) . . . . . . . . . . . . . . . . . . . . . . . . 4.29% 7/25/30 10,617 10,432,020 0.1Series 2017-HQA3, Class M2(b) . . . . . . . . . . . . . . . . . . . . . . . . 4.84% 4/25/30 69,862 71,029,790 0.5Series 2017-DNA1, Class M2(b) . . . . . . . . . . . . . . . . . . . . . . . . 5.74% 7/25/29 55,190 59,207,948 0.5Series 2015-DNA1, Class M3(b) . . . . . . . . . . . . . . . . . . . . . . . . 5.79% 10/25/27 13,401 14,694,757 0.1Series 2017-DNA2, Class M2(b) . . . . . . . . . . . . . . . . . . . . . . . . 5.94% 10/25/29 27,762 29,944,847 0.2Series 2017-HQA1, Class M2(b) . . . . . . . . . . . . . . . . . . . . . . . . 6.04% 8/25/29 54,479 58,945,424 0.4Series 2014-DN2, Class M3(b) . . . . . . . . . . . . . . . . . . . . . . . . . . 6.09% 4/25/24 4,550 4,927,563 0.0Series 2014-HQ2, Class M3(b) . . . . . . . . . . . . . . . . . . . . . . . . . . 6.24% 9/25/24 3,450 3,846,980 0.0Series 2016-DNA4, Class M3(b) . . . . . . . . . . . . . . . . . . . . . . . . 6.29% 3/25/29 48,992 54,148,159 0.4Series 2014-DN3, Class M3(b) . . . . . . . . . . . . . . . . . . . . . . . . . . 6.49% 8/25/24 8,561 9,266,428 0.1Series 2014-HQ1, Class M3(b) . . . . . . . . . . . . . . . . . . . . . . . . . . 6.59% 8/25/24 24,314 26,464,930 0.2Series 2013-DN2, Class M2(b) . . . . . . . . . . . . . . . . . . . . . . . . . . 6.74% 11/25/23 50,003 54,985,541 0.4Series 2014-DN1, Class M3(b) . . . . . . . . . . . . . . . . . . . . . . . . . . 6.99% 2/25/24 52,005 58,353,438 0.4Series 2014-DN4, Class M3(b) . . . . . . . . . . . . . . . . . . . . . . . . . . 7.04% 10/25/24 41,117 45,323,056 0.3Series 2016-DNA2, Class M3(b) . . . . . . . . . . . . . . . . . . . . . . . . 7.14% 10/25/28 34,349 38,728,569 0.3Series 2015-HQA1, Class M3(b) . . . . . . . . . . . . . . . . . . . . . . . . 7.19% 3/25/28 29,625 33,513,473 0.3Series 2015-DNA3, Class M3(b) . . . . . . . . . . . . . . . . . . . . . . . . 7.19% 4/25/28 16,659 19,527,482 0.2Series 2014-HQ3, Class M3(b) . . . . . . . . . . . . . . . . . . . . . . . . . . 7.24% 10/25/24 11,547 12,749,637 0.1Series 2015-HQA2, Class M3(b) . . . . . . . . . . . . . . . . . . . . . . . . 7.29% 5/25/28 31,197 35,754,636 0.3Series 2016-DNA3, Class M3(b) . . . . . . . . . . . . . . . . . . . . . . . . 7.49% 12/25/28 79,123 90,454,822 0.7Series 2016-HQA2, Class M3(b) . . . . . . . . . . . . . . . . . . . . . . . . 7.64% 11/25/28 17,695 20,814,866 0.2Series 2016-DNA1, Class M3(b) . . . . . . . . . . . . . . . . . . . . . . . . 8.04% 7/25/28 43,215 51,300,818 0.4Series 2016-HQA1, Class M3(b) . . . . . . . . . . . . . . . . . . . . . . . . 8.84% 9/25/28 44,812 54,025,449 0.4Series 2013-DN1, Class M2(b) . . . . . . . . . . . . . . . . . . . . . . . . . . 9.64% 7/25/23 27,500 32,354,002 0.2
Federal National Mortgage Association Connecticut Avenue Securities
Series 2017-C05, Class 1M2(b) . . . . . . . . . . . . . . . . . . . . . . . . . 4.69% 1/25/30 23,605 24,062,739 0.2Series 2018-C01, Class 1M2(b) . . . . . . . . . . . . . . . . . . . . . . . . . 4.74% 7/25/30 18,066 18,282,931 0.1Series 2017-C07, Class 1M2(b) . . . . . . . . . . . . . . . . . . . . . . . . . 4.89% 5/25/30 4,350 4,457,534 0.0Series 2017-C07, Class 2M2(b) . . . . . . . . . . . . . . . . . . . . . . . . . 4.99% 5/25/30 19,587 20,015,812 0.2Series 2014-C02, Class 1M2(b) . . . . . . . . . . . . . . . . . . . . . . . . . 5.09% 5/25/24 21,592 22,713,016 0.2Series 2017-C06, Class 1M2(b) . . . . . . . . . . . . . . . . . . . . . . . . . 5.14% 2/25/30 6,000 6,197,552 0.0Series 2017-C06, Class 2M2(b) . . . . . . . . . . . . . . . . . . . . . . . . . 5.29% 2/25/30 11,550 11,957,615 0.1Series 2017-C04, Class 2M2(b) . . . . . . . . . . . . . . . . . . . . . . . . . 5.34% 11/25/29 10,428 10,856,545 0.1Series 2014-C03, Class 1M2(b) . . . . . . . . . . . . . . . . . . . . . . . . . 5.49% 7/25/24 5,583 5,944,610 0.0Series 2017-C03, Class 1M2(b) . . . . . . . . . . . . . . . . . . . . . . . . . 5.49% 10/25/29 18,935 20,144,776 0.2Series 2017-C01, Class 1M2(b) . . . . . . . . . . . . . . . . . . . . . . . . . 6.04% 7/25/29 32,517 35,015,243 0.3Series 2017-C02, Class 2M2(b) . . . . . . . . . . . . . . . . . . . . . . . . . 6.14% 9/25/29 22,843 24,686,012 0.2Series 2015-C02, Class 2M2(b) . . . . . . . . . . . . . . . . . . . . . . . . . 6.49% 5/25/25 26,140 28,024,029 0.2Series 2015-C02, Class 1M2(b) . . . . . . . . . . . . . . . . . . . . . . . . . 6.49% 5/25/25 70,285 76,455,832 0.6Series 2016-C04, Class 1M2(b) . . . . . . . . . . . . . . . . . . . . . . . . . 6.74% 1/25/29 22,420 24,980,976 0.2Series 2016-C06, Class 1M2(b) . . . . . . . . . . . . . . . . . . . . . . . . . 6.74% 4/25/29 22,525 25,085,043 0.2
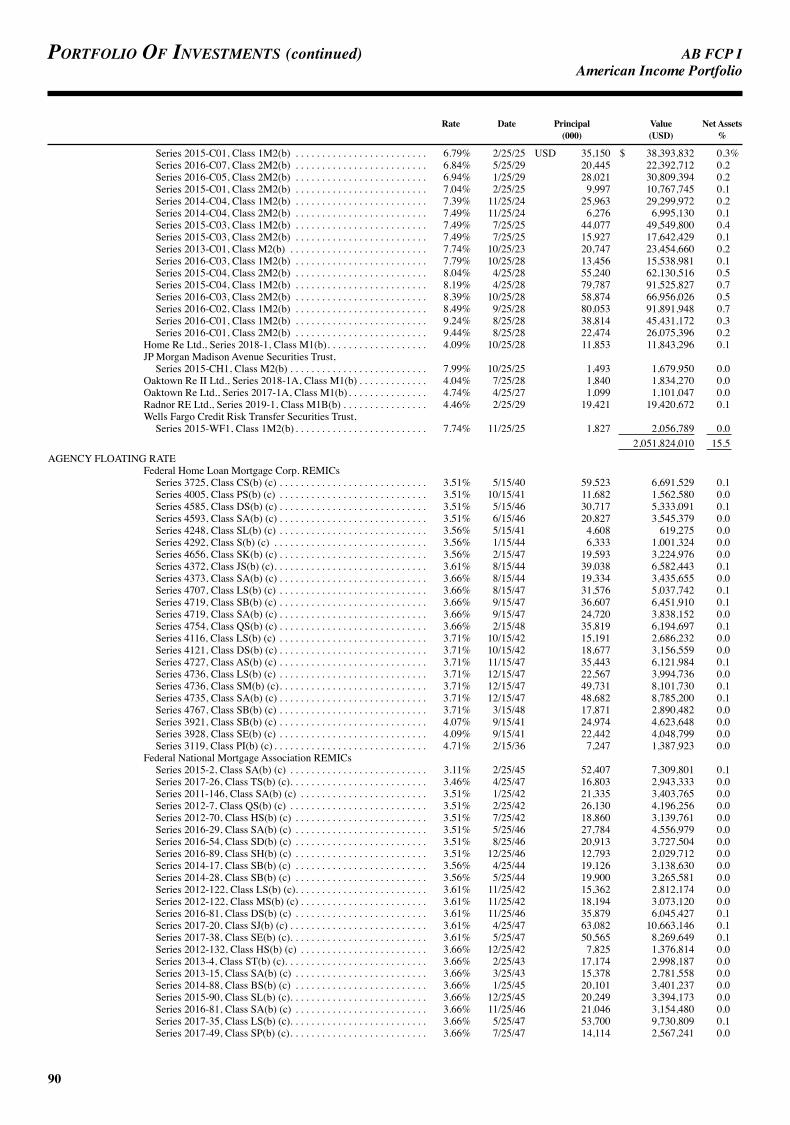
AB FCP I
90
Portfolio of investments (continued) AmericanIncomePortfolio
Rate Date Principal Value Net Assets (000) (USD) %
Series 2015-C01, Class 1M2(b) . . . . . . . . . . . . . . . . . . . . . . . . . 6.79% 2/25/25 USD 35,150 $ 38,393,832 0.3%Series 2016-C07, Class 2M2(b) . . . . . . . . . . . . . . . . . . . . . . . . . 6.84% 5/25/29 20,445 22,392,712 0.2Series 2016-C05, Class 2M2(b) . . . . . . . . . . . . . . . . . . . . . . . . . 6.94% 1/25/29 28,021 30,809,394 0.2Series 2015-C01, Class 2M2(b) . . . . . . . . . . . . . . . . . . . . . . . . . 7.04% 2/25/25 9,997 10,767,745 0.1Series 2014-C04, Class 1M2(b) . . . . . . . . . . . . . . . . . . . . . . . . . 7.39% 11/25/24 25,963 29,299,972 0.2Series 2014-C04, Class 2M2(b) . . . . . . . . . . . . . . . . . . . . . . . . . 7.49% 11/25/24 6,276 6,995,130 0.1Series 2015-C03, Class 1M2(b) . . . . . . . . . . . . . . . . . . . . . . . . . 7.49% 7/25/25 44,077 49,549,800 0.4Series 2015-C03, Class 2M2(b) . . . . . . . . . . . . . . . . . . . . . . . . . 7.49% 7/25/25 15,927 17,642,429 0.1Series 2013-C01, Class M2(b) . . . . . . . . . . . . . . . . . . . . . . . . . . 7.74% 10/25/23 20,747 23,454,660 0.2Series 2016-C03, Class 1M2(b) . . . . . . . . . . . . . . . . . . . . . . . . . 7.79% 10/25/28 13,456 15,538,981 0.1Series 2015-C04, Class 2M2(b) . . . . . . . . . . . . . . . . . . . . . . . . . 8.04% 4/25/28 55,240 62,130,516 0.5Series 2015-C04, Class 1M2(b) . . . . . . . . . . . . . . . . . . . . . . . . . 8.19% 4/25/28 79,787 91,525,827 0.7Series 2016-C03, Class 2M2(b) . . . . . . . . . . . . . . . . . . . . . . . . . 8.39% 10/25/28 58,874 66,956,026 0.5Series 2016-C02, Class 1M2(b) . . . . . . . . . . . . . . . . . . . . . . . . . 8.49% 9/25/28 80,053 91,891,948 0.7Series 2016-C01, Class 1M2(b) . . . . . . . . . . . . . . . . . . . . . . . . . 9.24% 8/25/28 38,814 45,431,172 0.3Series 2016-C01, Class 2M2(b) . . . . . . . . . . . . . . . . . . . . . . . . . 9.44% 8/25/28 22,474 26,075,396 0.2
Home Re Ltd., Series 2018-1, Class M1(b). . . . . . . . . . . . . . . . . . . 4.09% 10/25/28 11,853 11,843,296 0.1JP Morgan Madison Avenue Securities Trust,
Series 2015-CH1, Class M2(b) . . . . . . . . . . . . . . . . . . . . . . . . . . 7.99% 10/25/25 1,493 1,679,950 0.0Oaktown Re II Ltd., Series 2018-1A, Class M1(b) . . . . . . . . . . . . . 4.04% 7/25/28 1,840 1,834,270 0.0Oaktown Re Ltd., Series 2017-1A, Class M1(b) . . . . . . . . . . . . . . . 4.74% 4/25/27 1,099 1,101,047 0.0Radnor RE Ltd., Series 2019-1, Class M1B(b) . . . . . . . . . . . . . . . . 4.46% 2/25/29 19,421 19,420,672 0.1Wells Fargo Credit Risk Transfer Securities Trust,
Series 2015-WF1, Class 1M2(b) . . . . . . . . . . . . . . . . . . . . . . . . . 7.74% 11/25/25 1,827 2,056,789 0.0 2,051,824,010 15.5
AGENCY FLOATING RATEFederal Home Loan Mortgage Corp. REMICs
Series 3725, Class CS(b) (c) . . . . . . . . . . . . . . . . . . . . . . . . . . . . 3.51% 5/15/40 59,523 6,691,529 0.1Series 4005, Class PS(b) (c) . . . . . . . . . . . . . . . . . . . . . . . . . . . . 3.51% 10/15/41 11,682 1,562,580 0.0Series 4585, Class DS(b) (c) . . . . . . . . . . . . . . . . . . . . . . . . . . . . 3.51% 5/15/46 30,717 5,333,091 0.1Series 4593, Class SA(b) (c) . . . . . . . . . . . . . . . . . . . . . . . . . . . . 3.51% 6/15/46 20,827 3,545,379 0.0Series 4248, Class SL(b) (c) . . . . . . . . . . . . . . . . . . . . . . . . . . . . 3.56% 5/15/41 4,608 619,275 0.0Series 4292, Class S(b) (c) . . . . . . . . . . . . . . . . . . . . . . . . . . . . . 3.56% 1/15/44 6,333 1,001,324 0.0Series 4656, Class SK(b) (c) . . . . . . . . . . . . . . . . . . . . . . . . . . . . 3.56% 2/15/47 19,593 3,224,976 0.0Series 4372, Class JS(b) (c). . . . . . . . . . . . . . . . . . . . . . . . . . . . . 3.61% 8/15/44 39,038 6,582,443 0.1Series 4373, Class SA(b) (c) . . . . . . . . . . . . . . . . . . . . . . . . . . . . 3.66% 8/15/44 19,334 3,435,655 0.0Series 4707, Class LS(b) (c) . . . . . . . . . . . . . . . . . . . . . . . . . . . . 3.66% 8/15/47 31,576 5,037,742 0.1Series 4719, Class SB(b) (c) . . . . . . . . . . . . . . . . . . . . . . . . . . . . 3.66% 9/15/47 36,607 6,451,910 0.1Series 4719, Class SA(b) (c) . . . . . . . . . . . . . . . . . . . . . . . . . . . . 3.66% 9/15/47 24,720 3,838,152 0.0Series 4754, Class QS(b) (c) . . . . . . . . . . . . . . . . . . . . . . . . . . . . 3.66% 2/15/48 35,819 6,194,697 0.1Series 4116, Class LS(b) (c) . . . . . . . . . . . . . . . . . . . . . . . . . . . . 3.71% 10/15/42 15,191 2,686,232 0.0Series 4121, Class DS(b) (c) . . . . . . . . . . . . . . . . . . . . . . . . . . . . 3.71% 10/15/42 18,677 3,156,559 0.0Series 4727, Class AS(b) (c) . . . . . . . . . . . . . . . . . . . . . . . . . . . . 3.71% 11/15/47 35,443 6,121,984 0.1Series 4736, Class LS(b) (c) . . . . . . . . . . . . . . . . . . . . . . . . . . . . 3.71% 12/15/47 22,567 3,994,736 0.0Series 4736, Class SM(b) (c). . . . . . . . . . . . . . . . . . . . . . . . . . . . 3.71% 12/15/47 49,731 8,101,730 0.1Series 4735, Class SA(b) (c) . . . . . . . . . . . . . . . . . . . . . . . . . . . . 3.71% 12/15/47 48,682 8,785,200 0.1Series 4767, Class SB(b) (c) . . . . . . . . . . . . . . . . . . . . . . . . . . . . 3.71% 3/15/48 17,871 2,890,482 0.0Series 3921, Class SB(b) (c) . . . . . . . . . . . . . . . . . . . . . . . . . . . . 4.07% 9/15/41 24,974 4,623,648 0.0Series 3928, Class SE(b) (c) . . . . . . . . . . . . . . . . . . . . . . . . . . . . 4.09% 9/15/41 22,442 4,048,799 0.0Series 3119, Class PI(b) (c) . . . . . . . . . . . . . . . . . . . . . . . . . . . . . 4.71% 2/15/36 7,247 1,387,923 0.0
Federal National Mortgage Association REMICsSeries 2015-2, Class SA(b) (c) . . . . . . . . . . . . . . . . . . . . . . . . . . 3.11% 2/25/45 52,407 7,309,801 0.1Series 2017-26, Class TS(b) (c). . . . . . . . . . . . . . . . . . . . . . . . . . 3.46% 4/25/47 16,803 2,943,333 0.0Series 2011-146, Class SA(b) (c) . . . . . . . . . . . . . . . . . . . . . . . . 3.51% 1/25/42 21,335 3,403,765 0.0Series 2012-7, Class QS(b) (c) . . . . . . . . . . . . . . . . . . . . . . . . . . 3.51% 2/25/42 26,130 4,196,256 0.0Series 2012-70, Class HS(b) (c) . . . . . . . . . . . . . . . . . . . . . . . . . 3.51% 7/25/42 18,860 3,139,761 0.0Series 2016-29, Class SA(b) (c) . . . . . . . . . . . . . . . . . . . . . . . . . 3.51% 5/25/46 27,784 4,556,979 0.0Series 2016-54, Class SD(b) (c) . . . . . . . . . . . . . . . . . . . . . . . . . 3.51% 8/25/46 20,913 3,727,504 0.0Series 2016-89, Class SH(b) (c) . . . . . . . . . . . . . . . . . . . . . . . . . 3.51% 12/25/46 12,793 2,029,712 0.0Series 2014-17, Class SB(b) (c) . . . . . . . . . . . . . . . . . . . . . . . . . 3.56% 4/25/44 19,126 3,138,630 0.0Series 2014-28, Class SB(b) (c) . . . . . . . . . . . . . . . . . . . . . . . . . 3.56% 5/25/44 19,900 3,265,581 0.0Series 2012-122, Class LS(b) (c). . . . . . . . . . . . . . . . . . . . . . . . . 3.61% 11/25/42 15,362 2,812,174 0.0Series 2012-122, Class MS(b) (c) . . . . . . . . . . . . . . . . . . . . . . . . 3.61% 11/25/42 18,194 3,073,120 0.0Series 2016-81, Class DS(b) (c) . . . . . . . . . . . . . . . . . . . . . . . . . 3.61% 11/25/46 35,879 6,045,427 0.1Series 2017-20, Class SJ(b) (c) . . . . . . . . . . . . . . . . . . . . . . . . . . 3.61% 4/25/47 63,082 10,663,146 0.1Series 2017-38, Class SE(b) (c). . . . . . . . . . . . . . . . . . . . . . . . . . 3.61% 5/25/47 50,565 8,269,649 0.1Series 2012-132, Class HS(b) (c) . . . . . . . . . . . . . . . . . . . . . . . . 3.66% 12/25/42 7,825 1,376,814 0.0Series 2013-4, Class ST(b) (c). . . . . . . . . . . . . . . . . . . . . . . . . . . 3.66% 2/25/43 17,174 2,998,187 0.0Series 2013-15, Class SA(b) (c) . . . . . . . . . . . . . . . . . . . . . . . . . 3.66% 3/25/43 15,378 2,781,558 0.0Series 2014-88, Class BS(b) (c) . . . . . . . . . . . . . . . . . . . . . . . . . 3.66% 1/25/45 20,101 3,401,237 0.0Series 2015-90, Class SL(b) (c). . . . . . . . . . . . . . . . . . . . . . . . . . 3.66% 12/25/45 20,249 3,394,173 0.0Series 2016-81, Class SA(b) (c) . . . . . . . . . . . . . . . . . . . . . . . . . 3.66% 11/25/46 21,046 3,154,480 0.0Series 2017-35, Class LS(b) (c). . . . . . . . . . . . . . . . . . . . . . . . . . 3.66% 5/25/47 53,700 9,730,809 0.1Series 2017-49, Class SP(b) (c). . . . . . . . . . . . . . . . . . . . . . . . . . 3.66% 7/25/47 14,114 2,567,241 0.0

AB FCP I
91
AmericanIncomePortfolio
Rate Date Principal Value Net Assets (000) (USD) %
Series 2017-105, Class SE(b) (c). . . . . . . . . . . . . . . . . . . . . . . . . 3.66% 1/25/48 USD 86,644 $ 15,599,884 0.1%Series 2017-112, Class SA(b) (c) . . . . . . . . . . . . . . . . . . . . . . . . 3.66% 1/25/48 36,536 5,815,123 0.1Series 2018-13, Class SG(b) (c) . . . . . . . . . . . . . . . . . . . . . . . . . 3.66% 3/25/48 23,194 3,764,107 0.0Series 2013-81, Class JS(b) (c) . . . . . . . . . . . . . . . . . . . . . . . . . . 3.71% 12/25/42 20,643 2,747,311 0.0Series 2017-38, Class DS(b) (c) . . . . . . . . . . . . . . . . . . . . . . . . . 3.71% 5/25/47 35,495 4,408,567 0.0Series 2017-81, Class CS(b) (c) . . . . . . . . . . . . . . . . . . . . . . . . . 3.71% 10/25/47 26,764 4,446,508 0.0Series 2017-109, Class SJ(b) (c) . . . . . . . . . . . . . . . . . . . . . . . . . 3.71% 1/25/48 11,039 1,763,853 0.0Series 2018-30, Class SA(b) (c) . . . . . . . . . . . . . . . . . . . . . . . . . 3.71% 5/25/48 42,829 6,978,174 0.1Series 2018-28, Class PS(b) (c). . . . . . . . . . . . . . . . . . . . . . . . . . 3.71% 5/25/48 38,830 6,373,920 0.1Series 2018-28, Class SB(b) (c) . . . . . . . . . . . . . . . . . . . . . . . . . 3.71% 5/25/48 35,442 6,112,202 0.1Series 2018-32, Class SB(b) (c) . . . . . . . . . . . . . . . . . . . . . . . . . 3.71% 5/25/48 31,934 5,619,963 0.1Series 2018-39, Class AS(b) (c) . . . . . . . . . . . . . . . . . . . . . . . . . 3.71% 6/25/48 18,909 3,272,722 0.0Series 2018-45, Class SL(b) (c). . . . . . . . . . . . . . . . . . . . . . . . . . 3.71% 6/25/48 19,960 3,779,080 0.0Series 4494, Class SL(b) (c) . . . . . . . . . . . . . . . . . . . . . . . . . . . . 3.73% 7/15/45 65,778 11,350,548 0.1Series 2010-147, Class LS(b) (c). . . . . . . . . . . . . . . . . . . . . . . . . 3.96% 1/25/41 5,595 1,004,522 0.0Series 2015-26, Class SH(b) (c) . . . . . . . . . . . . . . . . . . . . . . . . . 3.96% 5/25/45 26,505 4,853,707 0.1Series 2014-37, Class SB(b) (c) . . . . . . . . . . . . . . . . . . . . . . . . . 4.19% 7/25/44 11,774 2,181,370 0.0Series 2014-40, Class HS(b) (c) . . . . . . . . . . . . . . . . . . . . . . . . . 4.21% 7/25/44 11,712 2,303,210 0.0
Government National Mortgage AssociationSeries 2014-160, Class SP(b) (c). . . . . . . . . . . . . . . . . . . . . . . . . 3.12% 10/20/44 34,088 4,685,549 0.0Series 2016-77, Class TS(b) (c). . . . . . . . . . . . . . . . . . . . . . . . . . 3.67% 12/20/44 13,915 2,120,051 0.0Series 2017-52, Class SN(b) (c) . . . . . . . . . . . . . . . . . . . . . . . . . 3.67% 4/20/47 14,540 2,135,944 0.0Series 2017-115, Class SA(b) (c) . . . . . . . . . . . . . . . . . . . . . . . . 3.72% 7/20/47 29,601 5,001,950 0.1Series 2017-103, Class SL(b) (c). . . . . . . . . . . . . . . . . . . . . . . . . 3.72% 7/20/47 49,563 7,383,723 0.1Series 2017-122, Class SA(b) (c) . . . . . . . . . . . . . . . . . . . . . . . . 3.72% 8/20/47 38,387 7,167,999 0.1Series 2017-139, Class SA(b) (c) . . . . . . . . . . . . . . . . . . . . . . . . 3.72% 8/20/47 12,910 2,137,056 0.0Series 2017-134, Class SE(b) (c). . . . . . . . . . . . . . . . . . . . . . . . . 3.72% 9/20/47 23,595 3,752,537 0.0Series 2017-149, Class SG(b) (c) . . . . . . . . . . . . . . . . . . . . . . . . 3.72% 10/20/47 29,204 4,718,415 0.0
328,773,378 2.5AGENCY FIXED RATE
Federal National Mortgage Association REMICsSeries 2016-33, Class NI(d) . . . . . . . . . . . . . . . . . . . . . . . . . . . . 5.00% 7/25/34 33,892 6,592,767 0.1Series 2016-11, Class GI(d). . . . . . . . . . . . . . . . . . . . . . . . . . . . . 5.00% 3/25/46 8,828 1,864,881 0.0Series 2016-26, Class IO(d) . . . . . . . . . . . . . . . . . . . . . . . . . . . . 5.00% 5/25/46 30,864 6,126,338 0.0Series 2016-37, Class BI(d). . . . . . . . . . . . . . . . . . . . . . . . . . . . . 5.00% 6/25/46 54,772 10,660,221 0.1Series 2016-34, Class AI(d). . . . . . . . . . . . . . . . . . . . . . . . . . . . . 5.00% 6/25/46 31,817 6,175,346 0.1Series 2016-64, Class BI(d). . . . . . . . . . . . . . . . . . . . . . . . . . . . . 5.00% 9/25/46 52,039 10,127,736 0.1Series 2014-37, Class AI(d). . . . . . . . . . . . . . . . . . . . . . . . . . . . . 5.50% 7/25/44 19,390 4,006,362 0.0
45,553,651 0.4 2,426,151,039 18.4
CORPORATES - INVESTMENT GRADEFINANCIAL INSTITUTIONSBANKING
ABN AMRO Bank NV . . . . . . . . . . . . . . . . . . . . . . . . . . . . . . . . . . 7.75% 5/15/23 7,651 8,479,591 0.1AIB Group PLC . . . . . . . . . . . . . . . . . . . . . . . . . . . . . . . . . . . . . . . . 4.75% 10/12/23 16,763 16,853,738 0.1AmSouth Bancorp . . . . . . . . . . . . . . . . . . . . . . . . . . . . . . . . . . . . . . 6.75% 11/01/25 11,929 13,617,574 0.1Banco Santander SA . . . . . . . . . . . . . . . . . . . . . . . . . . . . . . . . . . . . 3.80% 2/23/28 10,600 9,985,158 0.1Banco Santander SA . . . . . . . . . . . . . . . . . . . . . . . . . . . . . . . . . . . . 5.18% 11/19/25 8,600 8,822,860 0.1Bank of America Corp., Series V(e) . . . . . . . . . . . . . . . . . . . . . . . . 5.13% 6/17/19 2,281 2,272,474 0.0Bank of America Corp., Series B. . . . . . . . . . . . . . . . . . . . . . . . . . . 8.05% 6/15/27 34,006 41,383,840 0.3Bank of Ireland Group PLC. . . . . . . . . . . . . . . . . . . . . . . . . . . . . . . 4.50% 11/25/23 15,000 14,951,925 0.1Bank of New York Mellon Corp. (The), Series E(e) . . . . . . . . . . . . 4.95% 6/20/20 3,374 3,400,007 0.0Banque Federative du Credit Mutuel SA. . . . . . . . . . . . . . . . . . . . . 2.20% 7/20/20 9,890 9,763,863 0.1Banque Federative du Credit Mutuel SA. . . . . . . . . . . . . . . . . . . . . 2.75% 10/15/20 4,209 4,181,755 0.0Barclays PLC . . . . . . . . . . . . . . . . . . . . . . . . . . . . . . . . . . . . . . . . . . 4.34% 5/16/24 9,110 9,096,016 0.1BNP Paribas SA(e). . . . . . . . . . . . . . . . . . . . . . . . . . . . . . . . . . . . . . 6.75% 3/14/22 420 429,954 0.0BNP Paribas SA(e). . . . . . . . . . . . . . . . . . . . . . . . . . . . . . . . . . . . . . 7.63% 3/30/21 31,862 33,575,156 0.3BPCE SA . . . . . . . . . . . . . . . . . . . . . . . . . . . . . . . . . . . . . . . . . . . . . 5.15% 7/21/24 13,100 13,431,076 0.1BPCE SA . . . . . . . . . . . . . . . . . . . . . . . . . . . . . . . . . . . . . . . . . . . . . 5.70% 10/22/23 12,199 12,821,259 0.1Capital One Financial Corp. . . . . . . . . . . . . . . . . . . . . . . . . . . . . . . 3.75% 3/09/27 19,128 18,375,313 0.1Citizens Bank NA/Providence RI . . . . . . . . . . . . . . . . . . . . . . . . . . 2.25% 10/30/20 7,570 7,462,794 0.1Commonwealth Bank of Australia. . . . . . . . . . . . . . . . . . . . . . . . . . 2.25% 3/10/20 9,545 9,485,220 0.1Commonwealth Bank of Australia/New York NY, Series G . . . . . . 2.30% 3/12/20 13,051 12,972,107 0.1Compass Bank . . . . . . . . . . . . . . . . . . . . . . . . . . . . . . . . . . . . . . . . . 5.90% 4/01/26 7,500 7,784,692 0.1Cooperatieve Rabobank UA . . . . . . . . . . . . . . . . . . . . . . . . . . . . . . 3.75% 7/21/26 9,358 9,033,586 0.1Cooperatieve Rabobank UA(e) . . . . . . . . . . . . . . . . . . . . . . . . . . . . 11.00% 6/30/19 9,756 10,001,656 0.1Credit Agricole SA(e) . . . . . . . . . . . . . . . . . . . . . . . . . . . . . . . . . . . 8.13% 12/23/25 20,837 23,245,621 0.1Credit Agricole SA/London . . . . . . . . . . . . . . . . . . . . . . . . . . . . . . . 2.75% 6/10/20 425 423,338 0.0Credit Suisse Group Funding Guernsey Ltd.. . . . . . . . . . . . . . . . . . 2.75% 3/26/20 5,000 4,974,735 0.0Danske Bank A/S . . . . . . . . . . . . . . . . . . . . . . . . . . . . . . . . . . . . . . . 5.38% 1/12/24 10,000 10,293,560 0.1Discover Bank . . . . . . . . . . . . . . . . . . . . . . . . . . . . . . . . . . . . . . . . . 3.45% 7/27/26 19,666 18,594,478 0.1Goldman Sachs Group, Inc. (The) . . . . . . . . . . . . . . . . . . . . . . . . . . 3.63% 2/20/24 11,450 11,463,362 0.1HSBC Finance Corp. . . . . . . . . . . . . . . . . . . . . . . . . . . . . . . . . . . . . 6.68% 1/15/21 22,283 23,187,623 0.2
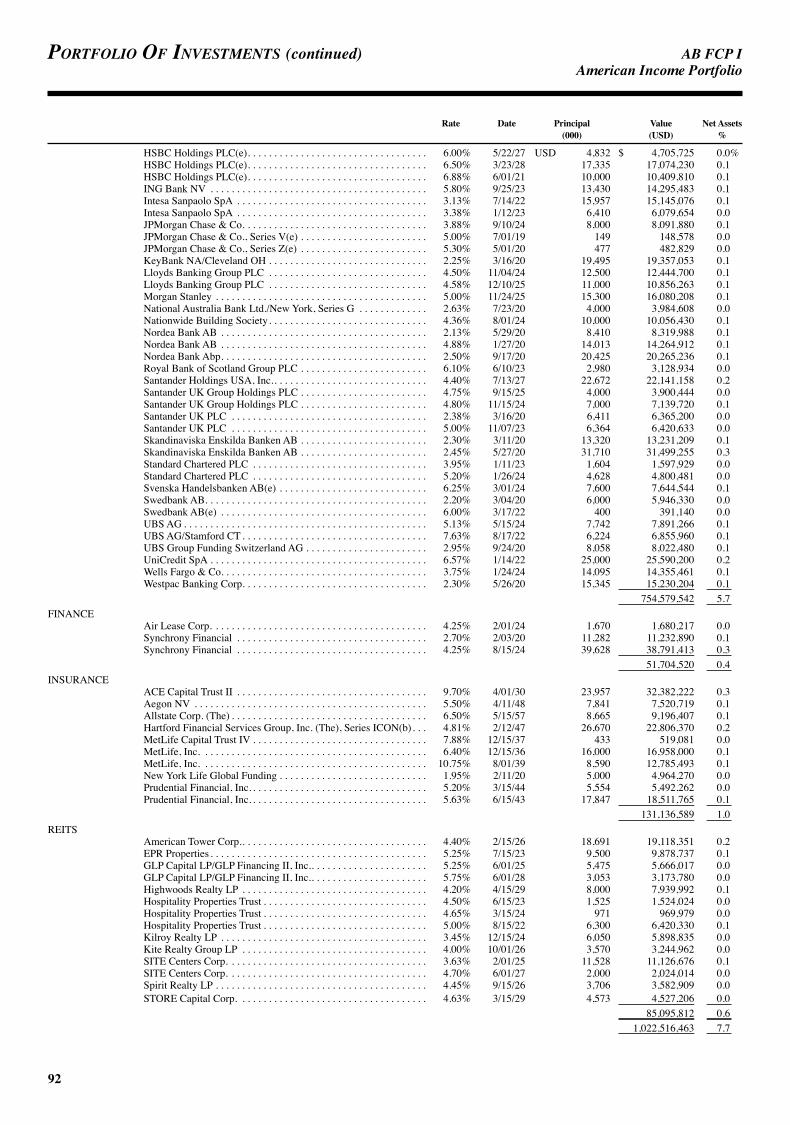
AB FCP I
92
Portfolio of investments (continued) AmericanIncomePortfolio
Rate Date Principal Value Net Assets (000) (USD) %
HSBC Holdings PLC(e). . . . . . . . . . . . . . . . . . . . . . . . . . . . . . . . . . 6.00% 5/22/27 USD 4,832 $ 4,705,725 0.0%HSBC Holdings PLC(e). . . . . . . . . . . . . . . . . . . . . . . . . . . . . . . . . . 6.50% 3/23/28 17,335 17,074,230 0.1HSBC Holdings PLC(e). . . . . . . . . . . . . . . . . . . . . . . . . . . . . . . . . . 6.88% 6/01/21 10,000 10,409,810 0.1ING Bank NV . . . . . . . . . . . . . . . . . . . . . . . . . . . . . . . . . . . . . . . . . 5.80% 9/25/23 13,430 14,295,483 0.1Intesa Sanpaolo SpA . . . . . . . . . . . . . . . . . . . . . . . . . . . . . . . . . . . . 3.13% 7/14/22 15,957 15,145,076 0.1Intesa Sanpaolo SpA . . . . . . . . . . . . . . . . . . . . . . . . . . . . . . . . . . . . 3.38% 1/12/23 6,410 6,079,654 0.0JPMorgan Chase & Co. . . . . . . . . . . . . . . . . . . . . . . . . . . . . . . . . . . 3.88% 9/10/24 8,000 8,091,880 0.1JPMorgan Chase & Co., Series V(e) . . . . . . . . . . . . . . . . . . . . . . . . 5.00% 7/01/19 149 148,578 0.0JPMorgan Chase & Co., Series Z(e) . . . . . . . . . . . . . . . . . . . . . . . . 5.30% 5/01/20 477 482,829 0.0KeyBank NA/Cleveland OH . . . . . . . . . . . . . . . . . . . . . . . . . . . . . . 2.25% 3/16/20 19,495 19,357,053 0.1Lloyds Banking Group PLC . . . . . . . . . . . . . . . . . . . . . . . . . . . . . . 4.50% 11/04/24 12,500 12,444,700 0.1Lloyds Banking Group PLC . . . . . . . . . . . . . . . . . . . . . . . . . . . . . . 4.58% 12/10/25 11,000 10,856,263 0.1Morgan Stanley . . . . . . . . . . . . . . . . . . . . . . . . . . . . . . . . . . . . . . . . 5.00% 11/24/25 15,300 16,080,208 0.1National Australia Bank Ltd./New York, Series G . . . . . . . . . . . . . 2.63% 7/23/20 4,000 3,984,608 0.0Nationwide Building Society. . . . . . . . . . . . . . . . . . . . . . . . . . . . . . 4.36% 8/01/24 10,000 10,056,430 0.1Nordea Bank AB . . . . . . . . . . . . . . . . . . . . . . . . . . . . . . . . . . . . . . . 2.13% 5/29/20 8,410 8,319,988 0.1Nordea Bank AB . . . . . . . . . . . . . . . . . . . . . . . . . . . . . . . . . . . . . . . 4.88% 1/27/20 14,013 14,264,912 0.1Nordea Bank Abp. . . . . . . . . . . . . . . . . . . . . . . . . . . . . . . . . . . . . . . 2.50% 9/17/20 20,425 20,265,236 0.1Royal Bank of Scotland Group PLC . . . . . . . . . . . . . . . . . . . . . . . . 6.10% 6/10/23 2,980 3,128,934 0.0Santander Holdings USA, Inc.. . . . . . . . . . . . . . . . . . . . . . . . . . . . . 4.40% 7/13/27 22,672 22,141,158 0.2Santander UK Group Holdings PLC . . . . . . . . . . . . . . . . . . . . . . . . 4.75% 9/15/25 4,000 3,900,444 0.0Santander UK Group Holdings PLC . . . . . . . . . . . . . . . . . . . . . . . . 4.80% 11/15/24 7,000 7,139,720 0.1Santander UK PLC . . . . . . . . . . . . . . . . . . . . . . . . . . . . . . . . . . . . . 2.38% 3/16/20 6,411 6,365,200 0.0Santander UK PLC . . . . . . . . . . . . . . . . . . . . . . . . . . . . . . . . . . . . . 5.00% 11/07/23 6,364 6,420,633 0.0Skandinaviska Enskilda Banken AB . . . . . . . . . . . . . . . . . . . . . . . . 2.30% 3/11/20 13,320 13,231,209 0.1Skandinaviska Enskilda Banken AB . . . . . . . . . . . . . . . . . . . . . . . . 2.45% 5/27/20 31,710 31,499,255 0.3Standard Chartered PLC . . . . . . . . . . . . . . . . . . . . . . . . . . . . . . . . . 3.95% 1/11/23 1,604 1,597,929 0.0Standard Chartered PLC . . . . . . . . . . . . . . . . . . . . . . . . . . . . . . . . . 5.20% 1/26/24 4,628 4,800,481 0.0Svenska Handelsbanken AB(e) . . . . . . . . . . . . . . . . . . . . . . . . . . . . 6.25% 3/01/24 7,600 7,644,544 0.1Swedbank AB. . . . . . . . . . . . . . . . . . . . . . . . . . . . . . . . . . . . . . . . . . 2.20% 3/04/20 6,000 5,946,330 0.0Swedbank AB(e) . . . . . . . . . . . . . . . . . . . . . . . . . . . . . . . . . . . . . . . 6.00% 3/17/22 400 391,140 0.0UBS AG . . . . . . . . . . . . . . . . . . . . . . . . . . . . . . . . . . . . . . . . . . . . . . 5.13% 5/15/24 7,742 7,891,266 0.1UBS AG/Stamford CT . . . . . . . . . . . . . . . . . . . . . . . . . . . . . . . . . . . 7.63% 8/17/22 6,224 6,855,960 0.1UBS Group Funding Switzerland AG . . . . . . . . . . . . . . . . . . . . . . . 2.95% 9/24/20 8,058 8,022,480 0.1UniCredit SpA . . . . . . . . . . . . . . . . . . . . . . . . . . . . . . . . . . . . . . . . . 6.57% 1/14/22 25,000 25,590,200 0.2Wells Fargo & Co. . . . . . . . . . . . . . . . . . . . . . . . . . . . . . . . . . . . . . . 3.75% 1/24/24 14,095 14,355,461 0.1Westpac Banking Corp. . . . . . . . . . . . . . . . . . . . . . . . . . . . . . . . . . . 2.30% 5/26/20 15,345 15,230,204 0.1 754,579,542 5.7
FINANCEAir Lease Corp. . . . . . . . . . . . . . . . . . . . . . . . . . . . . . . . . . . . . . . . . 4.25% 2/01/24 1,670 1,680,217 0.0Synchrony Financial . . . . . . . . . . . . . . . . . . . . . . . . . . . . . . . . . . . . 2.70% 2/03/20 11,282 11,232,890 0.1Synchrony Financial . . . . . . . . . . . . . . . . . . . . . . . . . . . . . . . . . . . . 4.25% 8/15/24 39,628 38,791,413 0.3 51,704,520 0.4
INSURANCEACE Capital Trust II . . . . . . . . . . . . . . . . . . . . . . . . . . . . . . . . . . . . 9.70% 4/01/30 23,957 32,382,222 0.3Aegon NV . . . . . . . . . . . . . . . . . . . . . . . . . . . . . . . . . . . . . . . . . . . . 5.50% 4/11/48 7,841 7,520,719 0.1Allstate Corp. (The) . . . . . . . . . . . . . . . . . . . . . . . . . . . . . . . . . . . . . 6.50% 5/15/57 8,665 9,196,407 0.1Hartford Financial Services Group, Inc. (The), Series ICON(b). . . 4.81% 2/12/47 26,670 22,806,370 0.2MetLife Capital Trust IV . . . . . . . . . . . . . . . . . . . . . . . . . . . . . . . . . 7.88% 12/15/37 433 519,081 0.0MetLife, Inc. . . . . . . . . . . . . . . . . . . . . . . . . . . . . . . . . . . . . . . . . . . 6.40% 12/15/36 16,000 16,958,000 0.1MetLife, Inc. . . . . . . . . . . . . . . . . . . . . . . . . . . . . . . . . . . . . . . . . . . 10.75% 8/01/39 8,590 12,785,493 0.1New York Life Global Funding . . . . . . . . . . . . . . . . . . . . . . . . . . . . 1.95% 2/11/20 5,000 4,964,270 0.0Prudential Financial, Inc. . . . . . . . . . . . . . . . . . . . . . . . . . . . . . . . . . 5.20% 3/15/44 5,554 5,492,262 0.0Prudential Financial, Inc. . . . . . . . . . . . . . . . . . . . . . . . . . . . . . . . . . 5.63% 6/15/43 17,847 18,511,765 0.1 131,136,589 1.0
REITSAmerican Tower Corp.. . . . . . . . . . . . . . . . . . . . . . . . . . . . . . . . . . . 4.40% 2/15/26 18,691 19,118,351 0.2EPR Properties . . . . . . . . . . . . . . . . . . . . . . . . . . . . . . . . . . . . . . . . . 5.25% 7/15/23 9,500 9,878,737 0.1GLP Capital LP/GLP Financing II, Inc.. . . . . . . . . . . . . . . . . . . . . . 5.25% 6/01/25 5,475 5,666,017 0.0GLP Capital LP/GLP Financing II, Inc.. . . . . . . . . . . . . . . . . . . . . . 5.75% 6/01/28 3,053 3,173,780 0.0Highwoods Realty LP . . . . . . . . . . . . . . . . . . . . . . . . . . . . . . . . . . . 4.20% 4/15/29 8,000 7,939,992 0.1Hospitality Properties Trust . . . . . . . . . . . . . . . . . . . . . . . . . . . . . . . 4.50% 6/15/23 1,525 1,524,024 0.0Hospitality Properties Trust . . . . . . . . . . . . . . . . . . . . . . . . . . . . . . . 4.65% 3/15/24 971 969,979 0.0Hospitality Properties Trust . . . . . . . . . . . . . . . . . . . . . . . . . . . . . . . 5.00% 8/15/22 6,300 6,420,330 0.1Kilroy Realty LP . . . . . . . . . . . . . . . . . . . . . . . . . . . . . . . . . . . . . . . 3.45% 12/15/24 6,050 5,898,835 0.0Kite Realty Group LP . . . . . . . . . . . . . . . . . . . . . . . . . . . . . . . . . . . 4.00% 10/01/26 3,570 3,244,962 0.0SITE Centers Corp. . . . . . . . . . . . . . . . . . . . . . . . . . . . . . . . . . . . . . 3.63% 2/01/25 11,528 11,126,676 0.1SITE Centers Corp. . . . . . . . . . . . . . . . . . . . . . . . . . . . . . . . . . . . . . 4.70% 6/01/27 2,000 2,024,014 0.0Spirit Realty LP . . . . . . . . . . . . . . . . . . . . . . . . . . . . . . . . . . . . . . . . 4.45% 9/15/26 3,706 3,582,909 0.0STORE Capital Corp. . . . . . . . . . . . . . . . . . . . . . . . . . . . . . . . . . . . 4.63% 3/15/29 4,573 4,527,206 0.0 85,095,812 0.6 1,022,516,463 7.7
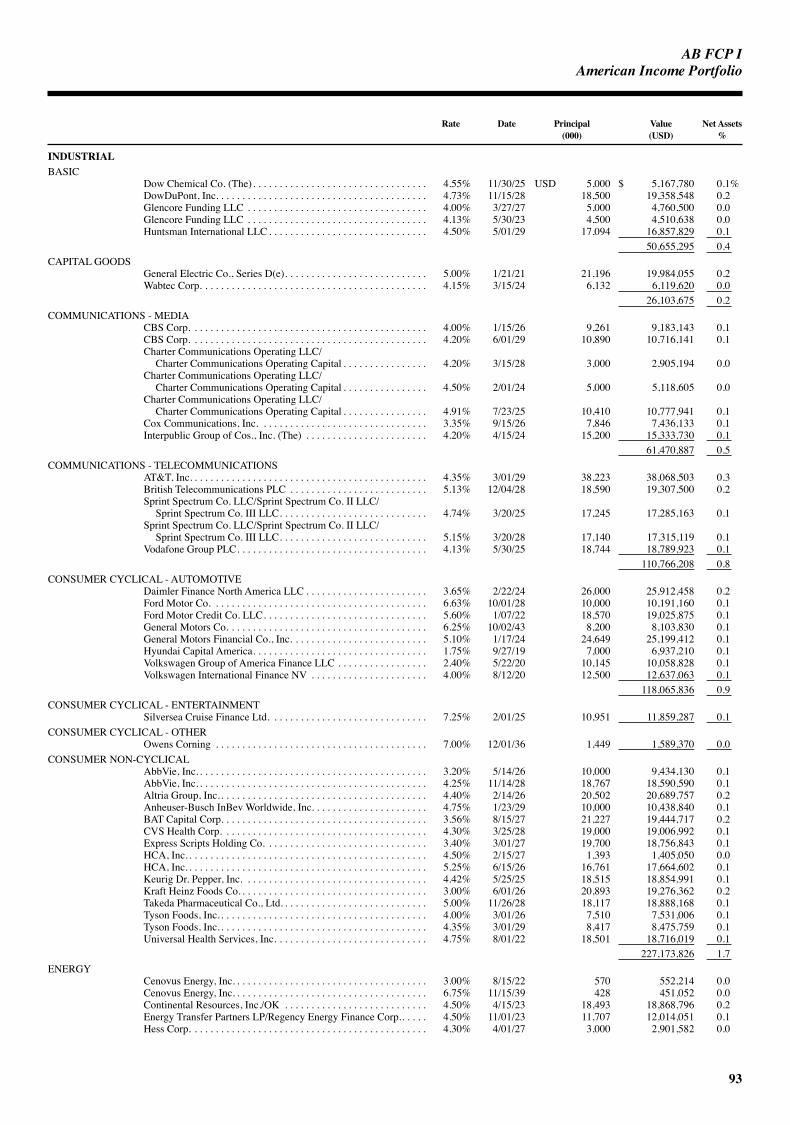
AB FCP I
93
AmericanIncomePortfolio
Rate Date Principal Value Net Assets (000) (USD) %
INDUSTRIALBASIC
Dow Chemical Co. (The). . . . . . . . . . . . . . . . . . . . . . . . . . . . . . . . . 4.55% 11/30/25 USD 5,000 $ 5,167,780 0.1%DowDuPont, Inc. . . . . . . . . . . . . . . . . . . . . . . . . . . . . . . . . . . . . . . . 4.73% 11/15/28 18,500 19,358,548 0.2Glencore Funding LLC . . . . . . . . . . . . . . . . . . . . . . . . . . . . . . . . . . 4.00% 3/27/27 5,000 4,760,500 0.0Glencore Funding LLC . . . . . . . . . . . . . . . . . . . . . . . . . . . . . . . . . . 4.13% 5/30/23 4,500 4,510,638 0.0Huntsman International LLC . . . . . . . . . . . . . . . . . . . . . . . . . . . . . . 4.50% 5/01/29 17,094 16,857,829 0.1 50,655,295 0.4
CAPITAL GOODSGeneral Electric Co., Series D(e). . . . . . . . . . . . . . . . . . . . . . . . . . . 5.00% 1/21/21 21,196 19,984,055 0.2Wabtec Corp. . . . . . . . . . . . . . . . . . . . . . . . . . . . . . . . . . . . . . . . . . . 4.15% 3/15/24 6,132 6,119,620 0.0 26,103,675 0.2
COMMUNICATIONS - MEDIACBS Corp. . . . . . . . . . . . . . . . . . . . . . . . . . . . . . . . . . . . . . . . . . . . . 4.00% 1/15/26 9,261 9,183,143 0.1CBS Corp. . . . . . . . . . . . . . . . . . . . . . . . . . . . . . . . . . . . . . . . . . . . . 4.20% 6/01/29 10,890 10,716,141 0.1Charter Communications Operating LLC/
Charter Communications Operating Capital . . . . . . . . . . . . . . . . 4.20% 3/15/28 3,000 2,905,194 0.0Charter Communications Operating LLC/
Charter Communications Operating Capital . . . . . . . . . . . . . . . . 4.50% 2/01/24 5,000 5,118,605 0.0Charter Communications Operating LLC/
Charter Communications Operating Capital . . . . . . . . . . . . . . . . 4.91% 7/23/25 10,410 10,777,941 0.1Cox Communications, Inc. . . . . . . . . . . . . . . . . . . . . . . . . . . . . . . . 3.35% 9/15/26 7,846 7,436,133 0.1Interpublic Group of Cos., Inc. (The) . . . . . . . . . . . . . . . . . . . . . . . 4.20% 4/15/24 15,200 15,333,730 0.1 61,470,887 0.5
COMMUNICATIONS - TELECOMMUNICATIONSAT&T, Inc. . . . . . . . . . . . . . . . . . . . . . . . . . . . . . . . . . . . . . . . . . . . . 4.35% 3/01/29 38,223 38,068,503 0.3British Telecommunications PLC . . . . . . . . . . . . . . . . . . . . . . . . . . 5.13% 12/04/28 18,590 19,307,500 0.2Sprint Spectrum Co. LLC/Sprint Spectrum Co. II LLC/
Sprint Spectrum Co. III LLC. . . . . . . . . . . . . . . . . . . . . . . . . . . . 4.74% 3/20/25 17,245 17,285,163 0.1Sprint Spectrum Co. LLC/Sprint Spectrum Co. II LLC/
Sprint Spectrum Co. III LLC. . . . . . . . . . . . . . . . . . . . . . . . . . . . 5.15% 3/20/28 17,140 17,315,119 0.1Vodafone Group PLC. . . . . . . . . . . . . . . . . . . . . . . . . . . . . . . . . . . . 4.13% 5/30/25 18,744 18,789,923 0.1 110,766,208 0.8
CONSUMER CYCLICAL - AUTOMOTIVEDaimler Finance North America LLC . . . . . . . . . . . . . . . . . . . . . . . 3.65% 2/22/24 26,000 25,912,458 0.2Ford Motor Co. . . . . . . . . . . . . . . . . . . . . . . . . . . . . . . . . . . . . . . . . 6.63% 10/01/28 10,000 10,191,160 0.1Ford Motor Credit Co. LLC. . . . . . . . . . . . . . . . . . . . . . . . . . . . . . . 5.60% 1/07/22 18,570 19,025,875 0.1General Motors Co. . . . . . . . . . . . . . . . . . . . . . . . . . . . . . . . . . . . . . 6.25% 10/02/43 8,200 8,103,830 0.1General Motors Financial Co., Inc. . . . . . . . . . . . . . . . . . . . . . . . . . 5.10% 1/17/24 24,649 25,199,412 0.1Hyundai Capital America. . . . . . . . . . . . . . . . . . . . . . . . . . . . . . . . . 1.75% 9/27/19 7,000 6,937,210 0.1Volkswagen Group of America Finance LLC . . . . . . . . . . . . . . . . . 2.40% 5/22/20 10,145 10,058,828 0.1Volkswagen International Finance NV . . . . . . . . . . . . . . . . . . . . . . 4.00% 8/12/20 12,500 12,637,063 0.1 118,065,836 0.9
CONSUMER CYCLICAL - ENTERTAINMENTSilversea Cruise Finance Ltd. . . . . . . . . . . . . . . . . . . . . . . . . . . . . . 7.25% 2/01/25 10,951 11,859,287 0.1
CONSUMER CYCLICAL - OTHEROwens Corning . . . . . . . . . . . . . . . . . . . . . . . . . . . . . . . . . . . . . . . . 7.00% 12/01/36 1,449 1,589,370 0.0
CONSUMER NON-CYCLICALAbbVie, Inc. . . . . . . . . . . . . . . . . . . . . . . . . . . . . . . . . . . . . . . . . . . . 3.20% 5/14/26 10,000 9,434,130 0.1AbbVie, Inc. . . . . . . . . . . . . . . . . . . . . . . . . . . . . . . . . . . . . . . . . . . . 4.25% 11/14/28 18,767 18,590,590 0.1Altria Group, Inc.. . . . . . . . . . . . . . . . . . . . . . . . . . . . . . . . . . . . . . . 4.40% 2/14/26 20,502 20,689,757 0.2Anheuser-Busch InBev Worldwide, Inc. . . . . . . . . . . . . . . . . . . . . . 4.75% 1/23/29 10,000 10,438,840 0.1BAT Capital Corp. . . . . . . . . . . . . . . . . . . . . . . . . . . . . . . . . . . . . . . 3.56% 8/15/27 21,227 19,444,717 0.2CVS Health Corp. . . . . . . . . . . . . . . . . . . . . . . . . . . . . . . . . . . . . . . 4.30% 3/25/28 19,000 19,006,992 0.1Express Scripts Holding Co. . . . . . . . . . . . . . . . . . . . . . . . . . . . . . . 3.40% 3/01/27 19,700 18,756,843 0.1HCA, Inc. . . . . . . . . . . . . . . . . . . . . . . . . . . . . . . . . . . . . . . . . . . . . . 4.50% 2/15/27 1,393 1,405,050 0.0HCA, Inc. . . . . . . . . . . . . . . . . . . . . . . . . . . . . . . . . . . . . . . . . . . . . . 5.25% 6/15/26 16,761 17,664,602 0.1Keurig Dr. Pepper, Inc. . . . . . . . . . . . . . . . . . . . . . . . . . . . . . . . . . . 4.42% 5/25/25 18,515 18,854,991 0.1Kraft Heinz Foods Co. . . . . . . . . . . . . . . . . . . . . . . . . . . . . . . . . . . . 3.00% 6/01/26 20,893 19,276,362 0.2Takeda Pharmaceutical Co., Ltd. . . . . . . . . . . . . . . . . . . . . . . . . . . . 5.00% 11/26/28 18,117 18,888,168 0.1Tyson Foods, Inc. . . . . . . . . . . . . . . . . . . . . . . . . . . . . . . . . . . . . . . . 4.00% 3/01/26 7,510 7,531,006 0.1Tyson Foods, Inc. . . . . . . . . . . . . . . . . . . . . . . . . . . . . . . . . . . . . . . . 4.35% 3/01/29 8,417 8,475,759 0.1Universal Health Services, Inc. . . . . . . . . . . . . . . . . . . . . . . . . . . . . 4.75% 8/01/22 18,501 18,716,019 0.1 227,173,826 1.7
ENERGYCenovus Energy, Inc. . . . . . . . . . . . . . . . . . . . . . . . . . . . . . . . . . . . . 3.00% 8/15/22 570 552,214 0.0Cenovus Energy, Inc. . . . . . . . . . . . . . . . . . . . . . . . . . . . . . . . . . . . . 6.75% 11/15/39 428 451,052 0.0Continental Resources, Inc./OK . . . . . . . . . . . . . . . . . . . . . . . . . . . 4.50% 4/15/23 18,493 18,868,796 0.2Energy Transfer Partners LP/Regency Energy Finance Corp.. . . . . 4.50% 11/01/23 11,707 12,014,051 0.1Hess Corp. . . . . . . . . . . . . . . . . . . . . . . . . . . . . . . . . . . . . . . . . . . . . 4.30% 4/01/27 3,000 2,901,582 0.0

AB FCP I
94
Portfolio of investments (continued) AmericanIncomePortfolio
Rate Date Principal Value Net Assets (000) (USD) %
Hess Corp. . . . . . . . . . . . . . . . . . . . . . . . . . . . . . . . . . . . . . . . . . . . . 7.30% 8/15/31 USD 20,385 $ 23,227,464 0.2%Marathon Oil Corp. . . . . . . . . . . . . . . . . . . . . . . . . . . . . . . . . . . . . . 3.85% 6/01/25 15,296 15,136,295 0.1TransCanada PipeLines Ltd. . . . . . . . . . . . . . . . . . . . . . . . . . . . . . . 9.88% 1/01/21 10,000 11,126,620 0.1Williams Cos., Inc. (The). . . . . . . . . . . . . . . . . . . . . . . . . . . . . . . . . 3.35% 8/15/22 4,957 4,930,019 0.0 89,208,093 0.7
SERVICESEquifax, Inc.. . . . . . . . . . . . . . . . . . . . . . . . . . . . . . . . . . . . . . . . . . . 3.30% 12/15/22 31,053 30,661,857 0.2Expedia Group, Inc. . . . . . . . . . . . . . . . . . . . . . . . . . . . . . . . . . . . . . 5.00% 2/15/26 13,074 13,519,954 0.1IHS Markit Ltd. . . . . . . . . . . . . . . . . . . . . . . . . . . . . . . . . . . . . . . . . 4.13% 8/01/23 5,173 5,193,237 0.0IHS Markit Ltd. . . . . . . . . . . . . . . . . . . . . . . . . . . . . . . . . . . . . . . . . 5.00% 11/01/22 3,910 4,035,319 0.0Verisk Analytics, Inc. . . . . . . . . . . . . . . . . . . . . . . . . . . . . . . . . . . . . 4.13% 3/15/29 6,211 6,217,118 0.1Verisk Analytics, Inc. . . . . . . . . . . . . . . . . . . . . . . . . . . . . . . . . . . . . 5.50% 6/15/45 5,930 6,082,792 0.1 65,710,277 0.5
TECHNOLOGYBroadcom Corp./Broadcom Cayman Finance Ltd. . . . . . . . . . . . . . 3.13% 1/15/25 10,000 9,265,130 0.1Broadcom Corp./Broadcom Cayman Finance Ltd. . . . . . . . . . . . . . 3.63% 1/15/24 19,300 18,745,839 0.1Juniper Networks, Inc. . . . . . . . . . . . . . . . . . . . . . . . . . . . . . . . . . . . 3.30% 6/15/20 7,050 7,036,965 0.1Lam Research Corp.. . . . . . . . . . . . . . . . . . . . . . . . . . . . . . . . . . . . . 3.75% 3/15/26 15,107 15,150,644 0.1Micron Technology, Inc. . . . . . . . . . . . . . . . . . . . . . . . . . . . . . . . . . 4.64% 2/06/24 19,000 19,113,867 0.2NXP BV/NXP Funding LLC . . . . . . . . . . . . . . . . . . . . . . . . . . . . . . 4.63% 6/01/23 14,725 14,982,791 0.1NXP BV/NXP Funding LLC . . . . . . . . . . . . . . . . . . . . . . . . . . . . . . 4.88% 3/01/24 5,000 5,131,770 0.0Seagate HDD Cayman . . . . . . . . . . . . . . . . . . . . . . . . . . . . . . . . . . . 4.75% 1/01/25 14,551 14,010,619 0.1Seagate HDD Cayman . . . . . . . . . . . . . . . . . . . . . . . . . . . . . . . . . . . 4.88% 3/01/24 5,000 4,866,785 0.0 108,304,410 0.8
TRANSPORTATION - RAILROADSBNSF Funding Trust I . . . . . . . . . . . . . . . . . . . . . . . . . . . . . . . . . . . 6.61% 12/15/55 5,597 6,051,488 0.1
TRANSPORTATION - SERVICESAshtead Capital, Inc. . . . . . . . . . . . . . . . . . . . . . . . . . . . . . . . . . . . . 5.25% 8/01/26 15,460 15,661,969 0.1 892,620,621 6.8
UTILITYELECTRIC
Electricite de France SA(e) . . . . . . . . . . . . . . . . . . . . . . . . . . . . . . . 5.25% 1/29/23 26,000 25,772,500 0.2Southern California Edison Co., Series E(e) . . . . . . . . . . . . . . . . . . 6.25% 2/01/22 6,000 5,820,126 0.0 31,592,626 0.2 1,946,729,710 14.7
CORPORATES - NON-INVESTMENT GRADEINDUSTRIALBASIC
Alcoa Nederland Holding BV . . . . . . . . . . . . . . . . . . . . . . . . . . . . . 6.13% 5/15/28 1,615 1,652,978 0.0CF Industries, Inc. . . . . . . . . . . . . . . . . . . . . . . . . . . . . . . . . . . . . . . 4.95% 6/01/43 5,471 4,572,109 0.0CF Industries, Inc. . . . . . . . . . . . . . . . . . . . . . . . . . . . . . . . . . . . . . . 5.38% 3/15/44 6,692 5,841,226 0.0Crown Americas LLC/Crown Americas Capital Corp. VI . . . . . . . 4.75% 2/01/26 10,261 10,297,478 0.1Eldorado Gold Corp. . . . . . . . . . . . . . . . . . . . . . . . . . . . . . . . . . . . . 6.13% 12/15/20 7,813 7,589,306 0.1Freeport-McMoRan, Inc. . . . . . . . . . . . . . . . . . . . . . . . . . . . . . . . . . 4.55% 11/14/24 800 792,232 0.0Freeport-McMoRan, Inc. . . . . . . . . . . . . . . . . . . . . . . . . . . . . . . . . . 5.40% 11/14/34 12,984 11,868,181 0.1Freeport-McMoRan, Inc. . . . . . . . . . . . . . . . . . . . . . . . . . . . . . . . . . 6.88% 2/15/23 3,308 3,496,563 0.0Grinding Media, Inc./Moly-Cop AltaSteel Ltd.. . . . . . . . . . . . . . . . 7.38% 12/15/23 8,617 8,648,176 0.1Novelis Corp. . . . . . . . . . . . . . . . . . . . . . . . . . . . . . . . . . . . . . . . . . . 5.88% 9/30/26 3,873 3,767,585 0.0Novelis Corp. . . . . . . . . . . . . . . . . . . . . . . . . . . . . . . . . . . . . . . . . . . 6.25% 8/15/24 3,816 3,838,438 0.0Peabody Energy Corp. . . . . . . . . . . . . . . . . . . . . . . . . . . . . . . . . . . . 6.00% 3/31/22 11,923 12,042,743 0.1SPCM SA. . . . . . . . . . . . . . . . . . . . . . . . . . . . . . . . . . . . . . . . . . . . . 4.88% 9/15/25 6,338 6,206,258 0.1Valvoline, Inc. . . . . . . . . . . . . . . . . . . . . . . . . . . . . . . . . . . . . . . . . . 4.38% 8/15/25 7,669 7,281,056 0.1 87,894,329 0.7
CAPITAL GOODSArdagh Packaging Finance PLC/Ardagh Holdings USA, Inc. . . . . 4.63% 5/15/23 5,968 6,041,406 0.1Ardagh Packaging Finance PLC/Ardagh Holdings USA, Inc. . . . . 6.00% 2/15/25 2,000 1,975,000 0.0Ball Corp.. . . . . . . . . . . . . . . . . . . . . . . . . . . . . . . . . . . . . . . . . . . . . 4.38% 12/15/20 850 866,142 0.0BBA US Holdings, Inc. . . . . . . . . . . . . . . . . . . . . . . . . . . . . . . . . . . 5.38% 5/01/26 6,605 6,727,728 0.1Cleaver-Brooks, Inc. . . . . . . . . . . . . . . . . . . . . . . . . . . . . . . . . . . . . 7.88% 3/01/23 5,839 5,722,220 0.0Colfax Corp.. . . . . . . . . . . . . . . . . . . . . . . . . . . . . . . . . . . . . . . . . . . 6.38% 2/15/26 3,106 3,237,343 0.0JELD-WEN, Inc. . . . . . . . . . . . . . . . . . . . . . . . . . . . . . . . . . . . . . . . 4.63% 12/15/25 1,461 1,374,129 0.0JELD-WEN, Inc. . . . . . . . . . . . . . . . . . . . . . . . . . . . . . . . . . . . . . . . 4.88% 12/15/27 2,092 1,950,060 0.0Mueller Water Products, Inc. . . . . . . . . . . . . . . . . . . . . . . . . . . . . . . 5.50% 6/15/26 11,722 11,817,687 0.1SPX FLOW, Inc. . . . . . . . . . . . . . . . . . . . . . . . . . . . . . . . . . . . . . . . 5.88% 8/15/26 1,900 1,914,852 0.0Stevens Holding Co., Inc. . . . . . . . . . . . . . . . . . . . . . . . . . . . . . . . . 6.13% 10/01/26 4,933 5,057,366 0.0Tervita Escrow Corp. . . . . . . . . . . . . . . . . . . . . . . . . . . . . . . . . . . . . 7.63% 12/01/21 8,200 8,150,980 0.1TransDigm, Inc. . . . . . . . . . . . . . . . . . . . . . . . . . . . . . . . . . . . . . . . . 5.50% 10/15/20 2,000 2,001,626 0.0TransDigm, Inc. . . . . . . . . . . . . . . . . . . . . . . . . . . . . . . . . . . . . . . . . 6.25% 3/15/26 23,770 24,317,922 0.2TransDigm, Inc. . . . . . . . . . . . . . . . . . . . . . . . . . . . . . . . . . . . . . . . . 6.50% 7/15/24 4,400 4,444,229 0.0 85,598,690 0.6
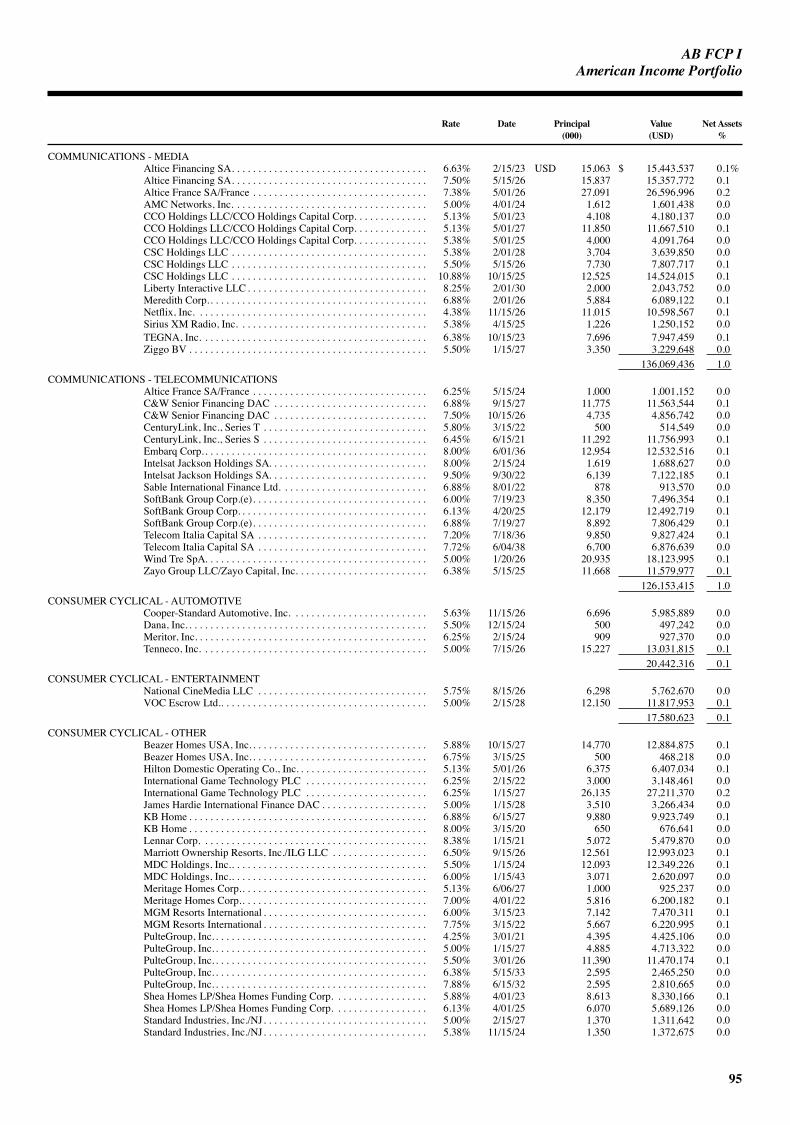
AB FCP I
95
AmericanIncomePortfolio
Rate Date Principal Value Net Assets (000) (USD) %
COMMUNICATIONS - MEDIAAltice Financing SA. . . . . . . . . . . . . . . . . . . . . . . . . . . . . . . . . . . . . 6.63% 2/15/23 USD 15,063 $ 15,443,537 0.1%Altice Financing SA. . . . . . . . . . . . . . . . . . . . . . . . . . . . . . . . . . . . . 7.50% 5/15/26 15,837 15,357,772 0.1Altice France SA/France . . . . . . . . . . . . . . . . . . . . . . . . . . . . . . . . . 7.38% 5/01/26 27,091 26,596,996 0.2AMC Networks, Inc. . . . . . . . . . . . . . . . . . . . . . . . . . . . . . . . . . . . . 5.00% 4/01/24 1,612 1,601,438 0.0CCO Holdings LLC/CCO Holdings Capital Corp. . . . . . . . . . . . . . 5.13% 5/01/23 4,108 4,180,137 0.0CCO Holdings LLC/CCO Holdings Capital Corp. . . . . . . . . . . . . . 5.13% 5/01/27 11,850 11,667,510 0.1CCO Holdings LLC/CCO Holdings Capital Corp. . . . . . . . . . . . . . 5.38% 5/01/25 4,000 4,091,764 0.0CSC Holdings LLC . . . . . . . . . . . . . . . . . . . . . . . . . . . . . . . . . . . . . 5.38% 2/01/28 3,704 3,639,850 0.0CSC Holdings LLC . . . . . . . . . . . . . . . . . . . . . . . . . . . . . . . . . . . . . 5.50% 5/15/26 7,730 7,807,717 0.1CSC Holdings LLC . . . . . . . . . . . . . . . . . . . . . . . . . . . . . . . . . . . . . 10.88% 10/15/25 12,525 14,524,015 0.1Liberty Interactive LLC . . . . . . . . . . . . . . . . . . . . . . . . . . . . . . . . . . 8.25% 2/01/30 2,000 2,043,752 0.0Meredith Corp.. . . . . . . . . . . . . . . . . . . . . . . . . . . . . . . . . . . . . . . . . 6.88% 2/01/26 5,884 6,089,122 0.1Netflix, Inc. . . . . . . . . . . . . . . . . . . . . . . . . . . . . . . . . . . . . . . . . . . . 4.38% 11/15/26 11,015 10,598,567 0.1Sirius XM Radio, Inc. . . . . . . . . . . . . . . . . . . . . . . . . . . . . . . . . . . . 5.38% 4/15/25 1,226 1,250,152 0.0TEGNA, Inc. . . . . . . . . . . . . . . . . . . . . . . . . . . . . . . . . . . . . . . . . . . 6.38% 10/15/23 7,696 7,947,459 0.1Ziggo BV . . . . . . . . . . . . . . . . . . . . . . . . . . . . . . . . . . . . . . . . . . . . . 5.50% 1/15/27 3,350 3,229,648 0.0 136,069,436 1.0
COMMUNICATIONS - TELECOMMUNICATIONSAltice France SA/France . . . . . . . . . . . . . . . . . . . . . . . . . . . . . . . . . 6.25% 5/15/24 1,000 1,001,152 0.0C&W Senior Financing DAC . . . . . . . . . . . . . . . . . . . . . . . . . . . . . 6.88% 9/15/27 11,775 11,563,544 0.1C&W Senior Financing DAC . . . . . . . . . . . . . . . . . . . . . . . . . . . . . 7.50% 10/15/26 4,735 4,856,742 0.0CenturyLink, Inc., Series T . . . . . . . . . . . . . . . . . . . . . . . . . . . . . . . 5.80% 3/15/22 500 514,549 0.0CenturyLink, Inc., Series S . . . . . . . . . . . . . . . . . . . . . . . . . . . . . . . 6.45% 6/15/21 11,292 11,756,993 0.1Embarq Corp.. . . . . . . . . . . . . . . . . . . . . . . . . . . . . . . . . . . . . . . . . . 8.00% 6/01/36 12,954 12,532,516 0.1Intelsat Jackson Holdings SA. . . . . . . . . . . . . . . . . . . . . . . . . . . . . . 8.00% 2/15/24 1,619 1,688,627 0.0Intelsat Jackson Holdings SA. . . . . . . . . . . . . . . . . . . . . . . . . . . . . . 9.50% 9/30/22 6,139 7,122,185 0.1Sable International Finance Ltd. . . . . . . . . . . . . . . . . . . . . . . . . . . . 6.88% 8/01/22 878 913,570 0.0SoftBank Group Corp.(e). . . . . . . . . . . . . . . . . . . . . . . . . . . . . . . . . 6.00% 7/19/23 8,350 7,496,354 0.1SoftBank Group Corp. . . . . . . . . . . . . . . . . . . . . . . . . . . . . . . . . . . . 6.13% 4/20/25 12,179 12,492,719 0.1SoftBank Group Corp.(e). . . . . . . . . . . . . . . . . . . . . . . . . . . . . . . . . 6.88% 7/19/27 8,892 7,806,429 0.1Telecom Italia Capital SA . . . . . . . . . . . . . . . . . . . . . . . . . . . . . . . . 7.20% 7/18/36 9,850 9,827,424 0.1Telecom Italia Capital SA . . . . . . . . . . . . . . . . . . . . . . . . . . . . . . . . 7.72% 6/04/38 6,700 6,876,639 0.0Wind Tre SpA. . . . . . . . . . . . . . . . . . . . . . . . . . . . . . . . . . . . . . . . . . 5.00% 1/20/26 20,935 18,123,995 0.1Zayo Group LLC/Zayo Capital, Inc. . . . . . . . . . . . . . . . . . . . . . . . . 6.38% 5/15/25 11,668 11,579,977 0.1 126,153,415 1.0
CONSUMER CYCLICAL - AUTOMOTIVECooper-Standard Automotive, Inc. . . . . . . . . . . . . . . . . . . . . . . . . . 5.63% 11/15/26 6,696 5,985,889 0.0Dana, Inc. . . . . . . . . . . . . . . . . . . . . . . . . . . . . . . . . . . . . . . . . . . . . . 5.50% 12/15/24 500 497,242 0.0Meritor, Inc. . . . . . . . . . . . . . . . . . . . . . . . . . . . . . . . . . . . . . . . . . . . 6.25% 2/15/24 909 927,370 0.0Tenneco, Inc. . . . . . . . . . . . . . . . . . . . . . . . . . . . . . . . . . . . . . . . . . . 5.00% 7/15/26 15,227 13,031,815 0.1 20,442,316 0.1
CONSUMER CYCLICAL - ENTERTAINMENTNational CineMedia LLC . . . . . . . . . . . . . . . . . . . . . . . . . . . . . . . . 5.75% 8/15/26 6,298 5,762,670 0.0VOC Escrow Ltd.. . . . . . . . . . . . . . . . . . . . . . . . . . . . . . . . . . . . . . . 5.00% 2/15/28 12,150 11,817,953 0.1 17,580,623 0.1
CONSUMER CYCLICAL - OTHERBeazer Homes USA, Inc. . . . . . . . . . . . . . . . . . . . . . . . . . . . . . . . . . 5.88% 10/15/27 14,770 12,884,875 0.1Beazer Homes USA, Inc. . . . . . . . . . . . . . . . . . . . . . . . . . . . . . . . . . 6.75% 3/15/25 500 468,218 0.0Hilton Domestic Operating Co., Inc. . . . . . . . . . . . . . . . . . . . . . . . . 5.13% 5/01/26 6,375 6,407,034 0.1International Game Technology PLC . . . . . . . . . . . . . . . . . . . . . . . 6.25% 2/15/22 3,000 3,148,461 0.0International Game Technology PLC . . . . . . . . . . . . . . . . . . . . . . . 6.25% 1/15/27 26,135 27,211,370 0.2James Hardie International Finance DAC . . . . . . . . . . . . . . . . . . . . 5.00% 1/15/28 3,510 3,266,434 0.0KB Home . . . . . . . . . . . . . . . . . . . . . . . . . . . . . . . . . . . . . . . . . . . . . 6.88% 6/15/27 9,880 9,923,749 0.1KB Home . . . . . . . . . . . . . . . . . . . . . . . . . . . . . . . . . . . . . . . . . . . . . 8.00% 3/15/20 650 676,641 0.0Lennar Corp. . . . . . . . . . . . . . . . . . . . . . . . . . . . . . . . . . . . . . . . . . . 8.38% 1/15/21 5,072 5,479,870 0.0Marriott Ownership Resorts, Inc./ILG LLC . . . . . . . . . . . . . . . . . . 6.50% 9/15/26 12,561 12,993,023 0.1MDC Holdings, Inc.. . . . . . . . . . . . . . . . . . . . . . . . . . . . . . . . . . . . . 5.50% 1/15/24 12,093 12,349,226 0.1MDC Holdings, Inc.. . . . . . . . . . . . . . . . . . . . . . . . . . . . . . . . . . . . . 6.00% 1/15/43 3,071 2,620,097 0.0Meritage Homes Corp.. . . . . . . . . . . . . . . . . . . . . . . . . . . . . . . . . . . 5.13% 6/06/27 1,000 925,237 0.0Meritage Homes Corp.. . . . . . . . . . . . . . . . . . . . . . . . . . . . . . . . . . . 7.00% 4/01/22 5,816 6,200,182 0.1MGM Resorts International . . . . . . . . . . . . . . . . . . . . . . . . . . . . . . . 6.00% 3/15/23 7,142 7,470,311 0.1MGM Resorts International . . . . . . . . . . . . . . . . . . . . . . . . . . . . . . . 7.75% 3/15/22 5,667 6,220,995 0.1PulteGroup, Inc. . . . . . . . . . . . . . . . . . . . . . . . . . . . . . . . . . . . . . . . . 4.25% 3/01/21 4,395 4,425,106 0.0PulteGroup, Inc. . . . . . . . . . . . . . . . . . . . . . . . . . . . . . . . . . . . . . . . . 5.00% 1/15/27 4,885 4,713,322 0.0PulteGroup, Inc. . . . . . . . . . . . . . . . . . . . . . . . . . . . . . . . . . . . . . . . . 5.50% 3/01/26 11,390 11,470,174 0.1PulteGroup, Inc. . . . . . . . . . . . . . . . . . . . . . . . . . . . . . . . . . . . . . . . . 6.38% 5/15/33 2,595 2,465,250 0.0PulteGroup, Inc. . . . . . . . . . . . . . . . . . . . . . . . . . . . . . . . . . . . . . . . . 7.88% 6/15/32 2,595 2,810,665 0.0Shea Homes LP/Shea Homes Funding Corp. . . . . . . . . . . . . . . . . . 5.88% 4/01/23 8,613 8,330,166 0.1Shea Homes LP/Shea Homes Funding Corp. . . . . . . . . . . . . . . . . . 6.13% 4/01/25 6,070 5,689,126 0.0Standard Industries, Inc./NJ. . . . . . . . . . . . . . . . . . . . . . . . . . . . . . . 5.00% 2/15/27 1,370 1,311,642 0.0Standard Industries, Inc./NJ. . . . . . . . . . . . . . . . . . . . . . . . . . . . . . . 5.38% 11/15/24 1,350 1,372,675 0.0

AB FCP I
96
Portfolio of investments (continued) AmericanIncomePortfolio
Rate Date Principal Value Net Assets (000) (USD) %
Sugarhouse HSP Gaming Prop Mezz LP/ Sugarhouse HSP Gaming Finance Corp.. . . . . . . . . . . . . . . . . . . 5.88% 5/15/25 USD 6,727 $ 6,654,066 0.1%
Taylor Morrison Communities, Inc./ Taylor Morrison Holdings II, Inc. . . . . . . . . . . . . . . . . . . . . . . . . 5.25% 4/15/21 4,030 4,030,000 0.0
Taylor Morrison Communities, Inc./ Taylor Morrison Holdings II, Inc. . . . . . . . . . . . . . . . . . . . . . . . . 5.63% 3/01/24 338 334,416 0.0
Taylor Morrison Communities, Inc./ Taylor Morrison Holdings II, Inc. . . . . . . . . . . . . . . . . . . . . . . . . 5.88% 4/15/23 15,519 15,519,000 0.1
Wyndham Hotels & Resorts, Inc. . . . . . . . . . . . . . . . . . . . . . . . . . . 5.38% 4/15/26 5,715 5,783,380 0.0Wynn Las Vegas LLC/Wynn Las Vegas Capital Corp. . . . . . . . . . . 5.50% 3/01/25 6,063 6,036,244 0.1 199,190,955 1.5
CONSUMER CYCLICAL - RETAILERSFirstCash, Inc. . . . . . . . . . . . . . . . . . . . . . . . . . . . . . . . . . . . . . . . . . 5.38% 6/01/24 9,131 9,267,481 0.1Group 1 Automotive, Inc. . . . . . . . . . . . . . . . . . . . . . . . . . . . . . . . . 5.25% 12/15/23 13,500 13,482,842 0.1Hanesbrands, Inc.. . . . . . . . . . . . . . . . . . . . . . . . . . . . . . . . . . . . . . . 4.88% 5/15/26 51 50,269 0.0L Brands, Inc.. . . . . . . . . . . . . . . . . . . . . . . . . . . . . . . . . . . . . . . . . . 6.75% 7/01/36 4,416 3,716,029 0.0L Brands, Inc.. . . . . . . . . . . . . . . . . . . . . . . . . . . . . . . . . . . . . . . . . . 6.88% 11/01/35 5,963 5,143,451 0.1L Brands, Inc.. . . . . . . . . . . . . . . . . . . . . . . . . . . . . . . . . . . . . . . . . . 6.95% 3/01/33 329 263,402 0.0L Brands, Inc.. . . . . . . . . . . . . . . . . . . . . . . . . . . . . . . . . . . . . . . . . . 7.60% 7/15/37 2,750 2,200,022 0.0 34,123,496 0.3
CONSUMER NON-CYCLICALAcadia Healthcare Co., Inc. . . . . . . . . . . . . . . . . . . . . . . . . . . . . . . . 5.63% 2/15/23 2,000 1,985,214 0.0Acadia Healthcare Co., Inc. . . . . . . . . . . . . . . . . . . . . . . . . . . . . . . . 6.50% 3/01/24 10,916 10,917,517 0.1Albertsons Cos. LLC/Safeway, Inc./New Albertsons LP/
Albertson’s LLC . . . . . . . . . . . . . . . . . . . . . . . . . . . . . . . . . . . . . 5.75% 3/15/25 4,169 3,970,973 0.0Albertsons Cos. LLC/Safeway, Inc./New Albertsons LP/
Albertson’s LLC . . . . . . . . . . . . . . . . . . . . . . . . . . . . . . . . . . . . . 6.63% 6/15/24 14,705 14,755,115 0.1Bausch Health Cos., Inc. . . . . . . . . . . . . . . . . . . . . . . . . . . . . . . . . . 5.50% 11/01/25 6,002 6,054,626 0.1Bausch Health Cos., Inc. . . . . . . . . . . . . . . . . . . . . . . . . . . . . . . . . . 5.75% 8/15/27 5,000 5,043,755 0.0Bausch Health Cos., Inc. . . . . . . . . . . . . . . . . . . . . . . . . . . . . . . . . . 6.50% 3/15/22 5,622 5,825,797 0.0Catalent Pharma Solutions, Inc.. . . . . . . . . . . . . . . . . . . . . . . . . . . . 4.88% 1/15/26 3,679 3,639,175 0.0DaVita, Inc. . . . . . . . . . . . . . . . . . . . . . . . . . . . . . . . . . . . . . . . . . . . 5.00% 5/01/25 4,760 4,596,423 0.0DaVita, Inc. . . . . . . . . . . . . . . . . . . . . . . . . . . . . . . . . . . . . . . . . . . . 5.13% 7/15/24 2,000 1,981,672 0.0Endo Dac/Endo Finance LLC/Endo Finco, Inc. . . . . . . . . . . . . . . . 6.00% 2/01/25 11,025 8,489,250 0.1First Quality Finance Co., Inc.. . . . . . . . . . . . . . . . . . . . . . . . . . . . . 4.63% 5/15/21 8,237 8,253,433 0.1HCA, Inc. . . . . . . . . . . . . . . . . . . . . . . . . . . . . . . . . . . . . . . . . . . . . . 5.38% 9/01/26 5,199 5,330,779 0.0HCA, Inc. . . . . . . . . . . . . . . . . . . . . . . . . . . . . . . . . . . . . . . . . . . . . . 5.63% 9/01/28 6,502 6,730,474 0.1HCA, Inc. . . . . . . . . . . . . . . . . . . . . . . . . . . . . . . . . . . . . . . . . . . . . . 7.50% 2/15/22 5,000 5,486,545 0.0Kinetic Concepts, Inc./KCI USA, Inc.. . . . . . . . . . . . . . . . . . . . . . . 7.88% 2/15/21 6,211 6,348,977 0.1Mallinckrodt International Finance SA/Mallinckrodt CB LLC. . . . 5.50% 4/15/25 14,570 11,935,059 0.1Mallinckrodt International Finance SA/Mallinckrodt CB LLC. . . . 5.63% 10/15/23 5,307 4,646,512 0.0Mallinckrodt International Finance SA/Mallinckrodt CB LLC. . . . 5.75% 8/01/22 2,700 2,539,644 0.0MEDNAX, Inc. . . . . . . . . . . . . . . . . . . . . . . . . . . . . . . . . . . . . . . . . 5.25% 12/01/23 8,081 8,168,404 0.1Post Holdings, Inc.. . . . . . . . . . . . . . . . . . . . . . . . . . . . . . . . . . . . . . 5.00% 8/15/26 14,218 13,684,242 0.1Post Holdings, Inc.. . . . . . . . . . . . . . . . . . . . . . . . . . . . . . . . . . . . . . 5.63% 1/15/28 7,135 6,923,305 0.1Post Holdings, Inc.. . . . . . . . . . . . . . . . . . . . . . . . . . . . . . . . . . . . . . 5.75% 3/01/27 1,000 989,907 0.0Spectrum Brands, Inc. . . . . . . . . . . . . . . . . . . . . . . . . . . . . . . . . . . . 5.75% 7/15/25 13,288 13,003,371 0.1Spectrum Brands, Inc. . . . . . . . . . . . . . . . . . . . . . . . . . . . . . . . . . . . 6.13% 12/15/24 2,611 2,584,511 0.0Tenet Healthcare Corp. . . . . . . . . . . . . . . . . . . . . . . . . . . . . . . . . . . 4.50% 4/01/21 3,784 3,841,225 0.0Tenet Healthcare Corp. . . . . . . . . . . . . . . . . . . . . . . . . . . . . . . . . . . 5.13% 5/01/25 7,709 7,644,815 0.1Tenet Healthcare Corp. . . . . . . . . . . . . . . . . . . . . . . . . . . . . . . . . . . 6.25% 2/01/27 8,500 8,763,432 0.1Vizient, Inc. . . . . . . . . . . . . . . . . . . . . . . . . . . . . . . . . . . . . . . . . . . . 10.38% 3/01/24 1,600 1,731,699 0.0 185,865,851 1.4
ENERGYAntero Resources Corp. . . . . . . . . . . . . . . . . . . . . . . . . . . . . . . . . . . 5.13% 12/01/22 2,615 2,618,366 0.0Antero Resources Corp. . . . . . . . . . . . . . . . . . . . . . . . . . . . . . . . . . . 5.63% 6/01/23 500 501,176 0.0Berry Petroleum Co. LLC . . . . . . . . . . . . . . . . . . . . . . . . . . . . . . . . 7.00% 2/15/26 6,480 6,484,821 0.0Bristow Group, Inc. . . . . . . . . . . . . . . . . . . . . . . . . . . . . . . . . . . . . . 8.75% 3/01/23 2,889 2,260,224 0.0Bruin E&P Partners LLC . . . . . . . . . . . . . . . . . . . . . . . . . . . . . . . . . 8.88% 8/01/23 10,377 10,141,868 0.1Carrizo Oil & Gas, Inc. . . . . . . . . . . . . . . . . . . . . . . . . . . . . . . . . . . 6.25% 4/15/23 6,050 5,966,214 0.0Cheniere Energy Partners LP. . . . . . . . . . . . . . . . . . . . . . . . . . . . . . 5.63% 10/01/26 15,850 16,122,192 0.1Diamond Offshore Drilling, Inc. . . . . . . . . . . . . . . . . . . . . . . . . . . . 4.88% 11/01/43 19,387 12,241,087 0.1Diamond Offshore Drilling, Inc. . . . . . . . . . . . . . . . . . . . . . . . . . . . 7.88% 8/15/25 1,000 945,220 0.0Energy Transfer LP . . . . . . . . . . . . . . . . . . . . . . . . . . . . . . . . . . . . . 4.25% 3/15/23 6,000 6,077,292 0.0Genesis Energy LP/Genesis Energy Finance Corp.. . . . . . . . . . . . . 6.25% 5/15/26 10,910 10,149,584 0.1Genesis Energy LP/Genesis Energy Finance Corp.. . . . . . . . . . . . . 6.50% 10/01/25 2,427 2,329,131 0.0Gulfport Energy Corp. . . . . . . . . . . . . . . . . . . . . . . . . . . . . . . . . . . . 6.00% 10/15/24 5,620 5,102,162 0.0Gulfport Energy Corp. . . . . . . . . . . . . . . . . . . . . . . . . . . . . . . . . . . . 6.38% 5/15/25 10,823 9,761,762 0.1Gulfport Energy Corp. . . . . . . . . . . . . . . . . . . . . . . . . . . . . . . . . . . . 6.38% 1/15/26 8,966 7,885,355 0.1Hess Infrastructure Partners LP/Hess Infrastructure Partners
Finance Corp. . . . . . . . . . . . . . . . . . . . . . . . . . . . . . . . . . . . . . . . 5.63% 2/15/26 8,201 8,242,046 0.1Hilcorp Energy I LP/Hilcorp Finance Co. . . . . . . . . . . . . . . . . . . . . 5.75% 10/01/25 14,944 14,848,911 0.1Indigo Natural Resources LLC . . . . . . . . . . . . . . . . . . . . . . . . . . . . 6.88% 2/15/26 12,270 10,694,949 0.1

AB FCP I
97
AmericanIncomePortfolio
Rate Date Principal Value Net Assets (000) (USD) %
Murphy Oil USA, Inc. . . . . . . . . . . . . . . . . . . . . . . . . . . . . . . . . . . . 5.63% 5/01/27 USD 661 $ 667,609 0.0%Nabors Industries, Inc. . . . . . . . . . . . . . . . . . . . . . . . . . . . . . . . . . . . 4.63% 9/15/21 5,615 5,499,140 0.0Nabors Industries, Inc. . . . . . . . . . . . . . . . . . . . . . . . . . . . . . . . . . . . 5.50% 1/15/23 10,462 9,841,488 0.1Nabors Industries, Inc. . . . . . . . . . . . . . . . . . . . . . . . . . . . . . . . . . . . 5.75% 2/01/25 2,000 1,771,278 0.0Nine Energy Service, Inc. . . . . . . . . . . . . . . . . . . . . . . . . . . . . . . . . 8.75% 11/01/23 5,223 5,224,128 0.0Parkland Fuel Corp. . . . . . . . . . . . . . . . . . . . . . . . . . . . . . . . . . . . . . 6.00% 4/01/26 12,341 12,130,611 0.1PDC Energy, Inc. . . . . . . . . . . . . . . . . . . . . . . . . . . . . . . . . . . . . . . . 5.75% 5/15/26 10,370 10,001,035 0.1PDC Energy, Inc. . . . . . . . . . . . . . . . . . . . . . . . . . . . . . . . . . . . . . . . 6.13% 9/15/24 6,833 6,765,141 0.1Precision Drilling Corp. . . . . . . . . . . . . . . . . . . . . . . . . . . . . . . . . . . 7.13% 1/15/26 9,035 8,892,066 0.1QEP Resources, Inc.. . . . . . . . . . . . . . . . . . . . . . . . . . . . . . . . . . . . . 5.25% 5/01/23 6,961 6,717,810 0.1QEP Resources, Inc.. . . . . . . . . . . . . . . . . . . . . . . . . . . . . . . . . . . . . 5.38% 10/01/22 7,426 7,334,593 0.1Range Resources Corp. . . . . . . . . . . . . . . . . . . . . . . . . . . . . . . . . . . 4.88% 5/15/25 2,400 2,200,534 0.0Range Resources Corp. . . . . . . . . . . . . . . . . . . . . . . . . . . . . . . . . . . 5.00% 8/15/22 6,322 6,234,522 0.0Range Resources Corp. . . . . . . . . . . . . . . . . . . . . . . . . . . . . . . . . . . 5.00% 3/15/23 11,057 10,675,655 0.1SemGroup Corp. . . . . . . . . . . . . . . . . . . . . . . . . . . . . . . . . . . . . . . . 6.38% 3/15/25 9,467 8,910,880 0.1SemGroup Corp. . . . . . . . . . . . . . . . . . . . . . . . . . . . . . . . . . . . . . . . 7.25% 3/15/26 6,061 5,864,981 0.0SemGroup Corp./Rose Rock Finance Corp. . . . . . . . . . . . . . . . . . . 5.63% 7/15/22 1,000 973,463 0.0SM Energy Co.. . . . . . . . . . . . . . . . . . . . . . . . . . . . . . . . . . . . . . . . . 5.63% 6/01/25 2,375 2,232,500 0.0SM Energy Co.. . . . . . . . . . . . . . . . . . . . . . . . . . . . . . . . . . . . . . . . . 6.63% 1/15/27 8,100 7,723,342 0.1SM Energy Co.. . . . . . . . . . . . . . . . . . . . . . . . . . . . . . . . . . . . . . . . . 6.75% 9/15/26 8,783 8,427,824 0.1Southern Star Central Corp.. . . . . . . . . . . . . . . . . . . . . . . . . . . . . . . 5.13% 7/15/22 2,000 1,983,730 0.0SRC Energy, Inc. . . . . . . . . . . . . . . . . . . . . . . . . . . . . . . . . . . . . . . . 6.25% 12/01/25 8,694 7,911,105 0.1Sunoco LP/Sunoco Finance Corp. . . . . . . . . . . . . . . . . . . . . . . . . . . 5.50% 2/15/26 10,788 10,708,622 0.1Sunoco LP/Sunoco Finance Corp. . . . . . . . . . . . . . . . . . . . . . . . . . . 5.88% 3/15/28 6,667 6,595,590 0.1Targa Resources Partners LP/Targa Resources Partners
Finance Corp. . . . . . . . . . . . . . . . . . . . . . . . . . . . . . . . . . . . . . . . 6.50% 7/15/27 16,917 17,892,502 0.1Transocean Phoenix 2 Ltd.. . . . . . . . . . . . . . . . . . . . . . . . . . . . . . . . 7.75% 10/15/24 8,238 8,664,877 0.1Transocean Poseidon Ltd. . . . . . . . . . . . . . . . . . . . . . . . . . . . . . . . . 6.88% 2/01/27 8,159 8,386,204 0.1Whiting Petroleum Corp. . . . . . . . . . . . . . . . . . . . . . . . . . . . . . . . . . 5.75% 3/15/21 5,314 5,378,055 0.0Whiting Petroleum Corp. . . . . . . . . . . . . . . . . . . . . . . . . . . . . . . . . . 6.25% 4/01/23 3,850 3,851,629 0.0Whiting Petroleum Corp. . . . . . . . . . . . . . . . . . . . . . . . . . . . . . . . . . 6.63% 1/15/26 14,557 14,262,949 0.1WPX Energy, Inc. . . . . . . . . . . . . . . . . . . . . . . . . . . . . . . . . . . . . . . 5.75% 6/01/26 6,240 6,294,594 0.0WPX Energy, Inc. . . . . . . . . . . . . . . . . . . . . . . . . . . . . . . . . . . . . . . 6.00% 1/15/22 500 517,529 0.0 352,908,346 2.7
OTHER INDUSTRIALAlgeco Global Finance PLC . . . . . . . . . . . . . . . . . . . . . . . . . . . . . . 8.00% 2/15/23 19,470 19,438,069 0.2H&E Equipment Services, Inc. . . . . . . . . . . . . . . . . . . . . . . . . . . . . 5.63% 9/01/25 15,883 15,743,500 0.1 35,181,569 0.3
SERVICESAPX Group, Inc. . . . . . . . . . . . . . . . . . . . . . . . . . . . . . . . . . . . . . . . 7.88% 12/01/22 34,175 34,001,869 0.3Carlson Travel, Inc. . . . . . . . . . . . . . . . . . . . . . . . . . . . . . . . . . . . . . 6.75% 12/15/23 5,718 5,703,928 0.1Prime Security Services Borrower LLC/Prime Finance, Inc. . . . . . 9.25% 5/15/23 13,004 13,703,888 0.1Refinitiv US Holdings, Inc. . . . . . . . . . . . . . . . . . . . . . . . . . . . . . . . 6.25% 5/15/26 3,890 3,919,226 0.0Ritchie Bros Auctioneers, Inc. . . . . . . . . . . . . . . . . . . . . . . . . . . . . . 5.38% 1/15/25 3,575 3,645,678 0.0Sabre GLBL, Inc.. . . . . . . . . . . . . . . . . . . . . . . . . . . . . . . . . . . . . . . 5.25% 11/15/23 1,196 1,226,192 0.0Sabre GLBL, Inc.. . . . . . . . . . . . . . . . . . . . . . . . . . . . . . . . . . . . . . . 5.38% 4/15/23 809 826,670 0.0 63,027,451 0.5
TECHNOLOGYCommScope Finance LLC. . . . . . . . . . . . . . . . . . . . . . . . . . . . . . . . 5.50% 3/01/24 4,669 4,752,776 0.0CommScope Finance LLC. . . . . . . . . . . . . . . . . . . . . . . . . . . . . . . . 6.00% 3/01/26 6,340 6,495,324 0.1CommScope Finance LLC. . . . . . . . . . . . . . . . . . . . . . . . . . . . . . . . 8.25% 3/01/27 8,758 9,087,931 0.1Dell, Inc.. . . . . . . . . . . . . . . . . . . . . . . . . . . . . . . . . . . . . . . . . . . . . . 6.50% 4/15/38 3,736 3,584,834 0.0Iron Mountain, Inc. . . . . . . . . . . . . . . . . . . . . . . . . . . . . . . . . . . . . . 5.75% 8/15/24 1,000 1,003,930 0.0Veritas US, Inc./Veritas Bermuda Ltd.. . . . . . . . . . . . . . . . . . . . . . . 7.50% 2/01/23 2,458 2,339,910 0.0 27,264,705 0.2
TRANSPORTATION - SERVICESAvis Budget Car Rental LLC/Avis Budget Finance, Inc. . . . . . . . . 5.25% 3/15/25 11,961 11,403,749 0.1Hertz Corp. (The). . . . . . . . . . . . . . . . . . . . . . . . . . . . . . . . . . . . . . . 5.50% 10/15/24 20,842 17,720,952 0.1Hertz Corp. (The). . . . . . . . . . . . . . . . . . . . . . . . . . . . . . . . . . . . . . . 7.63% 6/01/22 18,820 19,239,724 0.1United Rentals North America, Inc.. . . . . . . . . . . . . . . . . . . . . . . . . 6.50% 12/15/26 6,943 7,248,464 0.1XPO Logistics, Inc. . . . . . . . . . . . . . . . . . . . . . . . . . . . . . . . . . . . . . 6.75% 8/15/24 19,250 19,376,761 0.2 74,989,650 0.6 1,446,290,832 11.0
FINANCIAL INSTITUTIONSBANKING
Ally Financial, Inc. . . . . . . . . . . . . . . . . . . . . . . . . . . . . . . . . . . . . . 4.25% 4/15/21 3,833 3,873,093 0.0Ally Financial, Inc. . . . . . . . . . . . . . . . . . . . . . . . . . . . . . . . . . . . . . 8.00% 11/01/31 10,508 12,931,817 0.1American Express Co., Series C(e) . . . . . . . . . . . . . . . . . . . . . . . . . 4.90% 3/15/20 2,849 2,835,821 0.0Barclays PLC(e). . . . . . . . . . . . . . . . . . . . . . . . . . . . . . . . . . . . . . . . 7.75% 9/15/23 1,804 1,798,512 0.0Barclays PLC(e). . . . . . . . . . . . . . . . . . . . . . . . . . . . . . . . . . . . . . . . 7.88% 3/15/22 15,551 16,346,760 0.1Citigroup, Inc., Series O(e) . . . . . . . . . . . . . . . . . . . . . . . . . . . . . . . 5.88% 3/27/20 2,096 2,115,656 0.0Citigroup, Inc., Series Q(e) . . . . . . . . . . . . . . . . . . . . . . . . . . . . . . . 5.95% 8/15/20 3,706 3,749,775 0.0
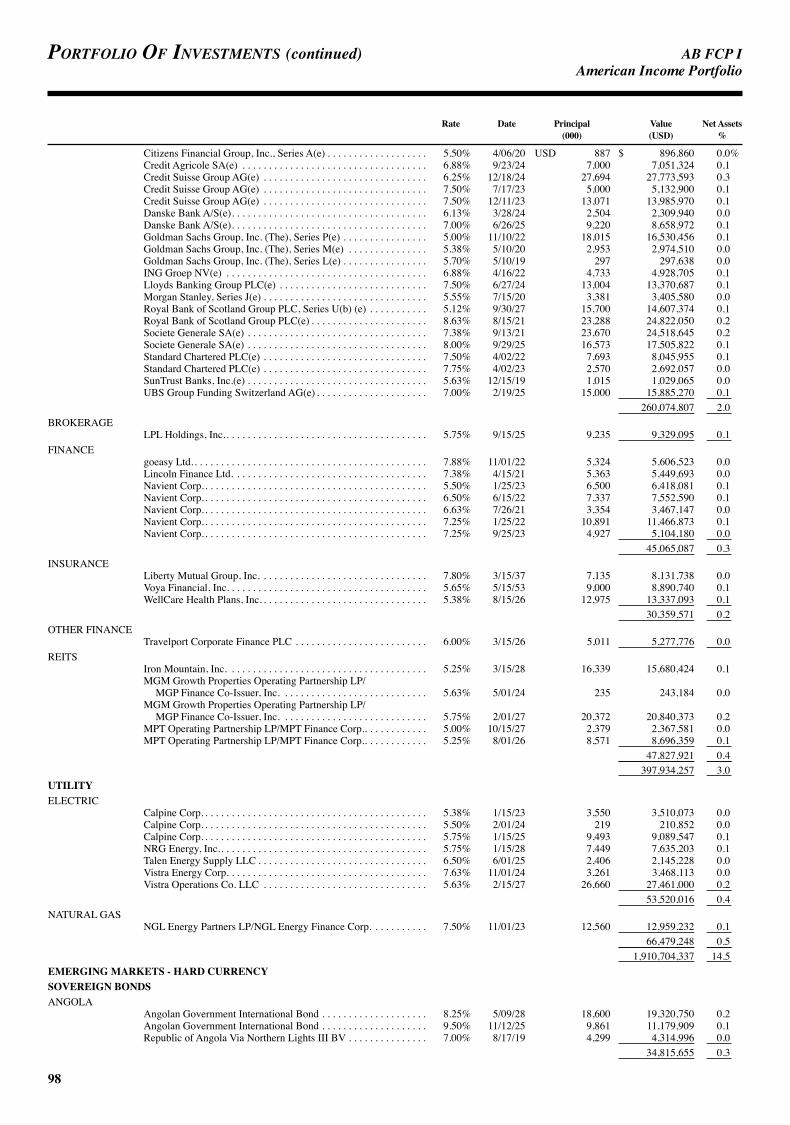
AB FCP I
98
Portfolio of investments (continued) AmericanIncomePortfolio
Rate Date Principal Value Net Assets (000) (USD) %
Citizens Financial Group, Inc., Series A(e) . . . . . . . . . . . . . . . . . . . 5.50% 4/06/20 USD 887 $ 896,860 0.0%Credit Agricole SA(e) . . . . . . . . . . . . . . . . . . . . . . . . . . . . . . . . . . . 6.88% 9/23/24 7,000 7,051,324 0.1Credit Suisse Group AG(e) . . . . . . . . . . . . . . . . . . . . . . . . . . . . . . . 6.25% 12/18/24 27,694 27,773,593 0.3Credit Suisse Group AG(e) . . . . . . . . . . . . . . . . . . . . . . . . . . . . . . . 7.50% 7/17/23 5,000 5,132,900 0.1Credit Suisse Group AG(e) . . . . . . . . . . . . . . . . . . . . . . . . . . . . . . . 7.50% 12/11/23 13,071 13,985,970 0.1Danske Bank A/S(e). . . . . . . . . . . . . . . . . . . . . . . . . . . . . . . . . . . . . 6.13% 3/28/24 2,504 2,309,940 0.0Danske Bank A/S(e). . . . . . . . . . . . . . . . . . . . . . . . . . . . . . . . . . . . . 7.00% 6/26/25 9,220 8,658,972 0.1Goldman Sachs Group, Inc. (The), Series P(e) . . . . . . . . . . . . . . . . 5.00% 11/10/22 18,015 16,530,456 0.1Goldman Sachs Group, Inc. (The), Series M(e) . . . . . . . . . . . . . . . 5.38% 5/10/20 2,953 2,974,510 0.0Goldman Sachs Group, Inc. (The), Series L(e) . . . . . . . . . . . . . . . . 5.70% 5/10/19 297 297,638 0.0ING Groep NV(e) . . . . . . . . . . . . . . . . . . . . . . . . . . . . . . . . . . . . . . 6.88% 4/16/22 4,733 4,928,705 0.1Lloyds Banking Group PLC(e) . . . . . . . . . . . . . . . . . . . . . . . . . . . . 7.50% 6/27/24 13,004 13,370,687 0.1Morgan Stanley, Series J(e) . . . . . . . . . . . . . . . . . . . . . . . . . . . . . . . 5.55% 7/15/20 3,381 3,405,580 0.0Royal Bank of Scotland Group PLC, Series U(b) (e) . . . . . . . . . . . 5.12% 9/30/27 15,700 14,607,374 0.1Royal Bank of Scotland Group PLC(e) . . . . . . . . . . . . . . . . . . . . . . 8.63% 8/15/21 23,288 24,822,050 0.2Societe Generale SA(e) . . . . . . . . . . . . . . . . . . . . . . . . . . . . . . . . . . 7.38% 9/13/21 23,670 24,518,645 0.2Societe Generale SA(e) . . . . . . . . . . . . . . . . . . . . . . . . . . . . . . . . . . 8.00% 9/29/25 16,573 17,505,822 0.1Standard Chartered PLC(e) . . . . . . . . . . . . . . . . . . . . . . . . . . . . . . . 7.50% 4/02/22 7,693 8,045,955 0.1Standard Chartered PLC(e) . . . . . . . . . . . . . . . . . . . . . . . . . . . . . . . 7.75% 4/02/23 2,570 2,692,057 0.0SunTrust Banks, Inc.(e) . . . . . . . . . . . . . . . . . . . . . . . . . . . . . . . . . . 5.63% 12/15/19 1,015 1,029,065 0.0UBS Group Funding Switzerland AG(e) . . . . . . . . . . . . . . . . . . . . . 7.00% 2/19/25 15,000 15,885,270 0.1 260,074,807 2.0
BROKERAGELPL Holdings, Inc.. . . . . . . . . . . . . . . . . . . . . . . . . . . . . . . . . . . . . . 5.75% 9/15/25 9,235 9,329,095 0.1
FINANCEgoeasy Ltd.. . . . . . . . . . . . . . . . . . . . . . . . . . . . . . . . . . . . . . . . . . . . 7.88% 11/01/22 5,324 5,606,523 0.0Lincoln Finance Ltd. . . . . . . . . . . . . . . . . . . . . . . . . . . . . . . . . . . . . 7.38% 4/15/21 5,363 5,449,693 0.0Navient Corp.. . . . . . . . . . . . . . . . . . . . . . . . . . . . . . . . . . . . . . . . . . 5.50% 1/25/23 6,500 6,418,081 0.1Navient Corp.. . . . . . . . . . . . . . . . . . . . . . . . . . . . . . . . . . . . . . . . . . 6.50% 6/15/22 7,337 7,552,590 0.1Navient Corp.. . . . . . . . . . . . . . . . . . . . . . . . . . . . . . . . . . . . . . . . . . 6.63% 7/26/21 3,354 3,467,147 0.0Navient Corp.. . . . . . . . . . . . . . . . . . . . . . . . . . . . . . . . . . . . . . . . . . 7.25% 1/25/22 10,891 11,466,873 0.1Navient Corp.. . . . . . . . . . . . . . . . . . . . . . . . . . . . . . . . . . . . . . . . . . 7.25% 9/25/23 4,927 5,104,180 0.0 45,065,087 0.3
INSURANCELiberty Mutual Group, Inc. . . . . . . . . . . . . . . . . . . . . . . . . . . . . . . . 7.80% 3/15/37 7,135 8,131,738 0.0Voya Financial, Inc. . . . . . . . . . . . . . . . . . . . . . . . . . . . . . . . . . . . . . 5.65% 5/15/53 9,000 8,890,740 0.1WellCare Health Plans, Inc. . . . . . . . . . . . . . . . . . . . . . . . . . . . . . . . 5.38% 8/15/26 12,975 13,337,093 0.1 30,359,571 0.2
OTHER FINANCETravelport Corporate Finance PLC . . . . . . . . . . . . . . . . . . . . . . . . . 6.00% 3/15/26 5,011 5,277,776 0.0
REITSIron Mountain, Inc. . . . . . . . . . . . . . . . . . . . . . . . . . . . . . . . . . . . . . 5.25% 3/15/28 16,339 15,680,424 0.1MGM Growth Properties Operating Partnership LP/
MGP Finance Co-Issuer, Inc. . . . . . . . . . . . . . . . . . . . . . . . . . . . 5.63% 5/01/24 235 243,184 0.0MGM Growth Properties Operating Partnership LP/
MGP Finance Co-Issuer, Inc. . . . . . . . . . . . . . . . . . . . . . . . . . . . 5.75% 2/01/27 20,372 20,840,373 0.2MPT Operating Partnership LP/MPT Finance Corp.. . . . . . . . . . . . 5.00% 10/15/27 2,379 2,367,581 0.0MPT Operating Partnership LP/MPT Finance Corp.. . . . . . . . . . . . 5.25% 8/01/26 8,571 8,696,359 0.1 47,827,921 0.4 397,934,257 3.0
UTILITYELECTRIC
Calpine Corp. . . . . . . . . . . . . . . . . . . . . . . . . . . . . . . . . . . . . . . . . . . 5.38% 1/15/23 3,550 3,510,073 0.0Calpine Corp. . . . . . . . . . . . . . . . . . . . . . . . . . . . . . . . . . . . . . . . . . . 5.50% 2/01/24 219 210,852 0.0Calpine Corp. . . . . . . . . . . . . . . . . . . . . . . . . . . . . . . . . . . . . . . . . . . 5.75% 1/15/25 9,493 9,089,547 0.1NRG Energy, Inc.. . . . . . . . . . . . . . . . . . . . . . . . . . . . . . . . . . . . . . . 5.75% 1/15/28 7,449 7,635,203 0.1Talen Energy Supply LLC . . . . . . . . . . . . . . . . . . . . . . . . . . . . . . . . 6.50% 6/01/25 2,406 2,145,228 0.0Vistra Energy Corp. . . . . . . . . . . . . . . . . . . . . . . . . . . . . . . . . . . . . . 7.63% 11/01/24 3,261 3,468,113 0.0Vistra Operations Co. LLC . . . . . . . . . . . . . . . . . . . . . . . . . . . . . . . 5.63% 2/15/27 26,660 27,461,000 0.2 53,520,016 0.4
NATURAL GASNGL Energy Partners LP/NGL Energy Finance Corp. . . . . . . . . . . 7.50% 11/01/23 12,560 12,959,232 0.1 66,479,248 0.5 1,910,704,337 14.5
EMERGING MARKETS - HARD CURRENCYSOVEREIGN BONDSANGOLA
Angolan Government International Bond . . . . . . . . . . . . . . . . . . . . 8.25% 5/09/28 18,600 19,320,750 0.2Angolan Government International Bond . . . . . . . . . . . . . . . . . . . . 9.50% 11/12/25 9,861 11,179,909 0.1Republic of Angola Via Northern Lights III BV . . . . . . . . . . . . . . . 7.00% 8/17/19 4,299 4,314,996 0.0 34,815,655 0.3
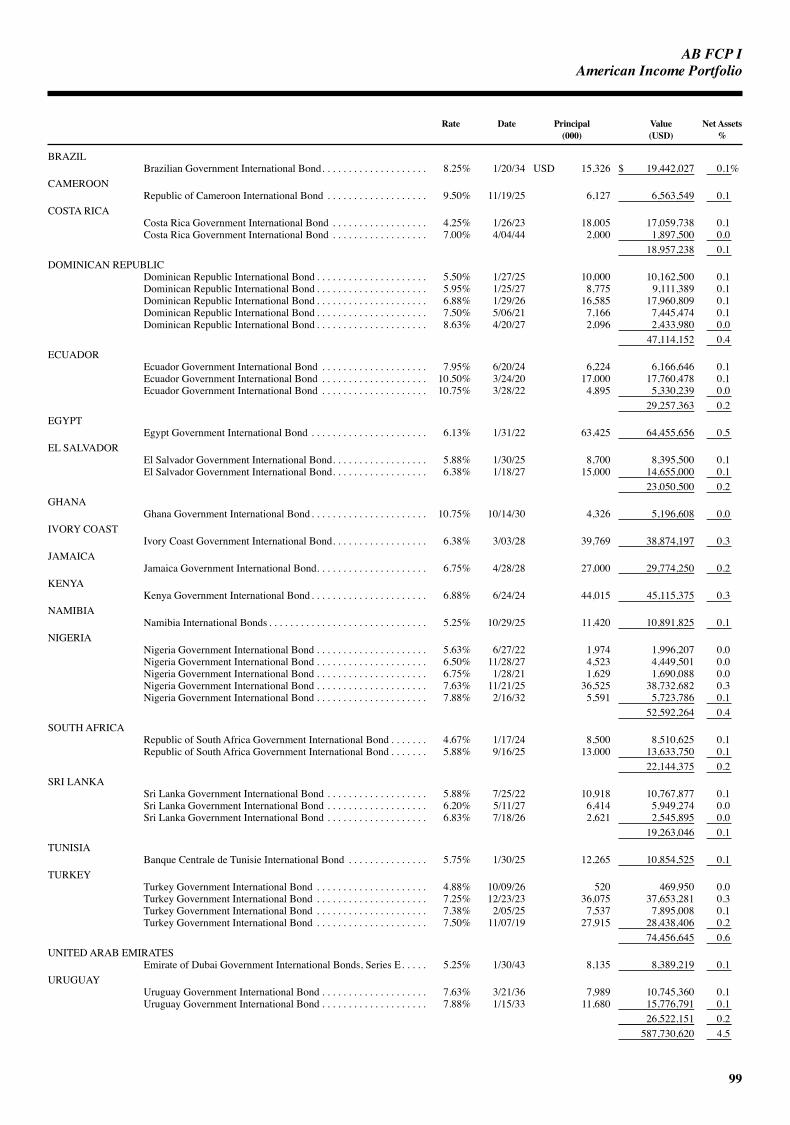
AB FCP I
99
AmericanIncomePortfolio
Rate Date Principal Value Net Assets (000) (USD) %
BRAZILBrazilian Government International Bond. . . . . . . . . . . . . . . . . . . . 8.25% 1/20/34 USD 15,326 $ 19,442,027 0.1%
CAMEROONRepublic of Cameroon International Bond . . . . . . . . . . . . . . . . . . . 9.50% 11/19/25 6,127 6,563,549 0.1
COSTA RICACosta Rica Government International Bond . . . . . . . . . . . . . . . . . . 4.25% 1/26/23 18,005 17,059,738 0.1Costa Rica Government International Bond . . . . . . . . . . . . . . . . . . 7.00% 4/04/44 2,000 1,897,500 0.0 18,957,238 0.1
DOMINICAN REPUBLICDominican Republic International Bond . . . . . . . . . . . . . . . . . . . . . 5.50% 1/27/25 10,000 10,162,500 0.1Dominican Republic International Bond . . . . . . . . . . . . . . . . . . . . . 5.95% 1/25/27 8,775 9,111,389 0.1Dominican Republic International Bond . . . . . . . . . . . . . . . . . . . . . 6.88% 1/29/26 16,585 17,960,809 0.1Dominican Republic International Bond . . . . . . . . . . . . . . . . . . . . . 7.50% 5/06/21 7,166 7,445,474 0.1Dominican Republic International Bond . . . . . . . . . . . . . . . . . . . . . 8.63% 4/20/27 2,096 2,433,980 0.0 47,114,152 0.4
ECUADOREcuador Government International Bond . . . . . . . . . . . . . . . . . . . . 7.95% 6/20/24 6,224 6,166,646 0.1Ecuador Government International Bond . . . . . . . . . . . . . . . . . . . . 10.50% 3/24/20 17,000 17,760,478 0.1Ecuador Government International Bond . . . . . . . . . . . . . . . . . . . . 10.75% 3/28/22 4,895 5,330,239 0.0 29,257,363 0.2
EGYPTEgypt Government International Bond . . . . . . . . . . . . . . . . . . . . . . 6.13% 1/31/22 63,425 64,455,656 0.5
EL SALVADOREl Salvador Government International Bond. . . . . . . . . . . . . . . . . . 5.88% 1/30/25 8,700 8,395,500 0.1El Salvador Government International Bond. . . . . . . . . . . . . . . . . . 6.38% 1/18/27 15,000 14,655,000 0.1 23,050,500 0.2
GHANAGhana Government International Bond . . . . . . . . . . . . . . . . . . . . . . 10.75% 10/14/30 4,326 5,196,608 0.0
IVORY COASTIvory Coast Government International Bond. . . . . . . . . . . . . . . . . . 6.38% 3/03/28 39,769 38,874,197 0.3
JAMAICAJamaica Government International Bond. . . . . . . . . . . . . . . . . . . . . 6.75% 4/28/28 27,000 29,774,250 0.2
KENYAKenya Government International Bond . . . . . . . . . . . . . . . . . . . . . . 6.88% 6/24/24 44,015 45,115,375 0.3
NAMIBIANamibia International Bonds . . . . . . . . . . . . . . . . . . . . . . . . . . . . . . 5.25% 10/29/25 11,420 10,891,825 0.1
NIGERIANigeria Government International Bond . . . . . . . . . . . . . . . . . . . . . 5.63% 6/27/22 1,974 1,996,207 0.0Nigeria Government International Bond . . . . . . . . . . . . . . . . . . . . . 6.50% 11/28/27 4,523 4,449,501 0.0Nigeria Government International Bond . . . . . . . . . . . . . . . . . . . . . 6.75% 1/28/21 1,629 1,690,088 0.0Nigeria Government International Bond . . . . . . . . . . . . . . . . . . . . . 7.63% 11/21/25 36,525 38,732,682 0.3Nigeria Government International Bond . . . . . . . . . . . . . . . . . . . . . 7.88% 2/16/32 5,591 5,723,786 0.1 52,592,264 0.4
SOUTH AFRICARepublic of South Africa Government International Bond . . . . . . . 4.67% 1/17/24 8,500 8,510,625 0.1Republic of South Africa Government International Bond . . . . . . . 5.88% 9/16/25 13,000 13,633,750 0.1 22,144,375 0.2
SRI LANKASri Lanka Government International Bond . . . . . . . . . . . . . . . . . . . 5.88% 7/25/22 10,918 10,767,877 0.1Sri Lanka Government International Bond . . . . . . . . . . . . . . . . . . . 6.20% 5/11/27 6,414 5,949,274 0.0Sri Lanka Government International Bond . . . . . . . . . . . . . . . . . . . 6.83% 7/18/26 2,621 2,545,895 0.0 19,263,046 0.1
TUNISIABanque Centrale de Tunisie International Bond . . . . . . . . . . . . . . . 5.75% 1/30/25 12,265 10,854,525 0.1
TURKEYTurkey Government International Bond . . . . . . . . . . . . . . . . . . . . . 4.88% 10/09/26 520 469,950 0.0Turkey Government International Bond . . . . . . . . . . . . . . . . . . . . . 7.25% 12/23/23 36,075 37,653,281 0.3Turkey Government International Bond . . . . . . . . . . . . . . . . . . . . . 7.38% 2/05/25 7,537 7,895,008 0.1Turkey Government International Bond . . . . . . . . . . . . . . . . . . . . . 7.50% 11/07/19 27,915 28,438,406 0.2 74,456,645 0.6
UNITED ARAB EMIRATESEmirate of Dubai Government International Bonds, Series E. . . . . 5.25% 1/30/43 8,135 8,389,219 0.1
URUGUAYUruguay Government International Bond . . . . . . . . . . . . . . . . . . . . 7.63% 3/21/36 7,989 10,745,360 0.1Uruguay Government International Bond . . . . . . . . . . . . . . . . . . . . 7.88% 1/15/33 11,680 15,776,791 0.1 26,522,151 0.2 587,730,620 4.5

AB FCP I
100
Portfolio of investments (continued) AmericanIncomePortfolio
Rate Date Principal Value Net Assets (000) (USD) %
INDUSTRIALBASIC
ABJA Investment Co. Pte Ltd.. . . . . . . . . . . . . . . . . . . . . . . . . . . . . 5.45% 1/24/28 USD 12,300 $ 11,193,000 0.1%Anglo American Capital PLC . . . . . . . . . . . . . . . . . . . . . . . . . . . . . 3.63% 9/11/24 900 874,802 0.0Anglo American Capital PLC . . . . . . . . . . . . . . . . . . . . . . . . . . . . . 4.88% 5/14/25 3,145 3,221,691 0.0Braskem America Finance Co. . . . . . . . . . . . . . . . . . . . . . . . . . . . . 7.13% 7/22/41 22,522 26,294,435 0.2CSN Resources SA . . . . . . . . . . . . . . . . . . . . . . . . . . . . . . . . . . . . . 7.63% 2/13/23 230 230,949 0.0Gold Fields Orogen Holdings BVI Ltd.. . . . . . . . . . . . . . . . . . . . . . 4.88% 10/07/20 11,837 11,943,533 0.1GTL Trade Finance, Inc./Gerdau Holdings, Inc. . . . . . . . . . . . . . . . 5.89% 4/29/24 5,434 5,746,455 0.1Klabin Finance SA. . . . . . . . . . . . . . . . . . . . . . . . . . . . . . . . . . . . . . 5.25% 7/16/24 3,000 3,026,250 0.0Minsur SA . . . . . . . . . . . . . . . . . . . . . . . . . . . . . . . . . . . . . . . . . . . . 6.25% 2/07/24 3,000 3,195,234 0.0Nexa Resources SA . . . . . . . . . . . . . . . . . . . . . . . . . . . . . . . . . . . . . 5.38% 5/04/27 11,230 11,335,562 0.1Suzano Austria GmbH . . . . . . . . . . . . . . . . . . . . . . . . . . . . . . . . . . . 5.75% 7/14/26 6,267 6,635,186 0.1Suzano Austria GmbH . . . . . . . . . . . . . . . . . . . . . . . . . . . . . . . . . . . 7.00% 3/16/47 2,000 2,191,842 0.0Vale Overseas Ltd. . . . . . . . . . . . . . . . . . . . . . . . . . . . . . . . . . . . . . . 4.38% 1/11/22 1,468 1,471,621 0.0Vale Overseas Ltd. . . . . . . . . . . . . . . . . . . . . . . . . . . . . . . . . . . . . . . 6.25% 8/10/26 1,347 1,422,432 0.0Vedanta Resources PLC. . . . . . . . . . . . . . . . . . . . . . . . . . . . . . . . . . 6.13% 8/09/24 4,073 3,589,331 0.0Vedanta Resources PLC. . . . . . . . . . . . . . . . . . . . . . . . . . . . . . . . . . 6.38% 7/30/22 17,267 16,230,980 0.1 108,603,303 0.8
CAPITAL GOODSCemex SAB de CV . . . . . . . . . . . . . . . . . . . . . . . . . . . . . . . . . . . . . 6.13% 5/05/25 3,000 3,056,970 0.0CIMPOR Financial Operations BV . . . . . . . . . . . . . . . . . . . . . . . . . 5.75% 7/17/24 5,205 4,638,956 0.0Indika Energy Capital III Pte Ltd. . . . . . . . . . . . . . . . . . . . . . . . . . . 5.88% 11/09/24 7,486 6,990,052 0.1Indo Energy Finance II BV . . . . . . . . . . . . . . . . . . . . . . . . . . . . . . . 6.38% 1/24/23 12,020 11,944,875 0.1Odebrecht Finance Ltd.(f) . . . . . . . . . . . . . . . . . . . . . . . . . . . . . . . . 4.38% 4/25/25 9,013 1,081,560 0.0Odebrecht Finance Ltd.(f) . . . . . . . . . . . . . . . . . . . . . . . . . . . . . . . . 7.13% 6/26/42 20,500 2,564,448 0.0 30,276,861 0.2
COMMUNICATIONS - MEDIAMyriad International Holdings BV . . . . . . . . . . . . . . . . . . . . . . . . . 5.50% 7/21/25 10,000 10,450,000 0.1
COMMUNICATIONS - TELECOMMUNICATIONSEmpresa Nacional de Telecomunicaciones SA . . . . . . . . . . . . . . . . 4.75% 8/01/26 15,000 14,819,625 0.1Millicom International Cellular SA . . . . . . . . . . . . . . . . . . . . . . . . . 5.13% 1/15/28 7,413 7,065,523 0.0Millicom International Cellular SA . . . . . . . . . . . . . . . . . . . . . . . . . 6.00% 3/15/25 4,393 4,458,895 0.1MTN Mauritius Investments Ltd. . . . . . . . . . . . . . . . . . . . . . . . . . . 5.37% 2/13/22 16,405 16,302,469 0.1Turk Telekomunikasyon AS. . . . . . . . . . . . . . . . . . . . . . . . . . . . . . . 3.75% 6/19/19 4,000 3,991,540 0.1 46,638,052 0.4
CONSUMER NON-CYCLICALBRF GmbH . . . . . . . . . . . . . . . . . . . . . . . . . . . . . . . . . . . . . . . . . . . 4.35% 9/29/26 8,645 7,772,149 0.1BRF SA . . . . . . . . . . . . . . . . . . . . . . . . . . . . . . . . . . . . . . . . . . . . . . 3.95% 5/22/23 209 195,937 0.0Central American Bottling Corp. . . . . . . . . . . . . . . . . . . . . . . . . . . . 5.75% 1/31/27 7,446 7,554,451 0.1Cosan Ltd. . . . . . . . . . . . . . . . . . . . . . . . . . . . . . . . . . . . . . . . . . . . . 5.95% 9/20/24 7,896 8,089,476 0.1MARB BondCo PLC . . . . . . . . . . . . . . . . . . . . . . . . . . . . . . . . . . . . 6.88% 1/19/25 4,889 4,743,963 0.0Marfrig Holdings Europe BV . . . . . . . . . . . . . . . . . . . . . . . . . . . . . 8.00% 6/08/23 27,700 28,619,917 0.2Minerva Luxembourg SA. . . . . . . . . . . . . . . . . . . . . . . . . . . . . . . . . 6.50% 9/20/26 24,416 23,500,400 0.1Natura Cosmeticos SA. . . . . . . . . . . . . . . . . . . . . . . . . . . . . . . . . . . 5.38% 2/01/23 10,796 10,883,771 0.1Tonon Luxembourg SA(f) (g) . . . . . . . . . . . . . . . . . . . . . . . . . . . . . 9.25% 1/24/20 12,040 273,125 0.0Virgolino de Oliveira Finance SA(h) . . . . . . . . . . . . . . . . . . . . . . . . 10.50% 1/28/18 3,700 183,391 0.0 91,816,580 0.7
ENERGYAzure Power Energy Ltd.. . . . . . . . . . . . . . . . . . . . . . . . . . . . . . . . . 5.50% 11/03/22 9,450 9,241,864 0.1Cosan Luxembourg SA . . . . . . . . . . . . . . . . . . . . . . . . . . . . . . . . . . 7.00% 1/20/27 235 251,415 0.0Ecopetrol SA . . . . . . . . . . . . . . . . . . . . . . . . . . . . . . . . . . . . . . . . . . 5.88% 9/18/23 14,275 15,295,662 0.1Medco Platinum Road Pte Ltd. . . . . . . . . . . . . . . . . . . . . . . . . . . . . 6.75% 1/30/25 8,355 7,832,813 0.0Petrobras Global Finance BV . . . . . . . . . . . . . . . . . . . . . . . . . . . . . 6.25% 3/17/24 10,700 11,325,950 0.1Petrobras Global Finance BV . . . . . . . . . . . . . . . . . . . . . . . . . . . . . 7.38% 1/17/27 10,300 11,308,174 0.1 55,255,878 0.4
TRANSPORTATION - AIRLINESGuanay Finance Ltd. . . . . . . . . . . . . . . . . . . . . . . . . . . . . . . . . . . . . 6.00% 12/15/20 3,602 3,624,493 0.0Latam Finance Ltd. . . . . . . . . . . . . . . . . . . . . . . . . . . . . . . . . . . . . . 7.00% 3/01/26 12,500 12,546,875 0.1 16,171,368 0.1
TRANSPORTATION - SERVICESRumo Luxembourg SARL. . . . . . . . . . . . . . . . . . . . . . . . . . . . . . . . 7.38% 2/09/24 25,474 27,257,180 0.2 386,469,222 2.9
UTILITYELECTRIC
Cemig Geracao e Transmissao SA. . . . . . . . . . . . . . . . . . . . . . . . . . 9.25% 12/05/24 1,803 2,001,943 0.0Consorcio Transmantaro SA . . . . . . . . . . . . . . . . . . . . . . . . . . . . . . 4.38% 5/07/23 30,911 31,026,916 0.2Light Servicos de Eletricidade SA/Light Energia SA . . . . . . . . . . . 7.25% 5/03/23 2,477 2,507,876 0.0LLPL Capital Pte Ltd. . . . . . . . . . . . . . . . . . . . . . . . . . . . . . . . . . . . 6.88% 2/04/39 6,414 6,590,385 0.1Terraform Global Operating LLC . . . . . . . . . . . . . . . . . . . . . . . . . . 6.13% 3/01/26 3,219 3,097,032 0.0 45,224,152 0.3

AB FCP I
101
AmericanIncomePortfolio
Rate Date Principal Value Net Assets (000) (USD) %
FINANCIAL INSTITUTIONSBANKING
State Bank of India/London. . . . . . . . . . . . . . . . . . . . . . . . . . . . . . . 4.38% 1/24/24 USD 11,500 $ 11,644,900 0.1%Turkiye Vakiflar Bankasi TAO. . . . . . . . . . . . . . . . . . . . . . . . . . . . . 5.75% 1/30/23 11,391 10,636,346 0.1Yapi ve Kredi Bankasi AS . . . . . . . . . . . . . . . . . . . . . . . . . . . . . . . . 6.10% 3/16/23 2,892 2,758,245 0.0 25,039,491 0.2
FINANCEUnifin Financiera SAB de CV SOFOM ENR . . . . . . . . . . . . . . . . . 7.00% 1/15/25 4,264 3,843,143 0.0
OTHER FINANCEMestenio Ltd. for Dominican Republic . . . . . . . . . . . . . . . . . . . . . . 8.50% 1/02/20 4,583 4,667,849 0.0
REITSYuzhou Properties Co., Ltd.. . . . . . . . . . . . . . . . . . . . . . . . . . . . . . . 8.63% 1/23/22 5,006 5,141,047 0.1 38,691,530 0.3
GOVERNMENTS - SOVEREIGN AGENCIESHONDURAS
Honduras Government International Bond . . . . . . . . . . . . . . . . . . . 6.25% 1/19/27 15,391 15,921,451 0.1CORPORATE BONDSEGYPT
Egypt Government International Bond . . . . . . . . . . . . . . . . . . . . . . 6.20% 3/01/24 12,897 13,077,558 0.1LOCAL GOVERNMENTS - REGIONAL BONDSARGENTINA
Provincia de Cordoba. . . . . . . . . . . . . . . . . . . . . . . . . . . . . . . . . . . . 7.13% 6/10/21 3,714 3,416,880 0.0 1,090,531,413 8.2
AGENCIESAGENCY DEBENTURES
Federal Home Loan Mortgage Corp. . . . . . . . . . . . . . . . . . . . . . . . . 6.25% 7/15/32 101,323 134,706,193 1.0Federal Home Loan Mortgage Corp. . . . . . . . . . . . . . . . . . . . . . . . . 6.75% 3/15/31 24,094 32,650,863 0.2Federal National Mortgage Association. . . . . . . . . . . . . . . . . . . . . . 6.25% 5/15/29 29,593 37,742,557 0.3Federal National Mortgage Association. . . . . . . . . . . . . . . . . . . . . . 6.63% 11/15/30 312,071 417,189,620 3.2Federal National Mortgage Association. . . . . . . . . . . . . . . . . . . . . . 7.13% 1/15/30 142,662 194,650,030 1.5Tennessee Valley Authority . . . . . . . . . . . . . . . . . . . . . . . . . . . . . . . 7.13% 5/01/30 19,383 26,475,918 0.2 843,415,181 6.4
COMMERCIAL MORTGAGE-BACKED SECURITIESNON-AGENCY FIXED RATE CMBS
225 Liberty Street Trust, Series 2016-225L, Class E. . . . . . . . . . . . 4.65% 2/10/36 16,531 16,712,598 0.1Citigroup Commercial Mortgage Trust
Series 2017-P7, Class XA(d). . . . . . . . . . . . . . . . . . . . . . . . . . . . 1.13% 4/14/50 59,584 4,126,414 0.0Series 2016-C3, Class XA(d) . . . . . . . . . . . . . . . . . . . . . . . . . . . 1.19% 11/15/49 193,095 11,868,230 0.1Series 2013-GC11, Class XA(d) . . . . . . . . . . . . . . . . . . . . . . . . . 1.40% 4/10/46 8,682 408,486 0.0Series 2016-P3, Class XA(d). . . . . . . . . . . . . . . . . . . . . . . . . . . . 1.70% 4/15/49 135,788 11,556,432 0.1Series 2013-GC11, Class D. . . . . . . . . . . . . . . . . . . . . . . . . . . . . 4.42% 4/10/46 1,201 1,199,285 0.0Series 2014-GC19, Class D. . . . . . . . . . . . . . . . . . . . . . . . . . . . . 5.09% 3/10/47 4,250 4,405,840 0.0Series 2013-GC17, Class D. . . . . . . . . . . . . . . . . . . . . . . . . . . . . 5.11% 11/10/46 5,540 5,520,423 0.1
Citigroup/Deutsche Bank Mortgage Trust, Series 2017-CD3, Class XA(d) . . . . . . . . . . . . . . . . . . . . . . . . . . 1.03% 2/10/50 76,813 4,866,509 0.0
Commercial Mortgage TrustSeries 2015-LC21, Class XA(d) . . . . . . . . . . . . . . . . . . . . . . . . . 0.77% 7/10/48 70,591 2,326,427 0.0Series 2016-DC2, Class XA(d) . . . . . . . . . . . . . . . . . . . . . . . . . . 1.03% 2/10/49 1,901 102,521 0.0Series 2014-CR15, Class XA(d) . . . . . . . . . . . . . . . . . . . . . . . . . 1.04% 2/10/47 10,136 334,270 0.0Series 2015-CR27, Class XA(d) . . . . . . . . . . . . . . . . . . . . . . . . . 1.12% 10/10/48 29,519 1,456,199 0.0Series 2012-CR1, Class XA(d) . . . . . . . . . . . . . . . . . . . . . . . . . . 1.87% 5/15/45 22,829 1,135,273 0.0Series 2013-CR6, Class D . . . . . . . . . . . . . . . . . . . . . . . . . . . . . . 4.08% 3/10/46 2,600 2,482,921 0.0Series 2015-PC1, Class C . . . . . . . . . . . . . . . . . . . . . . . . . . . . . . 4.44% 7/10/50 11,346 11,355,878 0.1Series 2012-CR3, Class E . . . . . . . . . . . . . . . . . . . . . . . . . . . . . . 4.75% 10/15/45 2,959 2,714,639 0.0
DBUBS Mortgage Trust, Series 2011-LC2A, Class E . . . . . . . . . . 5.53% 7/10/44 9,558 9,449,037 0.1Grantor Trust JPMBB, Series 2014-C24(i) . . . . . . . . . . . . . . . . . . . 4.00% 11/15/47 222 7,424,131 0.0GS Mortgage Securities Corp. II, Series 2013-GC10, Class XA(d) 1.52% 2/10/46 34,195 1,690,214 0.0GS Mortgage Securities Trust
Series 2016-GS3, Class XA(d) . . . . . . . . . . . . . . . . . . . . . . . . . . 1.26% 10/10/49 134,228 9,349,400 0.1Series 2013-GC13, Class D. . . . . . . . . . . . . . . . . . . . . . . . . . . . . 4.08% 7/10/46 10,000 9,466,135 0.1Series 2012-GCJ9, Class D . . . . . . . . . . . . . . . . . . . . . . . . . . . . . 4.75% 11/10/45 4,300 4,278,880 0.0Series 2010-C2, Class D . . . . . . . . . . . . . . . . . . . . . . . . . . . . . . . 5.18% 12/10/43 1,850 1,899,207 0.0
JP Morgan Chase Commercial Mortgage Securities TrustSeries 2016-JP2, Class XA(d) . . . . . . . . . . . . . . . . . . . . . . . . . . . 1.84% 8/15/49 67,555 7,070,661 0.1Series 2012-LC9, Class E . . . . . . . . . . . . . . . . . . . . . . . . . . . . . . 4.38% 12/15/47 10,881 10,244,681 0.1Series 2012-C6, Class E . . . . . . . . . . . . . . . . . . . . . . . . . . . . . . . 5.15% 5/15/45 5,000 4,612,299 0.0
JPMBB Commercial Mortgage Securities TrustSeries 2014-C22, Class XA(d) . . . . . . . . . . . . . . . . . . . . . . . . . . 0.87% 9/15/47 64,921 2,457,240 0.0Series 2015-C32, Class C . . . . . . . . . . . . . . . . . . . . . . . . . . . . . . 4.67% 11/15/48 5,625 5,706,393 0.1
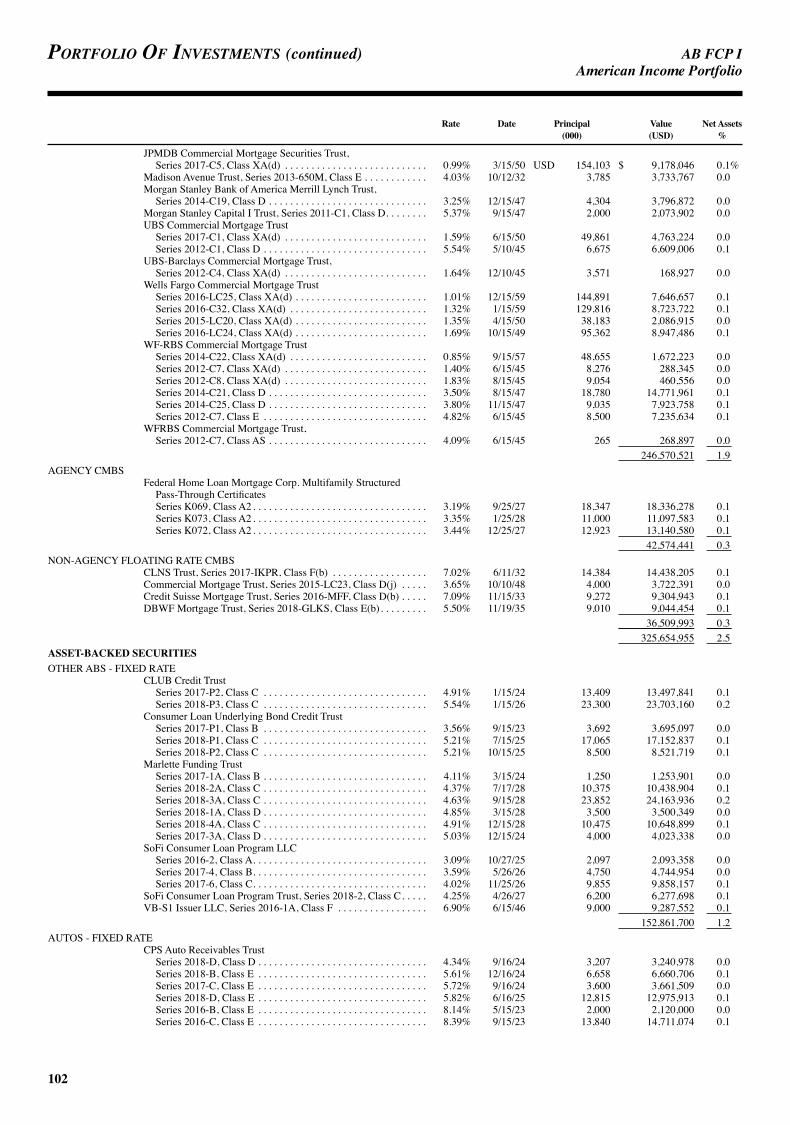
AB FCP I
102
Portfolio of investments (continued) AmericanIncomePortfolio
Rate Date Principal Value Net Assets (000) (USD) %
JPMDB Commercial Mortgage Securities Trust, Series 2017-C5, Class XA(d) . . . . . . . . . . . . . . . . . . . . . . . . . . . 0.99% 3/15/50 USD 154,103 $ 9,178,046 0.1%
Madison Avenue Trust, Series 2013-650M, Class E . . . . . . . . . . . . 4.03% 10/12/32 3,785 3,733,767 0.0Morgan Stanley Bank of America Merrill Lynch Trust,
Series 2014-C19, Class D . . . . . . . . . . . . . . . . . . . . . . . . . . . . . . 3.25% 12/15/47 4,304 3,796,872 0.0Morgan Stanley Capital I Trust, Series 2011-C1, Class D. . . . . . . . 5.37% 9/15/47 2,000 2,073,902 0.0UBS Commercial Mortgage Trust
Series 2017-C1, Class XA(d) . . . . . . . . . . . . . . . . . . . . . . . . . . . 1.59% 6/15/50 49,861 4,763,224 0.0Series 2012-C1, Class D . . . . . . . . . . . . . . . . . . . . . . . . . . . . . . . 5.54% 5/10/45 6,675 6,609,006 0.1
UBS-Barclays Commercial Mortgage Trust, Series 2012-C4, Class XA(d) . . . . . . . . . . . . . . . . . . . . . . . . . . . 1.64% 12/10/45 3,571 168,927 0.0
Wells Fargo Commercial Mortgage TrustSeries 2016-LC25, Class XA(d) . . . . . . . . . . . . . . . . . . . . . . . . . 1.01% 12/15/59 144,891 7,646,657 0.1Series 2016-C32, Class XA(d) . . . . . . . . . . . . . . . . . . . . . . . . . . 1.32% 1/15/59 129,816 8,723,722 0.1Series 2015-LC20, Class XA(d) . . . . . . . . . . . . . . . . . . . . . . . . . 1.35% 4/15/50 38,183 2,086,915 0.0Series 2016-LC24, Class XA(d) . . . . . . . . . . . . . . . . . . . . . . . . . 1.69% 10/15/49 95,362 8,947,486 0.1
WF-RBS Commercial Mortgage TrustSeries 2014-C22, Class XA(d) . . . . . . . . . . . . . . . . . . . . . . . . . . 0.85% 9/15/57 48,655 1,672,223 0.0Series 2012-C7, Class XA(d) . . . . . . . . . . . . . . . . . . . . . . . . . . . 1.40% 6/15/45 8,276 288,345 0.0Series 2012-C8, Class XA(d) . . . . . . . . . . . . . . . . . . . . . . . . . . . 1.83% 8/15/45 9,054 460,556 0.0Series 2014-C21, Class D . . . . . . . . . . . . . . . . . . . . . . . . . . . . . . 3.50% 8/15/47 18,780 14,771,961 0.1Series 2014-C25, Class D . . . . . . . . . . . . . . . . . . . . . . . . . . . . . . 3.80% 11/15/47 9,035 7,923,758 0.1Series 2012-C7, Class E . . . . . . . . . . . . . . . . . . . . . . . . . . . . . . . 4.82% 6/15/45 8,500 7,235,634 0.1
WFRBS Commercial Mortgage Trust, Series 2012-C7, Class AS . . . . . . . . . . . . . . . . . . . . . . . . . . . . . . 4.09% 6/15/45 265 268,897 0.0
246,570,521 1.9AGENCY CMBS
Federal Home Loan Mortgage Corp. Multifamily Structured Pass-Through CertificatesSeries K069, Class A2 . . . . . . . . . . . . . . . . . . . . . . . . . . . . . . . . . 3.19% 9/25/27 18,347 18,336,278 0.1Series K073, Class A2 . . . . . . . . . . . . . . . . . . . . . . . . . . . . . . . . . 3.35% 1/25/28 11,000 11,097,583 0.1Series K072, Class A2 . . . . . . . . . . . . . . . . . . . . . . . . . . . . . . . . . 3.44% 12/25/27 12,923 13,140,580 0.1
42,574,441 0.3NON-AGENCY FLOATING RATE CMBS
CLNS Trust, Series 2017-IKPR, Class F(b) . . . . . . . . . . . . . . . . . . 7.02% 6/11/32 14,384 14,438,205 0.1Commercial Mortgage Trust, Series 2015-LC23, Class D(j) . . . . . 3.65% 10/10/48 4,000 3,722,391 0.0Credit Suisse Mortgage Trust, Series 2016-MFF, Class D(b) . . . . . 7.09% 11/15/33 9,272 9,304,943 0.1DBWF Mortgage Trust, Series 2018-GLKS, Class E(b). . . . . . . . . 5.50% 11/19/35 9,010 9,044,454 0.1 36,509,993 0.3 325,654,955 2.5
ASSET-BACKED SECURITIESOTHER ABS - FIXED RATE
CLUB Credit TrustSeries 2017-P2, Class C . . . . . . . . . . . . . . . . . . . . . . . . . . . . . . . 4.91% 1/15/24 13,409 13,497,841 0.1Series 2018-P3, Class C . . . . . . . . . . . . . . . . . . . . . . . . . . . . . . . 5.54% 1/15/26 23,300 23,703,160 0.2
Consumer Loan Underlying Bond Credit TrustSeries 2017-P1, Class B . . . . . . . . . . . . . . . . . . . . . . . . . . . . . . . 3.56% 9/15/23 3,692 3,695,097 0.0Series 2018-P1, Class C . . . . . . . . . . . . . . . . . . . . . . . . . . . . . . . 5.21% 7/15/25 17,065 17,152,837 0.1Series 2018-P2, Class C . . . . . . . . . . . . . . . . . . . . . . . . . . . . . . . 5.21% 10/15/25 8,500 8,521,719 0.1
Marlette Funding TrustSeries 2017-1A, Class B . . . . . . . . . . . . . . . . . . . . . . . . . . . . . . . 4.11% 3/15/24 1,250 1,253,901 0.0Series 2018-2A, Class C . . . . . . . . . . . . . . . . . . . . . . . . . . . . . . . 4.37% 7/17/28 10,375 10,438,904 0.1Series 2018-3A, Class C . . . . . . . . . . . . . . . . . . . . . . . . . . . . . . . 4.63% 9/15/28 23,852 24,163,936 0.2Series 2018-1A, Class D . . . . . . . . . . . . . . . . . . . . . . . . . . . . . . . 4.85% 3/15/28 3,500 3,500,349 0.0Series 2018-4A, Class C . . . . . . . . . . . . . . . . . . . . . . . . . . . . . . . 4.91% 12/15/28 10,475 10,648,899 0.1Series 2017-3A, Class D . . . . . . . . . . . . . . . . . . . . . . . . . . . . . . . 5.03% 12/15/24 4,000 4,023,338 0.0
SoFi Consumer Loan Program LLCSeries 2016-2, Class A. . . . . . . . . . . . . . . . . . . . . . . . . . . . . . . . . 3.09% 10/27/25 2,097 2,093,358 0.0Series 2017-4, Class B. . . . . . . . . . . . . . . . . . . . . . . . . . . . . . . . . 3.59% 5/26/26 4,750 4,744,954 0.0Series 2017-6, Class C. . . . . . . . . . . . . . . . . . . . . . . . . . . . . . . . . 4.02% 11/25/26 9,855 9,858,157 0.1
SoFi Consumer Loan Program Trust, Series 2018-2, Class C. . . . . 4.25% 4/26/27 6,200 6,277,698 0.1VB-S1 Issuer LLC, Series 2016-1A, Class F . . . . . . . . . . . . . . . . . 6.90% 6/15/46 9,000 9,287,552 0.1 152,861,700 1.2
AUTOS - FIXED RATECPS Auto Receivables Trust
Series 2018-D, Class D . . . . . . . . . . . . . . . . . . . . . . . . . . . . . . . . 4.34% 9/16/24 3,207 3,240,978 0.0Series 2018-B, Class E . . . . . . . . . . . . . . . . . . . . . . . . . . . . . . . . 5.61% 12/16/24 6,658 6,660,706 0.1Series 2017-C, Class E . . . . . . . . . . . . . . . . . . . . . . . . . . . . . . . . 5.72% 9/16/24 3,600 3,661,509 0.0Series 2018-D, Class E . . . . . . . . . . . . . . . . . . . . . . . . . . . . . . . . 5.82% 6/16/25 12,815 12,975,913 0.1Series 2016-B, Class E . . . . . . . . . . . . . . . . . . . . . . . . . . . . . . . . 8.14% 5/15/23 2,000 2,120,000 0.0Series 2016-C, Class E . . . . . . . . . . . . . . . . . . . . . . . . . . . . . . . . 8.39% 9/15/23 13,840 14,711,074 0.1

AB FCP I
103
AmericanIncomePortfolio
Rate Date Principal Value Net Assets (000) (USD) %
CPS Auto TrustSeries 2016-D, Class E . . . . . . . . . . . . . . . . . . . . . . . . . . . . . . . . 6.86% 4/15/24 USD 1,687 $ 1,753,238 0.0%Series 2017-A, Class E . . . . . . . . . . . . . . . . . . . . . . . . . . . . . . . . 7.07% 4/15/24 6,800 7,137,461 0.1
Exeter Automobile Receivables TrustSeries 2017-3A, Class D . . . . . . . . . . . . . . . . . . . . . . . . . . . . . . . 5.28% 10/15/24 11,280 11,408,087 0.1Series 2018-4A, Class E . . . . . . . . . . . . . . . . . . . . . . . . . . . . . . . 5.38% 7/15/25 9,680 9,831,683 0.1Series 2017-1A, Class D . . . . . . . . . . . . . . . . . . . . . . . . . . . . . . . 6.20% 11/15/23 11,000 11,259,298 0.1Series 2016-3A, Class D . . . . . . . . . . . . . . . . . . . . . . . . . . . . . . . 6.40% 7/17/23 11,590 11,952,321 0.1
First Investors Auto Owner Trust, Series 2018-1A, Class E . . . . . . 5.35% 7/15/24 3,100 3,147,431 0.0Flagship Credit Auto Trust
Series 2016-4, Class D . . . . . . . . . . . . . . . . . . . . . . . . . . . . . . . . 3.89% 11/15/22 7,000 7,022,639 0.1Series 2018-3, Class D . . . . . . . . . . . . . . . . . . . . . . . . . . . . . . . . 4.15% 12/16/24 2,550 2,581,599 0.0Series 2019-1, Class E. . . . . . . . . . . . . . . . . . . . . . . . . . . . . . . . . 5.06% 6/15/26 1,400 1,402,982 0.0Series 2018-2, Class E. . . . . . . . . . . . . . . . . . . . . . . . . . . . . . . . . 5.51% 11/17/25 3,850 3,928,168 0.0Series 2018-4, Class E. . . . . . . . . . . . . . . . . . . . . . . . . . . . . . . . . 5.51% 3/16/26 10,085 10,284,726 0.1Series 2016-3, Class E. . . . . . . . . . . . . . . . . . . . . . . . . . . . . . . . . 6.25% 10/15/23 3,400 3,504,759 0.0Series 2016-4, Class E. . . . . . . . . . . . . . . . . . . . . . . . . . . . . . . . . 6.44% 1/16/24 3,435 3,557,842 0.0Series 2017-1, Class E. . . . . . . . . . . . . . . . . . . . . . . . . . . . . . . . . 6.46% 12/15/23 6,260 6,478,419 0.0Series 2015-3, Class D . . . . . . . . . . . . . . . . . . . . . . . . . . . . . . . . 7.12% 11/15/22 5,500 5,654,886 0.0Series 2016-2, Class D . . . . . . . . . . . . . . . . . . . . . . . . . . . . . . . . 8.56% 11/15/23 7,500 7,924,492 0.1
152,200,211 1.1 305,061,911 2.3
INFLATION-LINKED SECURITIESUNITED STATES
U.S. Treasury Inflation Index. . . . . . . . . . . . . . . . . . . . . . . . . . . . . . 0.25% 1/15/25 151,876 148,386,534 1.1EMERGING MARKETS - SOVEREIGNSBAHAMAS
Bahamas Government International Bond. . . . . . . . . . . . . . . . . . . . 6.00% 11/21/28 12,675 12,905,115 0.1BAHRAIN
Bahrain Government International Bond. . . . . . . . . . . . . . . . . . . . . 6.75% 9/20/29 16,489 17,148,560 0.2Bahrain Government International Bond. . . . . . . . . . . . . . . . . . . . . 7.00% 10/12/28 16,240 17,153,500 0.1 34,302,060 0.3
OMANOman Government International Bond . . . . . . . . . . . . . . . . . . . . . . 4.13% 1/17/23 12,870 12,387,375 0.1Oman Government International Bond . . . . . . . . . . . . . . . . . . . . . . 4.75% 6/15/26 31,965 29,287,931 0.2 41,675,306 0.3
SENEGALSenegal Government International Bond. . . . . . . . . . . . . . . . . . . . . 6.25% 5/23/33 24,586 23,325,967 0.2Senegal Government International Bond. . . . . . . . . . . . . . . . . . . . . 6.75% 3/13/48 17,720 16,103,050 0.1Senegal Government International Bond. . . . . . . . . . . . . . . . . . . . . 8.75% 5/13/21 1,404 1,519,830 0.0 40,948,847 0.3 129,831,328 1.0
COLLATERALIZED LOAN OBLIGATIONSCLO - FLOATING RATE
Apidos CLO, Series 2017-26A, Class D(b). . . . . . . . . . . . . . . . . . . 8.88% 7/18/29 5,450 5,236,861 0.1Bristol Park CLO Ltd., Series 2016-1A, Class C(b) . . . . . . . . . . . . 5.39% 4/15/29 4,000 3,994,896 0.0CIFC Funding Ltd., Series 2019-1A, Class C(b). . . . . . . . . . . . . . . 0.00% 4/20/32 2,600 2,600,000 0.0Dryden CLO Ltd., Series 2018-57A, Class A(b) . . . . . . . . . . . . . . . 3.69% 5/15/31 25,195 24,819,191 0.2Dryden Senior Loan Fund, Series 2017-49A, Class E(b) . . . . . . . . 9.08% 7/18/30 4,717 4,589,332 0.0Greywolf CLO VI Ltd., Series 2018-1A, Class A1(b). . . . . . . . . . . 3.79% 4/26/31 22,100 21,743,505 0.2Halcyon Loan Advisors Funding Ltd.,
Series 2018-1A, Class A2(b) . . . . . . . . . . . . . . . . . . . . . . . . . . . . 4.27% 7/21/31 7,424 7,301,272 0.1TIAA CLO II Ltd., Series 2017-1A, Class A(b) . . . . . . . . . . . . . . . 4.04% 4/20/29 5,105 5,087,179 0.0Venture CLO Ltd., Series 2017-27A, Class D(b) . . . . . . . . . . . . . . 6.76% 7/20/30 17,169 17,007,398 0.1 92,379,634 0.7
BANK LOANSINDUSTRIALCAPITAL GOODS
GFL Environmental Inc.(b) . . . . . . . . . . . . . . . . . . . . . . . . . . . . . . . 5.49% 5/30/25 5,196 5,103,803 0.0CONSUMER CYCLICAL - OTHER
Stars Group Holdings B.V.(b) . . . . . . . . . . . . . . . . . . . . . . . . . . . . . 6.30% 7/10/25 3,074 3,072,943 0.0CONSUMER CYCLICAL - RESTAURANTS
IRB Holding Corp. (fka Arby’s / Buffalo Wild Wings)(b) . . . . . . . 5.74% 2/05/25 3,227 3,199,472 0.0CONSUMER NON-CYCLICAL
athenahealth, Inc.(b). . . . . . . . . . . . . . . . . . . . . . . . . . . . . . . . . . . . . 7.20% 2/11/26 18,318 18,203,241 0.1Regionalcare Hospital Partners Holdings, Inc.(b) . . . . . . . . . . . . . . 6.98% 11/16/25 36,263 36,202,441 0.3 54,405,682 0.4

AB FCP I
104
Portfolio of investments (continued) AmericanIncomePortfolio
Rate Date Shares/Principal Value Net Assets (-)/(000) (USD) %
TECHNOLOGYVeritas US Inc.(b). . . . . . . . . . . . . . . . . . . . . . . . . . . . . . . . . . . . . . . 6.99% 1/27/23 USD 4,129 $ 3,870,979 0.1%Veritas US Inc.(b). . . . . . . . . . . . . . . . . . . . . . . . . . . . . . . . . . . . . . . 7.30% 1/27/23 1,354 1,269,060 0.0 5,140,039 0.1 70,921,939 0.5
QUASI-SOVEREIGNSQUASI-SOVEREIGN BONDSBAHRAIN
Oil and Gas Holding Co. BSCC (The). . . . . . . . . . . . . . . . . . . . . . . 7.63% 11/07/24 2,741 2,970,559 0.0Oil and Gas Holding Co. BSCC (The). . . . . . . . . . . . . . . . . . . . . . . 8.38% 11/07/28 4,380 4,774,200 0.1 7,744,759 0.1
INDONESIAIndonesia Asahan Aluminium Persero PT . . . . . . . . . . . . . . . . . . . . 5.71% 11/15/23 1,065 1,124,374 0.0
KAZAKHSTANKazMunayGas National Co. JSC. . . . . . . . . . . . . . . . . . . . . . . . . . . 4.75% 4/24/25 1,395 1,431,619 0.0KazMunayGas National Co. JSC. . . . . . . . . . . . . . . . . . . . . . . . . . . 5.38% 4/24/30 8,446 8,741,610 0.1 10,173,229 0.1
MEXICOPetroleos Mexicanos . . . . . . . . . . . . . . . . . . . . . . . . . . . . . . . . . . . . 6.50% 1/23/29 1,590 1,513,044 0.0
PANAMAAeropuerto Internacional de Tocumen SA. . . . . . . . . . . . . . . . . . . . 6.00% 11/18/48 5,808 6,159,384 0.0
SOUTH AFRICAEskom Holdings SOC Ltd. . . . . . . . . . . . . . . . . . . . . . . . . . . . . . . . 6.35% 8/10/28 12,000 12,285,000 0.1
TRINIDAD & TOBAGOTrinidad Generation UnLtd.. . . . . . . . . . . . . . . . . . . . . . . . . . . . . . . 5.25% 11/04/27 11,768 11,379,597 0.1
TURKEYExport Credit Bank of Turkey . . . . . . . . . . . . . . . . . . . . . . . . . . . . . 6.13% 5/03/24 3,595 3,415,250 0.0TC Ziraat Bankasi AS . . . . . . . . . . . . . . . . . . . . . . . . . . . . . . . . . . . 5.13% 9/29/23 3,028 2,812,255 0.0 6,227,505 0.0 56,606,892 0.4
EMERGING MARKETS - CORPORATE BONDSINDUSTRIALBASIC
Consolidated Energy Finance SA . . . . . . . . . . . . . . . . . . . . . . . . . . 6.88% 6/15/25 8,756 8,550,234 0.1CONSUMER CYCLICAL - OTHER
Wynn Macau Ltd.. . . . . . . . . . . . . . . . . . . . . . . . . . . . . . . . . . . . . . . 4.88% 10/01/24 953 916,593 0.0Wynn Macau Ltd.. . . . . . . . . . . . . . . . . . . . . . . . . . . . . . . . . . . . . . . 5.50% 10/01/27 3,203 3,058,596 0.0 3,975,189 0.0
CONSUMER NON-CYCLICALTeva Pharmaceutical Finance Netherlands III BV. . . . . . . . . . . . . . 6.00% 4/15/24 11,550 11,719,647 0.1Teva Pharmaceutical Finance Netherlands III BV. . . . . . . . . . . . . . 6.75% 3/01/28 6,743 6,921,541 0.1 18,641,188 0.2 31,166,611 0.3
FINANCIAL INSTITUTIONSFINANCE
Mumtalakat Sukuk Holding Co. . . . . . . . . . . . . . . . . . . . . . . . . . . . 5.63% 2/27/24 2,146 2,147,790 0.0REITS
RKPF Overseas 2019 A Ltd. . . . . . . . . . . . . . . . . . . . . . . . . . . . . . . 7.88% 2/01/23 1,629 1,657,507 0.0 3,805,297 0.0 34,971,908 0.3
GOVERNMENTS - SOVEREIGN BONDSBERMUDA
Bermuda Government International Bond. . . . . . . . . . . . . . . . . . . . 4.75% 2/15/29 5,000 5,226,925 0.1QATAR
Qatar Government International Bond. . . . . . . . . . . . . . . . . . . . . . . 3.88% 4/23/23 2,394 2,451,451 0.0Qatar Government International Bond. . . . . . . . . . . . . . . . . . . . . . . 5.25% 1/20/20 903 921,060 0.0 3,372,511 0.0
SAUDI ARABIASaudi Government International Bond . . . . . . . . . . . . . . . . . . . . . . 4.38% 4/16/29 15,091 15,392,820 0.1 23,992,256 0.2
PREFERRED STOCKSFINANCIAL INSTITUTIONSBANKING
GMAC Capital Trust I, Series 2. . . . . . . . . . . . . . . . . . . . . . . . . . . . 8.47% 49,050 1,274,810 0.0
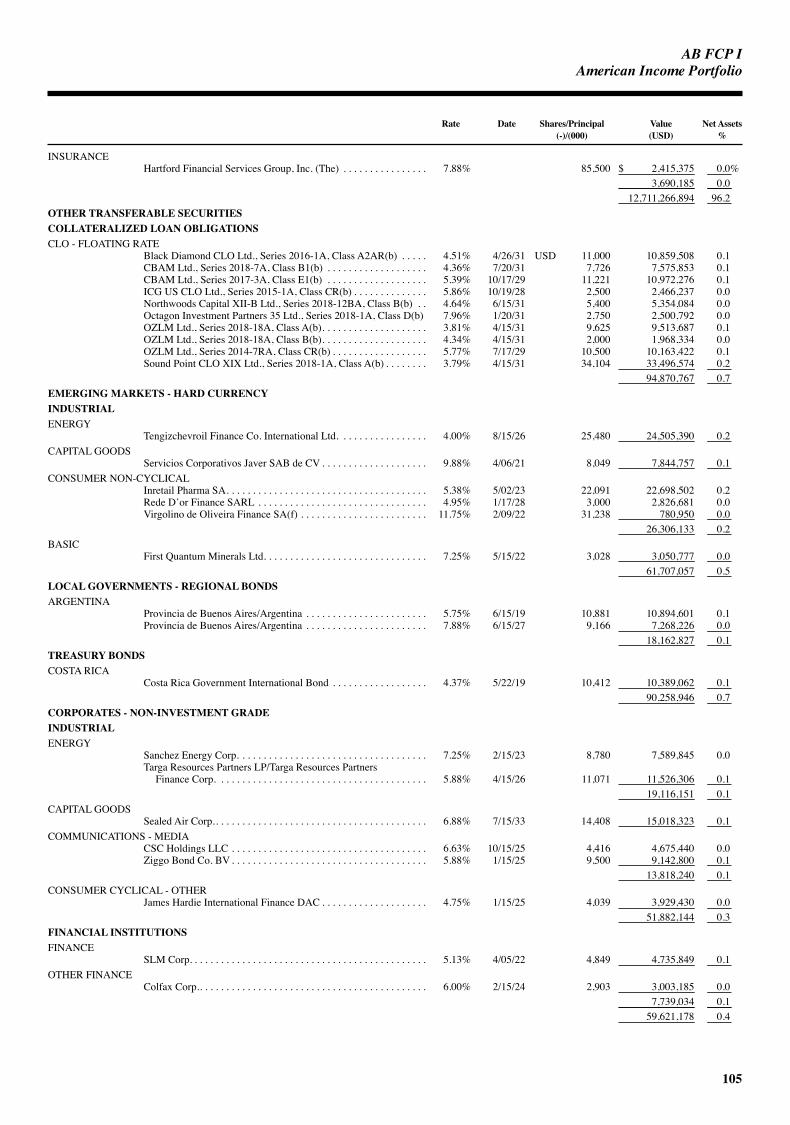
AB FCP I
105
AmericanIncomePortfolio
Rate Date Shares/Principal Value Net Assets (-)/(000) (USD) %
INSURANCEHartford Financial Services Group, Inc. (The) . . . . . . . . . . . . . . . . 7.88% 85,500 $ 2,415,375 0.0% 3,690,185 0.0 12,711,266,894 96.2
OTHER TRANSFERABLE SECURITIESCOLLATERALIZED LOAN OBLIGATIONSCLO - FLOATING RATE
Black Diamond CLO Ltd., Series 2016-1A, Class A2AR(b) . . . . . 4.51% 4/26/31 USD 11,000 10,859,508 0.1CBAM Ltd., Series 2018-7A, Class B1(b) . . . . . . . . . . . . . . . . . . . 4.36% 7/20/31 7,726 7,575,853 0.1CBAM Ltd., Series 2017-3A, Class E1(b) . . . . . . . . . . . . . . . . . . . 5.39% 10/17/29 11,221 10,972,276 0.1ICG US CLO Ltd., Series 2015-1A, Class CR(b) . . . . . . . . . . . . . . 5.86% 10/19/28 2,500 2,466,237 0.0Northwoods Capital XII-B Ltd., Series 2018-12BA, Class B(b) . . 4.64% 6/15/31 5,400 5,354,084 0.0Octagon Investment Partners 35 Ltd., Series 2018-1A, Class D(b) 7.96% 1/20/31 2,750 2,500,792 0.0OZLM Ltd., Series 2018-18A, Class A(b). . . . . . . . . . . . . . . . . . . . 3.81% 4/15/31 9,625 9,513,687 0.1OZLM Ltd., Series 2018-18A, Class B(b). . . . . . . . . . . . . . . . . . . . 4.34% 4/15/31 2,000 1,968,334 0.0OZLM Ltd., Series 2014-7RA, Class CR(b) . . . . . . . . . . . . . . . . . . 5.77% 7/17/29 10,500 10,163,422 0.1Sound Point CLO XIX Ltd., Series 2018-1A, Class A(b) . . . . . . . . 3.79% 4/15/31 34,104 33,496,574 0.2 94,870,767 0.7
EMERGING MARKETS - HARD CURRENCYINDUSTRIALENERGY
Tengizchevroil Finance Co. International Ltd. . . . . . . . . . . . . . . . . 4.00% 8/15/26 25,480 24,505,390 0.2CAPITAL GOODS
Servicios Corporativos Javer SAB de CV . . . . . . . . . . . . . . . . . . . . 9.88% 4/06/21 8,049 7,844,757 0.1CONSUMER NON-CYCLICAL
Inretail Pharma SA. . . . . . . . . . . . . . . . . . . . . . . . . . . . . . . . . . . . . . 5.38% 5/02/23 22,091 22,698,502 0.2Rede D’or Finance SARL . . . . . . . . . . . . . . . . . . . . . . . . . . . . . . . . 4.95% 1/17/28 3,000 2,826,681 0.0Virgolino de Oliveira Finance SA(f) . . . . . . . . . . . . . . . . . . . . . . . . 11.75% 2/09/22 31,238 780,950 0.0 26,306,133 0.2
BASICFirst Quantum Minerals Ltd. . . . . . . . . . . . . . . . . . . . . . . . . . . . . . . 7.25% 5/15/22 3,028 3,050,777 0.0 61,707,057 0.5
LOCAL GOVERNMENTS - REGIONAL BONDSARGENTINA
Provincia de Buenos Aires/Argentina . . . . . . . . . . . . . . . . . . . . . . . 5.75% 6/15/19 10,881 10,894,601 0.1Provincia de Buenos Aires/Argentina . . . . . . . . . . . . . . . . . . . . . . . 7.88% 6/15/27 9,166 7,268,226 0.0 18,162,827 0.1
TREASURY BONDSCOSTA RICA
Costa Rica Government International Bond . . . . . . . . . . . . . . . . . . 4.37% 5/22/19 10,412 10,389,062 0.1 90,258,946 0.7
CORPORATES - NON-INVESTMENT GRADEINDUSTRIALENERGY
Sanchez Energy Corp. . . . . . . . . . . . . . . . . . . . . . . . . . . . . . . . . . . . 7.25% 2/15/23 8,780 7,589,845 0.0Targa Resources Partners LP/Targa Resources Partners
Finance Corp. . . . . . . . . . . . . . . . . . . . . . . . . . . . . . . . . . . . . . . . 5.88% 4/15/26 11,071 11,526,306 0.1 19,116,151 0.1
CAPITAL GOODSSealed Air Corp.. . . . . . . . . . . . . . . . . . . . . . . . . . . . . . . . . . . . . . . . 6.88% 7/15/33 14,408 15,018,323 0.1
COMMUNICATIONS - MEDIACSC Holdings LLC . . . . . . . . . . . . . . . . . . . . . . . . . . . . . . . . . . . . . 6.63% 10/15/25 4,416 4,675,440 0.0Ziggo Bond Co. BV . . . . . . . . . . . . . . . . . . . . . . . . . . . . . . . . . . . . . 5.88% 1/15/25 9,500 9,142,800 0.1 13,818,240 0.1
CONSUMER CYCLICAL - OTHERJames Hardie International Finance DAC . . . . . . . . . . . . . . . . . . . . 4.75% 1/15/25 4,039 3,929,430 0.0 51,882,144 0.3
FINANCIAL INSTITUTIONSFINANCE
SLM Corp. . . . . . . . . . . . . . . . . . . . . . . . . . . . . . . . . . . . . . . . . . . . . 5.13% 4/05/22 4,849 4,735,849 0.1OTHER FINANCE
Colfax Corp.. . . . . . . . . . . . . . . . . . . . . . . . . . . . . . . . . . . . . . . . . . . 6.00% 2/15/24 2,903 3,003,185 0.0 7,739,034 0.1 59,621,178 0.4

AB FCP I
106
Portfolio of investments (continued) AmericanIncomePortfolio
Rate Date Shares/Principal Value Net Assets (-)/(000) (USD) %
BANK LOANSINDUSTRIALBASIC
Starfruit Finco B.V. (Starfruit US Holdco LLC) (fka AkzoNobel)(b) . . . . . . . . . . . . . . . . . . . . . . . . . . . . . . . . . . . 5.76% 10/01/25 USD 3,900 $ 3,873,207 0.0%
CAPITAL GOODSBrookfield WEC Holdings Inc. (fka Westinghouse Electric
Company LLC)(b) . . . . . . . . . . . . . . . . . . . . . . . . . . . . . . . . . . . . 6.24% 8/01/25 14,450 14,463,646 0.1CONSUMER CYCLICAL - RETAILERS
Specialty Building Products Holdings, LLC(b). . . . . . . . . . . . . . . . 8.24% 10/01/25 7,963 7,763,469 0.1CONSUMER NON-CYCLICAL
Envision Healthcare Corporation(b) . . . . . . . . . . . . . . . . . . . . . . . . 6.24% 10/10/25 7,693 7,388,066 0.1SERVICES
Financial & Risk US Holdings, Inc. (fka Refinitiv)(b) . . . . . . . . . . 6.24% 10/01/25 3,923 3,860,171 0.0TECHNOLOGY
Boxer Parent Company Inc. (fka BMC Software, Inc.)(b) . . . . . . . 7.05% 10/02/25 15,500 15,397,235 0.1 52,745,794 0.4
COMMERCIAL MORTGAGE-BACKED SECURITIESNON-AGENCY FIXED RATE CMBS
Grantor Trust CGCMT, Series 2015-GC17(i) . . . . . . . . . . . . . . . . . 4.34% 9/15/48 105 7,037,549 0.1Grantor Trust COMM, Series 2014-UBS2(i). . . . . . . . . . . . . . . . . . 4.32% 3/10/47 143 10,271,185 0.1Grantor Trust CSAIL, Series 2015-C1(i). . . . . . . . . . . . . . . . . . . . . 4.00% 4/15/50 207 7,236,379 0.0Grantor Trust WFRBS, Series 2014-C23(i). . . . . . . . . . . . . . . . . . . 3.40% 10/15/47 125 4,562,094 0.0GS Mortgage Securities Trust
Series 2013-GC13, Class E(i) . . . . . . . . . . . . . . . . . . . . . . . . . . . 3.49% 7/10/46 169 8,136,980 0.1Series 2013-GC13, Class F(i) . . . . . . . . . . . . . . . . . . . . . . . . . . . 3.49% 7/10/46 142 10,576,583 0.1
47,820,770 0.4CORPORATES - INVESTMENT GRADEFINANCIAL INSTITUTIONSBANKING
Skandinaviska Enskilda Banken AB . . . . . . . . . . . . . . . . . . . . . . . . 2.63% 11/17/20 6,180 6,131,759 0.1INSURANCE
AIG Life Holdings, Inc. . . . . . . . . . . . . . . . . . . . . . . . . . . . . . . . . . . 8.13% 3/15/46 354 420,980 0.0Aquarius & Investments PLC for Swiss Reinsurance Co., Ltd. . . . 6.38% 9/01/24 13,527 13,679,179 0.1 14,100,159 0.1 20,231,918 0.2
INDUSTRIALBASIC
Glencore Funding LLC . . . . . . . . . . . . . . . . . . . . . . . . . . . . . . . . . . 4.63% 4/29/24 2,142 2,184,684 0.0TECHNOLOGY
Seagate HDD Cayman . . . . . . . . . . . . . . . . . . . . . . . . . . . . . . . . . . . 4.88% 6/01/27 1,721 1,604,395 0.0 3,789,079 0.0 24,020,997 0.2
COMMON STOCKSMt. Logan Re Ltd., (Preference Shares)(i) . . . . . . . . . . . . . . . . . . . 18,232 17,450,205 0.1
LOCAL GOVERNMENTS - US MUNICIPAL BONDSUNITED STATES
State of California, Series 2010 . . . . . . . . . . . . . . . . . . . . . . . . . . . . 7.60% 11/01/40 USD 1,600 2,390,656 0.0State of Illinois, Series 2010 . . . . . . . . . . . . . . . . . . . . . . . . . . . . . . 7.35% 7/01/35 7,675 8,518,022 0.1 10,908,678 0.1 397,697,335 3.0
Total Investments(cost $13,670,322,765) . . . . . . . . . . . . . . . . . . . . . . . . . . . . . . . . . . $ 13,108,964,229 99.2%
Time DepositsANZ, London(k) . . . . . . . . . . . . . . . . . . . . . . . . . . . . . . . . . . . . . . . 1.40 % – 742,764 0.0BBH, Grand Cayman(k) . . . . . . . . . . . . . . . . . . . . . . . . . . . . . . . . . (0.26)% – 147 0.0Citibank, New York(k). . . . . . . . . . . . . . . . . . . . . . . . . . . . . . . . . . . 1.76 % – 152,539,339 1.2HSBC Bank PLC, London(k) . . . . . . . . . . . . . . . . . . . . . . . . . . . . . 0.36 % – 39,583 0.0HSBC Bank PLC, London(k) . . . . . . . . . . . . . . . . . . . . . . . . . . . . . 5.12 % – 389,669 0.0JPMorgan Chase, New York(k) . . . . . . . . . . . . . . . . . . . . . . . . . . . . 1.76 % – 43,859,568 0.3National Australia Bank, London(k) . . . . . . . . . . . . . . . . . . . . . . . . 0.76 % – 774,267 0.0Royal Bank of Canada, Toronto(k) . . . . . . . . . . . . . . . . . . . . . . . . . 0.82 % – 86,714 0.0Sumitomo, Tokyo(k) . . . . . . . . . . . . . . . . . . . . . . . . . . . . . . . . . . . . (0.57)% – 113,257 0.0
Total Time Deposits . . . . . . . . . . . . . . . . . . . . . . . . . . . . . . . . . . . . . . . . . . . . . . . . . . . . . . 198,545,308 1.5Other assets less liabilities . . . . . . . . . . . . . . . . . . . . . . . . . . . . . . . . . . . . . . . . . . . . . . . . . (95,554,188) (0.7)Net Assets . . . . . . . . . . . . . . . . . . . . . . . . . . . . . . . . . . . . . . . . . . . . . . . . . . . . . . . . . . . . . . $ 13,211,955,349 100.0%

AB FCP I
107
AmericanIncomePortfolio
FUTURES
Unrealized Number of Appreciation/ Type Expiration Date Contracts Original Value Market Value (Depreciation)
LongU.S. T-Note 2 Yr (CBT) Futures . . . . . . . . . . . . . . . . . . . . . . . . . . 6/28/19 6,236 $ 1,323,298,178 $ 1,323,249,966 $ (48,212)U.S. T-Note 5 Yr (CBT) Futures . . . . . . . . . . . . . . . . . . . . . . . . . . 6/28/19 2,374 272,082,376 271,971,375 (111,001)U.S. T-Note 10 Yr (CBT) Futures . . . . . . . . . . . . . . . . . . . . . . . . . 6/19/19 22,710 2,783,011,541 2,770,620,000 (12,391,541
ShortU.S. T-Note 10 Yr (CBT) Futures+ . . . . . . . . . . . . . . . . . . . . . . . . 6/19/19 175 21,414,258 21,350,000 64,258 $ (12,486,496)
Appreciation $ 64,258 Depreciation $ (12,550,754)
+ Used for share class hedging purposes.
FORWARD FOREIGN CURRENCY CONTRACTS
Contracts to In Exchange Unrealized Deliver For Settlement Appreciation/ Counterparty (000) (000) Date (Depreciation)
Brown Brothers Harriman & Co.+. . . . . . . . . . . . . . . . . . . . . . . . USD 852 AUD 1,202 3/06/19 $ 630Brown Brothers Harriman & Co.+. . . . . . . . . . . . . . . . . . . . . . . . USD 506,083 AUD 711,035 3/06/19 (1,688,296)Brown Brothers Harriman & Co.+. . . . . . . . . . . . . . . . . . . . . . . . USD 256,065 CAD 339,412 3/06/19 1,868,362Brown Brothers Harriman & Co.+. . . . . . . . . . . . . . . . . . . . . . . . USD 13,708 CHF 13,721 3/06/19 41,851Brown Brothers Harriman & Co.+. . . . . . . . . . . . . . . . . . . . . . . . USD 20,045 CNH 135,853 3/06/19 246,627Brown Brothers Harriman & Co.+. . . . . . . . . . . . . . . . . . . . . . . . USD 94,457 EUR 83,288 3/06/19 296,320Brown Brothers Harriman & Co.+. . . . . . . . . . . . . . . . . . . . . . . . USD 234,374 GBP 180,470 3/06/19 5,014,430Brown Brothers Harriman & Co.+. . . . . . . . . . . . . . . . . . . . . . . . USD 10,816 JPY 1,187,065 3/06/19 (164,545)Brown Brothers Harriman & Co.+. . . . . . . . . . . . . . . . . . . . . . . . USD 62,504 NZD 92,324 3/06/19 372,095Brown Brothers Harriman & Co.+. . . . . . . . . . . . . . . . . . . . . . . . USD 87,993 SGD 119,261 3/06/19 221,013Brown Brothers Harriman & Co.+. . . . . . . . . . . . . . . . . . . . . . . . USD 42,752 ZAR 581,344 3/06/19 (1,512,646)Brown Brothers Harriman & Co.+. . . . . . . . . . . . . . . . . . . . . . . . USD 444,816 AUD 621,819 3/22/19 (3,581,742)Brown Brothers Harriman & Co.+. . . . . . . . . . . . . . . . . . . . . . . . USD 20,363 CNH 136,851 3/22/19 78,291Brown Brothers Harriman & Co.+. . . . . . . . . . . . . . . . . . . . . . . . USD 89,497 EUR 78,816 3/22/19 291,409Brown Brothers Harriman & Co.+. . . . . . . . . . . . . . . . . . . . . . . . USD 91,503 SGD 123,644 3/22/19 (24,712)Brown Brothers Harriman & Co.+. . . . . . . . . . . . . . . . . . . . . . . . USD 36,447 ZAR 515,829 3/22/19 73,148
$ 1,532,235
Appreciation $ 8,504,176 Depreciation $ (14,316,401)
+ Used for share class hedging purposes.
CENTRALLY CLEARED CREDIT DEFAULT SWAPS
Notional Unrealized Termination Amount Market Appreciation/ Clearing Broker/(Exchange) Referenced Obligation Date (000) Value (Depreciation)
Sale ContractsMorgan Stanley & Co. LLC/(INTRCONX) CDX-NAHY Series 31, 5 Year Index 12/20/23 USD 147,427 $ 9,245,222 $ 3,604,368
CENTRALLY CLEARED INTEREST RATE SWAPS
Rate Type Notional Unrealized Amount Termination Payments Made Payments Received Appreciation/ Clearing Broker/(Exchange) (000) Date By the Fund By the Fund (Depreciation)
Citigroup Global Markets, Inc./(CME Group) USD 453,010 4/20/23 2.850% 3 Month LIBOR $ (5,163,771)Citigroup Global Markets, Inc./(CME Group) 58,460 6/28/26 1.460% 3 Month LIBOR 4,632,995Total $ (530,776)
Appreciation $ 4,632,995 Depreciation $ (5,163,771)
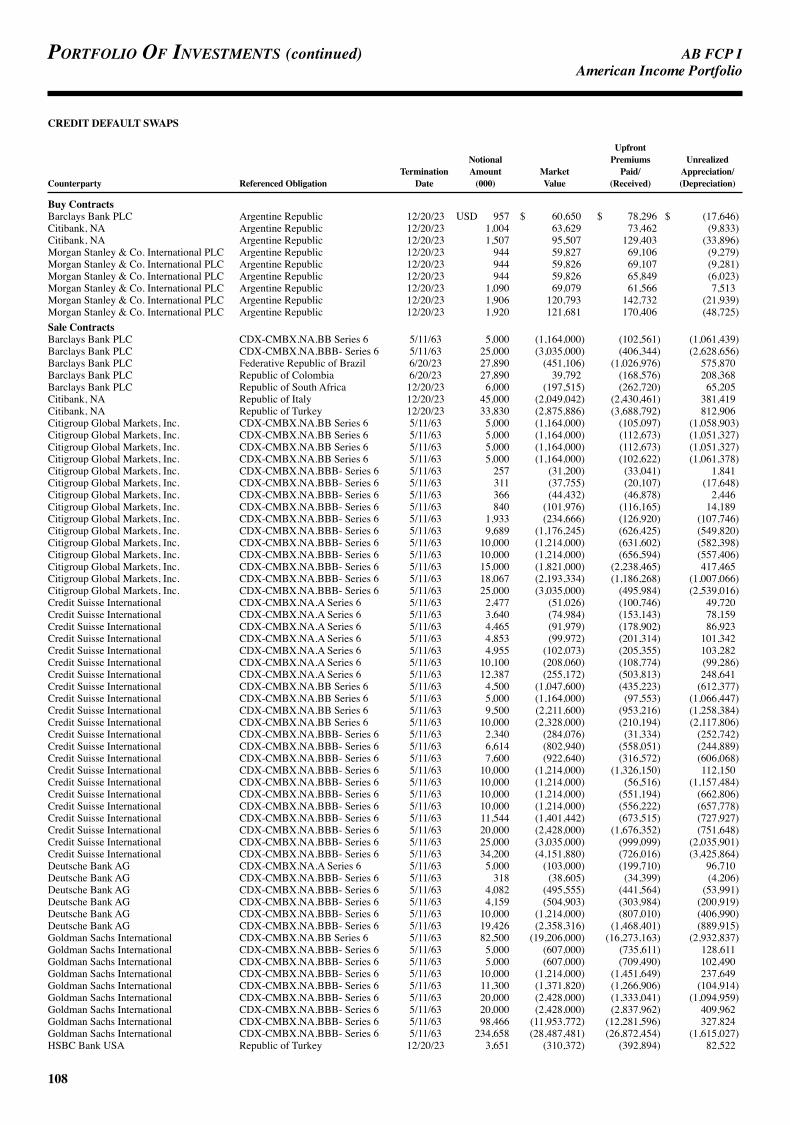
AB FCP I
108
Portfolio of investments (continued) AmericanIncomePortfolio
CREDIT DEFAULT SWAPS
Upfront Notional Premiums Unrealized Termination Amount Market Paid/ Appreciation/ Counterparty Referenced Obligation Date (000) Value (Received) (Depreciation)
Buy ContractsBarclays Bank PLC Argentine Republic 12/20/23 USD 957 $ 60,650 $ 78,296 $ (17,646)Citibank, NA Argentine Republic 12/20/23 1,004 63,629 73,462 (9,833)Citibank, NA Argentine Republic 12/20/23 1,507 95,507 129,403 (33,896)Morgan Stanley & Co. International PLC Argentine Republic 12/20/23 944 59,827 69,106 (9,279)Morgan Stanley & Co. International PLC Argentine Republic 12/20/23 944 59,826 69,107 (9,281)Morgan Stanley & Co. International PLC Argentine Republic 12/20/23 944 59,826 65,849 (6,023)Morgan Stanley & Co. International PLC Argentine Republic 12/20/23 1,090 69,079 61,566 7,513Morgan Stanley & Co. International PLC Argentine Republic 12/20/23 1,906 120,793 142,732 (21,939)Morgan Stanley & Co. International PLC Argentine Republic 12/20/23 1,920 121,681 170,406 (48,725)Sale ContractsBarclays Bank PLC CDX-CMBX.NA.BB Series 6 5/11/63 5,000 (1,164,000) (102,561) (1,061,439)Barclays Bank PLC CDX-CMBX.NA.BBB- Series 6 5/11/63 25,000 (3,035,000) (406,344) (2,628,656)Barclays Bank PLC Federative Republic of Brazil 6/20/23 27,890 (451,106) (1,026,976) 575,870Barclays Bank PLC Republic of Colombia 6/20/23 27,890 39,792 (168,576) 208,368Barclays Bank PLC Republic of South Africa 12/20/23 6,000 (197,515) (262,720) 65,205Citibank, NA Republic of Italy 12/20/23 45,000 (2,049,042) (2,430,461) 381,419Citibank, NA Republic of Turkey 12/20/23 33,830 (2,875,886) (3,688,792) 812,906Citigroup Global Markets, Inc. CDX-CMBX.NA.BB Series 6 5/11/63 5,000 (1,164,000) (105,097) (1,058,903)Citigroup Global Markets, Inc. CDX-CMBX.NA.BB Series 6 5/11/63 5,000 (1,164,000) (112,673) (1,051,327)Citigroup Global Markets, Inc. CDX-CMBX.NA.BB Series 6 5/11/63 5,000 (1,164,000) (112,673) (1,051,327)Citigroup Global Markets, Inc. CDX-CMBX.NA.BB Series 6 5/11/63 5,000 (1,164,000) (102,622) (1,061,378)Citigroup Global Markets, Inc. CDX-CMBX.NA.BBB- Series 6 5/11/63 257 (31,200) (33,041) 1,841Citigroup Global Markets, Inc. CDX-CMBX.NA.BBB- Series 6 5/11/63 311 (37,755) (20,107) (17,648)Citigroup Global Markets, Inc. CDX-CMBX.NA.BBB- Series 6 5/11/63 366 (44,432) (46,878) 2,446Citigroup Global Markets, Inc. CDX-CMBX.NA.BBB- Series 6 5/11/63 840 (101,976) (116,165) 14,189Citigroup Global Markets, Inc. CDX-CMBX.NA.BBB- Series 6 5/11/63 1,933 (234,666) (126,920) (107,746)Citigroup Global Markets, Inc. CDX-CMBX.NA.BBB- Series 6 5/11/63 9,689 (1,176,245) (626,425) (549,820)Citigroup Global Markets, Inc. CDX-CMBX.NA.BBB- Series 6 5/11/63 10,000 (1,214,000) (631,602) (582,398)Citigroup Global Markets, Inc. CDX-CMBX.NA.BBB- Series 6 5/11/63 10,000 (1,214,000) (656,594) (557,406)Citigroup Global Markets, Inc. CDX-CMBX.NA.BBB- Series 6 5/11/63 15,000 (1,821,000) (2,238,465) 417,465Citigroup Global Markets, Inc. CDX-CMBX.NA.BBB- Series 6 5/11/63 18,067 (2,193,334) (1,186,268) (1,007,066)Citigroup Global Markets, Inc. CDX-CMBX.NA.BBB- Series 6 5/11/63 25,000 (3,035,000) (495,984) (2,539,016)Credit Suisse International CDX-CMBX.NA.A Series 6 5/11/63 2,477 (51,026) (100,746) 49,720Credit Suisse International CDX-CMBX.NA.A Series 6 5/11/63 3,640 (74,984) (153,143) 78,159Credit Suisse International CDX-CMBX.NA.A Series 6 5/11/63 4,465 (91,979) (178,902) 86,923Credit Suisse International CDX-CMBX.NA.A Series 6 5/11/63 4,853 (99,972) (201,314) 101,342Credit Suisse International CDX-CMBX.NA.A Series 6 5/11/63 4,955 (102,073) (205,355) 103,282Credit Suisse International CDX-CMBX.NA.A Series 6 5/11/63 10,100 (208,060) (108,774) (99,286)Credit Suisse International CDX-CMBX.NA.A Series 6 5/11/63 12,387 (255,172) (503,813) 248,641Credit Suisse International CDX-CMBX.NA.BB Series 6 5/11/63 4,500 (1,047,600) (435,223) (612,377)Credit Suisse International CDX-CMBX.NA.BB Series 6 5/11/63 5,000 (1,164,000) (97,553) (1,066,447)Credit Suisse International CDX-CMBX.NA.BB Series 6 5/11/63 9,500 (2,211,600) (953,216) (1,258,384)Credit Suisse International CDX-CMBX.NA.BB Series 6 5/11/63 10,000 (2,328,000) (210,194) (2,117,806)Credit Suisse International CDX-CMBX.NA.BBB- Series 6 5/11/63 2,340 (284,076) (31,334) (252,742)Credit Suisse International CDX-CMBX.NA.BBB- Series 6 5/11/63 6,614 (802,940) (558,051) (244,889)Credit Suisse International CDX-CMBX.NA.BBB- Series 6 5/11/63 7,600 (922,640) (316,572) (606,068)Credit Suisse International CDX-CMBX.NA.BBB- Series 6 5/11/63 10,000 (1,214,000) (1,326,150) 112,150Credit Suisse International CDX-CMBX.NA.BBB- Series 6 5/11/63 10,000 (1,214,000) (56,516) (1,157,484)Credit Suisse International CDX-CMBX.NA.BBB- Series 6 5/11/63 10,000 (1,214,000) (551,194) (662,806)Credit Suisse International CDX-CMBX.NA.BBB- Series 6 5/11/63 10,000 (1,214,000) (556,222) (657,778)Credit Suisse International CDX-CMBX.NA.BBB- Series 6 5/11/63 11,544 (1,401,442) (673,515) (727,927)Credit Suisse International CDX-CMBX.NA.BBB- Series 6 5/11/63 20,000 (2,428,000) (1,676,352) (751,648)Credit Suisse International CDX-CMBX.NA.BBB- Series 6 5/11/63 25,000 (3,035,000) (999,099) (2,035,901)Credit Suisse International CDX-CMBX.NA.BBB- Series 6 5/11/63 34,200 (4,151,880) (726,016) (3,425,864)Deutsche Bank AG CDX-CMBX.NA.A Series 6 5/11/63 5,000 (103,000) (199,710) 96,710Deutsche Bank AG CDX-CMBX.NA.BBB- Series 6 5/11/63 318 (38,605) (34,399) (4,206)Deutsche Bank AG CDX-CMBX.NA.BBB- Series 6 5/11/63 4,082 (495,555) (441,564) (53,991)Deutsche Bank AG CDX-CMBX.NA.BBB- Series 6 5/11/63 4,159 (504,903) (303,984) (200,919)Deutsche Bank AG CDX-CMBX.NA.BBB- Series 6 5/11/63 10,000 (1,214,000) (807,010) (406,990)Deutsche Bank AG CDX-CMBX.NA.BBB- Series 6 5/11/63 19,426 (2,358,316) (1,468,401) (889,915)Goldman Sachs International CDX-CMBX.NA.BB Series 6 5/11/63 82,500 (19,206,000) (16,273,163) (2,932,837)Goldman Sachs International CDX-CMBX.NA.BBB- Series 6 5/11/63 5,000 (607,000) (735,611) 128,611Goldman Sachs International CDX-CMBX.NA.BBB- Series 6 5/11/63 5,000 (607,000) (709,490) 102,490Goldman Sachs International CDX-CMBX.NA.BBB- Series 6 5/11/63 10,000 (1,214,000) (1,451,649) 237,649Goldman Sachs International CDX-CMBX.NA.BBB- Series 6 5/11/63 11,300 (1,371,820) (1,266,906) (104,914)Goldman Sachs International CDX-CMBX.NA.BBB- Series 6 5/11/63 20,000 (2,428,000) (1,333,041) (1,094,959)Goldman Sachs International CDX-CMBX.NA.BBB- Series 6 5/11/63 20,000 (2,428,000) (2,837,962) 409,962Goldman Sachs International CDX-CMBX.NA.BBB- Series 6 5/11/63 98,466 (11,953,772) (12,281,596) 327,824Goldman Sachs International CDX-CMBX.NA.BBB- Series 6 5/11/63 234,658 (28,487,481) (26,872,454) (1,615,027)HSBC Bank USA Republic of Turkey 12/20/23 3,651 (310,372) (392,894) 82,522

AB FCP I
109
AmericanIncomePortfolio
Upfront Notional Premiums Unrealized Termination Amount Market Paid/ Appreciation/ Counterparty Referenced Obligation Date (000) Value (Received) (Depreciation)
HSBC Bank USA Republic of Turkey 12/20/23 USD 3,651 $ (310,372) $ (396,882) $ 86,510JP Morgan Securities, LLC CDX-CMBX.NA.A Series 6 5/11/63 7,042 (145,065) (289,348) 144,283JP Morgan Securities, LLC CDX-CMBX.NA.A Series 6 5/11/63 8,283 (170,630) (182,975) 12,345JP Morgan Securities, LLC CDX-CMBX.NA.A Series 6 5/11/63 10,000 (206,000) (433,422) 227,422JP Morgan Securities, LLC CDX-CMBX.NA.A Series 6 5/11/63 10,000 (206,000) (391,853) 185,853JP Morgan Securities, LLC CDX-CMBX.NA.A Series 6 5/11/63 25,000 (515,000) (929,677) 414,677JP Morgan Securities, LLC CDX-CMBX.NA.BBB- Series 6 5/11/63 5,000 (607,000) (699,231) 92,231JP Morgan Securities, LLC CDX-CMBX.NA.BBB- Series 6 5/11/63 5,000 (607,000) (796,917) 189,917JP Morgan Securities, LLC CDX-CMBX.NA.BBB- Series 6 5/11/63 5,000 (607,000) (594,436) (12,564)JP Morgan Securities, LLC CDX-CMBX.NA.BBB- Series 6 5/11/63 5,000 (607,000) (534,814) (72,186)JP Morgan Securities, LLC CDX-CMBX.NA.BBB- Series 6 5/11/63 6,452 (783,273) (892,257) 108,984JP Morgan Securities, LLC CDX-CMBX.NA.BBB- Series 6 5/11/63 6,972 (846,401) (930,479) 84,078JP Morgan Securities, LLC CDX-CMBX.NA.BBB- Series 6 5/11/63 10,000 (1,214,000) (1,580,710) 366,710JP Morgan Securities, LLC CDX-CMBX.NA.BBB- Series 6 5/11/63 10,000 (1,214,000) (1,617,683) 403,683JP Morgan Securities, LLC CDX-CMBX.NA.BBB- Series 6 5/11/63 10,000 (1,214,000) (1,590,139) 376,139JP Morgan Securities, LLC CDX-CMBX.NA.BBB- Series 6 5/11/63 10,000 (1,214,000) (1,593,834) 379,834JP Morgan Securities, LLC CDX-CMBX.NA.BBB- Series 6 5/11/63 10,000 (1,214,000) (1,285,984) 71,984JP Morgan Securities, LLC CDX-CMBX.NA.BBB- Series 6 5/11/63 10,000 (1,214,000) (1,081,254) (132,746)JP Morgan Securities, LLC CDX-CMBX.NA.BBB- Series 6 5/11/63 25,000 (3,035,000) (3,527,138) 492,138JPMorgan Chase Bank, NA Republic of Turkey 12/20/23 276 (23,463) (32,438) 8,975JPMorgan Chase Bank, NA Republic of Turkey 12/20/23 276 (23,463) (29,822) 6,359JPMorgan Chase Bank, NA Republic of Turkey 12/20/23 551 (46,841) (60,026) 13,185JPMorgan Chase Bank, NA Republic of Turkey 12/20/23 551 (46,841) (59,554) 12,713JPMorgan Chase Bank, NA Republic of Turkey 12/20/23 1,461 (124,199) (159,872) 35,673JPMorgan Chase Bank, NA Republic of Turkey 12/20/23 1,461 (124,200) (169,838) 45,638JPMorgan Chase Bank, NA Republic of Turkey 12/20/23 1,461 (124,200) (169,317) 45,117JPMorgan Chase Bank, NA Republic of Turkey 12/20/23 1,461 (124,199) (160,986) 36,787JPMorgan Chase Bank, NA Republic of Turkey 12/20/23 2,191 (186,257) (253,918) 67,661JPMorgan Chase Bank, NA Republic of Turkey 12/20/23 3,635 (309,011) (394,083) 85,072JPMorgan Chase Bank, NA Republic of Turkey 12/20/23 3,635 (309,011) (394,083) 85,072JPMorgan Chase Bank, NA Republic of Turkey 12/20/23 3,738 (317,768) (439,323) 121,555JPMorgan Chase Bank, NA Republic of Turkey 12/20/23 3,738 (317,768) (403,889) 86,121JPMorgan Chase Bank, NA Republic of Turkey 12/20/23 7,477 (635,620) (814,543) 178,923JPMorgan Chase Bank, NA Republic of Turkey 12/20/23 7,477 (635,621) (808,135) 172,514Morgan Stanley & Co. International PLC CDX-CMBX.NA.A Series 6 5/11/63 325 (6,702) (13,711) 7,009Morgan Stanley & Co. International PLC CDX-CMBX.NA.BB Series 6 5/11/63 5,000 (1,163,999) (95,037) (1,068,962)Morgan Stanley & Co. International PLC CDX-CMBX.NA.BB Series 6 5/11/63 5,000 (1,164,000) (99,905) (1,064,095)Morgan Stanley & Co. International PLC CDX-CMBX.NA.BB Series 6 5/11/63 5,000 (1,164,000) (89,632) (1,074,368)Morgan Stanley & Co. International PLC CDX-CMBX.NA.BB Series 6 5/11/63 10,000 (2,328,000) (200,018) (2,127,982)Morgan Stanley & Co. International PLC CDX-CMBX.NA.BB Series 6 5/11/63 10,000 (2,328,000) (204,923) (2,123,077)Morgan Stanley & Co. International PLC CDX-CMBX.NA.BBB- Series 6 5/11/63 5,000 (607,000) (735,611) 128,611Morgan Stanley & Co. International PLC CDX-CMBX.NA.BBB- Series 6 5/11/63 6,529 (792,620) (469,055) (323,565)Morgan Stanley & Co. International PLC CDX-CMBX.NA.BBB- Series 6 5/11/63 7,700 (934,780) (1,054,944) 120,164Morgan Stanley & Co. International PLC CDX-CMBX.NA.BBB- Series 6 5/11/63 10,000 (1,214,000) (139,841) (1,074,159)Morgan Stanley & Co. International PLC CDX-CMBX.NA.BBB- Series 6 5/11/63 10,000 (1,214,000) (162,000) (1,052,000)Morgan Stanley & Co. International PLC CDX-CMBX.NA.BBB- Series 6 5/11/63 10,000 (1,214,000) (112,785) (1,101,215)Morgan Stanley & Co. International PLC CDX-CMBX.NA.BBB- Series 6 5/11/63 15,000 (1,821,000) (218,080) (1,602,920)Morgan Stanley & Co. International PLC Republic of South Africa 6/20/23 27,890 (691,683) (799,705) 108,022Morgan Stanley & Co. International PLC Republic of Turkey 12/20/23 3,650 (310,287) (444,030) 133,743Morgan Stanley & Co. International PLC Russian Federation 6/20/23 27,890 (228,585) (442,097) 213,512Total $ (160,086,674) $ (120,847,339) $ (39,239,335)
Appreciation $ 10,002,421 Depreciation $ (49,241,756)
INFLATION (CPI) SWAPS
Rate Type Notional Unrealized Amount Termination Payments Made Payments Received Appreciation/ Counterparty (000) Date By the Fund By the Fund (Depreciation)
Deutsche Bank AG USD 65,000 1/15/26 1.578% CPI# $ 3,104,613Total for Swaps $ (33,061,130)
# Variable interest rate based on the rate of inflation as determined by the Consumer Price Index (CPI) . (a) Position, or a portion thereof, has been segregated to collateralize OTC derivatives outstanding. (b) Floating Rate Security. Stated interest rate was in effect at February 28, 2019.(c) Inverse interest only security.
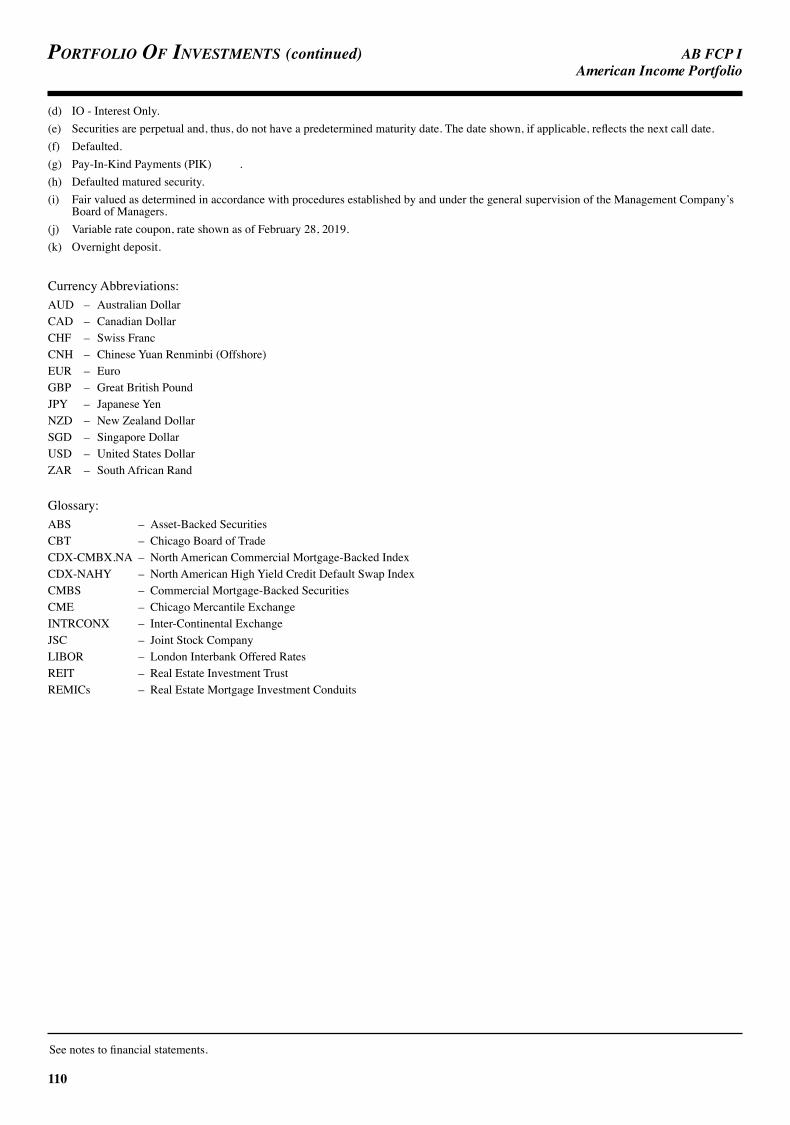
AB FCP I
110
Portfolio of investments (continued) AmericanIncomePortfolio
(d) IO - Interest Only.(e) Securities are perpetual and, thus, do not have a predetermined maturity date. The date shown, if applicable, reflects the next call date.(f) Defaulted.(g) Pay-In-Kind Payments (PIK) .(h) Defaulted matured security.(i) Fair valued as determined in accordance with procedures established by and under the general supervision of the Management Company’s
Board of Managers.(j) Variable rate coupon, rate shown as of February 28, 2019.(k) Overnight deposit.
Currency Abbreviations:AUD – Australian DollarCAD – Canadian DollarCHF – Swiss FrancCNH – Chinese Yuan Renminbi (Offshore)EUR – EuroGBP – Great British PoundJPY – Japanese YenNZD – New Zealand DollarSGD – Singapore DollarUSD – United States DollarZAR – South African Rand
Glossary:ABS – Asset-Backed SecuritiesCBT – Chicago Board of TradeCDX-CMBX.NA – North American Commercial Mortgage-Backed IndexCDX-NAHY – North American High Yield Credit Default Swap IndexCMBS – Commercial Mortgage-Backed SecuritiesCME – Chicago Mercantile ExchangeINTRCONX – Inter-Continental ExchangeJSC – Joint Stock CompanyLIBOR – London Interbank Offered RatesREIT – Real Estate Investment TrustREMICs – Real Estate Mortgage Investment Conduits
See notes to financial statements.
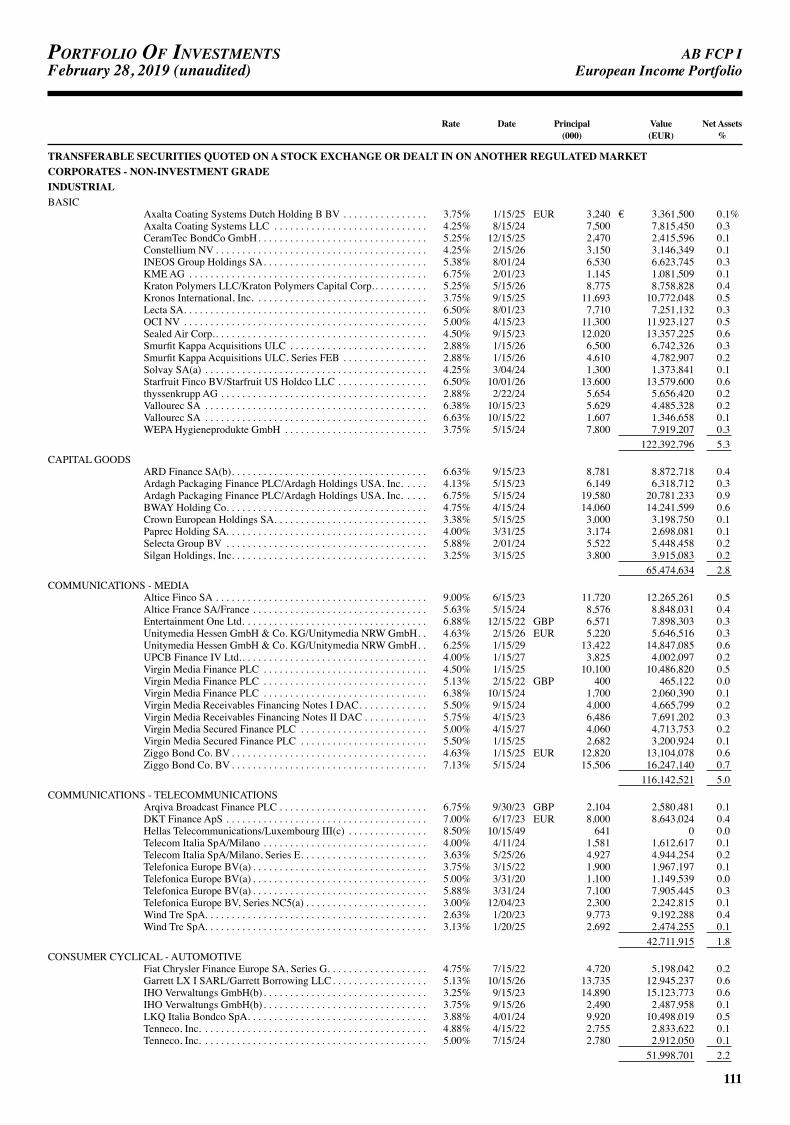
AB FCP I
111
Portfolio of investmentsFebruary 28, 2019 (unaudited) EuropeanIncomePortfolio
Rate Date Principal Value Net Assets (000) (EUR) %
TRANSFERABLE SECURITIES QUOTED ON A STOCK EXCHANGE OR DEALT IN ON ANOTHER REGULATED MARKETCORPORATES - NON-INVESTMENT GRADEINDUSTRIALBASIC
Axalta Coating Systems Dutch Holding B BV . . . . . . . . . . . . . . . . 3.75% 1/15/25 EUR 3,240 € 3,361,500 0.1%Axalta Coating Systems LLC . . . . . . . . . . . . . . . . . . . . . . . . . . . . . 4.25% 8/15/24 7,500 7,815,450 0.3CeramTec BondCo GmbH. . . . . . . . . . . . . . . . . . . . . . . . . . . . . . . . 5.25% 12/15/25 2,470 2,415,596 0.1Constellium NV . . . . . . . . . . . . . . . . . . . . . . . . . . . . . . . . . . . . . . . . 4.25% 2/15/26 3,150 3,146,349 0.1INEOS Group Holdings SA. . . . . . . . . . . . . . . . . . . . . . . . . . . . . . . 5.38% 8/01/24 6,530 6,623,745 0.3KME AG . . . . . . . . . . . . . . . . . . . . . . . . . . . . . . . . . . . . . . . . . . . . . 6.75% 2/01/23 1,145 1,081,509 0.1Kraton Polymers LLC/Kraton Polymers Capital Corp.. . . . . . . . . . 5.25% 5/15/26 8,775 8,758,828 0.4Kronos International, Inc. . . . . . . . . . . . . . . . . . . . . . . . . . . . . . . . . 3.75% 9/15/25 11,693 10,772,048 0.5Lecta SA. . . . . . . . . . . . . . . . . . . . . . . . . . . . . . . . . . . . . . . . . . . . . . 6.50% 8/01/23 7,710 7,251,132 0.3OCI NV . . . . . . . . . . . . . . . . . . . . . . . . . . . . . . . . . . . . . . . . . . . . . . 5.00% 4/15/23 11,300 11,923,127 0.5Sealed Air Corp.. . . . . . . . . . . . . . . . . . . . . . . . . . . . . . . . . . . . . . . . 4.50% 9/15/23 12,020 13,357,225 0.6Smurfit Kappa Acquisitions ULC . . . . . . . . . . . . . . . . . . . . . . . . . . 2.88% 1/15/26 6,500 6,742,326 0.3Smurfit Kappa Acquisitions ULC, Series FEB . . . . . . . . . . . . . . . . 2.88% 1/15/26 4,610 4,782,907 0.2Solvay SA(a) . . . . . . . . . . . . . . . . . . . . . . . . . . . . . . . . . . . . . . . . . . 4.25% 3/04/24 1,300 1,373,841 0.1Starfruit Finco BV/Starfruit US Holdco LLC . . . . . . . . . . . . . . . . . 6.50% 10/01/26 13,600 13,579,600 0.6thyssenkrupp AG . . . . . . . . . . . . . . . . . . . . . . . . . . . . . . . . . . . . . . . 2.88% 2/22/24 5,654 5,656,420 0.2Vallourec SA . . . . . . . . . . . . . . . . . . . . . . . . . . . . . . . . . . . . . . . . . . 6.38% 10/15/23 5,629 4,485,328 0.2Vallourec SA . . . . . . . . . . . . . . . . . . . . . . . . . . . . . . . . . . . . . . . . . . 6.63% 10/15/22 1,607 1,346,658 0.1WEPA Hygieneprodukte GmbH . . . . . . . . . . . . . . . . . . . . . . . . . . . 3.75% 5/15/24 7,800 7,919,207 0.3 122,392,796 5.3
CAPITAL GOODSARD Finance SA(b). . . . . . . . . . . . . . . . . . . . . . . . . . . . . . . . . . . . . 6.63% 9/15/23 8,781 8,872,718 0.4Ardagh Packaging Finance PLC/Ardagh Holdings USA, Inc. . . . . 4.13% 5/15/23 6,149 6,318,712 0.3Ardagh Packaging Finance PLC/Ardagh Holdings USA, Inc. . . . . 6.75% 5/15/24 19,580 20,781,233 0.9BWAY Holding Co. . . . . . . . . . . . . . . . . . . . . . . . . . . . . . . . . . . . . . 4.75% 4/15/24 14,060 14,241,599 0.6Crown European Holdings SA. . . . . . . . . . . . . . . . . . . . . . . . . . . . . 3.38% 5/15/25 3,000 3,198,750 0.1Paprec Holding SA. . . . . . . . . . . . . . . . . . . . . . . . . . . . . . . . . . . . . . 4.00% 3/31/25 3,174 2,698,081 0.1Selecta Group BV . . . . . . . . . . . . . . . . . . . . . . . . . . . . . . . . . . . . . . 5.88% 2/01/24 5,522 5,448,458 0.2Silgan Holdings, Inc. . . . . . . . . . . . . . . . . . . . . . . . . . . . . . . . . . . . . 3.25% 3/15/25 3,800 3,915,083 0.2 65,474,634 2.8
COMMUNICATIONS - MEDIAAltice Finco SA . . . . . . . . . . . . . . . . . . . . . . . . . . . . . . . . . . . . . . . . 9.00% 6/15/23 11,720 12,265,261 0.5Altice France SA/France . . . . . . . . . . . . . . . . . . . . . . . . . . . . . . . . . 5.63% 5/15/24 8,576 8,848,031 0.4Entertainment One Ltd. . . . . . . . . . . . . . . . . . . . . . . . . . . . . . . . . . . 6.88% 12/15/22 GBP 6,571 7,898,303 0.3Unitymedia Hessen GmbH & Co. KG/Unitymedia NRW GmbH. . 4.63% 2/15/26 EUR 5,220 5,646,516 0.3Unitymedia Hessen GmbH & Co. KG/Unitymedia NRW GmbH. . 6.25% 1/15/29 13,422 14,847,085 0.6UPCB Finance IV Ltd.. . . . . . . . . . . . . . . . . . . . . . . . . . . . . . . . . . . 4.00% 1/15/27 3,825 4,002,097 0.2Virgin Media Finance PLC . . . . . . . . . . . . . . . . . . . . . . . . . . . . . . . 4.50% 1/15/25 10,100 10,486,820 0.5Virgin Media Finance PLC . . . . . . . . . . . . . . . . . . . . . . . . . . . . . . . 5.13% 2/15/22 GBP 400 465,122 0.0Virgin Media Finance PLC . . . . . . . . . . . . . . . . . . . . . . . . . . . . . . . 6.38% 10/15/24 1,700 2,060,390 0.1Virgin Media Receivables Financing Notes I DAC. . . . . . . . . . . . . 5.50% 9/15/24 4,000 4,665,799 0.2Virgin Media Receivables Financing Notes II DAC . . . . . . . . . . . . 5.75% 4/15/23 6,486 7,691,202 0.3Virgin Media Secured Finance PLC . . . . . . . . . . . . . . . . . . . . . . . . 5.00% 4/15/27 4,060 4,713,753 0.2Virgin Media Secured Finance PLC . . . . . . . . . . . . . . . . . . . . . . . . 5.50% 1/15/25 2,682 3,200,924 0.1Ziggo Bond Co. BV . . . . . . . . . . . . . . . . . . . . . . . . . . . . . . . . . . . . . 4.63% 1/15/25 EUR 12,820 13,104,078 0.6Ziggo Bond Co. BV . . . . . . . . . . . . . . . . . . . . . . . . . . . . . . . . . . . . . 7.13% 5/15/24 15,506 16,247,140 0.7 116,142,521 5.0
COMMUNICATIONS - TELECOMMUNICATIONSArqiva Broadcast Finance PLC . . . . . . . . . . . . . . . . . . . . . . . . . . . . 6.75% 9/30/23 GBP 2,104 2,580,481 0.1DKT Finance ApS . . . . . . . . . . . . . . . . . . . . . . . . . . . . . . . . . . . . . . 7.00% 6/17/23 EUR 8,000 8,643,024 0.4Hellas Telecommunications/Luxembourg III(c) . . . . . . . . . . . . . . . 8.50% 10/15/49 641 0 0.0Telecom Italia SpA/Milano . . . . . . . . . . . . . . . . . . . . . . . . . . . . . . . 4.00% 4/11/24 1,581 1,612,617 0.1Telecom Italia SpA/Milano, Series E. . . . . . . . . . . . . . . . . . . . . . . . 3.63% 5/25/26 4,927 4,944,254 0.2Telefonica Europe BV(a) . . . . . . . . . . . . . . . . . . . . . . . . . . . . . . . . . 3.75% 3/15/22 1,900 1,967,197 0.1Telefonica Europe BV(a) . . . . . . . . . . . . . . . . . . . . . . . . . . . . . . . . . 5.00% 3/31/20 1,100 1,149,539 0.0Telefonica Europe BV(a) . . . . . . . . . . . . . . . . . . . . . . . . . . . . . . . . . 5.88% 3/31/24 7,100 7,905,445 0.3Telefonica Europe BV, Series NC5(a) . . . . . . . . . . . . . . . . . . . . . . . 3.00% 12/04/23 2,300 2,242,815 0.1Wind Tre SpA. . . . . . . . . . . . . . . . . . . . . . . . . . . . . . . . . . . . . . . . . . 2.63% 1/20/23 9,773 9,192,288 0.4Wind Tre SpA. . . . . . . . . . . . . . . . . . . . . . . . . . . . . . . . . . . . . . . . . . 3.13% 1/20/25 2,692 2,474,255 0.1 42,711,915 1.8
CONSUMER CYCLICAL - AUTOMOTIVEFiat Chrysler Finance Europe SA, Series G. . . . . . . . . . . . . . . . . . . 4.75% 7/15/22 4,720 5,198,042 0.2Garrett LX I SARL/Garrett Borrowing LLC. . . . . . . . . . . . . . . . . . 5.13% 10/15/26 13,735 12,945,237 0.6IHO Verwaltungs GmbH(b) . . . . . . . . . . . . . . . . . . . . . . . . . . . . . . . 3.25% 9/15/23 14,890 15,123,773 0.6IHO Verwaltungs GmbH(b) . . . . . . . . . . . . . . . . . . . . . . . . . . . . . . . 3.75% 9/15/26 2,490 2,487,958 0.1LKQ Italia Bondco SpA. . . . . . . . . . . . . . . . . . . . . . . . . . . . . . . . . . 3.88% 4/01/24 9,920 10,498,019 0.5Tenneco, Inc. . . . . . . . . . . . . . . . . . . . . . . . . . . . . . . . . . . . . . . . . . . 4.88% 4/15/22 2,755 2,833,622 0.1Tenneco, Inc. . . . . . . . . . . . . . . . . . . . . . . . . . . . . . . . . . . . . . . . . . . 5.00% 7/15/24 2,780 2,912,050 0.1 51,998,701 2.2
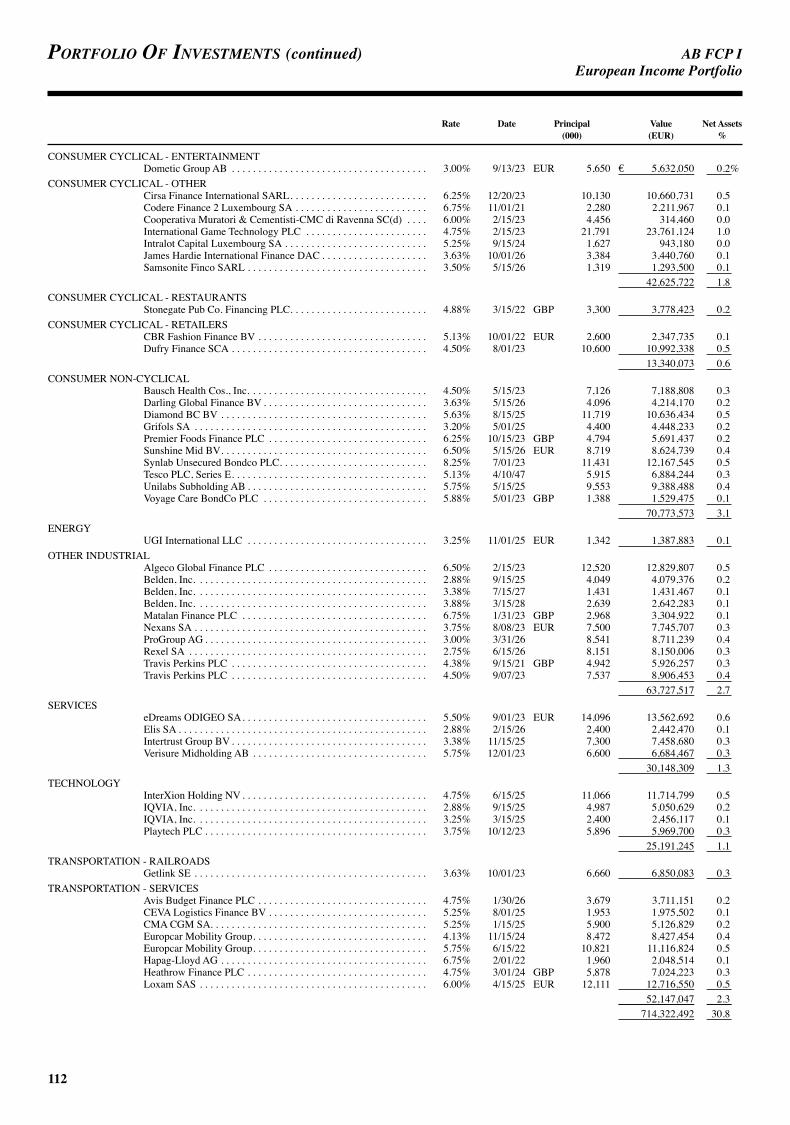
AB FCP I
112
Portfolio of investments (continued) EuropeanIncomePortfolio
Rate Date Principal Value Net Assets (000) (EUR) %
CONSUMER CYCLICAL - ENTERTAINMENTDometic Group AB . . . . . . . . . . . . . . . . . . . . . . . . . . . . . . . . . . . . . 3.00% 9/13/23 EUR 5,650 € 5,632,050 0.2%
CONSUMER CYCLICAL - OTHERCirsa Finance International SARL. . . . . . . . . . . . . . . . . . . . . . . . . . 6.25% 12/20/23 10,130 10,660,731 0.5Codere Finance 2 Luxembourg SA . . . . . . . . . . . . . . . . . . . . . . . . . 6.75% 11/01/21 2,280 2,211,967 0.1Cooperativa Muratori & Cementisti-CMC di Ravenna SC(d) . . . . 6.00% 2/15/23 4,456 314,460 0.0International Game Technology PLC . . . . . . . . . . . . . . . . . . . . . . . 4.75% 2/15/23 21,791 23,761,124 1.0Intralot Capital Luxembourg SA . . . . . . . . . . . . . . . . . . . . . . . . . . . 5.25% 9/15/24 1,627 943,180 0.0James Hardie International Finance DAC . . . . . . . . . . . . . . . . . . . . 3.63% 10/01/26 3,384 3,440,760 0.1Samsonite Finco SARL . . . . . . . . . . . . . . . . . . . . . . . . . . . . . . . . . . 3.50% 5/15/26 1,319 1,293,500 0.1 42,625,722 1.8
CONSUMER CYCLICAL - RESTAURANTSStonegate Pub Co. Financing PLC. . . . . . . . . . . . . . . . . . . . . . . . . . 4.88% 3/15/22 GBP 3,300 3,778,423 0.2
CONSUMER CYCLICAL - RETAILERSCBR Fashion Finance BV . . . . . . . . . . . . . . . . . . . . . . . . . . . . . . . . 5.13% 10/01/22 EUR 2,600 2,347,735 0.1Dufry Finance SCA . . . . . . . . . . . . . . . . . . . . . . . . . . . . . . . . . . . . . 4.50% 8/01/23 10,600 10,992,338 0.5 13,340,073 0.6
CONSUMER NON-CYCLICALBausch Health Cos., Inc. . . . . . . . . . . . . . . . . . . . . . . . . . . . . . . . . . 4.50% 5/15/23 7,126 7,188,808 0.3Darling Global Finance BV . . . . . . . . . . . . . . . . . . . . . . . . . . . . . . . 3.63% 5/15/26 4,096 4,214,170 0.2Diamond BC BV . . . . . . . . . . . . . . . . . . . . . . . . . . . . . . . . . . . . . . . 5.63% 8/15/25 11,719 10,636,434 0.5Grifols SA . . . . . . . . . . . . . . . . . . . . . . . . . . . . . . . . . . . . . . . . . . . . 3.20% 5/01/25 4,400 4,448,233 0.2Premier Foods Finance PLC . . . . . . . . . . . . . . . . . . . . . . . . . . . . . . 6.25% 10/15/23 GBP 4,794 5,691,437 0.2Sunshine Mid BV. . . . . . . . . . . . . . . . . . . . . . . . . . . . . . . . . . . . . . . 6.50% 5/15/26 EUR 8,719 8,624,739 0.4Synlab Unsecured Bondco PLC. . . . . . . . . . . . . . . . . . . . . . . . . . . . 8.25% 7/01/23 11,431 12,167,545 0.5Tesco PLC, Series E. . . . . . . . . . . . . . . . . . . . . . . . . . . . . . . . . . . . . 5.13% 4/10/47 5,915 6,884,244 0.3Unilabs Subholding AB . . . . . . . . . . . . . . . . . . . . . . . . . . . . . . . . . . 5.75% 5/15/25 9,553 9,388,488 0.4Voyage Care BondCo PLC . . . . . . . . . . . . . . . . . . . . . . . . . . . . . . . 5.88% 5/01/23 GBP 1,388 1,529,475 0.1 70,773,573 3.1
ENERGYUGI International LLC . . . . . . . . . . . . . . . . . . . . . . . . . . . . . . . . . . 3.25% 11/01/25 EUR 1,342 1,387,883 0.1
OTHER INDUSTRIALAlgeco Global Finance PLC . . . . . . . . . . . . . . . . . . . . . . . . . . . . . . 6.50% 2/15/23 12,520 12,829,807 0.5Belden, Inc. . . . . . . . . . . . . . . . . . . . . . . . . . . . . . . . . . . . . . . . . . . . 2.88% 9/15/25 4,049 4,079,376 0.2Belden, Inc. . . . . . . . . . . . . . . . . . . . . . . . . . . . . . . . . . . . . . . . . . . . 3.38% 7/15/27 1,431 1,431,467 0.1Belden, Inc. . . . . . . . . . . . . . . . . . . . . . . . . . . . . . . . . . . . . . . . . . . . 3.88% 3/15/28 2,639 2,642,283 0.1Matalan Finance PLC . . . . . . . . . . . . . . . . . . . . . . . . . . . . . . . . . . . 6.75% 1/31/23 GBP 2,968 3,304,922 0.1Nexans SA . . . . . . . . . . . . . . . . . . . . . . . . . . . . . . . . . . . . . . . . . . . . 3.75% 8/08/23 EUR 7,500 7,745,707 0.3ProGroup AG . . . . . . . . . . . . . . . . . . . . . . . . . . . . . . . . . . . . . . . . . . 3.00% 3/31/26 8,541 8,711,239 0.4Rexel SA . . . . . . . . . . . . . . . . . . . . . . . . . . . . . . . . . . . . . . . . . . . . . 2.75% 6/15/26 8,151 8,150,006 0.3Travis Perkins PLC . . . . . . . . . . . . . . . . . . . . . . . . . . . . . . . . . . . . . 4.38% 9/15/21 GBP 4,942 5,926,257 0.3Travis Perkins PLC . . . . . . . . . . . . . . . . . . . . . . . . . . . . . . . . . . . . . 4.50% 9/07/23 7,537 8,906,453 0.4 63,727,517 2.7
SERVICESeDreams ODIGEO SA. . . . . . . . . . . . . . . . . . . . . . . . . . . . . . . . . . . 5.50% 9/01/23 EUR 14,096 13,562,692 0.6Elis SA . . . . . . . . . . . . . . . . . . . . . . . . . . . . . . . . . . . . . . . . . . . . . . . 2.88% 2/15/26 2,400 2,442,470 0.1Intertrust Group BV . . . . . . . . . . . . . . . . . . . . . . . . . . . . . . . . . . . . . 3.38% 11/15/25 7,300 7,458,680 0.3Verisure Midholding AB . . . . . . . . . . . . . . . . . . . . . . . . . . . . . . . . . 5.75% 12/01/23 6,600 6,684,467 0.3 30,148,309 1.3
TECHNOLOGYInterXion Holding NV . . . . . . . . . . . . . . . . . . . . . . . . . . . . . . . . . . . 4.75% 6/15/25 11,066 11,714,799 0.5IQVIA, Inc. . . . . . . . . . . . . . . . . . . . . . . . . . . . . . . . . . . . . . . . . . . . 2.88% 9/15/25 4,987 5,050,629 0.2IQVIA, Inc. . . . . . . . . . . . . . . . . . . . . . . . . . . . . . . . . . . . . . . . . . . . 3.25% 3/15/25 2,400 2,456,117 0.1Playtech PLC . . . . . . . . . . . . . . . . . . . . . . . . . . . . . . . . . . . . . . . . . . 3.75% 10/12/23 5,896 5,969,700 0.3 25,191,245 1.1
TRANSPORTATION - RAILROADSGetlink SE . . . . . . . . . . . . . . . . . . . . . . . . . . . . . . . . . . . . . . . . . . . . 3.63% 10/01/23 6,660 6,850,083 0.3
TRANSPORTATION - SERVICESAvis Budget Finance PLC . . . . . . . . . . . . . . . . . . . . . . . . . . . . . . . . 4.75% 1/30/26 3,679 3,711,151 0.2CEVA Logistics Finance BV . . . . . . . . . . . . . . . . . . . . . . . . . . . . . . 5.25% 8/01/25 1,953 1,975,502 0.1CMA CGM SA. . . . . . . . . . . . . . . . . . . . . . . . . . . . . . . . . . . . . . . . . 5.25% 1/15/25 5,900 5,126,829 0.2Europcar Mobility Group. . . . . . . . . . . . . . . . . . . . . . . . . . . . . . . . . 4.13% 11/15/24 8,472 8,427,454 0.4Europcar Mobility Group. . . . . . . . . . . . . . . . . . . . . . . . . . . . . . . . . 5.75% 6/15/22 10,821 11,116,824 0.5Hapag-Lloyd AG . . . . . . . . . . . . . . . . . . . . . . . . . . . . . . . . . . . . . . . 6.75% 2/01/22 1,960 2,048,514 0.1Heathrow Finance PLC . . . . . . . . . . . . . . . . . . . . . . . . . . . . . . . . . . 4.75% 3/01/24 GBP 5,878 7,024,223 0.3Loxam SAS . . . . . . . . . . . . . . . . . . . . . . . . . . . . . . . . . . . . . . . . . . . 6.00% 4/15/25 EUR 12,111 12,716,550 0.5 52,147,047 2.3 714,322,492 30.8

AB FCP I
113
EuropeanIncomePortfolio
Rate Date Principal Value Net Assets (000) (EUR) %
FINANCIAL INSTITUTIONSBANKING
ABN AMRO Bank NV(a) . . . . . . . . . . . . . . . . . . . . . . . . . . . . . . . . 5.75% 9/22/20 EUR 10,100 € 10,568,993 0.5%Allied Irish Banks PLC, Series E(a) . . . . . . . . . . . . . . . . . . . . . . . . 7.38% 12/03/20 4,480 4,815,167 0.2Banco Bilbao Vizcaya Argentaria SA(a) . . . . . . . . . . . . . . . . . . . . . 5.88% 5/24/22 6,000 6,148,956 0.3Banco de Credito Social Cooperativo SA . . . . . . . . . . . . . . . . . . . . 7.75% 6/07/27 1,100 948,536 0.0Banco de Sabadell SA, Series E . . . . . . . . . . . . . . . . . . . . . . . . . . . 6.25% 4/26/20 750 796,214 0.0Banco Santander SA(a) . . . . . . . . . . . . . . . . . . . . . . . . . . . . . . . . . . 5.25% 9/29/23 3,800 3,648,000 0.2Bank of Ireland . . . . . . . . . . . . . . . . . . . . . . . . . . . . . . . . . . . . . . . . 10.00% 12/19/22 3,800 4,831,411 0.2Bankia SA . . . . . . . . . . . . . . . . . . . . . . . . . . . . . . . . . . . . . . . . . . . . 3.75% 2/15/29 7,000 7,035,140 0.3Barclays Bank PLC, Series RCI(a) . . . . . . . . . . . . . . . . . . . . . . . . . 14.00% 6/15/19 GBP 3,932 4,739,730 0.2Barclays PLC . . . . . . . . . . . . . . . . . . . . . . . . . . . . . . . . . . . . . . . . . . 2.00% 2/07/28 EUR 13,185 12,565,991 0.5BAWAG Group AG(a) . . . . . . . . . . . . . . . . . . . . . . . . . . . . . . . . . . . 5.00% 5/14/25 9,000 8,509,500 0.4CaixaBank SA(a) . . . . . . . . . . . . . . . . . . . . . . . . . . . . . . . . . . . . . . . 6.75% 6/13/24 8,800 9,208,162 0.4Danske Bank A/S, Series E(a) . . . . . . . . . . . . . . . . . . . . . . . . . . . . . 5.88% 4/06/22 7,921 8,060,346 0.3Erste Group Bank AG(a) . . . . . . . . . . . . . . . . . . . . . . . . . . . . . . . . . 6.50% 4/15/24 6,000 6,524,904 0.3Ibercaja Banco SA . . . . . . . . . . . . . . . . . . . . . . . . . . . . . . . . . . . . . . 5.00% 7/28/25 1,100 1,115,880 0.0Intesa Sanpaolo SpA, Series E. . . . . . . . . . . . . . . . . . . . . . . . . . . . . 6.63% 9/13/23 6,130 7,140,175 0.3Lloyds Bank PLC, Series PERP(a) . . . . . . . . . . . . . . . . . . . . . . . . . 13.00% 1/22/29 GBP 7,150 13,955,712 0.6Lloyds Banking Group PLC(a) . . . . . . . . . . . . . . . . . . . . . . . . . . . . 6.38% 6/27/20 EUR 5,315 5,560,994 0.2Santander UK PLC(a) . . . . . . . . . . . . . . . . . . . . . . . . . . . . . . . . . . . 6.22% 5/24/19 GBP 3,143 3,638,243 0.2Societe Generale SA(a) . . . . . . . . . . . . . . . . . . . . . . . . . . . . . . . . . . 9.38% 9/04/19 EUR 6,050 6,323,678 0.3UBS Group Funding Switzerland AG(a) . . . . . . . . . . . . . . . . . . . . . 5.75% 2/19/22 8,091 8,838,236 0.4UniCredit SpA(a) . . . . . . . . . . . . . . . . . . . . . . . . . . . . . . . . . . . . . . . 6.63% 6/03/23 7,770 7,517,475 0.3UniCredit SpA, Series E . . . . . . . . . . . . . . . . . . . . . . . . . . . . . . . . . 6.95% 10/31/22 34,379 39,260,034 1.7 181,751,477 7.8
FINANCELincoln Finance Ltd. . . . . . . . . . . . . . . . . . . . . . . . . . . . . . . . . . . . . 6.88% 4/15/21 8,735 8,956,869 0.4
INSURANCEASR Nederland NV(a). . . . . . . . . . . . . . . . . . . . . . . . . . . . . . . . . . . 4.63% 10/19/27 3,062 2,786,846 0.1Assicurazioni Generali SpA(a) . . . . . . . . . . . . . . . . . . . . . . . . . . . . 6.27% 6/16/26 GBP 3,400 4,034,577 0.2Galaxy Bidco Ltd. . . . . . . . . . . . . . . . . . . . . . . . . . . . . . . . . . . . . . . 6.38% 11/15/20 5,990 6,880,789 0.3Galaxy Finco Ltd. . . . . . . . . . . . . . . . . . . . . . . . . . . . . . . . . . . . . . . 7.88% 11/15/21 2,500 2,848,002 0.1Intesa Sanpaolo Vita SpA(a) . . . . . . . . . . . . . . . . . . . . . . . . . . . . . . 4.75% 12/17/24 EUR 1,700 1,698,562 0.1 18,248,776 0.8
OTHER FINANCEIntrum AB . . . . . . . . . . . . . . . . . . . . . . . . . . . . . . . . . . . . . . . . . . . . 2.75% 7/15/22 14,990 14,720,315 0.6Intrum AB . . . . . . . . . . . . . . . . . . . . . . . . . . . . . . . . . . . . . . . . . . . . 3.13% 7/15/24 9,360 9,008,251 0.4LHC3 PLC(b). . . . . . . . . . . . . . . . . . . . . . . . . . . . . . . . . . . . . . . . . . 4.13% 8/15/24 12,414 12,530,272 0.6 36,258,838 1.6
REITSEquinix, Inc.. . . . . . . . . . . . . . . . . . . . . . . . . . . . . . . . . . . . . . . . . . . 2.88% 2/01/26 3,427 3,496,215 0.1Iron Mountain UK PLC . . . . . . . . . . . . . . . . . . . . . . . . . . . . . . . . . . 3.88% 11/15/25 GBP 3,600 4,011,050 0.2Iron Mountain, Inc. . . . . . . . . . . . . . . . . . . . . . . . . . . . . . . . . . . . . . 3.00% 1/15/25 EUR 3,600 3,580,916 0.2 11,088,181 0.5 256,304,141 11.1
UTILITYELECTRIC
Naturgy Finance BV(a) . . . . . . . . . . . . . . . . . . . . . . . . . . . . . . . . . . 3.38% 4/24/24 6,100 6,141,279 0.2OTHER UTILITY
Thames Water Kemble Finance PLC, Series E . . . . . . . . . . . . . . . . 7.75% 4/01/19 GBP 1,575 1,843,652 0.1 7,984,931 0.3 978,611,564 42.2
GOVERNMENTS - TREASURIESFRANCE
French Republic Government Bond OAT . . . . . . . . . . . . . . . . . . . . 8.50% 4/25/23 EUR 104,101 141,920,581 6.1GERMANY
Bundesrepublik Deutschland Bundesanleihe, Series 97 . . . . . . . . . 6.50% 7/04/27 328,468 507,173,869 21.9ITALY
Italy Buoni Poliennali Del Tesoro . . . . . . . . . . . . . . . . . . . . . . . . . . 4.75% 9/01/44 2,129 2,490,502 0.1Italy Buoni Poliennali Del Tesoro . . . . . . . . . . . . . . . . . . . . . . . . . . 5.00% 9/01/40 12,813 15,381,122 0.6Italy Buoni Poliennali Del Tesoro . . . . . . . . . . . . . . . . . . . . . . . . . . 7.25% 11/01/26 36,112 48,342,376 2.1Italy Buoni Poliennali Del Tesoro . . . . . . . . . . . . . . . . . . . . . . . . . . 9.00% 11/01/23 33,304 44,190,447 1.9 110,404,447 4.7
NETHERLANDSNetherlands Government Bond . . . . . . . . . . . . . . . . . . . . . . . . . . . . 7.50% 1/15/23 18,000 23,515,848 1.0
SPAINSpain Government Bond . . . . . . . . . . . . . . . . . . . . . . . . . . . . . . . . . 5.15% 10/31/44 18,471 28,773,034 1.3Spain Government Bond . . . . . . . . . . . . . . . . . . . . . . . . . . . . . . . . . 5.75% 7/30/32 17,000 25,614,563 1.1Spain Government Bond . . . . . . . . . . . . . . . . . . . . . . . . . . . . . . . . . 5.90% 7/30/26 48,121 65,692,383 2.8
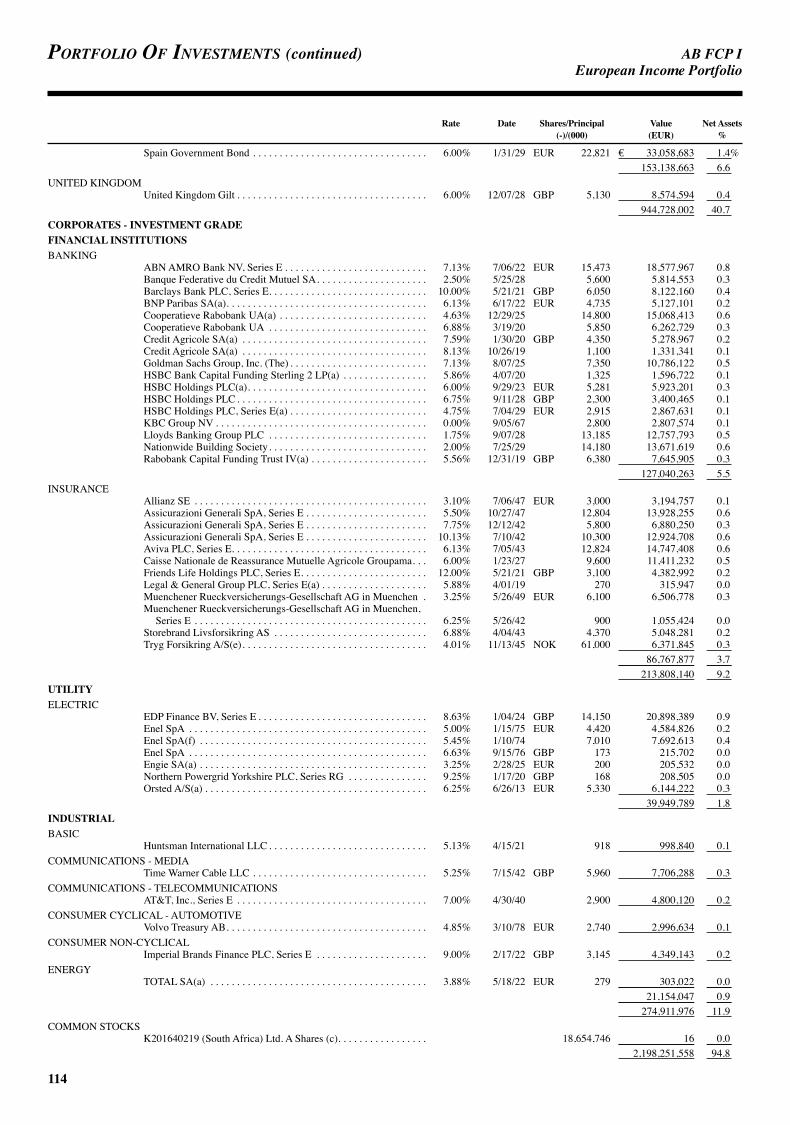
AB FCP I
114
Portfolio of investments (continued) EuropeanIncomePortfolio
Rate Date Shares/Principal Value Net Assets (-)/(000) (EUR) %
Spain Government Bond . . . . . . . . . . . . . . . . . . . . . . . . . . . . . . . . . 6.00% 1/31/29 EUR 22,821 € 33,058,683 1.4% 153,138,663 6.6
UNITED KINGDOMUnited Kingdom Gilt . . . . . . . . . . . . . . . . . . . . . . . . . . . . . . . . . . . . 6.00% 12/07/28 GBP 5,130 8,574,594 0.4 944,728,002 40.7
CORPORATES - INVESTMENT GRADEFINANCIAL INSTITUTIONSBANKING
ABN AMRO Bank NV, Series E . . . . . . . . . . . . . . . . . . . . . . . . . . . 7.13% 7/06/22 EUR 15,473 18,577,967 0.8Banque Federative du Credit Mutuel SA. . . . . . . . . . . . . . . . . . . . . 2.50% 5/25/28 5,600 5,814,553 0.3Barclays Bank PLC, Series E. . . . . . . . . . . . . . . . . . . . . . . . . . . . . . 10.00% 5/21/21 GBP 6,050 8,122,160 0.4BNP Paribas SA(a). . . . . . . . . . . . . . . . . . . . . . . . . . . . . . . . . . . . . . 6.13% 6/17/22 EUR 4,735 5,127,101 0.2Cooperatieve Rabobank UA(a) . . . . . . . . . . . . . . . . . . . . . . . . . . . . 4.63% 12/29/25 14,800 15,068,413 0.6Cooperatieve Rabobank UA . . . . . . . . . . . . . . . . . . . . . . . . . . . . . . 6.88% 3/19/20 5,850 6,262,729 0.3Credit Agricole SA(a) . . . . . . . . . . . . . . . . . . . . . . . . . . . . . . . . . . . 7.59% 1/30/20 GBP 4,350 5,278,967 0.2Credit Agricole SA(a) . . . . . . . . . . . . . . . . . . . . . . . . . . . . . . . . . . . 8.13% 10/26/19 1,100 1,331,341 0.1Goldman Sachs Group, Inc. (The) . . . . . . . . . . . . . . . . . . . . . . . . . . 7.13% 8/07/25 7,350 10,786,122 0.5HSBC Bank Capital Funding Sterling 2 LP(a) . . . . . . . . . . . . . . . . 5.86% 4/07/20 1,325 1,596,722 0.1HSBC Holdings PLC(a). . . . . . . . . . . . . . . . . . . . . . . . . . . . . . . . . . 6.00% 9/29/23 EUR 5,281 5,923,201 0.3HSBC Holdings PLC . . . . . . . . . . . . . . . . . . . . . . . . . . . . . . . . . . . . 6.75% 9/11/28 GBP 2,300 3,400,465 0.1HSBC Holdings PLC, Series E(a) . . . . . . . . . . . . . . . . . . . . . . . . . . 4.75% 7/04/29 EUR 2,915 2,867,631 0.1KBC Group NV . . . . . . . . . . . . . . . . . . . . . . . . . . . . . . . . . . . . . . . . 0.00% 9/05/67 2,800 2,807,574 0.1Lloyds Banking Group PLC . . . . . . . . . . . . . . . . . . . . . . . . . . . . . . 1.75% 9/07/28 13,185 12,757,793 0.5Nationwide Building Society. . . . . . . . . . . . . . . . . . . . . . . . . . . . . . 2.00% 7/25/29 14,180 13,671,619 0.6Rabobank Capital Funding Trust IV(a) . . . . . . . . . . . . . . . . . . . . . . 5.56% 12/31/19 GBP 6,380 7,645,905 0.3 127,040,263 5.5
INSURANCEAllianz SE . . . . . . . . . . . . . . . . . . . . . . . . . . . . . . . . . . . . . . . . . . . . 3.10% 7/06/47 EUR 3,000 3,194,757 0.1Assicurazioni Generali SpA, Series E . . . . . . . . . . . . . . . . . . . . . . . 5.50% 10/27/47 12,804 13,928,255 0.6Assicurazioni Generali SpA, Series E . . . . . . . . . . . . . . . . . . . . . . . 7.75% 12/12/42 5,800 6,880,250 0.3Assicurazioni Generali SpA, Series E . . . . . . . . . . . . . . . . . . . . . . . 10.13% 7/10/42 10,300 12,924,708 0.6Aviva PLC, Series E. . . . . . . . . . . . . . . . . . . . . . . . . . . . . . . . . . . . . 6.13% 7/05/43 12,824 14,747,408 0.6Caisse Nationale de Reassurance Mutuelle Agricole Groupama. . . 6.00% 1/23/27 9,600 11,411,232 0.5Friends Life Holdings PLC, Series E. . . . . . . . . . . . . . . . . . . . . . . . 12.00% 5/21/21 GBP 3,100 4,382,992 0.2Legal & General Group PLC, Series E(a) . . . . . . . . . . . . . . . . . . . . 5.88% 4/01/19 270 315,947 0.0Muenchener Rueckversicherungs-Gesellschaft AG in Muenchen . 3.25% 5/26/49 EUR 6,100 6,506,778 0.3Muenchener Rueckversicherungs-Gesellschaft AG in Muenchen,
Series E . . . . . . . . . . . . . . . . . . . . . . . . . . . . . . . . . . . . . . . . . . . . 6.25% 5/26/42 900 1,055,424 0.0Storebrand Livsforsikring AS . . . . . . . . . . . . . . . . . . . . . . . . . . . . . 6.88% 4/04/43 4,370 5,048,281 0.2Tryg Forsikring A/S(e). . . . . . . . . . . . . . . . . . . . . . . . . . . . . . . . . . . 4.01% 11/13/45 NOK 61,000 6,371,845 0.3 86,767,877 3.7 213,808,140 9.2
UTILITYELECTRIC
EDP Finance BV, Series E . . . . . . . . . . . . . . . . . . . . . . . . . . . . . . . . 8.63% 1/04/24 GBP 14,150 20,898,389 0.9Enel SpA . . . . . . . . . . . . . . . . . . . . . . . . . . . . . . . . . . . . . . . . . . . . . 5.00% 1/15/75 EUR 4,420 4,584,826 0.2Enel SpA(f) . . . . . . . . . . . . . . . . . . . . . . . . . . . . . . . . . . . . . . . . . . . 5.45% 1/10/74 7,010 7,692,613 0.4Enel SpA . . . . . . . . . . . . . . . . . . . . . . . . . . . . . . . . . . . . . . . . . . . . . 6.63% 9/15/76 GBP 173 215,702 0.0Engie SA(a) . . . . . . . . . . . . . . . . . . . . . . . . . . . . . . . . . . . . . . . . . . . 3.25% 2/28/25 EUR 200 205,532 0.0Northern Powergrid Yorkshire PLC, Series RG . . . . . . . . . . . . . . . 9.25% 1/17/20 GBP 168 208,505 0.0Orsted A/S(a) . . . . . . . . . . . . . . . . . . . . . . . . . . . . . . . . . . . . . . . . . . 6.25% 6/26/13 EUR 5,330 6,144,222 0.3 39,949,789 1.8
INDUSTRIALBASIC
Huntsman International LLC . . . . . . . . . . . . . . . . . . . . . . . . . . . . . . 5.13% 4/15/21 918 998,840 0.1COMMUNICATIONS - MEDIA
Time Warner Cable LLC . . . . . . . . . . . . . . . . . . . . . . . . . . . . . . . . . 5.25% 7/15/42 GBP 5,960 7,706,288 0.3COMMUNICATIONS - TELECOMMUNICATIONS
AT&T, Inc., Series E . . . . . . . . . . . . . . . . . . . . . . . . . . . . . . . . . . . . 7.00% 4/30/40 2,900 4,800,120 0.2CONSUMER CYCLICAL - AUTOMOTIVE
Volvo Treasury AB. . . . . . . . . . . . . . . . . . . . . . . . . . . . . . . . . . . . . . 4.85% 3/10/78 EUR 2,740 2,996,634 0.1CONSUMER NON-CYCLICAL
Imperial Brands Finance PLC, Series E . . . . . . . . . . . . . . . . . . . . . 9.00% 2/17/22 GBP 3,145 4,349,143 0.2ENERGY
TOTAL SA(a) . . . . . . . . . . . . . . . . . . . . . . . . . . . . . . . . . . . . . . . . . 3.88% 5/18/22 EUR 279 303,022 0.0 21,154,047 0.9 274,911,976 11.9
COMMON STOCKSK201640219 (South Africa) Ltd. A Shares (c). . . . . . . . . . . . . . . . . 18,654,746 16 0.0 2,198,251,558 94.8

AB FCP I
115
EuropeanIncomePortfolio
Rate Date Principal Value Net Assets (000) (EUR) %
OTHER TRANSFERABLE SECURITIESCORPORATES - NON-INVESTMENT GRADEFINANCIAL INSTITUTIONSREITS
Equinix, Inc.. . . . . . . . . . . . . . . . . . . . . . . . . . . . . . . . . . . . . . . . . . . 2.88% 10/01/25 EUR 3,355 € 3,447,263 0.1%INDUSTRIALCOMMUNICATIONS - MEDIA
Netflix, Inc. . . . . . . . . . . . . . . . . . . . . . . . . . . . . . . . . . . . . . . . . . . . 3.63% 5/15/27 5,500 5,623,750 0.2CONSUMER CYCLICAL - RETAILERS
PVH Corp. . . . . . . . . . . . . . . . . . . . . . . . . . . . . . . . . . . . . . . . . . . . . 3.13% 12/15/27 11,138 11,092,334 0.5CONSUMER NON-CYCLICAL
Constantin Investissement 3 SASU . . . . . . . . . . . . . . . . . . . . . . . . . 5.38% 4/15/25 8,729 8,473,398 0.4SERVICES
Techem Verwaltungsgesellschaft 674 mbH . . . . . . . . . . . . . . . . . . . 6.00% 7/30/26 2,643 2,704,460 0.1TRANSPORTATION - SERVICES
Avis Budget Finance PLC . . . . . . . . . . . . . . . . . . . . . . . . . . . . . . . . 4.13% 11/15/24 2,559 2,648,844 0.1Avis Budget Finance PLC . . . . . . . . . . . . . . . . . . . . . . . . . . . . . . . . 4.50% 5/15/25 2,130 2,194,569 0.1Hertz Holdings Netherlands BV . . . . . . . . . . . . . . . . . . . . . . . . . . . 5.50% 3/30/23 8,032 8,214,575 0.4 13,057,988 0.6 40,951,930 1.8 44,399,193 1.9
GOVERNMENTS - SOVEREIGN BONDSNETHERLANDS
SNS Reaal NV(c). . . . . . . . . . . . . . . . . . . . . . . . . . . . . . . . . . . . . . . 6.26% 12/31/49 770 1 0.0 44,399,194 1.9
Total Investments(cost €2,322,303,427) . . . . . . . . . . . . . . . . . . . . . . . . . . . . . . . . . . . € 2,242,650,752 96.7%
Time DepositsBBH, Grand Cayman(g) . . . . . . . . . . . . . . . . . . . . . . . . . . . . . . . . . 0.16 % - 110,036 0.0BBH, Grand Cayman(g) . . . . . . . . . . . . . . . . . . . . . . . . . . . . . . . . . 0.76 % - 13,792 0.0Citibank, New York(g). . . . . . . . . . . . . . . . . . . . . . . . . . . . . . . . . . . 1.76 % - 567,857 0.0Deutsche Bank, Frankfurt(g) . . . . . . . . . . . . . . . . . . . . . . . . . . . . . . (0.57)% - 43,913,622 1.9Nordea Bank Abp, Oslo(g) . . . . . . . . . . . . . . . . . . . . . . . . . . . . . . . 0.35 % - 291,310 0.0SEB, Stockholm(g) . . . . . . . . . . . . . . . . . . . . . . . . . . . . . . . . . . . . . 0.36 % - 576,700 0.0
Total Time Deposits . . . . . . . . . . . . . . . . . . . . . . . . . . . . . . . . . . . . . . . . . . . . . . . . . . . . . . 45,473,317 1.9Other assets less liabilities . . . . . . . . . . . . . . . . . . . . . . . . . . . . . . . . . . . . . . . . . . . . . . . . . 31,555,001 1.4Net Assets . . . . . . . . . . . . . . . . . . . . . . . . . . . . . . . . . . . . . . . . . . . . . . . . . . . . . . . . . . . . . . € 2,319,679,070 100.0%
FUTURES
Unrealized Number of Appreciation/ Description Expiration Date Contracts Original Value Market Value (Depreciation)
Long Euro Buxl 30 Yr Bond Futures. . . . . . . . . . . . . . . . . . . . . . . . . . . . 3/07/19 691 € 122,991,140 € 127,171,640 € 4,180,500Euro-BOBL Futures . . . . . . . . . . . . . . . . . . . . . . . . . . . . . . . . . . . . 3/07/19 78 10,370,880 10,352,160 (18,720)Euro-BTP Futures. . . . . . . . . . . . . . . . . . . . . . . . . . . . . . . . . . . . . . 3/07/19 93 11,448,160 11,926,320 478,160Euro-OAT Futures . . . . . . . . . . . . . . . . . . . . . . . . . . . . . . . . . . . . . 3/07/19 207 31,225,980 31,650,300 424,320
ShortEuro-Bund Futures . . . . . . . . . . . . . . . . . . . . . . . . . . . . . . . . . . . . . 3/07/19 1,737 283,251,910 287,143,470 (3,891,560)Euro-Schatz Futures . . . . . . . . . . . . . . . . . . . . . . . . . . . . . . . . . . . . 3/07/19 625 69,934,375 69,884,375 50,000Long Gilt Futures . . . . . . . . . . . . . . . . . . . . . . . . . . . . . . . . . . . . . . 6/26/19 573 85,028,922 84,047,835 981,087 € 2,203,787
Appreciation € 6,114,067 Depreciation € (3,910,280)
FORWARD FOREIGN CURRENCY CONTRACTS Contracts to In Exchange Unrealized Deliver For Settlement Appreciation/ Counterparty (000) (000) Date (Depreciation)
Brown Brothers Harriman & Co.+. . . . . . . . . . . . . . . . . . . . . . . . EUR 208,561 AUD 331,641 3/06/19 € (1,763,851)Brown Brothers Harriman & Co.+. . . . . . . . . . . . . . . . . . . . . . . . EUR 153 CHF 173 3/06/19 104Brown Brothers Harriman & Co.+. . . . . . . . . . . . . . . . . . . . . . . . EUR 400 CNH 3,114 3/06/19 7,971Brown Brothers Harriman & Co.+. . . . . . . . . . . . . . . . . . . . . . . . EUR 29,063 HKD 257,662 3/06/19 (207,355)Brown Brothers Harriman & Co.+. . . . . . . . . . . . . . . . . . . . . . . . EUR 6,651 SGD 10,202 3/06/19 (18,490)Brown Brothers Harriman & Co.+. . . . . . . . . . . . . . . . . . . . . . . . EUR 1,356,034 USD 1,531,874 3/06/19 (9,494,656)Brown Brothers Harriman & Co.+. . . . . . . . . . . . . . . . . . . . . . . . EUR 407 CNH 3,113 3/22/19 316

AB FCP I
116
Portfolio of investments (continued) EuropeanIncomePortfolio
Contracts to In Exchange Unrealized Deliver For Settlement Appreciation/ Counterparty (000) (000) Date (Depreciation)
Brown Brothers Harriman & Co.+. . . . . . . . . . . . . . . . . . . . . . . . EUR 32,835 HKD 292,481 3/22/19 € (106,067)Brown Brothers Harriman & Co.+. . . . . . . . . . . . . . . . . . . . . . . . EUR 7,611 SGD 11,685 3/22/19 (23,501)Citibank, NA . . . . . . . . . . . . . . . . . . . . . . . . . . . . . . . . . . . . . . . . GBP 171,328 EUR 198,502 4/09/19 (1,037,104)Citibank, NA . . . . . . . . . . . . . . . . . . . . . . . . . . . . . . . . . . . . . . . . NOK 55,393 EUR 5,716 4/12/19 33,624
€ (12,609,009)
Appreciation € 42,015 Depreciation € (12,651,024)
+ Used for share class hedging purposes.
CENTRALLY CLEARED CREDIT DEFAULT SWAPS Notional Unrealized Termination Amount Market Appreciation/ Clearing Broker/(Exchange) Referenced Obligation Date (000) Value (Depreciation)
Buy ContractsCitigroup Global Markets, Inc. iTraxx-XOVER Series 30, 5 Year Index 12/20/23 EUR 42,199 € (4,121,156) € 44,829
(a) Securities are perpetual and, thus, do not have a predetermined maturity date. The date shown, if applicable, reflects the next call date.(b) Pay-In-Kind Payments (PIK).(c) Fair valued as determined in accordance with procedures established by and under the general supervision of the Management Company’s
Board of Managers.(d) Defaulted.(e) Floating Rate Security. Stated interest rate was in effect at February 28, 2019.(f) Variable rate coupon, rate shown as of February 28, 2019.(g) Overnight deposit.
Currency Abbreviations:AUD – Australian DollarCHF – Swiss FrancCNH – Chinese Yuan Renminbi (offshore)EUR – EuroGBP – Great British PoundHKD – Hong Kong DollarNOK – Norwegian KroneSGD – Singapore DollarUSD – United States Dollar
Glossary:BOBL – BundesobligationenBTP – Buoni del Tesoro PoliennaliOAT – Obligations Assimilables du Trésor
See notes to financial statements.
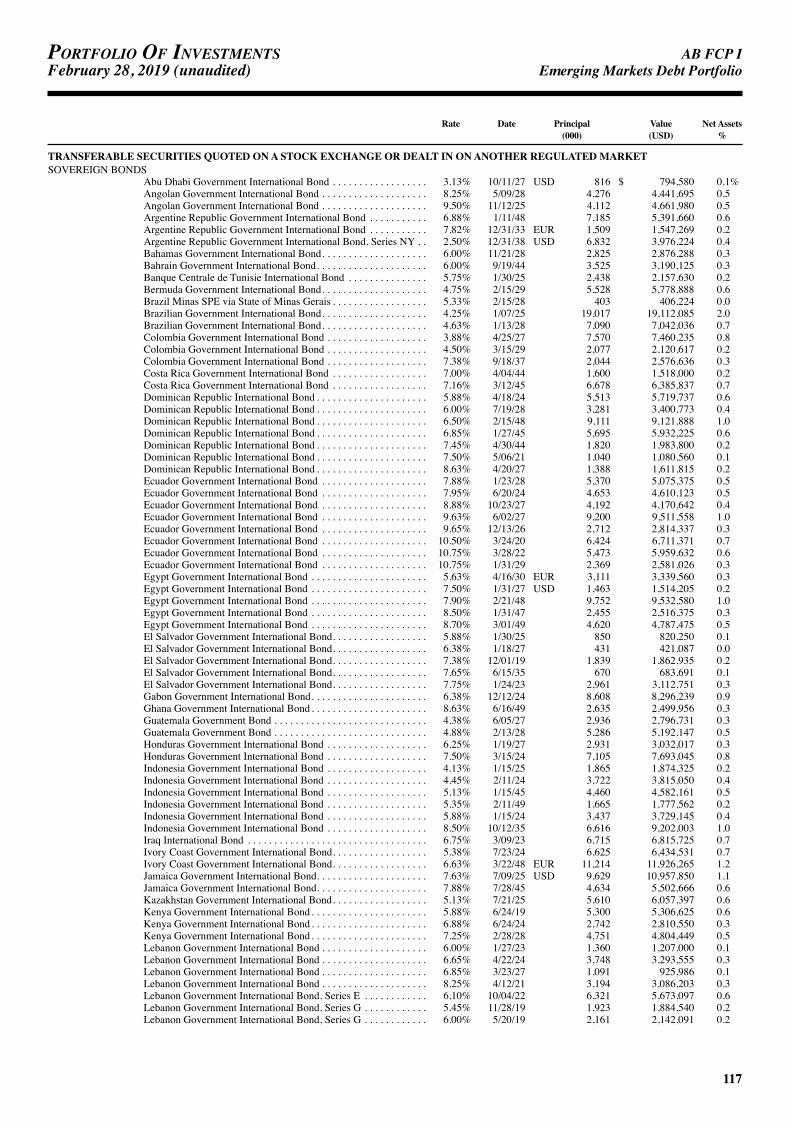
AB FCP I
117
Portfolio of investmentsFebruary 28, 2019 (unaudited) EmergingMarketsDebtPortfolio
Rate Date Principal Value Net Assets (000) (USD) %
TRANSFERABLE SECURITIES QUOTED ON A STOCK EXCHANGE OR DEALT IN ON ANOTHER REGULATED MARKET SOVEREIGN BONDS
Abu Dhabi Government International Bond . . . . . . . . . . . . . . . . . . 3.13% 10/11/27 USD 816 $ 794,580 0.1%Angolan Government International Bond . . . . . . . . . . . . . . . . . . . . 8.25% 5/09/28 4,276 4,441,695 0.5Angolan Government International Bond . . . . . . . . . . . . . . . . . . . . 9.50% 11/12/25 4,112 4,661,980 0.5Argentine Republic Government International Bond . . . . . . . . . . . 6.88% 1/11/48 7,185 5,391,660 0.6Argentine Republic Government International Bond . . . . . . . . . . . 7.82% 12/31/33 EUR 1,509 1,547,269 0.2Argentine Republic Government International Bond, Series NY . . 2.50% 12/31/38 USD 6,832 3,976,224 0.4Bahamas Government International Bond. . . . . . . . . . . . . . . . . . . . 6.00% 11/21/28 2,825 2,876,288 0.3Bahrain Government International Bond. . . . . . . . . . . . . . . . . . . . . 6.00% 9/19/44 3,525 3,190,125 0.3Banque Centrale de Tunisie International Bond . . . . . . . . . . . . . . . 5.75% 1/30/25 2,438 2,157,630 0.2Bermuda Government International Bond. . . . . . . . . . . . . . . . . . . . 4.75% 2/15/29 5,528 5,778,888 0.6Brazil Minas SPE via State of Minas Gerais . . . . . . . . . . . . . . . . . . 5.33% 2/15/28 403 406,224 0.0Brazilian Government International Bond. . . . . . . . . . . . . . . . . . . . 4.25% 1/07/25 19,017 19,112,085 2.0Brazilian Government International Bond. . . . . . . . . . . . . . . . . . . . 4.63% 1/13/28 7,090 7,042,036 0.7Colombia Government International Bond . . . . . . . . . . . . . . . . . . . 3.88% 4/25/27 7,570 7,460,235 0.8Colombia Government International Bond . . . . . . . . . . . . . . . . . . . 4.50% 3/15/29 2,077 2,120,617 0.2Colombia Government International Bond . . . . . . . . . . . . . . . . . . . 7.38% 9/18/37 2,044 2,576,636 0.3Costa Rica Government International Bond . . . . . . . . . . . . . . . . . . 7.00% 4/04/44 1,600 1,518,000 0.2Costa Rica Government International Bond . . . . . . . . . . . . . . . . . . 7.16% 3/12/45 6,678 6,385,837 0.7Dominican Republic International Bond . . . . . . . . . . . . . . . . . . . . . 5.88% 4/18/24 5,513 5,719,737 0.6Dominican Republic International Bond . . . . . . . . . . . . . . . . . . . . . 6.00% 7/19/28 3,281 3,400,773 0.4Dominican Republic International Bond . . . . . . . . . . . . . . . . . . . . . 6.50% 2/15/48 9,111 9,121,888 1.0Dominican Republic International Bond . . . . . . . . . . . . . . . . . . . . . 6.85% 1/27/45 5,695 5,932,225 0.6Dominican Republic International Bond . . . . . . . . . . . . . . . . . . . . . 7.45% 4/30/44 1,820 1,983,800 0.2Dominican Republic International Bond . . . . . . . . . . . . . . . . . . . . . 7.50% 5/06/21 1,040 1,080,560 0.1Dominican Republic International Bond . . . . . . . . . . . . . . . . . . . . . 8.63% 4/20/27 1,388 1,611,815 0.2Ecuador Government International Bond . . . . . . . . . . . . . . . . . . . . 7.88% 1/23/28 5,370 5,075,375 0.5Ecuador Government International Bond . . . . . . . . . . . . . . . . . . . . 7.95% 6/20/24 4,653 4,610,123 0.5Ecuador Government International Bond . . . . . . . . . . . . . . . . . . . . 8.88% 10/23/27 4,192 4,170,642 0.4Ecuador Government International Bond . . . . . . . . . . . . . . . . . . . . 9.63% 6/02/27 9,200 9,511,558 1.0Ecuador Government International Bond . . . . . . . . . . . . . . . . . . . . 9.65% 12/13/26 2,712 2,814,337 0.3Ecuador Government International Bond . . . . . . . . . . . . . . . . . . . . 10.50% 3/24/20 6,424 6,711,371 0.7Ecuador Government International Bond . . . . . . . . . . . . . . . . . . . . 10.75% 3/28/22 5,473 5,959,632 0.6Ecuador Government International Bond . . . . . . . . . . . . . . . . . . . . 10.75% 1/31/29 2,369 2,581,026 0.3Egypt Government International Bond . . . . . . . . . . . . . . . . . . . . . . 5.63% 4/16/30 EUR 3,111 3,339,560 0.3Egypt Government International Bond . . . . . . . . . . . . . . . . . . . . . . 7.50% 1/31/27 USD 1,463 1,514,205 0.2Egypt Government International Bond . . . . . . . . . . . . . . . . . . . . . . 7.90% 2/21/48 9,752 9,532,580 1.0Egypt Government International Bond . . . . . . . . . . . . . . . . . . . . . . 8.50% 1/31/47 2,455 2,516,375 0.3Egypt Government International Bond . . . . . . . . . . . . . . . . . . . . . . 8.70% 3/01/49 4,620 4,787,475 0.5El Salvador Government International Bond. . . . . . . . . . . . . . . . . . 5.88% 1/30/25 850 820,250 0.1El Salvador Government International Bond. . . . . . . . . . . . . . . . . . 6.38% 1/18/27 431 421,087 0.0El Salvador Government International Bond. . . . . . . . . . . . . . . . . . 7.38% 12/01/19 1,839 1,862,935 0.2El Salvador Government International Bond. . . . . . . . . . . . . . . . . . 7.65% 6/15/35 670 683,691 0.1El Salvador Government International Bond. . . . . . . . . . . . . . . . . . 7.75% 1/24/23 2,961 3,112,751 0.3Gabon Government International Bond. . . . . . . . . . . . . . . . . . . . . . 6.38% 12/12/24 8,608 8,296,239 0.9Ghana Government International Bond . . . . . . . . . . . . . . . . . . . . . . 8.63% 6/16/49 2,635 2,499,956 0.3Guatemala Government Bond . . . . . . . . . . . . . . . . . . . . . . . . . . . . . 4.38% 6/05/27 2,936 2,796,731 0.3Guatemala Government Bond . . . . . . . . . . . . . . . . . . . . . . . . . . . . . 4.88% 2/13/28 5,286 5,192,147 0.5Honduras Government International Bond . . . . . . . . . . . . . . . . . . . 6.25% 1/19/27 2,931 3,032,017 0.3Honduras Government International Bond . . . . . . . . . . . . . . . . . . . 7.50% 3/15/24 7,105 7,693,045 0.8Indonesia Government International Bond . . . . . . . . . . . . . . . . . . . 4.13% 1/15/25 1,865 1,874,325 0.2Indonesia Government International Bond . . . . . . . . . . . . . . . . . . . 4.45% 2/11/24 3,722 3,815,050 0.4Indonesia Government International Bond . . . . . . . . . . . . . . . . . . . 5.13% 1/15/45 4,460 4,582,161 0.5Indonesia Government International Bond . . . . . . . . . . . . . . . . . . . 5.35% 2/11/49 1,665 1,777,562 0.2Indonesia Government International Bond . . . . . . . . . . . . . . . . . . . 5.88% 1/15/24 3,437 3,729,145 0.4Indonesia Government International Bond . . . . . . . . . . . . . . . . . . . 8.50% 10/12/35 6,616 9,202,003 1.0Iraq International Bond . . . . . . . . . . . . . . . . . . . . . . . . . . . . . . . . . . 6.75% 3/09/23 6,715 6,815,725 0.7Ivory Coast Government International Bond. . . . . . . . . . . . . . . . . . 5.38% 7/23/24 6,625 6,434,531 0.7Ivory Coast Government International Bond. . . . . . . . . . . . . . . . . . 6.63% 3/22/48 EUR 11,214 11,926,265 1.2Jamaica Government International Bond. . . . . . . . . . . . . . . . . . . . . 7.63% 7/09/25 USD 9,629 10,957,850 1.1Jamaica Government International Bond. . . . . . . . . . . . . . . . . . . . . 7.88% 7/28/45 4,634 5,502,666 0.6Kazakhstan Government International Bond. . . . . . . . . . . . . . . . . . 5.13% 7/21/25 5,610 6,057,397 0.6Kenya Government International Bond . . . . . . . . . . . . . . . . . . . . . . 5.88% 6/24/19 5,300 5,306,625 0.6Kenya Government International Bond . . . . . . . . . . . . . . . . . . . . . . 6.88% 6/24/24 2,742 2,810,550 0.3Kenya Government International Bond . . . . . . . . . . . . . . . . . . . . . . 7.25% 2/28/28 4,751 4,804,449 0.5Lebanon Government International Bond . . . . . . . . . . . . . . . . . . . . 6.00% 1/27/23 1,360 1,207,000 0.1Lebanon Government International Bond . . . . . . . . . . . . . . . . . . . . 6.65% 4/22/24 3,748 3,293,555 0.3Lebanon Government International Bond . . . . . . . . . . . . . . . . . . . . 6.85% 3/23/27 1,091 925,986 0.1Lebanon Government International Bond . . . . . . . . . . . . . . . . . . . . 8.25% 4/12/21 3,194 3,086,203 0.3Lebanon Government International Bond, Series E . . . . . . . . . . . . 6.10% 10/04/22 6,321 5,673,097 0.6Lebanon Government International Bond, Series G . . . . . . . . . . . . 5.45% 11/28/19 1,923 1,884,540 0.2Lebanon Government International Bond, Series G . . . . . . . . . . . . 6.00% 5/20/19 2,161 2,142,091 0.2
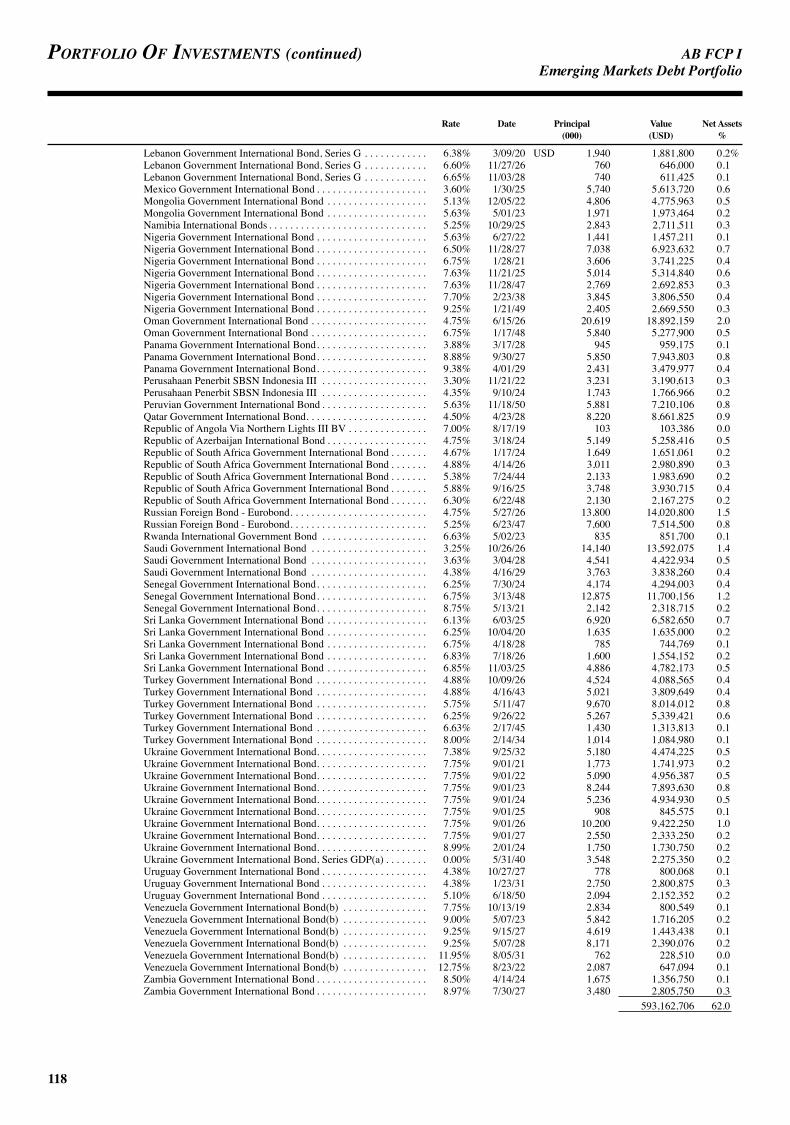
AB FCP I
118
Portfolio of investments (continued) EmergingMarketsDebtPortfolio
Rate Date Principal Value Net Assets (000) (USD) %
Lebanon Government International Bond, Series G . . . . . . . . . . . . 6.38% 3/09/20 USD 1,940 1,881,800 0.2%Lebanon Government International Bond, Series G . . . . . . . . . . . . 6.60% 11/27/26 760 646,000 0.1Lebanon Government International Bond, Series G . . . . . . . . . . . . 6.65% 11/03/28 740 611,425 0.1Mexico Government International Bond . . . . . . . . . . . . . . . . . . . . . 3.60% 1/30/25 5,740 5,613,720 0.6Mongolia Government International Bond . . . . . . . . . . . . . . . . . . . 5.13% 12/05/22 4,806 4,775,963 0.5Mongolia Government International Bond . . . . . . . . . . . . . . . . . . . 5.63% 5/01/23 1,971 1,973,464 0.2Namibia International Bonds . . . . . . . . . . . . . . . . . . . . . . . . . . . . . . 5.25% 10/29/25 2,843 2,711,511 0.3Nigeria Government International Bond . . . . . . . . . . . . . . . . . . . . . 5.63% 6/27/22 1,441 1,457,211 0.1Nigeria Government International Bond . . . . . . . . . . . . . . . . . . . . . 6.50% 11/28/27 7,038 6,923,632 0.7Nigeria Government International Bond . . . . . . . . . . . . . . . . . . . . . 6.75% 1/28/21 3,606 3,741,225 0.4Nigeria Government International Bond . . . . . . . . . . . . . . . . . . . . . 7.63% 11/21/25 5,014 5,314,840 0.6Nigeria Government International Bond . . . . . . . . . . . . . . . . . . . . . 7.63% 11/28/47 2,769 2,692,853 0.3Nigeria Government International Bond . . . . . . . . . . . . . . . . . . . . . 7.70% 2/23/38 3,845 3,806,550 0.4Nigeria Government International Bond . . . . . . . . . . . . . . . . . . . . . 9.25% 1/21/49 2,405 2,669,550 0.3Oman Government International Bond . . . . . . . . . . . . . . . . . . . . . . 4.75% 6/15/26 20,619 18,892,159 2.0Oman Government International Bond . . . . . . . . . . . . . . . . . . . . . . 6.75% 1/17/48 5,840 5,277,900 0.5Panama Government International Bond. . . . . . . . . . . . . . . . . . . . . 3.88% 3/17/28 945 959,175 0.1Panama Government International Bond. . . . . . . . . . . . . . . . . . . . . 8.88% 9/30/27 5,850 7,943,803 0.8Panama Government International Bond. . . . . . . . . . . . . . . . . . . . . 9.38% 4/01/29 2,431 3,479,977 0.4Perusahaan Penerbit SBSN Indonesia III . . . . . . . . . . . . . . . . . . . . 3.30% 11/21/22 3,231 3,190,613 0.3Perusahaan Penerbit SBSN Indonesia III . . . . . . . . . . . . . . . . . . . . 4.35% 9/10/24 1,743 1,766,966 0.2Peruvian Government International Bond . . . . . . . . . . . . . . . . . . . . 5.63% 11/18/50 5,881 7,210,106 0.8Qatar Government International Bond. . . . . . . . . . . . . . . . . . . . . . . 4.50% 4/23/28 8,220 8,661,825 0.9Republic of Angola Via Northern Lights III BV . . . . . . . . . . . . . . . 7.00% 8/17/19 103 103,386 0.0Republic of Azerbaijan International Bond . . . . . . . . . . . . . . . . . . . 4.75% 3/18/24 5,149 5,258,416 0.5Republic of South Africa Government International Bond . . . . . . . 4.67% 1/17/24 1,649 1,651,061 0.2Republic of South Africa Government International Bond . . . . . . . 4.88% 4/14/26 3,011 2,980,890 0.3Republic of South Africa Government International Bond . . . . . . . 5.38% 7/24/44 2,133 1,983,690 0.2Republic of South Africa Government International Bond . . . . . . . 5.88% 9/16/25 3,748 3,930,715 0.4Republic of South Africa Government International Bond . . . . . . . 6.30% 6/22/48 2,130 2,167,275 0.2Russian Foreign Bond - Eurobond. . . . . . . . . . . . . . . . . . . . . . . . . . 4.75% 5/27/26 13,800 14,020,800 1.5Russian Foreign Bond - Eurobond. . . . . . . . . . . . . . . . . . . . . . . . . . 5.25% 6/23/47 7,600 7,514,500 0.8Rwanda International Government Bond . . . . . . . . . . . . . . . . . . . . 6.63% 5/02/23 835 851,700 0.1Saudi Government International Bond . . . . . . . . . . . . . . . . . . . . . . 3.25% 10/26/26 14,140 13,592,075 1.4Saudi Government International Bond . . . . . . . . . . . . . . . . . . . . . . 3.63% 3/04/28 4,541 4,422,934 0.5Saudi Government International Bond . . . . . . . . . . . . . . . . . . . . . . 4.38% 4/16/29 3,763 3,838,260 0.4Senegal Government International Bond. . . . . . . . . . . . . . . . . . . . . 6.25% 7/30/24 4,174 4,294,003 0.4Senegal Government International Bond. . . . . . . . . . . . . . . . . . . . . 6.75% 3/13/48 12,875 11,700,156 1.2Senegal Government International Bond. . . . . . . . . . . . . . . . . . . . . 8.75% 5/13/21 2,142 2,318,715 0.2Sri Lanka Government International Bond . . . . . . . . . . . . . . . . . . . 6.13% 6/03/25 6,920 6,582,650 0.7Sri Lanka Government International Bond . . . . . . . . . . . . . . . . . . . 6.25% 10/04/20 1,635 1,635,000 0.2Sri Lanka Government International Bond . . . . . . . . . . . . . . . . . . . 6.75% 4/18/28 785 744,769 0.1Sri Lanka Government International Bond . . . . . . . . . . . . . . . . . . . 6.83% 7/18/26 1,600 1,554,152 0.2Sri Lanka Government International Bond . . . . . . . . . . . . . . . . . . . 6.85% 11/03/25 4,886 4,782,173 0.5Turkey Government International Bond . . . . . . . . . . . . . . . . . . . . . 4.88% 10/09/26 4,524 4,088,565 0.4Turkey Government International Bond . . . . . . . . . . . . . . . . . . . . . 4.88% 4/16/43 5,021 3,809,649 0.4Turkey Government International Bond . . . . . . . . . . . . . . . . . . . . . 5.75% 5/11/47 9,670 8,014,012 0.8Turkey Government International Bond . . . . . . . . . . . . . . . . . . . . . 6.25% 9/26/22 5,267 5,339,421 0.6Turkey Government International Bond . . . . . . . . . . . . . . . . . . . . . 6.63% 2/17/45 1,430 1,313,813 0.1Turkey Government International Bond . . . . . . . . . . . . . . . . . . . . . 8.00% 2/14/34 1,014 1,084,980 0.1Ukraine Government International Bond. . . . . . . . . . . . . . . . . . . . . 7.38% 9/25/32 5,180 4,474,225 0.5Ukraine Government International Bond. . . . . . . . . . . . . . . . . . . . . 7.75% 9/01/21 1,773 1,741,973 0.2Ukraine Government International Bond. . . . . . . . . . . . . . . . . . . . . 7.75% 9/01/22 5,090 4,956,387 0.5Ukraine Government International Bond. . . . . . . . . . . . . . . . . . . . . 7.75% 9/01/23 8,244 7,893,630 0.8Ukraine Government International Bond. . . . . . . . . . . . . . . . . . . . . 7.75% 9/01/24 5,236 4,934,930 0.5Ukraine Government International Bond. . . . . . . . . . . . . . . . . . . . . 7.75% 9/01/25 908 845,575 0.1Ukraine Government International Bond. . . . . . . . . . . . . . . . . . . . . 7.75% 9/01/26 10,200 9,422,250 1.0Ukraine Government International Bond. . . . . . . . . . . . . . . . . . . . . 7.75% 9/01/27 2,550 2,333,250 0.2Ukraine Government International Bond. . . . . . . . . . . . . . . . . . . . . 8.99% 2/01/24 1,750 1,730,750 0.2Ukraine Government International Bond, Series GDP(a) . . . . . . . . 0.00% 5/31/40 3,548 2,275,350 0.2Uruguay Government International Bond . . . . . . . . . . . . . . . . . . . . 4.38% 10/27/27 778 800,068 0.1Uruguay Government International Bond . . . . . . . . . . . . . . . . . . . . 4.38% 1/23/31 2,750 2,800,875 0.3Uruguay Government International Bond . . . . . . . . . . . . . . . . . . . . 5.10% 6/18/50 2,094 2,152,352 0.2Venezuela Government International Bond(b) . . . . . . . . . . . . . . . . 7.75% 10/13/19 2,834 800,549 0.1Venezuela Government International Bond(b) . . . . . . . . . . . . . . . . 9.00% 5/07/23 5,842 1,716,205 0.2Venezuela Government International Bond(b) . . . . . . . . . . . . . . . . 9.25% 9/15/27 4,619 1,443,438 0.1Venezuela Government International Bond(b) . . . . . . . . . . . . . . . . 9.25% 5/07/28 8,171 2,390,076 0.2Venezuela Government International Bond(b) . . . . . . . . . . . . . . . . 11.95% 8/05/31 762 228,510 0.0Venezuela Government International Bond(b) . . . . . . . . . . . . . . . . 12.75% 8/23/22 2,087 647,094 0.1Zambia Government International Bond . . . . . . . . . . . . . . . . . . . . . 8.50% 4/14/24 1,675 1,356,750 0.1Zambia Government International Bond . . . . . . . . . . . . . . . . . . . . . 8.97% 7/30/27 3,480 2,805,750 0.3 593,162,706 62.0

AB FCP I
119
EmergingMarketsDebtPortfolio
Rate Date Principal Value Net Assets (000) (USD) %
QUASI-SOVEREIGN BONDSAeropuerto Internacional de Tocumen SA. . . . . . . . . . . . . . . . . . . . 6.00% 11/18/48 USD 3,094 $ 3,281,187 0.3%CNAC HK Finbridge Co., Ltd. . . . . . . . . . . . . . . . . . . . . . . . . . . . . 4.13% 7/19/27 7,000 6,865,915 0.7Empresa de Transporte de Pasajeros Metro SA. . . . . . . . . . . . . . . . 4.75% 2/04/24 805 838,649 0.1EP PetroEcuador via Noble Sovereign Funding I Ltd.(c) . . . . . . . . 8.44% 9/24/19 159 158,105 0.0Eskom Holdings SOC Ltd. . . . . . . . . . . . . . . . . . . . . . . . . . . . . . . . 5.75% 1/26/21 10,123 10,067,323 1.0Eskom Holdings SOC Ltd. . . . . . . . . . . . . . . . . . . . . . . . . . . . . . . . 6.75% 8/06/23 614 617,838 0.1Eskom Holdings SOC Ltd. . . . . . . . . . . . . . . . . . . . . . . . . . . . . . . . 8.45% 8/10/28 1,890 2,012,850 0.2Export Credit Bank of Turkey . . . . . . . . . . . . . . . . . . . . . . . . . . . . . 4.25% 9/18/22 4,623 4,293,611 0.4Export Credit Bank of Turkey . . . . . . . . . . . . . . . . . . . . . . . . . . . . . 5.00% 9/23/21 2,835 2,753,494 0.3Export Credit Bank of Turkey . . . . . . . . . . . . . . . . . . . . . . . . . . . . . 5.38% 2/08/21 1,710 1,692,900 0.2Export-Import Bank of China (The) . . . . . . . . . . . . . . . . . . . . . . . . 3.38% 3/14/27 3,118 3,020,079 0.3Export-Import Bank of China (The) . . . . . . . . . . . . . . . . . . . . . . . . 3.63% 7/31/24 1,619 1,627,865 0.2Fondo MIVIVIENDA SA . . . . . . . . . . . . . . . . . . . . . . . . . . . . . . . . 3.50% 1/31/23 1,424 1,410,525 0.2Indonesia Asahan Aluminium Persero PT . . . . . . . . . . . . . . . . . . . . 6.53% 11/15/28 941 1,030,395 0.1Kazakhstan Temir Zholy National Co. JSC. . . . . . . . . . . . . . . . . . . 4.85% 11/17/27 5,065 5,159,969 0.5KazMunayGas National Co. JSC. . . . . . . . . . . . . . . . . . . . . . . . . . . 5.38% 4/24/30 7,272 7,526,520 0.8KazMunayGas National Co. JSC. . . . . . . . . . . . . . . . . . . . . . . . . . . 5.75% 4/19/47 1,546 1,584,650 0.2MDC-GMTN BV. . . . . . . . . . . . . . . . . . . . . . . . . . . . . . . . . . . . . . . 4.50% 11/07/28 3,723 3,932,419 0.4Oil and Gas Holding Co. BSCC (The). . . . . . . . . . . . . . . . . . . . . . . 7.63% 11/07/24 2,935 3,180,806 0.3Pelabuhan Indonesia II PT. . . . . . . . . . . . . . . . . . . . . . . . . . . . . . . . 4.25% 5/05/25 1,911 1,891,890 0.2Pertamina Persero PT. . . . . . . . . . . . . . . . . . . . . . . . . . . . . . . . . . . . 5.63% 5/20/43 3,840 3,864,000 0.4Perusahaan Listrik Negara PT . . . . . . . . . . . . . . . . . . . . . . . . . . . . . 4.13% 5/15/27 4,858 4,654,457 0.5Perusahaan Listrik Negara PT . . . . . . . . . . . . . . . . . . . . . . . . . . . . . 5.45% 5/21/28 6,292 6,567,275 0.7Petroleos de Venezuela SA(b) . . . . . . . . . . . . . . . . . . . . . . . . . . . . . 5.38% 4/12/27 7,377 1,669,114 0.2Petroleos de Venezuela SA(b) . . . . . . . . . . . . . . . . . . . . . . . . . . . . . 5.50% 4/12/37 8,347 1,888,509 0.2Petroleos de Venezuela SA(b) . . . . . . . . . . . . . . . . . . . . . . . . . . . . . 9.00% 11/17/21 9,326 2,448,095 0.3Petroleos Mexicanos . . . . . . . . . . . . . . . . . . . . . . . . . . . . . . . . . . . . 5.50% 6/27/44 5,066 3,975,290 0.4Petroleos Mexicanos . . . . . . . . . . . . . . . . . . . . . . . . . . . . . . . . . . . . 6.50% 3/13/27 6,602 6,374,231 0.7Petroleum Co. of Trinidad & Tobago Ltd. . . . . . . . . . . . . . . . . . . . . 9.75% 8/14/19 345 338,100 0.0Petroliam Nasional Bhd . . . . . . . . . . . . . . . . . . . . . . . . . . . . . . . . . . 7.63% 10/15/26 901 1,139,225 0.1Sinopec Group Overseas Development 2015 Ltd.. . . . . . . . . . . . . . 3.25% 4/28/25 2,600 2,522,715 0.3Sinopec Group Overseas Development 2017 Ltd.. . . . . . . . . . . . . . 3.25% 9/13/27 5,718 5,424,305 0.6Southern Gas Corridor CJSC. . . . . . . . . . . . . . . . . . . . . . . . . . . . . . 6.88% 3/24/26 2,311 2,573,876 0.3State Grid Overseas Investment 2013 Ltd., Series 2013 . . . . . . . . . 3.13% 5/22/23 776 766,849 0.1State Grid Overseas Investment 2014 Ltd. . . . . . . . . . . . . . . . . . . . 4.13% 5/07/24 2,043 2,106,111 0.2State Grid Overseas Investment 2016 Ltd. . . . . . . . . . . . . . . . . . . . 3.75% 5/02/23 2,662 2,689,213 0.3State Oil Co. of the Azerbaijan Republic. . . . . . . . . . . . . . . . . . . . . 6.95% 3/18/30 880 974,600 0.1Three Gorges Finance I Cayman Islands Ltd. . . . . . . . . . . . . . . . . . 3.15% 6/02/26 430 410,104 0.0Trinidad Generation UnLtd.. . . . . . . . . . . . . . . . . . . . . . . . . . . . . . . 5.25% 11/04/27 1,179 1,140,087 0.1 114,473,146 12.0
CORPORATE BONDSABJA Investment Co. Pte Ltd.. . . . . . . . . . . . . . . . . . . . . . . . . . . . . 5.45% 1/24/28 2,383 2,168,530 0.2AI Candelaria Spain SLU . . . . . . . . . . . . . . . . . . . . . . . . . . . . . . . . 7.50% 12/15/28 2,169 2,179,836 0.2Autopistas del Sol SA/Costa Rica . . . . . . . . . . . . . . . . . . . . . . . . . . 7.38% 12/30/30 2,171 2,026,864 0.2Axtel SAB de CV. . . . . . . . . . . . . . . . . . . . . . . . . . . . . . . . . . . . . . . 6.38% 11/14/24 3,190 3,095,097 0.3Baidu, Inc. . . . . . . . . . . . . . . . . . . . . . . . . . . . . . . . . . . . . . . . . . . . . 3.63% 7/06/27 541 515,020 0.1Baidu, Inc. . . . . . . . . . . . . . . . . . . . . . . . . . . . . . . . . . . . . . . . . . . . . 4.88% 11/14/28 1,810 1,884,650 0.2Banco Hipotecario SA(c). . . . . . . . . . . . . . . . . . . . . . . . . . . . . . . . . 56.79% 11/07/22 ARS 57,495 1,393,559 0.1BRF SA . . . . . . . . . . . . . . . . . . . . . . . . . . . . . . . . . . . . . . . . . . . . . . 3.95% 5/22/23 USD 6,190 5,803,125 0.6Central American Bottling Corp. . . . . . . . . . . . . . . . . . . . . . . . . . . . 5.75% 1/31/27 797 808,608 0.1China Evergrande Group, Series JAN . . . . . . . . . . . . . . . . . . . . . . . 8.25% 3/23/22 1,274 1,217,069 0.1Consolidated Energy Finance SA . . . . . . . . . . . . . . . . . . . . . . . . . . 6.88% 6/15/25 973 950,135 0.1Country Garden Holdings Co., Ltd.. . . . . . . . . . . . . . . . . . . . . . . . . 7.13% 4/25/22 1,255 1,287,050 0.1CSN Resources SA . . . . . . . . . . . . . . . . . . . . . . . . . . . . . . . . . . . . . 7.63% 2/13/23 2,184 2,193,009 0.2Digicel Group One Ltd. . . . . . . . . . . . . . . . . . . . . . . . . . . . . . . . . . . 8.25% 12/30/22 939 629,427 0.1Digicel Group Two Ltd. . . . . . . . . . . . . . . . . . . . . . . . . . . . . . . . . . . 8.25% 9/30/22 1,073 450,660 0.0
. . . . . . . . . . . . . . . . . . . . . . . . . . . . . . . . . . . . . . . . . . . . . . . . . . .Digicel Group Two Ltd.(d) . . . . . . . . . . . . . . . . . . . . . . . . . . . . . . . 9.13% 4/01/24 917 295,733 0.0Easy Tactic Ltd. . . . . . . . . . . . . . . . . . . . . . . . . . . . . . . . . . . . . . . . . 9.13% 7/28/22 286 296,010 0.0Ecopetrol SA . . . . . . . . . . . . . . . . . . . . . . . . . . . . . . . . . . . . . . . . . . 5.88% 9/18/23 8,634 9,251,331 1.0Empresa Electrica Angamos SA . . . . . . . . . . . . . . . . . . . . . . . . . . . 4.88% 5/25/29 582 581,116 0.1Energuate Trust . . . . . . . . . . . . . . . . . . . . . . . . . . . . . . . . . . . . . . . . 5.88% 5/03/27 3,311 3,150,168 0.3Genneia SA . . . . . . . . . . . . . . . . . . . . . . . . . . . . . . . . . . . . . . . . . . . 8.75% 1/20/22 1,605 1,492,650 0.2Greenko Dutch BV. . . . . . . . . . . . . . . . . . . . . . . . . . . . . . . . . . . . . . 5.25% 7/24/24 3,030 2,851,988 0.3HDFC Bank Ltd. . . . . . . . . . . . . . . . . . . . . . . . . . . . . . . . . . . . . . . . 8.10% 3/22/25 INR 180,000 2,404,669 0.3Housing Development Finance Corp., Ltd., Series G . . . . . . . . . . . 7.88% 8/21/19 50,000 699,422 0.1Indiabulls Housing Finance Ltd. . . . . . . . . . . . . . . . . . . . . . . . . . . . 8.57% 10/15/19 69,300 962,145 0.1Indian Renewable Energy Development Agency Ltd., Series E . . . 7.13% 10/10/22 250,000 3,312,771 0.3Inkia Energy Ltd. . . . . . . . . . . . . . . . . . . . . . . . . . . . . . . . . . . . . . . . 5.88% 11/09/27 USD 1,179 1,133,314 0.1JD.com, Inc. . . . . . . . . . . . . . . . . . . . . . . . . . . . . . . . . . . . . . . . . . . . 3.88% 4/29/26 1,722 1,625,525 0.2Light Servicos de Eletricidade SA/Light Energia SA . . . . . . . . . . . 7.25% 5/03/23 1,609 1,629,056 0.2Marfrig Holdings Europe BV . . . . . . . . . . . . . . . . . . . . . . . . . . . . . 8.00% 6/08/23 2,560 2,660,367 0.3
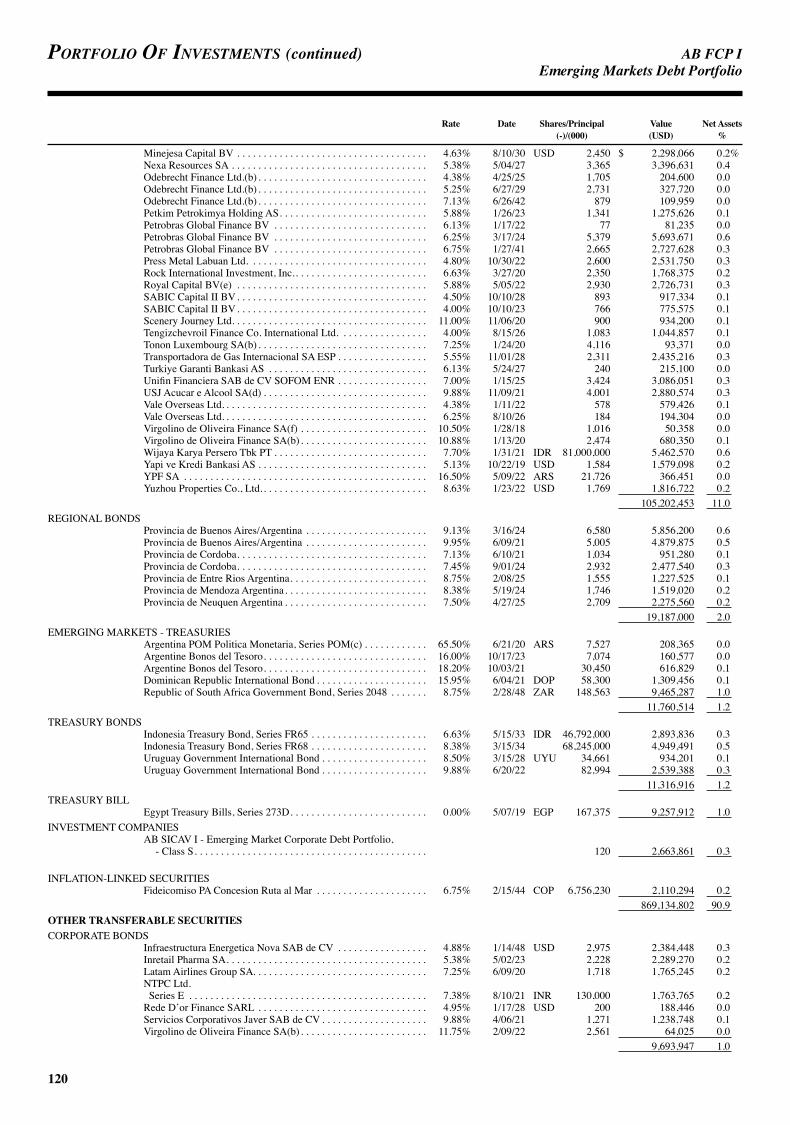
AB FCP I
120
Portfolio of investments (continued) EmergingMarketsDebtPortfolio
Rate Date Shares/Principal Value Net Assets (-)/(000) (USD) %
Minejesa Capital BV . . . . . . . . . . . . . . . . . . . . . . . . . . . . . . . . . . . . 4.63% 8/10/30 USD 2,450 $ 2,298,066 0.2%Nexa Resources SA . . . . . . . . . . . . . . . . . . . . . . . . . . . . . . . . . . . . . 5.38% 5/04/27 3,365 3,396,631 0.4Odebrecht Finance Ltd.(b) . . . . . . . . . . . . . . . . . . . . . . . . . . . . . . . . 4.38% 4/25/25 1,705 204,600 0.0Odebrecht Finance Ltd.(b) . . . . . . . . . . . . . . . . . . . . . . . . . . . . . . . . 5.25% 6/27/29 2,731 327,720 0.0Odebrecht Finance Ltd.(b) . . . . . . . . . . . . . . . . . . . . . . . . . . . . . . . . 7.13% 6/26/42 879 109,959 0.0Petkim Petrokimya Holding AS. . . . . . . . . . . . . . . . . . . . . . . . . . . . 5.88% 1/26/23 1,341 1,275,626 0.1Petrobras Global Finance BV . . . . . . . . . . . . . . . . . . . . . . . . . . . . . 6.13% 1/17/22 77 81,235 0.0Petrobras Global Finance BV . . . . . . . . . . . . . . . . . . . . . . . . . . . . . 6.25% 3/17/24 5,379 5,693,671 0.6Petrobras Global Finance BV . . . . . . . . . . . . . . . . . . . . . . . . . . . . . 6.75% 1/27/41 2,665 2,727,628 0.3Press Metal Labuan Ltd. . . . . . . . . . . . . . . . . . . . . . . . . . . . . . . . . . 4.80% 10/30/22 2,600 2,531,750 0.3Rock International Investment, Inc.. . . . . . . . . . . . . . . . . . . . . . . . . 6.63% 3/27/20 2,350 1,768,375 0.2Royal Capital BV(e) . . . . . . . . . . . . . . . . . . . . . . . . . . . . . . . . . . . . 5.88% 5/05/22 2,930 2,726,731 0.3SABIC Capital II BV. . . . . . . . . . . . . . . . . . . . . . . . . . . . . . . . . . . . 4.50% 10/10/28 893 917,334 0.1SABIC Capital II BV. . . . . . . . . . . . . . . . . . . . . . . . . . . . . . . . . . . . 4.00% 10/10/23 766 775,575 0.1Scenery Journey Ltd. . . . . . . . . . . . . . . . . . . . . . . . . . . . . . . . . . . . . 11.00% 11/06/20 900 934,200 0.1Tengizchevroil Finance Co. International Ltd. . . . . . . . . . . . . . . . . 4.00% 8/15/26 1,083 1,044,857 0.1Tonon Luxembourg SA(b) . . . . . . . . . . . . . . . . . . . . . . . . . . . . . . . . 7.25% 1/24/20 4,116 93,371 0.0Transportadora de Gas Internacional SA ESP . . . . . . . . . . . . . . . . . 5.55% 11/01/28 2,311 2,435,216 0.3Turkiye Garanti Bankasi AS . . . . . . . . . . . . . . . . . . . . . . . . . . . . . . 6.13% 5/24/27 240 215,100 0.0Unifin Financiera SAB de CV SOFOM ENR . . . . . . . . . . . . . . . . . 7.00% 1/15/25 3,424 3,086,051 0.3USJ Acucar e Alcool SA(d) . . . . . . . . . . . . . . . . . . . . . . . . . . . . . . . 9.88% 11/09/21 4,001 2,880,574 0.3Vale Overseas Ltd. . . . . . . . . . . . . . . . . . . . . . . . . . . . . . . . . . . . . . . 4.38% 1/11/22 578 579,426 0.1Vale Overseas Ltd. . . . . . . . . . . . . . . . . . . . . . . . . . . . . . . . . . . . . . . 6.25% 8/10/26 184 194,304 0.0Virgolino de Oliveira Finance SA(f) . . . . . . . . . . . . . . . . . . . . . . . . 10.50% 1/28/18 1,016 50,358 0.0Virgolino de Oliveira Finance SA(b) . . . . . . . . . . . . . . . . . . . . . . . . 10.88% 1/13/20 2,474 680,350 0.1Wijaya Karya Persero Tbk PT . . . . . . . . . . . . . . . . . . . . . . . . . . . . . 7.70% 1/31/21 IDR 81,000,000 5,462,570 0.6Yapi ve Kredi Bankasi AS . . . . . . . . . . . . . . . . . . . . . . . . . . . . . . . . 5.13% 10/22/19 USD 1,584 1,579,098 0.2YPF SA . . . . . . . . . . . . . . . . . . . . . . . . . . . . . . . . . . . . . . . . . . . . . . 16.50% 5/09/22 ARS 21,726 366,451 0.0Yuzhou Properties Co., Ltd.. . . . . . . . . . . . . . . . . . . . . . . . . . . . . . . 8.63% 1/23/22 USD 1,769 1,816,722 0.2 105,202,453 11.0
REGIONAL BONDSProvincia de Buenos Aires/Argentina . . . . . . . . . . . . . . . . . . . . . . . 9.13% 3/16/24 6,580 5,856,200 0.6Provincia de Buenos Aires/Argentina . . . . . . . . . . . . . . . . . . . . . . . 9.95% 6/09/21 5,005 4,879,875 0.5Provincia de Cordoba. . . . . . . . . . . . . . . . . . . . . . . . . . . . . . . . . . . . 7.13% 6/10/21 1,034 951,280 0.1Provincia de Cordoba. . . . . . . . . . . . . . . . . . . . . . . . . . . . . . . . . . . . 7.45% 9/01/24 2,932 2,477,540 0.3Provincia de Entre Rios Argentina. . . . . . . . . . . . . . . . . . . . . . . . . . 8.75% 2/08/25 1,555 1,227,525 0.1Provincia de Mendoza Argentina. . . . . . . . . . . . . . . . . . . . . . . . . . . 8.38% 5/19/24 1,746 1,519,020 0.2Provincia de Neuquen Argentina . . . . . . . . . . . . . . . . . . . . . . . . . . . 7.50% 4/27/25 2,709 2,275,560 0.2 19,187,000 2.0
EMERGING MARKETS - TREASURIESArgentina POM Politica Monetaria, Series POM(c) . . . . . . . . . . . . 65.50% 6/21/20 ARS 7,527 208,365 0.0Argentine Bonos del Tesoro. . . . . . . . . . . . . . . . . . . . . . . . . . . . . . . 16.00% 10/17/23 7,074 160,577 0.0Argentine Bonos del Tesoro. . . . . . . . . . . . . . . . . . . . . . . . . . . . . . . 18.20% 10/03/21 30,450 616,829 0.1Dominican Republic International Bond . . . . . . . . . . . . . . . . . . . . . 15.95% 6/04/21 DOP 58,300 1,309,456 0.1Republic of South Africa Government Bond, Series 2048 . . . . . . . 8.75% 2/28/48 ZAR 148,563 9,465,287 1.0 11,760,514 1.2
TREASURY BONDSIndonesia Treasury Bond, Series FR65 . . . . . . . . . . . . . . . . . . . . . . 6.63% 5/15/33 IDR 46,792,000 2,893,836 0.3Indonesia Treasury Bond, Series FR68 . . . . . . . . . . . . . . . . . . . . . . 8.38% 3/15/34 68,245,000 4,949,491 0.5Uruguay Government International Bond . . . . . . . . . . . . . . . . . . . . 8.50% 3/15/28 UYU 34,661 934,201 0.1Uruguay Government International Bond . . . . . . . . . . . . . . . . . . . . 9.88% 6/20/22 82,994 2,539,388 0.3 11,316,916 1.2
TREASURY BILLEgypt Treasury Bills, Series 273D. . . . . . . . . . . . . . . . . . . . . . . . . . 0.00% 5/07/19 EGP 167,375 9,257,912 1.0
INVESTMENT COMPANIESAB SICAV I - Emerging Market Corporate Debt Portfolio,
- Class S. . . . . . . . . . . . . . . . . . . . . . . . . . . . . . . . . . . . . . . . . . . . 120 2,663,861 0.3
INFLATION-LINKED SECURITIESFideicomiso PA Concesion Ruta al Mar . . . . . . . . . . . . . . . . . . . . . 6.75% 2/15/44 COP 6,756,230 2,110,294 0.2 869,134,802 90.9
OTHER TRANSFERABLE SECURITIESCORPORATE BONDS
Infraestructura Energetica Nova SAB de CV . . . . . . . . . . . . . . . . . 4.88% 1/14/48 USD 2,975 2,384,448 0.3Inretail Pharma SA. . . . . . . . . . . . . . . . . . . . . . . . . . . . . . . . . . . . . . 5.38% 5/02/23 2,228 2,289,270 0.2Latam Airlines Group SA. . . . . . . . . . . . . . . . . . . . . . . . . . . . . . . . . 7.25% 6/09/20 1,718 1,765,245 0.2NTPC Ltd. Series E . . . . . . . . . . . . . . . . . . . . . . . . . . . . . . . . . . . . . . . . . . . . . 7.38% 8/10/21 INR 130,000 1,763,765 0.2Rede D’or Finance SARL . . . . . . . . . . . . . . . . . . . . . . . . . . . . . . . . 4.95% 1/17/28 USD 200 188,446 0.0Servicios Corporativos Javer SAB de CV . . . . . . . . . . . . . . . . . . . . 9.88% 4/06/21 1,271 1,238,748 0.1Virgolino de Oliveira Finance SA(b) . . . . . . . . . . . . . . . . . . . . . . . . 11.75% 2/09/22 2,561 64,025 0.0 9,693,947 1.0
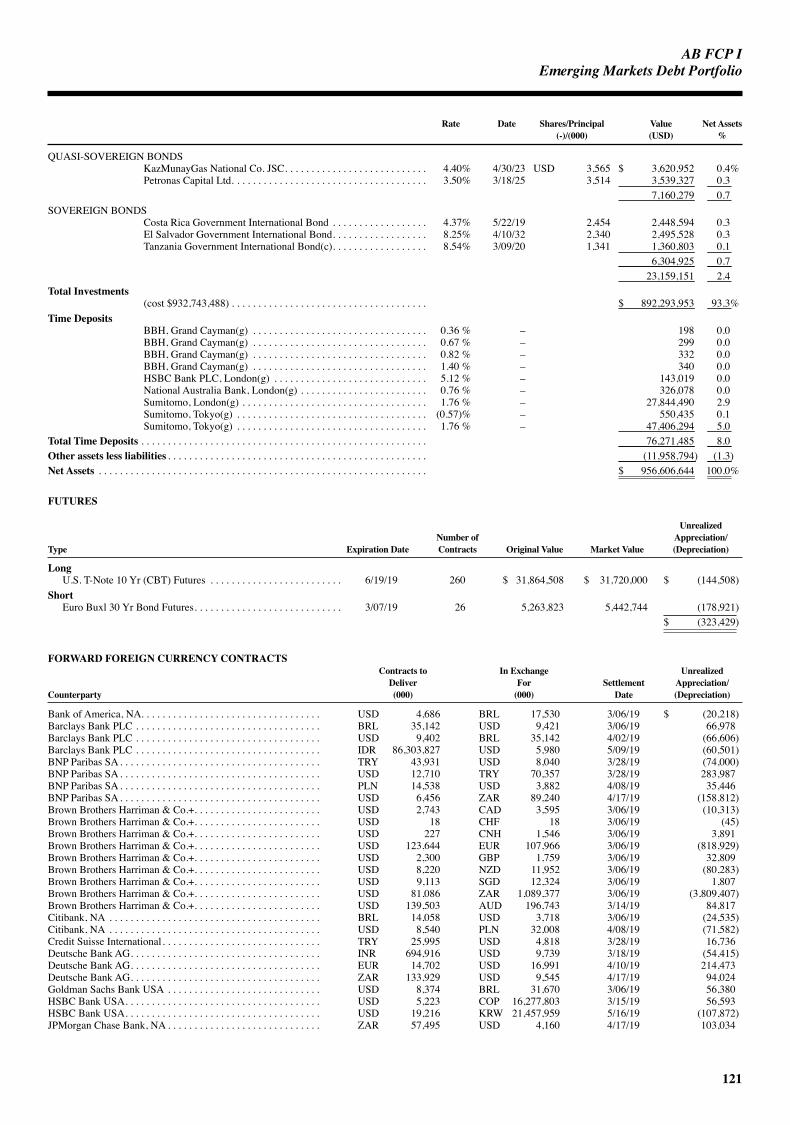
AB FCP I
121
EmergingMarketsDebtPortfolio
Rate Date Shares/Principal Value Net Assets (-)/(000) (USD) %
QUASI-SOVEREIGN BONDSKazMunayGas National Co. JSC. . . . . . . . . . . . . . . . . . . . . . . . . . . 4.40% 4/30/23 USD 3,565 $ 3,620,952 0.4%Petronas Capital Ltd. . . . . . . . . . . . . . . . . . . . . . . . . . . . . . . . . . . . . 3.50% 3/18/25 3,514 3,539,327 0.3 7,160,279 0.7
SOVEREIGN BONDSCosta Rica Government International Bond . . . . . . . . . . . . . . . . . . 4.37% 5/22/19 2,454 2,448,594 0.3El Salvador Government International Bond. . . . . . . . . . . . . . . . . . 8.25% 4/10/32 2,340 2,495,528 0.3Tanzania Government International Bond(c). . . . . . . . . . . . . . . . . . 8.54% 3/09/20 1,341 1,360,803 0.1 6,304,925 0.7 23,159,151 2.4
Total Investments(cost $932,743,488) . . . . . . . . . . . . . . . . . . . . . . . . . . . . . . . . . . . . . $ 892,293,953 93.3%
Time DepositsBBH, Grand Cayman(g) . . . . . . . . . . . . . . . . . . . . . . . . . . . . . . . . . 0.36 % – 198 0.0BBH, Grand Cayman(g) . . . . . . . . . . . . . . . . . . . . . . . . . . . . . . . . . 0.67 % – 299 0.0BBH, Grand Cayman(g) . . . . . . . . . . . . . . . . . . . . . . . . . . . . . . . . . 0.82 % – 332 0.0BBH, Grand Cayman(g) . . . . . . . . . . . . . . . . . . . . . . . . . . . . . . . . . 1.40 % – 340 0.0HSBC Bank PLC, London(g) . . . . . . . . . . . . . . . . . . . . . . . . . . . . . 5.12 % – 143,019 0.0National Australia Bank, London(g) . . . . . . . . . . . . . . . . . . . . . . . . 0.76 % – 326,078 0.0Sumitomo, London(g) . . . . . . . . . . . . . . . . . . . . . . . . . . . . . . . . . . . 1.76 % – 27,844,490 2.9Sumitomo, Tokyo(g) . . . . . . . . . . . . . . . . . . . . . . . . . . . . . . . . . . . . (0.57)% – 550,435 0.1Sumitomo, Tokyo(g) . . . . . . . . . . . . . . . . . . . . . . . . . . . . . . . . . . . . 1.76 % – 47,406,294 5.0
Total Time Deposits . . . . . . . . . . . . . . . . . . . . . . . . . . . . . . . . . . . . . . . . . . . . . . . . . . . . . . 76,271,485 8.0Other assets less liabilities . . . . . . . . . . . . . . . . . . . . . . . . . . . . . . . . . . . . . . . . . . . . . . . . . (11,958,794) (1.3)Net Assets . . . . . . . . . . . . . . . . . . . . . . . . . . . . . . . . . . . . . . . . . . . . . . . . . . . . . . . . . . . . . . $ 956,606,644 100.0%
FUTURES
Unrealized Number of Appreciation/ Type Expiration Date Contracts Original Value Market Value (Depreciation)
LongU.S. T-Note 10 Yr (CBT) Futures . . . . . . . . . . . . . . . . . . . . . . . . . 6/19/19 260 $ 31,864,508 $ 31,720,000 $ (144,508)
ShortEuro Buxl 30 Yr Bond Futures. . . . . . . . . . . . . . . . . . . . . . . . . . . . 3/07/19 26 5,263,823 5,442,744 (178,921) $ (323,429)
FORWARD FOREIGN CURRENCY CONTRACTS Contracts to In Exchange Unrealized Deliver For Settlement Appreciation/ Counterparty (000) (000) Date (Depreciation)
Bank of America, NA. . . . . . . . . . . . . . . . . . . . . . . . . . . . . . . . . . USD 4,686 BRL 17,530 3/06/19 $ (20,218)Barclays Bank PLC . . . . . . . . . . . . . . . . . . . . . . . . . . . . . . . . . . . BRL 35,142 USD 9,421 3/06/19 66,978Barclays Bank PLC . . . . . . . . . . . . . . . . . . . . . . . . . . . . . . . . . . . USD 9,402 BRL 35,142 4/02/19 (66,606)Barclays Bank PLC . . . . . . . . . . . . . . . . . . . . . . . . . . . . . . . . . . . IDR 86,303,827 USD 5,980 5/09/19 (60,501)BNP Paribas SA. . . . . . . . . . . . . . . . . . . . . . . . . . . . . . . . . . . . . . TRY 43,931 USD 8,040 3/28/19 (74,000)BNP Paribas SA. . . . . . . . . . . . . . . . . . . . . . . . . . . . . . . . . . . . . . USD 12,710 TRY 70,357 3/28/19 283,987BNP Paribas SA. . . . . . . . . . . . . . . . . . . . . . . . . . . . . . . . . . . . . . PLN 14,538 USD 3,882 4/08/19 35,446BNP Paribas SA. . . . . . . . . . . . . . . . . . . . . . . . . . . . . . . . . . . . . . USD 6,456 ZAR 89,240 4/17/19 (158,812)Brown Brothers Harriman & Co.+. . . . . . . . . . . . . . . . . . . . . . . . USD 2,743 CAD 3,595 3/06/19 (10,313)Brown Brothers Harriman & Co.+. . . . . . . . . . . . . . . . . . . . . . . . USD 18 CHF 18 3/06/19 (45)Brown Brothers Harriman & Co.+. . . . . . . . . . . . . . . . . . . . . . . . USD 227 CNH 1,546 3/06/19 3,891Brown Brothers Harriman & Co.+. . . . . . . . . . . . . . . . . . . . . . . . USD 123,644 EUR 107,966 3/06/19 (818,929)Brown Brothers Harriman & Co.+. . . . . . . . . . . . . . . . . . . . . . . . USD 2,300 GBP 1,759 3/06/19 32,809Brown Brothers Harriman & Co.+. . . . . . . . . . . . . . . . . . . . . . . . USD 8,220 NZD 11,952 3/06/19 (80,283)Brown Brothers Harriman & Co.+. . . . . . . . . . . . . . . . . . . . . . . . USD 9,113 SGD 12,324 3/06/19 1,807Brown Brothers Harriman & Co.+. . . . . . . . . . . . . . . . . . . . . . . . USD 81,086 ZAR 1,089,377 3/06/19 (3,809,407)Brown Brothers Harriman & Co.+. . . . . . . . . . . . . . . . . . . . . . . . USD 139,503 AUD 196,743 3/14/19 84,817Citibank, NA . . . . . . . . . . . . . . . . . . . . . . . . . . . . . . . . . . . . . . . . BRL 14,058 USD 3,718 3/06/19 (24,535)Citibank, NA . . . . . . . . . . . . . . . . . . . . . . . . . . . . . . . . . . . . . . . . USD 8,540 PLN 32,008 4/08/19 (71,582)Credit Suisse International. . . . . . . . . . . . . . . . . . . . . . . . . . . . . . TRY 25,995 USD 4,818 3/28/19 16,736Deutsche Bank AG. . . . . . . . . . . . . . . . . . . . . . . . . . . . . . . . . . . . INR 694,916 USD 9,739 3/18/19 (54,415)Deutsche Bank AG. . . . . . . . . . . . . . . . . . . . . . . . . . . . . . . . . . . . EUR 14,702 USD 16,991 4/10/19 214,473Deutsche Bank AG. . . . . . . . . . . . . . . . . . . . . . . . . . . . . . . . . . . . ZAR 133,929 USD 9,545 4/17/19 94,024Goldman Sachs Bank USA . . . . . . . . . . . . . . . . . . . . . . . . . . . . . USD 8,374 BRL 31,670 3/06/19 56,380HSBC Bank USA. . . . . . . . . . . . . . . . . . . . . . . . . . . . . . . . . . . . . USD 5,223 COP 16,277,803 3/15/19 56,593HSBC Bank USA. . . . . . . . . . . . . . . . . . . . . . . . . . . . . . . . . . . . . USD 19,216 KRW 21,457,959 5/16/19 (107,872)JPMorgan Chase Bank, NA . . . . . . . . . . . . . . . . . . . . . . . . . . . . . ZAR 57,495 USD 4,160 4/17/19 103,034
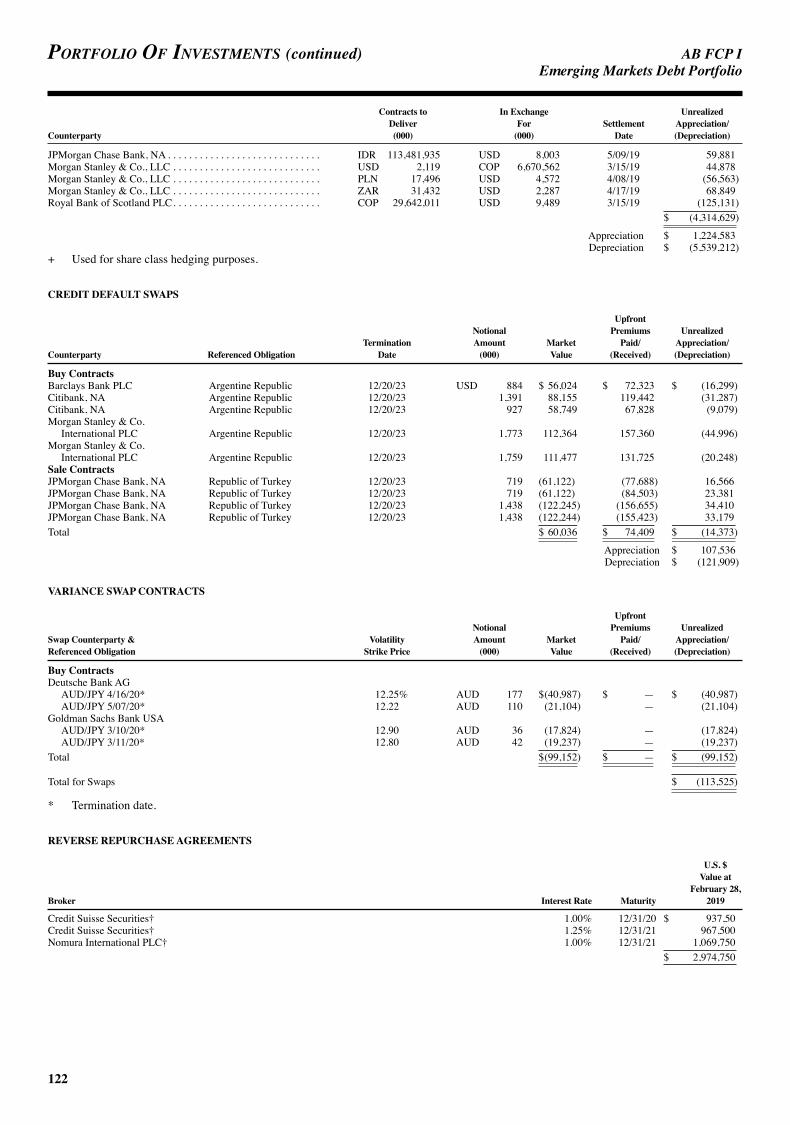
AB FCP I
122
Portfolio of investments (continued) EmergingMarketsDebtPortfolio
Contracts to In Exchange Unrealized Deliver For Settlement Appreciation/ Counterparty (000) (000) Date (Depreciation)
JPMorgan Chase Bank, NA . . . . . . . . . . . . . . . . . . . . . . . . . . . . . IDR 113,481,935 USD 8,003 5/09/19 59,881Morgan Stanley & Co., LLC . . . . . . . . . . . . . . . . . . . . . . . . . . . . USD 2,119 COP 6,670,562 3/15/19 44,878Morgan Stanley & Co., LLC . . . . . . . . . . . . . . . . . . . . . . . . . . . . PLN 17,496 USD 4,572 4/08/19 (56,563)Morgan Stanley & Co., LLC . . . . . . . . . . . . . . . . . . . . . . . . . . . . ZAR 31,432 USD 2,287 4/17/19 68,849Royal Bank of Scotland PLC. . . . . . . . . . . . . . . . . . . . . . . . . . . . COP 29,642,011 USD 9,489 3/15/19 (125,131)
$ (4,314,629)
Appreciation $ 1,224,583 Depreciation $ (5,539,212)
+ Used for share class hedging purposes.
CREDIT DEFAULT SWAPS
Upfront Notional Premiums Unrealized Termination Amount Market Paid/ Appreciation/ Counterparty Referenced Obligation Date (000) Value (Received) (Depreciation)
Buy ContractsBarclays Bank PLC Argentine Republic 12/20/23 USD 884 $ 56,024 $ 72,323 $ (16,299)Citibank, NA Argentine Republic 12/20/23 1,391 88,155 119,442 (31,287)Citibank, NA Argentine Republic 12/20/23 927 58,749 67,828 (9,079)Morgan Stanley & Co.
International PLC Argentine Republic 12/20/23 1,773 112,364 157,360 (44,996)Morgan Stanley & Co.
International PLC Argentine Republic 12/20/23 1,759 111,477 131,725 (20,248)Sale ContractsJPMorgan Chase Bank, NA Republic of Turkey 12/20/23 719 (61,122) (77,688) 16,566JPMorgan Chase Bank, NA Republic of Turkey 12/20/23 719 (61,122) (84,503) 23,381JPMorgan Chase Bank, NA Republic of Turkey 12/20/23 1,438 (122,245) (156,655) 34,410JPMorgan Chase Bank, NA Republic of Turkey 12/20/23 1,438 (122,244) (155,423) 33,179Total $ 60,036 $ 74,409 $ (14,373)
Appreciation $ 107,536 Depreciation $ (121,909)
VARIANCE SWAP CONTRACTS
Upfront Notional Premiums Unrealized Swap Counterparty & Volatility Amount Market Paid/ Appreciation/ Referenced Obligation Strike Price (000) Value (Received) (Depreciation)
Buy ContractsDeutsche Bank AG AUD/JPY 4/16/20* 12.25% AUD 177 $ (40,987) $ — $ (40,987) AUD/JPY 5/07/20* 12.22 AUD 110 (21,104) — (21,104)Goldman Sachs Bank USA AUD/JPY 3/10/20* 12.90 AUD 36 (17,824) — (17,824) AUD/JPY 3/11/20* 12.80 AUD 42 (19,237) — (19,237)Total $ (99,152) $ — $ (99,152)
Total for Swaps $ (113,525)
* Termination date.
REVERSE REPURCHASE AGREEMENTS
U.S. $ Value at February 28, Broker Interest Rate Maturity 2019
Credit Suisse Securities† 1.00% 12/31/20 $ 937,50Credit Suisse Securities† 1.25% 12/31/21 967,500Nomura International PLC† 1.00% 12/31/21 1,069,750
$ 2,974,750
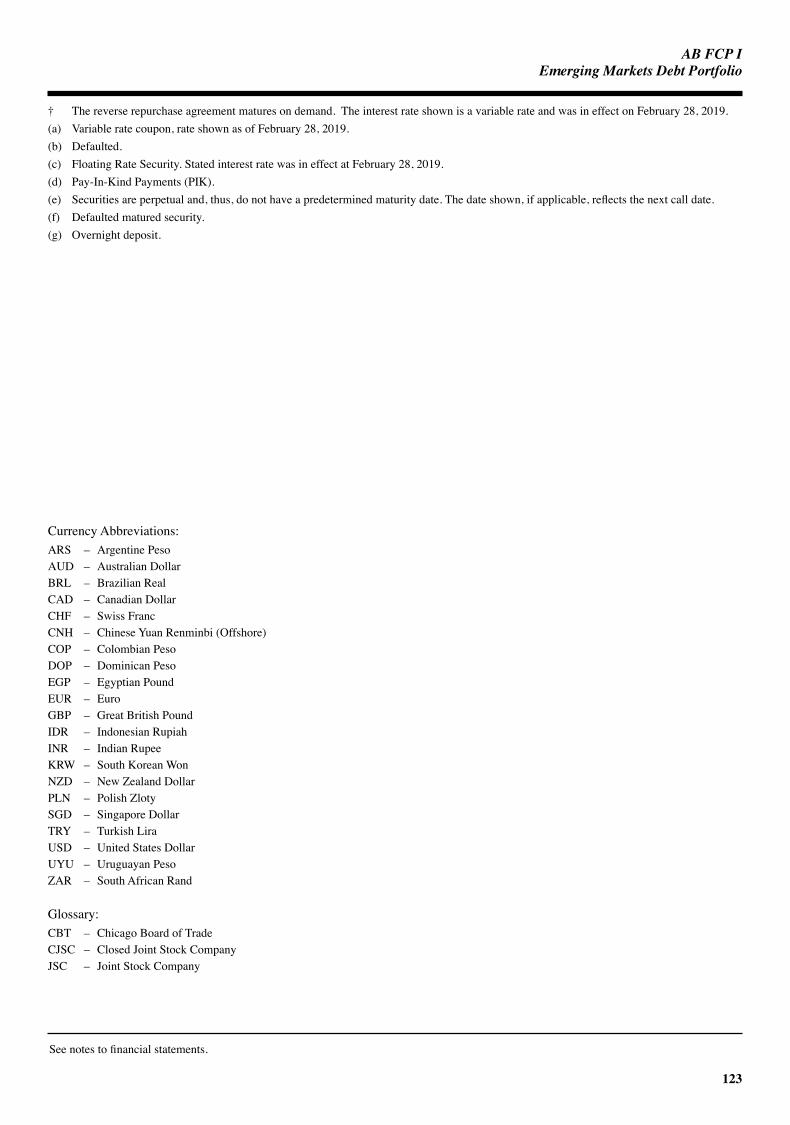
AB FCP I
123
EmergingMarketsDebtPortfolio
† The reverse repurchase agreement matures on demand. The interest rate shown is a variable rate and was in effect on February 28, 2019.(a) Variable rate coupon, rate shown as of February 28, 2019.(b) Defaulted.(c) Floating Rate Security. Stated interest rate was in effect at February 28, 2019.(d) Pay-In-Kind Payments (PIK).(e) Securities are perpetual and, thus, do not have a predetermined maturity date. The date shown, if applicable, reflects the next call date.(f) Defaulted matured security.(g) Overnight deposit.
Currency Abbreviations:ARS – Argentine PesoAUD – Australian DollarBRL – Brazilian RealCAD – Canadian DollarCHF – Swiss FrancCNH – Chinese Yuan Renminbi (Offshore)COP – Colombian PesoDOP – Dominican PesoEGP – Egyptian PoundEUR – EuroGBP – Great British PoundIDR – Indonesian RupiahINR – Indian RupeeKRW – South Korean WonNZD – New Zealand DollarPLN – Polish ZlotySGD – Singapore DollarTRY – Turkish LiraUSD – United States DollarUYU – Uruguayan PesoZAR – South African Rand
Glossary:CBT – Chicago Board of TradeCJSC – Closed Joint Stock CompanyJSC – Joint Stock Company
See notes to financial statements.

AB FCP I
124
Portfolio of investmentsFebruary 28, 2019 (unaudited) MortgageIncomePortfolio
Rate Date Principal Value Net Assets (000) (USD) %
TRANSFERABLE SECURITIES QUOTED ON A STOCK EXCHANGE OR DEALT IN ON ANOTHER REGULATED MARKETCOLLATERALIZED MORTGAGE OBLIGATIONSRISK SHARE FLOATING RATE
Bellemeade Re Ltd.Series 2015-1A, Class M2(a) . . . . . . . . . . . . . . . . . . . . . . . . . . . 6.79% 7/25/25 USD 297 $ 297,862 0.0%Series 2017-1, Class M1(a) . . . . . . . . . . . . . . . . . . . . . . . . . . . . . 4.19% 10/25/27 8,819 8,861,289 0.4Series 2017-1, Class M2(a) . . . . . . . . . . . . . . . . . . . . . . . . . . . . . 5.84% 10/25/27 9,044 9,288,884 0.5Series 2018-2A, Class B1(a) . . . . . . . . . . . . . . . . . . . . . . . . . . . . 5.14% 8/25/28 3,180 3,193,398 0.2Series 2018-2A, Class M1B(a) . . . . . . . . . . . . . . . . . . . . . . . . . . 3.84% 8/25/28 16,259 16,218,225 0.8Series 2018-2A, Class M1C(a) . . . . . . . . . . . . . . . . . . . . . . . . . . 4.09% 8/25/28 15,360 15,273,988 0.7Series 2018-3A, Class M1B(a) . . . . . . . . . . . . . . . . . . . . . . . . . . 4.34% 10/25/27 20,000 19,969,576 1.0Series 2018-3A, Class M2(a) . . . . . . . . . . . . . . . . . . . . . . . . . . . 5.24% 10/25/27 10,000 10,023,062 0.5
Chase Mortgage Trust, Series 2016-2, Class M4(b) . . . . . . . . . . . . 3.75% 12/25/45 896 864,114 0.0Connecticut Avenue Securities Trust
Series 2018-R07, Class 1B1(a) . . . . . . . . . . . . . . . . . . . . . . . . . . 6.84% 4/25/31 3,000 3,059,208 0.2Series 2019-R01, Class 2M2(a). . . . . . . . . . . . . . . . . . . . . . . . . . 4.94% 7/25/31 3,000 3,007,714 0.1
Eagle RE Ltd., Series 2018-1, Class M2(a) . . . . . . . . . . . . . . . . . . . 5.49% 11/25/28 5,000 5,019,617 0.2Federal Home Loan Mortgage Corp.
Series 2019-DNA1, Class M2(a). . . . . . . . . . . . . . . . . . . . . . . . . 5.14% 1/25/49 5,000 5,079,304 0.2Series 2019-HQA1, Class M2(a). . . . . . . . . . . . . . . . . . . . . . . . . 4.83% 2/25/49 5,000 5,023,835 0.2
Federal Home Loan Mortgage Corp. Structured Agency Credit Risk Debt Notes
Series 2013-DN1, Class M2(a) . . . . . . . . . . . . . . . . . . . . . . . . . . 9.64% 7/25/23 8,610 10,129,498 0.5Series 2013-DN2, Class M2(a) . . . . . . . . . . . . . . . . . . . . . . . . . . 6.74% 11/25/23 3,787 4,164,014 0.2Series 2014-DN4, Class M3(a) . . . . . . . . . . . . . . . . . . . . . . . . . . 7.04% 10/25/24 10,475 11,546,391 0.6Series 2014-HQ1, Class M3(a) . . . . . . . . . . . . . . . . . . . . . . . . . . 6.59% 8/25/24 11,635 12,664,198 0.6Series 2014-HQ2, Class M3(a) . . . . . . . . . . . . . . . . . . . . . . . . . . 6.24% 9/25/24 2,000 2,230,133 0.1Series 2014-HQ3, Class M3(a) . . . . . . . . . . . . . . . . . . . . . . . . . . 7.24% 10/25/24 10,064 11,111,723 0.5Series 2015-DN1, Class M3(a) . . . . . . . . . . . . . . . . . . . . . . . . . . 6.64% 1/25/25 12,468 13,386,970 0.7Series 2015-DNA1, Class B(a) . . . . . . . . . . . . . . . . . . . . . . . . . . 11.69% 10/25/27 7,289 9,102,067 0.4Series 2015-DNA1, Class M3(a). . . . . . . . . . . . . . . . . . . . . . . . . 5.79% 10/25/27 4,859 5,327,974 0.3Series 2015-DNA2, Class B(a) . . . . . . . . . . . . . . . . . . . . . . . . . . 10.04% 12/25/27 8,925 10,542,278 0.5Series 2015-DNA2, Class M3(a). . . . . . . . . . . . . . . . . . . . . . . . . 6.39% 12/25/27 14,194 15,442,457 0.8Series 2015-DNA3, Class B(a) . . . . . . . . . . . . . . . . . . . . . . . . . . 11.84% 4/25/28 5,012 6,299,395 0.3Series 2015-DNA3, Class M3(a). . . . . . . . . . . . . . . . . . . . . . . . . 7.19% 4/25/28 14,500 16,997,371 0.8Series 2015-HQ1, Class B(a) . . . . . . . . . . . . . . . . . . . . . . . . . . . 13.24% 3/25/25 4,592 6,210,978 0.3Series 2015-HQ1, Class M3(a) . . . . . . . . . . . . . . . . . . . . . . . . . . 6.29% 3/25/25 2,058 2,174,609 0.1Series 2015-HQ2, Class B(a) . . . . . . . . . . . . . . . . . . . . . . . . . . . 10.44% 5/25/25 2,922 3,589,062 0.2Series 2015-HQA1, Class B(a) . . . . . . . . . . . . . . . . . . . . . . . . . . 11.29% 3/25/28 3,482 4,232,411 0.2Series 2015-HQA1, Class M3(a). . . . . . . . . . . . . . . . . . . . . . . . . 7.19% 3/25/28 3,550 4,016,024 0.2Series 2015-HQA2, Class B(a) . . . . . . . . . . . . . . . . . . . . . . . . . . 12.99% 5/25/28 3,613 4,753,722 0.2Series 2015-HQA2, Class M3(a). . . . . . . . . . . . . . . . . . . . . . . . . 7.29% 5/25/28 5,000 5,730,403 0.3Series 2016-DNA1, Class B(a) . . . . . . . . . . . . . . . . . . . . . . . . . . 12.49% 7/25/28 1,934 2,521,372 0.1Series 2016-DNA1, Class M3(a). . . . . . . . . . . . . . . . . . . . . . . . . 8.04% 7/25/28 11,245 13,349,150 0.7Series 2016-DNA2, Class B(a) . . . . . . . . . . . . . . . . . . . . . . . . . . 12.99% 10/25/28 5,808 7,706,549 0.4Series 2016-DNA2, Class M3(a). . . . . . . . . . . . . . . . . . . . . . . . . 7.14% 10/25/28 28,845 32,523,096 1.6Series 2016-DNA3, Class B(a) . . . . . . . . . . . . . . . . . . . . . . . . . . 13.74% 12/25/28 498 680,031 0.0Series 2016-DNA3, Class M3(a). . . . . . . . . . . . . . . . . . . . . . . . . 7.49% 12/25/28 1,075 1,228,959 0.1Series 2016-DNA4, Class B(a) . . . . . . . . . . . . . . . . . . . . . . . . . . 11.09% 3/25/29 999 1,217,715 0.1Series 2016-HQA1, Class B(a) . . . . . . . . . . . . . . . . . . . . . . . . . . 15.24% 9/25/28 2,492 3,545,289 0.2Series 2016-HQA1, Class M3(a). . . . . . . . . . . . . . . . . . . . . . . . . 8.84% 9/25/28 2,758 3,325,017 0.2Series 2016-HQA2, Class B(a) . . . . . . . . . . . . . . . . . . . . . . . . . . 13.99% 11/25/28 499 674,035 0.0Series 2016-HQA2, Class M3(a). . . . . . . . . . . . . . . . . . . . . . . . . 7.64% 11/25/28 4,424 5,204,010 0.3Series 2016-HQA3, Class B(a) . . . . . . . . . . . . . . . . . . . . . . . . . . 11.49% 3/25/29 1,496 1,784,131 0.1Series 2017-DNA1, Class B1(a) . . . . . . . . . . . . . . . . . . . . . . . . . 7.44% 7/25/29 13,125 14,782,786 0.7Series 2017-DNA2, Class B1(a) . . . . . . . . . . . . . . . . . . . . . . . . . 7.64% 10/25/29 15,088 17,070,658 0.8Series 2017-DNA3, Class B1(a) . . . . . . . . . . . . . . . . . . . . . . . . . 6.94% 3/25/30 17,940 19,258,552 0.9Series 2017-HQA1, Class M2(a). . . . . . . . . . . . . . . . . . . . . . . . . 6.04% 8/25/29 26,595 28,775,394 1.4Series 2017-HQA2, Class M2(a). . . . . . . . . . . . . . . . . . . . . . . . . 5.14% 12/25/29 3,000 3,096,698 0.2Series 2017-HQA3, Class M2(a). . . . . . . . . . . . . . . . . . . . . . . . . 4.84% 4/25/30 5,586 5,679,411 0.3
Federal National Mortgage Association Connecticut Avenue Securities
Series 2013-C01, Class M2(a). . . . . . . . . . . . . . . . . . . . . . . . . . . 7.74% 10/25/23 6,371 7,202,468 0.4Series 2014-C04, Class 2M2(a). . . . . . . . . . . . . . . . . . . . . . . . . . 7.49% 11/25/24 15,037 16,760,561 0.8Series 2015-C01, Class 1M2(a). . . . . . . . . . . . . . . . . . . . . . . . . . 6.79% 2/25/25 19,842 21,673,113 1.1Series 2015-C02, Class 1M2(a). . . . . . . . . . . . . . . . . . . . . . . . . . 6.49% 5/25/25 20,515 22,316,008 1.1Series 2015-C02, Class 2M2(a). . . . . . . . . . . . . . . . . . . . . . . . . . 6.49% 5/25/25 9,766 10,469,820 0.5Series 2015-C03, Class 1M2(a). . . . . . . . . . . . . . . . . . . . . . . . . . 7.49% 7/25/25 13,010 14,625,779 0.7Series 2015-C03, Class 2M2(a). . . . . . . . . . . . . . . . . . . . . . . . . . 7.49% 7/25/25 19,622 21,735,355 1.1Series 2015-C04, Class 1M2(a). . . . . . . . . . . . . . . . . . . . . . . . . . 8.19% 4/25/28 22,762 26,110,456 1.3Series 2015-C04, Class 2M2(a). . . . . . . . . . . . . . . . . . . . . . . . . . 8.04% 4/25/28 18,901 21,259,050 1.0Series 2016-C01, Class 1B(a) . . . . . . . . . . . . . . . . . . . . . . . . . . . 14.24% 8/25/28 2,165 3,070,650 0.2Series 2016-C01, Class 1M2(a). . . . . . . . . . . . . . . . . . . . . . . . . . 9.24% 8/25/28 24,665 28,870,224 1.4Series 2016-C01, Class 2M2(a). . . . . . . . . . . . . . . . . . . . . . . . . . 9.44% 8/25/28 22,724 26,365,288 1.3Series 2016-C02, Class 1B(a) . . . . . . . . . . . . . . . . . . . . . . . . . . . 14.74% 9/25/28 2,573 3,697,733 0.2
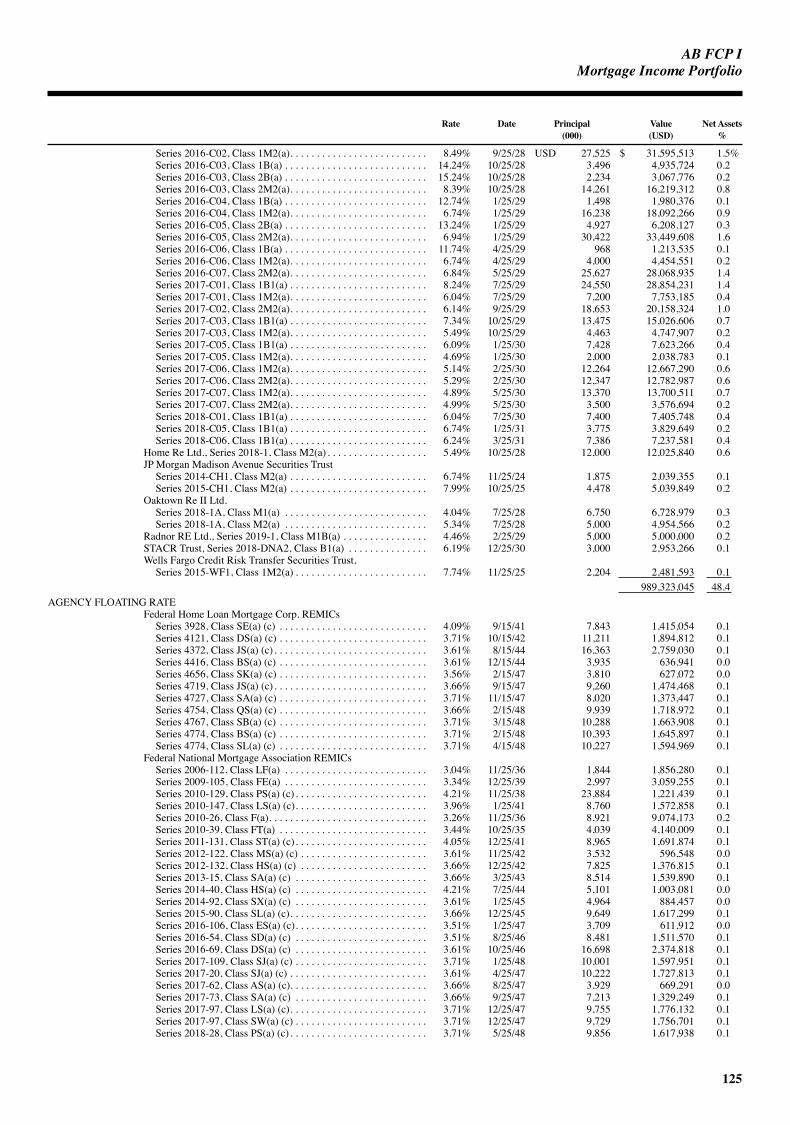
AB FCP I
125
MortgageIncomePortfolio
Rate Date Principal Value Net Assets (000) (USD) %
Series 2016-C02, Class 1M2(a). . . . . . . . . . . . . . . . . . . . . . . . . . 8.49% 9/25/28 USD 27,525 $ 31,595,513 1.5%Series 2016-C03, Class 1B(a) . . . . . . . . . . . . . . . . . . . . . . . . . . . 14.24% 10/25/28 3,496 4,935,724 0.2Series 2016-C03, Class 2B(a) . . . . . . . . . . . . . . . . . . . . . . . . . . . 15.24% 10/25/28 2,234 3,067,776 0.2Series 2016-C03, Class 2M2(a). . . . . . . . . . . . . . . . . . . . . . . . . . 8.39% 10/25/28 14,261 16,219,312 0.8Series 2016-C04, Class 1B(a) . . . . . . . . . . . . . . . . . . . . . . . . . . . 12.74% 1/25/29 1,498 1,980,376 0.1Series 2016-C04, Class 1M2(a). . . . . . . . . . . . . . . . . . . . . . . . . . 6.74% 1/25/29 16,238 18,092,266 0.9Series 2016-C05, Class 2B(a) . . . . . . . . . . . . . . . . . . . . . . . . . . . 13.24% 1/25/29 4,927 6,208,127 0.3Series 2016-C05, Class 2M2(a). . . . . . . . . . . . . . . . . . . . . . . . . . 6.94% 1/25/29 30,422 33,449,608 1.6Series 2016-C06, Class 1B(a) . . . . . . . . . . . . . . . . . . . . . . . . . . . 11.74% 4/25/29 968 1,213,535 0.1Series 2016-C06, Class 1M2(a). . . . . . . . . . . . . . . . . . . . . . . . . . 6.74% 4/25/29 4,000 4,454,551 0.2Series 2016-C07, Class 2M2(a). . . . . . . . . . . . . . . . . . . . . . . . . . 6.84% 5/25/29 25,627 28,068,935 1.4Series 2017-C01, Class 1B1(a) . . . . . . . . . . . . . . . . . . . . . . . . . . 8.24% 7/25/29 24,550 28,854,231 1.4Series 2017-C01, Class 1M2(a). . . . . . . . . . . . . . . . . . . . . . . . . . 6.04% 7/25/29 7,200 7,753,185 0.4Series 2017-C02, Class 2M2(a). . . . . . . . . . . . . . . . . . . . . . . . . . 6.14% 9/25/29 18,653 20,158,324 1.0Series 2017-C03, Class 1B1(a) . . . . . . . . . . . . . . . . . . . . . . . . . . 7.34% 10/25/29 13,475 15,026,606 0.7Series 2017-C03, Class 1M2(a). . . . . . . . . . . . . . . . . . . . . . . . . . 5.49% 10/25/29 4,463 4,747,907 0.2Series 2017-C05, Class 1B1(a) . . . . . . . . . . . . . . . . . . . . . . . . . . 6.09% 1/25/30 7,428 7,623,266 0.4Series 2017-C05, Class 1M2(a). . . . . . . . . . . . . . . . . . . . . . . . . . 4.69% 1/25/30 2,000 2,038,783 0.1Series 2017-C06, Class 1M2(a). . . . . . . . . . . . . . . . . . . . . . . . . . 5.14% 2/25/30 12,264 12,667,290 0.6Series 2017-C06, Class 2M2(a). . . . . . . . . . . . . . . . . . . . . . . . . . 5.29% 2/25/30 12,347 12,782,987 0.6Series 2017-C07, Class 1M2(a). . . . . . . . . . . . . . . . . . . . . . . . . . 4.89% 5/25/30 13,370 13,700,511 0.7Series 2017-C07, Class 2M2(a). . . . . . . . . . . . . . . . . . . . . . . . . . 4.99% 5/25/30 3,500 3,576,694 0.2Series 2018-C01, Class 1B1(a) . . . . . . . . . . . . . . . . . . . . . . . . . . 6.04% 7/25/30 7,400 7,405,748 0.4Series 2018-C05, Class 1B1(a) . . . . . . . . . . . . . . . . . . . . . . . . . . 6.74% 1/25/31 3,775 3,829,649 0.2Series 2018-C06, Class 1B1(a) . . . . . . . . . . . . . . . . . . . . . . . . . . 6.24% 3/25/31 7,386 7,237,581 0.4
Home Re Ltd., Series 2018-1, Class M2(a) . . . . . . . . . . . . . . . . . . . 5.49% 10/25/28 12,000 12,025,840 0.6JP Morgan Madison Avenue Securities Trust
Series 2014-CH1, Class M2(a) . . . . . . . . . . . . . . . . . . . . . . . . . . 6.74% 11/25/24 1,875 2,039,355 0.1Series 2015-CH1, Class M2(a) . . . . . . . . . . . . . . . . . . . . . . . . . . 7.99% 10/25/25 4,478 5,039,849 0.2
Oaktown Re II Ltd.Series 2018-1A, Class M1(a) . . . . . . . . . . . . . . . . . . . . . . . . . . . 4.04% 7/25/28 6,750 6,728,979 0.3Series 2018-1A, Class M2(a) . . . . . . . . . . . . . . . . . . . . . . . . . . . 5.34% 7/25/28 5,000 4,954,566 0.2
Radnor RE Ltd., Series 2019-1, Class M1B(a) . . . . . . . . . . . . . . . . 4.46% 2/25/29 5,000 5,000,000 0.2STACR Trust, Series 2018-DNA2, Class B1(a) . . . . . . . . . . . . . . . 6.19% 12/25/30 3,000 2,953,266 0.1Wells Fargo Credit Risk Transfer Securities Trust,
Series 2015-WF1, Class 1M2(a) . . . . . . . . . . . . . . . . . . . . . . . . . 7.74% 11/25/25 2,204 2,481,593 0.1 989,323,045 48.4
AGENCY FLOATING RATEFederal Home Loan Mortgage Corp. REMICs
Series 3928, Class SE(a) (c) . . . . . . . . . . . . . . . . . . . . . . . . . . . . 4.09% 9/15/41 7,843 1,415,054 0.1Series 4121, Class DS(a) (c) . . . . . . . . . . . . . . . . . . . . . . . . . . . . 3.71% 10/15/42 11,211 1,894,812 0.1Series 4372, Class JS(a) (c) . . . . . . . . . . . . . . . . . . . . . . . . . . . . . 3.61% 8/15/44 16,363 2,759,030 0.1Series 4416, Class BS(a) (c) . . . . . . . . . . . . . . . . . . . . . . . . . . . . 3.61% 12/15/44 3,935 636,941 0.0Series 4656, Class SK(a) (c) . . . . . . . . . . . . . . . . . . . . . . . . . . . . 3.56% 2/15/47 3,810 627,072 0.0Series 4719, Class JS(a) (c) . . . . . . . . . . . . . . . . . . . . . . . . . . . . . 3.66% 9/15/47 9,260 1,474,468 0.1Series 4727, Class SA(a) (c) . . . . . . . . . . . . . . . . . . . . . . . . . . . . 3.71% 11/15/47 8,020 1,373,447 0.1Series 4754, Class QS(a) (c) . . . . . . . . . . . . . . . . . . . . . . . . . . . . 3.66% 2/15/48 9,939 1,718,972 0.1Series 4767, Class SB(a) (c) . . . . . . . . . . . . . . . . . . . . . . . . . . . . 3.71% 3/15/48 10,288 1,663,908 0.1Series 4774, Class BS(a) (c) . . . . . . . . . . . . . . . . . . . . . . . . . . . . 3.71% 2/15/48 10,393 1,645,897 0.1Series 4774, Class SL(a) (c) . . . . . . . . . . . . . . . . . . . . . . . . . . . . 3.71% 4/15/48 10,227 1,594,969 0.1
Federal National Mortgage Association REMICsSeries 2006-112, Class LF(a) . . . . . . . . . . . . . . . . . . . . . . . . . . . 3.04% 11/25/36 1,844 1,856,280 0.1Series 2009-105, Class FE(a) . . . . . . . . . . . . . . . . . . . . . . . . . . . 3.34% 12/25/39 2,997 3,059,255 0.1Series 2010-129, Class PS(a) (c) . . . . . . . . . . . . . . . . . . . . . . . . . 4.21% 11/25/38 23,884 1,221,439 0.1Series 2010-147, Class LS(a) (c). . . . . . . . . . . . . . . . . . . . . . . . . 3.96% 1/25/41 8,760 1,572,858 0.1Series 2010-26, Class F(a). . . . . . . . . . . . . . . . . . . . . . . . . . . . . . 3.26% 11/25/36 8,921 9,074,173 0.2Series 2010-39, Class FT(a) . . . . . . . . . . . . . . . . . . . . . . . . . . . . 3.44% 10/25/35 4,039 4,140,009 0.1Series 2011-131, Class ST(a) (c). . . . . . . . . . . . . . . . . . . . . . . . . 4.05% 12/25/41 8,965 1,691,874 0.1Series 2012-122, Class MS(a) (c) . . . . . . . . . . . . . . . . . . . . . . . . 3.61% 11/25/42 3,532 596,548 0.0Series 2012-132, Class HS(a) (c) . . . . . . . . . . . . . . . . . . . . . . . . 3.66% 12/25/42 7,825 1,376,815 0.1Series 2013-15, Class SA(a) (c) . . . . . . . . . . . . . . . . . . . . . . . . . 3.66% 3/25/43 8,514 1,539,890 0.1Series 2014-40, Class HS(a) (c) . . . . . . . . . . . . . . . . . . . . . . . . . 4.21% 7/25/44 5,101 1,003,081 0.0Series 2014-92, Class SX(a) (c) . . . . . . . . . . . . . . . . . . . . . . . . . 3.61% 1/25/45 4,964 884,457 0.0Series 2015-90, Class SL(a) (c). . . . . . . . . . . . . . . . . . . . . . . . . . 3.66% 12/25/45 9,649 1,617,299 0.1Series 2016-106, Class ES(a) (c). . . . . . . . . . . . . . . . . . . . . . . . . 3.51% 1/25/47 3,709 611,912 0.0Series 2016-54, Class SD(a) (c) . . . . . . . . . . . . . . . . . . . . . . . . . 3.51% 8/25/46 8,481 1,511,570 0.1Series 2016-69, Class DS(a) (c) . . . . . . . . . . . . . . . . . . . . . . . . . 3.61% 10/25/46 16,698 2,374,818 0.1Series 2017-109, Class SJ(a) (c) . . . . . . . . . . . . . . . . . . . . . . . . . 3.71% 1/25/48 10,001 1,597,951 0.1Series 2017-20, Class SJ(a) (c) . . . . . . . . . . . . . . . . . . . . . . . . . . 3.61% 4/25/47 10,222 1,727,813 0.1Series 2017-62, Class AS(a) (c). . . . . . . . . . . . . . . . . . . . . . . . . . 3.66% 8/25/47 3,929 669,291 0.0Series 2017-73, Class SA(a) (c) . . . . . . . . . . . . . . . . . . . . . . . . . 3.66% 9/25/47 7,213 1,329,249 0.1Series 2017-97, Class LS(a) (c). . . . . . . . . . . . . . . . . . . . . . . . . . 3.71% 12/25/47 9,755 1,776,132 0.1Series 2017-97, Class SW(a) (c) . . . . . . . . . . . . . . . . . . . . . . . . . 3.71% 12/25/47 9,729 1,756,701 0.1Series 2018-28, Class PS(a) (c) . . . . . . . . . . . . . . . . . . . . . . . . . . 3.71% 5/25/48 9,856 1,617,938 0.1

AB FCP I
126
Portfolio of investments (continued) MortgageIncomePortfolio
Rate Date Principal Value Net Assets (000) (USD) %
Series 2018-28, Class SB(a) (c). . . . . . . . . . . . . . . . . . . . . . . . . . 3.71% 5/25/48 USD 10,276 $ 1,772,229 0.1%Series 2018-30, Class SA(a) (c) . . . . . . . . . . . . . . . . . . . . . . . . . 3.71% 5/25/48 10,101 1,645,815 0.1Series 2018-45, Class SM(a) (c) . . . . . . . . . . . . . . . . . . . . . . . . . 3.71% 6/25/48 11,899 2,174,473 0.1Series 2018-57, Class SL(a) (c). . . . . . . . . . . . . . . . . . . . . . . . . . 3.71% 8/25/48 13,454 2,218,506 0.1Series 2018-58, Class SA(a) (c) . . . . . . . . . . . . . . . . . . . . . . . . . 3.71% 8/25/48 5,714 987,910 0.0Series 2018-59, Class HS(a) (c) . . . . . . . . . . . . . . . . . . . . . . . . . 3.71% 8/25/48 13,306 2,067,051 0.1
Government National Mortgage AssociationSeries 2015-3, Class DS(a) (c) . . . . . . . . . . . . . . . . . . . . . . . . . . 3.12% 11/20/41 12,253 1,179,948 0.1Series 2017-115, Class SA(a) (c) . . . . . . . . . . . . . . . . . . . . . . . . 3.72% 7/20/47 8,112 1,370,785 0.1Series 2017-134, Class MS(a) (c) . . . . . . . . . . . . . . . . . . . . . . . . 3.72% 9/20/47 7,214 1,360,109 0.1Series 2017-134, Class SE(a) (c). . . . . . . . . . . . . . . . . . . . . . . . . 3.72% 9/20/47 8,791 1,398,123 0.1Series 2017-139, Class SA(a) (c) . . . . . . . . . . . . . . . . . . . . . . . . 3.72% 8/20/47 7,136 1,181,208 0.1Series 2017-52, Class SN(a) (c) . . . . . . . . . . . . . . . . . . . . . . . . . 3.67% 4/20/47 8,786 1,290,704 0.1
80,058,784 3.9NON-AGENCY FIXED RATE
Alternative Loan TrustSeries 2005-20CB, Class 1A3 . . . . . . . . . . . . . . . . . . . . . . . . . . . 5.50% 7/25/35 177 163,759 0.0Series 2005-20CB, Class 2A7 . . . . . . . . . . . . . . . . . . . . . . . . . . . 5.50% 7/25/35 167 148,585 0.0Series 2005-28CB, Class 1A7 . . . . . . . . . . . . . . . . . . . . . . . . . . . 5.50% 8/25/35 179 170,946 0.0Series 2005-50CB, Class 1A1 . . . . . . . . . . . . . . . . . . . . . . . . . . . 5.50% 11/25/35 2,128 1,966,372 0.1Series 2005-57CB, Class 4A3 . . . . . . . . . . . . . . . . . . . . . . . . . . . 5.50% 12/25/35 1,138 959,890 0.1Series 2005-57CB, Class 4A5 . . . . . . . . . . . . . . . . . . . . . . . . . . . 5.50% 12/25/35 684 576,900 0.0Series 2005-65CB, Class 1A13 . . . . . . . . . . . . . . . . . . . . . . . . . . 6.00% 1/25/36 1,328 1,245,267 0.1Series 2005-65CB, Class 1A4 . . . . . . . . . . . . . . . . . . . . . . . . . . . 5.50% 1/25/36 1,709 1,557,776 0.1Series 2005-70CB, Class A4 . . . . . . . . . . . . . . . . . . . . . . . . . . . . 5.50% 12/25/35 1,613 1,459,406 0.1Series 2005-86CB, Class A11 . . . . . . . . . . . . . . . . . . . . . . . . . . . 5.50% 2/25/36 338 288,739 0.0Series 2005-86CB, Class A8 . . . . . . . . . . . . . . . . . . . . . . . . . . . . 5.50% 2/25/36 242 209,806 0.0Series 2006-11CB, Class 1A2 . . . . . . . . . . . . . . . . . . . . . . . . . . . 6.00% 5/25/36 1,320 1,091,060 0.1Series 2006-28CB, Class A14 . . . . . . . . . . . . . . . . . . . . . . . . . . . 6.25% 10/25/36 590 468,901 0.0Series 2006-28CB, Class A18 . . . . . . . . . . . . . . . . . . . . . . . . . . . 6.00% 10/25/36 998 774,821 0.0Series 2006-32CB, Class A10 . . . . . . . . . . . . . . . . . . . . . . . . . . . 6.00% 11/25/36 743 620,086 0.0Series 2006-32CB, Class A21 . . . . . . . . . . . . . . . . . . . . . . . . . . . 5.50% 11/25/36 235 187,430 0.0Series 2006-32CB, Class A9 . . . . . . . . . . . . . . . . . . . . . . . . . . . . 6.00% 11/25/36 714 595,797 0.0Series 2006-7CB, Class 1A3 . . . . . . . . . . . . . . . . . . . . . . . . . . . . 6.25% 5/25/36 1,594 1,269,607 0.1Series 2006-J4, Class 2A1. . . . . . . . . . . . . . . . . . . . . . . . . . . . . . 6.00% 7/25/36 996 821,864 0.0Series 2006-J4, Class 2A2. . . . . . . . . . . . . . . . . . . . . . . . . . . . . . 6.00% 7/25/36 2,002 1,652,305 0.1Series 2006-J4, Class 2A9. . . . . . . . . . . . . . . . . . . . . . . . . . . . . . 6.00% 7/25/36 1,645 1,357,432 0.1
Chase Mortgage Finance Trust, Series 2007-S5, Class 1A17 . . . . . . . . . . . . . . . . . . . . . . . . . . . . . . . . . . . . . . . . . 6.00% 7/25/37 2,481 1,849,174 0.1
CitiMortgage Alternative Loan Trust, Series 2007-A6, Class 1A11. . . . . . . . . . . . . . . . . . . . . . . . . . . . . . . . . . . . . . . . . . 6.00% 6/25/37 205 198,074 0.0
Countrywide Home Loan Mortgage Pass-Through TrustSeries 2005-24, Class A1. . . . . . . . . . . . . . . . . . . . . . . . . . . . . . . 5.50% 11/25/35 1,010 869,051 0.0Series 2006-10, Class 1A8 . . . . . . . . . . . . . . . . . . . . . . . . . . . . . 6.00% 5/25/36 2,092 1,696,814 0.1Series 2006-21, Class A11. . . . . . . . . . . . . . . . . . . . . . . . . . . . . . 5.75% 2/25/37 889 739,120 0.0Series 2006-21, Class A13. . . . . . . . . . . . . . . . . . . . . . . . . . . . . . 6.00% 2/25/37 2,894 2,458,851 0.1Series 2006-9, Class A11. . . . . . . . . . . . . . . . . . . . . . . . . . . . . . . 6.00% 5/25/36 1,826 1,489,459 0.1Series 2006-9, Class A2. . . . . . . . . . . . . . . . . . . . . . . . . . . . . . . . 6.00% 5/25/36 215 175,064 0.0Series 2007-11, Class A12. . . . . . . . . . . . . . . . . . . . . . . . . . . . . . 6.00% 8/25/37 1,432 1,124,661 0.1Series 2007-5, Class A2. . . . . . . . . . . . . . . . . . . . . . . . . . . . . . . . 5.75% 5/25/37 1,124 926,245 0.0
Credit Suisse Mortgage Trust, Series 2010-6R, Class 3A2 . . . . . . . . . . . . . . . . . . . . . . . . . . . . . . . . . . . . . . . . . . 5.88% 1/26/38 4,200 3,233,052 0.2
First Horizon Alternative Mortgage Securities TrustSeries 2005-FA8, Class 1A12 . . . . . . . . . . . . . . . . . . . . . . . . . . . 5.50% 11/25/35 173 140,796 0.0Series 2006-FA2, Class 1A3 . . . . . . . . . . . . . . . . . . . . . . . . . . . . 6.00% 5/25/36 298 222,749 0.0
GSR Mortgage Loan Trust, Series 2006-9F, Class 4A1 . . . . . . . . . 6.50% 10/25/36 208 166,980 0.0JP Morgan Alternative Loan Trust, Series 2006-S1,
Class 1A7 . . . . . . . . . . . . . . . . . . . . . . . . . . . . . . . . . . . . . . . . . . 5.75% 3/25/36 1,852 1,522,974 0.1JP Morgan Mortgage Trust
Series 2006-S4, Class A3 . . . . . . . . . . . . . . . . . . . . . . . . . . . . . . 6.00% 1/25/37 1,336 939,329 0.0Series 2006-S4, Class A5 . . . . . . . . . . . . . . . . . . . . . . . . . . . . . . 6.00% 1/25/37 709 511,530 0.0Series 2007-S3, Class 1A64 . . . . . . . . . . . . . . . . . . . . . . . . . . . . 7.50% 8/25/37 1,711 1,148,011 0.1
Morgan Stanley Mortgage Loan TrustSeries 2005-7, Class 3A1 . . . . . . . . . . . . . . . . . . . . . . . . . . . . . . 5.08% 11/25/35 1,559 1,316,604 0.1Series 2006-2, Class 5A1 . . . . . . . . . . . . . . . . . . . . . . . . . . . . . . 5.50% 2/25/36 2,000 1,652,984 0.1Series 2006-7, Class 4A4 . . . . . . . . . . . . . . . . . . . . . . . . . . . . . . 6.00% 6/25/36 687 571,751 0.0
New Century Alternative Mortgage Loan Trust, Series 2006-ALT1, Class AF5. . . . . . . . . . . . . . . . . . . . . . . . . . . 6.31% 7/25/36 2,849 1,367,107 0.1
Washington Mutual Mortgage Pass-Through Certificates Trust
Series 2005-9, Class 5A1 . . . . . . . . . . . . . . . . . . . . . . . . . . . . . . 5.50% 11/25/35 2,091 1,808,877 0.1Series 2005-9, Class 5A5 . . . . . . . . . . . . . . . . . . . . . . . . . . . . . . 5.50% 11/25/35 212 183,404 0.0
43,899,410 2.2

AB FCP I
127
MortgageIncomePortfolio
Rate Date Principal Value Net Assets (000) (USD) %
NON-AGENCY FLOATING RATEAlternative Loan Trust
Series 2005-19CB, Class A2(a) (d) . . . . . . . . . . . . . . . . . . . . . . . 11.46% 6/25/35 USD 129 $ 145,056 0.0%Series 2007-17CB, Class 1A6(a). . . . . . . . . . . . . . . . . . . . . . . . . 2.99% 8/25/37 3,930 2,884,915 0.1
Bear Stearns Asset Backed Securities I Trust . . . . . . . . . . . . . . . . .Series 2005-AC7, Class A2(a) (d) . . . . . . . . . . . . . . . . . . . . . . . . 13.06% 10/25/35 424 417,575 0.0Series 2005-AC9, Class A4(a) (d) . . . . . . . . . . . . . . . . . . . . . . . . 12.95% 12/25/35 424 390,408 0.0
Chase Mortgage Trust, Series 2016-1, Class M4(b) . . . . . . . . . . . . 3.75% 4/25/45 2,249 2,169,911 0.1CSFB Mortgage-Backed Pass-Through Certificates,
Series 2005-9, Class 4A1(a) (d) . . . . . . . . . . . . . . . . . . . . . . . . . 12.68% 10/25/35 140 175,897 0.0JP Morgan Resecuritization Trust, Series 2010-1, Class 2A11(a) . . 7.20% 1/26/37 2,138 1,388,662 0.1Lehman Mortgage Trust, Series 2007-1, Class 3A2(a) (c) . . . . . . . 4.76% 2/25/37 889 217,075 0.0Structured Adjustable Rate Mortgage Loan Trust,
Series 2007-4, Class 1A1(a) . . . . . . . . . . . . . . . . . . . . . . . . . . . . 2.73% 5/25/37 3,568 3,270,079 0.2 11,059,578 0.5
AGENCY FIXED RATEFederal National Mortgage Association REMICs
Series 2015-30, Class EI(e) . . . . . . . . . . . . . . . . . . . . . . . . . . . . . 5.00% 5/25/45 1,122 222,922 0.0Series 2016-64, Class BI(e). . . . . . . . . . . . . . . . . . . . . . . . . . . . . 5.00% 9/25/46 10,263 1,997,389 0.1
2,220,311 0.1 1,126,561,128 55.1
COMMERCIAL MORTGAGE-BACKED SECURITIESNON-AGENCY FIXED RATE CMBS
Banc of America Commercial Mortgage Trust, Series 2015-UBS7, Class XA(e) . . . . . . . . . . . . . . . . . . . . . . . . . 0.85% 9/15/48 63,523 2,737,666 0.1
CFCRE Commercial Mortgage Trust, Series 2011-C1, Class E . . . . . . . . . . . . . . . . . . . . . . . . . . . . . . . 6.07% 4/15/44 298 249,878 0.0
CGBAM Commercial Mortgage Trust, Series 2015-SMRT, Class F. . . . . . . . . . . . . . . . . . . . . . . . . . . . . 3.79% 4/10/28 2,191 2,208,248 0.1
Citigroup Commercial Mortgage TrustSeries 2012-GC8, Class XA(e) . . . . . . . . . . . . . . . . . . . . . . . . . . 1.79% 9/10/45 19,996 952,373 0.1Series 2013-GC11, Class D. . . . . . . . . . . . . . . . . . . . . . . . . . . . . 4.42% 4/10/46 1,056 1,054,075 0.1Series 2013-GC15, Class XA(e) . . . . . . . . . . . . . . . . . . . . . . . . . 0.92% 9/10/46 34,281 1,223,244 0.1Series 2013-GC17, Class D. . . . . . . . . . . . . . . . . . . . . . . . . . . . . 5.11% 11/10/46 2,430 2,421,437 0.1Series 2014-GC19, Class D. . . . . . . . . . . . . . . . . . . . . . . . . . . . . 5.09% 3/10/47 2,800 2,902,671 0.1Series 2015-GC27, Class XA(e) . . . . . . . . . . . . . . . . . . . . . . . . . 1.38% 2/10/48 68,052 4,287,253 0.2Series 2015-GC29, Class XA(e) . . . . . . . . . . . . . . . . . . . . . . . . . 1.11% 4/10/48 8,217 386,786 0.0Series 2016-C3, Class XA(e) . . . . . . . . . . . . . . . . . . . . . . . . . . . 1.19% 11/15/49 104,012 6,392,929 0.3Series 2016-P3, Class XA(e). . . . . . . . . . . . . . . . . . . . . . . . . . . . 1.70% 4/15/49 49,467 4,209,959 0.2Series 2017-P8, Class XA(e). . . . . . . . . . . . . . . . . . . . . . . . . . . . 0.93% 9/15/50 38,742 2,393,969 0.1
Citigroup/Deutsche Bank Mortgage Trust, Series 2017-CD3, Class XA(e) . . . . . . . . . . . . . . . . . . . . . . . . . . 1.03% 2/10/50 101,090 6,404,572 0.3
Commercial Mortgage TrustSeries 2010-C1, Class D . . . . . . . . . . . . . . . . . . . . . . . . . . . . . . . 6.13% 7/10/46 2,500 2,562,207 0.1Series 2010-C1, Class F . . . . . . . . . . . . . . . . . . . . . . . . . . . . . . . 4.00% 7/10/46 3,780 3,553,601 0.2Series 2012-CR1, Class XA(e) . . . . . . . . . . . . . . . . . . . . . . . . . . 1.87% 5/15/45 15,890 790,236 0.0Series 2012-CR3, Class E . . . . . . . . . . . . . . . . . . . . . . . . . . . . . . 4.75% 10/15/45 2,173 1,993,541 0.1Series 2012-CR3, Class XA(e) . . . . . . . . . . . . . . . . . . . . . . . . . . 1.87% 10/15/45 3,183 176,882 0.0Series 2012-CR5, Class XA(e) . . . . . . . . . . . . . . . . . . . . . . . . . . 1.55% 12/10/45 15,795 761,171 0.0Series 2013-LC6, Class D . . . . . . . . . . . . . . . . . . . . . . . . . . . . . . 4.26% 1/10/46 640 639,549 0.0Series 2013-LC6, Class XA(e) . . . . . . . . . . . . . . . . . . . . . . . . . . 1.36% 1/10/46 19,575 840,577 0.0Series 2014-CR15, Class XA(e) . . . . . . . . . . . . . . . . . . . . . . . . . 1.04% 2/10/47 105,885 3,491,871 0.2Series 2014-CR16, Class D . . . . . . . . . . . . . . . . . . . . . . . . . . . . . 4.91% 4/10/47 1,841 1,724,347 0.1Series 2014-CR16, Class XA(e) . . . . . . . . . . . . . . . . . . . . . . . . . 1.09% 4/10/47 146,501 5,435,393 0.3Series 2014-CR20, Class XA(e) . . . . . . . . . . . . . . . . . . . . . . . . . 1.12% 11/10/47 9,658 422,779 0.0Series 2014-UBS2, Class D. . . . . . . . . . . . . . . . . . . . . . . . . . . . . 5.00% 3/10/47 1,250 1,126,865 0.1Series 2015-CR22, Class XA(e) . . . . . . . . . . . . . . . . . . . . . . . . . 0.95% 3/10/48 19,588 742,117 0.0Series 2015-CR27, Class XA(e) . . . . . . . . . . . . . . . . . . . . . . . . . 1.12% 10/10/48 108,180 5,336,549 0.3Series 2015-LC19, Class XA(e) . . . . . . . . . . . . . . . . . . . . . . . . . 1.17% 2/10/48 53,394 2,846,641 0.1Series 2015-LC21, Class XA(e) . . . . . . . . . . . . . . . . . . . . . . . . . 0.77% 7/10/48 64,548 2,127,264 0.1Series 2016-DC2, Class XA(e) . . . . . . . . . . . . . . . . . . . . . . . . . . 1.03% 2/10/49 58,280 3,143,801 0.2
CSAIL Commercial Mortgage Trust, Series 2016-C5, Class XA(e) . . . . . . . . . . . . . . . . . . . . . . . . . . . 1.02% 11/15/48 97,365 4,414,453 0.2
DBUBS Mortgage Trust, Series 2011-LC2A, Class D . . . . . . . . . . 5.53% 7/10/44 1,500 1,552,131 0.1Grantor Trust JPMBB, Series 2014-C24(f) . . . . . . . . . . . . . . . . . . . 4.00% 11/15/47 210 5,194,143 0.2GS Mortgage Securities Corp. II,
Series 2013-GC10, Class XA(e) . . . . . . . . . . . . . . . . . . . . . . . . . 1.52% 2/10/46 25,387 1,254,862 0.1GS Mortgage Securities Trust
Series 2011-GC5, Class D. . . . . . . . . . . . . . . . . . . . . . . . . . . . . . 5.39% 8/10/44 2,416 2,333,064 0.1Series 2013-GC13, Class D. . . . . . . . . . . . . . . . . . . . . . . . . . . . . 4.08% 7/10/46 2,190 2,073,084 0.1Series 2014-GC18, Class D. . . . . . . . . . . . . . . . . . . . . . . . . . . . . 4.99% 1/10/47 2,100 1,887,848 0.1Series 2014-GC22, Class D. . . . . . . . . . . . . . . . . . . . . . . . . . . . . 4.69% 6/10/47 2,069 1,897,525 0.1Series 2014-GC22, Class XA(e) . . . . . . . . . . . . . . . . . . . . . . . . . 0.99% 6/10/47 8,036 294,561 0.0
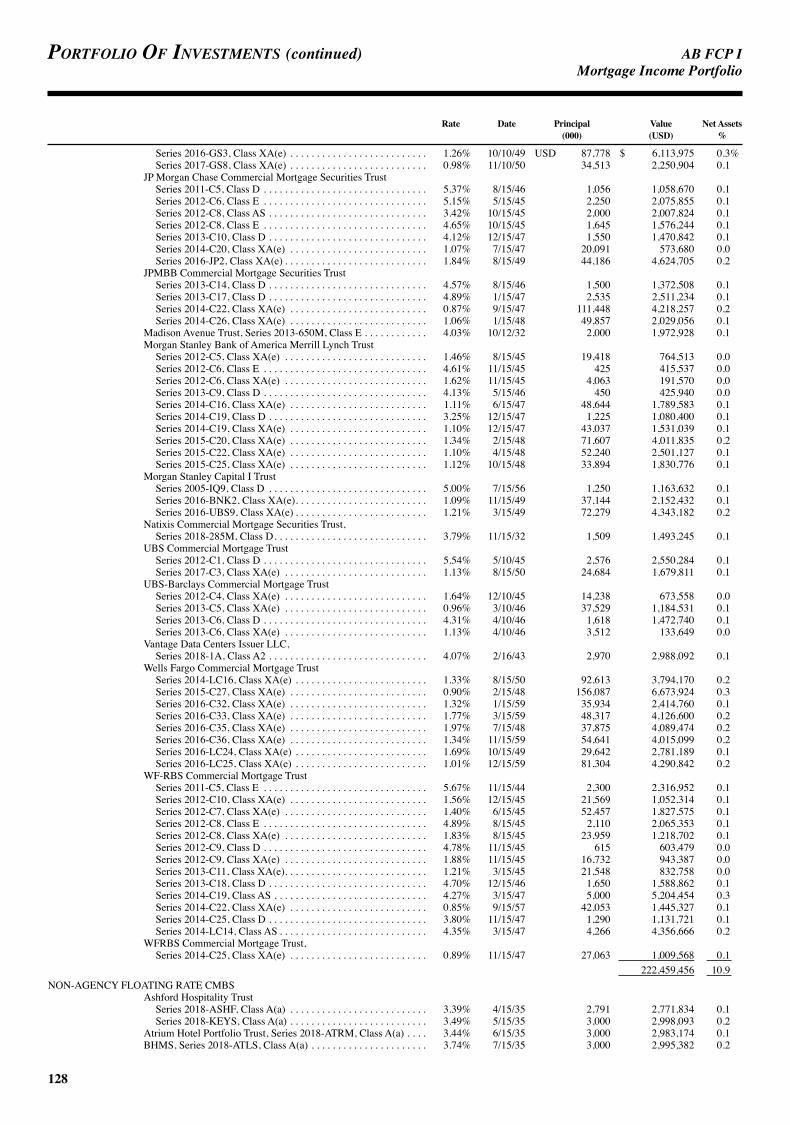
AB FCP I
128
Portfolio of investments (continued) MortgageIncomePortfolio
Rate Date Principal Value Net Assets (000) (USD) %
Series 2016-GS3, Class XA(e) . . . . . . . . . . . . . . . . . . . . . . . . . . 1.26% 10/10/49 USD 87,778 $ 6,113,975 0.3%Series 2017-GS8, Class XA(e) . . . . . . . . . . . . . . . . . . . . . . . . . . 0.98% 11/10/50 34,513 2,250,904 0.1
JP Morgan Chase Commercial Mortgage Securities TrustSeries 2011-C5, Class D . . . . . . . . . . . . . . . . . . . . . . . . . . . . . . . 5.37% 8/15/46 1,056 1,058,670 0.1Series 2012-C6, Class E . . . . . . . . . . . . . . . . . . . . . . . . . . . . . . . 5.15% 5/15/45 2,250 2,075,855 0.1Series 2012-C8, Class AS . . . . . . . . . . . . . . . . . . . . . . . . . . . . . . 3.42% 10/15/45 2,000 2,007,824 0.1Series 2012-C8, Class E . . . . . . . . . . . . . . . . . . . . . . . . . . . . . . . 4.65% 10/15/45 1,645 1,576,244 0.1Series 2013-C10, Class D . . . . . . . . . . . . . . . . . . . . . . . . . . . . . . 4.12% 12/15/47 1,550 1,470,842 0.1Series 2014-C20, Class XA(e) . . . . . . . . . . . . . . . . . . . . . . . . . . 1.07% 7/15/47 20,091 573,680 0.0Series 2016-JP2, Class XA(e) . . . . . . . . . . . . . . . . . . . . . . . . . . . 1.84% 8/15/49 44,186 4,624,705 0.2
JPMBB Commercial Mortgage Securities TrustSeries 2013-C14, Class D . . . . . . . . . . . . . . . . . . . . . . . . . . . . . . 4.57% 8/15/46 1,500 1,372,508 0.1Series 2013-C17, Class D . . . . . . . . . . . . . . . . . . . . . . . . . . . . . . 4.89% 1/15/47 2,535 2,511,234 0.1Series 2014-C22, Class XA(e) . . . . . . . . . . . . . . . . . . . . . . . . . . 0.87% 9/15/47 111,448 4,218,257 0.2Series 2014-C26, Class XA(e) . . . . . . . . . . . . . . . . . . . . . . . . . . 1.06% 1/15/48 49,857 2,029,056 0.1
Madison Avenue Trust, Series 2013-650M, Class E . . . . . . . . . . . . 4.03% 10/12/32 2,000 1,972,928 0.1Morgan Stanley Bank of America Merrill Lynch Trust
Series 2012-C5, Class XA(e) . . . . . . . . . . . . . . . . . . . . . . . . . . . 1.46% 8/15/45 19,418 764,513 0.0Series 2012-C6, Class E . . . . . . . . . . . . . . . . . . . . . . . . . . . . . . . 4.61% 11/15/45 425 415,537 0.0Series 2012-C6, Class XA(e) . . . . . . . . . . . . . . . . . . . . . . . . . . . 1.62% 11/15/45 4,063 191,570 0.0Series 2013-C9, Class D . . . . . . . . . . . . . . . . . . . . . . . . . . . . . . . 4.13% 5/15/46 450 425,940 0.0Series 2014-C16, Class XA(e) . . . . . . . . . . . . . . . . . . . . . . . . . . 1.11% 6/15/47 48,644 1,789,583 0.1Series 2014-C19, Class D . . . . . . . . . . . . . . . . . . . . . . . . . . . . . . 3.25% 12/15/47 1,225 1,080,400 0.1Series 2014-C19, Class XA(e) . . . . . . . . . . . . . . . . . . . . . . . . . . 1.10% 12/15/47 43,037 1,531,039 0.1Series 2015-C20, Class XA(e) . . . . . . . . . . . . . . . . . . . . . . . . . . 1.34% 2/15/48 71,607 4,011,835 0.2Series 2015-C22, Class XA(e) . . . . . . . . . . . . . . . . . . . . . . . . . . 1.10% 4/15/48 52,240 2,501,127 0.1Series 2015-C25, Class XA(e) . . . . . . . . . . . . . . . . . . . . . . . . . . 1.12% 10/15/48 33,894 1,830,776 0.1
Morgan Stanley Capital I TrustSeries 2005-IQ9, Class D . . . . . . . . . . . . . . . . . . . . . . . . . . . . . . 5.00% 7/15/56 1,250 1,163,632 0.1Series 2016-BNK2, Class XA(e). . . . . . . . . . . . . . . . . . . . . . . . . 1.09% 11/15/49 37,144 2,152,432 0.1Series 2016-UBS9, Class XA(e) . . . . . . . . . . . . . . . . . . . . . . . . . 1.21% 3/15/49 72,279 4,343,182 0.2
Natixis Commercial Mortgage Securities Trust, Series 2018-285M, Class D. . . . . . . . . . . . . . . . . . . . . . . . . . . . . 3.79% 11/15/32 1,509 1,493,245 0.1
UBS Commercial Mortgage TrustSeries 2012-C1, Class D . . . . . . . . . . . . . . . . . . . . . . . . . . . . . . . 5.54% 5/10/45 2,576 2,550,284 0.1Series 2017-C3, Class XA(e) . . . . . . . . . . . . . . . . . . . . . . . . . . . 1.13% 8/15/50 24,684 1,679,811 0.1
UBS-Barclays Commercial Mortgage TrustSeries 2012-C4, Class XA(e) . . . . . . . . . . . . . . . . . . . . . . . . . . . 1.64% 12/10/45 14,238 673,558 0.0Series 2013-C5, Class XA(e) . . . . . . . . . . . . . . . . . . . . . . . . . . . 0.96% 3/10/46 37,529 1,184,531 0.1Series 2013-C6, Class D . . . . . . . . . . . . . . . . . . . . . . . . . . . . . . . 4.31% 4/10/46 1,618 1,472,740 0.1Series 2013-C6, Class XA(e) . . . . . . . . . . . . . . . . . . . . . . . . . . . 1.13% 4/10/46 3,512 133,649 0.0
Vantage Data Centers Issuer LLC, Series 2018-1A, Class A2 . . . . . . . . . . . . . . . . . . . . . . . . . . . . . . 4.07% 2/16/43 2,970 2,988,092 0.1
Wells Fargo Commercial Mortgage TrustSeries 2014-LC16, Class XA(e) . . . . . . . . . . . . . . . . . . . . . . . . . 1.33% 8/15/50 92,613 3,794,170 0.2Series 2015-C27, Class XA(e) . . . . . . . . . . . . . . . . . . . . . . . . . . 0.90% 2/15/48 156,087 6,673,924 0.3Series 2016-C32, Class XA(e) . . . . . . . . . . . . . . . . . . . . . . . . . . 1.32% 1/15/59 35,934 2,414,760 0.1Series 2016-C33, Class XA(e) . . . . . . . . . . . . . . . . . . . . . . . . . . 1.77% 3/15/59 48,317 4,126,600 0.2Series 2016-C35, Class XA(e) . . . . . . . . . . . . . . . . . . . . . . . . . . 1.97% 7/15/48 37,875 4,089,474 0.2Series 2016-C36, Class XA(e) . . . . . . . . . . . . . . . . . . . . . . . . . . 1.34% 11/15/59 54,641 4,015,099 0.2Series 2016-LC24, Class XA(e) . . . . . . . . . . . . . . . . . . . . . . . . . 1.69% 10/15/49 29,642 2,781,189 0.1Series 2016-LC25, Class XA(e) . . . . . . . . . . . . . . . . . . . . . . . . . 1.01% 12/15/59 81,304 4,290,842 0.2
WF-RBS Commercial Mortgage TrustSeries 2011-C5, Class E . . . . . . . . . . . . . . . . . . . . . . . . . . . . . . . 5.67% 11/15/44 2,300 2,316,952 0.1Series 2012-C10, Class XA(e) . . . . . . . . . . . . . . . . . . . . . . . . . . 1.56% 12/15/45 21,569 1,052,314 0.1Series 2012-C7, Class XA(e) . . . . . . . . . . . . . . . . . . . . . . . . . . . 1.40% 6/15/45 52,457 1,827,575 0.1Series 2012-C8, Class E . . . . . . . . . . . . . . . . . . . . . . . . . . . . . . . 4.89% 8/15/45 2,110 2,065,353 0.1Series 2012-C8, Class XA(e) . . . . . . . . . . . . . . . . . . . . . . . . . . . 1.83% 8/15/45 23,959 1,218,702 0.1Series 2012-C9, Class D . . . . . . . . . . . . . . . . . . . . . . . . . . . . . . . 4.78% 11/15/45 615 603,479 0.0Series 2012-C9, Class XA(e) . . . . . . . . . . . . . . . . . . . . . . . . . . . 1.88% 11/15/45 16,732 943,387 0.0Series 2013-C11, Class XA(e). . . . . . . . . . . . . . . . . . . . . . . . . . . 1.21% 3/15/45 21,548 832,758 0.0Series 2013-C18, Class D . . . . . . . . . . . . . . . . . . . . . . . . . . . . . . 4.70% 12/15/46 1,650 1,588,862 0.1Series 2014-C19, Class AS . . . . . . . . . . . . . . . . . . . . . . . . . . . . . 4.27% 3/15/47 5,000 5,204,454 0.3Series 2014-C22, Class XA(e) . . . . . . . . . . . . . . . . . . . . . . . . . . 0.85% 9/15/57 42,053 1,445,327 0.1Series 2014-C25, Class D . . . . . . . . . . . . . . . . . . . . . . . . . . . . . . 3.80% 11/15/47 1,290 1,131,721 0.1Series 2014-LC14, Class AS . . . . . . . . . . . . . . . . . . . . . . . . . . . . 4.35% 3/15/47 4,266 4,356,666 0.2
WFRBS Commercial Mortgage Trust, Series 2014-C25, Class XA(e) . . . . . . . . . . . . . . . . . . . . . . . . . . 0.89% 11/15/47 27,063 1,009,568 0.1
222,459,456 10.9NON-AGENCY FLOATING RATE CMBS
Ashford Hospitality TrustSeries 2018-ASHF, Class A(a) . . . . . . . . . . . . . . . . . . . . . . . . . . 3.39% 4/15/35 2,791 2,771,834 0.1Series 2018-KEYS, Class A(a) . . . . . . . . . . . . . . . . . . . . . . . . . . 3.49% 5/15/35 3,000 2,998,093 0.2
Atrium Hotel Portfolio Trust, Series 2018-ATRM, Class A(a) . . . . 3.44% 6/15/35 3,000 2,983,174 0.1BHMS, Series 2018-ATLS, Class A(a) . . . . . . . . . . . . . . . . . . . . . . 3.74% 7/15/35 3,000 2,995,382 0.2

AB FCP I
129
MortgageIncomePortfolio
Rate Date Principal Value Net Assets (000) (USD) %
Braemar Hotels & Resorts Trust, Series 2018-PRME, Class A(a) . 3.31% 6/15/35 USD 5,000 $ 4,939,176 0.2%BX Trust
Series 2017-IMC, Class A(a). . . . . . . . . . . . . . . . . . . . . . . . . . . . 3.54% 10/15/32 5,150 5,133,875 0.3Series 2018-EXCL, Class A(a) . . . . . . . . . . . . . . . . . . . . . . . . . . 3.58% 9/15/37 4,718 4,691,758 0.2
CLNS Trust, Series 2017-IKPR, Class F(a). . . . . . . . . . . . . . . . . . . 7.02% 6/11/32 1,500 1,505,606 0.1Credit Suisse Mortgage Trust, Series 2016-MFF, Class D(a) . . . . . 7.09% 11/15/33 3,765 3,778,377 0.2DBWF Mortgage Trust, Series 2018-GLKS, Class A(a). . . . . . . . . 3.51% 11/19/35 4,600 4,593,963 0.2Invitation Homes Trust, Series 2018-SFR4, Class A(a) . . . . . . . . . 3.58% 1/17/38 4,723 4,722,977 0.2Morgan Stanley Bank of America Merrill Lynch Trust,
Series 2014-C18, Class C(b) . . . . . . . . . . . . . . . . . . . . . . . . . . . . 4.49% 10/15/47 1,333 1,336,062 0.1RETL, Series 2018-RVP, Class A(a) . . . . . . . . . . . . . . . . . . . . . . . . 3.59% 3/15/33 4,398 4,386,799 0.2Starwood Retail Property Trust, Series 2014-STAR, Class A(a). . . 3.71% 11/15/27 1,009 1,000,681 0.1Wells Fargo Commercial Mortgage Trust,
Series 2012-LC5, Class D(b). . . . . . . . . . . . . . . . . . . . . . . . . . . . 4.76% 10/15/45 380 376,517 0.0WF-RBS Commercial Mortgage Trust,
Series 2011-C4, Class E(b) . . . . . . . . . . . . . . . . . . . . . . . . . . . . . 5.23% 6/15/44 713 696,016 0.0 48,910,290 2.4 271,369,746 13.3
ASSET-BACKED SECURITIESAUTOS - FIXED RATE
Avis Budget Rental Car Funding AESOP LLC, Series 2018-1A, Class C . . . . . . . . . . . . . . . . . . . . . . . . . . . . . . . 4.73% 9/20/24 2,500 2,513,386 0.1
CPS Auto Receivables TrustSeries 2016-B, Class E . . . . . . . . . . . . . . . . . . . . . . . . . . . . . . . . 8.14% 5/15/23 1,410 1,494,600 0.1Series 2016-C, Class E . . . . . . . . . . . . . . . . . . . . . . . . . . . . . . . . 8.39% 9/15/23 3,250 3,454,551 0.2Series 2017-C, Class D . . . . . . . . . . . . . . . . . . . . . . . . . . . . . . . . 3.79% 6/15/23 2,000 2,006,833 0.1Series 2017-C, Class E . . . . . . . . . . . . . . . . . . . . . . . . . . . . . . . . 5.72% 9/16/24 3,500 3,559,800 0.2Series 2017-D, Class D . . . . . . . . . . . . . . . . . . . . . . . . . . . . . . . . 3.73% 9/15/23 3,000 3,001,355 0.1Series 2017-D, Class E . . . . . . . . . . . . . . . . . . . . . . . . . . . . . . . . 5.30% 6/17/24 1,700 1,702,741 0.1Series 2018-A, Class D . . . . . . . . . . . . . . . . . . . . . . . . . . . . . . . . 3.66% 12/15/23 1,400 1,395,109 0.1Series 2018-A, Class E . . . . . . . . . . . . . . . . . . . . . . . . . . . . . . . . 5.17% 3/17/25 1,750 1,749,707 0.1Series 2018-B, Class E . . . . . . . . . . . . . . . . . . . . . . . . . . . . . . . . 5.61% 12/16/24 3,500 3,501,422 0.2Series 2018-D, Class E . . . . . . . . . . . . . . . . . . . . . . . . . . . . . . . . 5.82% 6/16/25 2,850 2,885,786 0.1
CPS Auto TrustSeries 2016-D, Class E . . . . . . . . . . . . . . . . . . . . . . . . . . . . . . . . 6.86% 4/15/24 3,669 3,813,059 0.2Series 2017-A, Class D . . . . . . . . . . . . . . . . . . . . . . . . . . . . . . . . 4.61% 12/15/22 2,000 2,030,285 0.1Series 2017-A, Class E . . . . . . . . . . . . . . . . . . . . . . . . . . . . . . . . 7.07% 4/15/24 1,000 1,049,627 0.1Series 2018-C, Class D . . . . . . . . . . . . . . . . . . . . . . . . . . . . . . . . 4.40% 6/17/24 3,500 3,538,150 0.2
Exeter Automobile Receivables TrustSeries 2016-1A, Class D . . . . . . . . . . . . . . . . . . . . . . . . . . . . . . . 8.20% 2/15/23 500 520,885 0.0Series 2016-2A, Class D . . . . . . . . . . . . . . . . . . . . . . . . . . . . . . . 8.25% 4/17/23 2,500 2,674,854 0.1Series 2017-1A, Class D . . . . . . . . . . . . . . . . . . . . . . . . . . . . . . . 6.20% 11/15/23 2,000 2,047,145 0.1Series 2017-3A, Class C . . . . . . . . . . . . . . . . . . . . . . . . . . . . . . . 3.68% 7/17/23 2,015 2,024,188 0.1Series 2018-1A, Class E . . . . . . . . . . . . . . . . . . . . . . . . . . . . . . . 4.64% 10/15/24 3,000 2,984,676 0.1Series 2018-3A, Class D . . . . . . . . . . . . . . . . . . . . . . . . . . . . . . . 4.35% 6/17/24 5,000 5,089,000 0.2Series 2018-4A, Class E . . . . . . . . . . . . . . . . . . . . . . . . . . . . . . . 5.38% 7/15/25 3,000 3,047,009 0.1
First Investors Auto Owner Trust, Series 2015-2A, Class E . . . . . . 5.59% 11/15/22 2,000 2,021,357 0.1Flagship Credit Auto Trust
Series 2015-2, Class D . . . . . . . . . . . . . . . . . . . . . . . . . . . . . . . . 5.98% 8/15/22 2,140 2,178,245 0.1Series 2015-3, Class D . . . . . . . . . . . . . . . . . . . . . . . . . . . . . . . . 7.12% 11/15/22 2,500 2,570,403 0.1Series 2016-2, Class D . . . . . . . . . . . . . . . . . . . . . . . . . . . . . . . . 8.56% 11/15/23 2,000 2,113,198 0.1Series 2016-3, Class E. . . . . . . . . . . . . . . . . . . . . . . . . . . . . . . . . 6.25% 10/15/23 2,000 2,061,623 0.1Series 2016-4, Class D . . . . . . . . . . . . . . . . . . . . . . . . . . . . . . . . 3.89% 11/15/22 1,000 1,003,234 0.1Series 2016-4, Class E. . . . . . . . . . . . . . . . . . . . . . . . . . . . . . . . . 6.44% 1/16/24 1,000 1,035,762 0.1Series 2017-1, Class D . . . . . . . . . . . . . . . . . . . . . . . . . . . . . . . . 4.23% 5/15/23 2,250 2,281,642 0.1Series 2017-1, Class E. . . . . . . . . . . . . . . . . . . . . . . . . . . . . . . . . 6.46% 12/15/23 2,500 2,587,228 0.1Series 2017-2, Class E. . . . . . . . . . . . . . . . . . . . . . . . . . . . . . . . . 5.55% 7/15/24 1,875 1,908,776 0.1Series 2017-3, Class D . . . . . . . . . . . . . . . . . . . . . . . . . . . . . . . . 3.73% 9/15/23 3,000 3,000,542 0.1Series 2017-4, Class E. . . . . . . . . . . . . . . . . . . . . . . . . . . . . . . . . 5.02% 2/17/25 1,250 1,266,311 0.1Series 2018-1, Class E. . . . . . . . . . . . . . . . . . . . . . . . . . . . . . . . . 5.10% 5/15/25 3,050 3,072,287 0.2Series 2018-2, Class E. . . . . . . . . . . . . . . . . . . . . . . . . . . . . . . . . 5.51% 11/17/25 2,750 2,805,835 0.1Series 2018-3, Class D . . . . . . . . . . . . . . . . . . . . . . . . . . . . . . . . 4.15% 12/16/24 6,000 6,074,351 0.3Series 2018-3, Class E. . . . . . . . . . . . . . . . . . . . . . . . . . . . . . . . . 5.28% 12/15/25 3,000 3,036,288 0.1Series 2018-4, Class E. . . . . . . . . . . . . . . . . . . . . . . . . . . . . . . . . 5.51% 3/16/26 3,000 3,059,413 0.2Series 2019-1, Class E. . . . . . . . . . . . . . . . . . . . . . . . . . . . . . . . . 5.06% 6/15/26 2,500 2,505,325 0.1
Hertz Vehicle Financing II LPSeries 2018-1A, Class B . . . . . . . . . . . . . . . . . . . . . . . . . . . . . . . 3.60% 2/25/24 4,000 3,935,444 0.2Series 2018-1A, Class C . . . . . . . . . . . . . . . . . . . . . . . . . . . . . . . 4.39% 2/25/24 2,450 2,489,892 0.1
Hertz Vehicle Financing LLC, Series 2018-2A, Class A. . . . . . . . . 3.65% 6/27/22 3,000 3,008,512 0.1Westlake Automobile Receivables Trust,
Series 2016-3A, Class E . . . . . . . . . . . . . . . . . . . . . . . . . . . . . . . 5.69% 10/16/23 3,000 3,050,915 0.2 113,150,751 5.5

AB FCP I
130
Portfolio of investments (continued) MortgageIncomePortfolio
Rate Date Principal Value Net Assets (000) (USD) %
OTHER ABS - FIXED RATECLUB Credit Trust
Series 2017-P2, Class C . . . . . . . . . . . . . . . . . . . . . . . . . . . . . . . 4.91% 1/15/24 USD 3,500 $ 3,523,189 0.2%Series 2018-P3, Class C . . . . . . . . . . . . . . . . . . . . . . . . . . . . . . . 5.54% 1/15/26 3,250 3,306,235 0.2
Consumer Loan Underlying Bond Certificate Issuer Trust ISeries 2018-20, Class PT. . . . . . . . . . . . . . . . . . . . . . . . . . . . . . . 9.14% 11/16/43 2,671 2,653,166 0.1Series 2018-7, Class PT. . . . . . . . . . . . . . . . . . . . . . . . . . . . . . . . 8.93% 6/15/43 1,449 1,453,698 0.1
Consumer Loan Underlying Bond Club Certificate Issuer Trust ISeries 2018-12, Class PT. . . . . . . . . . . . . . . . . . . . . . . . . . . . . . . 11.08% 6/15/43 2,335 2,349,430 0.1Series 2018-4, Class PT. . . . . . . . . . . . . . . . . . . . . . . . . . . . . . . . 8.77% 5/15/43 1,376 1,387,008 0.1
Consumer Loan Underlying Bond Credit TrustSeries 2017-P1, Class B . . . . . . . . . . . . . . . . . . . . . . . . . . . . . . . 3.56% 9/15/23 3,000 3,002,516 0.1Series 2018-3, Class PT. . . . . . . . . . . . . . . . . . . . . . . . . . . . . . . . 8.60% 3/16/43 1,608 1,622,816 0.1Series 2018-P1, Class C . . . . . . . . . . . . . . . . . . . . . . . . . . . . . . . 5.21% 7/15/25 2,500 2,512,868 0.1Series 2018-P2, Class C . . . . . . . . . . . . . . . . . . . . . . . . . . . . . . . 5.21% 10/15/25 3,000 3,007,666 0.1
Marlette Funding TrustSeries 2016-1A, Class C . . . . . . . . . . . . . . . . . . . . . . . . . . . . . . . 9.09% 1/17/23 1,107 1,118,658 0.1Series 2017-1A, Class C . . . . . . . . . . . . . . . . . . . . . . . . . . . . . . . 6.66% 3/15/24 3,850 3,953,097 0.2Series 2017-2A, Class C . . . . . . . . . . . . . . . . . . . . . . . . . . . . . . . 4.58% 7/15/24 7,929 8,000,456 0.4Series 2017-3A, Class D . . . . . . . . . . . . . . . . . . . . . . . . . . . . . . . 5.03% 12/15/24 1,853 1,863,812 0.1Series 2018-1A, Class C . . . . . . . . . . . . . . . . . . . . . . . . . . . . . . . 3.69% 3/15/28 2,250 2,240,856 0.1Series 2018-1A, Class D . . . . . . . . . . . . . . . . . . . . . . . . . . . . . . . 4.85% 3/15/28 3,485 3,485,347 0.2Series 2018-2A, Class C . . . . . . . . . . . . . . . . . . . . . . . . . . . . . . . 4.37% 7/17/28 2,000 2,012,319 0.1Series 2018-4A, Class C . . . . . . . . . . . . . . . . . . . . . . . . . . . . . . . 4.91% 12/15/28 3,000 3,049,795 0.2
Prosper Marketplace Issuance Trust, Series 2017-2A, Class B . . . . 3.48% 9/15/23 2,043 2,042,530 0.1SoFi Consumer Loan Program LLC
Series 2016-1, Class R(f). . . . . . . . . . . . . . . . . . . . . . . . . . . . . . . 0.00% 8/25/25 2,135 587,242 0.0Series 2016-2, Class B. . . . . . . . . . . . . . . . . . . . . . . . . . . . . . . . . 4.77% 10/27/25 2,500 2,547,209 0.1Series 2017-3, Class B. . . . . . . . . . . . . . . . . . . . . . . . . . . . . . . . . 3.85% 5/25/26 1,258 1,266,320 0.1Series 2017-4, Class B. . . . . . . . . . . . . . . . . . . . . . . . . . . . . . . . . 3.59% 5/26/26 4,250 4,245,485 0.2Series 2017-6, Class C. . . . . . . . . . . . . . . . . . . . . . . . . . . . . . . . . 4.02% 11/25/26 2,250 2,250,721 0.1
SoFi Consumer Loan Program Trust . . . . . . . . . . . . . . . . . . . . . . . .Series 2018-1, Class C. . . . . . . . . . . . . . . . . . . . . . . . . . . . . . . . . 3.97% 2/25/27 2,500 2,483,386 0.1Series 2018-1, Class R1(f). . . . . . . . . . . . . . . . . . . . . . . . . . . . . . 0.00% 2/25/27 25 2,120,589 0.1Series 2018-2, Class C. . . . . . . . . . . . . . . . . . . . . . . . . . . . . . . . . 4.25% 4/26/27 2,500 2,531,330 0.1Series 2018-3, Class C. . . . . . . . . . . . . . . . . . . . . . . . . . . . . . . . . 4.67% 8/25/27 2,500 2,561,914 0.1
73,179,658 3.6HOME EQUITY LOANS - FIXED RATE
Citigroup Mortgage Loan Trust, Inc., Series 2005-WF1, Class A5. . . . . . . . . . . . . . . . . . . . . . . . . . . . . 5.01% 11/25/34 2 2,030 0.0
186,332,439 9.1MORTGAGE PASS-THROUGHSAGENCY FIXED RATE 30-YEAR
Federal Home Loan Mortgage Corp. Gold, Series 2016 . . . . . . . . . 4.50% 2/01/46 8,037 8,435,261 0.4Federal Home Loan Mortgage Corp. Gold, Series 2017 . . . . . . . . . 4.50% 6/01/47 10,990 11,529,801 0.6Federal Home Loan Mortgage Corp. Gold, Series 2018 . . . . . . . . . 4.00% 10/01/48 13,801 14,164,856 0.7Federal Home Loan Mortgage Corp. Gold, Series 2018 . . . . . . . . . 4.50% 10/01/48 4,778 5,009,823 0.2Federal Home Loan Mortgage Corp. Gold, Series 2018 . . . . . . . . . 5.00% 9/01/48 3,948 4,191,491 0.2Federal Home Loan Mortgage Corp. Gold, Series 2018 . . . . . . . . . 5.00% 11/01/48 2,967 3,147,693 0.1Federal National Mortgage Association, Series 2000 . . . . . . . . . . . 7.50% 10/01/30 5 5,596 0.0Federal National Mortgage Association, Series 2001 . . . . . . . . . . . 7.50% 6/01/31 31 35,771 0.0Federal National Mortgage Association, Series 2003 . . . . . . . . . . . 5.00% 11/01/33 310 329,007 0.0Federal National Mortgage Association, Series 2004 . . . . . . . . . . . 8.00% 9/01/33 690 791,463 0.0Federal National Mortgage Association, Series 2008 . . . . . . . . . . . 5.00% 7/01/37 328 348,555 0.0Federal National Mortgage Association, Series 2008 . . . . . . . . . . . 5.50% 5/01/38 384 416,240 0.0Federal National Mortgage Association, Series 2009 . . . . . . . . . . . 5.00% 5/01/39 162 174,362 0.0Federal National Mortgage Association, Series 2010 . . . . . . . . . . . 5.00% 2/01/40 976 1,050,379 0.1Federal National Mortgage Association, Series 2010 . . . . . . . . . . . 5.00% 4/01/40 1,125 1,211,865 0.1Federal National Mortgage Association, Series 2010 . . . . . . . . . . . 5.00% 12/01/40 1,528 1,633,409 0.1Federal National Mortgage Association, Series 2011 . . . . . . . . . . . 5.00% 4/01/41 628 677,200 0.0Federal National Mortgage Association, Series 2014 . . . . . . . . . . . 5.00% 8/01/44 1,885 2,033,235 0.1Federal National Mortgage Association, Series 2016 . . . . . . . . . . . 4.50% 4/01/46 6,703 7,029,948 0.3Federal National Mortgage Association, Series 2017 . . . . . . . . . . . 3.50% 8/01/47 3,713 3,720,439 0.2Federal National Mortgage Association, Series 2017 . . . . . . . . . . . 4.50% 10/01/47 11,145 11,669,845 0.6Federal National Mortgage Association, Series 2018 . . . . . . . . . . . 4.00% 1/01/48 16,273 16,729,446 0.8Federal National Mortgage Association, Series 2018 . . . . . . . . . . . 4.00% 8/01/48 1,113 1,142,752 0.1Federal National Mortgage Association, Series 2018 . . . . . . . . . . . 4.00% 9/01/48 7,167 7,351,763 0.4Federal National Mortgage Association, Series 2018 . . . . . . . . . . . 4.00% 11/01/48 9,747 10,004,423 0.5Federal National Mortgage Association, Series 2018 . . . . . . . . . . . 4.50% 9/01/48 4,130 4,321,430 0.2Federal National Mortgage Association, Series 2019, TBA . . . . . . 4.00% 3/01/49 1,000 1,019,531 0.0Federal National Mortgage Association, Series 2019, TBA . . . . . . 5.00% 3/01/49 40,500 42,468,049 2.1Government National Mortgage Association, Series 2009 . . . . . . . 5.00% 10/15/39 303 322,732 0.0Government National Mortgage Association, Series 2012 . . . . . . . 5.50% 6/15/38 103 111,912 0.0
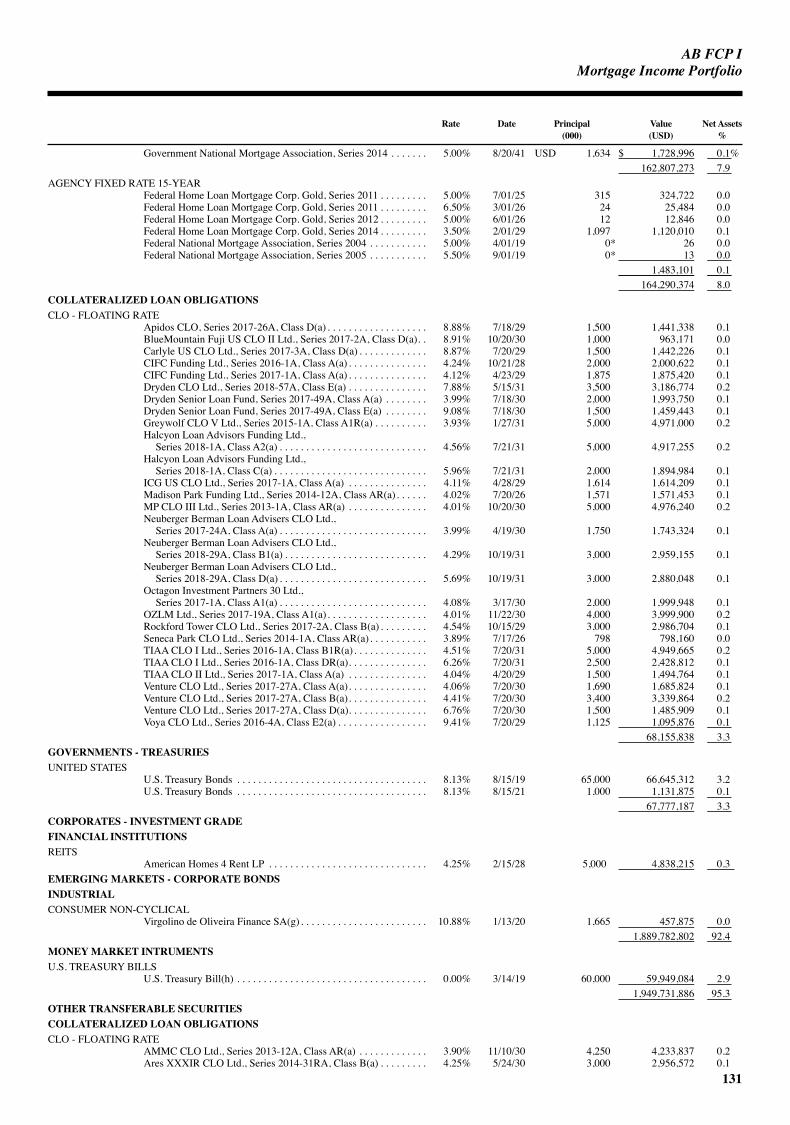
AB FCP I
131
MortgageIncomePortfolio
Rate Date Principal Value Net Assets (000) (USD) %
Government National Mortgage Association, Series 2014 . . . . . . . 5.00% 8/20/41 USD 1,634 $ 1,728,996 0.1% 162,807,273 7.9
AGENCY FIXED RATE 15-YEARFederal Home Loan Mortgage Corp. Gold, Series 2011 . . . . . . . . . 5.00% 7/01/25 315 324,722 0.0Federal Home Loan Mortgage Corp. Gold, Series 2011 . . . . . . . . . 6.50% 3/01/26 24 25,484 0.0Federal Home Loan Mortgage Corp. Gold, Series 2012 . . . . . . . . . 5.00% 6/01/26 12 12,846 0.0Federal Home Loan Mortgage Corp. Gold, Series 2014 . . . . . . . . . 3.50% 2/01/29 1,097 1,120,010 0.1Federal National Mortgage Association, Series 2004 . . . . . . . . . . . 5.00% 4/01/19 0* 26 0.0Federal National Mortgage Association, Series 2005 . . . . . . . . . . . 5.50% 9/01/19 0* 13 0.0 1,483,101 0.1 164,290,374 8.0
COLLATERALIZED LOAN OBLIGATIONSCLO - FLOATING RATE
Apidos CLO, Series 2017-26A, Class D(a) . . . . . . . . . . . . . . . . . . . 8.88% 7/18/29 1,500 1,441,338 0.1BlueMountain Fuji US CLO II Ltd., Series 2017-2A, Class D(a). . 8.91% 10/20/30 1,000 963,171 0.0Carlyle US CLO Ltd., Series 2017-3A, Class D(a) . . . . . . . . . . . . . 8.87% 7/20/29 1,500 1,442,226 0.1CIFC Funding Ltd., Series 2016-1A, Class A(a) . . . . . . . . . . . . . . . 4.24% 10/21/28 2,000 2,000,622 0.1CIFC Funding Ltd., Series 2017-1A, Class A(a) . . . . . . . . . . . . . . . 4.12% 4/23/29 1,875 1,875,420 0.1Dryden CLO Ltd., Series 2018-57A, Class E(a) . . . . . . . . . . . . . . . 7.88% 5/15/31 3,500 3,186,774 0.2Dryden Senior Loan Fund, Series 2017-49A, Class A(a) . . . . . . . . 3.99% 7/18/30 2,000 1,993,750 0.1Dryden Senior Loan Fund, Series 2017-49A, Class E(a) . . . . . . . . 9.08% 7/18/30 1,500 1,459,443 0.1Greywolf CLO V Ltd., Series 2015-1A, Class A1R(a) . . . . . . . . . . 3.93% 1/27/31 5,000 4,971,000 0.2Halcyon Loan Advisors Funding Ltd.,
Series 2018-1A, Class A2(a) . . . . . . . . . . . . . . . . . . . . . . . . . . . . 4.56% 7/21/31 5,000 4,917,255 0.2Halcyon Loan Advisors Funding Ltd.,
Series 2018-1A, Class C(a) . . . . . . . . . . . . . . . . . . . . . . . . . . . . . 5.96% 7/21/31 2,000 1,894,984 0.1ICG US CLO Ltd., Series 2017-1A, Class A(a) . . . . . . . . . . . . . . . 4.11% 4/28/29 1,614 1,614,209 0.1Madison Park Funding Ltd., Series 2014-12A, Class AR(a). . . . . . 4.02% 7/20/26 1,571 1,571,453 0.1MP CLO III Ltd., Series 2013-1A, Class AR(a) . . . . . . . . . . . . . . . 4.01% 10/20/30 5,000 4,976,240 0.2Neuberger Berman Loan Advisers CLO Ltd.,
Series 2017-24A, Class A(a) . . . . . . . . . . . . . . . . . . . . . . . . . . . . 3.99% 4/19/30 1,750 1,743,324 0.1Neuberger Berman Loan Advisers CLO Ltd.,
Series 2018-29A, Class B1(a) . . . . . . . . . . . . . . . . . . . . . . . . . . . 4.29% 10/19/31 3,000 2,959,155 0.1Neuberger Berman Loan Advisers CLO Ltd.,
Series 2018-29A, Class D(a) . . . . . . . . . . . . . . . . . . . . . . . . . . . . 5.69% 10/19/31 3,000 2,880,048 0.1Octagon Investment Partners 30 Ltd.,
Series 2017-1A, Class A1(a) . . . . . . . . . . . . . . . . . . . . . . . . . . . . 4.08% 3/17/30 2,000 1,999,948 0.1OZLM Ltd., Series 2017-19A, Class A1(a). . . . . . . . . . . . . . . . . . . 4.01% 11/22/30 4,000 3,999,900 0.2Rockford Tower CLO Ltd., Series 2017-2A, Class B(a) . . . . . . . . . 4.54% 10/15/29 3,000 2,986,704 0.1Seneca Park CLO Ltd., Series 2014-1A, Class AR(a). . . . . . . . . . . 3.89% 7/17/26 798 798,160 0.0TIAA CLO I Ltd., Series 2016-1A, Class B1R(a). . . . . . . . . . . . . . 4.51% 7/20/31 5,000 4,949,665 0.2TIAA CLO I Ltd., Series 2016-1A, Class DR(a). . . . . . . . . . . . . . . 6.26% 7/20/31 2,500 2,428,812 0.1TIAA CLO II Ltd., Series 2017-1A, Class A(a) . . . . . . . . . . . . . . . 4.04% 4/20/29 1,500 1,494,764 0.1Venture CLO Ltd., Series 2017-27A, Class A(a). . . . . . . . . . . . . . . 4.06% 7/20/30 1,690 1,685,824 0.1Venture CLO Ltd., Series 2017-27A, Class B(a). . . . . . . . . . . . . . . 4.41% 7/20/30 3,400 3,339,864 0.2Venture CLO Ltd., Series 2017-27A, Class D(a). . . . . . . . . . . . . . . 6.76% 7/20/30 1,500 1,485,909 0.1Voya CLO Ltd., Series 2016-4A, Class E2(a) . . . . . . . . . . . . . . . . . 9.41% 7/20/29 1,125 1,095,876 0.1 68,155,838 3.3
GOVERNMENTS - TREASURIESUNITED STATES
U.S. Treasury Bonds . . . . . . . . . . . . . . . . . . . . . . . . . . . . . . . . . . . . 8.13% 8/15/19 65,000 66,645,312 3.2U.S. Treasury Bonds . . . . . . . . . . . . . . . . . . . . . . . . . . . . . . . . . . . . 8.13% 8/15/21 1,000 1,131,875 0.1 67,777,187 3.3
CORPORATES - INVESTMENT GRADE FINANCIAL INSTITUTIONSREITS
American Homes 4 Rent LP . . . . . . . . . . . . . . . . . . . . . . . . . . . . . . 4.25% 2/15/28 5,000 4,838,215 0.3EMERGING MARKETS - CORPORATE BONDSINDUSTRIALCONSUMER NON-CYCLICAL
Virgolino de Oliveira Finance SA(g) . . . . . . . . . . . . . . . . . . . . . . . . 10.88% 1/13/20 1,665 457,875 0.0 1,889,782,802 92.4
MONEY MARKET INTRUMENTS U.S. TREASURY BILLS
U.S. Treasury Bill(h) . . . . . . . . . . . . . . . . . . . . . . . . . . . . . . . . . . . . 0.00% 3/14/19 60,000 59,949,084 2.9 1,949,731,886 95.3
OTHER TRANSFERABLE SECURITIESCOLLATERALIZED LOAN OBLIGATIONSCLO - FLOATING RATE
AMMC CLO Ltd., Series 2013-12A, Class AR(a) . . . . . . . . . . . . . 3.90% 11/10/30 4,250 4,233,837 0.2Ares XXXIR CLO Ltd., Series 2014-31RA, Class B(a) . . . . . . . . . 4.25% 5/24/30 3,000 2,956,572 0.1
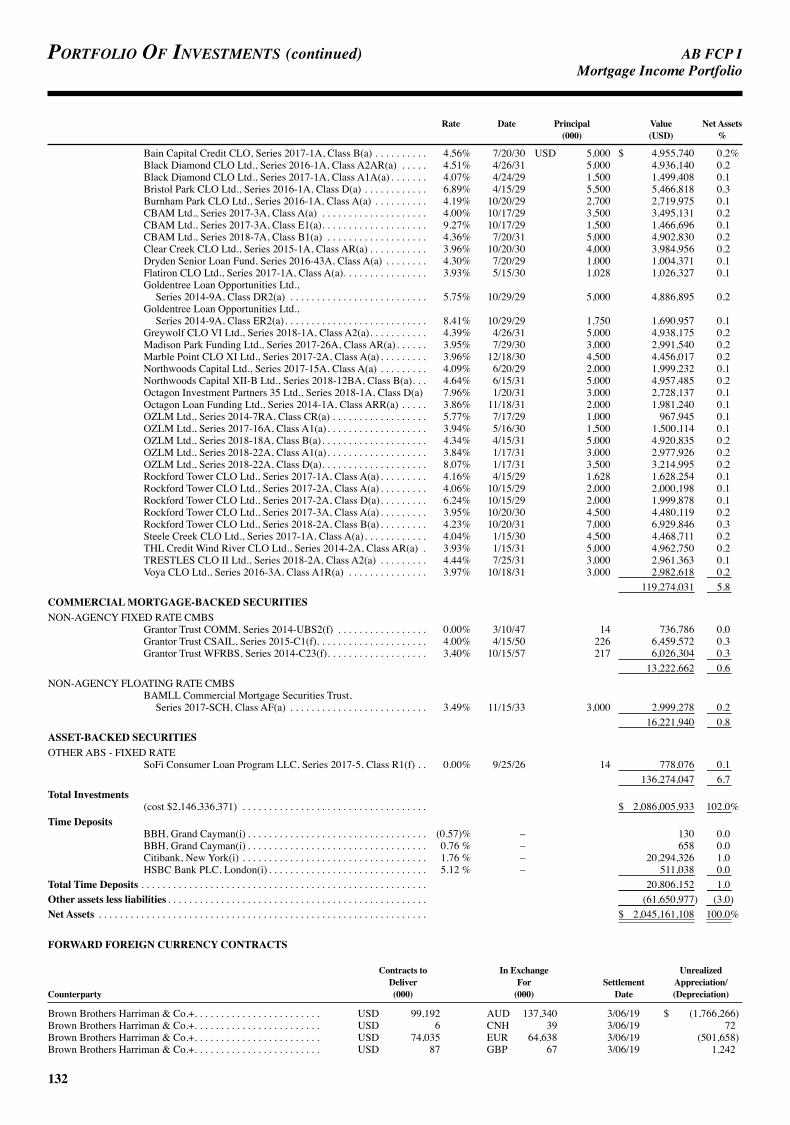
AB FCP I
132
Portfolio of investments (continued) MortgageIncomePortfolio
Rate Date Principal Value Net Assets (000) (USD) %
Bain Capital Credit CLO, Series 2017-1A, Class B(a) . . . . . . . . . . 4.56% 7/20/30 USD 5,000 $ 4,955,740 0.2%Black Diamond CLO Ltd., Series 2016-1A, Class A2AR(a) . . . . . 4.51% 4/26/31 5,000 4,936,140 0.2Black Diamond CLO Ltd., Series 2017-1A, Class A1A(a) . . . . . . . 4.07% 4/24/29 1,500 1,499,408 0.1Bristol Park CLO Ltd., Series 2016-1A, Class D(a) . . . . . . . . . . . . 6.89% 4/15/29 5,500 5,466,818 0.3Burnham Park CLO Ltd., Series 2016-1A, Class A(a) . . . . . . . . . . 4.19% 10/20/29 2,700 2,719,975 0.1CBAM Ltd., Series 2017-3A, Class A(a) . . . . . . . . . . . . . . . . . . . . 4.00% 10/17/29 3,500 3,495,131 0.2CBAM Ltd., Series 2017-3A, Class E1(a). . . . . . . . . . . . . . . . . . . . 9.27% 10/17/29 1,500 1,466,696 0.1CBAM Ltd., Series 2018-7A, Class B1(a) . . . . . . . . . . . . . . . . . . . 4.36% 7/20/31 5,000 4,902,830 0.2Clear Creek CLO Ltd., Series 2015-1A, Class AR(a) . . . . . . . . . . . 3.96% 10/20/30 4,000 3,984,956 0.2Dryden Senior Loan Fund, Series 2016-43A, Class A(a) . . . . . . . . 4.30% 7/20/29 1,000 1,004,371 0.1Flatiron CLO Ltd., Series 2017-1A, Class A(a). . . . . . . . . . . . . . . . 3.93% 5/15/30 1,028 1,026,327 0.1Goldentree Loan Opportunities Ltd.,
Series 2014-9A, Class DR2(a) . . . . . . . . . . . . . . . . . . . . . . . . . . 5.75% 10/29/29 5,000 4,886,895 0.2Goldentree Loan Opportunities Ltd.,
Series 2014-9A, Class ER2(a). . . . . . . . . . . . . . . . . . . . . . . . . . . 8.41% 10/29/29 1,750 1,690,957 0.1Greywolf CLO VI Ltd., Series 2018-1A, Class A2(a). . . . . . . . . . . 4.39% 4/26/31 5,000 4,938,175 0.2Madison Park Funding Ltd., Series 2017-26A, Class AR(a). . . . . . 3.95% 7/29/30 3,000 2,991,540 0.2Marble Point CLO XI Ltd., Series 2017-2A, Class A(a) . . . . . . . . . 3.96% 12/18/30 4,500 4,456,017 0.2Northwoods Capital Ltd., Series 2017-15A, Class A(a) . . . . . . . . . 4.09% 6/20/29 2,000 1,999,232 0.1Northwoods Capital XII-B Ltd., Series 2018-12BA, Class B(a). . . 4.64% 6/15/31 5,000 4,957,485 0.2Octagon Investment Partners 35 Ltd., Series 2018-1A, Class D(a) 7.96% 1/20/31 3,000 2,728,137 0.1Octagon Loan Funding Ltd., Series 2014-1A, Class ARR(a) . . . . . 3.86% 11/18/31 2,000 1,981,240 0.1OZLM Ltd., Series 2014-7RA, Class CR(a) . . . . . . . . . . . . . . . . . . 5.77% 7/17/29 1,000 967,945 0.1OZLM Ltd., Series 2017-16A, Class A1(a). . . . . . . . . . . . . . . . . . . 3.94% 5/16/30 1,500 1,500,114 0.1OZLM Ltd., Series 2018-18A, Class B(a). . . . . . . . . . . . . . . . . . . . 4.34% 4/15/31 5,000 4,920,835 0.2OZLM Ltd., Series 2018-22A, Class A1(a). . . . . . . . . . . . . . . . . . . 3.84% 1/17/31 3,000 2,977,926 0.2OZLM Ltd., Series 2018-22A, Class D(a). . . . . . . . . . . . . . . . . . . . 8.07% 1/17/31 3,500 3,214,995 0.2Rockford Tower CLO Ltd., Series 2017-1A, Class A(a) . . . . . . . . . 4.16% 4/15/29 1,628 1,628,254 0.1Rockford Tower CLO Ltd., Series 2017-2A, Class A(a) . . . . . . . . . 4.06% 10/15/29 2,000 2,000,198 0.1Rockford Tower CLO Ltd., Series 2017-2A, Class D(a). . . . . . . . . 6.24% 10/15/29 2,000 1,999,878 0.1Rockford Tower CLO Ltd., Series 2017-3A, Class A(a) . . . . . . . . . 3.95% 10/20/30 4,500 4,480,119 0.2Rockford Tower CLO Ltd., Series 2018-2A, Class B(a) . . . . . . . . . 4.23% 10/20/31 7,000 6,929,846 0.3Steele Creek CLO Ltd., Series 2017-1A, Class A(a). . . . . . . . . . . . 4.04% 1/15/30 4,500 4,468,711 0.2THL Credit Wind River CLO Ltd., Series 2014-2A, Class AR(a) . 3.93% 1/15/31 5,000 4,962,750 0.2TRESTLES CLO II Ltd., Series 2018-2A, Class A2(a) . . . . . . . . . 4.44% 7/25/31 3,000 2,961,363 0.1Voya CLO Ltd., Series 2016-3A, Class A1R(a) . . . . . . . . . . . . . . . 3.97% 10/18/31 3,000 2,982,618 0.2 119,274,031 5.8
COMMERCIAL MORTGAGE-BACKED SECURITIESNON-AGENCY FIXED RATE CMBS
Grantor Trust COMM, Series 2014-UBS2(f) . . . . . . . . . . . . . . . . . 0.00% 3/10/47 14 736,786 0.0Grantor Trust CSAIL, Series 2015-C1(f). . . . . . . . . . . . . . . . . . . . . 4.00% 4/15/50 226 6,459,572 0.3Grantor Trust WFRBS, Series 2014-C23(f). . . . . . . . . . . . . . . . . . . 3.40% 10/15/57 217 6,026,304 0.3 13,222,662 0.6
NON-AGENCY FLOATING RATE CMBSBAMLL Commercial Mortgage Securities Trust,
Series 2017-SCH, Class AF(a) . . . . . . . . . . . . . . . . . . . . . . . . . . 3.49% 11/15/33 3,000 2,999,278 0.2 16,221,940 0.8
ASSET-BACKED SECURITIESOTHER ABS - FIXED RATE
SoFi Consumer Loan Program LLC, Series 2017-5, Class R1(f) . . 0.00% 9/25/26 14 778,076 0.1 136,274,047 6.7
Total Investments(cost $2,146,336,371) . . . . . . . . . . . . . . . . . . . . . . . . . . . . . . . . . . . $ 2,086,005,933 102.0%
Time DepositsBBH, Grand Cayman(i) . . . . . . . . . . . . . . . . . . . . . . . . . . . . . . . . . . (0.57)% – 130 0.0BBH, Grand Cayman(i) . . . . . . . . . . . . . . . . . . . . . . . . . . . . . . . . . . 0.76 % – 658 0.0Citibank, New York(i) . . . . . . . . . . . . . . . . . . . . . . . . . . . . . . . . . . . 1.76 % – 20,294,326 1.0HSBC Bank PLC, London(i) . . . . . . . . . . . . . . . . . . . . . . . . . . . . . . 5.12 % – 511,038 0.0
Total Time Deposits . . . . . . . . . . . . . . . . . . . . . . . . . . . . . . . . . . . . . . . . . . . . . . . . . . . . . . 20,806,152 1.0Other assets less liabilities . . . . . . . . . . . . . . . . . . . . . . . . . . . . . . . . . . . . . . . . . . . . . . . . . (61,650,977) (3.0)Net Assets . . . . . . . . . . . . . . . . . . . . . . . . . . . . . . . . . . . . . . . . . . . . . . . . . . . . . . . . . . . . . . $ 2,045,161,108 100.0%
FORWARD FOREIGN CURRENCY CONTRACTS
Contracts to In Exchange Unrealized Deliver For Settlement Appreciation/ Counterparty (000) (000) Date (Depreciation)
Brown Brothers Harriman & Co.+. . . . . . . . . . . . . . . . . . . . . . . . USD 99,192 AUD 137,340 3/06/19 $ (1,766,266)Brown Brothers Harriman & Co.+. . . . . . . . . . . . . . . . . . . . . . . . USD 6 CNH 39 3/06/19 72Brown Brothers Harriman & Co.+. . . . . . . . . . . . . . . . . . . . . . . . USD 74,035 EUR 64,638 3/06/19 (501,658)Brown Brothers Harriman & Co.+. . . . . . . . . . . . . . . . . . . . . . . . USD 87 GBP 67 3/06/19 1,242
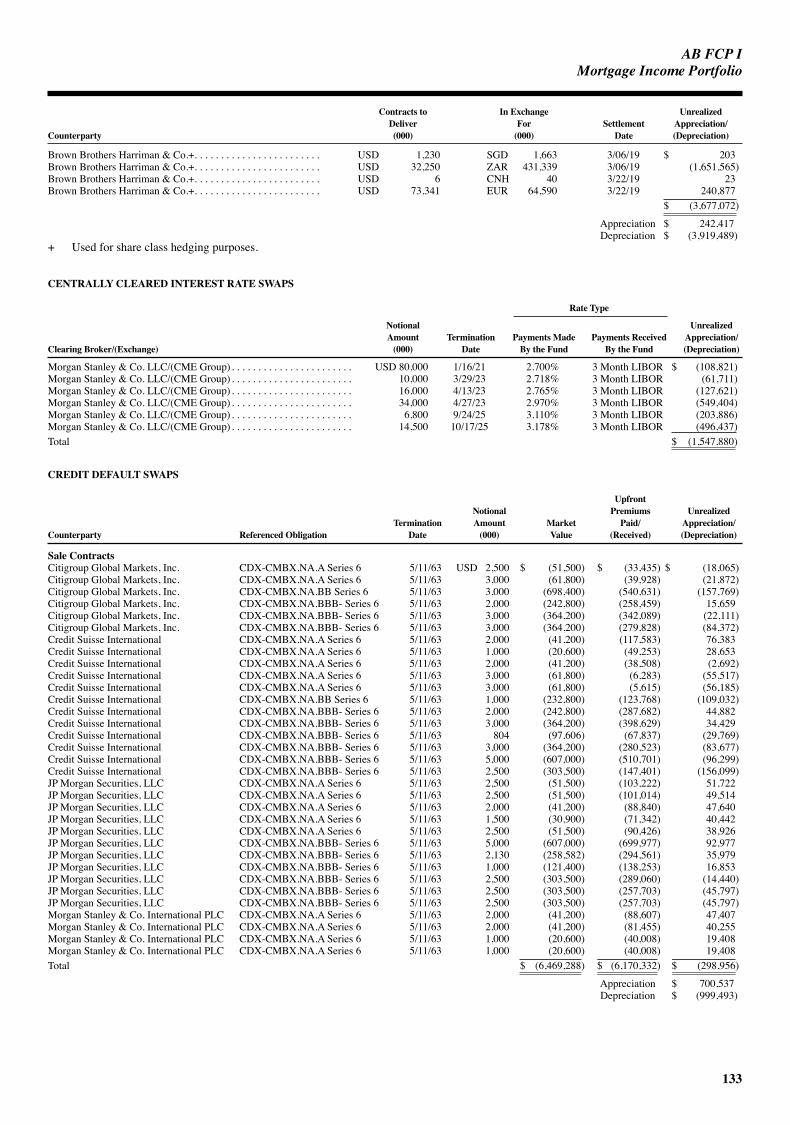
AB FCP I
133
MortgageIncomePortfolio
Contracts to In Exchange Unrealized Deliver For Settlement Appreciation/ Counterparty (000) (000) Date (Depreciation)
Brown Brothers Harriman & Co.+. . . . . . . . . . . . . . . . . . . . . . . . USD 1,230 SGD 1,663 3/06/19 $ 203Brown Brothers Harriman & Co.+. . . . . . . . . . . . . . . . . . . . . . . . USD 32,250 ZAR 431,339 3/06/19 (1,651,565)Brown Brothers Harriman & Co.+. . . . . . . . . . . . . . . . . . . . . . . . USD 6 CNH 40 3/22/19 23Brown Brothers Harriman & Co.+. . . . . . . . . . . . . . . . . . . . . . . . USD 73,341 EUR 64,590 3/22/19 240,877
$ (3,677,072)
Appreciation $ 242,417 Depreciation $ (3,919,489)+ Used for share class hedging purposes.
CENTRALLY CLEARED INTEREST RATE SWAPS
Rate Type
Notional Unrealized Amount Termination Payments Made Payments Received Appreciation/ Clearing Broker/(Exchange) (000) Date By the Fund By the Fund (Depreciation)
Morgan Stanley & Co. LLC/(CME Group) . . . . . . . . . . . . . . . . . . . . . . . USD 80,000 1/16/21 2.700% 3 Month LIBOR $ (108,821)Morgan Stanley & Co. LLC/(CME Group) . . . . . . . . . . . . . . . . . . . . . . . 10,000 3/29/23 2.718% 3 Month LIBOR (61,711)Morgan Stanley & Co. LLC/(CME Group) . . . . . . . . . . . . . . . . . . . . . . . 16,000 4/13/23 2.765% 3 Month LIBOR (127,621)Morgan Stanley & Co. LLC/(CME Group) . . . . . . . . . . . . . . . . . . . . . . . 34,000 4/27/23 2.970% 3 Month LIBOR (549,404)Morgan Stanley & Co. LLC/(CME Group) . . . . . . . . . . . . . . . . . . . . . . . 6,800 9/24/25 3.110% 3 Month LIBOR (203,886)Morgan Stanley & Co. LLC/(CME Group) . . . . . . . . . . . . . . . . . . . . . . . 14,500 10/17/25 3.178% 3 Month LIBOR (496,437)Total $ (1,547,880)
CREDIT DEFAULT SWAPS
Upfront Notional Premiums Unrealized Termination Amount Market Paid/ Appreciation/ Counterparty Referenced Obligation Date (000) Value (Received) (Depreciation)
Sale ContractsCitigroup Global Markets, Inc. CDX-CMBX.NA.A Series 6 5/11/63 USD 2,500 $ (51,500) $ (33,435) $ (18,065)Citigroup Global Markets, Inc. CDX-CMBX.NA.A Series 6 5/11/63 3,000 (61,800) (39,928) (21,872)Citigroup Global Markets, Inc. CDX-CMBX.NA.BB Series 6 5/11/63 3,000 (698,400) (540,631) (157,769)Citigroup Global Markets, Inc. CDX-CMBX.NA.BBB- Series 6 5/11/63 2,000 (242,800) (258,459) 15,659Citigroup Global Markets, Inc. CDX-CMBX.NA.BBB- Series 6 5/11/63 3,000 (364,200) (342,089) (22,111)Citigroup Global Markets, Inc. CDX-CMBX.NA.BBB- Series 6 5/11/63 3,000 (364,200) (279,828) (84,372)Credit Suisse International CDX-CMBX.NA.A Series 6 5/11/63 2,000 (41,200) (117,583) 76,383Credit Suisse International CDX-CMBX.NA.A Series 6 5/11/63 1,000 (20,600) (49,253) 28,653Credit Suisse International CDX-CMBX.NA.A Series 6 5/11/63 2,000 (41,200) (38,508) (2,692)Credit Suisse International CDX-CMBX.NA.A Series 6 5/11/63 3,000 (61,800) (6,283) (55,517)Credit Suisse International CDX-CMBX.NA.A Series 6 5/11/63 3,000 (61,800) (5,615) (56,185)Credit Suisse International CDX-CMBX.NA.BB Series 6 5/11/63 1,000 (232,800) (123,768) (109,032)Credit Suisse International CDX-CMBX.NA.BBB- Series 6 5/11/63 2,000 (242,800) (287,682) 44,882Credit Suisse International CDX-CMBX.NA.BBB- Series 6 5/11/63 3,000 (364,200) (398,629) 34,429Credit Suisse International CDX-CMBX.NA.BBB- Series 6 5/11/63 804 (97,606) (67,837) (29,769)Credit Suisse International CDX-CMBX.NA.BBB- Series 6 5/11/63 3,000 (364,200) (280,523) (83,677)Credit Suisse International CDX-CMBX.NA.BBB- Series 6 5/11/63 5,000 (607,000) (510,701) (96,299)Credit Suisse International CDX-CMBX.NA.BBB- Series 6 5/11/63 2,500 (303,500) (147,401) (156,099)JP Morgan Securities, LLC CDX-CMBX.NA.A Series 6 5/11/63 2,500 (51,500) (103,222) 51,722JP Morgan Securities, LLC CDX-CMBX.NA.A Series 6 5/11/63 2,500 (51,500) (101,014) 49,514JP Morgan Securities, LLC CDX-CMBX.NA.A Series 6 5/11/63 2,000 (41,200) (88,840) 47,640JP Morgan Securities, LLC CDX-CMBX.NA.A Series 6 5/11/63 1,500 (30,900) (71,342) 40,442JP Morgan Securities, LLC CDX-CMBX.NA.A Series 6 5/11/63 2,500 (51,500) (90,426) 38,926JP Morgan Securities, LLC CDX-CMBX.NA.BBB- Series 6 5/11/63 5,000 (607,000) (699,977) 92,977JP Morgan Securities, LLC CDX-CMBX.NA.BBB- Series 6 5/11/63 2,130 (258,582) (294,561) 35,979JP Morgan Securities, LLC CDX-CMBX.NA.BBB- Series 6 5/11/63 1,000 (121,400) (138,253) 16,853JP Morgan Securities, LLC CDX-CMBX.NA.BBB- Series 6 5/11/63 2,500 (303,500) (289,060) (14,440)JP Morgan Securities, LLC CDX-CMBX.NA.BBB- Series 6 5/11/63 2,500 (303,500) (257,703) (45,797)JP Morgan Securities, LLC CDX-CMBX.NA.BBB- Series 6 5/11/63 2,500 (303,500) (257,703) (45,797)Morgan Stanley & Co. International PLC CDX-CMBX.NA.A Series 6 5/11/63 2,000 (41,200) (88,607) 47,407Morgan Stanley & Co. International PLC CDX-CMBX.NA.A Series 6 5/11/63 2,000 (41,200) (81,455) 40,255Morgan Stanley & Co. International PLC CDX-CMBX.NA.A Series 6 5/11/63 1,000 (20,600) (40,008) 19,408Morgan Stanley & Co. International PLC CDX-CMBX.NA.A Series 6 5/11/63 1,000 (20,600) (40,008) 19,408Total $ (6,469,288) $ (6,170,332) $ (298,956)
Appreciation $ 700,537 Depreciation $ (999,493)

AB FCP I
134
Portfolio of investments MortgageIncomePortfolio
INFLATION (CPI) SWAPS
Rate Type
Notional Unrealized Amount Termination Payments Made Payments Received Appreciation/ Counterparty (000) Date By the Fund By the Fund (Depreciation)
JPMorgan Chase Bank, NA . . . . . . . . . . . . . . . . . . . . . . . . . . . . . . . . . . . USD 10,000 1/15/21 1.960% CPI# $ (18,509)
Total for Swaps $ (1,865,345)
# Variable interest rate based on the rate of inflation as determined by the Consumer Price Index (CPI).* Principal amount less than 500.(a) Floating Rate Security. Stated interest rate was in effect at February 28, 2019.(b) Variable rate coupon, rate shown as of February 28, 2019.(c) Inverse interest only security.(d) Inverse floater security.(e) IO - Interest Only.(f) Fair valued as determined in accordance with procedures established by and under the general supervision of the Management Company’s
Board of Managers.(g) Defaulted.(h) Position, or a portion thereof, has been segregated to collateralize OTC derivatives outstanding. (i) Overnight deposit.
Currency Abbreviations:AUD – Australian DollarCNH – Chinese Yuan Renminbi (Offshore)EUR – EuroGBP – Great British PoundSGD – Singapore DollarUSD – United States DollarZAR – South African Rand
Glossary:ABS – Asset-Backed SecuritiesCDX-CMBX.NA – North American Commercial Mortgage-Backed IndexCMBS – Commercial Mortgage-Backed SecuritiesCME – Chicago Mercantile ExchangeLIBOR – London Interbank Offered RatesREMICs – Real Estate Mortgage Investment ConduitsTBA – To Be Announced
See notes to financial statements.

AB FCP I
135
Portfolio of investmentsFebruary 28, 2019 (unaudited) GlobalBondIIPortfolio
Rate Date Principal Value Net Assets (000) (USD) %
TRANSFERABLE SECURITIES QUOTED ON A STOCK EXCHANGE OR DEALT IN ON ANOTHER REGULATED MARKETGOVERNMENTS - TREASURIESAUSTRIA
Republic of Austria Government Bond . . . . . . . . . . . . . . . . . . . . . . 3.65% 4/20/22 EUR 182 $ 232,408 1.4%CANADA
Canadian Government Bond, Series A49 . . . . . . . . . . . . . . . . . . . . 9.25% 6/01/22 CAD 245 229,784 1.4FRANCE
French Republic Government Bond OAT . . . . . . . . . . . . . . . . . . . . 2.25% 5/25/24 EUR 119 152,036 1.0ITALY
Italy Buoni Poliennali Del Tesoro . . . . . . . . . . . . . . . . . . . . . . . . . . 3.75% 3/01/21 104 125,536 0.8Italy Buoni Poliennali Del Tesoro . . . . . . . . . . . . . . . . . . . . . . . . . . 3.75% 5/01/21 108 131,148 0.8Italy Buoni Poliennali Del Tesoro . . . . . . . . . . . . . . . . . . . . . . . . . . 3.75% 8/01/21 389 473,101 2.9Italy Buoni Poliennali Del Tesoro . . . . . . . . . . . . . . . . . . . . . . . . . . 4.75% 9/01/21 52 65,017 0.4Italy Buoni Poliennali Del Tesoro . . . . . . . . . . . . . . . . . . . . . . . . . . 5.00% 3/01/22 133 168,660 1.1 963,462 6.0
MALAYSIAMalaysia Government Bond, Series 0114 . . . . . . . . . . . . . . . . . . . . 4.18% 7/15/24 MYR 162 40,472 0.3Malaysia Government Bond, Series 0217 . . . . . . . . . . . . . . . . . . . . 4.06% 9/30/24 163 40,407 0.2Malaysia Government Bond, Series 0218 . . . . . . . . . . . . . . . . . . . . 3.76% 4/20/23 187 46,046 0.3 126,925 0.8
POLANDRepublic of Poland Government Bond, Series 922 . . . . . . . . . . . . . 5.75% 9/23/22 PLN 833 248,224 1.5
SINGAPORESingapore Government Bond. . . . . . . . . . . . . . . . . . . . . . . . . . . . . . 3.25% 9/01/20 SGD 379 285,715 1.8
SPAINSpain Government Bond . . . . . . . . . . . . . . . . . . . . . . . . . . . . . . . . . 5.50% 4/30/21 EUR 264 336,744 2.1
UNITED KINGDOMUnited Kingdom Gilt . . . . . . . . . . . . . . . . . . . . . . . . . . . . . . . . . . . . 8.00% 6/07/21 GBP 54 82,890 0.5
UNITED STATESU.S. Treasury Bonds . . . . . . . . . . . . . . . . . . . . . . . . . . . . . . . . . . . . 8.13% 8/15/19 USD 147 150,638 0.9U.S. Treasury Bonds . . . . . . . . . . . . . . . . . . . . . . . . . . . . . . . . . . . . 8.13% 5/15/21 996 1,114,753 6.9U.S. Treasury Bonds . . . . . . . . . . . . . . . . . . . . . . . . . . . . . . . . . . . . 8.13% 8/15/21 193 218,707 1.4U.S. Treasury Bonds . . . . . . . . . . . . . . . . . . . . . . . . . . . . . . . . . . . . 8.75% 8/15/20 1,551 1,687,293 10.4 3,171,391 19.6 5,829,579 36.1
CORPORATES - INVESTMENT GRADE INDUSTRIALBASIC
Air Products & Chemicals, Inc. . . . . . . . . . . . . . . . . . . . . . . . . . . . . 0.38% 6/01/21 EUR 52 59,792 0.4Anglo American Capital PLC . . . . . . . . . . . . . . . . . . . . . . . . . . . . . 3.50% 3/28/22 13 16,106 0.1Glencore Finance Europe Ltd. . . . . . . . . . . . . . . . . . . . . . . . . . . . . . 1.63% 1/18/22 26 30,440 0.2LYB International Finance II BV. . . . . . . . . . . . . . . . . . . . . . . . . . . 1.88% 3/02/22 44 50,789 0.3 157,127 1.0
CAPITAL GOODS3M Co. . . . . . . . . . . . . . . . . . . . . . . . . . . . . . . . . . . . . . . . . . . . . . . . 1.88% 11/15/21 43 50,704 0.3Caterpillar Financial Services Corp.(a) . . . . . . . . . . . . . . . . . . . . . . 3.02% 3/15/21 USD 48 47,529 0.3Dover Corp. . . . . . . . . . . . . . . . . . . . . . . . . . . . . . . . . . . . . . . . . . . . 2.13% 12/01/20 EUR 51 60,124 0.3Johnson Controls International PLC . . . . . . . . . . . . . . . . . . . . . . . . 0.00% 12/04/20 11 12,019 0.1Johnson Controls International PLC . . . . . . . . . . . . . . . . . . . . . . . . 1.00% 9/15/23 43 48,365 0.3Rolls-Royce PLC . . . . . . . . . . . . . . . . . . . . . . . . . . . . . . . . . . . . . . . 2.13% 6/18/21 51 60,615 0.4 279,356 1.7
COMMUNICATIONS - MEDIASky Ltd. . . . . . . . . . . . . . . . . . . . . . . . . . . . . . . . . . . . . . . . . . . . . . . 2.63% 9/16/19 USD 61 60,462 0.4
COMMUNICATIONS - TELECOMMUNICATIONSBritish Telecommunications PLC . . . . . . . . . . . . . . . . . . . . . . . . . . 0.50% 6/23/22 EUR 46 51,725 0.3Deutsche Telekom International Finance BV . . . . . . . . . . . . . . . . . 6.00% 7/08/19 USD 30 30,581 0.2Orange SA . . . . . . . . . . . . . . . . . . . . . . . . . . . . . . . . . . . . . . . . . . . . 5.38% 7/08/19 37 37,037 0.2Orange SA . . . . . . . . . . . . . . . . . . . . . . . . . . . . . . . . . . . . . . . . . . . . 7.25% 11/10/20 GBP 11 15,799 0.1 135,142 0.8
CONSUMER CYCLICAL - AUTOMOTIVEBMW Finance NV . . . . . . . . . . . . . . . . . . . . . . . . . . . . . . . . . . . . . . 0.25% 1/14/22 EUR 56 63,278 0.4Daimler AG . . . . . . . . . . . . . . . . . . . . . . . . . . . . . . . . . . . . . . . . . . . 2.25% 1/24/22 13 15,243 0.1Daimler International Finance BV. . . . . . . . . . . . . . . . . . . . . . . . . . 0.25% 8/09/21 33 36,962 0.2FCE Bank PLC . . . . . . . . . . . . . . . . . . . . . . . . . . . . . . . . . . . . . . . . 3.25% 11/19/20 GBP 38 50,279 0.3Harley-Davidson Financial Services, Inc. . . . . . . . . . . . . . . . . . . . . 2.85% 1/15/21 USD 38 36,946 0.2Harley-Davidson Financial Services, Inc.(a) . . . . . . . . . . . . . . . . . . 3.56% 3/02/21 27 26,557 0.2Nissan Motor Acceptance Corp. . . . . . . . . . . . . . . . . . . . . . . . . . . . 2.15% 9/28/20 28 27,590 0.2RCI Banque SA . . . . . . . . . . . . . . . . . . . . . . . . . . . . . . . . . . . . . . . . 0.25% 7/12/21 EUR 42 47,555 0.3Toyota Motor Credit Corp.. . . . . . . . . . . . . . . . . . . . . . . . . . . . . . . . 0.00% 7/21/21 43 49,455 0.3

AB FCP I
136
Portfolio of investments (continued) GlobalBondIIPortfolio
Rate Date Principal Value Net Assets (000) (USD) %
Volkswagen Financial Services AG . . . . . . . . . . . . . . . . . . . . . . . . . 1.38% 10/16/23 EUR 41 $ 46,825 0.3%Volkswagen International Finance NV, Series 4Y . . . . . . . . . . . . . . 0.50% 3/30/21 21 23,868 0.1 424,558 2.6
CONSUMER CYCLICAL - ENTERTAINMENTCarnival Corp. . . . . . . . . . . . . . . . . . . . . . . . . . . . . . . . . . . . . . . . . . 1.13% 11/06/19 28 32,261 0.2Carnival Corp. . . . . . . . . . . . . . . . . . . . . . . . . . . . . . . . . . . . . . . . . . 1.63% 2/22/21 25 29,152 0.2 61,413 0.4
CONSUMER CYCLICAL - OTHERMarriott International, Inc./MD . . . . . . . . . . . . . . . . . . . . . . . . . . . . 2.30% 1/15/22 USD 40 38,802 0.2
CONSUMER CYCLICAL - RESTAURANTSMcDonald’s Corp. . . . . . . . . . . . . . . . . . . . . . . . . . . . . . . . . . . . . . . 6.38% 2/03/20 GBP 21 29,073 0.2McDonald’s Corp., Series G . . . . . . . . . . . . . . . . . . . . . . . . . . . . . . 0.50% 1/15/21 EUR 26 30,114 0.2 59,187 0.4
CONSUMER CYCLICAL - RETAILERSLVMH Moet Hennessy Louis Vuitton SE . . . . . . . . . . . . . . . . . . . . 0.00% 5/26/20 26 29,714 0.2LVMH Moet Hennessy Louis Vuitton SE . . . . . . . . . . . . . . . . . . . . 0.00% 2/28/21 5 5,970 0.0 35,684 0.2
CONSUMER NON-CYCLICALAbbott Ireland Financing DAC . . . . . . . . . . . . . . . . . . . . . . . . . . . . 0.00% 9/27/20 55 62,118 0.4Amgen, Inc. . . . . . . . . . . . . . . . . . . . . . . . . . . . . . . . . . . . . . . . . . . . 1.25% 2/25/22 44 51,740 0.3AstraZeneca PLC(a). . . . . . . . . . . . . . . . . . . . . . . . . . . . . . . . . . . . . 3.39% 6/10/22 USD 22 22,010 0.1Bayer US Finance LLC . . . . . . . . . . . . . . . . . . . . . . . . . . . . . . . . . . 2.38% 10/08/19 61 60,586 0.4Coca-Cola Co. (The) . . . . . . . . . . . . . . . . . . . . . . . . . . . . . . . . . . . . 0.00% 3/09/21 EUR 52 59,137 0.4Coca-Cola European Partners PLC . . . . . . . . . . . . . . . . . . . . . . . . . 0.75% 2/24/22 45 51,697 0.3DH Europe Finance SA(a) . . . . . . . . . . . . . . . . . . . . . . . . . . . . . . . . 0.00% 6/30/22 56 62,622 0.4Diageo Finance PLC . . . . . . . . . . . . . . . . . . . . . . . . . . . . . . . . . . . . 0.00% 11/17/20 27 30,745 0.2Diageo Finance PLC . . . . . . . . . . . . . . . . . . . . . . . . . . . . . . . . . . . . 0.25% 10/22/21 33 37,829 0.2FBG Finance Pty Ltd.(a) . . . . . . . . . . . . . . . . . . . . . . . . . . . . . . . . . 2.95% 9/06/22 AUD 64 44,884 0.3GlaxoSmithKline Capital PLC . . . . . . . . . . . . . . . . . . . . . . . . . . . . 0.00% 9/12/20 EUR 50 56,399 0.4McKesson Corp. . . . . . . . . . . . . . . . . . . . . . . . . . . . . . . . . . . . . . . . 0.63% 8/17/21 53 61,018 0.4Merck & Co., Inc. . . . . . . . . . . . . . . . . . . . . . . . . . . . . . . . . . . . . . . 1.13% 10/15/21 51 59,119 0.4PepsiCo, Inc. . . . . . . . . . . . . . . . . . . . . . . . . . . . . . . . . . . . . . . . . . . 1.75% 4/28/21 57 67,467 0.4Pfizer, Inc. . . . . . . . . . . . . . . . . . . . . . . . . . . . . . . . . . . . . . . . . . . . . 0.00% 3/06/20 45 51,379 0.3Takeda Pharmaceutical Co., Ltd. . . . . . . . . . . . . . . . . . . . . . . . . . . . 0.38% 11/21/20 46 52,640 0.3 831,390 5.2
ENERGYBP Capital Markets PLC . . . . . . . . . . . . . . . . . . . . . . . . . . . . . . . . . 2.18% 9/28/21 51 60,711 0.4Dolphin Energy Ltd. LLC . . . . . . . . . . . . . . . . . . . . . . . . . . . . . . . . 5.89% 6/15/19 USD 11 11,089 0.1Korea Gas Corp.. . . . . . . . . . . . . . . . . . . . . . . . . . . . . . . . . . . . . . . . 4.25% 11/02/20 26 26,722 0.1Ras Laffan Liquefied Natural Gas Co., Ltd. 3 . . . . . . . . . . . . . . . . . 6.75% 9/30/19 36 36,796 0.2Schlumberger Finance Canada Ltd. . . . . . . . . . . . . . . . . . . . . . . . . . 2.20% 11/20/20 11 10,594 0.1Shell International Finance BV . . . . . . . . . . . . . . . . . . . . . . . . . . . . 1.25% 3/15/22 EUR 52 60,926 0.4TransCanada PipeLines Ltd. . . . . . . . . . . . . . . . . . . . . . . . . . . . . . . 2.13% 11/15/19 USD 57 57,053 0.3TransCanada PipeLines Ltd. . . . . . . . . . . . . . . . . . . . . . . . . . . . . . . 9.88% 1/01/21 11 12,260 0.1 276,151 1.7
SERVICESeBay, Inc. . . . . . . . . . . . . . . . . . . . . . . . . . . . . . . . . . . . . . . . . . . . . . 2.88% 8/01/21 73 72,366 0.5
TECHNOLOGYDXC Technology Co.. . . . . . . . . . . . . . . . . . . . . . . . . . . . . . . . . . . . 2.88% 3/27/20 34 33,382 0.2Fidelity National Information Services, Inc. . . . . . . . . . . . . . . . . . . 0.40% 1/15/21 EUR 53 60,903 0.4Hewlett Packard Enterprise Co.. . . . . . . . . . . . . . . . . . . . . . . . . . . . 2.10% 10/04/19 USD 15 14,895 0.1Honeywell International, Inc. . . . . . . . . . . . . . . . . . . . . . . . . . . . . . 0.65% 2/21/20 EUR 72 82,013 0.5IBM Corp. . . . . . . . . . . . . . . . . . . . . . . . . . . . . . . . . . . . . . . . . . . . . 0.38% 1/31/23 51 58,155 0.3IBM Credit LLC(a) . . . . . . . . . . . . . . . . . . . . . . . . . . . . . . . . . . . . . 2.89% 2/05/21 USD 18 18,301 0.1LG Display Co., Ltd. . . . . . . . . . . . . . . . . . . . . . . . . . . . . . . . . . . . . 3.88% 11/15/21 14 14,440 0.1Oracle Corp.. . . . . . . . . . . . . . . . . . . . . . . . . . . . . . . . . . . . . . . . . . . 2.25% 1/10/21 EUR 49 58,462 0.4 340,551 2.1
TRANSPORTATION - SERVICESFedEx Corp. . . . . . . . . . . . . . . . . . . . . . . . . . . . . . . . . . . . . . . . . . . . 0.50% 4/09/20 53 60,091 0.4Heathrow Funding Ltd. . . . . . . . . . . . . . . . . . . . . . . . . . . . . . . . . . . 1.88% 5/23/22 32 38,046 0.2Penske Truck Leasing Co. LP/PTL Finance Corp. . . . . . . . . . . . . . 3.65% 7/29/21 USD 45 45,500 0.3 143,637 0.9 2,915,826 18.1
FINANCIAL INSTITUTIONSBANKING
American Express Credit Corp. . . . . . . . . . . . . . . . . . . . . . . . . . . . . 0.63% 11/22/21 EUR 8 9,546 0.1Banco Santander SA . . . . . . . . . . . . . . . . . . . . . . . . . . . . . . . . . . . . 2.75% 9/12/23 GBP 37 48,941 0.3Bank of America Corp. . . . . . . . . . . . . . . . . . . . . . . . . . . . . . . . . . . 0.74% 2/07/22 EUR 46 53,309 0.3Banque Federative du Credit Mutuel SA. . . . . . . . . . . . . . . . . . . . . 0.38% 1/13/22 21 24,022 0.1Banque Federative du Credit Mutuel SA. . . . . . . . . . . . . . . . . . . . . 2.20% 7/20/20 USD 27 26,678 0.2
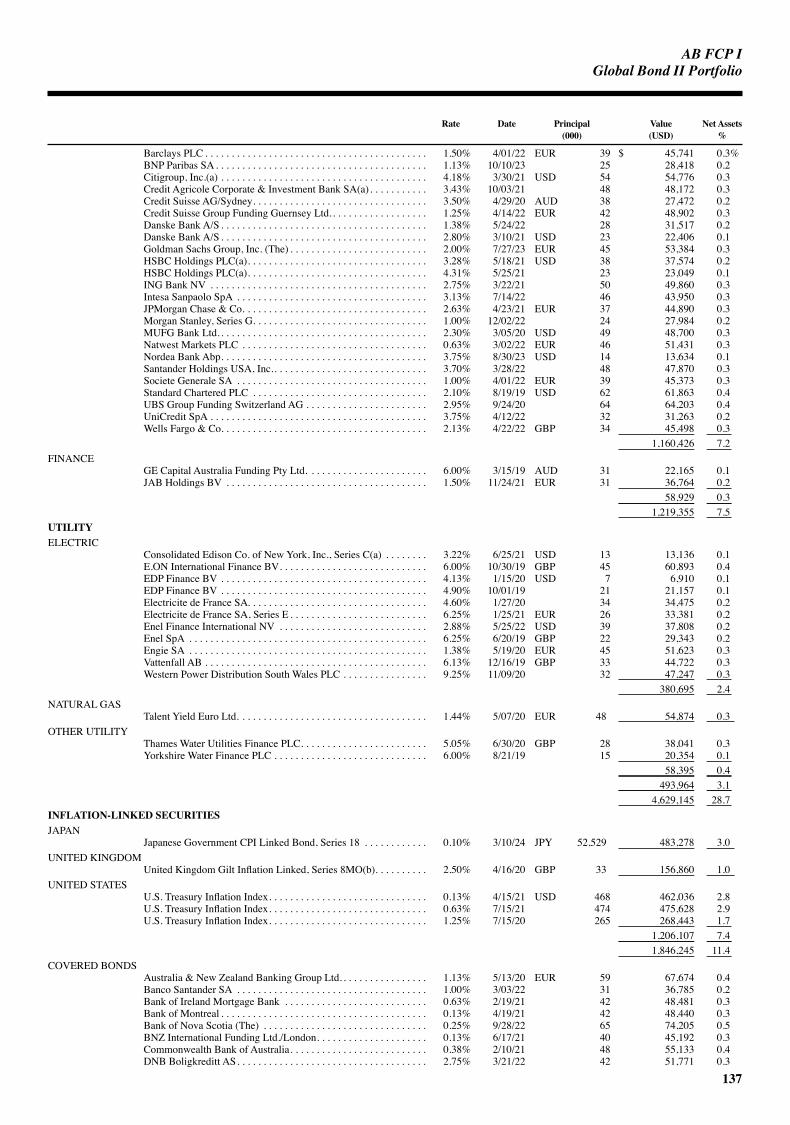
AB FCP I
137
GlobalBondIIPortfolio
Rate Date Principal Value Net Assets (000) (USD) %
Barclays PLC . . . . . . . . . . . . . . . . . . . . . . . . . . . . . . . . . . . . . . . . . . 1.50% 4/01/22 EUR 39 $ 45,741 0.3%BNP Paribas SA. . . . . . . . . . . . . . . . . . . . . . . . . . . . . . . . . . . . . . . . 1.13% 10/10/23 25 28,418 0.2Citigroup, Inc.(a) . . . . . . . . . . . . . . . . . . . . . . . . . . . . . . . . . . . . . . . 4.18% 3/30/21 USD 54 54,776 0.3Credit Agricole Corporate & Investment Bank SA(a). . . . . . . . . . . 3.43% 10/03/21 48 48,172 0.3Credit Suisse AG/Sydney. . . . . . . . . . . . . . . . . . . . . . . . . . . . . . . . . 3.50% 4/29/20 AUD 38 27,472 0.2Credit Suisse Group Funding Guernsey Ltd.. . . . . . . . . . . . . . . . . . 1.25% 4/14/22 EUR 42 48,902 0.3Danske Bank A/S . . . . . . . . . . . . . . . . . . . . . . . . . . . . . . . . . . . . . . . 1.38% 5/24/22 28 31,517 0.2Danske Bank A/S . . . . . . . . . . . . . . . . . . . . . . . . . . . . . . . . . . . . . . . 2.80% 3/10/21 USD 23 22,406 0.1Goldman Sachs Group, Inc. (The) . . . . . . . . . . . . . . . . . . . . . . . . . . 2.00% 7/27/23 EUR 45 53,384 0.3HSBC Holdings PLC(a). . . . . . . . . . . . . . . . . . . . . . . . . . . . . . . . . . 3.28% 5/18/21 USD 38 37,574 0.2HSBC Holdings PLC(a). . . . . . . . . . . . . . . . . . . . . . . . . . . . . . . . . . 4.31% 5/25/21 23 23,049 0.1ING Bank NV . . . . . . . . . . . . . . . . . . . . . . . . . . . . . . . . . . . . . . . . . 2.75% 3/22/21 50 49,860 0.3Intesa Sanpaolo SpA . . . . . . . . . . . . . . . . . . . . . . . . . . . . . . . . . . . . 3.13% 7/14/22 46 43,950 0.3JPMorgan Chase & Co. . . . . . . . . . . . . . . . . . . . . . . . . . . . . . . . . . . 2.63% 4/23/21 EUR 37 44,890 0.3Morgan Stanley, Series G. . . . . . . . . . . . . . . . . . . . . . . . . . . . . . . . . 1.00% 12/02/22 24 27,984 0.2MUFG Bank Ltd. . . . . . . . . . . . . . . . . . . . . . . . . . . . . . . . . . . . . . . . 2.30% 3/05/20 USD 49 48,700 0.3Natwest Markets PLC . . . . . . . . . . . . . . . . . . . . . . . . . . . . . . . . . . . 0.63% 3/02/22 EUR 46 51,431 0.3Nordea Bank Abp. . . . . . . . . . . . . . . . . . . . . . . . . . . . . . . . . . . . . . . 3.75% 8/30/23 USD 14 13,634 0.1Santander Holdings USA, Inc.. . . . . . . . . . . . . . . . . . . . . . . . . . . . . 3.70% 3/28/22 48 47,870 0.3Societe Generale SA . . . . . . . . . . . . . . . . . . . . . . . . . . . . . . . . . . . . 1.00% 4/01/22 EUR 39 45,373 0.3Standard Chartered PLC . . . . . . . . . . . . . . . . . . . . . . . . . . . . . . . . . 2.10% 8/19/19 USD 62 61,863 0.4UBS Group Funding Switzerland AG . . . . . . . . . . . . . . . . . . . . . . . 2.95% 9/24/20 64 64,203 0.4UniCredit SpA . . . . . . . . . . . . . . . . . . . . . . . . . . . . . . . . . . . . . . . . . 3.75% 4/12/22 32 31,263 0.2Wells Fargo & Co. . . . . . . . . . . . . . . . . . . . . . . . . . . . . . . . . . . . . . . 2.13% 4/22/22 GBP 34 45,498 0.3 1,160,426 7.2
FINANCEGE Capital Australia Funding Pty Ltd. . . . . . . . . . . . . . . . . . . . . . . 6.00% 3/15/19 AUD 31 22,165 0.1JAB Holdings BV . . . . . . . . . . . . . . . . . . . . . . . . . . . . . . . . . . . . . . 1.50% 11/24/21 EUR 31 36,764 0.2 58,929 0.3 1,219,355 7.5
UTILITYELECTRIC
Consolidated Edison Co. of New York, Inc., Series C(a) . . . . . . . . 3.22% 6/25/21 USD 13 13,136 0.1E.ON International Finance BV. . . . . . . . . . . . . . . . . . . . . . . . . . . . 6.00% 10/30/19 GBP 45 60,893 0.4EDP Finance BV . . . . . . . . . . . . . . . . . . . . . . . . . . . . . . . . . . . . . . . 4.13% 1/15/20 USD 7 6,910 0.1EDP Finance BV . . . . . . . . . . . . . . . . . . . . . . . . . . . . . . . . . . . . . . . 4.90% 10/01/19 21 21,157 0.1Electricite de France SA. . . . . . . . . . . . . . . . . . . . . . . . . . . . . . . . . . 4.60% 1/27/20 34 34,475 0.2Electricite de France SA, Series E . . . . . . . . . . . . . . . . . . . . . . . . . . 6.25% 1/25/21 EUR 26 33,381 0.2Enel Finance International NV . . . . . . . . . . . . . . . . . . . . . . . . . . . . 2.88% 5/25/22 USD 39 37,808 0.2Enel SpA . . . . . . . . . . . . . . . . . . . . . . . . . . . . . . . . . . . . . . . . . . . . . 6.25% 6/20/19 GBP 22 29,343 0.2Engie SA . . . . . . . . . . . . . . . . . . . . . . . . . . . . . . . . . . . . . . . . . . . . . 1.38% 5/19/20 EUR 45 51,623 0.3Vattenfall AB . . . . . . . . . . . . . . . . . . . . . . . . . . . . . . . . . . . . . . . . . . 6.13% 12/16/19 GBP 33 44,722 0.3Western Power Distribution South Wales PLC . . . . . . . . . . . . . . . . 9.25% 11/09/20 32 47,247 0.3 380,695 2.4
NATURAL GASTalent Yield Euro Ltd. . . . . . . . . . . . . . . . . . . . . . . . . . . . . . . . . . . . 1.44% 5/07/20 EUR 48 54,874 0.3
OTHER UTILITYThames Water Utilities Finance PLC. . . . . . . . . . . . . . . . . . . . . . . . 5.05% 6/30/20 GBP 28 38,041 0.3Yorkshire Water Finance PLC . . . . . . . . . . . . . . . . . . . . . . . . . . . . . 6.00% 8/21/19 15 20,354 0.1 58,395 0.4 493,964 3.1 4,629,145 28.7
INFLATION-LINKED SECURITIESJAPAN
Japanese Government CPI Linked Bond, Series 18 . . . . . . . . . . . . 0.10% 3/10/24 JPY 52,529 483,278 3.0UNITED KINGDOM
United Kingdom Gilt Inflation Linked, Series 8MO(b). . . . . . . . . . 2.50% 4/16/20 GBP 33 156,860 1.0UNITED STATES
U.S. Treasury Inflation Index. . . . . . . . . . . . . . . . . . . . . . . . . . . . . . 0.13% 4/15/21 USD 468 462,036 2.8U.S. Treasury Inflation Index. . . . . . . . . . . . . . . . . . . . . . . . . . . . . . 0.63% 7/15/21 474 475,628 2.9U.S. Treasury Inflation Index. . . . . . . . . . . . . . . . . . . . . . . . . . . . . . 1.25% 7/15/20 265 268,443 1.7 1,206,107 7.4 1,846,245 11.4
COVERED BONDSAustralia & New Zealand Banking Group Ltd. . . . . . . . . . . . . . . . . 1.13% 5/13/20 EUR 59 67,674 0.4Banco Santander SA . . . . . . . . . . . . . . . . . . . . . . . . . . . . . . . . . . . . 1.00% 3/03/22 31 36,785 0.2Bank of Ireland Mortgage Bank . . . . . . . . . . . . . . . . . . . . . . . . . . . 0.63% 2/19/21 42 48,481 0.3Bank of Montreal . . . . . . . . . . . . . . . . . . . . . . . . . . . . . . . . . . . . . . . 0.13% 4/19/21 42 48,440 0.3Bank of Nova Scotia (The) . . . . . . . . . . . . . . . . . . . . . . . . . . . . . . . 0.25% 9/28/22 65 74,205 0.5BNZ International Funding Ltd./London. . . . . . . . . . . . . . . . . . . . . 0.13% 6/17/21 40 45,192 0.3Commonwealth Bank of Australia. . . . . . . . . . . . . . . . . . . . . . . . . . 0.38% 2/10/21 48 55,133 0.4DNB Boligkreditt AS. . . . . . . . . . . . . . . . . . . . . . . . . . . . . . . . . . . . 2.75% 3/21/22 42 51,771 0.3

AB FCP I
138
Portfolio of investments (continued) GlobalBondIIPortfolio
Rate Date Principal Value Net Assets (000) (USD) %
DNB Boligkreditt AS. . . . . . . . . . . . . . . . . . . . . . . . . . . . . . . . . . . . 3.88% 6/16/21 EUR 14 $ 17,100 0.1%Korea Housing Finance Corp. . . . . . . . . . . . . . . . . . . . . . . . . . . . . . 2.00% 10/11/21 USD 31 30,518 0.2National Australia Bank Ltd. . . . . . . . . . . . . . . . . . . . . . . . . . . . . . . 1.38% 5/28/21 EUR 41 48,216 0.3National Bank of Canada . . . . . . . . . . . . . . . . . . . . . . . . . . . . . . . . . 1.50% 3/25/21 42 49,664 0.3Royal Bank of Canada . . . . . . . . . . . . . . . . . . . . . . . . . . . . . . . . . . . 1.63% 8/04/20 58 67,693 0.4Stadshypotek AB . . . . . . . . . . . . . . . . . . . . . . . . . . . . . . . . . . . . . . . 0.63% 11/10/21 38 43,660 0.3Toronto-Dominion Bank (The) . . . . . . . . . . . . . . . . . . . . . . . . . . . . 0.38% 1/12/21 57 65,108 0.4Westpac Banking Corp. . . . . . . . . . . . . . . . . . . . . . . . . . . . . . . . . . . 0.75% 7/22/21 43 49,375 0.3 799,015 5.0
MORTGAGE PASS-THROUGHSAGENCY FIXED RATE 30-YEAR
Federal National Mortgage Association, Series 1999 . . . . . . . . . . . 7.00% 9/01/29 USD 0* 28 0.0Federal National Mortgage Association, Series 1999 . . . . . . . . . . . 7.00% 10/01/29 0* 202 0.0Federal National Mortgage Association, Series 2000 . . . . . . . . . . . 7.00% 11/01/30 0* 32 0.0Federal National Mortgage Association, Series 2000 . . . . . . . . . . . 7.00% 12/01/30 0* 29 0.0Federal National Mortgage Association, Series 2001 . . . . . . . . . . . 7.00% 2/01/31 0* 101 0.0Federal National Mortgage Association, Series 2001 . . . . . . . . . . . 7.00% 5/01/31 0* 20 0.0Federal National Mortgage Association, Series 2001 . . . . . . . . . . . 7.00% 9/01/31 0* 399 0.0Federal National Mortgage Association, Series 2001 . . . . . . . . . . . 7.00% 11/01/31 0* 113 0.0Federal National Mortgage Association, Series 2001 . . . . . . . . . . . 7.00% 12/01/31 0* 344 0.0Federal National Mortgage Association, Series 2001 . . . . . . . . . . . 7.00% 12/01/31 1 778 0.0Federal National Mortgage Association, Series 2001 . . . . . . . . . . . 7.00% 1/01/32 0* 66 0.0Federal National Mortgage Association, Series 2002 . . . . . . . . . . . 7.00% 2/01/32 0* 101 0.0Federal National Mortgage Association, Series 2019, TBA . . . . . . 3.50% 3/01/49 227 227,092 1.4Federal National Mortgage Association, Series 2019, TBA . . . . . . 4.50% 3/01/49 440 455,331 2.8Federal National Mortgage Association, Series 2019, TBA . . . . . . 5.00% 3/01/49 80 83,888 0.6 768,524 4.8
LOCAL GOVERNMENTS - PROVINCIAL BONDSCANADA
Hydro-Quebec, Series HL . . . . . . . . . . . . . . . . . . . . . . . . . . . . . . . . 11.00% 8/15/20 CAD 97 83,205 0.5Hydro-Quebec, Series HX . . . . . . . . . . . . . . . . . . . . . . . . . . . . . . . . 10.50% 10/15/21 210 193,606 1.2Ontario Electricity Financial Corp., Series DK2 . . . . . . . . . . . . . . . 10.00% 2/06/20 76 62,083 0.4Province of British Columbia Canada, Series XW . . . . . . . . . . . . . 10.60% 9/05/20 108 92,133 0.6Province of Ontario Canada, Series HC . . . . . . . . . . . . . . . . . . . . . 9.50% 7/13/22 79 73,873 0.4 504,900 3.1
COLLATERALIZED MORTGAGE OBLIGATIONSRISK SHARE FLOATING RATE
Federal Home Loan Mortgage Corp. Structured Agency Credit Risk Debt Notes
Series 2014-DN3, Class M3(a) . . . . . . . . . . . . . . . . . . . . . . . . . . 6.49% 8/25/24 USD 28 30,499 0.2Series 2015-DNA3, Class M2(a). . . . . . . . . . . . . . . . . . . . . . . . . 5.34% 4/25/28 28 29,197 0.2Series 2015-HQ2, Class M2(a) . . . . . . . . . . . . . . . . . . . . . . . . . . 4.44% 5/25/25 35 35,603 0.2Series 2015-HQA1, Class M2(a). . . . . . . . . . . . . . . . . . . . . . . . . 5.14% 3/25/28 14 14,321 0.1
Federal National Mortgage Association Connecticut Avenue Securities
Series 2014-C03, Class 2M2(a). . . . . . . . . . . . . . . . . . . . . . . . . . 5.39% 7/25/24 50 52,927 0.3Series 2014-C04, Class 1M2(a). . . . . . . . . . . . . . . . . . . . . . . . . . 7.39% 11/25/24 59 66,442 0.4Series 2014-C04, Class 2M2(a). . . . . . . . . . . . . . . . . . . . . . . . . . 7.49% 11/25/24 57 63,504 0.4Series 2016-C02, Class 1M1(a). . . . . . . . . . . . . . . . . . . . . . . . . . 4.64% 9/25/28 0* 237 0.0Series 2016-C02, Class 1M2(a). . . . . . . . . . . . . . . . . . . . . . . . . . 8.49% 9/25/28 19 22,286 0.1Series 2016-C04, Class 1M1(a). . . . . . . . . . . . . . . . . . . . . . . . . . 3.94% 1/25/29 9 8,625 0.1Series 2016-C05, Class 2M1(a). . . . . . . . . . . . . . . . . . . . . . . . . . 3.84% 1/25/29 2 2,021 0.0Series 2016-C06, Class 1M1(a). . . . . . . . . . . . . . . . . . . . . . . . . . 3.79% 4/25/29 46 46,567 0.3Series 2016-C07, Class 2M1(a). . . . . . . . . . . . . . . . . . . . . . . . . . 3.79% 5/25/29 4 3,513 0.0
375,742 2.3GOVERNMENTS - SOVEREIGN BONDSFRANCE
Dexia Credit Local SA. . . . . . . . . . . . . . . . . . . . . . . . . . . . . . . . . . . 2.00% 1/22/21 EUR 136 161,548 1.0GERMANY
Kreditanstalt fuer Wiederaufbau . . . . . . . . . . . . . . . . . . . . . . . . . . . 6.25% 5/19/21 AUD 167 128,815 0.8JAPAN
Japan Finance Organization for Municipalities . . . . . . . . . . . . . . . . 5.75% 8/09/19 GBP 33 44,329 0.3 334,692 2.1
QUASI-SOVEREIGNSQUASI-SOVEREIGN BONDSCHINA
Export-Import Bank of China (The) . . . . . . . . . . . . . . . . . . . . . . . . 0.75% 6/08/22 EUR 48 $ 54,611 0.4Sinopec Group Overseas Development 2015 Ltd.. . . . . . . . . . . . . . 1.00% 4/28/22 30 34,537 0.2State Grid Overseas Investment 2016 Ltd. . . . . . . . . . . . . . . . . . . . 1.25% 5/19/22 30 34,176 0.2 123,324 0.8
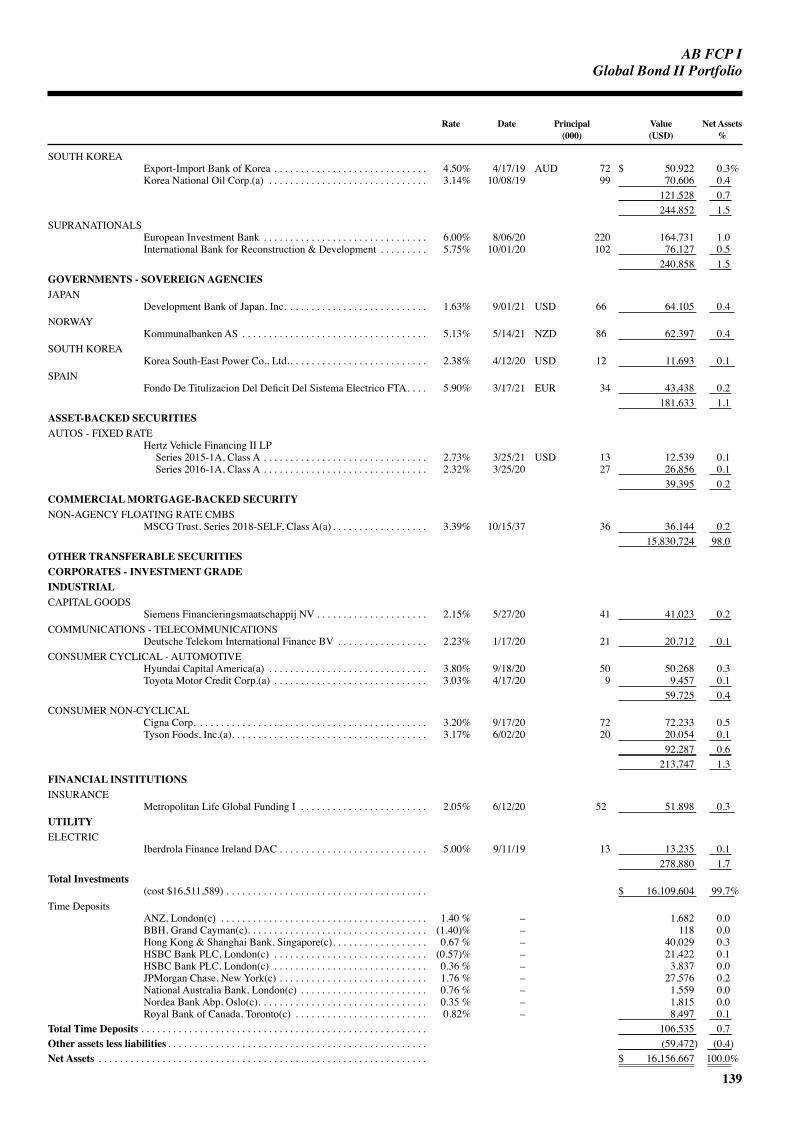
AB FCP I
139
GlobalBondIIPortfolio
Rate Date Principal Value Net Assets (000) (USD) %
SOUTH KOREAExport-Import Bank of Korea . . . . . . . . . . . . . . . . . . . . . . . . . . . . . 4.50% 4/17/19 AUD 72 $ 50,922 0.3%Korea National Oil Corp.(a) . . . . . . . . . . . . . . . . . . . . . . . . . . . . . . 3.14% 10/08/19 99 70,606 0.4 121,528 0.7 244,852 1.5
SUPRANATIONALSEuropean Investment Bank . . . . . . . . . . . . . . . . . . . . . . . . . . . . . . . 6.00% 8/06/20 220 164,731 1.0International Bank for Reconstruction & Development . . . . . . . . . 5.75% 10/01/20 102 76,127 0.5 240,858 1.5
GOVERNMENTS - SOVEREIGN AGENCIESJAPAN
Development Bank of Japan, Inc. . . . . . . . . . . . . . . . . . . . . . . . . . . 1.63% 9/01/21 USD 66 64,105 0.4NORWAY
Kommunalbanken AS . . . . . . . . . . . . . . . . . . . . . . . . . . . . . . . . . . . 5.13% 5/14/21 NZD 86 62,397 0.4SOUTH KOREA
Korea South-East Power Co., Ltd.. . . . . . . . . . . . . . . . . . . . . . . . . . 2.38% 4/12/20 USD 12 11,693 0.1SPAIN
Fondo De Titulizacion Del Deficit Del Sistema Electrico FTA. . . . 5.90% 3/17/21 EUR 34 43,438 0.2 181,633 1.1
ASSET-BACKED SECURITIESAUTOS - FIXED RATE
Hertz Vehicle Financing II LPSeries 2015-1A, Class A . . . . . . . . . . . . . . . . . . . . . . . . . . . . . . . 2.73% 3/25/21 USD 13 12,539 0.1Series 2016-1A, Class A . . . . . . . . . . . . . . . . . . . . . . . . . . . . . . . 2.32% 3/25/20 27 26,856 0.1
39,395 0.2COMMERCIAL MORTGAGE-BACKED SECURITYNON-AGENCY FLOATING RATE CMBS
MSCG Trust, Series 2018-SELF, Class A(a) . . . . . . . . . . . . . . . . . . 3.39% 10/15/37 36 36,144 0.2 15,830,724 98.0
OTHER TRANSFERABLE SECURITIESCORPORATES - INVESTMENT GRADEINDUSTRIALCAPITAL GOODS
Siemens Financieringsmaatschappij NV . . . . . . . . . . . . . . . . . . . . . 2.15% 5/27/20 41 41,023 0.2COMMUNICATIONS - TELECOMMUNICATIONS
Deutsche Telekom International Finance BV . . . . . . . . . . . . . . . . . 2.23% 1/17/20 21 20,712 0.1CONSUMER CYCLICAL - AUTOMOTIVE
Hyundai Capital America(a) . . . . . . . . . . . . . . . . . . . . . . . . . . . . . . 3.80% 9/18/20 50 50,268 0.3Toyota Motor Credit Corp.(a) . . . . . . . . . . . . . . . . . . . . . . . . . . . . . 3.03% 4/17/20 9 9,457 0.1 59,725 0.4
CONSUMER NON-CYCLICALCigna Corp. . . . . . . . . . . . . . . . . . . . . . . . . . . . . . . . . . . . . . . . . . . . 3.20% 9/17/20 72 72,233 0.5Tyson Foods, Inc.(a). . . . . . . . . . . . . . . . . . . . . . . . . . . . . . . . . . . . . 3.17% 6/02/20 20 20,054 0.1 92,287 0.6 213,747 1.3
FINANCIAL INSTITUTIONSINSURANCE
Metropolitan Life Global Funding I . . . . . . . . . . . . . . . . . . . . . . . . 2.05% 6/12/20 52 51,898 0.3UTILITYELECTRIC
Iberdrola Finance Ireland DAC . . . . . . . . . . . . . . . . . . . . . . . . . . . . 5.00% 9/11/19 13 13,235 0.1 278,880 1.7
Total Investments(cost $16,511,589) . . . . . . . . . . . . . . . . . . . . . . . . . . . . . . . . . . . . . . $ 16,109,604 99.7%
Time DepositsANZ, London(c) . . . . . . . . . . . . . . . . . . . . . . . . . . . . . . . . . . . . . . . 1.40 % – 1,682 0.0BBH, Grand Cayman(c). . . . . . . . . . . . . . . . . . . . . . . . . . . . . . . . . . (1.40)% – 118 0.0Hong Kong & Shanghai Bank, Singapore(c). . . . . . . . . . . . . . . . . . 0.67 % – 40,029 0.3HSBC Bank PLC, London(c) . . . . . . . . . . . . . . . . . . . . . . . . . . . . . (0.57)% – 21,422 0.1HSBC Bank PLC, London(c) . . . . . . . . . . . . . . . . . . . . . . . . . . . . . 0.36 % – 3,837 0.0JPMorgan Chase, New York(c) . . . . . . . . . . . . . . . . . . . . . . . . . . . . 1.76 % – 27,576 0.2National Australia Bank, London(c) . . . . . . . . . . . . . . . . . . . . . . . . 0.76 % – 1,559 0.0Nordea Bank Abp, Oslo(c). . . . . . . . . . . . . . . . . . . . . . . . . . . . . . . . 0.35 % – 1,815 0.0Royal Bank of Canada, Toronto(c) . . . . . . . . . . . . . . . . . . . . . . . . . 0.82% – 8,497 0.1
Total Time Deposits . . . . . . . . . . . . . . . . . . . . . . . . . . . . . . . . . . . . . . . . . . . . . . . . . . . . . . 106,535 0.7Other assets less liabilities . . . . . . . . . . . . . . . . . . . . . . . . . . . . . . . . . . . . . . . . . . . . . . . . . (59,472) (0.4)Net Assets . . . . . . . . . . . . . . . . . . . . . . . . . . . . . . . . . . . . . . . . . . . . . . . . . . . . . . . . . . . . . . $ 16,156,667 100.0%

AB FCP I
140
Portfolio of investments (continued) GlobalBondIIPortfolio
FUTURES
Unrealized Number of Appreciation/ Type Expiration Date Contracts Original Value Market Value (Depreciation)
Long10 Yr Australian Bond Futures. . . . . . . . . . . . . . . . . . . . . . . . . . . . 3/15/19 7 $ 653,198 $ 670,397 $ 17,19910 Yr Canadian Bond Futures . . . . . . . . . . . . . . . . . . . . . . . . . . . . 6/19/19 2 207,166 206,254 (912)Euro Buxl 30 Yr Bond Futures. . . . . . . . . . . . . . . . . . . . . . . . . . . . 3/07/19 2 404,909 418,673 13,764Euro-BOBL Futures . . . . . . . . . . . . . . . . . . . . . . . . . . . . . . . . . . . . 3/07/19 2 301,754 301,924 170Euro-Bono Futures . . . . . . . . . . . . . . . . . . . . . . . . . . . . . . . . . . . . . 3/07/19 1 162,917 168,172 5,255Euro-BTP Futures. . . . . . . . . . . . . . . . . . . . . . . . . . . . . . . . . . . . . . 3/07/19 3 425,554 437,600 12,046Euro-OAT Futures . . . . . . . . . . . . . . . . . . . . . . . . . . . . . . . . . . . . . 3/07/19 2 343,169 347,832 4,663Japan 10 Yr Bond (OSE) Futures . . . . . . . . . . . . . . . . . . . . . . . . . . 3/13/19 1 1,361,997 1,370,296 8,299Korea 3 Yr Bond Futures . . . . . . . . . . . . . . . . . . . . . . . . . . . . . . . . 3/19/19 2 242,134 242,036 (98)Long Gilt Futures . . . . . . . . . . . . . . . . . . . . . . . . . . . . . . . . . . . . . . 6/26/19 1 168,778 166,842 (1,936)U.S. 10 Yr Ultra Futures. . . . . . . . . . . . . . . . . . . . . . . . . . . . . . . . . 6/19/19 10 1,299,297 1,294,531 (4,766)U.S. T-Note 2 Yr (CBT) Futures . . . . . . . . . . . . . . . . . . . . . . . . . . 6/28/19 4 851,793 851,762 (31)U.S. T-Note 5 Yr (CBT) Futures . . . . . . . . . . . . . . . . . . . . . . . . . . 6/28/19 8 916,875 916,500 (375)U.S. T-Note 10 Yr (CBT) Futures . . . . . . . . . . . . . . . . . . . . . . . . . 6/19/19 1 122,555 122,000 (555)U.S. Ultra Bond (CBT) Futures . . . . . . . . . . . . . . . . . . . . . . . . . . . 6/19/19 3 485,383 478,781 (6,602)
Short10 Yr Mini JGB Futures . . . . . . . . . . . . . . . . . . . . . . . . . . . . . . . . . 3/12/19 4 544,207 547,688 (3,481)3 Yr Australian Bond Futures. . . . . . . . . . . . . . . . . . . . . . . . . . . . . 3/15/19 5 396,066 399,819 (3,753)Euro-BOBL Futures . . . . . . . . . . . . . . . . . . . . . . . . . . . . . . . . . . . . 3/07/19 5 781,184 784,196 (3,012)Euro-Schatz Futures . . . . . . . . . . . . . . . . . . . . . . . . . . . . . . . . . . . . 3/07/19 19 2,430,791 2,429,152 1,639Japan 10 Yr Bond (OSE) Futures . . . . . . . . . . . . . . . . . . . . . . . . . . 3/13/19 0** 250,205 251,654 (1,449)U.S. T-Note 5 Yr (CBT) Futures . . . . . . . . . . . . . . . . . . . . . . . . . . 6/28/19 6 691,574 691,292 282 $ 36,347
Appreciation $ 63,317 Depreciation $ (26,970)
FORWARD FOREIGN CURRENCY CONTRACTS Contracts to In Exchange Unrealized Deliver For Settlement Appreciation/ Counterparty (000) (000) Date (Depreciation)
Australia and New Zealand Banking Group Ltd. . . . . . . . . . . . . EUR 44 USD 50 4/10/19 $ (185)Australia and New Zealand Banking Group Ltd. . . . . . . . . . . . . EUR 157 USD 181 4/10/19 2,243Australia and New Zealand Banking Group Ltd. . . . . . . . . . . . . USD 638 EUR 557 4/10/19 (2,791)Australia and New Zealand Banking Group Ltd. . . . . . . . . . . . . USD 88 EUR 77 4/10/19 295Barclays Bank PLC . . . . . . . . . . . . . . . . . . . . . . . . . . . . . . . . . . . USD 281 EUR 247 4/10/19 467BNP Paribas SA. . . . . . . . . . . . . . . . . . . . . . . . . . . . . . . . . . . . . . USD 66 CAD 88 3/07/19 904BNP Paribas SA. . . . . . . . . . . . . . . . . . . . . . . . . . . . . . . . . . . . . . USD 113 EUR 100 4/10/19 884Brown Brothers Harriman & Co.. . . . . . . . . . . . . . . . . . . . . . . . . EUR 97 USD 113 4/10/19 1,212Citibank, NA . . . . . . . . . . . . . . . . . . . . . . . . . . . . . . . . . . . . . . . . EUR 1,699 USD 1,957 3/11/19 23,380Citibank, NA . . . . . . . . . . . . . . . . . . . . . . . . . . . . . . . . . . . . . . . . USD 58 TWD 1,781 3/14/19 (688)Citibank, NA . . . . . . . . . . . . . . . . . . . . . . . . . . . . . . . . . . . . . . . . EUR 1,699 USD 1,935 3/22/19 (282)Citibank, NA . . . . . . . . . . . . . . . . . . . . . . . . . . . . . . . . . . . . . . . . GBP 546 USD 721 4/09/19 (4,988)Citibank, NA . . . . . . . . . . . . . . . . . . . . . . . . . . . . . . . . . . . . . . . . EUR 51 USD 59 4/10/19 444Citibank, NA . . . . . . . . . . . . . . . . . . . . . . . . . . . . . . . . . . . . . . . . JPY 85,617 USD 776 4/11/19 5,333Citibank, NA . . . . . . . . . . . . . . . . . . . . . . . . . . . . . . . . . . . . . . . . KRW 28,763 USD 26 5/16/19 55Goldman Sachs Bank USA . . . . . . . . . . . . . . . . . . . . . . . . . . . . . EUR 20 USD 23 4/10/19 284Goldman Sachs Bank USA . . . . . . . . . . . . . . . . . . . . . . . . . . . . . USD 34 EUR 29 4/10/19 (189)Goldman Sachs Bank USA . . . . . . . . . . . . . . . . . . . . . . . . . . . . . USD 85 NOK 721 4/12/19 (353)Goldman Sachs Bank USA . . . . . . . . . . . . . . . . . . . . . . . . . . . . . SGD 354 USD 260 4/17/19 (1,398)HSBC Bank USA. . . . . . . . . . . . . . . . . . . . . . . . . . . . . . . . . . . . . EUR 94 USD 106 4/10/19 (798)HSBC Bank USA. . . . . . . . . . . . . . . . . . . . . . . . . . . . . . . . . . . . . SGD 154 USD 113 4/17/19 (279)HSBC Bank USA. . . . . . . . . . . . . . . . . . . . . . . . . . . . . . . . . . . . . USD 47 SGD 64 4/17/19 225Morgan Stanley & Co., Inc. . . . . . . . . . . . . . . . . . . . . . . . . . . . . . USD 38 CLP 25,072 3/15/19 (27)Morgan Stanley & Co., Inc. . . . . . . . . . . . . . . . . . . . . . . . . . . . . . PLN 970 USD 256 4/08/19 (484)Morgan Stanley & Co., Inc. . . . . . . . . . . . . . . . . . . . . . . . . . . . . . EUR 81 USD 94 4/10/19 660Morgan Stanley & Co., Inc. . . . . . . . . . . . . . . . . . . . . . . . . . . . . . USD 250 JPY 27,615 4/11/19 (1,936)Morgan Stanley & Co., Inc. . . . . . . . . . . . . . . . . . . . . . . . . . . . . . NZD 93 USD 65 4/26/19 509Royal Bank of Scotland PLC. . . . . . . . . . . . . . . . . . . . . . . . . . . . EUR 1,345 USD 1,543 4/10/19 8,184Royal Bank of Scotland PLC. . . . . . . . . . . . . . . . . . . . . . . . . . . . NOK 339 SEK 366 4/12/19 137Royal Bank of Scotland PLC. . . . . . . . . . . . . . . . . . . . . . . . . . . . AUD 1,018 USD 725 4/23/19 2,058Royal Bank of Scotland PLC. . . . . . . . . . . . . . . . . . . . . . . . . . . . USD 45 AUD 63 4/23/19 (495)Societe Generale . . . . . . . . . . . . . . . . . . . . . . . . . . . . . . . . . . . . . EUR 641 USD 741 4/10/19 9,190Standard Chartered Bank . . . . . . . . . . . . . . . . . . . . . . . . . . . . . . . CAD 1,081 USD 818 3/07/19 (4,265)Standard Chartered Bank . . . . . . . . . . . . . . . . . . . . . . . . . . . . . . . TWD 1,779 USD 58 3/14/19 612Standard Chartered Bank . . . . . . . . . . . . . . . . . . . . . . . . . . . . . . . USD 61 EUR 53 4/10/19 (523)Standard Chartered Bank . . . . . . . . . . . . . . . . . . . . . . . . . . . . . . . USD 79 KRW 88,535 5/16/19 (432)UBS AG . . . . . . . . . . . . . . . . . . . . . . . . . . . . . . . . . . . . . . . . . . . . CAD 119 USD 89 3/07/19 (1,207)
$ 35,756
Appreciation $ 57,076 Depreciation $ (21,320)

AB FCP I
141
GlobalBondIIPortfolio
CENTRALLY CLEARED CREDIT DEFAULT SWAPS Notional Unrealized Termination Amount Market Appreciation/ Clearing Broker/(Exchange) Referenced Obligation Date (000) Value (Depreciation)
Sale ContractsCitigroup Global Markets, Inc./(INTRCONX) CDX-NAIG Series 24, 10 Year Index 6/20/25 USD 1,060 $ 1,294 $ 11,907Citigroup Global Markets, Inc./(INTRCONX) CDX-NAIG Series 25, 10 Year Index 12/20/25 520 (95) 6,593Citigroup Global Markets, Inc./(INTRCONX) iTraxx-Europe Series 23, 10 Year Index 6/20/25 EUR 470 7,132 10,042Total $ 8,331 $ 28,542
CENTRALLY CLEARED INTEREST RATE SWAPS
Rate Type
Notional Unrealized Amount Termination Payments Made Payments Received Appreciation/ Clearing Broker / (Exchange) (000) Date By the Fund By the Fund (Depreciation)
Citigroup Global Markets, Inc./(CME Group) . . . . . . . . . . . . . . . . . . . . USD 330 9/10/48 3.023% 6 Month LIBOR $ (7,767)Citigroup Global Markets, Inc./(CME Group) . . . . . . . . . . . . . . . . . . . . JPY 17,500 2/28/39 6 Month LIBOR 0.494% (790)Citigroup Global Markets, Inc./(CME Group) . . . . . . . . . . . . . . . . . . . . 38,615 5/16/36 6 Month LIBOR 0.425% (786)Citigroup Global Markets, Inc./(CME Group) . . . . . . . . . . . . . . . . . . . . USD 1,920 9/10/20 3 Month LIBOR 2.828% 5,461Citigroup Global Markets, Inc./(CME Group) . . . . . . . . . . . . . . . . . . . . 750 9/10/23 3 Month LIBOR 2.896% 10,783Citigroup Global Markets, Inc./(LCH Group) . . . . . . . . . . . . . . . . . . . . . EUR 580 1/15/24 6 Month EURIBOR 0.201% 1,677Total $ 8,578
Appreciation $ 17,921 Depreciation $ (9,343)
CREDIT DEFAULT SWAPS
Upfront Notional Premiums Unrealized Termination Amount Market Paid/ Appreciation/ Counterparty Referenced Obligation Date (000) Value (Received) (Depreciation)
Sale ContractsCitigroup Global Markets, Inc. CDX-CMBX.NA.A Series 6 5/11/63 USD 20 $ (416) $ (367) $ (49)Citigroup Global Markets, Inc. CDX-CMBX.NA.A Series 6 5/11/63 31 (649) (1,199) 550Citigroup Global Markets, Inc. CDX-CMBX.NA.A Series 6 5/11/63 38 (786) (702) (84)Citigroup Global Markets, Inc. CDX-CMBX.NA.BBB- Series 6 5/11/63 86 (10,447) (6,936) (3,511)JP Morgan Securities LLC CDX-CMBX.NA.A Series 6 5/11/63 93 (1,916) (2,708) 792Morgan Stanley & Co. International PLC CDX-CMBX.NA.A Series 6 5/11/63 63 (1,297) (2,157) 860Total $ (15,511) $ (14,069) $ (1,442)
Appreciation $ 2,202 Depreciation $ (3,644)
Total for Swaps $ 35,678
* Principal amount less than 500.** Contract amount less than 0.5.(a) Floating Rate Security. Stated interest rate was in effect at February 28, 2019.(b) Variable rate coupon, rate shown as of February 28, 2019.(c) Overnight deposit.

AB FCP I
142
Portfolio of investments (continued)
See notes to financial statements.
GlobalBondIIPortfolio
Currency Abbreviations:AUD – Australian DollarCAD – Canadian DollarCLP – Chilean PesoEUR – EuroGBP – Great British PoundJPY – Japanese YenKRW – South Korean WonMYR – Malaysian RinggitNOK – Norwegian KroneNZD – New Zealand DollarPLN – Polish ZlotySEK – Swedish KronaSGD – Singapore DollarTWD – New Taiwan DollarUSD – United States Dollar
Glossary:BOBL – BundesobligationenBTP – Buoni del Tesoro PoliennaliCBT – Chicago Board of TradeCDX-CMBX.NA – North American Commercial Mortgage-Backed IndexCDX-NAIG – North American Investment Grade Credit Default Swap IndexCMBS – Commercial Mortgage-Backed SecuritiesCME – Chicago Mercantile ExchangeCPI – Consumer Price IndexEURIBOR – Euro Interbank Offered RateINTRCONX – Inter-Continental ExchangeLCH – London Clearing HouseLIBOR – London Interbank Offered RatesOAT – Obligations Assimilables du TrésorOSE – Osaka Securities Exchange

(This page left intentionally blank.)
143

AB FCP I
144
Dynamic Diversified GlobalEquity GlobalValue Portfolio BlendPortfolio Portfolio (USD) (USD) (USD)
ASSETSInvestments in securities at value . . . . . . . . . . . . . . . . . . . . . . . . . . . $ 57,197,607 $ 111,445,554 $ 420,085,968Time deposits . . . . . . . . . . . . . . . . . . . . . . . . . . . . . . . . . . . . . . 274,138 3,539,927 6,739,700Dividends and interest receivable . . . . . . . . . . . . . . . . . . . . . . . . . . . 188,219 163,692 822,862Receivable for capital stock sold . . . . . . . . . . . . . . . . . . . . . . . . . . . . 6,593 79,311 556,809Cash at depositary and broker . . . . . . . . . . . . . . . . . . . . . . . . . . . . . 608,738 323,552 417,284Upfront premiums paid on swap contracts . . . . . . . . . . . . . . . . . . . . . . . 10,119 -0- -0-Receivable for investment securities sold . . . . . . . . . . . . . . . . . . . . . . . 671,922 57,345 433,799Unrealized appreciation on forward foreign currency contracts . . . . . . . . . . . . 199,327 264,235 588,104Unrealized appreciation on swaps . . . . . . . . . . . . . . . . . . . . . . . . . . . 119,964 -0- -0-Interest receivable on swaps . . . . . . . . . . . . . . . . . . . . . . . . . . . . . . 52,357 -0- -0-Unrealized appreciation on financial futures contracts . . . . . . . . . . . . . . . . . 127,404 -0- -0-Receivable for reverse repurchase agreement . . . . . . . . . . . . . . . . . . . . . -0- -0- -0-Receivable on securities lending income . . . . . . . . . . . . . . . . . . . . . . . . -0- 229 1,710Other receivables . . . . . . . . . . . . . . . . . . . . . . . . . . . . . . . . . . . . -0- -0- -0-
59,456,388 115,873,845 429,646,236LIABILITIES
Payable for investment securities purchased . . . . . . . . . . . . . . . . . . . . . . 2,636,604 297,271 1,220,740Upfront premiums received on swap contracts . . . . . . . . . . . . . . . . . . . . . 26,556 -0- -0-Due to depositary and broker . . . . . . . . . . . . . . . . . . . . . . . . . . . . . . 24,036 4,344 -0-Dividends payable . . . . . . . . . . . . . . . . . . . . . . . . . . . . . . . . . . . -0- -0- 490,203Payable for capital stock redeemed . . . . . . . . . . . . . . . . . . . . . . . . . . . 300,984 474,212 1,388,000Unrealized depreciation on forward foreign currency contracts . . . . . . . . . . . . 145,508 197,271 1,117,416Unrealized depreciation on swaps . . . . . . . . . . . . . . . . . . . . . . . . . . . 132,644 -0- -0-Unrealized depreciation on financial futures contracts . . . . . . . . . . . . . . . . . 241,843 -0- -0-Interest payable on swaps . . . . . . . . . . . . . . . . . . . . . . . . . . . . . . . 31,944 -0- -0-Payable for reverse repurchase agreements . . . . . . . . . . . . . . . . . . . . . . -0- -0- -0-Accrued expenses and other liabilities . . . . . . . . . . . . . . . . . . . . . . . . . 212,775 199,390 623,707 3,752,894 1,172,488 4,840,066
NETASSETS . . . . . . . . . . . . . . . . . . . . . . . . . . . . . . . . . . . . . . . $ 55,703,494 $ 114,701,357 $ 424,806,170
See notes to financial statements.
Statement Of aSSetS and LiabiLitieSFebruary 28, 2019
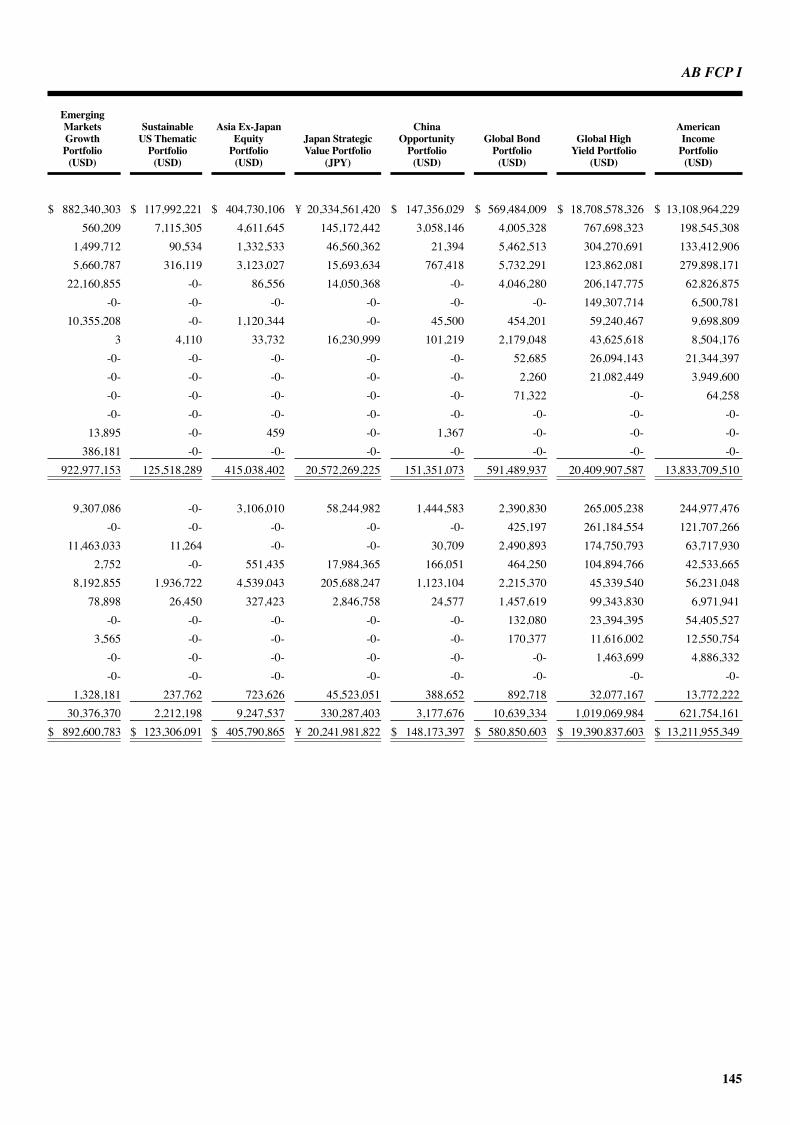
AB FCP I
145
Emerging Markets Sustainable AsiaEx-Japan China American Growth USThematic Equity JapanStrategic Opportunity GlobalBond GlobalHigh Income Portfolio Portfolio Portfolio ValuePortfolio Portfolio Portfolio YieldPortfolio Portfolio (USD) (USD) (USD) (JPY) (USD) (USD) (USD) (USD)
$ 882,340,303 $ 117,992,221 $ 404,730,106 ¥ 20,334,561,420 $ 147,356,029 $ 569,484,009 $ 18,708,578,326 $ 13,108,964,229 560,209 7,115,305 4,611,645 145,172,442 3,058,146 4,005,328 767,698,323 198,545,308 1,499,712 90,534 1,332,533 46,560,362 21,394 5,462,513 304,270,691 133,412,906 5,660,787 316,119 3,123,027 15,693,634 767,418 5,732,291 123,862,081 279,898,171 22,160,855 -0- 86,556 14,050,368 -0- 4,046,280 206,147,775 62,826,875 -0- -0- -0- -0- -0- -0- 149,307,714 6,500,781 10,355,208 -0- 1,120,344 -0- 45,500 454,201 59,240,467 9,698,809 3 4,110 33,732 16,230,999 101,219 2,179,048 43,625,618 8,504,176 -0- -0- -0- -0- -0- 52,685 26,094,143 21,344,397 -0- -0- -0- -0- -0- 2,260 21,082,449 3,949,600 -0- -0- -0- -0- -0- 71,322 -0- 64,258 -0- -0- -0- -0- -0- -0- -0- -0- 13,895 -0- 459 -0- 1,367 -0- -0- -0- 386,181 -0- -0- -0- -0- -0- -0- -0- 922,977,153 125,518,289 415,038,402 20,572,269,225 151,351,073 591,489,937 20,409,907,587 13,833,709,510
9,307,086 -0- 3,106,010 58,244,982 1,444,583 2,390,830 265,005,238 244,977,476 -0- -0- -0- -0- -0- 425,197 261,184,554 121,707,266 11,463,033 11,264 -0- -0- 30,709 2,490,893 174,750,793 63,717,930 2,752 -0- 551,435 17,984,365 166,051 464,250 104,894,766 42,533,665 8,192,855 1,936,722 4,539,043 205,688,247 1,123,104 2,215,370 45,339,540 56,231,048 78,898 26,450 327,423 2,846,758 24,577 1,457,619 99,343,830 6,971,941 -0- -0- -0- -0- -0- 132,080 23,394,395 54,405,527 3,565 -0- -0- -0- -0- 170,377 11,616,002 12,550,754 -0- -0- -0- -0- -0- -0- 1,463,699 4,886,332 -0- -0- -0- -0- -0- -0- -0- -0- 1,328,181 237,762 723,626 45,523,051 388,652 892,718 32,077,167 13,772,222 30,376,370 2,212,198 9,247,537 330,287,403 3,177,676 10,639,334 1,019,069,984 621,754,161$ 892,600,783 $ 123,306,091 $ 405,790,865 ¥ 20,241,981,822 $ 148,173,397 $ 580,850,603 $ 19,390,837,603 $ 13,211,955,349
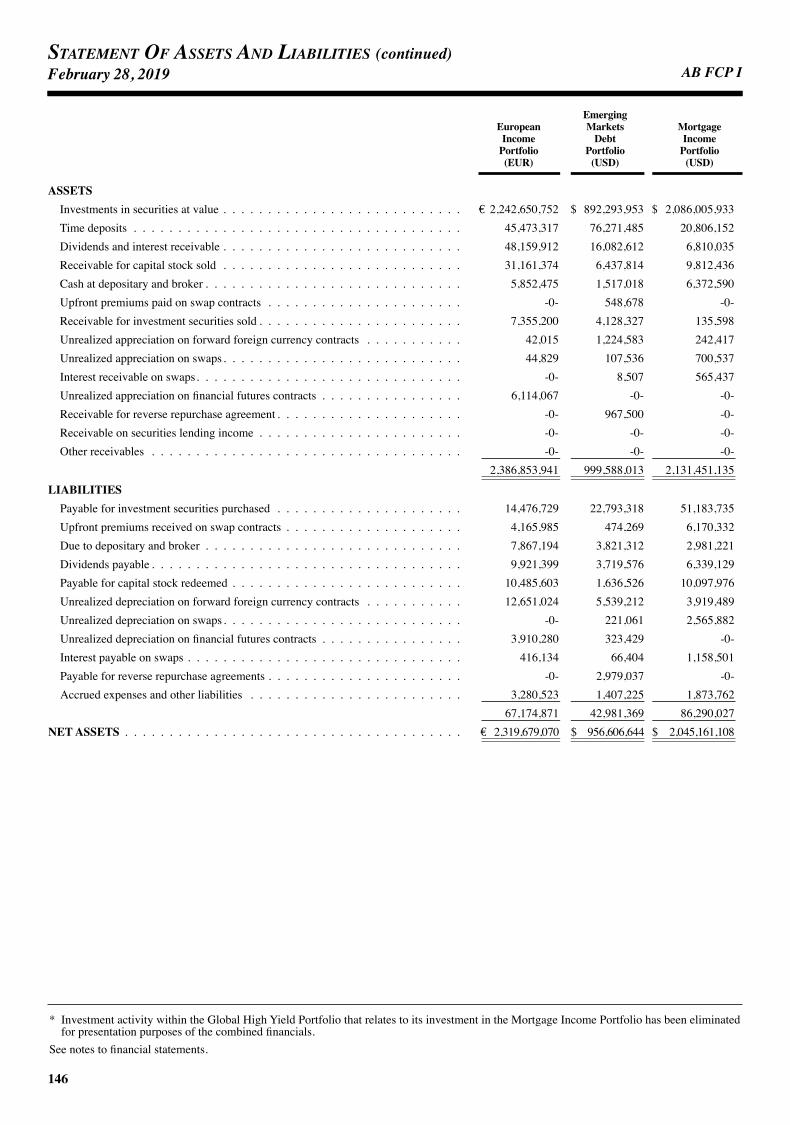
AB FCP I
146
Statement Of aSSetS and LiabiLitieS (continued)February 28, 2019
Emerging European Markets Mortgage Income Debt Income Portfolio Portfolio Portfolio (EUR) (USD) (USD)
ASSETSInvestments in securities at value . . . . . . . . . . . . . . . . . . . . . . . . . . . € 2,242,650,752 $ 892,293,953 $ 2,086,005,933Time deposits . . . . . . . . . . . . . . . . . . . . . . . . . . . . . . . . . . . . . 45,473,317 76,271,485 20,806,152Dividends and interest receivable . . . . . . . . . . . . . . . . . . . . . . . . . . . 48,159,912 16,082,612 6,810,035Receivable for capital stock sold . . . . . . . . . . . . . . . . . . . . . . . . . . . 31,161,374 6,437,814 9,812,436Cash at depositary and broker . . . . . . . . . . . . . . . . . . . . . . . . . . . . . 5,852,475 1,517,018 6,372,590Upfront premiums paid on swap contracts . . . . . . . . . . . . . . . . . . . . . . -0- 548,678 -0-Receivable for investment securities sold . . . . . . . . . . . . . . . . . . . . . . . 7,355,200 4,128,327 135,598Unrealized appreciation on forward foreign currency contracts . . . . . . . . . . . 42,015 1,224,583 242,417Unrealized appreciation on swaps . . . . . . . . . . . . . . . . . . . . . . . . . . . 44,829 107,536 700,537Interest receivable on swaps . . . . . . . . . . . . . . . . . . . . . . . . . . . . . . -0- 8,507 565,437Unrealized appreciation on financial futures contracts . . . . . . . . . . . . . . . . 6,114,067 -0- -0-Receivable for reverse repurchase agreement . . . . . . . . . . . . . . . . . . . . . -0- 967,500 -0-Receivable on securities lending income . . . . . . . . . . . . . . . . . . . . . . . -0- -0- -0-Other receivables . . . . . . . . . . . . . . . . . . . . . . . . . . . . . . . . . . . -0- -0- -0- 2,386,853,941 999,588,013 2,131,451,135
LIABILITIESPayable for investment securities purchased . . . . . . . . . . . . . . . . . . . . . 14,476,729 22,793,318 51,183,735Upfront premiums received on swap contracts . . . . . . . . . . . . . . . . . . . . 4,165,985 474,269 6,170,332Due to depositary and broker . . . . . . . . . . . . . . . . . . . . . . . . . . . . . 7,867,194 3,821,312 2,981,221Dividends payable . . . . . . . . . . . . . . . . . . . . . . . . . . . . . . . . . . . 9,921,399 3,719,576 6,339,129Payable for capital stock redeemed . . . . . . . . . . . . . . . . . . . . . . . . . . 10,485,603 1,636,526 10,097,976Unrealized depreciation on forward foreign currency contracts . . . . . . . . . . . 12,651,024 5,539,212 3,919,489Unrealized depreciation on swaps . . . . . . . . . . . . . . . . . . . . . . . . . . . -0- 221,061 2,565,882Unrealized depreciation on financial futures contracts . . . . . . . . . . . . . . . . 3,910,280 323,429 -0-Interest payable on swaps . . . . . . . . . . . . . . . . . . . . . . . . . . . . . . . 416,134 66,404 1,158,501Payable for reverse repurchase agreements . . . . . . . . . . . . . . . . . . . . . . -0- 2,979,037 -0-Accrued expenses and other liabilities . . . . . . . . . . . . . . . . . . . . . . . . 3,280,523 1,407,225 1,873,762 67,174,871 42,981,369 86,290,027
NETASSETS . . . . . . . . . . . . . . . . . . . . . . . . . . . . . . . . . . . . . . € 2,319,679,070 $ 956,606,644 $ 2,045,161,108
* Investment activity within the Global High Yield Portfolio that relates to its investment in the Mortgage Income Portfolio has been eliminated for presentation purposes of the combined financials.
See notes to financial statements.
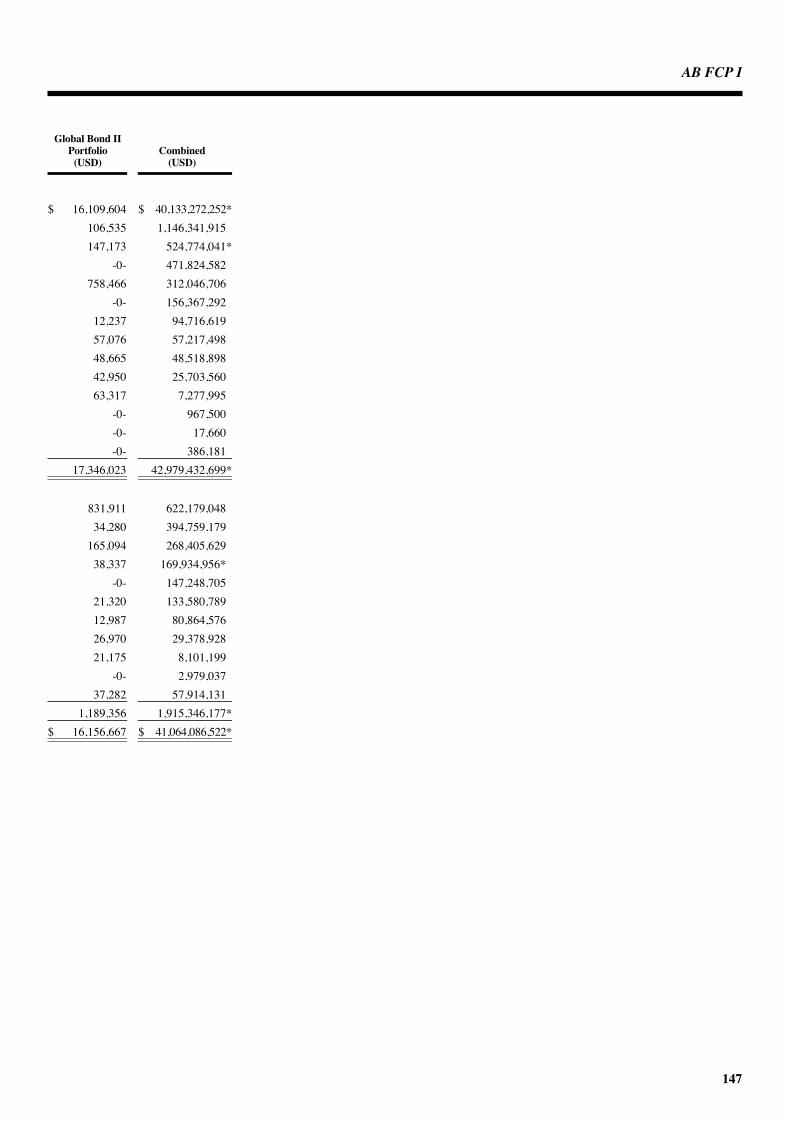
AB FCP I
147
GlobalBondII Portfolio Combined (USD) (USD)
$ 16,109,604 $ 40,133,272,252* 106,535 1,146,341,915 147,173 524,774,041* -0- 471,824,582 758,466 312,046,706 -0- 156,367,292 12,237 94,716,619 57,076 57,217,498 48,665 48,518,898 42,950 25,703,560 63,317 7,277,995 -0- 967,500 -0- 17,660 -0- 386,181 17,346,023 42,979,432,699*
831,911 622,179,048 34,280 394,759,179 165,094 268,405,629 38,337 169,934,956* -0- 147,248,705 21,320 133,580,789 12,987 80,864,576 26,970 29,378,928 21,175 8,101,199 -0- 2,979,037 37,282 57,914,131 1,189,356 1,915,346,177*$ 16,156,667 $ 41,064,086,522*
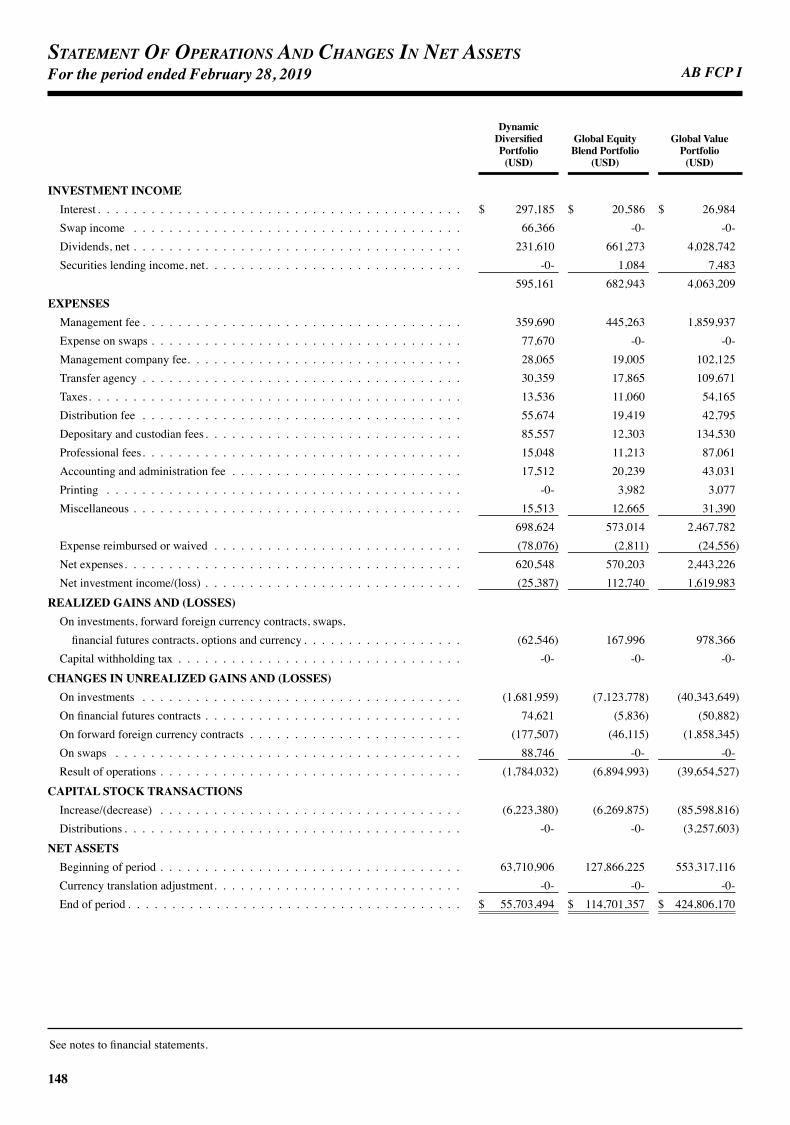
AB FCP I
148
Statement Of OperatiOnS and ChangeS in net aSSetSFor the period ended February 28, 2019
Dynamic Diversified GlobalEquity GlobalValue Portfolio BlendPortfolio Portfolio (USD) (USD) (USD)
INVESTMENTINCOMEInterest . . . . . . . . . . . . . . . . . . . . . . . . . . . . . . . . . . . . . . . . . $ 297,185 $ 20,586 $ 26,984Swap income . . . . . . . . . . . . . . . . . . . . . . . . . . . . . . . . . . . . . 66,366 -0- -0-Dividends, net . . . . . . . . . . . . . . . . . . . . . . . . . . . . . . . . . . . . . 231,610 661,273 4,028,742Securities lending income, net . . . . . . . . . . . . . . . . . . . . . . . . . . . . . -0- 1,084 7,483 595,161 682,943 4,063,209
EXPENSESManagement fee . . . . . . . . . . . . . . . . . . . . . . . . . . . . . . . . . . . . 359,690 445,263 1,859,937Expense on swaps . . . . . . . . . . . . . . . . . . . . . . . . . . . . . . . . . . . 77,670 -0- -0-Management company fee . . . . . . . . . . . . . . . . . . . . . . . . . . . . . . . 28,065 19,005 102,125Transfer agency . . . . . . . . . . . . . . . . . . . . . . . . . . . . . . . . . . . . 30,359 17,865 109,671Taxes . . . . . . . . . . . . . . . . . . . . . . . . . . . . . . . . . . . . . . . . . . 13,536 11,060 54,165Distribution fee . . . . . . . . . . . . . . . . . . . . . . . . . . . . . . . . . . . . 55,674 19,419 42,795Depositary and custodian fees . . . . . . . . . . . . . . . . . . . . . . . . . . . . . 85,557 12,303 134,530Professional fees . . . . . . . . . . . . . . . . . . . . . . . . . . . . . . . . . . . . 15,048 11,213 87,061Accounting and administration fee . . . . . . . . . . . . . . . . . . . . . . . . . . 17,512 20,239 43,031Printing . . . . . . . . . . . . . . . . . . . . . . . . . . . . . . . . . . . . . . . . -0- 3,982 3,077Miscellaneous . . . . . . . . . . . . . . . . . . . . . . . . . . . . . . . . . . . . . 15,513 12,665 31,390 698,624 573,014 2,467,782Expense reimbursed or waived . . . . . . . . . . . . . . . . . . . . . . . . . . . . (78,076) (2,811) (24,556)Net expenses . . . . . . . . . . . . . . . . . . . . . . . . . . . . . . . . . . . . . . 620,548 570,203 2,443,226Net investment income/(loss) . . . . . . . . . . . . . . . . . . . . . . . . . . . . . (25,387) 112,740 1,619,983
REALIZEDGAINSAND(LOSSES)On investments, forward foreign currency contracts, swaps,
financial futures contracts, options and currency . . . . . . . . . . . . . . . . . . (62,546) 167,996 978,366Capital withholding tax . . . . . . . . . . . . . . . . . . . . . . . . . . . . . . . . -0- -0- -0-
CHANGESINUNREALIZEDGAINSAND(LOSSES)On investments . . . . . . . . . . . . . . . . . . . . . . . . . . . . . . . . . . . . (1,681,959) (7,123,778) (40,343,649)On financial futures contracts . . . . . . . . . . . . . . . . . . . . . . . . . . . . . 74,621 (5,836) (50,882)On forward foreign currency contracts . . . . . . . . . . . . . . . . . . . . . . . . (177,507) (46,115) (1,858,345)On swaps . . . . . . . . . . . . . . . . . . . . . . . . . . . . . . . . . . . . . . . 88,746 -0- -0-Result of operations . . . . . . . . . . . . . . . . . . . . . . . . . . . . . . . . . . (1,784,032) (6,894,993) (39,654,527)
CAPITALSTOCKTRANSACTIONSIncrease/(decrease) . . . . . . . . . . . . . . . . . . . . . . . . . . . . . . . . . . (6,223,380) (6,269,875) (85,598,816)Distributions . . . . . . . . . . . . . . . . . . . . . . . . . . . . . . . . . . . . . . -0- -0- (3,257,603)
NETASSETSBeginning of period . . . . . . . . . . . . . . . . . . . . . . . . . . . . . . . . . . 63,710,906 127,866,225 553,317,116Currency translation adjustment . . . . . . . . . . . . . . . . . . . . . . . . . . . . -0- -0- -0-End of period . . . . . . . . . . . . . . . . . . . . . . . . . . . . . . . . . . . . . . $ 55,703,494 $ 114,701,357 $ 424,806,170
See notes to financial statements.

AB FCP I
149
Emerging Japan Markets Sustainable AsiaEx- Strategic China GlobalHigh American Growth USThematic JapanEquity Value Opportunity GlobalBond Yield Income Portfolio Portfolio Portfolio Portfolio Portfolio Portfolio Portfolio Portfolio (USD) (USD) (USD) (JPY) (USD) (USD) (USD) (USD)
$ 75,071 $ 54,203 $ 37,756 ¥ -0- $ 32,609 $ 9,834,134 $ 747,717,349 $ 344,699,037 -0- -0- -0- -0- -0- 89,847 84,256,691 28,962,776 5,859,881 402,656 3,277,370 271,122,963 722,884 -0- 18,209,011 135,871 99,415 -0- 11,052 338,356 4,655 -0- -0- -0- 6,034,367 456,859 3,326,178 271,461,319 760,148 9,923,981 850,183,051 373,797,684
6,202,770 587,631 2,390,370 88,142,062 1,127,053 2,311,692 141,715,538 52,153,984 -0- -0- -0- -0- -0- -0- 13,799,569 9,379,740 373,768 28,035 71,707 3,014,674 25,943 213,591 8,436,328 4,560,405 211,506 32,527 138,075 7,711,031 58,452 161,083 5,336,407 2,605,515 182,491 20,761 68,221 2,909,953 26,847 117,157 4,174,797 2,488,895 16,361 14,338 100,021 396,913 42,354 15,390 3,010,475 2,071,445 247,796 11,074 118,326 4,803,373 40,041 108,731 1,479,002 392,391 129,234 86,237 130,962 10,228,377 72,413 134,549 449,235 227,094 64,612 21,871 40,177 3,132,065 23,134 47,472 203,504 203,504 5,634 2,972 15,143 45,384 274 35,946 99,776 13,590 150,233 13,482 21,667 2,946,950 25,409 26,099 409,939 166,443 7,584,405 818,928 3,094,669 123,330,782 1,441,920 3,171,710 179,114,570 74,263,006 -0- (61,943) (53,951) (55,851) -0- -0- -0- -0- 7,584,405 756,985 3,040,718 123,274,931 1,441,920 3,171,710 179,114,570 74,263,006 (1,550,038) (300,126) 285,460 148,186,388 (681,772) 6,752,271 671,068,481 299,534,678
(57,128,301) (1,568,889) (2,508,135) 195,766,383 (4,003,469) (3,606,361) (564,701,796) (13,169,000) 1,856,047 -0- -0- -0- -0- -0- -0- -0-
(6,130,647) (1,680,416) (19,697,942) (2,670,160,218) 2,414,842 2,547,966 265,336,151 13,876,859 (471,594) -0- -0- -0- -0- 31,797 (18,287,392) (14,429,842) 66,367 (5,641) 1,183,657 15,114,772 652,083 (1,058,008) (98,926,260) 10,210,181 -0- -0- -0- -0- -0- 12,079 (8,578,185) (2,465,515) (63,358,166) (3,555,072) (20,736,960) (2,311,092,675) (1,618,316) 4,679,744 245,910,999 293,557,361
(123,380,741) 67,393 (40,654,076) (4,783,529,396) 6,156,116 136,364,771 (1,041,027,741) 2,788,562,252 (13,461) -0- (3,594,967) (118,412,938) (1,055,919) (2,632,351) (639,300,830) (214,069,603)
1,079,353,151 126,793,770 470,776,868 27,455,016,831 144,691,516 442,438,439 20,825,255,175 10,343,905,339 -0- -0- -0- -0- -0- -0- -0- -0-$ 892,600,783 $ 123,306,091 $ 405,790,865 ¥ 20,241,981,822 $ 148,173,397 $ 580,850,603 $ 19,390,837,603 $ 13,211,955,349
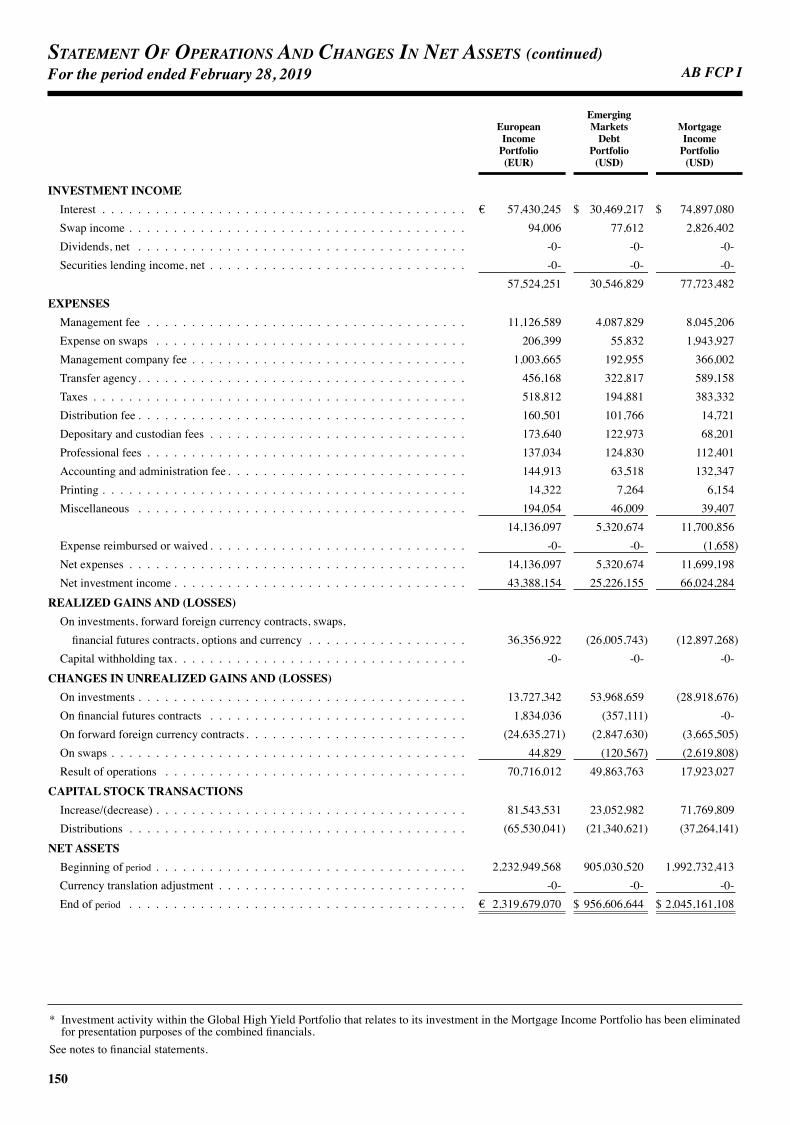
AB FCP I
150
Statement Of OperatiOnS and ChangeS in net aSSetS (continued)For the period ended February 28, 2019
* Investment activity within the Global High Yield Portfolio that relates to its investment in the Mortgage Income Portfolio has been eliminated for presentation purposes of the combined financials.
See notes to financial statements.
Emerging European Markets Mortgage Income Debt Income Portfolio Portfolio Portfolio (EUR) (USD) (USD)
INVESTMENTINCOMEInterest . . . . . . . . . . . . . . . . . . . . . . . . . . . . . . . . . . . . . . . . . € 57,430,245 $ 30,469,217 $ 74,897,080Swap income . . . . . . . . . . . . . . . . . . . . . . . . . . . . . . . . . . . . . . 94,006 77,612 2,826,402Dividends, net . . . . . . . . . . . . . . . . . . . . . . . . . . . . . . . . . . . . . -0- -0- -0-Securities lending income, net . . . . . . . . . . . . . . . . . . . . . . . . . . . . . -0- -0- -0- 57,524,251 30,546,829 77,723,482
EXPENSESManagement fee . . . . . . . . . . . . . . . . . . . . . . . . . . . . . . . . . . . . 11,126,589 4,087,829 8,045,206Expense on swaps . . . . . . . . . . . . . . . . . . . . . . . . . . . . . . . . . . . 206,399 55,832 1,943,927Management company fee . . . . . . . . . . . . . . . . . . . . . . . . . . . . . . . 1,003,665 192,955 366,002Transfer agency . . . . . . . . . . . . . . . . . . . . . . . . . . . . . . . . . . . . . 456,168 322,817 589,158Taxes . . . . . . . . . . . . . . . . . . . . . . . . . . . . . . . . . . . . . . . . . . 518,812 194,881 383,332Distribution fee . . . . . . . . . . . . . . . . . . . . . . . . . . . . . . . . . . . . . 160,501 101,766 14,721Depositary and custodian fees . . . . . . . . . . . . . . . . . . . . . . . . . . . . . 173,640 122,973 68,201Professional fees . . . . . . . . . . . . . . . . . . . . . . . . . . . . . . . . . . . . 137,034 124,830 112,401Accounting and administration fee . . . . . . . . . . . . . . . . . . . . . . . . . . . 144,913 63,518 132,347Printing . . . . . . . . . . . . . . . . . . . . . . . . . . . . . . . . . . . . . . . . . 14,322 7,264 6,154Miscellaneous . . . . . . . . . . . . . . . . . . . . . . . . . . . . . . . . . . . . . 194,054 46,009 39,407 14,136,097 5,320,674 11,700,856Expense reimbursed or waived . . . . . . . . . . . . . . . . . . . . . . . . . . . . . -0- -0- (1,658)Net expenses . . . . . . . . . . . . . . . . . . . . . . . . . . . . . . . . . . . . . . 14,136,097 5,320,674 11,699,198Net investment income . . . . . . . . . . . . . . . . . . . . . . . . . . . . . . . . . 43,388,154 25,226,155 66,024,284
REALIZEDGAINSAND(LOSSES)On investments, forward foreign currency contracts, swaps,
financial futures contracts, options and currency . . . . . . . . . . . . . . . . . . 36,356,922 (26,005,743) (12,897,268)Capital withholding tax . . . . . . . . . . . . . . . . . . . . . . . . . . . . . . . . . -0- -0- -0-
CHANGESINUNREALIZEDGAINSAND(LOSSES)On investments . . . . . . . . . . . . . . . . . . . . . . . . . . . . . . . . . . . . . 13,727,342 53,968,659 (28,918,676)On financial futures contracts . . . . . . . . . . . . . . . . . . . . . . . . . . . . . 1,834,036 (357,111) -0-On forward foreign currency contracts . . . . . . . . . . . . . . . . . . . . . . . . . (24,635,271) (2,847,630) (3,665,505)On swaps . . . . . . . . . . . . . . . . . . . . . . . . . . . . . . . . . . . . . . . . 44,829 (120,567) (2,619,808)Result of operations . . . . . . . . . . . . . . . . . . . . . . . . . . . . . . . . . . 70,716,012 49,863,763 17,923,027
CAPITALSTOCKTRANSACTIONSIncrease/(decrease) . . . . . . . . . . . . . . . . . . . . . . . . . . . . . . . . . . . 81,543,531 23,052,982 71,769,809Distributions . . . . . . . . . . . . . . . . . . . . . . . . . . . . . . . . . . . . . . (65,530,041) (21,340,621) (37,264,141)
NETASSETSBeginning of period . . . . . . . . . . . . . . . . . . . . . . . . . . . . . . . . . . . 2,232,949,568 905,030,520 1,992,732,413Currency translation adjustment . . . . . . . . . . . . . . . . . . . . . . . . . . . . -0- -0- -0-End of period . . . . . . . . . . . . . . . . . . . . . . . . . . . . . . . . . . . . . . € 2,319,679,070 $ 956,606,644 $ 2,045,161,108
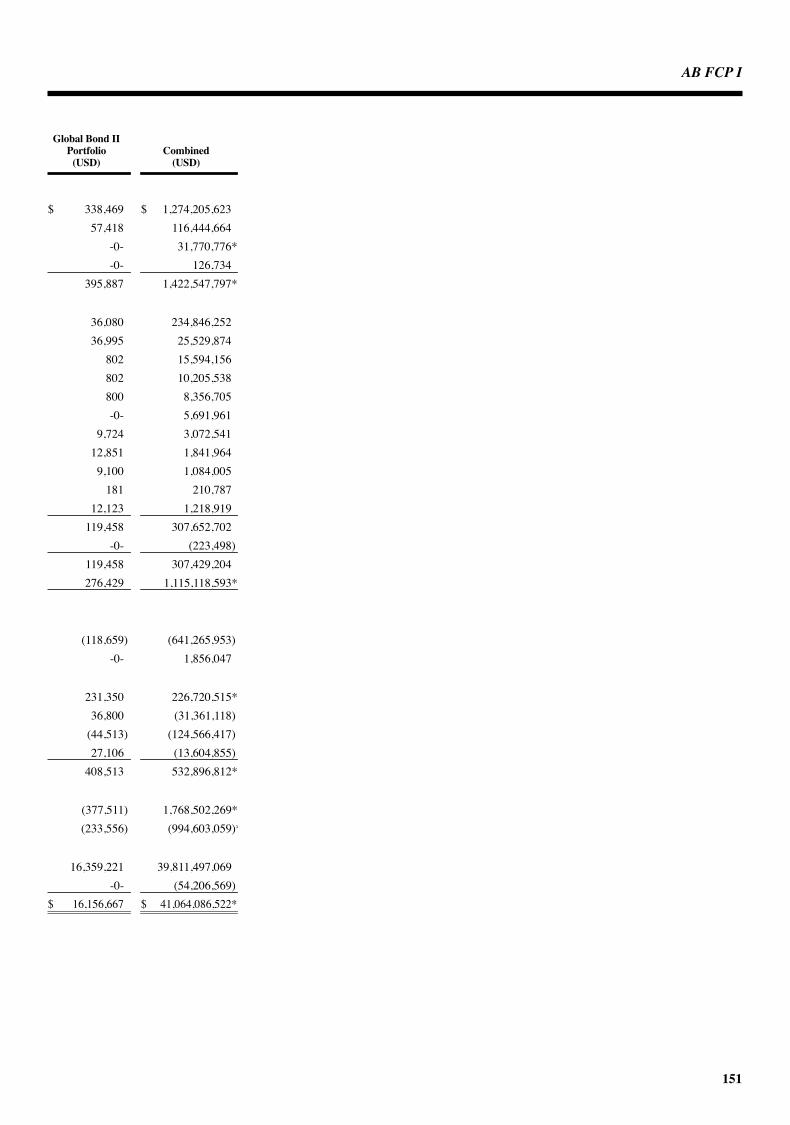
AB FCP I
151
GlobalBondII Portfolio Combined (USD) (USD)
$ 338,469 $ 1,274,205,623 57,418 116,444,664 -0- 31,770,776* -0- 126,734 395,887 1,422,547,797*
36,080 234,846,252 36,995 25,529,874 802 15,594,156 802 10,205,538 800 8,356,705 -0- 5,691,961 9,724 3,072,541 12,851 1,841,964 9,100 1,084,005 181 210,787 12,123 1,218,919 119,458 307,652,702 -0- (223,498) 119,458 307,429,204 276,429 1,115,118,593*
(118,659) (641,265,953) -0- 1,856,047
231,350 226,720,515* 36,800 (31,361,118) (44,513) (124,566,417) 27,106 (13,604,855) 408,513 532,896,812*
(377,511) 1,768,502,269* (233,556) (994,603,059)*
16,359,221 39,811,497,069 -0- (54,206,569)$ 16,156,667 $ 41,064,086,522*

AB FCP I
152
Dynamic GlobalEquity Diversified Blend GlobalValue Portfolio Portfolio Portfolio
CLASSA . . . . . . . . . . . . . . . . . . . . . . . . . . . . . . . . . . . . . . . . . . . . . . . . . . . . . . . . . . . . . . . . . . . . . . 164,551 794,051 4,218,914A EUR H . . . . . . . . . . . . . . . . . . . . . . . . . . . . . . . . . . . . . . . . . . . . . . . . . . . . . . . . . . . . . . . . 50,818 271,933 -0-A SGD H . . . . . . . . . . . . . . . . . . . . . . . . . . . . . . . . . . . . . . . . . . . . . . . . . . . . . . . . . . . . . . . . -0- -0- 435,639AD . . . . . . . . . . . . . . . . . . . . . . . . . . . . . . . . . . . . . . . . . . . . . . . . . . . . . . . . . . . . . . . . . . . . . -0- -0- 2,066,222AD AUD H . . . . . . . . . . . . . . . . . . . . . . . . . . . . . . . . . . . . . . . . . . . . . . . . . . . . . . . . . . . . . . -0- -0- 2,164,928AD CAD H . . . . . . . . . . . . . . . . . . . . . . . . . . . . . . . . . . . . . . . . . . . . . . . . . . . . . . . . . . . . . . -0- -0- 404,029AD EUR H . . . . . . . . . . . . . . . . . . . . . . . . . . . . . . . . . . . . . . . . . . . . . . . . . . . . . . . . . . . . . . -0- -0- 69,611AD GBP H . . . . . . . . . . . . . . . . . . . . . . . . . . . . . . . . . . . . . . . . . . . . . . . . . . . . . . . . . . . . . . -0- -0- 205,665AD SGD H . . . . . . . . . . . . . . . . . . . . . . . . . . . . . . . . . . . . . . . . . . . . . . . . . . . . . . . . . . . . . . -0- -0- 980AD ZAR H . . . . . . . . . . . . . . . . . . . . . . . . . . . . . . . . . . . . . . . . . . . . . . . . . . . . . . . . . . . . . . -0- -0- 904,927AX . . . . . . . . . . . . . . . . . . . . . . . . . . . . . . . . . . . . . . . . . . . . . . . . . . . . . . . . . . . . . . . . . . . . . 589,611 -0- -0-B . . . . . . . . . . . . . . . . . . . . . . . . . . . . . . . . . . . . . . . . . . . . . . . . . . . . . . . . . . . . . . . . . . . . . . 36,073 243,805 207,830BD . . . . . . . . . . . . . . . . . . . . . . . . . . . . . . . . . . . . . . . . . . . . . . . . . . . . . . . . . . . . . . . . . . . . . -0- -0- 235,650BD AUD H . . . . . . . . . . . . . . . . . . . . . . . . . . . . . . . . . . . . . . . . . . . . . . . . . . . . . . . . . . . . . . -0- -0- 55,249BD EUR H . . . . . . . . . . . . . . . . . . . . . . . . . . . . . . . . . . . . . . . . . . . . . . . . . . . . . . . . . . . . . . -0- -0- 11,163BD ZAR H . . . . . . . . . . . . . . . . . . . . . . . . . . . . . . . . . . . . . . . . . . . . . . . . . . . . . . . . . . . . . . -0- -0- 72,197BX . . . . . . . . . . . . . . . . . . . . . . . . . . . . . . . . . . . . . . . . . . . . . . . . . . . . . . . . . . . . . . . . . . . . . 520,812 -0- -0-C . . . . . . . . . . . . . . . . . . . . . . . . . . . . . . . . . . . . . . . . . . . . . . . . . . . . . . . . . . . . . . . . . . . . . . 180,304 160,468 227,238C EUR H . . . . . . . . . . . . . . . . . . . . . . . . . . . . . . . . . . . . . . . . . . . . . . . . . . . . . . . . . . . . . . . . 501 -0- -0-CX . . . . . . . . . . . . . . . . . . . . . . . . . . . . . . . . . . . . . . . . . . . . . . . . . . . . . . . . . . . . . . . . . . . . . 95,363 -0- -0-I . . . . . . . . . . . . . . . . . . . . . . . . . . . . . . . . . . . . . . . . . . . . . . . . . . . . . . . . . . . . . . . . . . . . . . . 917,931 144,179 946,082I EUR H . . . . . . . . . . . . . . . . . . . . . . . . . . . . . . . . . . . . . . . . . . . . . . . . . . . . . . . . . . . . . . . . 176,970 -0- -0-IX . . . . . . . . . . . . . . . . . . . . . . . . . . . . . . . . . . . . . . . . . . . . . . . . . . . . . . . . . . . . . . . . . . . . . 3,359 -0- -0-S . . . . . . . . . . . . . . . . . . . . . . . . . . . . . . . . . . . . . . . . . . . . . . . . . . . . . . . . . . . . . . . . . . . . . . -0- 916,289 2,350,760S GBP H . . . . . . . . . . . . . . . . . . . . . . . . . . . . . . . . . . . . . . . . . . . . . . . . . . . . . . . . . . . . . . . . -0- -0- 639,173S1 . . . . . . . . . . . . . . . . . . . . . . . . . . . . . . . . . . . . . . . . . . . . . . . . . . . . . . . . . . . . . . . . . . . . . -0- 2,762,978 7,284,143S1 EUR H . . . . . . . . . . . . . . . . . . . . . . . . . . . . . . . . . . . . . . . . . . . . . . . . . . . . . . . . . . . . . . . 476 -0- -0-S1A GB . . . . . . . . . . . . . . . . . . . . . . . . . . . . . . . . . . . . . . . . . . . . . . . . . . . . . . . . . . . . . . . . . -0- -0- 57,292SD . . . . . . . . . . . . . . . . . . . . . . . . . . . . . . . . . . . . . . . . . . . . . . . . . . . . . . . . . . . . . . . . . . . . . -0- -0- 507,407
ShareS OutStandingFebruary 28, 2019
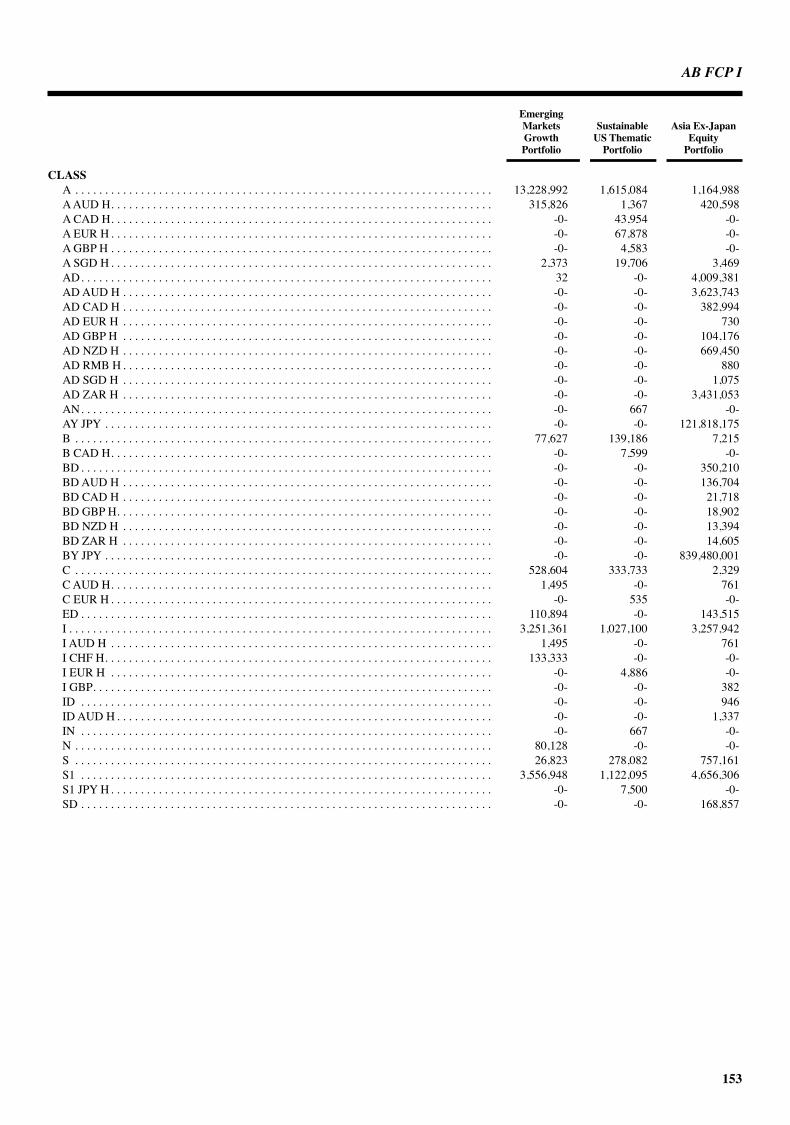
AB FCP I
153
Emerging Markets Sustainable AsiaEx-Japan Growth USThematic Equity Portfolio Portfolio Portfolio
CLASSA . . . . . . . . . . . . . . . . . . . . . . . . . . . . . . . . . . . . . . . . . . . . . . . . . . . . . . . . . . . . . . . . . . . . . . 13,228,992 1,615,084 1,164,988A AUD H . . . . . . . . . . . . . . . . . . . . . . . . . . . . . . . . . . . . . . . . . . . . . . . . . . . . . . . . . . . . . . . . 315,826 1,367 420,598A CAD H . . . . . . . . . . . . . . . . . . . . . . . . . . . . . . . . . . . . . . . . . . . . . . . . . . . . . . . . . . . . . . . . -0- 43,954 -0-A EUR H . . . . . . . . . . . . . . . . . . . . . . . . . . . . . . . . . . . . . . . . . . . . . . . . . . . . . . . . . . . . . . . . -0- 67,878 -0-A GBP H . . . . . . . . . . . . . . . . . . . . . . . . . . . . . . . . . . . . . . . . . . . . . . . . . . . . . . . . . . . . . . . . -0- 4,583 -0-A SGD H . . . . . . . . . . . . . . . . . . . . . . . . . . . . . . . . . . . . . . . . . . . . . . . . . . . . . . . . . . . . . . . . 2,373 19,706 3,469AD . . . . . . . . . . . . . . . . . . . . . . . . . . . . . . . . . . . . . . . . . . . . . . . . . . . . . . . . . . . . . . . . . . . . . 32 -0- 4,009,381AD AUD H . . . . . . . . . . . . . . . . . . . . . . . . . . . . . . . . . . . . . . . . . . . . . . . . . . . . . . . . . . . . . . -0- -0- 3,623,743AD CAD H . . . . . . . . . . . . . . . . . . . . . . . . . . . . . . . . . . . . . . . . . . . . . . . . . . . . . . . . . . . . . . -0- -0- 382,994AD EUR H . . . . . . . . . . . . . . . . . . . . . . . . . . . . . . . . . . . . . . . . . . . . . . . . . . . . . . . . . . . . . . -0- -0- 730AD GBP H . . . . . . . . . . . . . . . . . . . . . . . . . . . . . . . . . . . . . . . . . . . . . . . . . . . . . . . . . . . . . . -0- -0- 104,176AD NZD H . . . . . . . . . . . . . . . . . . . . . . . . . . . . . . . . . . . . . . . . . . . . . . . . . . . . . . . . . . . . . . -0- -0- 669,450AD RMB H . . . . . . . . . . . . . . . . . . . . . . . . . . . . . . . . . . . . . . . . . . . . . . . . . . . . . . . . . . . . . . -0- -0- 880AD SGD H . . . . . . . . . . . . . . . . . . . . . . . . . . . . . . . . . . . . . . . . . . . . . . . . . . . . . . . . . . . . . . -0- -0- 1,075AD ZAR H . . . . . . . . . . . . . . . . . . . . . . . . . . . . . . . . . . . . . . . . . . . . . . . . . . . . . . . . . . . . . . -0- -0- 3,431,053AN . . . . . . . . . . . . . . . . . . . . . . . . . . . . . . . . . . . . . . . . . . . . . . . . . . . . . . . . . . . . . . . . . . . . . -0- 667 -0-AY JPY . . . . . . . . . . . . . . . . . . . . . . . . . . . . . . . . . . . . . . . . . . . . . . . . . . . . . . . . . . . . . . . . . -0- -0- 121,818,175B . . . . . . . . . . . . . . . . . . . . . . . . . . . . . . . . . . . . . . . . . . . . . . . . . . . . . . . . . . . . . . . . . . . . . . 77,627 139,186 7,215B CAD H . . . . . . . . . . . . . . . . . . . . . . . . . . . . . . . . . . . . . . . . . . . . . . . . . . . . . . . . . . . . . . . . -0- 7,599 -0-BD . . . . . . . . . . . . . . . . . . . . . . . . . . . . . . . . . . . . . . . . . . . . . . . . . . . . . . . . . . . . . . . . . . . . . -0- -0- 350,210BD AUD H . . . . . . . . . . . . . . . . . . . . . . . . . . . . . . . . . . . . . . . . . . . . . . . . . . . . . . . . . . . . . . -0- -0- 136,704BD CAD H . . . . . . . . . . . . . . . . . . . . . . . . . . . . . . . . . . . . . . . . . . . . . . . . . . . . . . . . . . . . . . -0- -0- 21,718BD GBP H . . . . . . . . . . . . . . . . . . . . . . . . . . . . . . . . . . . . . . . . . . . . . . . . . . . . . . . . . . . . . . . -0- -0- 18,902BD NZD H . . . . . . . . . . . . . . . . . . . . . . . . . . . . . . . . . . . . . . . . . . . . . . . . . . . . . . . . . . . . . . -0- -0- 13,394BD ZAR H . . . . . . . . . . . . . . . . . . . . . . . . . . . . . . . . . . . . . . . . . . . . . . . . . . . . . . . . . . . . . . -0- -0- 14,605BY JPY . . . . . . . . . . . . . . . . . . . . . . . . . . . . . . . . . . . . . . . . . . . . . . . . . . . . . . . . . . . . . . . . . -0- -0- 839,480,001C . . . . . . . . . . . . . . . . . . . . . . . . . . . . . . . . . . . . . . . . . . . . . . . . . . . . . . . . . . . . . . . . . . . . . . 528,604 333,733 2,329C AUD H . . . . . . . . . . . . . . . . . . . . . . . . . . . . . . . . . . . . . . . . . . . . . . . . . . . . . . . . . . . . . . . . 1,495 -0- 761C EUR H . . . . . . . . . . . . . . . . . . . . . . . . . . . . . . . . . . . . . . . . . . . . . . . . . . . . . . . . . . . . . . . . -0- 535 -0-ED . . . . . . . . . . . . . . . . . . . . . . . . . . . . . . . . . . . . . . . . . . . . . . . . . . . . . . . . . . . . . . . . . . . . . 110,894 -0- 143,515I . . . . . . . . . . . . . . . . . . . . . . . . . . . . . . . . . . . . . . . . . . . . . . . . . . . . . . . . . . . . . . . . . . . . . . . 3,251,361 1,027,100 3,257,942I AUD H . . . . . . . . . . . . . . . . . . . . . . . . . . . . . . . . . . . . . . . . . . . . . . . . . . . . . . . . . . . . . . . . 1,495 -0- 761I CHF H . . . . . . . . . . . . . . . . . . . . . . . . . . . . . . . . . . . . . . . . . . . . . . . . . . . . . . . . . . . . . . . . . 133,333 -0- -0-I EUR H . . . . . . . . . . . . . . . . . . . . . . . . . . . . . . . . . . . . . . . . . . . . . . . . . . . . . . . . . . . . . . . . -0- 4,886 -0-I GBP . . . . . . . . . . . . . . . . . . . . . . . . . . . . . . . . . . . . . . . . . . . . . . . . . . . . . . . . . . . . . . . . . . . -0- -0- 382ID . . . . . . . . . . . . . . . . . . . . . . . . . . . . . . . . . . . . . . . . . . . . . . . . . . . . . . . . . . . . . . . . . . . . . -0- -0- 946ID AUD H . . . . . . . . . . . . . . . . . . . . . . . . . . . . . . . . . . . . . . . . . . . . . . . . . . . . . . . . . . . . . . . -0- -0- 1,337IN . . . . . . . . . . . . . . . . . . . . . . . . . . . . . . . . . . . . . . . . . . . . . . . . . . . . . . . . . . . . . . . . . . . . . -0- 667 -0-N . . . . . . . . . . . . . . . . . . . . . . . . . . . . . . . . . . . . . . . . . . . . . . . . . . . . . . . . . . . . . . . . . . . . . . 80,128 -0- -0-S . . . . . . . . . . . . . . . . . . . . . . . . . . . . . . . . . . . . . . . . . . . . . . . . . . . . . . . . . . . . . . . . . . . . . . 26,823 278,082 757,161S1 . . . . . . . . . . . . . . . . . . . . . . . . . . . . . . . . . . . . . . . . . . . . . . . . . . . . . . . . . . . . . . . . . . . . . 3,556,948 1,122,095 4,656,306S1 JPY H . . . . . . . . . . . . . . . . . . . . . . . . . . . . . . . . . . . . . . . . . . . . . . . . . . . . . . . . . . . . . . . . -0- 7,500 -0-SD . . . . . . . . . . . . . . . . . . . . . . . . . . . . . . . . . . . . . . . . . . . . . . . . . . . . . . . . . . . . . . . . . . . . . -0- -0- 168,857

AB FCP I
154
Japan Strategic China Value Opportunity GlobalBond Portfolio Portfolio Portfolio
CLASS2 . . . . . . . . . . . . . . . . . . . . . . . . . . . . . . . . . . . . . . . . . . . . . . . . . . . . . . . . . . . . . . . . . . . . . . . 4,421 -0- -0-A . . . . . . . . . . . . . . . . . . . . . . . . . . . . . . . . . . . . . . . . . . . . . . . . . . . . . . . . . . . . . . . . . . . . . . 147,916 1,166,859 1,013,795A AUD H . . . . . . . . . . . . . . . . . . . . . . . . . . . . . . . . . . . . . . . . . . . . . . . . . . . . . . . . . . . . . . . . 667 -0- -0-A CZK H . . . . . . . . . . . . . . . . . . . . . . . . . . . . . . . . . . . . . . . . . . . . . . . . . . . . . . . . . . . . . . . . 3,159 -0- -0-A EUR H . . . . . . . . . . . . . . . . . . . . . . . . . . . . . . . . . . . . . . . . . . . . . . . . . . . . . . . . . . . . . . . . 61,802 -0- -0-A NZD H . . . . . . . . . . . . . . . . . . . . . . . . . . . . . . . . . . . . . . . . . . . . . . . . . . . . . . . . . . . . . . . . 833 -0- -0-A SGD H . . . . . . . . . . . . . . . . . . . . . . . . . . . . . . . . . . . . . . . . . . . . . . . . . . . . . . . . . . . . . . . . 9,296 -0- -0-A USD H . . . . . . . . . . . . . . . . . . . . . . . . . . . . . . . . . . . . . . . . . . . . . . . . . . . . . . . . . . . . . . . . 471,300 -0- -0-A2 . . . . . . . . . . . . . . . . . . . . . . . . . . . . . . . . . . . . . . . . . . . . . . . . . . . . . . . . . . . . . . . . . . . . . -0- -0- 8,953,464A2 EUR H . . . . . . . . . . . . . . . . . . . . . . . . . . . . . . . . . . . . . . . . . . . . . . . . . . . . . . . . . . . . . . . -0- -0- 2,776A2 SGD H . . . . . . . . . . . . . . . . . . . . . . . . . . . . . . . . . . . . . . . . . . . . . . . . . . . . . . . . . . . . . . . -0- -0- 833AA . . . . . . . . . . . . . . . . . . . . . . . . . . . . . . . . . . . . . . . . . . . . . . . . . . . . . . . . . . . . . . . . . . . . . -0- -0- 1,717,731AA AUD H . . . . . . . . . . . . . . . . . . . . . . . . . . . . . . . . . . . . . . . . . . . . . . . . . . . . . . . . . . . . . . -0- -0- 2,757,853AA CAD H . . . . . . . . . . . . . . . . . . . . . . . . . . . . . . . . . . . . . . . . . . . . . . . . . . . . . . . . . . . . . . -0- -0- 846,486AA GBP H . . . . . . . . . . . . . . . . . . . . . . . . . . . . . . . . . . . . . . . . . . . . . . . . . . . . . . . . . . . . . . . -0- -0- 196,519AA NZD H . . . . . . . . . . . . . . . . . . . . . . . . . . . . . . . . . . . . . . . . . . . . . . . . . . . . . . . . . . . . . . -0- -0- 1,008AA SGD H . . . . . . . . . . . . . . . . . . . . . . . . . . . . . . . . . . . . . . . . . . . . . . . . . . . . . . . . . . . . . . -0- -0- 83,043AD . . . . . . . . . . . . . . . . . . . . . . . . . . . . . . . . . . . . . . . . . . . . . . . . . . . . . . . . . . . . . . . . . . . . . 20,613 620,205 -0-AD AUD H . . . . . . . . . . . . . . . . . . . . . . . . . . . . . . . . . . . . . . . . . . . . . . . . . . . . . . . . . . . . . . 625,379 824,177 -0-AD CAD H . . . . . . . . . . . . . . . . . . . . . . . . . . . . . . . . . . . . . . . . . . . . . . . . . . . . . . . . . . . . . . -0- 34,844 -0-AD EUR H . . . . . . . . . . . . . . . . . . . . . . . . . . . . . . . . . . . . . . . . . . . . . . . . . . . . . . . . . . . . . . -0- 31,483 -0-AD GBP H . . . . . . . . . . . . . . . . . . . . . . . . . . . . . . . . . . . . . . . . . . . . . . . . . . . . . . . . . . . . . . -0- 31,693 -0-AD NZD H . . . . . . . . . . . . . . . . . . . . . . . . . . . . . . . . . . . . . . . . . . . . . . . . . . . . . . . . . . . . . . 51,292 78,568 -0-AD RMB H . . . . . . . . . . . . . . . . . . . . . . . . . . . . . . . . . . . . . . . . . . . . . . . . . . . . . . . . . . . . . . -0- 816 -0-AD SGD H . . . . . . . . . . . . . . . . . . . . . . . . . . . . . . . . . . . . . . . . . . . . . . . . . . . . . . . . . . . . . . -0- 1,668 -0-AD USD H . . . . . . . . . . . . . . . . . . . . . . . . . . . . . . . . . . . . . . . . . . . . . . . . . . . . . . . . . . . . . . 120,957 -0- -0-AD ZAR H . . . . . . . . . . . . . . . . . . . . . . . . . . . . . . . . . . . . . . . . . . . . . . . . . . . . . . . . . . . . . . 121,543 1,870,483 -0-AJ . . . . . . . . . . . . . . . . . . . . . . . . . . . . . . . . . . . . . . . . . . . . . . . . . . . . . . . . . . . . . . . . . . . . . -0- -0- 5,348,421AR EUR H . . . . . . . . . . . . . . . . . . . . . . . . . . . . . . . . . . . . . . . . . . . . . . . . . . . . . . . . . . . . . . -0- -0- 66,367AT . . . . . . . . . . . . . . . . . . . . . . . . . . . . . . . . . . . . . . . . . . . . . . . . . . . . . . . . . . . . . . . . . . . . . -0- -0- 7,188,318AT AUD H . . . . . . . . . . . . . . . . . . . . . . . . . . . . . . . . . . . . . . . . . . . . . . . . . . . . . . . . . . . . . . . -0- -0- 527,183AT CAD H . . . . . . . . . . . . . . . . . . . . . . . . . . . . . . . . . . . . . . . . . . . . . . . . . . . . . . . . . . . . . . . -0- -0- 85,232AT EUR H . . . . . . . . . . . . . . . . . . . . . . . . . . . . . . . . . . . . . . . . . . . . . . . . . . . . . . . . . . . . . . . -0- -0- 21,438AT GBP H . . . . . . . . . . . . . . . . . . . . . . . . . . . . . . . . . . . . . . . . . . . . . . . . . . . . . . . . . . . . . . . -0- -0- 41,914AT NZD H . . . . . . . . . . . . . . . . . . . . . . . . . . . . . . . . . . . . . . . . . . . . . . . . . . . . . . . . . . . . . . . -0- -0- 68,009AT SGD H . . . . . . . . . . . . . . . . . . . . . . . . . . . . . . . . . . . . . . . . . . . . . . . . . . . . . . . . . . . . . . . -0- -0- 24,543AX . . . . . . . . . . . . . . . . . . . . . . . . . . . . . . . . . . . . . . . . . . . . . . . . . . . . . . . . . . . . . . . . . . . . . -0- -0- 10,966B . . . . . . . . . . . . . . . . . . . . . . . . . . . . . . . . . . . . . . . . . . . . . . . . . . . . . . . . . . . . . . . . . . . . . . 2,743 143,846 153,155B2 . . . . . . . . . . . . . . . . . . . . . . . . . . . . . . . . . . . . . . . . . . . . . . . . . . . . . . . . . . . . . . . . . . . . . -0- -0- 29,519BA . . . . . . . . . . . . . . . . . . . . . . . . . . . . . . . . . . . . . . . . . . . . . . . . . . . . . . . . . . . . . . . . . . . . . -0- -0- 17,478BA AUD H . . . . . . . . . . . . . . . . . . . . . . . . . . . . . . . . . . . . . . . . . . . . . . . . . . . . . . . . . . . . . . -0- -0- 11,548BD . . . . . . . . . . . . . . . . . . . . . . . . . . . . . . . . . . . . . . . . . . . . . . . . . . . . . . . . . . . . . . . . . . . . . 157 36,621 -0-BD AUD H . . . . . . . . . . . . . . . . . . . . . . . . . . . . . . . . . . . . . . . . . . . . . . . . . . . . . . . . . . . . . . 2,640 51,294 -0-BD EUR H . . . . . . . . . . . . . . . . . . . . . . . . . . . . . . . . . . . . . . . . . . . . . . . . . . . . . . . . . . . . . . -0- 5,232 -0-BD NZD H . . . . . . . . . . . . . . . . . . . . . . . . . . . . . . . . . . . . . . . . . . . . . . . . . . . . . . . . . . . . . . -0- 2,611 -0-BD USD H . . . . . . . . . . . . . . . . . . . . . . . . . . . . . . . . . . . . . . . . . . . . . . . . . . . . . . . . . . . . . . 15,450 -0- -0-BD ZAR H . . . . . . . . . . . . . . . . . . . . . . . . . . . . . . . . . . . . . . . . . . . . . . . . . . . . . . . . . . . . . . 10,328 17,642 -0-BT . . . . . . . . . . . . . . . . . . . . . . . . . . . . . . . . . . . . . . . . . . . . . . . . . . . . . . . . . . . . . . . . . . . . . -0- -0- 72,052BT AUD H . . . . . . . . . . . . . . . . . . . . . . . . . . . . . . . . . . . . . . . . . . . . . . . . . . . . . . . . . . . . . . -0- -0- 25,693BT CAD H . . . . . . . . . . . . . . . . . . . . . . . . . . . . . . . . . . . . . . . . . . . . . . . . . . . . . . . . . . . . . . -0- -0- 6,413BT GBP H . . . . . . . . . . . . . . . . . . . . . . . . . . . . . . . . . . . . . . . . . . . . . . . . . . . . . . . . . . . . . . . -0- -0- 6,213BX . . . . . . . . . . . . . . . . . . . . . . . . . . . . . . . . . . . . . . . . . . . . . . . . . . . . . . . . . . . . . . . . . . . . . -0- -0- 5,679C . . . . . . . . . . . . . . . . . . . . . . . . . . . . . . . . . . . . . . . . . . . . . . . . . . . . . . . . . . . . . . . . . . . . . . 15,239 28,677 250,021C EUR H . . . . . . . . . . . . . . . . . . . . . . . . . . . . . . . . . . . . . . . . . . . . . . . . . . . . . . . . . . . . . . . . 521 -0- -0-C2 . . . . . . . . . . . . . . . . . . . . . . . . . . . . . . . . . . . . . . . . . . . . . . . . . . . . . . . . . . . . . . . . . . . . . -0- -0- 265,233C2 EUR H . . . . . . . . . . . . . . . . . . . . . . . . . . . . . . . . . . . . . . . . . . . . . . . . . . . . . . . . . . . . . . . -0- -0- 457I . . . . . . . . . . . . . . . . . . . . . . . . . . . . . . . . . . . . . . . . . . . . . . . . . . . . . . . . . . . . . . . . . . . . . . . 330,782 16,048 1,807,244I EUR H . . . . . . . . . . . . . . . . . . . . . . . . . . . . . . . . . . . . . . . . . . . . . . . . . . . . . . . . . . . . . . . . 522 -0- -0-
ShareS OutStanding (continued)February 28, 2019

AB FCP I
155
Japan Strategic China Value Opportunity GlobalBond Portfolio Portfolio Portfolio
CLASSI USD H . . . . . . . . . . . . . . . . . . . . . . . . . . . . . . . . . . . . . . . . . . . . . . . . . . . . . . . . . . . . . . . . 40,992 -0- -0-I2 . . . . . . . . . . . . . . . . . . . . . . . . . . . . . . . . . . . . . . . . . . . . . . . . . . . . . . . . . . . . . . . . . . . . . . -0- -0- 9,500,203I2 AUD H . . . . . . . . . . . . . . . . . . . . . . . . . . . . . . . . . . . . . . . . . . . . . . . . . . . . . . . . . . . . . . . -0- -0- 1,468I2 EUR H . . . . . . . . . . . . . . . . . . . . . . . . . . . . . . . . . . . . . . . . . . . . . . . . . . . . . . . . . . . . . . . -0- -0- 101,754IT . . . . . . . . . . . . . . . . . . . . . . . . . . . . . . . . . . . . . . . . . . . . . . . . . . . . . . . . . . . . . . . . . . . . . . -0- -0- 242,455IT AUD H . . . . . . . . . . . . . . . . . . . . . . . . . . . . . . . . . . . . . . . . . . . . . . . . . . . . . . . . . . . . . . . -0- -0- 868N2 . . . . . . . . . . . . . . . . . . . . . . . . . . . . . . . . . . . . . . . . . . . . . . . . . . . . . . . . . . . . . . . . . . . . . -0- -0- 30,004NT . . . . . . . . . . . . . . . . . . . . . . . . . . . . . . . . . . . . . . . . . . . . . . . . . . . . . . . . . . . . . . . . . . . . . -0- -0- 7,960S . . . . . . . . . . . . . . . . . . . . . . . . . . . . . . . . . . . . . . . . . . . . . . . . . . . . . . . . . . . . . . . . . . . . . . -0- 50,589 -0-S EUR H . . . . . . . . . . . . . . . . . . . . . . . . . . . . . . . . . . . . . . . . . . . . . . . . . . . . . . . . . . . . . . . . 421 -0- 1,041S SGD H . . . . . . . . . . . . . . . . . . . . . . . . . . . . . . . . . . . . . . . . . . . . . . . . . . . . . . . . . . . . . . . . -0- -0- 833S1 . . . . . . . . . . . . . . . . . . . . . . . . . . . . . . . . . . . . . . . . . . . . . . . . . . . . . . . . . . . . . . . . . . . . . 638,733 469,853 -0-S1 2 . . . . . . . . . . . . . . . . . . . . . . . . . . . . . . . . . . . . . . . . . . . . . . . . . . . . . . . . . . . . . . . . . . . . -0- -0- 6,025,253S1 EUR H . . . . . . . . . . . . . . . . . . . . . . . . . . . . . . . . . . . . . . . . . . . . . . . . . . . . . . . . . . . . . . . -0- -0- 1,041S1 USD H . . . . . . . . . . . . . . . . . . . . . . . . . . . . . . . . . . . . . . . . . . . . . . . . . . . . . . . . . . . . . . . 137,405 -0- -0-SA . . . . . . . . . . . . . . . . . . . . . . . . . . . . . . . . . . . . . . . . . . . . . . . . . . . . . . . . . . . . . . . . . . . . . -0- -0- 44,658SD . . . . . . . . . . . . . . . . . . . . . . . . . . . . . . . . . . . . . . . . . . . . . . . . . . . . . . . . . . . . . . . . . . . . . 292,852 -0- -0-

AB FCP I
156
GlobalHigh American European Yield Income Income Portfolio Portfolio Portfolio
CLASSA . . . . . . . . . . . . . . . . . . . . . . . . . . . . . . . . . . . . . . . . . . . . . . . . . . . . . . . . . . . . . . . . . . . . . . 128,381,232 67,237,456 2,223,035A2 . . . . . . . . . . . . . . . . . . . . . . . . . . . . . . . . . . . . . . . . . . . . . . . . . . . . . . . . . . . . . . . . . . . . . 65,129,430 43,356,311 2,734,003A2 CHF H . . . . . . . . . . . . . . . . . . . . . . . . . . . . . . . . . . . . . . . . . . . . . . . . . . . . . . . . . . . . . . . 19,599 261,798 5,062A2 DUR PH . . . . . . . . . . . . . . . . . . . . . . . . . . . . . . . . . . . . . . . . . . . . . . . . . . . . . . . . . . . . . -0- 5,537 -0-A2 EUR H . . . . . . . . . . . . . . . . . . . . . . . . . . . . . . . . . . . . . . . . . . . . . . . . . . . . . . . . . . . . . . . 1,398,916 2,474,531 -0-A2 SGD H . . . . . . . . . . . . . . . . . . . . . . . . . . . . . . . . . . . . . . . . . . . . . . . . . . . . . . . . . . . . . . . 772,115 556,330 933A2 USD H . . . . . . . . . . . . . . . . . . . . . . . . . . . . . . . . . . . . . . . . . . . . . . . . . . . . . . . . . . . . . . . -0- -0- 862,131AA . . . . . . . . . . . . . . . . . . . . . . . . . . . . . . . . . . . . . . . . . . . . . . . . . . . . . . . . . . . . . . . . . . . . . 220,792,290 29,312,734 1,878,223AA AUD H . . . . . . . . . . . . . . . . . . . . . . . . . . . . . . . . . . . . . . . . . . . . . . . . . . . . . . . . . . . . . . 194,540,072 18,856,270 18,760,293AA CAD H . . . . . . . . . . . . . . . . . . . . . . . . . . . . . . . . . . . . . . . . . . . . . . . . . . . . . . . . . . . . . . 442,581 3,883,356 -0-AA DUR PH . . . . . . . . . . . . . . . . . . . . . . . . . . . . . . . . . . . . . . . . . . . . . . . . . . . . . . . . . . . . . -0- 3,783,991 -0-AA EUR H . . . . . . . . . . . . . . . . . . . . . . . . . . . . . . . . . . . . . . . . . . . . . . . . . . . . . . . . . . . . . . 921,405 211,674 -0-AA GBP H . . . . . . . . . . . . . . . . . . . . . . . . . . . . . . . . . . . . . . . . . . . . . . . . . . . . . . . . . . . . . . . 3,851,525 2,992,801 -0-AA HKD H . . . . . . . . . . . . . . . . . . . . . . . . . . . . . . . . . . . . . . . . . . . . . . . . . . . . . . . . . . . . . . -0- -0- 6,462,036AA NZD H . . . . . . . . . . . . . . . . . . . . . . . . . . . . . . . . . . . . . . . . . . . . . . . . . . . . . . . . . . . . . . 1,280,112 1,240,771 -0-AA RMB H . . . . . . . . . . . . . . . . . . . . . . . . . . . . . . . . . . . . . . . . . . . . . . . . . . . . . . . . . . . . . . 929,843 269,018 72,612AA SGD H . . . . . . . . . . . . . . . . . . . . . . . . . . . . . . . . . . . . . . . . . . . . . . . . . . . . . . . . . . . . . . 185,056 18,740 339,308AA USD H . . . . . . . . . . . . . . . . . . . . . . . . . . . . . . . . . . . . . . . . . . . . . . . . . . . . . . . . . . . . . . -0- -0- 82,292,165AA ZAR H . . . . . . . . . . . . . . . . . . . . . . . . . . . . . . . . . . . . . . . . . . . . . . . . . . . . . . . . . . . . . . 280,732,538 11,557,663 -0-AK . . . . . . . . . . . . . . . . . . . . . . . . . . . . . . . . . . . . . . . . . . . . . . . . . . . . . . . . . . . . . . . . . . . . . 140,624 61,128 182,242AK EUR H . . . . . . . . . . . . . . . . . . . . . . . . . . . . . . . . . . . . . . . . . . . . . . . . . . . . . . . . . . . . . . 7,963 31,187 -0-AR . . . . . . . . . . . . . . . . . . . . . . . . . . . . . . . . . . . . . . . . . . . . . . . . . . . . . . . . . . . . . . . . . . . . . -0- -0- 385,939AR EUR . . . . . . . . . . . . . . . . . . . . . . . . . . . . . . . . . . . . . . . . . . . . . . . . . . . . . . . . . . . . . . . . -0- 27,858 -0-AR EUR H . . . . . . . . . . . . . . . . . . . . . . . . . . . . . . . . . . . . . . . . . . . . . . . . . . . . . . . . . . . . . . 103,628 12,876 -0-AT . . . . . . . . . . . . . . . . . . . . . . . . . . . . . . . . . . . . . . . . . . . . . . . . . . . . . . . . . . . . . . . . . . . . . 1,702,980,801 644,219,991 20,300,781AT AUD H . . . . . . . . . . . . . . . . . . . . . . . . . . . . . . . . . . . . . . . . . . . . . . . . . . . . . . . . . . . . . . . 124,502,031 70,804,849 4,747,643AT CAD H . . . . . . . . . . . . . . . . . . . . . . . . . . . . . . . . . . . . . . . . . . . . . . . . . . . . . . . . . . . . . . . 10,530,349 21,187,924 -0-AT DUR PH . . . . . . . . . . . . . . . . . . . . . . . . . . . . . . . . . . . . . . . . . . . . . . . . . . . . . . . . . . . . . -0- 66,199 -0-AT EUR H . . . . . . . . . . . . . . . . . . . . . . . . . . . . . . . . . . . . . . . . . . . . . . . . . . . . . . . . . . . . . . . 8,450,737 6,264,052 -0-AT GBP H . . . . . . . . . . . . . . . . . . . . . . . . . . . . . . . . . . . . . . . . . . . . . . . . . . . . . . . . . . . . . . . 4,473,849 10,171,009 -0-AT NZD H . . . . . . . . . . . . . . . . . . . . . . . . . . . . . . . . . . . . . . . . . . . . . . . . . . . . . . . . . . . . . . . 10,819,610 5,434,879 -0-AT RMB H . . . . . . . . . . . . . . . . . . . . . . . . . . . . . . . . . . . . . . . . . . . . . . . . . . . . . . . . . . . . . . 3,576,288 2,794,726 -0-AT SGD H . . . . . . . . . . . . . . . . . . . . . . . . . . . . . . . . . . . . . . . . . . . . . . . . . . . . . . . . . . . . . . . 41,210,261 15,946,690 1,232,398AT USD H . . . . . . . . . . . . . . . . . . . . . . . . . . . . . . . . . . . . . . . . . . . . . . . . . . . . . . . . . . . . . . . -0- -0- 14,605,951B . . . . . . . . . . . . . . . . . . . . . . . . . . . . . . . . . . . . . . . . . . . . . . . . . . . . . . . . . . . . . . . . . . . . . . 4,391,669 4,065,536 380,069B2 . . . . . . . . . . . . . . . . . . . . . . . . . . . . . . . . . . . . . . . . . . . . . . . . . . . . . . . . . . . . . . . . . . . . . 193,528 457,113 25,802B2 EUR H . . . . . . . . . . . . . . . . . . . . . . . . . . . . . . . . . . . . . . . . . . . . . . . . . . . . . . . . . . . . . . . 526 -0- -0-BA . . . . . . . . . . . . . . . . . . . . . . . . . . . . . . . . . . . . . . . . . . . . . . . . . . . . . . . . . . . . . . . . . . . . . 10,653,943 2,969,188 174,070BA AUD H . . . . . . . . . . . . . . . . . . . . . . . . . . . . . . . . . . . . . . . . . . . . . . . . . . . . . . . . . . . . . . 9,023,005 1,398,507 1,314,395BA USD H . . . . . . . . . . . . . . . . . . . . . . . . . . . . . . . . . . . . . . . . . . . . . . . . . . . . . . . . . . . . . . -0- -0- 1,105,391BA ZAR H . . . . . . . . . . . . . . . . . . . . . . . . . . . . . . . . . . . . . . . . . . . . . . . . . . . . . . . . . . . . . . 8,269,477 1,381,853 -0-BT . . . . . . . . . . . . . . . . . . . . . . . . . . . . . . . . . . . . . . . . . . . . . . . . . . . . . . . . . . . . . . . . . . . . . 11,587,836 15,848,177 474,148BT AUD H . . . . . . . . . . . . . . . . . . . . . . . . . . . . . . . . . . . . . . . . . . . . . . . . . . . . . . . . . . . . . . 2,013,982 3,883,034 247,139BT CAD H . . . . . . . . . . . . . . . . . . . . . . . . . . . . . . . . . . . . . . . . . . . . . . . . . . . . . . . . . . . . . . 291,494 450,204 -0-BT EUR H . . . . . . . . . . . . . . . . . . . . . . . . . . . . . . . . . . . . . . . . . . . . . . . . . . . . . . . . . . . . . . . 81,664 126,616 -0-BT GBP H . . . . . . . . . . . . . . . . . . . . . . . . . . . . . . . . . . . . . . . . . . . . . . . . . . . . . . . . . . . . . . . 93,707 444,501 -0-BT NZD H . . . . . . . . . . . . . . . . . . . . . . . . . . . . . . . . . . . . . . . . . . . . . . . . . . . . . . . . . . . . . . . 124,777 491,567 -0-BT USD H . . . . . . . . . . . . . . . . . . . . . . . . . . . . . . . . . . . . . . . . . . . . . . . . . . . . . . . . . . . . . . . -0- -0- 666,950C . . . . . . . . . . . . . . . . . . . . . . . . . . . . . . . . . . . . . . . . . . . . . . . . . . . . . . . . . . . . . . . . . . . . . . 25,703,449 19,877,514 2,627,222C2 . . . . . . . . . . . . . . . . . . . . . . . . . . . . . . . . . . . . . . . . . . . . . . . . . . . . . . . . . . . . . . . . . . . . . 2,004,300 4,708,940 223,164C2 DUR PH . . . . . . . . . . . . . . . . . . . . . . . . . . . . . . . . . . . . . . . . . . . . . . . . . . . . . . . . . . . . . -0- 9,172 -0-C2 EUR H . . . . . . . . . . . . . . . . . . . . . . . . . . . . . . . . . . . . . . . . . . . . . . . . . . . . . . . . . . . . . . . 13,050 349,954 -0-C2 USD H . . . . . . . . . . . . . . . . . . . . . . . . . . . . . . . . . . . . . . . . . . . . . . . . . . . . . . . . . . . . . . . -0- -0- 116,224CK . . . . . . . . . . . . . . . . . . . . . . . . . . . . . . . . . . . . . . . . . . . . . . . . . . . . . . . . . . . . . . . . . . . . . 878 -0- 20,371CK EUR H . . . . . . . . . . . . . . . . . . . . . . . . . . . . . . . . . . . . . . . . . . . . . . . . . . . . . . . . . . . . . . 629 -0- -0-CT . . . . . . . . . . . . . . . . . . . . . . . . . . . . . . . . . . . . . . . . . . . . . . . . . . . . . . . . . . . . . . . . . . . . . 53,736 29,326 -0-CT USD H . . . . . . . . . . . . . . . . . . . . . . . . . . . . . . . . . . . . . . . . . . . . . . . . . . . . . . . . . . . . . . . -0- -0- 2,861EA . . . . . . . . . . . . . . . . . . . . . . . . . . . . . . . . . . . . . . . . . . . . . . . . . . . . . . . . . . . . . . . . . . . . . 21,047,136 -0- -0-
ShareS OutStanding (continued)February 28, 2019
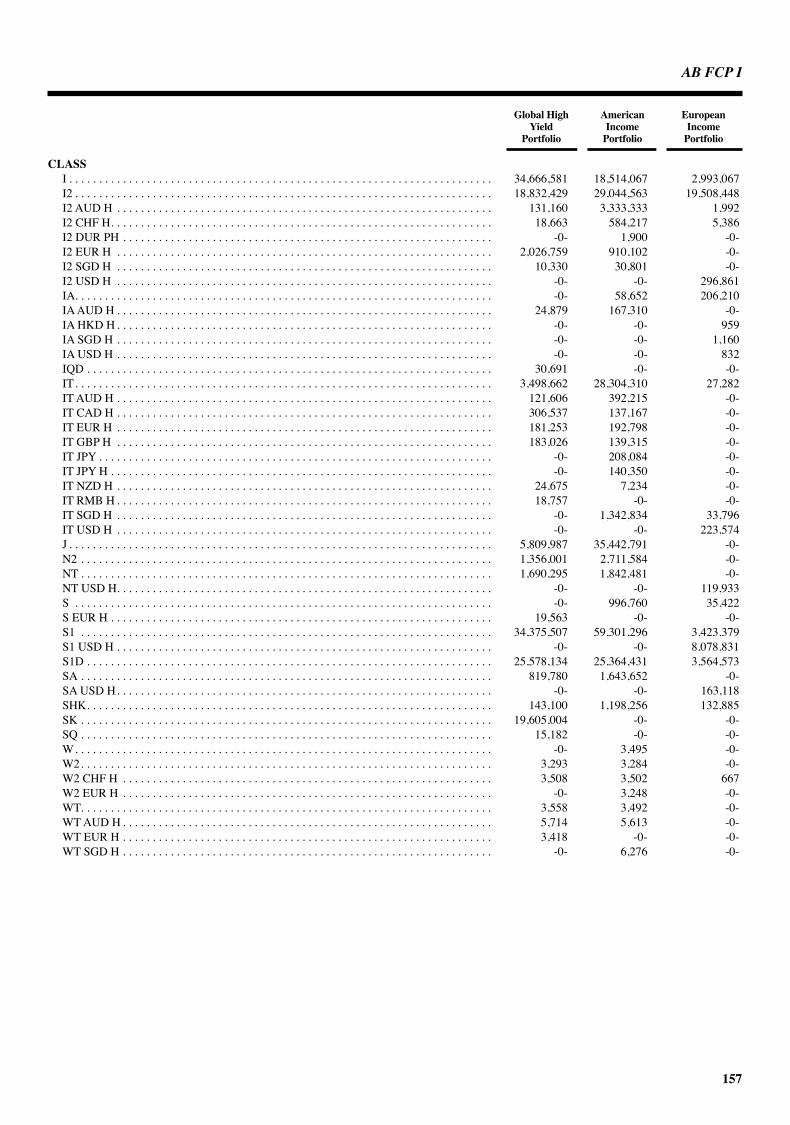
AB FCP I
157
GlobalHigh American European Yield Income Income Portfolio Portfolio Portfolio
CLASSI . . . . . . . . . . . . . . . . . . . . . . . . . . . . . . . . . . . . . . . . . . . . . . . . . . . . . . . . . . . . . . . . . . . . . . . 34,666,581 18,514,067 2,993,067I2 . . . . . . . . . . . . . . . . . . . . . . . . . . . . . . . . . . . . . . . . . . . . . . . . . . . . . . . . . . . . . . . . . . . . . . 18,832,429 29,044,563 19,508,448I2 AUD H . . . . . . . . . . . . . . . . . . . . . . . . . . . . . . . . . . . . . . . . . . . . . . . . . . . . . . . . . . . . . . . 131,160 3,333,333 1,992I2 CHF H . . . . . . . . . . . . . . . . . . . . . . . . . . . . . . . . . . . . . . . . . . . . . . . . . . . . . . . . . . . . . . . . 18,663 584,217 5,386I2 DUR PH . . . . . . . . . . . . . . . . . . . . . . . . . . . . . . . . . . . . . . . . . . . . . . . . . . . . . . . . . . . . . . -0- 1,900 -0-I2 EUR H . . . . . . . . . . . . . . . . . . . . . . . . . . . . . . . . . . . . . . . . . . . . . . . . . . . . . . . . . . . . . . . 2,026,759 910,102 -0-I2 SGD H . . . . . . . . . . . . . . . . . . . . . . . . . . . . . . . . . . . . . . . . . . . . . . . . . . . . . . . . . . . . . . . 10,330 30,801 -0-I2 USD H . . . . . . . . . . . . . . . . . . . . . . . . . . . . . . . . . . . . . . . . . . . . . . . . . . . . . . . . . . . . . . . -0- -0- 296,861IA . . . . . . . . . . . . . . . . . . . . . . . . . . . . . . . . . . . . . . . . . . . . . . . . . . . . . . . . . . . . . . . . . . . . . . -0- 58,652 206,210IA AUD H . . . . . . . . . . . . . . . . . . . . . . . . . . . . . . . . . . . . . . . . . . . . . . . . . . . . . . . . . . . . . . . 24,879 167,310 -0-IA HKD H . . . . . . . . . . . . . . . . . . . . . . . . . . . . . . . . . . . . . . . . . . . . . . . . . . . . . . . . . . . . . . . -0- -0- 959IA SGD H . . . . . . . . . . . . . . . . . . . . . . . . . . . . . . . . . . . . . . . . . . . . . . . . . . . . . . . . . . . . . . . -0- -0- 1,160IA USD H . . . . . . . . . . . . . . . . . . . . . . . . . . . . . . . . . . . . . . . . . . . . . . . . . . . . . . . . . . . . . . . -0- -0- 832IQD . . . . . . . . . . . . . . . . . . . . . . . . . . . . . . . . . . . . . . . . . . . . . . . . . . . . . . . . . . . . . . . . . . . . 30,691 -0- -0-IT . . . . . . . . . . . . . . . . . . . . . . . . . . . . . . . . . . . . . . . . . . . . . . . . . . . . . . . . . . . . . . . . . . . . . . 3,498,662 28,304,310 27,282IT AUD H . . . . . . . . . . . . . . . . . . . . . . . . . . . . . . . . . . . . . . . . . . . . . . . . . . . . . . . . . . . . . . . 121,606 392,215 -0-IT CAD H . . . . . . . . . . . . . . . . . . . . . . . . . . . . . . . . . . . . . . . . . . . . . . . . . . . . . . . . . . . . . . . 306,537 137,167 -0-IT EUR H . . . . . . . . . . . . . . . . . . . . . . . . . . . . . . . . . . . . . . . . . . . . . . . . . . . . . . . . . . . . . . . 181,253 192,798 -0-IT GBP H . . . . . . . . . . . . . . . . . . . . . . . . . . . . . . . . . . . . . . . . . . . . . . . . . . . . . . . . . . . . . . . 183,026 139,315 -0-IT JPY . . . . . . . . . . . . . . . . . . . . . . . . . . . . . . . . . . . . . . . . . . . . . . . . . . . . . . . . . . . . . . . . . . -0- 208,084 -0-IT JPY H . . . . . . . . . . . . . . . . . . . . . . . . . . . . . . . . . . . . . . . . . . . . . . . . . . . . . . . . . . . . . . . . -0- 140,350 -0-IT NZD H . . . . . . . . . . . . . . . . . . . . . . . . . . . . . . . . . . . . . . . . . . . . . . . . . . . . . . . . . . . . . . . 24,675 7,234 -0-IT RMB H . . . . . . . . . . . . . . . . . . . . . . . . . . . . . . . . . . . . . . . . . . . . . . . . . . . . . . . . . . . . . . . 18,757 -0- -0-IT SGD H . . . . . . . . . . . . . . . . . . . . . . . . . . . . . . . . . . . . . . . . . . . . . . . . . . . . . . . . . . . . . . . -0- 1,342,834 33,796IT USD H . . . . . . . . . . . . . . . . . . . . . . . . . . . . . . . . . . . . . . . . . . . . . . . . . . . . . . . . . . . . . . . -0- -0- 223,574J . . . . . . . . . . . . . . . . . . . . . . . . . . . . . . . . . . . . . . . . . . . . . . . . . . . . . . . . . . . . . . . . . . . . . . . 5,809,987 35,442,791 -0-N2 . . . . . . . . . . . . . . . . . . . . . . . . . . . . . . . . . . . . . . . . . . . . . . . . . . . . . . . . . . . . . . . . . . . . . 1,356,001 2,711,584 -0-NT . . . . . . . . . . . . . . . . . . . . . . . . . . . . . . . . . . . . . . . . . . . . . . . . . . . . . . . . . . . . . . . . . . . . . 1,690,295 1,842,481 -0-NT USD H . . . . . . . . . . . . . . . . . . . . . . . . . . . . . . . . . . . . . . . . . . . . . . . . . . . . . . . . . . . . . . . -0- -0- 119,933S . . . . . . . . . . . . . . . . . . . . . . . . . . . . . . . . . . . . . . . . . . . . . . . . . . . . . . . . . . . . . . . . . . . . . . -0- 996,760 35,422S EUR H . . . . . . . . . . . . . . . . . . . . . . . . . . . . . . . . . . . . . . . . . . . . . . . . . . . . . . . . . . . . . . . . 19,563 -0- -0-S1 . . . . . . . . . . . . . . . . . . . . . . . . . . . . . . . . . . . . . . . . . . . . . . . . . . . . . . . . . . . . . . . . . . . . . 34,375,507 59,301,296 3,423,379S1 USD H . . . . . . . . . . . . . . . . . . . . . . . . . . . . . . . . . . . . . . . . . . . . . . . . . . . . . . . . . . . . . . . -0- -0- 8,078,831S1D . . . . . . . . . . . . . . . . . . . . . . . . . . . . . . . . . . . . . . . . . . . . . . . . . . . . . . . . . . . . . . . . . . . . 25,578,134 25,364,431 3,564,573SA . . . . . . . . . . . . . . . . . . . . . . . . . . . . . . . . . . . . . . . . . . . . . . . . . . . . . . . . . . . . . . . . . . . . . 819,780 1,643,652 -0-SA USD H . . . . . . . . . . . . . . . . . . . . . . . . . . . . . . . . . . . . . . . . . . . . . . . . . . . . . . . . . . . . . . . -0- -0- 163,118SHK . . . . . . . . . . . . . . . . . . . . . . . . . . . . . . . . . . . . . . . . . . . . . . . . . . . . . . . . . . . . . . . . . . . . 143,100 1,198,256 132,885SK . . . . . . . . . . . . . . . . . . . . . . . . . . . . . . . . . . . . . . . . . . . . . . . . . . . . . . . . . . . . . . . . . . . . . 19,605,004 -0- -0-SQ . . . . . . . . . . . . . . . . . . . . . . . . . . . . . . . . . . . . . . . . . . . . . . . . . . . . . . . . . . . . . . . . . . . . . 15,182 -0- -0-W . . . . . . . . . . . . . . . . . . . . . . . . . . . . . . . . . . . . . . . . . . . . . . . . . . . . . . . . . . . . . . . . . . . . . . -0- 3,495 -0-W2 . . . . . . . . . . . . . . . . . . . . . . . . . . . . . . . . . . . . . . . . . . . . . . . . . . . . . . . . . . . . . . . . . . . . . 3,293 3,284 -0-W2 CHF H . . . . . . . . . . . . . . . . . . . . . . . . . . . . . . . . . . . . . . . . . . . . . . . . . . . . . . . . . . . . . . 3,508 3,502 667W2 EUR H . . . . . . . . . . . . . . . . . . . . . . . . . . . . . . . . . . . . . . . . . . . . . . . . . . . . . . . . . . . . . . -0- 3,248 -0-WT . . . . . . . . . . . . . . . . . . . . . . . . . . . . . . . . . . . . . . . . . . . . . . . . . . . . . . . . . . . . . . . . . . . . . 3,558 3,492 -0-WT AUD H . . . . . . . . . . . . . . . . . . . . . . . . . . . . . . . . . . . . . . . . . . . . . . . . . . . . . . . . . . . . . . 5,714 5,613 -0-WT EUR H . . . . . . . . . . . . . . . . . . . . . . . . . . . . . . . . . . . . . . . . . . . . . . . . . . . . . . . . . . . . . . 3,418 -0- -0-WT SGD H . . . . . . . . . . . . . . . . . . . . . . . . . . . . . . . . . . . . . . . . . . . . . . . . . . . . . . . . . . . . . . -0- 6,276 -0-

AB FCP I
158
Emerging Mortgage MarketsDebt Income GlobalBond Portfolio Portfolio IIPortfolio
CLASSA . . . . . . . . . . . . . . . . . . . . . . . . . . . . . . . . . . . . . . . . . . . . . . . . . . . . . . . . . . . . . . . . . . . . . . 1,144,746 8,058,036 -0-A2 . . . . . . . . . . . . . . . . . . . . . . . . . . . . . . . . . . . . . . . . . . . . . . . . . . . . . . . . . . . . . . . . . . . . . 988,464 11,847,850 -0-A2 CHF H . . . . . . . . . . . . . . . . . . . . . . . . . . . . . . . . . . . . . . . . . . . . . . . . . . . . . . . . . . . . . . . 600 -0- -0-A2 EUR H . . . . . . . . . . . . . . . . . . . . . . . . . . . . . . . . . . . . . . . . . . . . . . . . . . . . . . . . . . . . . . . 49,271 -0- -0-A2 SGD H . . . . . . . . . . . . . . . . . . . . . . . . . . . . . . . . . . . . . . . . . . . . . . . . . . . . . . . . . . . . . . . 312,284 -0- -0-A2X . . . . . . . . . . . . . . . . . . . . . . . . . . . . . . . . . . . . . . . . . . . . . . . . . . . . . . . . . . . . . . . . . . . . -0- 917,831 -0-AA . . . . . . . . . . . . . . . . . . . . . . . . . . . . . . . . . . . . . . . . . . . . . . . . . . . . . . . . . . . . . . . . . . . . . 6,518,527 29,776,915 -0-AA AUD H . . . . . . . . . . . . . . . . . . . . . . . . . . . . . . . . . . . . . . . . . . . . . . . . . . . . . . . . . . . . . . 5,190,508 10,047,722 -0-AA CAD H . . . . . . . . . . . . . . . . . . . . . . . . . . . . . . . . . . . . . . . . . . . . . . . . . . . . . . . . . . . . . . 9,253 -0- -0-AA EUR H . . . . . . . . . . . . . . . . . . . . . . . . . . . . . . . . . . . . . . . . . . . . . . . . . . . . . . . . . . . . . . 3,306 -0- -0-AA GBP H . . . . . . . . . . . . . . . . . . . . . . . . . . . . . . . . . . . . . . . . . . . . . . . . . . . . . . . . . . . . . . . 18,463 -0- -0-AA NZD H . . . . . . . . . . . . . . . . . . . . . . . . . . . . . . . . . . . . . . . . . . . . . . . . . . . . . . . . . . . . . . 96,403 -0- -0-AA RMB H . . . . . . . . . . . . . . . . . . . . . . . . . . . . . . . . . . . . . . . . . . . . . . . . . . . . . . . . . . . . . . 916 902 -0-AA SGD H . . . . . . . . . . . . . . . . . . . . . . . . . . . . . . . . . . . . . . . . . . . . . . . . . . . . . . . . . . . . . . 1,133 9,114 -0-AA ZAR H . . . . . . . . . . . . . . . . . . . . . . . . . . . . . . . . . . . . . . . . . . . . . . . . . . . . . . . . . . . . . . 13,101,659 4,997,991 -0-AR EUR . . . . . . . . . . . . . . . . . . . . . . . . . . . . . . . . . . . . . . . . . . . . . . . . . . . . . . . . . . . . . . . . 1,759 -0- -0-AR EUR H . . . . . . . . . . . . . . . . . . . . . . . . . . . . . . . . . . . . . . . . . . . . . . . . . . . . . . . . . . . . . . -0- 17,434 -0-AT . . . . . . . . . . . . . . . . . . . . . . . . . . . . . . . . . . . . . . . . . . . . . . . . . . . . . . . . . . . . . . . . . . . . . 16,812,561 10,588,909 -0-AT AUD H . . . . . . . . . . . . . . . . . . . . . . . . . . . . . . . . . . . . . . . . . . . . . . . . . . . . . . . . . . . . . . . 9,710,023 645,781 -0-AT CAD H . . . . . . . . . . . . . . . . . . . . . . . . . . . . . . . . . . . . . . . . . . . . . . . . . . . . . . . . . . . . . . . 237,542 -0- -0-AT EUR H . . . . . . . . . . . . . . . . . . . . . . . . . . . . . . . . . . . . . . . . . . . . . . . . . . . . . . . . . . . . . . . 484,517 -0- -0-AT GBP H . . . . . . . . . . . . . . . . . . . . . . . . . . . . . . . . . . . . . . . . . . . . . . . . . . . . . . . . . . . . . . . 120,502 4,570 -0-AT NZD H . . . . . . . . . . . . . . . . . . . . . . . . . . . . . . . . . . . . . . . . . . . . . . . . . . . . . . . . . . . . . . . 892,471 -0- -0-AT RMB H . . . . . . . . . . . . . . . . . . . . . . . . . . . . . . . . . . . . . . . . . . . . . . . . . . . . . . . . . . . . . . 16,684 -0- -0-AT SGD H . . . . . . . . . . . . . . . . . . . . . . . . . . . . . . . . . . . . . . . . . . . . . . . . . . . . . . . . . . . . . . . 477,474 113,664 -0-AX . . . . . . . . . . . . . . . . . . . . . . . . . . . . . . . . . . . . . . . . . . . . . . . . . . . . . . . . . . . . . . . . . . . . . -0- 471,263 -0-B . . . . . . . . . . . . . . . . . . . . . . . . . . . . . . . . . . . . . . . . . . . . . . . . . . . . . . . . . . . . . . . . . . . . . . 16,873 -0- -0-B2 . . . . . . . . . . . . . . . . . . . . . . . . . . . . . . . . . . . . . . . . . . . . . . . . . . . . . . . . . . . . . . . . . . . . . 36,121 -0- -0-B2X . . . . . . . . . . . . . . . . . . . . . . . . . . . . . . . . . . . . . . . . . . . . . . . . . . . . . . . . . . . . . . . . . . . . -0- 23,222 -0-BA . . . . . . . . . . . . . . . . . . . . . . . . . . . . . . . . . . . . . . . . . . . . . . . . . . . . . . . . . . . . . . . . . . . . . 187,889 18,152 -0-BA AUD H . . . . . . . . . . . . . . . . . . . . . . . . . . . . . . . . . . . . . . . . . . . . . . . . . . . . . . . . . . . . . . 144,542 131,626 -0-BA ZAR H . . . . . . . . . . . . . . . . . . . . . . . . . . . . . . . . . . . . . . . . . . . . . . . . . . . . . . . . . . . . . . 167,796 41,395 -0-BT . . . . . . . . . . . . . . . . . . . . . . . . . . . . . . . . . . . . . . . . . . . . . . . . . . . . . . . . . . . . . . . . . . . . . 652,091 -0- -0-BT AUD H . . . . . . . . . . . . . . . . . . . . . . . . . . . . . . . . . . . . . . . . . . . . . . . . . . . . . . . . . . . . . . 187,249 -0- -0-BT CAD H . . . . . . . . . . . . . . . . . . . . . . . . . . . . . . . . . . . . . . . . . . . . . . . . . . . . . . . . . . . . . . 55,515 -0- -0-BT EUR H . . . . . . . . . . . . . . . . . . . . . . . . . . . . . . . . . . . . . . . . . . . . . . . . . . . . . . . . . . . . . . . 2,546 -0- -0-BT GBP H . . . . . . . . . . . . . . . . . . . . . . . . . . . . . . . . . . . . . . . . . . . . . . . . . . . . . . . . . . . . . . . 5,949 -0- -0-BT NZD H . . . . . . . . . . . . . . . . . . . . . . . . . . . . . . . . . . . . . . . . . . . . . . . . . . . . . . . . . . . . . . . 25,477 -0- -0-BX . . . . . . . . . . . . . . . . . . . . . . . . . . . . . . . . . . . . . . . . . . . . . . . . . . . . . . . . . . . . . . . . . . . . . -0- 326,905 -0-C . . . . . . . . . . . . . . . . . . . . . . . . . . . . . . . . . . . . . . . . . . . . . . . . . . . . . . . . . . . . . . . . . . . . . . 431,524 2,417,278 -0-C2 . . . . . . . . . . . . . . . . . . . . . . . . . . . . . . . . . . . . . . . . . . . . . . . . . . . . . . . . . . . . . . . . . . . . . 152,044 2,163,944 -0-C2 EUR H . . . . . . . . . . . . . . . . . . . . . . . . . . . . . . . . . . . . . . . . . . . . . . . . . . . . . . . . . . . . . . 1,044 -0- -0-C2X . . . . . . . . . . . . . . . . . . . . . . . . . . . . . . . . . . . . . . . . . . . . . . . . . . . . . . . . . . . . . . . . . . . . -0- 3,920 -0-CT . . . . . . . . . . . . . . . . . . . . . . . . . . . . . . . . . . . . . . . . . . . . . . . . . . . . . . . . . . . . . . . . . . . . . 901 -0- -0-CX . . . . . . . . . . . . . . . . . . . . . . . . . . . . . . . . . . . . . . . . . . . . . . . . . . . . . . . . . . . . . . . . . . . . . -0- 19,337 -0-
ShareS OutStanding (continued)February 28, 2019

AB FCP I
159
Emerging Mortgage MarketsDebt Income GlobalBond Portfolio Portfolio IIPortfolio
CLASSI . . . . . . . . . . . . . . . . . . . . . . . . . . . . . . . . . . . . . . . . . . . . . . . . . . . . . . . . . . . . . . . . . . . . . . . 526,819 4,090,789 -0-I2 . . . . . . . . . . . . . . . . . . . . . . . . . . . . . . . . . . . . . . . . . . . . . . . . . . . . . . . . . . . . . . . . . . . . . . 238,269 4,925,135 -0-I2 CHF H . . . . . . . . . . . . . . . . . . . . . . . . . . . . . . . . . . . . . . . . . . . . . . . . . . . . . . . . . . . . . . . . 600 -0- -0-I2 EUR H . . . . . . . . . . . . . . . . . . . . . . . . . . . . . . . . . . . . . . . . . . . . . . . . . . . . . . . . . . . . . . . 3,931,825 5,797,706 -0-I2X . . . . . . . . . . . . . . . . . . . . . . . . . . . . . . . . . . . . . . . . . . . . . . . . . . . . . . . . . . . . . . . . . . . . -0- 1,092 -0-IT . . . . . . . . . . . . . . . . . . . . . . . . . . . . . . . . . . . . . . . . . . . . . . . . . . . . . . . . . . . . . . . . . . . . . . 5,297,109 -0- -0-IT AUD H . . . . . . . . . . . . . . . . . . . . . . . . . . . . . . . . . . . . . . . . . . . . . . . . . . . . . . . . . . . . . . . 1,534 -0- -0-IT EUR H . . . . . . . . . . . . . . . . . . . . . . . . . . . . . . . . . . . . . . . . . . . . . . . . . . . . . . . . . . . . . . . 1,333,333 2,891,392 -0-IT SGD H . . . . . . . . . . . . . . . . . . . . . . . . . . . . . . . . . . . . . . . . . . . . . . . . . . . . . . . . . . . . . . . 1,147 -0- -0-IX . . . . . . . . . . . . . . . . . . . . . . . . . . . . . . . . . . . . . . . . . . . . . . . . . . . . . . . . . . . . . . . . . . . . . -0- 102,388 -0-N2 . . . . . . . . . . . . . . . . . . . . . . . . . . . . . . . . . . . . . . . . . . . . . . . . . . . . . . . . . . . . . . . . . . . . . 33,561 775,425 -0-NT . . . . . . . . . . . . . . . . . . . . . . . . . . . . . . . . . . . . . . . . . . . . . . . . . . . . . . . . . . . . . . . . . . . . . 28,244 251,133 -0-S . . . . . . . . . . . . . . . . . . . . . . . . . . . . . . . . . . . . . . . . . . . . . . . . . . . . . . . . . . . . . . . . . . . . . . 275 2,447,119 -0-S EUR H . . . . . . . . . . . . . . . . . . . . . . . . . . . . . . . . . . . . . . . . . . . . . . . . . . . . . . . . . . . . . . . . 521 -0- -0-S GBP H . . . . . . . . . . . . . . . . . . . . . . . . . . . . . . . . . . . . . . . . . . . . . . . . . . . . . . . . . . . . . . . . 431 -0- -0-S1 . . . . . . . . . . . . . . . . . . . . . . . . . . . . . . . . . . . . . . . . . . . . . . . . . . . . . . . . . . . . . . . . . . . . . -0- 24,280,293 1,855,510S1 2 . . . . . . . . . . . . . . . . . . . . . . . . . . . . . . . . . . . . . . . . . . . . . . . . . . . . . . . . . . . . . . . . . . . . 3,647,450 -0- -0-S1 EUR H . . . . . . . . . . . . . . . . . . . . . . . . . . . . . . . . . . . . . . . . . . . . . . . . . . . . . . . . . . . . . . . 521 -0- -0-S1 GBP H . . . . . . . . . . . . . . . . . . . . . . . . . . . . . . . . . . . . . . . . . . . . . . . . . . . . . . . . . . . . . . . 431 -0- -0-S1 JPY . . . . . . . . . . . . . . . . . . . . . . . . . . . . . . . . . . . . . . . . . . . . . . . . . . . . . . . . . . . . . . . . . . -0- 996 -0-S1X . . . . . . . . . . . . . . . . . . . . . . . . . . . . . . . . . . . . . . . . . . . . . . . . . . . . . . . . . . . . . . . . . . . . -0- 1,877 -0-SA . . . . . . . . . . . . . . . . . . . . . . . . . . . . . . . . . . . . . . . . . . . . . . . . . . . . . . . . . . . . . . . . . . . . . 44,069 2,485,515 -0-
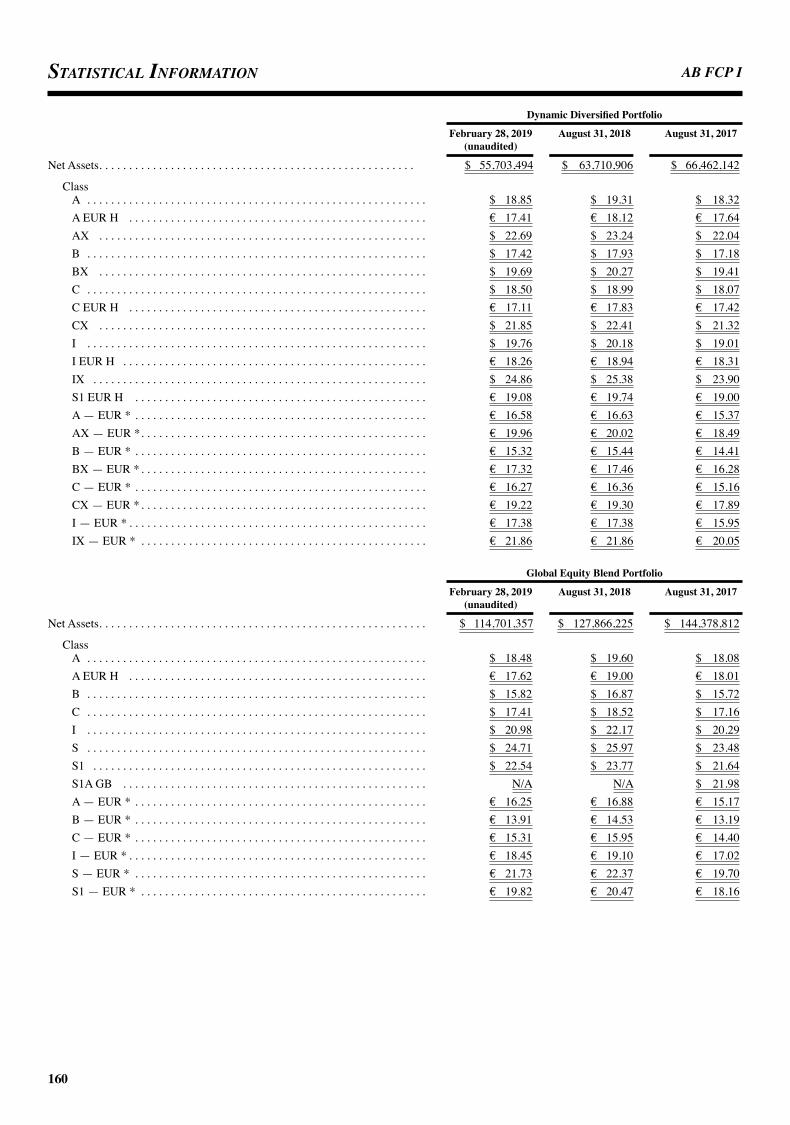
AB FCP I
160
DynamicDiversifiedPortfolio
February28,2019 August31,2018 August31,2017 (unaudited)
Net Assets . . . . . . . . . . . . . . . . . . . . . . . . . . . . . . . . . . . . . . . . . . . . . . . . . . . . . $ 55,703,494 $ 63,710,906 $ 66,462,142
ClassA . . . . . . . . . . . . . . . . . . . . . . . . . . . . . . . . . . . . . . . . . . . . . . . . . . . . . . . . . $ 18 .85 $ 19 .31 $ 18 .32A EUR H . . . . . . . . . . . . . . . . . . . . . . . . . . . . . . . . . . . . . . . . . . . . . . . . . . € 17 .41 € 18 .12 € 17 .64AX . . . . . . . . . . . . . . . . . . . . . . . . . . . . . . . . . . . . . . . . . . . . . . . . . . . . . . . $ 22 .69 $ 23 .24 $ 22 .04B . . . . . . . . . . . . . . . . . . . . . . . . . . . . . . . . . . . . . . . . . . . . . . . . . . . . . . . . . $ 17 .42 $ 17 .93 $ 17 .18BX . . . . . . . . . . . . . . . . . . . . . . . . . . . . . . . . . . . . . . . . . . . . . . . . . . . . . . . $ 19 .69 $ 20 .27 $ 19 .41C . . . . . . . . . . . . . . . . . . . . . . . . . . . . . . . . . . . . . . . . . . . . . . . . . . . . . . . . . $ 18 .50 $ 18 .99 $ 18 .07C EUR H . . . . . . . . . . . . . . . . . . . . . . . . . . . . . . . . . . . . . . . . . . . . . . . . . . € 17 .11 € 17 .83 € 17 .42CX . . . . . . . . . . . . . . . . . . . . . . . . . . . . . . . . . . . . . . . . . . . . . . . . . . . . . . . $ 21 .85 $ 22 .41 $ 21 .32I . . . . . . . . . . . . . . . . . . . . . . . . . . . . . . . . . . . . . . . . . . . . . . . . . . . . . . . . . $ 19 .76 $ 20 .18 $ 19 .01I EUR H . . . . . . . . . . . . . . . . . . . . . . . . . . . . . . . . . . . . . . . . . . . . . . . . . . . € 18 .26 € 18 .94 € 18 .31IX . . . . . . . . . . . . . . . . . . . . . . . . . . . . . . . . . . . . . . . . . . . . . . . . . . . . . . . . $ 24 .86 $ 25 .38 $ 23 .90S1 EUR H . . . . . . . . . . . . . . . . . . . . . . . . . . . . . . . . . . . . . . . . . . . . . . . . . € 19 .08 € 19 .74 € 19 .00A — EUR * . . . . . . . . . . . . . . . . . . . . . . . . . . . . . . . . . . . . . . . . . . . . . . . . . € 16 .58 € 16 .63 € 15 .37AX — EUR * . . . . . . . . . . . . . . . . . . . . . . . . . . . . . . . . . . . . . . . . . . . . . . . . € 19 .96 € 20 .02 € 18 .49B — EUR * . . . . . . . . . . . . . . . . . . . . . . . . . . . . . . . . . . . . . . . . . . . . . . . . . € 15 .32 € 15 .44 € 14 .41BX — EUR * . . . . . . . . . . . . . . . . . . . . . . . . . . . . . . . . . . . . . . . . . . . . . . . . € 17 .32 € 17 .46 € 16 .28C — EUR * . . . . . . . . . . . . . . . . . . . . . . . . . . . . . . . . . . . . . . . . . . . . . . . . . € 16 .27 € 16 .36 € 15 .16CX — EUR * . . . . . . . . . . . . . . . . . . . . . . . . . . . . . . . . . . . . . . . . . . . . . . . . € 19 .22 € 19 .30 € 17 .89I — EUR * . . . . . . . . . . . . . . . . . . . . . . . . . . . . . . . . . . . . . . . . . . . . . . . . . . € 17 .38 € 17 .38 € 15 .95IX — EUR * . . . . . . . . . . . . . . . . . . . . . . . . . . . . . . . . . . . . . . . . . . . . . . . . € 21 .86 € 21 .86 € 20 .05
GlobalEquityBlendPortfolio
February28,2019 August31,2018 August31,2017 (unaudited)
Net Assets . . . . . . . . . . . . . . . . . . . . . . . . . . . . . . . . . . . . . . . . . . . . . . . . . . . . . . . $ 114,701,357 $ 127,866,225 $ 144,378,812
ClassA . . . . . . . . . . . . . . . . . . . . . . . . . . . . . . . . . . . . . . . . . . . . . . . . . . . . . . . . . $ 18 .48 $ 19 .60 $ 18 .08A EUR H . . . . . . . . . . . . . . . . . . . . . . . . . . . . . . . . . . . . . . . . . . . . . . . . . . € 17 .62 € 19 .00 € 18 .01B . . . . . . . . . . . . . . . . . . . . . . . . . . . . . . . . . . . . . . . . . . . . . . . . . . . . . . . . . $ 15 .82 $ 16 .87 $ 15 .72C . . . . . . . . . . . . . . . . . . . . . . . . . . . . . . . . . . . . . . . . . . . . . . . . . . . . . . . . . $ 17 .41 $ 18 .52 $ 17 .16I . . . . . . . . . . . . . . . . . . . . . . . . . . . . . . . . . . . . . . . . . . . . . . . . . . . . . . . . . $ 20 .98 $ 22 .17 $ 20 .29S . . . . . . . . . . . . . . . . . . . . . . . . . . . . . . . . . . . . . . . . . . . . . . . . . . . . . . . . . $ 24 .71 $ 25 .97 $ 23 .48S1 . . . . . . . . . . . . . . . . . . . . . . . . . . . . . . . . . . . . . . . . . . . . . . . . . . . . . . . . $ 22 .54 $ 23 .77 $ 21 .64S1A GB . . . . . . . . . . . . . . . . . . . . . . . . . . . . . . . . . . . . . . . . . . . . . . . . . . . N/A N/A $ 21 .98A — EUR * . . . . . . . . . . . . . . . . . . . . . . . . . . . . . . . . . . . . . . . . . . . . . . . . . € 16 .25 € 16 .88 € 15 .17B — EUR * . . . . . . . . . . . . . . . . . . . . . . . . . . . . . . . . . . . . . . . . . . . . . . . . . € 13 .91 € 14 .53 € 13 .19C — EUR * . . . . . . . . . . . . . . . . . . . . . . . . . . . . . . . . . . . . . . . . . . . . . . . . . € 15 .31 € 15 .95 € 14 .40I — EUR * . . . . . . . . . . . . . . . . . . . . . . . . . . . . . . . . . . . . . . . . . . . . . . . . . . € 18 .45 € 19 .10 € 17 .02S — EUR * . . . . . . . . . . . . . . . . . . . . . . . . . . . . . . . . . . . . . . . . . . . . . . . . . € 21 .73 € 22 .37 € 19 .70S1 — EUR * . . . . . . . . . . . . . . . . . . . . . . . . . . . . . . . . . . . . . . . . . . . . . . . . € 19 .82 € 20 .47 € 18 .16
StatiStiCaL infOrmatiOn

AB FCP I
161
GlobalValuePortfolio
February28,2019 August31,2018 August31,2017 (unaudited)
Net Assets . . . . . . . . . . . . . . . . . . . . . . . . . . . . . . . . . . . . . . . . . . . . . . . . . . . . . . . $ 424,806,170 $ 553,317,116 $ 471,083,620
ClassA . . . . . . . . . . . . . . . . . . . . . . . . . . . . . . . . . . . . . . . . . . . . . . . . . . . . . . . . . $ 16 .40 $ 17 .66 $ 16 .65A SGD H . . . . . . . . . . . . . . . . . . . . . . . . . . . . . . . . . . . . . . . . . . . . . . . . . . SGD 16 .96 SGD 18 .38 SGD 17 .51AD . . . . . . . . . . . . . . . . . . . . . . . . . . . . . . . . . . . . . . . . . . . . . . . . . . . . . . . $ 13 .87 $ 15 .26 $ 14 .95AD AUD H . . . . . . . . . . . . . . . . . . . . . . . . . . . . . . . . . . . . . . . . . . . . . . . . AUD 13 .61 AUD 15 .08 AUD 14 .89AD CAD H . . . . . . . . . . . . . . . . . . . . . . . . . . . . . . . . . . . . . . . . . . . . . . . . CAD 13 .58 CAD 15 .01 CAD 14 .79AD EUR H . . . . . . . . . . . . . . . . . . . . . . . . . . . . . . . . . . . . . . . . . . . . . . . . . € 13 .92 € 15 .35 € 15 .16AD GBP H . . . . . . . . . . . . . . . . . . . . . . . . . . . . . . . . . . . . . . . . . . . . . . . . . £ 13 .63 £ 15 .08 £ 14 .91AD SGD H . . . . . . . . . . . . . . . . . . . . . . . . . . . . . . . . . . . . . . . . . . . . . . . . . SGD 13 .79 SGD 15 .19 SGD 14 .98AD ZAR H . . . . . . . . . . . . . . . . . . . . . . . . . . . . . . . . . . . . . . . . . . . . . . . . . R 89 .56 R 99 .78 R 98 .08B . . . . . . . . . . . . . . . . . . . . . . . . . . . . . . . . . . . . . . . . . . . . . . . . . . . . . . . . . $ 13 .74 $ 14 .87 $ 14 .16BD . . . . . . . . . . . . . . . . . . . . . . . . . . . . . . . . . . . . . . . . . . . . . . . . . . . . . . . $ 14 .11 $ 15 .51 $ 15 .19BD AUD H . . . . . . . . . . . . . . . . . . . . . . . . . . . . . . . . . . . . . . . . . . . . . . . . . AUD 13 .64 AUD 15 .11 AUD 14 .92BD EUR H . . . . . . . . . . . . . . . . . . . . . . . . . . . . . . . . . . . . . . . . . . . . . . . . . € 13 .93 € 15 .35 € 15 .15BD ZAR H . . . . . . . . . . . . . . . . . . . . . . . . . . . . . . . . . . . . . . . . . . . . . . . . . R 89 .94 R 100 .17 R 98 .44C . . . . . . . . . . . . . . . . . . . . . . . . . . . . . . . . . . . . . . . . . . . . . . . . . . . . . . . . . $ 15 .29 $ 16 .50 $ 15 .63I . . . . . . . . . . . . . . . . . . . . . . . . . . . . . . . . . . . . . . . . . . . . . . . . . . . . . . . . . $ 18 .78 $ 20 .14 $ 18 .83S . . . . . . . . . . . . . . . . . . . . . . . . . . . . . . . . . . . . . . . . . . . . . . . . . . . . . . . . . $ 21 .47 $ 22 .91 $ 21 .22S GBP H . . . . . . . . . . . . . . . . . . . . . . . . . . . . . . . . . . . . . . . . . . . . . . . . . . . £ 17 .76 £ 19 .22 £ 18 .19S1 . . . . . . . . . . . . . . . . . . . . . . . . . . . . . . . . . . . . . . . . . . . . . . . . . . . . . . . . $ 19 .63 $ 21 .02 $ 19 .61S1A GB . . . . . . . . . . . . . . . . . . . . . . . . . . . . . . . . . . . . . . . . . . . . . . . . . . . $ 20 .15 $ 21 .55 $ 20 .06SD . . . . . . . . . . . . . . . . . . . . . . . . . . . . . . . . . . . . . . . . . . . . . . . . . . . . . . . $ 93 .76 $ 103 .21 $ 101 .05A — EUR * . . . . . . . . . . . . . . . . . . . . . . . . . . . . . . . . . . . . . . . . . . . . . . . . . € 14 .42 € 15 .21 € 13 .97B — EUR * . . . . . . . . . . . . . . . . . . . . . . . . . . . . . . . . . . . . . . . . . . . . . . . . . € 12 .08 € 12 .81 € 11 .88C — EUR * . . . . . . . . . . . . . . . . . . . . . . . . . . . . . . . . . . . . . . . . . . . . . . . . . € 13 .45 € 14 .21 € 13 .11I — EUR * . . . . . . . . . . . . . . . . . . . . . . . . . . . . . . . . . . . . . . . . . . . . . . . . . . € 16 .52 € 17 .35 € 15 .80S — EUR * . . . . . . . . . . . . . . . . . . . . . . . . . . . . . . . . . . . . . . . . . . . . . . . . . € 18 .88 € 19 .73 € 17 .80S1 — EUR * . . . . . . . . . . . . . . . . . . . . . . . . . . . . . . . . . . . . . . . . . . . . . . . . € 17 .26 € 18 .11 € 16 .45
EmergingMarketsGrowthPortfolio
February28,2019 August31,2018 August31,2017 (unaudited)
Net Assets . . . . . . . . . . . . . . . . . . . . . . . . . . . . . . . . . . . . . . . . . . . . . . . . . . . . . . . $ 892,600,783 $ 1,079,353,151 $ 887,775,368
ClassA . . . . . . . . . . . . . . . . . . . . . . . . . . . . . . . . . . . . . . . . . . . . . . . . . . . . . . . . . $ 40 .11 $ 42 .42 $ 45 .84A AUD H . . . . . . . . . . . . . . . . . . . . . . . . . . . . . . . . . . . . . . . . . . . . . . . . . . AUD 18 .79 AUD 20 .11 AUD 21 .94A SGD H . . . . . . . . . . . . . . . . . . . . . . . . . . . . . . . . . . . . . . . . . . . . . . . . . . SGD 14 .00 SGD 14 .91 SGD 16 .30AD (1) . . . . . . . . . . . . . . . . . . . . . . . . . . . . . . . . . . . . . . . . . . . . . . . . . . . . $ 16 .62 N/A N/AB . . . . . . . . . . . . . . . . . . . . . . . . . . . . . . . . . . . . . . . . . . . . . . . . . . . . . . . . . $ 31 .03 $ 32 .98 $ 36 .00C . . . . . . . . . . . . . . . . . . . . . . . . . . . . . . . . . . . . . . . . . . . . . . . . . . . . . . . . . $ 33 .37 $ 35 .37 $ 38 .39C AUD H . . . . . . . . . . . . . . . . . . . . . . . . . . . . . . . . . . . . . . . . . . . . . . . . . . AUD 17 .90 AUD 19 .19 AUD 21 .05ED . . . . . . . . . . . . . . . . . . . . . . . . . . . . . . . . . . . . . . . . . . . . . . . . . . . . . . . $ 12 .00 $ 12 .92 N/A I . . . . . . . . . . . . . . . . . . . . . . . . . . . . . . . . . . . . . . . . . . . . . . . . . . . . . . . . . $ 47 .82 $ 50 .38 $ 54 .01I AUD H . . . . . . . . . . . . . . . . . . . . . . . . . . . . . . . . . . . . . . . . . . . . . . . . . . . AUD 19 .91 AUD 21 .22 AUD 22 .98I CHF H . . . . . . . . . . . . . . . . . . . . . . . . . . . . . . . . . . . . . . . . . . . . . . . . . . . CHF 12 .37 CHF 13 .25 N/A N . . . . . . . . . . . . . . . . . . . . . . . . . . . . . . . . . . . . . . . . . . . . . . . . . . . . . . . . . $ 19 .97 $ 21 .16 $ 22 .97S . . . . . . . . . . . . . . . . . . . . . . . . . . . . . . . . . . . . . . . . . . . . . . . . . . . . . . . . . $ 55 .67 $ 58 .33 $ 61 .84S1 . . . . . . . . . . . . . . . . . . . . . . . . . . . . . . . . . . . . . . . . . . . . . . . . . . . . . . . . $ 49 .51 $ 52 .10 $ 55 .75A — EUR * . . . . . . . . . . . . . . . . . . . . . . . . . . . . . . . . . . . . . . . . . . . . . . . . € 35 .28 € 36 .54 € 38 .46B — EUR * . . . . . . . . . . . . . . . . . . . . . . . . . . . . . . . . . . . . . . . . . . . . . . . . . € 27 .29 € 28 .41 € 30 .20

AB FCP I
162
StatiStical information (continued)
EmergingMarketsGrowthPortfolio(continued)
February28,2019 August31,2018 August31,2017 (unaudited)
C — EUR * . . . . . . . . . . . . . . . . . . . . . . . . . . . . . . . . . . . . . . . . . . . . . . . . . € 29 .35 € 30 .47 € 32 .21I — EUR * . . . . . . . . . . . . . . . . . . . . . . . . . . . . . . . . . . . . . . . . . . . . . . . . . . € 42 .06 € 43 .39 € 45 .31S — EUR * . . . . . . . . . . . . . . . . . . . . . . . . . . . . . . . . . . . . . . . . . . . . . . . . . € 48 .96 € 50 .24 € 51 .88S1 — EUR * . . . . . . . . . . . . . . . . . . . . . . . . . . . . . . . . . . . . . . . . . . . . . . . . € 43 .54 € 44 .88 € 46 .77
SustainableUSThematicPortfolio
February28,2019 August31,2018 August31,2017 (unaudited)
Net Assets . . . . . . . . . . . . . . . . . . . . . . . . . . . . . . . . . . . . . . . . . . . . . . . . . . . . . . . $ 123,306,091 $ 126,793,770 $ 64,612,612
ClassA . . . . . . . . . . . . . . . . . . . . . . . . . . . . . . . . . . . . . . . . . . . . . . . . . . . . . . . . . $ 23 .40 $ 24 .15 $ 20 .37A AUD H . . . . . . . . . . . . . . . . . . . . . . . . . . . . . . . . . . . . . . . . . . . . . . . . . . AUD 42 .97 AUD 44 .78 AUD 37 .98A CAD H . . . . . . . . . . . . . . . . . . . . . . . . . . . . . . . . . . . . . . . . . . . . . . . . . . CAD 38 .56 CAD 40 .20 CAD 34 .21A EUR H . . . . . . . . . . . . . . . . . . . . . . . . . . . . . . . . . . . . . . . . . . . . . . . . . . € 38 .45 € 40 .31 € 34 .94A GBP H . . . . . . . . . . . . . . . . . . . . . . . . . . . . . . . . . . . . . . . . . . . . . . . . . . £ 31 .94 £ 33 .39 £ 28 .66A SGD H . . . . . . . . . . . . . . . . . . . . . . . . . . . . . . . . . . . . . . . . . . . . . . . . . . SGD 30 .84 SGD 32 .04 SGD 27 .29AN . . . . . . . . . . . . . . . . . . . . . . . . . . . . . . . . . . . . . . . . . . . . . . . . . . . . . . . $ 45 .11 $ 46 .55 $ 39 .26B . . . . . . . . . . . . . . . . . . . . . . . . . . . . . . . . . . . . . . . . . . . . . . . . . . . . . . . . . $ 19 .65 $ 20 .38 $ 17 .37B CAD H . . . . . . . . . . . . . . . . . . . . . . . . . . . . . . . . . . . . . . . . . . . . . . . . . . CAD 35 .87 CAD 37 .57 CAD 32 .35C . . . . . . . . . . . . . . . . . . . . . . . . . . . . . . . . . . . . . . . . . . . . . . . . . . . . . . . . . $ 22 .45 $ 23 .22 $ 19 .67C EUR H . . . . . . . . . . . . . . . . . . . . . . . . . . . . . . . . . . . . . . . . . . . . . . . . . . € 37 .29 € 39 .17 € 34 .11I . . . . . . . . . . . . . . . . . . . . . . . . . . . . . . . . . . . . . . . . . . . . . . . . . . . . . . . . . $ 27 .09 $ 27 .84 $ 23 .30I EUR H . . . . . . . . . . . . . . . . . . . . . . . . . . . . . . . . . . . . . . . . . . . . . . . . . . . € 41 .05 € 42 .87 € 36 .88IN . . . . . . . . . . . . . . . . . . . . . . . . . . . . . . . . . . . . . . . . . . . . . . . . . . . . . . . . $ 48 .35 $ 49 .69 $ 41 .58S . . . . . . . . . . . . . . . . . . . . . . . . . . . . . . . . . . . . . . . . . . . . . . . . . . . . . . . . . $ 36 .12 $ 36 .96 $ 30 .60S1 . . . . . . . . . . . . . . . . . . . . . . . . . . . . . . . . . . . . . . . . . . . . . . . . . . . . . . . . $ 28 .45 $ 29 .20 $ 24 .35S1 JPY H . . . . . . . . . . . . . . . . . . . . . . . . . . . . . . . . . . . . . . . . . . . . . . . . . . ¥ 274 .00 ¥ 285 .00 ¥ 243 .00A — EUR * . . . . . . . . . . . . . . . . . . . . . . . . . . . . . . . . . . . . . . . . . . . . . . . . . € 20 .58 € 20 .80 € 17 .09B — EUR * . . . . . . . . . . . . . . . . . . . . . . . . . . . . . . . . . . . . . . . . . . . . . . . . . € 17 .28 € 17 .55 € 14 .57C — EUR * . . . . . . . . . . . . . . . . . . . . . . . . . . . . . . . . . . . . . . . . . . . . . . . . . € 19 .75 € 20 .00 € 16 .50I — EUR * . . . . . . . . . . . . . . . . . . . . . . . . . . . . . . . . . . . . . . . . . . . . . . . . . . € 23 .83 € 23 .98 € 19 .55S — EUR * . . . . . . . . . . . . . . . . . . . . . . . . . . . . . . . . . . . . . . . . . . . . . . . . . € 31 .77 € 31 .83 € 25 .67S1 — EUR * . . . . . . . . . . . . . . . . . . . . . . . . . . . . . . . . . . . . . . . . . . . . . . . . € 25 .02 € 25 .15 € 20 .43
AsiaEx-JapanEquityPortfolio
February28,2019 August31,2018 August31,2017 (unaudited)
Net Assets . . . . . . . . . . . . . . . . . . . . . . . . . . . . . . . . . . . . . . . . . . . . . . . . . . . . . . . $ 405,790,865 $ 470,776,868 $ 507,776,327
ClassA . . . . . . . . . . . . . . . . . . . . . . . . . . . . . . . . . . . . . . . . . . . . . . . . . . . . . . . . . $ 21 .13 $ 22 .11 $ 22 .71A AUD H . . . . . . . . . . . . . . . . . . . . . . . . . . . . . . . . . . . . . . . . . . . . . . . . . . AUD 22 .55 AUD 23 .80 AUD 24 .68A SGD H . . . . . . . . . . . . . . . . . . . . . . . . . . . . . . . . . . . . . . . . . . . . . . . . . . SGD 15 .58 SGD 16 .40 SGD 17 .08AD . . . . . . . . . . . . . . . . . . . . . . . . . . . . . . . . . . . . . . . . . . . . . . . . . . . . . . . $ 15 .02 $ 16 .00 $ 16 .96AD AUD H . . . . . . . . . . . . . . . . . . . . . . . . . . . . . . . . . . . . . . . . . . . . . . . . AUD 13 .73 AUD 14 .75 AUD 15 .81AD CAD H . . . . . . . . . . . . . . . . . . . . . . . . . . . . . . . . . . . . . . . . . . . . . . . . CAD 11 .39 CAD 12 .18 CAD 13 .00AD EUR H . . . . . . . . . . . . . . . . . . . . . . . . . . . . . . . . . . . . . . . . . . . . . . . . . € 14 .02 € 14 .95 € 15 .97AD GBP H . . . . . . . . . . . . . . . . . . . . . . . . . . . . . . . . . . . . . . . . . . . . . . . . . £ 14 .11 £ 15 .10 £ 16 .13AD NZD H . . . . . . . . . . . . . . . . . . . . . . . . . . . . . . . . . . . . . . . . . . . . . . . . . NZD 14 .77 NZD 15 .85 NZD 16 .95AD RMB H . . . . . . . . . . . . . . . . . . . . . . . . . . . . . . . . . . . . . . . . . . . . . . . . CNH 94 .55 CNH 101 .12 CNH 107 .89AD SGD H . . . . . . . . . . . . . . . . . . . . . . . . . . . . . . . . . . . . . . . . . . . . . . . . . SGD 14 .53 SGD 15 .51 SGD 16 .54AD ZAR H . . . . . . . . . . . . . . . . . . . . . . . . . . . . . . . . . . . . . . . . . . . . . . . . . R 102 .29 R 110 .43 R 117 .69AY JPY . . . . . . . . . . . . . . . . . . . . . . . . . . . . . . . . . . . . . . . . . . . . . . . . . . . . ¥ 1 .70 ¥ 1 .77 ¥ 1 .80

AB FCP I
163
AsiaEx-JapanEquityPortfolio(continued)
February28,2019 August31,2018 August31,2017 (unaudited)
B . . . . . . . . . . . . . . . . . . . . . . . . . . . . . . . . . . . . . . . . . . . . . . . . . . . . . . . . . $ 19 .29 $ 20 .28 $ 21 .04B AUD H (2) . . . . . . . . . . . . . . . . . . . . . . . . . . . . . . . . . . . . . . . . . . . . . . . N/A AUD 18 .04 AUD 18 .92BD . . . . . . . . . . . . . . . . . . . . . . . . . . . . . . . . . . . . . . . . . . . . . . . . . . . . . . . $ 14 .98 $ 15 .97 $ 16 .97BD AUD H . . . . . . . . . . . . . . . . . . . . . . . . . . . . . . . . . . . . . . . . . . . . . . . . . AUD 13 .79 AUD 14 .81 AUD 15 .92BD CAD H . . . . . . . . . . . . . . . . . . . . . . . . . . . . . . . . . . . . . . . . . . . . . . . . . CAD 11 .93 CAD 12 .77 CAD 13 .67BD GBP H . . . . . . . . . . . . . . . . . . . . . . . . . . . . . . . . . . . . . . . . . . . . . . . . . £ 14 .13 £ 15 .12 £ 16 .18BD NZD H . . . . . . . . . . . . . . . . . . . . . . . . . . . . . . . . . . . . . . . . . . . . . . . . . NZD 14 .73 NZD 15 .82 NZD 16 .95BD ZAR H . . . . . . . . . . . . . . . . . . . . . . . . . . . . . . . . . . . . . . . . . . . . . . . . . R 91 .97 R 99 .22 R 105 .93BY JPY . . . . . . . . . . . . . . . . . . . . . . . . . . . . . . . . . . . . . . . . . . . . . . . . . . . . ¥ 1 .64 ¥ 1 .71 ¥ 1 .75C . . . . . . . . . . . . . . . . . . . . . . . . . . . . . . . . . . . . . . . . . . . . . . . . . . . . . . . . . $ 20 .27 $ 21 .26 $ 21 .93C AUD H . . . . . . . . . . . . . . . . . . . . . . . . . . . . . . . . . . . . . . . . . . . . . . . . . . AUD 22 .10 AUD 23 .37 AUD 24 .35ED . . . . . . . . . . . . . . . . . . . . . . . . . . . . . . . . . . . . . . . . . . . . . . . . . . . . . . . $ 12 .81 $ 13 .64 N/A I . . . . . . . . . . . . . . . . . . . . . . . . . . . . . . . . . . . . . . . . . . . . . . . . . . . . . . . . . $ 22 .76 $ 23 .72 $ 24 .17I AUD H . . . . . . . . . . . . . . . . . . . . . . . . . . . . . . . . . . . . . . . . . . . . . . . . . . . AUD 24 .63 AUD 25 .89 AUD 26 .63I GBP . . . . . . . . . . . . . . . . . . . . . . . . . . . . . . . . . . . . . . . . . . . . . . . . . . . . . £ 19 .27 £ 20 .55 £ 20 .98ID . . . . . . . . . . . . . . . . . . . . . . . . . . . . . . . . . . . . . . . . . . . . . . . . . . . . . . . . $ 15 .02 $ 16 .01 $ 16 .93ID AUD H . . . . . . . . . . . . . . . . . . . . . . . . . . . . . . . . . . . . . . . . . . . . . . . . . AUD 13 .96 AUD 15 .00 AUD 16 .05S . . . . . . . . . . . . . . . . . . . . . . . . . . . . . . . . . . . . . . . . . . . . . . . . . . . . . . . . . $ 25 .17 $ 26 .09 $ 26 .28S1 . . . . . . . . . . . . . . . . . . . . . . . . . . . . . . . . . . . . . . . . . . . . . . . . . . . . . . . . $ 23 .11 $ 24 .06 $ 24 .46SD . . . . . . . . . . . . . . . . . . . . . . . . . . . . . . . . . . . . . . . . . . . . . . . . . . . . . . . $ 103 .45 $ 110 .34 $ 116 .70A — EUR * . . . . . . . . . . . . . . . . . . . . . . . . . . . . . . . . . . . . . . . . . . . . . . . . . € 18 .58 € 19 .04 € 19 .05AD — EUR * . . . . . . . . . . . . . . . . . . . . . . . . . . . . . . . . . . . . . . . . . . . . . . . . € 13 .21 € 13 .78 € 14 .23B — EUR * . . . . . . . . . . . . . . . . . . . . . . . . . . . . . . . . . . . . . . . . . . . . . . . . . € 16 .97 € 17 .47 € 17 .65BD — EUR * . . . . . . . . . . . . . . . . . . . . . . . . . . . . . . . . . . . . . . . . . . . . . . . . € 13 .18 € 13 .76 € 14 .24C — EUR * . . . . . . . . . . . . . . . . . . . . . . . . . . . . . . . . . . . . . . . . . . . . . . . . . € 17 .83 € 18 .31 € 18 .40I — EUR * . . . . . . . . . . . . . . . . . . . . . . . . . . . . . . . . . . . . . . . . . . . . . . . . . . € 20 .02 € 20 .43 € 20 .28ID — EUR * . . . . . . . . . . . . . . . . . . . . . . . . . . . . . . . . . . . . . . . . . . . . . . . . € 13 .21 € 13 .79 € 14 .20S — EUR * . . . . . . . . . . . . . . . . . . . . . . . . . . . . . . . . . . . . . . . . . . . . . . . . . € 22 .14 € 22 .47 € 22 .05S1 — EUR * . . . . . . . . . . . . . . . . . . . . . . . . . . . . . . . . . . . . . . . . . . . . . . . . € 20 .33 € 20 .72 € 20 .52
JapanStrategicValuePortfolio
February28,2019 August31,2018 August31,2017 (unaudited)
Net Assets . . . . . . . . . . . . . . . . . . . . . . . . . . . . . . . . . . . . . . . . . . . . . . . . . . . . . . . ¥ 20,241,981,822 ¥ 27,455,016,831 ¥ 33,980,558,952
Class2 . . . . . . . . . . . . . . . . . . . . . . . . . . . . . . . . . . . . . . . . . . . . . . . . . . . . . . . . . ¥ 11,101 .00 ¥ 12,323 .00 ¥ 11,766 .00A . . . . . . . . . . . . . . . . . . . . . . . . . . . . . . . . . . . . . . . . . . . . . . . . . . . . . . . . . ¥ 10,309 .00 ¥ 11,485 .00 ¥ 11,034 .00A AUD H . . . . . . . . . . . . . . . . . . . . . . . . . . . . . . . . . . . . . . . . . . . . . . . . . . AUD 20 .54 AUD 22 .79 AUD 21 .61A CZK H . . . . . . . . . . . . . . . . . . . . . . . . . . . . . . . . . . . . . . . . . . . . . . . . . . CZK 850 .84 CZK 947 .01 N/A A EUR H . . . . . . . . . . . . . . . . . . . . . . . . . . . . . . . . . . . . . . . . . . . . . . . . . . € 24 .66 € 27 .57 € 26 .74A NZD H . . . . . . . . . . . . . . . . . . . . . . . . . . . . . . . . . . . . . . . . . . . . . . . . . . NZD 22 .09 NZD 24 .44 NZD 23 .09A SGD H . . . . . . . . . . . . . . . . . . . . . . . . . . . . . . . . . . . . . . . . . . . . . . . . . . SGD 14 .70 SGD 16 .28 SGD 15 .54A USD H . . . . . . . . . . . . . . . . . . . . . . . . . . . . . . . . . . . . . . . . . . . . . . . . . . $ 28 .65 $ 31 .55 $ 29 .86AD . . . . . . . . . . . . . . . . . . . . . . . . . . . . . . . . . . . . . . . . . . . . . . . . . . . . . . . ¥ 11,210 .00 ¥ 12,650 .00 ¥ 12,431 .00AD AUD H . . . . . . . . . . . . . . . . . . . . . . . . . . . . . . . . . . . . . . . . . . . . . . . . AUD 15 .60 AUD 17 .77 AUD 17 .63AD NZD H . . . . . . . . . . . . . . . . . . . . . . . . . . . . . . . . . . . . . . . . . . . . . . . . . NZD 15 .81 NZD 17 .93 NZD 17 .77AD USD H . . . . . . . . . . . . . . . . . . . . . . . . . . . . . . . . . . . . . . . . . . . . . . . . . $ 14 .96 $ 16 .92 $ 16 .70AD ZAR H . . . . . . . . . . . . . . . . . . . . . . . . . . . . . . . . . . . . . . . . . . . . . . . . . R 106 .48 R 121 .64 R 119 .87B . . . . . . . . . . . . . . . . . . . . . . . . . . . . . . . . . . . . . . . . . . . . . . . . . . . . . . . . . ¥ 9,097 .00 ¥ 10,185 .00 ¥ 9,883 .00BD . . . . . . . . . . . . . . . . . . . . . . . . . . . . . . . . . . . . . . . . . . . . . . . . . . . . . . . ¥ 11,136 .00 ¥ 12,575 .00 ¥ 12,387 .00BD AUD H . . . . . . . . . . . . . . . . . . . . . . . . . . . . . . . . . . . . . . . . . . . . . . . . . AUD 15 .44 AUD 17 .61 AUD 17 .51

AB FCP I
164
StatiStical information (continued)
JapanStrategicValuePortfolio(continued)
February28,2019 August31,2018 August31,2017 (unaudited)
BD USD H . . . . . . . . . . . . . . . . . . . . . . . . . . . . . . . . . . . . . . . . . . . . . . . . . $ 14 .84 $ 16 .80 $ 16 .61BD ZAR H . . . . . . . . . . . . . . . . . . . . . . . . . . . . . . . . . . . . . . . . . . . . . . . . . R 106 .03 R 121 .22 R 119 .93C . . . . . . . . . . . . . . . . . . . . . . . . . . . . . . . . . . . . . . . . . . . . . . . . . . . . . . . . . ¥ 9,725 .00 ¥ 10,858 .00 ¥ 10,480 .00C EUR H . . . . . . . . . . . . . . . . . . . . . . . . . . . . . . . . . . . . . . . . . . . . . . . . . . € 23 .44 € 26 .29 € 25 .58I . . . . . . . . . . . . . . . . . . . . . . . . . . . . . . . . . . . . . . . . . . . . . . . . . . . . . . . . . ¥ 11,387 .00 ¥ 12,636 .00 ¥ 12,044 .00I EUR H . . . . . . . . . . . . . . . . . . . . . . . . . . . . . . . . . . . . . . . . . . . . . . . . . . . € 26 .38 € 29 .40 € 28 .14I USD H . . . . . . . . . . . . . . . . . . . . . . . . . . . . . . . . . . . . . . . . . . . . . . . . . . . $ 30 .38 $ 33 .32 $ 31 .29S . . . . . . . . . . . . . . . . . . . . . . . . . . . . . . . . . . . . . . . . . . . . . . . . . . . . . . . . . N/A N/A ¥ 13,486 .00S EUR H . . . . . . . . . . . . . . . . . . . . . . . . . . . . . . . . . . . . . . . . . . . . . . . . . . € 25 .40 € 28 .15 € 26 .76S1 . . . . . . . . . . . . . . . . . . . . . . . . . . . . . . . . . . . . . . . . . . . . . . . . . . . . . . . . ¥ 11,926 .00 ¥ 13,201 .00 ¥ 12,529 .00S1 USD H . . . . . . . . . . . . . . . . . . . . . . . . . . . . . . . . . . . . . . . . . . . . . . . . . $ 21 .61 $ 23 .64 $ 22 .11SD . . . . . . . . . . . . . . . . . . . . . . . . . . . . . . . . . . . . . . . . . . . . . . . . . . . . . . . ¥ 11,964 .00 ¥ 13,456 .00 ¥ 13,124 .002 — USD * . . . . . . . . . . . . . . . . . . . . . . . . . . . . . . . . . . . . . . . . . . . . . . . . . . $ 99 .68 $ 110 .91 $ 107 .022 — EUR * . . . . . . . . . . . . . . . . . . . . . . . . . . . . . . . . . . . . . . . . . . . . . . . . . . € 87 .58 € 95 .63 € 89 .89A — USD * . . . . . . . . . . . . . . . . . . . . . . . . . . . . . . . . . . . . . . . . . . . . . . . . . $ 92 .56 $ 103 .37 $ 100 .36A — EUR * . . . . . . . . . . . . . . . . . . . . . . . . . . . . . . . . . . . . . . . . . . . . . . . . . € 81 .33 € 89 .13 € 84 .30B — USD * . . . . . . . . . . . . . . . . . . . . . . . . . . . . . . . . . . . . . . . . . . . . . . . . . $ 81 .68 $ 91 .67 $ 89 .89B — EUR * . . . . . . . . . . . . . . . . . . . . . . . . . . . . . . . . . . . . . . . . . . . . . . . . . € 71 .77 € 79 .04 € 75 .51C — USD * . . . . . . . . . . . . . . . . . . . . . . . . . . . . . . . . . . . . . . . . . . . . . . . . . $ 87 .32 $ 97 .73 $ 95 .32C — EUR * . . . . . . . . . . . . . . . . . . . . . . . . . . . . . . . . . . . . . . . . . . . . . . . . . € 76 .73 € 84 .26 € 80 .07I — USD * . . . . . . . . . . . . . . . . . . . . . . . . . . . . . . . . . . . . . . . . . . . . . . . . . . $ 102 .24 $ 113 .73 $ 109 .55I — EUR * . . . . . . . . . . . . . . . . . . . . . . . . . . . . . . . . . . . . . . . . . . . . . . . . . . € 89 .84 € 98 .06 € 92 .02S — USD * . . . . . . . . . . . . . . . . . . . . . . . . . . . . . . . . . . . . . . . . . . . . . . . . . N/A N/A $ 122 .67S — EUR * . . . . . . . . . . . . . . . . . . . . . . . . . . . . . . . . . . . . . . . . . . . . . . . . . N/A N/A € 103 .03S1 — USD * . . . . . . . . . . . . . . . . . . . . . . . . . . . . . . . . . . . . . . . . . . . . . . . . $ 107 .08 $ 118 .82 $ 113 .96S1 — EUR * . . . . . . . . . . . . . . . . . . . . . . . . . . . . . . . . . . . . . . . . . . . . . . . . € 94 .09 € 102 .44 € 95 .72
ChinaOpportunityPortfolio
February28,2019 August31,2018 August31,2017 (unaudited)
Net Assets . . . . . . . . . . . . . . . . . . . . . . . . . . . . . . . . . . . . . . . . . . . . . . . . . . . . . . . $ 148,173,397 $ 144,691,516 $ 143,950,664
ClassA . . . . . . . . . . . . . . . . . . . . . . . . . . . . . . . . . . . . . . . . . . . . . . . . . . . . . . . . . $ 54 .08 $ 54 .92 $ 54 .09AD . . . . . . . . . . . . . . . . . . . . . . . . . . . . . . . . . . . . . . . . . . . . . . . . . . . . . . . $ 17 .59 $ 18 .25 $ 18 .58AD AUD H . . . . . . . . . . . . . . . . . . . . . . . . . . . . . . . . . . . . . . . . . . . . . . . . AUD 16 .54 AUD 17 .35 AUD 17 .90AD CAD H . . . . . . . . . . . . . . . . . . . . . . . . . . . . . . . . . . . . . . . . . . . . . . . . CAD 16 .68 CAD 17 .40 CAD 17 .84AD EUR H . . . . . . . . . . . . . . . . . . . . . . . . . . . . . . . . . . . . . . . . . . . . . . . . . € 17 .15 € 17 .84 € 18 .36AD GBP H . . . . . . . . . . . . . . . . . . . . . . . . . . . . . . . . . . . . . . . . . . . . . . . . . £ 17 .02 £ 17 .77 £ 18 .27AD NZD H . . . . . . . . . . . . . . . . . . . . . . . . . . . . . . . . . . . . . . . . . . . . . . . . . NZD 16 .85 NZD 17 .64 NZD 18 .16AD RMB H . . . . . . . . . . . . . . . . . . . . . . . . . . . . . . . . . . . . . . . . . . . . . . . . CNH 114 .29 CNH 119 .08 CNH 122 .04AD SGD H . . . . . . . . . . . . . . . . . . . . . . . . . . . . . . . . . . . . . . . . . . . . . . . . . SGD 16 .88 SGD 17 .56 SGD 18 .02AD ZAR H . . . . . . . . . . . . . . . . . . . . . . . . . . . . . . . . . . . . . . . . . . . . . . . . . R 107 .96 R 114 .22 R 117 .02B . . . . . . . . . . . . . . . . . . . . . . . . . . . . . . . . . . . . . . . . . . . . . . . . . . . . . . . . . $ 43 .68 $ 44 .58 $ 44 .33BD . . . . . . . . . . . . . . . . . . . . . . . . . . . . . . . . . . . . . . . . . . . . . . . . . . . . . . . $ 17 .59 $ 18 .23 $ 18 .58BD AUD H . . . . . . . . . . . . . . . . . . . . . . . . . . . . . . . . . . . . . . . . . . . . . . . . . AUD 16 .49 AUD 17 .28 AUD 17 .86BD EUR H . . . . . . . . . . . . . . . . . . . . . . . . . . . . . . . . . . . . . . . . . . . . . . . . . € 17 .07 € 17 .74 € 18 .28BD GBP H . . . . . . . . . . . . . . . . . . . . . . . . . . . . . . . . . . . . . . . . . . . . . . . . . N/A N/A £ 18 .23BD NZD H . . . . . . . . . . . . . . . . . . . . . . . . . . . . . . . . . . . . . . . . . . . . . . . . . NZD 16 .82 NZD 17 .60 NZD 18 .14BD ZAR H . . . . . . . . . . . . . . . . . . . . . . . . . . . . . . . . . . . . . . . . . . . . . . . . . R 108 .64 R 114 .79 R 117 .61C . . . . . . . . . . . . . . . . . . . . . . . . . . . . . . . . . . . . . . . . . . . . . . . . . . . . . . . . . $ 51 .23 $ 52 .14 $ 51 .58

AB FCP I
165
ChinaOpportunityPortfolio(continued)
February28,2019 August31,2018 August31,2017 (unaudited)
I . . . . . . . . . . . . . . . . . . . . . . . . . . . . . . . . . . . . . . . . . . . . . . . . . . . . . . . . . $ 63 .92 $ 64 .66 $ 63 .18S . . . . . . . . . . . . . . . . . . . . . . . . . . . . . . . . . . . . . . . . . . . . . . . . . . . . . . . . . $ 77 .64 $ 77 .94 $ 75 .00S1 . . . . . . . . . . . . . . . . . . . . . . . . . . . . . . . . . . . . . . . . . . . . . . . . . . . . . . . . $ 70 .74 $ 71 .33 $ 69 .25A — EUR * . . . . . . . . . . . . . . . . . . . . . . . . . . . . . . . . . . . . . . . . . . . . . . . . . € 47 .56 € 47 .30 € 45 .38B — EUR * . . . . . . . . . . . . . . . . . . . . . . . . . . . . . . . . . . . . . . . . . . . . . . . . . € 38 .42 € 38 .40 € 37 .19C — EUR * . . . . . . . . . . . . . . . . . . . . . . . . . . . . . . . . . . . . . . . . . . . . . . . . . € 45 .06 € 44 .91 € 43 .28I — EUR * . . . . . . . . . . . . . . . . . . . . . . . . . . . . . . . . . . . . . . . . . . . . . . . . . . € 56 .22 € 55 .69 € 53 .01S — EUR * . . . . . . . . . . . . . . . . . . . . . . . . . . . . . . . . . . . . . . . . . . . . . . . . . € 68 .29 € 67 .13 € 62 .92S1 — EUR * . . . . . . . . . . . . . . . . . . . . . . . . . . . . . . . . . . . . . . . . . . . . . . . . € 62 .22 € 61 .44 € 58 .10
GlobalBondPortfolio
February28,2019 August31,2018 August31,2017 (unaudited)
Net Assets . . . . . . . . . . . . . . . . . . . . . . . . . . . . . . . . . . . . . . . . . . . . . . . . . . . . . . . $ 580,850,603 $ 442,438,439 $ 741,149,459
ClassA . . . . . . . . . . . . . . . . . . . . . . . . . . . . . . . . . . . . . . . . . . . . . . . . . . . . . . . . . $ 7 .82 $ 7 .86 $ 8 .07A2 . . . . . . . . . . . . . . . . . . . . . . . . . . . . . . . . . . . . . . . . . . . . . . . . . . . . . . . . $ 17 .96 $ 17 .82 $ 17 .83A2 EUR H . . . . . . . . . . . . . . . . . . . . . . . . . . . . . . . . . . . . . . . . . . . . . . . . . € 14 .72 € 14 .83 € 15 .21A2 SGD H . . . . . . . . . . . . . . . . . . . . . . . . . . . . . . . . . . . . . . . . . . . . . . . . . SGD 15 .27 SGD 15 .22 SGD 15 .32AA . . . . . . . . . . . . . . . . . . . . . . . . . . . . . . . . . . . . . . . . . . . . . . . . . . . . . . . $ 12 .27 $ 12 .43 $ 12 .95AA AUD H . . . . . . . . . . . . . . . . . . . . . . . . . . . . . . . . . . . . . . . . . . . . . . . . . AUD 12 .19 AUD 12 .37 AUD 12 .90AA CAD H . . . . . . . . . . . . . . . . . . . . . . . . . . . . . . . . . . . . . . . . . . . . . . . . . CAD 12 .37 CAD 12 .54 CAD 13 .08AA GBP H . . . . . . . . . . . . . . . . . . . . . . . . . . . . . . . . . . . . . . . . . . . . . . . . . £ 12 .36 £ 12 .53 £ 13 .09AA NZD H . . . . . . . . . . . . . . . . . . . . . . . . . . . . . . . . . . . . . . . . . . . . . . . . . NZD 12 .48 NZD 12 .66 NZD 13 .19AA SGD H . . . . . . . . . . . . . . . . . . . . . . . . . . . . . . . . . . . . . . . . . . . . . . . . . SGD 12 .29 SGD 12 .44 SGD 12 .99AJ . . . . . . . . . . . . . . . . . . . . . . . . . . . . . . . . . . . . . . . . . . . . . . . . . . . . . . . . $ 7 .49 $ 7 .53 $ 7 .72AR EUR H . . . . . . . . . . . . . . . . . . . . . . . . . . . . . . . . . . . . . . . . . . . . . . . . . € 12 .97 € 13 .07 € 13 .60AT . . . . . . . . . . . . . . . . . . . . . . . . . . . . . . . . . . . . . . . . . . . . . . . . . . . . . . . . $ 7 .81 $ 7 .85 $ 8 .05AT AUD H . . . . . . . . . . . . . . . . . . . . . . . . . . . . . . . . . . . . . . . . . . . . . . . . . AUD 12 .29 AUD 12 .37 AUD 12 .71AT CAD H . . . . . . . . . . . . . . . . . . . . . . . . . . . . . . . . . . . . . . . . . . . . . . . . . CAD 12 .38 CAD 12 .46 CAD 12 .79AT EUR H . . . . . . . . . . . . . . . . . . . . . . . . . . . . . . . . . . . . . . . . . . . . . . . . . € 12 .03 € 12 .12 € 12 .47AT GBP H . . . . . . . . . . . . . . . . . . . . . . . . . . . . . . . . . . . . . . . . . . . . . . . . . £ 12 .50 £ 12 .58 £ 12 .94AT NZD H . . . . . . . . . . . . . . . . . . . . . . . . . . . . . . . . . . . . . . . . . . . . . . . . . NZD 12 .61 NZD 12 .69 NZD 13 .03AT SGD H . . . . . . . . . . . . . . . . . . . . . . . . . . . . . . . . . . . . . . . . . . . . . . . . . SGD 12 .74 SGD 12 .80 SGD 13 .16AX . . . . . . . . . . . . . . . . . . . . . . . . . . . . . . . . . . . . . . . . . . . . . . . . . . . . . . . $ 6 .26 $ 6 .29 $ 6 .46B . . . . . . . . . . . . . . . . . . . . . . . . . . . . . . . . . . . . . . . . . . . . . . . . . . . . . . . . . $ 7 .82 $ 7 .86 $ 8 .07B2 . . . . . . . . . . . . . . . . . . . . . . . . . . . . . . . . . . . . . . . . . . . . . . . . . . . . . . . . $ 14 .35 $ 14 .31 $ 14 .46BA . . . . . . . . . . . . . . . . . . . . . . . . . . . . . . . . . . . . . . . . . . . . . . . . . . . . . . . $ 11 .63 $ 11 .85 $ 12 .47BA AUD H . . . . . . . . . . . . . . . . . . . . . . . . . . . . . . . . . . . . . . . . . . . . . . . . . AUD 11 .56 AUD 11 .80 AUD 12 .43BT . . . . . . . . . . . . . . . . . . . . . . . . . . . . . . . . . . . . . . . . . . . . . . . . . . . . . . . . $ 7 .87 $ 7 .90 $ 8 .10BT AUD H . . . . . . . . . . . . . . . . . . . . . . . . . . . . . . . . . . . . . . . . . . . . . . . . . AUD 12 .33 AUD 12 .40 AUD 12 .73BT CAD H . . . . . . . . . . . . . . . . . . . . . . . . . . . . . . . . . . . . . . . . . . . . . . . . . CAD 12 .33 CAD 12 .39 CAD 12 .72BT EUR H (3) . . . . . . . . . . . . . . . . . . . . . . . . . . . . . . . . . . . . . . . . . . . . . . . N/A € 12 .08 € 12 .52BT GBP H . . . . . . . . . . . . . . . . . . . . . . . . . . . . . . . . . . . . . . . . . . . . . . . . . £ 12 .54 £ 12 .62 £ 12 .98BT NZD H (4) . . . . . . . . . . . . . . . . . . . . . . . . . . . . . . . . . . . . . . . . . . . . . . . N/A NZD 12 .72 NZD 13 .06BX . . . . . . . . . . . . . . . . . . . . . . . . . . . . . . . . . . . . . . . . . . . . . . . . . . . . . . . $ 6 .25 $ 6 .28 $ 6 .45C . . . . . . . . . . . . . . . . . . . . . . . . . . . . . . . . . . . . . . . . . . . . . . . . . . . . . . . . . $ 7 .82 $ 7 .86 $ 8 .07C2 . . . . . . . . . . . . . . . . . . . . . . . . . . . . . . . . . . . . . . . . . . . . . . . . . . . . . . . . $ 14 .95 $ 14 .87 $ 14 .94C2 EUR H . . . . . . . . . . . . . . . . . . . . . . . . . . . . . . . . . . . . . . . . . . . . . . . . . € 14 .10 € 14 .23 € 14 .67I . . . . . . . . . . . . . . . . . . . . . . . . . . . . . . . . . . . . . . . . . . . . . . . . . . . . . . . . . $ 7 .82 $ 7 .86 $ 8 .07I2 . . . . . . . . . . . . . . . . . . . . . . . . . . . . . . . . . . . . . . . . . . . . . . . . . . . . . . . . $ 12 .78 $ 12 .65 $ 12 .58
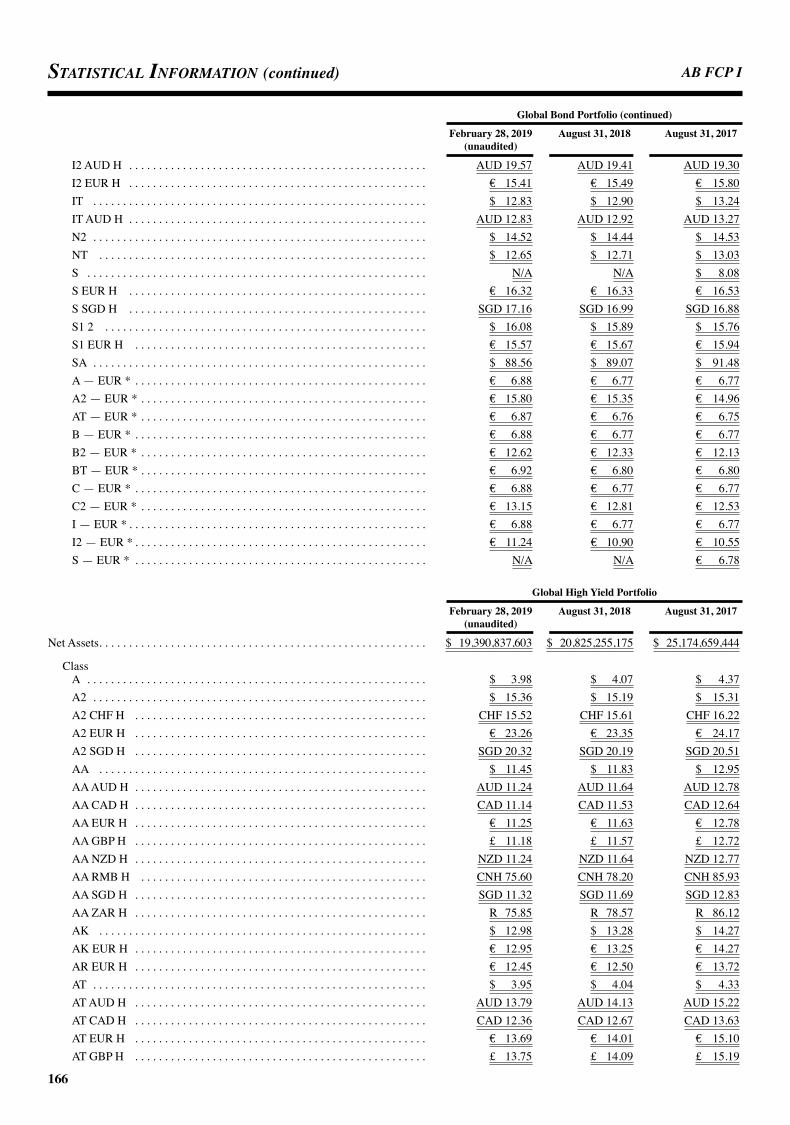
AB FCP I
166
StatiStical information (continued)
GlobalBondPortfolio(continued)
February28,2019 August31,2018 August31,2017 (unaudited)
I2 AUD H . . . . . . . . . . . . . . . . . . . . . . . . . . . . . . . . . . . . . . . . . . . . . . . . . . AUD 19 .57 AUD 19 .41 AUD 19 .30I2 EUR H . . . . . . . . . . . . . . . . . . . . . . . . . . . . . . . . . . . . . . . . . . . . . . . . . . € 15 .41 € 15 .49 € 15 .80IT . . . . . . . . . . . . . . . . . . . . . . . . . . . . . . . . . . . . . . . . . . . . . . . . . . . . . . . . $ 12 .83 $ 12 .90 $ 13 .24IT AUD H . . . . . . . . . . . . . . . . . . . . . . . . . . . . . . . . . . . . . . . . . . . . . . . . . . AUD 12 .83 AUD 12 .92 AUD 13 .27N2 . . . . . . . . . . . . . . . . . . . . . . . . . . . . . . . . . . . . . . . . . . . . . . . . . . . . . . . . $ 14 .52 $ 14 .44 $ 14 .53NT . . . . . . . . . . . . . . . . . . . . . . . . . . . . . . . . . . . . . . . . . . . . . . . . . . . . . . . $ 12 .65 $ 12 .71 $ 13 .03S . . . . . . . . . . . . . . . . . . . . . . . . . . . . . . . . . . . . . . . . . . . . . . . . . . . . . . . . . N/A N/A $ 8 .08S EUR H . . . . . . . . . . . . . . . . . . . . . . . . . . . . . . . . . . . . . . . . . . . . . . . . . . € 16 .32 € 16 .33 € 16 .53S SGD H . . . . . . . . . . . . . . . . . . . . . . . . . . . . . . . . . . . . . . . . . . . . . . . . . . SGD 17 .16 SGD 16 .99 SGD 16 .88S1 2 . . . . . . . . . . . . . . . . . . . . . . . . . . . . . . . . . . . . . . . . . . . . . . . . . . . . . . $ 16 .08 $ 15 .89 $ 15 .76S1 EUR H . . . . . . . . . . . . . . . . . . . . . . . . . . . . . . . . . . . . . . . . . . . . . . . . . € 15 .57 € 15 .67 € 15 .94SA . . . . . . . . . . . . . . . . . . . . . . . . . . . . . . . . . . . . . . . . . . . . . . . . . . . . . . . . $ 88 .56 $ 89 .07 $ 91 .48A — EUR * . . . . . . . . . . . . . . . . . . . . . . . . . . . . . . . . . . . . . . . . . . . . . . . . . € 6 .88 € 6 .77 € 6 .77A2 — EUR * . . . . . . . . . . . . . . . . . . . . . . . . . . . . . . . . . . . . . . . . . . . . . . . . € 15 .80 € 15 .35 € 14 .96AT — EUR * . . . . . . . . . . . . . . . . . . . . . . . . . . . . . . . . . . . . . . . . . . . . . . . . € 6 .87 € 6 .76 € 6 .75B — EUR * . . . . . . . . . . . . . . . . . . . . . . . . . . . . . . . . . . . . . . . . . . . . . . . . . € 6 .88 € 6 .77 € 6 .77B2 — EUR * . . . . . . . . . . . . . . . . . . . . . . . . . . . . . . . . . . . . . . . . . . . . . . . . € 12 .62 € 12 .33 € 12 .13BT — EUR * . . . . . . . . . . . . . . . . . . . . . . . . . . . . . . . . . . . . . . . . . . . . . . . . € 6 .92 € 6 .80 € 6 .80C — EUR * . . . . . . . . . . . . . . . . . . . . . . . . . . . . . . . . . . . . . . . . . . . . . . . . . € 6 .88 € 6 .77 € 6 .77C2 — EUR * . . . . . . . . . . . . . . . . . . . . . . . . . . . . . . . . . . . . . . . . . . . . . . . . € 13 .15 € 12 .81 € 12 .53I — EUR * . . . . . . . . . . . . . . . . . . . . . . . . . . . . . . . . . . . . . . . . . . . . . . . . . . € 6 .88 € 6 .77 € 6 .77I2 — EUR * . . . . . . . . . . . . . . . . . . . . . . . . . . . . . . . . . . . . . . . . . . . . . . . . . € 11 .24 € 10 .90 € 10 .55S — EUR * . . . . . . . . . . . . . . . . . . . . . . . . . . . . . . . . . . . . . . . . . . . . . . . . . N/A N/A € 6 .78
GlobalHighYieldPortfolio
February28,2019 August31,2018 August31,2017 (unaudited)
Net Assets . . . . . . . . . . . . . . . . . . . . . . . . . . . . . . . . . . . . . . . . . . . . . . . . . . . . . . . $ 19,390,837,603 $ 20,825,255,175 $ 25,174,659,444
Class A . . . . . . . . . . . . . . . . . . . . . . . . . . . . . . . . . . . . . . . . . . . . . . . . . . . . . . . . . $ 3 .98 $ 4 .07 $ 4 .37A2 . . . . . . . . . . . . . . . . . . . . . . . . . . . . . . . . . . . . . . . . . . . . . . . . . . . . . . . . $ 15 .36 $ 15 .19 $ 15 .31A2 CHF H . . . . . . . . . . . . . . . . . . . . . . . . . . . . . . . . . . . . . . . . . . . . . . . . . CHF 15 .52 CHF 15 .61 CHF 16 .22A2 EUR H . . . . . . . . . . . . . . . . . . . . . . . . . . . . . . . . . . . . . . . . . . . . . . . . . € 23 .26 € 23 .35 € 24 .17A2 SGD H . . . . . . . . . . . . . . . . . . . . . . . . . . . . . . . . . . . . . . . . . . . . . . . . . SGD 20 .32 SGD 20 .19 SGD 20 .51AA . . . . . . . . . . . . . . . . . . . . . . . . . . . . . . . . . . . . . . . . . . . . . . . . . . . . . . . $ 11 .45 $ 11 .83 $ 12 .95AA AUD H . . . . . . . . . . . . . . . . . . . . . . . . . . . . . . . . . . . . . . . . . . . . . . . . . AUD 11 .24 AUD 11 .64 AUD 12 .78AA CAD H . . . . . . . . . . . . . . . . . . . . . . . . . . . . . . . . . . . . . . . . . . . . . . . . . CAD 11 .14 CAD 11 .53 CAD 12 .64AA EUR H . . . . . . . . . . . . . . . . . . . . . . . . . . . . . . . . . . . . . . . . . . . . . . . . . € 11 .25 € 11 .63 € 12 .78AA GBP H . . . . . . . . . . . . . . . . . . . . . . . . . . . . . . . . . . . . . . . . . . . . . . . . . £ 11 .18 £ 11 .57 £ 12 .72AA NZD H . . . . . . . . . . . . . . . . . . . . . . . . . . . . . . . . . . . . . . . . . . . . . . . . . NZD 11 .24 NZD 11 .64 NZD 12 .77AA RMB H . . . . . . . . . . . . . . . . . . . . . . . . . . . . . . . . . . . . . . . . . . . . . . . . CNH 75 .60 CNH 78 .20 CNH 85 .93AA SGD H . . . . . . . . . . . . . . . . . . . . . . . . . . . . . . . . . . . . . . . . . . . . . . . . . SGD 11 .32 SGD 11 .69 SGD 12 .83AA ZAR H . . . . . . . . . . . . . . . . . . . . . . . . . . . . . . . . . . . . . . . . . . . . . . . . . R 75 .85 R 78 .57 R 86 .12AK . . . . . . . . . . . . . . . . . . . . . . . . . . . . . . . . . . . . . . . . . . . . . . . . . . . . . . . $ 12 .98 $ 13 .28 $ 14 .27AK EUR H . . . . . . . . . . . . . . . . . . . . . . . . . . . . . . . . . . . . . . . . . . . . . . . . . € 12 .95 € 13 .25 € 14 .27AR EUR H . . . . . . . . . . . . . . . . . . . . . . . . . . . . . . . . . . . . . . . . . . . . . . . . . € 12 .45 € 12 .50 € 13 .72AT . . . . . . . . . . . . . . . . . . . . . . . . . . . . . . . . . . . . . . . . . . . . . . . . . . . . . . . . $ 3 .95 $ 4 .04 $ 4 .33AT AUD H . . . . . . . . . . . . . . . . . . . . . . . . . . . . . . . . . . . . . . . . . . . . . . . . . AUD 13 .79 AUD 14 .13 AUD 15 .22AT CAD H . . . . . . . . . . . . . . . . . . . . . . . . . . . . . . . . . . . . . . . . . . . . . . . . . CAD 12 .36 CAD 12 .67 CAD 13 .63AT EUR H . . . . . . . . . . . . . . . . . . . . . . . . . . . . . . . . . . . . . . . . . . . . . . . . . € 13 .69 € 14 .01 € 15 .10AT GBP H . . . . . . . . . . . . . . . . . . . . . . . . . . . . . . . . . . . . . . . . . . . . . . . . . £ 13 .75 £ 14 .09 £ 15 .19

AB FCP I
167
GlobalHighYieldPortfolio(continued)
February28,2019 August31,2018 August31,2017 (unaudited)
AT NZD H . . . . . . . . . . . . . . . . . . . . . . . . . . . . . . . . . . . . . . . . . . . . . . . . . NZD 12 .60 NZD 12 .92 NZD 13 .91AT RMB H . . . . . . . . . . . . . . . . . . . . . . . . . . . . . . . . . . . . . . . . . . . . . . . . . CNH 88 .33 CNH 90 .45 CNH 97 .50AT SGD H . . . . . . . . . . . . . . . . . . . . . . . . . . . . . . . . . . . . . . . . . . . . . . . . . SGD 12 .44 SGD 12 .72 SGD 13 .69B . . . . . . . . . . . . . . . . . . . . . . . . . . . . . . . . . . . . . . . . . . . . . . . . . . . . . . . . . $ 3 .98 $ 4 .07 $ 4 .37B2 . . . . . . . . . . . . . . . . . . . . . . . . . . . . . . . . . . . . . . . . . . . . . . . . . . . . . . . . $ 22 .54 $ 22 .40 $ 22 .80B2 EUR H . . . . . . . . . . . . . . . . . . . . . . . . . . . . . . . . . . . . . . . . . . . . . . . . . € 21 .22 € 21 .39 € 22 .36BA . . . . . . . . . . . . . . . . . . . . . . . . . . . . . . . . . . . . . . . . . . . . . . . . . . . . . . . $ 10 .82 $ 11 .23 $ 12 .42BA AUD H . . . . . . . . . . . . . . . . . . . . . . . . . . . . . . . . . . . . . . . . . . . . . . . . . AUD 10 .61 AUD 11 .04 AUD 12 .25BA ZAR H . . . . . . . . . . . . . . . . . . . . . . . . . . . . . . . . . . . . . . . . . . . . . . . . . R 71 .33 R 74 .30 R 82 .35BT . . . . . . . . . . . . . . . . . . . . . . . . . . . . . . . . . . . . . . . . . . . . . . . . . . . . . . . . $ 4 .02 $ 4 .11 $ 4 .41BT AUD H . . . . . . . . . . . . . . . . . . . . . . . . . . . . . . . . . . . . . . . . . . . . . . . . . AUD 13 .76 AUD 14 .10 AUD 15 .18BT CAD H . . . . . . . . . . . . . . . . . . . . . . . . . . . . . . . . . . . . . . . . . . . . . . . . . CAD 12 .33 CAD 12 .63 CAD 13 .59BT EUR H . . . . . . . . . . . . . . . . . . . . . . . . . . . . . . . . . . . . . . . . . . . . . . . . . € 13 .70 € 14 .02 € 15 .10BT GBP H . . . . . . . . . . . . . . . . . . . . . . . . . . . . . . . . . . . . . . . . . . . . . . . . . £ 13 .75 £ 14 .08 £ 15 .18BT NZD H . . . . . . . . . . . . . . . . . . . . . . . . . . . . . . . . . . . . . . . . . . . . . . . . . NZD 12 .71 NZD 13 .02 NZD 14 .01C . . . . . . . . . . . . . . . . . . . . . . . . . . . . . . . . . . . . . . . . . . . . . . . . . . . . . . . . . $ 3 .98 $ 4 .07 $ 4 .37C2 . . . . . . . . . . . . . . . . . . . . . . . . . . . . . . . . . . . . . . . . . . . . . . . . . . . . . . . . $ 21 .86 $ 21 .67 $ 21 .94C2 EUR H . . . . . . . . . . . . . . . . . . . . . . . . . . . . . . . . . . . . . . . . . . . . . . . . . € 18 .59 € 18 .70 € 19 .44CK . . . . . . . . . . . . . . . . . . . . . . . . . . . . . . . . . . . . . . . . . . . . . . . . . . . . . . . $ 12 .94 $ 13 .23 $ 14 .22CK EUR H . . . . . . . . . . . . . . . . . . . . . . . . . . . . . . . . . . . . . . . . . . . . . . . . . € 12 .94 € 13 .23 € 14 .25CT . . . . . . . . . . . . . . . . . . . . . . . . . . . . . . . . . . . . . . . . . . . . . . . . . . . . . . . . $ 13 .41 $ 13 .71 $ 14 .72EA . . . . . . . . . . . . . . . . . . . . . . . . . . . . . . . . . . . . . . . . . . . . . . . . . . . . . . . $ 14 .03 $ 14 .53 N/A I . . . . . . . . . . . . . . . . . . . . . . . . . . . . . . . . . . . . . . . . . . . . . . . . . . . . . . . . . $ 3 .98 $ 4 .07 $ 4 .37I2 . . . . . . . . . . . . . . . . . . . . . . . . . . . . . . . . . . . . . . . . . . . . . . . . . . . . . . . . $ 9 .69 $ 9 .55 $ 9 .58I2 AUD H . . . . . . . . . . . . . . . . . . . . . . . . . . . . . . . . . . . . . . . . . . . . . . . . . . AUD 27 .23 AUD 26 .93 AUD 27 .03I2 CHF H . . . . . . . . . . . . . . . . . . . . . . . . . . . . . . . . . . . . . . . . . . . . . . . . . . CHF 15 .84 CHF 15 .89 CHF 16 .43I2 EUR H . . . . . . . . . . . . . . . . . . . . . . . . . . . . . . . . . . . . . . . . . . . . . . . . . . € 24 .37 € 24 .39 € 25 .10I2 SGD H . . . . . . . . . . . . . . . . . . . . . . . . . . . . . . . . . . . . . . . . . . . . . . . . . . SGD 17 .36 SGD 17 .20 SGD 17 .38IA AUD H . . . . . . . . . . . . . . . . . . . . . . . . . . . . . . . . . . . . . . . . . . . . . . . . . AUD 14 .11 AUD 14 .57 AUD 15 .91IQD . . . . . . . . . . . . . . . . . . . . . . . . . . . . . . . . . . . . . . . . . . . . . . . . . . . . . . $ 12 .73 $ 13 .03 $ 14 .00IT . . . . . . . . . . . . . . . . . . . . . . . . . . . . . . . . . . . . . . . . . . . . . . . . . . . . . . . . $ 12 .42 $ 12 .70 $ 13 .64IT AUD H . . . . . . . . . . . . . . . . . . . . . . . . . . . . . . . . . . . . . . . . . . . . . . . . . . AUD 12 .26 AUD 12 .58 AUD 13 .55IT CAD H . . . . . . . . . . . . . . . . . . . . . . . . . . . . . . . . . . . . . . . . . . . . . . . . . . CAD 14 .76 CAD 15 .12 CAD 16 .27IT EUR H . . . . . . . . . . . . . . . . . . . . . . . . . . . . . . . . . . . . . . . . . . . . . . . . . . € 13 .59 € 13 .91 N/A IT GBP H . . . . . . . . . . . . . . . . . . . . . . . . . . . . . . . . . . . . . . . . . . . . . . . . . . £ 14 .78 £ 15 .15 £ 16 .33IT NZD H . . . . . . . . . . . . . . . . . . . . . . . . . . . . . . . . . . . . . . . . . . . . . . . . . . NZD 14 .74 NZD 15 .12 NZD 16 .28IT RMB H . . . . . . . . . . . . . . . . . . . . . . . . . . . . . . . . . . . . . . . . . . . . . . . . . CNH 84 .38 CNH 86 .47 CNH 93 .22J . . . . . . . . . . . . . . . . . . . . . . . . . . . . . . . . . . . . . . . . . . . . . . . . . . . . . . . . . $ 4 .28 $ 4 .37 $ 4 .69N2 . . . . . . . . . . . . . . . . . . . . . . . . . . . . . . . . . . . . . . . . . . . . . . . . . . . . . . . . $ 18 .05 $ 17 .90 $ 18 .14NT . . . . . . . . . . . . . . . . . . . . . . . . . . . . . . . . . . . . . . . . . . . . . . . . . . . . . . . $ 12 .69 $ 12 .97 $ 13 .92S EUR H . . . . . . . . . . . . . . . . . . . . . . . . . . . . . . . . . . . . . . . . . . . . . . . . . . € 105 .32 € 104 .81 € 106 .58S1 . . . . . . . . . . . . . . . . . . . . . . . . . . . . . . . . . . . . . . . . . . . . . . . . . . . . . . . . $ 25 .90 $ 25 .50 $ 25 .49S1D . . . . . . . . . . . . . . . . . . . . . . . . . . . . . . . . . . . . . . . . . . . . . . . . . . . . . . $ 17 .51 $ 17 .72 $ 18 .60S1QD . . . . . . . . . . . . . . . . . . . . . . . . . . . . . . . . . . . . . . . . . . . . . . . . . . . . . N/A N/A $ 99 .61SA . . . . . . . . . . . . . . . . . . . . . . . . . . . . . . . . . . . . . . . . . . . . . . . . . . . . . . . . $ 83 .95 $ 85 .92 $ 92 .31SHK . . . . . . . . . . . . . . . . . . . . . . . . . . . . . . . . . . . . . . . . . . . . . . . . . . . . . . $ 92 .75 $ 94 .91 $ 101 .95SK . . . . . . . . . . . . . . . . . . . . . . . . . . . . . . . . . . . . . . . . . . . . . . . . . . . . . . . $ 34 .57 $ 34 .00 $ 33 .90SM AUD H (5) . . . . . . . . . . . . . . . . . . . . . . . . . . . . . . . . . . . . . . . . . . . . . . N/A AUD 86 .30 AUD 92 .96SQ (6) . . . . . . . . . . . . . . . . . . . . . . . . . . . . . . . . . . . . . . . . . . . . . . . . . . . . . $ 103 .92 N/A N/AW2 . . . . . . . . . . . . . . . . . . . . . . . . . . . . . . . . . . . . . . . . . . . . . . . . . . . . . . . $ 14 .90 $ 14 .67 N/A

AB FCP I
168
StatiStical information (continued)
GlobalHighYieldPortfolio(continued)
February28,2019 August31,2018 August31,2017 (unaudited)
W2 CHF H . . . . . . . . . . . . . . . . . . . . . . . . . . . . . . . . . . . . . . . . . . . . . . . . . CHF 14 .36 CHF 14 .39 N/AWT . . . . . . . . . . . . . . . . . . . . . . . . . . . . . . . . . . . . . . . . . . . . . . . . . . . . . . . $ 13 .71 $ 14 .03 N/AWT AUD H . . . . . . . . . . . . . . . . . . . . . . . . . . . . . . . . . . . . . . . . . . . . . . . . AUD 13 .65 AUD 14 .00 N/AWT EUR H . . . . . . . . . . . . . . . . . . . . . . . . . . . . . . . . . . . . . . . . . . . . . . . . . € 13 .68 € 14 .00 N/AA — EUR * . . . . . . . . . . . . . . . . . . . . . . . . . . . . . . . . . . . . . . . . . . . . . . . . . € 3 .50 € 3 .51 € 3 .67A2 — EUR * . . . . . . . . . . . . . . . . . . . . . . . . . . . . . . . . . . . . . . . . . . . . . . . . € 13 .51 € 13 .08 € 12 .85AK — EUR * . . . . . . . . . . . . . . . . . . . . . . . . . . . . . . . . . . . . . . . . . . . . . . . . € 11 .42 € 11 .44 € 11 .97AT — EUR * . . . . . . . . . . . . . . . . . . . . . . . . . . . . . . . . . . . . . . . . . . . . . . . . € 3 .47 € 3 .48 € 3 .63B — EUR * . . . . . . . . . . . . . . . . . . . . . . . . . . . . . . . . . . . . . . . . . . . . . . . . . € 3 .50 € 3 .51 € 3 .67B2 — EUR * . . . . . . . . . . . . . . . . . . . . . . . . . . . . . . . . . . . . . . . . . . . . . . . . € 19 .82 € 19 .29 € 19 .13BT — EUR * . . . . . . . . . . . . . . . . . . . . . . . . . . . . . . . . . . . . . . . . . . . . . . . . € 3 .54 € 3 .54 € 3 .70C — EUR * . . . . . . . . . . . . . . . . . . . . . . . . . . . . . . . . . . . . . . . . . . . . . . . . . € 3 .50 € 3 .51 € 3 .67C2 — EUR * . . . . . . . . . . . . . . . . . . . . . . . . . . . . . . . . . . . . . . . . . . . . . . . . € 19 .23 € 18 .67 € 18 .41I — EUR * . . . . . . . . . . . . . . . . . . . . . . . . . . . . . . . . . . . . . . . . . . . . . . . . . . € 3 .50 € 3 .51 € 3 .67I2 — EUR * . . . . . . . . . . . . . . . . . . . . . . . . . . . . . . . . . . . . . . . . . . . . . . . . . € 8 .52 € 8 .23 € 8 .04IQD — EUR * . . . . . . . . . . . . . . . . . . . . . . . . . . . . . . . . . . . . . . . . . . . . . . . € 11 .20 € 11 .22 € 11 .75S1 — EUR * . . . . . . . . . . . . . . . . . . . . . . . . . . . . . . . . . . . . . . . . . . . . . . . . € 22 .78 € 21 .96 € 21 .39S1D — EUR * . . . . . . . . . . . . . . . . . . . . . . . . . . . . . . . . . . . . . . . . . . . . . . . € 15 .40 € 15 .26 € 15 .61
AmericanIncomePortfolio
February28,2019 August31,2018 August31,2017 (unaudited)
Net Assets . . . . . . . . . . . . . . . . . . . . . . . . . . . . . . . . . . . . . . . . . . . . . . . . . . . . . . . $ 13,211,955,349 $ 10,343,905,339 $ 11,985,598,940
ClassA . . . . . . . . . . . . . . . . . . . . . . . . . . . . . . . . . . . . . . . . . . . . . . . . . . . . . . . . . $ 8 .00 $ 8 .01 $ 8 .50A2 . . . . . . . . . . . . . . . . . . . . . . . . . . . . . . . . . . . . . . . . . . . . . . . . . . . . . . . . $ 28 .48 $ 27 .79 $ 28 .07A2 CHF H . . . . . . . . . . . . . . . . . . . . . . . . . . . . . . . . . . . . . . . . . . . . . . . . . CHF 15 .83 CHF 15 .71 CHF 16 .35A2 DUR PH . . . . . . . . . . . . . . . . . . . . . . . . . . . . . . . . . . . . . . . . . . . . . . . . $ 17 .01 $ 16 .75 $ 16 .71A2 EUR H . . . . . . . . . . . . . . . . . . . . . . . . . . . . . . . . . . . . . . . . . . . . . . . . . € 18 .69 € 18 .51 € 19 .19A2 SGD H . . . . . . . . . . . . . . . . . . . . . . . . . . . . . . . . . . . . . . . . . . . . . . . . . SGD 19 .60 SGD 19 .21 SGD 19 .54AA . . . . . . . . . . . . . . . . . . . . . . . . . . . . . . . . . . . . . . . . . . . . . . . . . . . . . . . $ 12 .74 $ 12 .86 $ 13 .84AA AUD H . . . . . . . . . . . . . . . . . . . . . . . . . . . . . . . . . . . . . . . . . . . . . . . . . AUD 12 .60 AUD 12 .73 AUD 13 .73AA CAD H . . . . . . . . . . . . . . . . . . . . . . . . . . . . . . . . . . . . . . . . . . . . . . . . . CAD 12 .35 CAD 12 .47 CAD 13 .44AA DUR PH . . . . . . . . . . . . . . . . . . . . . . . . . . . . . . . . . . . . . . . . . . . . . . . $ 12 .31 $ 12 .55 $ 13 .32AA EUR H . . . . . . . . . . . . . . . . . . . . . . . . . . . . . . . . . . . . . . . . . . . . . . . . . € 12 .38 € 12 .50 € 13 .49AA GBP H . . . . . . . . . . . . . . . . . . . . . . . . . . . . . . . . . . . . . . . . . . . . . . . . . £ 12 .35 £ 12 .48 £ 13 .47AA NZD H . . . . . . . . . . . . . . . . . . . . . . . . . . . . . . . . . . . . . . . . . . . . . . . . . NZD 12 .44 NZD 12 .58 NZD 13 .56AA RMB H . . . . . . . . . . . . . . . . . . . . . . . . . . . . . . . . . . . . . . . . . . . . . . . . CNH 83 .31 CNH 84 .15 CNH 90 .89AA SGD H . . . . . . . . . . . . . . . . . . . . . . . . . . . . . . . . . . . . . . . . . . . . . . . . . SGD 12 .53 SGD 12 .65 SGD 13 .65AA ZAR H . . . . . . . . . . . . . . . . . . . . . . . . . . . . . . . . . . . . . . . . . . . . . . . . . R 84 .27 R 85 .11 R 91 .52AK . . . . . . . . . . . . . . . . . . . . . . . . . . . . . . . . . . . . . . . . . . . . . . . . . . . . . . . $ 13 .32 $ 13 .35 $ 14 .19AK EUR H . . . . . . . . . . . . . . . . . . . . . . . . . . . . . . . . . . . . . . . . . . . . . . . . . € 13 .31 € 13 .35 € 14 .21AR EUR . . . . . . . . . . . . . . . . . . . . . . . . . . . . . . . . . . . . . . . . . . . . . . . . . . . € 13 .21 € 12 .63 € 13 .29AR EUR H . . . . . . . . . . . . . . . . . . . . . . . . . . . . . . . . . . . . . . . . . . . . . . . . . € 13 .00 € 12 .88 € 13 .87AT . . . . . . . . . . . . . . . . . . . . . . . . . . . . . . . . . . . . . . . . . . . . . . . . . . . . . . . . $ 7 .99 $ 8 .00 $ 8 .49AT AUD H . . . . . . . . . . . . . . . . . . . . . . . . . . . . . . . . . . . . . . . . . . . . . . . . . AUD 13 .62 AUD 13 .67 AUD 14 .55AT CAD H . . . . . . . . . . . . . . . . . . . . . . . . . . . . . . . . . . . . . . . . . . . . . . . . . CAD 13 .38 CAD 13 .42 CAD 14 .27AT DUR PH . . . . . . . . . . . . . . . . . . . . . . . . . . . . . . . . . . . . . . . . . . . . . . . . $ 13 .29 $ 13 .45 $ 14 .09AT EUR H . . . . . . . . . . . . . . . . . . . . . . . . . . . . . . . . . . . . . . . . . . . . . . . . . € 13 .37 € 13 .41 € 14 .27AT GBP H . . . . . . . . . . . . . . . . . . . . . . . . . . . . . . . . . . . . . . . . . . . . . . . . . £ 13 .35 £ 13 .40 £ 14 .27AT NZD H . . . . . . . . . . . . . . . . . . . . . . . . . . . . . . . . . . . . . . . . . . . . . . . . . NZD 12 .87 NZD 12 .92 NZD 13 .74

AB FCP I
169
AmericanIncomePortfolio(continued)
February28,2019 August31,2018 August31,2017 (unaudited)
AT RMB H . . . . . . . . . . . . . . . . . . . . . . . . . . . . . . . . . . . . . . . . . . . . . . . . . CNH 89 .64 CNH 89 .92 CNH 95 .78AT SGD H . . . . . . . . . . . . . . . . . . . . . . . . . . . . . . . . . . . . . . . . . . . . . . . . . SGD 13 .38 SGD 13 .40 SGD 14 .26B . . . . . . . . . . . . . . . . . . . . . . . . . . . . . . . . . . . . . . . . . . . . . . . . . . . . . . . . . $ 8 .00 $ 8 .01 $ 8 .50B2 . . . . . . . . . . . . . . . . . . . . . . . . . . . . . . . . . . . . . . . . . . . . . . . . . . . . . . . . $ 23 .03 $ 22 .54 $ 22 .93BA . . . . . . . . . . . . . . . . . . . . . . . . . . . . . . . . . . . . . . . . . . . . . . . . . . . . . . . $ 12 .27 $ 12 .42 $ 13 .46BA AUD H . . . . . . . . . . . . . . . . . . . . . . . . . . . . . . . . . . . . . . . . . . . . . . . . . AUD 12 .11 AUD 12 .28 AUD 13 .34BA ZAR H . . . . . . . . . . . . . . . . . . . . . . . . . . . . . . . . . . . . . . . . . . . . . . . . . R 81 .53 R 82 .59 R 89 .46BT . . . . . . . . . . . . . . . . . . . . . . . . . . . . . . . . . . . . . . . . . . . . . . . . . . . . . . . . $ 8 .05 $ 8 .06 $ 8 .56BT AUD H . . . . . . . . . . . . . . . . . . . . . . . . . . . . . . . . . . . . . . . . . . . . . . . . . AUD 13 .68 AUD 13 .73 AUD 14 .60BT CAD H . . . . . . . . . . . . . . . . . . . . . . . . . . . . . . . . . . . . . . . . . . . . . . . . . CAD 13 .27 CAD 13 .30 CAD 14 .14BT EUR H . . . . . . . . . . . . . . . . . . . . . . . . . . . . . . . . . . . . . . . . . . . . . . . . . € 13 .38 € 13 .41 € 14 .28BT GBP H . . . . . . . . . . . . . . . . . . . . . . . . . . . . . . . . . . . . . . . . . . . . . . . . . £ 13 .44 £ 13 .49 £ 14 .36BT NZD H . . . . . . . . . . . . . . . . . . . . . . . . . . . . . . . . . . . . . . . . . . . . . . . . . NZD 12 .94 NZD 12 .99 NZD 13 .81C . . . . . . . . . . . . . . . . . . . . . . . . . . . . . . . . . . . . . . . . . . . . . . . . . . . . . . . . . $ 8 .00 $ 8 .01 $ 8 .50C2 . . . . . . . . . . . . . . . . . . . . . . . . . . . . . . . . . . . . . . . . . . . . . . . . . . . . . . . . $ 35 .03 $ 34 .24 $ 34 .75C2 DUR PH . . . . . . . . . . . . . . . . . . . . . . . . . . . . . . . . . . . . . . . . . . . . . . . . $ 16 .56 $ 16 .35 $ 16 .38C2 EUR H . . . . . . . . . . . . . . . . . . . . . . . . . . . . . . . . . . . . . . . . . . . . . . . . . € 18 .03 € 17 .89 € 18 .63CK . . . . . . . . . . . . . . . . . . . . . . . . . . . . . . . . . . . . . . . . . . . . . . . . . . . . . . . N/A N/A $ 14 .17CK EUR H . . . . . . . . . . . . . . . . . . . . . . . . . . . . . . . . . . . . . . . . . . . . . . . . . N/A N/A € 14 .21CT . . . . . . . . . . . . . . . . . . . . . . . . . . . . . . . . . . . . . . . . . . . . . . . . . . . . . . . . $ 13 .37 $ 13 .39 $ 14 .22CT DUR PH . . . . . . . . . . . . . . . . . . . . . . . . . . . . . . . . . . . . . . . . . . . . . . . . N/A N/A $ 14 .07I . . . . . . . . . . . . . . . . . . . . . . . . . . . . . . . . . . . . . . . . . . . . . . . . . . . . . . . . . $ 8 .00 $ 8 .01 $ 8 .50I2 . . . . . . . . . . . . . . . . . . . . . . . . . . . . . . . . . . . . . . . . . . . . . . . . . . . . . . . . $ 16 .77 $ 16 .32 $ 16 .39I2 AUD H . . . . . . . . . . . . . . . . . . . . . . . . . . . . . . . . . . . . . . . . . . . . . . . . . . AUD 15 .28 AUD 14 .91 N/AI2 CHF H . . . . . . . . . . . . . . . . . . . . . . . . . . . . . . . . . . . . . . . . . . . . . . . . . . CHF 16 .38 CHF 16 .22 CHF 16 .78I2 DUR PH . . . . . . . . . . . . . . . . . . . . . . . . . . . . . . . . . . . . . . . . . . . . . . . . . $ 17 .34 $ 17 .04 $ 16 .89I2 EUR H . . . . . . . . . . . . . . . . . . . . . . . . . . . . . . . . . . . . . . . . . . . . . . . . . . € 19 .98 € 19 .73 € 20 .34I2 SGD H . . . . . . . . . . . . . . . . . . . . . . . . . . . . . . . . . . . . . . . . . . . . . . . . . . SGD 17 .31 SGD 16 .92 SGD 17 .12IA . . . . . . . . . . . . . . . . . . . . . . . . . . . . . . . . . . . . . . . . . . . . . . . . . . . . . . . . $ 14 .36 $ 14 .45 $ 15 .47IA AUD H . . . . . . . . . . . . . . . . . . . . . . . . . . . . . . . . . . . . . . . . . . . . . . . . . AUD 14 .27 AUD 14 .38 AUD 15 .42IA DUR PH . . . . . . . . . . . . . . . . . . . . . . . . . . . . . . . . . . . . . . . . . . . . . . . . N/A N/A $ 13 .42IT . . . . . . . . . . . . . . . . . . . . . . . . . . . . . . . . . . . . . . . . . . . . . . . . . . . . . . . . $ 13 .03 $ 13 .06 $ 13 .86IT AUD H . . . . . . . . . . . . . . . . . . . . . . . . . . . . . . . . . . . . . . . . . . . . . . . . . . AUD 12 .74 AUD 12 .79 AUD 13 .61IT CAD H . . . . . . . . . . . . . . . . . . . . . . . . . . . . . . . . . . . . . . . . . . . . . . . . . . CAD 14 .61 CAD 14 .65 CAD 15 .59IT DUR PH . . . . . . . . . . . . . . . . . . . . . . . . . . . . . . . . . . . . . . . . . . . . . . . . N/A N/A $ 14 .00IT EUR H . . . . . . . . . . . . . . . . . . . . . . . . . . . . . . . . . . . . . . . . . . . . . . . . . . € 14 .56 € 14 .60 € 15 .55IT GBP H . . . . . . . . . . . . . . . . . . . . . . . . . . . . . . . . . . . . . . . . . . . . . . . . . . £ 14 .58 £ 14 .64 £ 15 .59IT JPY . . . . . . . . . . . . . . . . . . . . . . . . . . . . . . . . . . . . . . . . . . . . . . . . . . . . ¥ 9,897 .00 ¥ 9,870 .00 ¥ 10,366 .00IT JPY H . . . . . . . . . . . . . . . . . . . . . . . . . . . . . . . . . . . . . . . . . . . . . . . . . . ¥ 8,488 .00 ¥ 8,518 .00 ¥ 9,069 .00IT NZD H . . . . . . . . . . . . . . . . . . . . . . . . . . . . . . . . . . . . . . . . . . . . . . . . . . NZD 14 .61 NZD 14 .66 NZD 15 .59IT RMB H . . . . . . . . . . . . . . . . . . . . . . . . . . . . . . . . . . . . . . . . . . . . . . . . . N/A N/A CNH 97 .42IT SGD H . . . . . . . . . . . . . . . . . . . . . . . . . . . . . . . . . . . . . . . . . . . . . . . . . . SGD 13 .53 SGD 13 .55 SGD 14 .42J . . . . . . . . . . . . . . . . . . . . . . . . . . . . . . . . . . . . . . . . . . . . . . . . . . . . . . . . . $ 8 .15 $ 8 .17 $ 8 .67N2 . . . . . . . . . . . . . . . . . . . . . . . . . . . . . . . . . . . . . . . . . . . . . . . . . . . . . . . . $ 17 .04 $ 16 .67 $ 16 .93NT . . . . . . . . . . . . . . . . . . . . . . . . . . . . . . . . . . . . . . . . . . . . . . . . . . . . . . . $ 13 .00 $ 13 .02 $ 13 .82S . . . . . . . . . . . . . . . . . . . . . . . . . . . . . . . . . . . . . . . . . . . . . . . . . . . . . . . . . $ 19 .03 $ 18 .44 $ 18 .39S1 . . . . . . . . . . . . . . . . . . . . . . . . . . . . . . . . . . . . . . . . . . . . . . . . . . . . . . . . $ 21 .54 $ 20 .93 $ 20 .98S1D . . . . . . . . . . . . . . . . . . . . . . . . . . . . . . . . . . . . . . . . . . . . . . . . . . . . . . $ 15 .37 $ 15 .26 $ 15 .96SA . . . . . . . . . . . . . . . . . . . . . . . . . . . . . . . . . . . . . . . . . . . . . . . . . . . . . . . . $ 90 .31 $ 90 .51 $ 96 .14SHK . . . . . . . . . . . . . . . . . . . . . . . . . . . . . . . . . . . . . . . . . . . . . . . . . . . . . . $ 93 .87 $ 94 .09 $ 99 .92

AB FCP I
170
StatiStical information (continued)
AmericanIncomePortfolio(continued)
February28,2019 August31,2018 August31,2017 (unaudited)
W . . . . . . . . . . . . . . . . . . . . . . . . . . . . . . . . . . . . . . . . . . . . . . . . . . . . . . . . $ 14 .41 $ 14 .43 N/AW2 . . . . . . . . . . . . . . . . . . . . . . . . . . . . . . . . . . . . . . . . . . . . . . . . . . . . . . . $ 15 .40 $ 14 .96 N/AW2 CHF H . . . . . . . . . . . . . . . . . . . . . . . . . . . . . . . . . . . . . . . . . . . . . . . . . CHF 14 .83 CHF 14 .67 N/AW2 EUR H . . . . . . . . . . . . . . . . . . . . . . . . . . . . . . . . . . . . . . . . . . . . . . . . . € 14 .90 € 14 .71 N/AWT . . . . . . . . . . . . . . . . . . . . . . . . . . . . . . . . . . . . . . . . . . . . . . . . . . . . . . . $ 14 .40 $ 14 .43 N/AWT AUD H . . . . . . . . . . . . . . . . . . . . . . . . . . . . . . . . . . . . . . . . . . . . . . . . AUD 14 .34 AUD 14 .39 N/AWT SGD H . . . . . . . . . . . . . . . . . . . . . . . . . . . . . . . . . . . . . . . . . . . . . . . . . SGD 14 .38 SGD 14 .41 N/AA — EUR * . . . . . . . . . . . . . . . . . . . . . . . . . . . . . . . . . . . . . . . . . . . . . . . . . € 7 .04 € 6 .90 € 7 .13A2 — EUR * . . . . . . . . . . . . . . . . . . . . . . . . . . . . . . . . . . . . . . . . . . . . . . . . € 25 .05 € 23 .94 € 23 .55AK — EUR * . . . . . . . . . . . . . . . . . . . . . . . . . . . . . . . . . . . . . . . . . . . . . . . . € 11 .72 € 11 .50 € 11 .91AT — EUR * . . . . . . . . . . . . . . . . . . . . . . . . . . . . . . . . . . . . . . . . . . . . . . . . € 7 .03 € 6 .89 € 7 .12B — EUR * . . . . . . . . . . . . . . . . . . . . . . . . . . . . . . . . . . . . . . . . . . . . . . . . . € 7 .04 € 6 .90 € 7 .13B2 — EUR * . . . . . . . . . . . . . . . . . . . . . . . . . . . . . . . . . . . . . . . . . . . . . . . . € 20 .26 € 19 .41 € 19 .24BT — EUR * . . . . . . . . . . . . . . . . . . . . . . . . . . . . . . . . . . . . . . . . . . . . . . . . € 7 .08 € 6 .94 € 7 .18C — EUR * . . . . . . . . . . . . . . . . . . . . . . . . . . . . . . . . . . . . . . . . . . . . . . . . . € 7 .04 € 6 .90 € 7 .13C2 — EUR * . . . . . . . . . . . . . . . . . . . . . . . . . . . . . . . . . . . . . . . . . . . . . . . . € 30 .81 € 29 .49 € 29 .16I — EUR * . . . . . . . . . . . . . . . . . . . . . . . . . . . . . . . . . . . . . . . . . . . . . . . . . . € 7 .04 € 6 .90 € 7 .13I2 — EUR * . . . . . . . . . . . . . . . . . . . . . . . . . . . . . . . . . . . . . . . . . . . . . . . . . € 14 .75 € 14 .06 € 13 .75IT — EUR * . . . . . . . . . . . . . . . . . . . . . . . . . . . . . . . . . . . . . . . . . . . . . . . . . € 11 .46 € 11 .25 € 11 .63S1 — EUR * . . . . . . . . . . . . . . . . . . . . . . . . . . . . . . . . . . . . . . . . . . . . . . . . € 18 .94 € 18 .03 € 17 .60S1D — EUR * . . . . . . . . . . . . . . . . . . . . . . . . . . . . . . . . . . . . . . . . . . . . . . . € 13 .52 € 13 .14 € 13 .39
EuropeanIncomePortfolio
February28,2019 August31,2018 August31,2017 (unaudited)
Net Assets . . . . . . . . . . . . . . . . . . . . . . . . . . . . . . . . . . . . . . . . . . . . . . . . . . . . . . . € 2,319,679,070 € 2,232,949,568 € 2,058,947,444
Class A . . . . . . . . . . . . . . . . . . . . . . . . . . . . . . . . . . . . . . . . . . . . . . . . . . . . . . . . . € 6 .77 € 6 .86 € 7 .14A2 . . . . . . . . . . . . . . . . . . . . . . . . . . . . . . . . . . . . . . . . . . . . . . . . . . . . . . . . € 20 .07 € 19 .96 € 19 .98A2 CHF H . . . . . . . . . . . . . . . . . . . . . . . . . . . . . . . . . . . . . . . . . . . . . . . . . CHF 15 .51 CHF 15 .46 CHF 15 .55A2 SGD H . . . . . . . . . . . . . . . . . . . . . . . . . . . . . . . . . . . . . . . . . . . . . . . . . SGD 16 .77 SGD 16 .51 SGD 16 .26A2 USD H . . . . . . . . . . . . . . . . . . . . . . . . . . . . . . . . . . . . . . . . . . . . . . . . . $ 17 .17 $ 16 .82 $ 16 .43AA . . . . . . . . . . . . . . . . . . . . . . . . . . . . . . . . . . . . . . . . . . . . . . . . . . . . . . . € 12 .89 € 13 .16 € 13 .89AA AUD H . . . . . . . . . . . . . . . . . . . . . . . . . . . . . . . . . . . . . . . . . . . . . . . . . AUD 12 .85 AUD 13 .13 AUD 13 .85AA HKD H . . . . . . . . . . . . . . . . . . . . . . . . . . . . . . . . . . . . . . . . . . . . . . . . HKD 85 .21 HKD 87 .02 HKD 91 .77AA RMB H . . . . . . . . . . . . . . . . . . . . . . . . . . . . . . . . . . . . . . . . . . . . . . . . CNH 85 .19 CNH 87 .06 CNH 91 .86AA SGD H . . . . . . . . . . . . . . . . . . . . . . . . . . . . . . . . . . . . . . . . . . . . . . . . . SGD 12 .76 SGD 13 .03 SGD 13 .74AA USD H . . . . . . . . . . . . . . . . . . . . . . . . . . . . . . . . . . . . . . . . . . . . . . . . . $ 12 .93 $ 13 .19 $ 13 .88AK . . . . . . . . . . . . . . . . . . . . . . . . . . . . . . . . . . . . . . . . . . . . . . . . . . . . . . . € 14 .27 € 14 .47 € 15 .06AR . . . . . . . . . . . . . . . . . . . . . . . . . . . . . . . . . . . . . . . . . . . . . . . . . . . . . . . € 13 .13 € 13 .06 € 13 .80AT . . . . . . . . . . . . . . . . . . . . . . . . . . . . . . . . . . . . . . . . . . . . . . . . . . . . . . . . € 6 .77 € 6 .86 € 7 .14AT AUD H . . . . . . . . . . . . . . . . . . . . . . . . . . . . . . . . . . . . . . . . . . . . . . . . . AUD 14 .71 AUD 14 .92 AUD 15 .51AT SGD H . . . . . . . . . . . . . . . . . . . . . . . . . . . . . . . . . . . . . . . . . . . . . . . . . SGD 13 .75 SGD 13 .94 SGD 14 .50AT USD H . . . . . . . . . . . . . . . . . . . . . . . . . . . . . . . . . . . . . . . . . . . . . . . . . $ 14 .73 $ 14 .92 $ 15 .48B . . . . . . . . . . . . . . . . . . . . . . . . . . . . . . . . . . . . . . . . . . . . . . . . . . . . . . . . . € 6 .77 € 6 .86 € 7 .14B2 . . . . . . . . . . . . . . . . . . . . . . . . . . . . . . . . . . . . . . . . . . . . . . . . . . . . . . . . € 17 .50 € 17 .47 € 17 .61BA . . . . . . . . . . . . . . . . . . . . . . . . . . . . . . . . . . . . . . . . . . . . . . . . . . . . . . . € 12 .41 € 12 .73 € 13 .52BA AUD H . . . . . . . . . . . . . . . . . . . . . . . . . . . . . . . . . . . . . . . . . . . . . . . . . AUD 12 .39 AUD 12 .71 AUD 13 .49BA USD H . . . . . . . . . . . . . . . . . . . . . . . . . . . . . . . . . . . . . . . . . . . . . . . . . $ 12 .46 $ 12 .76 $ 13 .53BT . . . . . . . . . . . . . . . . . . . . . . . . . . . . . . . . . . . . . . . . . . . . . . . . . . . . . . . . € 6 .77 € 6 .86 € 7 .14

AB FCP I
171
EuropeanIncomePortfolio(continued)
February28,2019 August31,2018 August31,2017 (unaudited)
BT AUD H . . . . . . . . . . . . . . . . . . . . . . . . . . . . . . . . . . . . . . . . . . . . . . . . . AUD 14 .75 AUD 14 .96 AUD 15 .56BT USD H . . . . . . . . . . . . . . . . . . . . . . . . . . . . . . . . . . . . . . . . . . . . . . . . . $ 14 .74 $ 14 .92 $ 15 .48C . . . . . . . . . . . . . . . . . . . . . . . . . . . . . . . . . . . . . . . . . . . . . . . . . . . . . . . . . € 6 .77 € 6 .86 € 7 .14C2 . . . . . . . . . . . . . . . . . . . . . . . . . . . . . . . . . . . . . . . . . . . . . . . . . . . . . . . . € 19 .19 € 19 .13 € 19 .23C2 USD H . . . . . . . . . . . . . . . . . . . . . . . . . . . . . . . . . . . . . . . . . . . . . . . . . $ 16 .57 $ 16 .27 $ 15 .96CK . . . . . . . . . . . . . . . . . . . . . . . . . . . . . . . . . . . . . . . . . . . . . . . . . . . . . . . € 14 .25 € 14 .45 € 15 .03CT USD H . . . . . . . . . . . . . . . . . . . . . . . . . . . . . . . . . . . . . . . . . . . . . . . . . $ 13 .59 $ 13 .77 $ 14 .28I . . . . . . . . . . . . . . . . . . . . . . . . . . . . . . . . . . . . . . . . . . . . . . . . . . . . . . . . . € 6 .77 € 6 .86 € 7 .14I2 . . . . . . . . . . . . . . . . . . . . . . . . . . . . . . . . . . . . . . . . . . . . . . . . . . . . . . . . € 13 .27 € 13 .16 € 13 .10I2 AUD H . . . . . . . . . . . . . . . . . . . . . . . . . . . . . . . . . . . . . . . . . . . . . . . . . . AUD 28 .07 AUD 27 .50 AUD 26 .73I2 CHF H . . . . . . . . . . . . . . . . . . . . . . . . . . . . . . . . . . . . . . . . . . . . . . . . . . CHF 15 .82 CHF 15 .73 CHF 15 .75I2 USD H . . . . . . . . . . . . . . . . . . . . . . . . . . . . . . . . . . . . . . . . . . . . . . . . . . $ 24 .11 $ 23 .55 $ 22 .87IA . . . . . . . . . . . . . . . . . . . . . . . . . . . . . . . . . . . . . . . . . . . . . . . . . . . . . . . . € 13 .93 € 14 .19 € 14 .88IA HKD H . . . . . . . . . . . . . . . . . . . . . . . . . . . . . . . . . . . . . . . . . . . . . . . . . HKD 92 .74 HKD 94 .47 HKD 99 .04IA SGD H . . . . . . . . . . . . . . . . . . . . . . . . . . . . . . . . . . . . . . . . . . . . . . . . . . SGD 13 .87 SGD 14 .13 SGD 14 .83IA USD H . . . . . . . . . . . . . . . . . . . . . . . . . . . . . . . . . . . . . . . . . . . . . . . . . . $ 14 .05 $ 14 .30 $ 14 .96IT . . . . . . . . . . . . . . . . . . . . . . . . . . . . . . . . . . . . . . . . . . . . . . . . . . . . . . . . € 14 .31 € 14 .51 € 15 .09IT SGD H . . . . . . . . . . . . . . . . . . . . . . . . . . . . . . . . . . . . . . . . . . . . . . . . . . SGD 14 .26 SGD 14 .46 SGD 15 .04IT USD H . . . . . . . . . . . . . . . . . . . . . . . . . . . . . . . . . . . . . . . . . . . . . . . . . . $ 13 .96 $ 14 .14 $ 14 .69NT USD H . . . . . . . . . . . . . . . . . . . . . . . . . . . . . . . . . . . . . . . . . . . . . . . . . $ 14 .28 $ 14 .46 $ 15 .00S . . . . . . . . . . . . . . . . . . . . . . . . . . . . . . . . . . . . . . . . . . . . . . . . . . . . . . . . . € 106 .39 € 105 .15 € 103 .91S1 . . . . . . . . . . . . . . . . . . . . . . . . . . . . . . . . . . . . . . . . . . . . . . . . . . . . . . . . € 21 .59 € 21 .40 € 21 .25S1 USD H . . . . . . . . . . . . . . . . . . . . . . . . . . . . . . . . . . . . . . . . . . . . . . . . . $ 22 .46 $ 21 .92 $ 21 .23S1D . . . . . . . . . . . . . . . . . . . . . . . . . . . . . . . . . . . . . . . . . . . . . . . . . . . . . . € 14 .17 € 14 .37 € 14 .95SA USD H . . . . . . . . . . . . . . . . . . . . . . . . . . . . . . . . . . . . . . . . . . . . . . . . . $ 93 .10 $ 94 .36 $ 97 .90SHK . . . . . . . . . . . . . . . . . . . . . . . . . . . . . . . . . . . . . . . . . . . . . . . . . . . . . . € 93 .43 € 94 .80 € 98 .70W2 CHF H . . . . . . . . . . . . . . . . . . . . . . . . . . . . . . . . . . . . . . . . . . . . . . . . . CHF 14 .93 CHF 14 .83 N/AA — USD * . . . . . . . . . . . . . . . . . . . . . . . . . . . . . . . . . . . . . . . . . . . . . . . . . $ 7 .70 $ 7 .96 $ 8 .51A2 — USD * . . . . . . . . . . . . . . . . . . . . . . . . . . . . . . . . . . . . . . . . . . . . . . . . $ 22 .82 $ 23 .17 $ 23 .81AT — USD * . . . . . . . . . . . . . . . . . . . . . . . . . . . . . . . . . . . . . . . . . . . . . . . . $ 7 .70 $ 7 .96 $ 8 .51B — USD * . . . . . . . . . . . . . . . . . . . . . . . . . . . . . . . . . . . . . . . . . . . . . . . . . $ 7 .70 $ 7 .96 $ 8 .51B2 — USD * . . . . . . . . . . . . . . . . . . . . . . . . . . . . . . . . . . . . . . . . . . . . . . . . $ 19 .90 $ 20 .28 $ 20 .99BT — USD * . . . . . . . . . . . . . . . . . . . . . . . . . . . . . . . . . . . . . . . . . . . . . . . . $ 7 .70 $ 7 .96 $ 8 .51C — USD * . . . . . . . . . . . . . . . . . . . . . . . . . . . . . . . . . . . . . . . . . . . . . . . . . $ 7 .70 $ 7 .96 $ 8 .51C2 — USD * . . . . . . . . . . . . . . . . . . . . . . . . . . . . . . . . . . . . . . . . . . . . . . . . $ 21 .82 $ 22 .21 $ 22 .92I — USD * . . . . . . . . . . . . . . . . . . . . . . . . . . . . . . . . . . . . . . . . . . . . . . . . . . $ 7 .70 $ 7 .96 $ 8 .51I2 — USD * . . . . . . . . . . . . . . . . . . . . . . . . . . . . . . . . . . . . . . . . . . . . . . . . . $ 15 .09 $ 15 .28 $ 15 .61S — USD * . . . . . . . . . . . . . . . . . . . . . . . . . . . . . . . . . . . . . . . . . . . . . . . . . $ 120 .96 $ 122 .08 $ 123 .85S1 — USD * . . . . . . . . . . . . . . . . . . . . . . . . . . . . . . . . . . . . . . . . . . . . . . . . $ 24 .55 $ 24 .85 $ 25 .33
EmergingMarketsDebtPortfolio
February28,2019 August31,2018 August31,2017 (unaudited)
Net Assets . . . . . . . . . . . . . . . . . . . . . . . . . . . . . . . . . . . . . . . . . . . . . . . . . . . . . . . $ 956,606,644 $ 905,030,520 $ 1,261,839,893
ClassA . . . . . . . . . . . . . . . . . . . . . . . . . . . . . . . . . . . . . . . . . . . . . . . . . . . . . . . . . $ 14 .38 $ 13 .99 $ 16 .10A2 . . . . . . . . . . . . . . . . . . . . . . . . . . . . . . . . . . . . . . . . . . . . . . . . . . . . . . . . $ 31 .29 $ 29 .55 $ 32 .08A2 CHF H . . . . . . . . . . . . . . . . . . . . . . . . . . . . . . . . . . . . . . . . . . . . . . . . . CHF 15 .11 CHF 14 .52 CHF 16 .26A2 EUR H . . . . . . . . . . . . . . . . . . . . . . . . . . . . . . . . . . . . . . . . . . . . . . . . . € 20 .33 € 19 .50 € 21 .76

AB FCP I
172
StatiStical information (continued)
EmergingMarketsDebtPortfolio(continued)
February28,2019 August31,2018 August31,2017 (unaudited)
A2 SGD H . . . . . . . . . . . . . . . . . . . . . . . . . . . . . . . . . . . . . . . . . . . . . . . . . SGD 19 .94 SGD 18 .92 SGD 20 .72AA . . . . . . . . . . . . . . . . . . . . . . . . . . . . . . . . . . . . . . . . . . . . . . . . . . . . . . . $ 12 .50 $ 12 .24 $ 14 .32AA AUD H . . . . . . . . . . . . . . . . . . . . . . . . . . . . . . . . . . . . . . . . . . . . . . . . . AUD 12 .26 AUD 12 .04 AUD 14 .13AA CAD H . . . . . . . . . . . . . . . . . . . . . . . . . . . . . . . . . . . . . . . . . . . . . . . . . CAD 11 .79 CAD 11 .58 CAD 13 .57AA EUR H . . . . . . . . . . . . . . . . . . . . . . . . . . . . . . . . . . . . . . . . . . . . . . . . . € 11 .87 € 11 .64 € 13 .68AA GBP H . . . . . . . . . . . . . . . . . . . . . . . . . . . . . . . . . . . . . . . . . . . . . . . . . £ 11 .85 £ 11 .64 £ 13 .68AA NZD H . . . . . . . . . . . . . . . . . . . . . . . . . . . . . . . . . . . . . . . . . . . . . . . . . NZD 11 .84 NZD 11 .63 NZD 13 .65AA RMB H . . . . . . . . . . . . . . . . . . . . . . . . . . . . . . . . . . . . . . . . . . . . . . . . CNH 88 .08 CNH 86 .38 CNH 101 .50AA SGD H . . . . . . . . . . . . . . . . . . . . . . . . . . . . . . . . . . . . . . . . . . . . . . . . . SGD 12 .30 SGD 12 .05 SGD 14 .14AA ZAR H . . . . . . . . . . . . . . . . . . . . . . . . . . . . . . . . . . . . . . . . . . . . . . . . . R 82 .10 R 80 .71 R 94 .67AR EUR . . . . . . . . . . . . . . . . . . . . . . . . . . . . . . . . . . . . . . . . . . . . . . . . . . . € 13 .23 € 12 .24 € 14 .02AT . . . . . . . . . . . . . . . . . . . . . . . . . . . . . . . . . . . . . . . . . . . . . . . . . . . . . . . . $ 14 .44 $ 14 .04 $ 16 .17AT AUD H . . . . . . . . . . . . . . . . . . . . . . . . . . . . . . . . . . . . . . . . . . . . . . . . . AUD 13 .27 AUD 12 .93 AUD 14 .95AT CAD H . . . . . . . . . . . . . . . . . . . . . . . . . . . . . . . . . . . . . . . . . . . . . . . . . CAD 11 .90 CAD 11 .60 CAD 13 .40AT EUR H . . . . . . . . . . . . . . . . . . . . . . . . . . . . . . . . . . . . . . . . . . . . . . . . . € 13 .38 € 13 .04 € 15 .08AT GBP H . . . . . . . . . . . . . . . . . . . . . . . . . . . . . . . . . . . . . . . . . . . . . . . . . £ 12 .03 £ 11 .73 £ 13 .57AT NZD H . . . . . . . . . . . . . . . . . . . . . . . . . . . . . . . . . . . . . . . . . . . . . . . . . NZD 11 .76 NZD 11 .47 NZD 13 .25AT RMB H . . . . . . . . . . . . . . . . . . . . . . . . . . . . . . . . . . . . . . . . . . . . . . . . . CNH 87 .90 CNH 85 .63 CNH 99 .16AT SGD H . . . . . . . . . . . . . . . . . . . . . . . . . . . . . . . . . . . . . . . . . . . . . . . . . SGD 12 .83 SGD 12 .48 SGD 14 .42B . . . . . . . . . . . . . . . . . . . . . . . . . . . . . . . . . . . . . . . . . . . . . . . . . . . . . . . . . $ 14 .38 $ 13 .99 $ 16 .10B2 . . . . . . . . . . . . . . . . . . . . . . . . . . . . . . . . . . . . . . . . . . . . . . . . . . . . . . . . $ 27 .49 $ 26 .09 $ 28 .61BA . . . . . . . . . . . . . . . . . . . . . . . . . . . . . . . . . . . . . . . . . . . . . . . . . . . . . . . $ 11 .84 $ 11 .66 $ 13 .78BA AUD H . . . . . . . . . . . . . . . . . . . . . . . . . . . . . . . . . . . . . . . . . . . . . . . . . AUD 11 .61 AUD 11 .45 AUD 13 .59BA ZAR H . . . . . . . . . . . . . . . . . . . . . . . . . . . . . . . . . . . . . . . . . . . . . . . . . R 77 .36 R 76 .50 R 90 .77BT . . . . . . . . . . . . . . . . . . . . . . . . . . . . . . . . . . . . . . . . . . . . . . . . . . . . . . . . $ 14 .40 $ 14 .00 $ 16 .13BT AUD H . . . . . . . . . . . . . . . . . . . . . . . . . . . . . . . . . . . . . . . . . . . . . . . . . AUD 13 .26 AUD 12 .91 AUD 14 .93BT CAD H . . . . . . . . . . . . . . . . . . . . . . . . . . . . . . . . . . . . . . . . . . . . . . . . . CAD 11 .90 CAD 11 .60 CAD 13 .39BT EUR H . . . . . . . . . . . . . . . . . . . . . . . . . . . . . . . . . . . . . . . . . . . . . . . . . € 13 .40 € 13 .05 € 15 .11BT GBP H . . . . . . . . . . . . . . . . . . . . . . . . . . . . . . . . . . . . . . . . . . . . . . . . . £ 12 .00 £ 11 .70 £ 13 .54BT NZD H . . . . . . . . . . . . . . . . . . . . . . . . . . . . . . . . . . . . . . . . . . . . . . . . . NZD 11 .83 NZD 11 .53 NZD 13 .32C . . . . . . . . . . . . . . . . . . . . . . . . . . . . . . . . . . . . . . . . . . . . . . . . . . . . . . . . . $ 14 .38 $ 13 .99 $ 16 .10C2 . . . . . . . . . . . . . . . . . . . . . . . . . . . . . . . . . . . . . . . . . . . . . . . . . . . . . . . . $ 29 .49 $ 27 .91 $ 30 .45C2 EUR H . . . . . . . . . . . . . . . . . . . . . . . . . . . . . . . . . . . . . . . . . . . . . . . . . € 19 .62 € 18 .86 € 21 .13CT . . . . . . . . . . . . . . . . . . . . . . . . . . . . . . . . . . . . . . . . . . . . . . . . . . . . . . . . $ 12 .22 $ 11 .88 $ 13 .68I . . . . . . . . . . . . . . . . . . . . . . . . . . . . . . . . . . . . . . . . . . . . . . . . . . . . . . . . . $ 14 .38 $ 13 .99 $ 16 .10I2 . . . . . . . . . . . . . . . . . . . . . . . . . . . . . . . . . . . . . . . . . . . . . . . . . . . . . . . . $ 33 .56 $ 31 .61 $ 34 .14I2 CHF H . . . . . . . . . . . . . . . . . . . . . . . . . . . . . . . . . . . . . . . . . . . . . . . . . . CHF 15 .63 CHF 14 .98 CHF 16 .68I2 EUR H . . . . . . . . . . . . . . . . . . . . . . . . . . . . . . . . . . . . . . . . . . . . . . . . . . € 21 .42 € 20 .49 € 22 .75IT . . . . . . . . . . . . . . . . . . . . . . . . . . . . . . . . . . . . . . . . . . . . . . . . . . . . . . . . $ 12 .21 $ 11 .87 $ 13 .66IT AUD H . . . . . . . . . . . . . . . . . . . . . . . . . . . . . . . . . . . . . . . . . . . . . . . . . . AUD 11 .92 AUD 11 .61 AUD 13 .41IT EUR H . . . . . . . . . . . . . . . . . . . . . . . . . . . . . . . . . . . . . . . . . . . . . . . . . . € 12 .81 € 12 .48 € 14 .43IT SGD H . . . . . . . . . . . . . . . . . . . . . . . . . . . . . . . . . . . . . . . . . . . . . . . . . . SGD 12 .01 SGD 11 .69 SGD 13 .49N2 . . . . . . . . . . . . . . . . . . . . . . . . . . . . . . . . . . . . . . . . . . . . . . . . . . . . . . . . $ 16 .38 $ 15 .51 $ 16 .93NT . . . . . . . . . . . . . . . . . . . . . . . . . . . . . . . . . . . . . . . . . . . . . . . . . . . . . . . $ 11 .86 $ 11 .54 $ 13 .29S . . . . . . . . . . . . . . . . . . . . . . . . . . . . . . . . . . . . . . . . . . . . . . . . . . . . . . . . . $ 32 .54 $ 30 .53 $ 32 .73S EUR H . . . . . . . . . . . . . . . . . . . . . . . . . . . . . . . . . . . . . . . . . . . . . . . . . . € 21 .63 € 20 .61 € 22 .70S GBP H . . . . . . . . . . . . . . . . . . . . . . . . . . . . . . . . . . . . . . . . . . . . . . . . . . . £ 22 .67 £ 21 .50 £ 23 .45S1 2 . . . . . . . . . . . . . . . . . . . . . . . . . . . . . . . . . . . . . . . . . . . . . . . . . . . . . . $ 31 .04 $ 29 .20 $ 31 .48S1 EUR H . . . . . . . . . . . . . . . . . . . . . . . . . . . . . . . . . . . . . . . . . . . . . . . . . € 20 .60 € 19 .68 € 21 .79S1 GBP H . . . . . . . . . . . . . . . . . . . . . . . . . . . . . . . . . . . . . . . . . . . . . . . . . . £ 21 .61 £ 20 .55 £ 22 .53

AB FCP I
173
EmergingMarketsDebtPortfolio(continued)
February28,2019 August31,2018 August31,2017 (unaudited)
SA . . . . . . . . . . . . . . . . . . . . . . . . . . . . . . . . . . . . . . . . . . . . . . . . . . . . . . . . $ 88 .82 $ 86 .43 $ 99 .63A — EUR * . . . . . . . . . . . . . . . . . . . . . . . . . . . . . . . . . . . . . . . . . . . . . . . . . € 12 .65 € 12 .05 € 13 .51A2 — EUR * . . . . . . . . . . . . . . . . . . . . . . . . . . . . . . . . . . . . . . . . . . . . . . . . € 27 .52 € 25 .45 € 26 .92AT — EUR * . . . . . . . . . . . . . . . . . . . . . . . . . . . . . . . . . . . . . . . . . . . . . . . . € 12 .70 € 12 .09 € 13 .57B — EUR * . . . . . . . . . . . . . . . . . . . . . . . . . . . . . . . . . . . . . . . . . . . . . . . . . € 12 .65 € 12 .05 € 13 .51B2 — EUR * . . . . . . . . . . . . . . . . . . . . . . . . . . . . . . . . . . . . . . . . . . . . . . . . € 24 .18 € 22 .47 € 24 .00BT — EUR * . . . . . . . . . . . . . . . . . . . . . . . . . . . . . . . . . . . . . . . . . . . . . . . . € 12 .67 € 12 .06 € 13 .53C — EUR * . . . . . . . . . . . . . . . . . . . . . . . . . . . . . . . . . . . . . . . . . . . . . . . . . € 12 .65 € 12 .05 € 13 .51C2 — EUR * . . . . . . . . . . . . . . . . . . . . . . . . . . . . . . . . . . . . . . . . . . . . . . . . € 25 .94 € 24 .04 € 25 .55I — EUR * . . . . . . . . . . . . . . . . . . . . . . . . . . . . . . . . . . . . . . . . . . . . . . . . . . € 12 .65 € 12 .05 € 13 .51I2 — EUR * . . . . . . . . . . . . . . . . . . . . . . . . . . . . . . . . . . . . . . . . . . . . . . . . . € 29 .52 € 27 .23 € 28 .64S — EUR * . . . . . . . . . . . . . . . . . . . . . . . . . . . . . . . . . . . . . . . . . . . . . . . . . € 28 .62 € 26 .30 € 27 .46S12 — EUR * . . . . . . . . . . . . . . . . . . . . . . . . . . . . . . . . . . . . . . . . . . . . . . . € 27 .30 € 25 .15 € 26 .41
MortgageIncomePortfolio
February28,2019 August31,2018 August31,2017 (unaudited)
Net Assets . . . . . . . . . . . . . . . . . . . . . . . . . . . . . . . . . . . . . . . . . . . . . . . . . . . . . . . $ 2,045,161,108 $ 1,992,732,413 $ 658,162,455
ClassA . . . . . . . . . . . . . . . . . . . . . . . . . . . . . . . . . . . . . . . . . . . . . . . . . . . . . . . . . $ 13 .73 $ 13 .98 $ 14 .25A2 . . . . . . . . . . . . . . . . . . . . . . . . . . . . . . . . . . . . . . . . . . . . . . . . . . . . . . . . $ 17 .83 $ 17 .65 $ 17 .03A2X . . . . . . . . . . . . . . . . . . . . . . . . . . . . . . . . . . . . . . . . . . . . . . . . . . . . . . $ 12 .75 $ 12 .62 $ 12 .16AA . . . . . . . . . . . . . . . . . . . . . . . . . . . . . . . . . . . . . . . . . . . . . . . . . . . . . . . $ 12 .74 $ 13 .06 $ 13 .50AA AUD H . . . . . . . . . . . . . . . . . . . . . . . . . . . . . . . . . . . . . . . . . . . . . . . . . AUD 12 .63 AUD 12 .98 AUD 13 .44AA RMB H . . . . . . . . . . . . . . . . . . . . . . . . . . . . . . . . . . . . . . . . . . . . . . . . CNH 87 .41 CNH 89 .73 CNH 93 .07AA SGD H . . . . . . . . . . . . . . . . . . . . . . . . . . . . . . . . . . . . . . . . . . . . . . . . . SGD 12 .68 SGD 13 .00 SGD 13 .47AA ZAR H . . . . . . . . . . . . . . . . . . . . . . . . . . . . . . . . . . . . . . . . . . . . . . . . . R 85 .55 R 87 .80 R 90 .65AR EUR H . . . . . . . . . . . . . . . . . . . . . . . . . . . . . . . . . . . . . . . . . . . . . . . . . € 13 .32 € 13 .39 € 13 .85AT . . . . . . . . . . . . . . . . . . . . . . . . . . . . . . . . . . . . . . . . . . . . . . . . . . . . . . . . $ 13 .76 $ 14 .01 $ 14 .27AT AUD H . . . . . . . . . . . . . . . . . . . . . . . . . . . . . . . . . . . . . . . . . . . . . . . . . AUD 13 .69 AUD 13 .97 AUD 14 .25AT GBP H . . . . . . . . . . . . . . . . . . . . . . . . . . . . . . . . . . . . . . . . . . . . . . . . . £ 14 .66 £ 14 .95 N/AAT SGD H . . . . . . . . . . . . . . . . . . . . . . . . . . . . . . . . . . . . . . . . . . . . . . . . . SGD 13 .68 SGD 13 .93 SGD 14 .23ATX (7) . . . . . . . . . . . . . . . . . . . . . . . . . . . . . . . . . . . . . . . . . . . . . . . . . . . N/A $ 6 .78 $ 6 .91AX . . . . . . . . . . . . . . . . . . . . . . . . . . . . . . . . . . . . . . . . . . . . . . . . . . . . . . . $ 6 .66 $ 6 .78 $ 6 .91B2X . . . . . . . . . . . . . . . . . . . . . . . . . . . . . . . . . . . . . . . . . . . . . . . . . . . . . . $ 12 .19 $ 12 .09 $ 11 .71BA . . . . . . . . . . . . . . . . . . . . . . . . . . . . . . . . . . . . . . . . . . . . . . . . . . . . . . . $ 12 .06 $ 12 .43 $ 12 .99BA AUD H . . . . . . . . . . . . . . . . . . . . . . . . . . . . . . . . . . . . . . . . . . . . . . . . . AUD 11 .94 AUD 12 .34 AUD 12 .92BA ZAR H . . . . . . . . . . . . . . . . . . . . . . . . . . . . . . . . . . . . . . . . . . . . . . . . . R 81 .00 R 83 .55 R 87 .12BX . . . . . . . . . . . . . . . . . . . . . . . . . . . . . . . . . . . . . . . . . . . . . . . . . . . . . . . $ 6 .66 $ 6 .78 $ 6 .91C . . . . . . . . . . . . . . . . . . . . . . . . . . . . . . . . . . . . . . . . . . . . . . . . . . . . . . . . . $ 13 .74 $ 13 .99 $ 14 .25C2 . . . . . . . . . . . . . . . . . . . . . . . . . . . . . . . . . . . . . . . . . . . . . . . . . . . . . . . . $ 17 .40 $ 17 .27 $ 16 .74C2X . . . . . . . . . . . . . . . . . . . . . . . . . . . . . . . . . . . . . . . . . . . . . . . . . . . . . . $ 17 .21 $ 17 .08 $ 16 .53CX . . . . . . . . . . . . . . . . . . . . . . . . . . . . . . . . . . . . . . . . . . . . . . . . . . . . . . . $ 6 .66 $ 6 .78 $ 6 .91I . . . . . . . . . . . . . . . . . . . . . . . . . . . . . . . . . . . . . . . . . . . . . . . . . . . . . . . . . $ 13 .75 $ 14 .00 $ 14 .26I2 . . . . . . . . . . . . . . . . . . . . . . . . . . . . . . . . . . . . . . . . . . . . . . . . . . . . . . . . $ 18 .32 $ 18 .09 $ 17 .36I2 EUR H . . . . . . . . . . . . . . . . . . . . . . . . . . . . . . . . . . . . . . . . . . . . . . . . . . € 15 .09 € 15 .13 N/AI2X . . . . . . . . . . . . . . . . . . . . . . . . . . . . . . . . . . . . . . . . . . . . . . . . . . . . . . . $ 11 .25 $ 11 .11 $ 10 .65IT EUR H . . . . . . . . . . . . . . . . . . . . . . . . . . . . . . . . . . . . . . . . . . . . . . . . . . € 14 .67 € 14 .95 N/AIX . . . . . . . . . . . . . . . . . . . . . . . . . . . . . . . . . . . . . . . . . . . . . . . . . . . . . . . . $ 6 .66 $ 6 .78 $ 6 .91N2 . . . . . . . . . . . . . . . . . . . . . . . . . . . . . . . . . . . . . . . . . . . . . . . . . . . . . . . . $ 15 .20 $ 15 .09 N/A
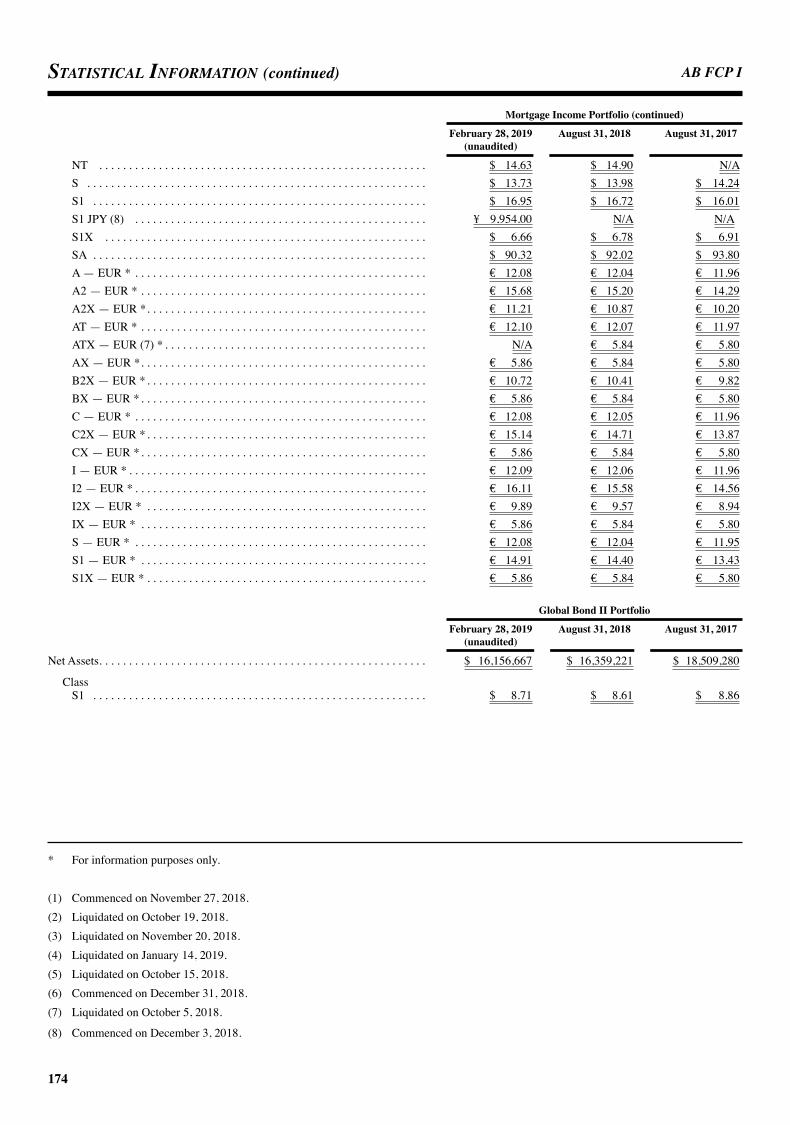
AB FCP I
174
StatiStical information (continued)
MortgageIncomePortfolio(continued)
February28,2019 August31,2018 August31,2017 (unaudited)
NT . . . . . . . . . . . . . . . . . . . . . . . . . . . . . . . . . . . . . . . . . . . . . . . . . . . . . . . $ 14 .63 $ 14 .90 N/AS . . . . . . . . . . . . . . . . . . . . . . . . . . . . . . . . . . . . . . . . . . . . . . . . . . . . . . . . . $ 13 .73 $ 13 .98 $ 14 .24S1 . . . . . . . . . . . . . . . . . . . . . . . . . . . . . . . . . . . . . . . . . . . . . . . . . . . . . . . . $ 16 .95 $ 16 .72 $ 16 .01S1 JPY (8) . . . . . . . . . . . . . . . . . . . . . . . . . . . . . . . . . . . . . . . . . . . . . . . . . ¥ 9,954 .00 N/A N/AS1X . . . . . . . . . . . . . . . . . . . . . . . . . . . . . . . . . . . . . . . . . . . . . . . . . . . . . . $ 6 .66 $ 6 .78 $ 6 .91SA . . . . . . . . . . . . . . . . . . . . . . . . . . . . . . . . . . . . . . . . . . . . . . . . . . . . . . . . $ 90 .32 $ 92 .02 $ 93 .80A — EUR * . . . . . . . . . . . . . . . . . . . . . . . . . . . . . . . . . . . . . . . . . . . . . . . . . € 12 .08 € 12 .04 € 11 .96A2 — EUR * . . . . . . . . . . . . . . . . . . . . . . . . . . . . . . . . . . . . . . . . . . . . . . . . € 15 .68 € 15 .20 € 14 .29A2X — EUR * . . . . . . . . . . . . . . . . . . . . . . . . . . . . . . . . . . . . . . . . . . . . . . . € 11 .21 € 10 .87 € 10 .20AT — EUR * . . . . . . . . . . . . . . . . . . . . . . . . . . . . . . . . . . . . . . . . . . . . . . . . € 12 .10 € 12 .07 € 11 .97ATX — EUR (7) * . . . . . . . . . . . . . . . . . . . . . . . . . . . . . . . . . . . . . . . . . . . . N/A € 5 .84 € 5 .80AX — EUR * . . . . . . . . . . . . . . . . . . . . . . . . . . . . . . . . . . . . . . . . . . . . . . . . € 5 .86 € 5 .84 € 5 .80B2X — EUR * . . . . . . . . . . . . . . . . . . . . . . . . . . . . . . . . . . . . . . . . . . . . . . . € 10 .72 € 10 .41 € 9 .82BX — EUR * . . . . . . . . . . . . . . . . . . . . . . . . . . . . . . . . . . . . . . . . . . . . . . . . € 5 .86 € 5 .84 € 5 .80C — EUR * . . . . . . . . . . . . . . . . . . . . . . . . . . . . . . . . . . . . . . . . . . . . . . . . . € 12 .08 € 12 .05 € 11 .96C2X — EUR * . . . . . . . . . . . . . . . . . . . . . . . . . . . . . . . . . . . . . . . . . . . . . . . € 15 .14 € 14 .71 € 13 .87CX — EUR * . . . . . . . . . . . . . . . . . . . . . . . . . . . . . . . . . . . . . . . . . . . . . . . . € 5 .86 € 5 .84 € 5 .80I — EUR * . . . . . . . . . . . . . . . . . . . . . . . . . . . . . . . . . . . . . . . . . . . . . . . . . . € 12 .09 € 12 .06 € 11 .96I2 — EUR * . . . . . . . . . . . . . . . . . . . . . . . . . . . . . . . . . . . . . . . . . . . . . . . . . € 16 .11 € 15 .58 € 14 .56I2X — EUR * . . . . . . . . . . . . . . . . . . . . . . . . . . . . . . . . . . . . . . . . . . . . . . . € 9 .89 € 9 .57 € 8 .94IX — EUR * . . . . . . . . . . . . . . . . . . . . . . . . . . . . . . . . . . . . . . . . . . . . . . . . € 5 .86 € 5 .84 € 5 .80S — EUR * . . . . . . . . . . . . . . . . . . . . . . . . . . . . . . . . . . . . . . . . . . . . . . . . . € 12 .08 € 12 .04 € 11 .95S1 — EUR * . . . . . . . . . . . . . . . . . . . . . . . . . . . . . . . . . . . . . . . . . . . . . . . . € 14 .91 € 14 .40 € 13 .43S1X — EUR * . . . . . . . . . . . . . . . . . . . . . . . . . . . . . . . . . . . . . . . . . . . . . . . € 5 .86 € 5 .84 € 5 .80
GlobalBondIIPortfolio
February28,2019 August31,2018 August31,2017 (unaudited)
Net Assets . . . . . . . . . . . . . . . . . . . . . . . . . . . . . . . . . . . . . . . . . . . . . . . . . . . . . . . $ 16,156,667 $ 16,359,221 $ 18,509,280
ClassS1 . . . . . . . . . . . . . . . . . . . . . . . . . . . . . . . . . . . . . . . . . . . . . . . . . . . . . . . . $ 8 .71 $ 8 .61 $ 8 .86
* For information purposes only .
(1) Commenced on November 27, 2018 .(2) Liquidated on October 19, 2018 .(3) Liquidated on November 20, 2018 .(4) Liquidated on January 14, 2019 .(5) Liquidated on October 15, 2018 .(6) Commenced on December 31, 2018 .(7) Liquidated on October 5, 2018 .
(8) Commenced on December 3, 2018 .

AB FCP I
175
AB FCP I– Commencement of Operations Share Classes Seeded
Dynamic Diversified Portfolio . . . . . . . . . . . . . . . . November 2, 2004 A, A EUR H, AX, B, BX, C, C EUR H, CX, I, I EUR H, IX & S1 EUR HGlobal Equity Blend Portfolio . . . . . . . . . . . . . . . September 1, 2003 A, A EUR H, B, C, I, S & S1Global Value Portfolio . . . . . . . . . . . . . . . . . . . . . . June 1, 2006 A, A SGD H, AD, AD AUD H, AD CAD H, AD EUR H, AD GBP H, AD SGD H, AD ZAR H, B, BD, BD AUD H, BD EUR H, BD ZAR H, C, I, S, S GBP H, S1, S1A GB & SDEmerging Markets Growth Portfolio . . . . . . . . . . . October 30, 1992 A, A AUD H, AD, A SGD H, B, C, C AUD H, ED, I, I AUD H, I CHF H, N, S & S1Sustainable US Thematic Portfolio . . . . . . . . . . . . June 1, 2006 A, A AUD H, A CAD H, A EUR H, A GBP H, A SGD H, AN, B, B CAD H, C, C EUR H, I, I EUR H, IN, S, S1 & S1 JPY HAsia Ex-Japan Equity Portfolio . . . . . . . . . . . . . . November 30, 2009 A, A AUD H, A SGD H, AD, AD AUD H, AD CAD H, AD EUR H, AD GBP H, AD NZD H, AD RMB H, AD SGD H, AD ZAR H, AY JPY, B, BD, BD AUD H, BD CAD H, BD GBP H, BD NZD H, BD ZAR H, BY JPY, C, C AUD H, ED, I, I AUD H, I GBP, ID, ID AUD H, S, S1 & SDJapan Strategic Value Portfolio . . . . . . . . . . . . . . . December 15, 2005 2, A, A AUD H, A CZK H, A EUR H, A NZD H, A SGD H, A USD H, AD, AD AUD H, AD NZD H, AD USD H, AD ZAR H, B, BD, BD AUD H, BD USD H, BD ZAR H, C, C EUR H, I, I EUR H, I USD H, S EUR H, S1, S1 USD H & SDChina Opportunity Portfolio . . . . . . . . . . . . . . . . . February 1, 2007 A, AD, AD AUD H, AD CAD H, AD EUR H, AD GBP H, AD NZD H, AD RMB H, AD SGD H, AD ZAR H, B, BD, BD AUD H, BD EUR H, BD NZD H, BD ZAR H, C, I, S & S1Global Bond Portfolio . . . . . . . . . . . . . . . . . . . . . . September 16, 1996 A, A2, A2 EUR H, A2 SGD H, AA, AA AUD H, AA CAD H, AA GBP H, AA NZD H, AA SGD H, AJ, AR EUR H, AT, AT AUD H, AT CAD H, AT EUR H, AT GBP H, AT NZD H, AT SGD H, AX, B, B2, BA, BA AUD H, BT, BT AUD H, BT CAD H, BT GBP H, BX, C, C2, C2 EUR H, I, I2, I2 AUD H, I2 EUR H, IT, IT AUD H, N2, NT, S EUR H, S SGD H, S1 2, S1 EUR H & SA
NOTE A: General InformationAB FCP I (the “Fund”) is a mutual investment fund (fonds commun de placement) organized under the laws of the Grand Duchy of Luxembourg and registered under Part I of the Law of December 17, 2010 on undertakings for collective investment, as amended (the “Law of 2010”). The Fund is managed in the interest of its co-owners (the “Shareholders”) by AllianceBernstein Luxembourg S.àr.l. (the “Management Company”), a company organized under the laws of the Grand Duchy of Luxembourg and having its registered office in Luxembourg. The Fund qualifies as an Undertaking for Collective Investments in Transferable Securities (“UCITS”) within the meaning of Article 1(2) of the EC Directive 2009/65 of July 13, 2009, as amended.
The Fund comprises separate pools of assets currently consisting of 15 active portfolios (each, a “Portfolio,” and, collectively, the “Portfolios”). Each Class of Shares represents an interest in each relevant Portfolio’s investment securities and other net assets. All Shares of a Class have equal rights to distributions and redemptions.
Effective October 31, 2018, the portfolio AB FCP I – US Thematic Research Portfolio was renamed AB FCP I – Sustainable US Thematic Portfolio.
The following table lists each Portfolio’s commencement of operations as well as Share Classes seeded as of February 28, 2019:
Notes to FiNaNcial statemeNtsFor the period ended February 28, 2019

AB FCP I
176
Notes to FiNaNcial statemeNts (continued)
AB FCP I– Commencement of Operations Share Classes Seeded
Global High Yield Portfolio . . . . . . . . . . . . . . . . . . September 22, 1997 A, A2, A2 CHF H, A2 EUR H, A2 SGD H, AA, AA AUD H, AA CAD H, AA EUR H, AA GBP H, AA NZD H, AA RMB H, AA SGD H, AA ZAR H, AK, AK EUR H, AR EUR H, AT, AT AUD H, AT CAD H, AT EUR H, AT GBP H, AT NZD H, AT RMB H, AT SGD H, B, B2, B2 EUR H, BA, BA AUD H, BA ZAR H, BT, BT AUD H, BT CAD H, BT EUR H, BT GBP H, BT NZD H, C, C2, C2 EUR H, CK, CK EUR H, CT, EA, I, I2, I2 AUD H, I2 CHF H, I2 EUR H, I2 SGD H, IA AUD H, IQD, IT, IT AUD H, IT CAD H, IT EUR H, IT GBP H, IT NZD H, IT RMB H, J, N2, NT, S EUR H, S1, S1D, SA, SQ, SHK, SK, W2, W2 CHF H, WT, WT AUD H & WT EUR HAmerican Income Portfolio . . . . . . . . . . . . . . . . . . July 1, 1993 A, A2, A2 CHF H, A2 DUR PH, A2 EUR H, A2 SGD H, AA, AA AUD H, AA CAD H, AA DUR PH, AA EUR H, AA GBP H, AA NZD H, AA RMB H, AA SGD H, AA ZAR H, AK, AK EUR H, AR EUR, AR EUR H, AT, AT AUD H, AT CAD H, AT DUR PH, AT EUR H, AT GBP H, AT NZD H, AT RMB H, AT SGD H, B, B2, BA, BA AUD H, BA ZAR H, BT, BT AUD H, BT CAD H, BT EUR H, BT GBP H, BT NZD H, C, C2, C2 DUR PH, C2 EUR H, CT, I, I2, I2 AUD H, I2 CHF H, I2 DUR PH, I2 EUR H, I2 SGD H, IA, IA AUD H, IT, IT AUD H, IT CAD H, IT EUR H, IT GBP H, IT JPY, IT JPY H, IT NZD H, IT SGD H, J, N2, NT, S, S1, S1D, SA, SHK, W, W2, W2 CHF H, W2 EUR H, WT, WT AUD H & WT SGD HEuropean Income Portfolio . . . . . . . . . . . . . . . . . . February 26, 1999 A, A2, A2 CHF H, A2 SGD H, A2 USD H, AA, AA AUD H, AA HKD H, AA RMB H, AA SGD H, AA USD H, AK, AR, AT, AT AUD H, AT SGD H, AT USD H, B, B2, BA, BA AUD H, BA USD H, BT, BT AUD H, BT USD H, C, C2, C2 USD H, CK, CT USD H, I, I2, I2 AUD H, I2 CHF H, I2 USD H, IA, IA HKD H, IA SGD H, IA USD H, IT, IT SGD H, IT USD H, NT USD H, S, S1, S1 USD H, S1D, SA USD H, SHK & W2 CHF HEmerging Markets Debt Portfolio . . . . . . . . . . . . . March 23, 2006 A, A2, A2 CHF H, A2 EUR H, A2 SGD H, AA, AA AUD H, AA CAD H, AA EUR H, AA GBP H, AA NZD H, AA RMB H, AA SGD H, AA ZAR H, AR EUR, AT, AT AUD H, AT CAD H, AT EUR H, AT GBP H, AT NZD H, AT RMB H, AT SGD H, B, B2, BA, BA AUD H, BA ZAR H, BT, BT AUD H, BT CAD H, BT EUR H, BT GBP H, BT NZD H, C, C2, C2 EUR H, CT, I, I2, I2 CHF H, I2 EUR H, IT, IT AUD H, IT EUR H, IT SGD H, N2, NT, S, S EUR H, S GBP H, S1 2, S1 EUR H, S1 GBP H & SA

AB FCP I
177
AB FCP I– Commencement of Operations Share Classes Seeded
Mortgage Income Portfolio . . . . . . . . . . . . . . . . . . September 27, 1994 A, A2, A2X, AA, AA AUD H, AA RMB H, AA SGD H, AA ZAR H, AR EUR H, AT, AT AUD H, AT GBP H, AT SGD H, AX, B2X, BA, BA AUD H, BA ZAR H, BX, C, C2, C2X, CX, I, I2, I2 EUR H, I2X, IT EUR H, IX, N2, NT, S, S1, S1 JPY, S1X & SAGlobal Bond II Portfolio . . . . . . . . . . . . . . . . . . . . December 17, 2012 S1
NOTE B: Significant Accounting PoliciesThe Financial Statements have been prepared in accordance with Luxembourg legal and regulatory requirements. The following is a summary of significant accounting policies followed by the Portfolios.
1. Valuation1.1 Investments in SecuritiesSecurities listed on a stock exchange or traded on any other regulated market are valued at the last available price on such exchange or market or, if no such price is available, at the mean of the closing bid and asked price quoted on such day. If a security is listed on several stock exchanges or markets, the last available price on the stock exchange or market which constitutes the main market for such security is used.
Securities are valued at their current market value determined on the basis of market quotations or, if market quotations are not readily available or are deemed unreliable, at “fair value” as determined in accordance with procedures established by, and under the general supervision of, the Management Company’s board of managers (the “Board of Managers”). Fair valuation procedures are designed to adjust closing market prices of Portfolio securities to reflect what is believed to be the fair value of those securities at the Portfolio’s Valuation Point.
When fair valuation procedures are employed with respect to a particular Portfolio security, various objective and subjective factors may be considered, including, among other things, developments affecting the security or involving an entire market since the security’s latest reported price, current valuations of relevant stock indices or pronouncements of certain governmental authorities. Fair value prices based on third party vendor modeling tools may be utilized to the extent available. Therefore, when fair valuation procedures are employed, the prices of individual Portfolio securities utilized to calculate the Portfolio’s Net Asset Value (“NAV”) may differ from quoted or published prices for the same securities. Currently, fair value adjustments are only applicable to certain equity securities and futures contracts.
Accordingly, as may also be the case with a previously reported stock exchange price, the price of any Portfolio security determined utilizing fair value pricing procedures may be materially different from the price to be realized upon the sale of such security.
For Portfolio securities primarily traded on U.S. exchanges, it is expected that fair value pricing procedures are employed only under very limited circumstances such as, for example, the early closing of an exchange on which a particular security is traded or the suspension of trading in a particular security. However, it is anticipated that fair value pricing procedures
will be utilized frequently for securities traded on non-U.S. exchanges or other markets, particularly European and Asian markets excluding India, because, among other reasons, these markets close well before the Portfolio’s Valuation Point. Between the close of these markets and the relevant Portfolio’s Valuation Point, significant events including broad market moves may occur. In particular events in the U.S. market on a trading day after the close of these mother markets may affect the value of the Portfolio’s securities. Japan Strategic Value Portfolio has adopted a policy to only fair value securities when deemed relevant based on the performance of a benchmark and relative capstock flows.
Fixed income securities (i), securities not listed on any stock exchange or traded on any regulated market (ii), and securities, trading of which on a stock exchange or a regulated market is thin (iii), are valued at the most recent bid price provided by the principal market makers. If there is no such market price, or if such market price is not representative of a security’s fair market value, then the security is valued in a manner determined to reflect its fair value in accordance with procedures established by, and under the general supervision of, the Management Company’s Board of Managers.
U.S. Government securities and any other debt instruments having 60 days or less remaining until maturity are generally valued at market by an independent pricing vendor, if a market price is available. If a market price is not available, the securities are valued at amortized cost. This methodology is commonly used for short-term securities that have an original maturity of 60 days or less, as well as short-term securities that had an original term to maturity that exceeded 60 days. In instances when amortized cost is utilized, the Valuation Committee (the “Committee”) must reasonably conclude that the utilization of amortized cost is approximately the same as the fair value of the security. Such factors the Committee will consider include, but are not limited to, an impairment of the creditworthiness of the issuer or material changes in interest rates. The Committee decisions are made in accordance with procedures established by, and under general supervision of, the Management Company’s Board of Managers.
Over-the-counter (“OTC”) swaps and other derivatives are valued daily, primarily using independent pricing services, independent pricing models using market inputs, as well as third party broker-dealers or counterparties.
1.2 Warrant Valuation A listed warrant is valued at the last traded price provided by approved vendors. If there has been no sale on the relevant business day, the warrant is valued at the last traded price from the previous day. On the following days, the security is valued in good faith at fair value. All unlisted warrants are valued in
AB FCP I
178
Notes to FiNaNcial statemeNts (continued)
good faith at fair value. Once a warrant has expired, it will no longer be valued.
1.3 Financial Futures ContractsInitial margin deposits are made upon entering into futures contracts. During the period the futures contract is open, changes in the value of the contract are recognized as unrealized gains or losses by “marking-to-market” on a daily basis to reflect the market value of the contract at the end of each day’s trading. Variation margin payments are made or received, depending upon whether unrealized losses or gains are incurred. When the contract is closed, a realized gain or loss is recorded. This realized gain or loss is equal to the difference between the proceeds from (or cost of) the closing transaction and the Portfolio’s basis in the contract.
Open futures contracts are valued using the closing settlement price or, in the absence of such a price, the most recent quoted bid price. If there are no quotations available for the day of valuations, the last available closing settlement price is used.
1.4 Forward Foreign Currency ContractsThe unrealized gain or loss on open forward foreign currency contracts is calculated as the difference between the contracted rate and the rate to close out the contract. Realized profit or loss includes net gains or losses on forward foreign currency contracts which have been settled or offset by other contracts with the same counterparty.
1.5 Options Purchased and Options WrittenWhen an option is purchased, an amount equal to the premium paid is recorded as an investment and is subsequently adjusted to the current market value of the option purchased. Premiums paid for the purchase of options which expire unexercised are treated on the expiration date as realized losses. If a purchased put option is exercised, the premium is subtracted from the proceeds of the sale of the underlying security or foreign currency in determining whether the relevant Portfolio has realized a gain or loss. If a purchased call option is exercised, the premium increases the cost basis of the security or foreign currency purchased by the relevant Portfolio. When an option is written, an amount equal to the premium received by the relevant Portfolio is recorded as a liability and is subsequently adjusted to the current market value of the option written. Premiums received from written options which expire unexercised are treated by the relevant Portfolio on the expiration date as realized gains. If a written call option is exercised, the premium is added to the proceeds from the sale of the underlying security or foreign currency in determining whether the relevant Portfolio has realized a gain or a loss. If a written put option is exercised, the premium reduces the cost basis of the security or foreign currency purchased by the relevant Portfolio. Listed put or call options by a portfolio are valued at the last sale price. If there has been no sale on that day, such securities are valued at the closing bid prices on that day.
1.6 Investments in other Undertakings for Collective Investments (“UCIs”)Investments in other UCIs are valued at the last available Net Asset Value for the UCI in question.
1.7 Swap AgreementsThe Portfolios accrue for interim payments on swap contracts on a daily basis, within income and expenses. Swap contracts
are marked to market on a daily basis with fluctuations in value recorded in unrealized appreciation (depreciation) on swaps in the Statement of Assets and Liabilities and change in unrealized gains and losses on swaps in the Statement of Operations and Changes in Net Assets. Once a swap contract has matured or is sold, the net amount is recorded as a realized gain or (loss) on investments on the Statement of Operations and Changes in Net Assets. The upfront premiums paid or received are recognized as cost or proceeds on the Statement of Assets and Liabilities and are amortized on a straight line basis over the life of the contract. Accruals of amortized upfront premiums on credit default swaps are included in swap income until the position is sold, thereafter the amortized upfront premiums are included in net realized gains and (losses) from swaps. On all other swap types the amortized upfront premiums are included within net realized gains and (losses) from swaps. Fluctuations in the value of swap contracts are recorded as a component of changes in unrealized gains and (losses) on swaps on the Statement of Operations and Changes in Net Assets.
“Upfront premiums paid (received) on swap contracts” disclosed in the Statements of Assets and Liabilities include premiums paid (received) on the OTC credit default swaps and a margin that is yet to be settled on the centrally cleared credit default swaps.
2. Organization ExpensesThe organization expenses of all existing Portfolios have been fully amortized in prior years.
3. Allocation MethodIncome and expenses (except for class-specific management and distribution fees) for the “fixed income” and “balanced” Portfolios are allocated on a daily basis utilizing a hybrid allocation model. This model allocates based upon each class’ proportionate percentage of the combined value of settled shares for those classes which accrue a daily dividend and the value of the shares outstanding for those classes which accrue a monthly dividend or no dividend at all. Income and expenses for the “equity” Portfolios are allocated on a daily basis by each class’ value of their proportionate shares outstanding. For all of the Portfolios, realized and unrealized gains and losses are allocated on a daily basis by each class’ value of their proportionate shares outstanding. Class-specific management, management company, distribution fees and realized and unrealized gains and losses on forward foreign currency contracts related to the Currency Hedged Share Classes are charged /allocated directly to the respective class.
Due to the distinct institutional nature of all types of Class S shares of the Portfolios, certain fund expenses, where applicable, are allocated to the respective Class S shares based upon minimum shareholder activity and account level requirements.
4. Currency TranslationValues expressed in a currency other than the currency in which a Portfolio is denominated as determined by the Management Regulations are translated at the average of the last available buying and selling price. Transactions in foreign currencies are translated into the currency of each Portfolio at the exchange rate ruling at the date of the transactions.
The Combined Statement of Assets and Liabilities is presented in U.S. Dollars at the exchange rates ruling at the date of the combined Statement of Assets and Liabilities, while the

AB FCP I
179
Combined Statement of Operations and Changes in Net Assets is presented in U.S. Dollars at the average exchange rates ruling during the period.
Exchange rates applied in the financial statements are: spot rate 1.1370 and average rate 1.1441 for EUR to USD, spot rate 0.0090 and average rate 0.0090 for JPY to USD.
The “Currency translation adjustment” presented in the Combined Statement of Operations and Changes in Net Assets is the result of the difference in exchange rates used to translate the Combined Statement of Assets and Liabilities and the Combined Statement of Operations and Changes in Net Assets.
5. Investment Income and Investment TransactionsDividend income is recorded on the ex-dividend date. Interest income is accrued daily. Investment gains and losses for the Portfolios are determined on an average cost basis.
The Fund accretes discounts and amortizes premiums as adjustments, if applicable, to interest income. Investment transactions are recorded on trade date plus one day.
6. EstimatesThe preparation of Financial Statements in conformity with accounting principles generally accepted in Luxembourg requires management to make estimates and assumptions that affect the reported amounts of assets and liabilities and disclosure of contingent assets and liabilities at the date of the Financial Statements and the reported amounts of income and expenses during the reporting period. Actual results may differ from those estimates.
7. Swing Pricing AdjustmentThe Management Company of the Fund has communicated to all shareholders of the Fund to implement a Net Asset Value (NAV) Adjustment Policy, also known as “swing pricing” policy effective from November 2, 2015. Under this policy, a Portfolio’s NAV may be adjusted to reflect the impact of estimated transaction costs, deal spreads and charges generated by shareholders’ purchase and redemption activity. Swing pricing is automatically applied when daily net subscriptions or redemptions exceeds a threshold specified by the Swing Pricing Committee under the supervision of the Board of Managers. When swing pricing is applied, the NAV of the relevant Portfolio’s shares will be adjusted up or down, in an amount generally not to exceed 2% of the relevant NAV, so that the transaction costs incurred due to the purchase and redemption activity are borne by the investors transacting in the Portfolio’s shares, rather than the Portfolio itself. This adjustment is intended to minimize dilution of the value of shareholders’ investment in shares of a Portfolio brought on by transactions in the Portfolio’s shares.
The Net Asset Value per Share and the total Net Assets as disclosed in the statistical information are the published Net Asset Value per Share and the total Net Assets, whereas the total Net Assets disclosed in the Statement of Assets and Liabilities and Statement of Operations and Changes in Net Assets is the total Net Asset Value excluding any period end swing adjustments.
As of February 28, 2019, none of the Portfolios’ Net Asset Value and the Net Asset Values per Share were swung.
NOTE C: TaxesAs a Luxembourg fonds commun de placement (FCP), the Fund is not subject, under present tax laws, to income, withholding or capital gains taxes in Luxembourg. The Fund is subject to the Luxembourg taxe d’abonnement at the rate of 0.05% per annum calculated and payable quarterly as the aggregate total net
assets on the last day of each calendar quarter. The rate is 0.01% for share classes reserved to institutional investors within the meaning of Article 174 of the Law of 2010. Interest, dividends and capital gains on securities may be subject to withholding or capital gains taxes in certain countries.
NOTE D: DistributionsThe Management Company does not currently intend to pay dividends with respect to the shares for the following Portfolios: Global Equity Blend Portfolio, Sustainable US Thematic Portfolio. Therefore, any net income and net realized profits attributable to the Shares will be reflected in the respective Net Asset Value of the Shares.
For Dynamic Diversified Portfolio:
- For class AR shares (and corresponding H shares), the Management Company intends to declare and make annual distributions. Distributions may come from gross income (before reduction for fees and expenses), realized and unrealized gains and capital attributable to the relevant class. Distributions in excess of net income (gross income less fees and expenses) may represent a return of the investor’s original investment amount and as such may result in a decrease in the NAV per share for the relevant class.
- For class A, B, C, I, S, S1, SP, S1P, AX, BX, CX and IX shares (and corresponding H shares), the Management Company currently does not intend to pay dividends with respect to the Shares. Therefore, any net income and net
realized profits attributable to the Shares will be reflected in the respective Net Asset Value of the Shares.
For Global Value Portfolio:
- For class A, B, C, I, S, S1, SA GB, SB GB, S1A GB and S1B GB shares (and corresponding H shares), the Management Company currently does not intend to pay distributions with respect to the Shares. Therefore, any net income and net realized profits attributable to the Shares will be reflected in the respective Net Asset Value of the Shares.
- For class AD, BD and SD shares (and corresponding H shares), the Management Company intends to declare and pay monthly distributions. The Management Company intends to maintain a stable distribution rate per share for such share classes, and therefore distributions may come from gross income (before reduction for fees and expenses), realized and unrealized gains and capital attributable to the relevant class. Distributions in excess of net income (gross income less fees and expenses) may represent a return of the investor’s original investment amount and as such may result in a decrease in the NAV per share for the relevant class.

AB FCP I
180
Notes to FiNaNcial statemeNts (continued)
For Emerging Markets Growth Portfolio:
- For class A, B, C, I, N, S and S1 shares (and corresponding H Shares), the Management Company currently does not intend to pay dividends with respect to the Shares. Therefore, any net income and net realized profits attributable to the Shares will be reflected in the respective Net Asset Value of the Shares.
- For class AD and ED shares (and corresponding H shares), the Management Company intends to declare and pay monthly distributions. The Management Company intends to maintain a stable distribution rate per share for such share classes, and therefore distributions may come from gross income (before reduction for fees and expenses), realized and unrealized gains and capital attributable to the relevant class. Distributions in excess of net income (gross income less fees and expenses) may represent a return of the investor’s original investment amount and as such may result in a decrease in the NAV per share for the relevant class.
For Asia Ex-Japan Equity Portfolio:
- For class A, B, C, I, S and S1 shares (and corresponding H shares), the Management Company currently does not intend to pay distributions with respect to the Shares. Therefore, any net income and net realized profits attributable to the Shares will be reflected in the respective Net Asset Value of the Shares.
- For class AY and class BY shares, the Management Company has discretion to declare and pay distributions based on the Portfolio’s net income attributable to each class of Shares.
- For class AD, BD, ED, ID and SD shares (and corresponding H shares), the Management Company intends to declare and pay monthly distributions. The Management Company intends to maintain a stable distribution rate per share for such share classes, and therefore distributions may come from gross income (before reduction for fees and expenses), realized and unrealized gains and capital attributable to the relevant class. Distributions in excess of net income (gross income less fees and expenses) may represent a return of the investor’s original investment amount and as such may result in a decrease in the NAV per share for the relevant class.
For Japan Strategic Value Portfolio:
- For class A, B, C, I, S, S1 and 2 shares (and corresponding H shares), the Management Company currently does not intend to pay distributions with respect to the Shares. Therefore, any net income and net realized profits attributable to the Shares will be reflected in the respective Net Asset Value of the Shares.
- For class AD, BD and SD shares (and corresponding H shares), the Management Company intends to declare and pay monthly distributions. The Management Company intends to maintain a stable distribution rate per share for such share classes, and therefore distributions may come from gross income (before reduction for fees and expenses), realized and unrealized gains and capital attributable to the relevant class. Distributions in excess of net income (gross income less fees and expenses) may represent a return of
the investor’s original investment amount and as such may result in a decrease in the NAV per share for the relevant class.
For China Opportunity Portfolio:
- For class A, B, C, I, S and S1 shares, the Management Company currently does not intend to pay dividends with respect to the Shares. Therefore, any net income and net realized profits attributable to such Shares will be reflected in the respective Net Asset Value of such Shares.
- For class AD and BD shares (and corresponding H shares), the Management Company intends to declare and pay monthly distributions. The Management Company intends to maintain a stable distribution rate per share for such share classes, and therefore distributions may come from gross income (before reduction for fees and expenses), realized and unrealized gains and capital attributable to the relevant class. Distributions in excess of net income (gross income less fees and expenses) may represent a return of the investor’s original investment amount and as such may result in a decrease in the NAV per share for the relevant class.
For Global Bond Portfolio:
- For class A, AX, B, BX, C, I, S and S1 shares (and corresponding H shares, unless noted otherwise), the Management Company intends to declare daily and pay monthly dividends equal to all or substantially all of the Portfolio’s net income attributable to each class of Shares.
- For class AJ, AT, BT, CT, IT and NT shares (and corresponding H shares), the Management Company intends to declare and pay monthly dividends equal to all or substantially all of the Portfolio’s net income attributable to each class of Shares.
- For class AA, BA and SA shares (and corresponding H shares), the Management Company intends to declare and make monthly distributions. The Management Company intends to maintain a stable distribution rate per share for such share classes. For class AR shares (and corresponding H shares), the Management Company intends to declare and make annual distributions. The distribution rate is to be derived from gross income (before deduction of fees and expenses) and distributions may also include realized and unrealized gains and capital attributable to such classes of Shares. Since fees and expenses do not reduce the distribution rate, the NAV per Share of the relevant classes will be reduced by such fees and expenses.
- For class A2, B2, C2, I2, N2, S 2 and S1 2 shares (and corresponding H shares) and S EUR H, S1 EUR H, S SGD H shares, the Management Company currently does not intend to pay dividends with respect to the Shares. Therefore, any net income and net realized profits attributable to the Shares will be reflected in the respective Net Asset Value of the Shares.
For Global High Yield Portfolio:
- For class A, B, C, I, JA and J shares (and corresponding H shares), the Management Company intends to declare daily and pay monthly dividends equal to all or substantially all of the Portfolio’s net income attributable to each class of Shares.
AB FCP I
181
- For class AT, BT, CT, IT, NT, SM, S1D, S1D2 and WT shares (and corresponding H shares), the Management Company intends to declare and pay monthly dividends equal to all or substantially all of the Portfolio’s net income attributable to each class of Shares.
- For class IQD and S1QD shares, the Management Company intends to declare and pay quarterly dividends equal to all or substantially all of the Portfolio’s net income attributable to the class of Shares. For class SK shares, the Management Company may declare and pay dividends at its discretion.
- For class AK and CK shares (and corresponding H shares), the Management Company intends to declare and pay bi-annually dividends equal to all or substantially all of the Portfolio’s net income attributable to the relevant class of Shares.
- For class AM shares, the Management Company intends to declare and pay monthly distributions. The Management Company intends to maintain a fixed distribution of 7% (annualized) per share for AM shares. As such, distributions may come from net income, realized and unrealized gains and/or capital attributable to the relevant class. Distributions from capital may represent a return of the investor’s original investment amount and as such may result in a decrease in the NAV per share for the relevant class. The Management Company will periodically review the level of income and expenses at the AM class level, along with the fixed distribution percentage and may decide to decrease or increase the fixed distribution percentage. Such percentage will be reflected in the next update of the prospectus and in the meantime, shareholders may obtain the latest percentage at www.alliancebernstein.com.
- For class AA, BA, EA, IA and SA shares (and corresponding H shares), the Management Company intends to declare and make monthly distributions. The Management Company intends to maintain a stable distribution rate per share for such share classes. For class AR shares (and corresponding H shares), the Management Company intends to declare and make annual distributions. For class SHK and SQ shares, the Management Company intends to declare daily and make monthly distributions. The distribution rate is to be derived from gross income (before deduction of fees and expenses) and distributions may also include realized and unrealized gains and capital attributable to such classes of Shares. Since fees and expenses do not reduce the distribution rate, the NAV per Share of the relevant classes will be reduced by such fees and expenses.
- For class A2, B2, C2, I2, N2, S, S1 and W2 shares (and corresponding H shares), the Management Company currently does not intend to pay dividends with respect to the Shares. Therefore, any net income and net realized profits attributable to the Shares will be reflected in the respective Net Asset Value of the Shares.
For American Income Portfolio:
- For class A, B, C, I, JA, J and W shares (and corresponding H shares), the Management Company intends to declare daily and pay monthly dividends equal to all or substantially all of the Portfolio’s net income attributable to each class of Shares.
- For class AT, BT, CT, IT, NT, S1D, S1D2 and WT shares (and corresponding H and DUR PH shares), the Management Company intends to declare and pay monthly dividends equal to all or substantially all of the Portfolio’s net income attributable to each class of Shares.
- For class AK and CK shares (and corresponding H shares), the Management Company intends to declare and pay bi-annually dividends equal to all or substantially all of the Portfolio’s net income attributable to each class of Shares.
- For class AM shares, the Management Company intends to declare and pay monthly distributions. The Management Company intends to maintain a fixed distribution of 5% (annualized) per share for AM shares. As such, distributions may come from net income, realized and unrealized gains and/or capital attributable to the relevant class. Distributions from capital may represent a return of the investor’s original investment amount and as such may result in a decrease in the NAV per share for the relevant class. The Management Company will periodically review the level of income and expenses at the AM class level, along with the fixed distribution percentage and may decide to decrease or increase the fixed distribution percentage. Such percentage will be reflected in the next update of the prospectus and in the meantime, shareholders may obtain the latest percentage at www.alliancebernstein.com.
- For class AA, BA, EA, IA and SA shares (and corresponding H and DUR PH shares), the Management Company intends to declare and make monthly distributions. For class SHK shares (and corresponding H shares), the Management Company intends to declare daily and make monthly distributions. The Management Company intends to maintain a stable distribution rate per share for such share classes. For class AR shares (and corresponding H shares), the Management Company intends to declare and make annual distributions. The distribution rate is to be derived from gross income (before deduction of fees and expenses) and distributions may also include realized and unrealized gains and capital attributable to such classes of Shares. Since fees and expenses do not reduce the distribution rate, the NAV per Share of the relevant classes will be reduced by such fees and expenses.
- For class S1QD shares (and corresponding H shares), the Management Company intends to declare and pay quarterly dividends equal to all or substantially all of the Portfolio’s net income attributable to the class of Shares.
- For class A2, B2, C2, I2, N2, S, S1 and W2 shares (and corresponding H and DUR PH shares), the Management Company currently does not intend to pay dividends with respect to the Shares. Therefore, any net income and net realized profits attributable to the Shares will be reflected in the respective Net Asset Value of the Shares.
For European Income Portfolio:
- For class A, B, C and I shares, the Management Company intends to declare daily and pay monthly dividends equal to all or substantially all of the Portfolio’s net income attributable to each class of Shares.
- For class AT, BT, CT, IT, NT and S1D shares (and corresponding H shares), the Management Company intends to declare and pay monthly dividends equal to all or

AB FCP I
182
Notes to FiNaNcial statemeNts (continued)
substantially all of the Portfolio’s net income attributable to each class of Shares.
- For class AK and CK shares, the Management Company intends to declare and pay bi-annually dividends equal to all or substantially all of the Portfolio’s net income attributable to each class of Shares.
- For class AM shares, the Management Company intends to declare and pay monthly distributions. The Management Company intends to maintain a fixed distribution of 5% (annualized) per share for AM shares. As such, distributions may come from net income, realized and unrealized gains and/or capital attributable to the relevant class. Distributions from capital may represent a return of the investor’s original investment amount and as such may result in a decrease in the NAV per share for the relevant class. The Management Company will periodically review the level of income and expenses at the AM class level, along with the fixed distribution percentage and may decide to decrease or increase the fixed distribution percentage. Such percentage will be reflected in the next update of the prospectus and in the meantime, shareholders may obtain the latest percentage at www.alliancebernstein.com.
- For class AA, BA, IA and SA shares (and corresponding H shares), the Management Company intends to declare and make monthly distributions. For class SHK shares (and corresponding H shares), the Management Company intends to declare daily and make monthly distributions. The Management Company intends to maintain a stable distribution rate per share for such share classes. For class AR shares (and corresponding H shares), the Management Company intends to declare and make annual distributions. The distribution rate is to be derived from gross income (before deduction of fees and expenses) and distributions may also include realized and unrealized gains and capital attributable to such classes of Shares. Since fees and expenses do not reduce the distribution rate, the NAV per Share of the relevant classes will be reduced by such fees and expenses.
- For class A2, B2, C2, I2, S, S1 and W2 shares (and corresponding H shares), the Management Company currently does not intend to pay dividends with respect to the Shares. Therefore, any net income and net realized profits attributable to the Shares will be reflected in the respective Net Asset Value of the Shares.
For Emerging Markets Debt Portfolio:
- For class A, B, C and I shares (and corresponding H shares), the Management Company intends to declare daily and pay monthly dividends equal to all or substantially all of the Portfolio’s net income attributable to each class of Shares.
- For class AT, BT, CT, IT and NT shares (and corresponding H shares), the Management Company intends to declare and pay monthly dividends equal to all or substantially all of the Portfolio’s net income attributable to each class of Shares.
- For class AM shares, the Management Company intends to declare and pay monthly distributions. The Management Company intends to maintain a fixed distribution of 5% (annualized) per share for AM shares. As such, distributions may come from net income, realized and
unrealized gains and/or capital attributable to the relevant class. Distributions from capital may represent a return of the investor’s original investment amount and as such may result in a decrease in the NAV per share for the relevant class. The Management Company will periodically review the level of income and expenses at the AM class level, along with the fixed distribution percentage and may decide to decrease or increase the fixed distribution percentage. Such percentage will be reflected in the next update of the prospectus and in the meantime, shareholders may obtain the latest percentage at www.alliancebernstein.com.
- For class AA, BA, EA and SA shares (and corresponding H shares), the Management Company intends to declare and make monthly distributions. The Management Company intends to maintain a stable distribution rate per share for such share classes. For class AR shares, the Management Company intends to declare and make annual distributions. The distribution rate is to be derived from gross income (before deduction of fees and expenses) and distributions may also include realized and unrealized gains and capital attributable to such classes of Shares. Since fees and expenses do not reduce the distribution rate, the NAV per Share of the relevant classes will be reduced by such fees and expenses.
- For class A2, B2, C2, I2, N2, S, S1 and S1 2 shares (and corresponding H shares), the Management Company currently does not intend to pay dividends with respect to the Shares. Therefore, any net income and net realized profits attributable to the Shares will be reflected in the respective Net Asset Value of the Shares.
For Mortgage Income Portfolio:
- For class A, AX, BX, C, CX, I, IX, S and S1X shares, the Management Company intends to declare daily and pay monthly dividends equal to all or substantially all of the Portfolio’s net income attributable to each class of Shares.
- For class AT, ATX, IT, NT and ZT shares, the Management Company intends to declare and pay monthly dividends equal to all or substantially all of the Portfolio’s net income attributable to each class of Shares.
- For class AA, BA, EA and SA shares (and corresponding H shares), the Management Company intends to declare and make monthly distributions. The Management Company intends to maintain a stable distribution rate per share for such share classes. For class AR shares (and corresponding H shares), the Management Company intends to declare and make annual distributions. The distribution rate is to be derived from gross income (before deduction of fees and expenses) and distributions may also include realized and unrealized gains and capital attributable to such classes of Shares. Since fees and expenses do not reduce the distribution rate, the NAV per Share of the relevant classes will be reduced by such fees and expenses.
- For class A2, A2X, B2X, C2, C2X, I2, I2X, N2 and S1 shares (and corresponding H shares), the Management Company currently does not intend to pay dividends with respect to the Shares. Therefore, any net income and net realized profits attributable to the Shares will be reflected in the respective Net Asset Value of the Shares.
AB FCP I
183
For Global Bond II Portfolio:
- For class S1 shares, the Management Company intends to declare daily and pay monthly dividends equal to all or substantially all of the Portfolio’s net income attributable to each class of Shares.
The Management Company also may determine if and to what extent dividends paid include realized capital gains and/or are
paid out of capital attributable to the relevant class of Shares. To the extent the net income and net realized profits attributable to these Shares exceed the amount declared payable, the excess return will be reflected in the respective. Net Asset Value of such Shares. Dividends may be automatically reinvested at the election of the Shareholder.
NOTE E: Management Fee and Other Transactions with AffiliatesThe Fund pays AllianceBernstein (Luxembourg) S.à r.l. (the “Management Company”) a management fee. Under the terms of the Investment Management Agreement from the management fee earned, the Management Company pays an investment management fee to AllianceBernstein L.P. (the “Investment Manager”).
The Management Company has voluntarily agreed to bear certain expenses to the extent necessary to limit total operating expenses on an annual basis.
These limitations have been set as follows (limitations expressed as a percentage of the average daily net assets):
AB FCP I– Share Class %
Dynamic Diversified Portfolio . . . . . . . . . . . . . . . . . Class A 1.95%
Class A EUR H 1.95% Class AX 1.90% Class B 2.95% Class BX 2.90% Class C 2.25% Class C EUR H 2.25% Class CX 2.20% Class I 1.25% Class I EUR H 1.25% Class IX 1.20% Class S1 EUR H 0.80%Global Equity Blend
Portfolio . . . . . . . . . . . . . . . . . Class A 2.10% Class A EUR H 2.10% Class B 3.10% Class C 2.55% Class I 1.30% Class S 0.10% Class S1 0.80%Global Value Portfolio . . . . . . . . Class S 0.12% Class S1 0.82% Class S1A GB 0.82% Class SD 0.12%Emerging Markets Growth
Portfolio . . . . . . . . . . . . . . . . . Class S 0.30% Class S1 1.20%
Sustainable US Thematic Portfolio . . . . . . . . . . . . . . . . . Class A 1.75%
Class A AUD H 1.75%
AB FCP I– Share Class %
Sustainable US Thematic Portfolio . . . . . . . . . . . . . . . . . Class A CAD H 1.75%
Class A EUR H 1.75% Class A GBP H 1.75% Class A SGD H 1.75% Class AN 1.75% Class B 2.75% Class B CAD H 2.75% Class C 2.20% Class C EUR H 2.20% Class I 0.95% Class I EUR H 0.95% Class IN 0.95% Class S 0.15% Class S1 0.80% Class S1 JPY H 0.80%Asia Ex-Japan Equity
Portfolio . . . . . . . . . . . . . . . . . Class A 2.05% Class A AUD H 2.05% Class A SGD H 2.05% Class AD 2.05% Class AD AUD H 2.05% Class AD CAD H 2.05% Class AD EUR H 2.05% Class AD GBP H 2.05% Class AD NZD H 2.05% Class AD RMB H 2.05% Class AD SGD H 2.05% Class AD ZAR H 2.05% Class AY JPY 2.05% Class B 3.05% Class B AUD H (a) 3.05% Class BD 3.05% Class BD AUD H 3.05% Class BD CAD H 3.05% Class BD GBP H 3.05% Class BD NZD H 3.05% Class BD ZAR H 3.05% Class BY JPY 2.52% Class C 2.50% Class C AUD H 2.50% Class ED 3.05% Class I 1.25% Class I AUD H 1.25% Class I GBP 1.25%

AB FCP I
184
Notes to FiNaNcial statemeNts (continued)
AB FCP I– Share Class %
Asia Ex-Japan Equity Portfolio . . . . . . . . . . . . . . . . . Class ID 1.25%
Class ID AUD H 1.25% Class S 0.30% Class S1 1.20% Class SD 0.30%Japan Strategic Value
Portfolio . . . . . . . . . . . . . . . . . Class 2 1.35% Class A 2.15% Class A AUD H 2.15% Class A CZK H 2.15% Class A EUR H 2.15% Class A NZD H 2.15% Class A SGD H 2.15% Class A USD H 2.15% Class AD 2.15% Class AD AUD H 2.15% Class AD NZD H 2.15% Class AD USD H 2.15% Class AD ZAR H 2.15% Class B 3.15% Class BD 3.15% Class BD AUD H 3.15% Class BD USD H 3.15% Class BD ZAR H 3.15% Class C 2.60% Class C EUR H 2.60% Class I 1.35% Class I EUR H 1.35% Class I USD H 1.35% Class S EUR H 0.15% Class S1 0.80% Class S1 USD H 0.80% Class SD 0.15%China Opportunity Portfolio . . . Class A 2.95% Class AD 2.95% Class AD AUD H 2.95% Class AD CAD H 2.95% Class AD EUR H 2.95% Class AD GBP H 2.95% Class AD NZD H 2.95% Class AD RMB H 2.95% Class AD SGD H 2.95% Class AD ZAR H 2.95% Class B 3.95% Class BD 3.95% Class BD AUD H 3.95% Class BD EUR H 3.95% Class BD NZD H 3.95% Class BD ZAR H 3.95% Class C 3.40% Class I 2.15% Class S 0.50% Class S1 1.50%
AB FCP I– Share Class %
Global Bond Portfolio . . . . . . . . Class S EUR H 0.15% Class S SGD H 0.15% Class S1 EUR H 0.65% Class SA 0.15%Global High Yield Portfolio . . . . Class S EUR H 0.10% Class S1 1.00% Class S1D 1.00% Class SA 0.10% Class SHK 0.10% Class SK 0.75% Class SM AUD H(b) 0.10% Class SQ 0.70%American Income Portfolio . . . . Class A 1.50% Class A2 1.50% Class A2 CHF H 1.50% Class A2 DUR PH 1.50% Class A2 EUR H 1.50% Class A2 SGD H 1.50% Class AA 1.50% Class AA AUD H 1.50% Class AA CAD H 1.50% Class AA DUR PH 1.50% Class AA EUR H 1.50% Class AA GBP H 1.50% Class AA NZD H 1.50% Class AA RMB H 1.50% Class AA SGD H 1.50% Class AA ZAR H 1.50% Class AK 1.50% Class AK EUR H 1.50% Class AR EUR 1.50% Class AR EUR H 1.50% Class AT 1.50% Class AT AUD H 1.50% Class AT CAD H 1.50% Class AT DUR PH 1.50% Class AT EUR H 1.50% Class AT GBP H 1.50% Class AT NZD H 1.50% Class AT RMB H 1.50% Class AT SGD H 1.50% Class B 2.20% Class B2 2.20% Class BA 2.20% Class BA AUD H 2.20% Class BA ZAR H 2.20% Class BT 2.20% Class BT AUD H 2.20% Class BT CAD H 2.20% Class BT EUR H 2.20% Class BT GBP H 2.20% Class BT NZD H 2.20% Class C 1.95% Class C2 1.95%
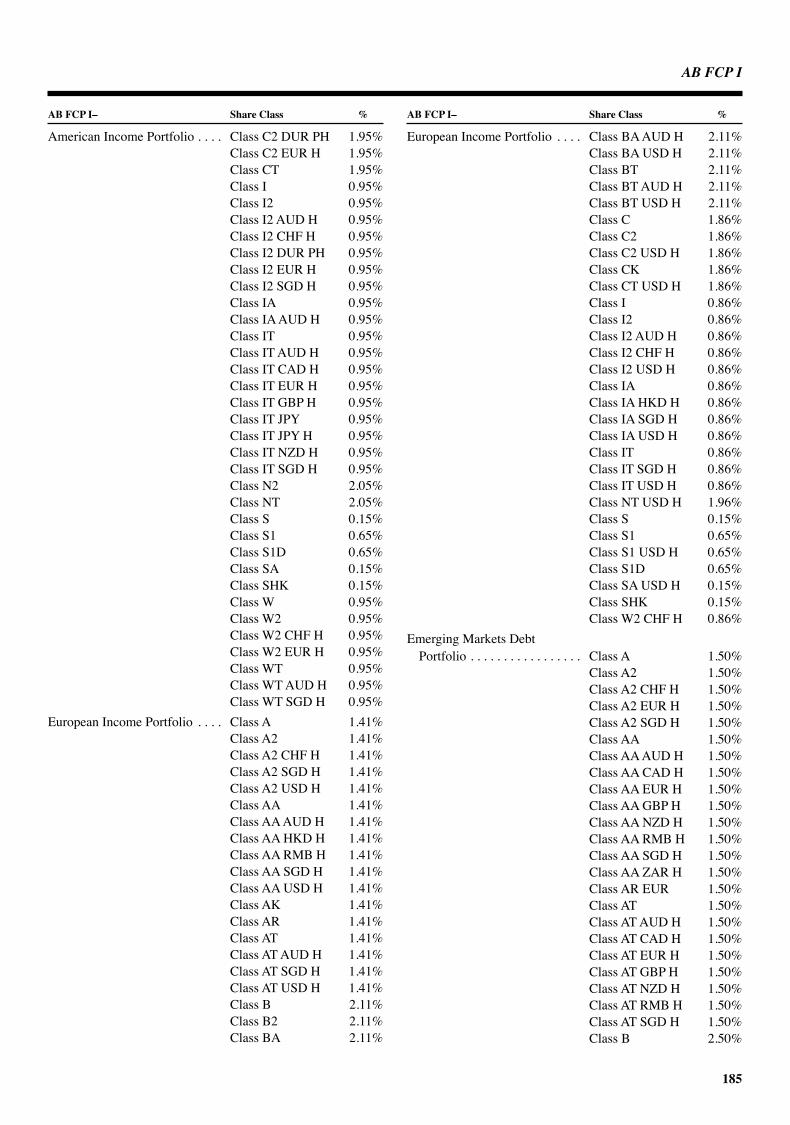
AB FCP I
185
AB FCP I– Share Class %
American Income Portfolio . . . . Class C2 DUR PH 1.95% Class C2 EUR H 1.95% Class CT 1.95% Class I 0.95% Class I2 0.95% Class I2 AUD H 0.95% Class I2 CHF H 0.95% Class I2 DUR PH 0.95% Class I2 EUR H 0.95% Class I2 SGD H 0.95% Class IA 0.95% Class IA AUD H 0.95% Class IT 0.95% Class IT AUD H 0.95% Class IT CAD H 0.95% Class IT EUR H 0.95% Class IT GBP H 0.95% Class IT JPY 0.95% Class IT JPY H 0.95% Class IT NZD H 0.95% Class IT SGD H 0.95% Class N2 2.05% Class NT 2.05% Class S 0.15% Class S1 0.65% Class S1D 0.65% Class SA 0.15% Class SHK 0.15% Class W 0.95% Class W2 0.95% Class W2 CHF H 0.95% Class W2 EUR H 0.95% Class WT 0.95% Class WT AUD H 0.95% Class WT SGD H 0.95%European Income Portfolio . . . . Class A 1.41% Class A2 1.41% Class A2 CHF H 1.41% Class A2 SGD H 1.41% Class A2 USD H 1.41% Class AA 1.41% Class AA AUD H 1.41% Class AA HKD H 1.41% Class AA RMB H 1.41% Class AA SGD H 1.41% Class AA USD H 1.41% Class AK 1.41% Class AR 1.41% Class AT 1.41% Class AT AUD H 1.41% Class AT SGD H 1.41% Class AT USD H 1.41% Class B 2.11% Class B2 2.11% Class BA 2.11%
AB FCP I– Share Class %
European Income Portfolio . . . . Class BA AUD H 2.11% Class BA USD H 2.11% Class BT 2.11% Class BT AUD H 2.11% Class BT USD H 2.11% Class C 1.86% Class C2 1.86% Class C2 USD H 1.86% Class CK 1.86% Class CT USD H 1.86% Class I 0.86% Class I2 0.86% Class I2 AUD H 0.86% Class I2 CHF H 0.86% Class I2 USD H 0.86% Class IA 0.86% Class IA HKD H 0.86% Class IA SGD H 0.86% Class IA USD H 0.86% Class IT 0.86% Class IT SGD H 0.86% Class IT USD H 0.86% Class NT USD H 1.96% Class S 0.15% Class S1 0.65% Class S1 USD H 0.65% Class S1D 0.65% Class SA USD H 0.15% Class SHK 0.15% Class W2 CHF H 0.86%Emerging Markets Debt
Portfolio . . . . . . . . . . . . . . . . . Class A 1.50% Class A2 1.50% Class A2 CHF H 1.50% Class A2 EUR H 1.50% Class A2 SGD H 1.50% Class AA 1.50% Class AA AUD H 1.50% Class AA CAD H 1.50% Class AA EUR H 1.50% Class AA GBP H 1.50% Class AA NZD H 1.50% Class AA RMB H 1.50% Class AA SGD H 1.50% Class AA ZAR H 1.50% Class AR EUR 1.50% Class AT 1.50% Class AT AUD H 1.50% Class AT CAD H 1.50% Class AT EUR H 1.50% Class AT GBP H 1.50% Class AT NZD H 1.50% Class AT RMB H 1.50% Class AT SGD H 1.50% Class B 2.50%
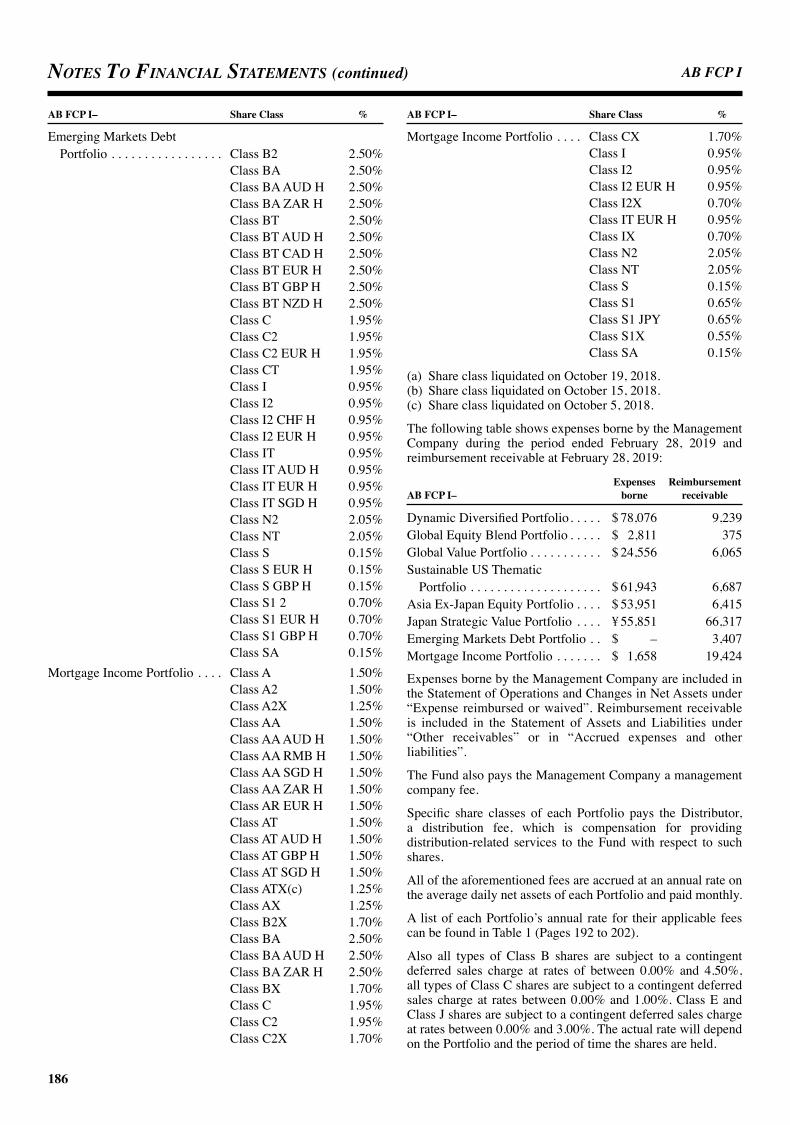
AB FCP I
186
Notes to FiNaNcial statemeNts (continued)
AB FCP I– Share Class %
Emerging Markets Debt Portfolio . . . . . . . . . . . . . . . . . Class B2 2.50%
Class BA 2.50% Class BA AUD H 2.50% Class BA ZAR H 2.50% Class BT 2.50% Class BT AUD H 2.50% Class BT CAD H 2.50% Class BT EUR H 2.50% Class BT GBP H 2.50% Class BT NZD H 2.50% Class C 1.95% Class C2 1.95% Class C2 EUR H 1.95% Class CT 1.95% Class I 0.95% Class I2 0.95% Class I2 CHF H 0.95% Class I2 EUR H 0.95% Class IT 0.95% Class IT AUD H 0.95% Class IT EUR H 0.95% Class IT SGD H 0.95% Class N2 2.05% Class NT 2.05% Class S 0.15% Class S EUR H 0.15% Class S GBP H 0.15% Class S1 2 0.70% Class S1 EUR H 0.70% Class S1 GBP H 0.70% Class SA 0.15%Mortgage Income Portfolio . . . . Class A 1.50% Class A2 1.50% Class A2X 1.25% Class AA 1.50% Class AA AUD H 1.50% Class AA RMB H 1.50% Class AA SGD H 1.50% Class AA ZAR H 1.50% Class AR EUR H 1.50% Class AT 1.50% Class AT AUD H 1.50% Class AT GBP H 1.50% Class AT SGD H 1.50% Class ATX(c) 1.25% Class AX 1.25% Class B2X 1.70% Class BA 2.50% Class BA AUD H 2.50% Class BA ZAR H 2.50% Class BX 1.70% Class C 1.95% Class C2 1.95% Class C2X 1.70%
AB FCP I– Share Class %
Mortgage Income Portfolio . . . . Class CX 1.70% Class I 0.95% Class I2 0.95% Class I2 EUR H 0.95% Class I2X 0.70% Class IT EUR H 0.95% Class IX 0.70% Class N2 2.05% Class NT 2.05% Class S 0.15% Class S1 0.65% Class S1 JPY 0.65% Class S1X 0.55% Class SA 0.15%
(a) Share class liquidated on October 19, 2018.(b) Share class liquidated on October 15, 2018.(c) Share class liquidated on October 5, 2018.
The following table shows expenses borne by the Management Company during the period ended February 28, 2019 and reimbursement receivable at February 28, 2019:
Expenses ReimbursementAB FCP I– borne receivable
Dynamic Diversified Portfolio . . . . . $ 78,076 9,239Global Equity Blend Portfolio . . . . . $ 2,811 375Global Value Portfolio . . . . . . . . . . . $ 24,556 6,065Sustainable US Thematic
Portfolio . . . . . . . . . . . . . . . . . . . . $ 61,943 6,687Asia Ex-Japan Equity Portfolio . . . . $ 53,951 6,415Japan Strategic Value Portfolio . . . . ¥ 55,851 66,317Emerging Markets Debt Portfolio . . $ – 3,407Mortgage Income Portfolio . . . . . . . $ 1,658 19,424
Expenses borne by the Management Company are included in the Statement of Operations and Changes in Net Assets under “Expense reimbursed or waived”. Reimbursement receivable is included in the Statement of Assets and Liabilities under “Other receivables” or in “Accrued expenses and other liabilities”.
The Fund also pays the Management Company a management company fee.
Specific share classes of each Portfolio pays the Distributor, a distribution fee, which is compensation for providing distribution-related services to the Fund with respect to such shares.
All of the aforementioned fees are accrued at an annual rate on the average daily net assets of each Portfolio and paid monthly.
A list of each Portfolio’s annual rate for their applicable fees can be found in Table 1 (Pages 192 to 202).
Also all types of Class B shares are subject to a contingent deferred sales charge at rates of between 0.00% and 4.50%, all types of Class C shares are subject to a contingent deferred sales charge at rates between 0.00% and 1.00%. Class E and Class J shares are subject to a contingent deferred sales charge at rates between 0.00% and 3.00%. The actual rate will depend on the Portfolio and the period of time the shares are held.
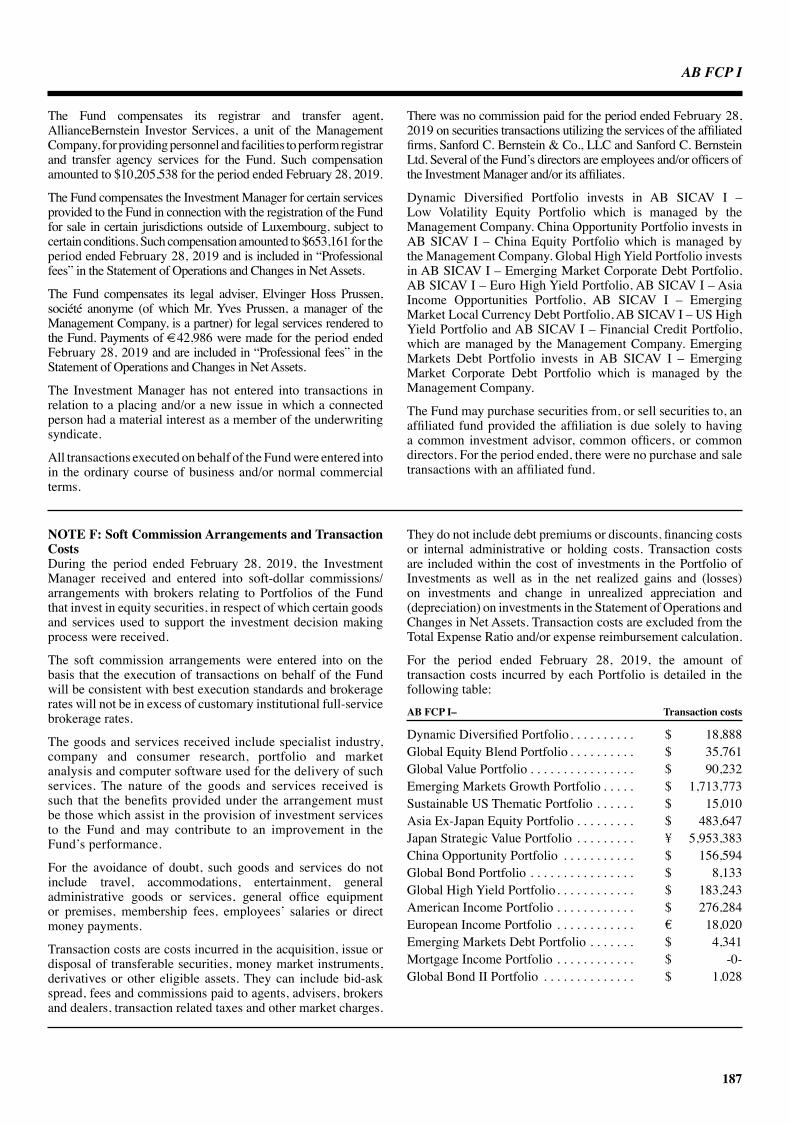
AB FCP I
187
The Fund compensates its registrar and transfer agent, AllianceBernstein Investor Services, a unit of the Management Company, for providing personnel and facilities to perform registrar and transfer agency services for the Fund. Such compensation amounted to $10,205,538 for the period ended February 28, 2019.
The Fund compensates the Investment Manager for certain services provided to the Fund in connection with the registration of the Fund for sale in certain jurisdictions outside of Luxembourg, subject to certain conditions. Such compensation amounted to $653,161 for the period ended February 28, 2019 and is included in “Professional fees” in the Statement of Operations and Changes in Net Assets.
The Fund compensates its legal adviser, Elvinger Hoss Prussen, société anonyme (of which Mr. Yves Prussen, a manager of the Management Company, is a partner) for legal services rendered to the Fund. Payments of €42,986 were made for the period ended February 28, 2019 and are included in “Professional fees” in the Statement of Operations and Changes in Net Assets.
The Investment Manager has not entered into transactions in relation to a placing and/or a new issue in which a connected person had a material interest as a member of the underwriting syndicate.
All transactions executed on behalf of the Fund were entered into in the ordinary course of business and/or normal commercial terms.
There was no commission paid for the period ended February 28, 2019 on securities transactions utilizing the services of the affiliated firms, Sanford C. Bernstein & Co., LLC and Sanford C. Bernstein Ltd. Several of the Fund’s directors are employees and/or officers of the Investment Manager and/or its affiliates.
Dynamic Diversified Portfolio invests in AB SICAV I – Low Volatility Equity Portfolio which is managed by the Management Company. China Opportunity Portfolio invests in AB SICAV I – China Equity Portfolio which is managed by the Management Company. Global High Yield Portfolio invests in AB SICAV I – Emerging Market Corporate Debt Portfolio, AB SICAV I – Euro High Yield Portfolio, AB SICAV I – Asia Income Opportunities Portfolio, AB SICAV I – Emerging Market Local Currency Debt Portfolio, AB SICAV I – US High Yield Portfolio and AB SICAV I – Financial Credit Portfolio, which are managed by the Management Company. Emerging Markets Debt Portfolio invests in AB SICAV I – Emerging Market Corporate Debt Portfolio which is managed by the Management Company.
The Fund may purchase securities from, or sell securities to, an affiliated fund provided the affiliation is due solely to having a common investment advisor, common officers, or common directors. For the period ended, there were no purchase and sale transactions with an affiliated fund.
NOTE F: Soft Commission Arrangements and Transaction CostsDuring the period ended February 28, 2019, the Investment Manager received and entered into soft-dollar commissions/arrangements with brokers relating to Portfolios of the Fund that invest in equity securities, in respect of which certain goods and services used to support the investment decision making process were received.
The soft commission arrangements were entered into on the basis that the execution of transactions on behalf of the Fund will be consistent with best execution standards and brokerage rates will not be in excess of customary institutional full-service brokerage rates.
The goods and services received include specialist industry, company and consumer research, portfolio and market analysis and computer software used for the delivery of such services. The nature of the goods and services received is such that the benefits provided under the arrangement must be those which assist in the provision of investment services to the Fund and may contribute to an improvement in the Fund’s performance.
For the avoidance of doubt, such goods and services do not include travel, accommodations, entertainment, general administrative goods or services, general office equipment or premises, membership fees, employees’ salaries or direct money payments.
Transaction costs are costs incurred in the acquisition, issue or disposal of transferable securities, money market instruments, derivatives or other eligible assets. They can include bid-ask spread, fees and commissions paid to agents, advisers, brokers and dealers, transaction related taxes and other market charges.
They do not include debt premiums or discounts, financing costs or internal administrative or holding costs. Transaction costs are included within the cost of investments in the Portfolio of Investments as well as in the net realized gains and (losses) on investments and change in unrealized appreciation and (depreciation) on investments in the Statement of Operations and Changes in Net Assets. Transaction costs are excluded from the Total Expense Ratio and/or expense reimbursement calculation.
For the period ended February 28, 2019, the amount of transaction costs incurred by each Portfolio is detailed in the following table:AB FCP I– Transaction costs
Dynamic Diversified Portfolio . . . . . . . . . . $ 18,888Global Equity Blend Portfolio . . . . . . . . . . $ 35,761Global Value Portfolio . . . . . . . . . . . . . . . . $ 90,232Emerging Markets Growth Portfolio . . . . . $ 1,713,773Sustainable US Thematic Portfolio . . . . . . $ 15,010Asia Ex-Japan Equity Portfolio . . . . . . . . . $ 483,647Japan Strategic Value Portfolio . . . . . . . . . ¥ 5,953,383China Opportunity Portfolio . . . . . . . . . . . $ 156,594Global Bond Portfolio . . . . . . . . . . . . . . . . $ 8,133Global High Yield Portfolio . . . . . . . . . . . . $ 183,243American Income Portfolio . . . . . . . . . . . . $ 276,284European Income Portfolio . . . . . . . . . . . . € 18,020Emerging Markets Debt Portfolio . . . . . . . $ 4,341Mortgage Income Portfolio . . . . . . . . . . . . $ -0-Global Bond II Portfolio . . . . . . . . . . . . . . $ 1,028
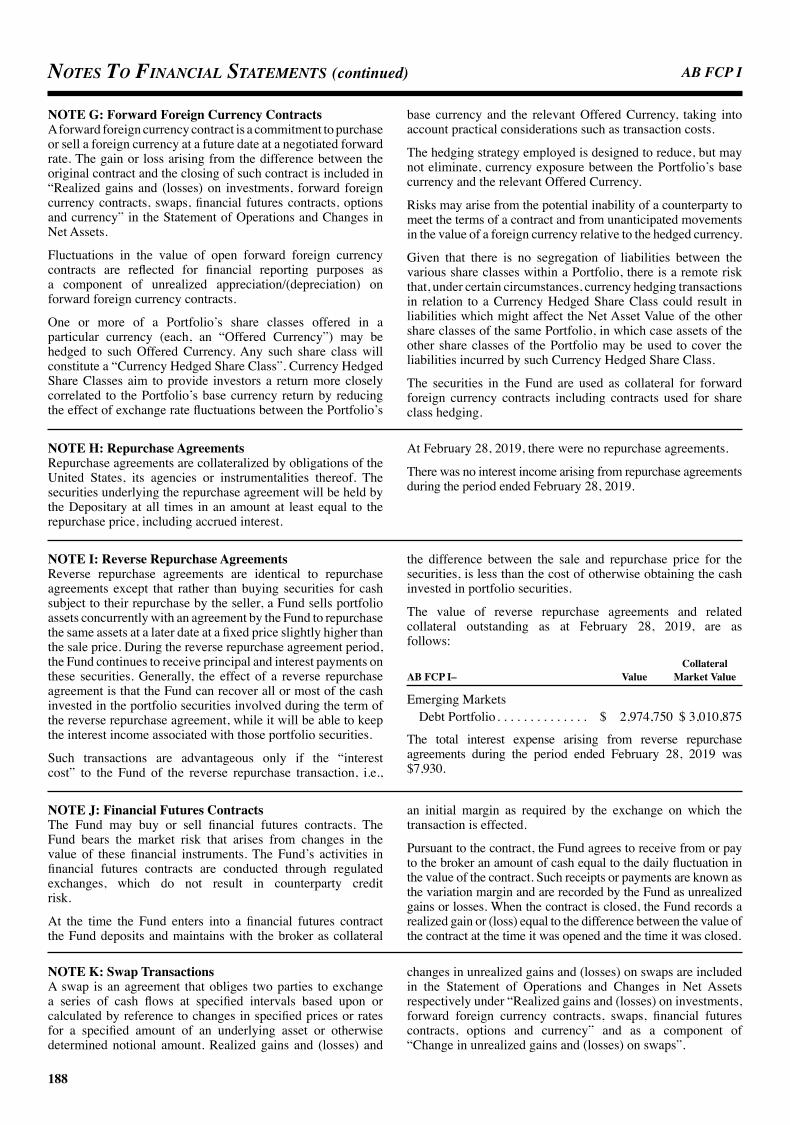
AB FCP I
188
Notes to FiNaNcial statemeNts (continued)
NOTE G: Forward Foreign Currency ContractsA forward foreign currency contract is a commitment to purchase or sell a foreign currency at a future date at a negotiated forward rate. The gain or loss arising from the difference between the original contract and the closing of such contract is included in “Realized gains and (losses) on investments, forward foreign currency contracts, swaps, financial futures contracts, options and currency” in the Statement of Operations and Changes in Net Assets.
Fluctuations in the value of open forward foreign currency contracts are reflected for financial reporting purposes as a component of unrealized appreciation/(depreciation) on forward foreign currency contracts.
One or more of a Portfolio’s share classes offered in a particular currency (each, an “Offered Currency”) may be hedged to such Offered Currency. Any such share class will constitute a “Currency Hedged Share Class”. Currency Hedged Share Classes aim to provide investors a return more closely correlated to the Portfolio’s base currency return by reducing the effect of exchange rate fluctuations between the Portfolio’s
base currency and the relevant Offered Currency, taking into account practical considerations such as transaction costs.
The hedging strategy employed is designed to reduce, but may not eliminate, currency exposure between the Portfolio’s base currency and the relevant Offered Currency.
Risks may arise from the potential inability of a counterparty to meet the terms of a contract and from unanticipated movements in the value of a foreign currency relative to the hedged currency.
Given that there is no segregation of liabilities between the various share classes within a Portfolio, there is a remote risk that, under certain circumstances, currency hedging transactions in relation to a Currency Hedged Share Class could result in liabilities which might affect the Net Asset Value of the other share classes of the same Portfolio, in which case assets of the other share classes of the Portfolio may be used to cover the liabilities incurred by such Currency Hedged Share Class.
The securities in the Fund are used as collateral for forward foreign currency contracts including contracts used for share class hedging.
NOTE H: Repurchase AgreementsRepurchase agreements are collateralized by obligations of the United States, its agencies or instrumentalities thereof. The securities underlying the repurchase agreement will be held by the Depositary at all times in an amount at least equal to the repurchase price, including accrued interest.
At February 28, 2019, there were no repurchase agreements.
There was no interest income arising from repurchase agreements during the period ended February 28, 2019.
NOTE I: Reverse Repurchase AgreementsReverse repurchase agreements are identical to repurchase agreements except that rather than buying securities for cash subject to their repurchase by the seller, a Fund sells portfolio assets concurrently with an agreement by the Fund to repurchase the same assets at a later date at a fixed price slightly higher than the sale price. During the reverse repurchase agreement period, the Fund continues to receive principal and interest payments on these securities. Generally, the effect of a reverse repurchase agreement is that the Fund can recover all or most of the cash invested in the portfolio securities involved during the term of the reverse repurchase agreement, while it will be able to keep the interest income associated with those portfolio securities.
Such transactions are advantageous only if the “interest cost” to the Fund of the reverse repurchase transaction, i.e.,
the difference between the sale and repurchase price for the securities, is less than the cost of otherwise obtaining the cash invested in portfolio securities.
The value of reverse repurchase agreements and related collateral outstanding as at February 28, 2019, are as follows: CollateralAB FCP I– Value Market Value
Emerging Markets Debt Portfolio . . . . . . . . . . . . . . $ 2,974,750 $ 3,010,875
The total interest expense arising from reverse repurchase agreements during the period ended February 28, 2019 was $7,930.
NOTE J: Financial Futures ContractsThe Fund may buy or sell financial futures contracts. The Fund bears the market risk that arises from changes in the value of these financial instruments. The Fund’s activities in financial futures contracts are conducted through regulated exchanges, which do not result in counterparty credit risk.
At the time the Fund enters into a financial futures contract the Fund deposits and maintains with the broker as collateral
an initial margin as required by the exchange on which the transaction is effected.
Pursuant to the contract, the Fund agrees to receive from or pay to the broker an amount of cash equal to the daily fluctuation in the value of the contract. Such receipts or payments are known as the variation margin and are recorded by the Fund as unrealized gains or losses. When the contract is closed, the Fund records a realized gain or (loss) equal to the difference between the value of the contract at the time it was opened and the time it was closed.
NOTE K: Swap TransactionsA swap is an agreement that obliges two parties to exchange a series of cash flows at specified intervals based upon or calculated by reference to changes in specified prices or rates for a specified amount of an underlying asset or otherwise determined notional amount. Realized gains and (losses) and
changes in unrealized gains and (losses) on swaps are included in the Statement of Operations and Changes in Net Assets respectively under “Realized gains and (losses) on investments, forward foreign currency contracts, swaps, financial futures contracts, options and currency” and as a component of “Change in unrealized gains and (losses) on swaps”.

AB FCP I
189
Centrally Cleared Credit Default SwapsThe buyer in a centrally cleared credit default swap agreement is obliged to pay the seller a periodic stream of payments over the term of the contract in return for a contingent payment upon the occurrence of a credit event with respect to an underlying reference obligation.
Centrally Cleared Interest Rate SwapsA centrally cleared interest rate swap is a bilateral agreement in which each of the parties agree to exchange a series of fixed or floating interest rate payments based on a notional amount that serves as a computation basis.
Total Return SwapsA total return swap is a bilateral agreement in which each of the parties agree to exchange the total performance of an underlying asset for a series of interest payments based on a notional amount that serves as a computation basis.
Credit Default SwapsThe buyer in a credit default swap agreement is obliged to pay the seller a periodic stream of payments over the term of the contract in return for a contingent payment upon the occurrence of a credit event with respect to an underlying reference obligation.
Interest Rate SwapsAn interest rate swap is a bilateral agreement in which each of the parties agree to exchange a series of fixed or floating interest rate payments based on a notional amount that serves as a computation basis.
Inflation SwapsAn inflation swap is a bilateral agreement in which each of the parties agree to exchange fixed rate payments for floating, inflation index linked payments based on a notional amount that serves as a computation basis.
NOTE L: Option TransactionsThe Fund may purchase and write (sell) put and call options on securities. The risk associated with purchasing an option is that the Fund pays a premium whether or not the option is exercised. Additionally, the Fund bears the risk of loss of the premium and a change in market value should the counterparty not perform under the contract. Put and call options purchased are accounted for in the same manner as Portfolio securities. The cost of securities acquired through the exercise of call options is increased by the premiums paid. The proceeds from securities sold through the exercise of put options are decreased by the premiums paid.
When the Fund writes an option, the premium received by the Fund is recorded as a liability and is subsequently adjusted to the current market value of the option written.
Premiums received from written options which expire unexercised are recorded by the Fund on the expiration date as realized gains from options written. The difference between the premium received and the amount paid on effecting a closing purchase transaction, including brokerage commissions, is also treated as a realized gain, or if the premium received is less than the amount paid for the closing purchase transaction, as a realized loss.
If a call option is exercised, the premium received is added to the proceeds from the sale of the underlying security or currency in determining whether the Fund has realized a gain or loss. If a put option is exercised, the premium received reduces the cost basis of the security or currency purchased by the Fund. In writing an option, the Fund bears the market risk of an unfavorable change in the price of the security or currency underlying the written option. Exercise of an option written by the Fund could result in the Fund selling or buying a security or currency at a price different from the current market value.
The Fund may also invest in options on swap agreements, also called swaptions. A swaption is an option that gives the buyer the right, but not the obligation, to enter into a swap on a future date in exchange for paying a market-based premium. A receiver swaption gives the owner the right to receive the total return of a specified asset, reference rate, or index. A payer swaption gives the owner the right to pay the total return of a specified asset, reference rate, or index. Swaptions also include options that allow an existing swap to be terminated or extended by one of the counterparties.
There were no open option contracts as at February 28, 2019.
NOTE M: CollateralThe following table lists the cash collateral held by/owed to broker for all of financial derivative instruments as of February 28, 2019: Cash Held Cash Owed AB FCP I– By Broker To Broker
Dynamic Diversified Portfolio Credit Suisse . . . . . . . . . . . . . . . $ 12,543 17 Morgan Stanley . . . . . . . . . . . . $ 567,858 24,019Global Equity Blend Portfolio JP Morgan . . . . . . . . . . . . . . . . . $ – 4,344Emerging Markets Growth
PortfolioGoldman Sachs . . . . . . . . . . . . . $ 146,431 –
Global Bond Portfolio Citibank . . . . . . . . . . . . . . . . . . $ 764,487 – Morgan Stanley . . . . . . . . . . . . $ 3,281,794 931,749
Cash Held Cash Owed AB FCP I– By Broker To Broker
Global High Yield Portfolio Citibank . . . . . . . . . . . . . . . . . . $ 966,626 965,266 Goldman Sachs . . . . . . . . . . . . . $ – 2,747,372 JP Morgan . . . . . . . . . . . . . . . . . $ 37,075,000 – Morgan Stanley . . . . . . . . . . . . $ 98,967,437 170,919,155 Standard Chartered Bank . . . . . $ – 119,000American Income Portfolio Citibank . . . . . . . . . . . . . . . . . . $ 13,633,087 4,577,800 JP Morgan . . . . . . . . . . . . . . . . . $ 19,563,000 – Morgan Stanley . . . . . . . . . . . . $ 29,630,788 –European Income Portfolio Citibank . . . . . . . . . . . . . . . . . . € 3,350 3,345 Goldman Sachs . . . . . . . . . . . . . € 5,849,126 3,051,140
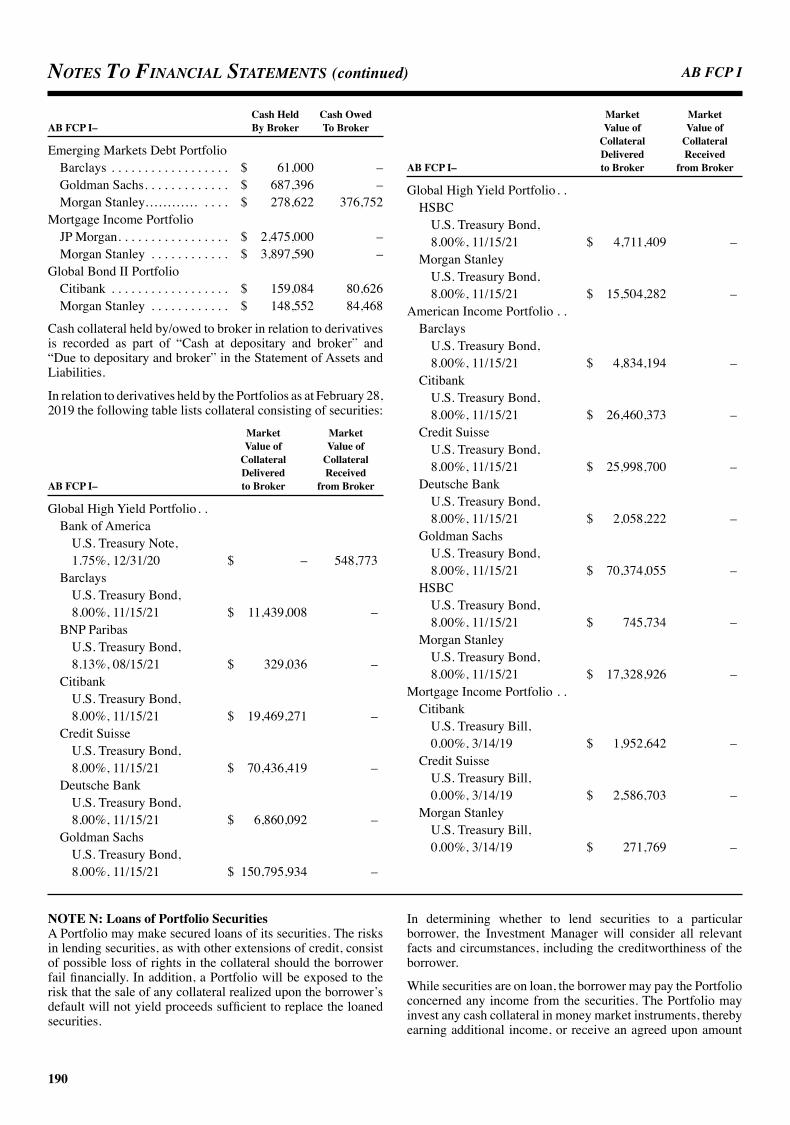
AB FCP I
190
Notes to FiNaNcial statemeNts (continued)
Cash Held Cash Owed AB FCP I– By Broker To Broker
Emerging Markets Debt Portfolio Barclays . . . . . . . . . . . . . . . . . . $ 61,000 – Goldman Sachs . . . . . . . . . . . . . $ 687,396 – Morgan Stanley………… . . . . $ 278,622 376,752Mortgage Income Portfolio JP Morgan . . . . . . . . . . . . . . . . . $ 2,475,000 – Morgan Stanley . . . . . . . . . . . . $ 3,897,590 –Global Bond II Portfolio Citibank . . . . . . . . . . . . . . . . . . $ 159,084 80,626 Morgan Stanley . . . . . . . . . . . . $ 148,552 84,468
Cash collateral held by/owed to broker in relation to derivatives is recorded as part of “Cash at depositary and broker” and “Due to depositary and broker” in the Statement of Assets and Liabilities.
In relation to derivatives held by the Portfolios as at February 28, 2019 the following table lists collateral consisting of securities: Market Market Value of Value of Collateral Collateral Delivered Received AB FCP I– to Broker from Broker
Global High Yield Portfolio . .Bank of America
U.S. Treasury Note, 1.75%, 12/31/20 $ – 548,773
Barclays U.S. Treasury Bond, 8.00%, 11/15/21 $ 11,439,008 –
BNP Paribas U.S. Treasury Bond, 8.13%, 08/15/21 $ 329,036 –
Citibank U.S. Treasury Bond, 8.00%, 11/15/21 $ 19,469,271 –
Credit Suisse U.S. Treasury Bond, 8.00%, 11/15/21 $ 70,436,419 –
Deutsche Bank U.S. Treasury Bond, 8.00%, 11/15/21 $ 6,860,092 –
Goldman Sachs U.S. Treasury Bond, 8.00%, 11/15/21 $ 150,795,934 –
Market Market Value of Value of Collateral Collateral Delivered Received AB FCP I– to Broker from Broker
Global High Yield Portfolio . .HSBC
U.S. Treasury Bond, 8.00%, 11/15/21 $ 4,711,409 –
Morgan Stanley U.S. Treasury Bond, 8.00%, 11/15/21 $ 15,504,282 –
American Income Portfolio . .Barclays
U.S. Treasury Bond, 8.00%, 11/15/21 $ 4,834,194 –
Citibank U.S. Treasury Bond, 8.00%, 11/15/21 $ 26,460,373 –
Credit Suisse U.S. Treasury Bond, 8.00%, 11/15/21 $ 25,998,700 –
Deutsche Bank U.S. Treasury Bond, 8.00%, 11/15/21 $ 2,058,222 –
Goldman Sachs U.S. Treasury Bond, 8.00%, 11/15/21 $ 70,374,055 –
HSBC U.S. Treasury Bond, 8.00%, 11/15/21 $ 745,734 –
Morgan Stanley U.S. Treasury Bond, 8.00%, 11/15/21 $ 17,328,926 –
Mortgage Income Portfolio . .Citibank
U.S. Treasury Bill, 0.00%, 3/14/19 $ 1,952,642 –
Credit Suisse U.S. Treasury Bill, 0.00%, 3/14/19 $ 2,586,703 –
Morgan Stanley U.S. Treasury Bill, 0.00%, 3/14/19 $ 271,769 –
NOTE N: Loans of Portfolio SecuritiesA Portfolio may make secured loans of its securities. The risks in lending securities, as with other extensions of credit, consist of possible loss of rights in the collateral should the borrower fail financially. In addition, a Portfolio will be exposed to the risk that the sale of any collateral realized upon the borrower’s default will not yield proceeds sufficient to replace the loaned securities.
In determining whether to lend securities to a particular borrower, the Investment Manager will consider all relevant facts and circumstances, including the creditworthiness of the borrower.
While securities are on loan, the borrower may pay the Portfolio concerned any income from the securities. The Portfolio may invest any cash collateral in money market instruments, thereby earning additional income, or receive an agreed upon amount

AB FCP I
191
of income from a borrower who has delivered equivalent collateral.
The Portfolio may have the right to regain record ownership of loaned securities or equivalent securities in order to exercise ownership rights such as voting rights, subscription rights and rights to dividends, interest or distributions. The Portfolio may pay reasonable finders’, administrative and other fees in connection with a loan.
For making secured loans of its securities, a Portfolio receives gross fee income, of which 20% is paid to the securities lending agent for providing securities lending services.
For the period ended February 28, 2019, the Portfolios earned a net fee income as follows:AB FCP I–
Global Equity Blend Portfolio . . . . . . . . . . $ 1,084Global Value Portfolio . . . . . . . . . . . . . . . . $ 7,483Emerging Markets Growth Portfolio . . . . . $ 99,415Asia Ex-Japan Equity Portfolio . . . . . . . . . $ 11,052Japan Strategic Value Portfolio . . . . . . . . . ¥ 338,356China Opportunity Portfolio . . . . . . . . . . . $ 4,655
This is included in the Statement of Operations and Changes in Net Assets under “Securities lending income, net”.
For the period ended February 28, 2019, Brown Brothers Harriman (acting as securities lending agent) earned a fee
of $31,681 for providing securities lending services. This is included in the Statement of Operations and Changes in Net Assets under “Securities lending income, net”. The value of loaned securities and related collateral outstanding as of February 28, 2019, are as below. The collateral relates to securities held on the Portfolios. Collateral AB FCP I– Value Market Value
Global Equity Blend Portfolio . . UBS AG $ 255,747 279,525Global Value Portfolio . . . . . . . . UBS AG $ 1,909,580 2,087,108Emerging Markets Growth
Portfolio . . . . . . . . . . . . . . . . . Citigroup Global Markets
Limited $ 719,883 755,876 Credit Suisse $ 308,589 324,019 Deutsche Bank $ 14,852 15,592 JPMorgan $ 5,326,997 5,593,350 Morgan Stanley $ 14,897,611 15,642,497 UBS AG $ 2,876,468 3,143,880Asia Ex-Japan Equity Portfolio . . Merrill Lynch $ 3,275,216 3,438,978China Opportunity Portfolio . . . JPMorgan $ 1,345,835 1,413,127
NOTE O: Bank FacilityThe Fund has access to an overdraft facility (the “Facility”), established with the Depositary, intended to provide for short-term/temporary financing if necessary, subject to certain restrictions, in connection with abnormal redemption activity.
Each Portfolio of the Fund is limited to borrowing 10% of its respective net assets. Borrowings pursuant to the Facility are subject to interest at a mutually agreed upon rate and security by the underlying assets of each Portfolio.
NOTE P: Co-Management of AssetsFor the purpose of effective management, where the investment policies of a Portfolio so permit, the Management Company may choose to co-manage assets of certain Portfolios within or outside the Fund. In such cases, assets of different Portfolios will be managed in common. The assets which are co-managed shall be referred to as a “pool”. These pooling arrangements are an administrative device designed to reduce operational and other expenses and do not change the legal rights and obligations of Shareholders. The pools do not constitute separate entities and are not directly accessible to investors. Each of the co-managed Portfolios shall remain entitled to its specific assets.
Where assets of several Portfolios are pooled for the purposes of collective management, a record is maintained of the
proportion of the Asset Pool which is attributable to each respective participating Portfolio, with a reference to the Portfolio’s original participation in this Pool and will change in the event of additional allocation or withdrawals. The entitlements of each participating Portfolio to the co-managed assets apply to each and every line of investments of such pool.
Additional investments made on behalf of the co-managed Portfolios shall be allotted to such Portfolios in accordance with their respective entitlement, whereas assets sold shall be levied similarly on the assets attributable to each participating Portfolio.
As of February 28, 2019, the Fund co-manages the assets of certain Portfolios within the Fund utilizing the following Pools:
Asset Pool Participating Portfolios
ACM Global Investments-Global Bond Pool . . . . . . . . . . . . . . . . Global Bond Portfolio
Global Bond II Portfolio
ACM Global Investments-Global Growth Pool . . . . . . . . . . . . . . Global Equity Blend Portfolio
ACM Global Investments-Global Value Pool . . . . . . . . . . . . . . . . Global Equity Blend Portfolio
Global Value Portfolio
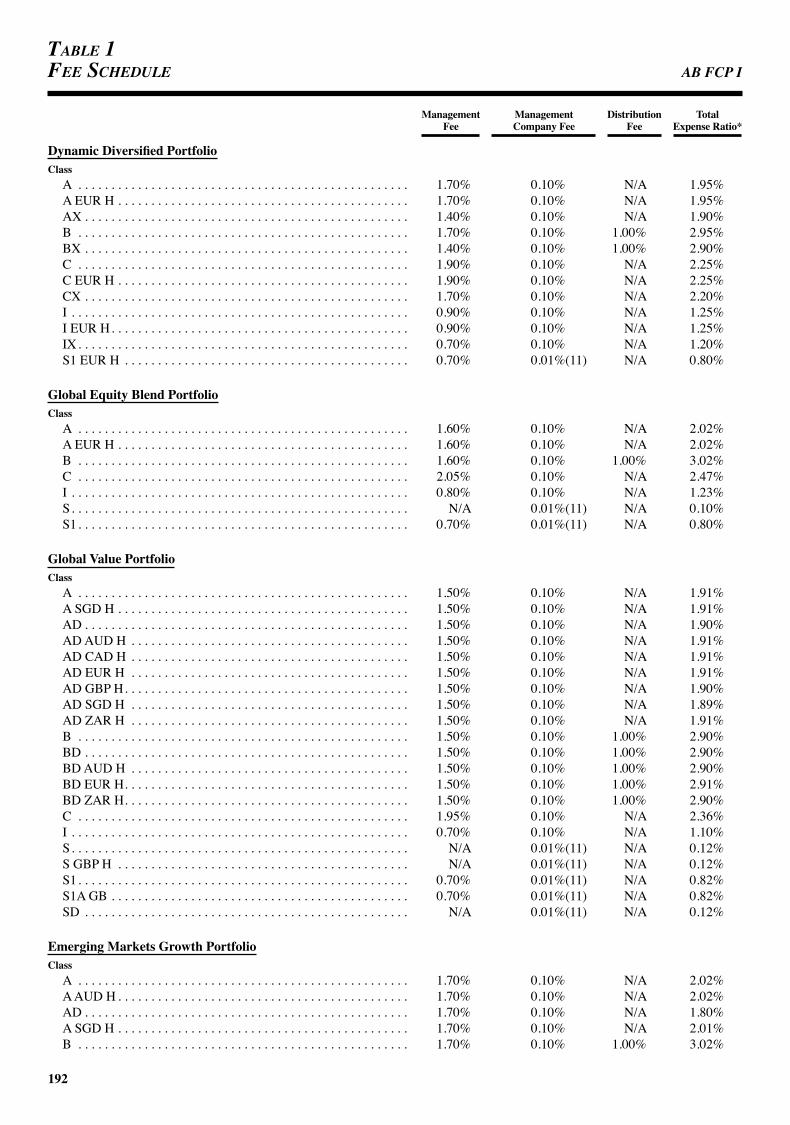
AB FCP I
192
table 1Fee schedule
Management Management Distribution Total Fee Company Fee Fee Expense Ratio*
Dynamic Diversified PortfolioClass
A . . . . . . . . . . . . . . . . . . . . . . . . . . . . . . . . . . . . . . . . . . . . . . . . . . 1.70% 0.10% N/A 1.95%A EUR H . . . . . . . . . . . . . . . . . . . . . . . . . . . . . . . . . . . . . . . . . . . . 1.70% 0.10% N/A 1.95%AX . . . . . . . . . . . . . . . . . . . . . . . . . . . . . . . . . . . . . . . . . . . . . . . . . 1.40% 0.10% N/A 1.90%B . . . . . . . . . . . . . . . . . . . . . . . . . . . . . . . . . . . . . . . . . . . . . . . . . . 1.70% 0.10% 1.00% 2.95%BX . . . . . . . . . . . . . . . . . . . . . . . . . . . . . . . . . . . . . . . . . . . . . . . . . 1.40% 0.10% 1.00% 2.90%C . . . . . . . . . . . . . . . . . . . . . . . . . . . . . . . . . . . . . . . . . . . . . . . . . . 1.90% 0.10% N/A 2.25%C EUR H . . . . . . . . . . . . . . . . . . . . . . . . . . . . . . . . . . . . . . . . . . . . 1.90% 0.10% N/A 2.25%CX . . . . . . . . . . . . . . . . . . . . . . . . . . . . . . . . . . . . . . . . . . . . . . . . . 1.70% 0.10% N/A 2.20%I . . . . . . . . . . . . . . . . . . . . . . . . . . . . . . . . . . . . . . . . . . . . . . . . . . . 0.90% 0.10% N/A 1.25%I EUR H . . . . . . . . . . . . . . . . . . . . . . . . . . . . . . . . . . . . . . . . . . . . . 0.90% 0.10% N/A 1.25%IX . . . . . . . . . . . . . . . . . . . . . . . . . . . . . . . . . . . . . . . . . . . . . . . . . . 0.70% 0.10% N/A 1.20%S1 EUR H . . . . . . . . . . . . . . . . . . . . . . . . . . . . . . . . . . . . . . . . . . . 0.70% 0.01%(11) N/A 0.80%
Global Equity Blend PortfolioClass
A . . . . . . . . . . . . . . . . . . . . . . . . . . . . . . . . . . . . . . . . . . . . . . . . . . 1.60% 0.10% N/A 2.02%A EUR H . . . . . . . . . . . . . . . . . . . . . . . . . . . . . . . . . . . . . . . . . . . . 1.60% 0.10% N/A 2.02%B . . . . . . . . . . . . . . . . . . . . . . . . . . . . . . . . . . . . . . . . . . . . . . . . . . 1.60% 0.10% 1.00% 3.02%C . . . . . . . . . . . . . . . . . . . . . . . . . . . . . . . . . . . . . . . . . . . . . . . . . . 2.05% 0.10% N/A 2.47%I . . . . . . . . . . . . . . . . . . . . . . . . . . . . . . . . . . . . . . . . . . . . . . . . . . . 0.80% 0.10% N/A 1.23%S . . . . . . . . . . . . . . . . . . . . . . . . . . . . . . . . . . . . . . . . . . . . . . . . . . . N/A 0.01%(11) N/A 0.10%S1 . . . . . . . . . . . . . . . . . . . . . . . . . . . . . . . . . . . . . . . . . . . . . . . . . . 0.70% 0.01%(11) N/A 0.80%
Global Value PortfolioClass
A . . . . . . . . . . . . . . . . . . . . . . . . . . . . . . . . . . . . . . . . . . . . . . . . . . 1.50% 0.10% N/A 1.91%A SGD H . . . . . . . . . . . . . . . . . . . . . . . . . . . . . . . . . . . . . . . . . . . . 1.50% 0.10% N/A 1.91%AD . . . . . . . . . . . . . . . . . . . . . . . . . . . . . . . . . . . . . . . . . . . . . . . . . 1.50% 0.10% N/A 1.90%AD AUD H . . . . . . . . . . . . . . . . . . . . . . . . . . . . . . . . . . . . . . . . . . 1.50% 0.10% N/A 1.91%AD CAD H . . . . . . . . . . . . . . . . . . . . . . . . . . . . . . . . . . . . . . . . . . 1.50% 0.10% N/A 1.91%AD EUR H . . . . . . . . . . . . . . . . . . . . . . . . . . . . . . . . . . . . . . . . . . 1.50% 0.10% N/A 1.91%AD GBP H . . . . . . . . . . . . . . . . . . . . . . . . . . . . . . . . . . . . . . . . . . . 1.50% 0.10% N/A 1.90%AD SGD H . . . . . . . . . . . . . . . . . . . . . . . . . . . . . . . . . . . . . . . . . . 1.50% 0.10% N/A 1.89%AD ZAR H . . . . . . . . . . . . . . . . . . . . . . . . . . . . . . . . . . . . . . . . . . 1.50% 0.10% N/A 1.91%B . . . . . . . . . . . . . . . . . . . . . . . . . . . . . . . . . . . . . . . . . . . . . . . . . . 1.50% 0.10% 1.00% 2.90%BD . . . . . . . . . . . . . . . . . . . . . . . . . . . . . . . . . . . . . . . . . . . . . . . . . 1.50% 0.10% 1.00% 2.90%BD AUD H . . . . . . . . . . . . . . . . . . . . . . . . . . . . . . . . . . . . . . . . . . 1.50% 0.10% 1.00% 2.90%BD EUR H . . . . . . . . . . . . . . . . . . . . . . . . . . . . . . . . . . . . . . . . . . . 1.50% 0.10% 1.00% 2.91%BD ZAR H . . . . . . . . . . . . . . . . . . . . . . . . . . . . . . . . . . . . . . . . . . . 1.50% 0.10% 1.00% 2.90%C . . . . . . . . . . . . . . . . . . . . . . . . . . . . . . . . . . . . . . . . . . . . . . . . . . 1.95% 0.10% N/A 2.36%I . . . . . . . . . . . . . . . . . . . . . . . . . . . . . . . . . . . . . . . . . . . . . . . . . . . 0.70% 0.10% N/A 1.10%S . . . . . . . . . . . . . . . . . . . . . . . . . . . . . . . . . . . . . . . . . . . . . . . . . . . N/A 0.01%(11) N/A 0.12%S GBP H . . . . . . . . . . . . . . . . . . . . . . . . . . . . . . . . . . . . . . . . . . . . N/A 0.01%(11) N/A 0.12%S1 . . . . . . . . . . . . . . . . . . . . . . . . . . . . . . . . . . . . . . . . . . . . . . . . . . 0.70% 0.01%(11) N/A 0.82%S1A GB . . . . . . . . . . . . . . . . . . . . . . . . . . . . . . . . . . . . . . . . . . . . . 0.70% 0.01%(11) N/A 0.82%SD . . . . . . . . . . . . . . . . . . . . . . . . . . . . . . . . . . . . . . . . . . . . . . . . . N/A 0.01%(11) N/A 0.12%
Emerging Markets Growth PortfolioClass
A . . . . . . . . . . . . . . . . . . . . . . . . . . . . . . . . . . . . . . . . . . . . . . . . . . 1.70% 0.10% N/A 2.02%A AUD H . . . . . . . . . . . . . . . . . . . . . . . . . . . . . . . . . . . . . . . . . . . . 1.70% 0.10% N/A 2.02%AD . . . . . . . . . . . . . . . . . . . . . . . . . . . . . . . . . . . . . . . . . . . . . . . . . 1.70% 0.10% N/A 1.80%A SGD H . . . . . . . . . . . . . . . . . . . . . . . . . . . . . . . . . . . . . . . . . . . . 1.70% 0.10% N/A 2.01%B . . . . . . . . . . . . . . . . . . . . . . . . . . . . . . . . . . . . . . . . . . . . . . . . . . 1.70% 0.10% 1.00% 3.02%
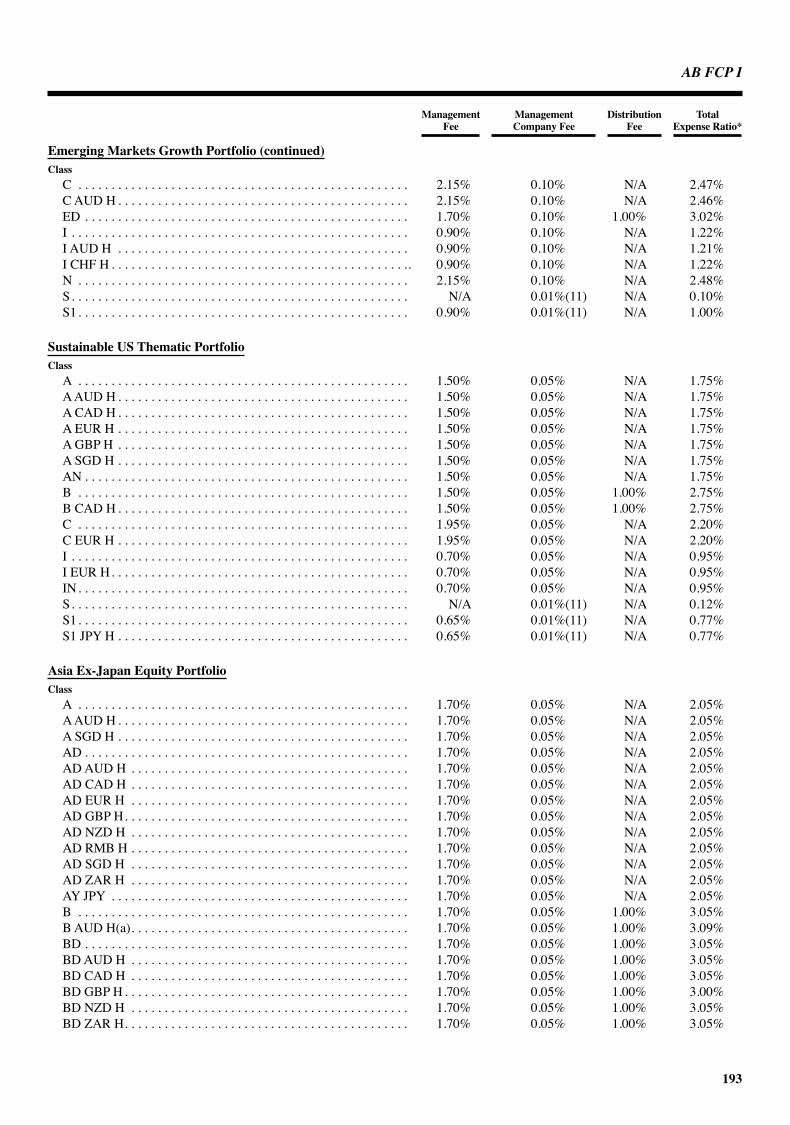
AB FCP I
193
Management Management Distribution Total Fee Company Fee Fee Expense Ratio*
Emerging Markets Growth Portfolio (continued)Class
C . . . . . . . . . . . . . . . . . . . . . . . . . . . . . . . . . . . . . . . . . . . . . . . . . . 2.15% 0.10% N/A 2.47%C AUD H . . . . . . . . . . . . . . . . . . . . . . . . . . . . . . . . . . . . . . . . . . . . 2.15% 0.10% N/A 2.46%ED . . . . . . . . . . . . . . . . . . . . . . . . . . . . . . . . . . . . . . . . . . . . . . . . . 1.70% 0.10% 1.00% 3.02%I . . . . . . . . . . . . . . . . . . . . . . . . . . . . . . . . . . . . . . . . . . . . . . . . . . . 0.90% 0.10% N/A 1.22%I AUD H . . . . . . . . . . . . . . . . . . . . . . . . . . . . . . . . . . . . . . . . . . . . 0.90% 0.10% N/A 1.21%I CHF H . . . . . . . . . . . . . . . . . . . . . . . . . . . . . . . . . . . . . . . . . . . . .. 0.90% 0.10% N/A 1.22%N . . . . . . . . . . . . . . . . . . . . . . . . . . . . . . . . . . . . . . . . . . . . . . . . . . 2.15% 0.10% N/A 2.48%S . . . . . . . . . . . . . . . . . . . . . . . . . . . . . . . . . . . . . . . . . . . . . . . . . . . N/A 0.01%(11) N/A 0.10%S1 . . . . . . . . . . . . . . . . . . . . . . . . . . . . . . . . . . . . . . . . . . . . . . . . . . 0.90% 0.01%(11) N/A 1.00%
Sustainable US Thematic PortfolioClass
A . . . . . . . . . . . . . . . . . . . . . . . . . . . . . . . . . . . . . . . . . . . . . . . . . . 1.50% 0.05% N/A 1.75%A AUD H . . . . . . . . . . . . . . . . . . . . . . . . . . . . . . . . . . . . . . . . . . . . 1.50% 0.05% N/A 1.75%A CAD H . . . . . . . . . . . . . . . . . . . . . . . . . . . . . . . . . . . . . . . . . . . . 1.50% 0.05% N/A 1.75%A EUR H . . . . . . . . . . . . . . . . . . . . . . . . . . . . . . . . . . . . . . . . . . . . 1.50% 0.05% N/A 1.75%A GBP H . . . . . . . . . . . . . . . . . . . . . . . . . . . . . . . . . . . . . . . . . . . . 1.50% 0.05% N/A 1.75%A SGD H . . . . . . . . . . . . . . . . . . . . . . . . . . . . . . . . . . . . . . . . . . . . 1.50% 0.05% N/A 1.75%AN . . . . . . . . . . . . . . . . . . . . . . . . . . . . . . . . . . . . . . . . . . . . . . . . . 1.50% 0.05% N/A 1.75%B . . . . . . . . . . . . . . . . . . . . . . . . . . . . . . . . . . . . . . . . . . . . . . . . . . 1.50% 0.05% 1.00% 2.75%B CAD H . . . . . . . . . . . . . . . . . . . . . . . . . . . . . . . . . . . . . . . . . . . . 1.50% 0.05% 1.00% 2.75%C . . . . . . . . . . . . . . . . . . . . . . . . . . . . . . . . . . . . . . . . . . . . . . . . . . 1.95% 0.05% N/A 2.20%C EUR H . . . . . . . . . . . . . . . . . . . . . . . . . . . . . . . . . . . . . . . . . . . . 1.95% 0.05% N/A 2.20%I . . . . . . . . . . . . . . . . . . . . . . . . . . . . . . . . . . . . . . . . . . . . . . . . . . . 0.70% 0.05% N/A 0.95%I EUR H . . . . . . . . . . . . . . . . . . . . . . . . . . . . . . . . . . . . . . . . . . . . . 0.70% 0.05% N/A 0.95%IN . . . . . . . . . . . . . . . . . . . . . . . . . . . . . . . . . . . . . . . . . . . . . . . . . . 0.70% 0.05% N/A 0.95%S . . . . . . . . . . . . . . . . . . . . . . . . . . . . . . . . . . . . . . . . . . . . . . . . . . . N/A 0.01%(11) N/A 0.12%S1 . . . . . . . . . . . . . . . . . . . . . . . . . . . . . . . . . . . . . . . . . . . . . . . . . . 0.65% 0.01%(11) N/A 0.77%S1 JPY H . . . . . . . . . . . . . . . . . . . . . . . . . . . . . . . . . . . . . . . . . . . . 0.65% 0.01%(11) N/A 0.77%
Asia Ex-Japan Equity PortfolioClass
A . . . . . . . . . . . . . . . . . . . . . . . . . . . . . . . . . . . . . . . . . . . . . . . . . . 1.70% 0.05% N/A 2.05%A AUD H . . . . . . . . . . . . . . . . . . . . . . . . . . . . . . . . . . . . . . . . . . . . 1.70% 0.05% N/A 2.05%A SGD H . . . . . . . . . . . . . . . . . . . . . . . . . . . . . . . . . . . . . . . . . . . . 1.70% 0.05% N/A 2.05%AD . . . . . . . . . . . . . . . . . . . . . . . . . . . . . . . . . . . . . . . . . . . . . . . . . 1.70% 0.05% N/A 2.05%AD AUD H . . . . . . . . . . . . . . . . . . . . . . . . . . . . . . . . . . . . . . . . . . 1.70% 0.05% N/A 2.05%AD CAD H . . . . . . . . . . . . . . . . . . . . . . . . . . . . . . . . . . . . . . . . . . 1.70% 0.05% N/A 2.05%AD EUR H . . . . . . . . . . . . . . . . . . . . . . . . . . . . . . . . . . . . . . . . . . 1.70% 0.05% N/A 2.05%AD GBP H . . . . . . . . . . . . . . . . . . . . . . . . . . . . . . . . . . . . . . . . . . . 1.70% 0.05% N/A 2.05%AD NZD H . . . . . . . . . . . . . . . . . . . . . . . . . . . . . . . . . . . . . . . . . . 1.70% 0.05% N/A 2.05%AD RMB H . . . . . . . . . . . . . . . . . . . . . . . . . . . . . . . . . . . . . . . . . . 1.70% 0.05% N/A 2.05%AD SGD H . . . . . . . . . . . . . . . . . . . . . . . . . . . . . . . . . . . . . . . . . . 1.70% 0.05% N/A 2.05%AD ZAR H . . . . . . . . . . . . . . . . . . . . . . . . . . . . . . . . . . . . . . . . . . 1.70% 0.05% N/A 2.05%AY JPY . . . . . . . . . . . . . . . . . . . . . . . . . . . . . . . . . . . . . . . . . . . . . 1.70% 0.05% N/A 2.05%B . . . . . . . . . . . . . . . . . . . . . . . . . . . . . . . . . . . . . . . . . . . . . . . . . . 1.70% 0.05% 1.00% 3.05%B AUD H(a) . . . . . . . . . . . . . . . . . . . . . . . . . . . . . . . . . . . . . . . . . . 1.70% 0.05% 1.00% 3.09%BD . . . . . . . . . . . . . . . . . . . . . . . . . . . . . . . . . . . . . . . . . . . . . . . . . 1.70% 0.05% 1.00% 3.05%BD AUD H . . . . . . . . . . . . . . . . . . . . . . . . . . . . . . . . . . . . . . . . . . 1.70% 0.05% 1.00% 3.05%BD CAD H . . . . . . . . . . . . . . . . . . . . . . . . . . . . . . . . . . . . . . . . . . 1.70% 0.05% 1.00% 3.05%BD GBP H . . . . . . . . . . . . . . . . . . . . . . . . . . . . . . . . . . . . . . . . . . . 1.70% 0.05% 1.00% 3.00%BD NZD H . . . . . . . . . . . . . . . . . . . . . . . . . . . . . . . . . . . . . . . . . . 1.70% 0.05% 1.00% 3.05%BD ZAR H . . . . . . . . . . . . . . . . . . . . . . . . . . . . . . . . . . . . . . . . . . . 1.70% 0.05% 1.00% 3.05%

AB FCP I
194
Table 1Fee Schedule (continued)
Management Management Distribution Total Fee Company Fee Fee Expense Ratio*
Asia Ex-Japan Equity Portfolio (continued)Class
BY JPY . . . . . . . . . . . . . . . . . . . . . . . . . . . . . . . . . . . . . . . . . . . . . 1.45% 0.05% 0.72% 2.52%C . . . . . . . . . . . . . . . . . . . . . . . . . . . . . . . . . . . . . . . . . . . . . . . . . . 2.15% 0.05% N/A 2.50%C AUD H . . . . . . . . . . . . . . . . . . . . . . . . . . . . . . . . . . . . . . . . . . . . 2.15% 0.05% N/A 2.50%ED . . . . . . . . . . . . . . . . . . . . . . . . . . . . . . . . . . . . . . . . . . . . . . . . . 1.70% 0.05% 1.00% 3.05%I . . . . . . . . . . . . . . . . . . . . . . . . . . . . . . . . . . . . . . . . . . . . . . . . . . . 0.90% 0.05% N/A 1.25%I AUD H . . . . . . . . . . . . . . . . . . . . . . . . . . . . . . . . . . . . . . . . . . . . 0.90% 0.05% N/A 1.25%I GBP . . . . . . . . . . . . . . . . . . . . . . . . . . . . . . . . . . . . . . . . . . . . . . . 0.90% 0.05% N/A 1.25%ID . . . . . . . . . . . . . . . . . . . . . . . . . . . . . . . . . . . . . . . . . . . . . . . . . . 0.90% 0.05% N/A 1.25%ID AUD H . . . . . . . . . . . . . . . . . . . . . . . . . . . . . . . . . . . . . . . . . . . 0.90% 0.05% N/A 1.25%S . . . . . . . . . . . . . . . . . . . . . . . . . . . . . . . . . . . . . . . . . . . . . . . . . . . N/A 0.01%(11) N/A 0.13%S1 . . . . . . . . . . . . . . . . . . . . . . . . . . . . . . . . . . . . . . . . . . . . . . . . . . 0.90% 0.01%(11) N/A 1.03%SD . . . . . . . . . . . . . . . . . . . . . . . . . . . . . . . . . . . . . . . . . . . . . . . . . N/A 0.01%(11) N/A 0.13%
Japan Strategic Value PortfolioClass
2 . . . . . . . . . . . . . . . . . . . . . . . . . . . . . . . . . . . . . . . . . . . . . . . . . . . 1.20% 0.05% N/A 1.35%A . . . . . . . . . . . . . . . . . . . . . . . . . . . . . . . . . . . . . . . . . . . . . . . . . . 1.50% 0.05% N/A 2.05%A AUD H . . . . . . . . . . . . . . . . . . . . . . . . . . . . . . . . . . . . . . . . . . . . 1.50% 0.05% N/A 2.05%A EUR H . . . . . . . . . . . . . . . . . . . . . . . . . . . . . . . . . . . . . . . . . . . . 1.50% 0.05% N/A 2.06%A CZK H . . . . . . . . . . . . . . . . . . . . . . . . . . . . . . . . . . . . . . . . . . . . 1.50% 0.05% N/A 2.06%A NZD H . . . . . . . . . . . . . . . . . . . . . . . . . . . . . . . . . . . . . . . . . . . . 1.50% 0.05% N/A 2.06%A SGD H . . . . . . . . . . . . . . . . . . . . . . . . . . . . . . . . . . . . . . . . . . . . 1.50% 0.05% N/A 2.05%A USD H . . . . . . . . . . . . . . . . . . . . . . . . . . . . . . . . . . . . . . . . . . . . 1.50% 0.05% N/A 2.06%AD . . . . . . . . . . . . . . . . . . . . . . . . . . . . . . . . . . . . . . . . . . . . . . . . . 1.50% 0.05% N/A 2.06%AD AUD H . . . . . . . . . . . . . . . . . . . . . . . . . . . . . . . . . . . . . . . . . . 1.50% 0.05% N/A 2.06%AD NZD H . . . . . . . . . . . . . . . . . . . . . . . . . . . . . . . . . . . . . . . . . . 1.50% 0.05% N/A 2.06%AD USD H . . . . . . . . . . . . . . . . . . . . . . . . . . . . . . . . . . . . . . . . . . 1.50% 0.05% N/A 2.06%AD ZAR H . . . . . . . . . . . . . . . . . . . . . . . . . . . . . . . . . . . . . . . . . . 1.50% 0.05% N/A 2.06%B . . . . . . . . . . . . . . . . . . . . . . . . . . . . . . . . . . . . . . . . . . . . . . . . . . 1.50% 0.05% 1.00% 3.05%BD . . . . . . . . . . . . . . . . . . . . . . . . . . . . . . . . . . . . . . . . . . . . . . . . . 1.50% 0.05% 1.00% 3.05%BD AUD H . . . . . . . . . . . . . . . . . . . . . . . . . . . . . . . . . . . . . . . . . . 1.50% 0.05% 1.00% 3.04%BD USD H . . . . . . . . . . . . . . . . . . . . . . . . . . . . . . . . . . . . . . . . . . . 1.50% 0.05% 1.00% 3.05%BD ZAR H . . . . . . . . . . . . . . . . . . . . . . . . . . . . . . . . . . . . . . . . . . . 1.50% 0.05% 1.00% 3.06%C . . . . . . . . . . . . . . . . . . . . . . . . . . . . . . . . . . . . . . . . . . . . . . . . . . 1.95% 0.05% N/A 2.51%C EUR H . . . . . . . . . . . . . . . . . . . . . . . . . . . . . . . . . . . . . . . . . . . . 1.95% 0.05% N/A 2.50%I . . . . . . . . . . . . . . . . . . . . . . . . . . . . . . . . . . . . . . . . . . . . . . . . . . . 0.70% 0.05% N/A 1.27%I EUR H . . . . . . . . . . . . . . . . . . . . . . . . . . . . . . . . . . . . . . . . . . . . . 0.70% 0.05% N/A 1.25%I USD H . . . . . . . . . . . . . . . . . . . . . . . . . . . . . . . . . . . . . . . . . . . . . 0.70% 0.05% N/A 1.26%S EUR H . . . . . . . . . . . . . . . . . . . . . . . . . . . . . . . . . . . . . . . . . . . . N/A 0.01%(11) N/A 0.10%S1 . . . . . . . . . . . . . . . . . . . . . . . . . . . . . . . . . . . . . . . . . . . . . . . . . . 0.65% 0.01%(11) N/A 0.77%S1 USD H . . . . . . . . . . . . . . . . . . . . . . . . . . . . . . . . . . . . . . . . . . . 0.65% 0.01%(11) N/A 0.77%SD . . . . . . . . . . . . . . . . . . . . . . . . . . . . . . . . . . . . . . . . . . . . . . . . . N/A 0.01%(11) N/A 0.12%
China Opportunity PortfolioClass
A . . . . . . . . . . . . . . . . . . . . . . . . . . . . . . . . . . . . . . . . . . . . . . . . . . 2.00%(1) 0.05% N/A 2.50%AD . . . . . . . . . . . . . . . . . . . . . . . . . . . . . . . . . . . . . . . . . . . . . . . . . 2.00%(1) 0.05% N/A 2.49%AD AUD H . . . . . . . . . . . . . . . . . . . . . . . . . . . . . . . . . . . . . . . . . . 2.00%(1) 0.05% N/A 2.49%AD CAD H . . . . . . . . . . . . . . . . . . . . . . . . . . . . . . . . . . . . . . . . . . 2.00%(1) 0.05% N/A 2.49%AD EUR H . . . . . . . . . . . . . . . . . . . . . . . . . . . . . . . . . . . . . . . . . . 2.00%(1) 0.05% N/A 2.49%AD GBP H . . . . . . . . . . . . . . . . . . . . . . . . . . . . . . . . . . . . . . . . . . . 2.00%(1) 0.05% N/A 2.50%AD NZD H . . . . . . . . . . . . . . . . . . . . . . . . . . . . . . . . . . . . . . . . . . 2.00%(1) 0.05% N/A 2.49%AD RMB H . . . . . . . . . . . . . . . . . . . . . . . . . . . . . . . . . . . . . . . . . . 2.00%(1) 0.05% N/A 2.51%

AB FCP I
195
Management Management Distribution Total Fee Company Fee Fee Expense Ratio*
China Opportunity Portfolio (continued)Class
AD SGD H . . . . . . . . . . . . . . . . . . . . . . . . . . . . . . . . . . . . . . . . . . 2.00%(1) 0.05% N/A 2.50%AD ZAR H . . . . . . . . . . . . . . . . . . . . . . . . . . . . . . . . . . . . . . . . . . 2.00%(1) 0.05% N/A 2.49%B . . . . . . . . . . . . . . . . . . . . . . . . . . . . . . . . . . . . . . . . . . . . . . . . . . 2.00%(1) 0.05% 1.00% 3.49%BD . . . . . . . . . . . . . . . . . . . . . . . . . . . . . . . . . . . . . . . . . . . . . . . . . 2.00%(1) 0.05% 1.00% 3.49%BD AUD H . . . . . . . . . . . . . . . . . . . . . . . . . . . . . . . . . . . . . . . . . . 2.00%(1) 0.05% 1.00% 3.49%BD EUR H . . . . . . . . . . . . . . . . . . . . . . . . . . . . . . . . . . . . . . . . . . . 2.00%(1) 0.05% 1.00% 3.49%BD NZD H . . . . . . . . . . . . . . . . . . . . . . . . . . . . . . . . . . . . . . . . . . 2.00%(1) 0.05% 1.00% 3.49%BD ZAR H . . . . . . . . . . . . . . . . . . . . . . . . . . . . . . . . . . . . . . . . . . . 2.00%(1) 0.05% 1.00% 3.48%C . . . . . . . . . . . . . . . . . . . . . . . . . . . . . . . . . . . . . . . . . . . . . . . . . . 2.45%(2) 0.05% N/A 2.94%I . . . . . . . . . . . . . . . . . . . . . . . . . . . . . . . . . . . . . . . . . . . . . . . . . . . 1.20%(3) 0.05% N/A 1.71%S . . . . . . . . . . . . . . . . . . . . . . . . . . . . . . . . . . . . . . . . . . . . . . . . . . . N/A 0.01%(11) N/A 0.14%S1 . . . . . . . . . . . . . . . . . . . . . . . . . . . . . . . . . . . . . . . . . . . . . . . . . . 0.90% 0.01%(11) N/A 1.04%
Global Bond PortfolioClass
A . . . . . . . . . . . . . . . . . . . . . . . . . . . . . . . . . . . . . . . . . . . . . . . . . . 1.10% 0.10% N/A 1.47%A2 . . . . . . . . . . . . . . . . . . . . . . . . . . . . . . . . . . . . . . . . . . . . . . . . . 1.10% 0.10% N/A 1.47%A2 EUR H . . . . . . . . . . . . . . . . . . . . . . . . . . . . . . . . . . . . . . . . . . . 1.10% 0.10% N/A 1.41%A2 SGD H . . . . . . . . . . . . . . . . . . . . . . . . . . . . . . . . . . . . . . . . . . . 1.10% 0.10% N/A 1.43%AA . . . . . . . . . . . . . . . . . . . . . . . . . . . . . . . . . . . . . . . . . . . . . . . . . 1.10% 0.10% N/A 1.47%AA AUD H . . . . . . . . . . . . . . . . . . . . . . . . . . . . . . . . . . . . . . . . . . 1.10% 0.10% N/A 1.48%AA CAD H . . . . . . . . . . . . . . . . . . . . . . . . . . . . . . . . . . . . . . . . . . 1.10% 0.10% N/A 1.47%AA GBP H . . . . . . . . . . . . . . . . . . . . . . . . . . . . . . . . . . . . . . . . . . . 1.10% 0.10% N/A 1.45%AA NZD H . . . . . . . . . . . . . . . . . . . . . . . . . . . . . . . . . . . . . . . . . . 1.10% 0.10% N/A 1.46%AA SGD H . . . . . . . . . . . . . . . . . . . . . . . . . . . . . . . . . . . . . . . . . . . 1.10% 0.10% N/A 1.47%AJ . . . . . . . . . . . . . . . . . . . . . . . . . . . . . . . . . . . . . . . . . . . . . . . . . . 1.10% 0.10% N/A 1.47%AR EUR H . . . . . . . . . . . . . . . . . . . . . . . . . . . . . . . . . . . . . . . . . . . 1.10% 0.10% N/A 1.47%AT . . . . . . . . . . . . . . . . . . . . . . . . . . . . . . . . . . . . . . . . . . . . . . . . . 1.10% 0.10% N/A 1.47%AT AUD H . . . . . . . . . . . . . . . . . . . . . . . . . . . . . . . . . . . . . . . . . . . 1.10% 0.10% N/A 1.47%AT CAD H . . . . . . . . . . . . . . . . . . . . . . . . . . . . . . . . . . . . . . . . . . . 1.10% 0.10% N/A 1.48%AT EUR H . . . . . . . . . . . . . . . . . . . . . . . . . . . . . . . . . . . . . . . . . . . 1.10% 0.10% N/A 1.47%AT GBP H . . . . . . . . . . . . . . . . . . . . . . . . . . . . . . . . . . . . . . . . . . . 1.10% 0.10% N/A 1.48%AT NZD H . . . . . . . . . . . . . . . . . . . . . . . . . . . . . . . . . . . . . . . . . . . 1.10% 0.10% N/A 1.47%AT SGD H . . . . . . . . . . . . . . . . . . . . . . . . . . . . . . . . . . . . . . . . . . . 1.10% 0.10% N/A 1.47%AX . . . . . . . . . . . . . . . . . . . . . . . . . . . . . . . . . . . . . . . . . . . . . . . . . 0.85% 0.10% N/A 1.22%B . . . . . . . . . . . . . . . . . . . . . . . . . . . . . . . . . . . . . . . . . . . . . . . . . . 1.10% 0.10% 1.00% 2.47%B2 . . . . . . . . . . . . . . . . . . . . . . . . . . . . . . . . . . . . . . . . . . . . . . . . . 1.10% 0.10% 1.00% 2.47%BA . . . . . . . . . . . . . . . . . . . . . . . . . . . . . . . . . . . . . . . . . . . . . . . . . 1.10% 0.10% 1.00% 2.47%BA AUD H . . . . . . . . . . . . . . . . . . . . . . . . . . . . . . . . . . . . . . . . . . 1.10% 0.10% 1.00% 2.46%BT . . . . . . . . . . . . . . . . . . . . . . . . . . . . . . . . . . . . . . . . . . . . . . . . . 1.10% 0.10% 1.00% 2.47%BT AUD H . . . . . . . . . . . . . . . . . . . . . . . . . . . . . . . . . . . . . . . . . . . 1.10% 0.10% 1.00% 2.47%BT CAD H . . . . . . . . . . . . . . . . . . . . . . . . . . . . . . . . . . . . . . . . . . . 1.10% 0.10% 1.00% 2.47%BT EUR H(b) . . . . . . . . . . . . . . . . . . . . . . . . . . . . . . . . . . . . . . . . . 1.10% 0.10% 1.00% 2.49%BT GBP H . . . . . . . . . . . . . . . . . . . . . . . . . . . . . . . . . . . . . . . . . . . 1.10% 0.10% 1.00% 2.47%BT NZD H(c) . . . . . . . . . . . . . . . . . . . . . . . . . . . . . . . . . . . . . . . . . 1.10% 0.10% 1.00% 2.46%BX . . . . . . . . . . . . . . . . . . . . . . . . . . . . . . . . . . . . . . . . . . . . . . . . . 0.85% 0.10% N/A 1.21%C . . . . . . . . . . . . . . . . . . . . . . . . . . . . . . . . . . . . . . . . . . . . . . . . . . 1.55% 0.10% N/A 1.92%C2 . . . . . . . . . . . . . . . . . . . . . . . . . . . . . . . . . . . . . . . . . . . . . . . . . 1.55% 0.10% N/A 1.92%C2 EUR H . . . . . . . . . . . . . . . . . . . . . . . . . . . . . . . . . . . . . . . . . . . 1.55% 0.10% N/A 1.90%I . . . . . . . . . . . . . . . . . . . . . . . . . . . . . . . . . . . . . . . . . . . . . . . . . . . 0.55% 0.10% N/A 0.92%I2 . . . . . . . . . . . . . . . . . . . . . . . . . . . . . . . . . . . . . . . . . . . . . . . . . . 0.55% 0.10% N/A 0.92%I2 AUD H . . . . . . . . . . . . . . . . . . . . . . . . . . . . . . . . . . . . . . . . . . . 0.55% 0.10% N/A 0.92%I2 EUR H . . . . . . . . . . . . . . . . . . . . . . . . . . . . . . . . . . . . . . . . . . . . 0.55% 0.10% N/A 0.92%

AB FCP I
196
Table 1Fee Schedule (continued)
Management Management Distribution Total Fee Company Fee Fee Expense Ratio*
Global Bond Portfolio (continued)Class
IT . . . . . . . . . . . . . . . . . . . . . . . . . . . . . . . . . . . . . . . . . . . . . . . . . . 0.55% 0.10% N/A 0.92%IT AUD H . . . . . . . . . . . . . . . . . . . . . . . . . . . . . . . . . . . . . . . . . . . 0.55% 0.10% N/A 0.91%N2 . . . . . . . . . . . . . . . . . . . . . . . . . . . . . . . . . . . . . . . . . . . . . . . . . 1.65% 0.10% N/A 2.02%NT . . . . . . . . . . . . . . . . . . . . . . . . . . . . . . . . . . . . . . . . . . . . . . . . . 1.65% 0.10% N/A 2.02%S EUR H . . . . . . . . . . . . . . . . . . . . . . . . . . . . . . . . . . . . . . . . . . . . N/A 0.01%(11) N/A 0.11%S SGD H . . . . . . . . . . . . . . . . . . . . . . . . . . . . . . . . . . . . . . . . . . . . N/A 0.01%(11) N/A 0.09%S1 2 . . . . . . . . . . . . . . . . . . . . . . . . . . . . . . . . . . . . . . . . . . . . . . . . 0.50% 0.01%(11) N/A 0.61%S1 EUR H . . . . . . . . . . . . . . . . . . . . . . . . . . . . . . . . . . . . . . . . . . . 0.50% 0.01%(11) N/A 0.63%SA . . . . . . . . . . . . . . . . . . . . . . . . . . . . . . . . . . . . . . . . . . . . . . . . . N/A 0.01%(11) N/A 0.11%
Global High Yield Portfolio**Class
A . . . . . . . . . . . . . . . . . . . . . . . . . . . . . . . . . . . . . . . . . . . . . . . . . . 1.55%(4) 0.10% N/A 1.79%A2 . . . . . . . . . . . . . . . . . . . . . . . . . . . . . . . . . . . . . . . . . . . . . . . . . 1.55%(4) 0.10% N/A 1.79%A2 CHF H . . . . . . . . . . . . . . . . . . . . . . . . . . . . . . . . . . . . . . . . . . . 1.55%(4) 0.10% N/A 1.79%A2 EUR H . . . . . . . . . . . . . . . . . . . . . . . . . . . . . . . . . . . . . . . . . . . 1.55%(4) 0.10% N/A 1.79%A2 SGD H . . . . . . . . . . . . . . . . . . . . . . . . . . . . . . . . . . . . . . . . . . . 1.55%(4) 0.10% N/A 1.79%AA . . . . . . . . . . . . . . . . . . . . . . . . . . . . . . . . . . . . . . . . . . . . . . . . . 1.55%(4) 0.10% N/A 1.79%AA AUD H . . . . . . . . . . . . . . . . . . . . . . . . . . . . . . . . . . . . . . . . . . 1.55%(4) 0.10% N/A 1.79%AA CAD H . . . . . . . . . . . . . . . . . . . . . . . . . . . . . . . . . . . . . . . . . . 1.55%(4) 0.10% N/A 1.79%AA EUR H . . . . . . . . . . . . . . . . . . . . . . . . . . . . . . . . . . . . . . . . . . . 1.55%(4) 0.10% N/A 1.79%AA GBP H . . . . . . . . . . . . . . . . . . . . . . . . . . . . . . . . . . . . . . . . . . . 1.55%(4) 0.10% N/A 1.79%AA NZD H . . . . . . . . . . . . . . . . . . . . . . . . . . . . . . . . . . . . . . . . . . 1.55%(4) 0.10% N/A 1.79%AA RMB H . . . . . . . . . . . . . . . . . . . . . . . . . . . . . . . . . . . . . . . . . . 1.55%(4) 0.10% N/A 1.79%AA SGD H . . . . . . . . . . . . . . . . . . . . . . . . . . . . . . . . . . . . . . . . . . . 1.55%(4) 0.10% N/A 1.79%AA ZAR H . . . . . . . . . . . . . . . . . . . . . . . . . . . . . . . . . . . . . . . . . . . 1.55%(4) 0.10% N/A 1.79%AK . . . . . . . . . . . . . . . . . . . . . . . . . . . . . . . . . . . . . . . . . . . . . . . . . 1.55%(4) 0.10% N/A 1.79%AK EUR H . . . . . . . . . . . . . . . . . . . . . . . . . . . . . . . . . . . . . . . . . . 1.55%(4) 0.10% N/A 1.78%AR EUR H . . . . . . . . . . . . . . . . . . . . . . . . . . . . . . . . . . . . . . . . . . . 1.55%(4) 0.10% N/A 1.79%AT . . . . . . . . . . . . . . . . . . . . . . . . . . . . . . . . . . . . . . . . . . . . . . . . . 1.55%(4) 0.10% N/A 1.79%AT AUD H . . . . . . . . . . . . . . . . . . . . . . . . . . . . . . . . . . . . . . . . . . . 1.55%(4) 0.10% N/A 1.79%AT CAD H . . . . . . . . . . . . . . . . . . . . . . . . . . . . . . . . . . . . . . . . . . . 1.55%(4) 0.10% N/A 1.79%AT EUR H . . . . . . . . . . . . . . . . . . . . . . . . . . . . . . . . . . . . . . . . . . . 1.55%(4) 0.10% N/A 1.79%AT GBP H . . . . . . . . . . . . . . . . . . . . . . . . . . . . . . . . . . . . . . . . . . . 1.55%(4) 0.10% N/A 1.79%AT NZD H . . . . . . . . . . . . . . . . . . . . . . . . . . . . . . . . . . . . . . . . . . . 1.55%(4) 0.10% N/A 1.79%AT RMB H . . . . . . . . . . . . . . . . . . . . . . . . . . . . . . . . . . . . . . . . . . . 1.55%(4) 0.10% N/A 1.79%AT SGD H . . . . . . . . . . . . . . . . . . . . . . . . . . . . . . . . . . . . . . . . . . . 1.55%(4) 0.10% N/A 1.79%B . . . . . . . . . . . . . . . . . . . . . . . . . . . . . . . . . . . . . . . . . . . . . . . . . . 1.55%(4) 0.10% 1.00% 2.79%B2 . . . . . . . . . . . . . . . . . . . . . . . . . . . . . . . . . . . . . . . . . . . . . . . . . 1.55%(4) 0.10% 1.00% 2.78%B2 EUR H . . . . . . . . . . . . . . . . . . . . . . . . . . . . . . . . . . . . . . . . . . . 1.55%(4) 0.10% 1.00% 2.77%BA . . . . . . . . . . . . . . . . . . . . . . . . . . . . . . . . . . . . . . . . . . . . . . . . . 1.55%(4) 0.10% 1.00% 2.78%BA AUD H . . . . . . . . . . . . . . . . . . . . . . . . . . . . . . . . . . . . . . . . . . 1.55%(4) 0.10% 1.00% 2.78%BA ZAR H . . . . . . . . . . . . . . . . . . . . . . . . . . . . . . . . . . . . . . . . . . . 1.55%(4) 0.10% 1.00% 2.77%BT . . . . . . . . . . . . . . . . . . . . . . . . . . . . . . . . . . . . . . . . . . . . . . . . . 1.55%(4) 0.10% 1.00% 2.78%BT AUD H . . . . . . . . . . . . . . . . . . . . . . . . . . . . . . . . . . . . . . . . . . . 1.55%(4) 0.10% 1.00% 2.78%BT CAD H . . . . . . . . . . . . . . . . . . . . . . . . . . . . . . . . . . . . . . . . . . . 1.55%(4) 0.10% 1.00% 2.79%BT EUR H . . . . . . . . . . . . . . . . . . . . . . . . . . . . . . . . . . . . . . . . . . . 1.55%(4) 0.10% 1.00% 2.78%BT GBP H . . . . . . . . . . . . . . . . . . . . . . . . . . . . . . . . . . . . . . . . . . . 1.55%(4) 0.10% 1.00% 2.79%BT NZD H . . . . . . . . . . . . . . . . . . . . . . . . . . . . . . . . . . . . . . . . . . . 1.55%(4) 0.10% 1.00% 2.78%C . . . . . . . . . . . . . . . . . . . . . . . . . . . . . . . . . . . . . . . . . . . . . . . . . . 2.00%(5) 0.10% N/A 2.24%C2 . . . . . . . . . . . . . . . . . . . . . . . . . . . . . . . . . . . . . . . . . . . . . . . . . 2.00%(5) 0.10% N/A 2.24%C2 EUR H . . . . . . . . . . . . . . . . . . . . . . . . . . . . . . . . . . . . . . . . . . . 2.00%(5) 0.10% N/A 2.24%CK . . . . . . . . . . . . . . . . . . . . . . . . . . . . . . . . . . . . . . . . . . . . . . . . . 2.00%(5) 0.10% N/A 2.24%CK EUR H . . . . . . . . . . . . . . . . . . . . . . . . . . . . . . . . . . . . . . . . . . . 2.00%(5) 0.10% N/A 2.24%
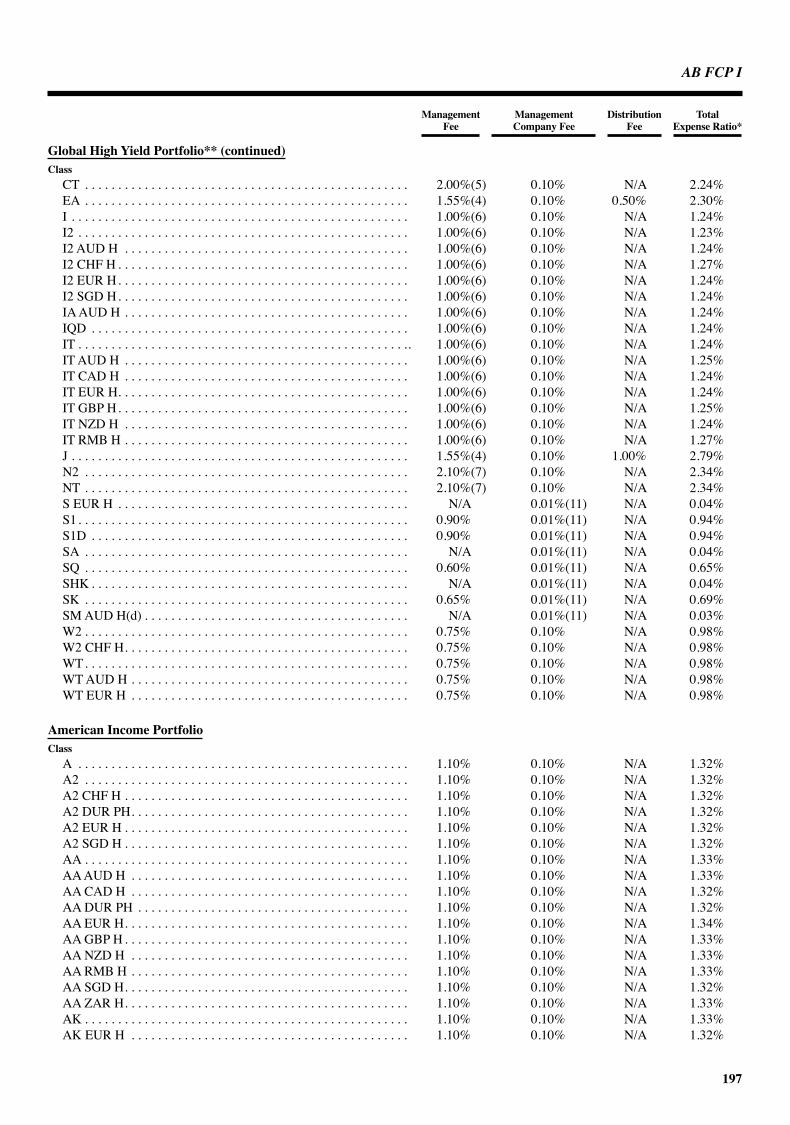
AB FCP I
197
Management Management Distribution Total Fee Company Fee Fee Expense Ratio*
Global High Yield Portfolio** (continued)Class
CT . . . . . . . . . . . . . . . . . . . . . . . . . . . . . . . . . . . . . . . . . . . . . . . . . 2.00%(5) 0.10% N/A 2.24%EA . . . . . . . . . . . . . . . . . . . . . . . . . . . . . . . . . . . . . . . . . . . . . . . . . 1.55%(4) 0.10% 0.50% 2.30%I . . . . . . . . . . . . . . . . . . . . . . . . . . . . . . . . . . . . . . . . . . . . . . . . . . . 1.00%(6) 0.10% N/A 1.24%I2 . . . . . . . . . . . . . . . . . . . . . . . . . . . . . . . . . . . . . . . . . . . . . . . . . . 1.00%(6) 0.10% N/A 1.23%I2 AUD H . . . . . . . . . . . . . . . . . . . . . . . . . . . . . . . . . . . . . . . . . . . 1.00%(6) 0.10% N/A 1.24%I2 CHF H . . . . . . . . . . . . . . . . . . . . . . . . . . . . . . . . . . . . . . . . . . . . 1.00%(6) 0.10% N/A 1.27%I2 EUR H . . . . . . . . . . . . . . . . . . . . . . . . . . . . . . . . . . . . . . . . . . . . 1.00%(6) 0.10% N/A 1.24%I2 SGD H . . . . . . . . . . . . . . . . . . . . . . . . . . . . . . . . . . . . . . . . . . . . 1.00%(6) 0.10% N/A 1.24%IA AUD H . . . . . . . . . . . . . . . . . . . . . . . . . . . . . . . . . . . . . . . . . . . 1.00%(6) 0.10% N/A 1.24%IQD . . . . . . . . . . . . . . . . . . . . . . . . . . . . . . . . . . . . . . . . . . . . . . . . 1.00%(6) 0.10% N/A 1.24%IT . . . . . . . . . . . . . . . . . . . . . . . . . . . . . . . . . . . . . . . . . . . . . . . . . .. 1.00%(6) 0.10% N/A 1.24%IT AUD H . . . . . . . . . . . . . . . . . . . . . . . . . . . . . . . . . . . . . . . . . . . 1.00%(6) 0.10% N/A 1.25%IT CAD H . . . . . . . . . . . . . . . . . . . . . . . . . . . . . . . . . . . . . . . . . . . 1.00%(6) 0.10% N/A 1.24%IT EUR H . . . . . . . . . . . . . . . . . . . . . . . . . . . . . . . . . . . . . . . . . . . . 1.00%(6) 0.10% N/A 1.24%IT GBP H . . . . . . . . . . . . . . . . . . . . . . . . . . . . . . . . . . . . . . . . . . . . 1.00%(6) 0.10% N/A 1.25%IT NZD H . . . . . . . . . . . . . . . . . . . . . . . . . . . . . . . . . . . . . . . . . . . 1.00%(6) 0.10% N/A 1.24%IT RMB H . . . . . . . . . . . . . . . . . . . . . . . . . . . . . . . . . . . . . . . . . . . 1.00%(6) 0.10% N/A 1.27%J . . . . . . . . . . . . . . . . . . . . . . . . . . . . . . . . . . . . . . . . . . . . . . . . . . . 1.55%(4) 0.10% 1.00% 2.79%N2 . . . . . . . . . . . . . . . . . . . . . . . . . . . . . . . . . . . . . . . . . . . . . . . . . 2.10%(7) 0.10% N/A 2.34%NT . . . . . . . . . . . . . . . . . . . . . . . . . . . . . . . . . . . . . . . . . . . . . . . . . 2.10%(7) 0.10% N/A 2.34%S EUR H . . . . . . . . . . . . . . . . . . . . . . . . . . . . . . . . . . . . . . . . . . . . N/A 0.01%(11) N/A 0.04%S1 . . . . . . . . . . . . . . . . . . . . . . . . . . . . . . . . . . . . . . . . . . . . . . . . . . 0.90% 0.01%(11) N/A 0.94%S1D . . . . . . . . . . . . . . . . . . . . . . . . . . . . . . . . . . . . . . . . . . . . . . . . 0.90% 0.01%(11) N/A 0.94%SA . . . . . . . . . . . . . . . . . . . . . . . . . . . . . . . . . . . . . . . . . . . . . . . . . N/A 0.01%(11) N/A 0.04%SQ . . . . . . . . . . . . . . . . . . . . . . . . . . . . . . . . . . . . . . . . . . . . . . . . . 0.60% 0.01%(11) N/A 0.65%SHK . . . . . . . . . . . . . . . . . . . . . . . . . . . . . . . . . . . . . . . . . . . . . . . . N/A 0.01%(11) N/A 0.04%SK . . . . . . . . . . . . . . . . . . . . . . . . . . . . . . . . . . . . . . . . . . . . . . . . . 0.65% 0.01%(11) N/A 0.69%SM AUD H(d) . . . . . . . . . . . . . . . . . . . . . . . . . . . . . . . . . . . . . . . . N/A 0.01%(11) N/A 0.03%W2 . . . . . . . . . . . . . . . . . . . . . . . . . . . . . . . . . . . . . . . . . . . . . . . . . 0.75% 0.10% N/A 0.98%W2 CHF H . . . . . . . . . . . . . . . . . . . . . . . . . . . . . . . . . . . . . . . . . . . 0.75% 0.10% N/A 0.98%WT . . . . . . . . . . . . . . . . . . . . . . . . . . . . . . . . . . . . . . . . . . . . . . . . . 0.75% 0.10% N/A 0.98%WT AUD H . . . . . . . . . . . . . . . . . . . . . . . . . . . . . . . . . . . . . . . . . . 0.75% 0.10% N/A 0.98%WT EUR H . . . . . . . . . . . . . . . . . . . . . . . . . . . . . . . . . . . . . . . . . . 0.75% 0.10% N/A 0.98%
American Income PortfolioClass
A . . . . . . . . . . . . . . . . . . . . . . . . . . . . . . . . . . . . . . . . . . . . . . . . . . 1.10% 0.10% N/A 1.32%A2 . . . . . . . . . . . . . . . . . . . . . . . . . . . . . . . . . . . . . . . . . . . . . . . . . 1.10% 0.10% N/A 1.32%A2 CHF H . . . . . . . . . . . . . . . . . . . . . . . . . . . . . . . . . . . . . . . . . . . 1.10% 0.10% N/A 1.32%A2 DUR PH . . . . . . . . . . . . . . . . . . . . . . . . . . . . . . . . . . . . . . . . . . 1.10% 0.10% N/A 1.32%A2 EUR H . . . . . . . . . . . . . . . . . . . . . . . . . . . . . . . . . . . . . . . . . . . 1.10% 0.10% N/A 1.32%A2 SGD H . . . . . . . . . . . . . . . . . . . . . . . . . . . . . . . . . . . . . . . . . . . 1.10% 0.10% N/A 1.32%AA . . . . . . . . . . . . . . . . . . . . . . . . . . . . . . . . . . . . . . . . . . . . . . . . . 1.10% 0.10% N/A 1.33%AA AUD H . . . . . . . . . . . . . . . . . . . . . . . . . . . . . . . . . . . . . . . . . . 1.10% 0.10% N/A 1.33%AA CAD H . . . . . . . . . . . . . . . . . . . . . . . . . . . . . . . . . . . . . . . . . . 1.10% 0.10% N/A 1.32%AA DUR PH . . . . . . . . . . . . . . . . . . . . . . . . . . . . . . . . . . . . . . . . . 1.10% 0.10% N/A 1.32%AA EUR H . . . . . . . . . . . . . . . . . . . . . . . . . . . . . . . . . . . . . . . . . . . 1.10% 0.10% N/A 1.34%AA GBP H . . . . . . . . . . . . . . . . . . . . . . . . . . . . . . . . . . . . . . . . . . . 1.10% 0.10% N/A 1.33%AA NZD H . . . . . . . . . . . . . . . . . . . . . . . . . . . . . . . . . . . . . . . . . . 1.10% 0.10% N/A 1.33%AA RMB H . . . . . . . . . . . . . . . . . . . . . . . . . . . . . . . . . . . . . . . . . . 1.10% 0.10% N/A 1.33%AA SGD H . . . . . . . . . . . . . . . . . . . . . . . . . . . . . . . . . . . . . . . . . . . 1.10% 0.10% N/A 1.32%AA ZAR H . . . . . . . . . . . . . . . . . . . . . . . . . . . . . . . . . . . . . . . . . . . 1.10% 0.10% N/A 1.33%AK . . . . . . . . . . . . . . . . . . . . . . . . . . . . . . . . . . . . . . . . . . . . . . . . . 1.10% 0.10% N/A 1.33%AK EUR H . . . . . . . . . . . . . . . . . . . . . . . . . . . . . . . . . . . . . . . . . . 1.10% 0.10% N/A 1.32%

AB FCP I
198
Table 1Fee Schedule (continued)
Management Management Distribution Total Fee Company Fee Fee Expense Ratio*
American Income Portfolio (continued)Class
AR EUR . . . . . . . . . . . . . . . . . . . . . . . . . . . . . . . . . . . . . . . . . . . . . 1.10% 0.10% N/A 1.32%AR EUR H . . . . . . . . . . . . . . . . . . . . . . . . . . . . . . . . . . . . . . . . . . . 1.10% 0.10% N/A 1.34%AT . . . . . . . . . . . . . . . . . . . . . . . . . . . . . . . . . . . . . . . . . . . . . . . . . 1.10% 0.10% N/A 1.33%AT AUD H . . . . . . . . . . . . . . . . . . . . . . . . . . . . . . . . . . . . . . . . . . . 1.10% 0.10% N/A 1.33%AT CAD H . . . . . . . . . . . . . . . . . . . . . . . . . . . . . . . . . . . . . . . . . . . 1.10% 0.10% N/A 1.33%AT DUR PH . . . . . . . . . . . . . . . . . . . . . . . . . . . . . . . . . . . . . . . . . . 1.10% 0.10% N/A 1.32%AT EUR H . . . . . . . . . . . . . . . . . . . . . . . . . . . . . . . . . . . . . . . . . . . 1.10% 0.10% N/A 1.32%AT GBP H . . . . . . . . . . . . . . . . . . . . . . . . . . . . . . . . . . . . . . . . . . . 1.10% 0.10% N/A 1.33%AT NZD H . . . . . . . . . . . . . . . . . . . . . . . . . . . . . . . . . . . . . . . . . . . 1.10% 0.10% N/A 1.32%AT RMB H . . . . . . . . . . . . . . . . . . . . . . . . . . . . . . . . . . . . . . . . . . . 1.10% 0.10% N/A 1.33%AT SGD H . . . . . . . . . . . . . . . . . . . . . . . . . . . . . . . . . . . . . . . . . . . 1.10% 0.10% N/A 1.32%B . . . . . . . . . . . . . . . . . . . . . . . . . . . . . . . . . . . . . . . . . . . . . . . . . . 1.10% 0.10% 0.70% 2.02%B2 . . . . . . . . . . . . . . . . . . . . . . . . . . . . . . . . . . . . . . . . . . . . . . . . . 1.10% 0.10% 0.70% 2.02%BA . . . . . . . . . . . . . . . . . . . . . . . . . . . . . . . . . . . . . . . . . . . . . . . . . 1.10% 0.10% 0.70% 2.02%BA AUD H . . . . . . . . . . . . . . . . . . . . . . . . . . . . . . . . . . . . . . . . . . 1.10% 0.10% 0.70% 2.02%BA ZAR H . . . . . . . . . . . . . . . . . . . . . . . . . . . . . . . . . . . . . . . . . . . 1.10% 0.10% 0.70% 2.02%BT . . . . . . . . . . . . . . . . . . . . . . . . . . . . . . . . . . . . . . . . . . . . . . . . . 1.10% 0.10% 0.70% 2.02%BT AUD H . . . . . . . . . . . . . . . . . . . . . . . . . . . . . . . . . . . . . . . . . . . 1.10% 0.10% 0.70% 2.02%BT CAD H . . . . . . . . . . . . . . . . . . . . . . . . . . . . . . . . . . . . . . . . . . . 1.10% 0.10% 0.70% 2.02%BT EUR H . . . . . . . . . . . . . . . . . . . . . . . . . . . . . . . . . . . . . . . . . . . 1.10% 0.10% 0.70% 2.02%BT GBP H . . . . . . . . . . . . . . . . . . . . . . . . . . . . . . . . . . . . . . . . . . . 1.10% 0.10% 0.70% 2.02%BT NZD H . . . . . . . . . . . . . . . . . . . . . . . . . . . . . . . . . . . . . . . . . . . 1.10% 0.10% 0.70% 2.02%C . . . . . . . . . . . . . . . . . . . . . . . . . . . . . . . . . . . . . . . . . . . . . . . . . . 1.55% 0.10% N/A 1.77%C2 . . . . . . . . . . . . . . . . . . . . . . . . . . . . . . . . . . . . . . . . . . . . . . . . . 1.55% 0.10% N/A 1.77%C2 DUR PH . . . . . . . . . . . . . . . . . . . . . . . . . . . . . . . . . . . . . . . . . . 1.55% 0.10% N/A 1.76%C2 EUR H . . . . . . . . . . . . . . . . . . . . . . . . . . . . . . . . . . . . . . . . . . . 1.55% 0.10% N/A 1.77%CT . . . . . . . . . . . . . . . . . . . . . . . . . . . . . . . . . . . . . . . . . . . . . . . . . 1.55% 0.10% N/A 1.77%I . . . . . . . . . . . . . . . . . . . . . . . . . . . . . . . . . . . . . . . . . . . . . . . . . . . 0.55% 0.10% N/A 0.77%I2 . . . . . . . . . . . . . . . . . . . . . . . . . . . . . . . . . . . . . . . . . . . . . . . . . . 0.55% 0.10% N/A 0.77%I2 AUD H . . . . . . . . . . . . . . . . . . . . . . . . . . . . . . . . . . . . . . . . . . . 0.55% 0.10% N/A 0.72%I2 CHF H . . . . . . . . . . . . . . . . . . . . . . . . . . . . . . . . . . . . . . . . . . . . 0.55% 0.10% N/A 0.77%I2 DUR PH . . . . . . . . . . . . . . . . . . . . . . . . . . . . . . . . . . . . . . . . . . 0.55% 0.10% N/A 0.77%I2 EUR H . . . . . . . . . . . . . . . . . . . . . . . . . . . . . . . . . . . . . . . . . . . . 0.55% 0.10% N/A 0.77%I2 SGD H . . . . . . . . . . . . . . . . . . . . . . . . . . . . . . . . . . . . . . . . . . . . 0.55% 0.10% N/A 0.78%IA . . . . . . . . . . . . . . . . . . . . . . . . . . . . . . . . . . . . . . . . . . . . . . . . . . 0.55% 0.10% N/A 0.80%IA AUD H . . . . . . . . . . . . . . . . . . . . . . . . . . . . . . . . . . . . . . . . . . . 0.55% 0.10% N/A 0.87%IT . . . . . . . . . . . . . . . . . . . . . . . . . . . . . . . . . . . . . . . . . . . . . . . . . . 0.55% 0.10% N/A 0.79%IT AUD H . . . . . . . . . . . . . . . . . . . . . . . . . . . . . . . . . . . . . . . . . . . 0.55% 0.10% N/A 0.78%IT CAD H . . . . . . . . . . . . . . . . . . . . . . . . . . . . . . . . . . . . . . . . . . . 0.55% 0.10% N/A 0.77%IT EUR H . . . . . . . . . . . . . . . . . . . . . . . . . . . . . . . . . . . . . . . . . . . . 0.55% 0.10% N/A 0.78%IT GBP H . . . . . . . . . . . . . . . . . . . . . . . . . . . . . . . . . . . . . . . . . . . . 0.55% 0.10% N/A 0.78%IT JPY . . . . . . . . . . . . . . . . . . . . . . . . . . . . . . . . . . . . . . . . . . . . . . 0.55% 0.10% N/A 0.77%IT JPY H . . . . . . . . . . . . . . . . . . . . . . . . . . . . . . . . . . . . . . . . . . . . 0.55% 0.10% N/A 0.77%IT NZD H . . . . . . . . . . . . . . . . . . . . . . . . . . . . . . . . . . . . . . . . . . . 0.55% 0.10% N/A 0.77%IT SGD H . . . . . . . . . . . . . . . . . . . . . . . . . . . . . . . . . . . . . . . . . . . . 0.55% 0.10% N/A 0.77%J . . . . . . . . . . . . . . . . . . . . . . . . . . . . . . . . . . . . . . . . . . . . . . . . . . . 1.10% 0.10% 0.70% 2.02%N2 . . . . . . . . . . . . . . . . . . . . . . . . . . . . . . . . . . . . . . . . . . . . . . . . . 1.65% 0.10% N/A 1.87%NT . . . . . . . . . . . . . . . . . . . . . . . . . . . . . . . . . . . . . . . . . . . . . . . . . 1.65% 0.10% N/A 1.87%S . . . . . . . . . . . . . . . . . . . . . . . . . . . . . . . . . . . . . . . . . . . . . . . . . . . N/A 0.01%(11) N/A 0.03%S1 . . . . . . . . . . . . . . . . . . . . . . . . . . . . . . . . . . . . . . . . . . . . . . . . . . 0.50% 0.01%(11) N/A 0.53%S1D . . . . . . . . . . . . . . . . . . . . . . . . . . . . . . . . . . . . . . . . . . . . . . . . 0.50% 0.01%(11) N/A 0.54%SA . . . . . . . . . . . . . . . . . . . . . . . . . . . . . . . . . . . . . . . . . . . . . . . . . N/A 0.01%(11) N/A 0.03%SHK . . . . . . . . . . . . . . . . . . . . . . . . . . . . . . . . . . . . . . . . . . . . . . . . N/A 0.01%(11) N/A 0.04%W . . . . . . . . . . . . . . . . . . . . . . . . . . . . . . . . . . . . . . . . . . . . . . . . . . 0.39%(12) 0.10% N/A 0.61%

AB FCP I
199
Management Management Distribution Total Fee Company Fee Fee Expense Ratio*
American Income Portfolio (continued)Class
W2 . . . . . . . . . . . . . . . . . . . . . . . . . . . . . . . . . . . . . . . . . . . . . . . . . 0.39%(12) 0.10% N/A 0.61%W2 EUR H . . . . . . . . . . . . . . . . . . . . . . . . . . . . . . . . . . . . . . . . . . 0.39%(12) 0.10% N/A 0.61%W2 CHF H . . . . . . . . . . . . . . . . . . . . . . . . . . . . . . . . . . . . . . . . . . . 0.39%(12) 0.10% N/A 0.61%WT . . . . . . . . . . . . . . . . . . . . . . . . . . . . . . . . . . . . . . . . . . . . . . . . . 0.39%(12) 0.10% N/A 0.61%WT AUD H . . . . . . . . . . . . . . . . . . . . . . . . . . . . . . . . . . . . . . . . . . 0.39%(12) 0.10% N/A 0.61%WT SGD H . . . . . . . . . . . . . . . . . . . . . . . . . . . . . . . . . . . . . . . . . . 0.39%(12) 0.10% N/A 0.61%
European Income PortfolioClass
A . . . . . . . . . . . . . . . . . . . . . . . . . . . . . . . . . . . . . . . . . . . . . . . . . . 1.10% 0.10% N/A 1.34%A2 . . . . . . . . . . . . . . . . . . . . . . . . . . . . . . . . . . . . . . . . . . . . . . . . . 1.10% 0.10% N/A 1.34%A2 CHF H . . . . . . . . . . . . . . . . . . . . . . . . . . . . . . . . . . . . . . . . . . . 1.10% 0.10% N/A 1.34%A2 SGD H . . . . . . . . . . . . . . . . . . . . . . . . . . . . . . . . . . . . . . . . . . . 1.10% 0.10% N/A 1.33%A2 USD H . . . . . . . . . . . . . . . . . . . . . . . . . . . . . . . . . . . . . . . . . . . 1.10% 0.10% N/A 1.34%AA . . . . . . . . . . . . . . . . . . . . . . . . . . . . . . . . . . . . . . . . . . . . . . . . . 1.10% 0.10% N/A 1.34%AA AUD H . . . . . . . . . . . . . . . . . . . . . . . . . . . . . . . . . . . . . . . . . . 1.10% 0.10% N/A 1.34%AA HKD H . . . . . . . . . . . . . . . . . . . . . . . . . . . . . . . . . . . . . . . . . . 1.10% 0.10% N/A 1.34%AA RMB H . . . . . . . . . . . . . . . . . . . . . . . . . . . . . . . . . . . . . . . . . . 1.10% 0.10% N/A 1.34%AA SGD H . . . . . . . . . . . . . . . . . . . . . . . . . . . . . . . . . . . . . . . . . . . 1.10% 0.10% N/A 1.34%AA USD H . . . . . . . . . . . . . . . . . . . . . . . . . . . . . . . . . . . . . . . . . . . 1.10% 0.10% N/A 1.34%AK . . . . . . . . . . . . . . . . . . . . . . . . . . . . . . . . . . . . . . . . . . . . . . . . . 1.10% 0.10% N/A 1.34%AR . . . . . . . . . . . . . . . . . . . . . . . . . . . . . . . . . . . . . . . . . . . . . . . . . 1.10% 0.10% N/A 1.34%AT . . . . . . . . . . . . . . . . . . . . . . . . . . . . . . . . . . . . . . . . . . . . . . . . . 1.10% 0.10% N/A 1.34%AT AUD H . . . . . . . . . . . . . . . . . . . . . . . . . . . . . . . . . . . . . . . . . . . 1.10% 0.10% N/A 1.34%AT SGD H . . . . . . . . . . . . . . . . . . . . . . . . . . . . . . . . . . . . . . . . . . . 1.10% 0.10% N/A 1.34%AT USD H . . . . . . . . . . . . . . . . . . . . . . . . . . . . . . . . . . . . . . . . . . . 1.10% 0.10% N/A 1.34%B . . . . . . . . . . . . . . . . . . . . . . . . . . . . . . . . . . . . . . . . . . . . . . . . . . 1.10% 0.10% 0.70% 2.04%B2 . . . . . . . . . . . . . . . . . . . . . . . . . . . . . . . . . . . . . . . . . . . . . . . . . 1.10% 0.10% 0.70% 2.04%BA . . . . . . . . . . . . . . . . . . . . . . . . . . . . . . . . . . . . . . . . . . . . . . . . . 1.10% 0.10% 0.70% 2.04%BA AUD H . . . . . . . . . . . . . . . . . . . . . . . . . . . . . . . . . . . . . . . . . . 1.10% 0.10% 0.70% 2.04%BA USD H . . . . . . . . . . . . . . . . . . . . . . . . . . . . . . . . . . . . . . . . . . . 1.10% 0.10% 0.70% 2.04%BT . . . . . . . . . . . . . . . . . . . . . . . . . . . . . . . . . . . . . . . . . . . . . . . . . 1.10% 0.10% 0.70% 2.04%BT AUD H . . . . . . . . . . . . . . . . . . . . . . . . . . . . . . . . . . . . . . . . . . . 1.10% 0.10% 0.70% 2.04%BT USD H . . . . . . . . . . . . . . . . . . . . . . . . . . . . . . . . . . . . . . . . . . . 1.10% 0.10% 0.70% 2.04%C . . . . . . . . . . . . . . . . . . . . . . . . . . . . . . . . . . . . . . . . . . . . . . . . . . 1.55% 0.10% N/A 1.79%C2 . . . . . . . . . . . . . . . . . . . . . . . . . . . . . . . . . . . . . . . . . . . . . . . . . 1.55% 0.10% N/A 1.79%C2 USD H . . . . . . . . . . . . . . . . . . . . . . . . . . . . . . . . . . . . . . . . . . . 1.55% 0.10% N/A 1.79%CK . . . . . . . . . . . . . . . . . . . . . . . . . . . . . . . . . . . . . . . . . . . . . . . . . 1.55% 0.10% N/A 1.79%CT USD H . . . . . . . . . . . . . . . . . . . . . . . . . . . . . . . . . . . . . . . . . . . 1.55% 0.10% N/A 1.80%I . . . . . . . . . . . . . . . . . . . . . . . . . . . . . . . . . . . . . . . . . . . . . . . . . . . 0.55% 0.10% N/A 0.79%I2 . . . . . . . . . . . . . . . . . . . . . . . . . . . . . . . . . . . . . . . . . . . . . . . . . . 0.55% 0.10% N/A 0.79%I2 AUD H . . . . . . . . . . . . . . . . . . . . . . . . . . . . . . . . . . . . . . . . . . . 0.55% 0.10% N/A 0.79%I2 CHF H . . . . . . . . . . . . . . . . . . . . . . . . . . . . . . . . . . . . . . . . . . . . 0.55% 0.10% N/A 0.79%I2 USD H . . . . . . . . . . . . . . . . . . . . . . . . . . . . . . . . . . . . . . . . . . . . 0.55% 0.10% N/A 0.79%IA . . . . . . . . . . . . . . . . . . . . . . . . . . . . . . . . . . . . . . . . . . . . . . . . . . 0.55% 0.10% N/A 0.79%IA HKD H . . . . . . . . . . . . . . . . . . . . . . . . . . . . . . . . . . . . . . . . . . . 0.55% 0.10% N/A 0.79%IA SGD H . . . . . . . . . . . . . . . . . . . . . . . . . . . . . . . . . . . . . . . . . . . 0.55% 0.10% N/A 0.78%IA USD H . . . . . . . . . . . . . . . . . . . . . . . . . . . . . . . . . . . . . . . . . . . 0.55% 0.10% N/A 0.78%IT . . . . . . . . . . . . . . . . . . . . . . . . . . . . . . . . . . . . . . . . . . . . . . . . . .. 0.55% 0.10% N/A 0.79%IT SGD H . . . . . . . . . . . . . . . . . . . . . . . . . . . . . . . . . . . . . . . . . . . . 0.55% 0.10% N/A 0.79%IT USD H . . . . . . . . . . . . . . . . . . . . . . . . . . . . . . . . . . . . . . . . . . . . 0.55% 0.10% N/A 0.81%NT USD H . . . . . . . . . . . . . . . . . . . . . . . . . . . . . . . . . . . . . . . . . . . 1.65% 0.10% N/A 1.89%S . . . . . . . . . . . . . . . . . . . . . . . . . . . . . . . . . . . . . . . . . . . . . . . . . . . N/A 0.01%(11) N/A 0.07%S1 . . . . . . . . . . . . . . . . . . . . . . . . . . . . . . . . . . . . . . . . . . . . . . . . . . 0.50% 0.01%(11) N/A 0.57%

AB FCP I
200
Table 1Fee Schedule (continued)
Management Management Distribution Total Fee Company Fee Fee Expense Ratio*
European Income Portfolio (continued)Class
S1 USD H . . . . . . . . . . . . . . . . . . . . . . . . . . . . . . . . . . . . . . . . . . . 0.50% 0.01%(11) N/A 0.56%S1D . . . . . . . . . . . . . . . . . . . . . . . . . . . . . . . . . . . . . . . . . . . . . . . . 0.50% 0.01%(11) N/A 0.56%SA USD H . . . . . . . . . . . . . . . . . . . . . . . . . . . . . . . . . . . . . . . . . . . N/A 0.01%(11) N/A 0.06%SHK . . . . . . . . . . . . . . . . . . . . . . . . . . . . . . . . . . . . . . . . . . . . . . . . N/A 0.01%(11) N/A 0.06%W2 CHF H . . . . . . . . . . . . . . . . . . . . . . . . . . . . . . . . . . . . . . . . . . . 0.39%(12) 0.10% N/A 0.61%
Emerging Markets Debt PortfolioClass
A . . . . . . . . . . . . . . . . . . . . . . . . . . . . . . . . . . . . . . . . . . . . . . . . . . 1.10% 0.05% N/A 1.37%A2 . . . . . . . . . . . . . . . . . . . . . . . . . . . . . . . . . . . . . . . . . . . . . . . . . 1.10% 0.05% N/A 1.37%A2 CHF H . . . . . . . . . . . . . . . . . . . . . . . . . . . . . . . . . . . . . . . . . . . 1.10% 0.05% N/A 1.34%A2 EUR H . . . . . . . . . . . . . . . . . . . . . . . . . . . . . . . . . . . . . . . . . . . 1.10% 0.05% N/A 1.37%A2 SGD H . . . . . . . . . . . . . . . . . . . . . . . . . . . . . . . . . . . . . . . . . . . 1.10% 0.05% N/A 1.37%AA . . . . . . . . . . . . . . . . . . . . . . . . . . . . . . . . . . . . . . . . . . . . . . . . . 1.10% 0.05% N/A 1.37%AA AUD H . . . . . . . . . . . . . . . . . . . . . . . . . . . . . . . . . . . . . . . . . . 1.10% 0.05% N/A 1.37%AA CAD H . . . . . . . . . . . . . . . . . . . . . . . . . . . . . . . . . . . . . . . . . . 1.10% 0.05% N/A 1.37%AA EUR H . . . . . . . . . . . . . . . . . . . . . . . . . . . . . . . . . . . . . . . . . . . 1.10% 0.05% N/A 1.36%AA GBP H . . . . . . . . . . . . . . . . . . . . . . . . . . . . . . . . . . . . . . . . . . . 1.10% 0.05% N/A 1.37%AA NZD H . . . . . . . . . . . . . . . . . . . . . . . . . . . . . . . . . . . . . . . . . . 1.10% 0.05% N/A 1.37%AA RMB H . . . . . . . . . . . . . . . . . . . . . . . . . . . . . . . . . . . . . . . . . . 1.10% 0.05% N/A 1.37%AA SGD H . . . . . . . . . . . . . . . . . . . . . . . . . . . . . . . . . . . . . . . . . . . 1.10% 0.05% N/A 1.35%AA ZAR H . . . . . . . . . . . . . . . . . . . . . . . . . . . . . . . . . . . . . . . . . . . 1.10% 0.05% N/A 1.37%AR EUR . . . . . . . . . . . . . . . . . . . . . . . . . . . . . . . . . . . . . . . . . . . . . 1.10% 0.05% N/A 1.36%AT . . . . . . . . . . . . . . . . . . . . . . . . . . . . . . . . . . . . . . . . . . . . . . . . . 1.10% 0.05% N/A 1.37%AT AUD H . . . . . . . . . . . . . . . . . . . . . . . . . . . . . . . . . . . . . . . . . . . 1.10% 0.05% N/A 1.37%AT CAD H . . . . . . . . . . . . . . . . . . . . . . . . . . . . . . . . . . . . . . . . . . . 1.10% 0.05% N/A 1.37%AT EUR H . . . . . . . . . . . . . . . . . . . . . . . . . . . . . . . . . . . . . . . . . . . 1.10% 0.05% N/A 1.37%AT GBP H . . . . . . . . . . . . . . . . . . . . . . . . . . . . . . . . . . . . . . . . . . . 1.10% 0.05% N/A 1.37%AT NZD H . . . . . . . . . . . . . . . . . . . . . . . . . . . . . . . . . . . . . . . . . . . 1.10% 0.05% N/A 1.37%AT RMB H . . . . . . . . . . . . . . . . . . . . . . . . . . . . . . . . . . . . . . . . . . . 1.10% 0.05% N/A 1.37%AT SGD H . . . . . . . . . . . . . . . . . . . . . . . . . . . . . . . . . . . . . . . . . . . 1.10% 0.05% N/A 1.37%B . . . . . . . . . . . . . . . . . . . . . . . . . . . . . . . . . . . . . . . . . . . . . . . . . . 1.10% 0.05% 1.00% 2.37%B2 . . . . . . . . . . . . . . . . . . . . . . . . . . . . . . . . . . . . . . . . . . . . . . . . . 1.10% 0.05% 1.00% 2.37%BA . . . . . . . . . . . . . . . . . . . . . . . . . . . . . . . . . . . . . . . . . . . . . . . . . 1.10% 0.05% 1.00% 2.36%BA AUD H . . . . . . . . . . . . . . . . . . . . . . . . . . . . . . . . . . . . . . . . . . 1.10% 0.05% 1.00% 2.36%BA ZAR H . . . . . . . . . . . . . . . . . . . . . . . . . . . . . . . . . . . . . . . . . . . 1.10% 0.05% 1.00% 2.36%BT . . . . . . . . . . . . . . . . . . . . . . . . . . . . . . . . . . . . . . . . . . . . . . . . . 1.10% 0.05% 1.00% 2.37%BT AUD H . . . . . . . . . . . . . . . . . . . . . . . . . . . . . . . . . . . . . . . . . . . 1.10% 0.05% 1.00% 2.37%BT CAD H . . . . . . . . . . . . . . . . . . . . . . . . . . . . . . . . . . . . . . . . . . . 1.10% 0.05% 1.00% 2.37%BT EUR H . . . . . . . . . . . . . . . . . . . . . . . . . . . . . . . . . . . . . . . . . . . 1.10% 0.05% 1.00% 2.36%BT GBP H . . . . . . . . . . . . . . . . . . . . . . . . . . . . . . . . . . . . . . . . . . . 1.10% 0.05% 1.00% 2.37%BT NZD H . . . . . . . . . . . . . . . . . . . . . . . . . . . . . . . . . . . . . . . . . . . 1.10% 0.05% 1.00% 2.37%C . . . . . . . . . . . . . . . . . . . . . . . . . . . . . . . . . . . . . . . . . . . . . . . . . . 1.55% 0.05% N/A 1.82%C2 . . . . . . . . . . . . . . . . . . . . . . . . . . . . . . . . . . . . . . . . . . . . . . . . . 1.55% 0.05% N/A 1.82%C2 EUR H . . . . . . . . . . . . . . . . . . . . . . . . . . . . . . . . . . . . . . . . . . . 1.55% 0.05% N/A 1.81%CT . . . . . . . . . . . . . . . . . . . . . . . . . . . . . . . . . . . . . . . . . . . . . . . . . 1.55% 0.05% N/A 1.79%I . . . . . . . . . . . . . . . . . . . . . . . . . . . . . . . . . . . . . . . . . . . . . . . . . . . 0.55% 0.05% N/A 0.82%I2 . . . . . . . . . . . . . . . . . . . . . . . . . . . . . . . . . . . . . . . . . . . . . . . . . . 0.55% 0.05% N/A 0.82%I2 CHF H . . . . . . . . . . . . . . . . . . . . . . . . . . . . . . . . . . . . . . . . . . . . 0.55% 0.05% N/A 0.81%I2 EUR H . . . . . . . . . . . . . . . . . . . . . . . . . . . . . . . . . . . . . . . . . . . . 0.55% 0.05% N/A 0.82%IT . . . . . . . . . . . . . . . . . . . . . . . . . . . . . . . . . . . . . . . . . . . . . . . . . . 0.55% 0.05% N/A 0.81%IT AUD H . . . . . . . . . . . . . . . . . . . . . . . . . . . . . . . . . . . . . . . . . . . 0.55% 0.05% N/A 0.81%IT EUR H . . . . . . . . . . . . . . . . . . . . . . . . . . . . . . . . . . . . . . . . . . . . 0.55% 0.05% N/A 0.82%IT SGD H . . . . . . . . . . . . . . . . . . . . . . . . . . . . . . . . . . . . . . . . . . . . 0.55% 0.05% N/A 0.79%

AB FCP I
201
Management Management Distribution Total Fee Company Fee Fee Expense Ratio*
Emerging Markets Debt Portfolio (continued)Class
N2 . . . . . . . . . . . . . . . . . . . . . . . . . . . . . . . . . . . . . . . . . . . . . . . . . 1.65% 0.05% N/A 1.92%NT . . . . . . . . . . . . . . . . . . . . . . . . . . . . . . . . . . . . . . . . . . . . . . . . . 1.65% 0.05% N/A 1.92%S . . . . . . . . . . . . . . . . . . . . . . . . . . . . . . . . . . . . . . . . . . . . . . . . . . . N/A 0.01%(11) N/A 0.09%S EUR H . . . . . . . . . . . . . . . . . . . . . . . . . . . . . . . . . . . . . . . . . . . . N/A 0.01%(11) N/A 0.06%S GBP H . . . . . . . . . . . . . . . . . . . . . . . . . . . . . . . . . . . . . . . . . . . . N/A 0.01%(11) N/A 0.06%S1 2 . . . . . . . . . . . . . . . . . . . . . . . . . . . . . . . . . . . . . . . . . . . . . . . . 0.55% 0.01%(11) N/A 0.63%S1 EUR H . . . . . . . . . . . . . . . . . . . . . . . . . . . . . . . . . . . . . . . . . . . 0.55% 0.01%(11) N/A 0.61%S1 GBP H . . . . . . . . . . . . . . . . . . . . . . . . . . . . . . . . . . . . . . . . . . . 0.55% 0.01%(11) N/A 0.61%SA . . . . . . . . . . . . . . . . . . . . . . . . . . . . . . . . . . . . . . . . . . . . . . . . . N/A 0.01%(11) N/A 0.07%
Mortgage Income PortfolioClass
A . . . . . . . . . . . . . . . . . . . . . . . . . . . . . . . . . . . . . . . . . . . . . . . . . . 1.10% 0.05% N/A 1.32%A2 . . . . . . . . . . . . . . . . . . . . . . . . . . . . . . . . . . . . . . . . . . . . . . . . . 1.10% 0.05% N/A 1.31%A2X . . . . . . . . . . . . . . . . . . . . . . . . . . . . . . . . . . . . . . . . . . . . . . . . 1.05%(8) 0.05% N/A 1.25%AA . . . . . . . . . . . . . . . . . . . . . . . . . . . . . . . . . . . . . . . . . . . . . . . . . 1.10% 0.05% N/A 1.32%AA AUD H . . . . . . . . . . . . . . . . . . . . . . . . . . . . . . . . . . . . . . . . . . 1.10% 0.05% N/A 1.32%AA RMB H . . . . . . . . . . . . . . . . . . . . . . . . . . . . . . . . . . . . . . . . . . 1.10% 0.05% N/A 1.34%AA SGD H . . . . . . . . . . . . . . . . . . . . . . . . . . . . . . . . . . . . . . . . . . . 1.10% 0.05% N/A 1.32%AA ZAR H . . . . . . . . . . . . . . . . . . . . . . . . . . . . . . . . . . . . . . . . . . . 1.10% 0.05% N/A 1.32%AR EUR H . . . . . . . . . . . . . . . . . . . . . . . . . . . . . . . . . . . . . . . . . . . 1.10% 0.05% N/A 1.33%AT . . . . . . . . . . . . . . . . . . . . . . . . . . . . . . . . . . . . . . . . . . . . . . . . . 1.10% 0.05% N/A 1.32%AT AUD H . . . . . . . . . . . . . . . . . . . . . . . . . . . . . . . . . . . . . . . . . . . 1.10% 0.05% N/A 1.32%AT GBP H . . . . . . . . . . . . . . . . . . . . . . . . . . . . . . . . . . . . . . . . . . . 1.10% 0.05% N/A 1.32%AT SGD H . . . . . . . . . . . . . . . . . . . . . . . . . . . . . . . . . . . . . . . . . . . 1.10% 0.05% N/A 1.32%ATX(e) . . . . . . . . . . . . . . . . . . . . . . . . . . . . . . . . . . . . . . . . . . . . . . 1.05%(8) 0.05% N/A 1.26%AX . . . . . . . . . . . . . . . . . . . . . . . . . . . . . . . . . . . . . . . . . . . . . . . . . 1.05%(8) 0.05% N/A 1.25%B2X . . . . . . . . . . . . . . . . . . . . . . . . . . . . . . . . . . . . . . . . . . . . . . . . 1.05%(8) 0.05% 0.45% 1.70%BA . . . . . . . . . . . . . . . . . . . . . . . . . . . . . . . . . . . . . . . . . . . . . . . . . 1.10% 0.05% 1.00% 2.31%BA AUD H . . . . . . . . . . . . . . . . . . . . . . . . . . . . . . . . . . . . . . . . . . 1.10% 0.05% 1.00% 2.32%BA ZAR H . . . . . . . . . . . . . . . . . . . . . . . . . . . . . . . . . . . . . . . . . . . 1.10% 0.05% 1.00% 2.31%BX . . . . . . . . . . . . . . . . . . . . . . . . . . . . . . . . . . . . . . . . . . . . . . . . . 1.05%(8) 0.05% 0.45% 1.70%C . . . . . . . . . . . . . . . . . . . . . . . . . . . . . . . . . . . . . . . . . . . . . . . . . . 1.55% 0.05% N/A 1.77%C2 . . . . . . . . . . . . . . . . . . . . . . . . . . . . . . . . . . . . . . . . . . . . . . . . . 1.55% 0.05% N/A 1.77%C2X . . . . . . . . . . . . . . . . . . . . . . . . . . . . . . . . . . . . . . . . . . . . . . . . 1.50%(9) 0.05% N/A 1.70%CX . . . . . . . . . . . . . . . . . . . . . . . . . . . . . . . . . . . . . . . . . . . . . . . . . 1.50%(9) 0.05% N/A 1.70%I . . . . . . . . . . . . . . . . . . . . . . . . . . . . . . . . . . . . . . . . . . . . . . . . . . . 0.55% 0.05% N/A 0.77%I2 . . . . . . . . . . . . . . . . . . . . . . . . . . . . . . . . . . . . . . . . . . . . . . . . . . 0.55% 0.05% N/A 0.77%I2 EUR H . . . . . . . . . . . . . . . . . . . . . . . . . . . . . . . . . . . . . . . . . . . . 0.55% 0.05% N/A 0.77%I2X . . . . . . . . . . . . . . . . . . . . . . . . . . . . . . . . . . . . . . . . . . . . . . . . . 0.50%(10) 0.05% N/A 0.70%IT EUR H . . . . . . . . . . . . . . . . . . . . . . . . . . . . . . . . . . . . . . . . . . . . 0.55% 0.05% N/A 0.77%IX . . . . . . . . . . . . . . . . . . . . . . . . . . . . . . . . . . . . . . . . . . . . . . . . . . 0.50%(10) 0.05% N/A 0.70%N2 . . . . . . . . . . . . . . . . . . . . . . . . . . . . . . . . . . . . . . . . . . . . . . . . . 1.65% 0.05% N/A 1.87%NT . . . . . . . . . . . . . . . . . . . . . . . . . . . . . . . . . . . . . . . . . . . . . . . . . 1.65% 0.05% N/A 1.88%S . . . . . . . . . . . . . . . . . . . . . . . . . . . . . . . . . . . . . . . . . . . . . . . . . . . N/A 0.01%(11) N/A 0.05%S1 . . . . . . . . . . . . . . . . . . . . . . . . . . . . . . . . . . . . . . . . . . . . . . . . . . 0.50% 0.01%(11) N/A 0.55%S1 JPY . . . . . . . . . . . . . . . . . . . . . . . . . . . . . . . . . . . . . . . . . . . . . . 0.50% 0.01%(11) N/A 0.57%S1X . . . . . . . . . . . . . . . . . . . . . . . . . . . . . . . . . . . . . . . . . . . . . . . . 0.40% 0.01%(11) N/A 0.44%SA . . . . . . . . . . . . . . . . . . . . . . . . . . . . . . . . . . . . . . . . . . . . . . . . . N/A 0.01%(11) N/A 0.05%
Global Bond II PortfolioClass
S1 . . . . . . . . . . . . . . . . . . . . . . . . . . . . . . . . . . . . . . . . . . . . . . . . . . 0.45% 0.01%(11) N/A 1.03%

AB FCP I
202
table 1Fee schedule (continued)
* Unaudited. The TER calculation follows the guidelines as outlined by SFAMA 16 May 2008.** For the Total Expense Ratio calculation of the Global High Yield Portfolio the total net assets of the underlying funds managed by the
Investment Manager are removed from the computation of the net management fee, management company fee and taxe d’abonnement of the Portfolio to avoid duplicated fees.
(a) Share class liquidated on October 19, 2018.(b) Share class liquidated on November 20, 2018.(c) Share class liquidated on January 14, 2019.(d) Share class liquidated on October 15, 2018.(e) Share class liquidated on October 5, 2018.
Management Fees for the period are reflected at their effective rate as determined by the following: (1) 2.00% up to $300,000,000 and 1.70% on the excess of $300,000,000.(2) 2.45% up to $300,000,000 and 2.15% on the excess of $300,000,000.(3) 1.20% up to $300,000,000 and 0.90% on the excess of $300,000,000.(4) 1.70% up to $5,000,000,000 and 1.50% on the excess of $5,000,000,000.(5) 2.15% up to $5,000,000,000 and 1.95% on the excess of $5,000,000,000.(6) 1.15% up to $5,000,000,000 and 0.95% on the excess of $5,000,000,000.(7) 2.25% up to $5,000,000,000 and 2.05% on the excess of $5,000,000,000.(8) 1.05% up to $100,000,000, 1.00% on the next $100,000,000 and 0.95% on the excess of $200,000,000.(9) 1.50% up to $100,000,000, 1.45% on the next $100,000,000 and 1.40% on the excess of $200,000,000.(10) 0.50% up to $100,000,000, 0.45% on the next $100,000,000 and 0.40% on the excess of $200,000,000.
Management Company Fees(11) Annual fee equal to the lesser of $50,000 or 0.01% of average daily Net Asset Value.
Maximum Management Fee as disclosed in the prospectus of the Fund(12) Up to 0.55%

AB FCP I
203
Turnover* (unaudited)
AB FCP I–Dynamic Diversified Portfolio . . . . . . . . . . . . . . . . . . . . . . . . . . . . . . . . . . . . . . . . . . . . . . . . . . . . . . . . . . . . . . . . 97.05%Global Equity Blend Portfolio . . . . . . . . . . . . . . . . . . . . . . . . . . . . . . . . . . . . . . . . . . . . . . . . . . . . . . . . . . . . . . . . 37.64%Global Value Portfolio . . . . . . . . . . . . . . . . . . . . . . . . . . . . . . . . . . . . . . . . . . . . . . . . . . . . . . . . . . . . . . . . . . . . . . 41.14%Emerging Markets Growth Portfolio . . . . . . . . . . . . . . . . . . . . . . . . . . . . . . . . . . . . . . . . . . . . . . . . . . . . . . . . . . . 94.12%Sustainable US Thematic Portfolio . . . . . . . . . . . . . . . . . . . . . . . . . . . . . . . . . . . . . . . . . . . . . . . . . . . . . . . . . . . . 45.99%Asia Ex-Japan Equity Portfolio . . . . . . . . . . . . . . . . . . . . . . . . . . . . . . . . . . . . . . . . . . . . . . . . . . . . . . . . . . . . . . . 65.79%Japan Strategic Value Portfolio . . . . . . . . . . . . . . . . . . . . . . . . . . . . . . . . . . . . . . . . . . . . . . . . . . . . . . . . . . . . . . . 42.56%China Opportunity Portfolio . . . . . . . . . . . . . . . . . . . . . . . . . . . . . . . . . . . . . . . . . . . . . . . . . . . . . . . . . . . . . . . . . 75.89%Global Bond Portfolio . . . . . . . . . . . . . . . . . . . . . . . . . . . . . . . . . . . . . . . . . . . . . . . . . . . . . . . . . . . . . . . . . . . . . . 125.11%Global High Yield Portfolio . . . . . . . . . . . . . . . . . . . . . . . . . . . . . . . . . . . . . . . . . . . . . . . . . . . . . . . . . . . . . . . . . . 40.93%American Income Portfolio . . . . . . . . . . . . . . . . . . . . . . . . . . . . . . . . . . . . . . . . . . . . . . . . . . . . . . . . . . . . . . . . . . 37.19%European Income Portfolio . . . . . . . . . . . . . . . . . . . . . . . . . . . . . . . . . . . . . . . . . . . . . . . . . . . . . . . . . . . . . . . . . . 54.76%Emerging Markets Debt Portfolio . . . . . . . . . . . . . . . . . . . . . . . . . . . . . . . . . . . . . . . . . . . . . . . . . . . . . . . . . . . . . 92.93%Mortgage Income Portfolio . . . . . . . . . . . . . . . . . . . . . . . . . . . . . . . . . . . . . . . . . . . . . . . . . . . . . . . . . . . . . . . . . . 32.89%Global Bond II Portfolio . . . . . . . . . . . . . . . . . . . . . . . . . . . . . . . . . . . . . . . . . . . . . . . . . . . . . . . . . . . . . . . . . . . . 124.02%
* Unaudited. Calculated in accordance with AICPA guidelines. Average market value of securities for the period is calculated based on month end valuation.
table 2PortFolio turNover

AB FCP I
204
Financial Information on the FundThe Fund publishes semi-annual and annual financial reports containing a list of each Portfolio’s holdings and their market values as of the end of the relevant half-year.
Please be informed that for Portfolios the base currency of which is the Japanese Yen, the payment of the redemption proceeds (the redemption price less any applicable contingent deferred sales charge) will be made by the Depositary or its agents usually within four Business Days after the redemption request for a given trade has been accepted.
Class SA GB and S1A GB Shares are available only to those UK institutional investors who demonstrate to the satisfaction of the Management Company that they are exempt from withholding tax on U.S.-source dividend income under the relevant tax treaty between the investor’s country of tax residence and the United States and agree to provide the Management Company certain other certifications and information to the extent required to establish their eligibility for these shares.
Class SB GB and S1B GB Shares are available only to those UK Institutional Investors who demonstrate to the satisfaction of the Management Company that they entitled to reduced withholding tax of 15% on US-source dividend income under the relevant tax treaty between the investor’s country of tax residence and the United States and agree to provide the Management Company certain other certifications and information to the extent required to establish their eligibility for these shares.
Information concerning issue and repurchase prices, purchases and sales of securities, the financial situation of the Fund and copies of annual and semi-annual reports can be requested free of charge from:
AllianceBernstein Investor Services, a unit ofAllianceBernstein (Luxembourg) S.à r.l. 2-4, rue Eugène Ruppert L-2453 Luxembourg
UniCredit Bank Austria AGRothschildplatz 11020 ViennaAustria
Nordea Bank Denmark A/SStrandgade 3DK-0900 Copenhagen CDenmark
Skandinaviska Enskilda Banken AB (publ)Kungsträdgårdsgatan 8SE-10640 StockholmSweden
BNP Paribas Securities Services3, rue d’Antin75002, ParisFrance
ODDO BHF Aktiengesellschaft Bockenheimer Landstraße 1060323 Frankfurt am MainGermany
AllianceBernstein Hong Kong Limited39th Floor, One Island East, Taikoo Place18 Westlands Road, Quarry BayHong Kong
BNP Paribas Securities Services SA, Milan BranchVia Ansperto 5MilanItaly
Allfunds Bank, S.A. Milan BranchVia Santa Margherita 7MilanItaly
Société Générale Securities Services S.p.A.Santa Chiara 19TurinItaly
CACEIS Bank Luxembourg Amsterdam BranchDe Ruyterkade 61013 AA AmsterdamP.O. Box 1921000 AD AmsterdamNetherlands
AllianceBernstein (Singapore) Ltd.30 Cecil Street#28-01 Prudential TowerSingapore 049712
Allfunds Bank, S.A.U.C/Estafeta no. 6 (La Moraleja)Complejo Pza. de la Fuente-Edificio 328109 Alcobendas (Madrid)Spain
UniCredit Bank Czech Republic and Slovakia, a.s.Prague 4 - Michle, Želetavská 1525/1Postal Code 140 92Czech Republic
Raiffeisenbank Austria d.d.Petrinjska 59 HR-10000 ZagrebCroatia
BNP Paribas Securities Services, Paris, succursale de Zürich, was authorized by the Swiss Financial Market Supervisory Authority as Swiss representative of the Fund, and also acts as paying agent. The Prospectus, the Management Regulations, the annual and semi-annual reports, as well as the list of the purchases and sales which the Fund has undertaken during the financial year, may be obtained, on simple request and free of charge, at the head office of the Swiss representative, BNP Paribas Securities Services, Paris, succursale de Zürich, Selnaustrasse 16, CH-8002 Zürich, Switzerland.
The Key Investor Information Documents (KIIDs) of the Fund are made available at www.alliancebernstein.com/go/kiid.
shareholder’s iNFormatioN (UNAUDITED)
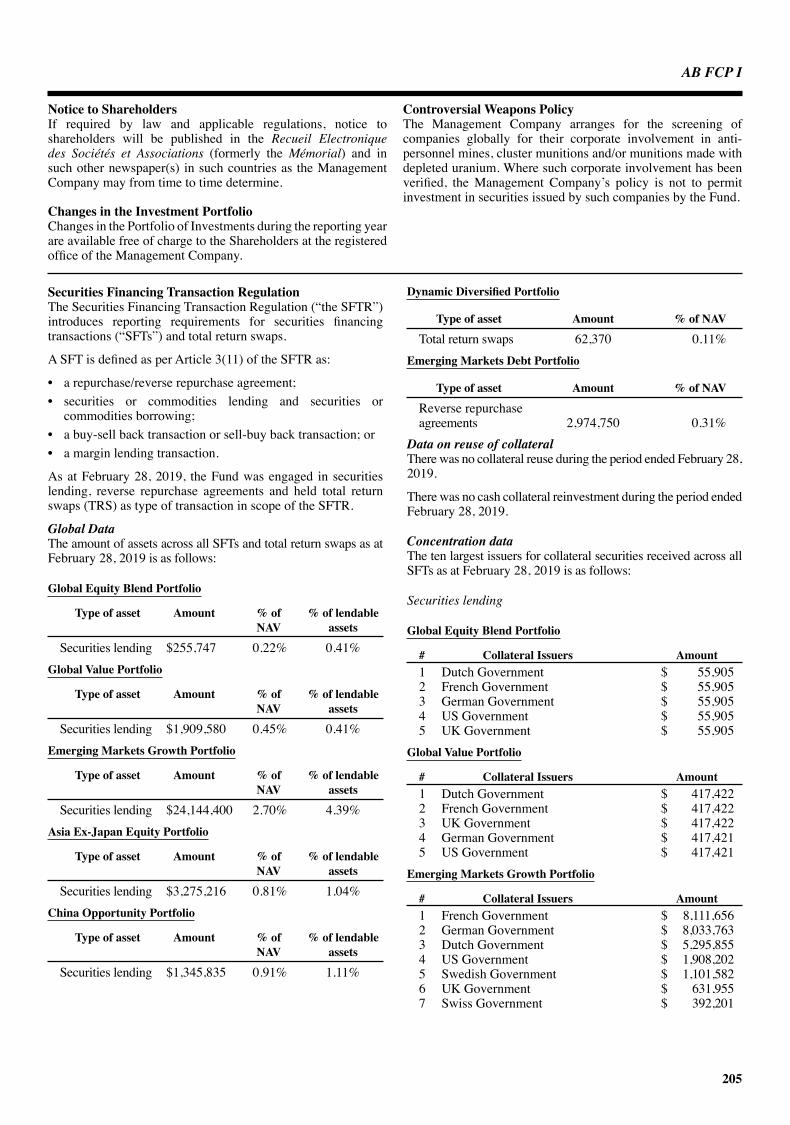
AB FCP I
205
Securities Financing Transaction RegulationThe Securities Financing Transaction Regulation (“the SFTR”) introduces reporting requirements for securities financing transactions (“SFTs”) and total return swaps.
A SFT is defined as per Article 3(11) of the SFTR as:
• a repurchase/reverse repurchase agreement;• securities or commodities lending and securities or
commodities borrowing;• a buy-sell back transaction or sell-buy back transaction; or• a margin lending transaction.
As at February 28, 2019, the Fund was engaged in securities lending, reverse repurchase agreements and held total return swaps (TRS) as type of transaction in scope of the SFTR.
Global DataThe amount of assets across all SFTs and total return swaps as at February 28, 2019 is as follows:
Global Equity Blend Portfolio
Type of asset Amount % of % of lendable NAV assets
Securities lending $255,747 0.22% 0.41%Global Value Portfolio
Type of asset Amount % of % of lendable NAV assets
Securities lending $1,909,580 0.45% 0.41%Emerging Markets Growth Portfolio
Type of asset Amount % of % of lendable NAV assets
Securities lending $24,144,400 2.70% 4.39%Asia Ex-Japan Equity Portfolio
Type of asset Amount % of % of lendable NAV assets
Securities lending $3,275,216 0.81% 1.04%China Opportunity Portfolio
Type of asset Amount % of % of lendable NAV assets
Securities lending $1,345,835 0.91% 1.11%
Dynamic Diversified Portfolio
Type of asset Amount % of NAV
Total return swaps 62,370 0.11%Emerging Markets Debt Portfolio
Type of asset Amount % of NAV
Reverse repurchaseagreements 2,974,750 0.31%
Data on reuse of collateralThere was no collateral reuse during the period ended February 28, 2019 .
There was no cash collateral reinvestment during the period ended February 28, 2019 .
Concentration dataThe ten largest issuers for collateral securities received across all SFTs as at February 28, 2019 is as follows:
Securities lending
Global Equity Blend Portfolio
# Collateral Issuers Amount1 Dutch Government $ 55,9052 French Government $ 55,9053 German Government $ 55,9054 US Government $ 55,9055 UK Government $ 55,905
Global Value Portfolio
# Collateral Issuers Amount1 Dutch Government $ 417,4222 French Government $ 417,4223 UK Government $ 417,4224 German Government $ 417,4215 US Government $ 417,421
Emerging Markets Growth Portfolio
# Collateral Issuers Amount1 French Government $ 8,111,6562 German Government $ 8,033,7633 Dutch Government $ 5,295,8554 US Government $ 1,908,2025 Swedish Government $ 1,101,5826 UK Government $ 631,9557 Swiss Government $ 392,201
Notice to ShareholdersIf required by law and applicable regulations, notice to shareholders will be published in the Recueil Electronique des Sociétés et Associations (formerly the Mémorial) and in such other newspaper(s) in such countries as the Management Company may from time to time determine.
Changes in the Investment PortfolioChanges in the Portfolio of Investments during the reporting year are available free of charge to the Shareholders at the registered office of the Management Company.
Controversial Weapons PolicyThe Management Company arranges for the screening of companies globally for their corporate involvement in anti-personnel mines, cluster munitions and/or munitions made with depleted uranium. Where such corporate involvement has been verified, the Management Company’s policy is not to permit investment in securities issued by such companies by the Fund.
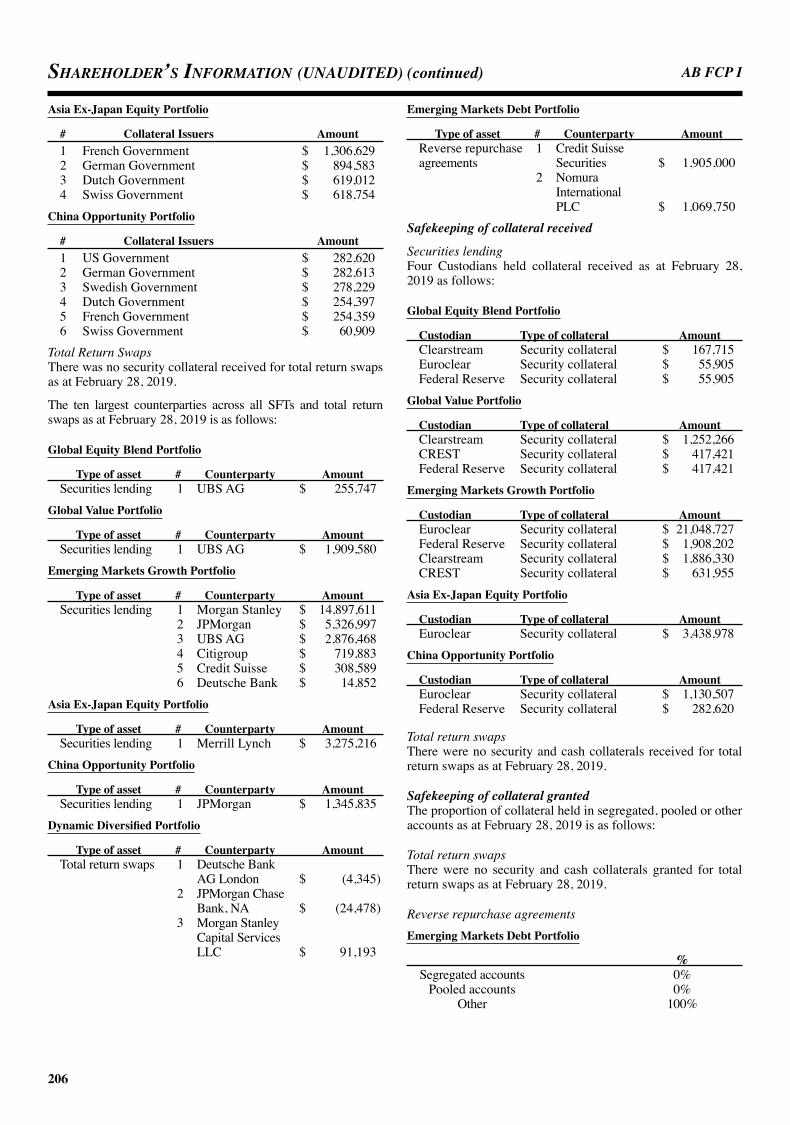
AB FCP I
206
Shareholder’S InformatIon (UNAUDITED) (continued)
Asia Ex-Japan Equity Portfolio
# Collateral Issuers Amount1 French Government $ 1,306,6292 German Government $ 894,5833 Dutch Government $ 619,0124 Swiss Government $ 618,754
China Opportunity Portfolio
# Collateral Issuers Amount1 US Government $ 282,6202 German Government $ 282,6133 Swedish Government $ 278,2294 Dutch Government $ 254,3975 French Government $ 254,3596 Swiss Government $ 60,909
Total Return SwapsThere was no security collateral received for total return swaps as at February 28, 2019 .
The ten largest counterparties across all SFTs and total return swaps as at February 28, 2019 is as follows:
Global Equity Blend Portfolio
Type of asset # Counterparty AmountSecurities lending 1 UBS AG $ 255,747
Global Value Portfolio
Type of asset # Counterparty AmountSecurities lending 1 UBS AG $ 1,909,580
Emerging Markets Growth Portfolio
Type of asset # Counterparty AmountSecurities lending 1 Morgan Stanley $ 14,897,611 2 JPMorgan $ 5,326,997 3 UBS AG $ 2,876,468 4 Citigroup $ 719,883 5 Credit Suisse $ 308,589 6 Deutsche Bank $ 14,852
Asia Ex-Japan Equity Portfolio
Type of asset # Counterparty AmountSecurities lending 1 Merrill Lynch $ 3,275,216
China Opportunity Portfolio
Type of asset # Counterparty AmountSecurities lending 1 JPMorgan $ 1,345,835
Dynamic Diversified Portfolio
Type of asset # Counterparty AmountTotal return swaps 1 Deutsche Bank AG London $ (4,345) 2 JPMorgan Chase Bank, NA $ (24,478) 3 Morgan Stanley Capital Services LLC $ 91,193
Emerging Markets Debt Portfolio
Type of asset # Counterparty AmountReverse repurchase 1 Credit Suisse agreements Securities $ 1,905,000 2 Nomura International PLC $ 1,069,750
Safekeeping of collateral received
Securities lendingFour Custodians held collateral received as at February 28, 2019 as follows:
Global Equity Blend Portfolio
Custodian Type of collateral AmountClearstream Security collateral $ 167,715Euroclear Security collateral $ 55,905Federal Reserve Security collateral $ 55,905
Global Value Portfolio
Custodian Type of collateral AmountClearstream Security collateral $ 1,252,266CREST Security collateral $ 417,421Federal Reserve Security collateral $ 417,421
Emerging Markets Growth Portfolio
Custodian Type of collateral AmountEuroclear Security collateral $ 21,048,727Federal Reserve Security collateral $ 1,908,202Clearstream Security collateral $ 1,886,330CREST Security collateral $ 631,955
Asia Ex-Japan Equity Portfolio
Custodian Type of collateral AmountEuroclear Security collateral $ 3,438,978
China Opportunity Portfolio
Custodian Type of collateral AmountEuroclear Security collateral $ 1,130,507Federal Reserve Security collateral $ 282,620
Total return swapsThere were no security and cash collaterals received for total return swaps as at February 28, 2019.
Safekeeping of collateral grantedThe proportion of collateral held in segregated, pooled or other accounts as at February 28, 2019 is as follows:
Total return swapsThere were no security and cash collaterals granted for total return swaps as at February 28, 2019.
Reverse repurchase agreementsEmerging Markets Debt Portfolio
% Segregated accounts 0% Pooled accounts 0% Other 100%

AB FCP I
207
Return/CostsReturn and cost for each type of SFTs and total return swaps for the period ended February 28, 2019 is as follows:
Securities lendingGlobal Equity Blend Portfolio
Returns Amount % of overall returnsTo Fund $ 1,084 80%To 3rd Party $ 271 20%
Global Value Portfolio
Returns Amount % of overall returnsTo Fund $ 7,483 80%To 3rd Party $ 1,871 20%
Emerging Markets Growth Portfolio
Returns Amount % of overall returnsTo Fund $ 99,415 80%To 3rd Party $ 24,854 20%
Asia Ex-Japan Equity Portfolio
Returns Amount % of overall returnsTo Fund $ 11,052 80%To 3rd Party $ 2,763 20%
Japan Strategic Value Portfolio
Returns Amount % of overall returnsTo Fund ¥ 338,356 80%To 3rd Party ¥ 84,589 20%
China Opportunity Portfolio
Returns Amount % of overall returnsTo Fund $ 4,655 80%To 3rd Party $ 1,164 20%
Total return swapsDynamic Diversified Portfolio
Returns* Amount % of overall returns**To Fund $ 299,028 100%Costs* Amount % of overall returnsTo Fund $ 344,305 100%
Reverse repurchase agreements Emerging Markets Debt Portfolio
Returns* Amount % of overall returns**To Fund $ 0 100%Costs* Amount % of overall returnsTo Fund $ 7,930 100%
* Return (cost) are identified as the realized gains (losses), change in unrealized gains (losses) and interest received (paid) on total return swaps and reverse repurchase agreements during the reporting period.
** All returns from OTC derivative transactions will accrue to the Portfolio and are not subject to any returns sharing agreement with the Portfolio’s manager or any other third parties.
Aggregate transaction dataThe maturity of each type of SFTs and total return swaps as at February 28, 2019 is as follows:
Securities lendingGlobal Equity Blend Portfolio Maturity Amount
Less than one day $0 One day to one week $0 One week to one month $0 One month to three months $0 Three months to one year $0 Above one year $0 Open maturity $255,747
Global Value Portfolio Maturity Amount
Less than one day $0 One day to one week $0 One week to one month $0 One month to three months $0 Three months to one year $0 Above one year $0 Open maturity $1,909,580
Emerging Markets Growth Portfolio Maturity Amount
Less than one day $0 One day to one week $0 One week to one month $0 One month to three months $0 Three months to one year $0 Above one year $0 Open maturity $24,144,400
Asia Ex-Japan Equity Portfolio Maturity Amount
Less than one day $0 One day to one week $0 One week to one month $0 One month to three months $0 Three months to one year $0 Above one year $0 Open maturity $3,275,216
China Opportunity Portfolio Maturity Amount
Less than one day $0 One day to one week $0 One week to one month $0 One month to three months $0 Three months to one year $0 Above one year $0 Open maturity $1,345,835

AB FCP I
208
Shareholder’S InformatIon (UNAUDITED) (continued)
Total return swapsDynamic Diversified Portfolio Maturity Amount
Less than one day $0 One day to one week $0 One week to one month $91,193 One month to three months $0 Three months to one year $(28,823) Above one year $0 Open maturity $0
Reverse repurchase agreementsEmerging Markets Debt Portfolio Maturity Amount
Less than one day $0 One day to one week $0 One week to one month $0 One month to three months $0 Three months to one year $0 Above one year $0 Open maturity $2,974,750
The settlement and clearing mechanisms for SFTs and total return swaps as at February 28, 2019 are as follows:
Securities lending
Global Equity Blend Portfolio Settlement and clearing mechanism Amount Tri-party $255,747
Global Value Portfolio Settlement and clearing mechanism Amount Tri-party $1,909,580Emerging Markets Growth Portfolio Settlement and clearing mechanism Amount Tri-party $24,144,400Asia Ex-Japan Equity Portfolio Settlement and clearing mechanism Amount Tri-party $3,275,216China Opportunity Portfolio Settlement and clearing mechanism Amount Tri-party $1,345,835
Total return swaps
Dynamic Diversified Portfolio Settlement and clearing mechanism Amount Bilateral $62,370
Reverse repurchase agreements
Emerging Markets Debt Portfolio Settlement and clearing mechanism Amount Bilateral $2,974,750

AB FCP I
209
The aggregate transaction data for collateral positions (including cash) received across all SFTs as at February 28, 2019 is as follows:
Securities lending
Global Equity Blend Portfolio Counterparty Type of collateral Amount Quality* Maturity tenor Currency of Country of of collateral collateral counterparty establishment Societe Generale United Kingdom Gilt $50,315 AA >1 year £ France 1.25%, 22/11/2027 Societe Generale German Government Bond $50,314 AAA >1 year € France 0.00%, 04/07/2022 Societe Generale France Government Bond $37,036 AA >1 year € France 3.50%, 25/04/2020 Societe Generale Netherlands Government Bond $31,140 AAA >1 year € France 5.50%, 15/01/2028 Societe Generale United States Treasury Note $28,641 AA+ 1 month to 3 months $ France 0.00%, 16/05/2019 Societe Generale Netherlands Government Bond $24,763 AAA >1 year € France 3.75%, 15/01/2023 Societe Generale United States Treasury Note $22,802 AA+ >1 year $ France 1.63%, 31/05/2023 Societe Generale France Government Bond $18,861 AA 3 months to 1 year € France 3.75%, 25/10/2019 Societe Generale United Kingdom Gilt $5,585 AA 3 months to 1 year £ France 1.75%, 22/07/2019 Societe Generale German Government Bond $5,300 AAA >1 year € France 1.75%, 15/04/2020 Societe Generale United States Treasury Note $4,456 AA+ less than 1 month $ France 0.00%, 21/03/2019 Societe Generale German Government Bond $291 AAA >1 year € France 0.00%, 04/07/2026 Societe Generale France Government Bond $8 AA >1 year € France 1.10%, 25/07/2022 Societe Generale United Kingdom Gilt $5 AA >1 year £ France 1.88%, 22/11/2022 Societe Generale United States Treasury Note $4 AA+ >1 year $ France 2.13%, 15/08/2021 Societe Generale Netherlands Government Bond $2 AAA >1 year € France 3.25%, 15/07/2021 Societe Generale United States Treasury Note $1 AA+ >1 year $ France 1.63%, 15/08/2022 Societe Generale United States Treasury Note $1 AA+ >1 year $ France 2.00%, 15/02/2025
* Standard and Poor’s long term issue credit rating
Global Value Portfolio Counterparty Type of collateral Amount Quality* Maturity tenor Currency of Country of of collateral collateral counterparty establishment Societe Generale United Kingdom Gilt $375,680 AA >1 year £ France 1.25%, 22/11/2027 Societe Generale German Government Bond $375,678 AAA >1 year € France 0.00%, 04/07/2022 Societe Generale France Government Bond $276,535 AA >1 year € France 3.50%, 25/04/2020 Societe Generale Netherlands Government Bond $232,512 AAA >1 year € France 5.50%, 15/01/2028 Societe Generale United States Treasury Note $213,846 AA+ 1 month to 3 months $ France 0.00%, 16/05/2019 Societe Generale Netherlands Government Bond $184,899 AAA >1 year € France 3.75%, 15/01/2023 Societe Generale United States Treasury Note $170,257 AA+ >1 year $ France 1.63%, 31/05/2023 Societe Generale France Government Bond $140,825 AA 3 months to 1 year € France 3.75%, 25/10/2019 Societe Generale United Kingdom Gilt $41,704 AA 3 months to 1 year £ France 1.75%, 22/07/2019 Societe Generale German Government Bond $39,572 AAA >1 year € France 1.75%, 15/04/2020 Societe Generale United States Treasury Note $33,274 AA+ less than 1 month $ France 0.00%, 21/03/2019 Societe Generale German Government Bond $2,171 AAA >1 year € France 0.00%, 04/07/2026 Societe Generale France Government Bond $62 AA >1 year € France 1.10%, 25/07/2022
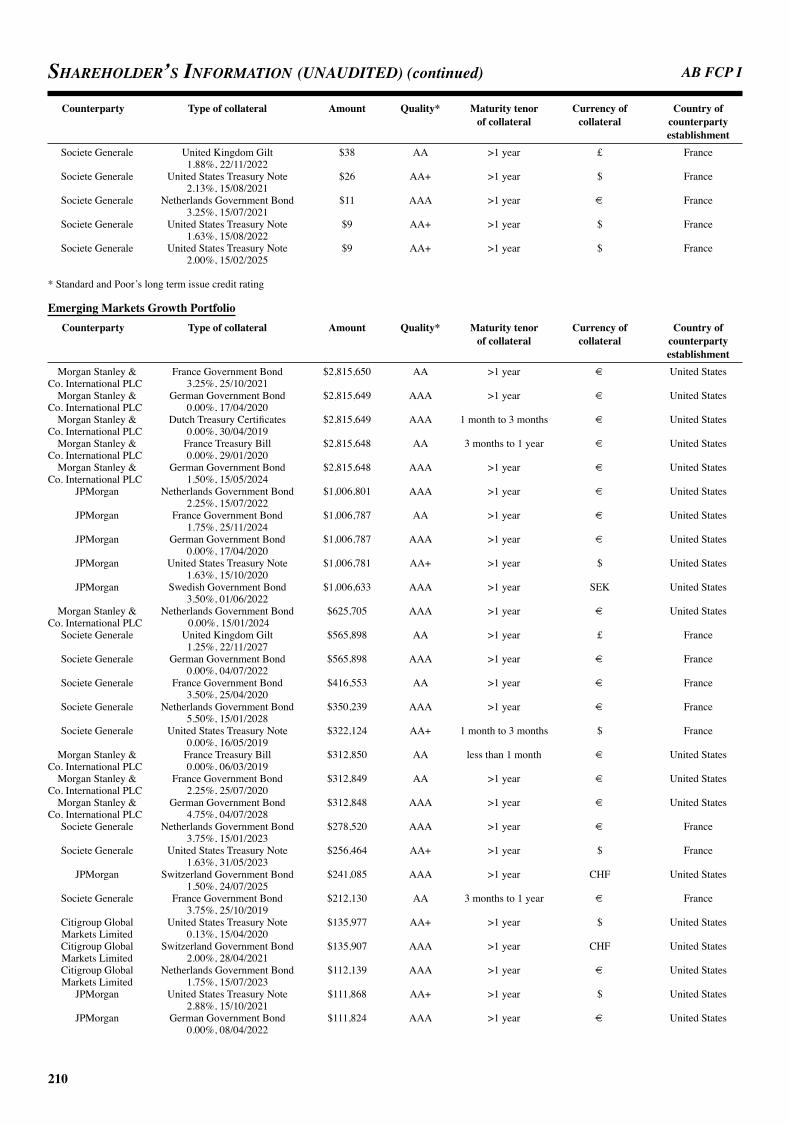
AB FCP I
210
Shareholder’S InformatIon (UNAUDITED) (continued)
Counterparty Type of collateral Amount Quality* Maturity tenor Currency of Country of of collateral collateral counterparty establishment Societe Generale United Kingdom Gilt $38 AA >1 year £ France 1.88%, 22/11/2022 Societe Generale United States Treasury Note $26 AA+ >1 year $ France 2.13%, 15/08/2021 Societe Generale Netherlands Government Bond $11 AAA >1 year € France 3.25%, 15/07/2021 Societe Generale United States Treasury Note $9 AA+ >1 year $ France 1.63%, 15/08/2022 Societe Generale United States Treasury Note $9 AA+ >1 year $ France 2.00%, 15/02/2025
* Standard and Poor’s long term issue credit rating
Emerging Markets Growth Portfolio Counterparty Type of collateral Amount Quality* Maturity tenor Currency of Country of of collateral collateral counterparty establishment Morgan Stanley & France Government Bond $2,815,650 AA >1 year € United States Co. International PLC 3.25%, 25/10/2021 Morgan Stanley & German Government Bond $2,815,649 AAA >1 year € United States Co. International PLC 0.00%, 17/04/2020 Morgan Stanley & Dutch Treasury Certificates $2,815,649 AAA 1 month to 3 months € United States Co. International PLC 0.00%, 30/04/2019 Morgan Stanley & France Treasury Bill $2,815,648 AA 3 months to 1 year € United States Co. International PLC 0.00%, 29/01/2020 Morgan Stanley & German Government Bond $2,815,648 AAA >1 year € United States Co. International PLC 1.50%, 15/05/2024 JPMorgan Netherlands Government Bond $1,006,801 AAA >1 year € United States 2.25%, 15/07/2022 JPMorgan France Government Bond $1,006,787 AA >1 year € United States 1.75%, 25/11/2024 JPMorgan German Government Bond $1,006,787 AAA >1 year € United States 0.00%, 17/04/2020 JPMorgan United States Treasury Note $1,006,781 AA+ >1 year $ United States 1.63%, 15/10/2020 JPMorgan Swedish Government Bond $1,006,633 AAA >1 year SEK United States 3.50%, 01/06/2022 Morgan Stanley & Netherlands Government Bond $625,705 AAA >1 year € United States Co. International PLC 0.00%, 15/01/2024 Societe Generale United Kingdom Gilt $565,898 AA >1 year £ France 1.25%, 22/11/2027 Societe Generale German Government Bond $565,898 AAA >1 year € France 0.00%, 04/07/2022 Societe Generale France Government Bond $416,553 AA >1 year € France 3.50%, 25/04/2020 Societe Generale Netherlands Government Bond $350,239 AAA >1 year € France 5.50%, 15/01/2028 Societe Generale United States Treasury Note $322,124 AA+ 1 month to 3 months $ France 0.00%, 16/05/2019 Morgan Stanley & France Treasury Bill $312,850 AA less than 1 month € United States Co. International PLC 0.00%, 06/03/2019 Morgan Stanley & France Government Bond $312,849 AA >1 year € United States Co. International PLC 2.25%, 25/07/2020 Morgan Stanley & German Government Bond $312,848 AAA >1 year € United States Co. International PLC 4.75%, 04/07/2028 Societe Generale Netherlands Government Bond $278,520 AAA >1 year € France 3.75%, 15/01/2023 Societe Generale United States Treasury Note $256,464 AA+ >1 year $ France 1.63%, 31/05/2023 JPMorgan Switzerland Government Bond $241,085 AAA >1 year CHF United States 1.50%, 24/07/2025 Societe Generale France Government Bond $212,130 AA 3 months to 1 year € France 3.75%, 25/10/2019 Citigroup Global United States Treasury Note $135,977 AA+ >1 year $ United States Markets Limited 0.13%, 15/04/2020 Citigroup Global Switzerland Government Bond $135,907 AAA >1 year CHF United States Markets Limited 2.00%, 28/04/2021 Citigroup Global Netherlands Government Bond $112,139 AAA >1 year € United States Markets Limited 1.75%, 15/07/2023 JPMorgan United States Treasury Note $111,868 AA+ >1 year $ United States 2.88%, 15/10/2021 JPMorgan German Government Bond $111,824 AAA >1 year € United States 0.00%, 08/04/2022
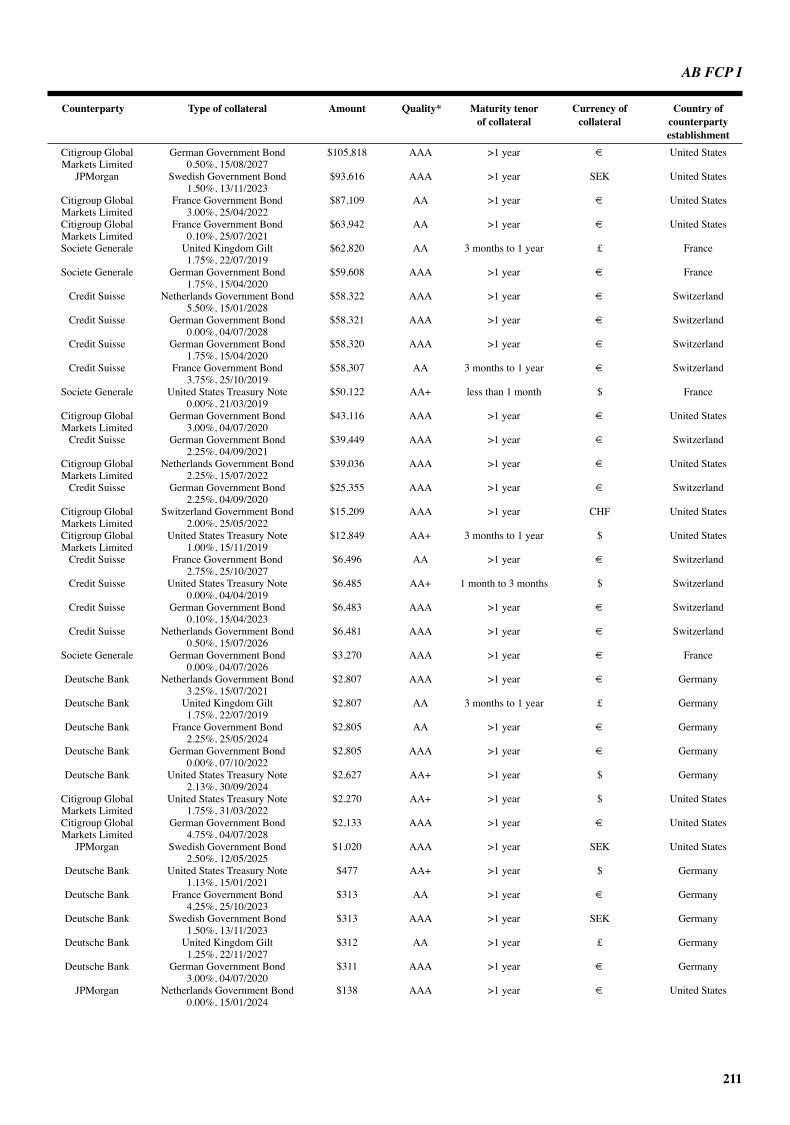
AB FCP I
211
Counterparty Type of collateral Amount Quality* Maturity tenor Currency of Country of of collateral collateral counterparty establishment Citigroup Global German Government Bond $105,818 AAA >1 year € United States Markets Limited 0.50%, 15/08/2027 JPMorgan Swedish Government Bond $93,616 AAA >1 year SEK United States 1.50%, 13/11/2023 Citigroup Global France Government Bond $87,109 AA >1 year € United States Markets Limited 3.00%, 25/04/2022 Citigroup Global France Government Bond $63,942 AA >1 year € United States Markets Limited 0.10%, 25/07/2021 Societe Generale United Kingdom Gilt $62,820 AA 3 months to 1 year £ France 1.75%, 22/07/2019 Societe Generale German Government Bond $59,608 AAA >1 year € France 1.75%, 15/04/2020 Credit Suisse Netherlands Government Bond $58,322 AAA >1 year € Switzerland 5.50%, 15/01/2028 Credit Suisse German Government Bond $58,321 AAA >1 year € Switzerland 0.00%, 04/07/2028 Credit Suisse German Government Bond $58,320 AAA >1 year € Switzerland 1.75%, 15/04/2020 Credit Suisse France Government Bond $58,307 AA 3 months to 1 year € Switzerland 3.75%, 25/10/2019 Societe Generale United States Treasury Note $50,122 AA+ less than 1 month $ France 0.00%, 21/03/2019 Citigroup Global German Government Bond $43,116 AAA >1 year € United States Markets Limited 3.00%, 04/07/2020 Credit Suisse German Government Bond $39,449 AAA >1 year € Switzerland 2.25%, 04/09/2021 Citigroup Global Netherlands Government Bond $39,036 AAA >1 year € United States Markets Limited 2.25%, 15/07/2022 Credit Suisse German Government Bond $25,355 AAA >1 year € Switzerland 2.25%, 04/09/2020 Citigroup Global Switzerland Government Bond $15,209 AAA >1 year CHF United States Markets Limited 2.00%, 25/05/2022 Citigroup Global United States Treasury Note $12,849 AA+ 3 months to 1 year $ United States Markets Limited 1.00%, 15/11/2019 Credit Suisse France Government Bond $6,496 AA >1 year € Switzerland 2.75%, 25/10/2027 Credit Suisse United States Treasury Note $6,485 AA+ 1 month to 3 months $ Switzerland 0.00%, 04/04/2019 Credit Suisse German Government Bond $6,483 AAA >1 year € Switzerland 0.10%, 15/04/2023 Credit Suisse Netherlands Government Bond $6,481 AAA >1 year € Switzerland 0.50%, 15/07/2026 Societe Generale German Government Bond $3,270 AAA >1 year € France 0.00%, 04/07/2026 Deutsche Bank Netherlands Government Bond $2,807 AAA >1 year € Germany 3.25%, 15/07/2021 Deutsche Bank United Kingdom Gilt $2,807 AA 3 months to 1 year £ Germany 1.75%, 22/07/2019 Deutsche Bank France Government Bond $2,805 AA >1 year € Germany 2.25%, 25/05/2024 Deutsche Bank German Government Bond $2,805 AAA >1 year € Germany 0.00%, 07/10/2022 Deutsche Bank United States Treasury Note $2,627 AA+ >1 year $ Germany 2.13%, 30/09/2024 Citigroup Global United States Treasury Note $2,270 AA+ >1 year $ United States Markets Limited 1.75%, 31/03/2022 Citigroup Global German Government Bond $2,133 AAA >1 year € United States Markets Limited 4.75%, 04/07/2028 JPMorgan Swedish Government Bond $1,020 AAA >1 year SEK United States 2.50%, 12/05/2025 Deutsche Bank United States Treasury Note $477 AA+ >1 year $ Germany 1.13%, 15/01/2021 Deutsche Bank France Government Bond $313 AA >1 year € Germany 4.25%, 25/10/2023 Deutsche Bank Swedish Government Bond $313 AAA >1 year SEK Germany 1.50%, 13/11/2023 Deutsche Bank United Kingdom Gilt $312 AA >1 year £ Germany 1.25%, 22/11/2027 Deutsche Bank German Government Bond $311 AAA >1 year € Germany 3.00%, 04/07/2020 JPMorgan Netherlands Government Bond $138 AAA >1 year € United States 0.00%, 15/01/2024

AB FCP I
212
Shareholder’S InformatIon (UNAUDITED) (continued)
Counterparty Type of collateral Amount Quality* Maturity tenor Currency of Country of of collateral collateral counterparty establishment Societe Generale France Government Bond $93 AA >1 year € France 1.10%, 25/07/2022 Citigroup Global France Government Bond $87 AA >1 year € United States Markets Limited 0.25%, 25/11/2026 Citigroup Global German Government Bond $86 AAA >1 year € United States Markets Limited 0.00%, 07/10/2022 Citigroup Global United States Treasury Note $73 AA+ 3 months to 1 year $ United States Markets Limited 2.38%, 15/01/2020 Societe Generale United Kingdom Gilt $58 AA >1 year £ France 1.88%, 22/11/2022 Societe Generale United States Treasury Note $40 AA+ >1 year $ France 2.13%, 15/08/2021 Citigroup Global France Government Bond $36 AA >1 year € United States Markets Limited 0.00%, 25/05/2021 Citigroup Global United Kingdom Gilt $27 AA >1 year £ United States Markets Limited 1.88%, 22/11/2022 Societe Generale Netherlands Government Bond $17 AAA >1 year € France 3.25%, 15/07/2021 Citigroup Global United Kingdom Gilt $17 AA >1 year £ United States Markets Limited 2.00%, 07/09/2025 Societe Generale United States Treasury Note $13 AA+ >1 year $ France 1.63%, 15/08/2022 Societe Generale United States Treasury Note $13 AA+ >1 year $ France 2.00%, 15/02/2025 Citigroup Global United Kingdom Gilt $13 AA >1 year £ United States Markets Limited 6.00%, 07/12/2028 Citigroup Global German Government Bond $11 AAA >1 year € United States Markets Limited 6.50%, 04/07/2027 JPMorgan German Government Bond $10 AAA >1 year € United States 3.00%, 04/07/2020 Citigroup Global German Government Bond $7 AAA >1 year € United States Markets Limited 0.00%, 05/04/2024 Citigroup Global United States Treasury Note $6 AA+ 3 months to 1 year $ United States Markets Limited 0.00%, 08/08/2019 Deutsche Bank United States Treasury Note $5 AA+ >1 year $ Germany 0.13%, 15/04/2020 Citigroup Global German Government Bond $3 AAA >1 year € United States Markets Limited 2.25%, 04/09/2020 Deutsche Bank United States Treasury Note $2 AA+ >1 year $ Germany 2.88%, 31/10/2023 Deutsche Bank United States Treasury Note $2 AA+ >1 year $ Germany 2.50%, 31/05/2020 Deutsche Bank United States Treasury Note $2 AA+ >1 year $ Germany 0.38%, 15/07/2025 Deutsche Bank German Government Bond $2 AAA >1 year € Germany 1.50%, 04/09/2022 Citigroup Global United Kingdom Gilt $2 AA 3 months to 1 year £ United States Markets Limited 1.75%, 22/07/2019 Morgan Stanley & German Government Bond $1 AAA >1 year € United States Co. International PLC 0.50%, 15/02/2028 Deutsche Bank United States Treasury Note $1 AA+ >1 year $ Germany 2.00%, 31/07/2020 Deutsche Bank United States Treasury Note $1 AA+ 3 months to 1 year $ Germany 1.00%, 15/10/2019 Citigroup Global United Kingdom Gilt $1 AA >1 year £ United States Markets Limited 1.50%, 22/07/2026 Citigroup Global France Government Bond $1 AA 3 months to 1 year € United States Markets Limited 3.75%, 25/10/2019 Citigroup Global Netherlands Government Bond $1 AAA >1 year € United States Markets Limited 0.00%, 15/01/2024
* Standard and Poor’s long term issue credit rating

AB FCP I
213
Asia Ex-Japan Equity Portfolio Counterparty Type of collateral Amount Quality* Maturity tenor Currency of Country of of collateral collateral counterparty establishment Merrill Lynch Netherlands Government Bond $619,012 AAA >1 year € United States 0.25%, 15/07/2025 Merrill Lynch German Government Bond $619,003 AAA 3 months to 1 year € United States 0.00%, 13/09/2019 Merrill Lynch France Government Bond $618,973 AA >1 year € United States 0.00%, 25/04/2021 Merrill Lynch France Government Bond $618,861 AA >1 year € United States 6.00%, 25/10/2025 Merrill Lynch Switzerland Government Bond $618,754 AAA >1 year CHF United States 2.00%, 28/04/2021 Merrill Lynch German Government Bond $154,834 AAA >1 year € United States 1.50%, 15/05/2024 Merrill Lynch German Government Bond $79,036 AAA >1 year € United States 2.25%, 04/09/2021 Merrill Lynch France Government Bond $68,795 AA >1 year € United States 0.50%, 25/05/2026 Merrill Lynch German Government Bond $41,710 AAA >1 year € United States 2.00%, 04/01/2022
* Standard and Poor’s long term issue credit rating
China Opportunity Portfolio Counterparty Type of collateral Amount Quality* Maturity tenor Currency of Country of of collateral collateral counterparty establishment JPMorgan Netherlands Government Bond $254,362 AAA >1 year € United States 2.25%, 15/07/2022 JPMorgan France Government Bond $254,359 AA >1 year € United States 1.75%, 25/11/2024 JPMorgan German Government Bond $254,359 AAA >1 year € United States 0.00%, 17/04/2020 JPMorgan United States Treasury Note $254,357 AA+ >1 year $ United States 1.63%, 15/10/2020 JPMorgan Swedish Government Bond $254,319 AAA >1 year SEK United States 3.50%, 01/06/2022 JPMorgan Switzerland Government Bond $60,909 AAA >1 year CHF United States 1.50%, 24/07/2025 JPMorgan United States Treasury Note $28,263 AA+ >1 year $ United States 2.88%, 15/10/2021 JPMorgan German Government Bond $28,252 AAA >1 year € United States 0.00%, 08/04/2022 JPMorgan Swedish Government Bond $23,652 AAA >1 year SEK United States 1.50%, 13/11/2023 JPMorgan Swedish Government Bond $258 AAA >1 year SEK United States 2.50%, 12/05/2025 JPMorgan Netherlands Government Bond $35 AAA >1 year € United States 0.00%, 15/01/2024 JPMorgan German Government Bond $2 AAA >1 year € United States 3.00%, 04/07/2020
* Standard and Poor’s long term issue credit rating
Reverse repurchase agreementsEmerging Markets Debt Portfolio Counterparty Type of collateral Amount Quality* Maturity tenor Currency of Country of of collateral collateral counterparty establishment Credit Suisse Ivory Coast Government $971,250 B+ >1 year $ Ivory Coast Securities International Bond Credit Suisse Ivory Coast Government $971,250 B+ >1 year $ Ivory Coast Securities International Bond Nomura Ivory Coast Government $1,068,375 B+ >1 year $ Ivory Coast International PLC International Bond
* Fitch long term issue credit rating
AB FCP I
214
Shareholder’S InformatIon (UNAUDITED) (continued)
MANAGEMENT COMPANY AllianceBernstein (Luxembourg) S.à r.l. 2-4, rue Eugène Ruppert L-2453 Luxembourg RCS: B34405
BOARD OF MANAGERS OF THE Louis Mangan MANAGEMENT COMPANY Silvio Cruz Yves Prussen Simone Thelen Bertrand Reimmel Steven Eisenberg
INVESTMENT MANAGER* AllianceBernstein L.P. 1345 Avenue of the Americas New York, New York 10105 United States of America
ADMINISTRATIVE AGENT* AND DEPOSITARY Brown Brothers Harriman (Luxembourg) S.C.A. 80, Route d’Esch L-1470 Luxembourg
REGISTRAR AND TRANSFER AGENT AllianceBernstein Investor Services a unit of AllianceBernstein (Luxembourg) S.à r.l 2-4, rue Eugène Ruppert L-2453 Luxembourg
DISTRIBUTOR AllianceBernstein Investments a unit of AllianceBernstein (Luxembourg) S.à r.l. 2-4, rue Eugène Ruppert L-2453 Luxembourg
INDEPENDENT AUDITOR Ernst & Young S.A. 35E, Avenue John F. Kennedy L-1855 Luxembourg
LEGAL ADVISERS In Luxembourg Elvinger Hoss Prussen, société anonyme 2, place Winston Churchill B.P. 425 L-2014 Luxembourg
In the United States Dechert LLP One International Place 40th Floor 100 Oliver Street Boston, MA 02110-2605 U.S.A.
* Delegated by the Management Company.

215
(This page left intentionally blank.)

216
(This page left intentionally blank.)

217
(This page left intentionally blank.)

ABI-SRS-EN-GN-0219