semi-annual financial statements - june 30, 2019...clarica mvp segregated funds semi-annual...
TRANSCRIPT

Clarica MVP Segregated Funds
Semi-Annual Financial Statements - June 30, 2019
issued by Sun Life Assurance Company of Canadamanaged by CI Investments Inc.
Table of Contents
Semi-Annual Financial Statements - June 30, 2019
Equity Fund(s)
Clarica MVP Asian-Pacific Non-RSP Equity Fund ...................................................................... 1
Clarica MVP Asian-Pacific RSP Equity Fund .............................................................................. 7
Clarica MVP Equity Fund ............................................................................................................ 13
Clarica MVP Global Equity Fund ................................................................................................. 19
Clarica MVP Growth Fund .......................................................................................................... 25
Clarica MVP International Fund .................................................................................................. 31
Clarica MVP Small Cap American Fund ..................................................................................... 37
Clarica MVP U.S. Equity Fund ..................................................................................................... 43
Balanced Fund(s)
Clarica MVP Balanced Fund ....................................................................................................... 49
Income Fund(s)
Clarica MVP Bond Fund .............................................................................................................. 55
Clarica MVP Dividend Fund ........................................................................................................ 61
Clarica MVP Money Market Fund .............................................................................................. 68
Notes to the Financial Statements ...................................................................................... 74
Legal Notice ............................................................................................................................. 78
CI Investments Inc., the Manager of the Funds, appoints independent auditors to audit the Funds’
Annual Financial Statements. Under Canadian securities laws (National Instrument 81-106),
if an auditor has not reviewed the Semi-Annual Financial Statements, this must be disclosed in an
accompanying notice.
The Fund’s independent auditors have not performed a review of these Semi-Annual Financial
Statements in accordance with standards established by the Chartered Professional Accountants
of Canada.
– 1 –Semi-Annual Financial Statements - June 30, 2019
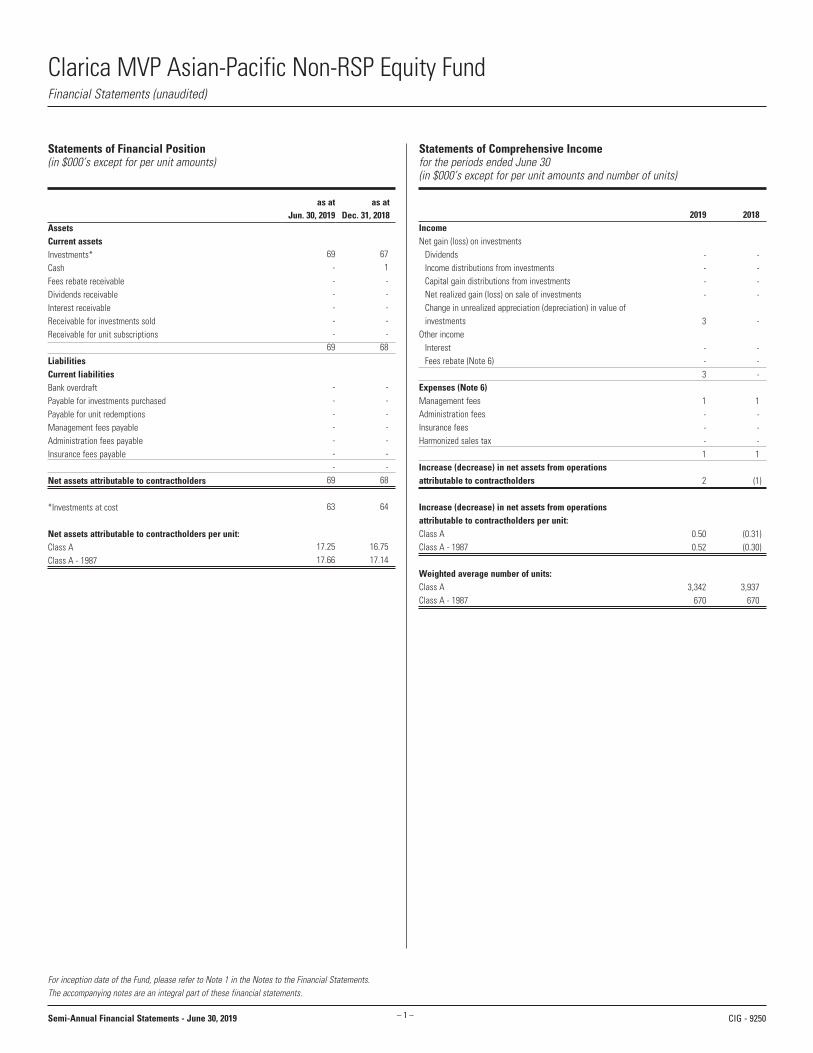
Clarica MVP Asian-Pacific Non-RSP Equity Fund
2019 2018
- - - - - - - -
3 -
- - - - 3 -
1 1 - - - - - - 1 1
2 (1)
0.50 (0.31) 0.52 (0.30)
3,342 3,937 670 670
as at as atJun. 30, 2019 Dec. 31, 2018
69 67 - 1 - - - - - - - - - - 69 68
- - - - - - - - - - - - - - 69 68
63 64
17.25 16.75 17.66 17.14
For inception date of the Fund, please refer to Note 1 in the Notes to the Financial Statements.The accompanying notes are an integral part of these financial statements.
Financial Statements (unaudited)
CIG - 9250
Statements of Financial Position (in $000’s except for per unit amounts)
Statements of Comprehensive Income for the periods ended June 30 (in $000’s except for per unit amounts and number of units)
Assets Current assets Investments* Cash Fees rebate receivable Dividends receivable Interest receivable Receivable for investments sold Receivable for unit subscriptions
Liabilities Current liabilities Bank overdraft Payable for investments purchased Payable for unit redemptions Management fees payable Administration fees payable Insurance fees payable
Net assets attributable to contractholders
*Investments at cost
Net assets attributable to contractholders per unit: Class AClass A - 1987
Income Net gain (loss) on investments Dividends Income distributions from investments Capital gain distributions from investments Net realized gain (loss) on sale of investments Change in unrealized appreciation (depreciation) in value of
investments Other income Interest Fees rebate (Note 6)
Expenses (Note 6)Management fees Administration fees Insurance fees Harmonized sales tax
Increase (decrease) in net assets from operations attributable to contractholders
Increase (decrease) in net assets from operations attributable to contractholders per unit: Class AClass A - 1987
Weighted average number of units: Class AClass A - 1987
– 2 –Semi-Annual Financial Statements - June 30, 2019
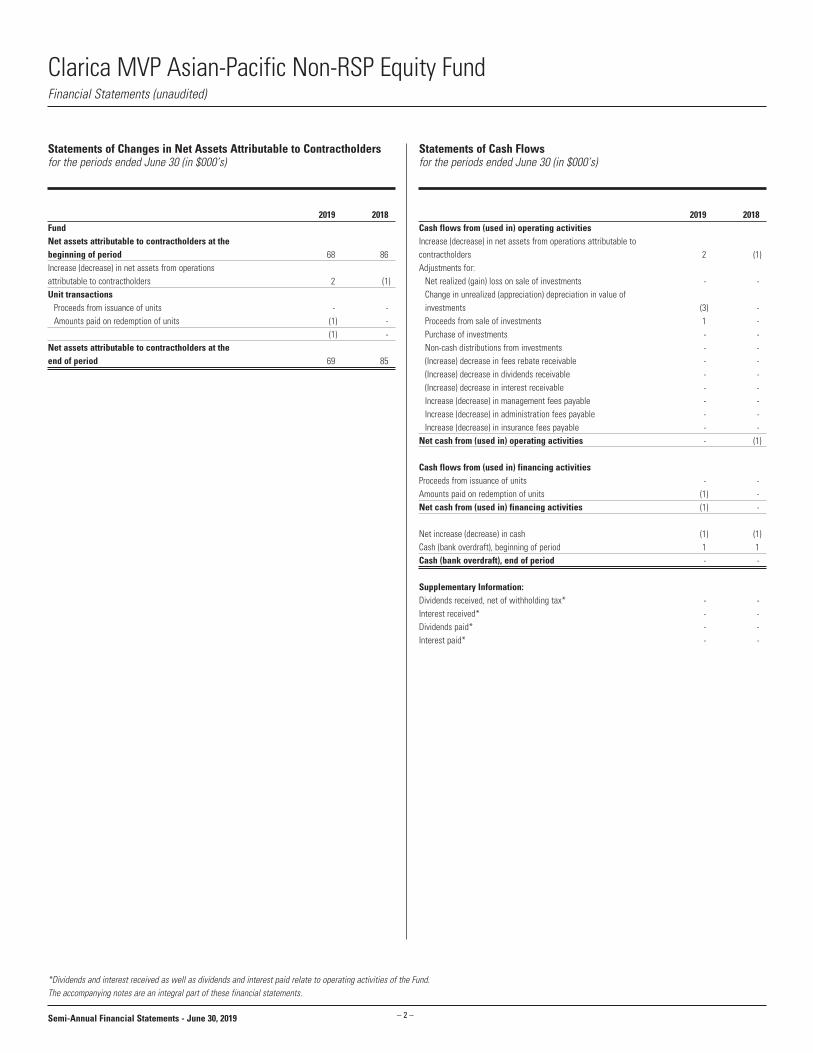
Clarica MVP Asian-Pacific Non-RSP Equity FundFinancial Statements (unaudited)
*Dividends and interest received as well as dividends and interest paid relate to operating activities of the Fund. The accompanying notes are an integral part of these financial statements.
2019 2018
68 86
2 (1)
- - (1) - (1) -
69 85
FundNet assets attributable to contractholders at the beginning of period Increase (decrease) in net assets from operations attributable to contractholders Unit transactions Proceeds from issuance of units Amounts paid on redemption of units
Net assets attributable to contractholders at the end of period
Statements of Changes in Net Assets Attributable to Contractholdersfor the periods ended June 30 (in $000’s)
2019 2018
2 (1)
- -
(3) - 1 - - - - - - - - - - - - - - - - - - (1)
- - (1) - (1) -
(1) (1) 1 1 - -
- - - - - - - -
Statements of Cash Flowsfor the periods ended June 30 (in $000’s)
Cash flows from (used in) operating activities Increase (decrease) in net assets from operations attributable to contractholders Adjustments for: Net realized (gain) loss on sale of investments Change in unrealized (appreciation) depreciation in value of
investments Proceeds from sale of investments Purchase of investments Non-cash distributions from investments (Increase) decrease in fees rebate receivable (Increase) decrease in dividends receivable (Increase) decrease in interest receivable Increase (decrease) in management fees payable Increase (decrease) in administration fees payable Increase (decrease) in insurance fees payable Net cash from (used in) operating activities
Cash flows from (used in) financing activities Proceeds from issuance of unitsAmounts paid on redemption of unitsNet cash from (used in) financing activities
Net increase (decrease) in cashCash (bank overdraft), beginning of periodCash (bank overdraft), end of period
Supplementary Information: Dividends received, net of withholding tax*Interest received*Dividends paid*Interest paid*
– 3 –Semi-Annual Financial Statements - June 30, 2019
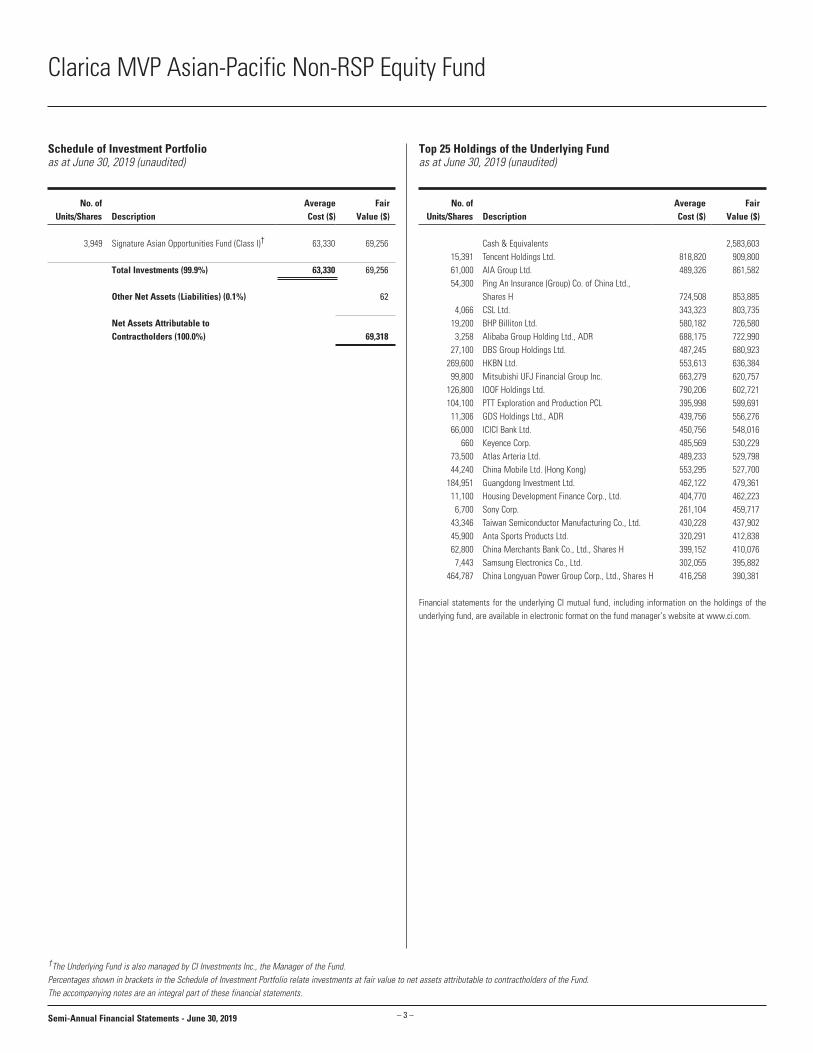
Clarica MVP Asian-Pacific Non-RSP Equity Fund
Schedule of Investment Portfolioas at June 30, 2019 (unaudited)
No. ofUnits/Shares Description
AverageCost ($)
FairValue ($)
3,949 Signature Asian Opportunities Fund (Class I)† 63,330 69,256
Total Investments (99.9%) 63,330 69,256 Other Net Assets (Liabilities) (0.1%) 62 Net Assets Attributable to Contractholders (100.0%) 69,318
Top 25 Holdings of the Underlying Fundas at June 30, 2019 (unaudited)
No. ofUnits/Shares Description
AverageCost ($)
FairValue ($)
Cash & Equivalents 2,583,603 15,391 Tencent Holdings Ltd. 818,820 909,800 61,000 AIA Group Ltd. 489,326 861,582 54,300 Ping An Insurance (Group) Co. of China Ltd., Shares H 724,508 853,885 4,066 CSL Ltd. 343,323 803,735 19,200 BHP Billiton Ltd. 580,182 726,580 3,258 Alibaba Group Holding Ltd., ADR 688,175 722,990 27,100 DBS Group Holdings Ltd. 487,245 680,923 269,600 HKBN Ltd. 553,613 636,384 99,800 Mitsubishi UFJ Financial Group Inc. 663,279 620,757 126,800 IOOF Holdings Ltd. 790,206 602,721 104,100 PTT Exploration and Production PCL 395,998 599,691 11,306 GDS Holdings Ltd., ADR 439,756 556,276 66,000 ICICI Bank Ltd. 450,756 548,016 660 Keyence Corp. 485,569 530,229 73,500 Atlas Arteria Ltd. 489,233 529,798 44,240 China Mobile Ltd. (Hong Kong) 553,295 527,700 184,951 Guangdong Investment Ltd. 462,122 479,361 11,100 Housing Development Finance Corp., Ltd. 404,770 462,223 6,700 Sony Corp. 261,104 459,717 43,346 Taiwan Semiconductor Manufacturing Co., Ltd. 430,228 437,902 45,900 Anta Sports Products Ltd. 320,291 412,838 62,800 China Merchants Bank Co., Ltd., Shares H 399,152 410,076 7,443 Samsung Electronics Co., Ltd. 302,055 395,882 464,787 China Longyuan Power Group Corp., Ltd., Shares H 416,258 390,381
Financial statements for the underlying CI mutual fund, including information on the holdings of the underlying fund, are available in electronic format on the fund manager’s website at www.ci.com.
† The Underlying Fund is also managed by CI Investments Inc., the Manager of the Fund.Percentages shown in brackets in the Schedule of Investment Portfolio relate investments at fair value to net assets attributable to contractholders of the Fund. The accompanying notes are an integral part of these financial statements.
– 4 –Semi-Annual Financial Statements - June 30, 2019
Clarica MVP Asian-Pacific Non-RSP Equity FundFund Specific Notes to Financial Statements (unaudited)
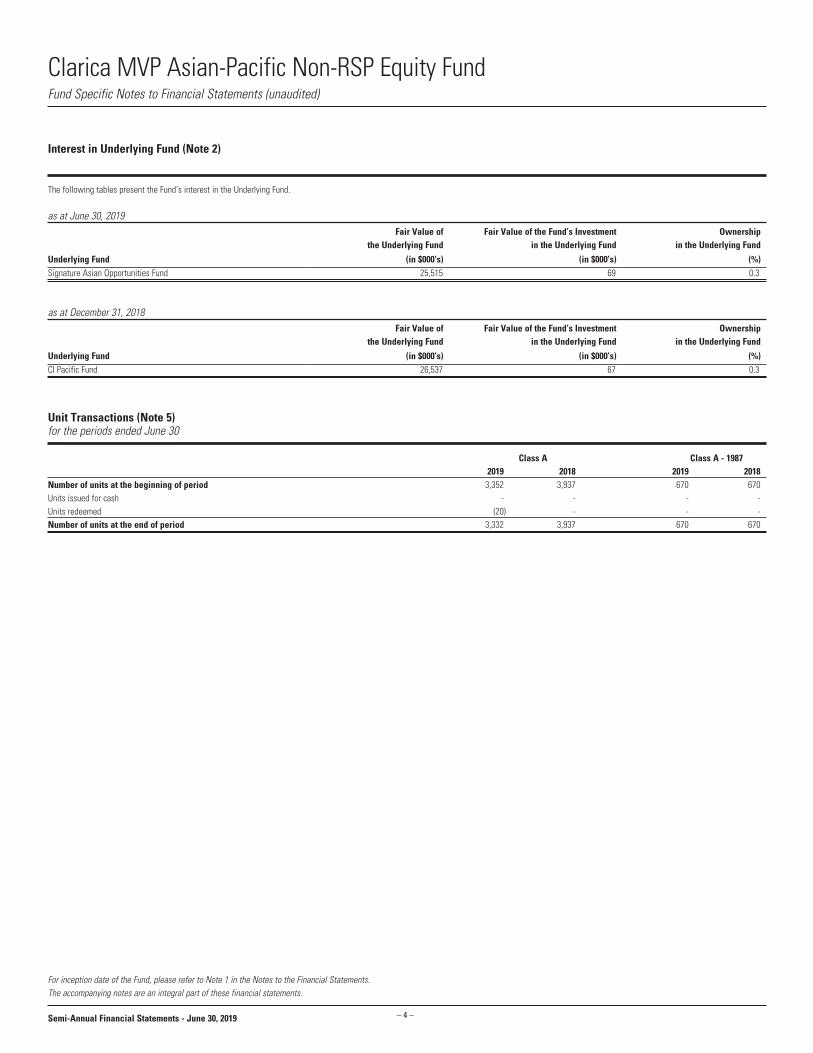
Interest in Underlying Fund (Note 2)
The following tables present the Fund’s interest in the Underlying Fund.
as at June 30, 2019 Fair Value of
the Underlying FundFair Value of the Fund’s Investment
in the Underlying FundOwnership
in the Underlying Fund
Underlying Fund (in $000’s) (in $000’s) (%)Signature Asian Opportunities Fund 25,515 69 0.3
as at December 31, 2018Fair Value of
the Underlying FundFair Value of the Fund’s Investment
in the Underlying FundOwnership
in the Underlying Fund
Underlying Fund (in $000’s) (in $000’s) (%)CI Pacific Fund 26,537 67 0.3
Unit Transactions (Note 5)for the periods ended June 30
Number of units at the beginning of periodUnits issued for cashUnits redeemed Number of units at the end of period
Class A Class A - 1987 2019 2018 2019 2018 3,352 3,937 670 670 - - - - (20) - - - 3,332 3,937 670 670
For inception date of the Fund, please refer to Note 1 in the Notes to the Financial Statements.The accompanying notes are an integral part of these financial statements.
– 5 –Semi-Annual Financial Statements - June 30, 2019
Clarica MVP Asian-Pacific Non-RSP Equity Fund
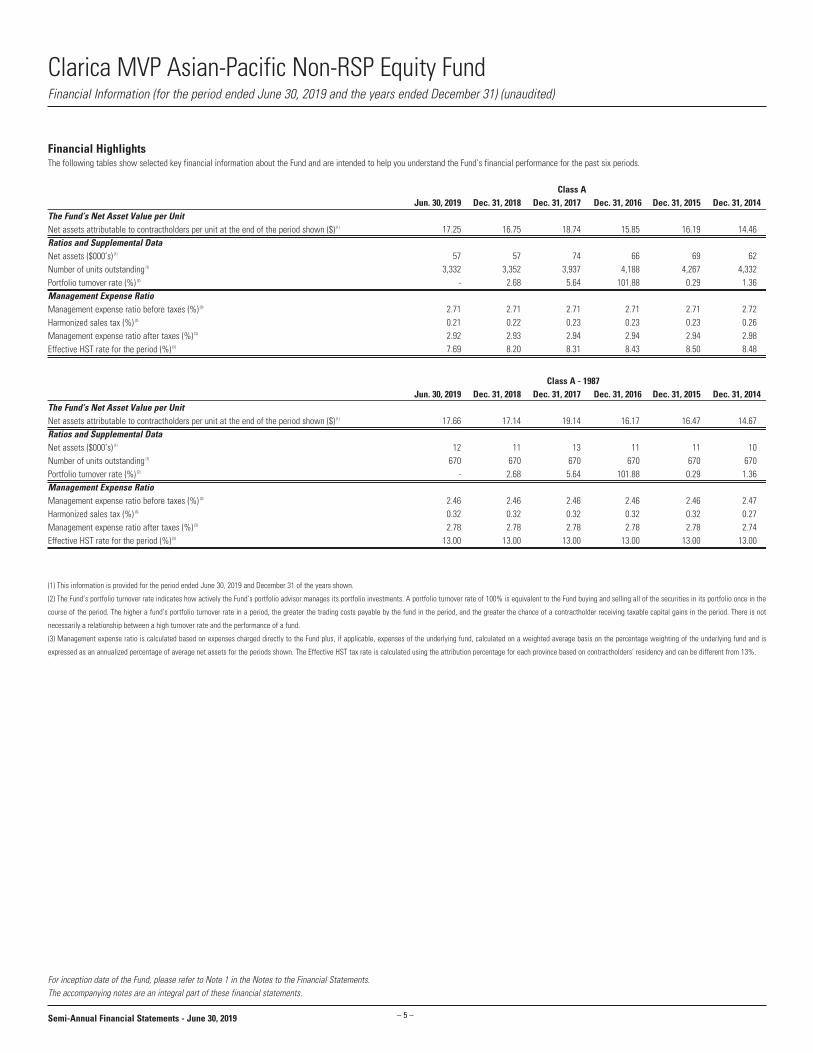
Financial Highlights The following tables show selected key financial information about the Fund and are intended to help you understand the Fund’s financial performance for the past six periods.
The Fund’s Net Asset Value per UnitNet assets attributable to contractholders per unit at the end of the period shown ($) (1)
Ratios and Supplemental DataNet assets ($000’s) (1)
Number of units outstanding (1)
Portfolio turnover rate (%) (2)
Management Expense RatioManagement expense ratio before taxes (%) (3)
Harmonized sales tax (%) (3)
Management expense ratio after taxes (%) (3)
Effective HST rate for the period (%) (3)
For inception date of the Fund, please refer to Note 1 in the Notes to the Financial Statements.The accompanying notes are an integral part of these financial statements.
Financial Information (for the period ended June 30, 2019 and the years ended December 31) (unaudited)
(1) This information is provided for the period ended June 30, 2019 and December 31 of the years shown.
(2) The Fund’s portfolio turnover rate indicates how actively the Fund’s portfolio advisor manages its portfolio investments. A portfolio turnover rate of 100% is equivalent to the Fund buying and selling all of the securities in its portfolio once in the
course of the period. The higher a fund’s portfolio turnover rate in a period, the greater the trading costs payable by the fund in the period, and the greater the chance of a contractholder receiving taxable capital gains in the period. There is not
necessarily a relationship between a high turnover rate and the performance of a fund.
(3) Management expense ratio is calculated based on expenses charged directly to the Fund plus, if applicable, expenses of the underlying fund, calculated on a weighted average basis on the percentage weighting of the underlying fund and is
expressed as an annualized percentage of average net assets for the periods shown. The Effective HST tax rate is calculated using the attribution percentage for each province based on contractholders’ residency and can be different from 13%.
Class A Jun. 30, 2019 Dec. 31, 2018 Dec. 31, 2017 Dec. 31, 2016 Dec. 31, 2015 Dec. 31, 2014
17.25 16.75 18.74 15.85 16.19 14.46
57 57 74 66 69 62 3,332 3,352 3,937 4,188 4,267 4,332 - 2.68 5.64 101.88 0.29 1.36
2.71 2.71 2.71 2.71 2.71 2.72 0.21 0.22 0.23 0.23 0.23 0.26 2.92 2.93 2.94 2.94 2.94 2.98 7.69 8.20 8.31 8.43 8.50 8.48
Class A - 1987 Jun. 30, 2019 Dec. 31, 2018 Dec. 31, 2017 Dec. 31, 2016 Dec. 31, 2015 Dec. 31, 2014
17.66 17.14 19.14 16.17 16.47 14.67
12 11 13 11 11 10 670 670 670 670 670 670 - 2.68 5.64 101.88 0.29 1.36
2.46 2.46 2.46 2.46 2.46 2.47 0.32 0.32 0.32 0.32 0.32 0.27 2.78 2.78 2.78 2.78 2.78 2.74 13.00 13.00 13.00 13.00 13.00 13.00
– 6 –Semi-Annual Financial Statements - June 30, 2019
Clarica MVP Asian-Pacific Non-RSP Equity Fund
The accompanying notes are an integral part of these financial statements.
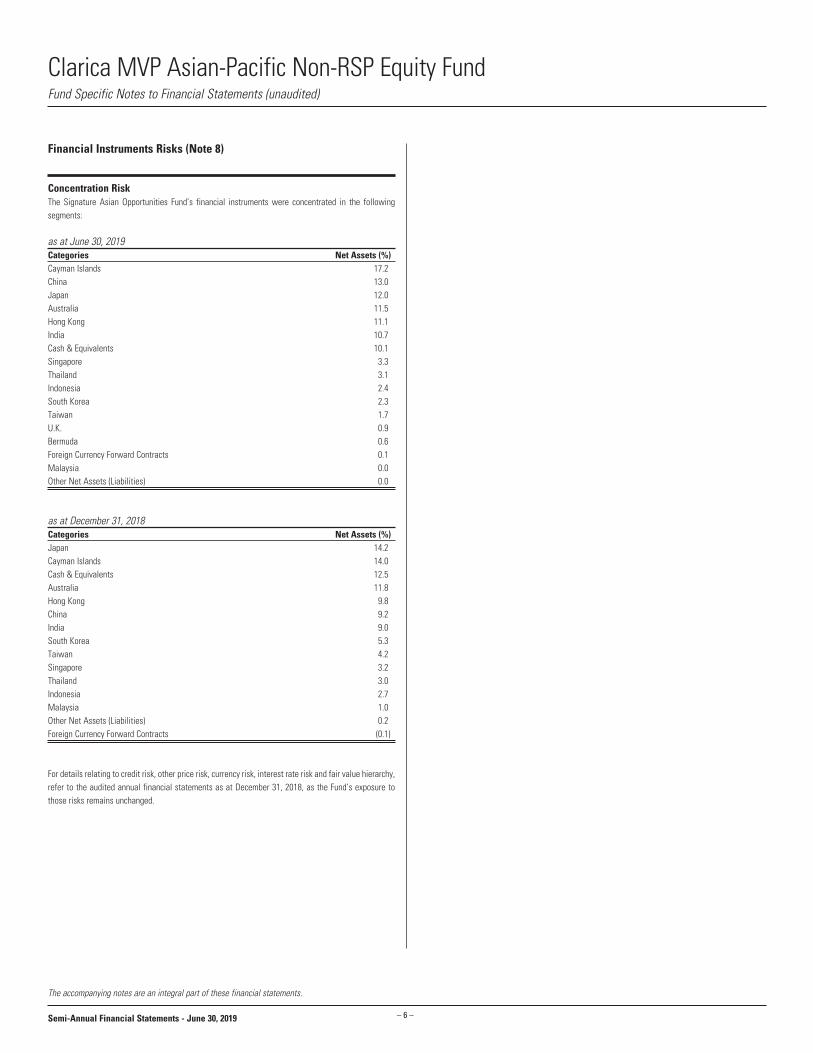
Concentration RiskThe Signature Asian Opportunities Fund’s financial instruments were concentrated in the following segments:
as at June 30, 2019Categories Net Assets (%)Cayman Islands 17.2China 13.0Japan 12.0Australia 11.5Hong Kong 11.1India 10.7Cash & Equivalents 10.1Singapore 3.3Thailand 3.1Indonesia 2.4South Korea 2.3Taiwan 1.7U.K. 0.9Bermuda 0.6Foreign Currency Forward Contracts 0.1Malaysia 0.0Other Net Assets (Liabilities) 0.0
as at December 31, 2018Categories Net Assets (%)Japan 14.2Cayman Islands 14.0Cash & Equivalents 12.5Australia 11.8Hong Kong 9.8China 9.2India 9.0South Korea 5.3Taiwan 4.2Singapore 3.2Thailand 3.0Indonesia 2.7Malaysia 1.0Other Net Assets (Liabilities) 0.2Foreign Currency Forward Contracts (0.1)
For details relating to credit risk, other price risk, currency risk, interest rate risk and fair value hierarchy, refer to the audited annual financial statements as at December 31, 2018, as the Fund’s exposure to those risks remains unchanged.
Fund Specific Notes to Financial Statements (unaudited)
Financial Instruments Risks (Note 8)

– 7 –Semi-Annual Financial Statements - June 30, 2019
Clarica MVP Asian-Pacific RSP Equity Fund
For inception date of the Fund, please refer to Note 1 in the Notes to the Financial Statements.The accompanying notes are an integral part of these financial statements.
Financial Statements (unaudited)
CIG - 9251
2019 2018
- - - - - - 9 9
20 (9)
- - - - 29 -
6 8 1 1 1 2 2 1 10 12
19 (12)
0.62 (0.31) 0.57 (0.31)
29,898 38,690 1,038 1,038
as at as atJun. 30, 2019 Dec. 31, 2018
535 589 1 1 - - - - - - 2 - 2 - 540 590
- - - - 4 - - - - - - - 4 - 536 590
489 563
18.43 17.91 19.01 18.44
Statements of Financial Position (in $000’s except for per unit amounts)
Statements of Comprehensive Income for the periods ended June 30 (in $000’s except for per unit amounts and number of units)
Assets Current assets Investments* Cash Fees rebate receivable Dividends receivable Interest receivable Receivable for investments sold Receivable for unit subscriptions
Liabilities Current liabilities Bank overdraft Payable for investments purchased Payable for unit redemptions Management fees payable Administration fees payable Insurance fees payable
Net assets attributable to contractholders
*Investments at cost
Net assets attributable to contractholders per unit: Class AClass A - 1987
Income Net gain (loss) on investments Dividends Income distributions from investments Capital gain distributions from investments Net realized gain (loss) on sale of investments Change in unrealized appreciation (depreciation) in value of
investments Other income Interest Fees rebate (Note 6)
Expenses (Note 6)Management fees Administration fees Insurance fees Harmonized sales tax
Increase (decrease) in net assets from operations attributable to contractholders
Increase (decrease) in net assets from operations attributable to contractholders per unit: Class AClass A - 1987
Weighted average number of units: Class AClass A - 1987

– 8 –Semi-Annual Financial Statements - June 30, 2019
Clarica MVP Asian-Pacific RSP Equity FundFinancial Statements (unaudited)
2019 2018
590 819
19 (12)
4 4 (77) (42) (73) (38)
536 769
FundNet assets attributable to contractholders at the beginning of period Increase (decrease) in net assets from operations attributable to contractholders Unit transactions Proceeds from issuance of units Amounts paid on redemption of units
Net assets attributable to contractholders at the end of period
Statements of Changes in Net Assets Attributable to Contractholdersfor the periods ended June 30 (in $000’s)
2019 2018
19 (12)
(9) (9)
(20) 9 84 55 (3) (3) - - - - - - - - - - - - - - 71 40
2 4 (73) (43) (71) (39)
- 1 1 2 1 3
- - - - - - - -
Statements of Cash Flowsfor the periods ended June 30 (in $000’s)
Cash flows from (used in) operating activities Increase (decrease) in net assets from operations attributable to contractholders Adjustments for: Net realized (gain) loss on sale of investments Change in unrealized (appreciation) depreciation in value of
investments Proceeds from sale of investments Purchase of investments Non-cash distributions from investments (Increase) decrease in fees rebate receivable (Increase) decrease in dividends receivable (Increase) decrease in interest receivable Increase (decrease) in management fees payable Increase (decrease) in administration fees payable Increase (decrease) in insurance fees payable Net cash from (used in) operating activities
Cash flows from (used in) financing activities Proceeds from issuance of unitsAmounts paid on redemption of unitsNet cash from (used in) financing activities
Net increase (decrease) in cashCash (bank overdraft), beginning of periodCash (bank overdraft), end of period
Supplementary Information: Dividends received, net of withholding tax*Interest received*Dividends paid*Interest paid*
*Dividends and interest received as well as dividends and interest paid relate to operating activities of the Fund. The accompanying notes are an integral part of these financial statements.
– 9 –Semi-Annual Financial Statements - June 30, 2019
Clarica MVP Asian-Pacific RSP Equity Fund
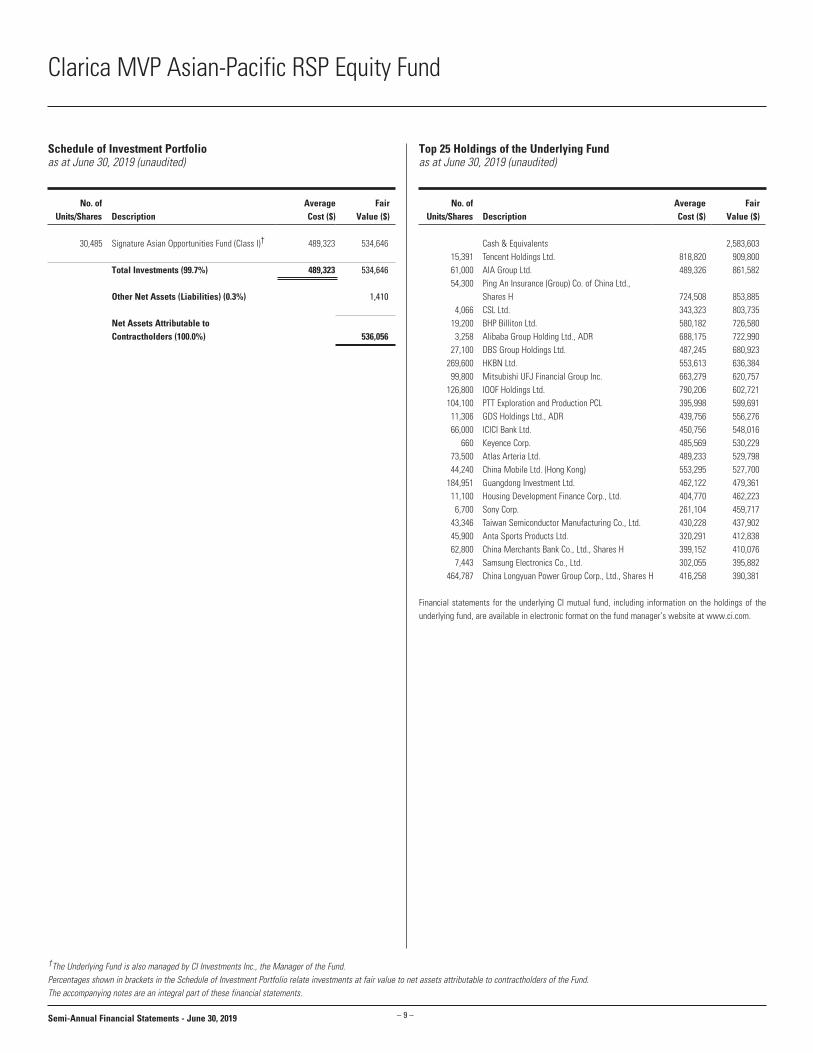
Schedule of Investment Portfolioas at June 30, 2019 (unaudited)
No. ofUnits/Shares Description
AverageCost ($)
FairValue ($)
30,485 Signature Asian Opportunities Fund (Class I)† 489,323 534,646
Total Investments (99.7%) 489,323 534,646 Other Net Assets (Liabilities) (0.3%) 1,410 Net Assets Attributable to Contractholders (100.0%) 536,056
Top 25 Holdings of the Underlying Fundas at June 30, 2019 (unaudited)
No. ofUnits/Shares Description
AverageCost ($)
FairValue ($)
Cash & Equivalents 2,583,603 15,391 Tencent Holdings Ltd. 818,820 909,800 61,000 AIA Group Ltd. 489,326 861,582 54,300 Ping An Insurance (Group) Co. of China Ltd., Shares H 724,508 853,885 4,066 CSL Ltd. 343,323 803,735 19,200 BHP Billiton Ltd. 580,182 726,580 3,258 Alibaba Group Holding Ltd., ADR 688,175 722,990 27,100 DBS Group Holdings Ltd. 487,245 680,923 269,600 HKBN Ltd. 553,613 636,384 99,800 Mitsubishi UFJ Financial Group Inc. 663,279 620,757 126,800 IOOF Holdings Ltd. 790,206 602,721 104,100 PTT Exploration and Production PCL 395,998 599,691 11,306 GDS Holdings Ltd., ADR 439,756 556,276 66,000 ICICI Bank Ltd. 450,756 548,016 660 Keyence Corp. 485,569 530,229 73,500 Atlas Arteria Ltd. 489,233 529,798 44,240 China Mobile Ltd. (Hong Kong) 553,295 527,700 184,951 Guangdong Investment Ltd. 462,122 479,361 11,100 Housing Development Finance Corp., Ltd. 404,770 462,223 6,700 Sony Corp. 261,104 459,717 43,346 Taiwan Semiconductor Manufacturing Co., Ltd. 430,228 437,902 45,900 Anta Sports Products Ltd. 320,291 412,838 62,800 China Merchants Bank Co., Ltd., Shares H 399,152 410,076 7,443 Samsung Electronics Co., Ltd. 302,055 395,882 464,787 China Longyuan Power Group Corp., Ltd., Shares H 416,258 390,381
Financial statements for the underlying CI mutual fund, including information on the holdings of the underlying fund, are available in electronic format on the fund manager’s website at www.ci.com.
† The Underlying Fund is also managed by CI Investments Inc., the Manager of the Fund.Percentages shown in brackets in the Schedule of Investment Portfolio relate investments at fair value to net assets attributable to contractholders of the Fund. The accompanying notes are an integral part of these financial statements.

– 10 –Semi-Annual Financial Statements - June 30, 2019
Clarica MVP Asian-Pacific RSP Equity FundFund Specific Notes to Financial Statements (unaudited)
Interest in Underlying Fund (Note 2)
The following tables present the Fund’s interest in the Underlying Fund.
as at June 30, 2019 Fair Value of
the Underlying FundFair Value of the Fund’s Investment
in the Underlying FundOwnership
in the Underlying Fund
Underlying Fund (in $000’s) (in $000’s) (%)Signature Asian Opportunities Fund 25,515 535 2.1
as at December 31, 2018Fair Value of
the Underlying FundFair Value of the Fund’s Investment
in the Underlying FundOwnership
in the Underlying Fund
Underlying Fund (in $000’s) (in $000’s) (%)CI Pacific Fund 26,537 589 2.2
Unit Transactions (Note 5)for the periods ended June 30
Number of units at the beginning of periodUnits issued for cashUnits redeemed Number of units at the end of period
Class A Class A - 1987 2019 2018 2019 2018 31,856 39,788 1,038 1,038 207 217 - - (4,052) (2,047) - - 28,011 37,958 1,038 1,038
For inception date of the Fund, please refer to Note 1 in the Notes to the Financial Statements.The accompanying notes are an integral part of these financial statements.

– 11 –Semi-Annual Financial Statements - June 30, 2019
Clarica MVP Asian-Pacific RSP Equity Fund
Financial Highlights The following tables show selected key financial information about the Fund and are intended to help you understand the Fund’s financial performance for the past six periods.
The Fund’s Net Asset Value per UnitNet assets attributable to contractholders per unit at the end of the period shown ($) (1)
Ratios and Supplemental DataNet assets ($000’s) (1)
Number of units outstanding (1)
Portfolio turnover rate (%) (2)
Management Expense RatioManagement expense ratio before taxes (%) (3)
Harmonized sales tax (%) (3)
Management expense ratio after taxes (%) (3)
Effective HST rate for the period (%) (3)
The Fund’s Net Asset Value per UnitNet assets attributable to contractholders per unit at the end of the period shown ($) (1)
Ratios and Supplemental DataNet assets ($000’s) (1)
Number of units outstanding (1)
Portfolio turnover rate (%) (2)
Management Expense RatioManagement expense ratio before taxes (%) (3)
Harmonized sales tax (%) (3)
Management expense ratio after taxes (%) (3)
Effective HST rate for the period (%) (3)
For inception date of the Fund, please refer to Note 1 in the Notes to the Financial Statements.The accompanying notes are an integral part of these financial statements.
Financial Information (for the period ended June 30, 2019 and the years ended December 31) (unaudited)
(1) This information is provided for the period ended June 30, 2019 and December 31 of the years shown.
(2) The Fund’s portfolio turnover rate indicates how actively the Fund’s portfolio advisor manages its portfolio investments. A portfolio turnover rate of 100% is equivalent to the Fund buying and selling all of the securities in its portfolio once in the
course of the period. The higher a fund’s portfolio turnover rate in a period, the greater the trading costs payable by the fund in the period, and the greater the chance of a contractholder receiving taxable capital gains in the period. There is not
necessarily a relationship between a high turnover rate and the performance of a fund.
(3) Management expense ratio is calculated based on expenses charged directly to the Fund plus, if applicable, expenses of the underlying fund, calculated on a weighted average basis on the percentage weighting of the underlying fund and is
expressed as an annualized percentage of average net assets for the periods shown. The Effective HST tax rate is calculated using the attribution percentage for each province based on contractholders’ residency and can be different from 13%.
Class A Jun. 30, 2019 Dec. 31, 2018 Dec. 31, 2017 Dec. 31, 2016 Dec. 31, 2015 Dec. 31, 2014
18.43 17.91 20.05 16.98 17.34 15.49
516 571 798 736 824 766 28,011 31,856 39,788 43,353 47,534 49,398 0.51 3.29 4.72 99.78 2.57 2.09
2.71 2.71 2.71 2.71 2.71 2.71 0.32 0.32 0.32 0.31 0.31 0.28 3.03 3.03 3.03 3.02 3.02 2.99 11.90 11.93 11.83 11.62 11.61 11.69
Class A - 1987 Jun. 30, 2019 Dec. 31, 2018 Dec. 31, 2017 Dec. 31, 2016 Dec. 31, 2015 Dec. 31, 2014
19.01 18.44 20.55 17.33 17.65 15.72
20 19 21 18 33 31 1,038 1,038 1,038 1,038 1,869 1,991 0.51 3.29 4.72 99.78 2.57 2.09
2.46 2.46 2.46 2.46 2.46 2.46 0.16 0.16 0.16 0.24 0.24 0.24 2.62 2.62 2.62 2.70 2.70 2.70 6.62 6.62 6.62 9.64 9.96 8.87
– 12 –Semi-Annual Financial Statements - June 30, 2019
Clarica MVP Asian-Pacific RSP Equity Fund
The accompanying notes are an integral part of these financial statements.
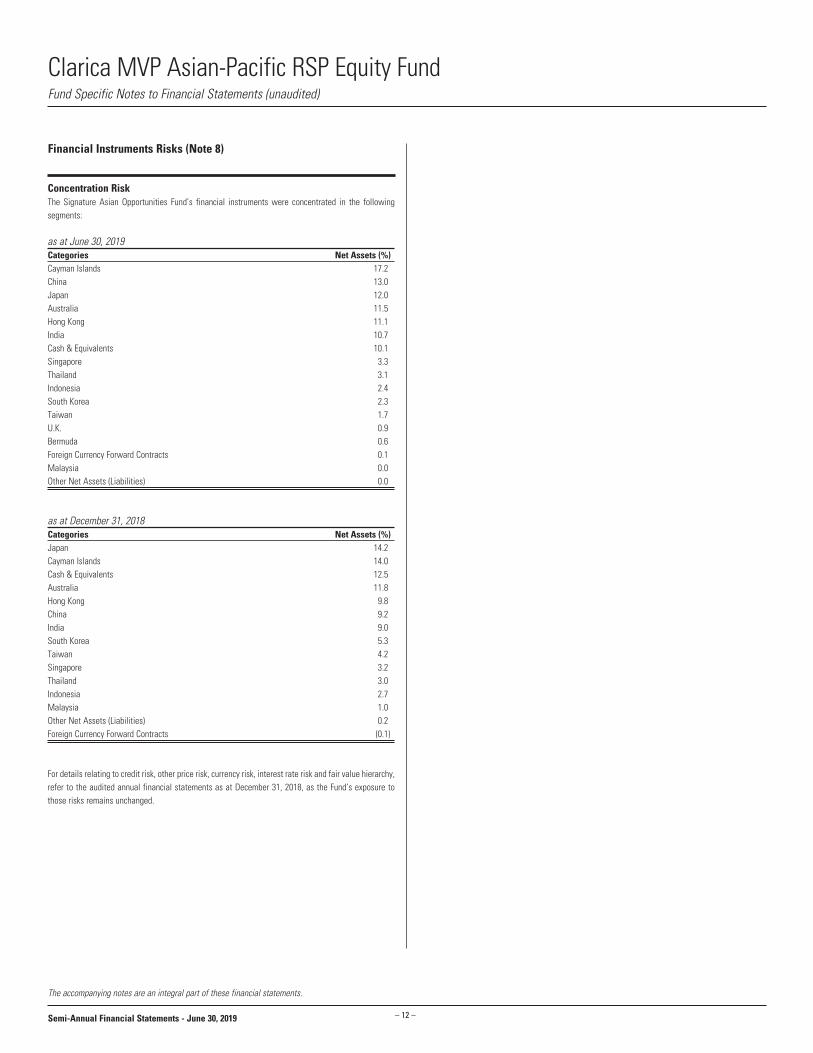
Concentration RiskThe Signature Asian Opportunities Fund’s financial instruments were concentrated in the following segments:
as at June 30, 2019Categories Net Assets (%)Cayman Islands 17.2China 13.0Japan 12.0Australia 11.5Hong Kong 11.1India 10.7Cash & Equivalents 10.1Singapore 3.3Thailand 3.1Indonesia 2.4South Korea 2.3Taiwan 1.7U.K. 0.9Bermuda 0.6Foreign Currency Forward Contracts 0.1Malaysia 0.0Other Net Assets (Liabilities) 0.0
as at December 31, 2018Categories Net Assets (%)Japan 14.2Cayman Islands 14.0Cash & Equivalents 12.5Australia 11.8Hong Kong 9.8China 9.2India 9.0South Korea 5.3Taiwan 4.2Singapore 3.2Thailand 3.0Indonesia 2.7Malaysia 1.0Other Net Assets (Liabilities) 0.2Foreign Currency Forward Contracts (0.1)
For details relating to credit risk, other price risk, currency risk, interest rate risk and fair value hierarchy, refer to the audited annual financial statements as at December 31, 2018, as the Fund’s exposure to those risks remains unchanged.
Fund Specific Notes to Financial Statements (unaudited)
Financial Instruments Risks (Note 8)

– 13 –Semi-Annual Financial Statements - June 30, 2019
Clarica MVP Equity Fund
For inception date of the Fund, please refer to Note 1 in the Notes to the Financial Statements.The accompanying notes are an integral part of these financial statements.
Financial Statements (unaudited)
CIG - 9254
2019 2018
- - 152 115 306 626 53 61
1,697 (107)
- - - - 2,208 695
158 183 19 22 34 39 24 28 235 272
1,973 423
6.98 1.32 7.39 1.47
255,529 288,014 25,594 29,501
as at as atJun. 30, 2019 Dec. 31, 2018
15,872 15,177 77 26 - - - - - - 9 3 - - 15,958 15,206
- - - - 8 1 - - - - - - 8 1 15,950 15,205
15,107 16,109
58.91 52.05 60.66 53.51
Statements of Financial Position (in $000’s except for per unit amounts)
Statements of Comprehensive Income for the periods ended June 30 (in $000’s except for per unit amounts and number of units)
AssetsCurrent assets Investments* Cash Fees rebate receivable Dividends receivable Interest receivable Receivable for investments sold Receivable for unit subscriptions
Liabilities Current liabilities Bank overdraft Payable for investments purchased Payable for unit redemptions Management fees payable Administration fees payable Insurance fees payable
Net assets attributable to contractholders
*Investments at cost
Net assets attributable to contractholders per unit: Class AClass A - 1987
Income Net gain (loss) on investments Dividends Income distributions from investments Capital gain distributions from investments Net realized gain (loss) on sale of investments Change in unrealized appreciation (depreciation) in value of
investments Other income Interest Fees rebate (Note 6)
Expenses (Note 6)Management fees Administration fees Insurance fees Harmonized sales tax
Increase (decrease) in net assets from operations attributable to contractholders
Increase (decrease) in net assets from operations attributable to contractholders per unit: Class AClass A - 1987
Weighted average number of units: Class AClass A - 1987

– 14 –Semi-Annual Financial Statements - June 30, 2019
Clarica MVP Equity FundFinancial Statements (unaudited)
2019 2018
15,205 18,702
1,973 423
72 114 (1,300) (960) (1,228) (846)
15,950 18,279
FundNet assets attributable to contractholders at the beginning of period Increase (decrease) in net assets from operations attributable to contractholders Unit transactions Proceeds from issuance of units Amounts paid on redemption of units
Net assets attributable to contractholders at the end of period
Statements of Changes in Net Assets Attributable to Contractholdersfor the periods ended June 30 (in $000’s)
2019 2018
1,973 423
(53) (61)
(1,697) 107 1,537 1,200 (30) (37) (458) (741) - - - - - - - - - - - - 1,272 891
72 114 (1,293) (957) (1,221) (843)
51 48 26 17 77 65
- - - - - - - -
Statements of Cash Flowsfor the periods ended June 30 (in $000’s)
Cash flows from (used in) operating activities Increase (decrease) in net assets from operations attributable to contractholders Adjustments for: Net realized (gain) loss on sale of investments Change in unrealized (appreciation) depreciation in value of
investments Proceeds from sale of investments Purchase of investments Non-cash distributions from investments (Increase) decrease in fees rebate receivable (Increase) decrease in dividends receivable (Increase) decrease in interest receivable Increase (decrease) in management fees payable Increase (decrease) in administration fees payable Increase (decrease) in insurance fees payable Net cash from (used in) operating activities
Cash flows from (used in) financing activities Proceeds from issuance of unitsAmounts paid on redemption of unitsNet cash from (used in) financing activities
Net increase (decrease) in cashCash (bank overdraft), beginning of periodCash (bank overdraft), end of period
Supplementary Information: Dividends received, net of withholding tax*Interest received*Dividends paid*Interest paid*
*Dividends and interest received as well as dividends and interest paid relate to operating activities of the Fund. The accompanying notes are an integral part of these financial statements.

– 15 –Semi-Annual Financial Statements - June 30, 2019
Clarica MVP Equity Fund
Schedule of Investment Portfolioas at June 30, 2019 (unaudited)
No. ofUnits/Shares Description
AverageCost ($)
FairValue ($)
846,491 Synergy Canadian Corporate Class (I Shares)† 15,106,758 15,871,880 Total Investments (99.5%) 15,106,758 15,871,880 Other Net Assets (Liabilities) (0.5%) 77,902 Net Assets Attributable to Contractholders (100.0%) 15,949,782
Top 25 Holdings of the Underlying Fundas at June 30, 2019 (unaudited)
No. ofUnits/Shares Description
AverageCost ($)
FairValue ($)
Cash & Equivalents 68,490,262 410,400 Royal Bank of Canada 33,194,552 42,710,328 554,467 Toronto-Dominion Bank 33,711,055 42,427,815 74,061 Canadian Pacific Railway Ltd. 17,526,173 22,842,634 351,679 Brookfield Asset Management Inc., Class A 16,424,511 22,032,689 101,643 Microsoft Corp. 9,226,071 17,831,685 183,394 Alimentation Couche-Tard Inc., Class B 11,923,111 15,113,500 405,945 Canadian Natural Resources Ltd. 15,989,034 14,333,918 292,317 Pembina Pipeline Corp. 12,757,815 14,250,454 109,389 Waste Connections Inc. 7,031,037 13,684,564 326,352 Parkland Fuel Corp. 8,905,308 13,559,926 105,927 Intact Financial Corp. 11,457,064 12,819,286 187,305 Agnico-Eagle Mines Ltd. 10,220,279 12,575,658 259,975 Enbridge Inc. 11,572,890 12,296,818 305,226 Air Canada 5,136,292 12,114,420 4,875 Amazon.com Inc. 6,708,302 12,089,533 359,204 Empire Co., Ltd., Class A 8,709,031 11,846,548 103,054 Abbott Laboratories Inc. 7,610,643 11,350,124 89,357 Canadian National Railway Co. 7,487,209 10,830,068 31,173 Mastercard Inc., Class A 4,882,681 10,799,243 185,668 Brookfield Infrastructure Partners L.P. 9,253,484 10,421,545 150,000 Sony Corp. 9,811,842 10,292,170 84,977 Franco-Nevada Corp. 8,594,990 9,445,194 62,245 PayPal Holdings Inc. 6,342,680 9,330,351 90,607 CGI Inc. 6,131,617 9,122,313
Financial statements for the underlying CI mutual fund, including information on the holdings of the underlying fund, are available in electronic format on the fund manager’s website at www.ci.com.
† The Underlying Fund is also managed by CI Investments Inc., the Manager of the Fund.Percentages shown in brackets in the Schedule of Investment Portfolio relate investments at fair value to net assets attributable to contractholders of the Fund. The accompanying notes are an integral part of these financial statements.
– 16 –Semi-Annual Financial Statements - June 30, 2019
Clarica MVP Equity FundFund Specific Notes to Financial Statements (unaudited)
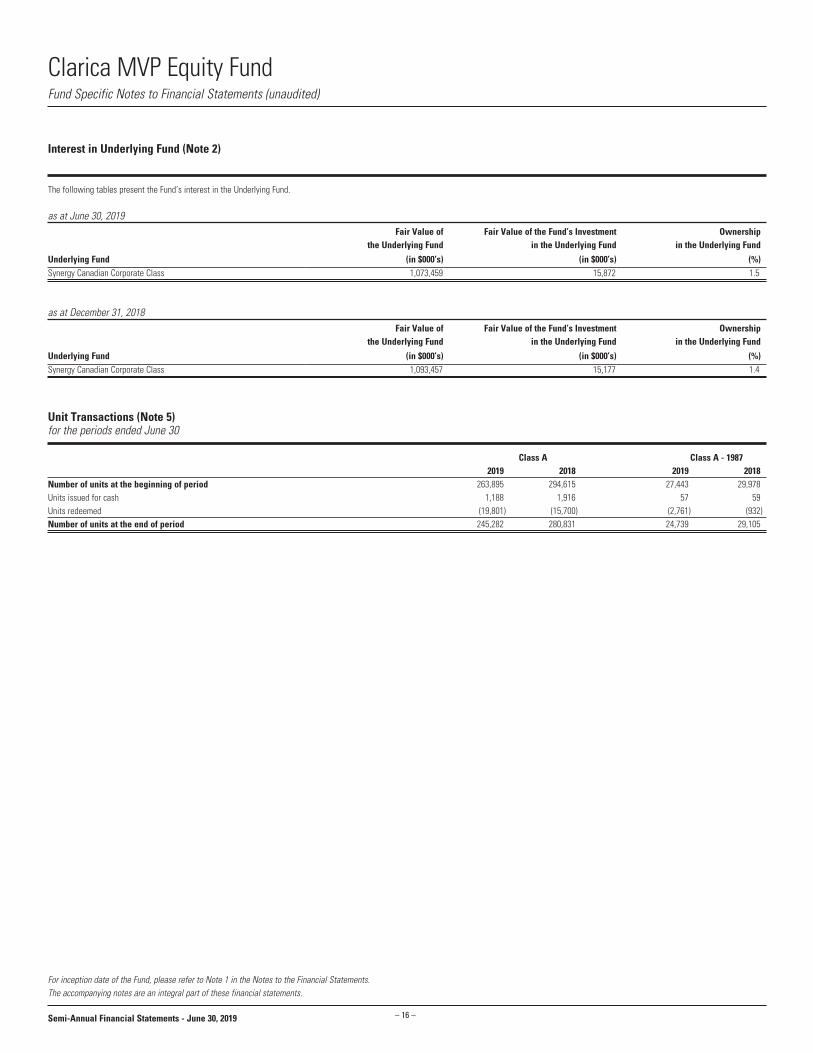
Interest in Underlying Fund (Note 2)
The following tables present the Fund’s interest in the Underlying Fund.
as at June 30, 2019 Fair Value of
the Underlying FundFair Value of the Fund’s Investment
in the Underlying FundOwnership
in the Underlying Fund
Underlying Fund (in $000’s) (in $000’s) (%)Synergy Canadian Corporate Class 1,073,459 15,872 1.5
as at December 31, 2018Fair Value of
the Underlying FundFair Value of the Fund’s Investment
in the Underlying FundOwnership
in the Underlying Fund
Underlying Fund (in $000’s) (in $000’s) (%)Synergy Canadian Corporate Class 1,093,457 15,177 1.4
Unit Transactions (Note 5)for the periods ended June 30
Number of units at the beginning of periodUnits issued for cashUnits redeemed Number of units at the end of period
Class A Class A - 1987 2019 2018 2019 2018 263,895 294,615 27,443 29,978 1,188 1,916 57 59 (19,801) (15,700) (2,761) (932) 245,282 280,831 24,739 29,105
For inception date of the Fund, please refer to Note 1 in the Notes to the Financial Statements.The accompanying notes are an integral part of these financial statements.

– 17 –Semi-Annual Financial Statements - June 30, 2019
Clarica MVP Equity Fund
Financial Highlights The following tables show selected key financial information about the Fund and are intended to help you understand the Fund’s financial performance for the past six periods.
The Fund’s Net Asset Value per UnitNet assets attributable to contractholders per unit at the end of the period shown ($) (1)
Ratios and Supplemental DataNet assets ($000’s) (1)
Number of units outstanding (1)
Portfolio turnover rate (%) (2)
Management Expense RatioManagement expense ratio before taxes (%) (3)
Harmonized sales tax (%) (3)
Management expense ratio after taxes (%) (3)
Effective HST rate for the period (%) (3)
The Fund’s Net Asset Value per UnitNet assets attributable to contractholders per unit at the end of the period shown ($) (1)
Ratios and Supplemental DataNet assets ($000’s) (1)
Number of units outstanding (1)
Portfolio turnover rate (%) (2)
Management Expense RatioManagement expense ratio before taxes (%) (3)
Harmonized sales tax (%) (3)
Management expense ratio after taxes (%) (3)
Effective HST rate for the period (%) (3)
For inception date of the Fund, please refer to Note 1 in the Notes to the Financial Statements.The accompanying notes are an integral part of these financial statements.
Financial Information (for the period ended June 30, 2019 and the years ended December 31) (unaudited)
(1) This information is provided for the period ended June 30, 2019 and December 31 of the years shown.
(2) The Fund’s portfolio turnover rate indicates how actively the Fund’s portfolio advisor manages its portfolio investments. A portfolio turnover rate of 100% is equivalent to the Fund buying and selling all of the securities in its portfolio once in the
course of the period. The higher a fund’s portfolio turnover rate in a period, the greater the trading costs payable by the fund in the period, and the greater the chance of a contractholder receiving taxable capital gains in the period. There is not
necessarily a relationship between a high turnover rate and the performance of a fund.
(3) Management expense ratio is calculated based on expenses charged directly to the Fund plus, if applicable, expenses of the underlying fund, calculated on a weighted average basis on the percentage weighting of the underlying fund and is
expressed as an annualized percentage of average net assets for the periods shown. The Effective HST tax rate is calculated using the attribution percentage for each province based on contractholders’ residency and can be different from 13%.
Class A Jun. 30, 2019 Dec. 31, 2018 Dec. 31, 2017 Dec. 31, 2016 Dec. 31, 2015 Dec. 31, 2014
58.91 52.05 57.48 52.87 50.64 50.47
14,449 13,736 16,936 17,275 18,907 21,289 245,282 263,895 294,615 326,737 373,353 421,793 3.04 5.82 5.92 105.37 5.71 1.52
2.69 2.69 2.69 2.69 2.69 2.69 0.31 0.31 0.32 0.31 0.31 0.28 3.00 3.00 3.01 3.00 3.00 2.97 11.65 11.71 11.77 11.63 11.63 11.74
Class A - 1987 Jun. 30, 2019 Dec. 31, 2018 Dec. 31, 2017 Dec. 31, 2016 Dec. 31, 2015 Dec. 31, 2014
60.66 53.51 58.90 54.00 51.57 51.25
1,501 1,469 1,766 1,902 2,095 2,775 24,739 27,443 29,978 35,219 40,616 54,137 3.04 5.82 5.92 105.37 5.71 1.52
2.44 2.44 2.44 2.44 2.44 2.44 0.23 0.24 0.23 0.24 0.25 0.24 2.67 2.68 2.67 2.68 2.69 2.68 9.28 9.68 9.60 9.79 10.23 9.84
– 18 –Semi-Annual Financial Statements - June 30, 2019
Clarica MVP Equity Fund
The accompanying notes are an integral part of these financial statements.
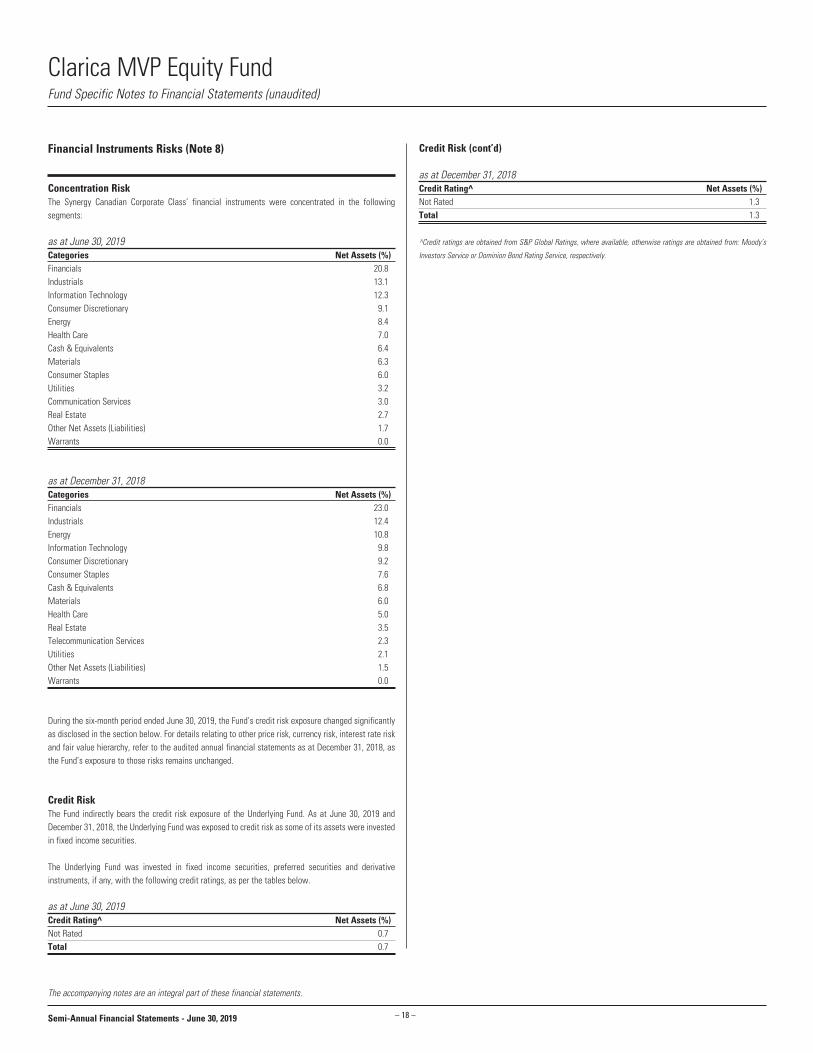
Concentration RiskThe Synergy Canadian Corporate Class’ financial instruments were concentrated in the following segments:
as at June 30, 2019Categories Net Assets (%)Financials 20.8Industrials 13.1Information Technology 12.3Consumer Discretionary 9.1Energy 8.4Health Care 7.0Cash & Equivalents 6.4Materials 6.3Consumer Staples 6.0Utilities 3.2Communication Services 3.0Real Estate 2.7Other Net Assets (Liabilities) 1.7Warrants 0.0
as at December 31, 2018Categories Net Assets (%)Financials 23.0Industrials 12.4Energy 10.8Information Technology 9.8Consumer Discretionary 9.2Consumer Staples 7.6Cash & Equivalents 6.8Materials 6.0Health Care 5.0Real Estate 3.5Telecommunication Services 2.3Utilities 2.1Other Net Assets (Liabilities) 1.5Warrants 0.0
During the six-month period ended June 30, 2019, the Fund’s credit risk exposure changed significantly as disclosed in the section below. For details relating to other price risk, currency risk, interest rate risk and fair value hierarchy, refer to the audited annual financial statements as at December 31, 2018, as the Fund’s exposure to those risks remains unchanged.
Credit RiskThe Fund indirectly bears the credit risk exposure of the Underlying Fund. As at June 30, 2019 and December 31, 2018, the Underlying Fund was exposed to credit risk as some of its assets were invested in fixed income securities.
The Underlying Fund was invested in fixed income securities, preferred securities and derivative instruments, if any, with the following credit ratings, as per the tables below.
as at June 30, 2019Credit Rating^ Net Assets (%)Not Rated 0.7Total 0.7
Fund Specific Notes to Financial Statements (unaudited)
Financial Instruments Risks (Note 8) Credit Risk (cont’d)
as at December 31, 2018Credit Rating^ Net Assets (%)Not Rated 1.3Total 1.3
^Credit ratings are obtained from S&P Global Ratings, where available, otherwise ratings are obtained from: Moody’s
Investors Service or Dominion Bond Rating Service, respectively.

– 19 –Semi-Annual Financial Statements - June 30, 2019
Clarica MVP Global Equity Fund
For inception date of the Fund, please refer to Note 1 in the Notes to the Financial Statements.The accompanying notes are an integral part of these financial statements.
Financial Statements (unaudited)
CIG - 9255
2019 2018
- - 13 10 26 51 12 17
115 (2)
- - - - 166 76
13 15 2 2 3 3 2 2 20 22
146 54
2.20 0.75 2.64 0.81
62,205 67,513 3,311 3,960
as at as atJun. 30, 2019 Dec. 31, 2018
1,310 1,297 2 6 - - - - - - - - - - 1,312 1,303
- - - - - - - - - - - - - - 1,312 1,303
1,211 1,313
21.16 19.00 21.82 19.56
Statements of Financial Position (in $000’s except for per unit amounts)
Statements of Comprehensive Income for the periods ended June 30 (in $000’s except for per unit amounts and number of units)
Assets Current assets Investments* Cash Fees rebate receivable Dividends receivable Interest receivable Receivable for investments sold Receivable for unit subscriptions
Liabilities Current liabilities Bank overdraft Payable for investments purchased Payable for unit redemptions Management fees payable Administration fees payable Insurance fees payable
Net assets attributable to contractholders
*Investments at cost
Net assets attributable to contractholders per unit: Class AClass A - 1987
Income Net gain (loss) on investments Dividends Income distributions from investments Capital gain distributions from investments Net realized gain (loss) on sale of investments Change in unrealized appreciation (depreciation) in value of
investments Other income Interest Fees rebate (Note 6)
Expenses (Note 6)Management fees Administration fees Insurance fees Harmonized sales tax
Increase (decrease) in net assets from operations attributable to contractholders
Increase (decrease) in net assets from operations attributable to contractholders per unit: Class AClass A - 1987
Weighted average number of units: Class AClass A - 1987

– 20 –Semi-Annual Financial Statements - June 30, 2019
Clarica MVP Global Equity FundFinancial Statements (unaudited)
2019 2018
1,303 1,531
146 54
15 17 (152) (127) (137) (110)
1,312 1,475
FundNet assets attributable to contractholders at the beginning of period Increase (decrease) in net assets from operations attributable to contractholders Unit transactions Proceeds from issuance of units Amounts paid on redemption of units
Net assets attributable to contractholders at the end of period
Statements of Changes in Net Assets Attributable to Contractholdersfor the periods ended June 30 (in $000’s)
2019 2018
146 54
(12) (17)
(115) 2 165 163 (12) (13) (39) (61) - - - - - - - - - - - - 133 128
15 16 (152) (125) (137) (109)
(4) 19 6 (15) 2 4
- - - - - - - -
Statements of Cash Flowsfor the periods ended June 30 (in $000’s)
Cash flows from (used in) operating activities Increase (decrease) in net assets from operations attributable to contractholders Adjustments for: Net realized (gain) loss on sale of investments Change in unrealized (appreciation) depreciation in value of
investments Proceeds from sale of investments Purchase of investments Non-cash distributions from investments (Increase) decrease in fees rebate receivable (Increase) decrease in dividends receivable (Increase) decrease in interest receivable Increase (decrease) in management fees payable Increase (decrease) in administration fees payable Increase (decrease) in insurance fees payable Net cash from (used in) operating activities
Cash flows from (used in) financing activities Proceeds from issuance of unitsAmounts paid on redemption of unitsNet cash from (used in) financing activities
Net increase (decrease) in cashCash (bank overdraft), beginning of periodCash (bank overdraft), end of period
Supplementary Information: Dividends received, net of withholding tax*Interest received*Dividends paid*Interest paid*
*Dividends and interest received as well as dividends and interest paid relate to operating activities of the Fund. The accompanying notes are an integral part of these financial statements.

– 21 –Semi-Annual Financial Statements - June 30, 2019
Clarica MVP Global Equity Fund
Schedule of Investment Portfolioas at June 30, 2019 (unaudited)
No. ofUnits/Shares Description
AverageCost ($)
FairValue ($)
76,887 Signature Global Equity Corporate Class (I Shares)† 1,211,138 1,309,511
Total Investments (99.8%) 1,211,138 1,309,511 Other Net Assets (Liabilities) (0.2%) 2,557 Net Assets Attributable to Contractholders (100.0%) 1,312,068
Top 25 Holdings of the Underlying Fundas at June 30, 2019 (unaudited)
No. ofUnits/Shares Description
AverageCost ($)
FairValue ($)
Cash & Equivalents 13,440,204 13,600 Microsoft Corp. 1,126,414 2,385,909 13,500 SPDR Gold Trust 2,265,136 2,354,929 44,250 Synchrony Financial 1,802,713 2,009,125 47,900 Advanced Micro Devices Inc. 677,893 1,905,110 725 Amazon.com Inc. 889,377 1,797,931 25,800 Sony Corp. 975,994 1,770,253 23,000 Marathon Petroleum Corp. 2,199,671 1,683,155 58,300 Prudential PLC 1,722,481 1,663,720 14,900 Merck & Co., Inc. 1,645,859 1,636,173 18,850 Royal Dutch Shell PLC, Class A, ADR 1,477,032 1,606,319 30,000 Samsung Electronics Co., Ltd. 1,099,641 1,595,656 29,451 Air Lease Corp. 1,496,159 1,594,448 22,900 Brookfield Asset Management Inc., Class A (USD) 1,176,311 1,432,918 5,300 Apple Inc. 1,084,676 1,373,742 102,793 SLM Corp. 1,431,224 1,308,487 8,500 Texas Instruments Inc. 1,240,858 1,277,466 10,600 Novartis AG, Registered Shares 1,199,869 1,268,320 79,400 Ping An Insurance (Group) Co. of China Ltd., Shares H 1,009,248 1,248,591 3,850 UnitedHealth Group Inc. 956,592 1,230,292 21,600 Pfizer Inc. 1,229,069 1,225,412 8,950 Nestle S.A., Registered Shares 818,039 1,213,279 18,942 Wells Fargo & Co. 1,116,176 1,173,844 30,880 Bank of America Corp. 1,162,908 1,172,776 5,100 Honeywell International Inc. 911,660 1,166,083
Financial statements for the underlying CI mutual fund, including information on the holdings of the underlying fund, are available in electronic format on the fund manager’s website at www.ci.com.
† The Underlying Fund is also managed by CI Investments Inc., the Manager of the Fund.Percentages shown in brackets in the Schedule of Investment Portfolio relate investments at fair value to net assets attributable to contractholders of the Fund. The accompanying notes are an integral part of these financial statements.

– 22 –Semi-Annual Financial Statements - June 30, 2019
Clarica MVP Global Equity FundFund Specific Notes to Financial Statements (unaudited)
Interest in Underlying Fund (Note 2)
The following tables present the Fund’s interest in the Underlying Fund.
as at June 30, 2019 Fair Value of
the Underlying FundFair Value of the Fund’s Investment
in the Underlying FundOwnership
in the Underlying Fund
Underlying Fund (in $000’s) (in $000’s) (%)Signature Global Equity Corporate Class 111,321 1,310 1.2
as at December 31, 2018Fair Value of
the Underlying FundFair Value of the Fund’s Investment
in the Underlying FundOwnership
in the Underlying Fund
Underlying Fund (in $000’s) (in $000’s) (%)Signature Global Equity Corporate Class 108,359 1,297 1.2
Unit Transactions (Note 5)for the periods ended June 30
Number of units at the beginning of periodUnits issued for cashUnits redeemed Number of units at the end of period
Class A Class A - 1987 2019 2018 2019 2018 64,561 69,952 3,922 4,033 705 766 14 14 (5,952) (5,818) (1,314) (138) 59,314 64,900 2,622 3,909
For inception date of the Fund, please refer to Note 1 in the Notes to the Financial Statements.The accompanying notes are an integral part of these financial statements.

– 23 –Semi-Annual Financial Statements - June 30, 2019
Clarica MVP Global Equity Fund
Financial Highlights The following tables show selected key financial information about the Fund and are intended to help you understand the Fund’s financial performance for the past six periods.
The Fund’s Net Asset Value per UnitNet assets attributable to contractholders per unit at the end of the period shown ($) (1)
Ratios and Supplemental DataNet assets ($000’s) (1)
Number of units outstanding (1)
Portfolio turnover rate (%) (2)
Management Expense RatioManagement expense ratio before taxes (%) (3)
Harmonized sales tax (%) (3)
Management expense ratio after taxes (%) (3)
Effective HST rate for the period (%) (3)
The Fund’s Net Asset Value per UnitNet assets attributable to contractholders per unit at the end of the period shown ($) (1)
Ratios and Supplemental DataNet assets ($000’s) (1)
Number of units outstanding (1)
Portfolio turnover rate (%) (2)
Management Expense RatioManagement expense ratio before taxes (%) (3)
Harmonized sales tax (%) (3)
Management expense ratio after taxes (%) (3)
Effective HST rate for the period (%) (3)
For inception date of the Fund, please refer to Note 1 in the Notes to the Financial Statements.The accompanying notes are an integral part of these financial statements.
Financial Information (for the period ended June 30, 2019 and the years ended December 31) (unaudited)
(1) This information is provided for the period ended June 30, 2019 and December 31 of the years shown.
(2) The Fund’s portfolio turnover rate indicates how actively the Fund’s portfolio advisor manages its portfolio investments. A portfolio turnover rate of 100% is equivalent to the Fund buying and selling all of the securities in its portfolio once in the
course of the period. The higher a fund’s portfolio turnover rate in a period, the greater the trading costs payable by the fund in the period, and the greater the chance of a contractholder receiving taxable capital gains in the period. There is not
necessarily a relationship between a high turnover rate and the performance of a fund.
(3) Management expense ratio is calculated based on expenses charged directly to the Fund plus, if applicable, expenses of the underlying fund, calculated on a weighted average basis on the percentage weighting of the underlying fund and is
expressed as an annualized percentage of average net assets for the periods shown. The Effective HST tax rate is calculated using the attribution percentage for each province based on contractholders’ residency and can be different from 13%.
Class A Jun. 30, 2019 Dec. 31, 2018 Dec. 31, 2017 Dec. 31, 2016 Dec. 31, 2015 Dec. 31, 2014
21.16 19.00 20.67 18.12 17.68 15.96
1,255 1,226 1,446 1,453 1,534 1,508 59,314 64,561 69,952 80,166 86,800 94,480 3.80 8.34 5.39 113.79 9.65 3.75
2.71 2.71 2.71 2.71 2.71 2.71 0.31 0.31 0.32 0.32 0.32 0.29 3.02 3.02 3.03 3.03 3.03 3.00 11.54 11.59 11.93 11.72 11.63 11.91
Class A - 1987 Jun. 30, 2019 Dec. 31, 2018 Dec. 31, 2017 Dec. 31, 2016 Dec. 31, 2015 Dec. 31, 2014
21.82 19.56 21.20 18.51 18.01 16.21
57 77 85 74 78 69 2,622 3,922 4,033 4,003 4,331 4,292 3.80 8.34 5.39 113.79 9.65 3.75
2.46 2.46 2.46 2.46 2.46 2.46 0.19 0.19 0.19 0.20 0.20 0.25 2.65 2.65 2.65 2.66 2.66 2.71 7.84 7.76 7.79 8.29 8.12 7.89
– 24 –Semi-Annual Financial Statements - June 30, 2019
Clarica MVP Global Equity Fund
The accompanying notes are an integral part of these financial statements.
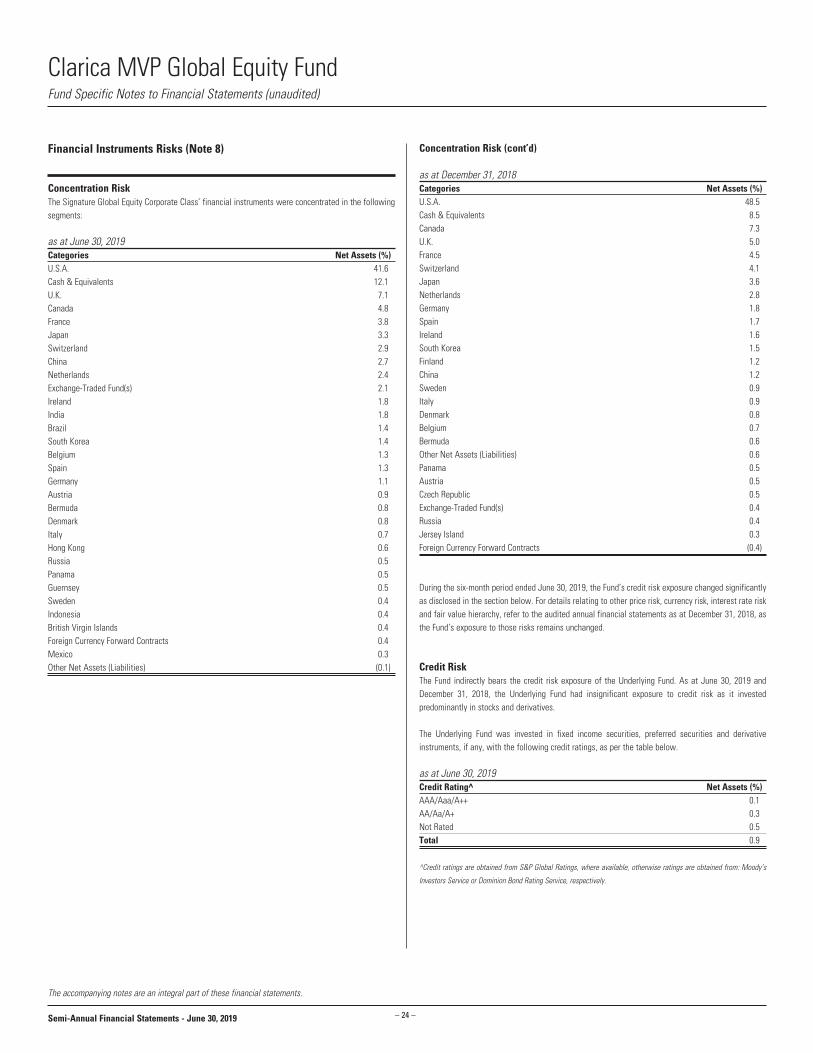
Concentration Risk (cont’d)
as at December 31, 2018Categories Net Assets (%)U.S.A. 48.5Cash & Equivalents 8.5Canada 7.3U.K. 5.0France 4.5Switzerland 4.1Japan 3.6Netherlands 2.8Germany 1.8Spain 1.7Ireland 1.6South Korea 1.5Finland 1.2China 1.2Sweden 0.9Italy 0.9Denmark 0.8Belgium 0.7Bermuda 0.6Other Net Assets (Liabilities) 0.6Panama 0.5Austria 0.5Czech Republic 0.5Exchange-Traded Fund(s) 0.4Russia 0.4Jersey Island 0.3Foreign Currency Forward Contracts (0.4)
During the six-month period ended June 30, 2019, the Fund’s credit risk exposure changed significantly as disclosed in the section below. For details relating to other price risk, currency risk, interest rate risk and fair value hierarchy, refer to the audited annual financial statements as at December 31, 2018, as the Fund’s exposure to those risks remains unchanged.
Credit RiskThe Fund indirectly bears the credit risk exposure of the Underlying Fund. As at June 30, 2019 and December 31, 2018, the Underlying Fund had insignificant exposure to credit risk as it invested predominantly in stocks and derivatives.
The Underlying Fund was invested in fixed income securities, preferred securities and derivative instruments, if any, with the following credit ratings, as per the table below.
as at June 30, 2019Credit Rating^ Net Assets (%)AAA/Aaa/A++ 0.1AA/Aa/A+ 0.3Not Rated 0.5 Total 0.9
^Credit ratings are obtained from S&P Global Ratings, where available, otherwise ratings are obtained from: Moody’s
Investors Service or Dominion Bond Rating Service, respectively.
Concentration RiskThe Signature Global Equity Corporate Class’ financial instruments were concentrated in the following segments:
as at June 30, 2019Categories Net Assets (%)U.S.A. 41.6Cash & Equivalents 12.1U.K. 7.1Canada 4.8France 3.8Japan 3.3Switzerland 2.9China 2.7Netherlands 2.4Exchange-Traded Fund(s) 2.1Ireland 1.8India 1.8Brazil 1.4South Korea 1.4Belgium 1.3Spain 1.3Germany 1.1Austria 0.9Bermuda 0.8Denmark 0.8Italy 0.7Hong Kong 0.6Russia 0.5Panama 0.5Guernsey 0.5Sweden 0.4Indonesia 0.4British Virgin Islands 0.4Foreign Currency Forward Contracts 0.4Mexico 0.3Other Net Assets (Liabilities) (0.1)
Fund Specific Notes to Financial Statements (unaudited)
Financial Instruments Risks (Note 8)

– 25 –Semi-Annual Financial Statements - June 30, 2019
Clarica MVP Growth Fund
For inception date of the Fund, please refer to Note 1 in the Notes to the Financial Statements.The accompanying notes are an integral part of these financial statements.
Financial Statements (unaudited)
CIG - 9256
2019 2018
- - 254 255 792 1,525 (109) 23
2,754 558
1 1 - - 3,692 2,362
366 430 46 54 81 95 55 65 548 644
3,144 1,718
8.39 4.11 9.03 4.51
365,156 406,095 8,746 10,448
as at as atJun. 30, 2019 Dec. 31, 2018
35,815 35,356 73 143 - - - - - - 12 7 - - 35,900 35,506
- - - - 10 5 - - - - - - 10 5 35,890 35,501
37,295 39,590
99.76 91.63 102.61 94.10
Statements of Financial Position (in $000’s except for per unit amounts)
Statements of Comprehensive Income for the periods ended June 30 (in $000’s except for per unit amounts and number of units)
Assets Current assets Investments* Cash Fees rebate receivable Dividends receivable Interest receivable Receivable for investments sold Receivable for unit subscriptions
Liabilities Current liabilities Bank overdraft Payable for investments purchased Payable for unit redemptions Management fees payable Administration fees payable Insurance fees payable
Net assets attributable to contractholders
*Investments at cost
Net assets attributable to contractholders per unit: Class AClass A - 1987
Income Net gain (loss) on investments Dividends Income distributions from investments Capital gain distributions from investments Net realized gain (loss) on sale of investments Change in unrealized appreciation (depreciation) in value of
investments Other income Interest Fees rebate (Note 6)
Expenses (Note 6)Management fees Administration fees Insurance fees Harmonized sales tax
Increase (decrease) in net assets from operations attributable to contractholders
Increase (decrease) in net assets from operations attributable to contractholders per unit: Class AClass A - 1987
Weighted average number of units: Class AClass A - 1987
– 26 –Semi-Annual Financial Statements - June 30, 2019
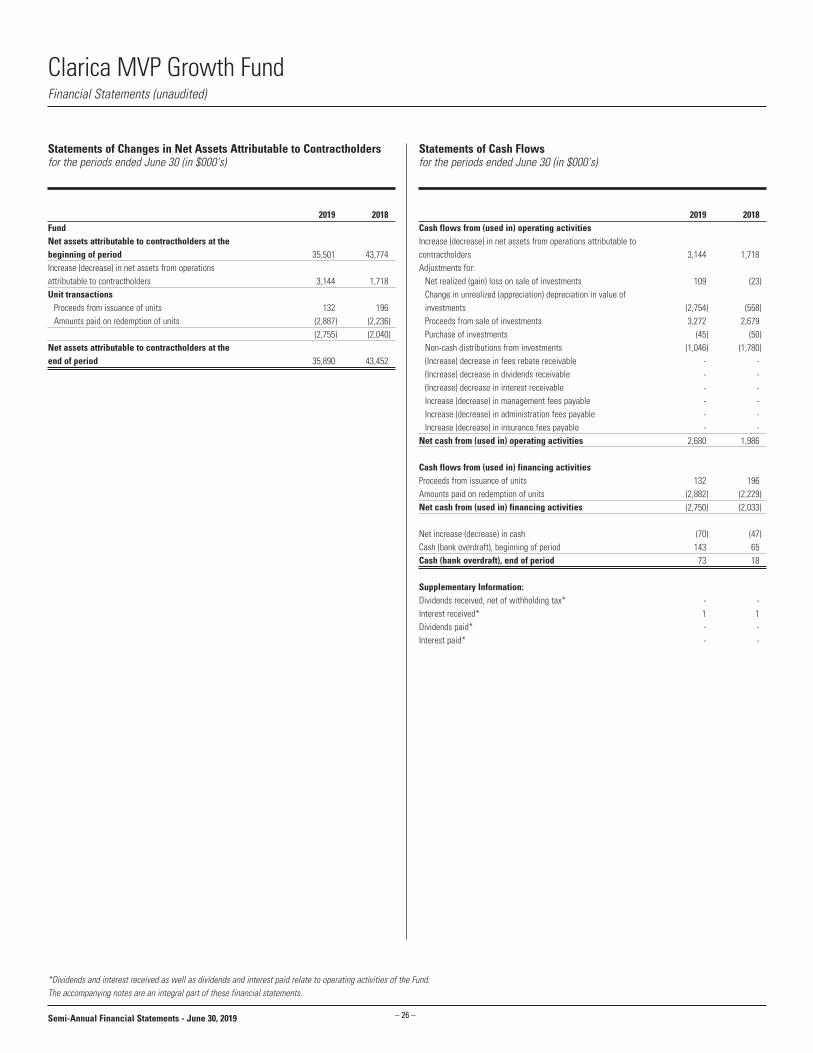
Clarica MVP Growth FundFinancial Statements (unaudited)
2019 2018
35,501 43,774
3,144 1,718
132 196 (2,887) (2,236) (2,755) (2,040)
35,890 43,452
FundNet assets attributable to contractholders at the beginning of period Increase (decrease) in net assets from operations attributable to contractholders Unit transactions Proceeds from issuance of units Amounts paid on redemption of units
Net assets attributable to contractholders at the end of period
Statements of Changes in Net Assets Attributable to Contractholdersfor the periods ended June 30 (in $000’s)
2019 2018
3,144 1,718
109 (23)
(2,754) (558) 3,272 2,679 (45) (50) (1,046) (1,780) - - - - - - - - - - - - 2,680 1,986
132 196 (2,882) (2,229) (2,750) (2,033)
(70) (47) 143 65 73 18
- - 1 1 - - - -
Statements of Cash Flowsfor the periods ended June 30 (in $000’s)
Cash flows from (used in) operating activities Increase (decrease) in net assets from operations attributable to contractholders Adjustments for: Net realized (gain) loss on sale of investments Change in unrealized (appreciation) depreciation in value of
investments Proceeds from sale of investments Purchase of investments Non-cash distributions from investments (Increase) decrease in fees rebate receivable (Increase) decrease in dividends receivable (Increase) decrease in interest receivable Increase (decrease) in management fees payable Increase (decrease) in administration fees payable Increase (decrease) in insurance fees payable Net cash from (used in) operating activities
Cash flows from (used in) financing activities Proceeds from issuance of unitsAmounts paid on redemption of unitsNet cash from (used in) financing activities
Net increase (decrease) in cashCash (bank overdraft), beginning of periodCash (bank overdraft), end of period
Supplementary Information: Dividends received, net of withholding tax*Interest received*Dividends paid*Interest paid*
*Dividends and interest received as well as dividends and interest paid relate to operating activities of the Fund. The accompanying notes are an integral part of these financial statements.

– 27 –Semi-Annual Financial Statements - June 30, 2019
Clarica MVP Growth Fund
Schedule of Investment Portfolioas at June 30, 2019 (unaudited)
No. ofUnits/Shares Description
AverageCost ($)
FairValue ($)
998,631 CI American Small Companies Corporate Class (I Shares)† 37,294,743 35,815,009 Total Investments (99.8%) 37,294,743 35,815,009 Other Net Assets (Liabilities) (0.2%) 75,305 Net Assets Attributable to Contractholders (100.0%) 35,890,314
Top 25 Holdings of the Underlying Fundas at June 30, 2019 (unaudited)
No. ofUnits/Shares Description
AverageCost ($)
FairValue ($)
Cash & Equivalents 17,621,587 96,217 LGI Homes Inc. 7,760,016 9,000,616 68,597 CarMax Inc. 6,289,786 7,800,361 96,821 XPO Logistics Inc. 8,268,238 7,330,141 36,970 Charles River Laboratories International Inc. 6,092,630 6,870,235 38,412 Middleby Corp. 6,124,635 6,826,318 10,685 Credit Acceptance Corp. 5,061,520 6,770,287 171,525 Bank OZK 9,307,071 6,759,108 63,155 Hexcel Corp. 2,595,541 6,689,423 93,277 Centene Corp. 5,326,351 6,405,854 178,155 Axos Financial Inc. 8,503,690 6,357,762 31,666 Molina Healthcare Inc. 5,575,467 5,936,001 60,750 LogMeIn Inc. 6,713,439 5,861,863 69,673 Encompass Health Corp. 5,082,955 5,781,219 152,955 Discovery Inc. 5,496,941 5,698,830 30,724 Jones Lang LaSalle Inc. 5,706,249 5,660,838 69,040 Texas Capital Bancshares Inc. 5,261,312 5,548,769 46,165 AMETEK Inc. 3,051,899 5,491,990 107,972 Liberty Media Corp. - Liberty SiriusXM 5,482,168 5,346,353 87,075 Western Alliance Bancorp. 5,370,916 5,099,587 23,766 Watsco Inc. 4,985,181 5,089,713 55,612 Toro Co. 4,505,845 4,872,304 68,522 Eagle Bancorp Inc. 5,124,012 4,857,444 44,741 Ryman Hospitality Properties Inc. 4,938,772 4,751,303 31,485 Woodward Inc. 1,868,963 4,665,911
Financial statements for the underlying CI mutual fund, including information on the holdings of the underlying fund, are available in electronic format on the fund manager’s website at www.ci.com.
† The Underlying Fund is also managed by CI Investments Inc., the Manager of the Fund.Percentages shown in brackets in the Schedule of Investment Portfolio relate investments at fair value to net assets attributable to contractholders of the Fund. The accompanying notes are an integral part of these financial statements.

– 28 –Semi-Annual Financial Statements - June 30, 2019
Clarica MVP Growth FundFund Specific Notes to Financial Statements (unaudited)
Interest in Underlying Fund (Note 2)
The following tables present the Fund’s interest in the Underlying Fund.
as at June 30, 2019 Fair Value of
the Underlying FundFair Value of the Fund’s Investment
in the Underlying FundOwnership
in the Underlying Fund
Underlying Fund (in $000’s) (in $000’s) (%)CI American Small Companies Corporate Class 280,294 35,815 12.8
as at December 31, 2018Fair Value of
the Underlying FundFair Value of the Fund’s Investment
in the Underlying FundOwnership
in the Underlying Fund
Underlying Fund (in $000’s) (in $000’s) (%)CI American Small Companies Corporate Class 316,253 35,356 11.2
Unit Transactions (Note 5)for the periods ended June 30
Number of units at the beginning of periodUnits issued for cashUnits redeemed Number of units at the end of period
Class A Class A - 1987 2019 2018 2019 2018 377,718 417,444 9,468 10,765 1,322 1,898 12 14 (27,165) (21,215) (1,823) (530) 351,875 398,127 7,657 10,249
For inception date of the Fund, please refer to Note 1 in the Notes to the Financial Statements.The accompanying notes are an integral part of these financial statements.

– 29 –Semi-Annual Financial Statements - June 30, 2019
Clarica MVP Growth Fund
Financial Highlights The following tables show selected key financial information about the Fund and are intended to help you understand the Fund’s financial performance for the past six periods.
The Fund’s Net Asset Value per UnitNet assets attributable to contractholders per unit at the end of the period shown ($) (1)
Ratios and Supplemental DataNet assets ($000’s) (1)
Number of units outstanding (1)
Portfolio turnover rate (%) (2)
Management Expense RatioManagement expense ratio before taxes (%) (3)
Harmonized sales tax (%) (3)
Management expense ratio after taxes (%) (3)
Effective HST rate for the period (%) (3)
The Fund’s Net Asset Value per UnitNet assets attributable to contractholders per unit at the end of the period shown ($) (1)
Ratios and Supplemental DataNet assets ($000’s) (1)
Number of units outstanding (1)
Portfolio turnover rate (%) (2)
Management Expense RatioManagement expense ratio before taxes (%) (3)
Harmonized sales tax (%) (3)
Management expense ratio after taxes (%) (3)
Effective HST rate for the period (%) (3)
For inception date of the Fund, please refer to Note 1 in the Notes to the Financial Statements.The accompanying notes are an integral part of these financial statements.
Financial Information (for the period ended June 30, 2019 and the years ended December 31) (unaudited)
(1) This information is provided for the period ended June 30, 2019 and December 31 of the years shown.
(2) The Fund’s portfolio turnover rate indicates how actively the Fund’s portfolio advisor manages its portfolio investments. A portfolio turnover rate of 100% is equivalent to the Fund buying and selling all of the securities in its portfolio once in the
course of the period. The higher a fund’s portfolio turnover rate in a period, the greater the trading costs payable by the fund in the period, and the greater the chance of a contractholder receiving taxable capital gains in the period. There is not
necessarily a relationship between a high turnover rate and the performance of a fund.
(3) Management expense ratio is calculated based on expenses charged directly to the Fund plus, if applicable, expenses of the underlying fund, calculated on a weighted average basis on the percentage weighting of the underlying fund and is
expressed as an annualized percentage of average net assets for the periods shown. The Effective HST tax rate is calculated using the attribution percentage for each province based on contractholders’ residency and can be different from 13%.
Class A Jun. 30, 2019 Dec. 31, 2018 Dec. 31, 2017 Dec. 31, 2016 Dec. 31, 2015 Dec. 31, 2014
99.76 91.63 102.17 97.48 88.87 78.76
35,104 34,610 42,648 44,338 45,692 45,074 351,875 377,718 417,444 454,837 514,172 572,286 2.94 5.61 5.52 111.38 5.42 1.14
2.70 2.70 2.70 2.70 2.70 2.70 0.30 0.31 0.30 0.30 0.30 0.29 3.00 3.01 3.00 3.00 3.00 2.99 11.27 11.30 11.29 11.13 11.08 11.18
Class A - 1987 Jun. 30, 2019 Dec. 31, 2018 Dec. 31, 2017 Dec. 31, 2016 Dec. 31, 2015 Dec. 31, 2014
102.61 94.10 104.60 99.49 90.45 79.94
786 891 1,126 1,173 1,194 1,282 7,657 9,468 10,765 11,792 13,200 16,032 2.94 5.61 5.52 111.38 5.42 1.14
2.45 2.45 2.45 2.45 2.45 2.45 0.24 0.24 0.24 0.22 0.22 0.25 2.69 2.69 2.69 2.67 2.67 2.70 9.91 9.96 9.67 9.18 9.05 8.69
– 30 –Semi-Annual Financial Statements - June 30, 2019
Clarica MVP Growth Fund
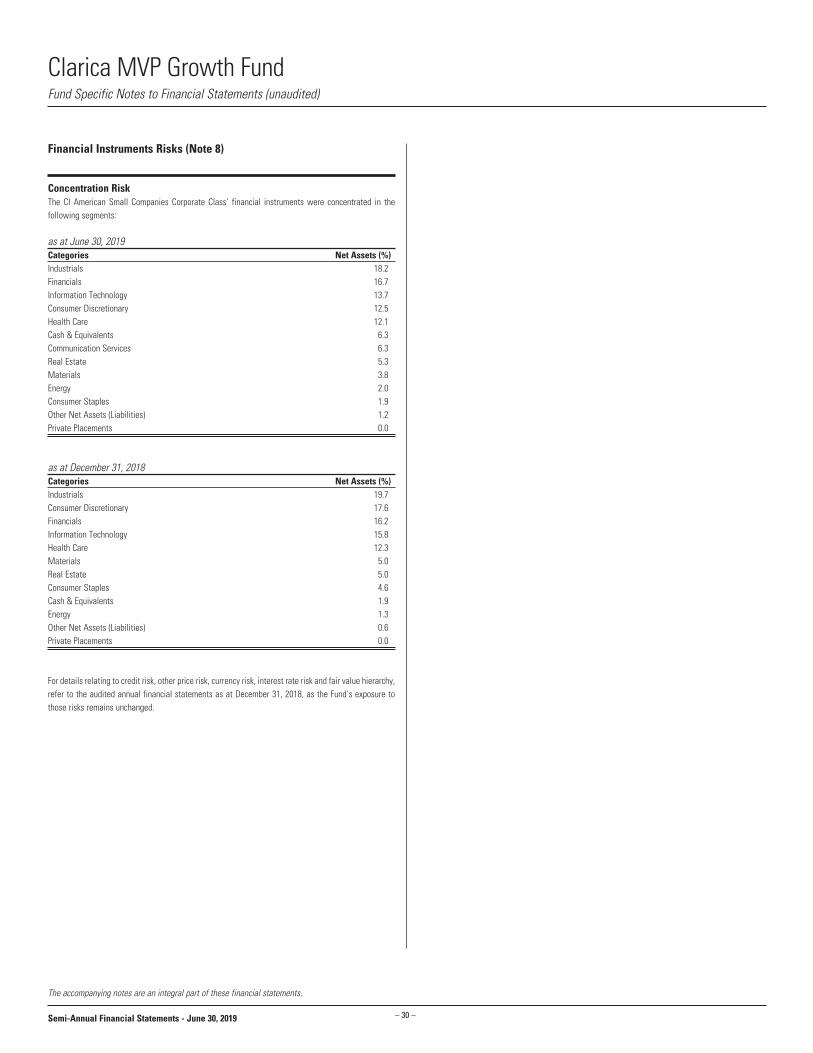
The accompanying notes are an integral part of these financial statements.
Concentration RiskThe CI American Small Companies Corporate Class’ financial instruments were concentrated in the following segments:
as at June 30, 2019Categories Net Assets (%)Industrials 18.2Financials 16.7Information Technology 13.7Consumer Discretionary 12.5Health Care 12.1Cash & Equivalents 6.3Communication Services 6.3Real Estate 5.3Materials 3.8Energy 2.0Consumer Staples 1.9Other Net Assets (Liabilities) 1.2Private Placements 0.0
as at December 31, 2018Categories Net Assets (%)Industrials 19.7Consumer Discretionary 17.6Financials 16.2Information Technology 15.8Health Care 12.3Materials 5.0Real Estate 5.0Consumer Staples 4.6Cash & Equivalents 1.9Energy 1.3Other Net Assets (Liabilities) 0.6Private Placements 0.0
For details relating to credit risk, other price risk, currency risk, interest rate risk and fair value hierarchy, refer to the audited annual financial statements as at December 31, 2018, as the Fund’s exposure to those risks remains unchanged.
Fund Specific Notes to Financial Statements (unaudited)
Financial Instruments Risks (Note 8)

– 31 –Semi-Annual Financial Statements - June 30, 2019
Clarica MVP International Fund
For inception date of the Fund, please refer to Note 1 in the Notes to the Financial Statements.The accompanying notes are an integral part of these financial statements.
Financial Statements (unaudited)
CIG - 9258
2019 2018
- - 4 4 11 23 (1) 1
22 (7)
- - - - 36 21
5 8 1 1 1 2 1 1 8 12
28 9
0.71 0.18 0.75 0.21
36,772 44,461 2,982 3,051
as at as atJun. 30, 2019 Dec. 31, 2018
515 535 - 1 - - - - - - 4 - - - 519 536
- - - - 1 - - - - - - - 1 - 518 536
518 560
13.45 12.76 13.90 13.15
Statements of Financial Position (in $000’s except for per unit amounts)
Statements of Comprehensive Income for the periods ended June 30 (in $000’s except for per unit amounts and number of units)
Assets Current assets Investments* Cash Fees rebate receivable Dividends receivable Interest receivable Receivable for investments sold Receivable for unit subscriptions
Liabilities Current liabilities Bank overdraft Payable for investments purchased Payable for unit redemptions Management fees payable Administration fees payable Insurance fees payable
Net assets attributable to contractholders
*Investments at cost
Net assets attributable to contractholders per unit: Class AClass A - 1987
Income Net gain (loss) on investments Dividends Income distributions from investments Capital gain distributions from investments Net realized gain (loss) on sale of investments Change in unrealized appreciation (depreciation) in value of
investments Other income Interest Fees rebate (Note 6)
Expenses (Note 6)Management fees Administration fees Insurance fees Harmonized sales tax
Increase (decrease) in net assets from operations attributable to contractholders
Increase (decrease) in net assets from operations attributable to contractholders per unit: Class AClass A - 1987
Weighted average number of units: Class AClass A - 1987
– 32 –Semi-Annual Financial Statements - June 30, 2019
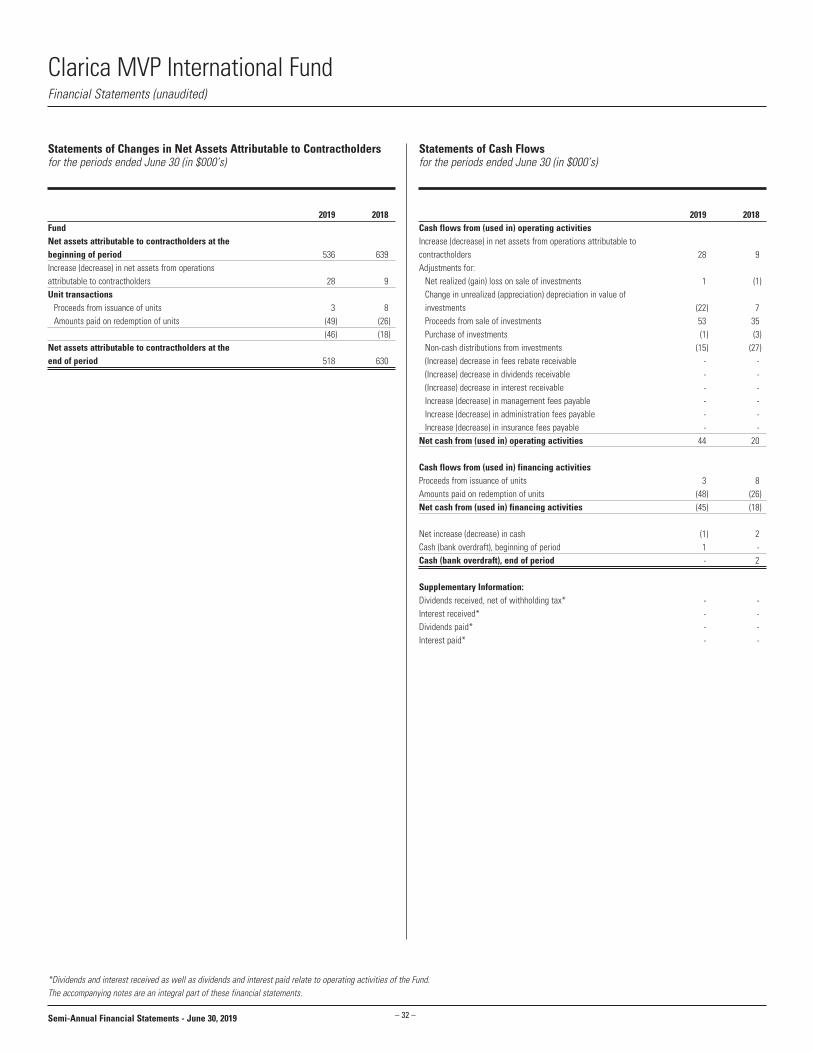
Clarica MVP International FundFinancial Statements (unaudited)
2019 2018
536 639
28 9
3 8 (49) (26) (46) (18)
518 630
FundNet assets attributable to contractholders at the beginning of period Increase (decrease) in net assets from operations attributable to contractholders Unit transactions Proceeds from issuance of units Amounts paid on redemption of units
Net assets attributable to contractholders at the end of period
Statements of Changes in Net Assets Attributable to Contractholdersfor the periods ended June 30 (in $000’s)
2019 2018
28 9
1 (1)
(22) 7 53 35 (1) (3) (15) (27) - - - - - - - - - - - - 44 20
3 8 (48) (26) (45) (18)
(1) 2 1 - - 2
- - - - - - - -
Statements of Cash Flowsfor the periods ended June 30 (in $000’s)
Cash flows from (used in) operating activities Increase (decrease) in net assets from operations attributable to contractholders Adjustments for: Net realized (gain) loss on sale of investments Change in unrealized (appreciation) depreciation in value of
investments Proceeds from sale of investments Purchase of investments Non-cash distributions from investments (Increase) decrease in fees rebate receivable (Increase) decrease in dividends receivable (Increase) decrease in interest receivable Increase (decrease) in management fees payable Increase (decrease) in administration fees payable Increase (decrease) in insurance fees payable Net cash from (used in) operating activities
Cash flows from (used in) financing activities Proceeds from issuance of unitsAmounts paid on redemption of unitsNet cash from (used in) financing activities
Net increase (decrease) in cashCash (bank overdraft), beginning of periodCash (bank overdraft), end of period
Supplementary Information: Dividends received, net of withholding tax*Interest received*Dividends paid*Interest paid*
*Dividends and interest received as well as dividends and interest paid relate to operating activities of the Fund. The accompanying notes are an integral part of these financial statements.
– 33 –Semi-Annual Financial Statements - June 30, 2019
Clarica MVP International Fund
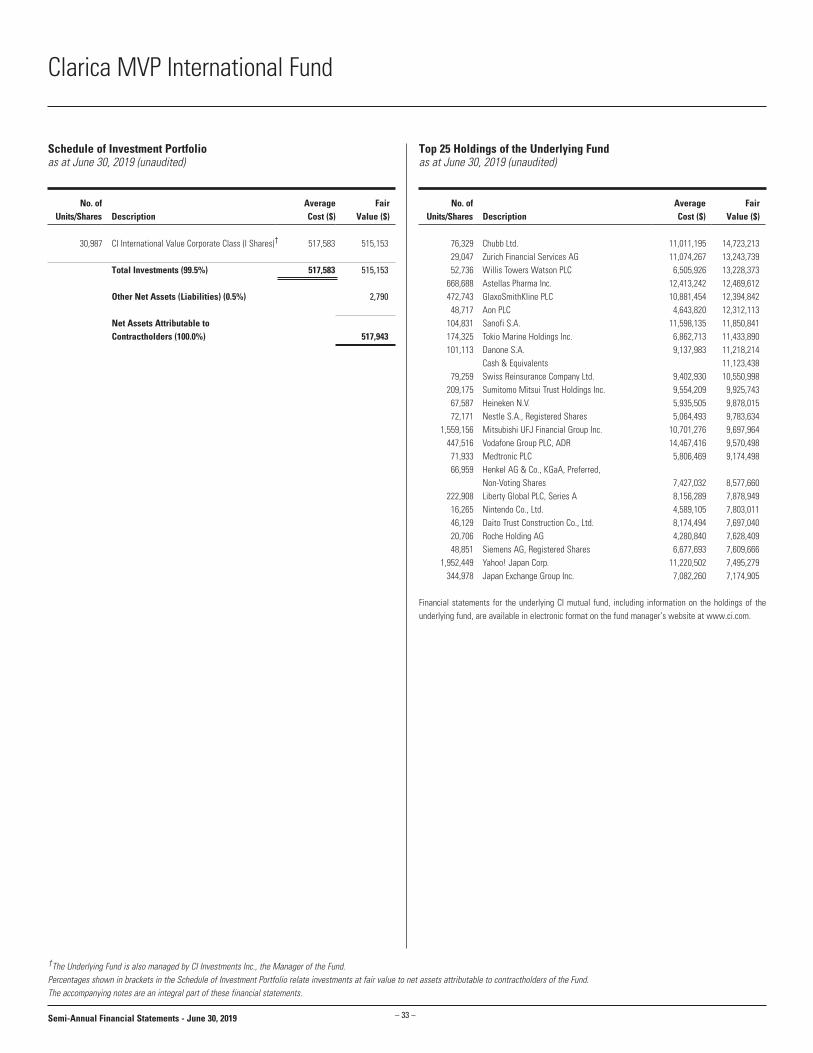
Schedule of Investment Portfolioas at June 30, 2019 (unaudited)
No. ofUnits/Shares Description
AverageCost ($)
FairValue ($)
30,987 CI International Value Corporate Class (I Shares)† 517,583 515,153
Total Investments (99.5%) 517,583 515,153 Other Net Assets (Liabilities) (0.5%) 2,790 Net Assets Attributable to Contractholders (100.0%) 517,943
Top 25 Holdings of the Underlying Fundas at June 30, 2019 (unaudited)
No. ofUnits/Shares Description
AverageCost ($)
FairValue ($)
76,329 Chubb Ltd. 11,011,195 14,723,213 29,047 Zurich Financial Services AG 11,074,267 13,243,739 52,736 Willis Towers Watson PLC 6,505,926 13,228,373 668,688 Astellas Pharma Inc. 12,413,242 12,469,612 472,743 GlaxoSmithKline PLC 10,881,454 12,394,842 48,717 Aon PLC 4,643,820 12,312,113 104,831 Sanofi S.A. 11,598,135 11,850,841 174,325 Tokio Marine Holdings Inc. 6,862,713 11,433,890 101,113 Danone S.A. 9,137,983 11,218,214 Cash & Equivalents 11,123,438 79,259 Swiss Reinsurance Company Ltd. 9,402,930 10,550,998 209,175 Sumitomo Mitsui Trust Holdings Inc. 9,554,209 9,925,743 67,587 Heineken N.V. 5,935,505 9,878,015 72,171 Nestle S.A., Registered Shares 5,064,493 9,783,634 1,559,156 Mitsubishi UFJ Financial Group Inc. 10,701,276 9,697,964 447,516 Vodafone Group PLC, ADR 14,467,416 9,570,498 71,933 Medtronic PLC 5,806,469 9,174,498 66,959 Henkel AG & Co., KGaA, Preferred, Non-Voting Shares 7,427,032 8,577,660 222,908 Liberty Global PLC, Series A 8,156,289 7,878,949 16,265 Nintendo Co., Ltd. 4,589,105 7,803,011 46,129 Daito Trust Construction Co., Ltd. 8,174,494 7,697,040 20,706 Roche Holding AG 4,280,840 7,628,409 48,851 Siemens AG, Registered Shares 6,677,693 7,609,666 1,952,449 Yahoo! Japan Corp. 11,220,502 7,495,279 344,978 Japan Exchange Group Inc. 7,082,260 7,174,905
Financial statements for the underlying CI mutual fund, including information on the holdings of the underlying fund, are available in electronic format on the fund manager’s website at www.ci.com.
† The Underlying Fund is also managed by CI Investments Inc., the Manager of the Fund.Percentages shown in brackets in the Schedule of Investment Portfolio relate investments at fair value to net assets attributable to contractholders of the Fund. The accompanying notes are an integral part of these financial statements.
– 34 –Semi-Annual Financial Statements - June 30, 2019
Clarica MVP International FundFund Specific Notes to Financial Statements (unaudited)
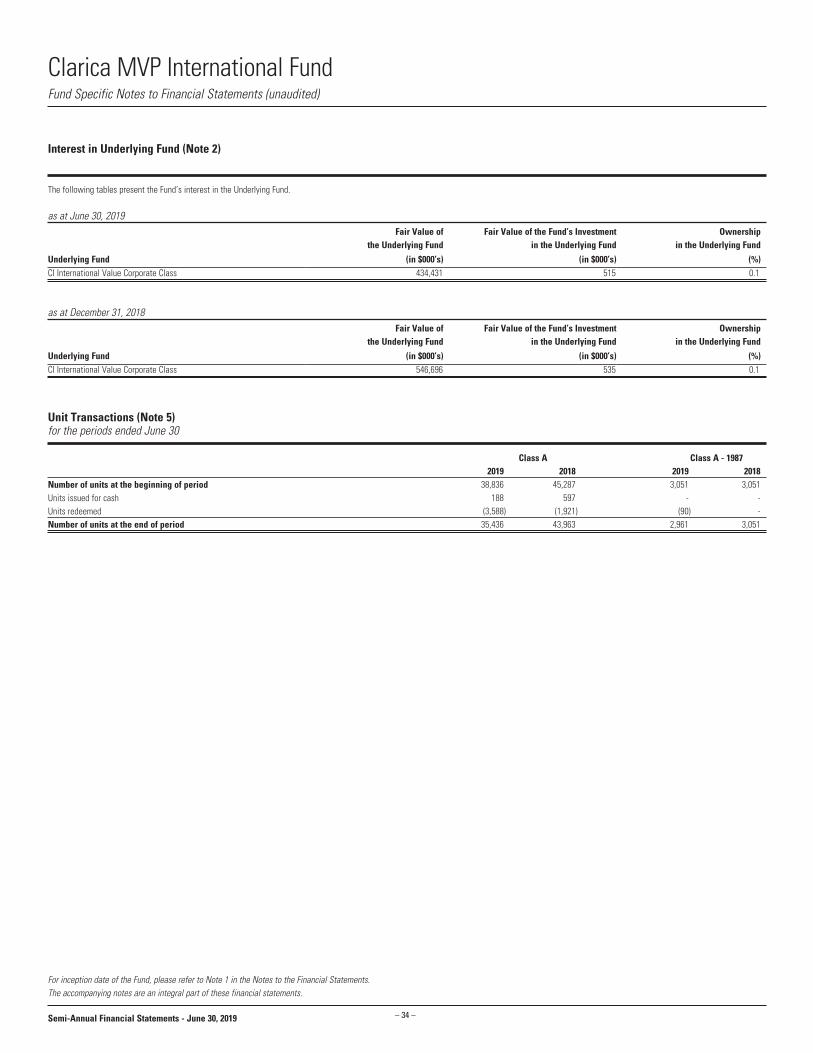
Interest in Underlying Fund (Note 2)
The following tables present the Fund’s interest in the Underlying Fund.
as at June 30, 2019 Fair Value of
the Underlying FundFair Value of the Fund’s Investment
in the Underlying FundOwnership
in the Underlying Fund
Underlying Fund (in $000’s) (in $000’s) (%)CI International Value Corporate Class 434,431 515 0.1
as at December 31, 2018Fair Value of
the Underlying FundFair Value of the Fund’s Investment
in the Underlying FundOwnership
in the Underlying Fund
Underlying Fund (in $000’s) (in $000’s) (%)CI International Value Corporate Class 546,696 535 0.1
Unit Transactions (Note 5)for the periods ended June 30
Number of units at the beginning of periodUnits issued for cashUnits redeemed Number of units at the end of period
Class A Class A - 1987 2019 2018 2019 2018 38,836 45,287 3,051 3,051 188 597 - - (3,588) (1,921) (90) - 35,436 43,963 2,961 3,051
For inception date of the Fund, please refer to Note 1 in the Notes to the Financial Statements.The accompanying notes are an integral part of these financial statements.

– 35 –Semi-Annual Financial Statements - June 30, 2019
Clarica MVP International Fund
Financial Highlights The following tables show selected key financial information about the Fund and are intended to help you understand the Fund’s financial performance for the past six periods.
The Fund’s Net Asset Value per UnitNet assets attributable to contractholders per unit at the end of the period shown ($) (1)
Ratios and Supplemental DataNet assets ($000’s) (1)
Number of units outstanding (1)
Portfolio turnover rate (%) (2)
Management Expense RatioManagement expense ratio before taxes (%) (3)
Harmonized sales tax (%) (3)
Management expense ratio after taxes (%) (3)
Effective HST rate for the period (%) (3)
The Fund’s Net Asset Value per UnitNet assets attributable to contractholders per unit at the end of the period shown ($) (1)
Ratios and Supplemental DataNet assets ($000’s) (1)
Number of units outstanding (1)
Portfolio turnover rate (%) (2)
Management Expense RatioManagement expense ratio before taxes (%) (3)
Harmonized sales tax (%) (3)
Management expense ratio after taxes (%) (3)
Effective HST rate for the period (%) (3)
For inception date of the Fund, please refer to Note 1 in the Notes to the Financial Statements.The accompanying notes are an integral part of these financial statements.
Financial Information (for the period ended June 30, 2019 and the years ended December 31) (unaudited)
(1) This information is provided for the period ended June 30, 2019 and December 31 of the years shown.
(2) The Fund’s portfolio turnover rate indicates how actively the Fund’s portfolio advisor manages its portfolio investments. A portfolio turnover rate of 100% is equivalent to the Fund buying and selling all of the securities in its portfolio once in the
course of the period. The higher a fund’s portfolio turnover rate in a period, the greater the trading costs payable by the fund in the period, and the greater the chance of a contractholder receiving taxable capital gains in the period. There is not
necessarily a relationship between a high turnover rate and the performance of a fund.
(3) Management expense ratio is calculated based on expenses charged directly to the Fund plus, if applicable, expenses of the underlying fund, calculated on a weighted average basis on the percentage weighting of the underlying fund and is
expressed as an annualized percentage of average net assets for the periods shown. The Effective HST tax rate is calculated using the attribution percentage for each province based on contractholders’ residency and can be different from 13%.
Class A Jun. 30, 2019 Dec. 31, 2018 Dec. 31, 2017 Dec. 31, 2016 Dec. 31, 2015 Dec. 31, 2014
13.45 12.76 13.19 11.75 12.44 11.35
477 496 598 584 680 692 35,436 38,836 45,287 49,707 54,652 60,952 3.06 6.11 106.32 103.59 6.16 2.03
3.21 3.21 3.21 3.21 3.21 3.22 0.36 0.36 0.37 0.37 0.38 0.35 3.57 3.57 3.58 3.58 3.59 3.57 11.22 11.32 11.47 11.59 11.73 11.63
Class A - 1987 Jun. 30, 2019 Dec. 31, 2018 Dec. 31, 2017 Dec. 31, 2016 Dec. 31, 2015 Dec. 31, 2014
13.90 13.15 13.54 12.01 12.68 11.53
41 40 41 36 37 33 2,961 3,051 3,051 2,972 2,900 2,907 3.06 6.11 106.32 103.59 6.16 2.03
2.96 2.96 2.96 2.96 2.96 2.97 0.18 0.18 0.19 0.19 0.20 0.28 3.14 3.14 3.15 3.15 3.16 3.25 6.17 6.20 6.21 6.52 6.78 7.11

– 36 –Semi-Annual Financial Statements - June 30, 2019
Clarica MVP International Fund
The accompanying notes are an integral part of these financial statements.
For details relating to credit risk, other price risk, currency risk, interest rate risk and fair value hierarchy, refer to the audited annual financial statements as at December 31, 2018, as the Fund’s exposure to those risks remains unchanged.
Concentration RiskThe CI International Value Corporate Class’ financial instruments were concentrated in the following segments:
as at June 30, 2019Categories Net Assets (%)Japan 19.5U.K. 16.0Switzerland 15.5Germany 8.0France 7.3Ireland 6.4Netherlands 5.8South Korea 3.6Cash & Equivalents 2.6Thailand 2.0Other Net Assets (Liabilities) 1.6U.S.A. 1.5Canada 1.5Curacao 1.3Mexico 1.3Israel 1.2Cayman Islands 1.2Sweden 1.0Brazil 1.0Luxembourg 0.9Turkey 0.8
as at December 31, 2018Categories Net Assets (%)Japan 21.7Switzerland 17.0U.K. 16.0France 8.3Ireland 6.1Netherlands 5.4Germany 4.5Cash & Equivalents 2.2Other Net Assets (Liabilities) 1.8Thailand 1.7Israel 1.7Cayman Islands 1.6Brazil 1.5Canada 1.4Sweden 1.4South Korea 1.4Mexico 1.1Curacao 1.1Luxembourg 0.9India 0.8Turkey 0.8Jersey Island 0.8U.S.A. 0.8
Fund Specific Notes to Financial Statements (unaudited)
Financial Instruments Risks (Note 8)
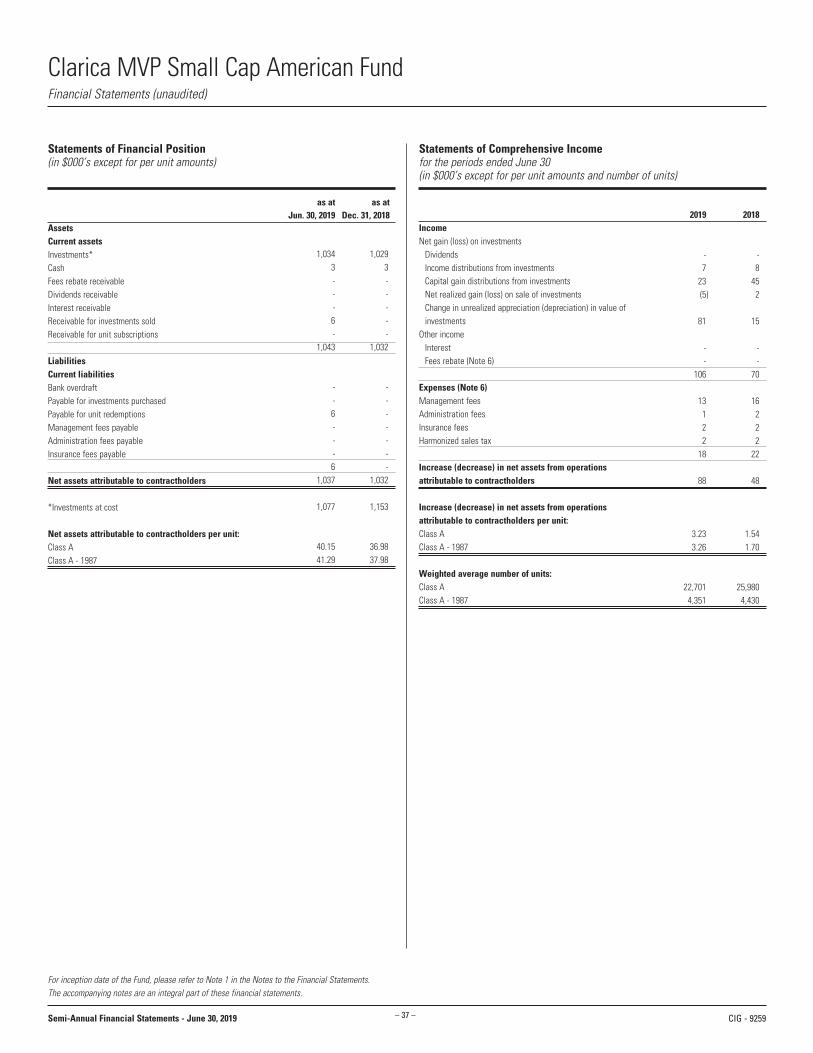
– 37 –Semi-Annual Financial Statements - June 30, 2019
Clarica MVP Small Cap American Fund
For inception date of the Fund, please refer to Note 1 in the Notes to the Financial Statements.The accompanying notes are an integral part of these financial statements.
Financial Statements (unaudited)
CIG - 9259
2019 2018
- - 7 8 23 45 (5) 2
81 15
- - - - 106 70
13 16 1 2 2 2 2 2 18 22
88 48
3.23 1.54 3.26 1.70
22,701 25,980 4,351 4,430
as at as atJun. 30, 2019 Dec. 31, 2018
1,034 1,029 3 3 - - - - - - 6 - - - 1,043 1,032
- - - - 6 - - - - - - - 6 - 1,037 1,032
1,077 1,153
40.15 36.98 41.29 37.98
Statements of Financial Position (in $000’s except for per unit amounts)
Statements of Comprehensive Income for the periods ended June 30 (in $000’s except for per unit amounts and number of units)
Assets Current assets Investments* Cash Fees rebate receivable Dividends receivable Interest receivable Receivable for investments sold Receivable for unit subscriptions
Liabilities Current liabilities Bank overdraft Payable for investments purchased Payable for unit redemptions Management fees payable Administration fees payable Insurance fees payable
Net assets attributable to contractholders
*Investments at cost
Net assets attributable to contractholders per unit: Class AClass A - 1987
Income Net gain (loss) on investments Dividends Income distributions from investments Capital gain distributions from investments Net realized gain (loss) on sale of investments Change in unrealized appreciation (depreciation) in value of
investments Other income Interest Fees rebate (Note 6)
Expenses (Note 6)Management fees Administration fees Insurance fees Harmonized sales tax
Increase (decrease) in net assets from operations attributable to contractholders
Increase (decrease) in net assets from operations attributable to contractholders per unit: Class AClass A - 1987
Weighted average number of units: Class AClass A - 1987
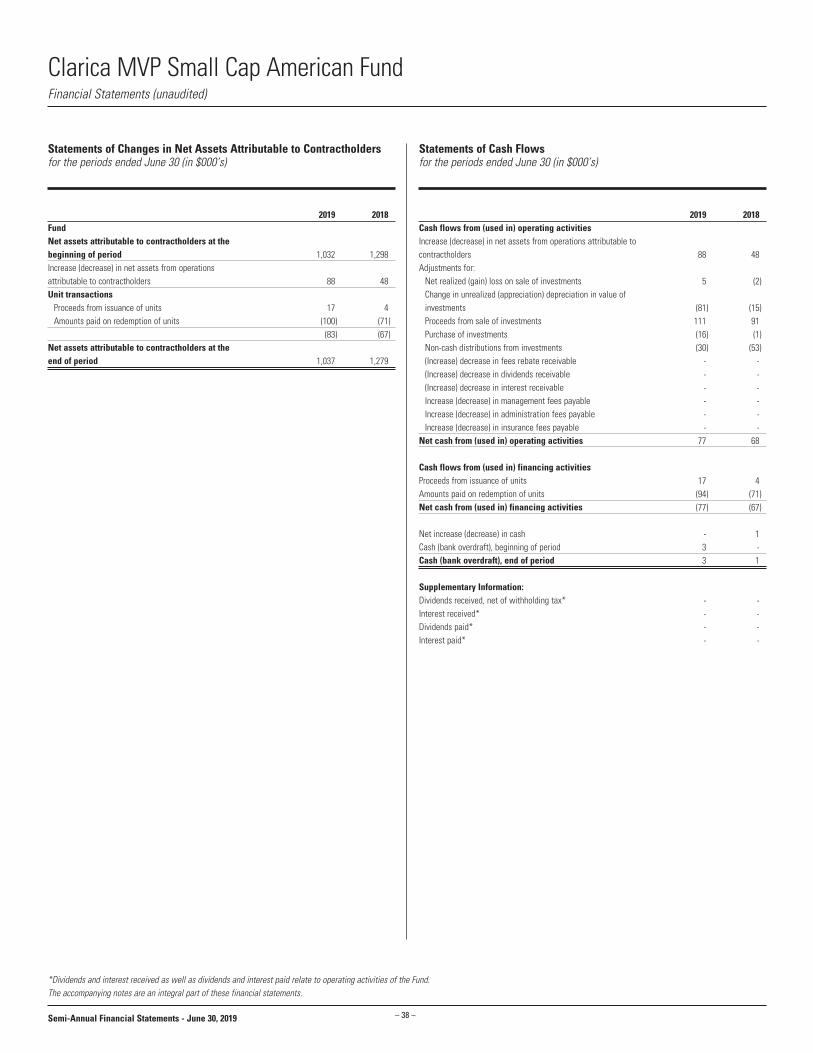
– 38 –Semi-Annual Financial Statements - June 30, 2019
Clarica MVP Small Cap American FundFinancial Statements (unaudited)
2019 2018
1,032 1,298
88 48
17 4 (100) (71) (83) (67)
1,037 1,279
FundNet assets attributable to contractholders at the beginning of period Increase (decrease) in net assets from operations attributable to contractholders Unit transactions Proceeds from issuance of units Amounts paid on redemption of units
Net assets attributable to contractholders at the end of period
Statements of Changes in Net Assets Attributable to Contractholdersfor the periods ended June 30 (in $000’s)
2019 2018
88 48
5 (2)
(81) (15) 111 91 (16) (1) (30) (53) - - - - - - - - - - - - 77 68
17 4 (94) (71) (77) (67)
- 1 3 - 3 1
- - - - - - - -
Statements of Cash Flowsfor the periods ended June 30 (in $000’s)
Cash flows from (used in) operating activities Increase (decrease) in net assets from operations attributable to contractholders Adjustments for: Net realized (gain) loss on sale of investments Change in unrealized (appreciation) depreciation in value of
investments Proceeds from sale of investments Purchase of investments Non-cash distributions from investments (Increase) decrease in fees rebate receivable (Increase) decrease in dividends receivable (Increase) decrease in interest receivable Increase (decrease) in management fees payable Increase (decrease) in administration fees payable Increase (decrease) in insurance fees payableNet cash from (used in) operating activities
Cash flows from (used in) financing activities Proceeds from issuance of unitsAmounts paid on redemption of unitsNet cash from (used in) financing activities
Net increase (decrease) in cashCash (bank overdraft), beginning of periodCash (bank overdraft), end of period
Supplementary Information: Dividends received, net of withholding tax*Interest received*Dividends paid*Interest paid*
*Dividends and interest received as well as dividends and interest paid relate to operating activities of the Fund. The accompanying notes are an integral part of these financial statements.

– 39 –Semi-Annual Financial Statements - June 30, 2019
Clarica MVP Small Cap American Fund
Schedule of Investment Portfolioas at June 30, 2019 (unaudited)
No. ofUnits/Shares Description
AverageCost ($)
FairValue ($)
28,837 CI American Small Companies Corporate Class (I Shares)† 1,077,031 1,034,211
Total Investments (99.7%) 1,077,031 1,034,211 Other Net Assets (Liabilities) (0.3%) 2,837 Net Assets Attributable to Contractholders (100.0%) 1,037,048
Top 25 Holdings of the Underlying Fundas at June 30, 2019 (unaudited)
No. ofUnits/Shares Description
AverageCost ($)
FairValue ($)
Cash & Equivalents 17,621,587 96,217 LGI Homes Inc. 7,760,016 9,000,616 68,597 CarMax Inc. 6,289,786 7,800,361 96,821 XPO Logistics Inc. 8,268,238 7,330,141 36,970 Charles River Laboratories International Inc. 6,092,630 6,870,235 38,412 Middleby Corp. 6,124,635 6,826,318 10,685 Credit Acceptance Corp. 5,061,520 6,770,287 171,525 Bank OZK 9,307,071 6,759,108 63,155 Hexcel Corp. 2,595,541 6,689,423 93,277 Centene Corp. 5,326,351 6,405,854 178,155 Axos Financial Inc. 8,503,690 6,357,762 31,666 Molina Healthcare Inc. 5,575,467 5,936,001 60,750 LogMeIn Inc. 6,713,439 5,861,863 69,673 Encompass Health Corp. 5,082,955 5,781,219 152,955 Discovery Inc. 5,496,941 5,698,830 30,724 Jones Lang LaSalle Inc. 5,706,249 5,660,838 69,040 Texas Capital Bancshares Inc. 5,261,312 5,548,769 46,165 AMETEK Inc. 3,051,899 5,491,990 107,972 Liberty Media Corp. - Liberty SiriusXM 5,482,168 5,346,353 87,075 Western Alliance Bancorp. 5,370,916 5,099,587 23,766 Watsco Inc. 4,985,181 5,089,713 55,612 Toro Co. 4,505,845 4,872,304 68,522 Eagle Bancorp Inc. 5,124,012 4,857,444 44,741 Ryman Hospitality Properties Inc. 4,938,772 4,751,303 31,485 Woodward Inc. 1,868,963 4,665,911
Financial statements for the underlying CI mutual fund, including information on the holdings of the underlying fund, are available in electronic format on the fund manager’s website at www.ci.com.
† The Underlying Fund is also managed by CI Investments Inc., the Manager of the Fund.Percentages shown in brackets in the Schedule of Investment Portfolio relate investments at fair value to net assets attributable to contractholders of the Fund. The accompanying notes are an integral part of these financial statements.

– 40 –Semi-Annual Financial Statements - June 30, 2019
Clarica MVP Small Cap American FundFund Specific Notes to Financial Statements (unaudited)
Interest in Underlying Fund (Note 2)
The following tables present the Fund’s interest in the Underlying Fund.
as at June 30, 2019 Fair Value of
the Underlying FundFair Value of the Fund’s Investment
in the Underlying FundOwnership
in the Underlying Fund
Underlying Fund (in $000’s) (in $000’s) (%)CI American Small Companies Corporate Class 280,294 1,034 0.4
as at December 31, 2018Fair Value of
the Underlying FundFair Value of the Fund’s Investment
in the Underlying FundOwnership
in the Underlying Fund
Underlying Fund (in $000’s) (in $000’s) (%)CI American Small Companies Corporate Class 316,253 1,029 0.3
Unit Transactions (Note 5)for the periods ended June 30
Number of units at the beginning of periodUnits issued for cashUnits redeemed Number of units at the end of period
Class A Class A - 1987 2019 2018 2019 2018 23,367 26,763 4,411 4,459 149 91 281 - (1,615) (1,651) (871) (48) 21,901 25,203 3,821 4,411
For inception date of the Fund, please refer to Note 1 in the Notes to the Financial Statements.The accompanying notes are an integral part of these financial statements.

– 41 –Semi-Annual Financial Statements - June 30, 2019
Clarica MVP Small Cap American Fund
Financial Highlights The following tables show selected key financial information about the Fund and are intended to help you understand the Fund’s financial performance for the past six periods.
The Fund’s Net Asset Value per UnitNet assets attributable to contractholders per unit at the end of the period shown ($) (1)
Ratios and Supplemental DataNet assets ($000’s) (1)
Number of units outstanding (1)
Portfolio turnover rate (%) (2)
Management Expense RatioManagement expense ratio before taxes (%) (3)
Harmonized sales tax (%) (3)
Management expense ratio after taxes (%) (3)
Effective HST rate for the period (%) (3)
The Fund’s Net Asset Value per UnitNet assets attributable to contractholders per unit at the end of the period shown ($) (1)
Ratios and Supplemental DataNet assets ($000’s) (1)
Number of units outstanding (1)
Portfolio turnover rate (%) (2)
Management Expense RatioManagement expense ratio before taxes (%) (3)
Harmonized sales tax (%) (3)
Management expense ratio after taxes (%) (3)
Effective HST rate for the period (%) (3)
For inception date of the Fund, please refer to Note 1 in the Notes to the Financial Statements.The accompanying notes are an integral part of these financial statements.
Financial Information (for the period ended June 30, 2019 and the years ended December 31) (unaudited)
(1) This information is provided for the period ended June 30, 2019 and December 31 of the years shown.
(2) The Fund’s portfolio turnover rate indicates how actively the Fund’s portfolio advisor manages its portfolio investments. A portfolio turnover rate of 100% is equivalent to the Fund buying and selling all of the securities in its portfolio once in the
course of the period. The higher a fund’s portfolio turnover rate in a period, the greater the trading costs payable by the fund in the period, and the greater the chance of a contractholder receiving taxable capital gains in the period. There is not
necessarily a relationship between a high turnover rate and the performance of a fund.
(3) Management expense ratio is calculated based on expenses charged directly to the Fund plus, if applicable, expenses of the underlying fund, calculated on a weighted average basis on the percentage weighting of the underlying fund and is
expressed as an annualized percentage of average net assets for the periods shown. The Effective HST tax rate is calculated using the attribution percentage for each province based on contractholders’ residency and can be different from 13%.
Class A Jun. 30, 2019 Dec. 31, 2018 Dec. 31, 2017 Dec. 31, 2016 Dec. 31, 2015 Dec. 31, 2014
40.15 36.98 41.44 39.74 36.42 32.46
879 864 1,109 1,201 1,308 1,279 21,901 23,367 26,763 30,224 35,899 39,407 4.27 7.03 6.06 110.38 6.86 12.36
3.20 3.20 3.20 3.20 3.20 3.21 0.36 0.37 0.37 0.35 0.36 0.34 3.56 3.57 3.57 3.55 3.56 3.55 11.26 11.47 11.57 11.06 11.10 11.32
Class A - 1987 Jun. 30, 2019 Dec. 31, 2018 Dec. 31, 2017 Dec. 31, 2016 Dec. 31, 2015 Dec. 31, 2014
41.29 37.98 42.44 40.59 37.09 32.96
158 168 189 181 165 148 3,821 4,411 4,459 4,459 4,459 4,480 4.27 7.03 6.06 110.38 6.86 12.36
2.95 2.95 2.95 2.95 2.95 2.95 0.34 0.34 0.34 0.34 0.24 0.29 3.29 3.29 3.29 3.29 3.19 3.24 11.54 11.47 11.47 11.50 8.20 8.05
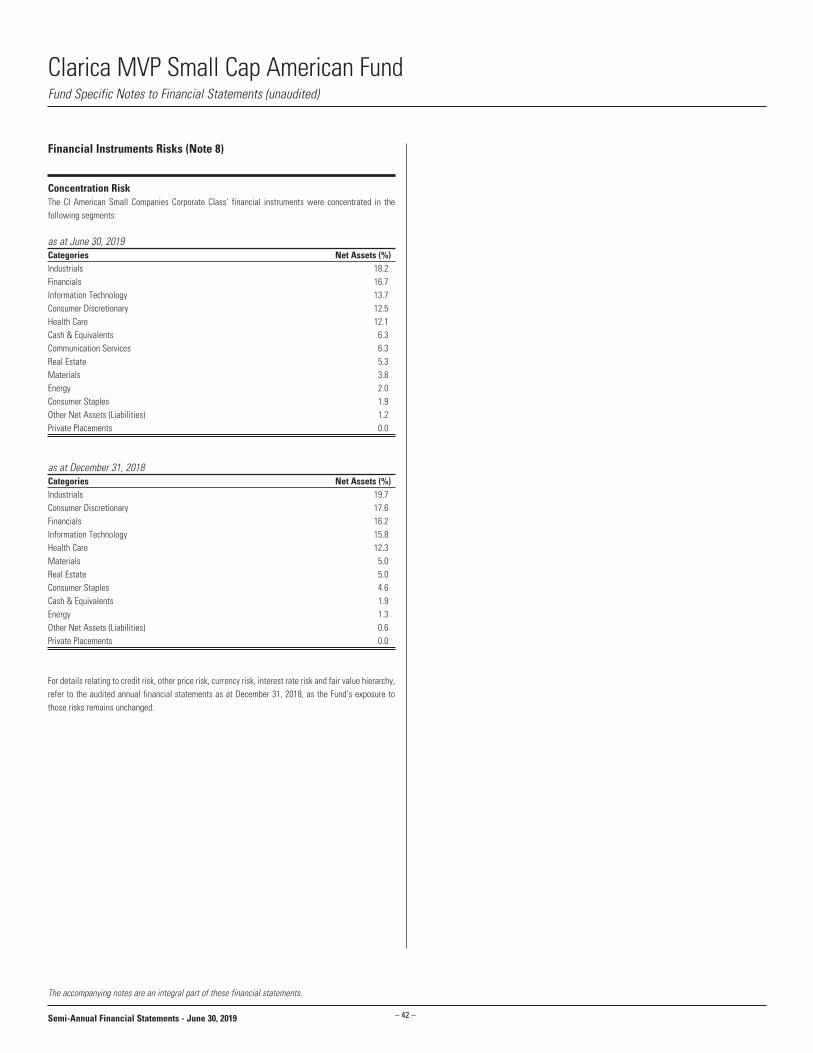
– 42 –Semi-Annual Financial Statements - June 30, 2019
Clarica MVP Small Cap American Fund
The accompanying notes are an integral part of these financial statements.
Concentration RiskThe CI American Small Companies Corporate Class’ financial instruments were concentrated in the following segments:
as at June 30, 2019Categories Net Assets (%)Industrials 18.2Financials 16.7Information Technology 13.7Consumer Discretionary 12.5Health Care 12.1Cash & Equivalents 6.3Communication Services 6.3Real Estate 5.3Materials 3.8Energy 2.0Consumer Staples 1.9Other Net Assets (Liabilities) 1.2Private Placements 0.0
as at December 31, 2018Categories Net Assets (%)Industrials 19.7Consumer Discretionary 17.6Financials 16.2Information Technology 15.8Health Care 12.3Materials 5.0Real Estate 5.0Consumer Staples 4.6Cash & Equivalents 1.9Energy 1.3Other Net Assets (Liabilities) 0.6Private Placements 0.0
For details relating to credit risk, other price risk, currency risk, interest rate risk and fair value hierarchy, refer to the audited annual financial statements as at December 31, 2018, as the Fund’s exposure to those risks remains unchanged.
Fund Specific Notes to Financial Statements (unaudited)
Financial Instruments Risks (Note 8)

– 43 –Semi-Annual Financial Statements - June 30, 2019
Clarica MVP U.S. Equity Fund
For inception date of the Fund, please refer to Note 1 in the Notes to the Financial Statements.The accompanying notes are an integral part of these financial statements.
Financial Statements (unaudited)
CIG - 9261
2019 2018
- - 17 14 52 89 1 (5)
218 (49)
- - - - 288 49
27 28 3 3 3 4 4 4 37 39
251 10
2.56 0.09 2.59 0.15
95,882 103,107 2,206 2,258
as at as atJun. 30, 2019 Dec. 31, 2018
2,342 2,310 5 4 - - - - - - 1 - - - 2,348 2,314
- - - - 1 - - - - - - - 1 - 2,347 2,314
2,314 2,500
25.15 22.66 25.70 23.12
Statements of Financial Position (in $000’s except for per unit amounts)
Statements of Comprehensive Income for the periods ended June 30 (in $000’s except for per unit amounts and number of units)
Assets Current assets Investments* Cash Fees rebate receivable Dividends receivable Interest receivable Receivable for investments sold Receivable for unit subscriptions
Liabilities Current liabilities Bank overdraft Payable for investments purchased Payable for unit redemptions Management fees payable Administration fees payable Insurance fees payable
Net assets attributable to contractholders
*Investments at cost
Net assets attributable to contractholders per unit: Class AClass A - 1987
Income Net gain (loss) on investments Dividends Income distributions from investments Capital gain distributions from investments Net realized gain (loss) on sale of investments Change in unrealized appreciation (depreciation) in value of
investments Other income Interest Fees rebate (Note 6)
Expenses (Note 6)Management fees Administration fees Insurance fees Harmonized sales tax
Increase (decrease) in net assets from operations attributable to contractholders
Increase (decrease) in net assets from operations attributable to contractholders per unit: Class AClass A - 1987
Weighted average number of units: Class AClass A - 1987

– 44 –Semi-Annual Financial Statements - June 30, 2019
Clarica MVP U.S. Equity Fund Financial Statements (unaudited)
2019 2018
2,314 2,572
251 10
15 33 (233) (163) (218) (130)
2,347 2,452
FundNet assets attributable to contractholders at the beginning of period Increase (decrease) in net assets from operations attributable to contractholders Unit transactions Proceeds from issuance of units Amounts paid on redemption of units
Net assets attributable to contractholders at the end of period
Statements of Changes in Net Assets Attributable to Contractholdersfor the periods ended June 30 (in $000’s)
2019 2018
251 10
(1) 5
(218) 49 266 189 (11) (21) (69) (103) - - - - - - - - - - - - 218 129
15 33 (232) (162) (217) (129)
1 - 4 5 5 5
- - - - - - - -
Statements of Cash Flowsfor the periods ended June 30 (in $000’s)
Cash flows from (used in) operating activities Increase (decrease) in net assets from operations attributable to contractholders Adjustments for: Net realized (gain) loss on sale of investments Change in unrealized (appreciation) depreciation in value of
investments Proceeds from sale of investments Purchase of investments Non-cash distributions from investments (Increase) decrease in fees rebate receivable (Increase) decrease in dividends receivable (Increase) decrease in interest receivable Increase (decrease) in management fees payable Increase (decrease) in administration fees payable Increase (decrease) in insurance fees payable Net cash from (used in) operating activities
Cash flows from (used in) financing activities Proceeds from issuance of unitsAmounts paid on redemption of unitsNet cash from (used in) financing activities
Net increase (decrease) in cashCash (bank overdraft), beginning of periodCash (bank overdraft), end of period
Supplementary Information: Dividends received, net of withholding tax*Interest received*Dividends paid*Interest paid*
*Dividends and interest received as well as dividends and interest paid relate to operating activities of the Fund. The accompanying notes are an integral part of these financial statements.
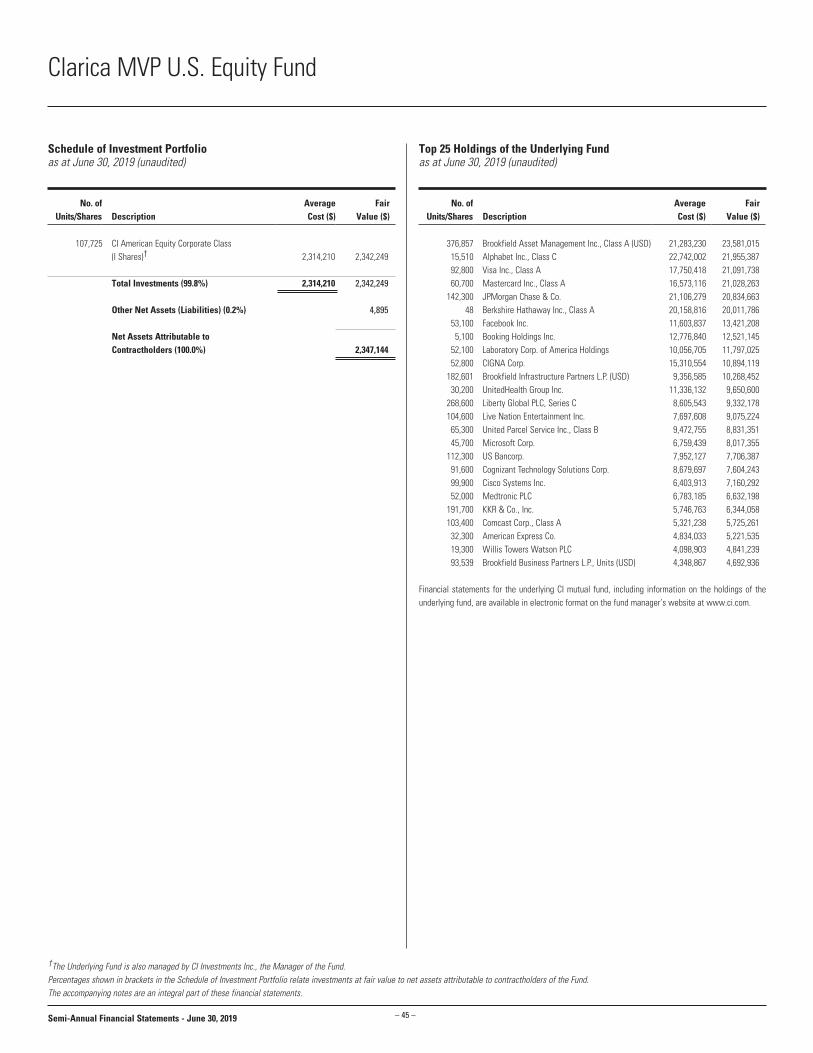
– 45 –Semi-Annual Financial Statements - June 30, 2019
Clarica MVP U.S. Equity Fund
Schedule of Investment Portfolioas at June 30, 2019 (unaudited)
No. ofUnits/Shares Description
AverageCost ($)
FairValue ($)
107,725 CI American Equity Corporate Class (I Shares)† 2,314,210 2,342,249
Total Investments (99.8%) 2,314,210 2,342,249 Other Net Assets (Liabilities) (0.2%) 4,895 Net Assets Attributable to Contractholders (100.0%) 2,347,144
Top 25 Holdings of the Underlying Fundas at June 30, 2019 (unaudited)
No. ofUnits/Shares Description
AverageCost ($)
FairValue ($)
376,857 Brookfield Asset Management Inc., Class A (USD) 21,283,230 23,581,015 15,510 Alphabet Inc., Class C 22,742,002 21,955,387 92,800 Visa Inc., Class A 17,750,418 21,091,738 60,700 Mastercard Inc., Class A 16,573,116 21,028,263 142,300 JPMorgan Chase & Co. 21,106,279 20,834,663 48 Berkshire Hathaway Inc., Class A 20,158,816 20,011,786 53,100 Facebook Inc. 11,603,837 13,421,208 5,100 Booking Holdings Inc. 12,776,840 12,521,145 52,100 Laboratory Corp. of America Holdings 10,056,705 11,797,025 52,800 CIGNA Corp. 15,310,554 10,894,119 182,601 Brookfield Infrastructure Partners L.P. (USD) 9,356,585 10,268,452 30,200 UnitedHealth Group Inc. 11,336,132 9,650,600 268,600 Liberty Global PLC, Series C 8,605,543 9,332,178 104,600 Live Nation Entertainment Inc. 7,697,608 9,075,224 65,300 United Parcel Service Inc., Class B 9,472,755 8,831,351 45,700 Microsoft Corp. 6,759,439 8,017,355 112,300 US Bancorp. 7,952,127 7,706,387 91,600 Cognizant Technology Solutions Corp. 8,679,697 7,604,243 99,900 Cisco Systems Inc. 6,403,913 7,160,292 52,000 Medtronic PLC 6,783,185 6,632,198 191,700 KKR & Co., Inc. 5,746,763 6,344,058 103,400 Comcast Corp., Class A 5,321,238 5,725,261 32,300 American Express Co. 4,834,033 5,221,535 19,300 Willis Towers Watson PLC 4,098,903 4,841,239 93,539 Brookfield Business Partners L.P., Units (USD) 4,348,867 4,692,936
Financial statements for the underlying CI mutual fund, including information on the holdings of the underlying fund, are available in electronic format on the fund manager’s website at www.ci.com.
† The Underlying Fund is also managed by CI Investments Inc., the Manager of the Fund.Percentages shown in brackets in the Schedule of Investment Portfolio relate investments at fair value to net assets attributable to contractholders of the Fund. The accompanying notes are an integral part of these financial statements.

– 46 –Semi-Annual Financial Statements - June 30, 2019
Clarica MVP U.S. Equity Fund Fund Specific Notes to Financial Statements (unaudited)
Interest in Underlying Fund (Note 2)
The following tables present the Fund’s interest in the Underlying Fund.
as at June 30, 2019 Fair Value of
the Underlying FundFair Value of the Fund’s Investment
in the Underlying FundOwnership
in the Underlying Fund
Underlying Fund (in $000’s) (in $000’s) (%)CI American Equity Corporate Class 337,689 2,342 0.7
as at December 31, 2018Fair Value of
the Underlying FundFair Value of the Fund’s Investment
in the Underlying FundOwnership
in the Underlying Fund
Underlying Fund (in $000’s) (in $000’s) (%)Cambridge American Equity Corporate Class 332,677 2,310 0.7
Unit Transactions (Note 5)for the periods ended June 30
Number of units at the beginning of periodUnits issued for cashUnits redeemed Number of units at the end of period
Class A Class A - 1987 2019 2018 2019 2018 99,852 106,281 2,248 2,291 618 1,379 12 13 (9,388) (6,770) (63) (68) 91,082 100,890 2,197 2,236
For inception date of the Fund, please refer to Note 1 in the Notes to the Financial Statements.The accompanying notes are an integral part of these financial statements.

– 47 –Semi-Annual Financial Statements - June 30, 2019
Clarica MVP U.S. Equity Fund
Financial Highlights The following tables show selected key financial information about the Fund and are intended to help you understand the Fund’s financial performance for the past six periods.
The Fund’s Net Asset Value per UnitNet assets attributable to contractholders per unit at the end of the period shown ($) (1)
Ratios and Supplemental DataNet assets ($000’s) (1)
Number of units outstanding (1)
Portfolio turnover rate (%) (2)
Management Expense RatioManagement expense ratio before taxes (%) (3)
Harmonized sales tax (%) (3)
Management expense ratio after taxes (%) (3)
Effective HST rate for the period (%) (3)
The Fund’s Net Asset Value per UnitNet assets attributable to contractholders per unit at the end of the period shown ($) (1)
Ratios and Supplemental DataNet assets ($000’s) (1)
Number of units outstanding (1)
Portfolio turnover rate (%) (2)
Management Expense RatioManagement expense ratio before taxes (%) (3)
Harmonized sales tax (%) (3)
Management expense ratio after taxes (%) (3)
Effective HST rate for the period (%) (3)
For inception date of the Fund, please refer to Note 1 in the Notes to the Financial Statements.The accompanying notes are an integral part of these financial statements.
Financial Information (for the period ended June 30, 2019 and the years ended December 31) (unaudited)
(1) This information is provided for the period ended June 30, 2019 and December 31 of the years shown.
(2) The Fund’s portfolio turnover rate indicates how actively the Fund’s portfolio advisor manages its portfolio investments. A portfolio turnover rate of 100% is equivalent to the Fund buying and selling all of the securities in its portfolio once in the
course of the period. The higher a fund’s portfolio turnover rate in a period, the greater the trading costs payable by the fund in the period, and the greater the chance of a contractholder receiving taxable capital gains in the period. There is not
necessarily a relationship between a high turnover rate and the performance of a fund.
(3) Management expense ratio is calculated based on expenses charged directly to the Fund plus, if applicable, expenses of the underlying fund, calculated on a weighted average basis on the percentage weighting of the underlying fund and is
expressed as an annualized percentage of average net assets for the periods shown. The Effective HST tax rate is calculated using the attribution percentage for each province based on contractholders’ residency and can be different from 13%.
Class A Jun. 30, 2019 Dec. 31, 2018 Dec. 31, 2017 Dec. 31, 2016 Dec. 31, 2015 Dec. 31, 2014
25.15 22.66 23.68 23.18 21.11 19.74
2,291 2,262 2,517 2,663 2,660 2,631 91,082 99,852 106,281 114,881 126,013 133,310 3.35 9.04 7.56 114.17 8.63 3.33
2.88 2.88 2.88 2.88 2.88 2.89 0.32 0.32 0.32 0.32 0.32 0.30 3.20 3.20 3.20 3.20 3.20 3.19 11.23 11.14 11.13 11.13 11.13 11.07
Class A - 1987 Jun. 30, 2019 Dec. 31, 2018 Dec. 31, 2017 Dec. 31, 2016 Dec. 31, 2015 Dec. 31, 2014
25.70 23.12 24.09 23.52 21.37 19.94
56 52 55 55 57 62 2,197 2,248 2,291 2,334 2,682 3,104 3.35 9.04 7.56 114.17 8.63 3.33
2.70 2.70 2.70 2.70 2.70 2.70 0.21 0.21 0.22 0.22 0.22 0.27 2.91 2.91 2.92 2.92 2.92 2.97 7.89 7.83 8.09 8.29 8.34 8.88

– 48 –Semi-Annual Financial Statements - June 30, 2019
Clarica MVP U.S. Equity Fund
The accompanying notes are an integral part of these financial statements.
Concentration RiskThe CI American Equity Corporate Class’ financial instruments were concentrated in the following segments:
as at June 30, 2019Categories Net Assets (%)Information Technology 31.0Financials 29.1Health Care 12.2Communication Services 9.2Industrials 7.8Consumer Discretionary 5.9Utilities 3.0Other Net Assets (Liabilities) 1.2Energy 0.9Cash & Equivalents (0.3)
as at December 31, 2018Categories Net Assets (%)Information Technology 28.4Financials 27.7Consumer Discretionary 14.9Health Care 11.5Industrials 6.9Cash & Equivalents 4.0Utilities 2.3Consumer Staples 2.1Other Net Assets (Liabilities) 1.3Energy 0.9
For details relating to credit risk, other price risk, currency risk, interest rate risk and fair value hierarchy, refer to the audited annual financial statements as at December 31, 2018, as the Fund’s exposure to those risks remains unchanged.
Fund Specific Notes to Financial Statements (unaudited)
Financial Instruments Risks (Note 8)

– 49 –Semi-Annual Financial Statements - June 30, 2019
Clarica MVP Balanced Fund
For inception date of the Fund, please refer to Note 1 in the Notes to the Financial Statements.The accompanying notes are an integral part of these financial statements.
Financial Statements (unaudited)
CIG - 9252
2019 2018
- - - - - - (155) (13)
2,595 618
1 1 - - 2,441 606
244 282 29 34 54 62 40 46 367 424
2,074 182
5.14 0.40 5.82 0.56
382,188 422,225 18,602 21,156
as at as atJun. 30, 2019 Dec. 31, 2018
24,322 24,138 109 32 - - - - - - 11 5 - - 24,442 24,175
- - - - 9 4 - - - - - - 9 4 24,433 24,171
25,258 27,669
63.22 58.16 65.14 59.81
Statements of Financial Position (in $000’s except for per unit amounts)
Statements of Comprehensive Income for the periods ended June 30 (in $000’s except for per unit amounts and number of units)
Assets Current assets Investments* Cash Fees rebate receivable Dividends receivable Interest receivable Receivable for investments sold Receivable for unit subscriptions
Liabilities Current liabilities Bank overdraft Payable for investments purchased Payable for unit redemptions Management fees payable Administration fees payable Insurance fees payable
Net assets attributable to contractholders
*Investments at cost
Net assets attributable to contractholders per unit: Class AClass A - 1987
Income Net gain (loss) on investments Dividends Income distributions from investments Capital gain distributions from investments Net realized gain (loss) on sale of investments Change in unrealized appreciation (depreciation) in value of
investments Other income Interest Fees rebate (Note 6)
Expenses (Note 6)Management fees Administration fees Insurance fees Harmonized sales tax
Increase (decrease) in net assets from operations attributable to contractholders
Increase (decrease) in net assets from operations attributable to contractholders per unit: Class AClass A - 1987
Weighted average number of units: Class AClass A - 1987
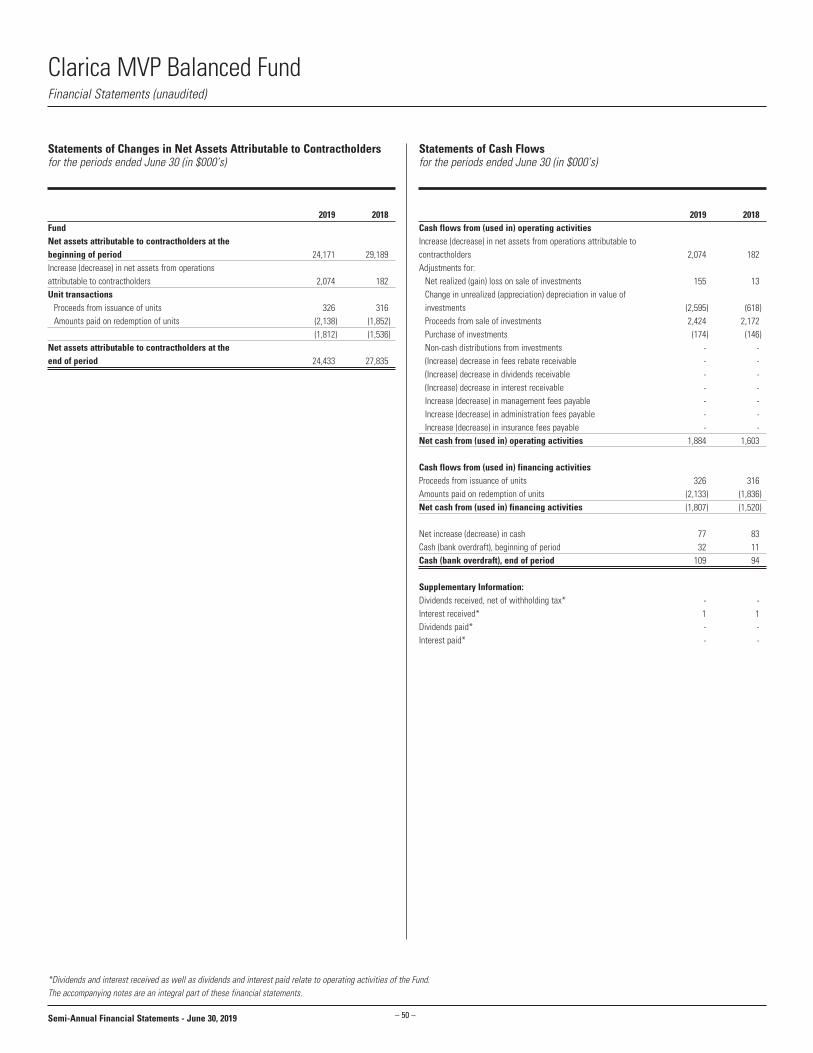
– 50 –Semi-Annual Financial Statements - June 30, 2019
Clarica MVP Balanced FundFinancial Statements (unaudited)
2019 2018
24,171 29,189
2,074 182
326 316 (2,138) (1,852) (1,812) (1,536)
24,433 27,835
FundNet assets attributable to contractholders at the beginning of period Increase (decrease) in net assets from operations attributable to contractholders Unit transactions Proceeds from issuance of units Amounts paid on redemption of units
Net assets attributable to contractholders at the end of period
Statements of Changes in Net Assets Attributable to Contractholdersfor the periods ended June 30 (in $000’s)
2019 2018
2,074 182
155 13
(2,595) (618) 2,424 2,172 (174) (146) - - - - - - - - - - - - - - 1,884 1,603
326 316 (2,133) (1,836) (1,807) (1,520)
77 83 32 11 109 94
- - 1 1 - - - -
Statements of Cash Flowsfor the periods ended June 30 (in $000’s)
Cash flows from (used in) operating activities Increase (decrease) in net assets from operations attributable to contractholders Adjustments for: Net realized (gain) loss on sale of investments Change in unrealized (appreciation) depreciation in value of
investments Proceeds from sale of investments Purchase of investments Non-cash distributions from investments (Increase) decrease in fees rebate receivable (Increase) decrease in dividends receivable (Increase) decrease in interest receivable Increase (decrease) in management fees payable Increase (decrease) in administration fees payable Increase (decrease) in insurance fees payable Net cash from (used in) operating activities
Cash flows from (used in) financing activities Proceeds from issuance of unitsAmounts paid on redemption of unitsNet cash from (used in) financing activities
Net increase (decrease) in cashCash (bank overdraft), beginning of periodCash (bank overdraft), end of period
Supplementary Information: Dividends received, net of withholding tax*Interest received*Dividends paid*Interest paid*
*Dividends and interest received as well as dividends and interest paid relate to operating activities of the Fund. The accompanying notes are an integral part of these financial statements.

– 51 –Semi-Annual Financial Statements - June 30, 2019
Clarica MVP Balanced Fund
Schedule of Investment Portfolioas at June 30, 2019 (unaudited)
No. ofUnits/Shares Description
AverageCost ($)
FairValue ($)
2,618,381 Signature Canadian Balanced Fund (Class I)† 25,257,959 24,322,145
Total Investments (99.5%) 25,257,959 24,322,145 Other Net Assets (Liabilities) (0.5%) 110,489 Net Assets Attributable to Contractholders (100.0%) 24,432,634
Top 25 Holdings of the Underlying Fundas at June 30, 2019 (unaudited)
No. ofUnits/Shares Description
AverageCost ($)
FairValue ($)
101,870,000 Government of Canada 2% 06/01/2028 106,297,669 106,477,306 Cash & Equivalents 66,405,130 2,203,474 Manulife Financial Corp. 48,203,980 52,442,681 640,200 The Bank of Nova Scotia 44,515,636 45,031,668 246,100 SPDR Gold Trust 40,625,564 42,929,478 32,916,000 Province of Ontario 2.9% 06/02/2028 33,962,220 34,971,789 590,187 Suncor Energy Inc. 24,762,947 24,109,139 19,012,000 Province of Ontario 2.6% 06/02/2025 19,595,956 19,727,540 18,837,000 Province of Quebec 2.5% 09/01/2026 18,918,654 19,479,342 261,700 Total S.A. 20,162,588 19,203,961 137,350 Nestle S.A., Registered Shares 11,181,355 18,619,419 476,729 Canadian Natural Resources Ltd. 18,993,893 16,833,301 14,580,000 Province of Quebec 3.75% 09/01/2024 15,803,549 15,946,039 15,070,000 Province of Ontario 2.7% 06/02/2029 15,404,751 15,798,136 51,200 Canadian Pacific Railway Ltd. 11,965,793 15,791,616 14,849,000 Government of Canada 1.75% 05/01/2021 14,898,201 14,922,503 303,700 Enbridge Inc. 15,353,469 14,365,010 13,238,000 Province of Ontario 3.5% 06/02/2024 14,321,009 14,266,625 130,800 Canadian Imperial Bank of Commerce 14,709,899 13,469,784 12,184,000 Government of Canada 2.25% 06/01/2029 12,945,901 13,062,324 428,098 Teck Resources Ltd., Class B 12,407,380 12,937,122 186,404 Sony Corp. 7,411,054 12,790,011 12,023,000 Province of Quebec 2.75% 09/01/2025 12,374,296 12,602,690 10,748,000 Province of Quebec 3.1% 12/01/2051 11,222,420 12,324,908 148,079 Alimentation Couche-Tard Inc., Class B 4,912,125 12,203,190
Financial statements for the underlying CI mutual fund, including information on the holdings of the underlying fund, are available in electronic format on the fund manager’s website at www.ci.com.
† The Underlying Fund is also managed by CI Investments Inc., the Manager of the Fund.Percentages shown in brackets in the Schedule of Investment Portfolio relate investments at fair value to net assets attributable to contractholders of the Fund. The accompanying notes are an integral part of these financial statements.
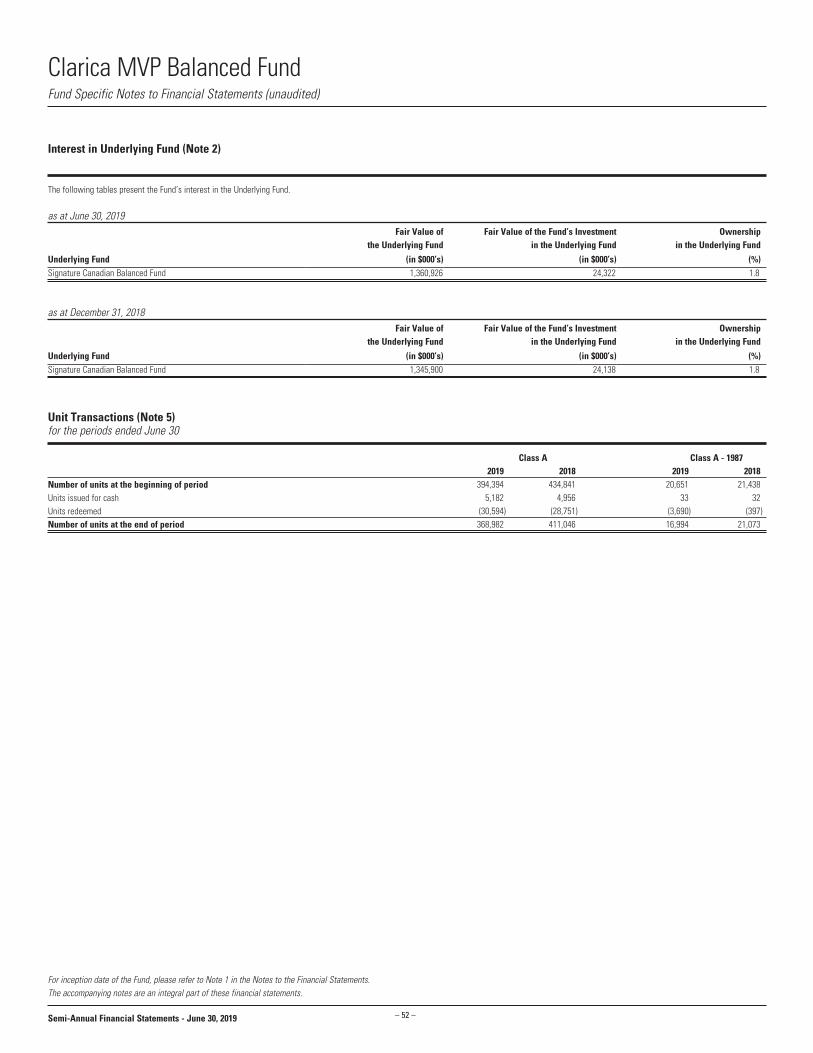
– 52 –Semi-Annual Financial Statements - June 30, 2019
Clarica MVP Balanced FundFund Specific Notes to Financial Statements (unaudited)
Interest in Underlying Fund (Note 2)
The following tables present the Fund’s interest in the Underlying Fund.
as at June 30, 2019 Fair Value of
the Underlying FundFair Value of the Fund’s Investment
in the Underlying FundOwnership
in the Underlying Fund
Underlying Fund (in $000’s) (in $000’s) (%)Signature Canadian Balanced Fund 1,360,926 24,322 1.8
as at December 31, 2018Fair Value of
the Underlying FundFair Value of the Fund’s Investment
in the Underlying FundOwnership
in the Underlying Fund
Underlying Fund (in $000’s) (in $000’s) (%)Signature Canadian Balanced Fund 1,345,900 24,138 1.8
Unit Transactions (Note 5)for the periods ended June 30
Number of units at the beginning of periodUnits issued for cashUnits redeemed Number of units at the end of period
Class A Class A - 1987 2019 2018 2019 2018 394,394 434,841 20,651 21,438 5,182 4,956 33 32 (30,594) (28,751) (3,690) (397) 368,982 411,046 16,994 21,073
For inception date of the Fund, please refer to Note 1 in the Notes to the Financial Statements.The accompanying notes are an integral part of these financial statements.
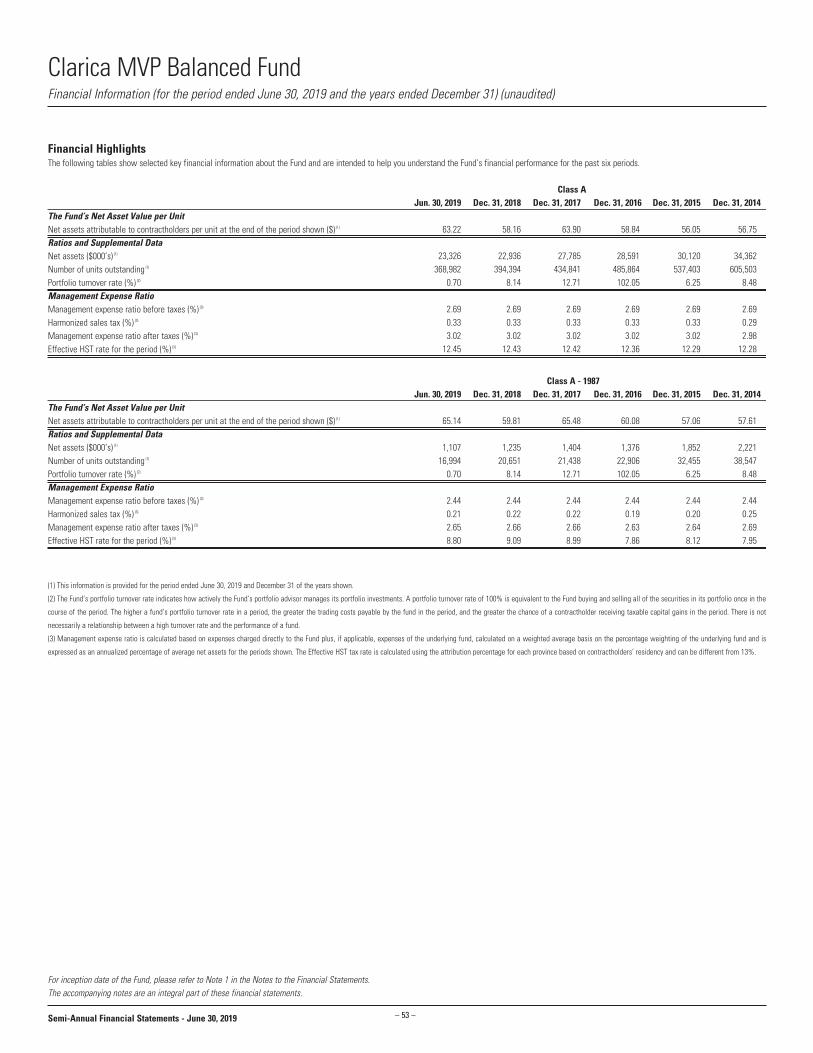
– 53 –Semi-Annual Financial Statements - June 30, 2019
Clarica MVP Balanced Fund
Financial Highlights The following tables show selected key financial information about the Fund and are intended to help you understand the Fund’s financial performance for the past six periods.
The Fund’s Net Asset Value per UnitNet assets attributable to contractholders per unit at the end of the period shown ($) (1)
Ratios and Supplemental DataNet assets ($000’s) (1)
Number of units outstanding (1)
Portfolio turnover rate (%) (2)
Management Expense RatioManagement expense ratio before taxes (%) (3)
Harmonized sales tax (%) (3)
Management expense ratio after taxes (%) (3)
Effective HST rate for the period (%) (3)
The Fund’s Net Asset Value per UnitNet assets attributable to contractholders per unit at the end of the period shown ($) (1)
Ratios and Supplemental DataNet assets ($000’s) (1)
Number of units outstanding (1)
Portfolio turnover rate (%) (2)
Management Expense RatioManagement expense ratio before taxes (%) (3)
Harmonized sales tax (%) (3)
Management expense ratio after taxes (%) (3)
Effective HST rate for the period (%) (3)
For inception date of the Fund, please refer to Note 1 in the Notes to the Financial Statements.The accompanying notes are an integral part of these financial statements.
Financial Information (for the period ended June 30, 2019 and the years ended December 31) (unaudited)
(1) This information is provided for the period ended June 30, 2019 and December 31 of the years shown.
(2) The Fund’s portfolio turnover rate indicates how actively the Fund’s portfolio advisor manages its portfolio investments. A portfolio turnover rate of 100% is equivalent to the Fund buying and selling all of the securities in its portfolio once in the
course of the period. The higher a fund’s portfolio turnover rate in a period, the greater the trading costs payable by the fund in the period, and the greater the chance of a contractholder receiving taxable capital gains in the period. There is not
necessarily a relationship between a high turnover rate and the performance of a fund.
(3) Management expense ratio is calculated based on expenses charged directly to the Fund plus, if applicable, expenses of the underlying fund, calculated on a weighted average basis on the percentage weighting of the underlying fund and is
expressed as an annualized percentage of average net assets for the periods shown. The Effective HST tax rate is calculated using the attribution percentage for each province based on contractholders’ residency and can be different from 13%.
Class A Jun. 30, 2019 Dec. 31, 2018 Dec. 31, 2017 Dec. 31, 2016 Dec. 31, 2015 Dec. 31, 2014
63.22 58.16 63.90 58.84 56.05 56.75
23,326 22,936 27,785 28,591 30,120 34,362 368,982 394,394 434,841 485,864 537,403 605,503 0.70 8.14 12.71 102.05 6.25 8.48
2.69 2.69 2.69 2.69 2.69 2.69 0.33 0.33 0.33 0.33 0.33 0.29 3.02 3.02 3.02 3.02 3.02 2.98 12.45 12.43 12.42 12.36 12.29 12.28
Class A - 1987 Jun. 30, 2019 Dec. 31, 2018 Dec. 31, 2017 Dec. 31, 2016 Dec. 31, 2015 Dec. 31, 2014
65.14 59.81 65.48 60.08 57.06 57.61
1,107 1,235 1,404 1,376 1,852 2,221 16,994 20,651 21,438 22,906 32,455 38,547 0.70 8.14 12.71 102.05 6.25 8.48
2.44 2.44 2.44 2.44 2.44 2.44 0.21 0.22 0.22 0.19 0.20 0.25 2.65 2.66 2.66 2.63 2.64 2.69 8.80 9.09 8.99 7.86 8.12 7.95
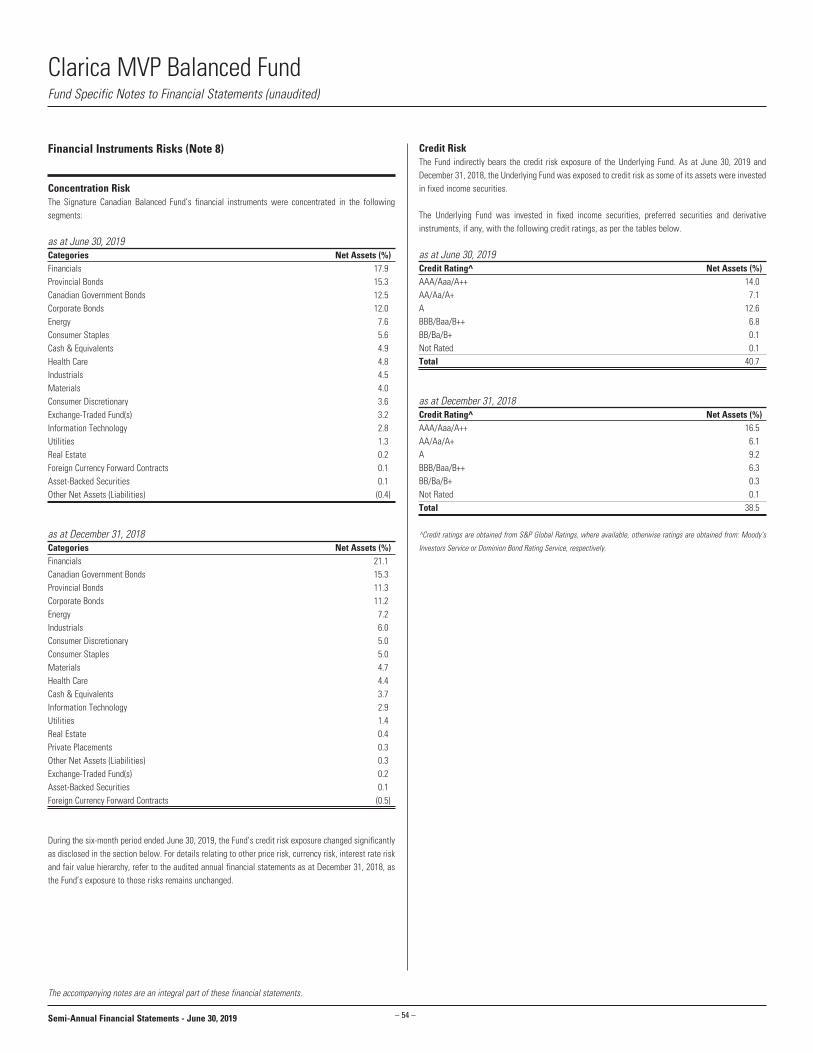
– 54 –Semi-Annual Financial Statements - June 30, 2019
Clarica MVP Balanced Fund
The accompanying notes are an integral part of these financial statements.
Concentration RiskThe Signature Canadian Balanced Fund’s financial instruments were concentrated in the following segments:
as at June 30, 2019Categories Net Assets (%)Financials 17.9Provincial Bonds 15.3Canadian Government Bonds 12.5Corporate Bonds 12.0Energy 7.6Consumer Staples 5.6Cash & Equivalents 4.9Health Care 4.8Industrials 4.5Materials 4.0Consumer Discretionary 3.6Exchange-Traded Fund(s) 3.2Information Technology 2.8Utilities 1.3Real Estate 0.2Foreign Currency Forward Contracts 0.1Asset-Backed Securities 0.1Other Net Assets (Liabilities) (0.4)
as at December 31, 2018Categories Net Assets (%)Financials 21.1Canadian Government Bonds 15.3Provincial Bonds 11.3Corporate Bonds 11.2Energy 7.2Industrials 6.0Consumer Discretionary 5.0Consumer Staples 5.0Materials 4.7Health Care 4.4Cash & Equivalents 3.7Information Technology 2.9Utilities 1.4Real Estate 0.4Private Placements 0.3Other Net Assets (Liabilities) 0.3Exchange-Traded Fund(s) 0.2Asset-Backed Securities 0.1Foreign Currency Forward Contracts (0.5)
During the six-month period ended June 30, 2019, the Fund’s credit risk exposure changed significantly as disclosed in the section below. For details relating to other price risk, currency risk, interest rate risk and fair value hierarchy, refer to the audited annual financial statements as at December 31, 2018, as the Fund’s exposure to those risks remains unchanged.
Credit RiskThe Fund indirectly bears the credit risk exposure of the Underlying Fund. As at June 30, 2019 and December 31, 2018, the Underlying Fund was exposed to credit risk as some of its assets were invested in fixed income securities.
The Underlying Fund was invested in fixed income securities, preferred securities and derivative instruments, if any, with the following credit ratings, as per the tables below.
as at June 30, 2019Credit Rating^ Net Assets (%)AAA/Aaa/A++ 14.0AA/Aa/A+ 7.1A 12.6BBB/Baa/B++ 6.8BB/Ba/B+ 0.1Not Rated 0.1Total 40.7
as at December 31, 2018Credit Rating^ Net Assets (%)AAA/Aaa/A++ 16.5 AA/Aa/A+ 6.1 A 9.2 BBB/Baa/B++ 6.3 BB/Ba/B+ 0.3 Not Rated 0.1 Total 38.5
^Credit ratings are obtained from S&P Global Ratings, where available, otherwise ratings are obtained from: Moody’s
Investors Service or Dominion Bond Rating Service, respectively.
Fund Specific Notes to Financial Statements (unaudited)
Financial Instruments Risks (Note 8)

– 55 –Semi-Annual Financial Statements - June 30, 2019
Clarica MVP Bond Fund
For inception date of the Fund, please refer to Note 1 in the Notes to the Financial Statements.The accompanying notes are an integral part of these financial statements.
Financial Statements (unaudited)
CIG - 9253
2019 2018
- - 64 72 - - 1 (7)
204 (42)
- - - - 269 23
27 31 4 5 9 10 5 6 45 52
224 (29)
2.40 (0.27) 2.55 (0.19)
90,942 105,893 2,330 2,732
as at as atJun. 30, 2019 Dec. 31, 2018
4,103 4,120 6 1 - - - - - - 1 - - - 4,110 4,121
- - - - - - - - - - - - - - 4,110 4,121
3,973 4,194
45.04 42.64 46.33 43.79
Statements of Financial Position (in $000’s except for per unit amounts)
Statements of Comprehensive Income for the periods ended June 30 (in $000’s except for per unit amounts and number of units)
Assets Current assets Investments* Cash Fees rebate receivable Dividends receivable Interest receivable Receivable for investments sold Receivable for unit subscriptions
Liabilities Current liabilities Bank overdraft Payable for investments purchased Payable for unit redemptions Management fees payable Administration fees payable Insurance fees payable
Net assets attributable to contractholders
*Investments at cost
Net assets attributable to contractholders per unit: Class AClass A - 1987
Income Net gain (loss) on investments Dividends Income distributions from investments Capital gain distributions from investments Net realized gain (loss) on sale of investments Change in unrealized appreciation (depreciation) in value of
investments Other income Interest Fees rebate (Note 6)
Expenses (Note 6)Management fees Administration fees Insurance fees Harmonized sales tax
Increase (decrease) in net assets from operations attributable to contractholders
Increase (decrease) in net assets from operations attributable to contractholders per unit: Class AClass A - 1987
Weighted average number of units: Class AClass A - 1987
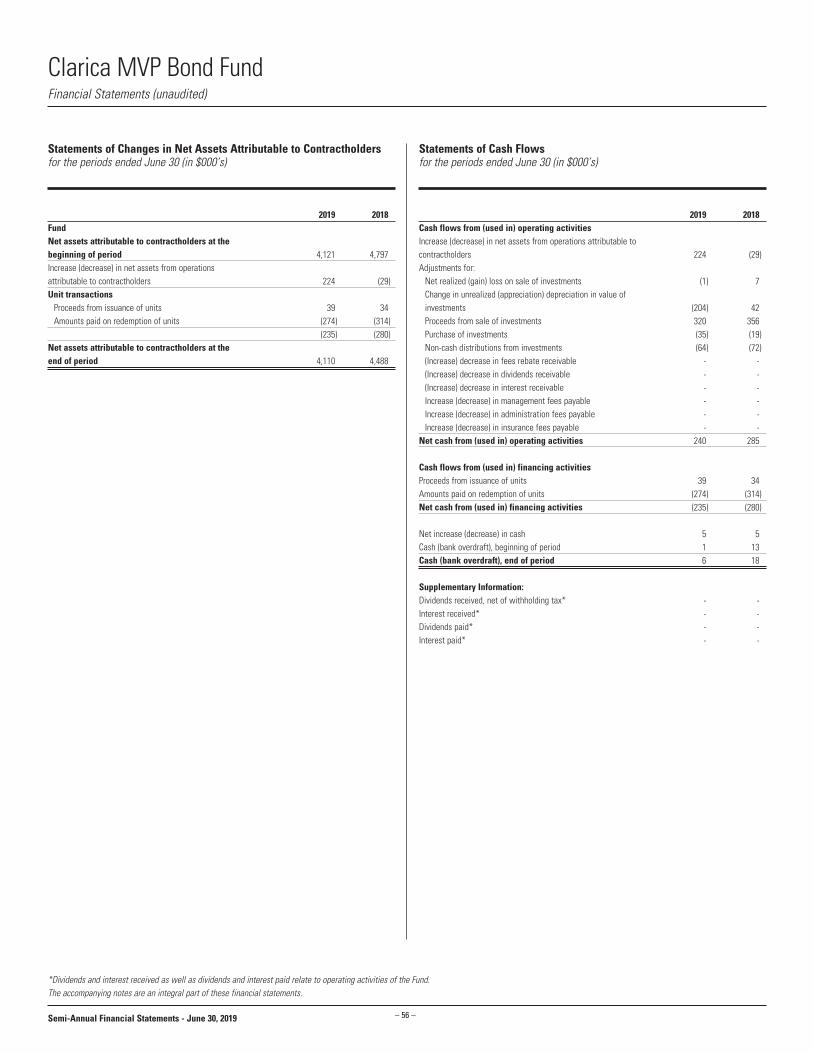
– 56 –Semi-Annual Financial Statements - June 30, 2019
Clarica MVP Bond FundFinancial Statements (unaudited)
2019 2018
4,121 4,797
224 (29)
39 34 (274) (314) (235) (280)
4,110 4,488
FundNet assets attributable to contractholders at the beginning of period Increase (decrease) in net assets from operations attributable to contractholders Unit transactions Proceeds from issuance of units Amounts paid on redemption of units
Net assets attributable to contractholders at the end of period
Statements of Changes in Net Assets Attributable to Contractholdersfor the periods ended June 30 (in $000’s)
2019 2018
224 (29)
(1) 7
(204) 42 320 356 (35) (19) (64) (72) - - - - - - - - - - - - 240 285
39 34 (274) (314) (235) (280)
5 5 1 13 6 18
- - - - - - - -
Statements of Cash Flowsfor the periods ended June 30 (in $000’s)
Cash flows from (used in) operating activities Increase (decrease) in net assets from operations attributable to contractholders Adjustments for: Net realized (gain) loss on sale of investments Change in unrealized (appreciation) depreciation in value of
investments Proceeds from sale of investments Purchase of investments Non-cash distributions from investments (Increase) decrease in fees rebate receivable (Increase) decrease in dividends receivable (Increase) decrease in interest receivable Increase (decrease) in management fees payable Increase (decrease) in administration fees payable Increase (decrease) in insurance fees payable Net cash from (used in) operating activities
Cash flows from (used in) financing activities Proceeds from issuance of unitsAmounts paid on redemption of unitsNet cash from (used in) financing activities
Net increase (decrease) in cashCash (bank overdraft), beginning of periodCash (bank overdraft), end of period
Supplementary Information: Dividends received, net of withholding tax*Interest received*Dividends paid*Interest paid*
*Dividends and interest received as well as dividends and interest paid relate to operating activities of the Fund. The accompanying notes are an integral part of these financial statements.
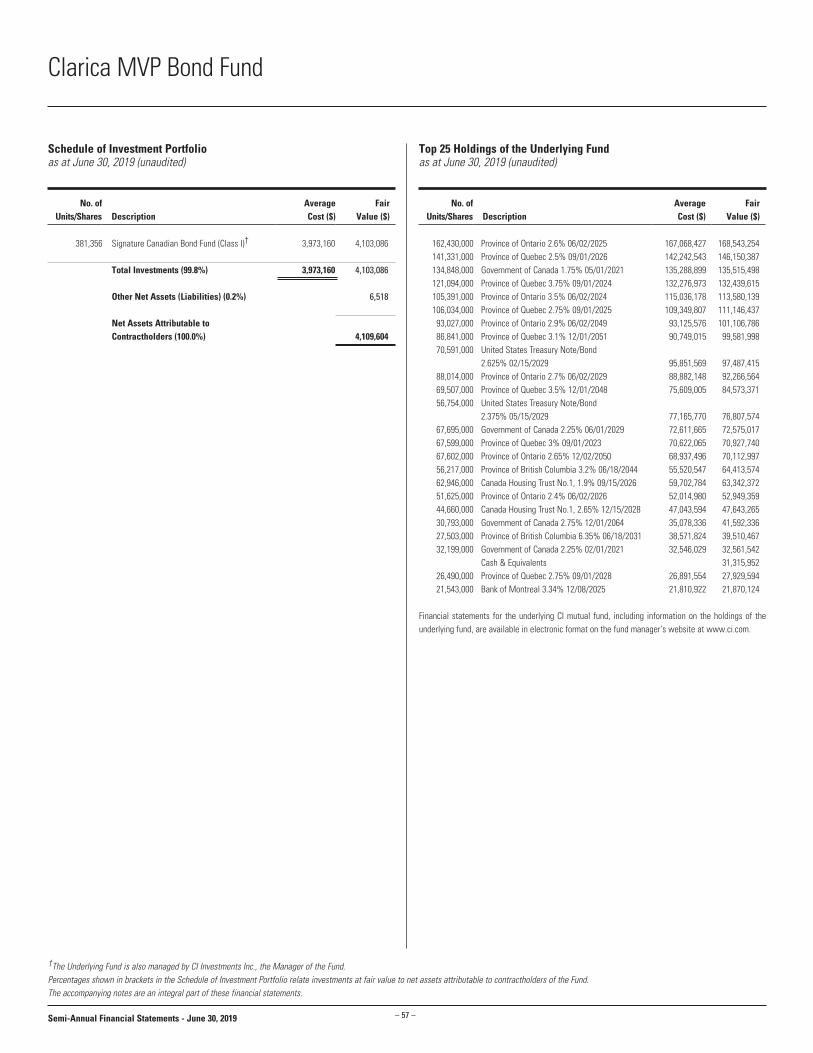
– 57 –Semi-Annual Financial Statements - June 30, 2019
Clarica MVP Bond Fund
Schedule of Investment Portfolioas at June 30, 2019 (unaudited)
No. ofUnits/Shares Description
AverageCost ($)
FairValue ($)
381,356 Signature Canadian Bond Fund (Class I)† 3,973,160 4,103,086
Total Investments (99.8%) 3,973,160 4,103,086 Other Net Assets (Liabilities) (0.2%) 6,518 Net Assets Attributable to Contractholders (100.0%) 4,109,604
Top 25 Holdings of the Underlying Fundas at June 30, 2019 (unaudited)
No. ofUnits/Shares Description
AverageCost ($)
FairValue ($)
162,430,000 Province of Ontario 2.6% 06/02/2025 167,068,427 168,543,254 141,331,000 Province of Quebec 2.5% 09/01/2026 142,242,543 146,150,387 134,848,000 Government of Canada 1.75% 05/01/2021 135,288,899 135,515,498 121,094,000 Province of Quebec 3.75% 09/01/2024 132,276,973 132,439,615 105,391,000 Province of Ontario 3.5% 06/02/2024 115,036,178 113,580,139 106,034,000 Province of Quebec 2.75% 09/01/2025 109,349,807 111,146,437 93,027,000 Province of Ontario 2.9% 06/02/2049 93,125,576 101,106,786 86,841,000 Province of Quebec 3.1% 12/01/2051 90,749,015 99,581,998 70,591,000 United States Treasury Note/Bond 2.625% 02/15/2029 95,851,569 97,487,415 88,014,000 Province of Ontario 2.7% 06/02/2029 88,882,148 92,266,564 69,507,000 Province of Quebec 3.5% 12/01/2048 75,609,005 84,573,371 56,754,000 United States Treasury Note/Bond 2.375% 05/15/2029 77,165,770 76,807,574 67,695,000 Government of Canada 2.25% 06/01/2029 72,611,665 72,575,017 67,599,000 Province of Quebec 3% 09/01/2023 70,622,065 70,927,740 67,602,000 Province of Ontario 2.65% 12/02/2050 68,937,496 70,112,997 56,217,000 Province of British Columbia 3.2% 06/18/2044 55,520,547 64,413,574 62,946,000 Canada Housing Trust No.1, 1.9% 09/15/2026 59,702,784 63,342,372 51,625,000 Province of Ontario 2.4% 06/02/2026 52,014,980 52,949,359 44,660,000 Canada Housing Trust No.1, 2.65% 12/15/2028 47,043,594 47,643,265 30,793,000 Government of Canada 2.75% 12/01/2064 35,078,336 41,592,336 27,503,000 Province of British Columbia 6.35% 06/18/2031 38,571,824 39,510,467 32,199,000 Government of Canada 2.25% 02/01/2021 32,546,029 32,561,542 Cash & Equivalents 31,315,952 26,490,000 Province of Quebec 2.75% 09/01/2028 26,891,554 27,929,594 21,543,000 Bank of Montreal 3.34% 12/08/2025 21,810,922 21,870,124
Financial statements for the underlying CI mutual fund, including information on the holdings of the underlying fund, are available in electronic format on the fund manager’s website at www.ci.com.
† The Underlying Fund is also managed by CI Investments Inc., the Manager of the Fund.Percentages shown in brackets in the Schedule of Investment Portfolio relate investments at fair value to net assets attributable to contractholders of the Fund. The accompanying notes are an integral part of these financial statements.
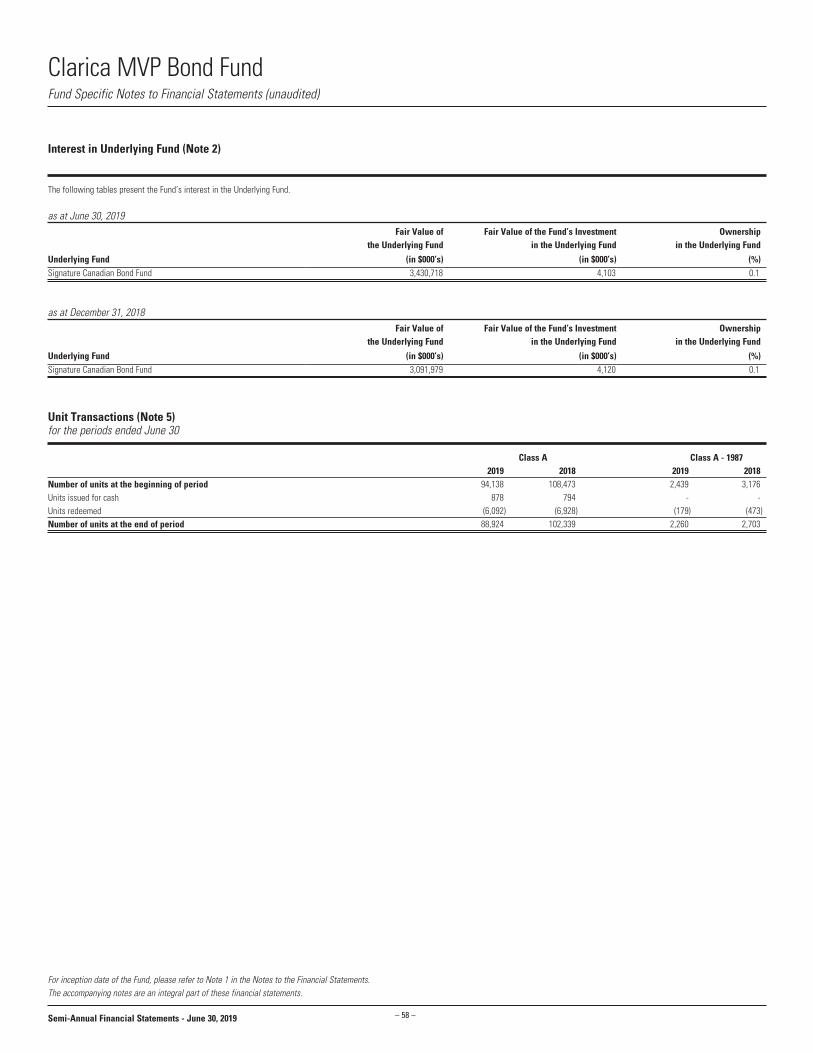
– 58 –Semi-Annual Financial Statements - June 30, 2019
Clarica MVP Bond FundFund Specific Notes to Financial Statements (unaudited)
Interest in Underlying Fund (Note 2)
The following tables present the Fund’s interest in the Underlying Fund.
as at June 30, 2019 Fair Value of
the Underlying FundFair Value of the Fund’s Investment
in the Underlying FundOwnership
in the Underlying Fund
Underlying Fund (in $000’s) (in $000’s) (%)Signature Canadian Bond Fund 3,430,718 4,103 0.1
as at December 31, 2018Fair Value of
the Underlying FundFair Value of the Fund’s Investment
in the Underlying FundOwnership
in the Underlying Fund
Underlying Fund (in $000’s) (in $000’s) (%)Signature Canadian Bond Fund 3,091,979 4,120 0.1
Unit Transactions (Note 5)for the periods ended June 30
Number of units at the beginning of periodUnits issued for cashUnits redeemed Number of units at the end of period
Class A Class A - 1987 2019 2018 2019 2018 94,138 108,473 2,439 3,176 878 794 - - (6,092) (6,928) (179) (473) 88,924 102,339 2,260 2,703
For inception date of the Fund, please refer to Note 1 in the Notes to the Financial Statements.The accompanying notes are an integral part of these financial statements.

– 59 –Semi-Annual Financial Statements - June 30, 2019
Clarica MVP Bond Fund
Financial Highlights The following tables show selected key financial information about the Fund and are intended to help you understand the Fund’s financial performance for the past six periods.
The Fund’s Net Asset Value per UnitNet assets attributable to contractholders per unit at the end of the period shown ($) (1)
Ratios and Supplemental DataNet assets ($000’s) (1)
Number of units outstanding (1)
Portfolio turnover rate (%) (2)
Management Expense RatioManagement expense ratio before taxes (%) (3)
Harmonized sales tax (%) (3)
Management expense ratio after taxes (%) (3)
Effective HST rate for the period (%) (3)
The Fund’s Net Asset Value per UnitNet assets attributable to contractholders per unit at the end of the period shown ($) (1)
Ratios and Supplemental DataNet assets ($000’s) (1)
Number of units outstanding (1)
Portfolio turnover rate (%) (2)
Management Expense RatioManagement expense ratio before taxes (%) (3)
Harmonized sales tax (%) (3)
Management expense ratio after taxes (%) (3)
Effective HST rate for the period (%) (3)
For inception date of the Fund, please refer to Note 1 in the Notes to the Financial Statements.The accompanying notes are an integral part of these financial statements.
Financial Information (for the period ended June 30, 2019 and the years ended December 31) (unaudited)
(1) This information is provided for the period ended June 30, 2019 and December 31 of the years shown.
(2) The Fund’s portfolio turnover rate indicates how actively the Fund’s portfolio advisor manages its portfolio investments. A portfolio turnover rate of 100% is equivalent to the Fund buying and selling all of the securities in its portfolio once in the
course of the period. The higher a fund’s portfolio turnover rate in a period, the greater the trading costs payable by the fund in the period, and the greater the chance of a contractholder receiving taxable capital gains in the period. There is not
necessarily a relationship between a high turnover rate and the performance of a fund.
(3) Management expense ratio is calculated based on expenses charged directly to the Fund plus, if applicable, expenses of the underlying fund, calculated on a weighted average basis on the percentage weighting of the underlying fund and is
expressed as an annualized percentage of average net assets for the periods shown. The Effective HST tax rate is calculated using the attribution percentage for each province based on contractholders’ residency and can be different from 13%.
Class A Jun. 30, 2019 Dec. 31, 2018 Dec. 31, 2017 Dec. 31, 2016 Dec. 31, 2015 Dec. 31, 2014
45.04 42.64 42.94 43.01 43.05 42.37
4,005 4,014 4,657 5,293 5,825 6,375 88,924 94,138 108,473 123,063 135,318 150,438 2.43 4.65 8.28 98.30 2.47 7.74
2.01 2.01 2.01 2.01 2.01 2.02 0.25 0.25 0.26 0.26 0.26 0.23 2.26 2.26 2.27 2.27 2.27 2.25 12.65 12.64 12.72 12.81 12.88 12.80
Class A - 1987 Jun. 30, 2019 Dec. 31, 2018 Dec. 31, 2017 Dec. 31, 2016 Dec. 31, 2015 Dec. 31, 2014
46.33 43.79 43.96 43.91 43.82 43.01
105 107 140 143 155 183 2,260 2,439 3,176 3,259 3,528 4,263 2.43 4.65 8.28 98.30 2.47 7.74
1.76 1.76 1.76 1.76 1.76 1.77 0.17 0.19 0.21 0.19 0.21 0.20 1.93 1.95 1.97 1.95 1.97 1.97 9.88 10.87 11.66 11.00 11.93 11.41
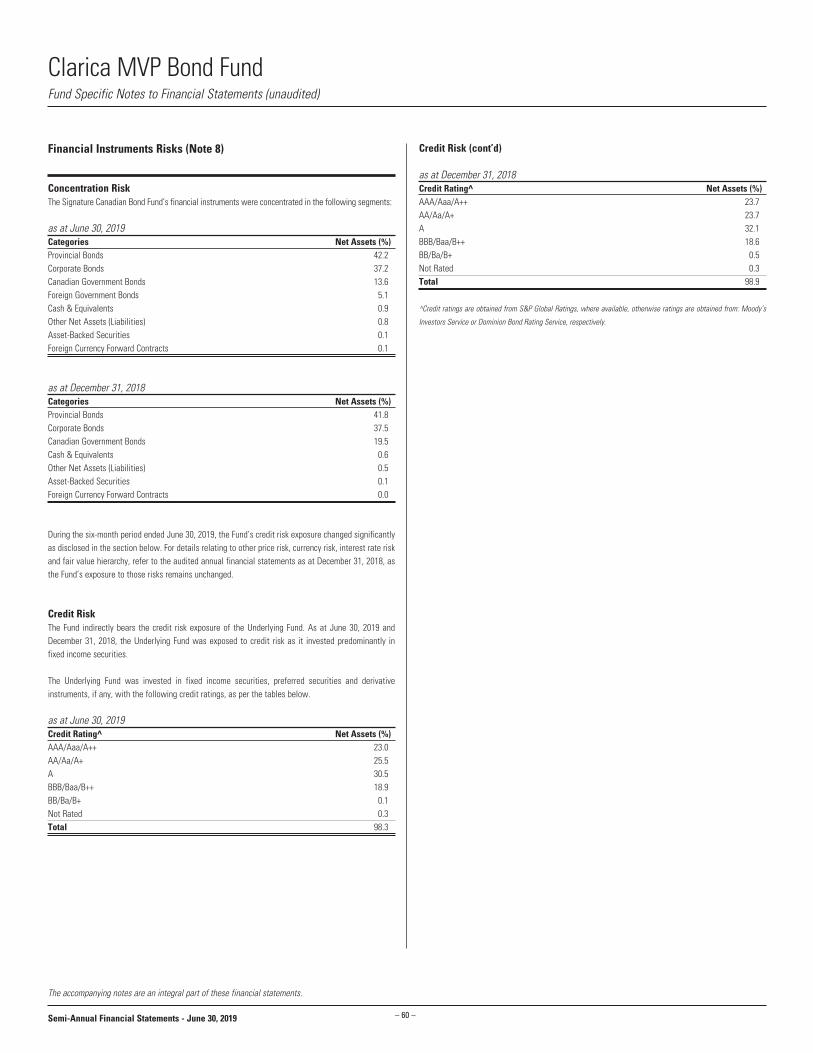
– 60 –Semi-Annual Financial Statements - June 30, 2019
Clarica MVP Bond Fund
The accompanying notes are an integral part of these financial statements.
Credit Risk (cont’d)
as at December 31, 2018Credit Rating^ Net Assets (%)AAA/Aaa/A++ 23.7 AA/Aa/A+ 23.7 A 32.1 BBB/Baa/B++ 18.6 BB/Ba/B+ 0.5 Not Rated 0.3 Total 98.9
^Credit ratings are obtained from S&P Global Ratings, where available, otherwise ratings are obtained from: Moody’s
Investors Service or Dominion Bond Rating Service, respectively.
Concentration RiskThe Signature Canadian Bond Fund’s financial instruments were concentrated in the following segments:
as at June 30, 2019Categories Net Assets (%)Provincial Bonds 42.2Corporate Bonds 37.2Canadian Government Bonds 13.6Foreign Government Bonds 5.1Cash & Equivalents 0.9Other Net Assets (Liabilities) 0.8Asset-Backed Securities 0.1Foreign Currency Forward Contracts 0.1
as at December 31, 2018Categories Net Assets (%)Provincial Bonds 41.8Corporate Bonds 37.5Canadian Government Bonds 19.5Cash & Equivalents 0.6Other Net Assets (Liabilities) 0.5Asset-Backed Securities 0.1Foreign Currency Forward Contracts 0.0
During the six-month period ended June 30, 2019, the Fund’s credit risk exposure changed significantly as disclosed in the section below. For details relating to other price risk, currency risk, interest rate risk and fair value hierarchy, refer to the audited annual financial statements as at December 31, 2018, as the Fund’s exposure to those risks remains unchanged.
Credit RiskThe Fund indirectly bears the credit risk exposure of the Underlying Fund. As at June 30, 2019 and December 31, 2018, the Underlying Fund was exposed to credit risk as it invested predominantly in fixed income securities.
The Underlying Fund was invested in fixed income securities, preferred securities and derivative instruments, if any, with the following credit ratings, as per the tables below.
as at June 30, 2019Credit Rating^ Net Assets (%)AAA/Aaa/A++ 23.0AA/Aa/A+ 25.5A 30.5BBB/Baa/B++ 18.9BB/Ba/B+ 0.1Not Rated 0.3Total 98.3
Fund Specific Notes to Financial Statements (unaudited)
Financial Instruments Risks (Note 8)
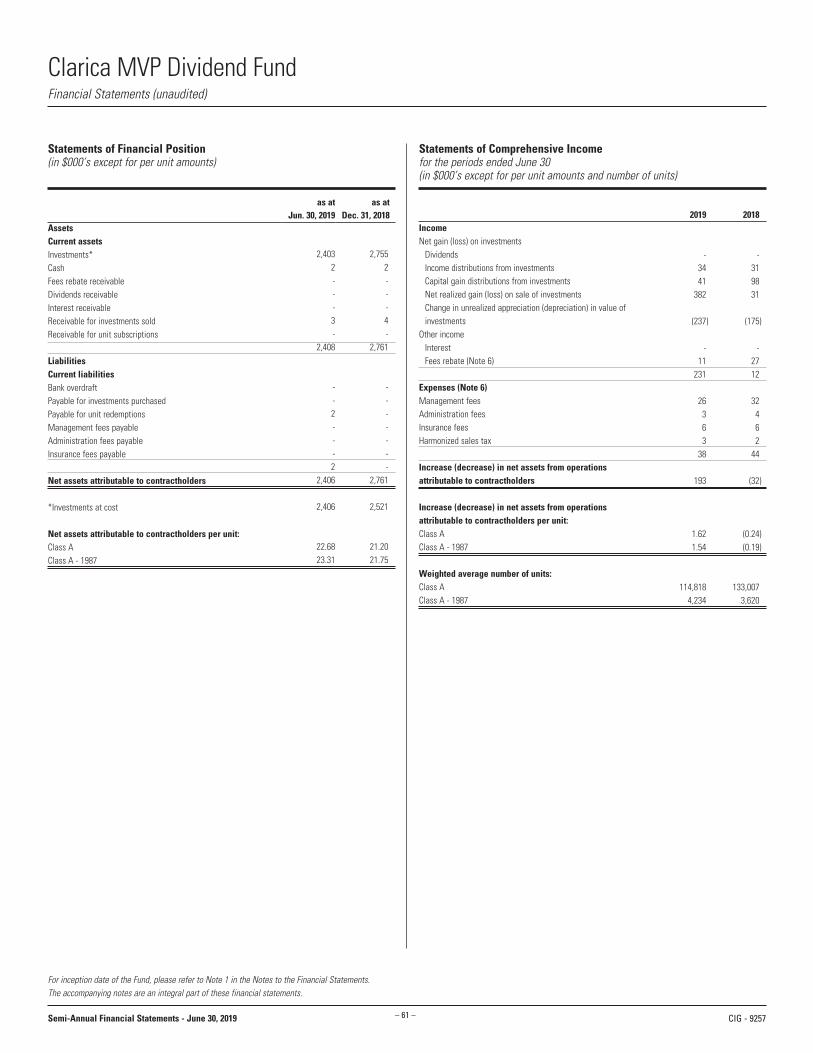
– 61 –Semi-Annual Financial Statements - June 30, 2019
Clarica MVP Dividend Fund
For inception date of the Fund, please refer to Note 1 in the Notes to the Financial Statements.The accompanying notes are an integral part of these financial statements.
Financial Statements (unaudited)
CIG - 9257
2019 2018
- - 34 31 41 98 382 31
(237) (175)
- - 11 27 231 12
26 32 3 4 6 6 3 2 38 44
193 (32)
1.62 (0.24) 1.54 (0.19)
114,818 133,007 4,234 3,620
as at as atJun. 30, 2019 Dec. 31, 2018
2,403 2,755 2 2 - - - - - - 3 4 - - 2,408 2,761
- - - - 2 - - - - - - - 2 - 2,406 2,761
2,406 2,521
22.68 21.20 23.31 21.75
Statements of Financial Position (in $000’s except for per unit amounts)
Statements of Comprehensive Income for the periods ended June 30 (in $000’s except for per unit amounts and number of units)
Assets Current assets Investments* Cash Fees rebate receivable Dividends receivable Interest receivable Receivable for investments sold Receivable for unit subscriptions
Liabilities Current liabilities Bank overdraft Payable for investments purchased Payable for unit redemptions Management fees payable Administration fees payable Insurance fees payable
Net assets attributable to contractholders
*Investments at cost
Net assets attributable to contractholders per unit: Class AClass A - 1987
Income Net gain (loss) on investments Dividends Income distributions from investments Capital gain distributions from investments Net realized gain (loss) on sale of investments Change in unrealized appreciation (depreciation) in value of
investments Other income Interest Fees rebate (Note 6)
Expenses (Note 6)Management fees Administration fees Insurance fees Harmonized sales tax
Increase (decrease) in net assets from operations attributable to contractholders
Increase (decrease) in net assets from operations attributable to contractholders per unit: Class AClass A - 1987
Weighted average number of units: Class AClass A - 1987

– 62 –Semi-Annual Financial Statements - June 30, 2019
Clarica MVP Dividend FundFinancial Statements (unaudited)
2019 2018
2,761 3,224
193 (32)
17 79 (565) (142) (548) (63)
2,406 3,129
FundNet assets attributable to contractholders at the beginning of period Increase (decrease) in net assets from operations attributable to contractholders Unit transactions Proceeds from issuance of units Amounts paid on redemption of units
Net assets attributable to contractholders at the end of period
Statements of Changes in Net Assets Attributable to Contractholdersfor the periods ended June 30 (in $000’s)
2019 2018
193 (32)
(382) (31)
237 175 3,340 161 (2,767) (126) (75) (129) - - - - - - - - - - - - 546 18
17 84 (563) (141) (546) (57)
- (39) 2 51 2 12
- - - - - - - -
Statements of Cash Flowsfor the periods ended June 30 (in $000’s)
Cash flows from (used in) operating activities Increase (decrease) in net assets from operations attributable to contractholders Adjustments for: Net realized (gain) loss on sale of investments Change in unrealized (appreciation) depreciation in value of
investments Proceeds from sale of investments Purchase of investments Non-cash distributions from investments (Increase) decrease in fees rebate receivable (Increase) decrease in dividends receivable (Increase) decrease in interest receivable Increase (decrease) in management fees payable Increase (decrease) in administration fees payable Increase (decrease) in insurance fees payable Net cash from (used in) operating activities
Cash flows from (used in) financing activities Proceeds from issuance of unitsAmounts paid on redemption of unitsNet cash from (used in) financing activities
Net increase (decrease) in cashCash (bank overdraft), beginning of periodCash (bank overdraft), end of period
Supplementary Information: Dividends received, net of withholding tax*Interest received*Dividends paid*Interest paid*
*Dividends and interest received as well as dividends and interest paid relate to operating activities of the Fund. The accompanying notes are an integral part of these financial statements.
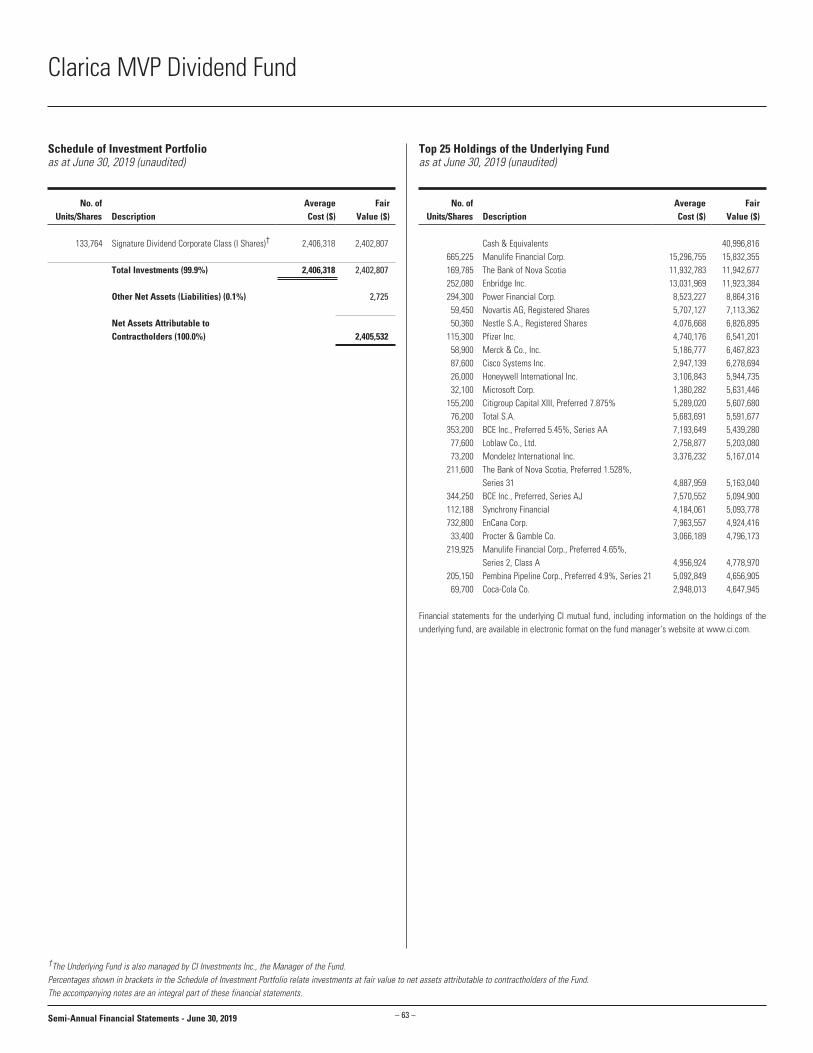
– 63 –Semi-Annual Financial Statements - June 30, 2019
Clarica MVP Dividend Fund
Schedule of Investment Portfolioas at June 30, 2019 (unaudited)
No. ofUnits/Shares Description
AverageCost ($)
FairValue ($)
133,764 Signature Dividend Corporate Class (I Shares)† 2,406,318 2,402,807
Total Investments (99.9%) 2,406,318 2,402,807 Other Net Assets (Liabilities) (0.1%) 2,725 Net Assets Attributable to Contractholders (100.0%) 2,405,532
Top 25 Holdings of the Underlying Fundas at June 30, 2019 (unaudited)
No. ofUnits/Shares Description
AverageCost ($)
FairValue ($)
Cash & Equivalents 40,996,816 665,225 Manulife Financial Corp. 15,296,755 15,832,355 169,785 The Bank of Nova Scotia 11,932,783 11,942,677 252,080 Enbridge Inc. 13,031,969 11,923,384 294,300 Power Financial Corp. 8,523,227 8,864,316 59,450 Novartis AG, Registered Shares 5,707,127 7,113,362 50,360 Nestle S.A., Registered Shares 4,076,668 6,826,895 115,300 Pfizer Inc. 4,740,176 6,541,201 58,900 Merck & Co., Inc. 5,186,777 6,467,823 87,600 Cisco Systems Inc. 2,947,139 6,278,694 26,000 Honeywell International Inc. 3,106,843 5,944,735 32,100 Microsoft Corp. 1,380,282 5,631,446 155,200 Citigroup Capital XIII, Preferred 7.875% 5,289,020 5,607,680 76,200 Total S.A. 5,683,691 5,591,677 353,200 BCE Inc., Preferred 5.45%, Series AA 7,193,649 5,439,280 77,600 Loblaw Co., Ltd. 2,758,877 5,203,080 73,200 Mondelez International Inc. 3,376,232 5,167,014 211,600 The Bank of Nova Scotia, Preferred 1.528%, Series 31 4,887,959 5,163,040 344,250 BCE Inc., Preferred, Series AJ 7,570,552 5,094,900 112,188 Synchrony Financial 4,184,061 5,093,778 732,800 EnCana Corp. 7,963,557 4,924,416 33,400 Procter & Gamble Co. 3,066,189 4,796,173 219,925 Manulife Financial Corp., Preferred 4.65%, Series 2, Class A 4,956,924 4,778,970 205,150 Pembina Pipeline Corp., Preferred 4.9%, Series 21 5,092,849 4,656,905 69,700 Coca-Cola Co. 2,948,013 4,647,945
Financial statements for the underlying CI mutual fund, including information on the holdings of the underlying fund, are available in electronic format on the fund manager’s website at www.ci.com.
† The Underlying Fund is also managed by CI Investments Inc., the Manager of the Fund.Percentages shown in brackets in the Schedule of Investment Portfolio relate investments at fair value to net assets attributable to contractholders of the Fund. The accompanying notes are an integral part of these financial statements.
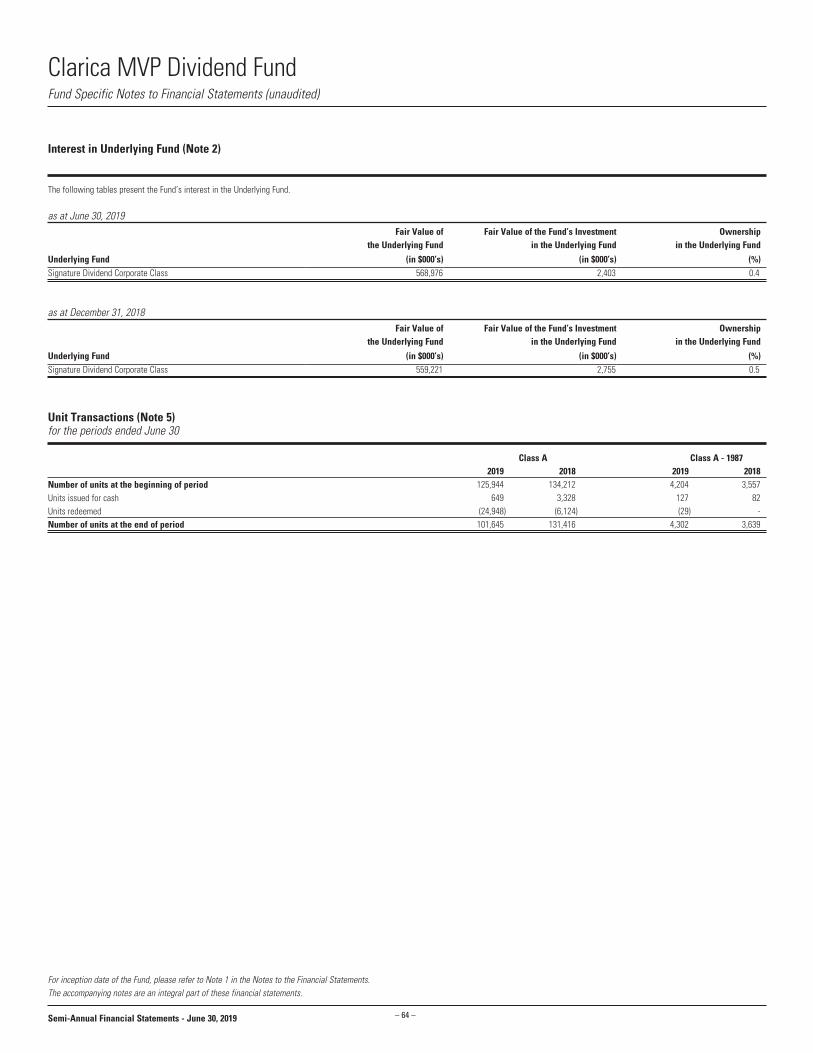
– 64 –Semi-Annual Financial Statements - June 30, 2019
Clarica MVP Dividend FundFund Specific Notes to Financial Statements (unaudited)
Interest in Underlying Fund (Note 2)
The following tables present the Fund’s interest in the Underlying Fund.
as at June 30, 2019 Fair Value of
the Underlying FundFair Value of the Fund’s Investment
in the Underlying FundOwnership
in the Underlying Fund
Underlying Fund (in $000’s) (in $000’s) (%)Signature Dividend Corporate Class 568,976 2,403 0.4
as at December 31, 2018Fair Value of
the Underlying FundFair Value of the Fund’s Investment
in the Underlying FundOwnership
in the Underlying Fund
Underlying Fund (in $000’s) (in $000’s) (%)Signature Dividend Corporate Class 559,221 2,755 0.5
For inception date of the Fund, please refer to Note 1 in the Notes to the Financial Statements.The accompanying notes are an integral part of these financial statements.
Unit Transactions (Note 5)for the periods ended June 30
Number of units at the beginning of periodUnits issued for cashUnits redeemed Number of units at the end of period
Class A Class A - 1987 2019 2018 2019 2018 125,944 134,212 4,204 3,557 649 3,328 127 82 (24,948) (6,124) (29) - 101,645 131,416 4,302 3,639

– 65 –Semi-Annual Financial Statements - June 30, 2019
Clarica MVP Dividend Fund
Financial Highlights The following tables show selected key financial information about the Fund and are intended to help you understand the Fund’s financial performance for the past six periods.
The Fund’s Net Asset Value per UnitNet assets attributable to contractholders per unit at the end of the period shown ($) (1)
Ratios and Supplemental DataNet assets ($000’s) (1)
Number of units outstanding (1)
Portfolio turnover rate (%) (2)
Management Expense RatioManagement expense ratio before taxes (%) (3)
Harmonized sales tax (%) (3)
Management expense ratio after taxes (%) (3)
Effective HST rate for the period (%) (3)
The Fund’s Net Asset Value per UnitNet assets attributable to contractholders per unit at the end of the period shown ($) (1)
Ratios and Supplemental DataNet assets ($000’s) (1)
Number of units outstanding (1)
Portfolio turnover rate (%) (2)
Management Expense RatioManagement expense ratio before taxes (%) (3)
Harmonized sales tax (%) (3)
Management expense ratio after taxes (%) (3)
Effective HST rate for the period (%) (3)
For inception date of the Fund, please refer to Note 1 in the Notes to the Financial Statements.The accompanying notes are an integral part of these financial statements.
Financial Information (for the period ended June 30, 2019 and the years ended December 31) (unaudited)
(1) This information is provided for the period ended June 30, 2019 and December 31 of the years shown.
(2) The Fund’s portfolio turnover rate indicates how actively the Fund’s portfolio advisor manages its portfolio investments. A portfolio turnover rate of 100% is equivalent to the Fund buying and selling all of the securities in its portfolio once in the
course of the period. The higher a fund’s portfolio turnover rate in a period, the greater the trading costs payable by the fund in the period, and the greater the chance of a contractholder receiving taxable capital gains in the period. There is not
necessarily a relationship between a high turnover rate and the performance of a fund.
(3) Management expense ratio is calculated based on expenses charged directly to the Fund plus, if applicable, expenses of the underlying fund, calculated on a weighted average basis on the percentage weighting of the underlying fund and is
expressed as an annualized percentage of average net assets for the periods shown. The Effective HST tax rate is calculated using the attribution percentage for each province based on contractholders’ residency and can be different from 13%.
Class A Jun. 30, 2019 Dec. 31, 2018 Dec. 31, 2017 Dec. 31, 2016 Dec. 31, 2015 Dec. 31, 2014
22.68 21.20 23.39 21.62 19.86 20.34
2,306 2,670 3,139 2,897 2,916 3,179 101,645 125,944 134,212 133,993 146,818 156,315 106.37 10.03 11.46 6.73 6.62 8.35
2.69 2.69 2.69 2.69 2.69 2.68 0.33 0.33 0.32 0.32 0.33 0.31 3.02 3.02 3.01 3.01 3.02 2.99 12.19 12.21 12.01 12.07 12.14 12.32
Class A - 1987 Jun. 30, 2019 Dec. 31, 2018 Dec. 31, 2017 Dec. 31, 2016 Dec. 31, 2015 Dec. 31, 2014
23.31 21.75 23.93 22.05 20.20 20.63
100 91 85 78 83 89 4,302 4,204 3,557 3,557 4,096 4,292 106.37 10.03 11.46 6.73 6.62 8.35
2.44 2.44 2.44 2.44 2.44 2.43 0.24 0.23 0.23 0.26 0.25 0.27 2.68 2.67 2.67 2.70 2.69 2.70 10.06 9.52 9.52 10.48 10.29 11.13

– 66 –Semi-Annual Financial Statements - June 30, 2019
Clarica MVP Dividend Fund
The accompanying notes are an integral part of these financial statements.
Credit RiskThe Fund indirectly bears the credit risk exposure of the Underlying Fund. As at June 30, 2019 and December 31, 2018, the Underlying Fund was exposed to credit risk as some of its assets were invested in fixed income securities, preferred securities and derivatives.
The Underlying Fund was invested in fixed income securities, preferred securities and derivative instruments, if any, with the following credit ratings, as per the tables below.
as at June 30, 2019Credit Rating^ Net Assets (%)AAA/Aaa/A++ 0.1AA/Aa/A+ 0.3A 8.3BBB/Baa/B++ 21.9BB/Ba/B+ 7.4B 0.2Not Rated 1.4 Total 39.6
as at December 31, 2018Credit Rating^ Net Assets (%)AAA/Aaa/A++ 0.1 AA/Aa/A+ 0.1 A 5.9 BBB/Baa/B++ 22.6 BB/Ba/B+ 7.9 Not Rated 1.2 Total 37.8
^Credit ratings are obtained from S&P Global Ratings, where available, otherwise ratings are obtained from: Moody’s
Investors Service or Dominion Bond Rating Service, respectively.
Interest Rate RiskAs at June 30, 2019 and December 31, 2018, the Fund indirectly bears the interest rate risk exposure of the Underlying Fund. As at June 30, 2019 and December 31, 2018, the Underlying Fund was exposed to interest rate risk as some of its assets were invested in fixed income securities.
The tables below summarize the Underlying Fund’s exposure to interest rate risk, categorized by the contractual maturity date.
as at June 30, 2019
Less than1 Year
1 - 3Years
3 - 5Years
Greaterthan
5 Years Total
(%) (%) (%) (%) (%)Interest Rate Exposure 7.2 - - 1.1 8.3
as at December 31, 2018
Less than1 Year
1 - 3Years
3 - 5Years
Greaterthan
5 Years Total
(%) (%) (%) (%) (%)Interest Rate Exposure 2.8 - - 0.3 3.1
Concentration RiskThe Signature Dividend Corporate Class’ financial instruments were concentrated in the following segments:
as at June 30, 2019Categories Net Assets (%)Long PositionsFinancials 38.3Energy 12.0Consumer Staples 7.9Cash & Equivalents 7.2Utilities 7.1Health Care 6.3Communication Services 4.8Industrials 4.2Information Technology 3.7Real Estate 2.3Materials 2.1Consumer Discretionary 1.7Corporate Bonds 1.1Other Net Assets (Liabilities) 1.0Foreign Currency Forward Contracts 0.3Total Long Positions 100.0
Short PositionsOption Contracts (0.0)Total Short Positions (0.0)
as at December 31, 2018Categories Net Assets (%)Financials 38.6Energy 13.7Consumer Staples 7.7Utilities 7.7Health Care 7.1Information Technology 5.2Industrials 4.6Telecommunication Services 4.4Materials 3.0Cash & Equivalents 2.8Consumer Discretionary 2.6Real Estate 1.9Other Net Assets (Liabilities) 1.0Corporate Bonds 0.3Fund(s) 0.0Foreign Currency Forward Contracts (0.6)
During the six-month period ended June 30, 2019, the Fund’s credit risk and interest rate risk exposure changed significantly as disclosed in the section below. For details relating to other price risk, currency risk and fair value hierarchy, refer to the audited annual financial statements as at December 31, 2018, as the Fund’s exposure to those risks remains unchanged.
Fund Specific Notes to Financial Statements (unaudited)
Financial Instruments Risks (Note 8)

– 67 –Semi-Annual Financial Statements - June 30, 2019
Clarica MVP Dividend Fund
The accompanying notes are an integral part of these financial statements.
Interest Rate Risk (cont’d)As at June 30, 2019, had the prevailing interest rates increased or decreased by 0.25% (December 31, 2018 - 0.25%), with all other variables held constant, net assets attributable to contractholders of the Fund would have indirectly decreased or increased, respectively, by approximately $3,000 (December 31, 2018 - a nominal amount). In practice, the actual results may differ from this analysis and the difference may be material.
Fund Specific Notes to Financial Statements (unaudited)

– 68 –Semi-Annual Financial Statements - June 30, 2019
Clarica MVP Money Market Fund
For inception date of the Fund, please refer to Note 1 in the Notes to the Financial Statements.The accompanying notes are an integral part of these financial statements.
Financial Statements (unaudited)
CIG - 9260
2019 2018
- - 10 7 - - - -
- -
1 - - - 11 7
4 4 1 1 2 1 1 1 8 7
3 -
- - 0.01 -
694,521 794,580 71,279 6,506
as at as atJun. 30, 2019 Dec. 31, 2018
856 810 4 - - - - - - - - 16 - - 860 826
- 13 - - - - - - - - - - - 13 860 813
856 810
1.23 1.23 1.27 1.26
Statements of Financial Position (in $000’s except for per unit amounts)
Statements of Comprehensive Income for the periods ended June 30 (in $000’s except for per unit amounts and number of units)
Assets Current assets Investments* Cash Fees rebate receivable Dividends receivable Interest receivable Receivable for investments sold Receivable for unit subscriptions
Liabilities Current liabilities Bank overdraft Payable for investments purchased Payable for unit redemptions Management fees payable Administration fees payable Insurance fees payable
Net assets attributable to contractholders
*Investments at cost
Net assets attributable to contractholders per unit: Class AClass A - 1987
Income Net gain (loss) on investments Dividends Income distributions from investments Capital gain distributions from investments Net realized gain (loss) on sale of investments Change in unrealized appreciation (depreciation) in value of
investments Other income Interest Fees rebate (Note 6)
Expenses (Note 6)Management fees Administration fees Insurance fees Harmonized sales tax
Increase (decrease) in net assets from operations attributable to contractholders
Increase (decrease) in net assets from operations attributable to contractholders per unit: Class AClass A - 1987
Weighted average number of units: Class AClass A - 1987

– 69 –Semi-Annual Financial Statements - June 30, 2019
Clarica MVP Money Market FundFinancial Statements (unaudited)
2019 2018
813 914
3 -
739 486 (695) (456) 44 30
860 944
FundNet assets attributable to contractholders at the beginning of period Increase (decrease) in net assets from operations attributable to contractholders Unit transactions Proceeds from issuance of units Amounts paid on redemption of units
Net assets attributable to contractholders at the end of period
Statements of Changes in Net Assets Attributable to Contractholdersfor the periods ended June 30 (in $000’s)
2019 2018
3 -
- -
- - 541 592 (561) (484) (10) (7) - - - - - (2) - - - - - - (27) 99
739 486 (695) (455) 44 31
17 130 (13) (128) 4 2
- - 1 - - - - -
Statements of Cash Flowsfor the periods ended June 30 (in $000’s)
Cash flows from (used in) operating activities Increase (decrease) in net assets from operations attributable to contractholders Adjustments for: Net realized (gain) loss on sale of investments Change in unrealized (appreciation) depreciation in value of
investments Proceeds from sale of investments Purchase of investments Non-cash distributions from investments (Increase) decrease in fees rebate receivable (Increase) decrease in dividends receivable (Increase) decrease in interest receivable Increase (decrease) in management fees payable Increase (decrease) in administration fees payable Increase (decrease) in insurance fees payable Net cash from (used in) operating activities
Cash flows from (used in) financing activities Proceeds from issuance of unitsAmounts paid on redemption of unitsNet cash from (used in) financing activities
Net increase (decrease) in cashCash (bank overdraft), beginning of periodCash (bank overdraft), end of period
Supplementary Information: Dividends received, net of withholding tax*Interest received*Dividends paid*Interest paid*
*Dividends and interest received as well as dividends and interest paid relate to operating activities of the Fund. The accompanying notes are an integral part of these financial statements.

– 70 –Semi-Annual Financial Statements - June 30, 2019
Clarica MVP Money Market Fund
Schedule of Investment Portfolioas at June 30, 2019 (unaudited)
No. ofUnits/Shares Description
AverageCost ($)
FairValue ($)
85,621 CI Money Market Fund (Class I)† 856,214 856,215
Total Investments (99.6%) 856,214 856,215 Other Net Assets (Liabilities) (0.4%) 3,543 Net Assets Attributable to Contractholders (100.0%) 859,758
Top 25 Holdings of the Underlying Fundas at June 30, 2019 (unaudited)
No. ofUnits/Shares Description
AverageCost ($)
FairValue ($)
65,476,000 Enbridge Pipelines Inc., 2.04438% 07/03/2019 65,377,131 65,472,323 Cash & Equivalents 63,951,013 26,439,000 TransCanada PipeLines Ltd., 1.91988% 07/24/2019 26,389,030 26,408,403 22,939,000 Canadian Imperial Bank of Commerce 2.50052% 11/01/2019 22,380,894 22,747,318 22,804,000 Manulife Bank of Canada 2.40007% 01/07/2020 22,273,807 22,520,606 22,473,000 Province of Alberta 1.74070% 09/10/2019 22,383,333 22,398,008 21,151,000 Province of British Columbia 1.74971% 07/17/2019 21,074,222 21,135,789 21,319,000 HSBC Bank Canada 2.25032% 02/26/2020 20,852,327 21,004,910 20,861,000 Inter Pipeline (Corridor) Inc., 2.00 110% 07/09/2019 20,758,572 20,852,999 20,984,000 Toronto-Dominion Bank 2.48051% 11/29/2019 20,477,446 20,770,136 20,978,000 Royal Bank of Canada 1.99982% 03/25/2020 20,573,334 20,671,089 20,735,000 HSBC Bank Canada 2.35042% 09/25/2019 20,262,657 20,621,526 20,547,000 The Bank of Nova Scotia 2.32962% 01/23/2020 20,086,747 20,278,116 20,159,000 National Bank of Canada 2.14977% 07/17/2019 19,742,717 20,141,188 20,000,000 Manulife Bank of Canada 2.2025% 01/27/2020 20,000,000 20,000,000 20,313,000 Royal Bank of Canada 1.96982% 04/21/2020 19,924,819 19,990,674 19,951,000 Bank of Montreal 1.90046% 06/01/2020 19,579,911 19,603,087 19,470,000 Province of Ontario 1.75918% 07/03/2019 19,390,562 19,469,061 19,070,000 Province of Ontario 1.76141% 07/31/2019 18,998,488 19,043,333 18,090,000 HSBC Bank Canada 2.18125% 07/10/2019 18,090,000 18,090,000 16,900,000 Enterprise Rent-A-Car Canada Ltd., 2.00057% 09/10/2019 16,825,302 16,835,178 16,661,000 First Banks, Inc., 1.80834% 08/15/2019 16,607,518 16,624,647 15,657,000 Suncor Energy Inc., 1.90953% 09/20/2019 15,582,003 15,591,112 15,221,000 Suncor Energy Inc., 1.95076% 08/21/2019 15,147,330 15,180,341 15,207,000 Province of Alberta 1.74946% 08/13/2019 15,146,020 15,176,378
Financial statements for the underlying CI mutual fund, including information on the holdings of the underlying fund, are available in electronic format on the fund manager’s website at www.ci.com.
† The Underlying Fund is also managed by CI Investments Inc., the Manager of the Fund.Percentages shown in brackets in the Schedule of Investment Portfolio relate investments at fair value to net assets attributable to contractholders of the Fund. The accompanying notes are an integral part of these financial statements.

– 71 –Semi-Annual Financial Statements - June 30, 2019
Clarica MVP Money Market FundFund Specific Notes to Financial Statements (unaudited)
Interest in Underlying Fund (Note 2)
The following tables present the Fund’s interest in the Underlying Fund.
as at June 30, 2019 Fair Value of
the Underlying FundFair Value of the Fund’s Investment
in the Underlying FundOwnership
in the Underlying Fund
Underlying Fund (in $000’s) (in $000’s) (%)CI Money Market Fund 738,146 856 0.1
as at December 31, 2018Fair Value of
the Underlying FundFair Value of the Fund’s Investment
in the Underlying FundOwnership
in the Underlying Fund
Underlying Fund (in $000’s) (in $000’s) (%)CI Money Market Fund 821,765 810 0.1
Unit Transactions (Note 5)for the periods ended June 30
Number of units at the beginning of periodUnits issued for cashUnits redeemed Number of units at the end of period
Class A Class A - 1987 2019 2018 2019 2018 654,625 738,413 6,506 6,506 481,625 396,994 116,033 - (451,243) (372,188) (110,497) - 685,007 763,219 12,042 6,506
For inception date of the Fund, please refer to Note 1 in the Notes to the Financial Statements.The accompanying notes are an integral part of these financial statements.
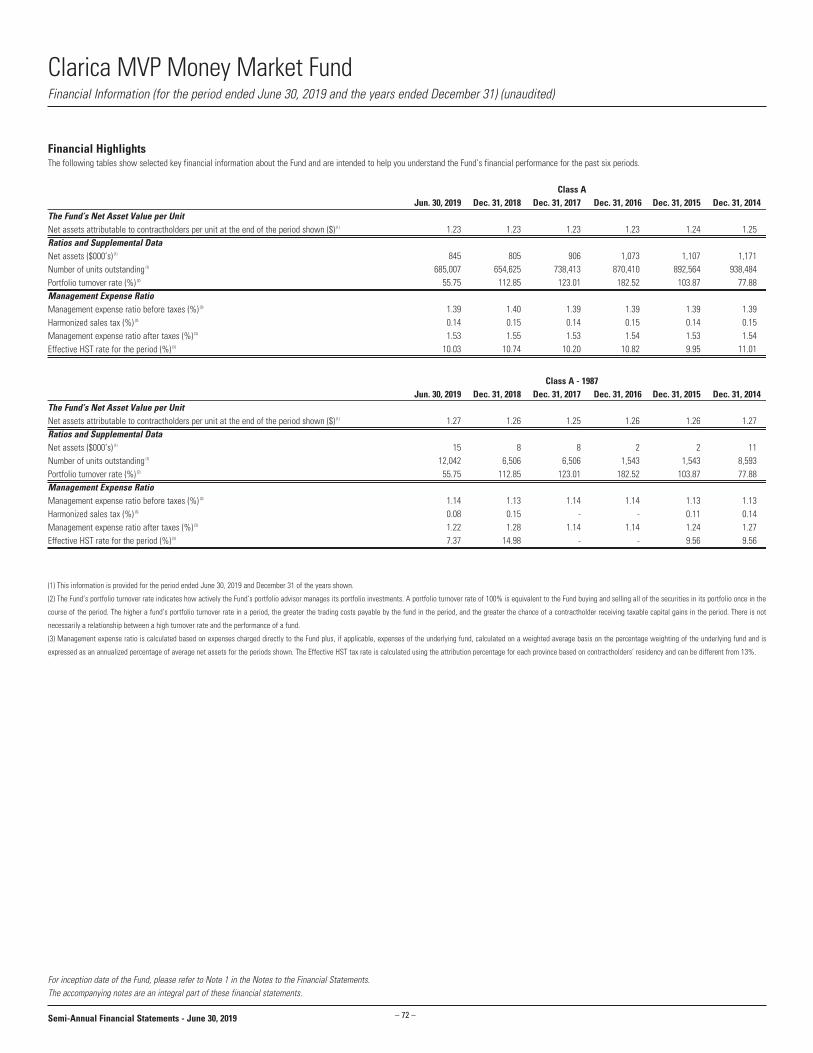
– 72 –Semi-Annual Financial Statements - June 30, 2019
Clarica MVP Money Market Fund
Financial Highlights The following tables show selected key financial information about the Fund and are intended to help you understand the Fund’s financial performance for the past six periods.
The Fund’s Net Asset Value per UnitNet assets attributable to contractholders per unit at the end of the period shown ($) (1)
Ratios and Supplemental DataNet assets ($000’s) (1)
Number of units outstanding (1)
Portfolio turnover rate (%) (2)
Management Expense RatioManagement expense ratio before taxes (%) (3)
Harmonized sales tax (%) (3)
Management expense ratio after taxes (%) (3)
Effective HST rate for the period (%) (3)
The Fund’s Net Asset Value per UnitNet assets attributable to contractholders per unit at the end of the period shown ($) (1)
Ratios and Supplemental DataNet assets ($000’s) (1)
Number of units outstanding (1)
Portfolio turnover rate (%) (2)
Management Expense RatioManagement expense ratio before taxes (%) (3)
Harmonized sales tax (%) (3)
Management expense ratio after taxes (%) (3)
Effective HST rate for the period (%) (3)
For inception date of the Fund, please refer to Note 1 in the Notes to the Financial Statements.The accompanying notes are an integral part of these financial statements.
Financial Information (for the period ended June 30, 2019 and the years ended December 31) (unaudited)
(1) This information is provided for the period ended June 30, 2019 and December 31 of the years shown.
(2) The Fund’s portfolio turnover rate indicates how actively the Fund’s portfolio advisor manages its portfolio investments. A portfolio turnover rate of 100% is equivalent to the Fund buying and selling all of the securities in its portfolio once in the
course of the period. The higher a fund’s portfolio turnover rate in a period, the greater the trading costs payable by the fund in the period, and the greater the chance of a contractholder receiving taxable capital gains in the period. There is not
necessarily a relationship between a high turnover rate and the performance of a fund.
(3) Management expense ratio is calculated based on expenses charged directly to the Fund plus, if applicable, expenses of the underlying fund, calculated on a weighted average basis on the percentage weighting of the underlying fund and is
expressed as an annualized percentage of average net assets for the periods shown. The Effective HST tax rate is calculated using the attribution percentage for each province based on contractholders’ residency and can be different from 13%.
Class A Jun. 30, 2019 Dec. 31, 2018 Dec. 31, 2017 Dec. 31, 2016 Dec. 31, 2015 Dec. 31, 2014
1.23 1.23 1.23 1.23 1.24 1.25
845 805 906 1,073 1,107 1,171 685,007 654,625 738,413 870,410 892,564 938,484 55.75 112.85 123.01 182.52 103.87 77.88
1.39 1.40 1.39 1.39 1.39 1.39 0.14 0.15 0.14 0.15 0.14 0.15 1.53 1.55 1.53 1.54 1.53 1.54 10.03 10.74 10.20 10.82 9.95 11.01
Class A - 1987 Jun. 30, 2019 Dec. 31, 2018 Dec. 31, 2017 Dec. 31, 2016 Dec. 31, 2015 Dec. 31, 2014
1.27 1.26 1.25 1.26 1.26 1.27
15 8 8 2 2 11 12,042 6,506 6,506 1,543 1,543 8,593 55.75 112.85 123.01 182.52 103.87 77.88
1.14 1.13 1.14 1.14 1.13 1.13 0.08 0.15 - - 0.11 0.14 1.22 1.28 1.14 1.14 1.24 1.27 7.37 14.98 - - 9.56 9.56

– 73 –Semi-Annual Financial Statements - June 30, 2019
Clarica MVP Money Market Fund
The accompanying notes are an integral part of these financial statements.
Concentration RiskThe CI Money Market Fund’s financial instruments were concentrated in the following segments:
as at June 30, 2019Categories Net Assets (%)Short-Term Investments 81.8Corporate Bonds 9.6Cash & Equivalents 8.7Other Net Assets (Liabilities) (0.1)
as at December 31, 2018Categories Net Assets (%)Short-Term Investments 76.7Cash & Equivalents 13.7Corporate Bonds 9.5Other Net Assets (Liabilities) 0.1
For details relating to credit risk, other price risk, currency risk, interest rate risk and fair value hierarchy, refer to the audited annual financial statements as at December 31, 2018, as the Fund’s exposure to those risks remains unchanged.
Fund Specific Notes to Financial Statements (unaudited)
Financial Instruments Risks (Note 8)

– 74 –Semi-Annual Financial Statements - June 30, 2019
Clarica MVP Segregated Funds
1. THE FUNDS
The following Clarica MVP Segregated Funds were created by a board resolution of Sun Life Assurance
Company of Canada (“Sun Life”) or its predecessor; Clarica Life Insurance Company (“Clarica”) on the
dates as indicated below:
Funds Date
Clarica MVP Asian-Pacific Non-RSP Equity Fund July 1, 1997
Clarica MVP Asian-Pacific RSP Equity Fund December 31, 1996
Clarica MVP Balanced Fund December 31, 1986
Clarica MVP Bond Fund December 31, 1986
Clarica MVP Dividend Fund December 31, 1997
Clarica MVP Equity Fund December 31, 1986
Clarica MVP Global Equity Fund December 31, 1996
Clarica MVP Growth Fund December 14, 1992
Clarica MVP International Fund December 31, 1997
Clarica MVP Money Market Fund January 1, 1988
Clarica MVP Small Cap American Fund December 31, 1997
Clarica MVP U.S. Equity Fund December 14, 1992
(the “Fund” or collectively the “Funds” or the “Clarica MVP Segregated Funds”)
Sun Life, a wholly owned subsidiary of Sun Life Financial Inc., is the sole issuer of the individual
variable insurance contract providing for investment in each Fund. The assets of each of the Funds are
owned by Sun Life and are segregated from Sun Life’s other assets. The Funds are not separate legal
entities but are separate reporting entities.
Sun Life has appointed CI Investments Inc. (“CI” or the “Manager”) to perform certain administrative
and management services on its behalf in relation to the Funds and the contracts. The head office
of CI Investments Inc. is located at 2 Queen Street East, Twentieth Floor, M5C 3G7, Toronto, Ontario.
CI Investments Inc. is a subsidiary of CI Financial Corp.
On May 29, 2009, Sun Life and the Manager introduced changes to the Funds whereby certain contract
holders in the Funds were switched to a new class of units based on their contract date. Accordingly,
contracts issued between January 1, 1987 and December 31, 1992 inclusive were switched to a new
class of units effective July 10, 2009, known as Class A - 1987.
These financial statements were authorized for issue by the Manager on September 27, 2019.
The Statements of Financial Position are as at June 30, 2019 and December 31, 2018. The Statements
of Comprehensive Income, Statements of Changes in Net Assets Attributable to Contractholders
and Statements of Cash Flows are for the periods ended June 30, 2019 and 2018. Schedules of
Investment Portfolio are as at June 30, 2019. The Fund Specific Notes to Financial Statements
for each Fund consist of Interest in Underlying Fund as at June 30, 2019 and December 31, 2018,
Unit Transactions for the periods ended June 30, 2019 and 2018, and Financial Instruments Risks as
at June 30, 2019 and December 31, 2018.
2. SIGNIFICANT ACCOUNTING POLICIES
These financial statements have been prepared in compliance with International Financial Reporting
Standards as published by the International Accounting Standards Board (“IFRS”). The following is a
summary of the significant accounting policies of the Fund:
a. Classification and recognition of financial instruments
Investment funds held by the Funds are classified as FVTPL in accordance with IFRS 9. Purchases
and sales of financial assets are recognized at their trade date. The Funds’ obligations for net
assets attributable to holders of redeemable units are presented at the redemption amount, which
approximates their fair value. All other financial assets and liabilities are measured at amortized cost,
which approximates their fair value. Under this method, financial assets and liabilities reflect the
amount required to be received or paid, discounted, when appropriate, at the effective rate of interest.
b. Fair value of financial investments
At the financial reporting date, listed securities are valued based on the last traded market price
for financial assets and financial liabilities where the last traded price falls within the day’s bid-ask
spread. In circumstances where the last traded price is not within the bid-ask spread, the Manager
determines the point within the bid-ask spread that is most representative of fair value based on the
existing market conditions. Unlisted securities are valued based on price quotations received from
recognized investment dealers, or failing that, their fair value is determined by the Manager on the
basis of the latest reported information available. Underlying Funds are valued on each business day
at their net asset value as reported by the Underlying Funds’ manager.
c. Cash
Cash is comprised of cash on deposit. Bank overdraft are shown in current liabilities in the Statements
of Financial Position.
d. Cost of investments
Cost of investments represents the amount paid for each security and is determined on an average
cost basis.
e. Investment transactions
Investment transactions are accounted for on the trade date. Realized gains and losses on sales of
investments and unrealized appreciation or depreciation in value of investments are calculated on an
average cost basis.
f. Income recognition
Distributions from investments are recorded on the ex-distribution date and interest income is accrued
on a daily basis.
Distributions received from investment fund holdings are recognized by the Funds in the same form in
which they were received from the Underlying Funds.
g. Foreign exchange
The Funds’ subscriptions and redemptions are denominated in Canadian dollars, which is also the
Funds’ functional and presentation currency.
h. Net asset value per unit
Net asset value (“NAV”) per unit for each class is calculated at the end of each day on which the
Toronto Stock Exchange is open for business by dividing the total net asset value of each class by its
outstanding units.
The total net asset value of each class is computed by calculating the value of that class’ proportionate
share of the Fund’s assets less that class’ proportionate share of the Fund’s common liabilities and
class specific liabilities. Expenses directly attributable to a class are charged to that class. Income
and other expenses are allocated to each class proportionately based upon the relative total net asset
value of each class to the total net asset value of the Fund.
Notes to the Financial Statements (unaudited)
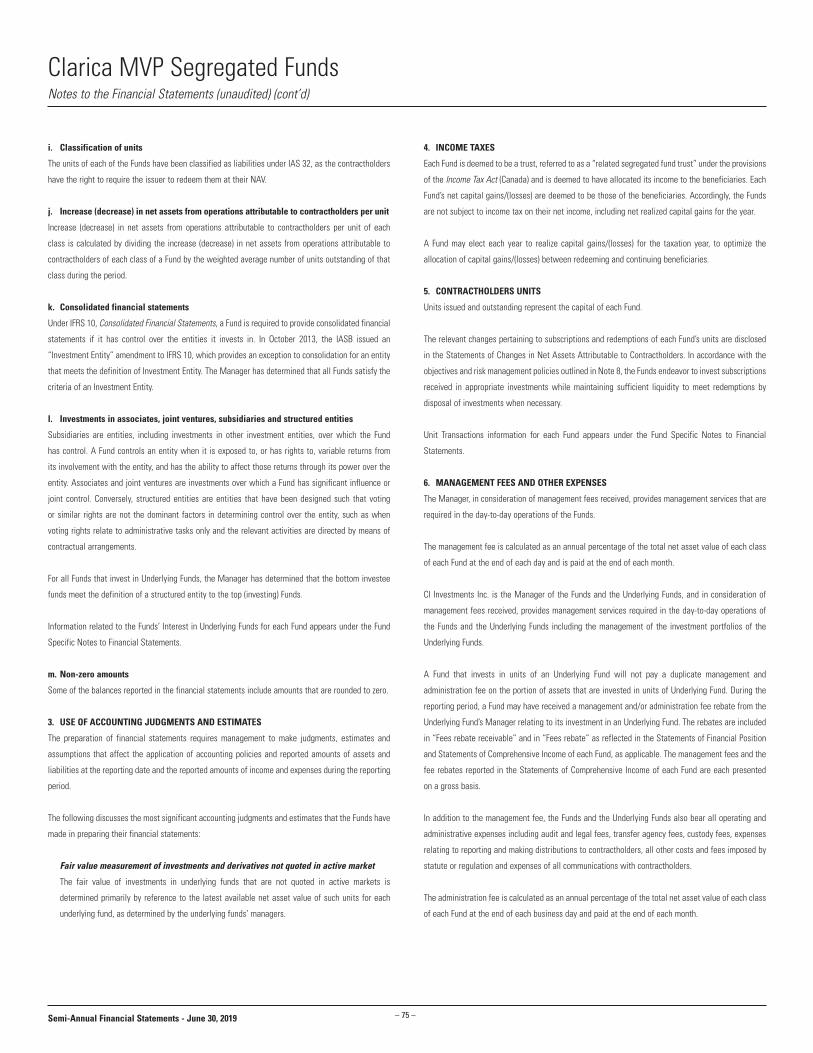
– 75 –Semi-Annual Financial Statements - June 30, 2019
Clarica MVP Segregated Funds
i. Classification of units
The units of each of the Funds have been classified as liabilities under IAS 32, as the contractholders
have the right to require the issuer to redeem them at their NAV.
j. Increase (decrease) in net assets from operations attributable to contractholders per unit
Increase (decrease) in net assets from operations attributable to contractholders per unit of each
class is calculated by dividing the increase (decrease) in net assets from operations attributable to
contractholders of each class of a Fund by the weighted average number of units outstanding of that
class during the period.
k. Consolidated financial statements
Under IFRS 10, Consolidated Financial Statements, a Fund is required to provide consolidated financial
statements if it has control over the entities it invests in. In October 2013, the IASB issued an
“Investment Entity” amendment to IFRS 10, which provides an exception to consolidation for an entity
that meets the definition of Investment Entity. The Manager has determined that all Funds satisfy the
criteria of an Investment Entity.
l. Investments in associates, joint ventures, subsidiaries and structured entities
Subsidiaries are entities, including investments in other investment entities, over which the Fund
has control. A Fund controls an entity when it is exposed to, or has rights to, variable returns from
its involvement with the entity, and has the ability to affect those returns through its power over the
entity. Associates and joint ventures are investments over which a Fund has significant influence or
joint control. Conversely, structured entities are entities that have been designed such that voting
or similar rights are not the dominant factors in determining control over the entity, such as when
voting rights relate to administrative tasks only and the relevant activities are directed by means of
contractual arrangements.
For all Funds that invest in Underlying Funds, the Manager has determined that the bottom investee
funds meet the definition of a structured entity to the top (investing) Funds.
Information related to the Funds’ Interest in Underlying Funds for each Fund appears under the Fund
Specific Notes to Financial Statements.
m. Non-zero amounts
Some of the balances reported in the financial statements include amounts that are rounded to zero.
3. USE OF ACCOUNTING JUDGMENTS AND ESTIMATES
The preparation of financial statements requires management to make judgments, estimates and
assumptions that affect the application of accounting policies and reported amounts of assets and
liabilities at the reporting date and the reported amounts of income and expenses during the reporting
period.
The following discusses the most significant accounting judgments and estimates that the Funds have
made in preparing their financial statements:
Fair value measurement of investments and derivatives not quoted in active market
The fair value of investments in underlying funds that are not quoted in active markets is
determined primarily by reference to the latest available net asset value of such units for each
underlying fund, as determined by the underlying funds’ managers.
4. INCOME TAXES
Each Fund is deemed to be a trust, referred to as a “related segregated fund trust” under the provisions
of the Income Tax Act (Canada) and is deemed to have allocated its income to the beneficiaries. Each
Fund’s net capital gains/(losses) are deemed to be those of the beneficiaries. Accordingly, the Funds
are not subject to income tax on their net income, including net realized capital gains for the year.
A Fund may elect each year to realize capital gains/(losses) for the taxation year, to optimize the
allocation of capital gains/(losses) between redeeming and continuing beneficiaries.
5. CONTRACTHOLDERS UNITS
Units issued and outstanding represent the capital of each Fund.
The relevant changes pertaining to subscriptions and redemptions of each Fund’s units are disclosed
in the Statements of Changes in Net Assets Attributable to Contractholders. In accordance with the
objectives and risk management policies outlined in Note 8, the Funds endeavor to invest subscriptions
received in appropriate investments while maintaining sufficient liquidity to meet redemptions by
disposal of investments when necessary.
Unit Transactions information for each Fund appears under the Fund Specific Notes to Financial
Statements.
6. MANAGEMENT FEES AND OTHER EXPENSES
The Manager, in consideration of management fees received, provides management services that are
required in the day-to-day operations of the Funds.
The management fee is calculated as an annual percentage of the total net asset value of each class
of each Fund at the end of each day and is paid at the end of each month.
CI Investments Inc. is the Manager of the Funds and the Underlying Funds, and in consideration of
management fees received, provides management services required in the day-to-day operations of
the Funds and the Underlying Funds including the management of the investment portfolios of the
Underlying Funds.
A Fund that invests in units of an Underlying Fund will not pay a duplicate management and
administration fee on the portion of assets that are invested in units of Underlying Fund. During the
reporting period, a Fund may have received a management and/or administration fee rebate from the
Underlying Fund’s Manager relating to its investment in an Underlying Fund. The rebates are included
in “Fees rebate receivable” and in “Fees rebate” as reflected in the Statements of Financial Position
and Statements of Comprehensive Income of each Fund, as applicable. The management fees and the
fee rebates reported in the Statements of Comprehensive Income of each Fund are each presented
on a gross basis.
In addition to the management fee, the Funds and the Underlying Funds also bear all operating and
administrative expenses including audit and legal fees, transfer agency fees, custody fees, expenses
relating to reporting and making distributions to contractholders, all other costs and fees imposed by
statute or regulation and expenses of all communications with contractholders.
The administration fee is calculated as an annual percentage of the total net asset value of each class
of each Fund at the end of each business day and paid at the end of each month.
Notes to the Financial Statements (unaudited) (cont’d)

– 76 –Semi-Annual Financial Statements - June 30, 2019
Clarica MVP Segregated Funds
The Funds pay an insurance fee to Sun Life. The insurance fee of each class of the Fund is a charge by
Sun Life for the applicable Guarantee Option in respect of that Fund Class. The insurance fees payable
at period-end are included in the “Insurance fees payable” in the Statements of Financial Position,
while insurance fees expense for the period are included in the “Insurance fees” in the Statements
of Comprehensive Income.
7. RELATED PARTY TRANSACTIONS
A Fund may invest in an Underlying Fund that is also managed by CI Investments Inc., the Manager
of the Funds. For details refer to the Fund Specific Notes to Financial Statements or the Schedule of
Investment Portfolio of each Fund.
The management fees paid to CI Investments Inc. are also considered a related party transaction. For
more details refer to Note 6.
8. FINANCIAL INSTRUMENTS RISK
Risk management
The Funds invest in units of Underlying Funds and are exposed to a variety of financial instruments
risks: credit risk, liquidity risk and market risk (including other price risk, currency risk and interest rate
risk). The level of risk to which each Fund is exposed depends on the investment objective and the
type of investments held by the Underlying Funds. The value of investments within an Underlying Fund
portfolio can fluctuate daily as a result of changes in prevailing interest rates, economic and market
conditions and company specific news related to investments held by the Underlying Fund and this will
affect the value of each of the Funds. The Manager of the Underlying Funds may minimize potential
adverse effects of these risks by, but not limited to, regular monitoring of the Underlying Funds’
positions and market events, diversification of the investment portfolio by asset type, country, sector,
term to maturity within the constraints of the stated objectives, and through the usage of derivatives
to hedge certain risk exposures.
Concentration risk
Concentration risk arises as a result of the concentration of exposures within the same category,
whether it is a geographical allocation, asset type, industry sector or counterparty.
Details of each of the Funds’ exposure to concentration risk are available in the Fund Specific Notes
to Financial Statements.
Credit risk
Credit risk is the risk that a security issuer or counterparty to a financial instrument will fail to meet
its financial obligations. The fair value of a debt instrument includes consideration of the credit
worthiness of the debt issuer. The carrying amount of debt instruments represents the credit risk
exposure of each Underlying Fund. Credit risk exposure for derivative instruments is based on each
Underlying Fund’s unrealized gain on the contractual obligations with the counterparty as at the
reporting date. The credit risk exposure of the Funds’ other assets are represented by their carrying
amount as disclosed in the Statements of Financial Position.
The Credit rating of the Sun Life as at June 30, 2019 was AA (December 31, 2018 – AA-).
Liquidity risk
Liquidity risk is the risk that a Fund may not be able to settle or meet its obligations, on time or at a
reasonable price. The Funds are exposed to daily cash redemptions of redeemable units. The Funds
invest all of their assets in Underlying Funds which can be readily disposed of.
Market risk
The Funds’ investments are subject to market risk which is the risk that the fair value of future cash
flows of a financial instrument will fluctuate due to changes in market conditions.
Other Price Risk
Other price risk is the risk that the value of financial instruments will fluctuate as a result of
changes in market prices (other than those arising from currency risk or interest rate risk). The value
of each investment is influenced by the outlook of the issuer and by general economic and political
conditions, as well as industry and market trends. All securities present a risk of loss of capital.
Other assets and liabilities are monetary items that are short-term in nature and therefore are not
subject to other price risk.
Currency Risk
Currency risk arises from financial instruments that are denominated in a currency other than
Canadian dollars, the functional currency of the Funds and the Underlying Funds. As a result, the
Underlying Funds may be exposed to the risk that the value of securities denominated in other
currencies will fluctuate due to changes in exchange rates. Equities traded in foreign markets are
also exposed to currency risk as the prices denominated in foreign currencies are converted to
Underlying Funds’ functional currency to determine their fair value.
Interest Rate Risk
Interest rate risk is the risk that the fair value of interest-bearing investments will fluctuate due
to changes in prevailing levels of market interest rates. As a result, the value of the Underlying
Funds that invest in debt securities and/or income trusts will be affected by changes in applicable
interest rates. If interest rates fall, the fair value of existing debt securities may increase due to the
increase in yield. Alternatively, if interest rates rise, the yield of existing debt securities decrease
which may then lead to a decrease in their fair value. The magnitude of the decline will generally
be greater for long-term debt securities than for short-term debt securities.
Interest rate risk also applies to convertible securities. The fair value of these securities varies
inversely with interest rates, similar to other debt securities. However, since they may be converted
into common shares, convertible securities are generally less affected by interest rate fluctuations
than other debt securities.
The Funds exposure to interest rate sensitivity on short-term interest bearing investments is
minimal due to their short-term nature.
Fair value hierarchy
The Funds are required to classify financial instruments measured at fair value using a fair value
hierarchy. Investments whose values are based on quoted market prices in active markets are
classified as Level 1. This level includes publicly traded equities, exchange-traded and retail mutual
funds, exchange-traded warrants, futures contracts and traded options.
Financial instruments that trade in markets that are not considered to be active, but are valued based
on quoted market prices, dealer quotations or alternative pricing sources supported by observable
inputs are classified as Level 2. These include fixed-income securities, mortgage-backed securities
(“MBS”), short-term instruments, non-traded warrants, over-the-counter options, structured notes of
indexed securities, if applicable, foreign currency forward contracts and swap instruments.
Notes to the Financial Statements (unaudited) (cont’d)
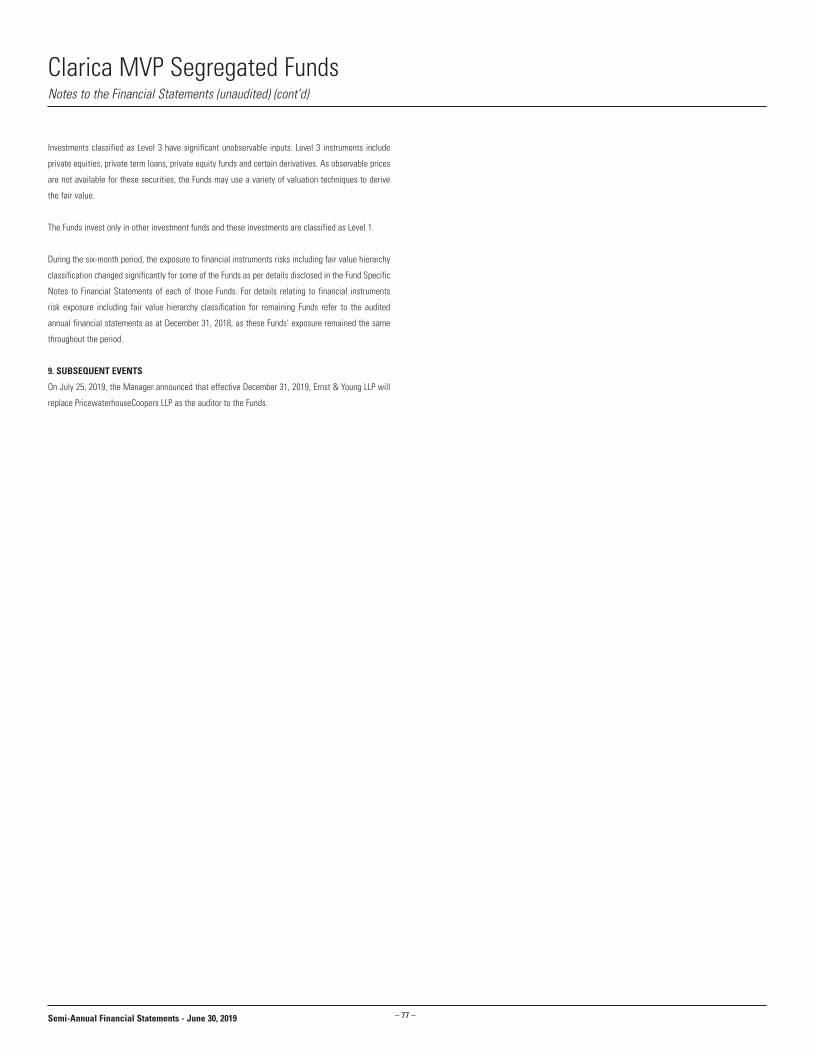
– 77 –Semi-Annual Financial Statements - June 30, 2019
Clarica MVP Segregated Funds
Investments classified as Level 3 have significant unobservable inputs. Level 3 instruments include
private equities, private term loans, private equity funds and certain derivatives. As observable prices
are not available for these securities, the Funds may use a variety of valuation techniques to derive
the fair value.
The Funds invest only in other investment funds and these investments are classified as Level 1.
During the six-month period, the exposure to financial instruments risks including fair value hierarchy
classification changed significantly for some of the Funds as per details disclosed in the Fund Specific
Notes to Financial Statements of each of those Funds. For details relating to financial instruments
risk exposure including fair value hierarchy classification for remaining Funds refer to the audited
annual financial statements as at December 31, 2018, as these Funds’ exposure remained the same
throughout the period.
9. SUBSEQUENT EVENTS
On July 25, 2019, the Manager announced that effective December 31, 2019, Ernst & Young LLP will
replace PricewaterhouseCoopers LLP as the auditor to the Funds.
Notes to the Financial Statements (unaudited) (cont’d)

– 78 –Semi-Annual Financial Statements - June 30, 2019
Clarica MVP Segregated Funds
You can get additional copies of these Financial Statements at your request, and at no cost, by calling
1-800-792-9374, by emailing [email protected], or by asking your representative.
Sun Life Assurance Company of Canada, a member of the Sun Life Financial group of companies,
is the sole issuer of the individual variable insurance contracts providing for investment in Clarica
MVP Segregated Funds. A description of the key features of the individual variable insurance contract
is contained in the Information Folder. SUBJECT TO ANY APPLICABLE DEATH AND MATURITY
GUARANTEES, ANY AMOUNT THAT IS ALLOCATED TO A SEGREGATED FUND IS INVESTED
AT THE RISK OF THE CONTRACTHOLDER(S) AND MAY INCREASE OR DECREASE IN VALUE.
Certain names, words, phrases, graphics or designs in this document may constitute trade
names, registered or unregistered trademarks or service marks of CI Investments Inc. CI Financial,
CI Investments, and the CI Investments design are registered trademarks of CI Investments Inc.
Clarica is a registered trademark of Sun Life Assurance Company of Canada. Trusted Partner in
Wealth is a trademark of CI Investments Inc.
INFORMATION FOLDER: CI would be pleased to provide, without charge, the most recent
Information Folder upon request by calling 1-800-792-9374 or emailing [email protected].
Legal Notice

MVP_SA_09/19E
2 Queen Street East, Twentieth Floor, Toronto, Ontario M5C 3G7 I www.ci.comHead Office / Toronto416-364-1145 1-800-268-9374
Calgary 403-205-43961-800-776-9027
Montreal 514-875-0090 1-800-268-1602
Vancouver 604-681-3346 1-800-665-6994
Client Services English: 1-800-792-9355 French: 1-800-668-3528
Sun Life Assurance Company of Canada
227 King Street SouthP.O. Box 1601 STN WaterlooWaterloo, Ontario N2J 4C5