semester teaching analysis report fy 2013-2014
TRANSCRIPT

TTEEXXAASS AA&&MM UUNNIIVVEERRSSIITTYY
SSEEMMEESSTTEERR TTEEAACCHHIINNGG AANNAALLYYSSIISS RREEPPOORRTT FFYY 22001133--22001144
Prepared by Office of Data and Research Services
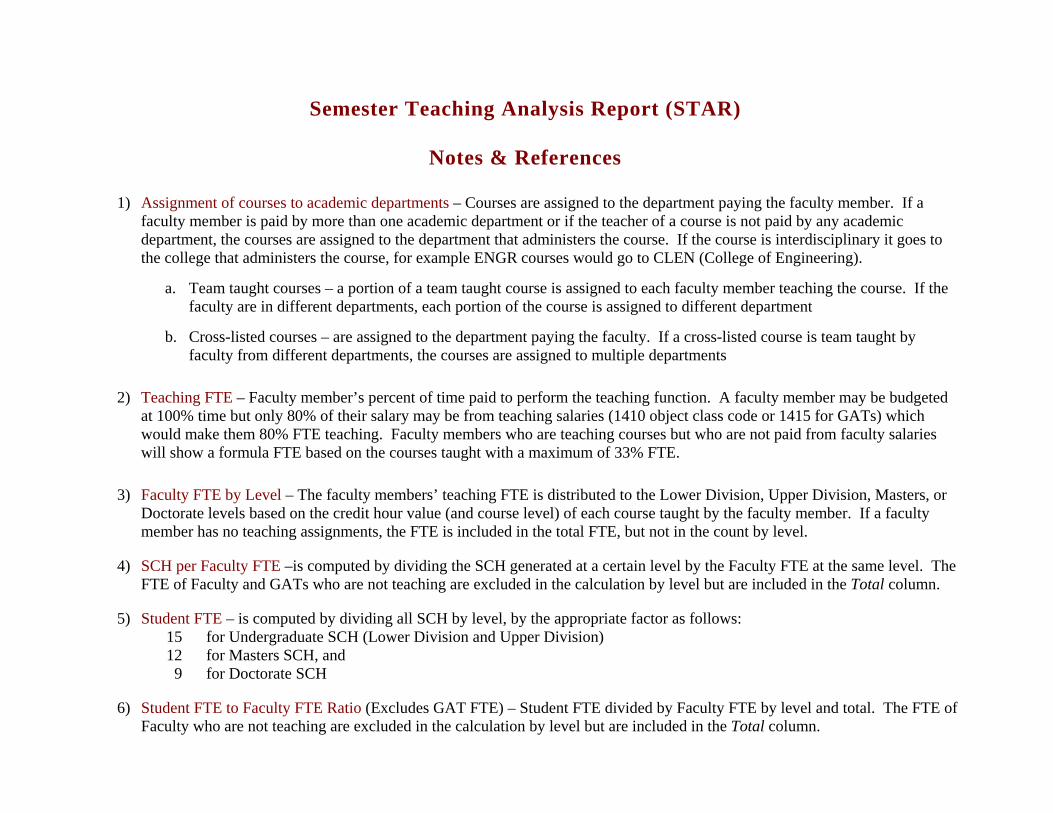
Semester Teaching Analysis Report (STAR)
Notes & References
1) Assignment of courses to academic departments – Courses are assigned to the department paying the faculty member. If a faculty member is paid by more than one academic department or if the teacher of a course is not paid by any academic department, the courses are assigned to the department that administers the course. If the course is interdisciplinary it goes to the college that administers the course, for example ENGR courses would go to CLEN (College of Engineering).
a. Team taught courses – a portion of a team taught course is assigned to each faculty member teaching the course. If the faculty are in different departments, each portion of the course is assigned to different department
b. Cross-listed courses – are assigned to the department paying the faculty. If a cross-listed course is team taught by faculty from different departments, the courses are assigned to multiple departments
2) Teaching FTE – Faculty member’s percent of time paid to perform the teaching function. A faculty member may be budgeted at 100% time but only 80% of their salary may be from teaching salaries (1410 object class code or 1415 for GATs) which would make them 80% FTE teaching. Faculty members who are teaching courses but who are not paid from faculty salaries will show a formula FTE based on the courses taught with a maximum of 33% FTE.
3) Faculty FTE by Level – The faculty members’ teaching FTE is distributed to the Lower Division, Upper Division, Masters, or Doctorate levels based on the credit hour value (and course level) of each course taught by the faculty member. If a faculty member has no teaching assignments, the FTE is included in the total FTE, but not in the count by level.
4) SCH per Faculty FTE –is computed by dividing the SCH generated at a certain level by the Faculty FTE at the same level. The FTE of Faculty and GATs who are not teaching are excluded in the calculation by level but are included in the Total column.
5) Student FTE – is computed by dividing all SCH by level, by the appropriate factor as follows: 15 for Undergraduate SCH (Lower Division and Upper Division) 12 for Masters SCH, and 9 for Doctorate SCH
6) Student FTE to Faculty FTE Ratio (Excludes GAT FTE) – Student FTE divided by Faculty FTE by level and total. The FTE of Faculty who are not teaching are excluded in the calculation by level but are included in the Total column.
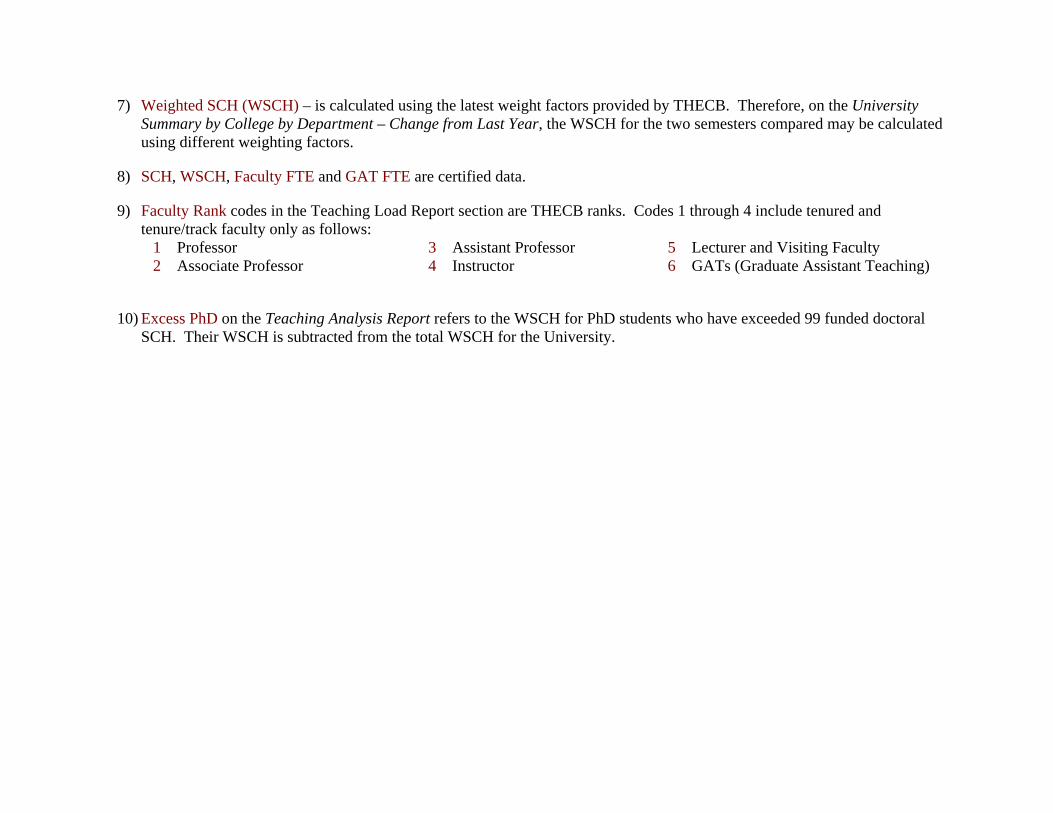
7) Weighted SCH (WSCH) – is calculated using the latest weight factors provided by THECB. Therefore, on the University Summary by College by Department – Change from Last Year, the WSCH for the two semesters compared may be calculated using different weighting factors.
8) SCH, WSCH, Faculty FTE and GAT FTE are certified data.
9) Faculty Rank codes in the Teaching Load Report section are THECB ranks. Codes 1 through 4 include tenured and tenure/track faculty only as follows:
1 Professor 3 Assistant Professor 5 Lecturer and Visiting Faculty 2 Associate Professor 4 Instructor 6 GATs (Graduate Assistant Teaching)
10) Excess PhD on the Teaching Analysis Report refers to the WSCH for PhD students who have exceeded 99 funded doctoral SCH. Their WSCH is subtracted from the total WSCH for the University.
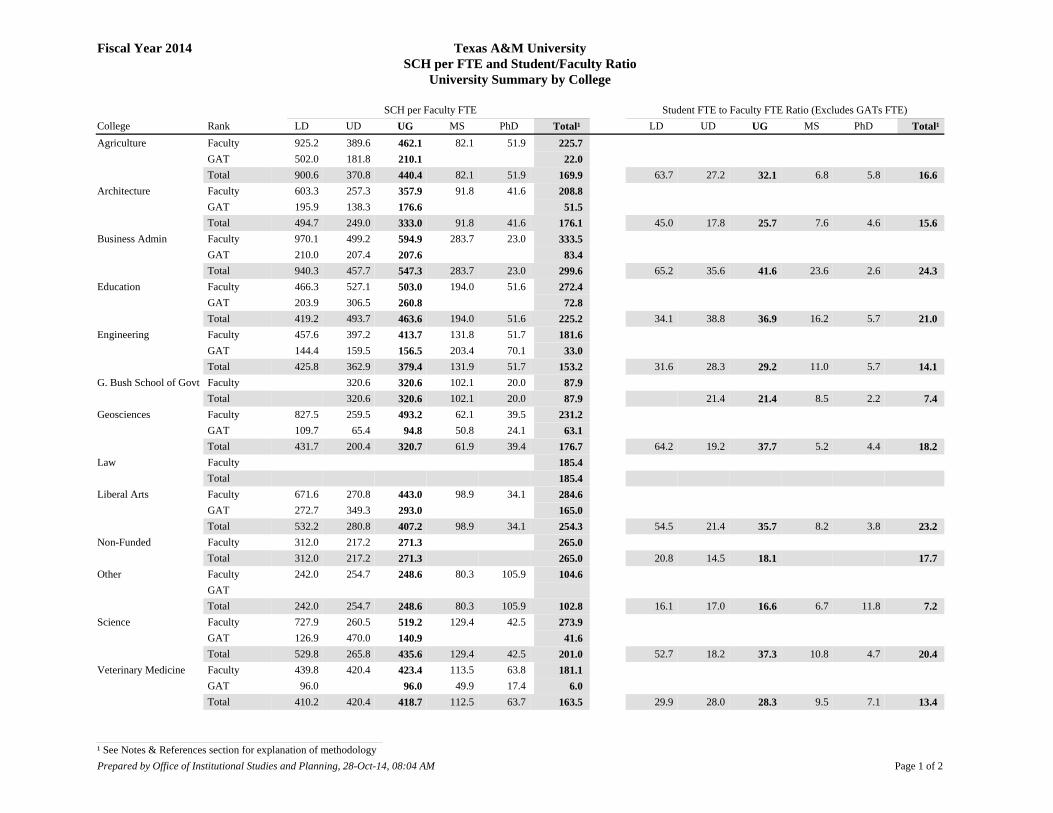
Total¹ Total¹College Rank LD UD UG MSSCH per Faculty FTE
Texas A&M UniversitySCH per FTE and Student/Faculty Ratio
University Summary by College
Fiscal Year 2014
PhD LD UD UG MSStudent FTE to Faculty FTE Ratio (Excludes GATs FTE)
PhD225.7FacultyAgriculture 925.2 389.6 462.1 82.1 51.922.0GAT 502.0 181.8 210.1
169.9 16.6Total 900.6 370.8 440.4 82.1 51.9 63.7 27.2 32.1 6.8 5.8208.8FacultyArchitecture 603.3 257.3 357.9 91.8 41.651.5GAT 195.9 138.3 176.6
176.1 15.6Total 494.7 249.0 333.0 91.8 41.6 45.0 17.8 25.7 7.6 4.6333.5FacultyBusiness Admin 970.1 499.2 594.9 283.7 23.083.4GAT 210.0 207.4 207.6
299.6 24.3Total 940.3 457.7 547.3 283.7 23.0 65.2 35.6 41.6 23.6 2.6272.4FacultyEducation 466.3 527.1 503.0 194.0 51.672.8GAT 203.9 306.5 260.8
225.2 21.0Total 419.2 493.7 463.6 194.0 51.6 34.1 38.8 36.9 16.2 5.7181.6FacultyEngineering 457.6 397.2 413.7 131.8 51.733.0GAT 144.4 159.5 156.5 203.4 70.1
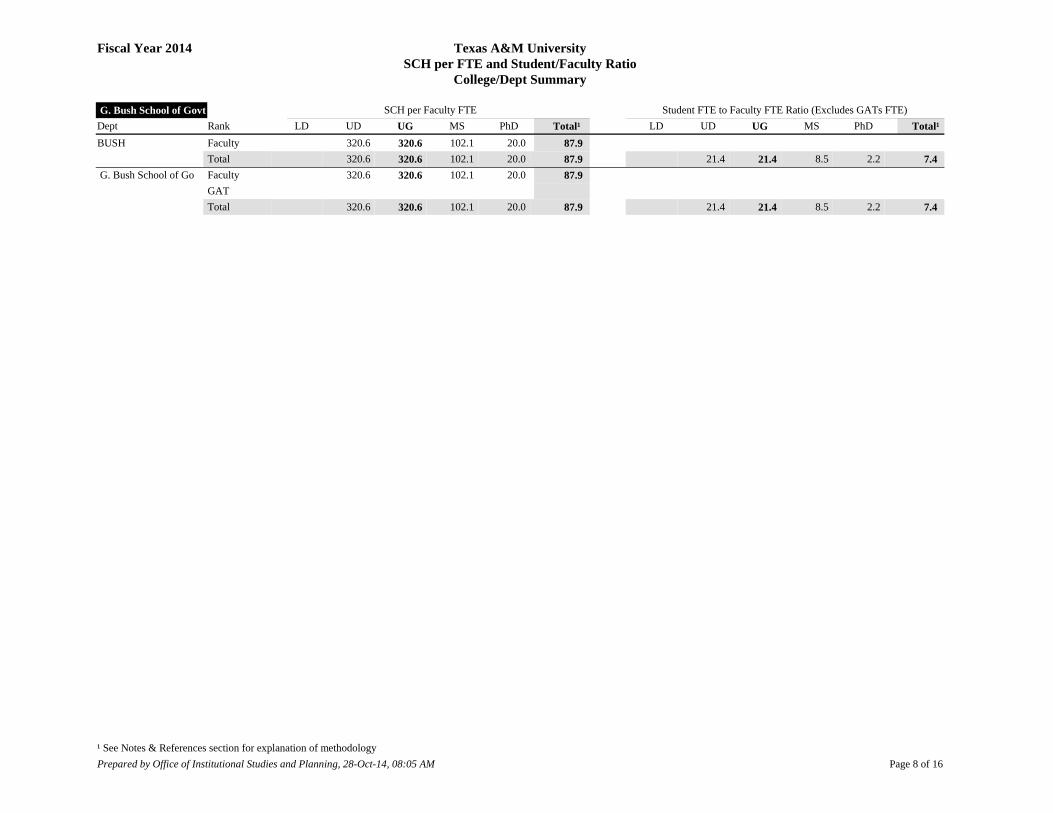
153.2 14.1Total 425.8 362.9 379.4 131.9 51.7 31.6 28.3 29.2 11.0 5.787.9FacultyG. Bush School of Govt 320.6 320.6 102.1 20.087.9 7.4Total 320.6 320.6 102.1 20.0 21.4 21.4 8.5 2.2
231.2FacultyGeosciences 827.5 259.5 493.2 62.1 39.563.1GAT 109.7 65.4 94.8 50.8 24.1
176.7 18.2Total 431.7 200.4 320.7 61.9 39.4 64.2 19.2 37.7 5.2 4.4185.4FacultyLaw 185.4 Total 284.6FacultyLiberal Arts 671.6 270.8 443.0 98.9 34.1165.0GAT 272.7 349.3 293.0 254.3 23.2Total 532.2 280.8 407.2 98.9 34.1 54.5 21.4 35.7 8.2 3.8265.0FacultyNon-Funded 312.0 217.2 271.3 265.0 17.7Total 312.0 217.2 271.3 20.8 14.5 18.1 104.6FacultyOther 242.0 254.7 248.6 80.3 105.9
GAT 102.8 7.2Total 242.0 254.7 248.6 80.3 105.9 16.1 17.0 16.6 6.7 11.8273.9FacultyScience 727.9 260.5 519.2 129.4 42.541.6GAT 126.9 470.0 140.9
201.0 20.4Total 529.8 265.8 435.6 129.4 42.5 52.7 18.2 37.3 10.8 4.7181.1FacultyVeterinary Medicine 439.8 420.4 423.4 113.5 63.8
6.0GAT 96.0 96.0 49.9 17.4163.5 13.4Total 410.2 420.4 418.7 112.5 63.7 29.9 28.0 28.3 9.5 7.1
Prepared by Office of Institutional Studies and Planning, 28-Oct-14, 08:04 AM Page 1 of 2¹ See Notes & References section for explanation of methodology
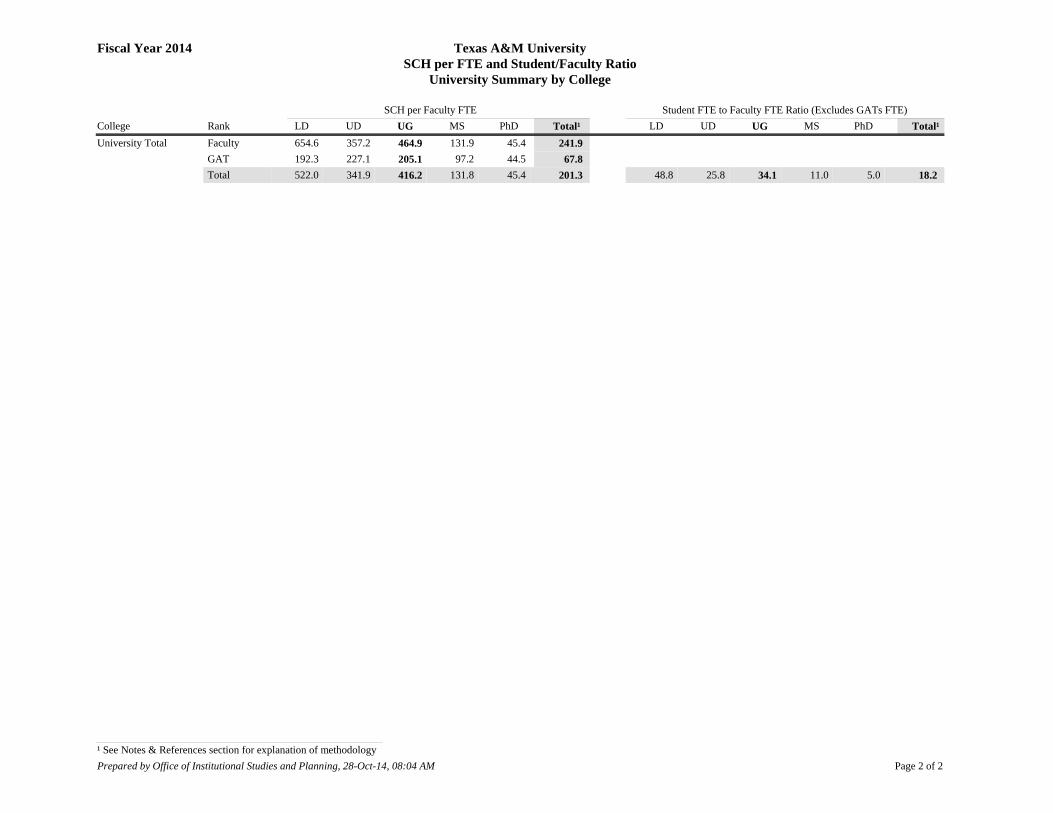
Total¹ Total¹College Rank LD UD UG MSSCH per Faculty FTE
Texas A&M UniversitySCH per FTE and Student/Faculty Ratio
University Summary by College
Fiscal Year 2014
PhD LD UD UG MSStudent FTE to Faculty FTE Ratio (Excludes GATs FTE)
PhDUniversity Total
Total 201.3522.0 341.9 416.2 131.8 45.4 18.248.8 25.8 34.1 11.0 5.0GAT 67.8192.3 227.1 205.1 97.2 44.5Faculty 241.9654.6 357.2 464.9 131.9 45.4
Prepared by Office of Institutional Studies and Planning, 28-Oct-14, 08:04 AM Page 2 of 2¹ See Notes & References section for explanation of methodology

Total¹ Total¹Dept Rank LD UD UG MSSCH per Faculty FTE
Texas A&M UniversitySCH per FTE and Student/Faculty Ratio
College/Dept Summary
Fiscal Year 2014
PhD LD UD UG MSStudent FTE to Faculty FTE Ratio (Excludes GATs FTE)
PhDAgriculture
282.7FacultyAGEC 1,093.5 466.9 551.0 142.3 62.915.4GAT 308.3 308.3
187.9 20.5Total 1,093.5 456.2 536.7 142.3 62.9 72.9 32.6 38.0 11.9 7.0250.6FacultyALEC 741.6 328.0 365.4 116.9 53.063.2GAT 126.0 116.0 116.3
205.9 18.8Total 701.2 278.9 310.8 116.9 53.0 50.0 24.2 26.5 9.7 5.9290.9FacultyANSC 1,186.9 492.1 619.4 67.5 49.725.4GAT 249.7 249.7
199.8 21.0Total 1,186.9 460.0 578.3 67.5 49.7 79.1 35.4 43.4 5.6 5.5154.1FacultyBAEN 268.1 417.0 389.8 51.7 47.4
GAT 121.8 11.2Total 268.1 417.0 389.8 51.7 47.4 17.9 27.8 26.0 4.3 5.3183.6FacultyBCBP 268.7 342.7 340.7 103.2 58.6
GAT 137.4 13.5Total 268.7 342.7 340.7 103.2 58.6 17.9 22.8 22.7 8.6 6.5
FacultyCLAG Total
337.8FacultyENTO 1,188.3 681.9 781.6 75.0 70.516.3GAT 564.0 564.0
217.6 24.6Total 1,071.1 681.9 772.2 75.0 70.5 87.9 45.5 53.8 6.3 7.8205.6FacultyESSM 1,498.2 473.1 575.5 100.7 53.9
GAT 167.8 14.9Total 1,498.2 473.1 575.5 100.7 53.9 99.9 31.5 38.4 8.4 6.0203.4FacultyHRSC 721.6 453.3 523.6 62.7 33.4
GAT 159.5 14.3Total 721.6 453.3 523.6 62.7 33.4 48.1 30.2 34.9 5.2 3.7321.5FacultyNFSC 1,171.7 249.9 536.5 65.4 42.0
GAT 233.7 22.0Total 1,171.7 249.9 536.5 65.4 42.0 78.1 16.7 35.8 5.5 4.7187.5FacultyPLPM 2,105.5 260.0 328.2 68.9 52.3
GAT 141.1 13.5Total 2,105.5 260.0 328.2 68.9 52.3 140.4 17.3 21.9 5.7 5.8237.9FacultyPOSC 876.4 444.1 517.6 74.8 54.7
GAT 196.3 17.0Total 876.4 444.1 517.6 74.8 54.7 58.4 29.6 34.5 6.2 6.1205.2FacultyRPTS 434.6 337.9 351.9 93.6 31.881.8GAT 544.0 229.8 285.5
Prepared by Office of Institutional Studies and Planning, 28-Oct-14, 08:05 AM Page 1 of 16¹ See Notes & References section for explanation of methodology

Total¹ Total¹Dept Rank LD UD UG MSSCH per Faculty FTE
Texas A&M UniversitySCH per FTE and Student/Faculty Ratio
College/Dept Summary
Fiscal Year 2014
PhD LD UD UG MSStudent FTE to Faculty FTE Ratio (Excludes GATs FTE)
PhDAgriculture
163.1 17.1Total 462.7 314.8 337.3 93.6 31.8 41.5 26.7 28.8 7.8 3.5186.8FacultySCSC 525.0 555.4 549.9 79.5 71.6
GAT 150.0 14.0Total 525.0 555.4 549.9 79.5 71.6 35.0 37.0 36.7 6.6 8.0141.1FacultyWFSC 2,968.3 321.0 406.6 59.0 42.8
2.5GAT 91.8 91.8 106.2 10.5Total 2,968.3 313.0 396.0 59.0 42.8 197.9 21.6 27.3 4.9 4.8
Agriculture
Total 169.9900.6 370.8 440.4 82.1 51.9 16.663.7 27.2 32.1 6.8 5.8GAT 22.0502.0 181.8 210.1 Faculty 225.7925.2 389.6 462.1 82.1 51.9
Prepared by Office of Institutional Studies and Planning, 28-Oct-14, 08:05 AM Page 2 of 16¹ See Notes & References section for explanation of methodology

Total¹ Total¹Dept Rank LD UD UG MSSCH per Faculty FTE
Texas A&M UniversitySCH per FTE and Student/Faculty Ratio
College/Dept Summary
Fiscal Year 2014
PhD LD UD UG MSStudent FTE to Faculty FTE Ratio (Excludes GATs FTE)
PhDArchitecture
230.4FacultyARCH 585.7 347.1 460.2 100.5 43.933.4GAT 315.3 46.0 296.4
188.6 17.0Total 551.2 344.1 448.9 100.5 43.9 42.1 23.2 32.2 8.4 4.9115.5FacultyCLAR 113.5 113.5 137.9
GAT 96.0 7.9Total 113.5 113.5 137.9 7.6 7.6 11.5
261.9FacultyCOSC 663.3 325.5 388.6 75.7 95.9GAT 233.9 105.6 192.8
238.6 18.9Total 522.9 314.5 365.5 75.7 51.8 22.1 27.6 6.3 130.3FacultyLAUP 621.9 187.6 253.4 113.0 38.593.3GAT 149.1 150.0 149.6
125.3 10.8Total 400.5 181.4 229.5 113.0 38.5 50.2 14.5 19.9 9.4 4.3234.6FacultyVIZA 588.4 197.5 350.3 70.1 138.937.9GAT 142.9 153.0 145.3
166.9 17.5Total 448.7 193.8 311.5 70.1 138.9 43.6 14.1 25.6 5.8 15.4Architecture
Total 176.1494.7 249.0 333.0 91.8 41.6 15.645.0 17.8 25.7 7.6 4.6GAT 51.5195.9 138.3 176.6 Faculty 208.8603.3 257.3 357.9 91.8 41.6
Prepared by Office of Institutional Studies and Planning, 28-Oct-14, 08:05 AM Page 3 of 16¹ See Notes & References section for explanation of methodology

Total¹ Total¹Dept Rank LD UD UG MSSCH per Faculty FTE
Texas A&M UniversitySCH per FTE and Student/Faculty Ratio
College/Dept Summary
Fiscal Year 2014
PhD LD UD UG MSStudent FTE to Faculty FTE Ratio (Excludes GATs FTE)
PhDBusiness Admin
339.0FacultyACCT 834.6 360.6 512.3 339.9 48.8207.4GAT 210.0 192.0 207.4 336.7 24.3Total 780.8 359.4 501.9 339.9 48.8 57.0 24.1 34.6 28.3 5.4254.2FacultyCLBA 610.2 201.7 454.9 190.1
GAT 254.4 17.7Total 610.2 202.6 455.3 190.1 40.7 13.5 30.4 15.8 355.2FacultyFINC 262.9 747.0 721.6 234.6 86.919.5GAT 259.6 259.6
319.3 25.2Total 262.9 735.4 711.2 234.6 86.9 17.5 50.2 48.5 19.5 9.7368.1FacultyINFO 1,108.2 413.1 544.4 295.6 16.210.9GAT 152.6 152.6
259.9 26.0Total 1,108.2 396.4 523.8 295.6 16.2 73.9 28.2 36.9 24.6 1.8336.2FacultyMGMT 1,541.9 520.5 715.1 277.9 16.8206.6GAT 209.1 209.1 313.6 26.6Total 1,541.9 393.5 533.9 277.9 16.8 102.8 44.3 55.5 23.2 1.9281.4FacultyMKTG 608.5 608.5 274.1 14.9120.8GAT 257.1 257.1 274.2 19.9Total 589.9 589.9 274.1 14.9 41.5 41.5 22.8 1.7
Business Admin
Total 299.6940.3 457.7 547.3 283.7 23.0 24.365.2 35.6 41.6 23.6 2.6GAT 83.4210.0 207.4 207.6 Faculty 333.5970.1 499.2 594.9 283.7 23.0
Prepared by Office of Institutional Studies and Planning, 28-Oct-14, 08:05 AM Page 4 of 16¹ See Notes & References section for explanation of methodology

Total¹ Total¹Dept Rank LD UD UG MSSCH per Faculty FTE
Texas A&M UniversitySCH per FTE and Student/Faculty Ratio
College/Dept Summary
Fiscal Year 2014
PhD LD UD UG MSStudent FTE to Faculty FTE Ratio (Excludes GATs FTE)
PhDEducation
FacultyCLED 52.0GAT 17.3 1.7Total
203.8FacultyEAHR 882.2 692.3 693.4 178.3 63.519.4GAT 109.3 109.3
162.8 16.2Total 882.2 565.7 567.2 178.3 63.5 58.8 48.2 48.2 14.9 7.1126.0FacultyEPSY 334.5 292.3 294.2 273.6 54.2113.3GAT 191.7 191.7 125.2 11.0Total 334.5 273.5 275.8 273.6 54.2 22.3 22.4 22.4 22.8 6.0386.5FacultyHLKN 466.7 654.5 541.8 142.9 41.660.1GAT 199.7 1,001.2 295.2
278.6 28.4Total 418.3 669.4 509.4 142.9 41.6 34.1 46.6 39.1 11.9 4.6233.8FacultyTLAC 487.0 420.2 423.6 223.1 46.3167.3GAT 306.0 264.6 266.1 223.1 19.2Total 456.4 384.9 388.3 223.1 46.3 36.6 33.2 33.4 18.6 5.1
Education
Total 225.2419.2 493.7 463.6 194.0 51.6 21.034.1 38.8 36.9 16.2 5.7GAT 72.8203.9 306.5 260.8 Faculty 272.4466.3 527.1 503.0 194.0 51.6
Prepared by Office of Institutional Studies and Planning, 28-Oct-14, 08:05 AM Page 5 of 16¹ See Notes & References section for explanation of methodology

Total¹ Total¹Dept Rank LD UD UG MSSCH per Faculty FTE
Texas A&M UniversitySCH per FTE and Student/Faculty Ratio
College/Dept Summary
Fiscal Year 2014
PhD LD UD UG MSStudent FTE to Faculty FTE Ratio (Excludes GATs FTE)
PhDEngineering
145.7FacultyAERO 345.9 364.9 357.5 79.0 41.7327.3GAT 327.3 327.3 146.3 10.9Total 345.9 364.4 357.3 79.0 41.7 23.1 24.7 24.0 6.6 4.6138.7FacultyBMEN 2,283.5 398.0 512.5 91.3 45.3
7.2GAT 168.0 168.0 321.5 142.0105.4 10.8Total 2,283.5 390.8 502.5 95.1 45.6 152.2 26.9 34.5 8.1 5.1170.4FacultyCHEN 957.8 370.1 416.7 105.8 55.7
GAT 159.7 12.9Total 957.8 370.1 416.7 105.8 55.7 63.9 24.7 27.8 8.8 6.2344.0FacultyCLED 128.0 344.0 344.0 22.9Total 128.0 344.0 8.5 22.9 232.4FacultyCLEN 319.7 286.4 315.5 113.6 103.1
GAT 143.2 15.6Total 319.7 286.4 315.5 113.6 103.1 21.3 19.1 21.0 9.5 11.5245.9FacultyCSCE 694.2 472.6 577.3 191.1 52.6240.0GAT 960.0 960.0 245.8 18.5Total 694.2 488.3 583.9 191.1 52.6 46.3 33.6 39.6 15.9 5.8145.9FacultyCVEN 450.6 430.1 432.0 122.8 35.948.8GAT 150.8 150.8
129.7 11.6Total 450.6 364.7 370.8 122.8 35.9 30.0 31.8 31.6 10.2 4.0178.8FacultyECEN 455.5 376.1 398.2 161.3 61.3
GAT 138.7 13.7Total 455.5 376.1 398.2 161.3 61.3 30.4 25.1 26.5 13.4 6.8214.7FacultyETID 288.6 316.4 308.2 123.4 38.2107.8GAT 89.5 117.6 108.8 188.3 17.0Total 218.9 251.2 241.5 123.4 38.2 22.5 24.9 24.2 10.3 4.2155.7FacultyISEN 510.6 314.5 339.7 157.0 28.272.6GAT 283.0 283.0
135.6 13.0Total 510.6 307.4 328.3 157.0 28.2 34.0 26.4 27.4 13.1 3.1201.8FacultyMEEN 693.4 510.9 542.3 109.6 57.723.3GAT 683.0 109.9 224.7
156.3 15.6Total 692.1 467.0 506.4 109.6 57.7 53.0 35.0 38.1 9.1 6.4139.5FacultyMSEN 342.7 393.3 360.9 100.6 77.1139.5 11.4Total 342.7 393.3 360.9 100.6 77.1 22.8 26.2 24.1 8.4 8.6145.0FacultyNUEN 446.1 235.6 275.0 127.3 72.0
GAT 123.4 11.7Total 446.1 235.6 275.0 127.3 72.0 29.7 15.7 18.3 10.6 8.0
Prepared by Office of Institutional Studies and Planning, 28-Oct-14, 08:05 AM Page 6 of 16¹ See Notes & References section for explanation of methodology

Total¹ Total¹Dept Rank LD UD UG MSSCH per Faculty FTE
Texas A&M UniversitySCH per FTE and Student/Faculty Ratio
College/Dept Summary
Fiscal Year 2014
PhD LD UD UG MSStudent FTE to Faculty FTE Ratio (Excludes GATs FTE)
PhDEngineering
212.1FacultyPETE 426.8 547.1 527.6 143.3 69.88.3GAT 195.6 195.6 131.8 46.4
156.2 16.4Total 426.8 527.2 511.6 143.2 69.7 28.5 37.3 35.8 12.1 7.8Engineering
Total 153.2425.8 362.9 379.4 131.9 51.7 14.131.6 28.3 29.2 11.0 5.7GAT 33.0144.4 159.5 156.5 203.4 70.1Faculty 181.6457.6 397.2 413.7 131.8 51.7
Prepared by Office of Institutional Studies and Planning, 28-Oct-14, 08:05 AM Page 7 of 16¹ See Notes & References section for explanation of methodology
Total¹ Total¹Dept Rank LD UD UG MSSCH per Faculty FTE
Texas A&M UniversitySCH per FTE and Student/Faculty Ratio
College/Dept Summary
Fiscal Year 2014
PhD LD UD UG MSStudent FTE to Faculty FTE Ratio (Excludes GATs FTE)
PhDG. Bush School of Govt
87.9FacultyBUSH 320.6 320.6 102.1 20.087.9 7.4Total 320.6 320.6 102.1 20.0 21.4 21.4 8.5 2.2
G. Bush School of Go
Total 87.9 320.6 320.6 102.1 20.0 7.4 21.4 21.4 8.5 2.2GAT Faculty 87.9 320.6 320.6 102.1 20.0
Prepared by Office of Institutional Studies and Planning, 28-Oct-14, 08:05 AM Page 8 of 16¹ See Notes & References section for explanation of methodology

Total¹ Total¹Dept Rank LD UD UG MSSCH per Faculty FTE
Texas A&M UniversitySCH per FTE and Student/Faculty Ratio
College/Dept Summary
Fiscal Year 2014
PhD LD UD UG MSStudent FTE to Faculty FTE Ratio (Excludes GATs FTE)
PhDGeosciences
Faculty3614 Total
135.3FacultyATMO 519.2 199.8 332.6 49.2 35.98.9GAT 66.0 66.0
116.9 9.9Total 453.3 199.8 315.0 49.2 35.9 35.4 13.3 22.5 4.1 4.042.2FacultyCLGE 122.4 46.9 52.9 48.4 168.5
333.3GAT 333.3 333.3 46.4 3.3Total 163.9 46.9 58.3 48.4 168.5 13.6 3.1 4.0 4.0 18.7
459.8FacultyGEOG 1,435.9 417.2 806.7 55.2 37.958.7GAT 120.1 80.4 106.2 12.0
323.6 33.3Total 818.0 340.6 567.0 54.4 37.9 102.8 29.4 57.5 4.6 4.2190.1FacultyGEPL 664.2 246.4 405.2 79.8 49.482.5GAT 112.0 61.4 93.0 62.7 24.1
141.9 18.2Total 248.2 148.4 202.2 79.2 49.2 67.1 21.0 38.5 6.8 5.5168.1FacultyOCNG 593.1 122.6 375.8 55.3 31.126.1GAT 83.5 83.5
134.8 12.4Total 432.8 122.6 317.9 55.3 31.1 42.1 8.2 26.4 4.6 3.5Geosciences
Total 176.7431.7 200.4 320.7 61.9 39.4 18.264.2 19.2 37.7 5.2 4.4GAT 63.1109.7 65.4 94.8 50.8 24.1Faculty 231.2827.5 259.5 493.2 62.1 39.5
Prepared by Office of Institutional Studies and Planning, 28-Oct-14, 08:05 AM Page 9 of 16¹ See Notes & References section for explanation of methodology

Total¹ Total¹Dept Rank LD UD UG MSSCH per Faculty FTE
Texas A&M UniversitySCH per FTE and Student/Faculty Ratio
College/Dept Summary
Fiscal Year 2014
PhD LD UD UG MSStudent FTE to Faculty FTE Ratio (Excludes GATs FTE)
PhDLaw
185.4FacultyCLSL 185.4 Total
Law
Total 185.4 GAT Faculty 185.4
Prepared by Office of Institutional Studies and Planning, 28-Oct-14, 08:05 AM Page 10 of 16¹ See Notes & References section for explanation of methodology

Total¹ Total¹Dept Rank LD UD UG MSSCH per Faculty FTE
Texas A&M UniversitySCH per FTE and Student/Faculty Ratio
College/Dept Summary
Fiscal Year 2014
PhD LD UD UG MSStudent FTE to Faculty FTE Ratio (Excludes GATs FTE)
PhDLiberal Arts
215.6FacultyANTH 932.8 219.6 522.8 51.6 33.8153.7GAT 353.1 84.0 314.7 192.2 21.5Total 572.2 196.7 429.3 51.6 33.8 100.9 15.8 52.0 4.3 3.8171.7FacultyCLLA 357.1 143.8 207.4 31.3 171.7 11.5Total 357.1 143.8 207.4 31.3 23.8 9.6 13.8 2.6 279.0FacultyCOMM 545.3 491.6 507.8 58.7 29.9292.8GAT 286.0 831.5 390.5 284.1 30.8Total 364.7 556.4 453.6 58.7 29.9 80.1 45.8 56.2 4.9 3.3360.4FacultyECON 1,436.5 563.5 780.5 333.5 47.4104.6GAT 420.6 513.0 445.8 283.2 28.6Total 995.1 559.1 710.9 333.5 47.4 117.3 40.8 59.8 27.8 5.3189.4FacultyENGL 309.1 245.4 270.0 83.4 27.7169.5GAT 215.5 278.5 240.6 184.3 16.8Total 275.4 251.7 262.2 83.4 27.7 28.7 20.7 23.8 7.0 3.1136.6FacultyHISP 292.5 165.8 201.8 114.5 27.8269.0GAT 290.8 239.1 289.0 169.4 15.4Total 291.4 167.5 230.6 114.5 27.8 52.0 11.4 23.0 9.5 3.1385.3FacultyHIST 893.5 210.4 562.1 42.4 26.620.8GAT 270.0 270.0
311.6 26.4Total 860.1 210.4 553.8 42.4 26.6 60.6 14.0 38.0 3.5 3.0204.8FacultyINTS 261.3 161.1 218.1 62.1 51.0GAT 102.0 102.0
202.7 13.7Total 261.3 160.1 217.2 62.1 17.4 10.9 14.6 5.2 219.2FacultyPHUM 508.8 258.0 358.7 60.6 23.267.4GAT 205.3 147.0 198.0
171.5 17.0Total 397.3 252.2 324.9 60.6 23.2 41.9 17.7 27.4 5.1 2.6429.5FacultyPOLS 1,250.0 169.2 716.9 74.0 28.2409.8GAT 505.0 280.9 409.8 427.4 32.4Total 1,106.4 186.4 663.5 74.0 28.2 91.4 14.7 53.5 6.2 3.1457.7FacultyPRFM 715.4 166.7 540.1 45.1 40.3
GAT 402.6 30.6Total 715.4 166.7 540.1 45.1 40.3 47.7 11.1 36.0 3.8 4.5293.8FacultyPSYC 1,026.0 327.4 524.3 77.7 35.0114.6GAT 92.5 350.0 175.2 228.7 24.6Total 436.7 332.8 379.2 77.7 35.0 79.0 29.2 43.3 6.5 3.9185.6FacultySOCI 417.7 345.5 364.2 59.2 47.9374.6GAT 490.5 224.4 419.5
Prepared by Office of Institutional Studies and Planning, 28-Oct-14, 08:05 AM Page 11 of 16¹ See Notes & References section for explanation of methodology

Total¹ Total¹Dept Rank LD UD UG MSSCH per Faculty FTE
Texas A&M UniversitySCH per FTE and Student/Faculty Ratio
College/Dept Summary
Fiscal Year 2014
PhD LD UD UG MSStudent FTE to Faculty FTE Ratio (Excludes GATs FTE)
PhDLiberal Arts
231.6 21.4Total 465.1 322.3 386.1 59.2 47.9 89.0 26.6 42.7 4.9 5.3Liberal Arts
Total 254.3532.2 280.8 407.2 98.9 34.1 23.254.5 21.4 35.7 8.2 3.8GAT 165.0272.7 349.3 293.0 Faculty 284.6671.6 270.8 443.0 98.9 34.1
Prepared by Office of Institutional Studies and Planning, 28-Oct-14, 08:05 AM Page 12 of 16¹ See Notes & References section for explanation of methodology
Total¹ Total¹Dept Rank LD UD UG MSSCH per Faculty FTE
Texas A&M UniversitySCH per FTE and Student/Faculty Ratio
College/Dept Summary
Fiscal Year 2014
PhD LD UD UG MSStudent FTE to Faculty FTE Ratio (Excludes GATs FTE)
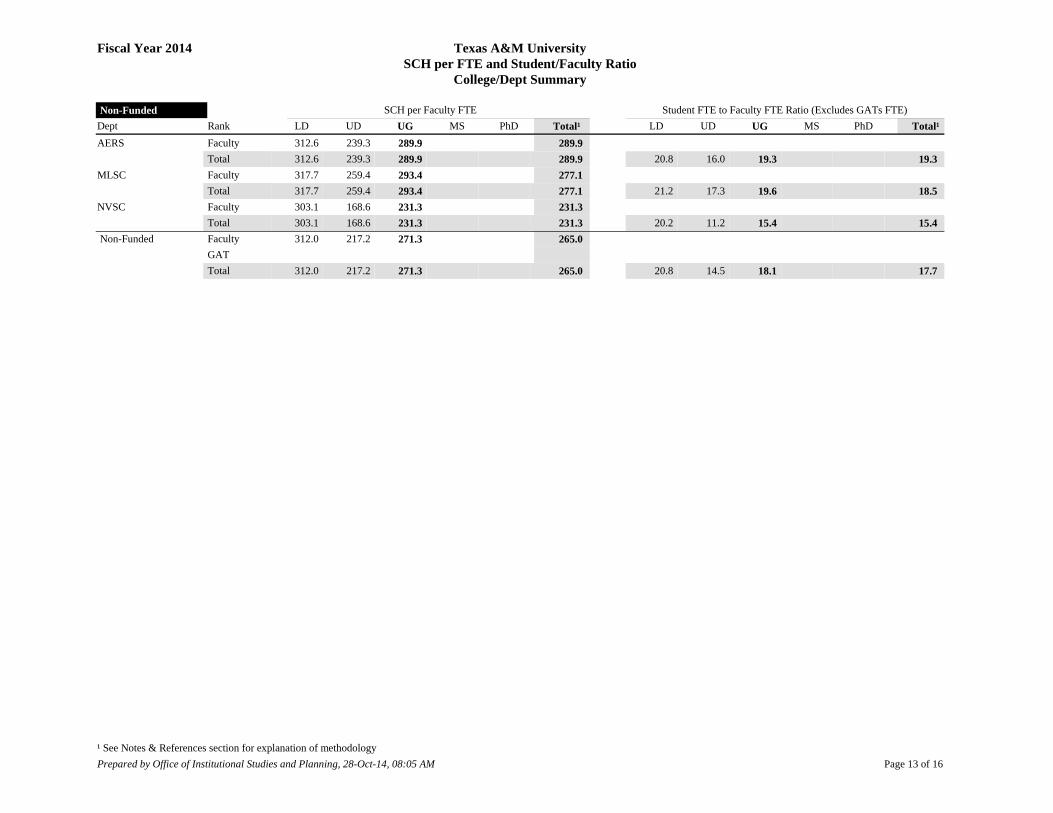
PhDNon-Funded
289.9FacultyAERS 312.6 239.3 289.9 289.9 19.3Total 312.6 239.3 289.9 20.8 16.0 19.3 277.1FacultyMLSC 317.7 259.4 293.4 277.1 18.5Total 317.7 259.4 293.4 21.2 17.3 19.6 231.3FacultyNVSC 303.1 168.6 231.3 231.3 15.4Total 303.1 168.6 231.3 20.2 11.2 15.4
Non-Funded
Total 265.0312.0 217.2 271.3 17.720.8 14.5 18.1 GAT Faculty 265.0312.0 217.2 271.3
Prepared by Office of Institutional Studies and Planning, 28-Oct-14, 08:05 AM Page 13 of 16¹ See Notes & References section for explanation of methodology
Total¹ Total¹Dept Rank LD UD UG MSSCH per Faculty FTE
Texas A&M UniversitySCH per FTE and Student/Faculty Ratio
College/Dept Summary
Fiscal Year 2014
PhD LD UD UG MSStudent FTE to Faculty FTE Ratio (Excludes GATs FTE)
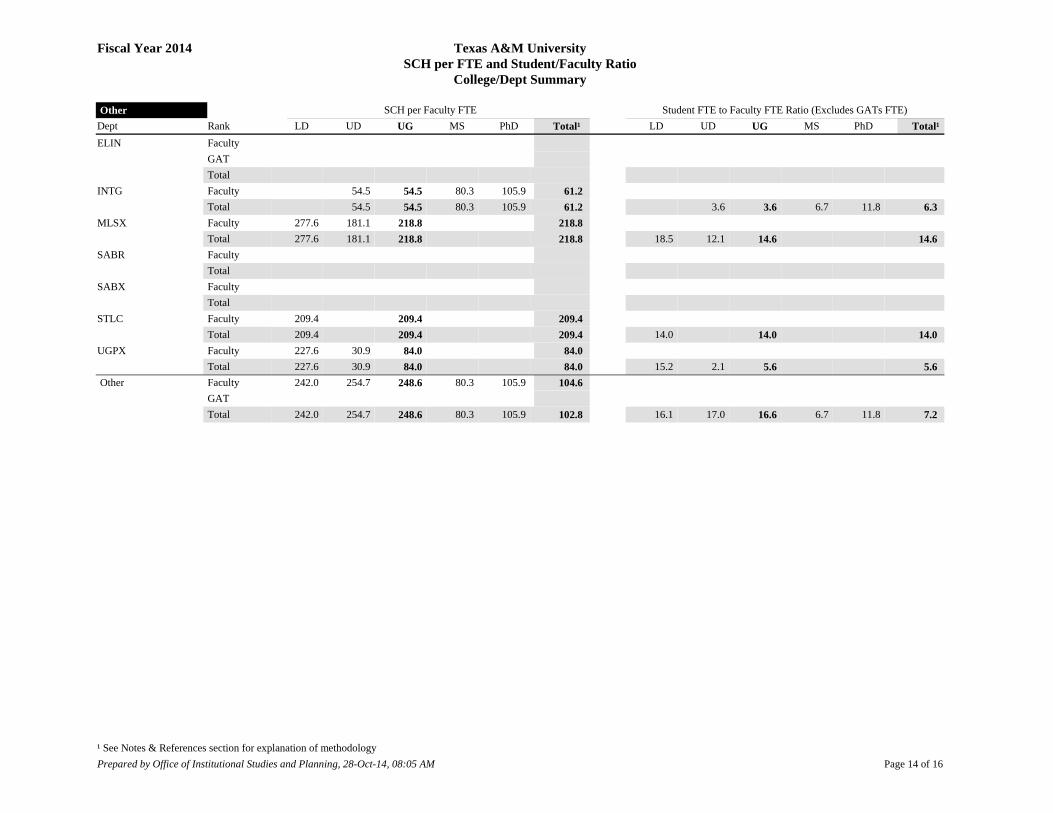
PhDOther
FacultyELIN GAT Total
61.2FacultyINTG 54.5 54.5 80.3 105.961.2 6.3Total 54.5 54.5 80.3 105.9 3.6 3.6 6.7 11.8
218.8FacultyMLSX 277.6 181.1 218.8 218.8 14.6Total 277.6 181.1 218.8 18.5 12.1 14.6
FacultySABR Total FacultySABX Total
209.4FacultySTLC 209.4 209.4 209.4 14.0Total 209.4 209.4 14.0 14.0 84.0FacultyUGPX 227.6 30.9 84.0 84.0 5.6Total 227.6 30.9 84.0 15.2 2.1 5.6
Other
Total 102.8242.0 254.7 248.6 80.3 105.9 7.216.1 17.0 16.6 6.7 11.8GAT Faculty 104.6242.0 254.7 248.6 80.3 105.9
Prepared by Office of Institutional Studies and Planning, 28-Oct-14, 08:05 AM Page 14 of 16¹ See Notes & References section for explanation of methodology
Total¹ Total¹Dept Rank LD UD UG MSSCH per Faculty FTE
Texas A&M UniversitySCH per FTE and Student/Faculty Ratio
College/Dept Summary
Fiscal Year 2014
PhD LD UD UG MSStudent FTE to Faculty FTE Ratio (Excludes GATs FTE)
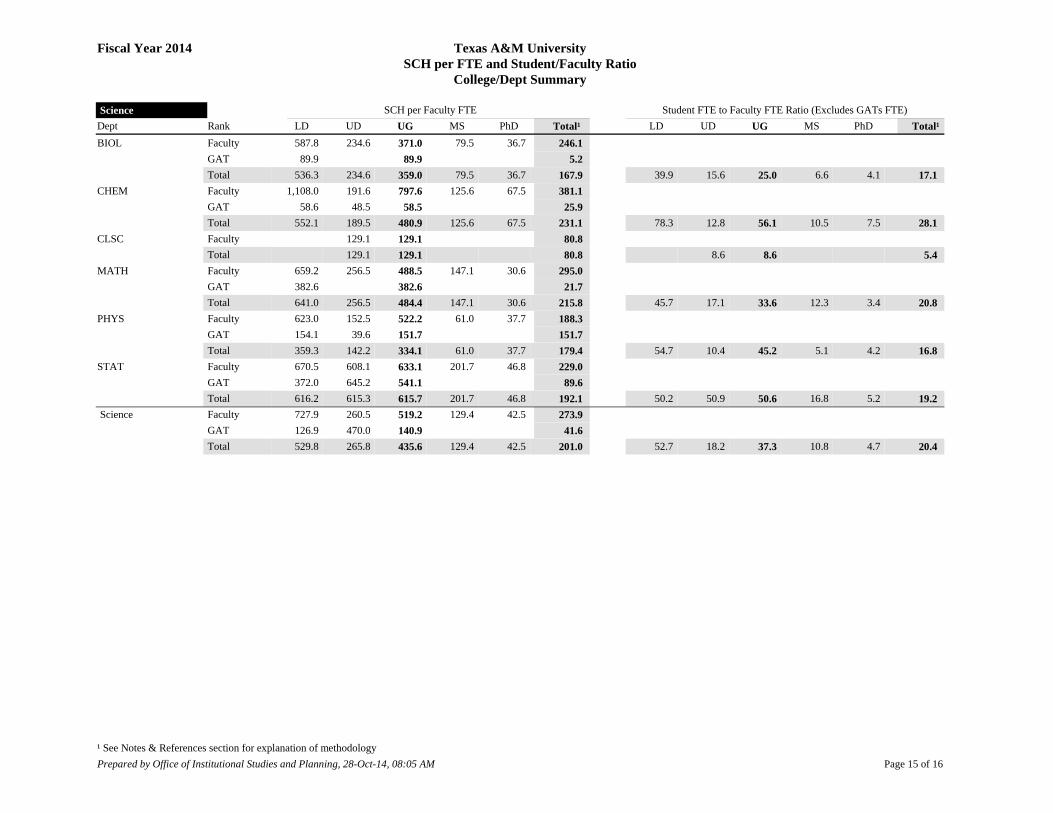
PhDScience
246.1FacultyBIOL 587.8 234.6 371.0 79.5 36.75.2GAT 89.9 89.9
167.9 17.1Total 536.3 234.6 359.0 79.5 36.7 39.9 15.6 25.0 6.6 4.1381.1FacultyCHEM 1,108.0 191.6 797.6 125.6 67.525.9GAT 58.6 48.5 58.5
231.1 28.1Total 552.1 189.5 480.9 125.6 67.5 78.3 12.8 56.1 10.5 7.580.8FacultyCLSC 129.1 129.1 80.8 5.4Total 129.1 129.1 8.6 8.6
295.0FacultyMATH 659.2 256.5 488.5 147.1 30.621.7GAT 382.6 382.6
215.8 20.8Total 641.0 256.5 484.4 147.1 30.6 45.7 17.1 33.6 12.3 3.4188.3FacultyPHYS 623.0 152.5 522.2 61.0 37.7151.7GAT 154.1 39.6 151.7 179.4 16.8Total 359.3 142.2 334.1 61.0 37.7 54.7 10.4 45.2 5.1 4.2229.0FacultySTAT 670.5 608.1 633.1 201.7 46.889.6GAT 372.0 645.2 541.1
192.1 19.2Total 616.2 615.3 615.7 201.7 46.8 50.2 50.9 50.6 16.8 5.2Science
Total 201.0529.8 265.8 435.6 129.4 42.5 20.452.7 18.2 37.3 10.8 4.7GAT 41.6126.9 470.0 140.9 Faculty 273.9727.9 260.5 519.2 129.4 42.5
Prepared by Office of Institutional Studies and Planning, 28-Oct-14, 08:05 AM Page 15 of 16¹ See Notes & References section for explanation of methodology

Total¹ Total¹Dept Rank LD UD UG MSSCH per Faculty FTE
Texas A&M UniversitySCH per FTE and Student/Faculty Ratio
College/Dept Summary
Fiscal Year 2014
PhD LD UD UG MSStudent FTE to Faculty FTE Ratio (Excludes GATs FTE)
PhDVeterinary Medicine
225.8FacultyCLVM 763.6 136.9 252.9 225.8 15.1Total 763.6 136.9 252.9 50.9 9.1 16.9 168.5FacultyVIBS 255.5 370.9 356.0 126.5 61.3
3.9GAT 49.9 17.4145.1 12.7Total 255.5 370.9 356.0 123.2 61.0 17.0 24.7 23.7 10.7 6.885.2FacultyVLCS 630.8 630.8 94.2 111.9
GAT 74.8 7.6Total 630.8 630.8 94.2 111.9 42.1 42.1 7.9 12.433.3FacultyVSCS 45.5 45.5 57.5 60.033.3 3.5Total 45.5 45.5 57.5 60.0 3.0 3.0 4.8 6.7
202.0FacultyVTPB 532.5 616.1 598.8 73.7 65.5GAT
173.6 14.6Total 532.5 616.1 598.8 73.7 65.5 35.5 41.1 39.9 6.1 7.3223.9FacultyVTPP 332.6 436.7 422.2 161.3 59.296.0GAT 96.0 96.0
221.3 16.4Total 268.5 436.7 406.2 161.3 59.2 24.5 29.1 28.5 13.4 6.6Veterinary Medicine
Total 163.5410.2 420.4 418.7 112.5 63.7 13.429.9 28.0 28.3 9.5 7.1GAT 6.096.0 96.0 49.9 17.4Faculty 181.1439.8 420.4 423.4 113.5 63.8
Prepared by Office of Institutional Studies and Planning, 28-Oct-14, 08:05 AM Page 16 of 16¹ See Notes & References section for explanation of methodology

CollegeTotal SCH
LD UD MS PhD TotalTeaching Supplem't
Excess PhD
Net WSCH
FTEGAT
Teaching SalaryGAT
WSCH (incl. Excess PhD)Faculty Faculty
Cost perWSCHSCHTotal
Texas A&M University – Teaching Analysis ReportUniversity Summary by College
Fiscal Year 2014
Agriculture 150,583 80,829 218,138 75,463 166,950 541,380 19,853 7,309 553,924 220.0 87.8 $22,974,292 $3,292,833 $174.4 $47.4$26,267,125Architecture 57,022 56,387 63,670 53,886 26,536 200,478 6,754 2,098 205,134 91.4 24.7 $9,370,947 $674,221 $176.2 $49.0$10,045,168Business Admin 139,019 53,638 138,257 92,240 33,033 317,169 3,937 5,158 315,948 139.4 23.0 $24,394,002 $630,499 $180.0 $79.2$25,024,501Education 144,642 73,353 128,201 42,948 83,836 328,339 3,426 3,802 327,963 173.4 51.9 $16,444,225 $1,764,119 $125.9 $55.5$18,208,344Engineering 196,064 109,465 321,970 211,682 402,013 1,045,131 29,045 22,649 1,051,527 358.3 90.0 $48,230,303 $3,319,629 $262.9 $49.0$51,549,932G. Bush School of Govt 8,334 192 30,033 2,447 32,672 12 32,684 34.4 $4,496,552 $539.5 $137.6$4,496,552Geosciences 56,982 58,939 34,360 21,474 55,419 170,191 6,121 2,830 173,483 76.9 38.3 $8,473,481 $1,607,898 $176.9 $58.1$10,081,379Law 20,549 98,841 98,841 39.7 $5,082,106 $247.3 $51.4$5,082,106Liberal Arts 312,759 220,901 158,753 23,849 84,945 488,447 17,721 2,129 504,040 331.7 113.2 $35,972,127 $3,931,597 $127.6 $79.2$39,903,724Non-Funded 9,157 13.0 n/aOther 5,852 2,728 2,312 653 4,969 10,662 5 629 10,038 19.1 0.3 $742,587 $10,000 $128.6 $75.0$752,587Science 243,644 264,920 120,154 47,439 237,348 669,861 14,641 16,004 668,498 292.4 135.9 $35,431,948 $6,150,525 $170.7 $62.2$41,582,473Veterinary Medicine 19,013 3,995 33,550 19,716 41,683 98,943 1,788 1,049 99,682 34.9 3.7 $3,455,882 $143,502 $189.3 $36.1$3,599,384
1,363,620 925,155 1,219,557 619,382 1,139,179 4,002,115 103,304 63,658 4,041,760 1,824.5 568.7 $215,068,452 $21,524,823 $173.5 $58.5$236,593,275University Total
Prepared by Office of Institutional Studies and Planning, 28-Oct-14, 08:06 AM Section I. Page 1 of 1
CollegeTotal SCH LD UD MS PhD Total
Teaching Supplem't
Excess PhD
Net WSCH
FTEGAT
Teaching SalaryGAT
WSCH (incl. Excess PhD)Faculty Faculty
Cost perWSCHSCHTotal
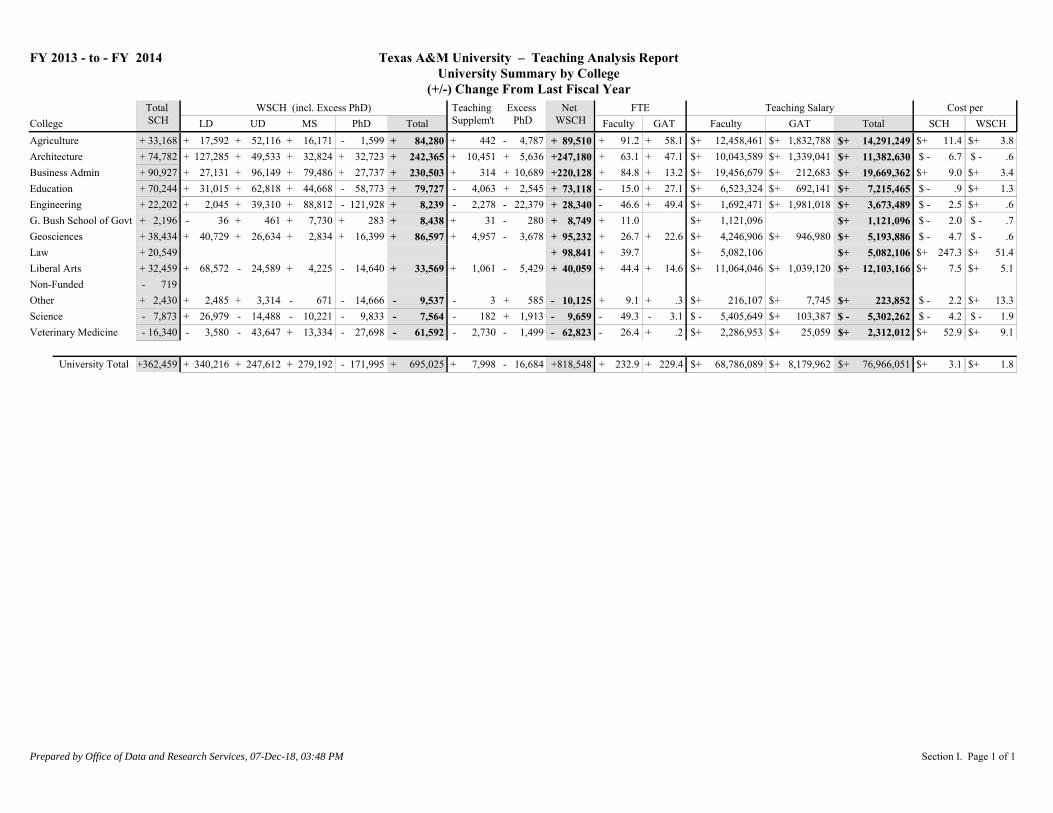
FY 2013 - to - FY 2014 Texas A&M University – Teaching Analysis ReportUniversity Summary by College
(+/-) Change From Last Fiscal Year
Agriculture + 33,168 + 17,592 + 52,116 + 16,171 - 1,599 + 84,280 + 442 - 4,787 + 89,510 + 91.2 + 58.1 $+ 12,458,461 $+ 1,832,788 $+ 11.4 $+ 3.8$+ 14,291,249Architecture + 74,782 + 127,285 + 49,533 + 32,824 + 32,723 + 242,365 + 10,451 + 5,636 +247,180 + 63.1 + 47.1 $+ 10,043,589 $+ 1,339,041 $ - 6.7 $ - .6$+ 11,382,630Business Admin + 90,927 + 27,131 + 96,149 + 79,486 + 27,737 + 230,503 + 314 + 10,689 +220,128 + 84.8 + 13.2 $+ 19,456,679 $+ 212,683 $+ 9.0 $+ 3.4$+ 19,669,362Education + 70,244 + 31,015 + 62,818 + 44,668 - 58,773 + 79,727 - 4,063 + 2,545 + 73,118 - 15.0 + 27.1 $+ 6,523,324 $+ 692,141 $ - .9 $+ 1.3$+ 7,215,465Engineering + 22,202 + 2,045 + 39,310 + 88,812 - 121,928 + 8,239 - 2,278 - 22,379 + 28,340 - 46.6 + 49.4 $+ 1,692,471 $+ 1,981,018 $ - 2.5 $+ .6$+ 3,673,489G. Bush School of Govt + 2,196 - 36 + 461 + 7,730 + 283 + 8,438 + 31 - 280 + 8,749 + 11.0 $+ 1,121,096 $ - 2.0 $ - .7$+ 1,121,096Geosciences + 38,434 + 40,729 + 26,634 + 2,834 + 16,399 + 86,597 + 4,957 - 3,678 + 95,232 + 26.7 + 22.6 $+ 4,246,906 $+ 946,980 $ - 4.7 $ - .6$+ 5,193,886Law + 20,549 + 98,841 + 39.7 $+ 5,082,106 $+ 247.3 $+ 51.4$+ 5,082,106Liberal Arts + 32,459 + 68,572 - 24,589 + 4,225 - 14,640 + 33,569 + 1,061 - 5,429 + 40,059 + 44.4 + 14.6 $+ 11,064,046 $+ 1,039,120 $+ 7.5 $+ 5.1$+ 12,103,166Non-Funded - 719 Other + 2,430 + 2,485 + 3,314 - 671 - 14,666 - 9,537 - 3 + 585 - 10,125 + 9.1 + .3 $+ 216,107 $+ 7,745 $ - 2.2 $+ 13.3$+ 223,852Science - 7,873 + 26,979 - 14,488 - 10,221 - 9,833 - 7,564 - 182 + 1,913 - 9,659 - 49.3 - 3.1 $ - 5,405,649 $+ 103,387 $ - 4.2 $ - 1.9$ - 5,302,262Veterinary Medicine - 16,340 - 3,580 - 43,647 + 13,334 - 27,698 - 61,592 - 2,730 - 1,499 - 62,823 - 26.4 + .2 $+ 2,286,953 $+ 25,059 $+ 52.9 $+ 9.1$+ 2,312,012
+362,459 + 340,216 + 247,612 + 279,192 - 171,995 + 695,025 + 7,998 - 16,684 +818,548 + 232.9 + 229.4 $+ 68,786,089 $+ 8,179,962 $+ 3.1 $+ 1.8$+ 76,966,051University Total
Prepared by Office of Data and Research Services, 07-Dec-18, 03:48 PM Section I. Page 1 of 1

CollegeTotal SCH LD UD MS PhD Total
Teaching Supplem't
Excess PhD
Net WSCH
FTEGAT
Teaching SalaryGAT
WSCH (incl. Excess PhD)Faculty Faculty
Cost perWSCHSCHTotal
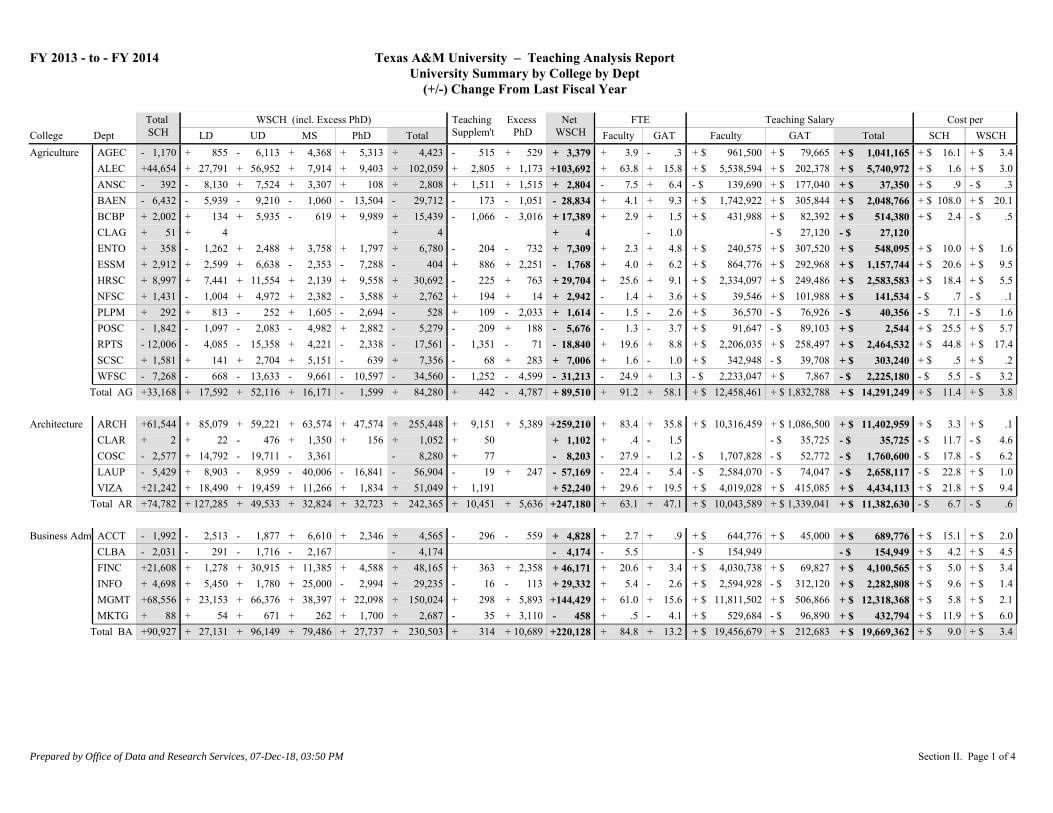
FY 2013 - to - FY 2014 Texas A&M University – Teaching Analysis ReportUniversity Summary by College
(+/- %) Percent Change From Last Fiscal Year
Agriculture + 4% + 4% + 5% + 4% + 3% - 13% + 3% + 9% + 15% + 12% + 13% + 7% + 8%+ 12%Architecture + 27% + 52% + 15% + 11% + 23% + 24% + 31% + 69% + 24% + 13% + 44% + 21% + 46% - 4% - 1%+ 22%Business Admin + 21% + 14% + 22% + 28% + 30% + 23% + 3% + 118% + 22% + 20% + 13% + 28% + 7% + 5% + 5%+ 28%Education + 6% + 5% + 7% + 17% - 9% + 3% - 11% + 11% + 3% - 1% + 7% + 6% + 5% - 1% + 2%+ 6%Engineering + 3% + 3% + 13% - 8% - 2% - 21% + 1% - 3% + 16% + 1% + 17% - 1% + 1%+ 2%G. Bush School of Govt + 7% - 100% + 150% + 7% + 3% + 7% + 184% - 100% + 7% + 9% + 7% + 7%Geosciences + 24% + 25% + 31% + 5% + 12% + 20% + 31% - 32% + 21% + 13% + 25% + 19% + 25% - 3% - 1%+ 20%Law + 100% + 100% + 100% + 100% + 100% + 100%+ 100%Liberal Arts + 3% + 10% - 4% + 6% - 5% + 2% + 2% - 42% + 2% + 4% + 4% + 10% + 8% + 6% + 7%+ 10%Non-Funded - 5% Other + 20% + 40% + 60% - 20% - 42% - 19% - 23% + 30% - 21% + 27% + 456% + 17% + 343% - 2% + 49%+ 17%Science - 1% + 3% - 3% - 6% - 1% + 3% - 4% - 1% - 4% - 2% - 3%- 3%Veterinary Medicine - 16% - 19% - 22% + 18% - 13% - 12% - 24% - 22% - 12% - 15% + 1% + 18% + 4% + 40% + 34%+ 17%
+ 6% + 9% + 5% + 12% - 4% + 4% + 2% - 6% + 5% + 3% + 10% + 8% + 10% + 2% + 3%+ 8%University Total
Prepared by Office of Data and Research Services, 07-Dec-18, 03:50 PM Section I. Page 1 of 1

College DeptTotal SCH LD UD MS PhD Total
Teaching Supplem't
Excess PhD
Net WSCH
FTEGAT
Teaching SalaryGAT
WSCH (incl. Excess PhD)Faculty Faculty
Cost perWSCHSCHTotal
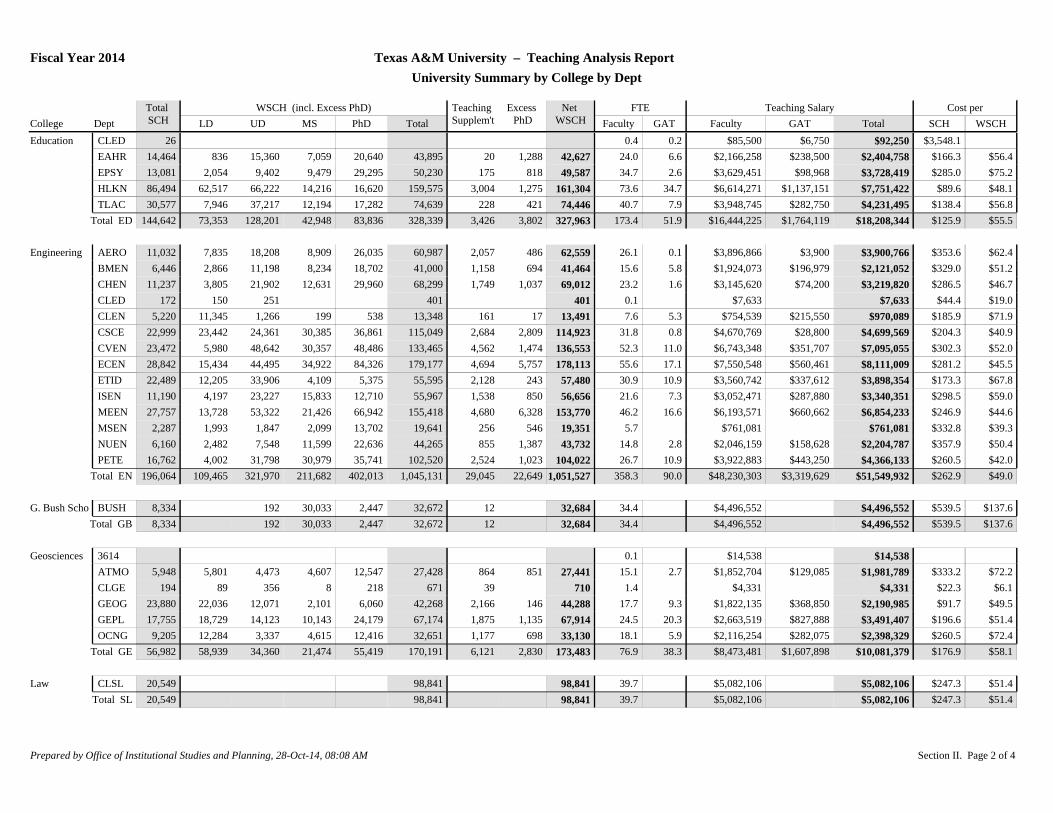
Texas A&M University – Teaching Analysis ReportUniversity Summary by College by Dept
Fiscal Year 2014
Agriculture AGEC 15,251 7,132 25,434 9,080 8,873 50,519 2,014 146 52,387 18.3 10.2 $2,331,936 $344,725 $175.5 $51.1$2,676,661ALEC 17,553 6,424 23,486 8,579 7,353 45,842 1,667 219 47,290 22.4 7.0 $1,990,323 $192,924 $124.4 $46.2$2,183,247ANSC 19,999 17,094 26,276 8,418 8,210 59,998 3,580 333 63,245 22.5 12.2 $2,484,662 $396,677 $144.1 $45.6$2,881,339BAEN 5,510 1,846 12,098 4,507 9,056 27,507 1,122 366 28,264 12.2 3.6 $1,766,494 $130,826 $344.4 $67.1$1,897,320BCBP 15,585 1,132 35,778 6,968 44,622 88,500 1,146 1,680 87,966 28.8 10.6 $2,608,357 $556,029 $203.0 $36.0$3,164,386CLAG 51 4 4 4ENTO 10,076 6,992 14,683 3,599 15,417 40,690 1,528 1,549 40,668 9.8 6.4 $984,344 $302,442 $127.7 $31.6$1,286,786ESSM 8,213 5,247 11,257 6,526 8,734 31,763 1,505 917 32,351 13.9 3.1 $1,387,941 $138,153 $185.8 $47.2$1,526,094HRSC 7,282 5,859 8,378 2,815 6,263 23,316 980 438 23,858 12.2 3.6 $1,247,879 $111,110 $186.6 $57.0$1,358,989NFSC 12,673 11,547 9,084 3,338 5,136 29,106 1,217 285 30,038 13.5 5.3 $1,524,535 $169,956 $133.7 $56.4$1,694,491PLPM 5,271 2,360 8,984 2,748 10,484 24,576 1,134 524 25,187 9.6 3.5 $1,138,206 $127,761 $240.2 $50.3$1,265,967POSC 3,368 2,611 4,167 1,507 4,006 12,291 488 63 12,717 4.8 1.0 $521,363 $31,920 $164.3 $43.5$553,283RPTS 14,131 5,058 16,843 3,481 6,225 31,607 1,107 10 32,704 19.3 10.8 $1,800,114 $400,882 $155.8 $67.3$2,200,996SCSC 8,134 4,460 10,162 7,166 14,524 36,312 935 562 36,685 14.5 3.9 $1,350,331 $146,925 $184.1 $40.8$1,497,256WFSC 7,488 3,061 11,509 6,731 18,049 39,349 1,430 218 40,561 18.2 6.7 $1,837,807 $242,503 $277.8 $51.3$2,080,310
Total AG 150,583 80,829 218,138 75,463 166,950 541,380 19,853 7,309 553,924 220.0 87.8 $22,974,292 $3,292,833 $174.4 $47.4$26,267,125
Architecture ARCH 19,496 25,806 17,711 20,754 13,889 78,160 3,145 1,092 80,213 29.4 8.0 $3,285,463 $226,925 $180.2 $43.8$3,512,388CLAR 1,022 7 2,663 613 52 3,336 17 3,352 3.3 0.7 $16,825 $16.5 $5.0$16,825COSC 15,285 12,324 22,900 4,977 40,200 2,023 42,224 19.3 3.2 $2,012,202 $103,088 $138.4 $50.1$2,115,290LAUP 9,347 6,774 12,120 17,867 12,180 48,941 898 1,006 48,833 22.9 3.8 $2,409,554 $122,233 $270.9 $51.8$2,531,787VIZA 11,872 11,475 8,276 9,676 415 29,842 671 30,513 16.4 9.0 $1,663,728 $205,150 $157.4 $61.2$1,868,878
Total AR 57,022 56,387 63,670 53,886 26,536 200,478 6,754 2,098 205,134 91.4 24.7 $9,370,947 $674,221 $176.2 $49.0$10,045,168
Business Ad ACCT 33,811 15,925 21,943 24,941 6,824 69,632 908 70,540 34.2 0.7 $6,148,479 $31,500 $182.8 $87.6$6,179,979CLBA 4,643 3,795 934 2,923 7,652 7,652 6.3 $508,989 $109.6 $66.5$508,989FINC 20,696 488 28,015 13,039 6,499 48,041 280 1,161 47,160 20.1 2.6 $3,476,154 $61,259 $170.9 $75.0$3,537,413INFO 27,263 21,254 27,405 25,036 3,255 76,949 764 609 77,104 25.8 11.7 $4,111,171 $292,770 $161.5 $57.1$4,403,941MGMT 35,333 11,978 33,472 19,260 10,537 75,248 294 1,764 73,777 32.1 7.1 $5,913,354 $219,424 $173.6 $83.1$6,132,778MKTG 17,273 198 26,488 7,043 5,919 39,647 1,691 1,625 39,713 20.8 0.9 $4,235,855 $25,546 $246.7 $107.3$4,261,401
Total BA 139,019 53,638 138,257 92,240 33,033 317,169 3,937 5,158 315,948 139.4 23.0 $24,394,002 $630,499 $180.0 $79.2$25,024,501
Prepared by Office of Institutional Studies and Planning, 28-Oct-14, 08:08 AM Section II. Page 1 of 4
College DeptTotal SCH LD UD MS PhD Total
Teaching Supplem't
Excess PhD
Net WSCH
FTEGAT
Teaching SalaryGAT
WSCH (incl. Excess PhD)Faculty Faculty
Cost perWSCHSCHTotal
Texas A&M University – Teaching Analysis ReportUniversity Summary by College by Dept
Fiscal Year 2014
Education CLED 26 0.4 0.2 $85,500 $6,750 $3,548.1$92,250EAHR 14,464 836 15,360 7,059 20,640 43,895 20 1,288 42,627 24.0 6.6 $2,166,258 $238,500 $166.3 $56.4$2,404,758EPSY 13,081 2,054 9,402 9,479 29,295 50,230 175 818 49,587 34.7 2.6 $3,629,451 $98,968 $285.0 $75.2$3,728,419HLKN 86,494 62,517 66,222 14,216 16,620 159,575 3,004 1,275 161,304 73.6 34.7 $6,614,271 $1,137,151 $89.6 $48.1$7,751,422TLAC 30,577 7,946 37,217 12,194 17,282 74,639 228 421 74,446 40.7 7.9 $3,948,745 $282,750 $138.4 $56.8$4,231,495
Total ED 144,642 73,353 128,201 42,948 83,836 328,339 3,426 3,802 327,963 173.4 51.9 $16,444,225 $1,764,119 $125.9 $55.5$18,208,344
Engineering AERO 11,032 7,835 18,208 8,909 26,035 60,987 2,057 486 62,559 26.1 0.1 $3,896,866 $3,900 $353.6 $62.4$3,900,766BMEN 6,446 2,866 11,198 8,234 18,702 41,000 1,158 694 41,464 15.6 5.8 $1,924,073 $196,979 $329.0 $51.2$2,121,052CHEN 11,237 3,805 21,902 12,631 29,960 68,299 1,749 1,037 69,012 23.2 1.6 $3,145,620 $74,200 $286.5 $46.7$3,219,820CLED 172 150 251 401 401 0.1 $7,633 $44.4 $19.0$7,633CLEN 5,220 11,345 1,266 199 538 13,348 161 17 13,491 7.6 5.3 $754,539 $215,550 $185.9 $71.9$970,089CSCE 22,999 23,442 24,361 30,385 36,861 115,049 2,684 2,809 114,923 31.8 0.8 $4,670,769 $28,800 $204.3 $40.9$4,699,569CVEN 23,472 5,980 48,642 30,357 48,486 133,465 4,562 1,474 136,553 52.3 11.0 $6,743,348 $351,707 $302.3 $52.0$7,095,055ECEN 28,842 15,434 44,495 34,922 84,326 179,177 4,694 5,757 178,113 55.6 17.1 $7,550,548 $560,461 $281.2 $45.5$8,111,009ETID 22,489 12,205 33,906 4,109 5,375 55,595 2,128 243 57,480 30.9 10.9 $3,560,742 $337,612 $173.3 $67.8$3,898,354ISEN 11,190 4,197 23,227 15,833 12,710 55,967 1,538 850 56,656 21.6 7.3 $3,052,471 $287,880 $298.5 $59.0$3,340,351MEEN 27,757 13,728 53,322 21,426 66,942 155,418 4,680 6,328 153,770 46.2 16.6 $6,193,571 $660,662 $246.9 $44.6$6,854,233MSEN 2,287 1,993 1,847 2,099 13,702 19,641 256 546 19,351 5.7 $761,081 $332.8 $39.3$761,081NUEN 6,160 2,482 7,548 11,599 22,636 44,265 855 1,387 43,732 14.8 2.8 $2,046,159 $158,628 $357.9 $50.4$2,204,787PETE 16,762 4,002 31,798 30,979 35,741 102,520 2,524 1,023 104,022 26.7 10.9 $3,922,883 $443,250 $260.5 $42.0$4,366,133
Total EN 196,064 109,465 321,970 211,682 402,013 1,045,131 29,045 22,649 1,051,527 358.3 90.0 $48,230,303 $3,319,629 $262.9 $49.0$51,549,932
G. Bush Scho BUSH 8,334 192 30,033 2,447 32,672 12 32,684 34.4 $4,496,552 $539.5 $137.6$4,496,552Total GB 8,334 192 30,033 2,447 32,672 12 32,684 34.4 $4,496,552 $539.5 $137.6$4,496,552
Geosciences 3614 0.1 $14,538 $14,538ATMO 5,948 5,801 4,473 4,607 12,547 27,428 864 851 27,441 15.1 2.7 $1,852,704 $129,085 $333.2 $72.2$1,981,789CLGE 194 89 356 8 218 671 39 710 1.4 $4,331 $22.3 $6.1$4,331GEOG 23,880 22,036 12,071 2,101 6,060 42,268 2,166 146 44,288 17.7 9.3 $1,822,135 $368,850 $91.7 $49.5$2,190,985GEPL 17,755 18,729 14,123 10,143 24,179 67,174 1,875 1,135 67,914 24.5 20.3 $2,663,519 $827,888 $196.6 $51.4$3,491,407OCNG 9,205 12,284 3,337 4,615 12,416 32,651 1,177 698 33,130 18.1 5.9 $2,116,254 $282,075 $260.5 $72.4$2,398,329
Total GE 56,982 58,939 34,360 21,474 55,419 170,191 6,121 2,830 173,483 76.9 38.3 $8,473,481 $1,607,898 $176.9 $58.1$10,081,379
Law CLSL 20,549 98,841 98,841 39.7 $5,082,106 $247.3 $51.4$5,082,106Total SL 20,549 98,841 98,841 39.7 $5,082,106 $247.3 $51.4$5,082,106
Prepared by Office of Institutional Studies and Planning, 28-Oct-14, 08:08 AM Section II. Page 2 of 4
College DeptTotal SCH LD UD MS PhD Total
Teaching Supplem't
Excess PhD
Net WSCH
FTEGAT
Teaching SalaryGAT
WSCH (incl. Excess PhD)Faculty Faculty
Cost perWSCHSCHTotal
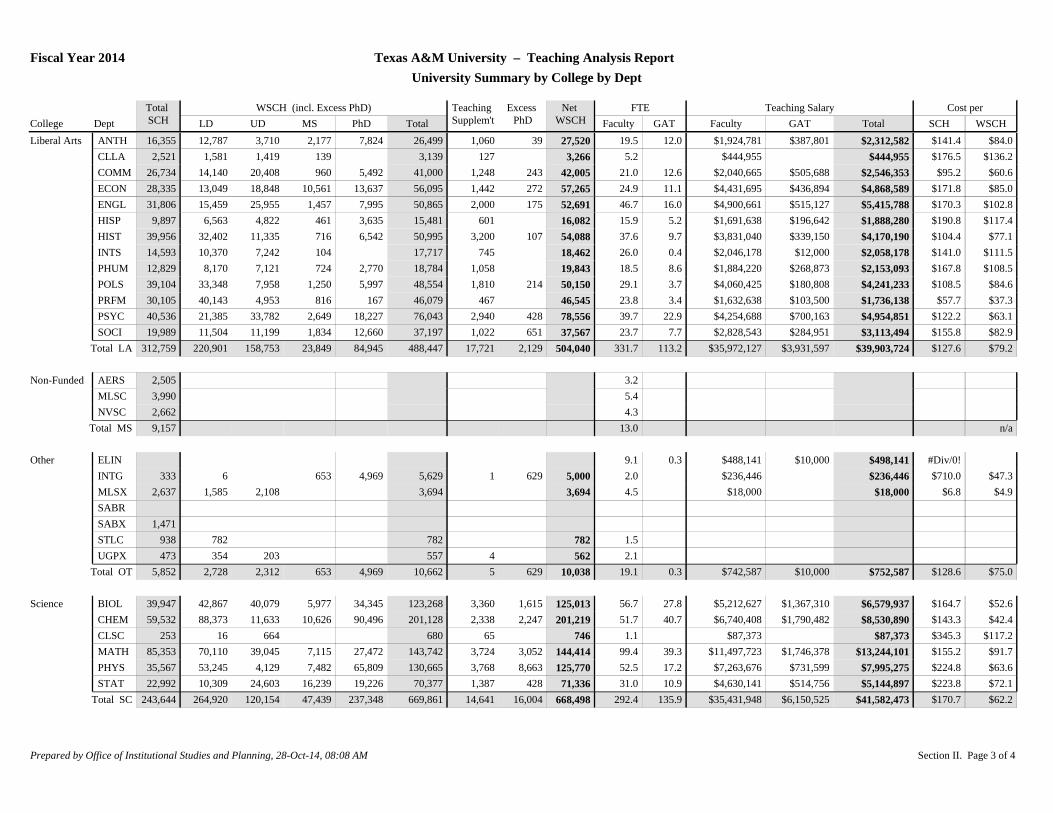
Texas A&M University – Teaching Analysis ReportUniversity Summary by College by Dept
Fiscal Year 2014
Liberal Arts ANTH 16,355 12,787 3,710 2,177 7,824 26,499 1,060 39 27,520 19.5 12.0 $1,924,781 $387,801 $141.4 $84.0$2,312,582CLLA 2,521 1,581 1,419 139 3,139 127 3,266 5.2 $444,955 $176.5 $136.2$444,955COMM 26,734 14,140 20,408 960 5,492 41,000 1,248 243 42,005 21.0 12.6 $2,040,665 $505,688 $95.2 $60.6$2,546,353ECON 28,335 13,049 18,848 10,561 13,637 56,095 1,442 272 57,265 24.9 11.1 $4,431,695 $436,894 $171.8 $85.0$4,868,589ENGL 31,806 15,459 25,955 1,457 7,995 50,865 2,000 175 52,691 46.7 16.0 $4,900,661 $515,127 $170.3 $102.8$5,415,788HISP 9,897 6,563 4,822 461 3,635 15,481 601 16,082 15.9 5.2 $1,691,638 $196,642 $190.8 $117.4$1,888,280HIST 39,956 32,402 11,335 716 6,542 50,995 3,200 107 54,088 37.6 9.7 $3,831,040 $339,150 $104.4 $77.1$4,170,190INTS 14,593 10,370 7,242 104 17,717 745 18,462 26.0 0.4 $2,046,178 $12,000 $141.0 $111.5$2,058,178PHUM 12,829 8,170 7,121 724 2,770 18,784 1,058 19,843 18.5 8.6 $1,884,220 $268,873 $167.8 $108.5$2,153,093POLS 39,104 33,348 7,958 1,250 5,997 48,554 1,810 214 50,150 29.1 3.7 $4,060,425 $180,808 $108.5 $84.6$4,241,233PRFM 30,105 40,143 4,953 816 167 46,079 467 46,545 23.8 3.4 $1,632,638 $103,500 $57.7 $37.3$1,736,138PSYC 40,536 21,385 33,782 2,649 18,227 76,043 2,940 428 78,556 39.7 22.9 $4,254,688 $700,163 $122.2 $63.1$4,954,851SOCI 19,989 11,504 11,199 1,834 12,660 37,197 1,022 651 37,567 23.7 7.7 $2,828,543 $284,951 $155.8 $82.9$3,113,494
Total LA 312,759 220,901 158,753 23,849 84,945 488,447 17,721 2,129 504,040 331.7 113.2 $35,972,127 $3,931,597 $127.6 $79.2$39,903,724
Non-Funded AERS 2,505 3.2MLSC 3,990 5.4NVSC 2,662 4.3
Total MS 9,157 13.0 n/a
Other ELIN 9.1 0.3 $488,141 $10,000 #Div/0!$498,141INTG 333 6 653 4,969 5,629 1 629 5,000 2.0 $236,446 $710.0 $47.3$236,446MLSX 2,637 1,585 2,108 3,694 3,694 4.5 $18,000 $6.8 $4.9$18,000SABRSABX 1,471STLC 938 782 782 782 1.5UGPX 473 354 203 557 4 562 2.1
Total OT 5,852 2,728 2,312 653 4,969 10,662 5 629 10,038 19.1 0.3 $742,587 $10,000 $128.6 $75.0$752,587
Science BIOL 39,947 42,867 40,079 5,977 34,345 123,268 3,360 1,615 125,013 56.7 27.8 $5,212,627 $1,367,310 $164.7 $52.6$6,579,937CHEM 59,532 88,373 11,633 10,626 90,496 201,128 2,338 2,247 201,219 51.7 40.7 $6,740,408 $1,790,482 $143.3 $42.4$8,530,890CLSC 253 16 664 680 65 746 1.1 $87,373 $345.3 $117.2$87,373MATH 85,353 70,110 39,045 7,115 27,472 143,742 3,724 3,052 144,414 99.4 39.3 $11,497,723 $1,746,378 $155.2 $91.7$13,244,101PHYS 35,567 53,245 4,129 7,482 65,809 130,665 3,768 8,663 125,770 52.5 17.2 $7,263,676 $731,599 $224.8 $63.6$7,995,275STAT 22,992 10,309 24,603 16,239 19,226 70,377 1,387 428 71,336 31.0 10.9 $4,630,141 $514,756 $223.8 $72.1$5,144,897
Total SC 243,644 264,920 120,154 47,439 237,348 669,861 14,641 16,004 668,498 292.4 135.9 $35,431,948 $6,150,525 $170.7 $62.2$41,582,473
Prepared by Office of Institutional Studies and Planning, 28-Oct-14, 08:08 AM Section II. Page 3 of 4

College DeptTotal SCH LD UD MS PhD Total
Teaching Supplem't
Excess PhD
Net WSCH
FTEGAT
Teaching SalaryGAT
WSCH (incl. Excess PhD)Faculty Faculty
Cost perWSCHSCHTotal
Texas A&M University – Teaching Analysis ReportUniversity Summary by College by Dept
Fiscal Year 2014
Veterinary M CLVM 1,052 1,050 1,359 2,409 5 2,414 1.6 $36,206 $34.4 $15.0$36,206VIBS 5,788 687 10,312 7,904 13,164 32,068 537 678 31,926 11.7 1.8 $1,107,949 $61,900 $202.1 $36.6$1,169,849VLCS 306 12 272 562 2,749 3,595 28 3,624 1.1 0.1 $154,094 $5,501 $521.6 $44.0$159,595VSCS 247 15 380 4,189 4,584 1 4,585 2.3 $253,520 $1,026.4 $55.3$253,520VTPB 6,229 1,021 12,431 4,343 12,939 30,734 953 305 31,381 10.2 1.6 $1,083,999 $68,001 $184.9 $36.7$1,152,000VTPP 5,391 1,224 9,161 6,527 8,641 25,553 265 65 25,753 8.0 0.2 $820,114 $8,100 $153.6 $32.2$828,214
Total VM 19,013 3,995 33,550 19,716 41,683 98,943 1,788 1,049 99,682 34.9 3.7 $3,455,882 $143,502 $189.3 $36.1$3,599,384
1,363,620 925,155 1,219,557 619,382 1,139,179 4,002,115 103,304 63,658 4,041,760 1,824.5 568.7 $215,068,452 $21,524,823 $173.5 $58.5$236,593,275University Total
Prepared by Office of Institutional Studies and Planning, 28-Oct-14, 08:08 AM Section II. Page 4 of 4
College DeptTotal SCH LD UD MS PhD Total
Teaching Supplem't
Excess PhD
Net WSCH
FTEGAT
Teaching SalaryGAT
WSCH (incl. Excess PhD)Faculty Faculty
Cost perWSCHSCHTotal
Texas A&M University – Teaching Analysis ReportUniversity Summary by College by Dept
(+/-) Change From Last Fiscal Year
FY 2013 - to - FY 2014
Agriculture AGEC - 1,170 + 855 - 6,113 + 4,368 + 5,313 + 4,423 - 515 + 529 + 3,379 + 3.9 - .3 + $ 961,500 + $ 79,665 + $ 16.1 + $ 3.4+ $ 1,041,165ALEC +44,654 + 27,791 + 56,952 + 7,914 + 9,403 + 102,059 + 2,805 + 1,173 +103,692 + 63.8 + 15.8 + $ 5,538,594 + $ 202,378 + $ 1.6 + $ 3.0+ $ 5,740,972ANSC - 392 - 8,130 + 7,524 + 3,307 + 108 + 2,808 + 1,511 + 1,515 + 2,804 - 7.5 + 6.4 - $ 139,690 + $ 177,040 + $ .9 - $ .3+ $ 37,350BAEN - 6,432 - 5,939 - 9,210 - 1,060 - 13,504 - 29,712 - 173 - 1,051 - 28,834 + 4.1 + 9.3 + $ 1,742,922 + $ 305,844 + $ 108.0 + $ 20.1+ $ 2,048,766BCBP + 2,002 + 134 + 5,935 - 619 + 9,989 + 15,439 - 1,066 - 3,016 + 17,389 + 2.9 + 1.5 + $ 431,988 + $ 82,392 + $ 2.4 - $ .5+ $ 514,380CLAG + 51 + 4 + 4 + 4 - 1.0 - $ 27,120 - $ 27,120ENTO + 358 - 1,262 + 2,488 + 3,758 + 1,797 + 6,780 - 204 - 732 + 7,309 + 2.3 + 4.8 + $ 240,575 + $ 307,520 + $ 10.0 + $ 1.6+ $ 548,095ESSM + 2,912 + 2,599 + 6,638 - 2,353 - 7,288 - 404 + 886 + 2,251 - 1,768 + 4.0 + 6.2 + $ 864,776 + $ 292,968 + $ 20.6 + $ 9.5+ $ 1,157,744HRSC + 8,997 + 7,441 + 11,554 + 2,139 + 9,558 + 30,692 - 225 + 763 + 29,704 + 25.6 + 9.1 + $ 2,334,097 + $ 249,486 + $ 18.4 + $ 5.5+ $ 2,583,583NFSC + 1,431 - 1,004 + 4,972 + 2,382 - 3,588 + 2,762 + 194 + 14 + 2,942 - 1.4 + 3.6 + $ 39,546 + $ 101,988 - $ .7 - $ .1+ $ 141,534PLPM + 292 + 813 - 252 + 1,605 - 2,694 - 528 + 109 - 2,033 + 1,614 - 1.5 - 2.6 + $ 36,570 - $ 76,926 - $ 7.1 - $ 1.6- $ 40,356POSC - 1,842 - 1,097 - 2,083 - 4,982 + 2,882 - 5,279 - 209 + 188 - 5,676 - 1.3 - 3.7 + $ 91,647 - $ 89,103 + $ 25.5 + $ 5.7+ $ 2,544RPTS - 12,006 - 4,085 - 15,358 + 4,221 - 2,338 - 17,561 - 1,351 - 71 - 18,840 + 19.6 + 8.8 + $ 2,206,035 + $ 258,497 + $ 44.8 + $ 17.4+ $ 2,464,532SCSC + 1,581 + 141 + 2,704 + 5,151 - 639 + 7,356 - 68 + 283 + 7,006 + 1.6 - 1.0 + $ 342,948 - $ 39,708 + $ .5 + $ .2+ $ 303,240WFSC - 7,268 - 668 - 13,633 - 9,661 - 10,597 - 34,560 - 1,252 - 4,599 - 31,213 - 24.9 + 1.3 - $ 2,233,047 + $ 7,867 - $ 5.5 - $ 3.2- $ 2,225,180
Total AG +33,168 + 17,592 + 52,116 + 16,171 - 1,599 + 84,280 + 442 - 4,787 + 89,510 + 91.2 + 58.1 + $ 12,458,461 + $ 1,832,788 + $ 11.4 + $ 3.8+ $ 14,291,249
Architecture ARCH +61,544 + 85,079 + 59,221 + 63,574 + 47,574 + 255,448 + 9,151 + 5,389 +259,210 + 83.4 + 35.8 + $ 10,316,459 + $ 1,086,500 + $ 3.3 + $ .1+ $ 11,402,959CLAR + 2 + 22 - 476 + 1,350 + 156 + 1,052 + 50 + 1,102 + .4 - 1.5 - $ 35,725 - $ 11.7 - $ 4.6- $ 35,725COSC - 2,577 + 14,792 - 19,711 - 3,361 - 8,280 + 77 - 8,203 - 27.9 - 1.2 - $ 1,707,828 - $ 52,772 - $ 17.8 - $ 6.2- $ 1,760,600LAUP - 5,429 + 8,903 - 8,959 - 40,006 - 16,841 - 56,904 - 19 + 247 - 57,169 - 22.4 - 5.4 - $ 2,584,070 - $ 74,047 - $ 22.8 + $ 1.0- $ 2,658,117VIZA +21,242 + 18,490 + 19,459 + 11,266 + 1,834 + 51,049 + 1,191 + 52,240 + 29.6 + 19.5 + $ 4,019,028 + $ 415,085 + $ 21.8 + $ 9.4+ $ 4,434,113
Total AR +74,782 + 127,285 + 49,533 + 32,824 + 32,723 + 242,365 + 10,451 + 5,636 +247,180 + 63.1 + 47.1 + $ 10,043,589 + $ 1,339,041 - $ 6.7 - $ .6+ $ 11,382,630
Business Adm ACCT - 1,992 - 2,513 - 1,877 + 6,610 + 2,346 + 4,565 - 296 - 559 + 4,828 + 2.7 + .9 + $ 644,776 + $ 45,000 + $ 15.1 + $ 2.0+ $ 689,776CLBA - 2,031 - 291 - 1,716 - 2,167 - 4,174 - 4,174 - 5.5 - $ 154,949 + $ 4.2 + $ 4.5- $ 154,949FINC +21,608 + 1,278 + 30,915 + 11,385 + 4,588 + 48,165 + 363 + 2,358 + 46,171 + 20.6 + 3.4 + $ 4,030,738 + $ 69,827 + $ 5.0 + $ 3.4+ $ 4,100,565INFO + 4,698 + 5,450 + 1,780 + 25,000 - 2,994 + 29,235 - 16 - 113 + 29,332 + 5.4 - 2.6 + $ 2,594,928 - $ 312,120 + $ 9.6 + $ 1.4+ $ 2,282,808MGMT +68,556 + 23,153 + 66,376 + 38,397 + 22,098 + 150,024 + 298 + 5,893 +144,429 + 61.0 + 15.6 + $ 11,811,502 + $ 506,866 + $ 5.8 + $ 2.1+ $ 12,318,368MKTG + 88 + 54 + 671 + 262 + 1,700 + 2,687 - 35 + 3,110 - 458 + .5 - 4.1 + $ 529,684 - $ 96,890 + $ 11.9 + $ 6.0+ $ 432,794
Total BA +90,927 + 27,131 + 96,149 + 79,486 + 27,737 + 230,503 + 314 + 10,689 +220,128 + 84.8 + 13.2 + $ 19,456,679 + $ 212,683 + $ 9.0 + $ 3.4+ $ 19,669,362
Prepared by Office of Data and Research Services, 07-Dec-18, 03:50 PM Section II. Page 1 of 4

College DeptTotal SCH LD UD MS PhD Total
Teaching Supplem't
Excess PhD
Net WSCH
FTEGAT
Teaching SalaryGAT
WSCH (incl. Excess PhD)Faculty Faculty
Cost perWSCHSCHTotal
Texas A&M University – Teaching Analysis ReportUniversity Summary by College by Dept
(+/-) Change From Last Fiscal Year
FY 2013 - to - FY 2014
Education CLED - 20 + .4 + $ 122,726 + $ 13,500 + $2,877.6 + $ 136,226EAHR - 26,270 - 303 - 23,055 - 10,031 - 66,569 - 99,957 + 79 - 3,359 - 96,518 - 48.6 - 6.9 - $ 2,421,102 - $ 247,506 + $ 20.2 + $ 10.4- $ 2,668,608EPSY +12,800 + 1,724 + 6,719 + 25,445 + 5,886 + 39,774 + 361 + 3,081 + 37,053 + 4.2 - 3.1 + $ 2,413,280 - $ 63,128 - $ 14.1 - $ 1.2+ $ 2,350,152HLKN +82,974 + 23,380 + 86,136 + 23,083 - 1,401 + 131,198 - 3,820 + 4,173 +123,205 + 15.2 + 45.7 + $ 3,934,850 + $ 1,313,650 - $ 2.8 - $ .5+ $ 5,248,500TLAC + 760 + 6,214 - 6,983 + 6,170 + 3,310 + 8,712 - 683 - 1,349 + 9,378 + 14.3 - 9.0 + $ 2,473,570 - $ 324,375 + $ 13.4 + $ 4.5+ $ 2,149,195
Total ED +70,244 + 31,015 + 62,818 + 44,668 - 58,773 + 79,727 - 4,063 + 2,545 + 73,118 - 15.0 + 27.1 + $ 6,523,324 + $ 692,141 - $ .9 + $ 1.3+ $ 7,215,465
Engineering AERO - 9,133 - 3,141 - 17,552 - 7,731 - 29,389 - 57,813 - 1,716 - 3,474 - 56,054 - 31.8 - 1.4 - $ 3,975,001 - $ 82,350 - $ 26.5 - $ 3.1- $ 4,057,351BMEN - 852 - 2,670 - 876 + 4,159 + 855 + 1,468 - 560 + 335 + 573 + 1.2 - 1.8 - $ 100,233 - $ 63,708 + $ 5.8 - $ 1.6- $ 163,941CHEN + 8,368 + 4,481 + 12,104 + 18,347 + 20,506 + 55,439 + 995 - 2,334 + 58,769 + 16.9 - 4.7 + $ 3,449,888 - $ 229,000 + $ 17.2 + $ 1.7+ $ 3,220,888CLED + 172 + 150 + 251 + 401 + 401 + .1 + $ 7,633 + $ 44.4 + $ 19.0+ $ 7,633CLEN + 3,142 + 7,899 + 951 + 552 - 2,708 + 6,694 + 323 - 203 + 7,220 - 7.8 + 21.0 + $ 284,652 + $ 862,200 + $ 31.7 + $ 13.4+ $ 1,146,852CSCE + 8,956 + 3,226 + 10,470 + 35,706 - 3,605 + 45,797 + 676 - 7,374 + 53,847 - 5.0 + 1.5 - $ 589,980 + $ 61,200 - $ 28.4 - $ 6.7- $ 528,780CVEN + 3,099 + 973 - 2,075 + 22,064 + 3,351 + 24,312 - 42 + 3,536 + 20,735 + 3.7 - 2.6 + $ 2,044,668 - $ 62,724 + $ 11.5 + $ 1.7+ $ 1,981,944ECEN - 19,387 - 16,858 - 17,595 - 15,948 - 81,637 - 132,038 - 2,838 - 8,386 -126,490 - 53.8 - 6.3 - $ 7,074,540 - $ 227,053 - $ 17.5 - $ 2.3- $ 7,301,593ETID +28,740 + 13,497 + 44,557 + 12,421 + 20,301 + 90,776 + 1,655 + 667 + 91,764 + 42.7 + 12.1 + $ 6,146,106 + $ 471,808 + $ 12.7 + $ 1.3+ $ 6,617,914ISEN +23,789 + 10,930 + 48,712 + 31,523 + 21,576 + 112,741 + 3,740 + 911 +115,570 + 46.8 + 22.4 + $ 6,896,268 + $ 869,468 + $ 31.7 + $ 8.6+ $ 7,765,736MEEN - 29,122 - 20,415 - 38,153 - 21,933 - 106,720 - 187,220 - 5,841 - 1,678 -191,382 - 61.6 + 4.3 - $ 7,504,736 + $ 188,493 - $ .9 + $ 1.5- $ 7,316,243MSEN + 2,287 + 1,993 + 1,847 + 2,099 + 13,702 + 19,641 + 256 + 546 + 19,351 + 5.7 + $ 761,081 + $ 332.8 + $ 39.3+ $ 761,081NUEN - 1,029 + 1,159 - 10,168 + 2,553 + 17,130 + 10,674 + 339 - 3,540 + 14,553 - 1.9 - .5 + $ 363,595 - $ 20,235 + $ 22.4 - $ 1.9+ $ 343,360PETE + 3,171 + 821 + 6,836 + 4,998 + 4,710 + 17,365 + 734 - 1,384 + 19,483 - 1.9 + 5.4 + $ 983,070 + $ 212,919 + $ 7.9 + $ 1.3+ $ 1,195,989
Total EN +22,202 + 2,045 + 39,310 + 88,812 - 121,928 + 8,239 - 2,278 - 22,379 + 28,340 - 46.6 + 49.4 + $ 1,692,471 + $ 1,981,018 - $ 2.5 + $ .6+ $ 3,673,489
G. Bush Scho BUSH + 2,196 - 36 + 461 + 7,730 + 283 + 8,438 + 31 - 280 + 8,749 + 11.0 + $ 1,121,096 - $ 2.0 - $ .7+ $ 1,121,096Total GB + 2,196 - 36 + 461 + 7,730 + 283 + 8,438 + 31 - 280 + 8,749 + 11.0 + $ 1,121,096 - $ 2.0 - $ .7+ $ 1,121,096
Geosciences 3614 + .1 + $ 14,538 + $ 14,538ATMO + 1,032 + 1,176 + 2,001 - 433 - 3,577 - 833 + 1,010 - 3,141 + 3,317 - 1.5 - 1.1 + $ 686,733 - $ 35,163 + $ 18.3 + $ 5.2+ $ 651,570CLGE - 77 + 178 - 595 + 15 - 152 - 554 - 52 - 606 - .1 - $ 110,096 - $ 232.9 - $ 52.5- $ 110,096GEOG +23,277 + 22,584 + 13,697 - 493 + 3,832 + 39,620 + 3,394 - 221 + 43,236 + 12.3 + 6.9 + $ 1,893,691 + $ 255,970 + $ .1 + $ .1+ $ 2,149,661GEPL + 5,002 + 4,530 + 6,696 + 208 + 8,801 + 20,234 - 347 - 177 + 20,064 + 4.9 + 10.2 + $ 471,328 + $ 428,948 - $ 2.7 - $ 1.1+ $ 900,276OCNG + 9,201 + 12,261 + 4,836 + 3,538 + 7,495 + 28,130 + 952 - 139 + 29,221 + 11.1 + 6.6 + $ 1,290,712 + $ 297,225 - $ 44.0 - $ 7.5+ $ 1,587,937
Total GE +38,434 + 40,729 + 26,634 + 2,834 + 16,399 + 86,597 + 4,957 - 3,678 + 95,232 + 26.7 + 22.6 + $ 4,246,906 + $ 946,980 - $ 4.7 - $ .6+ $ 5,193,886
Law CLSL +20,549 + 98,841 + 39.7 + $ 5,082,106 + $ 247.3 + $ 51.4+ $ 5,082,106Total SL +20,549 + 98,841 + 39.7 #Error + $ 5,082,106 + $ 247.3 #Error+ $ 5,082,106
Prepared by Office of Data and Research Services, 07-Dec-18, 03:50 PM Section II. Page 2 of 4
College DeptTotal SCH LD UD MS PhD Total
Teaching Supplem't
Excess PhD
Net WSCH
FTEGAT
Teaching SalaryGAT
WSCH (incl. Excess PhD)Faculty Faculty
Cost perWSCHSCHTotal
Texas A&M University – Teaching Analysis ReportUniversity Summary by College by Dept
(+/-) Change From Last Fiscal Year
FY 2013 - to - FY 2014
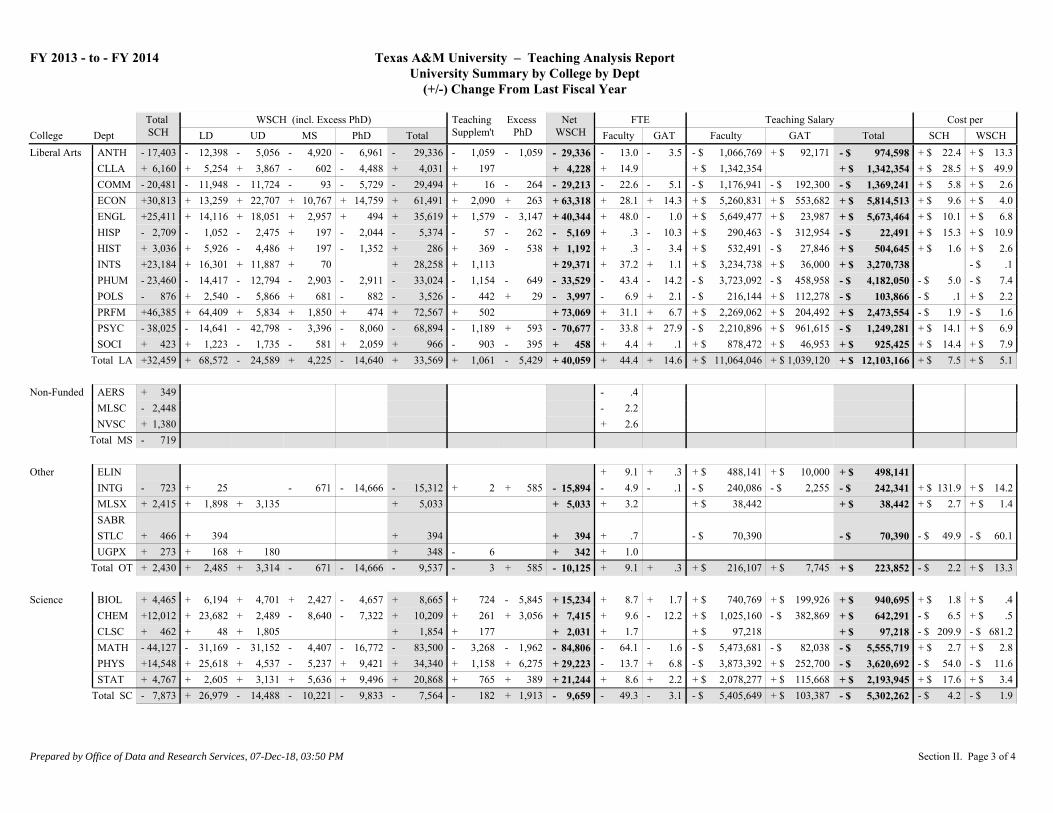
Liberal Arts ANTH - 17,403 - 12,398 - 5,056 - 4,920 - 6,961 - 29,336 - 1,059 - 1,059 - 29,336 - 13.0 - 3.5 - $ 1,066,769 + $ 92,171 + $ 22.4 + $ 13.3- $ 974,598CLLA + 6,160 + 5,254 + 3,867 - 602 - 4,488 + 4,031 + 197 + 4,228 + 14.9 + $ 1,342,354 + $ 28.5 + $ 49.9+ $ 1,342,354COMM - 20,481 - 11,948 - 11,724 - 93 - 5,729 - 29,494 + 16 - 264 - 29,213 - 22.6 - 5.1 - $ 1,176,941 - $ 192,300 + $ 5.8 + $ 2.6- $ 1,369,241ECON +30,813 + 13,259 + 22,707 + 10,767 + 14,759 + 61,491 + 2,090 + 263 + 63,318 + 28.1 + 14.3 + $ 5,260,831 + $ 553,682 + $ 9.6 + $ 4.0+ $ 5,814,513ENGL +25,411 + 14,116 + 18,051 + 2,957 + 494 + 35,619 + 1,579 - 3,147 + 40,344 + 48.0 - 1.0 + $ 5,649,477 + $ 23,987 + $ 10.1 + $ 6.8+ $ 5,673,464HISP - 2,709 - 1,052 - 2,475 + 197 - 2,044 - 5,374 - 57 - 262 - 5,169 + .3 - 10.3 + $ 290,463 - $ 312,954 + $ 15.3 + $ 10.9- $ 22,491HIST + 3,036 + 5,926 - 4,486 + 197 - 1,352 + 286 + 369 - 538 + 1,192 + .3 - 3.4 + $ 532,491 - $ 27,846 + $ 1.6 + $ 2.6+ $ 504,645INTS +23,184 + 16,301 + 11,887 + 70 + 28,258 + 1,113 + 29,371 + 37.2 + 1.1 + $ 3,234,738 + $ 36,000 - $ .1+ $ 3,270,738PHUM - 23,460 - 14,417 - 12,794 - 2,903 - 2,911 - 33,024 - 1,154 - 649 - 33,529 - 43.4 - 14.2 - $ 3,723,092 - $ 458,958 - $ 5.0 - $ 7.4- $ 4,182,050POLS - 876 + 2,540 - 5,866 + 681 - 882 - 3,526 - 442 + 29 - 3,997 - 6.9 + 2.1 - $ 216,144 + $ 112,278 - $ .1 + $ 2.2- $ 103,866PRFM +46,385 + 64,409 + 5,834 + 1,850 + 474 + 72,567 + 502 + 73,069 + 31.1 + 6.7 + $ 2,269,062 + $ 204,492 - $ 1.9 - $ 1.6+ $ 2,473,554PSYC - 38,025 - 14,641 - 42,798 - 3,396 - 8,060 - 68,894 - 1,189 + 593 - 70,677 - 33.8 + 27.9 - $ 2,210,896 + $ 961,615 + $ 14.1 + $ 6.9- $ 1,249,281SOCI + 423 + 1,223 - 1,735 - 581 + 2,059 + 966 - 903 - 395 + 458 + 4.4 + .1 + $ 878,472 + $ 46,953 + $ 14.4 + $ 7.9+ $ 925,425
Total LA +32,459 + 68,572 - 24,589 + 4,225 - 14,640 + 33,569 + 1,061 - 5,429 + 40,059 + 44.4 + 14.6 + $ 11,064,046 + $ 1,039,120 + $ 7.5 + $ 5.1+ $ 12,103,166
Non-Funded AERS + 349 - .4 MLSC - 2,448 - 2.2 NVSC + 1,380 + 2.6
Total MS - 719
Other ELIN + 9.1 + .3 + $ 488,141 + $ 10,000 + $ 498,141INTG - 723 + 25 - 671 - 14,666 - 15,312 + 2 + 585 - 15,894 - 4.9 - .1 - $ 240,086 - $ 2,255 + $ 131.9 + $ 14.2- $ 242,341MLSX + 2,415 + 1,898 + 3,135 + 5,033 + 5,033 + 3.2 + $ 38,442 + $ 2.7 + $ 1.4+ $ 38,442SABR STLC + 466 + 394 + 394 + 394 + .7 - $ 70,390 - $ 49.9 - $ 60.1- $ 70,390UGPX + 273 + 168 + 180 + 348 - 6 + 342 + 1.0
Total OT + 2,430 + 2,485 + 3,314 - 671 - 14,666 - 9,537 - 3 + 585 - 10,125 + 9.1 + .3 + $ 216,107 + $ 7,745 - $ 2.2 + $ 13.3+ $ 223,852
Science BIOL + 4,465 + 6,194 + 4,701 + 2,427 - 4,657 + 8,665 + 724 - 5,845 + 15,234 + 8.7 + 1.7 + $ 740,769 + $ 199,926 + $ 1.8 + $ .4+ $ 940,695CHEM +12,012 + 23,682 + 2,489 - 8,640 - 7,322 + 10,209 + 261 + 3,056 + 7,415 + 9.6 - 12.2 + $ 1,025,160 - $ 382,869 - $ 6.5 + $ .5+ $ 642,291CLSC + 462 + 48 + 1,805 + 1,854 + 177 + 2,031 + 1.7 + $ 97,218 - $ 209.9 - $ 681.2+ $ 97,218MATH - 44,127 - 31,169 - 31,152 - 4,407 - 16,772 - 83,500 - 3,268 - 1,962 - 84,806 - 64.1 - 1.6 - $ 5,473,681 - $ 82,038 + $ 2.7 + $ 2.8- $ 5,555,719PHYS +14,548 + 25,618 + 4,537 - 5,237 + 9,421 + 34,340 + 1,158 + 6,275 + 29,223 - 13.7 + 6.8 - $ 3,873,392 + $ 252,700 - $ 54.0 - $ 11.6- $ 3,620,692STAT + 4,767 + 2,605 + 3,131 + 5,636 + 9,496 + 20,868 + 765 + 389 + 21,244 + 8.6 + 2.2 + $ 2,078,277 + $ 115,668 + $ 17.6 + $ 3.4+ $ 2,193,945
Total SC - 7,873 + 26,979 - 14,488 - 10,221 - 9,833 - 7,564 - 182 + 1,913 - 9,659 - 49.3 - 3.1 - $ 5,405,649 + $ 103,387 - $ 4.2 - $ 1.9- $ 5,302,262
Prepared by Office of Data and Research Services, 07-Dec-18, 03:50 PM Section II. Page 3 of 4

College DeptTotal SCH LD UD MS PhD Total
Teaching Supplem't
Excess PhD
Net WSCH
FTEGAT
Teaching SalaryGAT
WSCH (incl. Excess PhD)Faculty Faculty
Cost perWSCHSCHTotal
Texas A&M University – Teaching Analysis ReportUniversity Summary by College by Dept
(+/-) Change From Last Fiscal Year
FY 2013 - to - FY 2014
Veterinary M CLVM - 983 - 968 - 1,093 - 2,061 - 18 - 2,079 - 1.7 + $ 55,639 + $ 29.0 + $ 12.6+ $ 55,639VIBS - 4,751 - 2,366 - 8,908 + 187 - 27,325 - 38,411 - 834 - 2,306 - 36,939 - 21.8 - 2.4 + $ 529,247 - $ 115,348 + $ 40.8 + $ 9.0+ $ 413,899VLCS - 15 + 6 + 355 - 1,237 + 302 - 573 + 36 - 537 + .1 + .3 + $ 115,717 + $ 11,002 + $ 214.6 + $ 19.3+ $ 126,719VSCS + 34 - 43 - 65 - 216 + 2,361 + 2,036 - 3 + 2,034 + 1.9 + $ 336,494 + $ 655.6 + $ 31.4+ $ 336,494VTPB - 7,953 - 1,586 - 24,498 + 10,465 + 11,403 - 4,215 - 1,502 + 1,527 - 7,244 + 1.4 + 1.6 + $ 1,246,905 + $ 97,005 + $ 72.0 + $ 9.8+ $ 1,343,910VTPP - 2,671 + 1,376 - 9,439 + 4,134 - 14,439 - 18,368 - 409 - 720 - 18,057 - 6.3 + .8 + $ 2,951 + $ 32,400 + $ 18.4 + $ 5.1+ $ 35,351
Total VM - 16,340 - 3,580 - 43,647 + 13,334 - 27,698 - 61,592 - 2,730 - 1,499 - 62,823 - 26.4 + .2 + $ 2,286,953 + $ 25,059 + $ 52.9 + $ 9.1+ $ 2,312,012
Prepared by Office of Data and Research Services, 07-Dec-18, 03:50 PM Section II. Page 4 of 4

College DeptTotal SCH LD UD MS PhD Total
Teaching Supplem't
Excess PhD
Net WSCH
FTEGAT
Teaching SalaryGAT
WSCH (incl. Excess PhD)Faculty Faculty
Cost perWSCHSCHTotal
Texas A&M University – Teaching Analysis ReportUniversity Summary by College by Dept
(+/-%) Percent Change From Last Fiscal Year
FY 2013 - to - FY 2014
Agriculture AGEC - 2% + 2% - 5% + 11% + 14% + 2% - 5% + 264% + 1% + 4% - 1% + 9% + 5% + 10% + 7%+ 8%ALEC + 39% + 93% + 37% + 11% + 17% + 33% + 23% + 147% + 32% + 46% + 34% + 45% + 13% + 1% + 7%+ 41%ANSC - 9% + 6% + 9% + 1% + 9% + 995% + 1% - 6% + 12% - 1% + 10% + 1% - 1% BAEN - 16% - 35% - 11% - 4% - 20% - 15% - 3% - 32% - 15% + 6% + 77% + 20% + 64% + 46% + 43%+ 22%BCBP + 4% + 4% + 6% - 3% + 8% + 6% - 24% - 37% + 7% + 4% + 5% + 6% + 5% + 1% - 1%+ 6%CLAG + 100% + 100% + 100% + 100% - 100% - 100% - 100%ENTO + 1% - 3% + 4% + 26% + 2% + 3% - 3% - 9% + 4% + 5% + 18% + 5% + 26% + 9% + 5%+ 9%ESSM + 10% + 14% + 17% - 8% - 17% + 17% + 159% - 1% + 8% + 103% + 18% + 113% + 12% + 25%+ 23%HRSC + 18% + 19% + 21% + 10% + 24% + 20% - 3% + 28% + 18% + 36% + 47% + 31% + 39% + 11% + 11%+ 31%NFSC + 2% - 1% + 10% + 13% - 10% + 2% + 3% + 1% + 2% - 2% + 13% + 11% + 1%PLPM + 2% + 13% - 1% + 24% - 8% - 1% + 3% - 56% + 2% - 5% - 20% + 1% - 17% - 3% - 3%- 1%POSC - 15% - 12% - 14% - 52% + 32% - 13% - 13% + 100% - 13% - 8% - 55% + 6% - 48% + 18% + 15% RPTS - 12% - 12% - 13% + 25% - 6% - 8% - 17% - 55% - 9% + 20% + 16% + 26% + 12% + 40% + 35%+ 23%SCSC + 7% + 1% + 10% + 32% - 1% + 7% - 2% + 20% + 7% + 4% - 8% + 9% - 8% + 7%WFSC - 20% - 5% - 23% - 26% - 13% - 18% - 18% - 84% - 16% - 25% + 5% - 23% + 1% - 2% - 6%- 21%
Total AG + 4% + 4% + 5% + 4% + % + 3% + % - 13% + 3% + 9% + 15% + 12% + 13% + 7% + 8%+ 12%
Architecture ARCH + 65% + 70% + 72% + 62% + 75% + 69% + 57% + 161% + 68% + 55% + 126% + 65% + 149% + 2% + 68%CLAR + 100% - 6% + 276% + 100% + 12% + 100% + 12% + 4% - 43% - 41% - 41% - 48%- 41%COSC - 3% + 32% - 15% - 12% - 4% + 1% - 4% - 22% - 7% - 15% - 9% - 11% - 11%- 14%LAUP - 10% + 36% - 13% - 31% - 22% - 19% + 5% - 19% - 16% - 22% - 18% - 11% - 8% + 2%- 17%VIZA + 42% + 37% + 64% + 24% + 281% + 40% + 42% + 40% + 43% + 56% + 67% + 51% + 16% + 18%+ 65%
Total AR + 27% + 52% + 15% + 11% + 23% + 24% + 31% + 69% + 24% + 13% + 44% + 21% + 46% - 4% - 1%+ 22%
Business Adm ACCT - 3% - 7% - 4% + 15% + 21% + 3% - 14% - 100% + 4% + 4% + 250% + 6% + 250% + 9% + 2%+ 6%CLBA - 13% - 2% - 38% - 20% - 15% - 15% - 22% - 9% + 4% + 7%- 9%FINC + 26% + 110% + 28% + 21% + 16% + 25% + 35% + 68% + 24% + 26% + 36% + 30% + 30% + 3% + 5%+ 30%INFO + 3% + 4% + 1% + 20% - 13% + 7% - 3% + 7% + 4% - 4% + 12% - 15% + 6% + 3%+ 9%MGMT + 94% + 94% + 98% + 99% + 110% + 99% + 34% + 507% + 96% + 90% + 121% + 100% + 137% + 3% + 3%+ 101%MKTG + 16% + 1% + 2% + 17% + 4% - 1% +2,233% - 1% + 1% - 69% + 7% - 65% + 5% + 6%+ 5%
Total BA + 21% + 14% + 22% + 28% + 30% + 23% + 3% + 118% + 22% + 20% + 13% + 28% + 7% + 5% + 5%+ 28%
Prepared by Office of Data and Research Services, 07-Dec-18, 03:51 PM Section II. Page 1 of 4
College DeptTotal SCH LD UD MS PhD Total
Teaching Supplem't
Excess PhD
Net WSCH
FTEGAT
Teaching SalaryGAT
WSCH (incl. Excess PhD)Faculty Faculty
Cost perWSCHSCHTotal
Texas A&M University – Teaching Analysis ReportUniversity Summary by College by Dept
(+/-%) Percent Change From Last Fiscal Year
FY 2013 - to - FY 2014
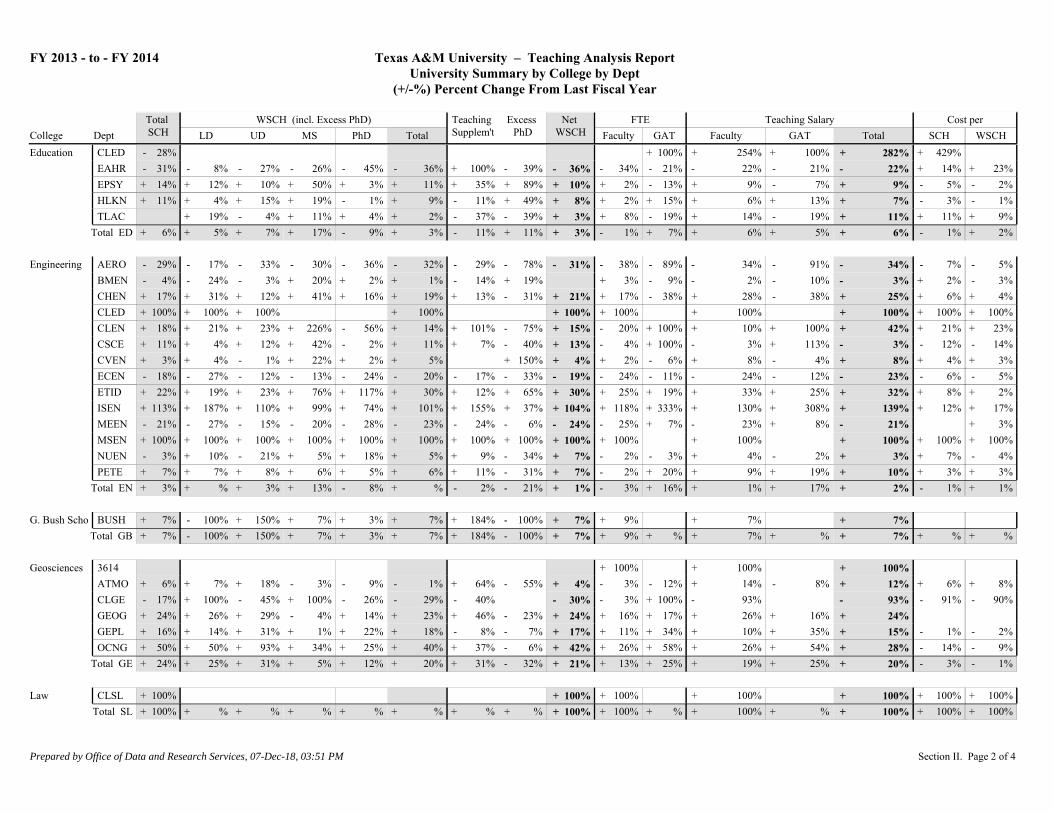
Education CLED - 28% + 100% + 254% + 100% + 429% + 282%EAHR - 31% - 8% - 27% - 26% - 45% - 36% + 100% - 39% - 36% - 34% - 21% - 22% - 21% + 14% + 23%- 22%EPSY + 14% + 12% + 10% + 50% + 3% + 11% + 35% + 89% + 10% + 2% - 13% + 9% - 7% - 5% - 2%+ 9%HLKN + 11% + 4% + 15% + 19% - 1% + 9% - 11% + 49% + 8% + 2% + 15% + 6% + 13% - 3% - 1%+ 7%TLAC + 19% - 4% + 11% + 4% + 2% - 37% - 39% + 3% + 8% - 19% + 14% - 19% + 11% + 9%+ 11%
Total ED + 6% + 5% + 7% + 17% - 9% + 3% - 11% + 11% + 3% - 1% + 7% + 6% + 5% - 1% + 2%+ 6%
Engineering AERO - 29% - 17% - 33% - 30% - 36% - 32% - 29% - 78% - 31% - 38% - 89% - 34% - 91% - 7% - 5%- 34%BMEN - 4% - 24% - 3% + 20% + 2% + 1% - 14% + 19% + 3% - 9% - 2% - 10% + 2% - 3%- 3%CHEN + 17% + 31% + 12% + 41% + 16% + 19% + 13% - 31% + 21% + 17% - 38% + 28% - 38% + 6% + 4%+ 25%CLED + 100% + 100% + 100% + 100% + 100% + 100% + 100% + 100% + 100%+ 100%CLEN + 18% + 21% + 23% + 226% - 56% + 14% + 101% - 75% + 15% - 20% + 100% + 10% + 100% + 21% + 23%+ 42%CSCE + 11% + 4% + 12% + 42% - 2% + 11% + 7% - 40% + 13% - 4% + 100% - 3% + 113% - 12% - 14%- 3%CVEN + 3% + 4% - 1% + 22% + 2% + 5% + 150% + 4% + 2% - 6% + 8% - 4% + 4% + 3%+ 8%ECEN - 18% - 27% - 12% - 13% - 24% - 20% - 17% - 33% - 19% - 24% - 11% - 24% - 12% - 6% - 5%- 23%ETID + 22% + 19% + 23% + 76% + 117% + 30% + 12% + 65% + 30% + 25% + 19% + 33% + 25% + 8% + 2%+ 32%ISEN + 113% + 187% + 110% + 99% + 74% + 101% + 155% + 37% + 104% + 118% + 333% + 130% + 308% + 12% + 17%+ 139%MEEN - 21% - 27% - 15% - 20% - 28% - 23% - 24% - 6% - 24% - 25% + 7% - 23% + 8% + 3%- 21%MSEN + 100% + 100% + 100% + 100% + 100% + 100% + 100% + 100% + 100% + 100% + 100% + 100% + 100%+ 100%NUEN - 3% + 10% - 21% + 5% + 18% + 5% + 9% - 34% + 7% - 2% - 3% + 4% - 2% + 7% - 4%+ 3%PETE + 7% + 7% + 8% + 6% + 5% + 6% + 11% - 31% + 7% - 2% + 20% + 9% + 19% + 3% + 3%+ 10%
Total EN + 3% + % + 3% + 13% - 8% + % - 2% - 21% + 1% - 3% + 16% + 1% + 17% - 1% + 1%+ 2%
G. Bush Scho BUSH + 7% - 100% + 150% + 7% + 3% + 7% + 184% - 100% + 7% + 9% + 7% + 7%Total GB + 7% - 100% + 150% + 7% + 3% + 7% + 184% - 100% + 7% + 9% + % + 7% + % + % + %+ 7%
Geosciences 3614 + 100% + 100% + 100%ATMO + 6% + 7% + 18% - 3% - 9% - 1% + 64% - 55% + 4% - 3% - 12% + 14% - 8% + 6% + 8%+ 12%CLGE - 17% + 100% - 45% + 100% - 26% - 29% - 40% - 30% - 3% + 100% - 93% - 91% - 90%- 93%GEOG + 24% + 26% + 29% - 4% + 14% + 23% + 46% - 23% + 24% + 16% + 17% + 26% + 16% + 24%GEPL + 16% + 14% + 31% + 1% + 22% + 18% - 8% - 7% + 17% + 11% + 34% + 10% + 35% - 1% - 2%+ 15%OCNG + 50% + 50% + 93% + 34% + 25% + 40% + 37% - 6% + 42% + 26% + 58% + 26% + 54% - 14% - 9%+ 28%
Total GE + 24% + 25% + 31% + 5% + 12% + 20% + 31% - 32% + 21% + 13% + 25% + 19% + 25% - 3% - 1%+ 20%
Law CLSL + 100% + 100% + 100% + 100% + 100% + 100%+ 100%Total SL + 100% + % + % + % + % + % + % + % + 100% + 100% + % + 100% + % + 100% + 100%+ 100%
Prepared by Office of Data and Research Services, 07-Dec-18, 03:51 PM Section II. Page 2 of 4
College DeptTotal SCH LD UD MS PhD Total
Teaching Supplem't
Excess PhD
Net WSCH
FTEGAT
Teaching SalaryGAT
WSCH (incl. Excess PhD)Faculty Faculty
Cost perWSCHSCHTotal
Texas A&M University – Teaching Analysis ReportUniversity Summary by College by Dept
(+/-%) Percent Change From Last Fiscal Year
FY 2013 - to - FY 2014
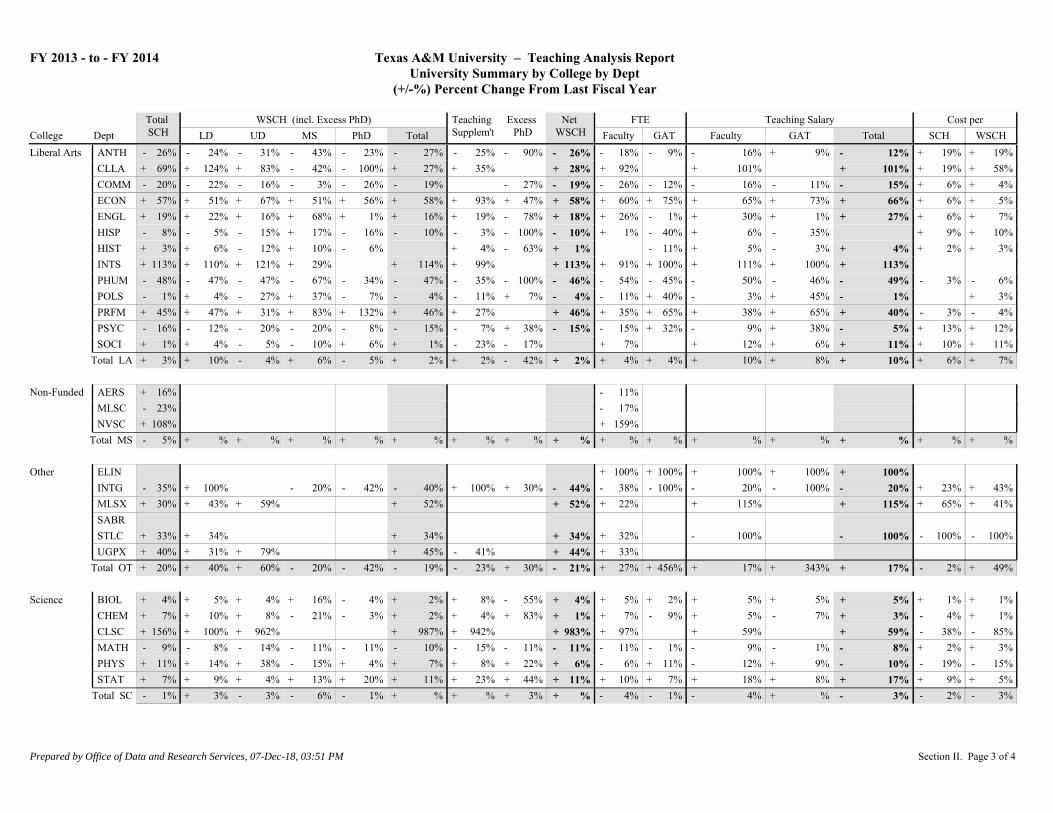
Liberal Arts ANTH - 26% - 24% - 31% - 43% - 23% - 27% - 25% - 90% - 26% - 18% - 9% - 16% + 9% + 19% + 19%- 12%CLLA + 69% + 124% + 83% - 42% - 100% + 27% + 35% + 28% + 92% + 101% + 19% + 58%+ 101%COMM - 20% - 22% - 16% - 3% - 26% - 19% - 27% - 19% - 26% - 12% - 16% - 11% + 6% + 4%- 15%ECON + 57% + 51% + 67% + 51% + 56% + 58% + 93% + 47% + 58% + 60% + 75% + 65% + 73% + 6% + 5%+ 66%ENGL + 19% + 22% + 16% + 68% + 1% + 16% + 19% - 78% + 18% + 26% - 1% + 30% + 1% + 6% + 7%+ 27%HISP - 8% - 5% - 15% + 17% - 16% - 10% - 3% - 100% - 10% + 1% - 40% + 6% - 35% + 9% + 10% HIST + 3% + 6% - 12% + 10% - 6% + 4% - 63% + 1% - 11% + 5% - 3% + 2% + 3%+ 4%INTS + 113% + 110% + 121% + 29% + 114% + 99% + 113% + 91% + 100% + 111% + 100% + 113%PHUM - 48% - 47% - 47% - 67% - 34% - 47% - 35% - 100% - 46% - 54% - 45% - 50% - 46% - 3% - 6%- 49%POLS - 1% + 4% - 27% + 37% - 7% - 4% - 11% + 7% - 4% - 11% + 40% - 3% + 45% + 3%- 1%PRFM + 45% + 47% + 31% + 83% + 132% + 46% + 27% + 46% + 35% + 65% + 38% + 65% - 3% - 4%+ 40%PSYC - 16% - 12% - 20% - 20% - 8% - 15% - 7% + 38% - 15% - 15% + 32% - 9% + 38% + 13% + 12%- 5%SOCI + 1% + 4% - 5% - 10% + 6% + 1% - 23% - 17% + 7% + 12% + 6% + 10% + 11%+ 11%
Total LA + 3% + 10% - 4% + 6% - 5% + 2% + 2% - 42% + 2% + 4% + 4% + 10% + 8% + 6% + 7%+ 10%
Non-Funded AERS + 16% - 11% MLSC - 23% - 17% NVSC + 108% + 159%
Total MS - 5% + % + % + % + % + % + % + % + % + % + % + % + % + % + %+ %
Other ELIN + 100% + 100% + 100% + 100% + 100%INTG - 35% + 100% - 20% - 42% - 40% + 100% + 30% - 44% - 38% - 100% - 20% - 100% + 23% + 43%- 20%MLSX + 30% + 43% + 59% + 52% + 52% + 22% + 115% + 65% + 41%+ 115%SABR STLC + 33% + 34% + 34% + 34% + 32% - 100% - 100% - 100%- 100%UGPX + 40% + 31% + 79% + 45% - 41% + 44% + 33%
Total OT + 20% + 40% + 60% - 20% - 42% - 19% - 23% + 30% - 21% + 27% + 456% + 17% + 343% - 2% + 49%+ 17%
Science BIOL + 4% + 5% + 4% + 16% - 4% + 2% + 8% - 55% + 4% + 5% + 2% + 5% + 5% + 1% + 1%+ 5%CHEM + 7% + 10% + 8% - 21% - 3% + 2% + 4% + 83% + 1% + 7% - 9% + 5% - 7% - 4% + 1%+ 3%CLSC + 156% + 100% + 962% + 987% + 942% + 983% + 97% + 59% - 38% - 85%+ 59%MATH - 9% - 8% - 14% - 11% - 11% - 10% - 15% - 11% - 11% - 11% - 1% - 9% - 1% + 2% + 3%- 8%PHYS + 11% + 14% + 38% - 15% + 4% + 7% + 8% + 22% + 6% - 6% + 11% - 12% + 9% - 19% - 15%- 10%STAT + 7% + 9% + 4% + 13% + 20% + 11% + 23% + 44% + 11% + 10% + 7% + 18% + 8% + 9% + 5%+ 17%
Total SC - 1% + 3% - 3% - 6% - 1% + % + % + 3% + % - 4% - 1% - 4% + % - 2% - 3%- 3%
Prepared by Office of Data and Research Services, 07-Dec-18, 03:51 PM Section II. Page 3 of 4
College DeptTotal SCH LD UD MS PhD Total
Teaching Supplem't
Excess PhD
Net WSCH
FTEGAT
Teaching SalaryGAT
WSCH (incl. Excess PhD)Faculty Faculty
Cost perWSCHSCHTotal
Texas A&M University – Teaching Analysis ReportUniversity Summary by College by Dept
(+/-%) Percent Change From Last Fiscal Year
FY 2013 - to - FY 2014
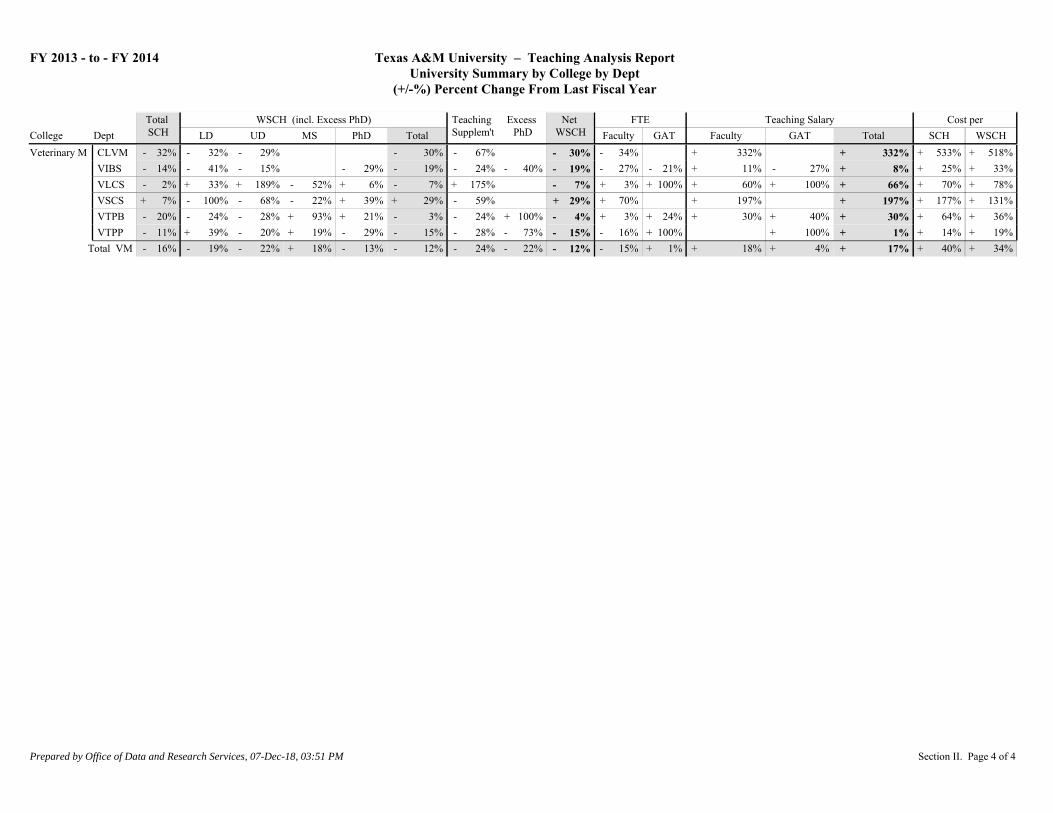
Veterinary M CLVM - 32% - 32% - 29% - 30% - 67% - 30% - 34% + 332% + 533% + 518%+ 332%VIBS - 14% - 41% - 15% - 29% - 19% - 24% - 40% - 19% - 27% - 21% + 11% - 27% + 25% + 33%+ 8%VLCS - 2% + 33% + 189% - 52% + 6% - 7% + 175% - 7% + 3% + 100% + 60% + 100% + 70% + 78%+ 66%VSCS + 7% - 100% - 68% - 22% + 39% + 29% - 59% + 29% + 70% + 197% + 177% + 131%+ 197%VTPB - 20% - 24% - 28% + 93% + 21% - 3% - 24% + 100% - 4% + 3% + 24% + 30% + 40% + 64% + 36%+ 30%VTPP - 11% + 39% - 20% + 19% - 29% - 15% - 28% - 73% - 15% - 16% + 100% + 100% + 14% + 19%+ 1%
Total VM - 16% - 19% - 22% + 18% - 13% - 12% - 24% - 22% - 12% - 15% + 1% + 18% + 4% + 40% + 34%+ 17%
Prepared by Office of Data and Research Services, 07-Dec-18, 03:51 PM Section II. Page 4 of 4

Funding AreaTotal SCH LD UD MS PhD Total
Teaching Supplem't
Excess PhD
Net WSCH
FTEGAT
Teaching SalaryGAT
WSCH (incl. Excess PhD)Faculty Faculty
Cost perWSCHSCHTotal
Texas A&M University – Teaching Analysis ReportUniversity Summary by Funding Code
Fiscal Year 2014
Texas A&M Univ.
(01) Liberal Arts 410,668 265,757 183,162 78,220 149,367 676,506 19,296 5,919 689,883 461.7 73.7 $51,639,768 $2,696,292 $132.3 $78.8$54,336,060(02) Science 284,239 269,364 290,591 112,681 430,661 1,103,297 28,636 22,4311,109,502 377.9 64.7 $42,464,671 $2,732,706 $159.0 $40.7$45,197,377(03) Fine Art 40,511 49,042 14,881 2,575 298 66,796 963 67,760 34.1 1.3 $2,422,518 $35,034 $60.7 $36.3$2,457,552(04) Teacher Educ. 47,859 16,541 38,471 23,770 53,941 132,723 946 3,641 130,027 90.2 3.4 $9,303,204 $127,003 $197.0 $72.5$9,430,207(05) Agriculture 66,880 46,074 91,427 41,873 44,525 223,899 10,085 2,740 231,243 91.1 1.8 $9,783,230 $67,751 $147.3 $42.6$9,850,981(06) Engineering 224,509 169,720 341,937 263,496 410,663 1,185,817 33,698 23,7901,195,724 382.9 14.3 $50,270,343 $549,795 $226.4 $42.5$50,820,139(07) Home Economic 2,141 1,257 1,480 19 100 2,856 10 2,866 2.5 0.1 $168,443 $3,750 $80.4 $60.1$172,193(08) 08 20,549 98,841 35.5 $4,529,906 $220.4 $45.8$4,529,906(13) Phys. Training 15,873 21,680 21,680 8 21,688 17.0 3.3 $1,085,016 $107,712 $75.1 $55.0$1,192,728(14) Health Service 42,060 26,809 26,078 4,399 6,035 63,320 1,402 29 64,693 22.3 3.4 $1,836,349 $111,294 $46.3 $30.1$1,947,643(16) Bus. Admin. 164,515 41,440 179,011 89,245 43,588 353,285 5,868 5,106 354,046 144.5 12.6 $21,713,868 $422,994 $134.6 $62.5$22,136,862(18) Pract. Teacher 8,007 2,946 12,223 15,169 42 15,211 6.7 1.3 $495,055 $42,225 $67.1 $35.3$537,280(19) Technology 23,995 14,526 40,297 3,103 57,926 2,351 60,277 27.6 10.2 $2,840,727 $324,527 $131.9 $52.5$3,165,254(99) Not State Funde 11,814 22.3 0.3 $506,579 $10,000 $43.7$516,579Budgeted, Not Teach 108.1 378.3 $16,008,776 $14,293,739 $30,302,515
1,363,620 925,155 1,219,557 619,382 1,139,179 3,903,274 103,304 63,658 4,041,760 1,824.5 568.7 $215,068,452 $21,524,823 $173.5 $58.5$236,593,275UniversityTotal
Prepared by Office of Institutional Studies and Planning, 28-Oct-14, 08:10 AM Section III. Page 1 of 1

Level / Funding AreaTotal SCH LD UD MS PhD Total
Teaching Supplem't
Excess PhD
Net WSCH
FTEGAT
Teaching SalaryGAT
WSCH (incl. Excess PhD)Faculty Faculty
Cost perWSCHSCHTotal
Texas A&M University – Teaching Analysis ReportUniversity Summary by Level by Funding CodeFiscal Year 2014
Texas A&M Univ.
0(99) Not State Funde 9.1 0.3 $488,141 $10,000 $498,141
9.1 0.3 $488,141 $10,000 $498,141Total
7(08) 08 20,549 98,841 35.5 $4,529,906 $220.4 $45.8$4,529,906
20,549 98,841 35.5 $4,529,906 $220.4 $45.8$4,529,906Total
Lower Division(01) Liberal Arts 251,863 250,666 250,666 8,044 258,710 116.3 50.7 $9,557,616 $1,873,646 $45.4 $44.2$11,431,262(02) Science 140,951 249,232 249,232 10,968 260,200 61.2 53.2 $6,124,242 $2,270,072 $59.6 $32.3$8,394,314(03) Fine Art 32,425 46,955 46,955 388 47,344 16.3 1.2 $987,903 $32,450 $31.5 $21.6$1,020,353(04) Teacher Educ. 5,841 8,914 8,914 258 9,172 2.7 $252,107 $43.2 $27.5$252,107(05) Agriculture 17,147 35,514 35,514 2,448 37,962 6.5 $559,248 $32.6 $14.7$559,248(06) Engineering 64,799 158,493 158,493 6,625 165,118 38.2 3.5 $3,963,705 $148,205 $63.5 $24.9$4,111,910(07) Home Economic 1,013 1,043 1,043 1,043 1.2 $68,858 $68.0 $66.0$68,858(13) Phys. Training 15,873 21,680 21,680 8 21,688 17.0 3.3 $1,085,016 $107,712 $75.1 $55.0$1,192,728(14) Health Service 22,256 24,139 24,139 732 24,872 10.8 3.0 $752,877 $97,794 $38.2 $34.2$850,671(16) Bus. Admin. 32,031 37,294 37,294 90 37,384 12.6 0.9 $1,007,642 $41,824 $32.8 $28.1$1,049,466(18) Pract. Teacher 1,347 2,694 2,694 2,694 0.9 0.2 $53,633 $6,750 $44.8 $22.4$60,383(19) Technology 6,026 13,952 13,952 650 14,602 6.5 3.7 $667,252 $99,039 $127.2 $52.5$766,291(99) Not State Funde 6,269 7.6 $1,497 $0.2$1,497
597,841 850,577 850,577 30,212 880,789 297.8 119.6 $25,081,596 $4,677,493 $49.8 $33.8$29,759,089Total
Upper Division(01) Liberal Arts 123,226 15,091 183,162 198,253 11,252 209,504 132.4 23.0 $13,203,325 $822,646 $113.8 $66.9$14,025,972(02) Science 108,705 20,132 290,591 310,722 17,668 328,390 123.4 10.8 $12,290,778 $434,733 $117.1 $38.8$12,725,511(03) Fine Art 7,583 2,087 14,881 16,968 575 17,543 13.8 0.1 $987,175 $2,584 $130.5 $56.4$989,759(04) Teacher Educ. 25,451 7,627 38,471 46,098 688 46,786 19.6 3.4 $1,607,800 $127,003 $68.2 $37.1$1,734,803(05) Agriculture 40,029 10,560 91,427 101,987 7,637 109,624 34.4 1.8 $3,686,438 $67,751 $93.8 $34.2$3,754,189(06) Engineering 101,628 11,227 341,937 353,164 27,073 380,237 90.8 10.8 $11,000,940 $398,215 $112.2 $30.0$11,399,155(07) Home Economic 1,110 213 1,480 1,693 10 1,704 1.2 0.1 $83,534 $3,750 $78.6 $51.2$87,284(14) Health Service 17,699 2,669 26,078 28,747 670 29,417 7.2 0.4 $632,341 $13,500 $36.5 $22.0$645,841(16) Bus. Admin. 103,146 4,146 179,011 183,157 5,778 188,935 62.8 11.7 $7,652,311 $381,170 $77.9 $42.5$8,033,481(18) Pract. Teacher 6,660 252 12,223 12,475 42 12,517 5.8 1.2 $441,422 $35,475 $71.6 $38.1$476,897(19) Technology 17,165 573 40,297 40,871 1,700 42,571 19.0 6.6 $1,912,769 $225,489 $124.6 $50.2$2,138,258(99) Not State Funde 5,545 5.6 $11,820 $2.1$11,820
Prepared by Office of Institutional Studies and Planning, 28-Oct-14, 08:11 AM Section IV. Page 1 of 2

Level / Funding AreaTotal SCH LD UD MS PhD Total
Teaching Supplem't
Excess PhD
Net WSCH
FTEGAT
Teaching SalaryGAT
WSCH (incl. Excess PhD)Faculty Faculty
Cost perWSCHSCHTotal
Texas A&M University – Teaching Analysis ReportUniversity Summary by Level by Funding CodeFiscal Year 2014
Texas A&M Univ.
557,947 74,579 1,219,557 1,294,136 73,092 1,367,227 515.9 69.7 $53,510,653 $2,512,316 $100.4 $41.0$56,022,969Total
Masters(01) Liberal Arts 20,212 78,220 78,220 78,220 62.9 $8,134,151 $402.4 $104.0$8,134,151(02) Science 14,846 112,681 112,681 112,681 58.1 0.5 $6,943,405 $20,766 $469.1 $61.8$6,964,171(03) Fine Art 464 2,575 2,575 2,575 3.8 $426,859 $920.0 $165.8$426,859(04) Teacher Educ. 9,782 23,770 23,770 23,770 17.8 $1,795,256 $183.5 $75.5$1,795,256(05) Agriculture 5,431 41,873 41,873 41,873 22.7 $2,338,784 $430.6 $55.9$2,338,784(06) Engineering 34,399 263,496 263,496 263,496 92.5 0.1 $12,763,131 $2,519 $371.1 $48.4$12,765,651(07) Home Economic 6 19 19 19 $2,501 $416.9 $134.9$2,501(14) Health Service 1,486 4,399 4,399 4,399 1.6 $165,345 $111.3 $37.6$165,345(16) Bus. Admin. 27,460 89,245 89,245 89,245 42.8 $6,810,202 $248.0 $76.3$6,810,202(19) Technology 804 3,103 3,103 3,103 2.1 $260,706 $324.3 $84.0$260,706(99) Not State Funde $3,135 $3,135
114,890 619,382 619,382 619,382 304.4 0.6 $39,643,474 $23,285 $345.3 $64.0$39,666,760Total
Doctoral(01) Liberal Arts 15,367 149,367 149,367 5,919 143,448 150.2 $20,744,676 $1,349.9 $144.6$20,744,676(02) Science 19,737 430,661 430,661 22,431 408,230 135.3 0.2 $17,106,247 $7,135 $867.1 $41.9$17,113,381(03) Fine Art 39 298 298 298 0.2 $20,581 $527.7 $69.1$20,581(04) Teacher Educ. 6,785 53,941 53,941 3,641 50,300 50.1 $5,648,040 $832.4 $112.3$5,648,040(05) Agriculture 4,273 44,525 44,525 2,740 41,784 27.5 $3,198,759 $748.6 $76.6$3,198,759(06) Engineering 23,683 410,663 410,663 23,790 386,873 161.4 $22,542,567 $856 $951.9 $58.3$22,543,422(07) Home Economic 12 100 100 100 0.1 $13,550 $1,129.2 $134.9$13,550(14) Health Service 619 6,035 6,035 29 6,006 2.8 $285,786 $461.7 $47.6$285,786(16) Bus. Admin. 1,878 43,588 43,588 5,106 38,482 26.2 $6,243,713 $3,324.7 $162.2$6,243,713(99) Not State Funde $1,986 $1,986
72,393 1,139,179 1,139,179 63,6581,075,521 553.8 0.2 $75,805,905 $7,990 $1,047.3 $70.5$75,813,895Total
Budgeted, Not TeachingBudgeted, Not Teach 108.1 378.3 $16,008,776 $14,293,739 $30,302,515(99) Not State Funde
108.1 378.3 $16,008,776 $14,293,739 $30,302,515Total
1,363,620 925,155 1,219,557 619,382 1,139,179 3,903,274 103,304 63,658 4,041,760 1,824.5 568.7 $215,068,452 $21,524,823 $173.5 $58.5$236,593,275UniversityTotal
Prepared by Office of Institutional Studies and Planning, 28-Oct-14, 08:11 AM Section IV. Page 2 of 2

Funding AreaTotal SCH LD UD MS PhD Total
Teaching Supplem't
Excess PhD
Net WSCH
FTEGAT
Teaching SalaryGAT
WSCH (incl. Excess PhD)Faculty Faculty
Cost perWSCHSCHTotal
Agriculture
Texas A&M University – Teaching Analysis ReportAnalysis by College by Funding Code
Fiscal Year 2014
(01) Liberal Arts 16,320 3,056 20,850 1,393 4,909 30,208 897 10 31,095 20.6 5.0 $1,775,870 $166,536 $119.0 $62.5$1,942,406(02) Science 47,005 20,000 80,845 27,066 108,009 235,920 6,513 4,539 237,894 74.6 0.4 $7,455,616 $19,003 $159.0 $31.4$7,474,619(04) Teacher Educ. 189 9 210 117 167 503 22 524 0.2 $16,757 $88.7 $32.0$16,757(05) Agriculture 66,756 46,055 91,193 41,827 44,306 223,381 10,060 2,657 230,783 91.0 1.8 $9,774,809 $67,751 $147.4 $42.6$9,842,560(06) Engineering 5,828 2,957 12,782 4,182 8,167 28,089 1,485 104 29,469 10.2 $1,452,830 $249.3 $49.3$1,452,830(07) Home Economic 638 274 614 888 10 898 1.1 $73,979 $116.0 $82.4$73,979(13) Phys. Training 59 81 81 8 89 $1,373 $23.3 $15.4$1,373(14) Health Service 6,940 5,654 2,974 8,628 241 8,869 2.3 $158,708 $22.9 $17.9$158,708(16) Bus. Admin. 5,513 1,523 6,932 878 1,393 10,726 528 11,253 2.2 1.4 $192,206 $43,255 $42.7 $20.9$235,461(18) Pract. Teacher 210 380 380 24 404 1.2 0.5 $138,885 $11,850 $717.8 $373.3$150,735(19) Technology 1,077 1,220 1,358 2,578 66 2,644 1.3 0.2 $140,627 $4,878 $135.1 $55.0$145,505(99) Not State Funde 49Budgeted, Not Teach 15.2 78.5 $1,792,633 $2,979,560 $4,772,193
Total Agriculture 150,583 80,829 218,138 75,463 166,950 541,380 19,853 7,309 553,924 220.0 87.8 $22,974,292 $3,292,833 $174.4 $47.4$26,267,125
Prepared by Office of Institutional Studies and Planning, 28-Oct-14, 08:12 AM Section V. Page 1 of 13
Funding AreaTotal SCH LD UD MS PhD Total
Teaching Supplem't
Excess PhD
Net WSCH
FTEGAT
Teaching SalaryGAT
WSCH (incl. Excess PhD)Faculty Faculty
Cost perWSCHSCHTotal
Architecture
Texas A&M University – Teaching Analysis ReportAnalysis by College by Funding Code
Fiscal Year 2014
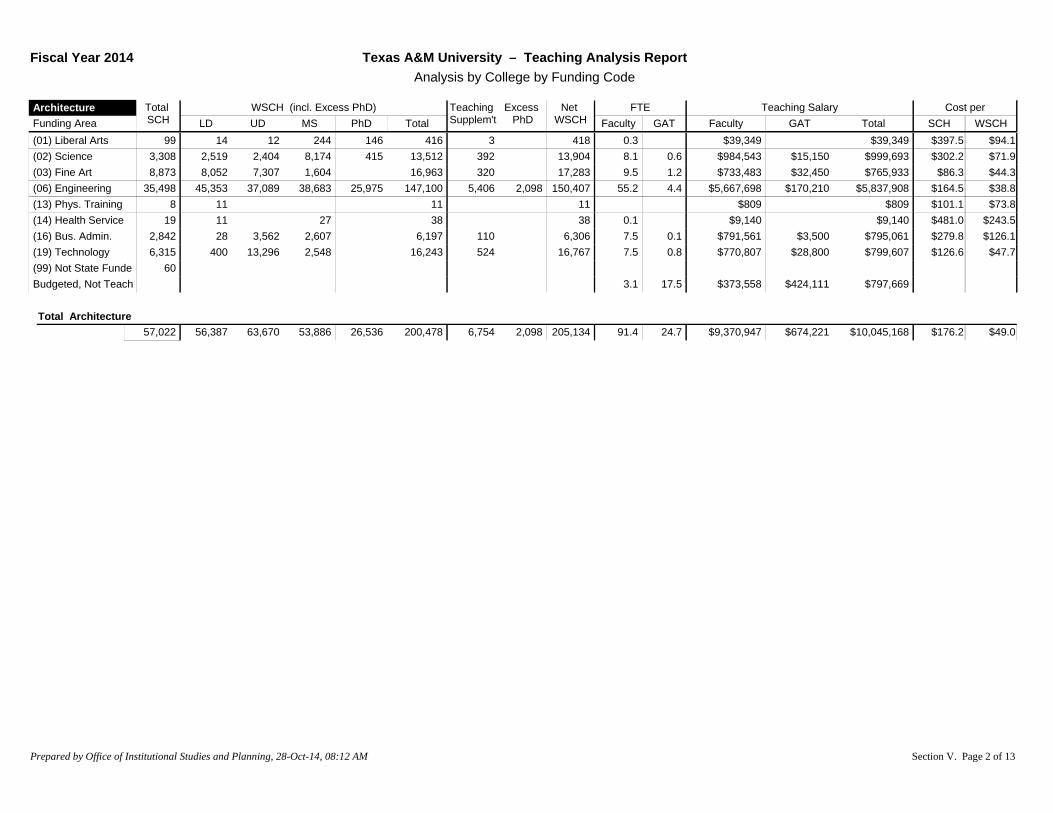
(01) Liberal Arts 99 14 12 244 146 416 3 418 0.3 $39,349 $397.5 $94.1$39,349(02) Science 3,308 2,519 2,404 8,174 415 13,512 392 13,904 8.1 0.6 $984,543 $15,150 $302.2 $71.9$999,693(03) Fine Art 8,873 8,052 7,307 1,604 16,963 320 17,283 9.5 1.2 $733,483 $32,450 $86.3 $44.3$765,933(06) Engineering 35,498 45,353 37,089 38,683 25,975 147,100 5,406 2,098 150,407 55.2 4.4 $5,667,698 $170,210 $164.5 $38.8$5,837,908(13) Phys. Training 8 11 11 11 $809 $101.1 $73.8$809(14) Health Service 19 11 27 38 38 0.1 $9,140 $481.0 $243.5$9,140(16) Bus. Admin. 2,842 28 3,562 2,607 6,197 110 6,306 7.5 0.1 $791,561 $3,500 $279.8 $126.1$795,061(19) Technology 6,315 400 13,296 2,548 16,243 524 16,767 7.5 0.8 $770,807 $28,800 $126.6 $47.7$799,607(99) Not State Funde 60Budgeted, Not Teach 3.1 17.5 $373,558 $424,111 $797,669
Total Architecture 57,022 56,387 63,670 53,886 26,536 200,478 6,754 2,098 205,134 91.4 24.7 $9,370,947 $674,221 $176.2 $49.0$10,045,168
Prepared by Office of Institutional Studies and Planning, 28-Oct-14, 08:12 AM Section V. Page 2 of 13

Funding AreaTotal SCH LD UD MS PhD Total
Teaching Supplem't
Excess PhD
Net WSCH
FTEGAT
Teaching SalaryGAT
WSCH (incl. Excess PhD)Faculty Faculty
Cost perWSCHSCHTotal
Business Admin
Texas A&M University – Teaching Analysis ReportAnalysis by College by Funding Code
Fiscal Year 2014
(01) Liberal Arts 403 1,560 1,560 1,560 0.9 $104,214 $258.6 $66.8$104,214(02) Science 60 455 455 455 0.4 $130,596 $2,176.6 $286.8$130,596(06) Engineering 11,747 19,889 4,543 18,147 52 42,631 83 52 42,661 6.7 $849,077 $72.3 $19.9$849,077(07) Home Economic 240 247 247 247 0.2 $11,940 $49.8 $48.3$11,940(16) Bus. Admin. 125,678 32,339 133,714 72,079 32,981 271,112 3,855 5,106 269,861 108.7 9.3 $18,287,960 $315,939 $148.0 $68.9$18,603,899(19) Technology 498 1,163 1,163 1,163 0.5 $44,916 $90.2 $38.6$44,916(99) Not State Funde 393 0.1 $14,955 $38.1$14,955Budgeted, Not Teach 22.0 13.7 $4,950,344 $314,560 $5,264,904
Total Business Admin 139,019 53,638 138,257 92,240 33,033 317,169 3,937 5,158 315,948 139.4 23.0 $24,394,002 $630,499 $180.0 $79.2$25,024,501
Prepared by Office of Institutional Studies and Planning, 28-Oct-14, 08:12 AM Section V. Page 3 of 13

Funding AreaTotal SCH LD UD MS PhD Total
Teaching Supplem't
Excess PhD
Net WSCH
FTEGAT
Teaching SalaryGAT
WSCH (incl. Excess PhD)Faculty Faculty
Cost perWSCHSCHTotal
Education
Texas A&M University – Teaching Analysis ReportAnalysis by College by Funding Code
Fiscal Year 2014
(01) Liberal Arts 9,380 689 9,764 5,608 14,658 30,719 77 156 30,640 13.1 1.7 $1,362,602 $60,375 $151.7 $46.4$1,422,977(02) Science 8,025 363 20,805 5,427 2,837 29,431 482 29,913 9.4 1.3 $904,258 $47,250 $118.6 $31.8$951,508(03) Fine Art 816 699 807 1,506 1,506 1.6 $116,825 $143.2 $77.6$116,825(04) Teacher Educ. 46,282 15,940 36,447 23,646 53,472 129,505 703 3,617 126,590 89.0 3.4 $9,173,526 $127,003 $201.0 $73.5$9,300,529(06) Engineering 2,497 6,015 107 17 6,139 6,139 0.7 $75,536 $30.3 $12.3$75,536(07) Home Economic 720 195 866 1,061 1,061 0.7 0.1 $37,988 $3,750 $58.0 $39.3$41,738(13) Phys. Training 15,806 21,588 21,588 21,588 16.9 3.3 $1,082,834 $107,712 $75.3 $55.1$1,190,546(14) Health Service 32,919 19,893 21,850 3,623 5,519 50,884 1,011 29 51,866 18.4 3.4 $1,501,540 $111,294 $49.0 $31.1$1,612,834(16) Bus. Admin. 20,182 5,026 25,344 4,644 7,334 42,349 1,135 43,484 12.2 1.1 $1,150,334 $40,500 $59.0 $27.4$1,190,834(18) Pract. Teacher 7,797 2,946 11,843 14,789 18 14,807 5.4 0.8 $356,170 $30,375 $49.6 $26.1$386,545(19) Technology 150 369 369 369 0.2 $11,800 $78.7 $32.0$11,800(99) Not State Funde 68 $1,497 $22.0$1,497Budgeted, Not Teach 5.7 36.8 $669,316 $1,235,860 $1,905,176
Total Education 144,642 73,353 128,201 42,948 83,836 328,339 3,426 3,802 327,963 173.4 51.9 $16,444,225 $1,764,119 $125.9 $55.5$18,208,344
Prepared by Office of Institutional Studies and Planning, 28-Oct-14, 08:12 AM Section V. Page 4 of 13
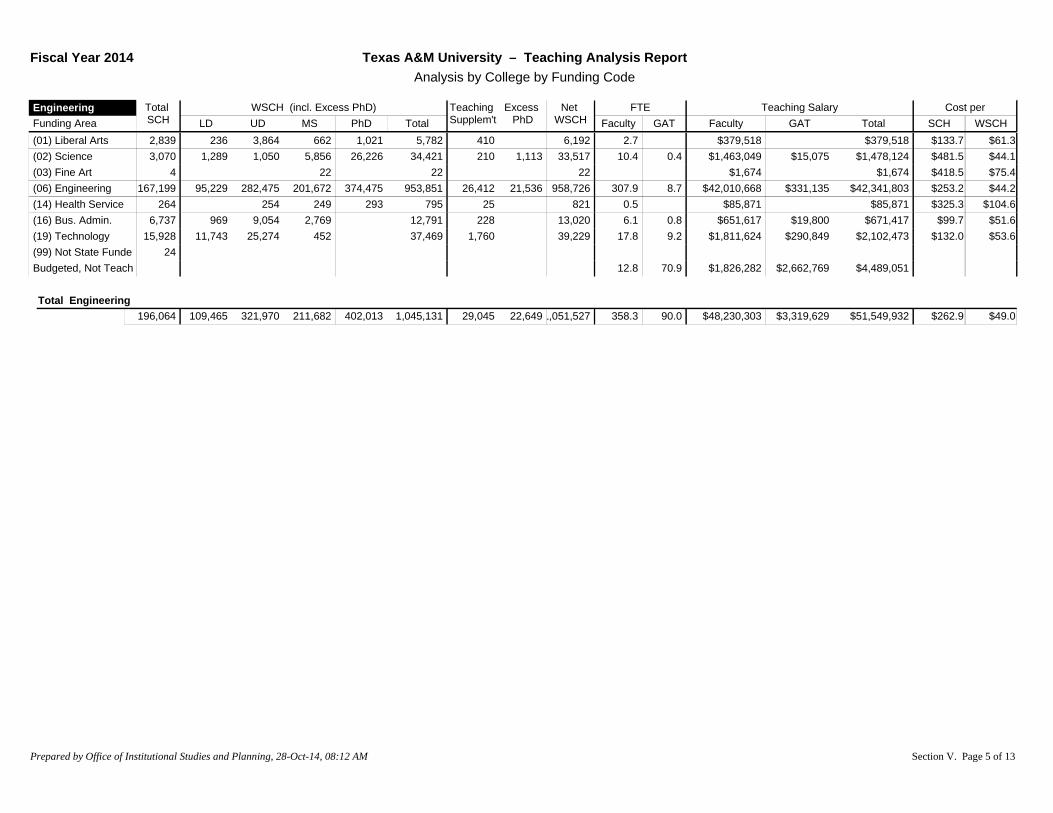
Funding AreaTotal SCH LD UD MS PhD Total
Teaching Supplem't
Excess PhD
Net WSCH
FTEGAT
Teaching SalaryGAT
WSCH (incl. Excess PhD)Faculty Faculty
Cost perWSCHSCHTotal
Engineering
Texas A&M University – Teaching Analysis ReportAnalysis by College by Funding Code
Fiscal Year 2014
(01) Liberal Arts 2,839 236 3,864 662 1,021 5,782 410 6,192 2.7 $379,518 $133.7 $61.3$379,518(02) Science 3,070 1,289 1,050 5,856 26,226 34,421 210 1,113 33,517 10.4 0.4 $1,463,049 $15,075 $481.5 $44.1$1,478,124(03) Fine Art 4 22 22 22 $1,674 $418.5 $75.4$1,674(06) Engineering 167,199 95,229 282,475 201,672 374,475 953,851 26,412 21,536 958,726 307.9 8.7 $42,010,668 $331,135 $253.2 $44.2$42,341,803(14) Health Service 264 254 249 293 795 25 821 0.5 $85,871 $325.3 $104.6$85,871(16) Bus. Admin. 6,737 969 9,054 2,769 12,791 228 13,020 6.1 0.8 $651,617 $19,800 $99.7 $51.6$671,417(19) Technology 15,928 11,743 25,274 452 37,469 1,760 39,229 17.8 9.2 $1,811,624 $290,849 $132.0 $53.6$2,102,473(99) Not State Funde 24Budgeted, Not Teach 12.8 70.9 $1,826,282 $2,662,769 $4,489,051
Total Engineering 196,064 109,465 321,970 211,682 402,013 1,045,131 29,045 22,6491,051,527 358.3 90.0 $48,230,303 $3,319,629 $262.9 $49.0$51,549,932
Prepared by Office of Institutional Studies and Planning, 28-Oct-14, 08:12 AM Section V. Page 5 of 13
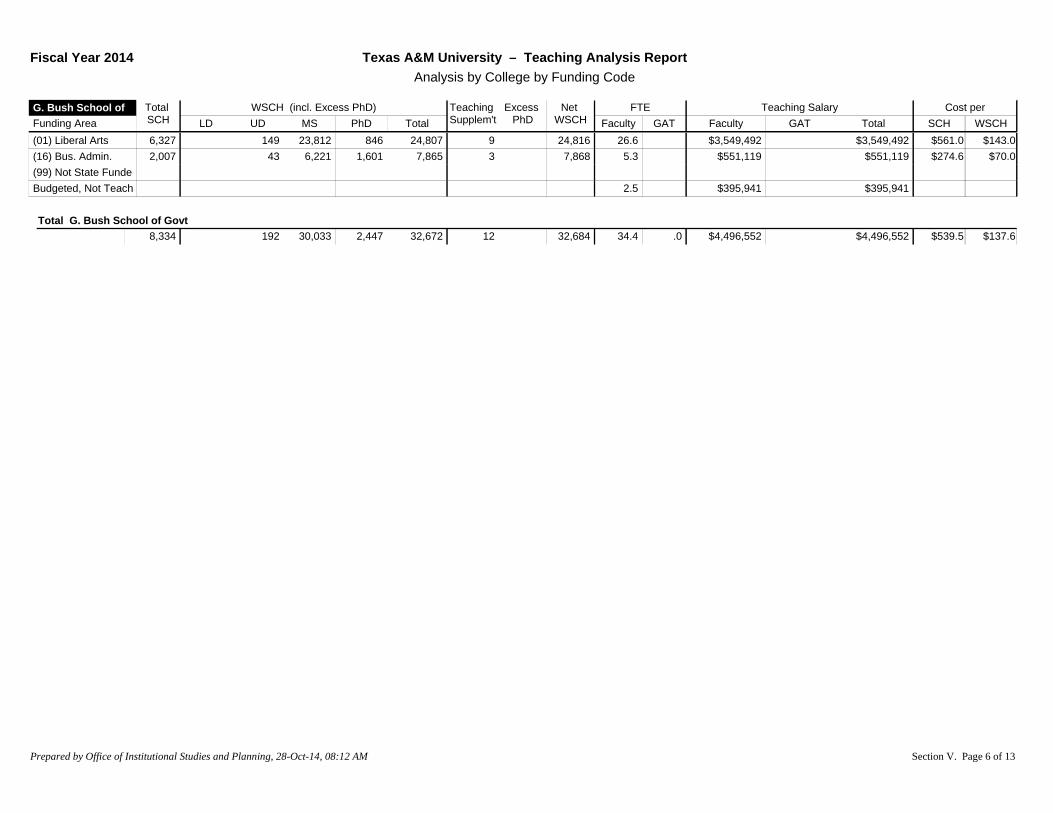
Funding AreaTotal SCH LD UD MS PhD Total
Teaching Supplem't
Excess PhD
Net WSCH
FTEGAT
Teaching SalaryGAT
WSCH (incl. Excess PhD)Faculty Faculty
Cost perWSCHSCHTotal
G. Bush School of
Texas A&M University – Teaching Analysis ReportAnalysis by College by Funding Code
Fiscal Year 2014
(01) Liberal Arts 6,327 149 23,812 846 24,807 9 24,816 26.6 $3,549,492 $561.0 $143.0$3,549,492(16) Bus. Admin. 2,007 43 6,221 1,601 7,865 3 7,868 5.3 $551,119 $274.6 $70.0$551,119(99) Not State FundeBudgeted, Not Teach 2.5 $395,941 $395,941
Total G. Bush School of Govt8,334 192 30,033 2,447 32,672 12 32,684 34.4 .0 $4,496,552 $539.5 $137.6$4,496,552
Prepared by Office of Institutional Studies and Planning, 28-Oct-14, 08:12 AM Section V. Page 6 of 13

Funding AreaTotal SCH LD UD MS PhD Total
Teaching Supplem't
Excess PhD
Net WSCH
FTEGAT
Teaching SalaryGAT
WSCH (incl. Excess PhD)Faculty Faculty
Cost perWSCHSCHTotal
Geosciences
Texas A&M University – Teaching Analysis ReportAnalysis by College by Funding Code
Fiscal Year 2014
(01) Liberal Arts 16,063 11,720 6,033 1,308 4,063 23,124 809 146 23,787 13.8 1.1 $1,418,220 $45,900 $91.1 $61.6$1,464,120(02) Science 39,634 47,067 24,451 19,798 50,472 141,787 5,015 2,684 144,119 58.9 23.9 $6,554,051 $961,651 $189.6 $52.1$7,515,702(03) Fine Art 20 49 49 49 0.1 $7,978 $398.9 $164.2$7,978(06) Engineering 1,250 153 3,827 368 884 5,232 297 5,529 1.0 1.0 $109,503 $40,350 $119.9 $27.1$149,853(99) Not State Funde 15Budgeted, Not Teach 3.0 12.3 $383,729 $559,997 $943,726
Total Geosciences 56,982 58,939 34,360 21,474 55,419 170,191 6,121 2,830 173,483 76.9 38.3 $8,473,481 $1,607,898 $176.9 $58.1$10,081,379
Prepared by Office of Institutional Studies and Planning, 28-Oct-14, 08:12 AM Section V. Page 7 of 13

Funding AreaTotal SCH LD UD MS PhD Total
Teaching Supplem't
Excess PhD
Net WSCH
FTEGAT
Teaching SalaryGAT
WSCH (incl. Excess PhD)Faculty Faculty
Cost perWSCHSCHTotal
Law
Texas A&M University – Teaching Analysis ReportAnalysis by College by Funding Code
Fiscal Year 2014
(08) 08 20,549 98,841 35.5 $4,529,906 $220.4 $45.8$4,529,906Budgeted, Not Teach 4.2 $552,200 $552,200
Total Law 20,549 98,841 39.7 .0 $5,082,106 $247.3 $51.4$5,082,106
Prepared by Office of Institutional Studies and Planning, 28-Oct-14, 08:12 AM Section V. Page 8 of 13
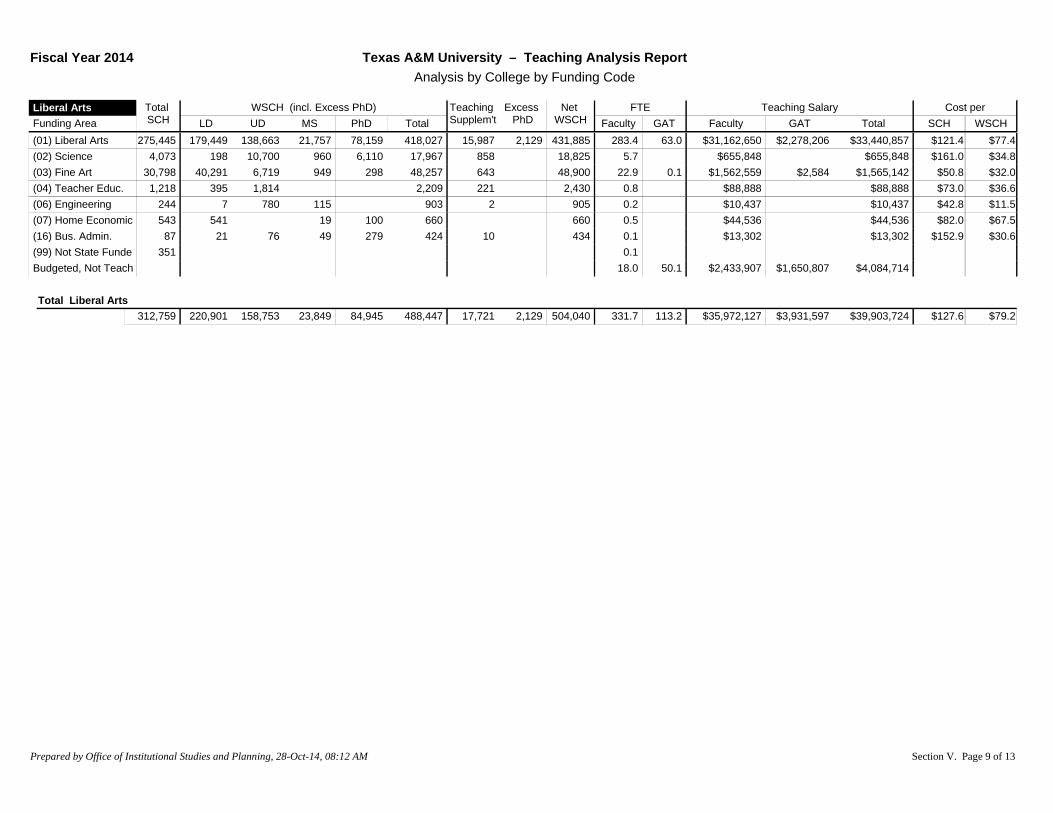
Funding AreaTotal SCH LD UD MS PhD Total
Teaching Supplem't
Excess PhD
Net WSCH
FTEGAT
Teaching SalaryGAT
WSCH (incl. Excess PhD)Faculty Faculty
Cost perWSCHSCHTotal
Liberal Arts
Texas A&M University – Teaching Analysis ReportAnalysis by College by Funding Code
Fiscal Year 2014
(01) Liberal Arts 275,445 179,449 138,663 21,757 78,159 418,027 15,987 2,129 431,885 283.4 63.0 $31,162,650 $2,278,206 $121.4 $77.4$33,440,857(02) Science 4,073 198 10,700 960 6,110 17,967 858 18,825 5.7 $655,848 $161.0 $34.8$655,848(03) Fine Art 30,798 40,291 6,719 949 298 48,257 643 48,900 22.9 0.1 $1,562,559 $2,584 $50.8 $32.0$1,565,142(04) Teacher Educ. 1,218 395 1,814 2,209 221 2,430 0.8 $88,888 $73.0 $36.6$88,888(06) Engineering 244 7 780 115 903 2 905 0.2 $10,437 $42.8 $11.5$10,437(07) Home Economic 543 541 19 100 660 660 0.5 $44,536 $82.0 $67.5$44,536(16) Bus. Admin. 87 21 76 49 279 424 10 434 0.1 $13,302 $152.9 $30.6$13,302(99) Not State Funde 351 0.1Budgeted, Not Teach 18.0 50.1 $2,433,907 $1,650,807 $4,084,714
Total Liberal Arts 312,759 220,901 158,753 23,849 84,945 488,447 17,721 2,129 504,040 331.7 113.2 $35,972,127 $3,931,597 $127.6 $79.2$39,903,724
Prepared by Office of Institutional Studies and Planning, 28-Oct-14, 08:12 AM Section V. Page 9 of 13

Funding AreaTotal SCH LD UD MS PhD Total
Teaching Supplem't
Excess PhD
Net WSCH
FTEGAT
Teaching SalaryGAT
WSCH (incl. Excess PhD)Faculty Faculty
Cost perWSCHSCHTotal
Non-Funded
Texas A&M University – Teaching Analysis ReportAnalysis by College by Funding Code
Fiscal Year 2014
(99) Not State Funde 9,157 12.7Budgeted, Not Teach 0.3
Total Non-Funded 9,157 13.0 .0
Prepared by Office of Institutional Studies and Planning, 28-Oct-14, 08:12 AM Section V. Page 10 of 13

Funding AreaTotal SCH LD UD MS PhD Total
Teaching Supplem't
Excess PhD
Net WSCH
FTEGAT
Teaching SalaryGAT
WSCH (incl. Excess PhD)Faculty Faculty
Cost perWSCHSCHTotal
Other
Texas A&M University – Teaching Analysis ReportAnalysis by College by Funding Code
Fiscal Year 2014
(01) Liberal Arts 2,585 1,232 2,312 3,544 4 3,548 6.0 $18,000 $7.0 $5.1$18,000(02) Science 267 577 4,168 4,744 546 4,199 0.9 $133,418 $499.7 $31.8$133,418(05) Agriculture 20 6 177 183 1 83 101 0.1 $6,630 $331.5 $65.9$6,630(06) Engineering 46 77 624 701 701 0.3 $28,364 $616.6 $40.5$28,364(16) Bus. Admin. 1,273 1,489 1,489 1,489 1.7(99) Not State Funde 1,661 9.4 0.3 $490,127 $10,000 $301.1$500,127Budgeted, Not Teach 0.8 $66,048 $66,048
Total Other 5,852 2,728 2,312 653 4,969 10,662 5 629 10,038 19.1 0.3 $742,587 $10,000 $128.6 $75.0$752,587
Prepared by Office of Institutional Studies and Planning, 28-Oct-14, 08:12 AM Section V. Page 11 of 13

Funding AreaTotal SCH LD UD MS PhD Total
Teaching Supplem't
Excess PhD
Net WSCH
FTEGAT
Teaching SalaryGAT
WSCH (incl. Excess PhD)Faculty Faculty
Cost perWSCHSCHTotal
Science
Texas A&M University – Teaching Analysis ReportAnalysis by College by Funding Code
Fiscal Year 2014
(01) Liberal Arts 80,618 69,362 616 21,668 45,480 137,126 1,099 3,480 134,745 93.7 2.9 $11,779,444 $145,275 $147.9 $88.5$11,924,719(02) Science 162,617 195,316 119,228 25,529 191,776 531,848 13,540 12,525 532,863 182.0 37.9 $21,536,437 $1,668,014 $142.7 $43.5$23,204,451(04) Teacher Educ. 134 197 40 237 237 0.2 $17,855 $133.2 $75.3$17,855(06) Engineering 28 25 138 52 215 3 217 0.1 $16,893 $603.3 $77.7$16,893(16) Bus. Admin. 196 44 286 330 330 0.6 $75,769 $386.6 $229.3$75,769(19) Technology 27 104 104 104 0.4 $60,953 $2,257.5 $584.8$60,953(99) Not State Funde 24Budgeted, Not Teach 15.4 95.0 $1,944,596 $4,337,236 $6,281,832
Total Science 243,644 264,920 120,154 47,439 237,348 669,861 14,641 16,004 668,498 292.4 135.9 $35,431,948 $6,150,525 $170.7 $62.2$41,582,473
Prepared by Office of Institutional Studies and Planning, 28-Oct-14, 08:12 AM Section V. Page 12 of 13

Funding AreaTotal SCH LD UD MS PhD Total
Teaching Supplem't
Excess PhD
Net WSCH
FTEGAT
Teaching SalaryGAT
WSCH (incl. Excess PhD)Faculty Faculty
Cost perWSCHSCHTotal
Veterinary Medicine
Texas A&M University – Teaching Analysis ReportAnalysis by College by Funding Code
Fiscal Year 2014
(01) Liberal Arts 589 899 209 87 1,196 1 1,197 0.7 $50,408 $85.6 $42.1$50,408(02) Science 16,181 2,613 31,108 18,838 40,651 93,210 1,627 1,026 93,812 27.5 0.2 $2,646,855 $6,563 $164.0 $28.3$2,653,418(04) Teacher Educ. 36 7 262 270 24 246 0.1 $6,178 $171.6 $25.1$6,178(05) Agriculture 104 12 234 46 42 335 25 359 $1,791 $17.2 $5.0$1,791(06) Engineering 173 118 308 115 416 957 11 968 0.6 0.2 $49,338 $8,100 $332.0 $59.3$57,438(14) Health Service 1,918 1,251 1,000 500 224 2,976 124 3,100 1.0 $81,091 $42.3 $26.2$81,091(99) Not State Funde 12Budgeted, Not Teach 5.0 3.3 $620,222 $128,839 $749,061
Total Veterinary Medicine 19,013 3,995 33,550 19,716 41,683 98,943 1,788 1,049 99,682 34.9 3.7 $3,455,882 $143,502 $189.3 $36.1$3,599,384
Prepared by Office of Institutional Studies and Planning, 28-Oct-14, 08:12 AM Section V. Page 13 of 13

Level / Funding AreaTotal SCH LD UD MS PhD Total
Teaching Supplem't
Excess PhD
Net WSCH
FTEGAT
Teaching SalaryGAT
WSCH (incl. Excess PhD)Faculty Faculty
Cost perWSCHSCHTotal
Agriculture
Texas A&M University – Teaching Analysis ReportUniversity Summary by Level by Funding CodeFiscal Year 2014
Undergraduate(01) Liberal Arts 6,691 1,449 8,834 10,283 396 10,679 4.8 2.1 $350,244 $70,240 $62.8 $39.4$420,484(01) Liberal Arts 2,156 223 3,222 3,445 89 3,534 2.8 0.4 $201,816 $15,043 $100.6 $61.4$216,859(01) Liberal Arts 6,608 1,384 8,795 10,179 412 10,590 5.5 2.5 $455,372 $81,253 $81.2 $50.7$536,625(02) Science 18,443 11,104 36,208 47,312 3,053 50,365 13.0 $1,223,830 $66.4 $24.3$1,223,830(02) Science 17,844 8,619 38,700 47,319 3,130 50,449 12.3 0.4 $1,213,072 $19,003 $69.0 $24.4$1,232,075(02) Science 2,202 278 5,937 6,215 330 6,545 4.5 $363,043 $164.9 $55.5$363,043(04) Teacher Educ. 120 9 210 219 22 241 $4,332 $36.1 $18.0$4,332(05) Agriculture 28,348 25,659 41,642 67,301 4,881 72,182 18.7 0.9 $1,988,323 $35,051 $71.4 $28.0$2,023,374(05) Agriculture 25,336 18,560 43,049 61,609 4,743 66,353 18.0 0.8 $1,872,035 $32,700 $75.2 $28.7$1,904,735(05) Agriculture 3,395 1,837 6,501 8,338 435 8,773 4.2 $380,972 $112.2 $43.4$380,972(06) Engineering 2,379 1,493 6,281 7,774 710 8,484 1.8 $211,361 $88.9 $24.9$211,361(06) Engineering 2,243 1,456 5,857 7,313 709 8,023 1.8 $244,635 $109.1 $30.5$244,635(06) Engineering 189 7 644 652 65 717 0.1 $15,125 $80.0 $21.1$15,125(07) Home Economic 360 133 381 514 10 524 0.6 $44,946 $124.8 $85.7$44,946(07) Home Economic 278 141 233 374 374 0.5 $29,033 $104.4 $77.7$29,033(13) Phys. Training 32 44 44 4 48 $537 $16.8 $11.1$537(13) Phys. Training 27 37 37 4 41 $836 $30.9 $20.5$836(14) Health Service 3,799 3,214 1,460 4,675 219 4,894 1.2 $82,835 $21.8 $16.9$82,835(14) Health Service 2,871 2,286 1,311 3,597 22 3,619 0.9 $62,542 $21.8 $17.3$62,542(14) Health Service 270 154 202 356 356 0.3 $13,330 $49.4 $37.4$13,330(16) Bus. Admin. 2,384 756 3,102 3,858 221 4,079 0.8 0.5 $63,215 $16,862 $33.6 $19.6$80,077(16) Bus. Admin. 1,914 578 2,538 3,116 228 3,344 0.6 0.7 $50,355 $20,093 $36.8 $21.1$70,448(16) Bus. Admin. 885 190 1,292 1,482 78 1,560 0.4 0.3 $28,226 $6,300 $39.0 $22.1$34,526(18) Pract. Teacher 102 173 173 13 186 0.5 $55,049 $539.7 $296.1$55,049(18) Pract. Teacher 108 207 207 10 218 0.8 0.5 $83,836 $11,850 $886.0 $439.3$95,686(19) Technology 72 56 118 174 12 186 0.1 $5,747 $79.8 $30.9$5,747(19) Technology 543 529 775 1,304 47 1,351 0.5 $55,994 $103.1 $41.5$55,994(19) Technology 462 635 465 1,099 8 1,107 0.6 0.2 $78,885 $4,878 $181.3 $75.7$83,763(99) Not State Funde(99) Not State Funde 49
130,109 80,829 218,138 298,967 19,853 318,820 95.1 9.2 $9,179,529 $313,273 $73.0 $29.8$9,492,802Total
Masters(01) Liberal Arts 229 886 886 886 0.8 $67,002 $292.6 $75.6$67,002(01) Liberal Arts 115 445 445 445 0.8 $83,308 $724.4 $187.2$83,308(01) Liberal Arts 16 62 62 62 0.2 $18,259 $1,141.2 $294.9$18,259
Prepared by Office of Institutional Studies and Planning, 28-Oct-14, 08:13 AM Section VI. Page 1 of 25
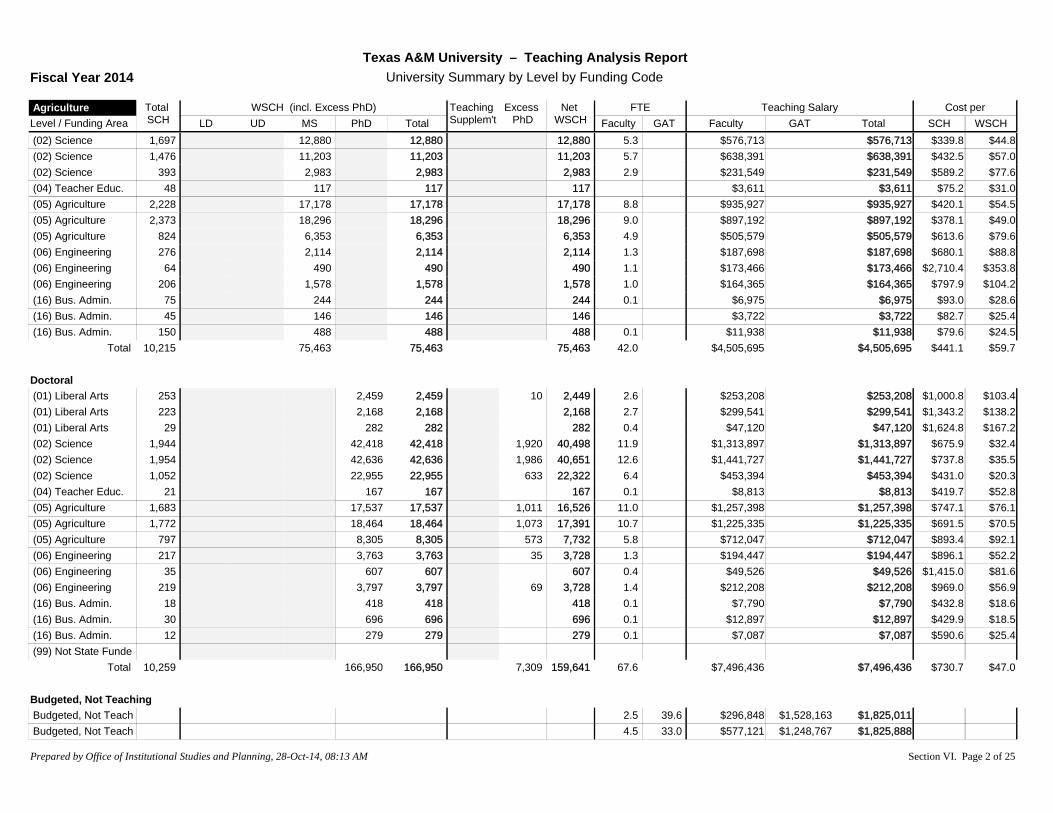
Level / Funding AreaTotal SCH LD UD MS PhD Total
Teaching Supplem't
Excess PhD
Net WSCH
FTEGAT
Teaching SalaryGAT
WSCH (incl. Excess PhD)Faculty Faculty
Cost perWSCHSCHTotal
Agriculture
Texas A&M University – Teaching Analysis ReportUniversity Summary by Level by Funding CodeFiscal Year 2014
(02) Science 1,697 12,880 12,880 12,880 5.3 $576,713 $339.8 $44.8$576,713(02) Science 1,476 11,203 11,203 11,203 5.7 $638,391 $432.5 $57.0$638,391(02) Science 393 2,983 2,983 2,983 2.9 $231,549 $589.2 $77.6$231,549(04) Teacher Educ. 48 117 117 117 $3,611 $75.2 $31.0$3,611(05) Agriculture 2,228 17,178 17,178 17,178 8.8 $935,927 $420.1 $54.5$935,927(05) Agriculture 2,373 18,296 18,296 18,296 9.0 $897,192 $378.1 $49.0$897,192(05) Agriculture 824 6,353 6,353 6,353 4.9 $505,579 $613.6 $79.6$505,579(06) Engineering 276 2,114 2,114 2,114 1.3 $187,698 $680.1 $88.8$187,698(06) Engineering 64 490 490 490 1.1 $173,466 $2,710.4 $353.8$173,466(06) Engineering 206 1,578 1,578 1,578 1.0 $164,365 $797.9 $104.2$164,365(16) Bus. Admin. 75 244 244 244 0.1 $6,975 $93.0 $28.6$6,975(16) Bus. Admin. 45 146 146 146 $3,722 $82.7 $25.4$3,722(16) Bus. Admin. 150 488 488 488 0.1 $11,938 $79.6 $24.5$11,938
10,215 75,463 75,463 75,463 42.0 $4,505,695 $441.1 $59.7$4,505,695Total
Doctoral(01) Liberal Arts 253 2,459 2,459 10 2,449 2.6 $253,208 $1,000.8 $103.4$253,208(01) Liberal Arts 223 2,168 2,168 2,168 2.7 $299,541 $1,343.2 $138.2$299,541(01) Liberal Arts 29 282 282 282 0.4 $47,120 $1,624.8 $167.2$47,120(02) Science 1,944 42,418 42,418 1,920 40,498 11.9 $1,313,897 $675.9 $32.4$1,313,897(02) Science 1,954 42,636 42,636 1,986 40,651 12.6 $1,441,727 $737.8 $35.5$1,441,727(02) Science 1,052 22,955 22,955 633 22,322 6.4 $453,394 $431.0 $20.3$453,394(04) Teacher Educ. 21 167 167 167 0.1 $8,813 $419.7 $52.8$8,813(05) Agriculture 1,683 17,537 17,537 1,011 16,526 11.0 $1,257,398 $747.1 $76.1$1,257,398(05) Agriculture 1,772 18,464 18,464 1,073 17,391 10.7 $1,225,335 $691.5 $70.5$1,225,335(05) Agriculture 797 8,305 8,305 573 7,732 5.8 $712,047 $893.4 $92.1$712,047(06) Engineering 217 3,763 3,763 35 3,728 1.3 $194,447 $896.1 $52.2$194,447(06) Engineering 35 607 607 607 0.4 $49,526 $1,415.0 $81.6$49,526(06) Engineering 219 3,797 3,797 69 3,728 1.4 $212,208 $969.0 $56.9$212,208(16) Bus. Admin. 18 418 418 418 0.1 $7,790 $432.8 $18.6$7,790(16) Bus. Admin. 30 696 696 696 0.1 $12,897 $429.9 $18.5$12,897(16) Bus. Admin. 12 279 279 279 0.1 $7,087 $590.6 $25.4$7,087(99) Not State Funde
10,259 166,950 166,950 7,309 159,641 67.6 $7,496,436 $730.7 $47.0$7,496,436Total
Budgeted, Not TeachingBudgeted, Not Teach 2.5 39.6 $296,848 $1,528,163 $1,825,011Budgeted, Not Teach 4.5 33.0 $577,121 $1,248,767 $1,825,888
Prepared by Office of Institutional Studies and Planning, 28-Oct-14, 08:13 AM Section VI. Page 2 of 25
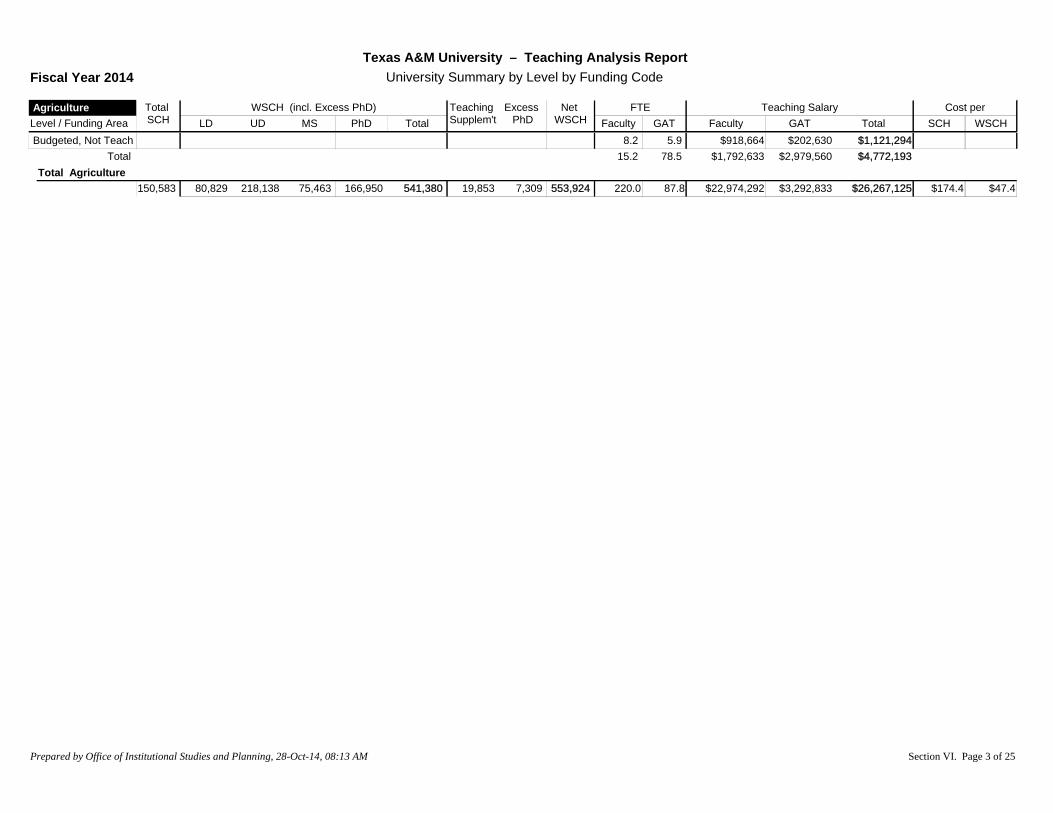
Level / Funding AreaTotal SCH LD UD MS PhD Total
Teaching Supplem't
Excess PhD
Net WSCH
FTEGAT
Teaching SalaryGAT
WSCH (incl. Excess PhD)Faculty Faculty
Cost perWSCHSCHTotal
Agriculture
Texas A&M University – Teaching Analysis ReportUniversity Summary by Level by Funding CodeFiscal Year 2014
Budgeted, Not Teach 8.2 5.9 $918,664 $202,630 $1,121,29415.2 78.5 $1,792,633 $2,979,560 $4,772,193Total
Total Agriculture 150,583 80,829 218,138 75,463 166,950 541,380 19,853 7,309 553,924 220.0 87.8 $22,974,292 $3,292,833 $174.4 $47.4$26,267,125
Prepared by Office of Institutional Studies and Planning, 28-Oct-14, 08:13 AM Section VI. Page 3 of 25
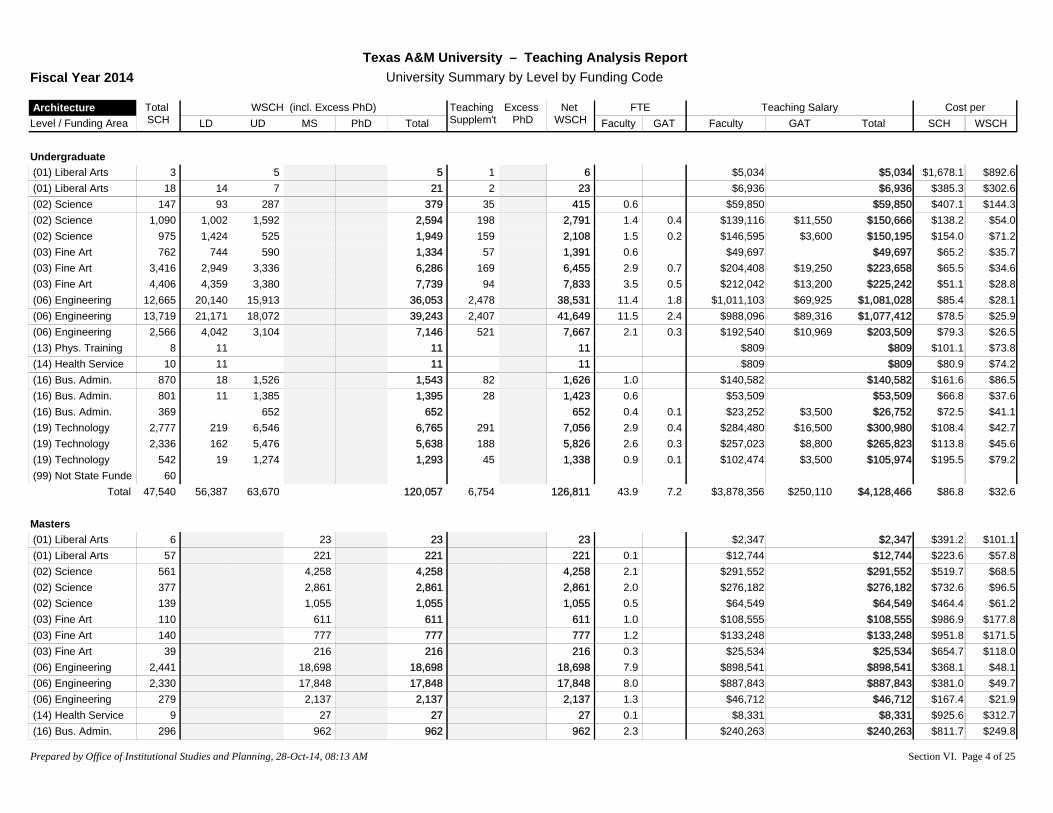
Level / Funding AreaTotal SCH LD UD MS PhD Total
Teaching Supplem't
Excess PhD
Net WSCH
FTEGAT
Teaching SalaryGAT
WSCH (incl. Excess PhD)Faculty Faculty
Cost perWSCHSCHTotal
Architecture
Texas A&M University – Teaching Analysis ReportUniversity Summary by Level by Funding CodeFiscal Year 2014
Undergraduate(01) Liberal Arts 3 5 5 1 6 $5,034 $1,678.1 $892.6$5,034(01) Liberal Arts 18 14 7 21 2 23 $6,936 $385.3 $302.6$6,936(02) Science 147 93 287 379 35 415 0.6 $59,850 $407.1 $144.3$59,850(02) Science 1,090 1,002 1,592 2,594 198 2,791 1.4 0.4 $139,116 $11,550 $138.2 $54.0$150,666(02) Science 975 1,424 525 1,949 159 2,108 1.5 0.2 $146,595 $3,600 $154.0 $71.2$150,195(03) Fine Art 762 744 590 1,334 57 1,391 0.6 $49,697 $65.2 $35.7$49,697(03) Fine Art 3,416 2,949 3,336 6,286 169 6,455 2.9 0.7 $204,408 $19,250 $65.5 $34.6$223,658(03) Fine Art 4,406 4,359 3,380 7,739 94 7,833 3.5 0.5 $212,042 $13,200 $51.1 $28.8$225,242(06) Engineering 12,665 20,140 15,913 36,053 2,478 38,531 11.4 1.8 $1,011,103 $69,925 $85.4 $28.1$1,081,028(06) Engineering 13,719 21,171 18,072 39,243 2,407 41,649 11.5 2.4 $988,096 $89,316 $78.5 $25.9$1,077,412(06) Engineering 2,566 4,042 3,104 7,146 521 7,667 2.1 0.3 $192,540 $10,969 $79.3 $26.5$203,509(13) Phys. Training 8 11 11 11 $809 $101.1 $73.8$809(14) Health Service 10 11 11 11 $809 $80.9 $74.2$809(16) Bus. Admin. 870 18 1,526 1,543 82 1,626 1.0 $140,582 $161.6 $86.5$140,582(16) Bus. Admin. 801 11 1,385 1,395 28 1,423 0.6 $53,509 $66.8 $37.6$53,509(16) Bus. Admin. 369 652 652 652 0.4 0.1 $23,252 $3,500 $72.5 $41.1$26,752(19) Technology 2,777 219 6,546 6,765 291 7,056 2.9 0.4 $284,480 $16,500 $108.4 $42.7$300,980(19) Technology 2,336 162 5,476 5,638 188 5,826 2.6 0.3 $257,023 $8,800 $113.8 $45.6$265,823(19) Technology 542 19 1,274 1,293 45 1,338 0.9 0.1 $102,474 $3,500 $195.5 $79.2$105,974(99) Not State Funde 60
47,540 56,387 63,670 120,057 6,754 126,811 43.9 7.2 $3,878,356 $250,110 $86.8 $32.6$4,128,466Total
Masters(01) Liberal Arts 6 23 23 23 $2,347 $391.2 $101.1$2,347(01) Liberal Arts 57 221 221 221 0.1 $12,744 $223.6 $57.8$12,744(02) Science 561 4,258 4,258 4,258 2.1 $291,552 $519.7 $68.5$291,552(02) Science 377 2,861 2,861 2,861 2.0 $276,182 $732.6 $96.5$276,182(02) Science 139 1,055 1,055 1,055 0.5 $64,549 $464.4 $61.2$64,549(03) Fine Art 110 611 611 611 1.0 $108,555 $986.9 $177.8$108,555(03) Fine Art 140 777 777 777 1.2 $133,248 $951.8 $171.5$133,248(03) Fine Art 39 216 216 216 0.3 $25,534 $654.7 $118.0$25,534(06) Engineering 2,441 18,698 18,698 18,698 7.9 $898,541 $368.1 $48.1$898,541(06) Engineering 2,330 17,848 17,848 17,848 8.0 $887,843 $381.0 $49.7$887,843(06) Engineering 279 2,137 2,137 2,137 1.3 $46,712 $167.4 $21.9$46,712(14) Health Service 9 27 27 27 0.1 $8,331 $925.6 $312.7$8,331(16) Bus. Admin. 296 962 962 962 2.3 $240,263 $811.7 $249.8$240,263
Prepared by Office of Institutional Studies and Planning, 28-Oct-14, 08:13 AM Section VI. Page 4 of 25
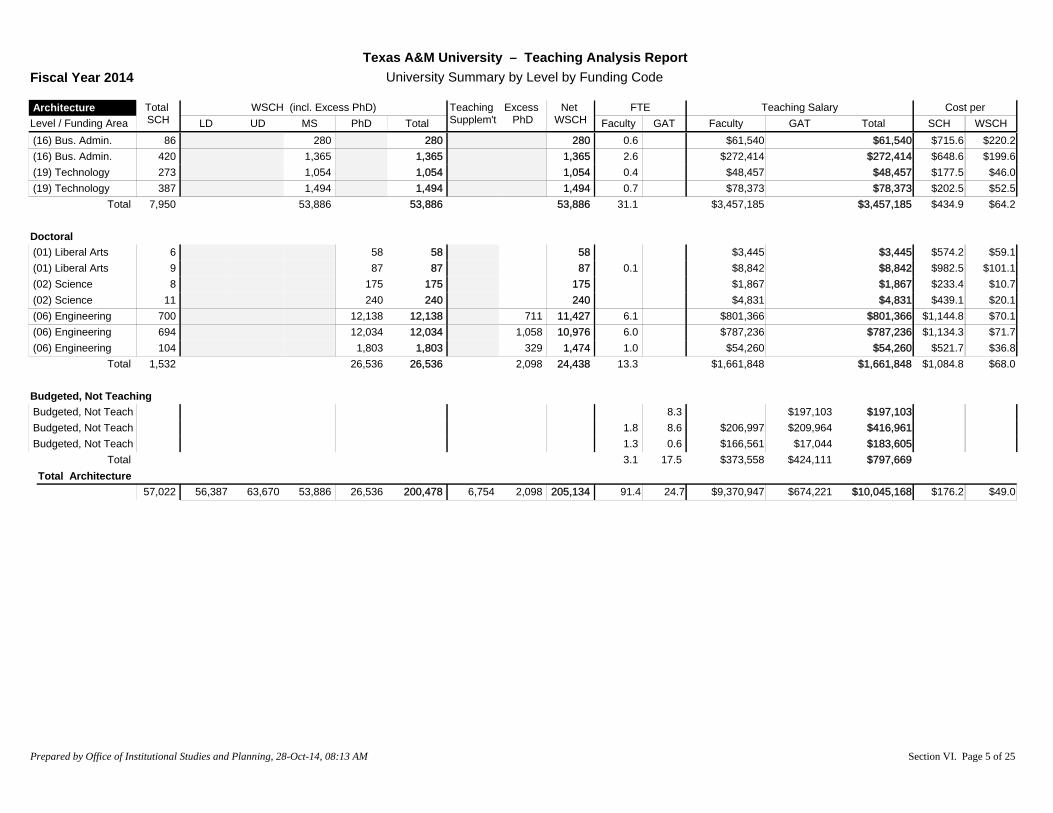
Level / Funding AreaTotal SCH LD UD MS PhD Total
Teaching Supplem't
Excess PhD
Net WSCH
FTEGAT
Teaching SalaryGAT
WSCH (incl. Excess PhD)Faculty Faculty
Cost perWSCHSCHTotal
Architecture
Texas A&M University – Teaching Analysis ReportUniversity Summary by Level by Funding CodeFiscal Year 2014
(16) Bus. Admin. 86 280 280 280 0.6 $61,540 $715.6 $220.2$61,540(16) Bus. Admin. 420 1,365 1,365 1,365 2.6 $272,414 $648.6 $199.6$272,414(19) Technology 273 1,054 1,054 1,054 0.4 $48,457 $177.5 $46.0$48,457(19) Technology 387 1,494 1,494 1,494 0.7 $78,373 $202.5 $52.5$78,373
7,950 53,886 53,886 53,886 31.1 $3,457,185 $434.9 $64.2$3,457,185Total
Doctoral(01) Liberal Arts 6 58 58 58 $3,445 $574.2 $59.1$3,445(01) Liberal Arts 9 87 87 87 0.1 $8,842 $982.5 $101.1$8,842(02) Science 8 175 175 175 $1,867 $233.4 $10.7$1,867(02) Science 11 240 240 240 $4,831 $439.1 $20.1$4,831(06) Engineering 700 12,138 12,138 711 11,427 6.1 $801,366 $1,144.8 $70.1$801,366(06) Engineering 694 12,034 12,034 1,058 10,976 6.0 $787,236 $1,134.3 $71.7$787,236(06) Engineering 104 1,803 1,803 329 1,474 1.0 $54,260 $521.7 $36.8$54,260
1,532 26,536 26,536 2,098 24,438 13.3 $1,661,848 $1,084.8 $68.0$1,661,848Total
Budgeted, Not TeachingBudgeted, Not Teach 8.3 $197,103 $197,103Budgeted, Not Teach 1.8 8.6 $206,997 $209,964 $416,961Budgeted, Not Teach 1.3 0.6 $166,561 $17,044 $183,605
3.1 17.5 $373,558 $424,111 $797,669TotalTotal Architecture
57,022 56,387 63,670 53,886 26,536 200,478 6,754 2,098 205,134 91.4 24.7 $9,370,947 $674,221 $176.2 $49.0$10,045,168
Prepared by Office of Institutional Studies and Planning, 28-Oct-14, 08:13 AM Section VI. Page 5 of 25
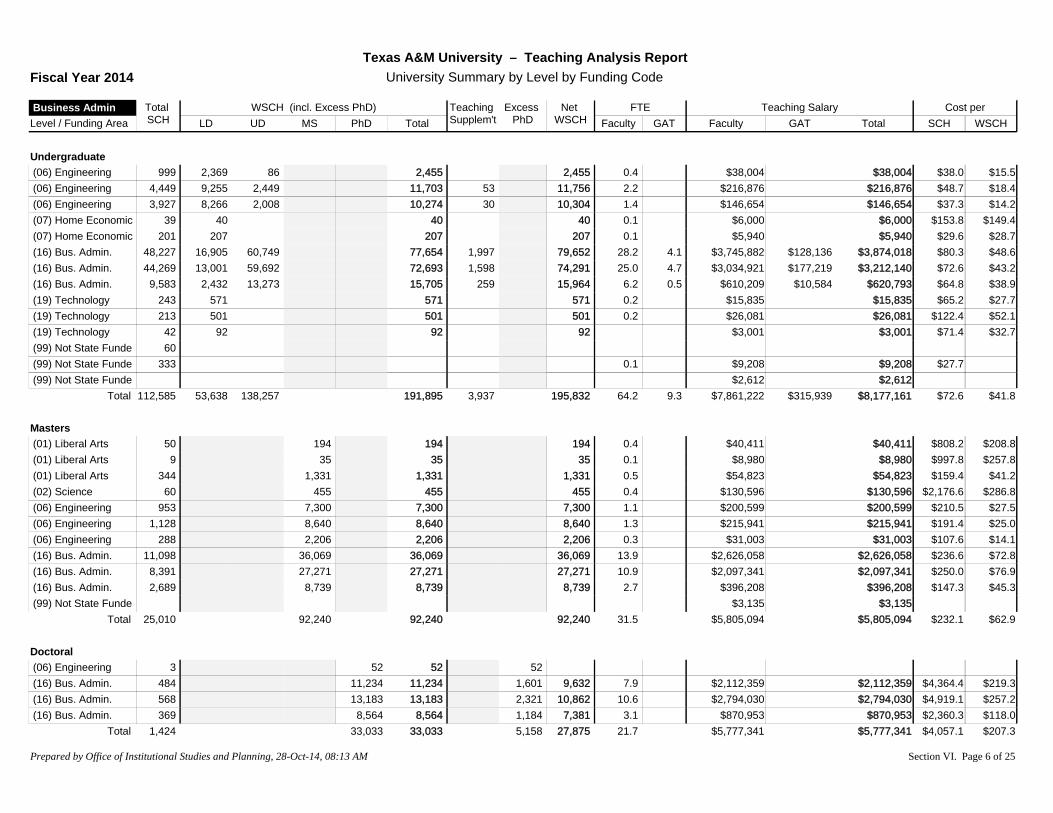
Level / Funding AreaTotal SCH LD UD MS PhD Total
Teaching Supplem't
Excess PhD
Net WSCH
FTEGAT
Teaching SalaryGAT
WSCH (incl. Excess PhD)Faculty Faculty
Cost perWSCHSCHTotal
Business Admin
Texas A&M University – Teaching Analysis ReportUniversity Summary by Level by Funding CodeFiscal Year 2014
Undergraduate(06) Engineering 999 2,369 86 2,455 2,455 0.4 $38,004 $38.0 $15.5$38,004(06) Engineering 4,449 9,255 2,449 11,703 53 11,756 2.2 $216,876 $48.7 $18.4$216,876(06) Engineering 3,927 8,266 2,008 10,274 30 10,304 1.4 $146,654 $37.3 $14.2$146,654(07) Home Economic 39 40 40 40 0.1 $6,000 $153.8 $149.4$6,000(07) Home Economic 201 207 207 207 0.1 $5,940 $29.6 $28.7$5,940(16) Bus. Admin. 48,227 16,905 60,749 77,654 1,997 79,652 28.2 4.1 $3,745,882 $128,136 $80.3 $48.6$3,874,018(16) Bus. Admin. 44,269 13,001 59,692 72,693 1,598 74,291 25.0 4.7 $3,034,921 $177,219 $72.6 $43.2$3,212,140(16) Bus. Admin. 9,583 2,432 13,273 15,705 259 15,964 6.2 0.5 $610,209 $10,584 $64.8 $38.9$620,793(19) Technology 243 571 571 571 0.2 $15,835 $65.2 $27.7$15,835(19) Technology 213 501 501 501 0.2 $26,081 $122.4 $52.1$26,081(19) Technology 42 92 92 92 $3,001 $71.4 $32.7$3,001(99) Not State Funde 60(99) Not State Funde 333 0.1 $9,208 $27.7$9,208(99) Not State Funde $2,612 $2,612
112,585 53,638 138,257 191,895 3,937 195,832 64.2 9.3 $7,861,222 $315,939 $72.6 $41.8$8,177,161Total
Masters(01) Liberal Arts 50 194 194 194 0.4 $40,411 $808.2 $208.8$40,411(01) Liberal Arts 9 35 35 35 0.1 $8,980 $997.8 $257.8$8,980(01) Liberal Arts 344 1,331 1,331 1,331 0.5 $54,823 $159.4 $41.2$54,823(02) Science 60 455 455 455 0.4 $130,596 $2,176.6 $286.8$130,596(06) Engineering 953 7,300 7,300 7,300 1.1 $200,599 $210.5 $27.5$200,599(06) Engineering 1,128 8,640 8,640 8,640 1.3 $215,941 $191.4 $25.0$215,941(06) Engineering 288 2,206 2,206 2,206 0.3 $31,003 $107.6 $14.1$31,003(16) Bus. Admin. 11,098 36,069 36,069 36,069 13.9 $2,626,058 $236.6 $72.8$2,626,058(16) Bus. Admin. 8,391 27,271 27,271 27,271 10.9 $2,097,341 $250.0 $76.9$2,097,341(16) Bus. Admin. 2,689 8,739 8,739 8,739 2.7 $396,208 $147.3 $45.3$396,208(99) Not State Funde $3,135 $3,135
25,010 92,240 92,240 92,240 31.5 $5,805,094 $232.1 $62.9$5,805,094Total
Doctoral(06) Engineering 3 52 52 52(16) Bus. Admin. 484 11,234 11,234 1,601 9,632 7.9 $2,112,359 $4,364.4 $219.3$2,112,359(16) Bus. Admin. 568 13,183 13,183 2,321 10,862 10.6 $2,794,030 $4,919.1 $257.2$2,794,030(16) Bus. Admin. 369 8,564 8,564 1,184 7,381 3.1 $870,953 $2,360.3 $118.0$870,953
1,424 33,033 33,033 5,158 27,875 21.7 $5,777,341 $4,057.1 $207.3$5,777,341Total
Prepared by Office of Institutional Studies and Planning, 28-Oct-14, 08:13 AM Section VI. Page 6 of 25
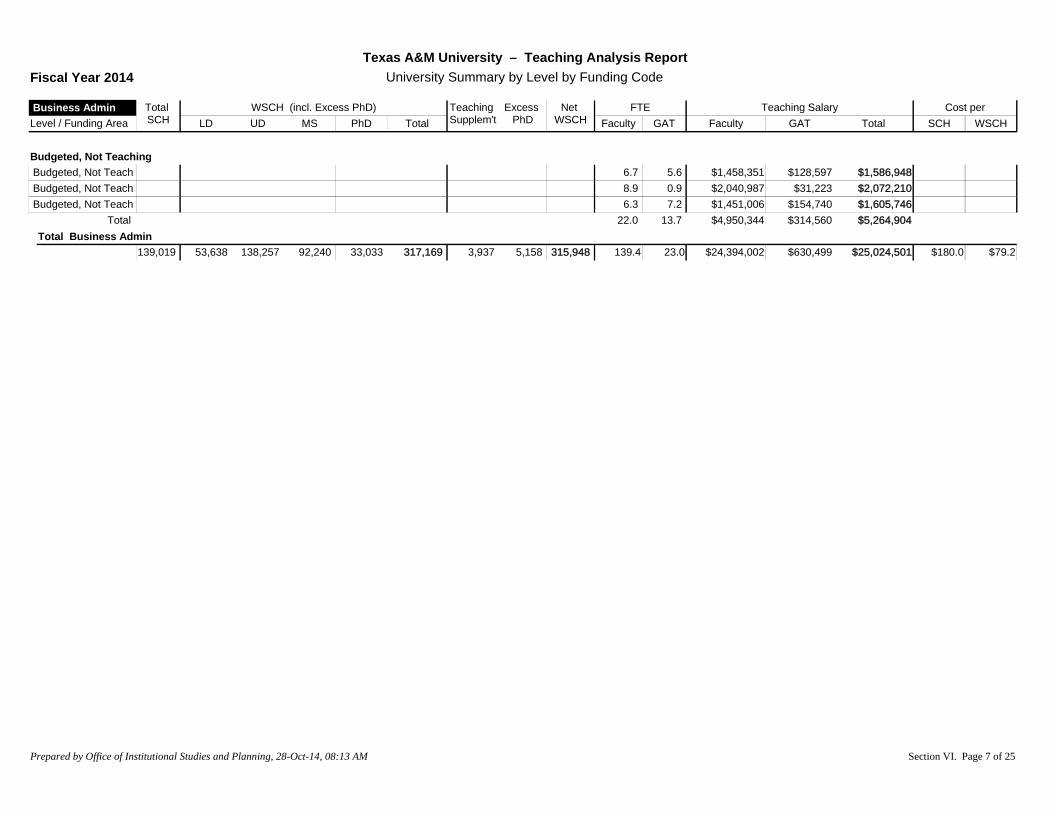
Level / Funding AreaTotal SCH LD UD MS PhD Total
Teaching Supplem't
Excess PhD
Net WSCH
FTEGAT
Teaching SalaryGAT
WSCH (incl. Excess PhD)Faculty Faculty
Cost perWSCHSCHTotal
Business Admin
Texas A&M University – Teaching Analysis ReportUniversity Summary by Level by Funding CodeFiscal Year 2014
Budgeted, Not TeachingBudgeted, Not Teach 6.7 5.6 $1,458,351 $128,597 $1,586,948Budgeted, Not Teach 8.9 0.9 $2,040,987 $31,223 $2,072,210Budgeted, Not Teach 6.3 7.2 $1,451,006 $154,740 $1,605,746
22.0 13.7 $4,950,344 $314,560 $5,264,904TotalTotal Business Admin
139,019 53,638 138,257 92,240 33,033 317,169 3,937 5,158 315,948 139.4 23.0 $24,394,002 $630,499 $180.0 $79.2$25,024,501
Prepared by Office of Institutional Studies and Planning, 28-Oct-14, 08:13 AM Section VI. Page 7 of 25

Level / Funding AreaTotal SCH LD UD MS PhD Total
Teaching Supplem't
Excess PhD
Net WSCH
FTEGAT
Teaching SalaryGAT
WSCH (incl. Excess PhD)Faculty Faculty
Cost perWSCHSCHTotal
Education
Texas A&M University – Teaching Analysis ReportUniversity Summary by Level by Funding CodeFiscal Year 2014
Undergraduate(01) Liberal Arts 2,774 342 4,148 4,490 49 4,540 2.0 0.7 $160,367 $23,625 $66.3 $40.5$183,992(01) Liberal Arts 660 45 1,052 1,097 1,097 0.3 0.1 $18,100 $3,000 $32.0 $19.2$21,100(01) Liberal Arts 2,989 302 4,564 4,866 28 4,894 2.2 0.9 $181,174 $33,750 $71.9 $43.9$214,924(02) Science 3,174 144 9,238 9,382 202 9,584 3.1 0.8 $286,161 $27,000 $98.7 $32.7$313,161(02) Science 3,282 203 9,450 9,653 214 9,867 2.9 0.6 $273,636 $20,250 $89.5 $29.8$293,886(02) Science 724 16 2,117 2,133 66 2,199 0.5 $49,647 $68.6 $22.6$49,647(03) Fine Art 408 445 241 686 686 0.8 $57,445 $140.8 $83.8$57,445(03) Fine Art 408 254 566 820 820 0.8 $59,379 $145.5 $72.4$59,379(04) Teacher Educ. 13,033 7,287 15,524 22,812 363 23,175 9.7 2.0 $811,661 $71,252 $67.7 $38.1$882,913(04) Teacher Educ. 14,655 7,661 18,131 25,792 288 26,080 10.5 1.2 $841,765 $45,000 $60.5 $34.0$886,765(04) Teacher Educ. 2,137 991 2,792 3,783 51 3,834 1.2 0.2 $104,809 $10,751 $54.1 $30.1$115,560(06) Engineering 1,227 2,996 2,996 2,996 0.3 $34,206 $27.9 $11.4$34,206(06) Engineering 171 347 107 454 454 $4,333 $25.3 $9.5$4,333(06) Engineering 1,098 2,672 2,672 2,672 0.3 $34,491 $31.4 $12.9$34,491(07) Home Economic 300 74 366 440 440 0.2 0.1 $14,221 $3,750 $59.9 $40.8$17,971(07) Home Economic 150 25 208 233 233 0.3 $10,500 $70.0 $45.1$10,500(07) Home Economic 270 96 292 388 388 0.2 $13,267 $49.1 $34.2$13,267(13) Phys. Training 7,510 10,253 10,253 10,253 8.1 0.9 $518,482 $30,292 $73.1 $53.5$548,775(13) Phys. Training 7,686 10,505 10,505 10,505 8.2 1.7 $517,516 $55,216 $74.5 $54.5$572,732(13) Phys. Training 610 830 830 830 0.7 0.6 $46,836 $22,204 $113.2 $83.2$69,039(14) Health Service 13,357 8,943 8,783 17,727 437 18,164 6.0 1.8 $460,127 $57,970 $38.8 $28.5$518,097(14) Health Service 14,493 9,256 10,191 19,448 473 19,921 6.7 0.8 $498,524 $28,670 $36.4 $26.5$527,194(14) Health Service 3,279 1,693 2,875 4,568 101 4,669 1.9 0.7 $152,467 $24,654 $54.0 $37.9$177,122(16) Bus. Admin. 6,740 2,150 8,773 10,924 479 11,402 2.3 0.9 $196,845 $33,750 $34.2 $20.2$230,595(16) Bus. Admin. 8,250 2,069 11,687 13,756 402 14,158 3.1 0.2 $240,020 $6,750 $29.9 $17.4$246,770(16) Bus. Admin. 3,447 807 4,883 5,691 254 5,945 0.9 $78,072 $22.6 $13.1$78,072(18) Pract. Teacher 4,023 1,248 6,376 7,624 3 7,628 2.4 0.5 $151,537 $16,875 $41.9 $22.1$168,412(18) Pract. Teacher 285 210 346 556 556 0.1 $14,438 $50.7 $26.0$14,438(18) Pract. Teacher 3,489 1,488 5,121 6,609 15 6,624 2.9 0.4 $190,195 $13,500 $58.4 $30.8$203,695(19) Technology 90 221 221 221 0.1 $5,799 $64.4 $26.2$5,799(19) Technology 60 148 148 148 0.1 $6,001 $100.0 $40.7$6,001(99) Not State Funde 68 $1,497 $22.0$1,497
120,847 73,353 128,201 201,555 3,426 204,981 78.8 15.1 $6,033,519 $528,259 $54.3 $32.0$6,561,778Total
Masters(01) Liberal Arts 601 2,326 2,326 2,326 0.7 $75,420 $125.5 $32.4$75,420
Prepared by Office of Institutional Studies and Planning, 28-Oct-14, 08:13 AM Section VI. Page 8 of 25
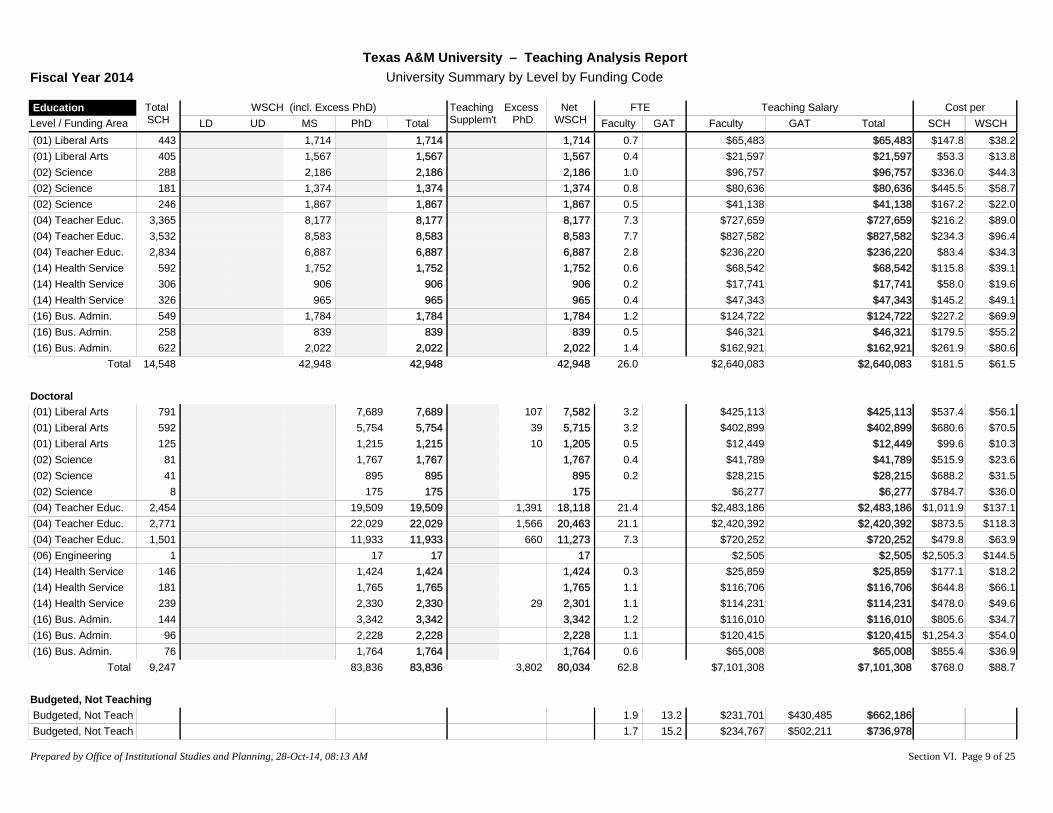
Level / Funding AreaTotal SCH LD UD MS PhD Total
Teaching Supplem't
Excess PhD
Net WSCH
FTEGAT
Teaching SalaryGAT
WSCH (incl. Excess PhD)Faculty Faculty
Cost perWSCHSCHTotal
Education
Texas A&M University – Teaching Analysis ReportUniversity Summary by Level by Funding CodeFiscal Year 2014
(01) Liberal Arts 443 1,714 1,714 1,714 0.7 $65,483 $147.8 $38.2$65,483(01) Liberal Arts 405 1,567 1,567 1,567 0.4 $21,597 $53.3 $13.8$21,597(02) Science 288 2,186 2,186 2,186 1.0 $96,757 $336.0 $44.3$96,757(02) Science 181 1,374 1,374 1,374 0.8 $80,636 $445.5 $58.7$80,636(02) Science 246 1,867 1,867 1,867 0.5 $41,138 $167.2 $22.0$41,138(04) Teacher Educ. 3,365 8,177 8,177 8,177 7.3 $727,659 $216.2 $89.0$727,659(04) Teacher Educ. 3,532 8,583 8,583 8,583 7.7 $827,582 $234.3 $96.4$827,582(04) Teacher Educ. 2,834 6,887 6,887 6,887 2.8 $236,220 $83.4 $34.3$236,220(14) Health Service 592 1,752 1,752 1,752 0.6 $68,542 $115.8 $39.1$68,542(14) Health Service 306 906 906 906 0.2 $17,741 $58.0 $19.6$17,741(14) Health Service 326 965 965 965 0.4 $47,343 $145.2 $49.1$47,343(16) Bus. Admin. 549 1,784 1,784 1,784 1.2 $124,722 $227.2 $69.9$124,722(16) Bus. Admin. 258 839 839 839 0.5 $46,321 $179.5 $55.2$46,321(16) Bus. Admin. 622 2,022 2,022 2,022 1.4 $162,921 $261.9 $80.6$162,921
14,548 42,948 42,948 42,948 26.0 $2,640,083 $181.5 $61.5$2,640,083Total
Doctoral(01) Liberal Arts 791 7,689 7,689 107 7,582 3.2 $425,113 $537.4 $56.1$425,113(01) Liberal Arts 592 5,754 5,754 39 5,715 3.2 $402,899 $680.6 $70.5$402,899(01) Liberal Arts 125 1,215 1,215 10 1,205 0.5 $12,449 $99.6 $10.3$12,449(02) Science 81 1,767 1,767 1,767 0.4 $41,789 $515.9 $23.6$41,789(02) Science 41 895 895 895 0.2 $28,215 $688.2 $31.5$28,215(02) Science 8 175 175 175 $6,277 $784.7 $36.0$6,277(04) Teacher Educ. 2,454 19,509 19,509 1,391 18,118 21.4 $2,483,186 $1,011.9 $137.1$2,483,186(04) Teacher Educ. 2,771 22,029 22,029 1,566 20,463 21.1 $2,420,392 $873.5 $118.3$2,420,392(04) Teacher Educ. 1,501 11,933 11,933 660 11,273 7.3 $720,252 $479.8 $63.9$720,252(06) Engineering 1 17 17 17 $2,505 $2,505.3 $144.5$2,505(14) Health Service 146 1,424 1,424 1,424 0.3 $25,859 $177.1 $18.2$25,859(14) Health Service 181 1,765 1,765 1,765 1.1 $116,706 $644.8 $66.1$116,706(14) Health Service 239 2,330 2,330 29 2,301 1.1 $114,231 $478.0 $49.6$114,231(16) Bus. Admin. 144 3,342 3,342 3,342 1.2 $116,010 $805.6 $34.7$116,010(16) Bus. Admin. 96 2,228 2,228 2,228 1.1 $120,415 $1,254.3 $54.0$120,415(16) Bus. Admin. 76 1,764 1,764 1,764 0.6 $65,008 $855.4 $36.9$65,008
9,247 83,836 83,836 3,802 80,034 62.8 $7,101,308 $768.0 $88.7$7,101,308Total
Budgeted, Not TeachingBudgeted, Not Teach 1.9 13.2 $231,701 $430,485 $662,186Budgeted, Not Teach 1.7 15.2 $234,767 $502,211 $736,978
Prepared by Office of Institutional Studies and Planning, 28-Oct-14, 08:13 AM Section VI. Page 9 of 25

Level / Funding AreaTotal SCH LD UD MS PhD Total
Teaching Supplem't
Excess PhD
Net WSCH
FTEGAT
Teaching SalaryGAT
WSCH (incl. Excess PhD)Faculty Faculty
Cost perWSCHSCHTotal
Education
Texas A&M University – Teaching Analysis ReportUniversity Summary by Level by Funding CodeFiscal Year 2014
Budgeted, Not Teach 2.1 8.5 $202,848 $303,164 $506,0125.7 36.8 $669,316 $1,235,860 $1,905,176Total
Total Education 144,642 73,353 128,201 42,948 83,836 328,339 3,426 3,802 327,963 173.4 51.9 $16,444,225 $1,764,119 $125.9 $55.5$18,208,344
Prepared by Office of Institutional Studies and Planning, 28-Oct-14, 08:13 AM Section VI. Page 10 of 25
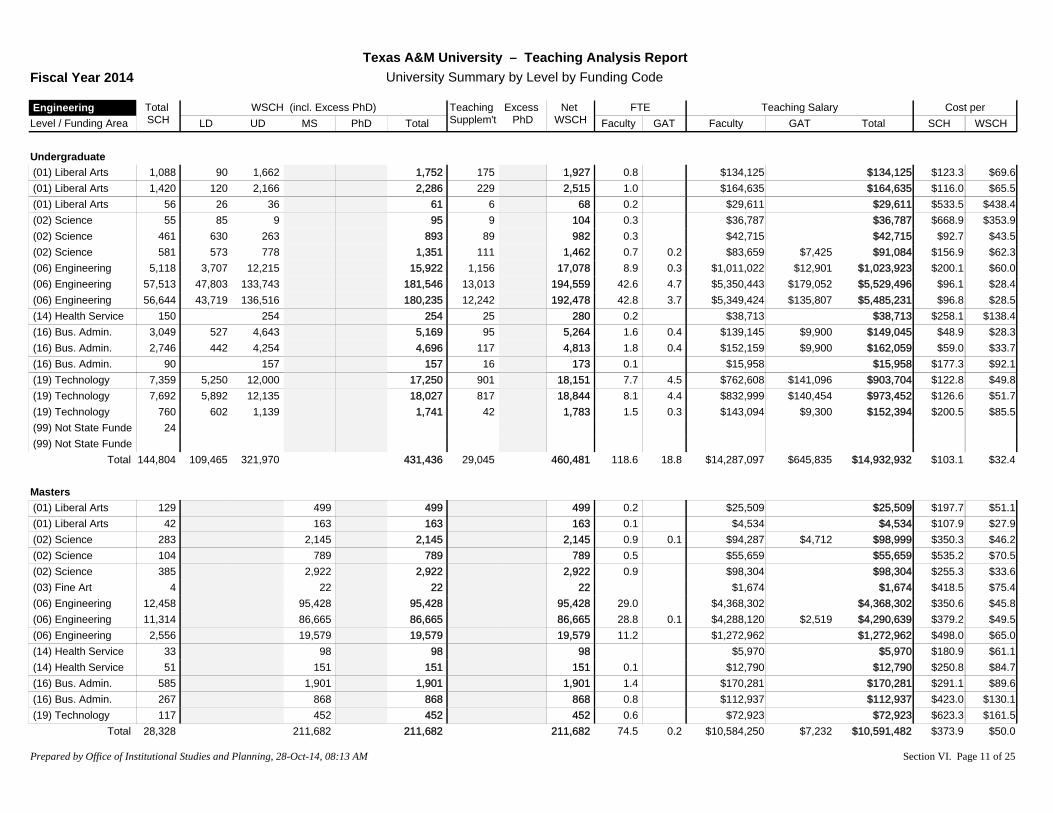
Level / Funding AreaTotal SCH LD UD MS PhD Total
Teaching Supplem't
Excess PhD
Net WSCH
FTEGAT
Teaching SalaryGAT
WSCH (incl. Excess PhD)Faculty Faculty
Cost perWSCHSCHTotal
Engineering
Texas A&M University – Teaching Analysis ReportUniversity Summary by Level by Funding CodeFiscal Year 2014
Undergraduate(01) Liberal Arts 1,088 90 1,662 1,752 175 1,927 0.8 $134,125 $123.3 $69.6$134,125(01) Liberal Arts 1,420 120 2,166 2,286 229 2,515 1.0 $164,635 $116.0 $65.5$164,635(01) Liberal Arts 56 26 36 61 6 68 0.2 $29,611 $533.5 $438.4$29,611(02) Science 55 85 9 95 9 104 0.3 $36,787 $668.9 $353.9$36,787(02) Science 461 630 263 893 89 982 0.3 $42,715 $92.7 $43.5$42,715(02) Science 581 573 778 1,351 111 1,462 0.7 0.2 $83,659 $7,425 $156.9 $62.3$91,084(06) Engineering 5,118 3,707 12,215 15,922 1,156 17,078 8.9 0.3 $1,011,022 $12,901 $200.1 $60.0$1,023,923(06) Engineering 57,513 47,803 133,743 181,546 13,013 194,559 42.6 4.7 $5,350,443 $179,052 $96.1 $28.4$5,529,496(06) Engineering 56,644 43,719 136,516 180,235 12,242 192,478 42.8 3.7 $5,349,424 $135,807 $96.8 $28.5$5,485,231(14) Health Service 150 254 254 25 280 0.2 $38,713 $258.1 $138.4$38,713(16) Bus. Admin. 3,049 527 4,643 5,169 95 5,264 1.6 0.4 $139,145 $9,900 $48.9 $28.3$149,045(16) Bus. Admin. 2,746 442 4,254 4,696 117 4,813 1.8 0.4 $152,159 $9,900 $59.0 $33.7$162,059(16) Bus. Admin. 90 157 157 16 173 0.1 $15,958 $177.3 $92.1$15,958(19) Technology 7,359 5,250 12,000 17,250 901 18,151 7.7 4.5 $762,608 $141,096 $122.8 $49.8$903,704(19) Technology 7,692 5,892 12,135 18,027 817 18,844 8.1 4.4 $832,999 $140,454 $126.6 $51.7$973,452(19) Technology 760 602 1,139 1,741 42 1,783 1.5 0.3 $143,094 $9,300 $200.5 $85.5$152,394(99) Not State Funde 24(99) Not State Funde
144,804 109,465 321,970 431,436 29,045 460,481 118.6 18.8 $14,287,097 $645,835 $103.1 $32.4$14,932,932Total
Masters(01) Liberal Arts 129 499 499 499 0.2 $25,509 $197.7 $51.1$25,509(01) Liberal Arts 42 163 163 163 0.1 $4,534 $107.9 $27.9$4,534(02) Science 283 2,145 2,145 2,145 0.9 0.1 $94,287 $4,712 $350.3 $46.2$98,999(02) Science 104 789 789 789 0.5 $55,659 $535.2 $70.5$55,659(02) Science 385 2,922 2,922 2,922 0.9 $98,304 $255.3 $33.6$98,304(03) Fine Art 4 22 22 22 $1,674 $418.5 $75.4$1,674(06) Engineering 12,458 95,428 95,428 95,428 29.0 $4,368,302 $350.6 $45.8$4,368,302(06) Engineering 11,314 86,665 86,665 86,665 28.8 0.1 $4,288,120 $2,519 $379.2 $49.5$4,290,639(06) Engineering 2,556 19,579 19,579 19,579 11.2 $1,272,962 $498.0 $65.0$1,272,962(14) Health Service 33 98 98 98 $5,970 $180.9 $61.1$5,970(14) Health Service 51 151 151 151 0.1 $12,790 $250.8 $84.7$12,790(16) Bus. Admin. 585 1,901 1,901 1,901 1.4 $170,281 $291.1 $89.6$170,281(16) Bus. Admin. 267 868 868 868 0.8 $112,937 $423.0 $130.1$112,937(19) Technology 117 452 452 452 0.6 $72,923 $623.3 $161.5$72,923
28,328 211,682 211,682 211,682 74.5 0.2 $10,584,250 $7,232 $373.9 $50.0$10,591,482Total
Prepared by Office of Institutional Studies and Planning, 28-Oct-14, 08:13 AM Section VI. Page 11 of 25

Level / Funding AreaTotal SCH LD UD MS PhD Total
Teaching Supplem't
Excess PhD
Net WSCH
FTEGAT
Teaching SalaryGAT
WSCH (incl. Excess PhD)Faculty Faculty
Cost perWSCHSCHTotal
Engineering
Texas A&M University – Teaching Analysis ReportUniversity Summary by Level by Funding CodeFiscal Year 2014
Doctoral(01) Liberal Arts 66 642 642 642 0.2 $10,532 $159.6 $16.4$10,532(01) Liberal Arts 39 379 379 379 0.2 $10,573 $271.1 $27.9$10,573(02) Science 236 5,150 5,150 218 4,931 0.8 $117,282 $497.0 $23.8$117,282(02) Science 451 9,841 9,841 415 9,426 3.1 $478,310 $1,060.6 $50.7$478,310(02) Science 515 11,235 11,235 480 10,755 3.0 0.1 $456,046 $2,938 $891.4 $42.7$458,983(06) Engineering 8,801 152,609 152,609 8,774 143,835 58.9 $8,773,479 $996.9 $61.0$8,773,479(06) Engineering 8,875 153,893 153,893 9,364 144,529 58.8 $8,861,375 $856 $998.6 $61.3$8,862,231(06) Engineering 3,920 67,973 67,973 3,399 64,574 26.8 $2,735,541 $697.8 $42.4$2,735,541(14) Health Service 9 88 88 88 $5,363 $595.9 $61.1$5,363(14) Health Service 21 205 205 205 0.1 $23,035 $1,096.9 $112.5$23,035(16) Bus. Admin. 0.3 $42,559 $42,559(16) Bus. Admin. 0.2 $18,579 $18,579
22,933 402,013 402,013 22,649 379,364 152.4 0.1 $21,532,674 $3,793 $939.1 $56.8$21,536,467Total
Budgeted, Not TeachingBudgeted, Not Teach 0.9 33.5 $162,908 $1,262,464 $1,425,372Budgeted, Not Teach 2.5 34.5 $369,594 $1,294,572 $1,664,166Budgeted, Not Teach 9.5 2.9 $1,293,780 $105,733 $1,399,513(99) Not State Funde
12.8 70.9 $1,826,282 $2,662,769 $4,489,051TotalTotal Engineering
196,064 109,465 321,970 211,682 402,013 1,045,131 29,045 22,649 ,051,527 358.3 90.0 $48,230,303 $3,319,629 $262.9 $49.0$51,549,932
Prepared by Office of Institutional Studies and Planning, 28-Oct-14, 08:13 AM Section VI. Page 12 of 25
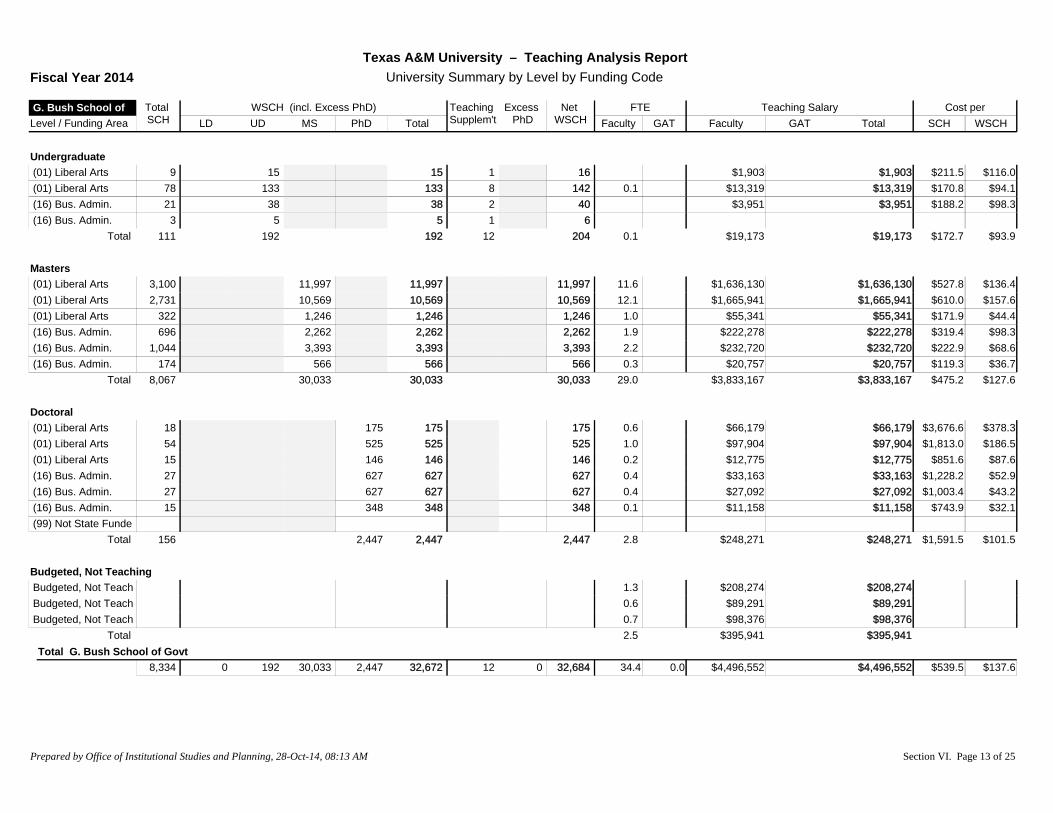
Level / Funding AreaTotal SCH LD UD MS PhD Total
Teaching Supplem't
Excess PhD
Net WSCH
FTEGAT
Teaching SalaryGAT
WSCH (incl. Excess PhD)Faculty Faculty
Cost perWSCHSCHTotal
G. Bush School of
Texas A&M University – Teaching Analysis ReportUniversity Summary by Level by Funding CodeFiscal Year 2014
Undergraduate(01) Liberal Arts 9 15 15 1 16 $1,903 $211.5 $116.0$1,903(01) Liberal Arts 78 133 133 8 142 0.1 $13,319 $170.8 $94.1$13,319(16) Bus. Admin. 21 38 38 2 40 $3,951 $188.2 $98.3$3,951(16) Bus. Admin. 3 5 5 1 6
111 192 192 12 204 0.1 $19,173 $172.7 $93.9$19,173Total
Masters(01) Liberal Arts 3,100 11,997 11,997 11,997 11.6 $1,636,130 $527.8 $136.4$1,636,130(01) Liberal Arts 2,731 10,569 10,569 10,569 12.1 $1,665,941 $610.0 $157.6$1,665,941(01) Liberal Arts 322 1,246 1,246 1,246 1.0 $55,341 $171.9 $44.4$55,341(16) Bus. Admin. 696 2,262 2,262 2,262 1.9 $222,278 $319.4 $98.3$222,278(16) Bus. Admin. 1,044 3,393 3,393 3,393 2.2 $232,720 $222.9 $68.6$232,720(16) Bus. Admin. 174 566 566 566 0.3 $20,757 $119.3 $36.7$20,757
8,067 30,033 30,033 30,033 29.0 $3,833,167 $475.2 $127.6$3,833,167Total
Doctoral(01) Liberal Arts 18 175 175 175 0.6 $66,179 $3,676.6 $378.3$66,179(01) Liberal Arts 54 525 525 525 1.0 $97,904 $1,813.0 $186.5$97,904(01) Liberal Arts 15 146 146 146 0.2 $12,775 $851.6 $87.6$12,775(16) Bus. Admin. 27 627 627 627 0.4 $33,163 $1,228.2 $52.9$33,163(16) Bus. Admin. 27 627 627 627 0.4 $27,092 $1,003.4 $43.2$27,092(16) Bus. Admin. 15 348 348 348 0.1 $11,158 $743.9 $32.1$11,158(99) Not State Funde
156 2,447 2,447 2,447 2.8 $248,271 $1,591.5 $101.5$248,271Total
Budgeted, Not TeachingBudgeted, Not Teach 1.3 $208,274 $208,274Budgeted, Not Teach 0.6 $89,291 $89,291Budgeted, Not Teach 0.7 $98,376 $98,376
2.5 $395,941 $395,941TotalTotal G. Bush School of Govt
8,334 0 192 30,033 2,447 32,672 12 0 32,684 34.4 0.0 $4,496,552 $539.5 $137.6$4,496,552
Prepared by Office of Institutional Studies and Planning, 28-Oct-14, 08:13 AM Section VI. Page 13 of 25
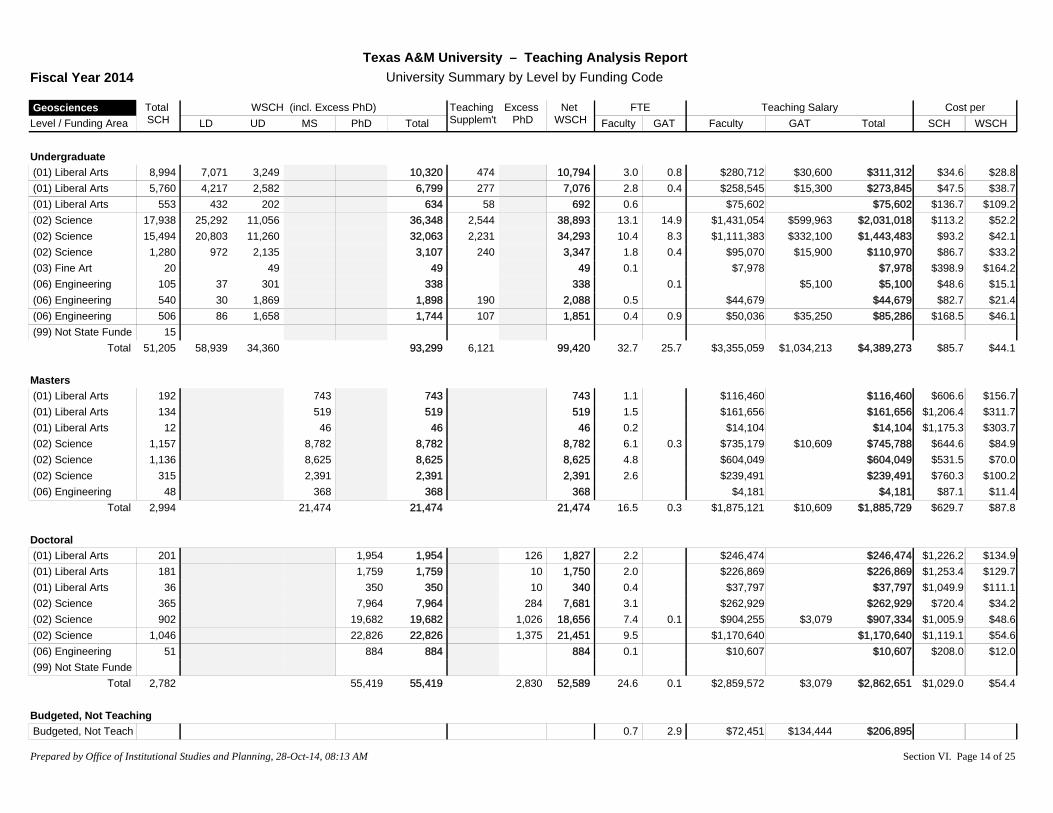
Level / Funding AreaTotal SCH LD UD MS PhD Total
Teaching Supplem't
Excess PhD
Net WSCH
FTEGAT
Teaching SalaryGAT
WSCH (incl. Excess PhD)Faculty Faculty
Cost perWSCHSCHTotal
Geosciences
Texas A&M University – Teaching Analysis ReportUniversity Summary by Level by Funding CodeFiscal Year 2014
Undergraduate(01) Liberal Arts 8,994 7,071 3,249 10,320 474 10,794 3.0 0.8 $280,712 $30,600 $34.6 $28.8$311,312(01) Liberal Arts 5,760 4,217 2,582 6,799 277 7,076 2.8 0.4 $258,545 $15,300 $47.5 $38.7$273,845(01) Liberal Arts 553 432 202 634 58 692 0.6 $75,602 $136.7 $109.2$75,602(02) Science 17,938 25,292 11,056 36,348 2,544 38,893 13.1 14.9 $1,431,054 $599,963 $113.2 $52.2$2,031,018(02) Science 15,494 20,803 11,260 32,063 2,231 34,293 10.4 8.3 $1,111,383 $332,100 $93.2 $42.1$1,443,483(02) Science 1,280 972 2,135 3,107 240 3,347 1.8 0.4 $95,070 $15,900 $86.7 $33.2$110,970(03) Fine Art 20 49 49 49 0.1 $7,978 $398.9 $164.2$7,978(06) Engineering 105 37 301 338 338 0.1 $5,100 $48.6 $15.1$5,100(06) Engineering 540 30 1,869 1,898 190 2,088 0.5 $44,679 $82.7 $21.4$44,679(06) Engineering 506 86 1,658 1,744 107 1,851 0.4 0.9 $50,036 $35,250 $168.5 $46.1$85,286(99) Not State Funde 15
51,205 58,939 34,360 93,299 6,121 99,420 32.7 25.7 $3,355,059 $1,034,213 $85.7 $44.1$4,389,273Total
Masters(01) Liberal Arts 192 743 743 743 1.1 $116,460 $606.6 $156.7$116,460(01) Liberal Arts 134 519 519 519 1.5 $161,656 $1,206.4 $311.7$161,656(01) Liberal Arts 12 46 46 46 0.2 $14,104 $1,175.3 $303.7$14,104(02) Science 1,157 8,782 8,782 8,782 6.1 0.3 $735,179 $10,609 $644.6 $84.9$745,788(02) Science 1,136 8,625 8,625 8,625 4.8 $604,049 $531.5 $70.0$604,049(02) Science 315 2,391 2,391 2,391 2.6 $239,491 $760.3 $100.2$239,491(06) Engineering 48 368 368 368 $4,181 $87.1 $11.4$4,181
2,994 21,474 21,474 21,474 16.5 0.3 $1,875,121 $10,609 $629.7 $87.8$1,885,729Total
Doctoral(01) Liberal Arts 201 1,954 1,954 126 1,827 2.2 $246,474 $1,226.2 $134.9$246,474(01) Liberal Arts 181 1,759 1,759 10 1,750 2.0 $226,869 $1,253.4 $129.7$226,869(01) Liberal Arts 36 350 350 10 340 0.4 $37,797 $1,049.9 $111.1$37,797(02) Science 365 7,964 7,964 284 7,681 3.1 $262,929 $720.4 $34.2$262,929(02) Science 902 19,682 19,682 1,026 18,656 7.4 0.1 $904,255 $3,079 $1,005.9 $48.6$907,334(02) Science 1,046 22,826 22,826 1,375 21,451 9.5 $1,170,640 $1,119.1 $54.6$1,170,640(06) Engineering 51 884 884 884 0.1 $10,607 $208.0 $12.0$10,607(99) Not State Funde
2,782 55,419 55,419 2,830 52,589 24.6 0.1 $2,859,572 $3,079 $1,029.0 $54.4$2,862,651Total
Budgeted, Not TeachingBudgeted, Not Teach 0.7 2.9 $72,451 $134,444 $206,895
Prepared by Office of Institutional Studies and Planning, 28-Oct-14, 08:13 AM Section VI. Page 14 of 25
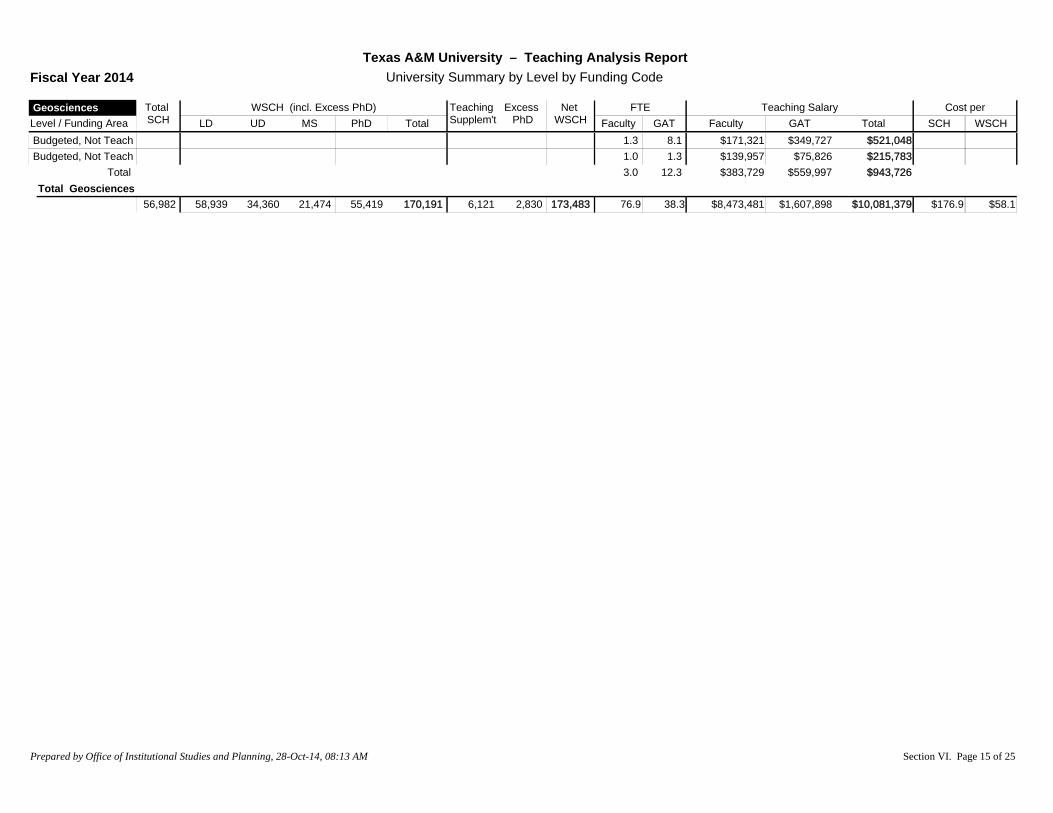
Level / Funding AreaTotal SCH LD UD MS PhD Total
Teaching Supplem't
Excess PhD
Net WSCH
FTEGAT
Teaching SalaryGAT
WSCH (incl. Excess PhD)Faculty Faculty
Cost perWSCHSCHTotal
Geosciences
Texas A&M University – Teaching Analysis ReportUniversity Summary by Level by Funding CodeFiscal Year 2014
Budgeted, Not Teach 1.3 8.1 $171,321 $349,727 $521,048Budgeted, Not Teach 1.0 1.3 $139,957 $75,826 $215,783
3.0 12.3 $383,729 $559,997 $943,726TotalTotal Geosciences
56,982 58,939 34,360 21,474 55,419 170,191 6,121 2,830 173,483 76.9 38.3 $8,473,481 $1,607,898 $176.9 $58.1$10,081,379
Prepared by Office of Institutional Studies and Planning, 28-Oct-14, 08:13 AM Section VI. Page 15 of 25

Level / Funding AreaTotal SCH LD UD MS PhD Total
Teaching Supplem't
Excess PhD
Net WSCH
FTEGAT
Teaching SalaryGAT
WSCH (incl. Excess PhD)Faculty Faculty
Cost perWSCHSCHTotal
Law
Texas A&M University – Teaching Analysis ReportUniversity Summary by Level by Funding CodeFiscal Year 2014
7(08) 08 9,980 48,004 16.3 $2,154,703 $215.9 $44.9$2,154,703(08) 08 9,257 44,526 17.2 $2,248,703 $242.9 $50.5$2,248,703(08) 08 1,312 6,311 2.1 $126,500 $96.4 $20.0$126,500
20,549 98,841 35.5 $4,529,906 $220.4 $45.8$4,529,906Total
Budgeted, Not TeachingBudgeted, Not Teach 1.5 $251,273 $251,273Budgeted, Not Teach 0.9 $173,630 $173,630Budgeted, Not Teach 1.8 $127,297 $127,297
4.2 $552,200 $552,200TotalTotal Law
20,549 0 0 0 0 0 0 0 98,841 39.7 0.0 $5,082,106 $247.3 $51.4$5,082,106
Prepared by Office of Institutional Studies and Planning, 28-Oct-14, 08:13 AM Section VI. Page 16 of 25
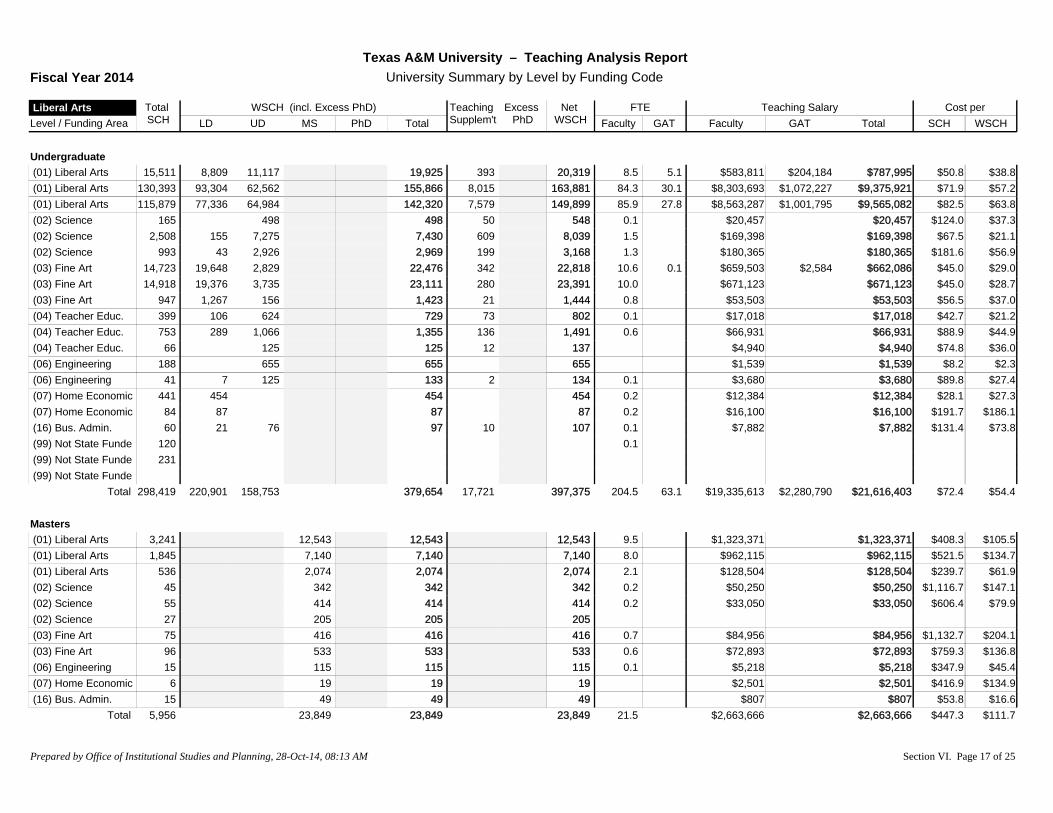
Level / Funding AreaTotal SCH LD UD MS PhD Total
Teaching Supplem't
Excess PhD
Net WSCH
FTEGAT
Teaching SalaryGAT
WSCH (incl. Excess PhD)Faculty Faculty
Cost perWSCHSCHTotal
Liberal Arts
Texas A&M University – Teaching Analysis ReportUniversity Summary by Level by Funding CodeFiscal Year 2014
Undergraduate(01) Liberal Arts 15,511 8,809 11,117 19,925 393 20,319 8.5 5.1 $583,811 $204,184 $50.8 $38.8$787,995(01) Liberal Arts 130,393 93,304 62,562 155,866 8,015 163,881 84.3 30.1 $8,303,693 $1,072,227 $71.9 $57.2$9,375,921(01) Liberal Arts 115,879 77,336 64,984 142,320 7,579 149,899 85.9 27.8 $8,563,287 $1,001,795 $82.5 $63.8$9,565,082(02) Science 165 498 498 50 548 0.1 $20,457 $124.0 $37.3$20,457(02) Science 2,508 155 7,275 7,430 609 8,039 1.5 $169,398 $67.5 $21.1$169,398(02) Science 993 43 2,926 2,969 199 3,168 1.3 $180,365 $181.6 $56.9$180,365(03) Fine Art 14,723 19,648 2,829 22,476 342 22,818 10.6 0.1 $659,503 $2,584 $45.0 $29.0$662,086(03) Fine Art 14,918 19,376 3,735 23,111 280 23,391 10.0 $671,123 $45.0 $28.7$671,123(03) Fine Art 947 1,267 156 1,423 21 1,444 0.8 $53,503 $56.5 $37.0$53,503(04) Teacher Educ. 399 106 624 729 73 802 0.1 $17,018 $42.7 $21.2$17,018(04) Teacher Educ. 753 289 1,066 1,355 136 1,491 0.6 $66,931 $88.9 $44.9$66,931(04) Teacher Educ. 66 125 125 12 137 $4,940 $74.8 $36.0$4,940(06) Engineering 188 655 655 655 $1,539 $8.2 $2.3$1,539(06) Engineering 41 7 125 133 2 134 0.1 $3,680 $89.8 $27.4$3,680(07) Home Economic 441 454 454 454 0.2 $12,384 $28.1 $27.3$12,384(07) Home Economic 84 87 87 87 0.2 $16,100 $191.7 $186.1$16,100(16) Bus. Admin. 60 21 76 97 10 107 0.1 $7,882 $131.4 $73.8$7,882(99) Not State Funde 120 0.1(99) Not State Funde 231(99) Not State Funde
298,419 220,901 158,753 379,654 17,721 397,375 204.5 63.1 $19,335,613 $2,280,790 $72.4 $54.4$21,616,403Total
Masters(01) Liberal Arts 3,241 12,543 12,543 12,543 9.5 $1,323,371 $408.3 $105.5$1,323,371(01) Liberal Arts 1,845 7,140 7,140 7,140 8.0 $962,115 $521.5 $134.7$962,115(01) Liberal Arts 536 2,074 2,074 2,074 2.1 $128,504 $239.7 $61.9$128,504(02) Science 45 342 342 342 0.2 $50,250 $1,116.7 $147.1$50,250(02) Science 55 414 414 414 0.2 $33,050 $606.4 $79.9$33,050(02) Science 27 205 205 205(03) Fine Art 75 416 416 416 0.7 $84,956 $1,132.7 $204.1$84,956(03) Fine Art 96 533 533 533 0.6 $72,893 $759.3 $136.8$72,893(06) Engineering 15 115 115 115 0.1 $5,218 $347.9 $45.4$5,218(07) Home Economic 6 19 19 19 $2,501 $416.9 $134.9$2,501(16) Bus. Admin. 15 49 49 49 $807 $53.8 $16.6$807
5,956 23,849 23,849 23,849 21.5 $2,663,666 $447.3 $111.7$2,663,666Total
Prepared by Office of Institutional Studies and Planning, 28-Oct-14, 08:13 AM Section VI. Page 17 of 25

Level / Funding AreaTotal SCH LD UD MS PhD Total
Teaching Supplem't
Excess PhD
Net WSCH
FTEGAT
Teaching SalaryGAT
WSCH (incl. Excess PhD)Faculty Faculty
Cost perWSCHSCHTotal
Liberal Arts
Texas A&M University – Teaching Analysis ReportUniversity Summary by Level by Funding CodeFiscal Year 2014
Doctoral(01) Liberal Arts 3,545 34,457 34,457 1,234 33,223 38.7 $5,376,307 $1,516.6 $161.8$5,376,307(01) Liberal Arts 750 7,290 7,290 97 7,193 8.5 $650,685 $867.6 $90.5$650,685(01) Liberal Arts 3,746 36,411 36,411 797 35,614 37.9 $5,270,877 $1,407.1 $148.0$5,270,877(02) Science 50 1,091 1,091 1,091 0.6 $76,338 $1,526.8 $70.0$76,338(02) Science 128 2,793 2,793 2,793 1.0 $125,990 $984.3 $45.1$125,990(02) Science 102 2,226 2,226 2,226 0.7(03) Fine Art 12 92 92 92 $5,654 $471.1 $61.7$5,654(03) Fine Art 27 206 206 206 0.1 $14,927 $552.9 $72.4$14,927(07) Home Economic 12 100 100 100 0.1 $13,550 $1,129.2 $134.9$13,550(16) Bus. Admin. 12 279 279 279 $4,612 $384.4 $16.6$4,612
8,384 84,945 84,945 2,129 82,816 87.7 $11,538,941 $1,376.3 $139.3$11,538,941Total
Budgeted, Not TeachingBudgeted, Not Teach 7.5 23.6 $907,125 $789,235 $1,696,360Budgeted, Not Teach 5.6 24.8 $781,036 $812,189 $1,593,225Budgeted, Not Teach 5.0 1.7 $745,746 $49,383 $795,129
18.0 50.1 $2,433,907 $1,650,807 $4,084,714TotalTotal Liberal Arts
312,759 220,901 158,753 23,849 84,945 488,447 17,721 2,129 504,040 331.7 113.2 $35,972,127 $3,931,597 $127.6 $79.2$39,903,724
Prepared by Office of Institutional Studies and Planning, 28-Oct-14, 08:13 AM Section VI. Page 18 of 25
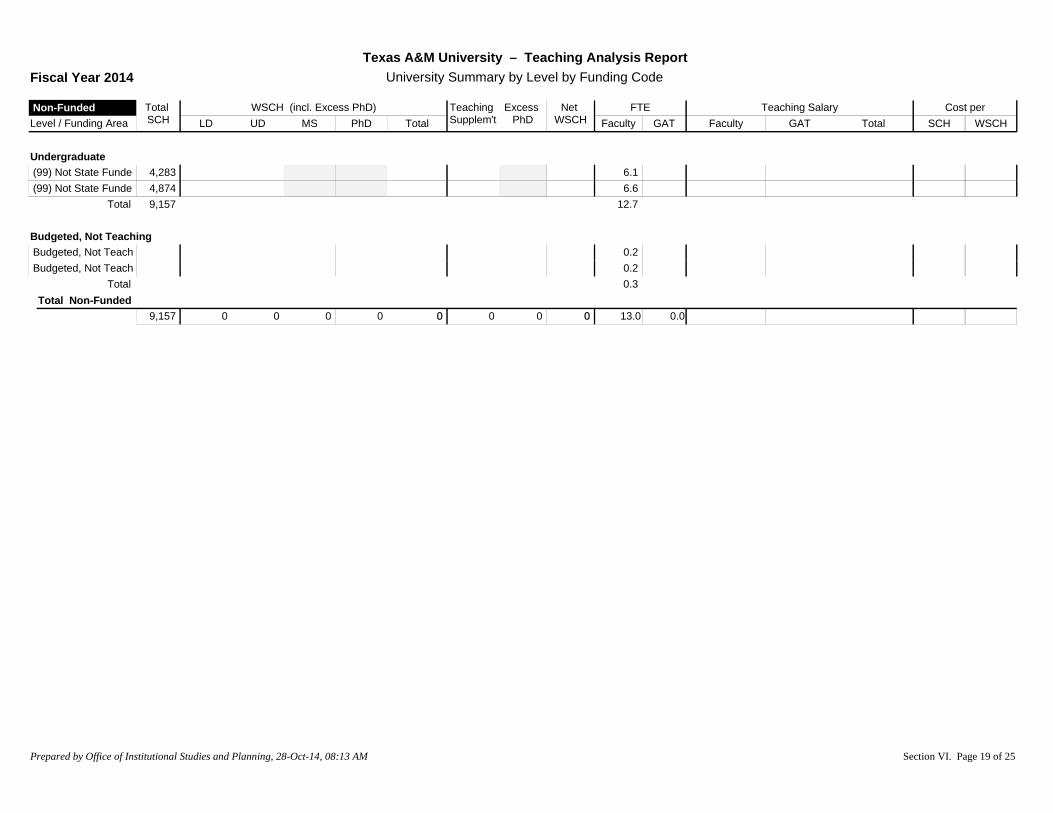
Level / Funding AreaTotal SCH LD UD MS PhD Total
Teaching Supplem't
Excess PhD
Net WSCH
FTEGAT
Teaching SalaryGAT
WSCH (incl. Excess PhD)Faculty Faculty
Cost perWSCHSCHTotal
Non-Funded
Texas A&M University – Teaching Analysis ReportUniversity Summary by Level by Funding CodeFiscal Year 2014
Undergraduate(99) Not State Funde 4,283 6.1(99) Not State Funde 4,874 6.6
9,157 12.7Total
Budgeted, Not TeachingBudgeted, Not Teach 0.2Budgeted, Not Teach 0.2
0.3TotalTotal Non-Funded
9,157 0 0 0 0 0 0 0 0 13.0 0.0
Prepared by Office of Institutional Studies and Planning, 28-Oct-14, 08:13 AM Section VI. Page 19 of 25

Level / Funding AreaTotal SCH LD UD MS PhD Total
Teaching Supplem't
Excess PhD
Net WSCH
FTEGAT
Teaching SalaryGAT
WSCH (incl. Excess PhD)Faculty Faculty
Cost perWSCHSCHTotal
Other
Texas A&M University – Teaching Analysis ReportUniversity Summary by Level by Funding CodeFiscal Year 2014
0(99) Not State Funde 6.0 0.2 $322,129 $6,000 $328,129(99) Not State Funde 3.1 0.1 $166,012 $4,000 $170,012
9.1 0.3 $488,141 $10,000 $498,141Total
Undergraduate(01) Liberal Arts 1,238 579 1,125 1,704 3 1,707 3.1 $9,000 $7.3 $5.3$9,000(01) Liberal Arts 955 279 1,156 1,435 2 1,437 2.4 $9,000 $9.4 $6.3$9,000(01) Liberal Arts 392 374 31 405 405 0.6(05) Agriculture 3 6 6 1 7 $2,686 $895.4 $391.6$2,686(16) Bus. Admin. 49 57 57 57 0.1(16) Bus. Admin. 1,224 1,432 1,432 1,432 1.6(99) Not State Funde 692(99) Not State Funde 969 0.3(99) Not State Funde
5,522 2,728 2,312 5,040 5 5,044 8.0 $20,686 $3.7 $4.1$20,686Total
Masters(02) Science 16 121 121 121 0.2 $31,190 $1,949.4 $256.8$31,190(02) Science 60 455 455 455 0.2 $28,030 $467.2 $61.6$28,030(06) Engineering 1 8 8 8 $2,313 $2,313.0 $302.0$2,313(06) Engineering 9 69 69 69 $2,313 $257.0 $33.6$2,313
86 653 653 653 0.4 $63,846 $742.4 $97.7$63,846Total
Doctoral(02) Science 105 2,291 2,291 393 1,898 0.3 $38,943 $370.9 $20.5$38,943(02) Science 86 1,877 1,877 153 1,724 0.3 $35,254 $409.9 $20.5$35,254(05) Agriculture 9 94 94 94 $1,972 $219.1 $21.0$1,972(05) Agriculture 8 83 83 83 $1,972 $246.5$1,972(06) Engineering 15 260 260 260 0.1 $11,869 $791.3 $45.6$11,869(06) Engineering 21 364 364 364 0.1 $11,869 $565.2 $32.6$11,869(99) Not State Funde $1,986 $1,986
244 4,969 4,969 629 4,340 0.9 $103,866 $425.7 $23.9$103,866Total
Budgeted, Not TeachingBudgeted, Not Teach 0.3 $30,423 $30,423Budgeted, Not Teach 0.5 $35,625 $35,625
Prepared by Office of Institutional Studies and Planning, 28-Oct-14, 08:13 AM Section VI. Page 20 of 25

Level / Funding AreaTotal SCH LD UD MS PhD Total
Teaching Supplem't
Excess PhD
Net WSCH
FTEGAT
Teaching SalaryGAT
WSCH (incl. Excess PhD)Faculty Faculty
Cost perWSCHSCHTotal
Other
Texas A&M University – Teaching Analysis ReportUniversity Summary by Level by Funding CodeFiscal Year 2014
Budgeted, Not Teach0.8 $66,048 $66,048Total
Total Other 5,852 2,728 2,312 653 4,969 10,662 5 629 10,038 19.1 0.3 $742,587 $10,000 $128.6 $75.0$752,587
Prepared by Office of Institutional Studies and Planning, 28-Oct-14, 08:13 AM Section VI. Page 21 of 25
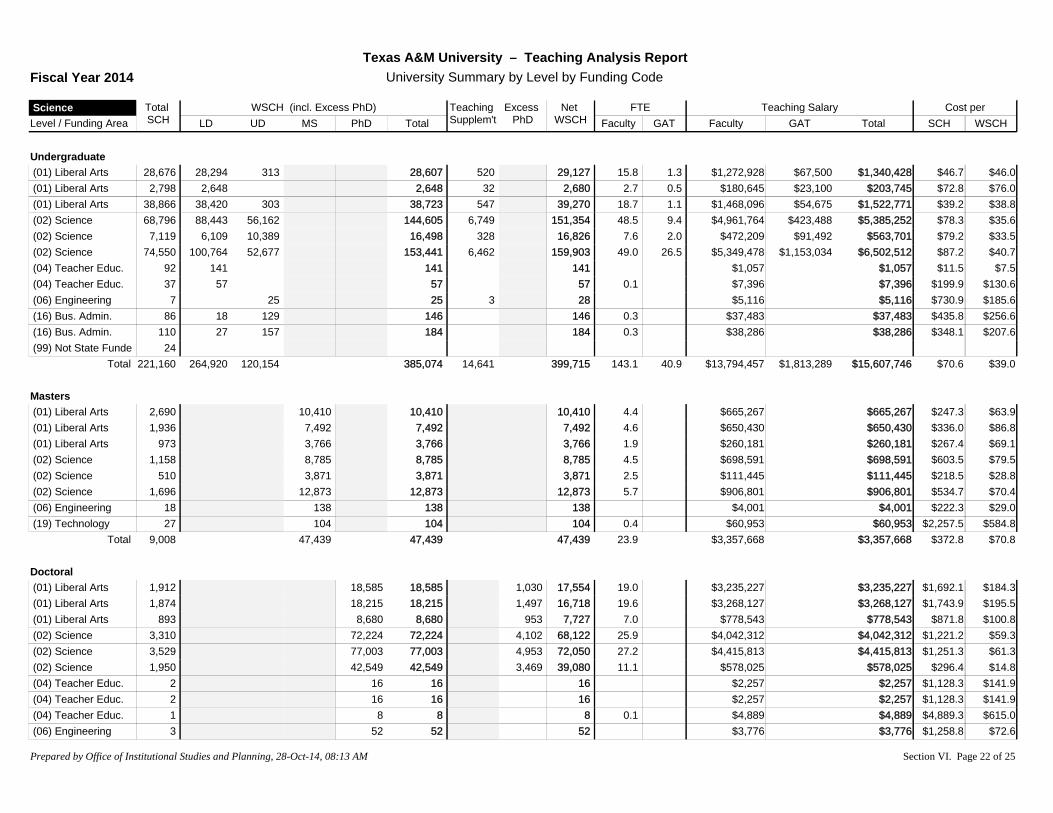
Level / Funding AreaTotal SCH LD UD MS PhD Total
Teaching Supplem't
Excess PhD
Net WSCH
FTEGAT
Teaching SalaryGAT
WSCH (incl. Excess PhD)Faculty Faculty
Cost perWSCHSCHTotal
Science
Texas A&M University – Teaching Analysis ReportUniversity Summary by Level by Funding CodeFiscal Year 2014
Undergraduate(01) Liberal Arts 28,676 28,294 313 28,607 520 29,127 15.8 1.3 $1,272,928 $67,500 $46.7 $46.0$1,340,428(01) Liberal Arts 2,798 2,648 2,648 32 2,680 2.7 0.5 $180,645 $23,100 $72.8 $76.0$203,745(01) Liberal Arts 38,866 38,420 303 38,723 547 39,270 18.7 1.1 $1,468,096 $54,675 $39.2 $38.8$1,522,771(02) Science 68,796 88,443 56,162 144,605 6,749 151,354 48.5 9.4 $4,961,764 $423,488 $78.3 $35.6$5,385,252(02) Science 7,119 6,109 10,389 16,498 328 16,826 7.6 2.0 $472,209 $91,492 $79.2 $33.5$563,701(02) Science 74,550 100,764 52,677 153,441 6,462 159,903 49.0 26.5 $5,349,478 $1,153,034 $87.2 $40.7$6,502,512(04) Teacher Educ. 92 141 141 141 $1,057 $11.5 $7.5$1,057(04) Teacher Educ. 37 57 57 57 0.1 $7,396 $199.9 $130.6$7,396(06) Engineering 7 25 25 3 28 $5,116 $730.9 $185.6$5,116(16) Bus. Admin. 86 18 129 146 146 0.3 $37,483 $435.8 $256.6$37,483(16) Bus. Admin. 110 27 157 184 184 0.3 $38,286 $348.1 $207.6$38,286(99) Not State Funde 24
221,160 264,920 120,154 385,074 14,641 399,715 143.1 40.9 $13,794,457 $1,813,289 $70.6 $39.0$15,607,746Total
Masters(01) Liberal Arts 2,690 10,410 10,410 10,410 4.4 $665,267 $247.3 $63.9$665,267(01) Liberal Arts 1,936 7,492 7,492 7,492 4.6 $650,430 $336.0 $86.8$650,430(01) Liberal Arts 973 3,766 3,766 3,766 1.9 $260,181 $267.4 $69.1$260,181(02) Science 1,158 8,785 8,785 8,785 4.5 $698,591 $603.5 $79.5$698,591(02) Science 510 3,871 3,871 3,871 2.5 $111,445 $218.5 $28.8$111,445(02) Science 1,696 12,873 12,873 12,873 5.7 $906,801 $534.7 $70.4$906,801(06) Engineering 18 138 138 138 $4,001 $222.3 $29.0$4,001(19) Technology 27 104 104 104 0.4 $60,953 $2,257.5 $584.8$60,953
9,008 47,439 47,439 47,439 23.9 $3,357,668 $372.8 $70.8$3,357,668Total
Doctoral(01) Liberal Arts 1,912 18,585 18,585 1,030 17,554 19.0 $3,235,227 $1,692.1 $184.3$3,235,227(01) Liberal Arts 1,874 18,215 18,215 1,497 16,718 19.6 $3,268,127 $1,743.9 $195.5$3,268,127(01) Liberal Arts 893 8,680 8,680 953 7,727 7.0 $778,543 $871.8 $100.8$778,543(02) Science 3,310 72,224 72,224 4,102 68,122 25.9 $4,042,312 $1,221.2 $59.3$4,042,312(02) Science 3,529 77,003 77,003 4,953 72,050 27.2 $4,415,813 $1,251.3 $61.3$4,415,813(02) Science 1,950 42,549 42,549 3,469 39,080 11.1 $578,025 $296.4 $14.8$578,025(04) Teacher Educ. 2 16 16 16 $2,257 $1,128.3 $141.9$2,257(04) Teacher Educ. 2 16 16 16 $2,257 $1,128.3 $141.9$2,257(04) Teacher Educ. 1 8 8 8 0.1 $4,889 $4,889.3 $615.0$4,889(06) Engineering 3 52 52 52 $3,776 $1,258.8 $72.6$3,776
Prepared by Office of Institutional Studies and Planning, 28-Oct-14, 08:13 AM Section VI. Page 22 of 25

Level / Funding AreaTotal SCH LD UD MS PhD Total
Teaching Supplem't
Excess PhD
Net WSCH
FTEGAT
Teaching SalaryGAT
WSCH (incl. Excess PhD)Faculty Faculty
Cost perWSCHSCHTotal
Science
Texas A&M University – Teaching Analysis ReportUniversity Summary by Level by Funding CodeFiscal Year 2014
(06) Engineering $4,001 $4,00113,476 237,348 237,348 16,004 221,343 110.0 $16,335,227 $1,212.2 $73.8$16,335,227Total
Budgeted, Not TeachingBudgeted, Not Teach 6.3 10.9 $769,948 $493,293 $1,263,241Budgeted, Not Teach 4.2 37.1 $572,773 $1,709,239 $2,282,012Budgeted, Not Teach 4.9 47.0 $601,875 $2,134,704 $2,736,579
15.4 95.0 $1,944,596 $4,337,236 $6,281,832TotalTotal Science
243,644 264,920 120,154 47,439 237,348 669,861 14,641 16,004 668,498 292.4 135.9 $35,431,948 $6,150,525 $170.7 $62.2$41,582,473
Prepared by Office of Institutional Studies and Planning, 28-Oct-14, 08:13 AM Section VI. Page 23 of 25

Level / Funding AreaTotal SCH LD UD MS PhD Total
Teaching Supplem't
Excess PhD
Net WSCH
FTEGAT
Teaching SalaryGAT
WSCH (incl. Excess PhD)Faculty Faculty
Cost perWSCHSCHTotal
Veterinary Medicine
Texas A&M University – Teaching Analysis ReportUniversity Summary by Level by Funding CodeFiscal Year 2014
Undergraduate(01) Liberal Arts 221 378 378 378 0.2 $11,391 $51.5 $30.1$11,391(01) Liberal Arts 203 347 347 347 0.3 $15,576 $76.7 $44.9$15,576(01) Liberal Arts 102 174 174 1 175 0.1 $6,018 $59.0 $34.4$6,018(02) Science 5,728 1,419 14,822 16,241 808 17,049 4.0 $298,881 $52.2 $17.5$298,881(02) Science 5,082 1,177 13,281 14,458 771 15,229 4.6 $313,791 $61.7 $20.6$313,791(02) Science 1,026 18 3,005 3,023 47 3,070 1.5 $93,058 $90.7 $30.3$93,058(05) Agriculture 90 12 223 236 24 260 $1,610 $17.9 $6.2$1,610(05) Agriculture 4 11 11 1 12 $60 $15.1 $5.2$60(06) Engineering 126 118 279 397 9 406 0.3 0.2 $6,789 $8,100 $118.2 $36.7$14,889(06) Engineering 8 29 29 3 32 $4,493 $561.6 $142.6$4,493(14) Health Service 679 359 606 964 13 977 0.4 $41,673 $61.4 $42.6$41,673(14) Health Service 1,047 893 394 1,287 111 1,398 0.3 $34,198 $32.7 $24.5$34,198(99) Not State Funde 12
14,328 3,995 33,550 37,545 1,788 39,333 11.8 0.2 $827,538 $8,100 $58.3 $21.2$835,638Total
Masters(01) Liberal Arts 24 93 93 93 $6,691 $278.8 $72.0$6,691(01) Liberal Arts 21 81 81 81 $6,355 $302.6 $78.2$6,355(01) Liberal Arts 9 35 35 35 $1,188 $132.0 $34.1$1,188(02) Science 1,083 8,220 8,220 8,220 2.7 0.2 $299,398 $5,445 $281.5 $37.1$304,843(02) Science 1,051 7,977 7,977 7,977 3.1 $297,868 $283.4 $37.3$297,868(02) Science 348 2,641 2,641 2,641 1.9 $231,748 $665.9 $87.7$231,748(04) Teacher Educ. 3 7 7 7 $183 $61.1 $25.1$183(05) Agriculture 6 46 46 46 $86 $14.4 $1.9$86(06) Engineering 3 23 23 23 $3,294 $1,098.2 $143.4$3,294(06) Engineering 12 92 92 92 $6,260 $521.6 $68.1$6,260(14) Health Service 84 249 249 249 0.1(14) Health Service 57 169 169 169 $2,285 $40.1 $13.5$2,285(14) Health Service 28 83 83 83 $2,343 $83.7 $28.3$2,343
2,729 19,716 19,716 19,716 7.9 0.2 $857,700 $5,445 $316.3 $43.8$863,145Total
Doctoral(01) Liberal Arts 3 29 29 29 $1,198 $399.5 $41.1$1,198(01) Liberal Arts 6 58 58 58 $1,989 $331.6 $34.1$1,989(02) Science 659 14,379 14,379 218 14,161 3.5 $434,146 $1,118 $660.5 $30.7$435,264(02) Science 750 16,365 16,365 371 15,994 3.7 $413,614 $551.5 $25.9$413,614
Prepared by Office of Institutional Studies and Planning, 28-Oct-14, 08:13 AM Section VI. Page 24 of 25
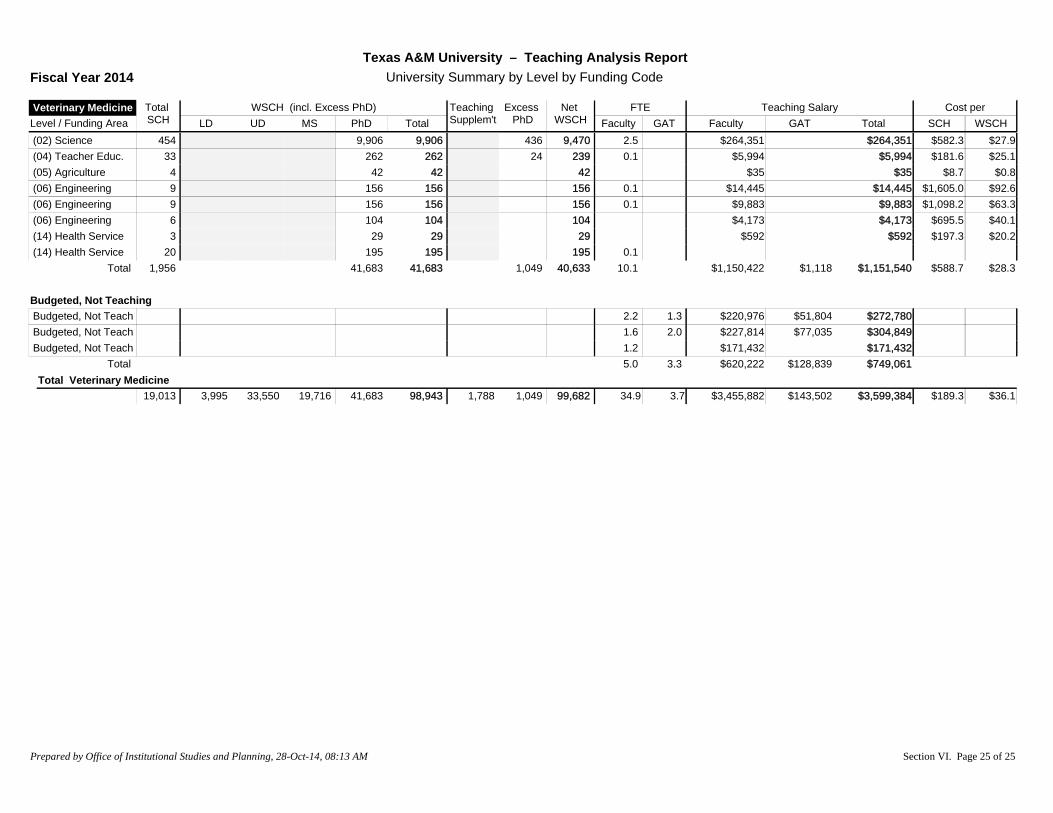
Level / Funding AreaTotal SCH LD UD MS PhD Total
Teaching Supplem't
Excess PhD
Net WSCH
FTEGAT
Teaching SalaryGAT
WSCH (incl. Excess PhD)Faculty Faculty
Cost perWSCHSCHTotal
Veterinary Medicine
Texas A&M University – Teaching Analysis ReportUniversity Summary by Level by Funding CodeFiscal Year 2014
(02) Science 454 9,906 9,906 436 9,470 2.5 $264,351 $582.3 $27.9$264,351(04) Teacher Educ. 33 262 262 24 239 0.1 $5,994 $181.6 $25.1$5,994(05) Agriculture 4 42 42 42 $35 $8.7 $0.8$35(06) Engineering 9 156 156 156 0.1 $14,445 $1,605.0 $92.6$14,445(06) Engineering 9 156 156 156 0.1 $9,883 $1,098.2 $63.3$9,883(06) Engineering 6 104 104 104 $4,173 $695.5 $40.1$4,173(14) Health Service 3 29 29 29 $592 $197.3 $20.2$592(14) Health Service 20 195 195 195 0.1
1,956 41,683 41,683 1,049 40,633 10.1 $1,150,422 $1,118 $588.7 $28.3$1,151,540Total
Budgeted, Not TeachingBudgeted, Not Teach 2.2 1.3 $220,976 $51,804 $272,780Budgeted, Not Teach 1.6 2.0 $227,814 $77,035 $304,849Budgeted, Not Teach 1.2 $171,432 $171,432
5.0 3.3 $620,222 $128,839 $749,061TotalTotal Veterinary Medicine
19,013 3,995 33,550 19,716 41,683 98,943 1,788 1,049 99,682 34.9 3.7 $3,455,882 $143,502 $189.3 $36.1$3,599,384
Prepared by Office of Institutional Studies and Planning, 28-Oct-14, 08:13 AM Section VI. Page 25 of 25

Level / Funding AreaTotal SCH LD UD MS PhD Total
Teaching Supplem't
Excess PhD
Net WSCH
FTEGAT
Teaching SalaryGAT
WSCH (incl. Excess PhD)Faculty Faculty
Cost perWSCHSCHTotal
Agriculture AGEC
Texas A&M University – Teaching Analysis ReportAnalysis of Dept by Level and Funding Code
Fiscal Year 2014
Undergraduate(02) Science 30 85 85 8 93 $4,354 $145.1 $46.8$4,354(05) Agriculture 13,099 7,132 25,350 32,482 2,006 34,488 8.2 0.5 $1,002,158 $24,200 $78.4 $29.8$1,026,358
13,129 7,132 25,434 32,567 2,014 34,581 8.2 0.5 $1,006,511 $24,200 $78.5 $29.8$1,030,711Total
Masters(01) Liberal Arts 39 151 151 151 $5,428 $139.2 $36.0$5,428(05) Agriculture 1,105 8,520 8,520 8,520 3.0 $389,359 $352.4 $45.7$389,359(16) Bus. Admin. 126 410 410 410 0.1 $12,023 $95.4 $29.4$12,023
1,270 9,080 9,080 9,080 3.1 $406,809 $320.3 $44.8$406,809Total
Doctoral(05) Agriculture 852 8,873 8,873 146 8,727 4.8 $719,925 $845.5 $82.5$719,925
852 8,873 8,873 146 8,727 4.8 $719,925 $845.5 $82.5$719,925Total
Budgeted, Not TeachingBudgeted, Not Teach 2.2 9.7 $198,690 $320,525 $519,215
2.2 9.7 $198,690 $320,525 $519,215TotalAGEC 15,251 7,132 25,434 9,080 8,873 50,519 2,014 146 52,387 18.3 10.2 $2,331,936 $344,725 $175.5 $51.1$2,676,661Total
Prepared by Office of Institutional Studies and Planning, 28-Oct-14, 08:14 AM Section VII. Page 1 of 96

Level / Funding AreaTotal SCH LD UD MS PhD Total
Teaching Supplem't
Excess PhD
Net WSCH
FTEGAT
Teaching SalaryGAT
WSCH (incl. Excess PhD)Faculty Faculty
Cost perWSCHSCHTotal
Agriculture ALEC
Texas A&M University – Teaching Analysis ReportAnalysis of Dept by Level and Funding Code
Fiscal Year 2014
Undergraduate(01) Liberal Arts 5,334 1,018 7,212 8,230 317 8,548 4.4 2.1 $303,235 $63,505 $68.8 $42.9$366,740(04) Teacher Educ. 120 9 210 219 22 241 $4,332 $36.1 $18.0$4,332(05) Agriculture 5,619 4,821 8,565 13,387 762 14,149 6.4 0.3 $513,776 $6,426 $92.6 $36.8$520,202(16) Bus. Admin. 4,257 519 6,809 7,329 528 7,856 1.5 1.0 $122,880 $28,431 $35.5 $19.3$151,311(18) Pract. Teacher 210 380 380 24 404 1.2 0.5 $138,885 $11,850 $717.8 $373.3$150,735(19) Technology 150 56 309 366 14 380 0.1 $4,491 $30.0 $11.8$4,491
15,690 6,424 23,486 29,911 1,667 31,577 13.8 4.0 $1,087,599 $110,212 $76.3 $37.9$1,197,811Total
Masters(04) Teacher Educ. 48 117 117 117 $3,611 $75.2 $31.0$3,611(05) Agriculture 1,047 8,072 8,072 8,072 3.5 $367,353 $350.9 $45.5$367,353(16) Bus. Admin. 120 390 390 390 0.1 $9,587 $79.9 $24.6$9,587
1,215 8,579 8,579 8,579 3.6 $380,552 $313.2 $44.4$380,552Total
Doctoral(04) Teacher Educ. 21 167 167 167 0.1 $8,813 $419.7 $52.8$8,813(05) Agriculture 576 6,002 6,002 219 5,783 3.8 $378,761 $657.6 $65.5$378,761(16) Bus. Admin. 51 1,184 1,184 1,184 0.3 $25,032 $490.8 $21.1$25,032
648 7,353 7,353 219 7,134 4.2 $412,605 $636.7 $57.8$412,605Total
Budgeted, Not TeachingBudgeted, Not Teach 0.9 3.0 $109,567 $82,712 $192,279
0.9 3.0 $109,567 $82,712 $192,279TotalALEC 17,553 6,424 23,486 8,579 7,353 45,842 1,667 219 47,290 22.4 7.0 $1,990,323 $192,924 $124.4 $46.2$2,183,247Total
Prepared by Office of Institutional Studies and Planning, 28-Oct-14, 08:14 AM Section VII. Page 2 of 96

Level / Funding AreaTotal SCH LD UD MS PhD Total
Teaching Supplem't
Excess PhD
Net WSCH
FTEGAT
Teaching SalaryGAT
WSCH (incl. Excess PhD)Faculty Faculty
Cost perWSCHSCHTotal
Agriculture ANSC
Texas A&M University – Teaching Analysis ReportAnalysis of Dept by Level and Funding Code
Fiscal Year 2014
Undergraduate(01) Liberal Arts 15 1 23 24 24 0.2 $4,878 $329.8 $205.9$4,878(02) Science 23 12 48 61 6 67 0.6 $75,959 $3,302.6 $1,136.4$75,959(05) Agriculture 18,159 17,081 26,174 43,255 3,574 46,830 9.5 0.9 $910,004 $37,125 $52.2 $20.2$947,129(19) Technology 12 30 30 30 0.2 $4,878 $398.5 $162.0$4,878
18,209 17,094 26,276 43,370 3,580 46,950 10.1 1.3 $985,963 $46,881 $56.7 $22.0$1,032,844Total
Masters(02) Science 140 1,063 1,063 1,063 0.3 $42,855 $306.1 $40.3$42,855(05) Agriculture 954 7,355 7,355 7,355 5.1 $527,790 $553.2 $71.8$527,790
1,094 8,418 8,418 8,418 5.4 $570,645 $521.6 $67.8$570,645Total
Doctoral(02) Science 84 1,833 1,833 1,833 0.5 $79,453 $945.9 $43.3$79,453(05) Agriculture 612 6,377 6,377 333 6,044 4.1 $532,665 $870.4 $88.1$532,665
696 8,210 8,210 333 7,876 4.7 $612,117 $879.5 $77.7$612,117Total
Budgeted, Not TeachingBudgeted, Not Teach 2.3 10.9 $315,936 $349,796 $665,732
2.3 10.9 $315,936 $349,796 $665,732TotalANSC 19,999 17,094 26,276 8,418 8,210 59,998 3,580 333 63,245 22.5 12.2 $2,484,662 $396,677 $144.1 $45.6$2,881,339Total
Prepared by Office of Institutional Studies and Planning, 28-Oct-14, 08:14 AM Section VII. Page 3 of 96
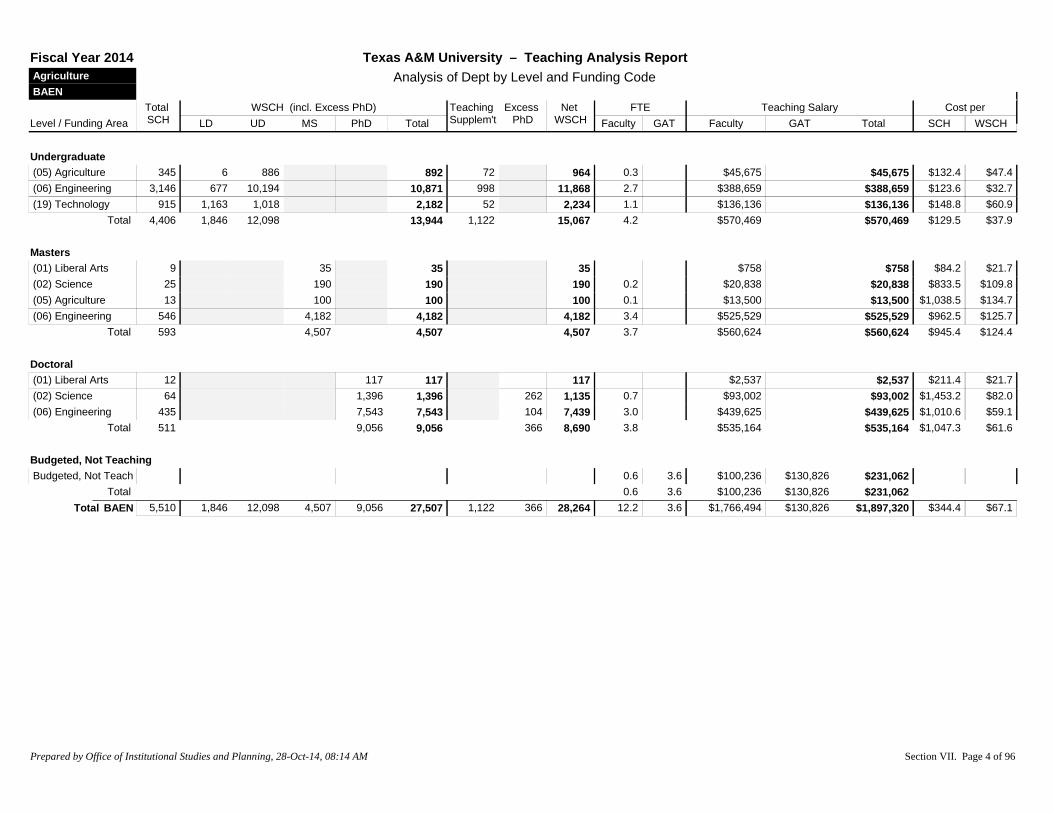
Level / Funding AreaTotal SCH LD UD MS PhD Total
Teaching Supplem't
Excess PhD
Net WSCH
FTEGAT
Teaching SalaryGAT
WSCH (incl. Excess PhD)Faculty Faculty
Cost perWSCHSCHTotal
Agriculture BAEN
Texas A&M University – Teaching Analysis ReportAnalysis of Dept by Level and Funding Code
Fiscal Year 2014
Undergraduate(05) Agriculture 345 6 886 892 72 964 0.3 $45,675 $132.4 $47.4$45,675(06) Engineering 3,146 677 10,194 10,871 998 11,868 2.7 $388,659 $123.6 $32.7$388,659(19) Technology 915 1,163 1,018 2,182 52 2,234 1.1 $136,136 $148.8 $60.9$136,136
4,406 1,846 12,098 13,944 1,122 15,067 4.2 $570,469 $129.5 $37.9$570,469Total
Masters(01) Liberal Arts 9 35 35 35 $758 $84.2 $21.7$758(02) Science 25 190 190 190 0.2 $20,838 $833.5 $109.8$20,838(05) Agriculture 13 100 100 100 0.1 $13,500 $1,038.5 $134.7$13,500(06) Engineering 546 4,182 4,182 4,182 3.4 $525,529 $962.5 $125.7$525,529
593 4,507 4,507 4,507 3.7 $560,624 $945.4 $124.4$560,624Total
Doctoral(01) Liberal Arts 12 117 117 117 $2,537 $211.4 $21.7$2,537(02) Science 64 1,396 1,396 262 1,135 0.7 $93,002 $1,453.2 $82.0$93,002(06) Engineering 435 7,543 7,543 104 7,439 3.0 $439,625 $1,010.6 $59.1$439,625
511 9,056 9,056 366 8,690 3.8 $535,164 $1,047.3 $61.6$535,164Total
Budgeted, Not TeachingBudgeted, Not Teach 0.6 3.6 $100,236 $130,826 $231,062
0.6 3.6 $100,236 $130,826 $231,062TotalBAEN 5,510 1,846 12,098 4,507 9,056 27,507 1,122 366 28,264 12.2 3.6 $1,766,494 $130,826 $344.4 $67.1$1,897,320Total
Prepared by Office of Institutional Studies and Planning, 28-Oct-14, 08:14 AM Section VII. Page 4 of 96
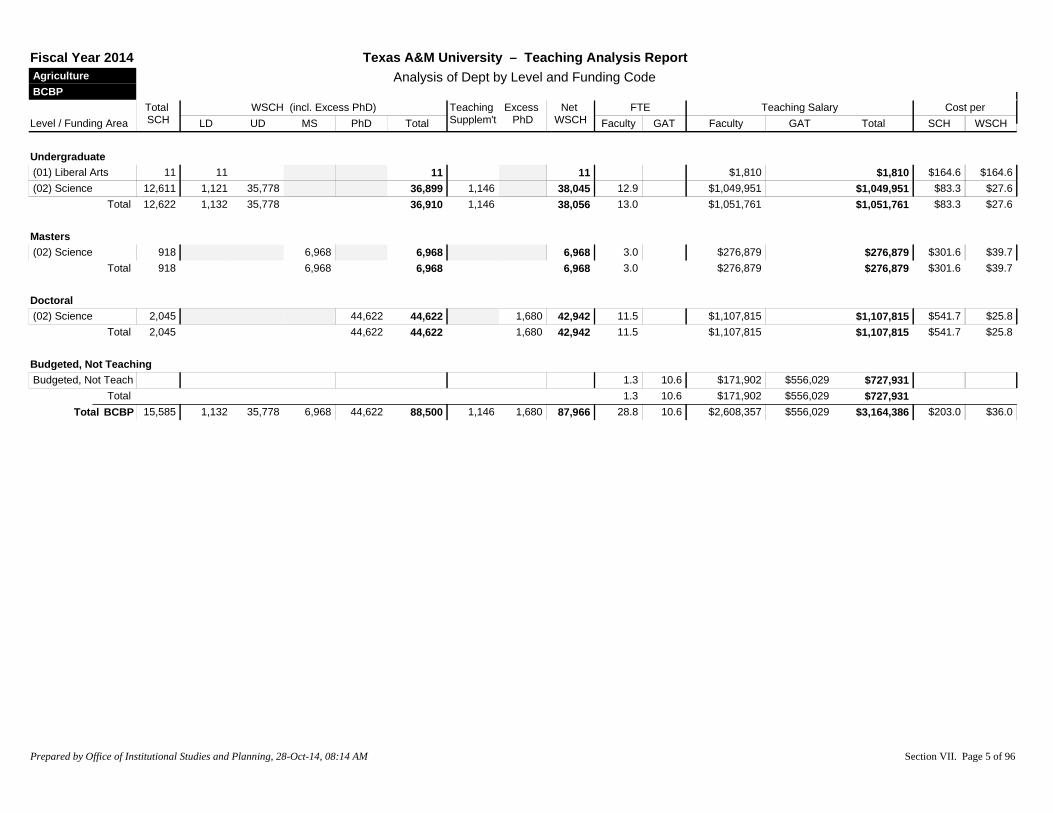
Level / Funding AreaTotal SCH LD UD MS PhD Total
Teaching Supplem't
Excess PhD
Net WSCH
FTEGAT
Teaching SalaryGAT
WSCH (incl. Excess PhD)Faculty Faculty
Cost perWSCHSCHTotal
Agriculture BCBP
Texas A&M University – Teaching Analysis ReportAnalysis of Dept by Level and Funding Code
Fiscal Year 2014
Undergraduate(01) Liberal Arts 11 11 11 11 $1,810 $164.6 $164.6$1,810(02) Science 12,611 1,121 35,778 36,899 1,146 38,045 12.9 $1,049,951 $83.3 $27.6$1,049,951
12,622 1,132 35,778 36,910 1,146 38,056 13.0 $1,051,761 $83.3 $27.6$1,051,761Total
Masters(02) Science 918 6,968 6,968 6,968 3.0 $276,879 $301.6 $39.7$276,879
918 6,968 6,968 6,968 3.0 $276,879 $301.6 $39.7$276,879Total
Doctoral(02) Science 2,045 44,622 44,622 1,680 42,942 11.5 $1,107,815 $541.7 $25.8$1,107,815
2,045 44,622 44,622 1,680 42,942 11.5 $1,107,815 $541.7 $25.8$1,107,815Total
Budgeted, Not TeachingBudgeted, Not Teach 1.3 10.6 $171,902 $556,029 $727,931
1.3 10.6 $171,902 $556,029 $727,931TotalBCBP 15,585 1,132 35,778 6,968 44,622 88,500 1,146 1,680 87,966 28.8 10.6 $2,608,357 $556,029 $203.0 $36.0$3,164,386Total
Prepared by Office of Institutional Studies and Planning, 28-Oct-14, 08:14 AM Section VII. Page 5 of 96

Level / Funding AreaTotal SCH LD UD MS PhD Total
Teaching Supplem't
Excess PhD
Net WSCH
FTEGAT
Teaching SalaryGAT
WSCH (incl. Excess PhD)Faculty Faculty
Cost perWSCHSCHTotal
Agriculture CLAG
Texas A&M University – Teaching Analysis ReportAnalysis of Dept by Level and Funding Code
Fiscal Year 2014
Undergraduate(05) Agriculture 2 4 4 4(99) Not State Funde 49
51 4 4 4Total
Doctoral(99) Not State Funde
TotalCLAG 51 4 0 0 0 4 0 0 4Total
Prepared by Office of Institutional Studies and Planning, 28-Oct-14, 08:14 AM Section VII. Page 6 of 96

Level / Funding AreaTotal SCH LD UD MS PhD Total
Teaching Supplem't
Excess PhD
Net WSCH
FTEGAT
Teaching SalaryGAT
WSCH (incl. Excess PhD)Faculty Faculty
Cost perWSCHSCHTotal
Agriculture ENTO
Texas A&M University – Teaching Analysis ReportAnalysis of Dept by Level and Funding Code
Fiscal Year 2014
Undergraduate(02) Science 8,681 6,880 14,387 21,267 1,490 22,757 3.7 0.2 $290,539 $11,925 $34.8 $13.3$302,464(05) Agriculture 131 31 295 326 29 356 0.1 $12,580 $96.4 $35.3$12,580(13) Phys. Training 59 81 81 8 89 $1,373 $23.3 $15.4$1,373
8,871 6,992 14,683 21,674 1,528 23,202 3.9 0.2 $304,492 $11,925 $35.7 $13.6$316,417Total
Masters(01) Liberal Arts 24 93 93 93 $2,235 $93.1 $24.1$2,235(02) Science 405 3,074 3,074 3,074 2.0 $213,220 $526.5 $69.4$213,220(05) Agriculture 56 432 432 432 0.1 $5,200 $92.8 $12.0$5,200
485 3,599 3,599 3,599 2.1 $220,655 $454.9 $61.3$220,655Total
Doctoral(01) Liberal Arts 12 117 117 117 $2,806 $233.9 $24.1$2,806(02) Science 695 15,165 15,165 1,549 13,616 3.4 $391,874 $563.8 $28.8$391,874(05) Agriculture 13 135 135 135 $873 $67.2 $6.5$873
720 15,417 15,417 1,549 13,868 3.4 $395,554 $549.4 $28.5$395,554Total
Budgeted, Not TeachingBudgeted, Not Teach 0.5 6.2 $63,643 $290,517 $354,160
0.5 6.2 $63,643 $290,517 $354,160TotalENTO 10,076 6,992 14,683 3,599 15,417 40,690 1,528 1,549 40,668 9.8 6.4 $984,344 $302,442 $127.7 $31.6$1,286,786Total
Prepared by Office of Institutional Studies and Planning, 28-Oct-14, 08:14 AM Section VII. Page 7 of 96

Level / Funding AreaTotal SCH LD UD MS PhD Total
Teaching Supplem't
Excess PhD
Net WSCH
FTEGAT
Teaching SalaryGAT
WSCH (incl. Excess PhD)Faculty Faculty
Cost perWSCHSCHTotal
Agriculture ESSM
Texas A&M University – Teaching Analysis ReportAnalysis of Dept by Level and Funding Code
Fiscal Year 2014
Undergraduate(02) Science 3,828 3,483 5,421 8,904 780 9,684 1.8 $192,857 $50.4 $19.9$192,857(05) Agriculture 1,909 1,335 3,248 4,583 423 5,006 2.0 $193,887 $101.6 $38.7$193,887(06) Engineering 912 428 2,588 3,016 302 3,318 0.4 $36,832 $40.4 $11.1$36,832
6,649 5,247 11,257 16,504 1,505 18,009 4.2 $423,576 $63.7 $23.5$423,576Total
Masters(02) Science 295 2,239 2,239 2,239 0.5 $50,328 $170.6 $22.5$50,328(05) Agriculture 556 4,287 4,287 4,287 2.4 $261,357 $470.1 $61.0$261,357
851 6,526 6,526 6,526 2.9 $311,685 $366.3 $47.8$311,685Total
Doctoral(02) Science 93 2,029 2,029 2,029 0.5 $48,425 $520.7 $23.9$48,425(05) Agriculture 584 6,080 6,080 917 5,163 4.1 $403,918 $692.2 $78.2$403,918(06) Engineering 36 624 624 624 0.1 $16,555 $459.9 $26.5$16,555
713 8,734 8,734 917 7,817 4.7 $468,898 $658.1 $60.0$468,898Total
Budgeted, Not TeachingBudgeted, Not Teach 2.1 3.1 $183,782 $138,153 $321,935
2.1 3.1 $183,782 $138,153 $321,935TotalESSM 8,213 5,247 11,257 6,526 8,734 31,763 1,505 917 32,351 13.9 3.1 $1,387,941 $138,153 $185.8 $47.2$1,526,094Total
Prepared by Office of Institutional Studies and Planning, 28-Oct-14, 08:14 AM Section VII. Page 8 of 96

Level / Funding AreaTotal SCH LD UD MS PhD Total
Teaching Supplem't
Excess PhD
Net WSCH
FTEGAT
Teaching SalaryGAT
WSCH (incl. Excess PhD)Faculty Faculty
Cost perWSCHSCHTotal
Agriculture HRSC
Texas A&M University – Teaching Analysis ReportAnalysis of Dept by Level and Funding Code
Fiscal Year 2014
Undergraduate(01) Liberal Arts 22 22 22 2 24 $842 $38.3 $34.8$842(02) Science 339 43 933 976 98 1,073 0.3 $20,514 $60.5 $19.1$20,514(05) Agriculture 4,836 5,504 5,724 11,228 810 12,038 3.8 $385,918 $79.8 $32.1$385,918(07) Home Economic 128 9 196 206 206 0.2 $20,212 $157.9 $98.3$20,212(14) Health Service 1,068 275 1,401 1,676 71 1,746 0.2 $20,472 $19.2 $11.7$20,472(16) Bus. Admin. 74 7 123 130 130 0.1 $8,917 $120.5 $68.5$8,917
6,467 5,859 8,378 14,238 980 15,218 4.5 $456,876 $70.6 $30.0$456,876Total
Masters(02) Science 58 440 440 440 0.1 $7,863 $135.6 $17.9$7,863(05) Agriculture 308 2,375 2,375 2,375 1.9 $141,405 $459.1 $59.5$141,405
366 2,815 2,815 2,815 2.0 $149,268 $407.8 $53.0$149,268Total
Doctoral(02) Science 139 3,033 3,033 3,033 1.0 $92,934 $668.6 $30.6$92,934(05) Agriculture 310 3,230 3,230 438 2,793 3.5 $424,698 $1,370.0 $152.1$424,698
449 6,263 6,263 438 5,826 4.4 $517,632 $1,152.9 $88.9$517,632Total
Budgeted, Not TeachingBudgeted, Not Teach 1.2 3.6 $124,103 $111,110 $235,213
1.2 3.6 $124,103 $111,110 $235,213TotalHRSC 7,282 5,859 8,378 2,815 6,263 23,316 980 438 23,858 12.2 3.6 $1,247,879 $111,110 $186.6 $57.0$1,358,989Total
Prepared by Office of Institutional Studies and Planning, 28-Oct-14, 08:14 AM Section VII. Page 9 of 96

Level / Funding AreaTotal SCH LD UD MS PhD Total
Teaching Supplem't
Excess PhD
Net WSCH
FTEGAT
Teaching SalaryGAT
WSCH (incl. Excess PhD)Faculty Faculty
Cost perWSCHSCHTotal
Agriculture NFSC
Texas A&M University – Teaching Analysis ReportAnalysis of Dept by Level and Funding Code
Fiscal Year 2014
Undergraduate(01) Liberal Arts 3 5 5 1 6 $5,128 $1,709.4 $909.3$5,128(02) Science 3,712 3,156 5,747 8,903 627 9,530 3.3 $329,879 $88.9 $34.6$329,879(05) Agriculture 1,844 2,748 1,343 4,091 409 4,500 1.5 $341,525 $185.2 $75.9$341,525(07) Home Economic 510 265 417 682 10 692 0.9 $53,766 $105.4 $77.6$53,766(14) Health Service 5,871 5,379 1,571 6,950 170 7,120 2.0 $134,729 $22.9 $18.9$134,729
11,940 11,547 9,084 20,631 1,217 21,848 7.8 $865,027 $72.4 $39.6$865,027Total
Masters(02) Science 259 1,966 1,966 1,966 1.7 $166,174 $641.6 $84.5$166,174(05) Agriculture 178 1,372 1,372 1,372 0.6 $78,556 $441.3 $57.2$78,556
437 3,338 3,338 3,338 2.2 $244,730 $560.0 $73.3$244,730Total
Doctoral(02) Science 180 3,928 3,928 87 3,840 1.5 $156,554 $869.7 $40.8$156,554(05) Agriculture 116 1,209 1,209 198 1,011 0.9 $109,287 $942.1 $108.1$109,287
296 5,136 5,136 285 4,851 2.4 $265,841 $898.1 $54.8$265,841Total
Budgeted, Not TeachingBudgeted, Not Teach 1.0 5.3 $148,937 $169,956 $318,893
1.0 5.3 $148,937 $169,956 $318,893TotalNFSC 12,673 11,547 9,084 3,338 5,136 29,106 1,217 285 30,038 13.5 5.3 $1,524,535 $169,956 $133.7 $56.4$1,694,491Total
Prepared by Office of Institutional Studies and Planning, 28-Oct-14, 08:14 AM Section VII. Page 10 of 96
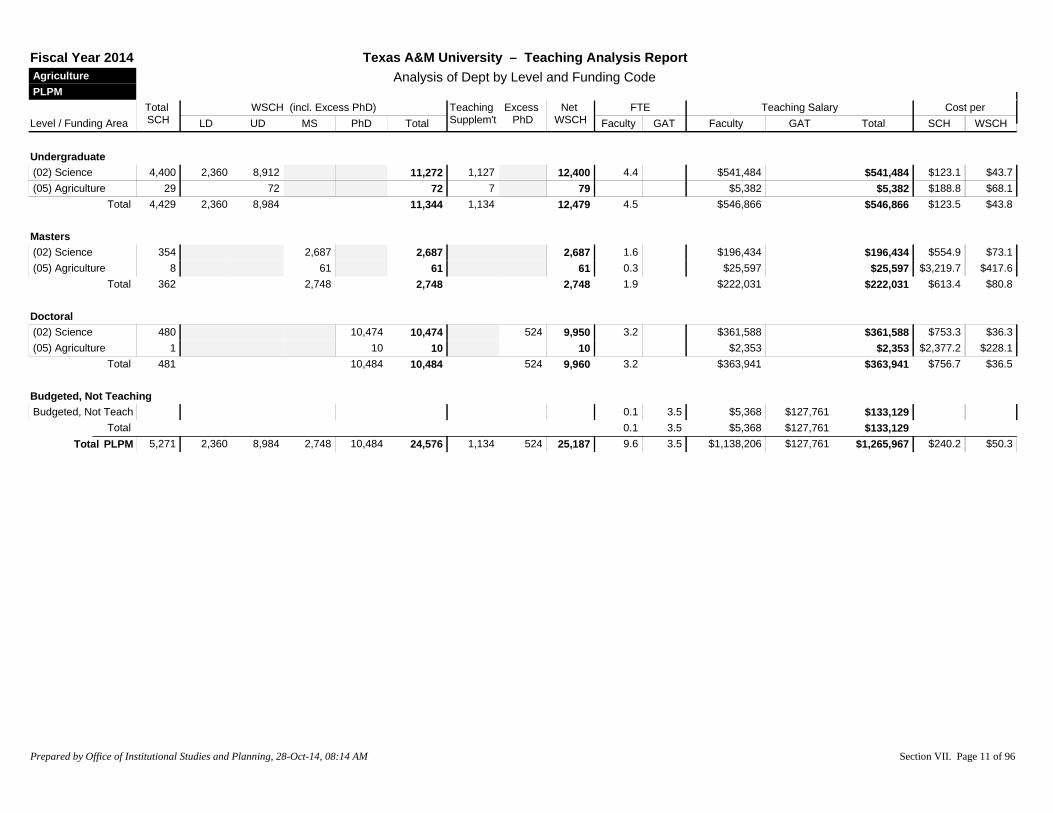
Level / Funding AreaTotal SCH LD UD MS PhD Total
Teaching Supplem't
Excess PhD
Net WSCH
FTEGAT
Teaching SalaryGAT
WSCH (incl. Excess PhD)Faculty Faculty
Cost perWSCHSCHTotal
Agriculture PLPM
Texas A&M University – Teaching Analysis ReportAnalysis of Dept by Level and Funding Code
Fiscal Year 2014
Undergraduate(02) Science 4,400 2,360 8,912 11,272 1,127 12,400 4.4 $541,484 $123.1 $43.7$541,484(05) Agriculture 29 72 72 7 79 $5,382 $188.8 $68.1$5,382
4,429 2,360 8,984 11,344 1,134 12,479 4.5 $546,866 $123.5 $43.8$546,866Total
Masters(02) Science 354 2,687 2,687 2,687 1.6 $196,434 $554.9 $73.1$196,434(05) Agriculture 8 61 61 61 0.3 $25,597 $3,219.7 $417.6$25,597
362 2,748 2,748 2,748 1.9 $222,031 $613.4 $80.8$222,031Total
Doctoral(02) Science 480 10,474 10,474 524 9,950 3.2 $361,588 $753.3 $36.3$361,588(05) Agriculture 1 10 10 10 $2,353 $2,377.2 $228.1$2,353
481 10,484 10,484 524 9,960 3.2 $363,941 $756.7 $36.5$363,941Total
Budgeted, Not TeachingBudgeted, Not Teach 0.1 3.5 $5,368 $127,761 $133,129
0.1 3.5 $5,368 $127,761 $133,129TotalPLPM 5,271 2,360 8,984 2,748 10,484 24,576 1,134 524 25,187 9.6 3.5 $1,138,206 $127,761 $240.2 $50.3$1,265,967Total
Prepared by Office of Institutional Studies and Planning, 28-Oct-14, 08:14 AM Section VII. Page 11 of 96

Level / Funding AreaTotal SCH LD UD MS PhD Total
Teaching Supplem't
Excess PhD
Net WSCH
FTEGAT
Teaching SalaryGAT
WSCH (incl. Excess PhD)Faculty Faculty
Cost perWSCHSCHTotal
Agriculture POSC
Texas A&M University – Teaching Analysis ReportAnalysis of Dept by Level and Funding Code
Fiscal Year 2014
Undergraduate(02) Science 135 69 281 350 35 385 0.1 $18,514 $137.1 $48.1$18,514(05) Agriculture 2,739 2,542 3,886 6,428 453 6,881 1.9 $200,330 $73.1 $29.1$200,330
2,874 2,611 4,167 6,778 488 7,267 2.1 $218,844 $76.1 $30.1$218,844Total
Masters(02) Science 37 281 281 281 0.1 $8,997 $243.2 $32.0$8,997(05) Agriculture 159 1,226 1,226 1,226 0.8 $80,054 $503.5 $65.3$80,054
196 1,507 1,507 1,507 0.8 $89,051 $454.3 $59.1$89,051Total
Doctoral(02) Science 79 1,724 1,724 1,724 0.3 $32,040 $405.6 $18.6$32,040(05) Agriculture 219 2,282 2,282 63 2,219 1.4 $167,742 $765.9 $75.6$167,742
298 4,006 4,006 63 3,943 1.8 $199,782 $670.4 $50.7$199,782Total
Budgeted, Not TeachingBudgeted, Not Teach 0.2 1.0 $13,687 $31,920 $45,607
0.2 1.0 $13,687 $31,920 $45,607TotalPOSC 3,368 2,611 4,167 1,507 4,006 12,291 488 63 12,717 4.8 1.0 $521,363 $31,920 $164.3 $43.5$553,283Total
Prepared by Office of Institutional Studies and Planning, 28-Oct-14, 08:14 AM Section VII. Page 12 of 96

Level / Funding AreaTotal SCH LD UD MS PhD Total
Teaching Supplem't
Excess PhD
Net WSCH
FTEGAT
Teaching SalaryGAT
WSCH (incl. Excess PhD)Faculty Faculty
Cost perWSCHSCHTotal
Agriculture RPTS
Texas A&M University – Teaching Analysis ReportAnalysis of Dept by Level and Funding Code
Fiscal Year 2014
Undergraduate(01) Liberal Arts 10,066 2,004 13,603 15,607 577 16,184 8.6 2.7 $696,417 $98,153 $78.9 $49.1$794,570(02) Science 306 80 788 868 87 955 0.4 $47,057 $153.8 $49.3$47,057(05) Agriculture 987 125 2,450 2,575 257 2,832 0.2 $26,561 $26.9 $9.4$26,561(06) Engineering 753 1,852 1,852 185 2,038 0.6 $45,630 $60.6 $22.4$45,630(14) Health Service 1 2 2 2 0.1 $3,507 $3,506.6 $2,026.9$3,507(16) Bus. Admin. 852 997 997 997 0.2 0.4 $10,000 $14,824 $29.1 $24.9$24,824
12,965 5,058 16,843 21,901 1,107 23,008 10.0 3.1 $829,171 $112,977 $72.7 $40.9$942,148Total
Masters(01) Liberal Arts 288 1,115 1,115 1,115 1.7 $160,149 $556.1 $143.7$160,149(02) Science 268 2,034 2,034 2,034 0.5 $56,227 $209.8 $27.6$56,227(05) Agriculture 33 254 254 254 $3,659 $110.9 $14.4$3,659(16) Bus. Admin. 24 78 78 78 $1,024 $42.7 $13.1$1,024
613 3,481 3,481 3,481 2.2 $221,060 $360.6 $63.5$221,060Total
Doctoral(01) Liberal Arts 481 4,675 4,675 10 4,666 5.7 $594,526 $1,236.0 $127.4$594,526(02) Science 60 1,309 1,309 1,309 0.6 $62,180 $1,036.3 $47.5$62,180(05) Agriculture 3 31 31 31 $450 $149.9 $14.4$450(16) Bus. Admin. 9 209 209 209 $2,743 $304.7 $13.1$2,743
553 6,225 6,225 10 6,215 6.3 $659,898 $1,193.3 $106.2$659,898Total
Budgeted, Not TeachingBudgeted, Not Teach 0.8 7.7 $89,985 $287,905 $377,890
0.8 7.7 $89,985 $287,905 $377,890TotalRPTS 14,131 5,058 16,843 3,481 6,225 31,607 1,107 10 32,704 19.3 10.8 $1,800,114 $400,882 $155.8 $67.3$2,200,996Total
Prepared by Office of Institutional Studies and Planning, 28-Oct-14, 08:14 AM Section VII. Page 13 of 96

Level / Funding AreaTotal SCH LD UD MS PhD Total
Teaching Supplem't
Excess PhD
Net WSCH
FTEGAT
Teaching SalaryGAT
WSCH (incl. Excess PhD)Faculty Faculty
Cost perWSCHSCHTotal
Agriculture SCSC
Texas A&M University – Teaching Analysis ReportAnalysis of Dept by Level and Funding Code
Fiscal Year 2014
Undergraduate(02) Science 3 9 9 1 10 $1,636 $545.2 $164.0$1,636(05) Agriculture 6,071 4,460 10,153 14,613 934 15,547 3.9 $321,786 $53.0 $20.7$321,786
6,074 4,460 10,162 14,622 935 15,557 3.9 $323,422 $53.2 $20.8$323,422Total
Masters(02) Science 167 1,268 1,268 1,268 0.4 $33,598 $201.2 $26.5$33,598(05) Agriculture 765 5,898 5,898 5,898 3.5 $302,443 $395.3 $51.3$302,443
932 7,166 7,166 7,166 3.9 $336,041 $360.5 $46.9$336,041Total
Doctoral(02) Science 243 5,302 5,302 218 5,084 1.0 $82,057 $337.7 $16.1$82,057(05) Agriculture 885 9,222 9,222 344 8,878 4.3 $416,415 $470.5 $46.9$416,415
1,128 14,524 14,524 562 13,962 5.3 $498,471 $441.9 $35.7$498,471Total
Budgeted, Not TeachingBudgeted, Not Teach 1.5 3.9 $192,397 $146,925 $339,322
1.5 3.9 $192,397 $146,925 $339,322TotalSCSC 8,134 4,460 10,162 7,166 14,524 36,312 935 562 36,685 14.5 3.9 $1,350,331 $146,925 $184.1 $40.8$1,497,256Total
Prepared by Office of Institutional Studies and Planning, 28-Oct-14, 08:14 AM Section VII. Page 14 of 96
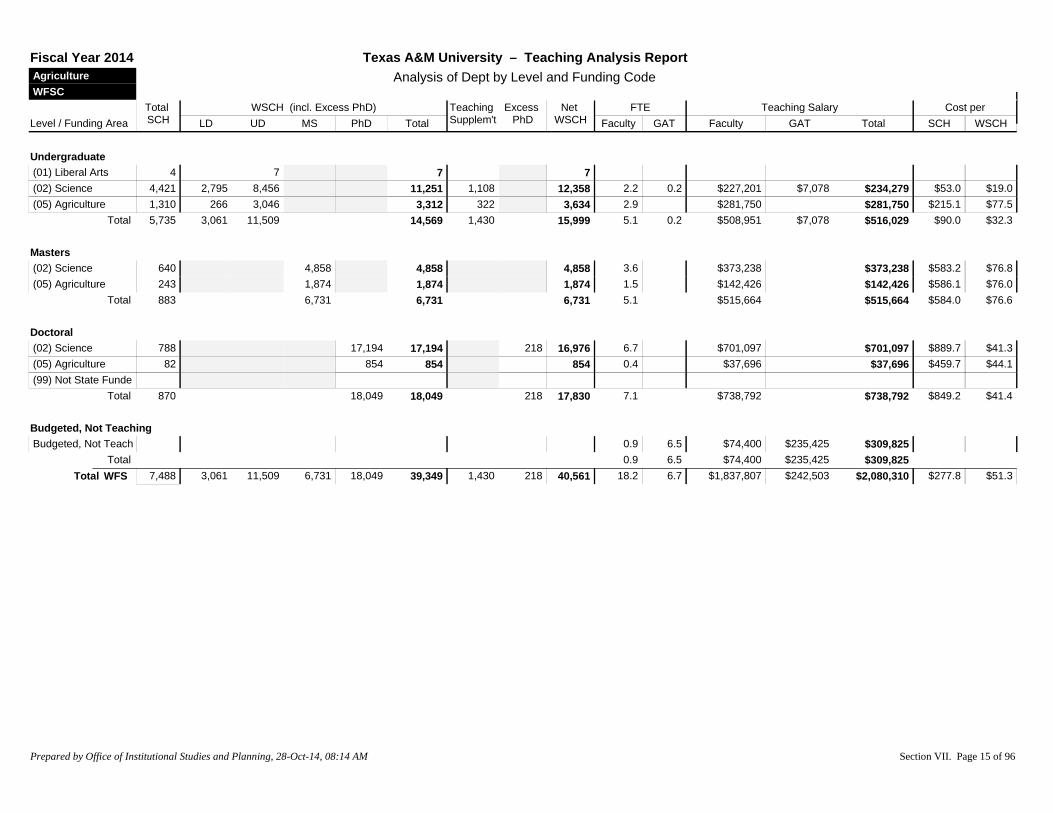
Level / Funding AreaTotal SCH LD UD MS PhD Total
Teaching Supplem't
Excess PhD
Net WSCH
FTEGAT
Teaching SalaryGAT
WSCH (incl. Excess PhD)Faculty Faculty
Cost perWSCHSCHTotal
Agriculture WFSC
Texas A&M University – Teaching Analysis ReportAnalysis of Dept by Level and Funding Code
Fiscal Year 2014
Undergraduate(01) Liberal Arts 4 7 7 7(02) Science 4,421 2,795 8,456 11,251 1,108 12,358 2.2 0.2 $227,201 $7,078 $53.0 $19.0$234,279(05) Agriculture 1,310 266 3,046 3,312 322 3,634 2.9 $281,750 $215.1 $77.5$281,750
5,735 3,061 11,509 14,569 1,430 15,999 5.1 0.2 $508,951 $7,078 $90.0 $32.3$516,029Total
Masters(02) Science 640 4,858 4,858 4,858 3.6 $373,238 $583.2 $76.8$373,238(05) Agriculture 243 1,874 1,874 1,874 1.5 $142,426 $586.1 $76.0$142,426
883 6,731 6,731 6,731 5.1 $515,664 $584.0 $76.6$515,664Total
Doctoral(02) Science 788 17,194 17,194 218 16,976 6.7 $701,097 $889.7 $41.3$701,097(05) Agriculture 82 854 854 854 0.4 $37,696 $459.7 $44.1$37,696(99) Not State Funde
870 18,049 18,049 218 17,830 7.1 $738,792 $849.2 $41.4$738,792Total
Budgeted, Not TeachingBudgeted, Not Teach 0.9 6.5 $74,400 $235,425 $309,825
0.9 6.5 $74,400 $235,425 $309,825TotalWFS 7,488 3,061 11,509 6,731 18,049 39,349 1,430 218 40,561 18.2 6.7 $1,837,807 $242,503 $277.8 $51.3$2,080,310Total
Prepared by Office of Institutional Studies and Planning, 28-Oct-14, 08:14 AM Section VII. Page 15 of 96

Level / Funding AreaTotal SCH LD UD MS PhD Total
Teaching Supplem't
Excess PhD
Net WSCH
FTEGAT
Teaching SalaryGAT
WSCH (incl. Excess PhD)Faculty Faculty
Cost perWSCHSCHTotal
Architecture ARCH
Texas A&M University – Teaching Analysis ReportAnalysis of Dept by Level and Funding Code
Fiscal Year 2014
Prepared by Office of Institutional Studies and Planning, 28-Oct-14, 08:14 AM Section VII. Page 16 of 96

Level / Funding AreaTotal SCH LD UD MS PhD Total
Teaching Supplem't
Excess PhD
Net WSCH
FTEGAT
Teaching SalaryGAT
WSCH (incl. Excess PhD)Faculty Faculty
Cost perWSCHSCHTotal
Architecture ARCH
Texas A&M University – Teaching Analysis ReportAnalysis of Dept by Level and Funding Code
Fiscal Year 2014
Undergraduate(01) Liberal Arts 21 14 12 26 3 29 0.1 $11,970 $570.0 $419.1$11,970(03) Fine Art 622 209 1,162 1,370 44 1,414 0.9 $84,189 $135.4 $59.5$84,189(06) Engineering 14,431 25,562 14,356 39,918 2,997 42,914 10.1 0.8 $1,041,101 $34,800 $74.6 $25.1$1,075,901(19) Technology 902 21 2,182 2,203 102 2,305 1.0 $93,606 $103.8 $40.6$93,606
15,976 25,806 17,711 43,517 3,145 46,662 12.1 0.8 $1,230,866 $34,800 $79.2 $27.1$1,265,666Total
Masters(03) Fine Art 35 194 194 194 0.4 $45,846 $1,309.9 $236.0$45,846(06) Engineering 2,684 20,559 20,559 20,559 9.5 $1,128,942 $420.6 $54.9$1,128,942
2,719 20,754 20,754 20,754 9.9 $1,174,788 $432.1 $56.6$1,174,788Total
Doctoral(06) Engineering 801 13,889 13,889 1,092 12,797 6.6 $783,963 $978.7 $61.3$783,963
801 13,889 13,889 1,092 12,797 6.6 $783,963 $978.7 $61.3$783,963Total
Budgeted, Not TeachingBudgeted, Not Teach 0.9 7.2 $95,846 $192,125 $287,971
0.9 7.2 $95,846 $192,125 $287,971TotalARCH 19,496 25,806 17,711 20,754 13,889 78,160 3,145 1,092 80,213 29.4 8.0 $3,285,463 $226,925 $180.2 $43.8$3,512,388Total
Prepared by Office of Institutional Studies and Planning, 28-Oct-14, 08:14 AM Section VII. Page 17 of 96

Level / Funding AreaTotal SCH LD UD MS PhD Total
Teaching Supplem't
Excess PhD
Net WSCH
FTEGAT
Teaching SalaryGAT
WSCH (incl. Excess PhD)Faculty Faculty
Cost perWSCHSCHTotal
Architecture CLAR
Texas A&M University – Teaching Analysis ReportAnalysis of Dept by Level and Funding Code
Fiscal Year 2014
Undergraduate(03) Fine Art 411 999 999 17 1,016 1.2(06) Engineering 468 7 1,665 1,672 1,672 1.9(99) Not State Funde 60
939 7 2,663 2,671 17 2,688 3.1Total
Masters(06) Engineering 80 613 613 613 0.2
80 613 613 613 0.2Total
Doctoral(06) Engineering 3 52 52 52
3 52 52 52Total
Budgeted, Not TeachingBudgeted, Not Teach 0.7 $16,825 $16,825
0.7 $16,825 $16,825TotalCLAR 1,022 7 2,663 613 52 3,336 17 0 3,352 3.3 0.7 $16,825 $16.5 $5.0$16,825Total
Prepared by Office of Institutional Studies and Planning, 28-Oct-14, 08:14 AM Section VII. Page 18 of 96
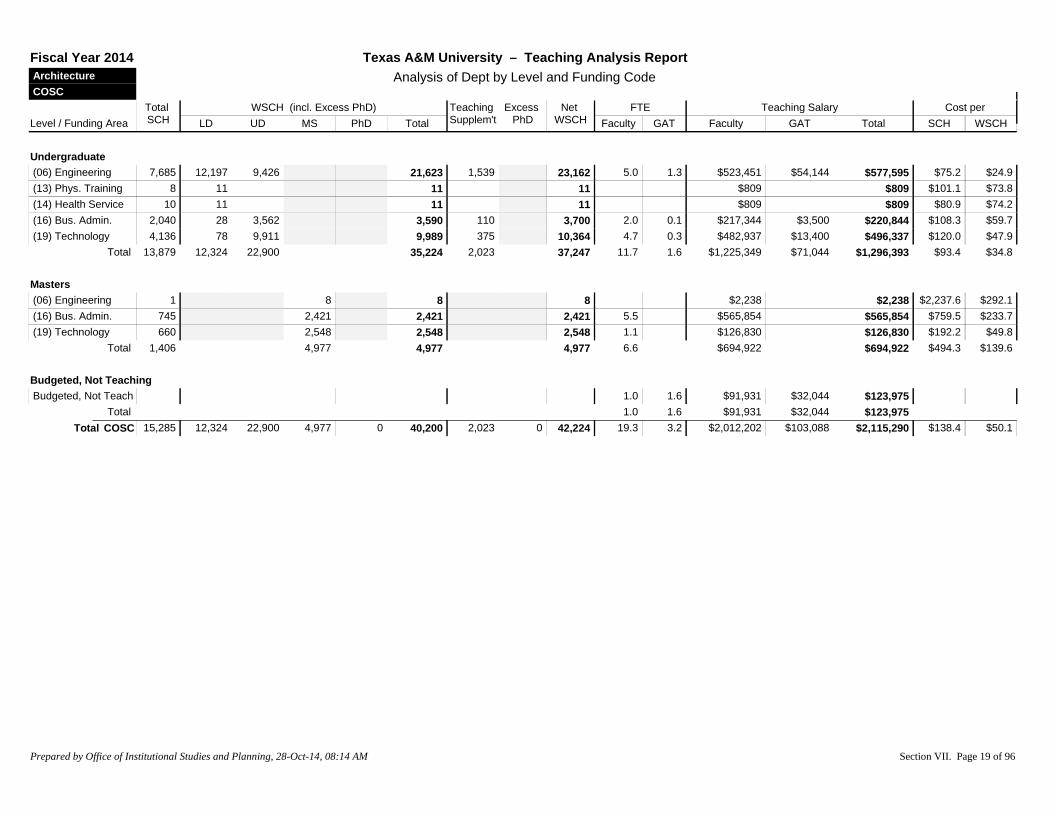
Level / Funding AreaTotal SCH LD UD MS PhD Total
Teaching Supplem't
Excess PhD
Net WSCH
FTEGAT
Teaching SalaryGAT
WSCH (incl. Excess PhD)Faculty Faculty
Cost perWSCHSCHTotal
Architecture COSC
Texas A&M University – Teaching Analysis ReportAnalysis of Dept by Level and Funding Code
Fiscal Year 2014
Undergraduate(06) Engineering 7,685 12,197 9,426 21,623 1,539 23,162 5.0 1.3 $523,451 $54,144 $75.2 $24.9$577,595(13) Phys. Training 8 11 11 11 $809 $101.1 $73.8$809(14) Health Service 10 11 11 11 $809 $80.9 $74.2$809(16) Bus. Admin. 2,040 28 3,562 3,590 110 3,700 2.0 0.1 $217,344 $3,500 $108.3 $59.7$220,844(19) Technology 4,136 78 9,911 9,989 375 10,364 4.7 0.3 $482,937 $13,400 $120.0 $47.9$496,337
13,879 12,324 22,900 35,224 2,023 37,247 11.7 1.6 $1,225,349 $71,044 $93.4 $34.8$1,296,393Total
Masters(06) Engineering 1 8 8 8 $2,238 $2,237.6 $292.1$2,238(16) Bus. Admin. 745 2,421 2,421 2,421 5.5 $565,854 $759.5 $233.7$565,854(19) Technology 660 2,548 2,548 2,548 1.1 $126,830 $192.2 $49.8$126,830
1,406 4,977 4,977 4,977 6.6 $694,922 $494.3 $139.6$694,922Total
Budgeted, Not TeachingBudgeted, Not Teach 1.0 1.6 $91,931 $32,044 $123,975
1.0 1.6 $91,931 $32,044 $123,975TotalCOSC 15,285 12,324 22,900 4,977 0 40,200 2,023 0 42,224 19.3 3.2 $2,012,202 $103,088 $138.4 $50.1$2,115,290Total
Prepared by Office of Institutional Studies and Planning, 28-Oct-14, 08:14 AM Section VII. Page 19 of 96

Level / Funding AreaTotal SCH LD UD MS PhD Total
Teaching Supplem't
Excess PhD
Net WSCH
FTEGAT
Teaching SalaryGAT
WSCH (incl. Excess PhD)Faculty Faculty
Cost perWSCHSCHTotal
Architecture LAUP
Texas A&M University – Teaching Analysis ReportAnalysis of Dept by Level and Funding Code
Fiscal Year 2014
Undergraduate(03) Fine Art 216 9 510 519 51 570 0.2 $16,871 $78.1 $29.6$16,871(06) Engineering 6,020 6,765 11,610 18,375 847 19,222 7.2 2.4 $605,927 $81,266 $114.2 $35.8$687,193
6,236 6,774 12,120 18,894 898 19,792 7.4 2.4 $622,799 $81,266 $112.9 $35.6$704,065Total
Masters(01) Liberal Arts 63 244 244 244 0.1 $15,091 $239.5 $61.9$15,091(06) Engineering 2,273 17,411 17,411 17,411 7.3 $698,002 $307.1 $40.1$698,002(14) Health Service 9 27 27 27 0.1 $8,331 $925.6 $312.7$8,331(16) Bus. Admin. 57 185 185 185 0.1 $8,363 $146.7 $45.1$8,363
2,402 17,867 17,867 17,867 7.6 $729,787 $303.8 $40.8$729,787Total
Doctoral(01) Liberal Arts 15 146 146 146 0.1 $12,287 $819.2 $84.3$12,287(06) Engineering 694 12,034 12,034 1,006 11,028 6.6 $858,900 $1,237.6 $77.9$858,900
709 12,180 12,180 1,006 11,174 6.7 $871,187 $1,228.8 $78.0$871,187Total
Budgeted, Not TeachingBudgeted, Not Teach 1.2 1.4 $185,781 $40,967 $226,748
1.2 1.4 $185,781 $40,967 $226,748TotalLAUP 9,347 6,774 12,120 17,867 12,180 48,941 898 1,006 48,833 22.9 3.8 $2,409,554 $122,233 $270.9 $51.8$2,531,787Total
Prepared by Office of Institutional Studies and Planning, 28-Oct-14, 08:14 AM Section VII. Page 20 of 96

Level / Funding AreaTotal SCH LD UD MS PhD Total
Teaching Supplem't
Excess PhD
Net WSCH
FTEGAT
Teaching SalaryGAT
WSCH (incl. Excess PhD)Faculty Faculty
Cost perWSCHSCHTotal
Architecture VIZA
Texas A&M University – Teaching Analysis ReportAnalysis of Dept by Level and Funding Code
Fiscal Year 2014
Undergraduate(02) Science 2,212 2,519 2,404 4,923 392 5,315 3.5 0.6 $345,562 $15,150 $163.1 $67.9$360,712(03) Fine Art 7,335 7,834 4,636 12,471 209 12,679 4.8 1.2 $365,086 $32,450 $54.2 $31.4$397,536(06) Engineering 346 822 32 854 23 877 0.6 $21,259 $61.4 $24.2$21,259(19) Technology 617 301 1,203 1,504 47 1,551 0.8 0.6 $67,435 $15,400 $134.3 $53.4$82,835
10,510 11,475 8,276 19,751 671 20,422 9.6 2.4 $799,342 $63,000 $82.0 $42.2$862,342Total
Masters(02) Science 1,077 8,174 8,174 8,174 4.6 $632,283 $587.1 $77.3$632,283(03) Fine Art 254 1,410 1,410 1,410 2.1 $221,490 $872.0 $157.1$221,490(06) Engineering 12 92 92 92 $3,915 $326.3 $42.6$3,915
1,343 9,676 9,676 9,676 6.7 $857,688 $638.6 $88.6$857,688Total
Doctoral(02) Science 19 415 415 415 0.1 $6,698 $352.5 $16.2$6,698
19 415 415 415 0.1 $6,698 $352.5 $16.2$6,698Total
Budgeted, Not TeachingBudgeted, Not Teach 6.6 $142,150 $142,150
6.6 $142,150 $142,150TotalVIZA 11,872 11,475 8,276 9,676 415 29,842 671 0 30,513 16.4 9.0 $1,663,728 $205,150 $157.4 $61.2$1,868,878Total
Prepared by Office of Institutional Studies and Planning, 28-Oct-14, 08:14 AM Section VII. Page 21 of 96

Level / Funding AreaTotal SCH LD UD MS PhD Total
Teaching Supplem't
Excess PhD
Net WSCH
FTEGAT
Teaching SalaryGAT
WSCH (incl. Excess PhD)Faculty Faculty
Cost perWSCHSCHTotal
Business Admin ACCT
Texas A&M University – Teaching Analysis ReportAnalysis of Dept by Level and Funding Code
Fiscal Year 2014
Prepared by Office of Institutional Studies and Planning, 28-Oct-14, 08:14 AM Section VII. Page 22 of 96

Level / Funding AreaTotal SCH LD UD MS PhD Total
Teaching Supplem't
Excess PhD
Net WSCH
FTEGAT
Teaching SalaryGAT
WSCH (incl. Excess PhD)Faculty Faculty
Cost perWSCHSCHTotal
Business Admin ACCT
Texas A&M University – Teaching Analysis ReportAnalysis of Dept by Level and Funding Code
Fiscal Year 2014
Undergraduate(16) Bus. Admin. 25,843 15,925 21,943 37,868 908 38,776 17.7 0.7 $2,231,242 $31,500 $87.6 $58.4$2,262,742
25,843 15,925 21,943 37,868 908 38,776 17.7 0.7 $2,231,242 $31,500 $87.6 $58.4$2,262,742Total
Masters(16) Bus. Admin. 7,674 24,941 24,941 24,941 8.0 $1,702,897 $221.9 $68.3$1,702,897
7,674 24,941 24,941 24,941 8.0 $1,702,897 $221.9 $68.3$1,702,897Total
Doctoral(16) Bus. Admin. 294 6,824 6,824 6,824 2.1 $580,500 $1,974.5 $85.1$580,500
294 6,824 6,824 6,824 2.1 $580,500 $1,974.5 $85.1$580,500Total
Budgeted, Not TeachingBudgeted, Not Teach 6.3 $1,633,840 $1,633,840
6.3 $1,633,840 $1,633,840TotalACCT 33,811 15,925 21,943 24,941 6,824 69,632 908 0 70,540 34.2 0.7 $6,148,479 $31,500 $182.8 $87.6$6,179,979Total
Prepared by Office of Institutional Studies and Planning, 28-Oct-14, 08:14 AM Section VII. Page 23 of 96

Level / Funding AreaTotal SCH LD UD MS PhD Total
Teaching Supplem't
Excess PhD
Net WSCH
FTEGAT
Teaching SalaryGAT
WSCH (incl. Excess PhD)Faculty Faculty
Cost perWSCHSCHTotal
Business Admin CLBA
Texas A&M University – Teaching Analysis ReportAnalysis of Dept by Level and Funding Code
Fiscal Year 2014
Undergraduate(16) Bus. Admin. 3,760 3,795 934 4,729 4,729 3.1 $167,306 $44.5 $35.4$167,306(99) Not State Funde 60
3,820 3,795 934 4,729 4,729 3.1 $167,306 $43.8 $35.4$167,306Total
Masters(01) Liberal Arts 400 1,548 1,548 1,548 0.8 $89,802 $224.5 $58.0$89,802(16) Bus. Admin. 423 1,375 1,375 1,375 0.8 $79,996 $189.1 $58.2$79,996
823 2,923 2,923 2,923 1.6 $169,798 $206.3 $58.1$169,798Total
Budgeted, Not TeachingBudgeted, Not Teach 1.6 $171,885 $171,885
1.6 $171,885 $171,885TotalCLBA 4,643 3,795 934 2,923 0 7,652 0 0 7,652 6.3 $508,989 $109.6 $66.5$508,989Total
Prepared by Office of Institutional Studies and Planning, 28-Oct-14, 08:14 AM Section VII. Page 24 of 96

Level / Funding AreaTotal SCH LD UD MS PhD Total
Teaching Supplem't
Excess PhD
Net WSCH
FTEGAT
Teaching SalaryGAT
WSCH (incl. Excess PhD)Faculty Faculty
Cost perWSCHSCHTotal
Business Admin FINC
Texas A&M University – Teaching Analysis ReportAnalysis of Dept by Level and Funding Code
Fiscal Year 2014
Undergraduate(07) Home Economic 240 247 247 247 0.2 $11,940 $49.8 $48.3$11,940(16) Bus. Admin. 15,831 241 28,015 28,256 280 28,536 7.6 0.2 $1,051,713 $8,300 $67.0 $37.1$1,060,013(99) Not State Funde 333 0.1 $11,820 $35.5$11,820
16,404 488 28,015 28,503 280 28,783 8.0 0.2 $1,075,473 $8,300 $66.1 $37.7$1,083,773Total
Masters(16) Bus. Admin. 4,012 13,039 13,039 13,039 6.1 $920,616 $229.5 $70.6$920,616(99) Not State Funde $3,135 $3,135
4,012 13,039 13,039 13,039 6.1 $923,751 $230.2 $70.8$923,751Total
Doctoral(16) Bus. Admin. 280 6,499 6,499 1,161 5,338 1.1 $359,341 $1,283.4 $67.3$359,341
280 6,499 6,499 1,161 5,338 1.1 $359,341 $1,283.4 $67.3$359,341Total
Budgeted, Not TeachingBudgeted, Not Teach 4.9 2.4 $1,117,589 $52,959 $1,170,548
4.9 2.4 $1,117,589 $52,959 $1,170,548TotalFINC 20,696 488 28,015 13,039 6,499 48,041 280 1,161 47,160 20.1 2.6 $3,476,154 $61,259 $170.9 $75.0$3,537,413Total
Prepared by Office of Institutional Studies and Planning, 28-Oct-14, 08:14 AM Section VII. Page 25 of 96

Level / Funding AreaTotal SCH LD UD MS PhD Total
Teaching Supplem't
Excess PhD
Net WSCH
FTEGAT
Teaching SalaryGAT
WSCH (incl. Excess PhD)Faculty Faculty
Cost perWSCHSCHTotal
Business Admin INFO
Texas A&M University – Teaching Analysis ReportAnalysis of Dept by Level and Funding Code
Fiscal Year 2014
Undergraduate(06) Engineering 9,375 19,889 4,543 24,432 83 24,515 4.0 $401,534 $42.8 $16.4$401,534(16) Bus. Admin. 12,841 201 22,862 23,063 681 23,745 10.3 0.9 $1,412,502 $41,017 $113.2 $61.2$1,453,519(19) Technology 498 1,163 1,163 1,163 0.5 $44,916 $90.2 $38.6$44,916
22,714 21,254 27,405 48,659 764 49,423 14.8 0.9 $1,858,952 $41,017 $83.6 $38.4$1,899,969Total
Masters(01) Liberal Arts 3 12 12 12 0.1 $14,412 $4,803.9 $1,241.3$14,412(02) Science 60 455 455 455 0.4 $130,596 $2,176.6 $286.8$130,596(06) Engineering 2,369 18,147 18,147 18,147 2.7 $447,543 $188.9 $24.7$447,543(16) Bus. Admin. 1,976 6,422 6,422 6,422 2.2 $397,055 $200.9 $61.8$397,055
4,408 25,036 25,036 25,036 5.4 $989,606 $224.5 $39.5$989,606Total
Doctoral(06) Engineering 3 52 52 52(16) Bus. Admin. 138 3,203 3,203 557 2,646 3.0 $693,450 $5,025.0 $262.1$693,450
141 3,255 3,255 609 2,646 3.0 $693,450 $4,918.1 $262.1$693,450Total
Budgeted, Not TeachingBudgeted, Not Teach 2.8 10.8 $569,163 $251,753 $820,916
2.8 10.8 $569,163 $251,753 $820,916TotalINFO 27,263 21,254 27,405 25,036 3,255 76,949 764 609 77,104 25.8 11.7 $4,111,171 $292,770 $161.5 $57.1$4,403,941Total
Prepared by Office of Institutional Studies and Planning, 28-Oct-14, 08:14 AM Section VII. Page 26 of 96
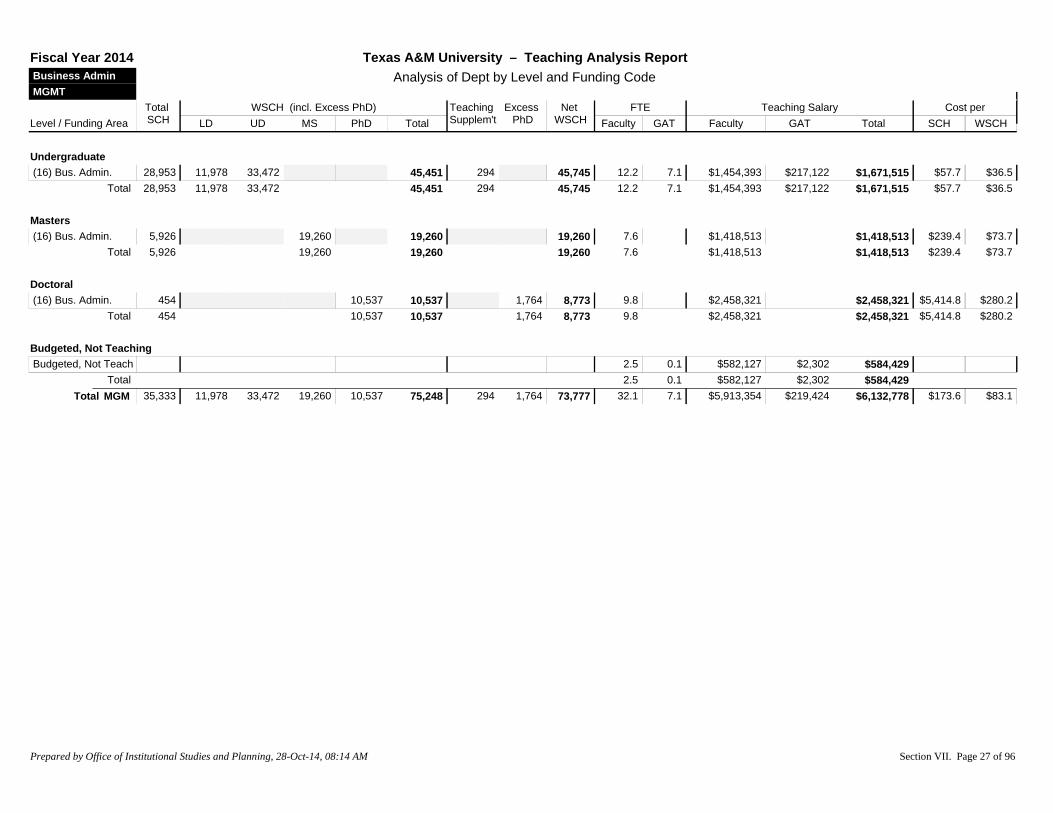
Level / Funding AreaTotal SCH LD UD MS PhD Total
Teaching Supplem't
Excess PhD
Net WSCH
FTEGAT
Teaching SalaryGAT
WSCH (incl. Excess PhD)Faculty Faculty
Cost perWSCHSCHTotal
Business Admin MGMT
Texas A&M University – Teaching Analysis ReportAnalysis of Dept by Level and Funding Code
Fiscal Year 2014
Undergraduate(16) Bus. Admin. 28,953 11,978 33,472 45,451 294 45,745 12.2 7.1 $1,454,393 $217,122 $57.7 $36.5$1,671,515
28,953 11,978 33,472 45,451 294 45,745 12.2 7.1 $1,454,393 $217,122 $57.7 $36.5$1,671,515Total
Masters(16) Bus. Admin. 5,926 19,260 19,260 19,260 7.6 $1,418,513 $239.4 $73.7$1,418,513
5,926 19,260 19,260 19,260 7.6 $1,418,513 $239.4 $73.7$1,418,513Total
Doctoral(16) Bus. Admin. 454 10,537 10,537 1,764 8,773 9.8 $2,458,321 $5,414.8 $280.2$2,458,321
454 10,537 10,537 1,764 8,773 9.8 $2,458,321 $5,414.8 $280.2$2,458,321Total
Budgeted, Not TeachingBudgeted, Not Teach 2.5 0.1 $582,127 $2,302 $584,429
2.5 0.1 $582,127 $2,302 $584,429TotalMGM 35,333 11,978 33,472 19,260 10,537 75,248 294 1,764 73,777 32.1 7.1 $5,913,354 $219,424 $173.6 $83.1$6,132,778Total
Prepared by Office of Institutional Studies and Planning, 28-Oct-14, 08:14 AM Section VII. Page 27 of 96

Level / Funding AreaTotal SCH LD UD MS PhD Total
Teaching Supplem't
Excess PhD
Net WSCH
FTEGAT
Teaching SalaryGAT
WSCH (incl. Excess PhD)Faculty Faculty
Cost perWSCHSCHTotal
Business Admin MKTG
Texas A&M University – Teaching Analysis ReportAnalysis of Dept by Level and Funding Code
Fiscal Year 2014
Undergraduate(16) Bus. Admin. 14,851 198 26,488 26,685 1,691 28,377 8.5 0.5 $1,073,857 $18,000 $73.5 $38.5$1,091,857
14,851 198 26,488 26,685 1,691 28,377 8.5 0.5 $1,073,857 $18,000 $73.5 $38.5$1,091,857Total
Masters(16) Bus. Admin. 2,167 7,043 7,043 7,043 2.8 $600,529 $277.1 $85.3$600,529
2,167 7,043 7,043 7,043 2.8 $600,529 $277.1 $85.3$600,529Total
Doctoral(16) Bus. Admin. 255 5,919 5,919 1,625 4,294 5.7 $1,685,729 $6,610.7 $392.6$1,685,729
255 5,919 5,919 1,625 4,294 5.7 $1,685,729 $6,610.7 $392.6$1,685,729Total
Budgeted, Not TeachingBudgeted, Not Teach 3.8 0.4 $875,740 $7,546 $883,286
3.8 0.4 $875,740 $7,546 $883,286TotalMKT 17,273 198 26,488 7,043 5,919 39,647 1,691 1,625 39,713 20.8 0.9 $4,235,855 $25,546 $246.7 $107.3$4,261,401Total
Prepared by Office of Institutional Studies and Planning, 28-Oct-14, 08:14 AM Section VII. Page 28 of 96
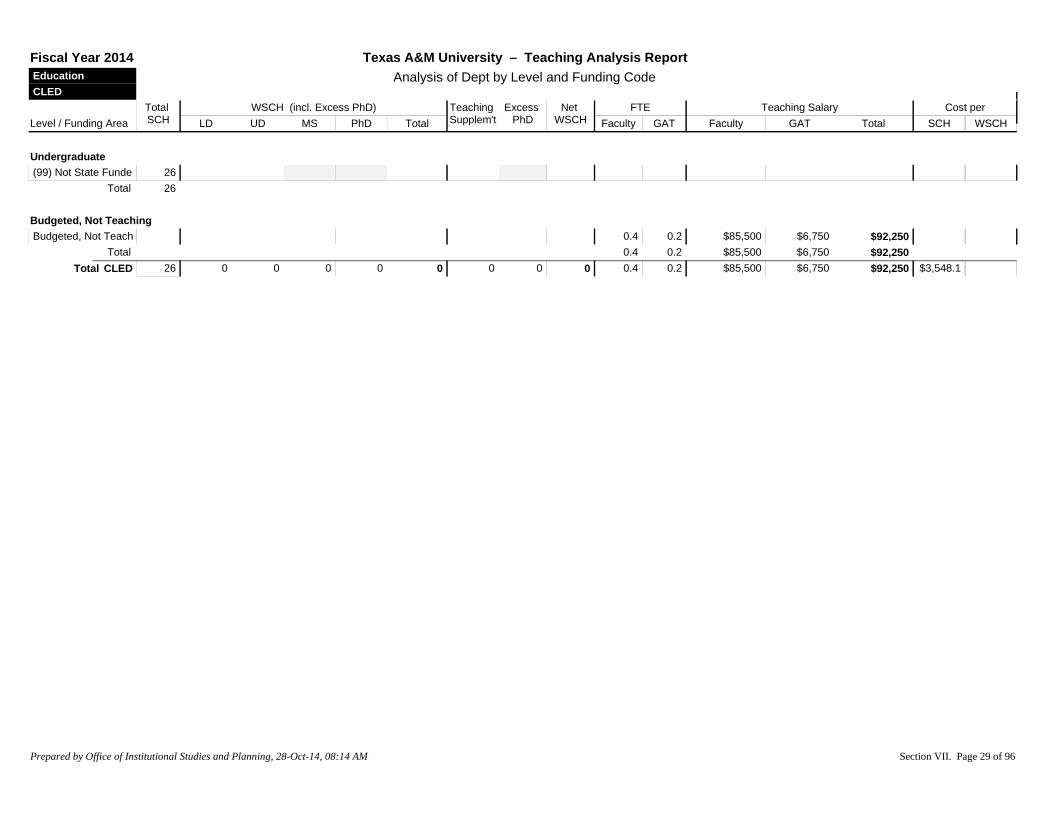
Level / Funding AreaTotal SCH LD UD MS PhD Total
Teaching Supplem't
Excess PhD
Net WSCH
FTEGAT
Teaching SalaryGAT
WSCH (incl. Excess PhD)Faculty Faculty
Cost perWSCHSCHTotal
Education CLED
Texas A&M University – Teaching Analysis ReportAnalysis of Dept by Level and Funding Code
Fiscal Year 2014
Undergraduate(99) Not State Funde 26
26Total
Budgeted, Not TeachingBudgeted, Not Teach 0.4 0.2 $85,500 $6,750 $92,250
0.4 0.2 $85,500 $6,750 $92,250TotalCLED 26 0 0 0 0 0 0 0 0 0.4 0.2 $85,500 $6,750 $3,548.1$92,250Total
Prepared by Office of Institutional Studies and Planning, 28-Oct-14, 08:14 AM Section VII. Page 29 of 96

Level / Funding AreaTotal SCH LD UD MS PhD Total
Teaching Supplem't
Excess PhD
Net WSCH
FTEGAT
Teaching SalaryGAT
WSCH (incl. Excess PhD)Faculty Faculty
Cost perWSCHSCHTotal
Education EAHR
Texas A&M University – Teaching Analysis ReportAnalysis of Dept by Level and Funding Code
Fiscal Year 2014
Undergraduate(01) Liberal Arts 1,134 105 1,749 1,854 20 1,874 0.7 0.4 $50,496 $13,500 $56.4 $34.1$63,996(04) Teacher Educ. 2,742 366 4,685 5,051 5,051 1.5 0.2 $121,526 $6,750 $46.8 $25.4$128,276(06) Engineering 33 7 107 115 115 $2,623 $79.5 $22.9$2,623(16) Bus. Admin. 5,238 358 8,818 9,176 9,176 2.2 0.8 $159,641 $27,000 $35.6 $20.3$186,641(99) Not State Funde 42 $1,497 $35.7$1,497
9,189 836 15,360 16,197 20 16,216 4.4 1.3 $335,783 $47,250 $41.7 $23.6$383,033Total
Masters(01) Liberal Arts 9 35 35 35 $755 $83.9 $21.7$755(04) Teacher Educ. 2,742 6,663 6,663 6,663 5.6 $452,455 $165.0 $67.9$452,455(16) Bus. Admin. 111 361 361 361 0.1 $8,389 $75.6 $23.3$8,389
2,862 7,059 7,059 7,059 5.7 $461,600 $161.3 $65.4$461,600Total
Doctoral(01) Liberal Arts 21 204 204 204 $4,427 $210.8 $21.7$4,427(04) Teacher Educ. 2,299 18,277 18,277 1,288 16,989 12.9 $1,281,791 $557.5 $75.4$1,281,791(16) Bus. Admin. 93 2,159 2,159 2,159 0.3 $7,869 $84.6 $3.6$7,869
2,413 20,640 20,640 1,288 19,352 13.2 $1,294,087 $536.3 $66.9$1,294,087Total
Budgeted, Not TeachingBudgeted, Not Teach 0.7 5.3 $74,787 $191,250 $266,037
0.7 5.3 $74,787 $191,250 $266,037TotalEAHR 14,464 836 15,360 7,059 20,640 43,895 20 1,288 42,627 24.0 6.6 $2,166,258 $238,500 $166.3 $56.4$2,404,758Total
Prepared by Office of Institutional Studies and Planning, 28-Oct-14, 08:14 AM Section VII. Page 30 of 96

Level / Funding AreaTotal SCH LD UD MS PhD Total
Teaching Supplem't
Excess PhD
Net WSCH
FTEGAT
Teaching SalaryGAT
WSCH (incl. Excess PhD)Faculty Faculty
Cost perWSCHSCHTotal
Education EPSY
Texas A&M University – Teaching Analysis ReportAnalysis of Dept by Level and Funding Code
Fiscal Year 2014
Undergraduate(01) Liberal Arts 69 5 109 114 11 126 0.2 $15,605 $226.2 $124.0$15,605(04) Teacher Educ. 5,246 1,854 7,590 9,445 163 9,608 4.8 1.5 $396,430 $56,127 $86.3 $47.1$452,557(07) Home Economic 720 195 866 1,061 1,061 0.7 0.1 $37,988 $3,750 $58.0 $39.3$41,738(18) Pract. Teacher 252 467 467 467 0.9 $50,813 $201.6 $108.9$50,813(19) Technology 150 369 369 369 0.2 $11,800 $78.7 $32.0$11,800
6,437 2,054 9,402 11,456 175 11,630 6.8 1.5 $512,637 $59,877 $88.9 $49.2$572,514Total
Masters(01) Liberal Arts 798 3,088 3,088 3,088 1.1 $89,317 $111.9 $28.9$89,317(04) Teacher Educ. 2,239 5,441 5,441 5,441 2.9 $302,602 $135.2 $55.6$302,602(14) Health Service 321 950 950 950 0.4 $42,517 $132.5 $44.7$42,517
3,358 9,479 9,479 9,479 4.3 $434,435 $129.4 $45.8$434,435Total
Doctoral(01) Liberal Arts 1,325 12,879 12,879 126 12,753 6.7 $808,835 $610.4 $63.4$808,835(02) Science 3 65 65 65 $3,121 $1,040.4 $47.7$3,121(04) Teacher Educ. 1,522 12,100 12,100 692 11,408 12.9 $1,397,312 $918.1 $122.5$1,397,312(14) Health Service 436 4,251 4,251 4,251 2.1 $210,569 $483.0 $49.5$210,569
3,286 29,295 29,295 818 28,477 21.7 $2,419,838 $736.4 $85.0$2,419,838Total
Budgeted, Not TeachingBudgeted, Not Teach 2.0 1.1 $262,541 $39,091 $301,632
2.0 1.1 $262,541 $39,091 $301,632TotalEPSY 13,081 2,054 9,402 9,479 29,295 50,230 175 818 49,587 34.7 2.6 $3,629,451 $98,968 $285.0 $75.2$3,728,419Total
Prepared by Office of Institutional Studies and Planning, 28-Oct-14, 08:14 AM Section VII. Page 31 of 96

Level / Funding AreaTotal SCH LD UD MS PhD Total
Teaching Supplem't
Excess PhD
Net WSCH
FTEGAT
Teaching SalaryGAT
WSCH (incl. Excess PhD)Faculty Faculty
Cost perWSCHSCHTotal
Education HLKN
Texas A&M University – Teaching Analysis ReportAnalysis of Dept by Level and Funding Code
Fiscal Year 2014
Undergraduate(01) Liberal Arts 1,320 105 2,078 2,183 46 2,228 0.5 $40,907 $31.0 $18.4$40,907(02) Science 5,257 101 15,505 15,606 449 16,055 4.9 $484,486 $92.2 $30.2$484,486(03) Fine Art 816 699 807 1,506 1,506 1.6 $116,825 $143.2 $77.6$116,825(04) Teacher Educ. 11,043 9,455 9,089 18,544 363 18,907 5.8 0.2 $544,749 $6,751 $49.9 $29.2$551,500(06) Engineering 2,463 6,007 6,007 6,007 0.7 $70,408 $28.6 $11.7$70,408(13) Phys. Training 15,806 21,588 21,588 21,588 16.9 3.3 $1,082,834 $107,712 $75.3 $55.1$1,190,546(14) Health Service 31,129 19,893 21,850 41,742 1,011 42,754 14.6 3.4 $1,111,118 $111,294 $39.3 $28.6$1,222,412(16) Bus. Admin. 13,199 4,668 16,525 21,194 1,135 22,329 4.2 0.4 $355,295 $13,500 $27.9 $16.5$368,795(18) Pract. Teacher 216 369 369 369 0.6 $44,858 $207.7 $121.7$44,858
81,249 62,517 66,222 128,739 3,004 131,743 49.9 7.2 $3,851,478 $239,257 $50.3 $31.1$4,090,735Total
Masters(01) Liberal Arts 117 453 453 453 0.1 $12,879 $110.1 $28.4$12,879(02) Science 673 5,108 5,108 5,108 2.0 $202,528 $300.9 $39.6$202,528(04) Teacher Educ. 699 1,699 1,699 1,699 3.0 $337,402 $482.7 $198.6$337,402(14) Health Service 903 2,673 2,673 2,673 0.9 $91,109 $100.9 $34.1$91,109(16) Bus. Admin. 1,318 4,284 4,284 4,284 3.0 $325,575 $247.0 $76.0$325,575
3,710 14,216 14,216 14,216 8.9 $969,493 $261.3 $68.2$969,493Total
Doctoral(01) Liberal Arts 51 496 496 29 467 0.1 $13,856 $271.7 $29.7$13,856(02) Science 49 1,069 1,069 1,069 0.4 $39,682 $809.8 $37.1$39,682(04) Teacher Educ. 1,081 8,594 8,594 1,216 7,378 9.4 $1,236,190 $1,143.6 $167.6$1,236,190(06) Engineering 1 17 17 17 $2,505 $2,505.3 $144.5$2,505(14) Health Service 130 1,268 1,268 29 1,238 0.4 $46,226 $355.6 $37.3$46,226(16) Bus. Admin. 223 5,176 5,176 5,176 2.6 $293,564 $1,316.4 $56.7$293,564
1,535 16,620 16,620 1,275 15,345 12.8 $1,632,024 $1,063.2 $106.4$1,632,024Total
Budgeted, Not TeachingBudgeted, Not Teach 1.9 27.5 $161,276 $897,894 $1,059,170
1.9 27.5 $161,276 $897,894 $1,059,170TotalHLKN 86,494 62,517 66,222 14,216 16,620 159,575 3,004 1,275 161,304 73.6 34.7 $6,614,271 $1,137,151 $89.6 $48.1$7,751,422Total
Prepared by Office of Institutional Studies and Planning, 28-Oct-14, 08:14 AM Section VII. Page 32 of 96

Level / Funding AreaTotal SCH LD UD MS PhD Total
Teaching Supplem't
Excess PhD
Net WSCH
FTEGAT
Teaching SalaryGAT
WSCH (incl. Excess PhD)Faculty Faculty
Cost perWSCHSCHTotal
Education TLAC
Texas A&M University – Teaching Analysis ReportAnalysis of Dept by Level and Funding Code
Fiscal Year 2014
Undergraduate(01) Liberal Arts 3,900 474 5,828 6,302 6,302 3.1 1.3 $252,633 $46,875 $76.8 $47.5$299,508(02) Science 1,923 262 5,300 5,562 33 5,595 1.5 1.3 $124,958 $47,250 $89.6 $30.8$172,208(04) Teacher Educ. 10,794 4,264 15,082 19,346 176 19,523 9.1 1.6 $695,531 $57,375 $69.8 $38.6$752,906(18) Pract. Teacher 7,329 2,946 11,007 13,953 18 13,972 3.9 0.8 $260,499 $30,375 $39.7 $20.8$290,874
23,946 7,946 37,217 45,163 228 45,391 17.7 5.0 $1,333,621 $181,875 $63.3 $33.4$1,515,496Total
Masters(01) Liberal Arts 525 2,032 2,032 2,032 0.6 $59,548 $113.4 $29.3$59,548(02) Science 42 319 319 319 0.1 $16,003 $381.0 $50.2$16,003(04) Teacher Educ. 4,051 9,844 9,844 9,844 6.4 $699,003 $172.6 $71.0$699,003
4,618 12,194 12,194 12,194 7.1 $774,554 $167.7 $63.5$774,554Total
Doctoral(01) Liberal Arts 111 1,079 1,079 1,079 0.1 $13,342 $120.2 $12.4$13,342(02) Science 78 1,702 1,702 1,702 0.3 $33,479 $429.2 $19.7$33,479(04) Teacher Educ. 1,824 14,501 14,501 421 14,079 14.7 $1,708,537 $936.7 $121.3$1,708,537
2,013 17,282 17,282 421 16,860 15.1 $1,755,358 $872.0 $104.1$1,755,358Total
Budgeted, Not TeachingBudgeted, Not Teach 0.8 2.8 $85,212 $100,875 $186,087
0.8 2.8 $85,212 $100,875 $186,087TotalTLAC 30,577 7,946 37,217 12,194 17,282 74,639 228 421 74,446 40.7 7.9 $3,948,745 $282,750 $138.4 $56.8$4,231,495Total
Prepared by Office of Institutional Studies and Planning, 28-Oct-14, 08:14 AM Section VII. Page 33 of 96

Level / Funding AreaTotal SCH LD UD MS PhD Total
Teaching Supplem't
Excess PhD
Net WSCH
FTEGAT
Teaching SalaryGAT
WSCH (incl. Excess PhD)Faculty Faculty
Cost perWSCHSCHTotal
Engineering AERO
Texas A&M University – Teaching Analysis ReportAnalysis of Dept by Level and Funding Code
Fiscal Year 2014
Prepared by Office of Institutional Studies and Planning, 28-Oct-14, 08:14 AM Section VII. Page 34 of 96
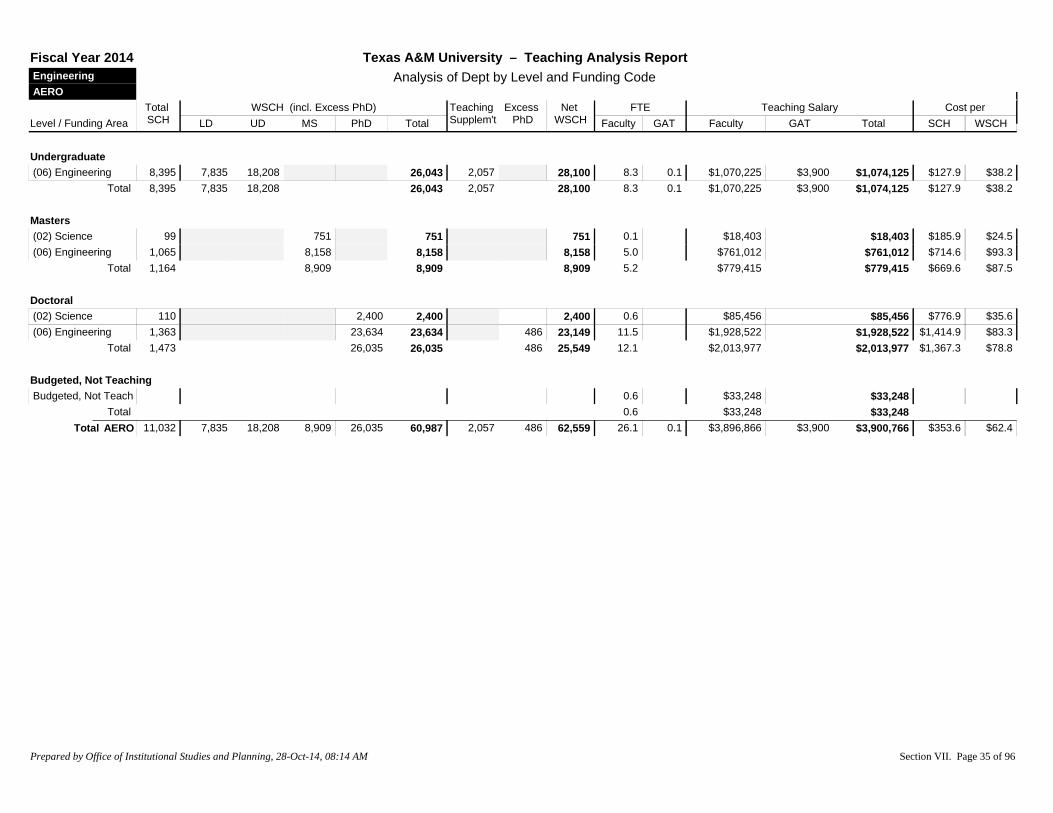
Level / Funding AreaTotal SCH LD UD MS PhD Total
Teaching Supplem't
Excess PhD
Net WSCH
FTEGAT
Teaching SalaryGAT
WSCH (incl. Excess PhD)Faculty Faculty
Cost perWSCHSCHTotal
Engineering AERO
Texas A&M University – Teaching Analysis ReportAnalysis of Dept by Level and Funding Code
Fiscal Year 2014
Undergraduate(06) Engineering 8,395 7,835 18,208 26,043 2,057 28,100 8.3 0.1 $1,070,225 $3,900 $127.9 $38.2$1,074,125
8,395 7,835 18,208 26,043 2,057 28,100 8.3 0.1 $1,070,225 $3,900 $127.9 $38.2$1,074,125Total
Masters(02) Science 99 751 751 751 0.1 $18,403 $185.9 $24.5$18,403(06) Engineering 1,065 8,158 8,158 8,158 5.0 $761,012 $714.6 $93.3$761,012
1,164 8,909 8,909 8,909 5.2 $779,415 $669.6 $87.5$779,415Total
Doctoral(02) Science 110 2,400 2,400 2,400 0.6 $85,456 $776.9 $35.6$85,456(06) Engineering 1,363 23,634 23,634 486 23,149 11.5 $1,928,522 $1,414.9 $83.3$1,928,522
1,473 26,035 26,035 486 25,549 12.1 $2,013,977 $1,367.3 $78.8$2,013,977Total
Budgeted, Not TeachingBudgeted, Not Teach 0.6 $33,248 $33,248
0.6 $33,248 $33,248TotalAERO 11,032 7,835 18,208 8,909 26,035 60,987 2,057 486 62,559 26.1 0.1 $3,896,866 $3,900 $353.6 $62.4$3,900,766Total
Prepared by Office of Institutional Studies and Planning, 28-Oct-14, 08:14 AM Section VII. Page 35 of 96

Level / Funding AreaTotal SCH LD UD MS PhD Total
Teaching Supplem't
Excess PhD
Net WSCH
FTEGAT
Teaching SalaryGAT
WSCH (incl. Excess PhD)Faculty Faculty
Cost perWSCHSCHTotal
Engineering BMEN
Texas A&M University – Teaching Analysis ReportAnalysis of Dept by Level and Funding Code
Fiscal Year 2014
Undergraduate(06) Engineering 4,309 2,866 11,198 14,064 1,158 15,222 3.0 0.1 $386,029 $3,375 $90.4 $25.6$389,404
4,309 2,866 11,198 14,064 1,158 15,222 3.0 0.1 $386,029 $3,375 $90.4 $25.6$389,404Total
Masters(02) Science 8 61 61 61 0.1 $11,345 $1,418.2 $186.8$11,345(06) Engineering 1,067 8,173 8,173 8,173 3.7 0.1 $473,664 $2,519 $446.3 $58.3$476,183
1,075 8,234 8,234 8,234 3.8 0.1 $485,009 $2,519 $453.5 $59.2$487,528Total
Doctoral(02) Science 64 1,396 1,396 1,396 0.5 $75,066 $1,172.9 $53.8$75,066(06) Engineering 998 17,305 17,305 694 16,612 7.4 $857,094 $856 $859.7 $51.6$857,949
1,062 18,702 18,702 694 18,008 7.9 $932,160 $856 $878.5 $51.8$933,016Total
Budgeted, Not TeachingBudgeted, Not Teach 0.9 5.6 $120,875 $190,229 $311,104
0.9 5.6 $120,875 $190,229 $311,104TotalBME 6,446 2,866 11,198 8,234 18,702 41,000 1,158 694 41,464 15.6 5.8 $1,924,073 $196,979 $329.0 $51.2$2,121,052Total
Prepared by Office of Institutional Studies and Planning, 28-Oct-14, 08:14 AM Section VII. Page 36 of 96

Level / Funding AreaTotal SCH LD UD MS PhD Total
Teaching Supplem't
Excess PhD
Net WSCH
FTEGAT
Teaching SalaryGAT
WSCH (incl. Excess PhD)Faculty Faculty
Cost perWSCHSCHTotal
Engineering CHEN
Texas A&M University – Teaching Analysis ReportAnalysis of Dept by Level and Funding Code
Fiscal Year 2014
Undergraduate(06) Engineering 7,526 3,798 21,212 25,011 1,680 26,690 6.9 $765,875 $101.8 $28.7$765,875(16) Bus. Admin. 387 7 690 697 70 766 0.1 $17,942 $46.4 $23.4$17,942
7,913 3,805 21,902 25,707 1,749 27,456 7.0 $783,817 $99.1 $28.5$783,817Total
Masters(02) Science 327 2,482 2,482 2,482 1.1 $90,263 $276.0 $36.4$90,263(06) Engineering 1,325 10,150 10,150 10,150 4.3 $630,151 $475.6 $62.1$630,151
1,652 12,631 12,631 12,631 5.4 $720,413 $436.1 $57.0$720,413Total
Doctoral(02) Science 216 4,713 4,713 65 4,648 1.6 $256,048 $1,185.4 $55.1$256,048(06) Engineering 1,456 25,247 25,247 971 24,276 8.8 $1,355,358 $930.9 $55.8$1,355,358
1,672 29,960 29,960 1,037 28,924 10.5 $1,611,406 $963.8 $55.7$1,611,406Total
Budgeted, Not TeachingBudgeted, Not Teach 0.3 1.6 $29,984 $74,200 $104,184
0.3 1.6 $29,984 $74,200 $104,184TotalCHEN 11,237 3,805 21,902 12,631 29,960 68,299 1,749 1,037 69,012 23.2 1.6 $3,145,620 $74,200 $286.5 $46.7$3,219,820Total
Prepared by Office of Institutional Studies and Planning, 28-Oct-14, 08:14 AM Section VII. Page 37 of 96
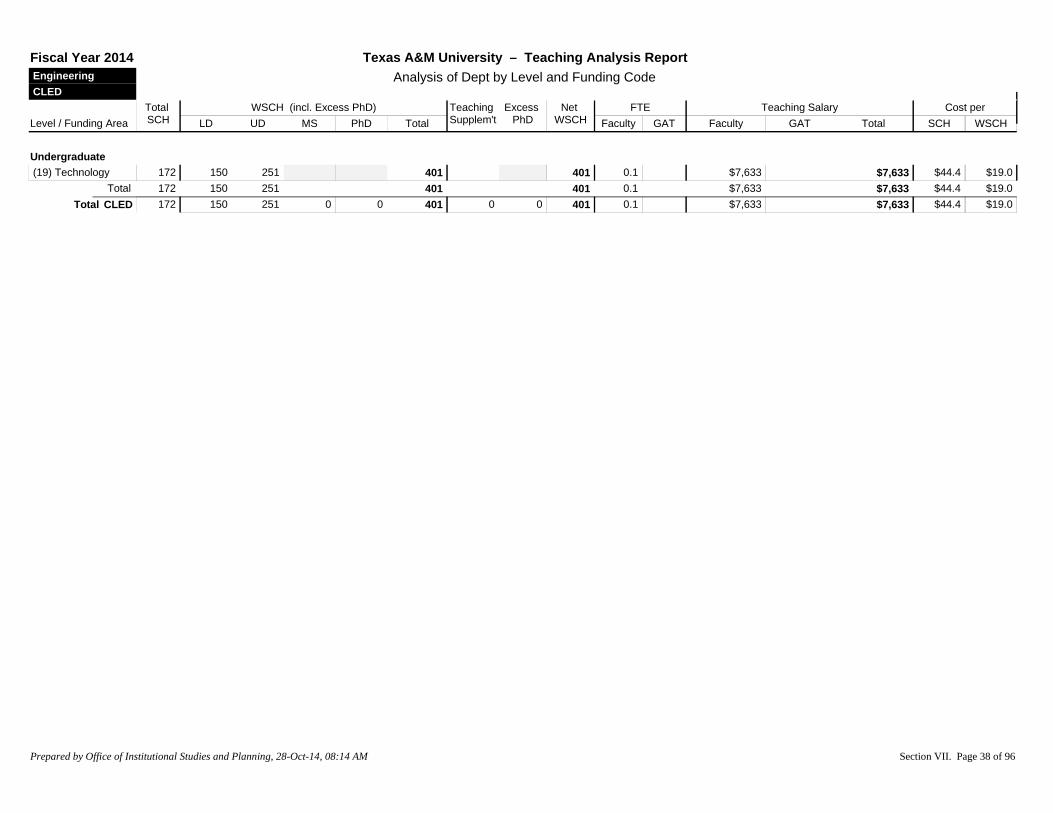
Level / Funding AreaTotal SCH LD UD MS PhD Total
Teaching Supplem't
Excess PhD
Net WSCH
FTEGAT
Teaching SalaryGAT
WSCH (incl. Excess PhD)Faculty Faculty
Cost perWSCHSCHTotal
Engineering CLED
Texas A&M University – Teaching Analysis ReportAnalysis of Dept by Level and Funding Code
Fiscal Year 2014
Undergraduate(19) Technology 172 150 251 401 401 0.1 $7,633 $44.4 $19.0$7,633
172 150 251 401 401 0.1 $7,633 $44.4 $19.0$7,633TotalCLED 172 150 251 0 0 401 0 0 401 0.1 $7,633 $44.4 $19.0$7,633Total
Prepared by Office of Institutional Studies and Planning, 28-Oct-14, 08:14 AM Section VII. Page 38 of 96
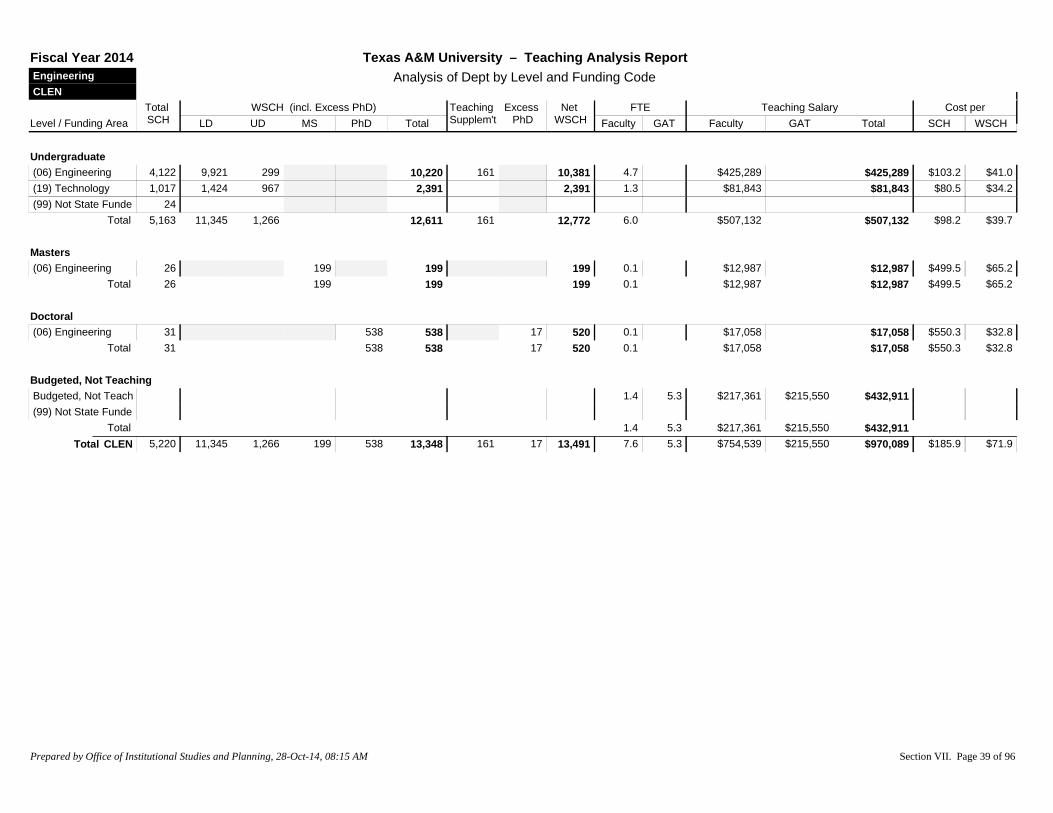
Level / Funding AreaTotal SCH LD UD MS PhD Total
Teaching Supplem't
Excess PhD
Net WSCH
FTEGAT
Teaching SalaryGAT
WSCH (incl. Excess PhD)Faculty Faculty
Cost perWSCHSCHTotal
Engineering CLEN
Texas A&M University – Teaching Analysis ReportAnalysis of Dept by Level and Funding Code
Fiscal Year 2014
Undergraduate(06) Engineering 4,122 9,921 299 10,220 161 10,381 4.7 $425,289 $103.2 $41.0$425,289(19) Technology 1,017 1,424 967 2,391 2,391 1.3 $81,843 $80.5 $34.2$81,843(99) Not State Funde 24
5,163 11,345 1,266 12,611 161 12,772 6.0 $507,132 $98.2 $39.7$507,132Total
Masters(06) Engineering 26 199 199 199 0.1 $12,987 $499.5 $65.2$12,987
26 199 199 199 0.1 $12,987 $499.5 $65.2$12,987Total
Doctoral(06) Engineering 31 538 538 17 520 0.1 $17,058 $550.3 $32.8$17,058
31 538 538 17 520 0.1 $17,058 $550.3 $32.8$17,058Total
Budgeted, Not TeachingBudgeted, Not Teach 1.4 5.3 $217,361 $215,550 $432,911(99) Not State Funde
1.4 5.3 $217,361 $215,550 $432,911TotalCLEN 5,220 11,345 1,266 199 538 13,348 161 17 13,491 7.6 5.3 $754,539 $215,550 $185.9 $71.9$970,089Total
Prepared by Office of Institutional Studies and Planning, 28-Oct-14, 08:15 AM Section VII. Page 39 of 96
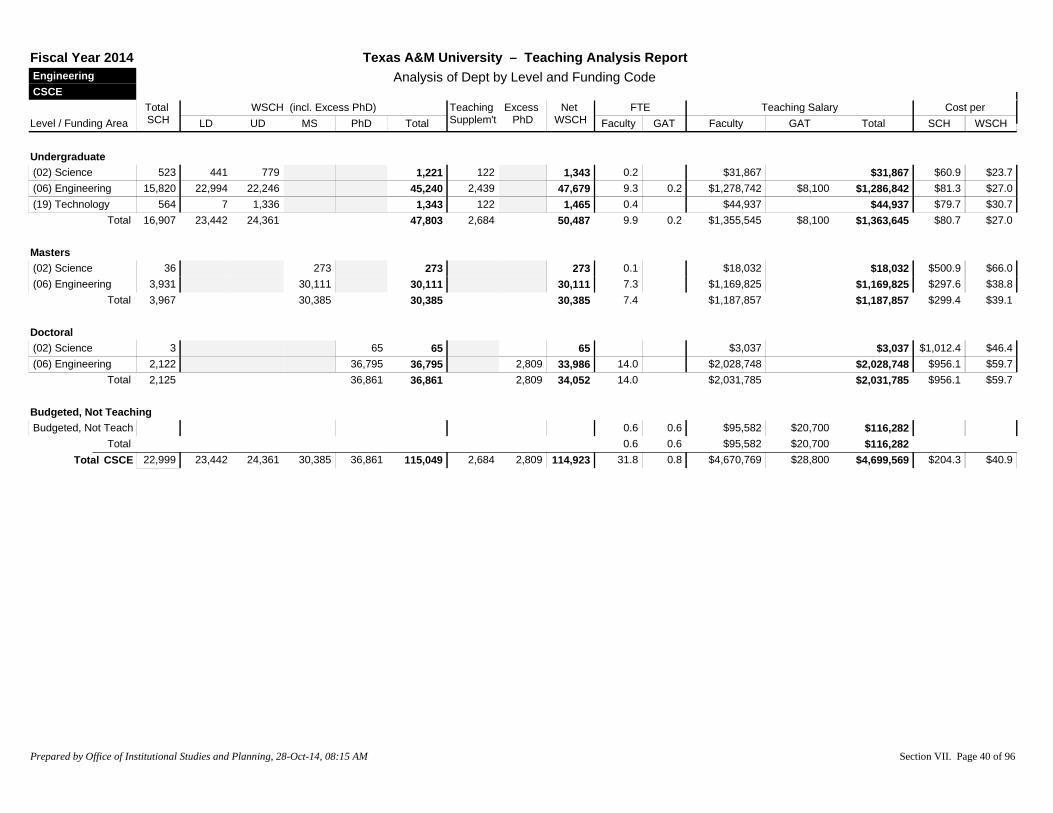
Level / Funding AreaTotal SCH LD UD MS PhD Total
Teaching Supplem't
Excess PhD
Net WSCH
FTEGAT
Teaching SalaryGAT
WSCH (incl. Excess PhD)Faculty Faculty
Cost perWSCHSCHTotal
Engineering CSCE
Texas A&M University – Teaching Analysis ReportAnalysis of Dept by Level and Funding Code
Fiscal Year 2014
Undergraduate(02) Science 523 441 779 1,221 122 1,343 0.2 $31,867 $60.9 $23.7$31,867(06) Engineering 15,820 22,994 22,246 45,240 2,439 47,679 9.3 0.2 $1,278,742 $8,100 $81.3 $27.0$1,286,842(19) Technology 564 7 1,336 1,343 122 1,465 0.4 $44,937 $79.7 $30.7$44,937
16,907 23,442 24,361 47,803 2,684 50,487 9.9 0.2 $1,355,545 $8,100 $80.7 $27.0$1,363,645Total
Masters(02) Science 36 273 273 273 0.1 $18,032 $500.9 $66.0$18,032(06) Engineering 3,931 30,111 30,111 30,111 7.3 $1,169,825 $297.6 $38.8$1,169,825
3,967 30,385 30,385 30,385 7.4 $1,187,857 $299.4 $39.1$1,187,857Total
Doctoral(02) Science 3 65 65 65 $3,037 $1,012.4 $46.4$3,037(06) Engineering 2,122 36,795 36,795 2,809 33,986 14.0 $2,028,748 $956.1 $59.7$2,028,748
2,125 36,861 36,861 2,809 34,052 14.0 $2,031,785 $956.1 $59.7$2,031,785Total
Budgeted, Not TeachingBudgeted, Not Teach 0.6 0.6 $95,582 $20,700 $116,282
0.6 0.6 $95,582 $20,700 $116,282TotalCSCE 22,999 23,442 24,361 30,385 36,861 115,049 2,684 2,809 114,923 31.8 0.8 $4,670,769 $28,800 $204.3 $40.9$4,699,569Total
Prepared by Office of Institutional Studies and Planning, 28-Oct-14, 08:15 AM Section VII. Page 40 of 96

Level / Funding AreaTotal SCH LD UD MS PhD Total
Teaching Supplem't
Excess PhD
Net WSCH
FTEGAT
Teaching SalaryGAT
WSCH (incl. Excess PhD)Faculty Faculty
Cost perWSCHSCHTotal
Engineering CVEN
Texas A&M University – Teaching Analysis ReportAnalysis of Dept by Level and Funding Code
Fiscal Year 2014
Undergraduate(01) Liberal Arts 990 1,651 1,651 165 1,816 0.7 $116,307 $117.5 $64.0$116,307(06) Engineering 15,729 5,980 46,991 52,971 4,397 57,369 12.1 3.7 $1,524,686 $119,001 $104.5 $28.7$1,643,687
16,719 5,980 48,642 54,622 4,562 59,184 12.7 3.7 $1,640,993 $119,001 $105.3 $29.7$1,759,994Total
Masters(06) Engineering 3,963 30,357 30,357 30,357 11.2 $1,429,422 $360.7 $47.1$1,429,422
3,963 30,357 30,357 30,357 11.2 $1,429,422 $360.7 $47.1$1,429,422Total
Doctoral(02) Science 24 524 524 524 0.5 $78,661 $3,277.5 $150.2$78,661(06) Engineering 2,766 47,962 47,962 1,474 46,489 26.5 $3,438,784 $1,243.2 $74.0$3,438,784
2,790 48,486 48,486 1,474 47,012 26.9 $3,517,445 $1,260.7 $74.8$3,517,445Total
Budgeted, Not TeachingBudgeted, Not Teach 1.4 7.4 $155,488 $232,706 $388,194
1.4 7.4 $155,488 $232,706 $388,194TotalCVEN 23,472 5,980 48,642 30,357 48,486 133,465 4,562 1,474 136,553 52.3 11.0 $6,743,348 $351,707 $302.3 $52.0$7,095,055Total
Prepared by Office of Institutional Studies and Planning, 28-Oct-14, 08:15 AM Section VII. Page 41 of 96

Level / Funding AreaTotal SCH LD UD MS PhD Total
Teaching Supplem't
Excess PhD
Net WSCH
FTEGAT
Teaching SalaryGAT
WSCH (incl. Excess PhD)Faculty Faculty
Cost perWSCHSCHTotal
Engineering ECEN
Texas A&M University – Teaching Analysis ReportAnalysis of Dept by Level and Funding Code
Fiscal Year 2014
Undergraduate(01) Liberal Arts 869 1,449 1,449 145 1,594 0.5 $91,064 $104.8 $57.1$91,064(06) Engineering 18,569 15,434 43,046 58,480 4,549 63,029 16.9 $2,188,704 $117.9 $34.7$2,188,704
19,438 15,434 44,495 59,929 4,694 64,623 17.4 $2,279,769 $117.3 $35.3$2,279,769Total
Masters(02) Science 5 38 38 38 $651 $130.2 $17.2$651(06) Engineering 4,554 34,884 34,884 34,884 9.9 $1,335,279 $293.2 $38.3$1,335,279
4,559 34,922 34,922 34,922 9.9 $1,335,929 $293.0 $38.3$1,335,929Total
Doctoral(02) Science 70 1,527 1,527 1,527 0.1 $21,639 $309.1 $14.2$21,639(06) Engineering 4,775 82,799 82,799 5,757 77,042 26.7 $3,561,283 $745.8 $46.2$3,561,283
4,845 84,326 84,326 5,757 78,569 26.8 $3,582,922 $739.5 $45.6$3,582,922Total
Budgeted, Not TeachingBudgeted, Not Teach 1.5 17.1 $351,928 $560,461 $912,389
1.5 17.1 $351,928 $560,461 $912,389TotalECEN 28,842 15,434 44,495 34,922 84,326 179,177 4,694 5,757 178,113 55.6 17.1 $7,550,548 $560,461 $281.2 $45.5$8,111,009Total
Prepared by Office of Institutional Studies and Planning, 28-Oct-14, 08:15 AM Section VII. Page 42 of 96
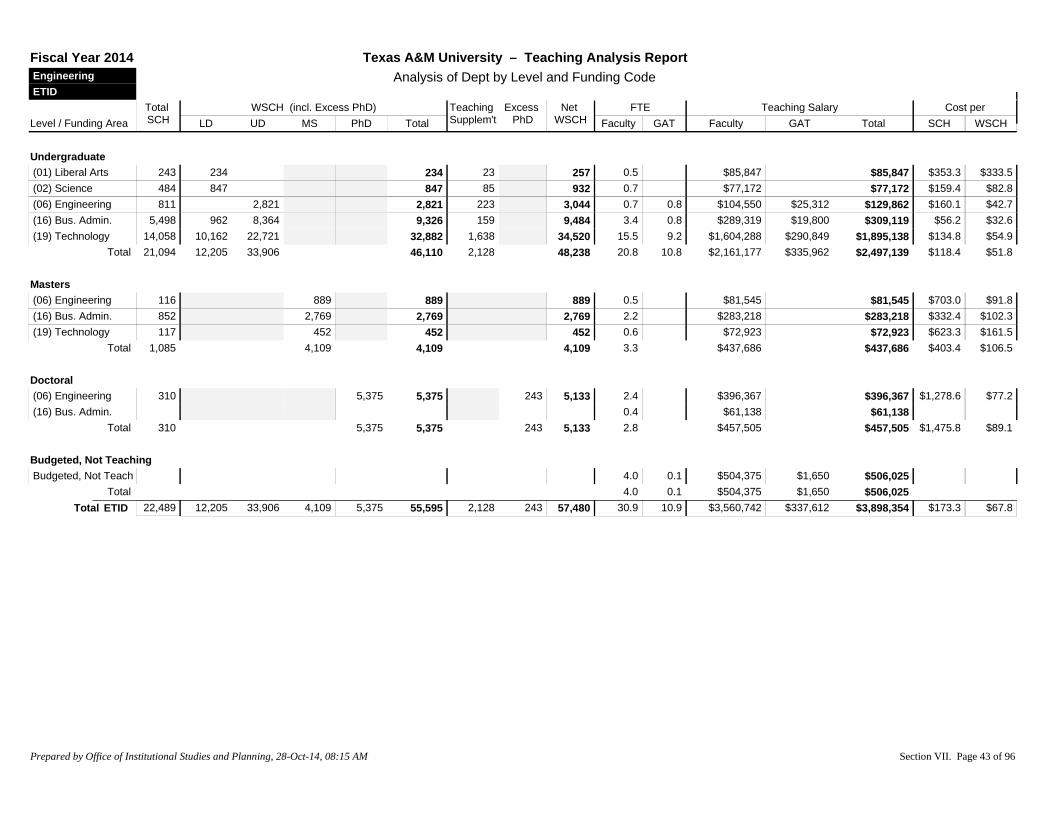
Level / Funding AreaTotal SCH LD UD MS PhD Total
Teaching Supplem't
Excess PhD
Net WSCH
FTEGAT
Teaching SalaryGAT
WSCH (incl. Excess PhD)Faculty Faculty
Cost perWSCHSCHTotal
Engineering ETID
Texas A&M University – Teaching Analysis ReportAnalysis of Dept by Level and Funding Code
Fiscal Year 2014
Undergraduate(01) Liberal Arts 243 234 234 23 257 0.5 $85,847 $353.3 $333.5$85,847(02) Science 484 847 847 85 932 0.7 $77,172 $159.4 $82.8$77,172(06) Engineering 811 2,821 2,821 223 3,044 0.7 0.8 $104,550 $25,312 $160.1 $42.7$129,862(16) Bus. Admin. 5,498 962 8,364 9,326 159 9,484 3.4 0.8 $289,319 $19,800 $56.2 $32.6$309,119(19) Technology 14,058 10,162 22,721 32,882 1,638 34,520 15.5 9.2 $1,604,288 $290,849 $134.8 $54.9$1,895,138
21,094 12,205 33,906 46,110 2,128 48,238 20.8 10.8 $2,161,177 $335,962 $118.4 $51.8$2,497,139Total
Masters(06) Engineering 116 889 889 889 0.5 $81,545 $703.0 $91.8$81,545(16) Bus. Admin. 852 2,769 2,769 2,769 2.2 $283,218 $332.4 $102.3$283,218(19) Technology 117 452 452 452 0.6 $72,923 $623.3 $161.5$72,923
1,085 4,109 4,109 4,109 3.3 $437,686 $403.4 $106.5$437,686Total
Doctoral(06) Engineering 310 5,375 5,375 243 5,133 2.4 $396,367 $1,278.6 $77.2$396,367(16) Bus. Admin. 0.4 $61,138 $61,138
310 5,375 5,375 243 5,133 2.8 $457,505 $1,475.8 $89.1$457,505Total
Budgeted, Not TeachingBudgeted, Not Teach 4.0 0.1 $504,375 $1,650 $506,025
4.0 0.1 $504,375 $1,650 $506,025TotalETID 22,489 12,205 33,906 4,109 5,375 55,595 2,128 243 57,480 30.9 10.9 $3,560,742 $337,612 $173.3 $67.8$3,898,354Total
Prepared by Office of Institutional Studies and Planning, 28-Oct-14, 08:15 AM Section VII. Page 43 of 96

Level / Funding AreaTotal SCH LD UD MS PhD Total
Teaching Supplem't
Excess PhD
Net WSCH
FTEGAT
Teaching SalaryGAT
WSCH (incl. Excess PhD)Faculty Faculty
Cost perWSCHSCHTotal
Engineering ISEN
Texas A&M University – Teaching Analysis ReportAnalysis of Dept by Level and Funding Code
Fiscal Year 2014
Undergraduate(06) Engineering 8,390 4,197 23,227 27,424 1,538 28,962 7.4 1.9 $962,501 $84,579 $124.8 $36.2$1,047,080
8,390 4,197 23,227 27,424 1,538 28,962 7.4 1.9 $962,501 $84,579 $124.8 $36.2$1,047,080Total
Masters(06) Engineering 2,067 15,833 15,833 15,833 4.5 $705,142 $341.1 $44.5$705,142
2,067 15,833 15,833 15,833 4.5 $705,142 $341.1 $44.5$705,142Total
Doctoral(06) Engineering 733 12,710 12,710 850 11,861 8.9 $1,272,622 $1,736.2 $107.3$1,272,622
733 12,710 12,710 850 11,861 8.9 $1,272,622 $1,736.2 $107.3$1,272,622Total
Budgeted, Not TeachingBudgeted, Not Teach 0.7 5.4 $112,205 $203,301 $315,506
0.7 5.4 $112,205 $203,301 $315,506TotalISEN 11,190 4,197 23,227 15,833 12,710 55,967 1,538 850 56,656 21.6 7.3 $3,052,471 $287,880 $298.5 $59.0$3,340,351Total
Prepared by Office of Institutional Studies and Planning, 28-Oct-14, 08:15 AM Section VII. Page 44 of 96
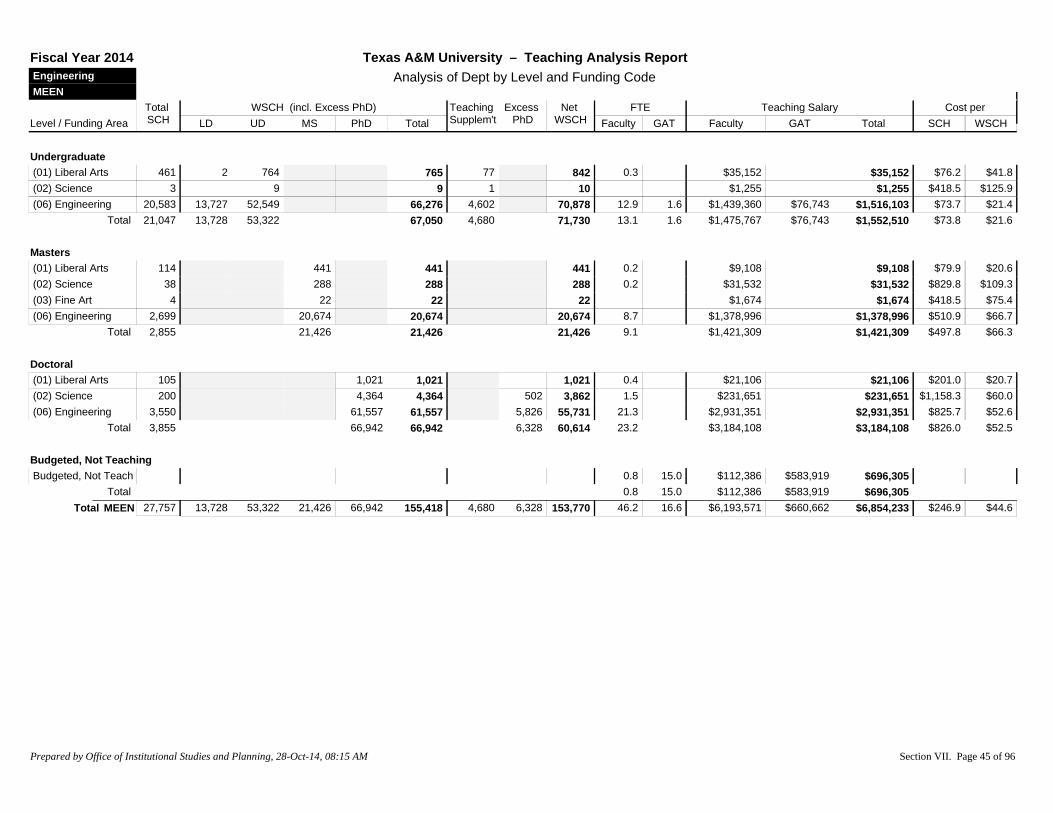
Level / Funding AreaTotal SCH LD UD MS PhD Total
Teaching Supplem't
Excess PhD
Net WSCH
FTEGAT
Teaching SalaryGAT
WSCH (incl. Excess PhD)Faculty Faculty
Cost perWSCHSCHTotal
Engineering MEEN
Texas A&M University – Teaching Analysis ReportAnalysis of Dept by Level and Funding Code
Fiscal Year 2014
Undergraduate(01) Liberal Arts 461 2 764 765 77 842 0.3 $35,152 $76.2 $41.8$35,152(02) Science 3 9 9 1 10 $1,255 $418.5 $125.9$1,255(06) Engineering 20,583 13,727 52,549 66,276 4,602 70,878 12.9 1.6 $1,439,360 $76,743 $73.7 $21.4$1,516,103
21,047 13,728 53,322 67,050 4,680 71,730 13.1 1.6 $1,475,767 $76,743 $73.8 $21.6$1,552,510Total
Masters(01) Liberal Arts 114 441 441 441 0.2 $9,108 $79.9 $20.6$9,108(02) Science 38 288 288 288 0.2 $31,532 $829.8 $109.3$31,532(03) Fine Art 4 22 22 22 $1,674 $418.5 $75.4$1,674(06) Engineering 2,699 20,674 20,674 20,674 8.7 $1,378,996 $510.9 $66.7$1,378,996
2,855 21,426 21,426 21,426 9.1 $1,421,309 $497.8 $66.3$1,421,309Total
Doctoral(01) Liberal Arts 105 1,021 1,021 1,021 0.4 $21,106 $201.0 $20.7$21,106(02) Science 200 4,364 4,364 502 3,862 1.5 $231,651 $1,158.3 $60.0$231,651(06) Engineering 3,550 61,557 61,557 5,826 55,731 21.3 $2,931,351 $825.7 $52.6$2,931,351
3,855 66,942 66,942 6,328 60,614 23.2 $3,184,108 $826.0 $52.5$3,184,108Total
Budgeted, Not TeachingBudgeted, Not Teach 0.8 15.0 $112,386 $583,919 $696,305
0.8 15.0 $112,386 $583,919 $696,305TotalMEEN 27,757 13,728 53,322 21,426 66,942 155,418 4,680 6,328 153,770 46.2 16.6 $6,193,571 $660,662 $246.9 $44.6$6,854,233Total
Prepared by Office of Institutional Studies and Planning, 28-Oct-14, 08:15 AM Section VII. Page 45 of 96
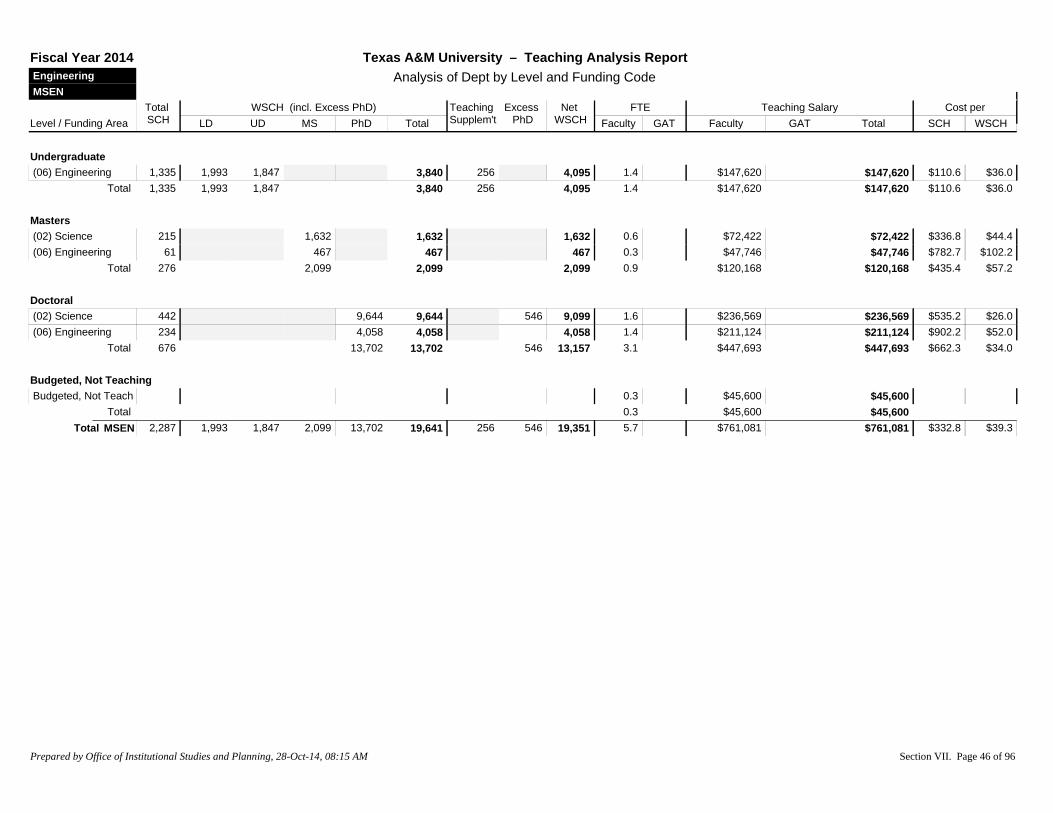
Level / Funding AreaTotal SCH LD UD MS PhD Total
Teaching Supplem't
Excess PhD
Net WSCH
FTEGAT
Teaching SalaryGAT
WSCH (incl. Excess PhD)Faculty Faculty
Cost perWSCHSCHTotal
Engineering MSEN
Texas A&M University – Teaching Analysis ReportAnalysis of Dept by Level and Funding Code
Fiscal Year 2014
Undergraduate(06) Engineering 1,335 1,993 1,847 3,840 256 4,095 1.4 $147,620 $110.6 $36.0$147,620
1,335 1,993 1,847 3,840 256 4,095 1.4 $147,620 $110.6 $36.0$147,620Total
Masters(02) Science 215 1,632 1,632 1,632 0.6 $72,422 $336.8 $44.4$72,422(06) Engineering 61 467 467 467 0.3 $47,746 $782.7 $102.2$47,746
276 2,099 2,099 2,099 0.9 $120,168 $435.4 $57.2$120,168Total
Doctoral(02) Science 442 9,644 9,644 546 9,099 1.6 $236,569 $535.2 $26.0$236,569(06) Engineering 234 4,058 4,058 4,058 1.4 $211,124 $902.2 $52.0$211,124
676 13,702 13,702 546 13,157 3.1 $447,693 $662.3 $34.0$447,693Total
Budgeted, Not TeachingBudgeted, Not Teach 0.3 $45,600 $45,600
0.3 $45,600 $45,600TotalMSEN 2,287 1,993 1,847 2,099 13,702 19,641 256 546 19,351 5.7 $761,081 $332.8 $39.3$761,081Total
Prepared by Office of Institutional Studies and Planning, 28-Oct-14, 08:15 AM Section VII. Page 46 of 96

Level / Funding AreaTotal SCH LD UD MS PhD Total
Teaching Supplem't
Excess PhD
Net WSCH
FTEGAT
Teaching SalaryGAT
WSCH (incl. Excess PhD)Faculty Faculty
Cost perWSCHSCHTotal
Engineering NUEN
Texas A&M University – Teaching Analysis ReportAnalysis of Dept by Level and Funding Code
Fiscal Year 2014
Undergraduate(06) Engineering 3,114 2,482 7,293 9,776 829 10,605 4.0 $555,401 $178.3 $52.4$555,401(14) Health Service 150 254 254 25 280 0.2 $38,713 $258.1 $138.4$38,713
3,264 2,482 7,548 10,030 855 10,884 4.3 $594,114 $182.0 $54.6$594,114Total
Masters(01) Liberal Arts 57 221 221 221 0.1 $20,934 $367.3 $94.9$20,934(02) Science 3 23 23 23 $5,602 $1,867.2 $246.0$5,602(06) Engineering 1,450 11,107 11,107 11,107 4.0 $526,755 $363.3 $47.4$526,755(14) Health Service 84 249 249 249 0.1 $18,761 $223.3 $75.5$18,761
1,594 11,599 11,599 11,599 4.3 $572,051 $358.9 $49.3$572,051Total
Doctoral(02) Science 64 1,396 1,396 1,396 0.4 $63,510 $992.3 $45.5$63,510(06) Engineering 1,208 20,947 20,947 1,387 19,560 5.6 $788,086 $652.4 $40.3$788,086(14) Health Service 30 293 293 293 0.2 $28,398 $946.6 $97.1$28,398
1,302 22,636 22,636 1,387 21,249 6.2 $879,994 $675.9 $41.4$879,994Total
Budgeted, Not TeachingBudgeted, Not Teach 2.8 $158,628 $158,628
2.8 $158,628 $158,628TotalNUEN 6,160 2,482 7,548 11,599 22,636 44,265 855 1,387 43,732 14.8 2.8 $2,046,159 $158,628 $357.9 $50.4$2,204,787Total
Prepared by Office of Institutional Studies and Planning, 28-Oct-14, 08:15 AM Section VII. Page 47 of 96

Level / Funding AreaTotal SCH LD UD MS PhD Total
Teaching Supplem't
Excess PhD
Net WSCH
FTEGAT
Teaching SalaryGAT
WSCH (incl. Excess PhD)Faculty Faculty
Cost perWSCHSCHTotal
Engineering PETE
Texas A&M University – Teaching Analysis ReportAnalysis of Dept by Level and Funding Code
Fiscal Year 2014
Undergraduate(02) Science 87 262 262 2 263 0.4 0.2 $52,867 $7,425 $696.1 $228.9$60,292(06) Engineering 10,572 4,002 31,536 35,539 2,523 38,061 6.8 0.2 $861,907 $6,750 $82.2 $22.8$868,657
10,659 4,002 31,798 35,800 2,524 38,325 7.2 0.4 $914,774 $14,175 $87.2 $24.2$928,949Total
Masters(02) Science 41 308 308 308 0.1 $4,712 $116.1 $15.3$4,712(06) Engineering 4,004 30,671 30,671 30,671 9.4 $1,376,860 $343.9 $44.9$1,376,860
4,045 30,979 30,979 30,979 9.4 0.1 $1,376,860 $4,712 $341.6 $44.6$1,381,573Total
Doctoral(02) Science 9 194 194 194 0.1 $2,938 $329.7 $15.1$2,938(06) Engineering 2,050 35,547 35,547 1,023 34,524 9.9 $1,583,999 $772.7 $45.9$1,583,999
2,059 35,741 35,741 1,023 34,718 9.9 0.1 $1,583,999 $2,938 $770.8 $45.7$1,586,936Total
Budgeted, Not TeachingBudgeted, Not Teach 0.3 10.3 $47,250 $421,425 $468,675
0.3 10.3 $47,250 $421,425 $468,675TotalPETE 16,762 4,002 31,798 30,979 35,741 102,520 2,524 1,023 104,022 26.7 10.9 $3,922,883 $443,250 $260.5 $42.0$4,366,133Total
Prepared by Office of Institutional Studies and Planning, 28-Oct-14, 08:15 AM Section VII. Page 48 of 96
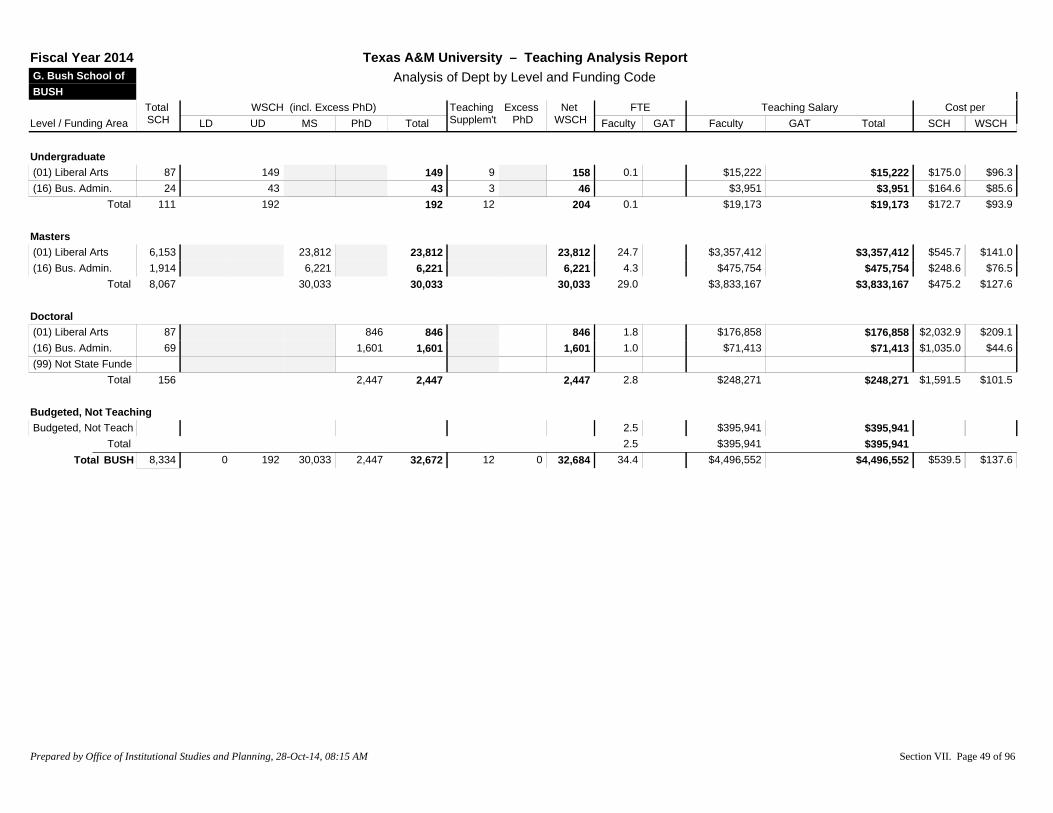
Level / Funding AreaTotal SCH LD UD MS PhD Total
Teaching Supplem't
Excess PhD
Net WSCH
FTEGAT
Teaching SalaryGAT
WSCH (incl. Excess PhD)Faculty Faculty
Cost perWSCHSCHTotal
G. Bush School of BUSH
Texas A&M University – Teaching Analysis ReportAnalysis of Dept by Level and Funding Code
Fiscal Year 2014
Undergraduate(01) Liberal Arts 87 149 149 9 158 0.1 $15,222 $175.0 $96.3$15,222(16) Bus. Admin. 24 43 43 3 46 $3,951 $164.6 $85.6$3,951
111 192 192 12 204 0.1 $19,173 $172.7 $93.9$19,173Total
Masters(01) Liberal Arts 6,153 23,812 23,812 23,812 24.7 $3,357,412 $545.7 $141.0$3,357,412(16) Bus. Admin. 1,914 6,221 6,221 6,221 4.3 $475,754 $248.6 $76.5$475,754
8,067 30,033 30,033 30,033 29.0 $3,833,167 $475.2 $127.6$3,833,167Total
Doctoral(01) Liberal Arts 87 846 846 846 1.8 $176,858 $2,032.9 $209.1$176,858(16) Bus. Admin. 69 1,601 1,601 1,601 1.0 $71,413 $1,035.0 $44.6$71,413(99) Not State Funde
156 2,447 2,447 2,447 2.8 $248,271 $1,591.5 $101.5$248,271Total
Budgeted, Not TeachingBudgeted, Not Teach 2.5 $395,941 $395,941
2.5 $395,941 $395,941TotalBUSH 8,334 0 192 30,033 2,447 32,672 12 0 32,684 34.4 $4,496,552 $539.5 $137.6$4,496,552Total
Prepared by Office of Institutional Studies and Planning, 28-Oct-14, 08:15 AM Section VII. Page 49 of 96

Level / Funding AreaTotal SCH LD UD MS PhD Total
Teaching Supplem't
Excess PhD
Net WSCH
FTEGAT
Teaching SalaryGAT
WSCH (incl. Excess PhD)Faculty Faculty
Cost perWSCHSCHTotal
Geosciences 3614
Texas A&M University – Teaching Analysis ReportAnalysis of Dept by Level and Funding Code
Fiscal Year 2014
Prepared by Office of Institutional Studies and Planning, 28-Oct-14, 08:15 AM Section VII. Page 50 of 96

Level / Funding AreaTotal SCH LD UD MS PhD Total
Teaching Supplem't
Excess PhD
Net WSCH
FTEGAT
Teaching SalaryGAT
WSCH (incl. Excess PhD)Faculty Faculty
Cost perWSCHSCHTotal
Geosciences 3614
Texas A&M University – Teaching Analysis ReportAnalysis of Dept by Level and Funding Code
Fiscal Year 2014
Budgeted, Not TeachingBudgeted, Not Teach 0.1 $14,538 $14,538
0.1 $14,538 $14,538Total3614 0.1 $14,538 $14,538Total
Prepared by Office of Institutional Studies and Planning, 28-Oct-14, 08:15 AM Section VII. Page 51 of 96

Level / Funding AreaTotal SCH LD UD MS PhD Total
Teaching Supplem't
Excess PhD
Net WSCH
FTEGAT
Teaching SalaryGAT
WSCH (incl. Excess PhD)Faculty Faculty
Cost perWSCHSCHTotal
Geosciences ATMO
Texas A&M University – Teaching Analysis ReportAnalysis of Dept by Level and Funding Code
Fiscal Year 2014
Undergraduate(02) Science 4,746 5,801 4,424 10,225 864 11,089 4.9 0.4 $574,701 $18,001 $124.9 $53.4$592,702(03) Fine Art 20 49 49 49 0.1 $7,978 $398.9 $164.2$7,978
4,766 5,801 4,473 10,274 864 11,138 5.0 0.4 $582,679 $18,001 $126.0 $53.9$600,680Total
Masters(02) Science 607 4,607 4,607 4,607 4.1 $468,103 $771.2 $101.6$468,103
607 4,607 4,607 4,607 4.1 $468,103 $771.2 $101.6$468,103Total
Doctoral(02) Science 575 12,547 12,547 851 11,696 5.6 $743,003 $1,292.2 $63.5$743,003
575 12,547 12,547 851 11,696 5.6 $743,003 $1,292.2 $63.5$743,003Total
Budgeted, Not TeachingBudgeted, Not Teach 0.4 2.3 $58,919 $111,084 $170,003
0.4 2.3 $58,919 $111,084 $170,003TotalATMO 5,948 5,801 4,473 4,607 12,547 27,428 864 851 27,441 15.1 2.7 $1,852,704 $129,085 $333.2 $72.2$1,981,789Total
Prepared by Office of Institutional Studies and Planning, 28-Oct-14, 08:15 AM Section VII. Page 52 of 96
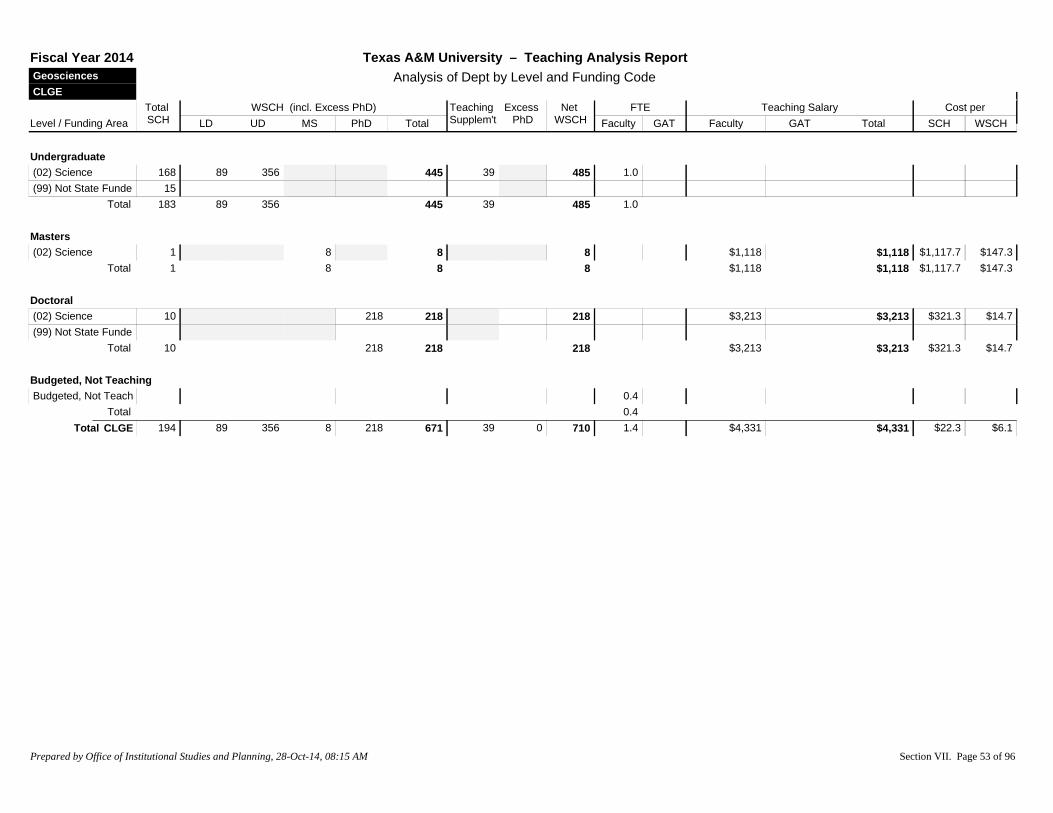
Level / Funding AreaTotal SCH LD UD MS PhD Total
Teaching Supplem't
Excess PhD
Net WSCH
FTEGAT
Teaching SalaryGAT
WSCH (incl. Excess PhD)Faculty Faculty
Cost perWSCHSCHTotal
Geosciences CLGE
Texas A&M University – Teaching Analysis ReportAnalysis of Dept by Level and Funding Code
Fiscal Year 2014
Undergraduate(02) Science 168 89 356 445 39 485 1.0(99) Not State Funde 15
183 89 356 445 39 485 1.0Total
Masters(02) Science 1 8 8 8 $1,118 $1,117.7 $147.3$1,118
1 8 8 8 $1,118 $1,117.7 $147.3$1,118Total
Doctoral(02) Science 10 218 218 218 $3,213 $321.3 $14.7$3,213(99) Not State Funde
10 218 218 218 $3,213 $321.3 $14.7$3,213Total
Budgeted, Not TeachingBudgeted, Not Teach 0.4
0.4TotalCLGE 194 89 356 8 218 671 39 0 710 1.4 $4,331 $22.3 $6.1$4,331Total
Prepared by Office of Institutional Studies and Planning, 28-Oct-14, 08:15 AM Section VII. Page 53 of 96
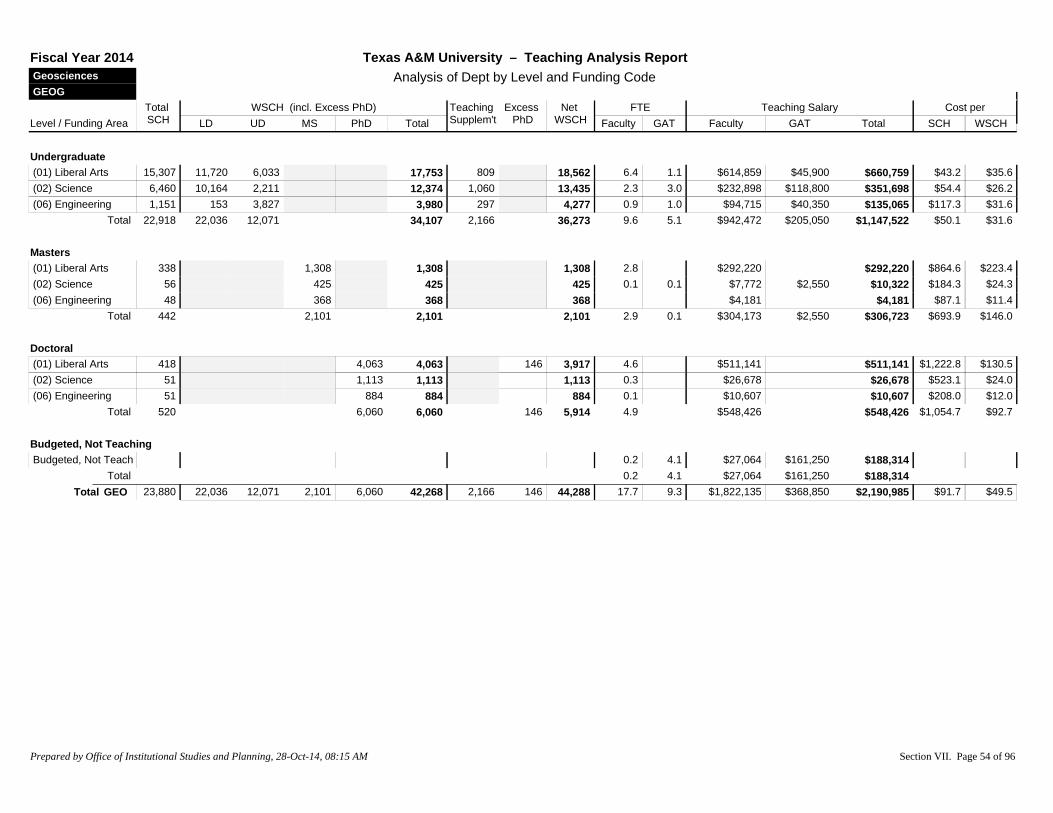
Level / Funding AreaTotal SCH LD UD MS PhD Total
Teaching Supplem't
Excess PhD
Net WSCH
FTEGAT
Teaching SalaryGAT
WSCH (incl. Excess PhD)Faculty Faculty
Cost perWSCHSCHTotal
Geosciences GEOG
Texas A&M University – Teaching Analysis ReportAnalysis of Dept by Level and Funding Code
Fiscal Year 2014
Undergraduate(01) Liberal Arts 15,307 11,720 6,033 17,753 809 18,562 6.4 1.1 $614,859 $45,900 $43.2 $35.6$660,759(02) Science 6,460 10,164 2,211 12,374 1,060 13,435 2.3 3.0 $232,898 $118,800 $54.4 $26.2$351,698(06) Engineering 1,151 153 3,827 3,980 297 4,277 0.9 1.0 $94,715 $40,350 $117.3 $31.6$135,065
22,918 22,036 12,071 34,107 2,166 36,273 9.6 5.1 $942,472 $205,050 $50.1 $31.6$1,147,522Total
Masters(01) Liberal Arts 338 1,308 1,308 1,308 2.8 $292,220 $864.6 $223.4$292,220(02) Science 56 425 425 425 0.1 0.1 $7,772 $2,550 $184.3 $24.3$10,322(06) Engineering 48 368 368 368 $4,181 $87.1 $11.4$4,181
442 2,101 2,101 2,101 2.9 0.1 $304,173 $2,550 $693.9 $146.0$306,723Total
Doctoral(01) Liberal Arts 418 4,063 4,063 146 3,917 4.6 $511,141 $1,222.8 $130.5$511,141(02) Science 51 1,113 1,113 1,113 0.3 $26,678 $523.1 $24.0$26,678(06) Engineering 51 884 884 884 0.1 $10,607 $208.0 $12.0$10,607
520 6,060 6,060 146 5,914 4.9 $548,426 $1,054.7 $92.7$548,426Total
Budgeted, Not TeachingBudgeted, Not Teach 0.2 4.1 $27,064 $161,250 $188,314
0.2 4.1 $27,064 $161,250 $188,314TotalGEO 23,880 22,036 12,071 2,101 6,060 42,268 2,166 146 44,288 17.7 9.3 $1,822,135 $368,850 $91.7 $49.5$2,190,985Total
Prepared by Office of Institutional Studies and Planning, 28-Oct-14, 08:15 AM Section VII. Page 54 of 96

Level / Funding AreaTotal SCH LD UD MS PhD Total
Teaching Supplem't
Excess PhD
Net WSCH
FTEGAT
Teaching SalaryGAT
WSCH (incl. Excess PhD)Faculty Faculty
Cost perWSCHSCHTotal
Geosciences GEPL
Texas A&M University – Teaching Analysis ReportAnalysis of Dept by Level and Funding Code
Fiscal Year 2014
Undergraduate(02) Science 15,310 18,729 14,123 32,852 1,875 34,727 9.6 18.3 $918,707 $726,412 $107.5 $47.4$1,645,120
15,310 18,729 14,123 32,852 1,875 34,727 9.6 18.3 $918,707 $726,412 $107.5 $47.4$1,645,120Total
Masters(02) Science 1,336 10,143 10,143 10,143 5.8 0.2 $667,955 $8,059 $505.8 $66.6$676,013
1,336 10,143 10,143 10,143 5.8 0.2 $667,955 $8,059 $505.8 $66.6$676,013Total
Doctoral(02) Science 1,108 24,179 24,179 1,135 23,044 7.9 0.1 $879,849 $3,079 $796.8 $38.3$882,928
1,108 24,179 24,179 1,135 23,044 7.9 0.1 $879,849 $3,079 $796.8 $38.3$882,928Total
Budgeted, Not TeachingBudgeted, Not Teach 1.2 1.7 $197,008 $90,338 $287,346
1.2 1.7 $197,008 $90,338 $287,346TotalGEPL 17,755 18,729 14,123 10,143 24,179 67,174 1,875 1,135 67,914 24.5 20.3 $2,663,519 $827,888 $196.6 $51.4$3,491,407Total
Prepared by Office of Institutional Studies and Planning, 28-Oct-14, 08:15 AM Section VII. Page 55 of 96

Level / Funding AreaTotal SCH LD UD MS PhD Total
Teaching Supplem't
Excess PhD
Net WSCH
FTEGAT
Teaching SalaryGAT
WSCH (incl. Excess PhD)Faculty Faculty
Cost perWSCHSCHTotal
Geosciences OCNG
Texas A&M University – Teaching Analysis ReportAnalysis of Dept by Level and Funding Code
Fiscal Year 2014
Undergraduate(02) Science 8,028 12,284 3,337 15,621 1,177 16,798 7.4 1.8 $911,201 $84,750 $124.1 $59.3$995,951
8,028 12,284 3,337 15,621 1,177 16,798 7.4 1.8 $911,201 $84,750 $124.1 $59.3$995,951Total
Masters(02) Science 608 4,615 4,615 4,615 3.7 $433,773 $713.4 $94.0$433,773
608 4,615 4,615 4,615 3.7 $433,773 $713.4 $94.0$433,773Total
Doctoral(02) Science 569 12,416 12,416 698 11,717 6.2 $685,080 $1,204.0 $58.5$685,080
569 12,416 12,416 698 11,717 6.2 $685,080 $1,204.0 $58.5$685,080Total
Budgeted, Not TeachingBudgeted, Not Teach 0.8 4.1 $86,200 $197,325 $283,525
0.8 4.1 $86,200 $197,325 $283,525TotalOCN 9,205 12,284 3,337 4,615 12,416 32,651 1,177 698 33,130 18.1 5.9 $2,116,254 $282,075 $260.5 $72.4$2,398,329Total
Prepared by Office of Institutional Studies and Planning, 28-Oct-14, 08:15 AM Section VII. Page 56 of 96
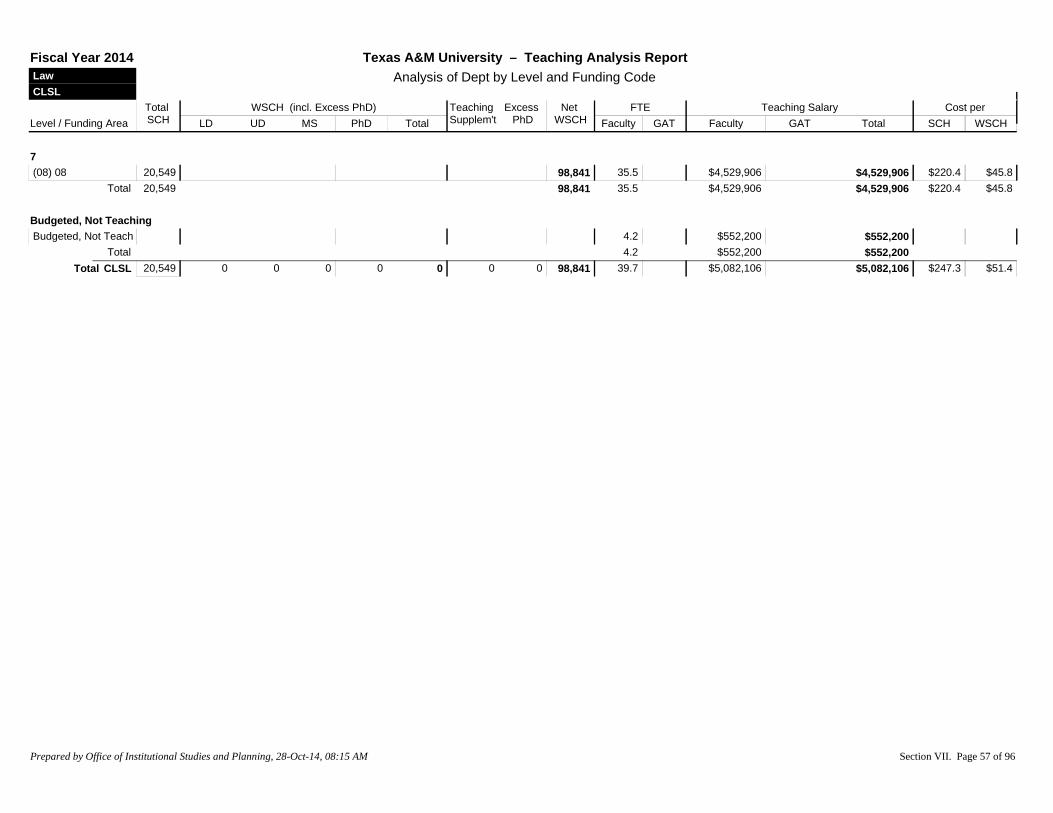
Level / Funding AreaTotal SCH LD UD MS PhD Total
Teaching Supplem't
Excess PhD
Net WSCH
FTEGAT
Teaching SalaryGAT
WSCH (incl. Excess PhD)Faculty Faculty
Cost perWSCHSCHTotal
Law CLSL
Texas A&M University – Teaching Analysis ReportAnalysis of Dept by Level and Funding Code
Fiscal Year 2014
7(08) 08 20,549 98,841 35.5 $4,529,906 $220.4 $45.8$4,529,906
20,549 98,841 35.5 $4,529,906 $220.4 $45.8$4,529,906Total
Budgeted, Not TeachingBudgeted, Not Teach 4.2 $552,200 $552,200
4.2 $552,200 $552,200TotalCLSL 20,549 0 0 0 0 0 0 0 98,841 39.7 $5,082,106 $247.3 $51.4$5,082,106Total
Prepared by Office of Institutional Studies and Planning, 28-Oct-14, 08:15 AM Section VII. Page 57 of 96

Level / Funding AreaTotal SCH LD UD MS PhD Total
Teaching Supplem't
Excess PhD
Net WSCH
FTEGAT
Teaching SalaryGAT
WSCH (incl. Excess PhD)Faculty Faculty
Cost perWSCHSCHTotal
Liberal Arts ANTH
Texas A&M University – Teaching Analysis ReportAnalysis of Dept by Level and Funding Code
Fiscal Year 2014
Prepared by Office of Institutional Studies and Planning, 28-Oct-14, 08:15 AM Section VII. Page 58 of 96

Level / Funding AreaTotal SCH LD UD MS PhD Total
Teaching Supplem't
Excess PhD
Net WSCH
FTEGAT
Teaching SalaryGAT
WSCH (incl. Excess PhD)Faculty Faculty
Cost perWSCHSCHTotal
Liberal Arts ANTH
Texas A&M University – Teaching Analysis ReportAnalysis of Dept by Level and Funding Code
Fiscal Year 2014
Undergraduate(01) Liberal Arts 15,031 12,780 3,694 16,474 1,058 17,531 7.0 5.8 $662,363 $188,800 $56.6 $48.6$851,163(02) Science 2 6 6 1 7 0.1 $10,204 $5,102.2 $1,536.8$10,204(06) Engineering 6 7 11 18 2 20 $823 $137.2 $41.3$823
15,039 12,787 3,710 16,498 1,060 17,558 7.1 5.8 $673,391 $188,800 $57.3 $49.1$862,191Total
Masters(01) Liberal Arts 478 1,850 1,850 1,850 3.6 $335,537 $702.0 $181.4$335,537(02) Science 28 213 213 213 0.1 $10,271 $366.8 $48.3$10,271(06) Engineering 15 115 115 115 0.1 $5,218 $347.9 $45.4$5,218
521 2,177 2,177 2,177 3.7 $351,026 $673.8 $161.2$351,026Total
Doctoral(01) Liberal Arts 787 7,650 7,650 39 7,611 8.7 $891,928 $1,133.3 $117.2$891,928(02) Science 8 175 175 175 0.1 $8,437 $1,054.6 $48.3$8,437
795 7,824 7,824 39 7,785 8.7 $900,364 $1,132.5 $115.6$900,364Total
Budgeted, Not TeachingBudgeted, Not Teach 6.2 $199,001 $199,001
6.2 $199,001 $199,001TotalANTH 16,355 12,787 3,710 2,177 7,824 26,499 1,060 39 27,520 19.5 12.0 $1,924,781 $387,801 $141.4 $84.0$2,312,582Total
Prepared by Office of Institutional Studies and Planning, 28-Oct-14, 08:15 AM Section VII. Page 59 of 96
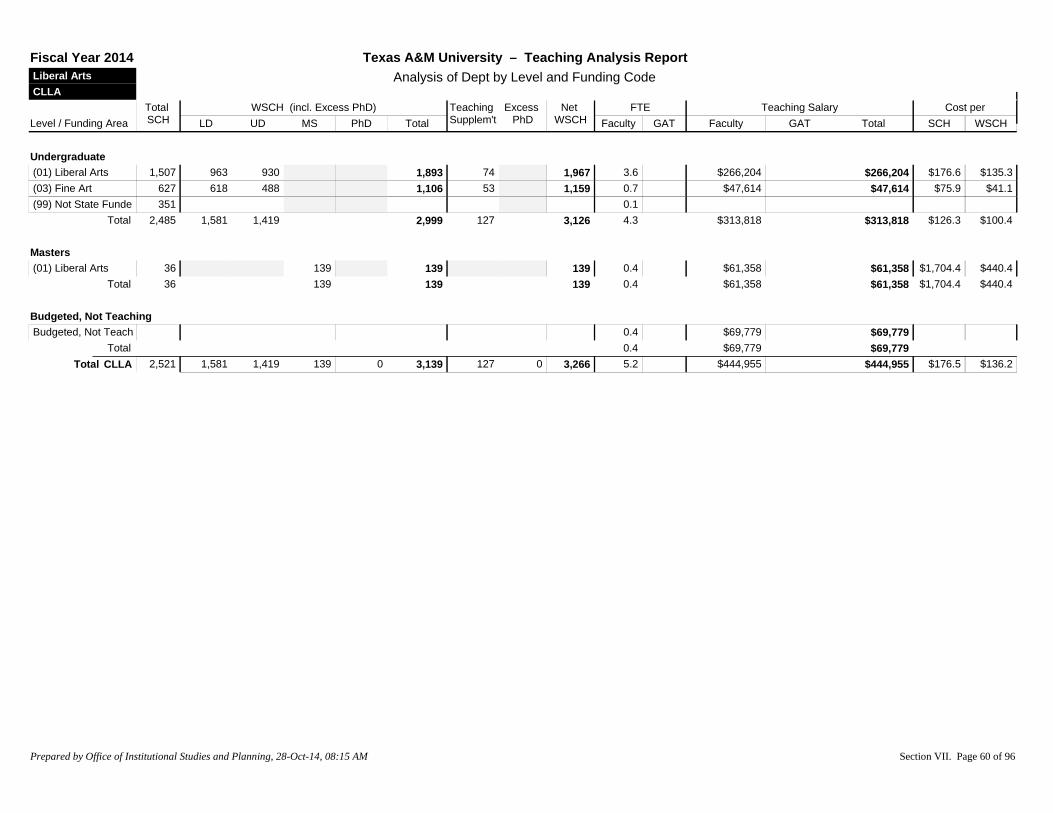
Level / Funding AreaTotal SCH LD UD MS PhD Total
Teaching Supplem't
Excess PhD
Net WSCH
FTEGAT
Teaching SalaryGAT
WSCH (incl. Excess PhD)Faculty Faculty
Cost perWSCHSCHTotal
Liberal Arts CLLA
Texas A&M University – Teaching Analysis ReportAnalysis of Dept by Level and Funding Code
Fiscal Year 2014
Undergraduate(01) Liberal Arts 1,507 963 930 1,893 74 1,967 3.6 $266,204 $176.6 $135.3$266,204(03) Fine Art 627 618 488 1,106 53 1,159 0.7 $47,614 $75.9 $41.1$47,614(99) Not State Funde 351 0.1
2,485 1,581 1,419 2,999 127 3,126 4.3 $313,818 $126.3 $100.4$313,818Total
Masters(01) Liberal Arts 36 139 139 139 0.4 $61,358 $1,704.4 $440.4$61,358
36 139 139 139 0.4 $61,358 $1,704.4 $440.4$61,358Total
Budgeted, Not TeachingBudgeted, Not Teach 0.4 $69,779 $69,779
0.4 $69,779 $69,779TotalCLLA 2,521 1,581 1,419 139 0 3,139 127 0 3,266 5.2 $444,955 $176.5 $136.2$444,955Total
Prepared by Office of Institutional Studies and Planning, 28-Oct-14, 08:15 AM Section VII. Page 60 of 96

Level / Funding AreaTotal SCH LD UD MS PhD Total
Teaching Supplem't
Excess PhD
Net WSCH
FTEGAT
Teaching SalaryGAT
WSCH (incl. Excess PhD)Faculty Faculty
Cost perWSCHSCHTotal
Liberal Arts COMM
Texas A&M University – Teaching Analysis ReportAnalysis of Dept by Level and Funding Code
Fiscal Year 2014
Undergraduate(01) Liberal Arts 25,644 14,136 19,515 33,650 1,248 34,898 11.0 9.2 $937,413 $372,982 $51.1 $37.5$1,310,395(03) Fine Art 54 4 124 128 128 0.1 0.1 $6,781 $2,584 $173.4 $73.0$9,365(06) Engineering 223 770 770 770 0.1 $4,396 $19.7 $5.7$4,396
25,921 14,140 20,408 34,548 1,248 35,796 11.2 9.3 $948,590 $375,566 $51.1 $37.0$1,324,156Total
Masters(01) Liberal Arts 248 960 960 960 1.5 $173,324 $698.9 $180.6$173,324
248 960 960 960 1.5 $173,324 $698.9 $180.6$173,324Total
Doctoral(01) Liberal Arts 565 5,492 5,492 243 5,249 6.8 $739,817 $1,309.4 $140.9$739,817
565 5,492 5,492 243 5,249 6.8 $739,817 $1,309.4 $140.9$739,817Total
Budgeted, Not TeachingBudgeted, Not Teach 1.5 3.3 $178,934 $130,122 $309,056
1.5 3.3 $178,934 $130,122 $309,056TotalCOM 26,734 14,140 20,408 960 5,492 41,000 1,248 243 42,005 21.0 12.6 $2,040,665 $505,688 $95.2 $60.6$2,546,353Total
Prepared by Office of Institutional Studies and Planning, 28-Oct-14, 08:15 AM Section VII. Page 61 of 96

Level / Funding AreaTotal SCH LD UD MS PhD Total
Teaching Supplem't
Excess PhD
Net WSCH
FTEGAT
Teaching SalaryGAT
WSCH (incl. Excess PhD)Faculty Faculty
Cost perWSCHSCHTotal
Liberal Arts ECON
Texas A&M University – Teaching Analysis ReportAnalysis of Dept by Level and Funding Code
Fiscal Year 2014
Undergraduate(01) Liberal Arts 24,203 13,049 18,848 31,897 1,442 33,339 10.0 2.5 $1,431,600 $103,977 $63.4 $46.1$1,535,577
24,203 13,049 18,848 31,897 1,442 33,339 10.0 2.5 $1,431,600 $103,977 $63.4 $46.1$1,535,577Total
Masters(01) Liberal Arts 2,729 10,561 10,561 10,561 2.8 $488,825 $179.1 $46.3$488,825
2,729 10,561 10,561 10,561 2.8 $488,825 $179.1 $46.3$488,825Total
Doctoral(01) Liberal Arts 1,403 13,637 13,637 272 13,365 10.5 $2,244,830 $1,600.0 $168.0$2,244,830
1,403 13,637 13,637 272 13,365 10.5 $2,244,830 $1,600.0 $168.0$2,244,830Total
Budgeted, Not TeachingBudgeted, Not Teach 1.6 8.6 $266,440 $332,917 $599,357
1.6 8.6 $266,440 $332,917 $599,357TotalECON 28,335 13,049 18,848 10,561 13,637 56,095 1,442 272 57,265 24.9 11.1 $4,431,695 $436,894 $171.8 $85.0$4,868,589Total
Prepared by Office of Institutional Studies and Planning, 28-Oct-14, 08:15 AM Section VII. Page 62 of 96

Level / Funding AreaTotal SCH LD UD MS PhD Total
Teaching Supplem't
Excess PhD
Net WSCH
FTEGAT
Teaching SalaryGAT
WSCH (incl. Excess PhD)Faculty Faculty
Cost perWSCHSCHTotal
Liberal Arts ENGL
Texas A&M University – Teaching Analysis ReportAnalysis of Dept by Level and Funding Code
Fiscal Year 2014
Undergraduate(01) Liberal Arts 29,800 15,222 24,610 39,832 1,842 41,674 30.4 11.1 $2,904,070 $374,906 $110.0 $78.7$3,278,976(03) Fine Art 273 104 488 593 59 652 0.5 $62,573 $229.2 $96.0$62,573(04) Teacher Educ. 540 133 856 989 99 1,088 0.6 $66,214 $122.6 $60.8$66,214
30,613 15,459 25,955 41,414 2,000 43,414 31.4 11.1 $3,032,856 $374,906 $111.3 $78.5$3,407,762Total
Masters(01) Liberal Arts 342 1,324 1,324 1,324 1.6 $190,218 $556.2 $143.7$190,218(03) Fine Art 24 133 133 133 0.1 $5,591 $232.9 $42.0$5,591
366 1,457 1,457 1,457 1.6 $195,809 $535.0 $134.4$195,809Total
Doctoral(01) Liberal Arts 806 7,834 7,834 175 7,659 10.7 $1,273,129 $1,579.6 $166.2$1,273,129(03) Fine Art 21 160 160 160 0.1 $6,649 $316.6 $41.4$6,649
827 7,995 7,995 175 7,820 10.8 $1,279,778 $1,547.5 $163.7$1,279,778Total
Budgeted, Not TeachingBudgeted, Not Teach 2.9 4.9 $392,218 $140,221 $532,439
2.9 4.9 $392,218 $140,221 $532,439TotalENGL 31,806 15,459 25,955 1,457 7,995 50,865 2,000 175 52,691 46.7 16.0 $4,900,661 $515,127 $170.3 $102.8$5,415,788Total
Prepared by Office of Institutional Studies and Planning, 28-Oct-14, 08:15 AM Section VII. Page 63 of 96

Level / Funding AreaTotal SCH LD UD MS PhD Total
Teaching Supplem't
Excess PhD
Net WSCH
FTEGAT
Teaching SalaryGAT
WSCH (incl. Excess PhD)Faculty Faculty
Cost perWSCHSCHTotal
Liberal Arts HISP
Texas A&M University – Teaching Analysis ReportAnalysis of Dept by Level and Funding Code
Fiscal Year 2014
Undergraduate(01) Liberal Arts 9,335 6,550 4,684 11,234 586 11,819 10.0 4.8 $1,027,513 $182,640 $129.6 $102.4$1,210,153(03) Fine Art 69 13 139 152 15 167 0.1 $7,629 $110.6 $45.8$7,629
9,404 6,563 4,822 11,385 601 11,986 10.1 4.8 $1,035,142 $182,640 $129.5 $101.6$1,217,782Total
Masters(01) Liberal Arts 119 461 461 461 0.4 $43,817 $368.2 $95.1$43,817
119 461 461 461 0.4 $43,817 $368.2 $95.1$43,817Total
Doctoral(01) Liberal Arts 374 3,635 3,635 3,635 4.8 $553,205 $1,479.2 $152.2$553,205
374 3,635 3,635 3,635 4.8 $553,205 $1,479.2 $152.2$553,205Total
Budgeted, Not TeachingBudgeted, Not Teach 0.7 0.4 $59,474 $14,002 $73,476
0.7 0.4 $59,474 $14,002 $73,476TotalHISP 9,897 6,563 4,822 461 3,635 15,481 601 0 16,082 15.9 5.2 $1,691,638 $196,642 $190.8 $117.4$1,888,280Total
Prepared by Office of Institutional Studies and Planning, 28-Oct-14, 08:15 AM Section VII. Page 64 of 96

Level / Funding AreaTotal SCH LD UD MS PhD Total
Teaching Supplem't
Excess PhD
Net WSCH
FTEGAT
Teaching SalaryGAT
WSCH (incl. Excess PhD)Faculty Faculty
Cost perWSCHSCHTotal
Liberal Arts HIST
Texas A&M University – Teaching Analysis ReportAnalysis of Dept by Level and Funding Code
Fiscal Year 2014
Undergraduate(01) Liberal Arts 39,065 32,398 11,262 43,660 3,192 46,852 25.4 0.8 $2,430,913 $29,700 $63.0 $52.5$2,460,613(03) Fine Art 33 4 73 77 8 85 0.1 $4,463 $135.3 $52.5$4,463
39,098 32,402 11,335 43,737 3,200 46,937 25.4 0.8 $2,435,376 $29,700 $63.0 $52.5$2,465,076Total
Masters(01) Liberal Arts 185 716 716 716 1.5 $158,786 $858.3 $221.8$158,786
185 716 716 716 1.5 $158,786 $858.3 $221.8$158,786Total
Doctoral(01) Liberal Arts 673 6,542 6,542 107 6,435 9.2 $1,098,665 $1,632.5 $170.7$1,098,665
673 6,542 6,542 107 6,435 9.2 $1,098,665 $1,632.5 $170.7$1,098,665Total
Budgeted, Not TeachingBudgeted, Not Teach 1.4 9.0 $138,213 $309,450 $447,663
1.4 9.0 $138,213 $309,450 $447,663TotalHIST 39,956 32,402 11,335 716 6,542 50,995 3,200 107 54,088 37.6 9.7 $3,831,040 $339,150 $104.4 $77.1$4,170,190Total
Prepared by Office of Institutional Studies and Planning, 28-Oct-14, 08:15 AM Section VII. Page 65 of 96

Level / Funding AreaTotal SCH LD UD MS PhD Total
Teaching Supplem't
Excess PhD
Net WSCH
FTEGAT
Teaching SalaryGAT
WSCH (incl. Excess PhD)Faculty Faculty
Cost perWSCHSCHTotal
Liberal Arts INTS
Texas A&M University – Teaching Analysis ReportAnalysis of Dept by Level and Funding Code
Fiscal Year 2014
Undergraduate(01) Liberal Arts 14,374 10,344 6,819 17,163 700 17,864 23.9 0.2 $1,764,771 $6,000 $123.2 $99.1$1,770,771(03) Fine Art 192 26 423 449 45 494 0.4 $72,994 $380.2 $147.8$72,994
14,566 10,370 7,242 17,612 745 18,358 24.4 0.2 $1,837,766 $6,000 $126.6 $100.4$1,843,766Total
Masters(01) Liberal Arts 27 104 104 104 0.1 $5,250 $194.4 $50.2$5,250
27 104 104 104 0.1 $5,250 $194.4 $50.2$5,250Total
Budgeted, Not TeachingBudgeted, Not Teach 1.5 0.2 $203,162 $6,000 $209,162
1.5 0.2 $203,162 $6,000 $209,162TotalINTS 14,593 10,370 7,242 104 0 17,717 745 0 18,462 26.0 0.4 $2,046,178 $12,000 $141.0 $111.5$2,058,178Total
Prepared by Office of Institutional Studies and Planning, 28-Oct-14, 08:15 AM Section VII. Page 66 of 96
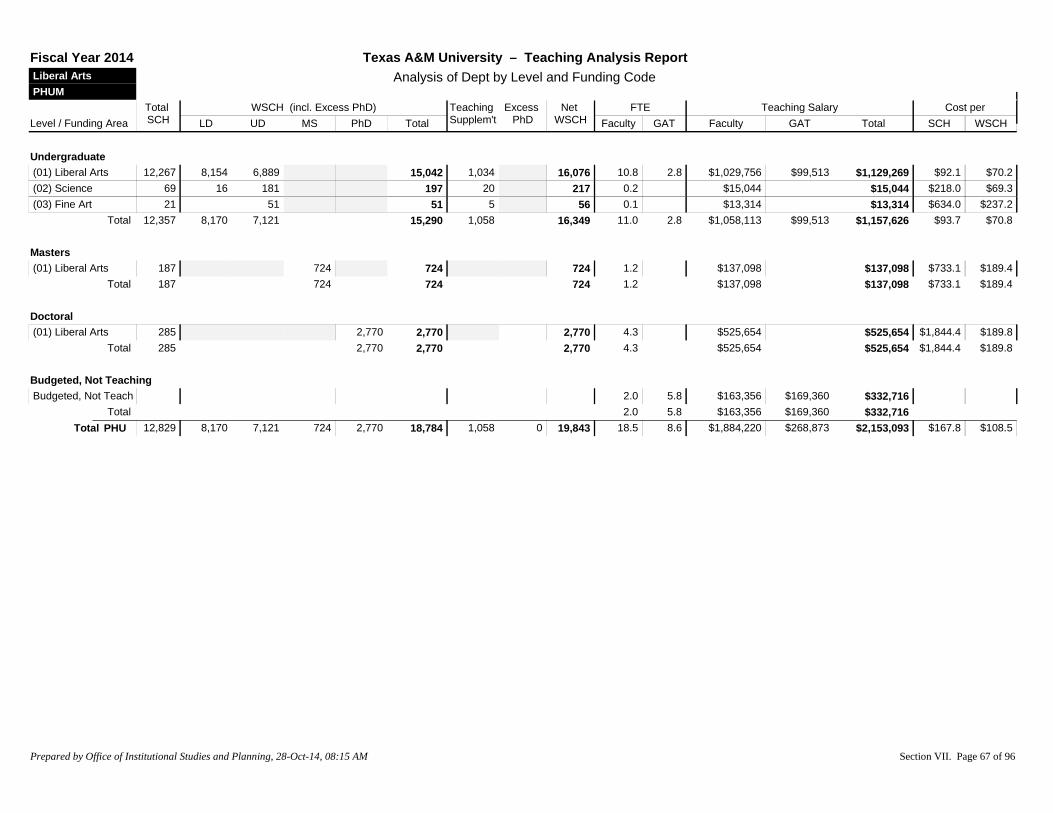
Level / Funding AreaTotal SCH LD UD MS PhD Total
Teaching Supplem't
Excess PhD
Net WSCH
FTEGAT
Teaching SalaryGAT
WSCH (incl. Excess PhD)Faculty Faculty
Cost perWSCHSCHTotal
Liberal Arts PHUM
Texas A&M University – Teaching Analysis ReportAnalysis of Dept by Level and Funding Code
Fiscal Year 2014
Undergraduate(01) Liberal Arts 12,267 8,154 6,889 15,042 1,034 16,076 10.8 2.8 $1,029,756 $99,513 $92.1 $70.2$1,129,269(02) Science 69 16 181 197 20 217 0.2 $15,044 $218.0 $69.3$15,044(03) Fine Art 21 51 51 5 56 0.1 $13,314 $634.0 $237.2$13,314
12,357 8,170 7,121 15,290 1,058 16,349 11.0 2.8 $1,058,113 $99,513 $93.7 $70.8$1,157,626Total
Masters(01) Liberal Arts 187 724 724 724 1.2 $137,098 $733.1 $189.4$137,098
187 724 724 724 1.2 $137,098 $733.1 $189.4$137,098Total
Doctoral(01) Liberal Arts 285 2,770 2,770 2,770 4.3 $525,654 $1,844.4 $189.8$525,654
285 2,770 2,770 2,770 4.3 $525,654 $1,844.4 $189.8$525,654Total
Budgeted, Not TeachingBudgeted, Not Teach 2.0 5.8 $163,356 $169,360 $332,716
2.0 5.8 $163,356 $169,360 $332,716TotalPHU 12,829 8,170 7,121 724 2,770 18,784 1,058 0 19,843 18.5 8.6 $1,884,220 $268,873 $167.8 $108.5$2,153,093Total
Prepared by Office of Institutional Studies and Planning, 28-Oct-14, 08:15 AM Section VII. Page 67 of 96
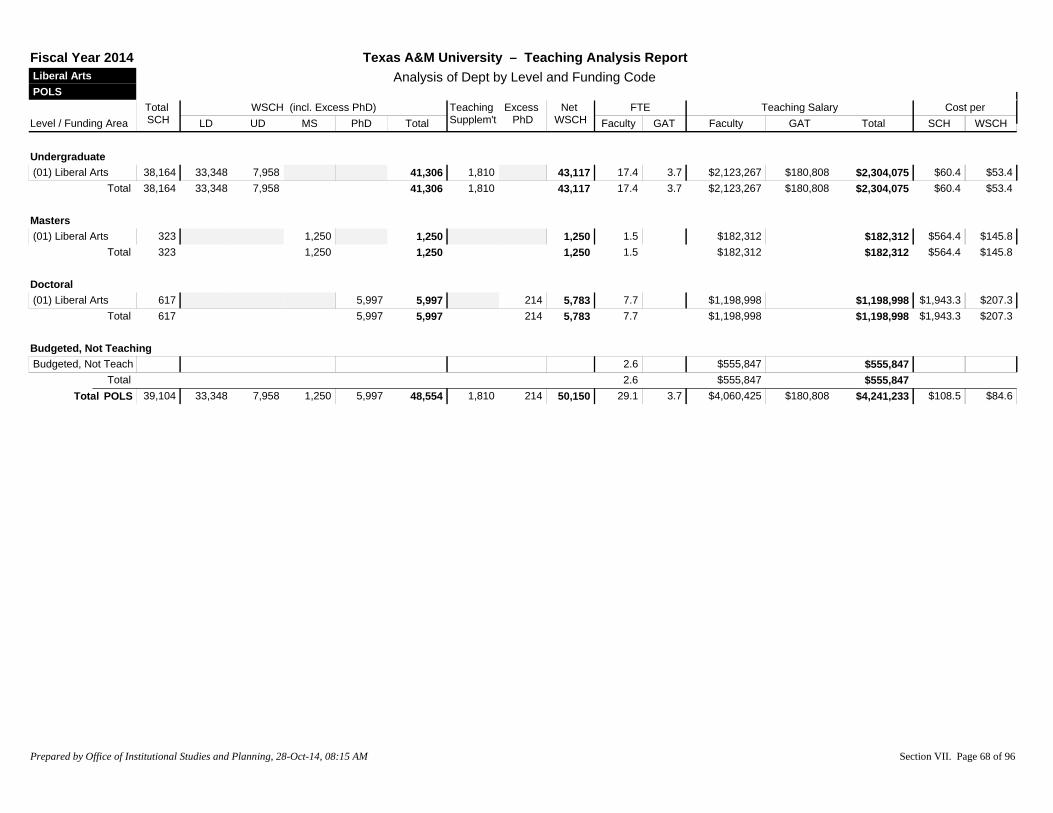
Level / Funding AreaTotal SCH LD UD MS PhD Total
Teaching Supplem't
Excess PhD
Net WSCH
FTEGAT
Teaching SalaryGAT
WSCH (incl. Excess PhD)Faculty Faculty
Cost perWSCHSCHTotal
Liberal Arts POLS
Texas A&M University – Teaching Analysis ReportAnalysis of Dept by Level and Funding Code
Fiscal Year 2014
Undergraduate(01) Liberal Arts 38,164 33,348 7,958 41,306 1,810 43,117 17.4 3.7 $2,123,267 $180,808 $60.4 $53.4$2,304,075
38,164 33,348 7,958 41,306 1,810 43,117 17.4 3.7 $2,123,267 $180,808 $60.4 $53.4$2,304,075Total
Masters(01) Liberal Arts 323 1,250 1,250 1,250 1.5 $182,312 $564.4 $145.8$182,312
323 1,250 1,250 1,250 1.5 $182,312 $564.4 $145.8$182,312Total
Doctoral(01) Liberal Arts 617 5,997 5,997 214 5,783 7.7 $1,198,998 $1,943.3 $207.3$1,198,998
617 5,997 5,997 214 5,783 7.7 $1,198,998 $1,943.3 $207.3$1,198,998Total
Budgeted, Not TeachingBudgeted, Not Teach 2.6 $555,847 $555,847
2.6 $555,847 $555,847TotalPOLS 39,104 33,348 7,958 1,250 5,997 48,554 1,810 214 50,150 29.1 3.7 $4,060,425 $180,808 $108.5 $84.6$4,241,233Total
Prepared by Office of Institutional Studies and Planning, 28-Oct-14, 08:15 AM Section VII. Page 68 of 96

Level / Funding AreaTotal SCH LD UD MS PhD Total
Teaching Supplem't
Excess PhD
Net WSCH
FTEGAT
Teaching SalaryGAT
WSCH (incl. Excess PhD)Faculty Faculty
Cost perWSCHSCHTotal
Liberal Arts PRFM
Texas A&M University – Teaching Analysis ReportAnalysis of Dept by Level and Funding Code
Fiscal Year 2014
Undergraduate(01) Liberal Arts 93 81 21 102 8 110 0.5 $56,109 $603.3 $511.1$56,109(03) Fine Art 29,319 39,521 4,933 44,454 458 44,912 19.4 $1,168,761 $39.9 $26.0$1,168,761(07) Home Economic 525 541 541 541 0.4 $28,484 $54.3 $52.7$28,484
29,937 40,143 4,953 45,096 467 45,563 20.4 $1,253,354 $41.9 $27.5$1,253,354Total
Masters(03) Fine Art 147 816 816 816 1.2 $152,258 $1,035.8 $186.6$152,258
147 816 816 816 1.2 $152,258 $1,035.8 $186.6$152,258Total
Doctoral(01) Liberal Arts 3 29 29 29 0.1 $8,170 $2,723.3 $280.2$8,170(03) Fine Art 18 138 138 138 0.1 $13,932 $774.0 $101.3$13,932
21 167 167 167 0.2 $22,102 $1,052.5 $132.6$22,102Total
Budgeted, Not TeachingBudgeted, Not Teach 2.0 3.4 $204,924 $103,500 $308,424
2.0 3.4 $204,924 $103,500 $308,424TotalPRFM 30,105 40,143 4,953 816 167 46,079 467 0 46,545 23.8 3.4 $1,632,638 $103,500 $57.7 $37.3$1,736,138Total
Prepared by Office of Institutional Studies and Planning, 28-Oct-14, 08:15 AM Section VII. Page 69 of 96

Level / Funding AreaTotal SCH LD UD MS PhD Total
Teaching Supplem't
Excess PhD
Net WSCH
FTEGAT
Teaching SalaryGAT
WSCH (incl. Excess PhD)Faculty Faculty
Cost perWSCHSCHTotal
Liberal Arts PSYC
Texas A&M University – Teaching Analysis ReportAnalysis of Dept by Level and Funding Code
Fiscal Year 2014
Undergraduate(01) Liberal Arts 34,070 20,921 22,235 43,156 1,971 45,127 18.3 15.3 $1,762,771 $480,380 $65.8 $49.7$2,243,151(02) Science 3,595 182 10,513 10,694 838 11,532 2.7 $344,972 $96.0 $29.9$344,972(04) Teacher Educ. 678 262 958 1,220 122 1,342 0.2 $22,674 $33.4 $16.9$22,674(16) Bus. Admin. 60 21 76 97 10 107 0.1 $7,882 $131.4 $73.8$7,882
38,403 21,385 33,782 55,167 2,940 58,108 21.2 15.3 $2,138,300 $480,380 $68.2 $45.1$2,618,680Total
Masters(01) Liberal Arts 474 1,834 1,834 1,834 2.2 $223,104 $470.7 $121.6$223,104(02) Science 99 748 748 748 0.4 $73,029 $741.4 $97.7$73,029(07) Home Economic 6 19 19 19 $2,501 $416.9 $134.9$2,501(16) Bus. Admin. 15 49 49 49 $807 $53.8 $16.6$807
594 2,649 2,649 2,649 2.6 $299,442 $504.5 $113.0$299,442Total
Doctoral(01) Liberal Arts 1,257 12,218 12,218 428 11,790 12.8 $1,505,421 $1,197.6 $127.7$1,505,421(02) Science 258 5,630 5,630 5,630 2.2 $181,691 $704.2 $32.3$181,691(07) Home Economic 12 100 100 100 0.1 $13,550 $1,129.2 $134.9$13,550(16) Bus. Admin. 12 279 279 279 $4,612 $384.4 $16.6$4,612
1,539 18,227 18,227 428 17,799 15.1 $1,705,275 $1,108.0 $95.8$1,705,275Total
Budgeted, Not TeachingBudgeted, Not Teach 0.8 7.6 $111,672 $219,783 $331,455
0.8 7.6 $111,672 $219,783 $331,455TotalPSYC 40,536 21,385 33,782 2,649 18,227 76,043 2,940 428 78,556 39.7 22.9 $4,254,688 $700,163 $122.2 $63.1$4,954,851Total
Prepared by Office of Institutional Studies and Planning, 28-Oct-14, 08:15 AM Section VII. Page 70 of 96
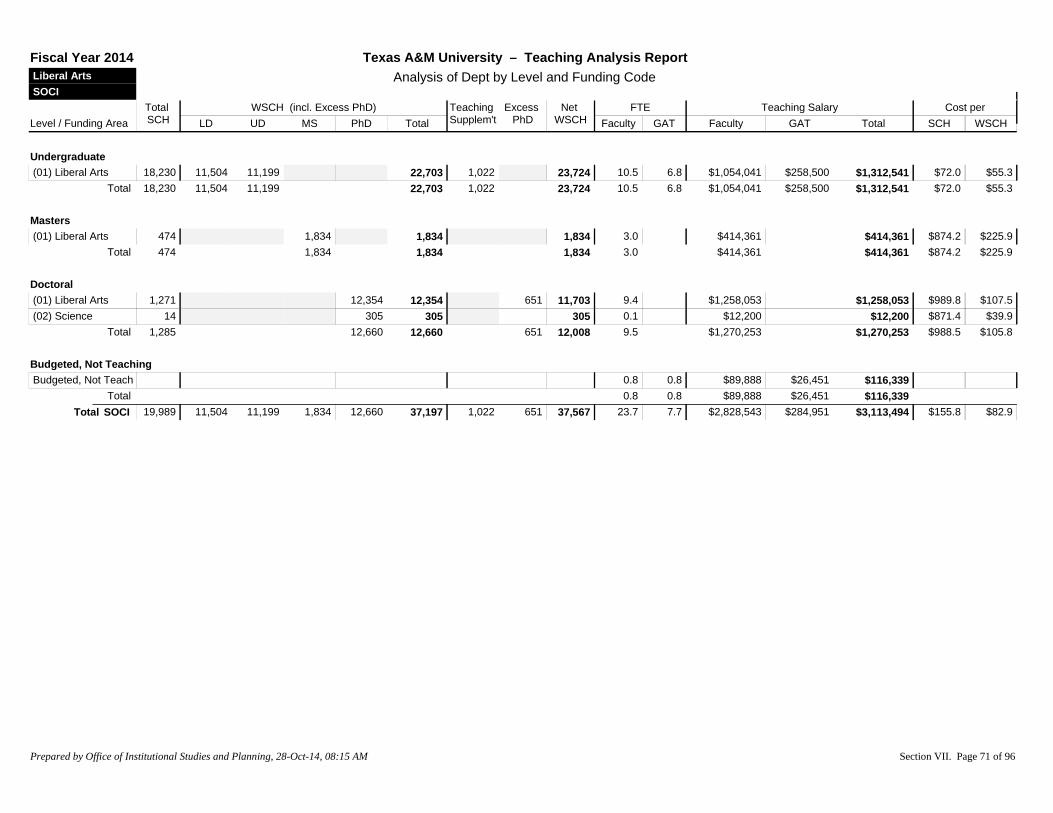
Level / Funding AreaTotal SCH LD UD MS PhD Total
Teaching Supplem't
Excess PhD
Net WSCH
FTEGAT
Teaching SalaryGAT
WSCH (incl. Excess PhD)Faculty Faculty
Cost perWSCHSCHTotal
Liberal Arts SOCI
Texas A&M University – Teaching Analysis ReportAnalysis of Dept by Level and Funding Code
Fiscal Year 2014
Undergraduate(01) Liberal Arts 18,230 11,504 11,199 22,703 1,022 23,724 10.5 6.8 $1,054,041 $258,500 $72.0 $55.3$1,312,541
18,230 11,504 11,199 22,703 1,022 23,724 10.5 6.8 $1,054,041 $258,500 $72.0 $55.3$1,312,541Total
Masters(01) Liberal Arts 474 1,834 1,834 1,834 3.0 $414,361 $874.2 $225.9$414,361
474 1,834 1,834 1,834 3.0 $414,361 $874.2 $225.9$414,361Total
Doctoral(01) Liberal Arts 1,271 12,354 12,354 651 11,703 9.4 $1,258,053 $989.8 $107.5$1,258,053(02) Science 14 305 305 305 0.1 $12,200 $871.4 $39.9$12,200
1,285 12,660 12,660 651 12,008 9.5 $1,270,253 $988.5 $105.8$1,270,253Total
Budgeted, Not TeachingBudgeted, Not Teach 0.8 0.8 $89,888 $26,451 $116,339
0.8 0.8 $89,888 $26,451 $116,339TotalSOCI 19,989 11,504 11,199 1,834 12,660 37,197 1,022 651 37,567 23.7 7.7 $2,828,543 $284,951 $155.8 $82.9$3,113,494Total
Prepared by Office of Institutional Studies and Planning, 28-Oct-14, 08:15 AM Section VII. Page 71 of 96
Level / Funding AreaTotal SCH LD UD MS PhD Total
Teaching Supplem't
Excess PhD
Net WSCH
FTEGAT
Teaching SalaryGAT
WSCH (incl. Excess PhD)Faculty Faculty
Cost perWSCHSCHTotal
Non-Funded AERS
Texas A&M University – Teaching Analysis ReportAnalysis of Dept by Level and Funding Code
Fiscal Year 2014
Prepared by Office of Institutional Studies and Planning, 28-Oct-14, 08:15 AM Section VII. Page 72 of 96

Level / Funding AreaTotal SCH LD UD MS PhD Total
Teaching Supplem't
Excess PhD
Net WSCH
FTEGAT
Teaching SalaryGAT
WSCH (incl. Excess PhD)Faculty Faculty
Cost perWSCHSCHTotal
Non-Funded AERS
Texas A&M University – Teaching Analysis ReportAnalysis of Dept by Level and Funding Code
Fiscal Year 2014
Undergraduate(99) Not State Funde 2,505 3.2
2,505 3.2TotalAERS 2,505 0 0 0 0 0 0 0 0 3.2Total
Prepared by Office of Institutional Studies and Planning, 28-Oct-14, 08:15 AM Section VII. Page 73 of 96

Level / Funding AreaTotal SCH LD UD MS PhD Total
Teaching Supplem't
Excess PhD
Net WSCH
FTEGAT
Teaching SalaryGAT
WSCH (incl. Excess PhD)Faculty Faculty
Cost perWSCHSCHTotal
Non-Funded MLSC
Texas A&M University – Teaching Analysis ReportAnalysis of Dept by Level and Funding Code
Fiscal Year 2014
Undergraduate(99) Not State Funde 3,990 5.1
3,990 5.1Total
Budgeted, Not TeachingBudgeted, Not Teach 0.3
0.3TotalMLSC 3,990 0 0 0 0 0 0 0 0 5.4Total
Prepared by Office of Institutional Studies and Planning, 28-Oct-14, 08:15 AM Section VII. Page 74 of 96
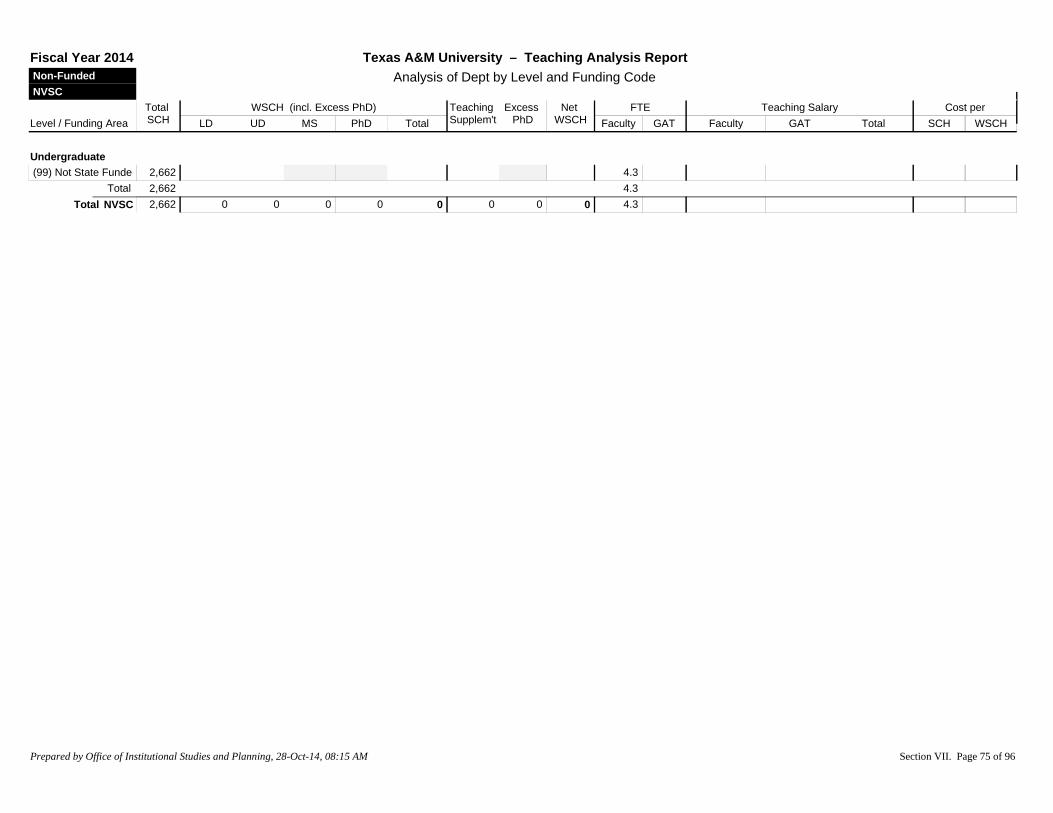
Level / Funding AreaTotal SCH LD UD MS PhD Total
Teaching Supplem't
Excess PhD
Net WSCH
FTEGAT
Teaching SalaryGAT
WSCH (incl. Excess PhD)Faculty Faculty
Cost perWSCHSCHTotal
Non-Funded NVSC
Texas A&M University – Teaching Analysis ReportAnalysis of Dept by Level and Funding Code
Fiscal Year 2014
Undergraduate(99) Not State Funde 2,662 4.3
2,662 4.3TotalNVSC 2,662 0 0 0 0 0 0 0 0 4.3Total
Prepared by Office of Institutional Studies and Planning, 28-Oct-14, 08:15 AM Section VII. Page 75 of 96
Level / Funding AreaTotal SCH LD UD MS PhD Total
Teaching Supplem't
Excess PhD
Net WSCH
FTEGAT
Teaching SalaryGAT
WSCH (incl. Excess PhD)Faculty Faculty
Cost perWSCHSCHTotal
Other ELIN
Texas A&M University – Teaching Analysis ReportAnalysis of Dept by Level and Funding Code
Fiscal Year 2014
Prepared by Office of Institutional Studies and Planning, 28-Oct-14, 08:15 AM Section VII. Page 76 of 96
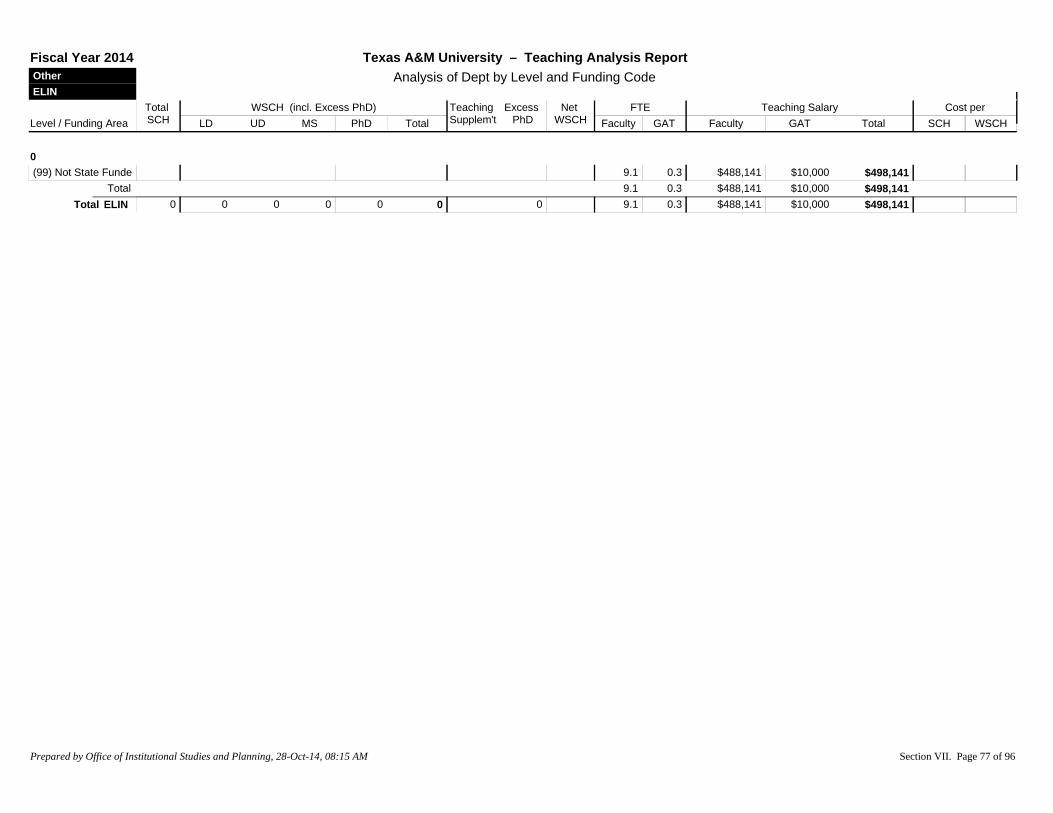
Level / Funding AreaTotal SCH LD UD MS PhD Total
Teaching Supplem't
Excess PhD
Net WSCH
FTEGAT
Teaching SalaryGAT
WSCH (incl. Excess PhD)Faculty Faculty
Cost perWSCHSCHTotal
Other ELIN
Texas A&M University – Teaching Analysis ReportAnalysis of Dept by Level and Funding Code
Fiscal Year 2014
0(99) Not State Funde 9.1 0.3 $488,141 $10,000 $498,141
9.1 0.3 $488,141 $10,000 $498,141TotalELIN 0 0 0 0 0 0 0 9.1 0.3 $488,141 $10,000 $498,141Total
Prepared by Office of Institutional Studies and Planning, 28-Oct-14, 08:15 AM Section VII. Page 77 of 96

Level / Funding AreaTotal SCH LD UD MS PhD Total
Teaching Supplem't
Excess PhD
Net WSCH
FTEGAT
Teaching SalaryGAT
WSCH (incl. Excess PhD)Faculty Faculty
Cost perWSCHSCHTotal
Other INTG
Texas A&M University – Teaching Analysis ReportAnalysis of Dept by Level and Funding Code
Fiscal Year 2014
Undergraduate(05) Agriculture 3 6 6 1 7 $2,686 $895.4 $391.6$2,686
3 6 6 1 7 $2,686 $895.4 $391.6$2,686Total
Masters(02) Science 76 577 577 577 0.4 $59,220 $779.2 $102.7$59,220(06) Engineering 10 77 77 77 $4,626 $462.6 $60.4$4,626
86 653 653 653 0.4 $63,846 $742.4 $97.7$63,846Total
Doctoral(02) Science 191 4,168 4,168 546 3,622 0.6 $74,198 $388.5 $20.5$74,198(05) Agriculture 17 177 177 83 94 $3,944 $232.0 $42.1$3,944(06) Engineering 36 624 624 624 0.2 $23,738 $659.4 $38.0$23,738(99) Not State Funde $1,986 $1,986
244 4,969 4,969 629 4,340 0.9 $103,866 $425.7 $23.9$103,866Total
Budgeted, Not TeachingBudgeted, Not Teach 0.8 $66,048 $66,048
0.8 $66,048 $66,048TotalINTG 333 6 0 653 4,969 5,629 1 629 5,000 2.0 $236,446 $710.0 $47.3$236,446Total
Prepared by Office of Institutional Studies and Planning, 28-Oct-14, 08:15 AM Section VII. Page 78 of 96

Level / Funding AreaTotal SCH LD UD MS PhD Total
Teaching Supplem't
Excess PhD
Net WSCH
FTEGAT
Teaching SalaryGAT
WSCH (incl. Excess PhD)Faculty Faculty
Cost perWSCHSCHTotal
Other MLSX
Texas A&M University – Teaching Analysis ReportAnalysis of Dept by Level and Funding Code
Fiscal Year 2014
Undergraduate(01) Liberal Arts 1,330 96 2,108 2,204 2,204 2.7 $18,000 $13.5 $8.2$18,000(16) Bus. Admin. 1,273 1,489 1,489 1,489 1.7(99) Not State Funde 34 0.1
2,637 1,585 2,108 3,694 3,694 4.5 $18,000 $6.8 $4.9$18,000TotalMLSX 2,637 1,585 2,108 0 0 3,694 0 0 3,694 4.5 $18,000 $6.8 $4.9$18,000Total
Prepared by Office of Institutional Studies and Planning, 28-Oct-14, 08:15 AM Section VII. Page 79 of 96
Level / Funding AreaTotal SCH LD UD MS PhD Total
Teaching Supplem't
Excess PhD
Net WSCH
FTEGAT
Teaching SalaryGAT
WSCH (incl. Excess PhD)Faculty Faculty
Cost perWSCHSCHTotal
Other SABR
Texas A&M University – Teaching Analysis ReportAnalysis of Dept by Level and Funding Code
Fiscal Year 2014
Budgeted, Not TeachingBudgeted, Not Teach
TotalSABRTotal
Prepared by Office of Institutional Studies and Planning, 28-Oct-14, 08:15 AM Section VII. Page 80 of 96

Level / Funding AreaTotal SCH LD UD MS PhD Total
Teaching Supplem't
Excess PhD
Net WSCH
FTEGAT
Teaching SalaryGAT
WSCH (incl. Excess PhD)Faculty Faculty
Cost perWSCHSCHTotal
Other SABX
Texas A&M University – Teaching Analysis ReportAnalysis of Dept by Level and Funding Code
Fiscal Year 2014
Undergraduate(99) Not State Funde 1,471
1,471Total
Budgeted, Not TeachingBudgeted, Not Teach
TotalSABX 1,471 0 0 0 0 0 0 0 0Total
Prepared by Office of Institutional Studies and Planning, 28-Oct-14, 08:15 AM Section VII. Page 81 of 96
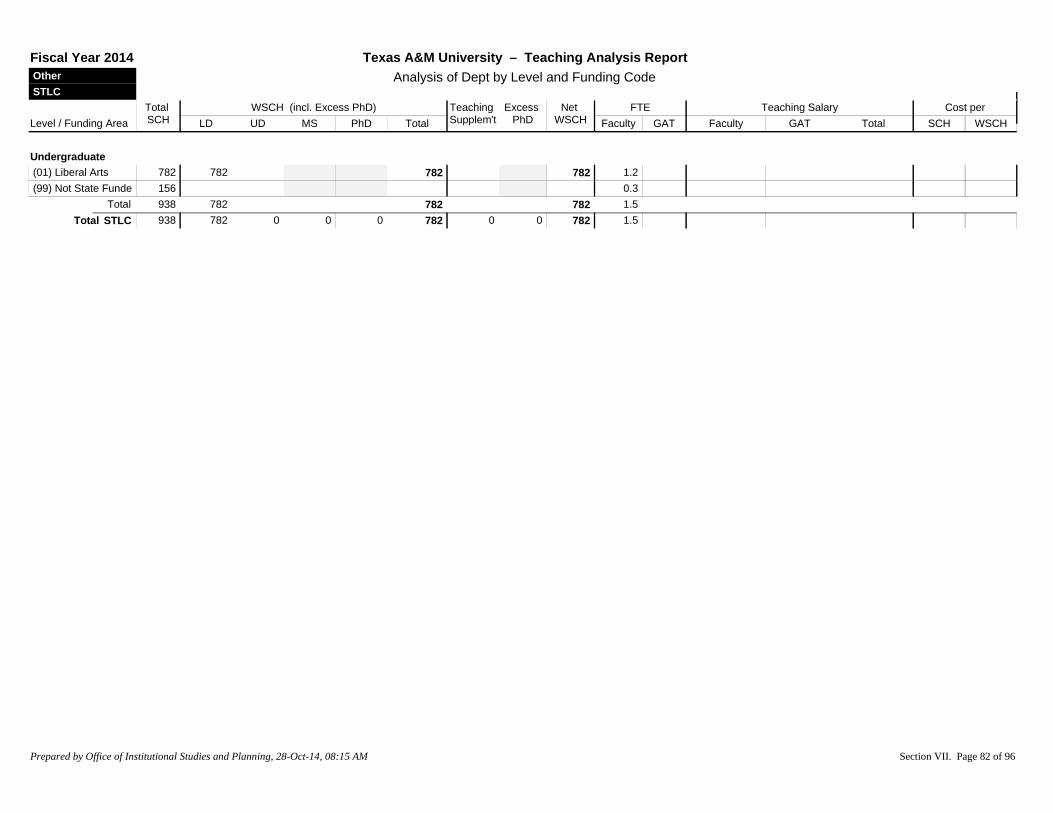
Level / Funding AreaTotal SCH LD UD MS PhD Total
Teaching Supplem't
Excess PhD
Net WSCH
FTEGAT
Teaching SalaryGAT
WSCH (incl. Excess PhD)Faculty Faculty
Cost perWSCHSCHTotal
Other STLC
Texas A&M University – Teaching Analysis ReportAnalysis of Dept by Level and Funding Code
Fiscal Year 2014
Undergraduate(01) Liberal Arts 782 782 782 782 1.2(99) Not State Funde 156 0.3
938 782 782 782 1.5TotalSTLC 938 782 0 0 0 782 0 0 782 1.5Total
Prepared by Office of Institutional Studies and Planning, 28-Oct-14, 08:15 AM Section VII. Page 82 of 96

Level / Funding AreaTotal SCH LD UD MS PhD Total
Teaching Supplem't
Excess PhD
Net WSCH
FTEGAT
Teaching SalaryGAT
WSCH (incl. Excess PhD)Faculty Faculty
Cost perWSCHSCHTotal
Other UGPX
Texas A&M University – Teaching Analysis ReportAnalysis of Dept by Level and Funding Code
Fiscal Year 2014
Undergraduate(01) Liberal Arts 473 354 203 557 4 562 2.1
473 354 203 557 4 562 2.1TotalUGPX 473 354 203 0 0 557 4 0 562 2.1Total
Prepared by Office of Institutional Studies and Planning, 28-Oct-14, 08:15 AM Section VII. Page 83 of 96

Level / Funding AreaTotal SCH LD UD MS PhD Total
Teaching Supplem't
Excess PhD
Net WSCH
FTEGAT
Teaching SalaryGAT
WSCH (incl. Excess PhD)Faculty Faculty
Cost perWSCHSCHTotal
Science BIOL
Texas A&M University – Teaching Analysis ReportAnalysis of Dept by Level and Funding Code
Fiscal Year 2014
Prepared by Office of Institutional Studies and Planning, 28-Oct-14, 08:15 AM Section VII. Page 84 of 96
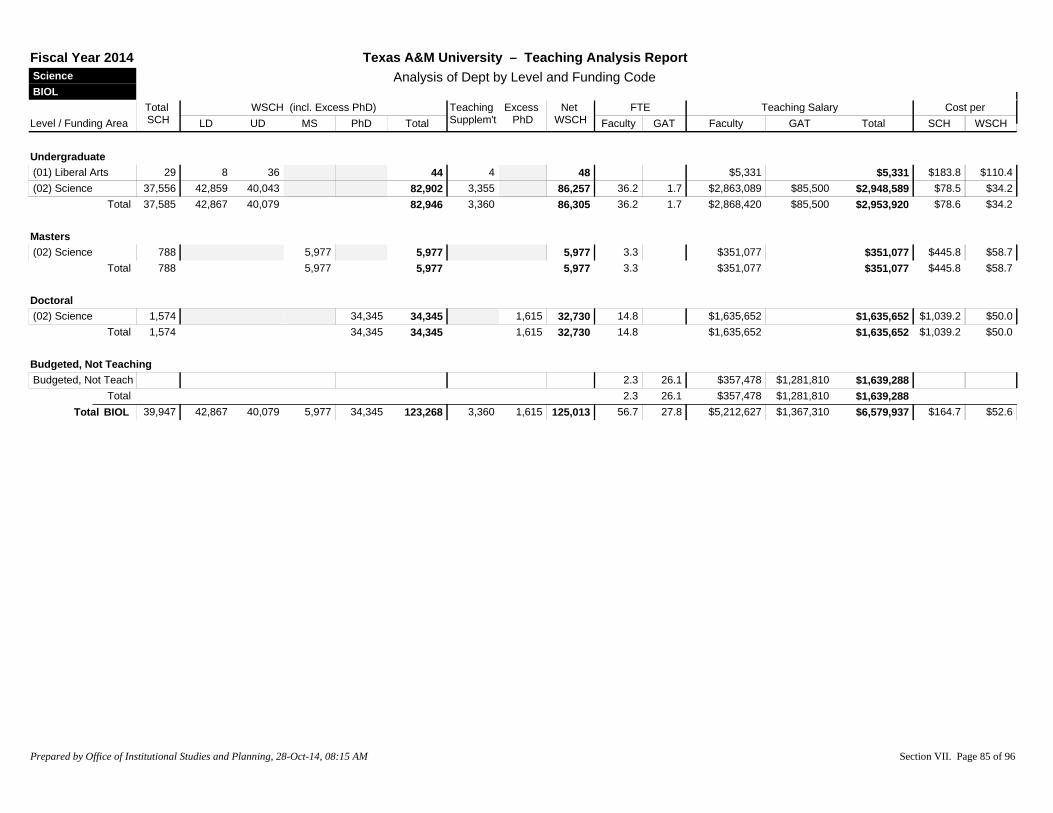
Level / Funding AreaTotal SCH LD UD MS PhD Total
Teaching Supplem't
Excess PhD
Net WSCH
FTEGAT
Teaching SalaryGAT
WSCH (incl. Excess PhD)Faculty Faculty
Cost perWSCHSCHTotal
Science BIOL
Texas A&M University – Teaching Analysis ReportAnalysis of Dept by Level and Funding Code
Fiscal Year 2014
Undergraduate(01) Liberal Arts 29 8 36 44 4 48 $5,331 $183.8 $110.4$5,331(02) Science 37,556 42,859 40,043 82,902 3,355 86,257 36.2 1.7 $2,863,089 $85,500 $78.5 $34.2$2,948,589
37,585 42,867 40,079 82,946 3,360 86,305 36.2 1.7 $2,868,420 $85,500 $78.6 $34.2$2,953,920Total
Masters(02) Science 788 5,977 5,977 5,977 3.3 $351,077 $445.8 $58.7$351,077
788 5,977 5,977 5,977 3.3 $351,077 $445.8 $58.7$351,077Total
Doctoral(02) Science 1,574 34,345 34,345 1,615 32,730 14.8 $1,635,652 $1,039.2 $50.0$1,635,652
1,574 34,345 34,345 1,615 32,730 14.8 $1,635,652 $1,039.2 $50.0$1,635,652Total
Budgeted, Not TeachingBudgeted, Not Teach 2.3 26.1 $357,478 $1,281,810 $1,639,288
2.3 26.1 $357,478 $1,281,810 $1,639,288TotalBIOL 39,947 42,867 40,079 5,977 34,345 123,268 3,360 1,615 125,013 56.7 27.8 $5,212,627 $1,367,310 $164.7 $52.6$6,579,937Total
Prepared by Office of Institutional Studies and Planning, 28-Oct-14, 08:15 AM Section VII. Page 85 of 96

Level / Funding AreaTotal SCH LD UD MS PhD Total
Teaching Supplem't
Excess PhD
Net WSCH
FTEGAT
Teaching SalaryGAT
WSCH (incl. Excess PhD)Faculty Faculty
Cost perWSCHSCHTotal
Science CHEM
Texas A&M University – Teaching Analysis ReportAnalysis of Dept by Level and Funding Code
Fiscal Year 2014
Undergraduate(02) Science 53,984 88,373 11,633 100,006 2,338 102,345 22.9 18.0 $2,289,950 $797,560 $57.2 $30.2$3,087,510
53,984 88,373 11,633 100,006 2,338 102,345 22.9 18.0 $2,289,950 $797,560 $57.2 $30.2$3,087,510Total
Masters(02) Science 1,400 10,626 10,626 10,626 3.9 $624,092 $445.8 $58.7$624,092
1,400 10,626 10,626 10,626 3.9 $624,092 $445.8 $58.7$624,092Total
Doctoral(02) Science 4,145 90,444 90,444 2,247 88,196 21.2 $3,478,946 $839.3 $39.4$3,478,946(06) Engineering 3 52 52 52 $3,776 $1,258.8 $72.6$3,776
4,148 90,496 90,496 2,247 88,248 21.2 $3,482,722 $839.6 $39.5$3,482,722Total
Budgeted, Not TeachingBudgeted, Not Teach 3.7 22.6 $343,644 $992,922 $1,336,566
3.7 22.6 $343,644 $992,922 $1,336,566TotalCHE 59,532 88,373 11,633 10,626 90,496 201,128 2,338 2,247 201,219 51.7 40.7 $6,740,408 $1,790,482 $143.3 $42.4$8,530,890Total
Prepared by Office of Institutional Studies and Planning, 28-Oct-14, 08:15 AM Section VII. Page 86 of 96
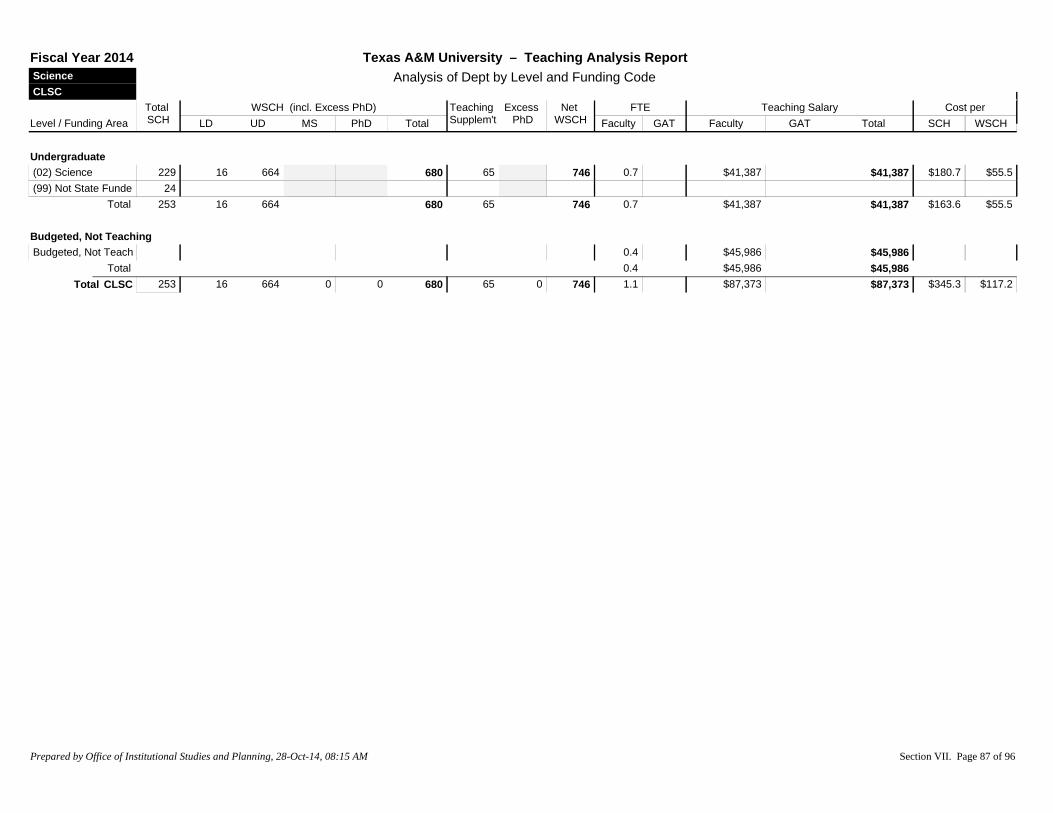
Level / Funding AreaTotal SCH LD UD MS PhD Total
Teaching Supplem't
Excess PhD
Net WSCH
FTEGAT
Teaching SalaryGAT
WSCH (incl. Excess PhD)Faculty Faculty
Cost perWSCHSCHTotal
Science CLSC
Texas A&M University – Teaching Analysis ReportAnalysis of Dept by Level and Funding Code
Fiscal Year 2014
Undergraduate(02) Science 229 16 664 680 65 746 0.7 $41,387 $180.7 $55.5$41,387(99) Not State Funde 24
253 16 664 680 65 746 0.7 $41,387 $163.6 $55.5$41,387Total
Budgeted, Not TeachingBudgeted, Not Teach 0.4 $45,986 $45,986
0.4 $45,986 $45,986TotalCLSC 253 16 664 0 0 680 65 0 746 1.1 $87,373 $345.3 $117.2$87,373Total
Prepared by Office of Institutional Studies and Planning, 28-Oct-14, 08:15 AM Section VII. Page 87 of 96

Level / Funding AreaTotal SCH LD UD MS PhD Total
Teaching Supplem't
Excess PhD
Net WSCH
FTEGAT
Teaching SalaryGAT
WSCH (incl. Excess PhD)Faculty Faculty
Cost perWSCHSCHTotal
Science MATH
Texas A&M University – Teaching Analysis ReportAnalysis of Dept by Level and Funding Code
Fiscal Year 2014
Undergraduate(01) Liberal Arts 63,531 62,682 575 63,257 774 64,031 34.0 2.2 $2,589,693 $102,075 $42.4 $42.0$2,691,768(02) Science 16,860 7,186 38,185 45,371 2,949 48,320 23.3 $2,758,866 $163.6 $57.1$2,758,866(04) Teacher Educ. 129 197 197 197 0.1 $8,453 $65.5 $42.8$8,453(16) Bus. Admin. 196 44 286 330 330 0.6 $75,769 $386.6 $229.3$75,769
80,716 70,110 39,045 109,155 3,724 112,879 57.9 2.2 $5,432,781 $102,075 $68.6 $49.0$5,534,856Total
Masters(01) Liberal Arts 1,803 6,978 6,978 6,978 4.3 $546,288 $303.0 $78.3$546,288(06) Engineering 18 138 138 138 $4,001 $222.3 $29.0$4,001
1,821 7,115 7,115 7,115 4.3 $550,288 $302.2 $77.3$550,288Total
Doctoral(01) Liberal Arts 2,802 27,235 27,235 3,052 24,183 31.6 $4,824,177 $1,721.7 $199.5$4,824,177(02) Science 9 196 196 196 0.3 $48,266 $5,362.9 $245.8$48,266(04) Teacher Educ. 5 40 40 40 0.1 $9,402 $1,880.5 $236.5$9,402(06) Engineering $4,001 $4,001
2,816 27,472 27,472 3,052 24,419 32.1 $4,885,846 $1,735.0 $200.1$4,885,846Total
Budgeted, Not TeachingBudgeted, Not Teach 5.1 37.1 $628,808 $1,644,303 $2,273,111
5.1 37.1 $628,808 $1,644,303 $2,273,111TotalMATH 85,353 70,110 39,045 7,115 27,472 143,742 3,724 3,052 144,414 99.4 39.3 $11,497,723 $1,746,378 $155.2 $91.7$13,244,101Total
Prepared by Office of Institutional Studies and Planning, 28-Oct-14, 08:15 AM Section VII. Page 88 of 96

Level / Funding AreaTotal SCH LD UD MS PhD Total
Teaching Supplem't
Excess PhD
Net WSCH
FTEGAT
Teaching SalaryGAT
WSCH (incl. Excess PhD)Faculty Faculty
Cost perWSCHSCHTotal
Science PHYS
Texas A&M University – Teaching Analysis ReportAnalysis of Dept by Level and Funding Code
Fiscal Year 2014
Undergraduate(02) Science 31,545 53,245 4,104 57,349 3,765 61,114 17.0 17.2 $2,287,259 $731,599 $95.7 $49.4$3,018,858(06) Engineering 7 25 25 3 28 $5,116 $730.9 $185.6$5,116
31,552 53,245 4,129 57,374 3,768 61,142 17.0 17.2 $2,292,375 $731,599 $95.8 $49.5$3,023,974Total
Masters(02) Science 972 7,377 7,377 7,377 5.2 $706,669 $727.0 $95.8$706,669(19) Technology 27 104 104 104 0.4 $60,953 $2,257.5 $584.8$60,953
999 7,482 7,482 7,482 5.6 $767,622 $768.4 $102.6$767,622Total
Doctoral(02) Science 3,016 65,809 65,809 8,663 57,147 27.5 $3,828,698 $1,269.5 $67.0$3,828,698
3,016 65,809 65,809 8,663 57,147 27.5 $3,828,698 $1,269.5 $67.0$3,828,698Total
Budgeted, Not TeachingBudgeted, Not Teach 2.4 $374,981 $374,981
2.4 $374,981 $374,981TotalPHYS 35,567 53,245 4,129 7,482 65,809 130,665 3,768 8,663 125,770 52.5 17.2 $7,263,676 $731,599 $224.8 $63.6$7,995,275Total
Prepared by Office of Institutional Studies and Planning, 28-Oct-14, 08:15 AM Section VII. Page 89 of 96
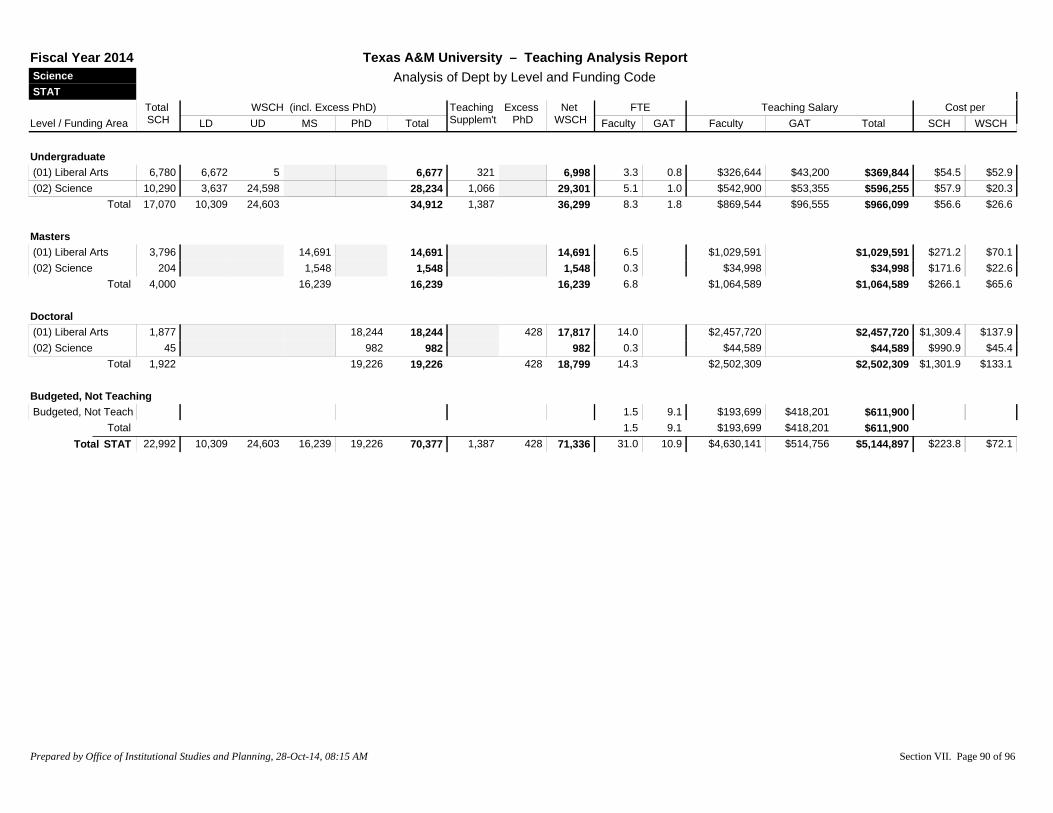
Level / Funding AreaTotal SCH LD UD MS PhD Total
Teaching Supplem't
Excess PhD
Net WSCH
FTEGAT
Teaching SalaryGAT
WSCH (incl. Excess PhD)Faculty Faculty
Cost perWSCHSCHTotal
Science STAT
Texas A&M University – Teaching Analysis ReportAnalysis of Dept by Level and Funding Code
Fiscal Year 2014
Undergraduate(01) Liberal Arts 6,780 6,672 5 6,677 321 6,998 3.3 0.8 $326,644 $43,200 $54.5 $52.9$369,844(02) Science 10,290 3,637 24,598 28,234 1,066 29,301 5.1 1.0 $542,900 $53,355 $57.9 $20.3$596,255
17,070 10,309 24,603 34,912 1,387 36,299 8.3 1.8 $869,544 $96,555 $56.6 $26.6$966,099Total
Masters(01) Liberal Arts 3,796 14,691 14,691 14,691 6.5 $1,029,591 $271.2 $70.1$1,029,591(02) Science 204 1,548 1,548 1,548 0.3 $34,998 $171.6 $22.6$34,998
4,000 16,239 16,239 16,239 6.8 $1,064,589 $266.1 $65.6$1,064,589Total
Doctoral(01) Liberal Arts 1,877 18,244 18,244 428 17,817 14.0 $2,457,720 $1,309.4 $137.9$2,457,720(02) Science 45 982 982 982 0.3 $44,589 $990.9 $45.4$44,589
1,922 19,226 19,226 428 18,799 14.3 $2,502,309 $1,301.9 $133.1$2,502,309Total
Budgeted, Not TeachingBudgeted, Not Teach 1.5 9.1 $193,699 $418,201 $611,900
1.5 9.1 $193,699 $418,201 $611,900TotalSTAT 22,992 10,309 24,603 16,239 19,226 70,377 1,387 428 71,336 31.0 10.9 $4,630,141 $514,756 $223.8 $72.1$5,144,897Total
Prepared by Office of Institutional Studies and Planning, 28-Oct-14, 08:15 AM Section VII. Page 90 of 96

Level / Funding AreaTotal SCH LD UD MS PhD Total
Teaching Supplem't
Excess PhD
Net WSCH
FTEGAT
Teaching SalaryGAT
WSCH (incl. Excess PhD)Faculty Faculty
Cost perWSCHSCHTotal
Veterinary MedicineCLVM
Texas A&M University – Teaching Analysis ReportAnalysis of Dept by Level and Funding Code
Fiscal Year 2014
Undergraduate(02) Science 1,040 1,050 1,359 2,409 5 2,414 1.4(99) Not State Funde 12
1,052 1,050 1,359 2,409 5 2,414 1.4Total
Budgeted, Not TeachingBudgeted, Not Teach 0.2 $36,206 $36,206
0.2 $36,206 $36,206TotalCLVM 1,052 1,050 1,359 0 0 2,409 5 0 2,414 1.6 $36,206 $34.4 $15.0$36,206Total
Prepared by Office of Institutional Studies and Planning, 28-Oct-14, 08:15 AM Section VII. Page 91 of 96

Level / Funding AreaTotal SCH LD UD MS PhD Total
Teaching Supplem't
Excess PhD
Net WSCH
FTEGAT
Teaching SalaryGAT
WSCH (incl. Excess PhD)Faculty Faculty
Cost perWSCHSCHTotal
Veterinary MedicineVIBS
Texas A&M University – Teaching Analysis ReportAnalysis of Dept by Level and Funding Code
Fiscal Year 2014
Undergraduate(01) Liberal Arts 325 556 556 556 0.3 $18,633 $57.3 $33.5$18,633(02) Science 3,567 687 9,522 10,209 531 10,741 3.5 $218,038 $61.1 $20.3$218,038(06) Engineering 51 183 183 183 0.3(14) Health Service 30 52 52 5 57 $1,670 $55.7 $29.3$1,670
3,973 687 10,312 10,999 537 11,536 4.0 $238,342 $60.0 $20.7$238,342Total
Masters(01) Liberal Arts 54 209 209 209 0.1 $14,234 $263.6 $68.1$14,234(02) Science 947 7,188 7,188 7,188 2.9 0.2 $278,671 $5,445 $300.0 $39.5$284,116(04) Teacher Educ. 3 7 7 7 $183 $61.1 $25.1$183(14) Health Service 169 500 500 500 0.1 $4,628 $27.4 $9.3$4,628
1,173 7,904 7,904 7,904 3.1 0.2 $297,717 $5,445 $258.4 $38.4$303,162Total
Doctoral(01) Liberal Arts 9 87 87 87 $3,188 $354.2 $36.4$3,188(02) Science 577 12,590 12,590 655 11,936 3.2 $426,451 $1,118 $741.0 $35.8$427,569(04) Teacher Educ. 33 262 262 24 239 0.1 $5,994 $181.6 $25.1$5,994(14) Health Service 23 224 224 224 0.1 $592 $25.7 $2.6$592
642 13,164 13,164 678 12,486 3.4 $436,225 $1,118 $681.2 $35.0$437,343Total
Budgeted, Not TeachingBudgeted, Not Teach 1.2 1.6 $135,665 $55,337 $191,002
1.2 1.6 $135,665 $55,337 $191,002TotalVIBS 5,788 687 10,312 7,904 13,164 32,068 537 678 31,926 11.7 1.8 $1,107,949 $61,900 $202.1 $36.6$1,169,849Total
Prepared by Office of Institutional Studies and Planning, 28-Oct-14, 08:15 AM Section VII. Page 92 of 96
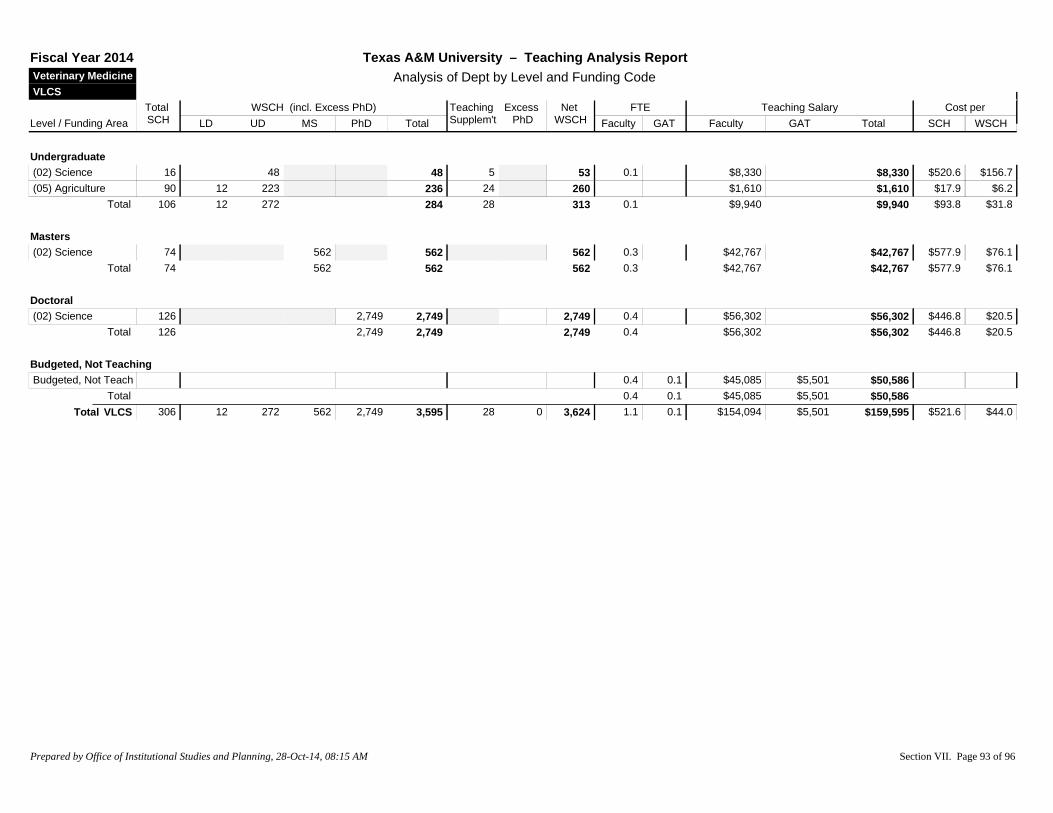
Level / Funding AreaTotal SCH LD UD MS PhD Total
Teaching Supplem't
Excess PhD
Net WSCH
FTEGAT
Teaching SalaryGAT
WSCH (incl. Excess PhD)Faculty Faculty
Cost perWSCHSCHTotal
Veterinary MedicineVLCS
Texas A&M University – Teaching Analysis ReportAnalysis of Dept by Level and Funding Code
Fiscal Year 2014
Undergraduate(02) Science 16 48 48 5 53 0.1 $8,330 $520.6 $156.7$8,330(05) Agriculture 90 12 223 236 24 260 $1,610 $17.9 $6.2$1,610
106 12 272 284 28 313 0.1 $9,940 $93.8 $31.8$9,940Total
Masters(02) Science 74 562 562 562 0.3 $42,767 $577.9 $76.1$42,767
74 562 562 562 0.3 $42,767 $577.9 $76.1$42,767Total
Doctoral(02) Science 126 2,749 2,749 2,749 0.4 $56,302 $446.8 $20.5$56,302
126 2,749 2,749 2,749 0.4 $56,302 $446.8 $20.5$56,302Total
Budgeted, Not TeachingBudgeted, Not Teach 0.4 0.1 $45,085 $5,501 $50,586
0.4 0.1 $45,085 $5,501 $50,586TotalVLCS 306 12 272 562 2,749 3,595 28 0 3,624 1.1 0.1 $154,094 $5,501 $521.6 $44.0$159,595Total
Prepared by Office of Institutional Studies and Planning, 28-Oct-14, 08:15 AM Section VII. Page 93 of 96

Level / Funding AreaTotal SCH LD UD MS PhD Total
Teaching Supplem't
Excess PhD
Net WSCH
FTEGAT
Teaching SalaryGAT
WSCH (incl. Excess PhD)Faculty Faculty
Cost perWSCHSCHTotal
Veterinary MedicineVSCS
Texas A&M University – Teaching Analysis ReportAnalysis of Dept by Level and Funding Code
Fiscal Year 2014
Undergraduate(02) Science 5 15 15 1 16
5 15 15 1 16Total
Masters(02) Science 50 380 380 380 0.3 $39,476 $789.5 $104.0$39,476
50 380 380 380 0.3 $39,476 $789.5 $104.0$39,476Total
Doctoral(02) Science 192 4,189 4,189 4,189 1.0 $115,966 $604.0 $27.7$115,966
192 4,189 4,189 4,189 1.0 $115,966 $604.0 $27.7$115,966Total
Budgeted, Not TeachingBudgeted, Not Teach 0.9 $98,078 $98,078
0.9 $98,078 $98,078TotalVSCS 247 0 15 380 4,189 4,584 1 0 4,585 2.3 $253,520 $1,026.4 $55.3$253,520Total
Prepared by Office of Institutional Studies and Planning, 28-Oct-14, 08:15 AM Section VII. Page 94 of 96
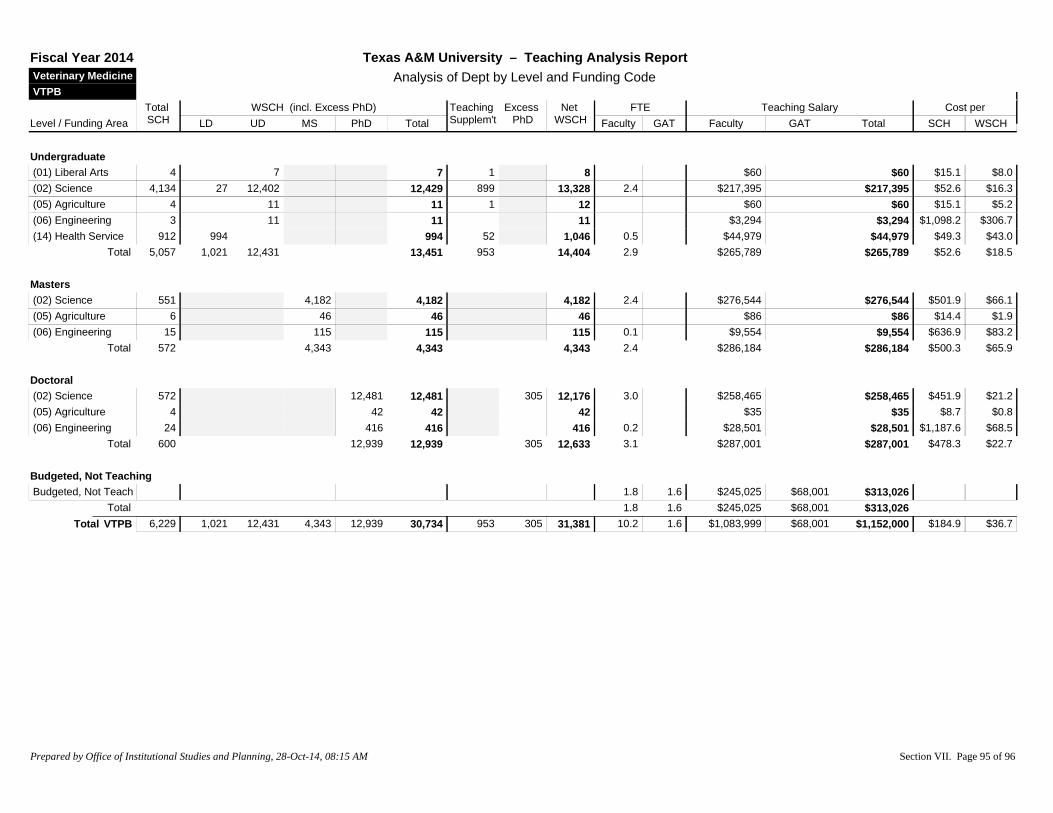
Level / Funding AreaTotal SCH LD UD MS PhD Total
Teaching Supplem't
Excess PhD
Net WSCH
FTEGAT
Teaching SalaryGAT
WSCH (incl. Excess PhD)Faculty Faculty
Cost perWSCHSCHTotal
Veterinary MedicineVTPB
Texas A&M University – Teaching Analysis ReportAnalysis of Dept by Level and Funding Code
Fiscal Year 2014
Undergraduate(01) Liberal Arts 4 7 7 1 8 $60 $15.1 $8.0$60(02) Science 4,134 27 12,402 12,429 899 13,328 2.4 $217,395 $52.6 $16.3$217,395(05) Agriculture 4 11 11 1 12 $60 $15.1 $5.2$60(06) Engineering 3 11 11 11 $3,294 $1,098.2 $306.7$3,294(14) Health Service 912 994 994 52 1,046 0.5 $44,979 $49.3 $43.0$44,979
5,057 1,021 12,431 13,451 953 14,404 2.9 $265,789 $52.6 $18.5$265,789Total
Masters(02) Science 551 4,182 4,182 4,182 2.4 $276,544 $501.9 $66.1$276,544(05) Agriculture 6 46 46 46 $86 $14.4 $1.9$86(06) Engineering 15 115 115 115 0.1 $9,554 $636.9 $83.2$9,554
572 4,343 4,343 4,343 2.4 $286,184 $500.3 $65.9$286,184Total
Doctoral(02) Science 572 12,481 12,481 305 12,176 3.0 $258,465 $451.9 $21.2$258,465(05) Agriculture 4 42 42 42 $35 $8.7 $0.8$35(06) Engineering 24 416 416 416 0.2 $28,501 $1,187.6 $68.5$28,501
600 12,939 12,939 305 12,633 3.1 $287,001 $478.3 $22.7$287,001Total
Budgeted, Not TeachingBudgeted, Not Teach 1.8 1.6 $245,025 $68,001 $313,026
1.8 1.6 $245,025 $68,001 $313,026TotalVTPB 6,229 1,021 12,431 4,343 12,939 30,734 953 305 31,381 10.2 1.6 $1,083,999 $68,001 $184.9 $36.7$1,152,000Total
Prepared by Office of Institutional Studies and Planning, 28-Oct-14, 08:15 AM Section VII. Page 95 of 96

Level / Funding AreaTotal SCH LD UD MS PhD Total
Teaching Supplem't
Excess PhD
Net WSCH
FTEGAT
Teaching SalaryGAT
WSCH (incl. Excess PhD)Faculty Faculty
Cost perWSCHSCHTotal
Veterinary MedicineVTPP
Texas A&M University – Teaching Analysis ReportAnalysis of Dept by Level and Funding Code
Fiscal Year 2014
Undergraduate(01) Liberal Arts 197 337 337 337 0.2 $14,292 $72.5 $42.4$14,292(02) Science 3,074 849 7,761 8,610 186 8,797 2.7 $261,966 $85.2 $29.8$261,966(06) Engineering 80 118 115 233 11 244 0.1 0.2 $7,988 $8,100 $201.1 $65.9$16,088(14) Health Service 784 257 948 1,205 67 1,272 0.3 $29,221 $37.3 $23.0$29,221
4,135 1,224 9,161 10,385 265 10,650 3.3 0.2 $313,467 $8,100 $77.8 $30.2$321,567Total
Masters(02) Science 860 6,527 6,527 6,527 1.8 $191,556 $222.7 $29.3$191,556
860 6,527 6,527 6,527 1.8 $191,556 $222.7 $29.3$191,556Total
Doctoral(02) Science 396 8,641 8,641 65 8,575 2.3 $254,927 $643.8 $29.7$254,927
396 8,641 8,641 65 8,575 2.3 $254,927 $643.8 $29.7$254,927Total
Budgeted, Not TeachingBudgeted, Not Teach 0.6 $60,163 $60,163
0.6 $60,163 $60,163TotalVTPP 5,391 1,224 9,161 6,527 8,641 25,553 265 65 25,753 8.0 0.2 $820,114 $8,100 $153.6 $32.2$828,214Total
Prepared by Office of Institutional Studies and Planning, 28-Oct-14, 08:15 AM Section VII. Page 96 of 96