sem and 3d microtomography application to investigate the ... · sem and 3d microtomography...
TRANSCRIPT
© 2016 IBRACON
Volume 9, Number 6 (December 2016) p. 824 - 841 • ISSN 1983-4195http://dx.doi.org/10.1590/S1983-41952016000600002
© 2016 IBRACON
SEM and 3D microtomography application to investigate the distribution of fibers in advanced cementitious composites
Aplicação de MEV e microtomografia 3D na investigação da distribuição de fibras em compósitos cimentícios avançados
Abstract
Resumo
The incorporation of fibers on cement composites reduces its fragility, turning it a ductile material. The amount of fibers and its distribution presents a large influence on the composite performance, especially by the fact that it is self-consolidating, which facilitates the fiber distribution. 3D microtomog-raphy is an efficient tool for determining the fibers distribution, generating images and creating a representation in three dimensions of the sample. Moreover, the scanning electron microscopy (SEM) can be used to analyze the interaction of fibers with the cement composite. The purpose of this paper is to investigate the application of these techniques to visualize the distribution and interaction of metallic and polypropylene fibers inserted into an advanced cementitious composite, at 3% in volume content. The results presented these techniques’ efficiency in the verification of fibers distribu-tion within the mixture and the absence of flaws in the composition.
Keywords: advanced composites, fibers, microtomography, scanning electron microscopy.
A incorporação de fibras em compostos cimentícios atenua sua fragilidade, tornando-o um material dúctil. A quantidade e dispersão das fibras exercem grande influência em seu desempenho. O compósito cimentício avançado é autoadensável, o que facilita a distribuição das fibras. A microtomografia 3D é uma ferramenta eficiente para determinação do posicionamento das fibras, gerando imagens sequencialmente, criando uma representação em três dimensões da amostra. Ainda, a microscopia eletrônica de varredura (MEV) pode ser utilizada na análise da interação das fibras com o compósito. O objetivo deste artigo é investigar a aplicação destas técnicas para visualizar a distribuição e a interação de fibras metálicas e de polipropileno inseridas em um compósito cimentício avançado, em teor de 3% em volume. Os resultados comprovaram a eficiência dos métodos, sendo possível verificar a distribuição das fibras dentro da mistura e a inexistência de falhas na composição.
Palavras-chave: compósitos avançados, fibras, microtomografia, microscopia eletrônica de varredura.
a Instituto Tecnológico em Desempenho e Construção Civil, PPGEC, Unisinos, São Leopoldo, RS, Brasil.
Received: 11 Feb 2016 • Accepted: 18 Apr 2016 • Available Online: 21 Nov 2016
F. PACHECO a
R. CHRIST a
A. M. GIL a
B.F. TUTIKIAN a
1. Introduction
The development of advanced cementitious composites aims to achieve the properties unreached with the use of conventional ma-terials. Therefore, conventional concrete composition, mix design methods, raw materials and its cure are modified. Li [1] empha-sizes the growth of such advanced composite’s use and improve-ment, exceeding the academic and laboratory barriers, presenting viability for commercial and large-scale applications.The interest in the application of such materials lies on its aptitude for special cases by its high potential of durability, loadbearing ca-pacity and structure’s low weight due to lower sections necessary to withstand the imposed loads [2]. Blais and Couture [3] stands out that, under the same conditions of plane geometry and load, there is a 50% reduction in the depth required for structures using advanced cementitious composites when compared to conven-tional concrete, as shown in Table 1.Unlike conventional concrete, used since 1907 [4], advanced ce-mentitious composites have recent use in the world and requires greater knowledge of its properties, microstructure, and character-istics. Then, its application depends on the development of studies to provide the knowledge necessary to perform the correct diag-nose and evaluation. One of the main current study approach is the fiber incorporation into cementitious composites in its variety of kinds of materials and geometry.Neville and Brooks [5] classify fibers as discontinuous and discrete, mentioning other possibilities of material’s composition such as cel-lulose, steel and carbon. Complementarily the authors stand out the innumerous benefits of using such materials, since there is proper interfacial adhesion, dependent on fiber’s surface roughness.The incorporation of randomly distributed microfiber changes com-posites mechanical properties, through cracks initiation and propaga-tion control, leading to greater ductility [6]. The fiber hybridization con-sists in the use of two or more fiber type in cementitious composites, which has shown as an efficient solution to increase material’s tensile strength and reduction of crack’s propagation. The use of fibers with different materials and dimensions provides greater synergy to the composite, once each fiber type acts in different times during the load-ing process. The hybrid fiber mix provides benefits in composite’s ten-sile strength, cracks control and ductility increase [7,8]. However, in order to obtain these properties it is required fiber’s even distribution.
Papers [9,10,11,12] demonstrate the viability of using advanced tests to obtain images for the diagnosis of microstructural damage in con-crete specimens. One method to visualize the fiber distribution con-sists in the microscopic diagnose by the use of specific equipment.One of the tools for determining the distribution of fibers within advanced cementitious composites is the high-resolution 3D mi-crotomography [12,13]. This method proposes the graphical dis-play and presentation of the different components of the same mix-ture by the density difference between its components. The use of microtomography technique aim to identify the proportion and arrangement of different types of fibers, which is guaranteed by distinct material’s x-ray absorption, which enables a contrast in the image’s reproduction [13].Another major factor is the verification of fibers’ interaction with the cementitious composite, its influence to the creation of transition regions and the interface between different materials. This inter-action can be assessed by scanning electron microscopy (SEM), which generates images that allow the visualization of the interface between two materials. The adhesion of the composite fibers is the main feature that influence the desired performance and depends on the material that comprises the fibers.Landis et al. [10] used the image capture as the method of quantita-tion and analysis of damage in concrete specimens, concluding that this is an effective tool for this use. Maroliya [14] generated SEM images using 35x and 1000x approximations in a composite con-taining 0,20 of steel fibers relative to the weight of cement, standing the possibility of transition zone identification. According to the au-thor, images presented material’s compact interface, with complete envelopment of steel fibers by the cementitious matrix. Yazici et al. [15] obtained the same verification, recognizing the interface area between the fibers and the cementitious matrix as dense and com-pact. Henry, Darma and Sugiyama [16] used the 3D microtomogra-phy technique to analyze the effects of thermal curing and reheat in high performance concrete samples. According to the authors, this method allowed the verification of the water/cement reduction effect in advanced composites due to the reduction of void’s presence.Within this context, this paper aimed to investigate the applica-tion of 3D microtomography and SEM techniques to analyze the distribution and interaction of fiber hybrid mixture of steel and polypropylene fibers inserted in an advanced cementitious composite.
825IBRACON Structures and Materials Journal • 2016 • vol. 9 • nº 6
F. PACHECO | R. CHRIST | A. M. GIL | B.F. TUTIKIAN
Table 1 – Section depth and weight comparison of different construction systems
Cross section shape
(without reinforcement)
Type of beamSection shape
Weight
RPC (X shape)360 mm
130 kg/m
Steel structure360 mm
110 kg/m
Prestressed concrete700 mm
470 kg/m
Reinforced concrete700 mm
530 kg/m
826 IBRACON Structures and Materials Journal • 2016 • vol. 9 • nº 6
SEM and 3D microtomography application to investigate the distribution of fibers in advanced cementitious composites
2. Materials e experimental program
In order to analyze the feasibility of 3D microtomography and SEM techniques application cylindrical samples taken from a prismatic specimen were used, according to experimental pro-gram following described.
2.1 Materials
The binders used were Portland cement with a few additions of
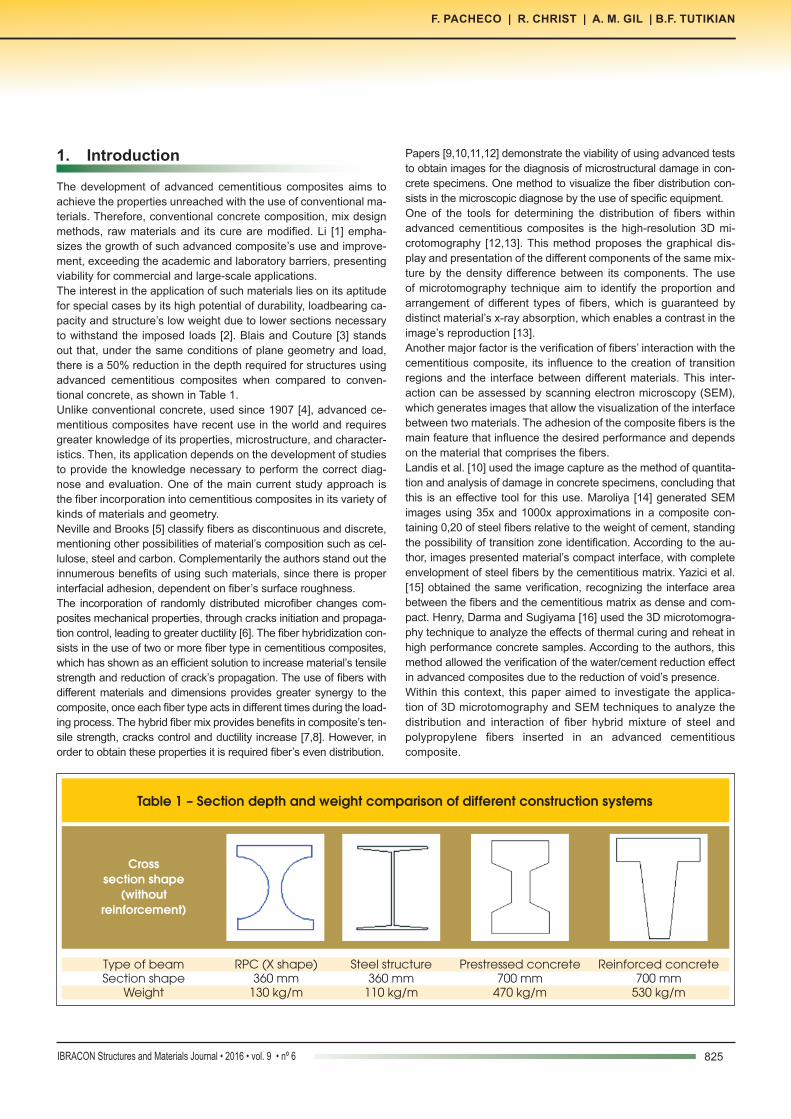
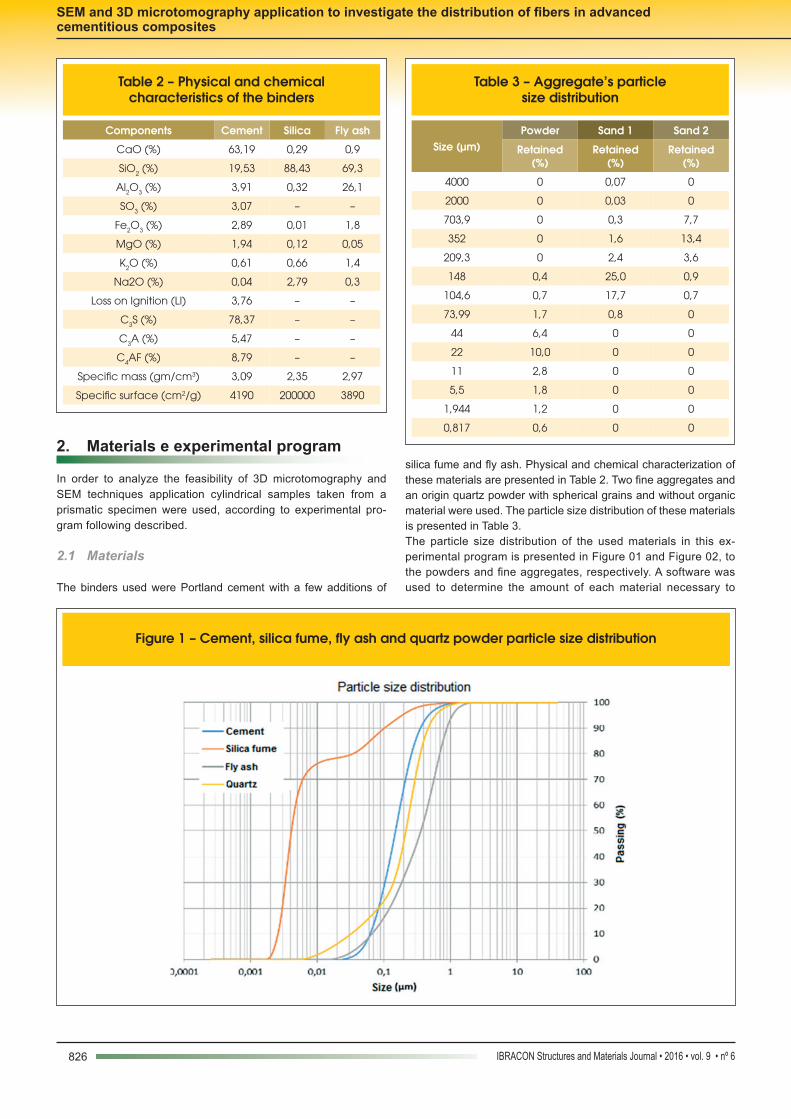
silica fume and fly ash. Physical and chemical characterization of these materials are presented in Table 2. Two fine aggregates and an origin quartz powder with spherical grains and without organic material were used. The particle size distribution of these materials is presented in Table 3.The particle size distribution of the used materials in this ex-perimental program is presented in Figure 01 and Figure 02, to the powders and fine aggregates, respectively. A software was used to determine the amount of each material necessary to
Table 2 – Physical and chemical characteristics of the binders
Components Cement Silica Fly ash
CaO (%) 63,19 0,29 0,9
SiO2 (%) 19,53 88,43 69,3
Al2O3 (%) 3,91 0,32 26,1
SO3 (%) 3,07 – –
Fe2O3 (%) 2,89 0,01 1,8
MgO (%) 1,94 0,12 0,05
K2O (%) 0,61 0,66 1,4
Na2O (%) 0,04 2,79 0,3
Loss on Ignition (LI) 3,76 – –
C3S (%) 78,37 – –
C3A (%) 5,47 – –
C4AF (%) 8,79 – –
Specific mass (gm/cm3) 3,09 2,35 2,97
Specific surface (cm2/g) 4190 200000 3890
Table 3 – Aggregate’s particle size distribution
Size (µm)Powder Sand 1 Sand 2
Retained (%)
Retained (%)
Retained (%)
4000 0 0,07 0
2000 0 0,03 0
703,9 0 0,3 7,7
352 0 1,6 13,4
209,3 0 2,4 3,6
148 0,4 25,0 0,9
104,6 0,7 17,7 0,7
73,99 1,7 0,8 0
44 6,4 0 0
22 10,0 0 0
11 2,8 0 0
5,5 1,8 0 0
1,944 1,2 0 0
0,817 0,6 0 0
Figure 1 – Cement, silica fume, fly ash and quartz powder particle size distribution
827IBRACON Structures and Materials Journal • 2016 • vol. 9 • nº 6
F. PACHECO | R. CHRIST | A. M. GIL | B.F. TUTIKIAN
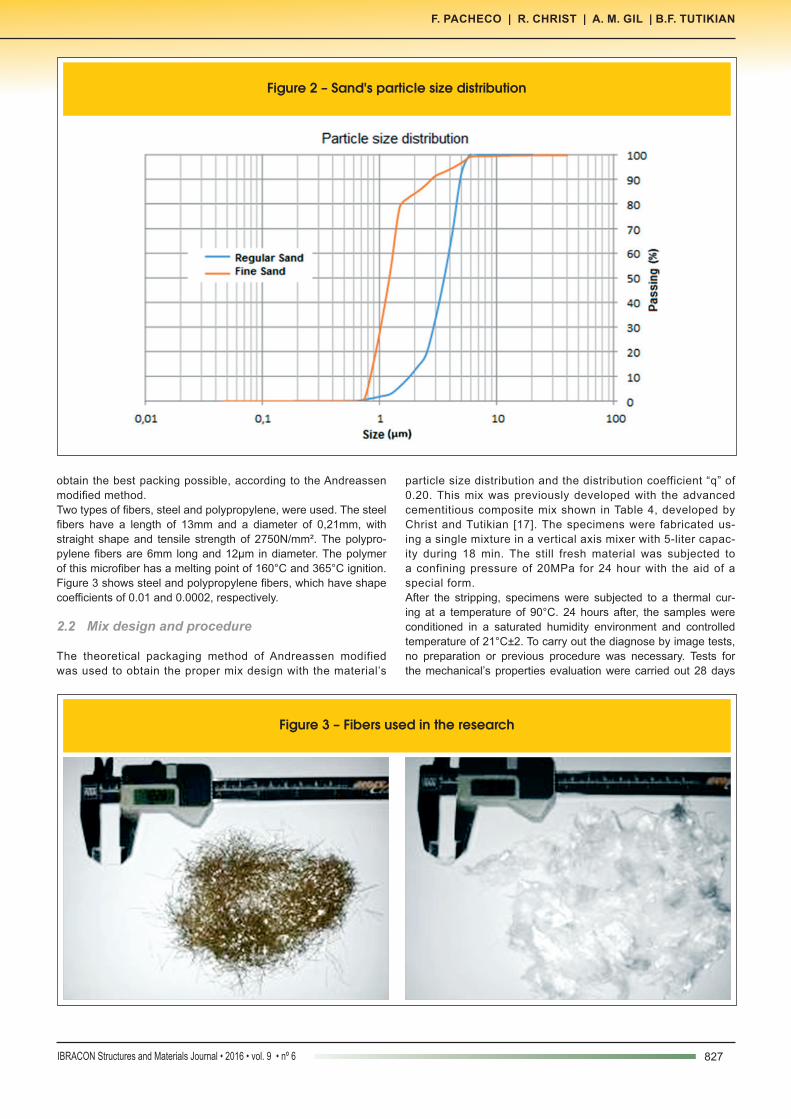
obtain the best packing possible, according to the Andreassen modified method.Two types of fibers, steel and polypropylene, were used. The steel fibers have a length of 13mm and a diameter of 0,21mm, with straight shape and tensile strength of 2750N/mm². The polypro-pylene fibers are 6mm long and 12μm in diameter. The polymer of this microfiber has a melting point of 160°C and 365°C ignition. Figure 3 shows steel and polypropylene fibers, which have shape coefficients of 0.01 and 0.0002, respectively.
2.2 Mix design and procedure
The theoretical packaging method of Andreassen modified was used to obtain the proper mix design with the material’s
particle size distribution and the distribution coefficient “q” of 0.20. This mix was previously developed with the advanced cementitious composite mix shown in Table 4, developed by Christ and Tutikian [17]. The specimens were fabricated us-ing a single mixture in a vertical axis mixer with 5-liter capac-ity during 18 min. The still fresh material was subjected to a confining pressure of 20MPa for 24 hour with the aid of a special form.After the stripping, specimens were subjected to a thermal cur-ing at a temperature of 90°C. 24 hours after, the samples were conditioned in a saturated humidity environment and controlled temperature of 21°C±2. To carry out the diagnose by image tests, no preparation or previous procedure was necessary. Tests for the mechanical’s properties evaluation were carried out 28 days
Figure 2 – Sand's particle size distribution
Figure 3 – Fibers used in the research
828 IBRACON Structures and Materials Journal • 2016 • vol. 9 • nº 6
SEM and 3D microtomography application to investigate the distribution of fibers in advanced cementitious composites
after its molding and have resulted in a compressive strength of 185MPa and in a bending tensile strength (4 points) of 44MPa.
2.3 3D microtomography and SEM
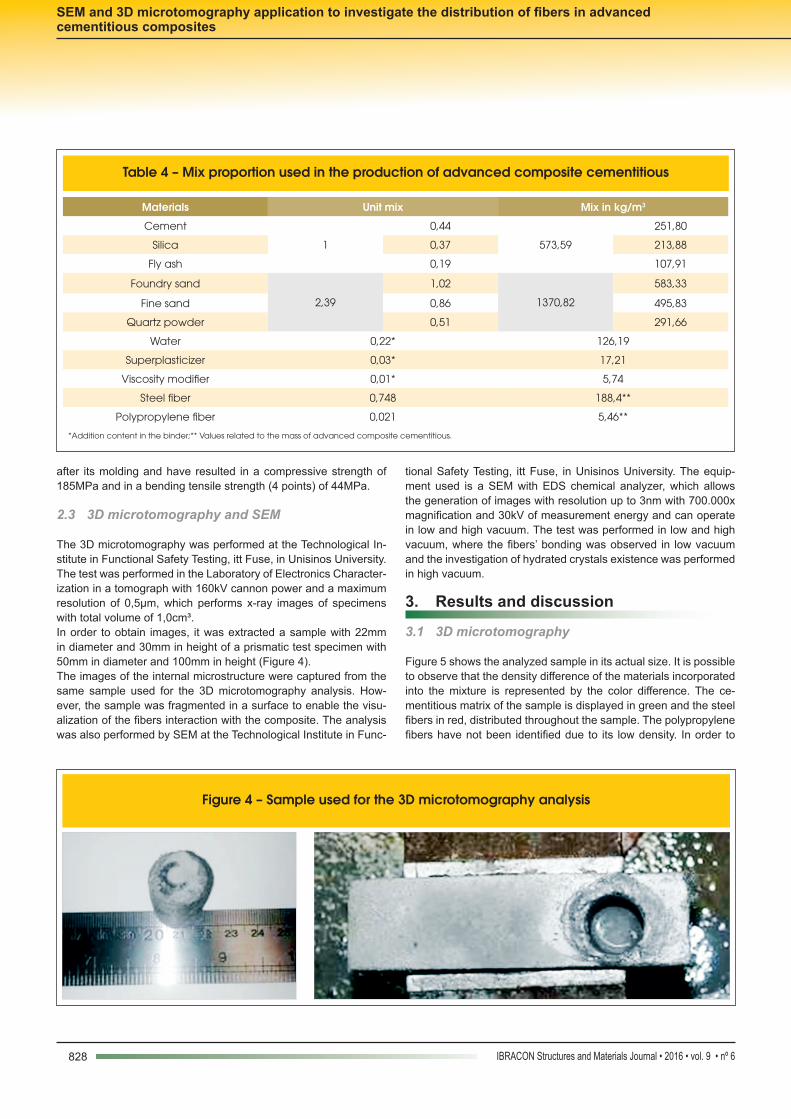
The 3D microtomography was performed at the Technological In-stitute in Functional Safety Testing, itt Fuse, in Unisinos University. The test was performed in the Laboratory of Electronics Character-ization in a tomograph with 160kV cannon power and a maximum resolution of 0,5μm, which performs x-ray images of specimens with total volume of 1,0cm³.In order to obtain images, it was extracted a sample with 22mm in diameter and 30mm in height of a prismatic test specimen with 50mm in diameter and 100mm in height (Figure 4).The images of the internal microstructure were captured from the same sample used for the 3D microtomography analysis. How-ever, the sample was fragmented in a surface to enable the visu-alization of the fibers interaction with the composite. The analysis was also performed by SEM at the Technological Institute in Func-
tional Safety Testing, itt Fuse, in Unisinos University. The equip-ment used is a SEM with EDS chemical analyzer, which allows the generation of images with resolution up to 3nm with 700.000x magnification and 30kV of measurement energy and can operate in low and high vacuum. The test was performed in low and high vacuum, where the fibers’ bonding was observed in low vacuum and the investigation of hydrated crystals existence was performed in high vacuum.
3. Results and discussion
3.1 3D microtomography
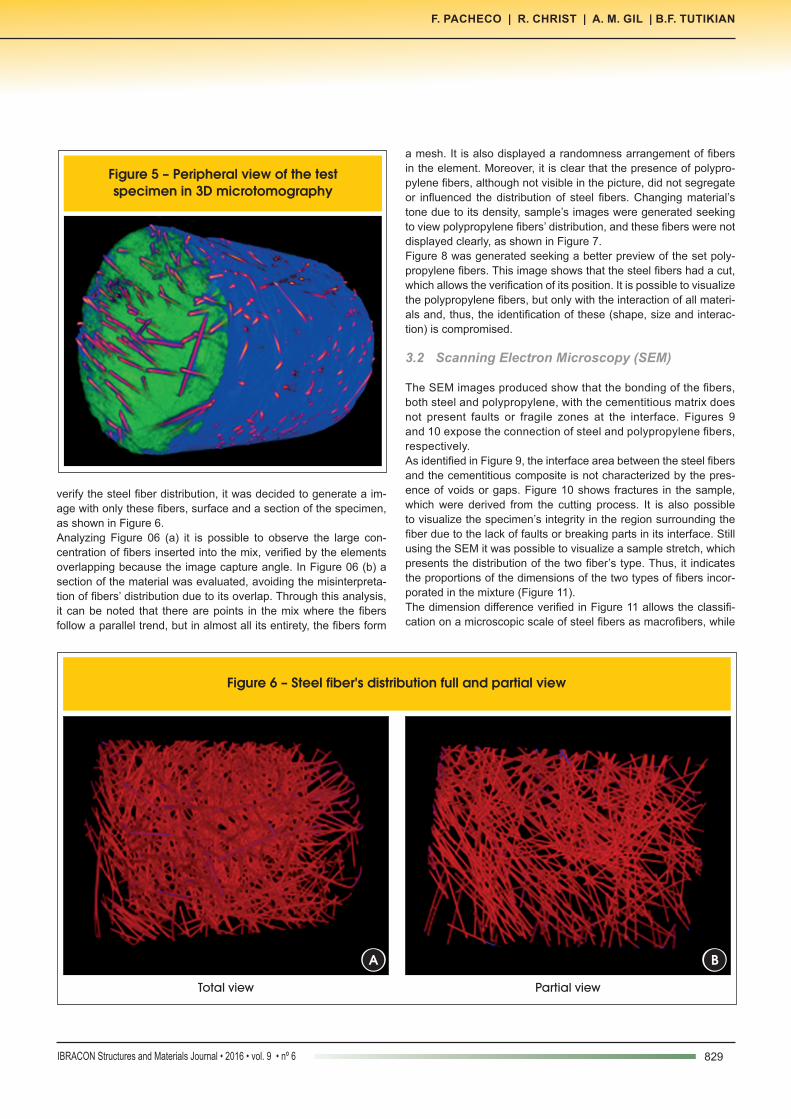
Figure 5 shows the analyzed sample in its actual size. It is possible to observe that the density difference of the materials incorporated into the mixture is represented by the color difference. The ce-mentitious matrix of the sample is displayed in green and the steel fibers in red, distributed throughout the sample. The polypropylene fibers have not been identified due to its low density. In order to
Table 4 – Mix proportion used in the production of advanced composite cementitious
Materials Unit mix Mix in kg/m3
Cement
1
0,44
573,59
251,80
Silica 0,37 213,88
Fly ash 0,19 107,91
Foundry sand
2,39
1,02
1370,82
583,33
Fine sand 0,86 495,83
Quartz powder 0,51 291,66
Water 0,22* 126,19
Superplasticizer 0,03* 17,21
Viscosity modifier 0,01* 5,74
Steel fiber 0,748 188,4**
Polypropylene fiber 0,021 5,46**
*Addition content in the binder;** Values related to the mass of advanced composite cementitious.
Figure 4 – Sample used for the 3D microtomography analysis
829IBRACON Structures and Materials Journal • 2016 • vol. 9 • nº 6
F. PACHECO | R. CHRIST | A. M. GIL | B.F. TUTIKIAN
verify the steel fiber distribution, it was decided to generate a im-age with only these fibers, surface and a section of the specimen, as shown in Figure 6.Analyzing Figure 06 (a) it is possible to observe the large con-centration of fibers inserted into the mix, verified by the elements overlapping because the image capture angle. In Figure 06 (b) a section of the material was evaluated, avoiding the misinterpreta-tion of fibers’ distribution due to its overlap. Through this analysis, it can be noted that there are points in the mix where the fibers follow a parallel trend, but in almost all its entirety, the fibers form
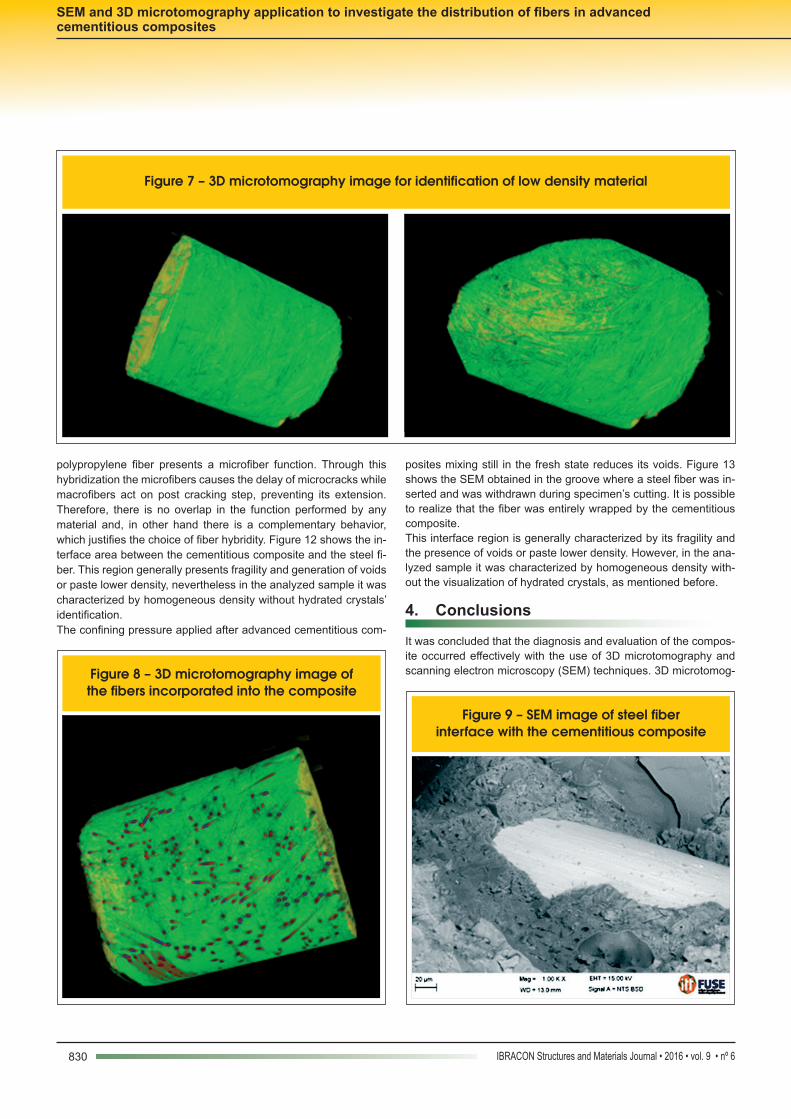
a mesh. It is also displayed a randomness arrangement of fibers in the element. Moreover, it is clear that the presence of polypro-pylene fibers, although not visible in the picture, did not segregate or influenced the distribution of steel fibers. Changing material’s tone due to its density, sample’s images were generated seeking to view polypropylene fibers’ distribution, and these fibers were not displayed clearly, as shown in Figure 7.Figure 8 was generated seeking a better preview of the set poly-propylene fibers. This image shows that the steel fibers had a cut, which allows the verification of its position. It is possible to visualize the polypropylene fibers, but only with the interaction of all materi-als and, thus, the identification of these (shape, size and interac-tion) is compromised.
3.2 Scanning Electron Microscopy (SEM)
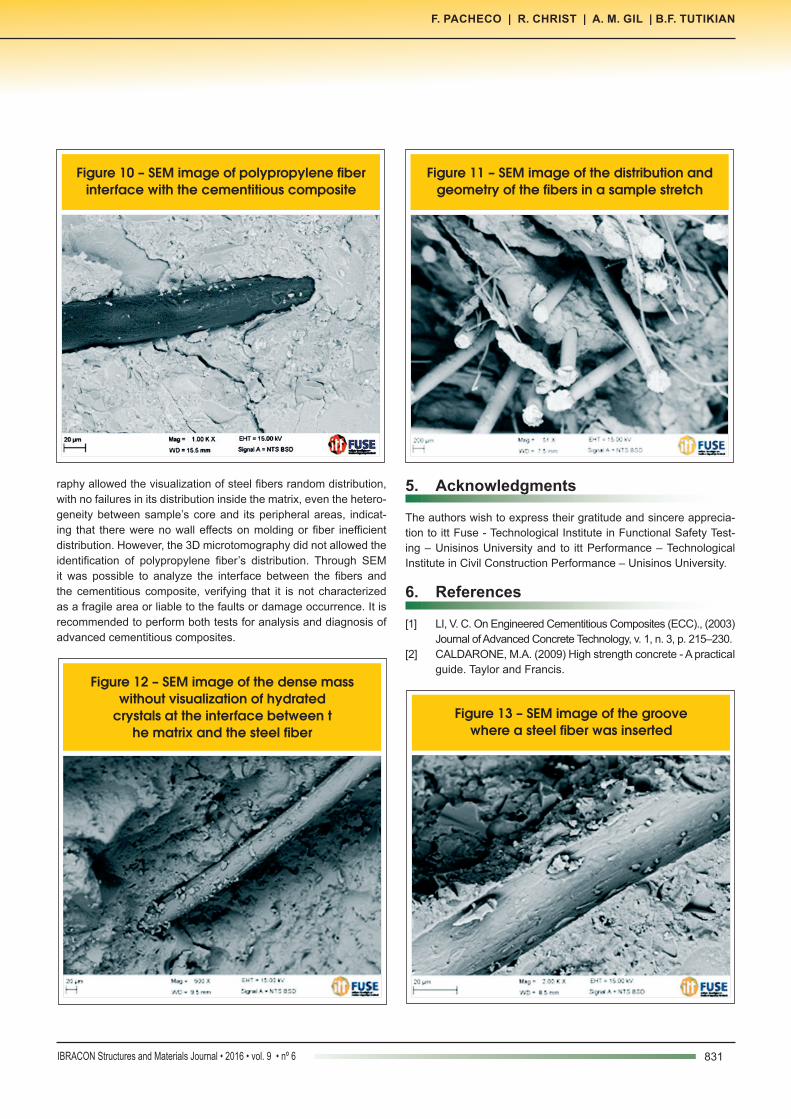
The SEM images produced show that the bonding of the fibers, both steel and polypropylene, with the cementitious matrix does not present faults or fragile zones at the interface. Figures 9 and 10 expose the connection of steel and polypropylene fibers, respectively.As identified in Figure 9, the interface area between the steel fibers and the cementitious composite is not characterized by the pres-ence of voids or gaps. Figure 10 shows fractures in the sample, which were derived from the cutting process. It is also possible to visualize the specimen’s integrity in the region surrounding the fiber due to the lack of faults or breaking parts in its interface. Still using the SEM it was possible to visualize a sample stretch, which presents the distribution of the two fiber’s type. Thus, it indicates the proportions of the dimensions of the two types of fibers incor-porated in the mixture (Figure 11).The dimension difference verified in Figure 11 allows the classifi-cation on a microscopic scale of steel fibers as macrofibers, while
Figure 5 – Peripheral view of the test specimen in 3D microtomography
A B
Figure 6 – Steel fiber's distribution full and partial view
Total view Partial view
830 IBRACON Structures and Materials Journal • 2016 • vol. 9 • nº 6
SEM and 3D microtomography application to investigate the distribution of fibers in advanced cementitious composites
polypropylene fiber presents a microfiber function. Through this hybridization the microfibers causes the delay of microcracks while macrofibers act on post cracking step, preventing its extension. Therefore, there is no overlap in the function performed by any material and, in other hand there is a complementary behavior, which justifies the choice of fiber hybridity. Figure 12 shows the in-terface area between the cementitious composite and the steel fi-ber. This region generally presents fragility and generation of voids or paste lower density, nevertheless in the analyzed sample it was characterized by homogeneous density without hydrated crystals’ identification.The confining pressure applied after advanced cementitious com-
posites mixing still in the fresh state reduces its voids. Figure 13 shows the SEM obtained in the groove where a steel fiber was in-serted and was withdrawn during specimen’s cutting. It is possible to realize that the fiber was entirely wrapped by the cementitious composite.This interface region is generally characterized by its fragility and the presence of voids or paste lower density. However, in the ana-lyzed sample it was characterized by homogeneous density with-out the visualization of hydrated crystals, as mentioned before.
4. Conclusions
It was concluded that the diagnosis and evaluation of the compos-ite occurred effectively with the use of 3D microtomography and scanning electron microscopy (SEM) techniques. 3D microtomog-
Figure 7 – 3D microtomography image for identification of low density material
Figure 8 – 3D microtomography image of the fibers incorporated into the composite
Figure 9 – SEM image of steel fiber interface with the cementitious composite
831IBRACON Structures and Materials Journal • 2016 • vol. 9 • nº 6
F. PACHECO | R. CHRIST | A. M. GIL | B.F. TUTIKIAN
raphy allowed the visualization of steel fibers random distribution, with no failures in its distribution inside the matrix, even the hetero-geneity between sample’s core and its peripheral areas, indicat-ing that there were no wall effects on molding or fiber inefficient distribution. However, the 3D microtomography did not allowed the identification of polypropylene fiber’s distribution. Through SEM it was possible to analyze the interface between the fibers and the cementitious composite, verifying that it is not characterized as a fragile area or liable to the faults or damage occurrence. It is recommended to perform both tests for analysis and diagnosis of advanced cementitious composites.
5. Acknowledgments
The authors wish to express their gratitude and sincere apprecia-tion to itt Fuse - Technological Institute in Functional Safety Test-ing – Unisinos University and to itt Performance – Technological Institute in Civil Construction Performance – Unisinos University.
6. References
[1] LI, V. C. On Engineered Cementitious Composites (ECC)., (2003) Journal of Advanced Concrete Technology, v. 1, n. 3, p. 215–230.
[2] CALDARONE, M.A. (2009) High strength concrete - A practical guide. Taylor and Francis.
Figure 10 – SEM image of polypropylene fiber interface with the cementitious composite
Figure 11 – SEM image of the distribution and geometry of the fibers in a sample stretch
Figure 12 – SEM image of the dense mass without visualization of hydrated
crystals at the interface between the matrix and the steel fiber
Figure 13 – SEM image of the groove where a steel fiber was inserted
832 IBRACON Structures and Materials Journal • 2016 • vol. 9 • nº 6
SEM and 3D microtomography application to investigate the distribution of fibers in advanced cementitious composites
[3] BLAIS, P.Y, COUTURE, M. (1999). Precast, prestressed pedestrian bridge- World´s first Reactive Powder Concrete Structure. PCI Journal.
[4] MARCOLIN, N. Criação no concreto (2006). Revista Pes-quisa Fapesp, n°127.
[5] NEVILLE, A.M; BROOKS, J.J. (2014) Concrete Technology. Trans-Atlantic Publications; 2nd Revised edition.
[6] DAWOOD, E. T.; RAMLI, M. Contribution of Hybrid Fibers on the Properties of High Strength Concrete Having High Work-ability. Procedia Engineering, jan. 2011. v. 14, p. 814–820.
[7] BANTHIA, N.; GUPTA, R. Hybrid fiber reinforced concrete (HyFRC): fiber synergy in high strength matrices. Materials and Structures, dez. 2004. v. 37, n. 10, p. 707–716.
[8] PIZZOL, V.D; MENDES, L.M; FREZATTI, L; SAVASTANO Jr, H; TONOLI, G.H.D. Effect of accelerated carbonation on the microstructure and physical properties of hybrid fiber-cement composites. Minerals Engineering. Volume 59, January 2014, p. 101–106.
[9] PROMENTILLA, M.A.B (2011) MAB. Characterizing the mi-crostructure of deteriorated cementitious materials with x-ray microtomography. ASEAN Eng J 2011; 1. Online Referenc-ing, http://www.seed-net.org/ASEANEJ_1-4.html (2013, ac-cessado em 15 de dezembro de 2015.
[10] LANDIS, E.N; NAGY, E.N; KEANE, D.T; NAGY, G. Technique to measure 3D work-of-fracture of concrete in compression (1999) J. Eng. Mech. 125: 599-605.
[11] APPOLONI, C.R; FERNANDES, C.P; RODRIGUES, C.R.O. X-ray microtomography study of a sandstone reservoir rock. Nucl Instrum Meth A 580: 629-632.
[12] MACHADO, A. C; SILVA, M.A; FILHO, R.D.T; PFEIL, M.S; LIMA, I; LOPES, R.T.(2015) Investigação 3D da distribuição de fibras de aço em concreto reforçado por microtomografia de raios X.RIEM, nº8.
[13] ABDIN. Y. et al. Geometrical characterization and micro-structural modeling of short steel fiber composites. Com-posites Manufacturing and Composites. Volume 67, Decem-ber 2014, Pages 171-180.
[14] MAROLIYA, M.K (2012). Sustainability of ultra high strength reactive poder concrete. International journal of engineering research and development. Volume 4, Issue, 4, p 44-57.
[15] YAZICI, H; YIGITER, H; KARABULUT, A.S; BARADAN, B. (2008) Utilization of fly ash and ground granulated blast fur-nace slag as an alternative silica source in reactive powder concrete. Fuel, Nº87, p 2401-2407.
[16] HENRY, M; DARMA, I.V; SUGIYAMA, T. (2014) Analysis of the effect of heating and re-curing on the microstructure of high-strength concrete using X-ray CT. Construction and building materials, 67, p37-46.
[17] CHRIST, R; TUTIKIAN, B. (2013) Study of pressure and cur-ing temperature in Reactive Powder Concretes (RPC) with different amounts of Metallic Microfibers. Revista de la Con-strucción. Volumen 12-p 32-40.