selkirk tree farm licence 55 - lp building products · this is the first management plan (mp)...
TRANSCRIPT

Louisiana-Pacific Canada Ltd.
Tree Farm Licence 55
DRAFT MANAGEMENT PLAN #5
Date: August 2016
Fernando Cocciolo RPF 2226 “I certify that the work described
herein fulfills the standards expected
of a member of the Association of British
Columbia Forest Professionals”
TABLE OF CONTENTS
Page
1.0 Introduction ............................................................................................................ 1
2.0 Location and description ..................................................................................... 1
3.0 TFL 55 Licence Holder History ............................................................................ 2
4.0 TFL 55 Consolidations and Subdivisions............................................................ 3
5.0 Major TFL 55 Boundary Changes ......................................................................... 3
6.0 TFL 55 Planning Documents ................................................................................ 3
7.0 Public Review Strategy Summary ........................................................................ 4
7.1 Summary of Revisions
Appendices Appendix A: Timber Supply Analysis Report .............................................................. X Appendix B: Accepted Information Package for Timber Supply Analysis ................ X
List of Figures Figure 1: TFL 55 Overview Map ................................................................................ 2
List of Tables
Table 1: TFL 55 Licence Holders ............................................................................ 3

This page intentionally left blank

TFL 55 Management Plan #5 [1]
1 INTRODUCTION
This is the first Management Plan (MP) prepared for Tree Farm Licence 55 (TFL) to meet the requirements of the Tree Farm Licence Management Plan Regulation (B.C. Reg. 280/2009). This regulation, enacted by the provincial government in November 2009 (with associated amendments to the Forest Act), includes content requirements, submission timing and public review requirements for TFL Management Plans. These content requirements (in regulation) replace the MP content requirements listed in the tree farm licence document and reduce the duplication of Forest Stewardship Plan matters (objectives and strategies). The content item of the greatest interest is likely the timber supply analysis that will provide information to the Chief Forester of BC for the determination of the next Allowable Annual Cut (AAC) for TFL 55.
2 LOCATION AND DESCRIPTION
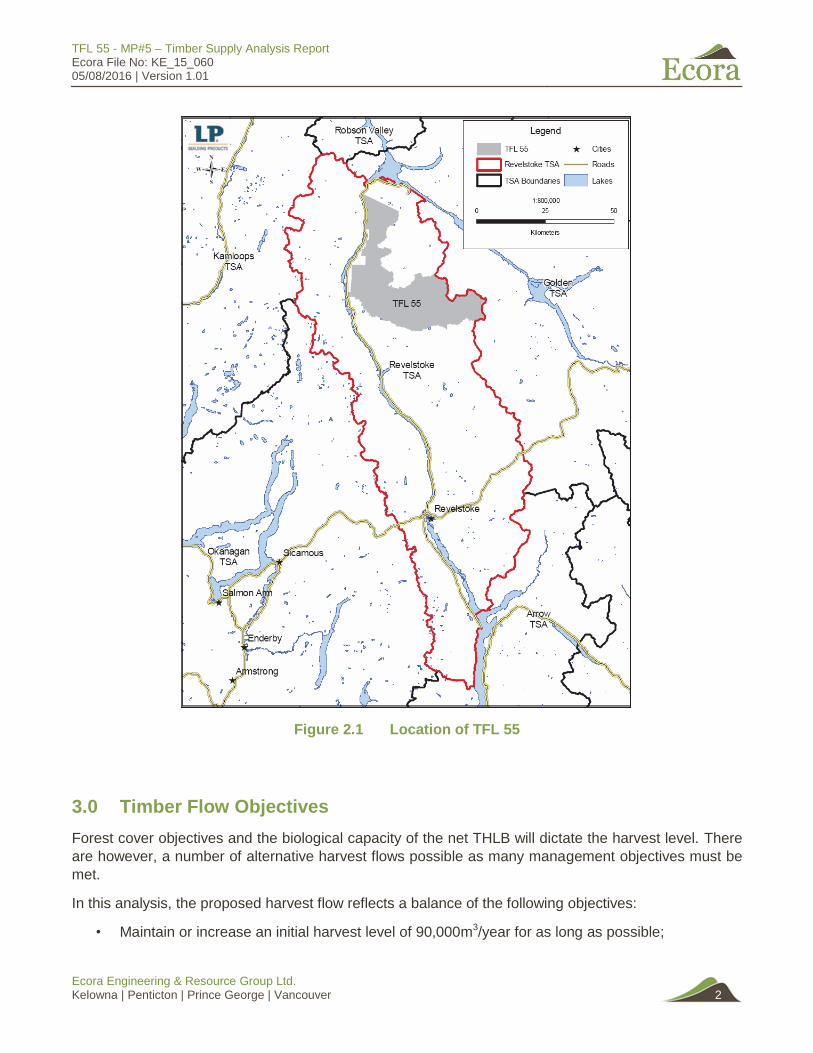
The TFL is situated in the Selkirk Mountains north of Revelstoke National Park between Goldstream River and Mica Creek along the eastside of the Revelstoke Reservoir. The gross area of the TFL 55 is 92,642 hectares. Approximately 55,585 hectares of this or 58% is considered to be productive forest.
The City of Revelstoke is the largest community in the region and is a service and government administrative centre for the local economy. Highway 23, which traverses along the eastside of the Revelstoke Reservoir to Mica townsite, provides the primary access to the tree farm licence. The southwest corner of the TFL at Goldstream River is 85 kilometres north of Revelstoke. The overview map (Figure 1) highlights the boundaries of the TFL in relation to the surrounding communities and regional features. TFL 55 lies in the interior wet-belt and is covered in part by three biogeoclimatic zones: alpine tundra, interior cedar-hemlock and Englemann spruce-subalpine fir. The forests are mixtures of predominately hemlock, cedar, Douglas-fir types at lower elevations with balsam-spruce types at higher elevations. The climate is characterized by warm summers and cool winters, marked by characteristically heavy rainfall and high levels of winter snowfall.
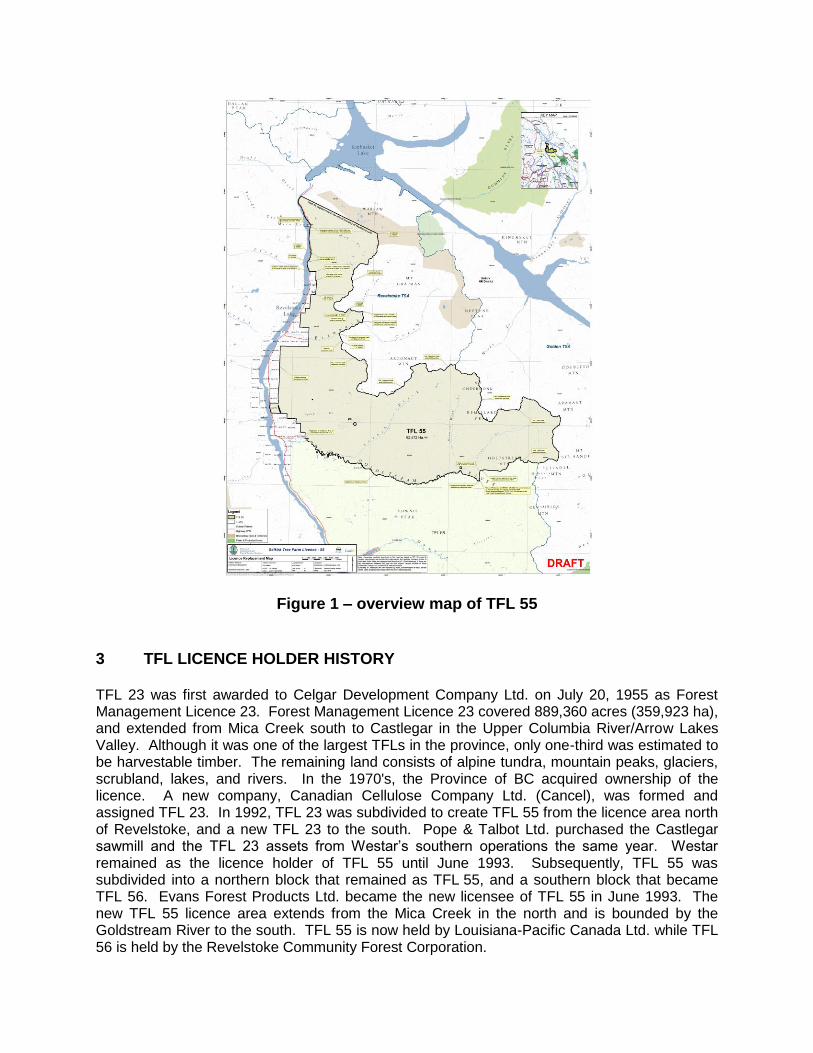
Figure 1 – overview map of TFL 55
3 TFL LICENCE HOLDER HISTORY TFL 23 was first awarded to Celgar Development Company Ltd. on July 20, 1955 as Forest Management Licence 23. Forest Management Licence 23 covered 889,360 acres (359,923 ha), and extended from Mica Creek south to Castlegar in the Upper Columbia River/Arrow Lakes Valley. Although it was one of the largest TFLs in the province, only one-third was estimated to be harvestable timber. The remaining land consists of alpine tundra, mountain peaks, glaciers, scrubland, lakes, and rivers. In the 1970's, the Province of BC acquired ownership of the licence. A new company, Canadian Cellulose Company Ltd. (Cancel), was formed and assigned TFL 23. In 1992, TFL 23 was subdivided to create TFL 55 from the licence area north of Revelstoke, and a new TFL 23 to the south. Pope & Talbot Ltd. purchased the Castlegar sawmill and the TFL 23 assets from Westar’s southern operations the same year. Westar remained as the licence holder of TFL 55 until June 1993. Subsequently, TFL 55 was subdivided into a northern block that remained as TFL 55, and a southern block that became TFL 56. Evans Forest Products Ltd. became the new licensee of TFL 55 in June 1993. The new TFL 55 licence area extends from the Mica Creek in the north and is bounded by the Goldstream River to the south. TFL 55 is now held by Louisiana-Pacific Canada Ltd. while TFL 56 is held by the Revelstoke Community Forest Corporation.
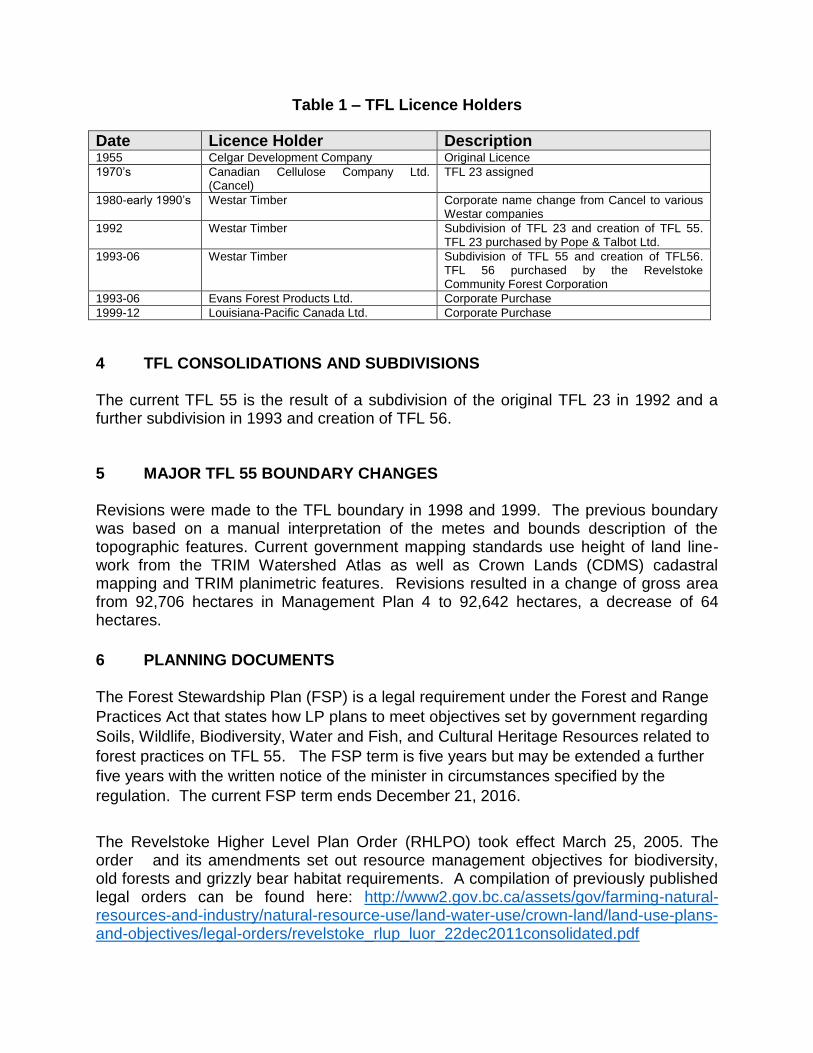
Table 1 – TFL Licence Holders
Date Licence Holder Description 1955 Celgar Development Company Original Licence
1970’s Canadian Cellulose Company Ltd. (Cancel)
TFL 23 assigned
1980-early 1990’s Westar Timber Corporate name change from Cancel to various Westar companies
1992 Westar Timber Subdivision of TFL 23 and creation of TFL 55. TFL 23 purchased by Pope & Talbot Ltd.
1993-06 Westar Timber Subdivision of TFL 55 and creation of TFL56. TFL 56 purchased by the Revelstoke Community Forest Corporation
1993-06 Evans Forest Products Ltd. Corporate Purchase
1999-12 Louisiana-Pacific Canada Ltd. Corporate Purchase
4 TFL CONSOLIDATIONS AND SUBDIVISIONS The current TFL 55 is the result of a subdivision of the original TFL 23 in 1992 and a further subdivision in 1993 and creation of TFL 56. 5 MAJOR TFL 55 BOUNDARY CHANGES Revisions were made to the TFL boundary in 1998 and 1999. The previous boundary was based on a manual interpretation of the metes and bounds description of the topographic features. Current government mapping standards use height of land line-work from the TRIM Watershed Atlas as well as Crown Lands (CDMS) cadastral mapping and TRIM planimetric features. Revisions resulted in a change of gross area from 92,706 hectares in Management Plan 4 to 92,642 hectares, a decrease of 64 hectares.
6 PLANNING DOCUMENTS The Forest Stewardship Plan (FSP) is a legal requirement under the Forest and Range
Practices Act that states how LP plans to meet objectives set by government regarding
Soils, Wildlife, Biodiversity, Water and Fish, and Cultural Heritage Resources related to
forest practices on TFL 55. The FSP term is five years but may be extended a further
five years with the written notice of the minister in circumstances specified by the
regulation. The current FSP term ends December 21, 2016.
The Revelstoke Higher Level Plan Order (RHLPO) took effect March 25, 2005. The order and its amendments set out resource management objectives for biodiversity, old forests and grizzly bear habitat requirements. A compilation of previously published legal orders can be found here: http://www2.gov.bc.ca/assets/gov/farming-natural-resources-and-industry/natural-resource-use/land-water-use/crown-land/land-use-plans-and-objectives/legal-orders/revelstoke_rlup_luor_22dec2011consolidated.pdf

7 PUBLIC REVIEW STRATEGY
This section will be completed following the review period and will be included in the final management plan submission.

APPENDIX A Timber Supply Analysis

Ecora Engineering & Resource Group Ltd. 601 West Broadway, Unit 14, Vancouver, BC V5Z 4C2 | P: 250.469.9757 Ext. 1031 | www.ecora.ca
Tree Farm Licence 55 Management Plan #5 Timber Supply Analysis Report
Presented To
Louisiana Pacific – Malakwa Division
Dated: August 2016
Ecora File No.: KE_15_060

TFL 55 - MP#5 – Timber Supply Analysis Report Ecora File No: KE_15_060 05/08/2016 | Version 1.01
Ecora Engineering & Resource Group Ltd. Kelowna | Penticton | Prince George | Vancouver
THIS PAGE IS INTENTIONALLY LEFT BLANK
TFL 55 - MP#5 – Timber Supply Analysis Report Ecora File No: KE_15_060 05/08/2016 | Version 1.01
Ecora Engineering & Resource Group Ltd. Kelowna | Penticton | Prince George | Vancouver
Presented To:
Louisiana Pacific Corporation 4872 Lybarger Road Malakwa, BC V0E2J0
Prepared by:
Jerry Miehm, RPF Senior Resource Analyst Direct Line: 250.469.9757 x1031 [email protected]
Date
]
Version Control and Revision History
Version Date Prepared By Reviewed By Notes/Revisions
1.01 23/08/2016 Miehm LP Staff Draft for public review

TFL 55 - MP#5 – Timber Supply Analysis Report Ecora File No: KE_15_060 05/08/2016 | Version 1.01
Ecora Engineering & Resource Group Ltd. Kelowna | Penticton | Prince George | Vancouver

TFL 55 - MP#5 – Timber Supply Analysis Report Ecora File No: KE_15_060 05/08/2016 | Version 1.01
Ecora Engineering & Resource Group Ltd. Kelowna | Penticton | Prince George | Vancouver i
Table of Contents
1.0 Introduction ................................................................................................................... 1
2.0 General Description of the Land Base and Tenure .................................................... 1
3.0 Timber Flow Objectives ................................................................................................ 2
4.0 Land Base Information ................................................................................................. 3
5.0 Timber Supply Analysis Methods ................................................................................ 6
5.1 Model Description ........................................................................................................... 6
5.2 Timber Supply Modelling ................................................................................................ 6
6.0 Timber Supply Analysis ............................................................................................... 6
6.1 Base Case ...................................................................................................................... 6
7.0 Sensitivity Analysis .................................................................................................... 14
7.1 Timber Harvesting Land Base ...................................................................................... 15
7.2 Stand Yield ................................................................................................................... 16
7.2.1 Natural Stands +/- 10% ..................................................................................... 16
7.2.2 Natural Stands – VDYP Phase 2 ....................................................................... 17
7.2.3 Managed Stands +/- 10% .................................................................................. 17
7.2.4 Genetic Gain ..................................................................................................... 18
7.3 Site Productivity ............................................................................................................ 19
7.3.1 PSI Instead of SIBEC Site Index ....................................................................... 19
7.3.2 VRI SI Instead of SIBEC ................................................................................... 20
7.3.3 Managed Stand SI +/- 1 m ................................................................................ 20
7.4 Management Assumptions ........................................................................................... 21
7.4.1 IRM Instead of Patch Size ................................................................................. 21
7.4.2 Minimum Harvest Age Assumptions .................................................................. 22
8.0 Discussion of Results ................................................................................................ 23
List of Tables in Text
Table 4.1 Base Case Timber Harvesting Land Base Determination ............................................... 3
Table 4.2 Leading Species Distribution .......................................................................................... 4
Table 7.1 Sensitivity Analysis Runs .............................................................................................. 15

TFL 55 - MP#5 – Timber Supply Analysis Report Ecora File No: KE_15_060 05/08/2016 | Version 1.01
Ecora Engineering & Resource Group Ltd. Kelowna | Penticton | Prince George | Vancouver ii
List of Figures in Text
Figure 2.1 Location of TFL 55 .......................................................................................................... 2
Figure 4.1 Age Class Distribution .................................................................................................... 4
Figure 4.2 Leading Species Distribution .......................................................................................... 5
Figure 6.1 Annual Harvest Volume (m3/year) ................................................................................... 7
Figure 6.2 Growing Stock (m3) on the THLB .................................................................................... 8
Figure 6.3 Age Class Distribution of the THLB ................................................................................. 8
Figure 6.4 Average Annual Area Harvested (ha) ............................................................................. 9
Figure 6.5 Average Harvest Age (years) ........................................................................................ 10
Figure 6.6 Average Harvest Volume (m3/ha).................................................................................. 10
Figure 6.7 ‘Shrub/Herb’ Patch Size Distribution in the R17 Landscape Unit (%) ............................ 11
Figure 6.8 ‘Old’ Patch Size Distribution in the R17 Landscape Unit (%) ......................................... 12
Figure 6.9 ‘Shrub/Herb’ Patch Size Distribution in the R5 Landscape Unit (%) .............................. 13
Figure 6.10 ‘Old’ Patch Size Distribution in the R5 Landscape Unit (%) ........................................... 14
Figure 7.1 Harvest Level Impact of THLB Uncertainty ................................................................... 16
Figure 7.2 Harvest Level Impact of Natural Stand Yield Uncertainty .............................................. 17
Figure 7.3 Harvest Level with VDYP6 Phase 2 .............................................................................. 17
Figure 7.4 Harvest Level Impact of Managed Stand Yield Uncertainty ........................................... 18
Figure 7.5 Harvest Level Impact of Genetic Gain Assumptions ..................................................... 18
Figure 7.6 Harvest Level Impact of Using PSI for MSYT ................................................................ 19
Figure 7.7 Harvest Level Impact of Using VRI SI for MSYT ........................................................... 20
Figure 7.8 Harvest Level Impact of MSYT SI Variation .................................................................. 21
Figure 7.9 Harvest Level Impact – IRM Instead of Patch Size ....................................................... 22
Figure 7.10 Harvest Level Impact of MHA Changes ........................................................................ 22
Appendices
Appendix A
Information Package

TFL 55 - MP#5 – Timber Supply Analysis Report Ecora File No: KE_15_060 05/08/2016 | Version 1.01
Ecora Engineering & Resource Group Ltd. Kelowna | Penticton | Prince George | Vancouver iii
Acronyms and Abbreviations
BEC Biogeoclimatic Ecosystem Classification CMAI Culmination Mean Annual Increment DBH Diameter – Breast Height DIB Diameter Inside Bark LP Louisiana Pacific LRSY Long-run Sustained Yield MAI Mean Annual Increment MFLNRO Ministry of Forests, Lands and Natural Resource Operations MP Management Plan MSYT Managed Stand Yield Table NDT Natural Disturbance Type NROV Natural Range of Variation NSYT Natural Stand Yield Table RHLPO Revelstoke Higher Level Plan Order SIA Site Index Adjustment (J.S. Thrower and Associates Ltd.) SIBEC Site Index Estimates by BEC Site Series TFL Tree Farm Licence THLB Timber Harvesting Land Base TIPSY Table Interpolation for Stand Yields VDYP Variable Density Yield Prediction VRI Vegetation Resources Inventory WTP Wildlife Tree Patch

TFL 55 - MP#5 – Timber Supply Analysis Report Ecora File No: KE_15_060 05/08/2016 | Version 1.01
Ecora Engineering & Resource Group Ltd. Kelowna | Penticton | Prince George | Vancouver 1
1.0 Introduction
Louisiana Pacific Ltd. (LP) must complete a timber supply analysis for TFL 55 in conjunction with the
Management Planning process that is required by legislation and the terms of the licence. An
Information Package describing the spatial data, yield forecasts and management assumption that
would underpin the timber supply analysis was prepared and submitted to the Ministry of Forest, Lands
and Natural Resource Operations (MFLNRO) and was also advertised for public review. It was
accepted by MFLNRO on 8 June 2016 as an adequate basis upon which to prepare timber supply
forecasts for the TFL.
The next step in the timber supply analysis process is the preparation of a base case timber supply
forecast. Timber supply is the quantity of timber available for harvest over time. It is dynamic, not only
because trees naturally grow and die, but also because conditions that affect tree growth, and the
social and economic environment that affect the availability of timber for harvest, change with time.
Timber supply analysis is the process of assessing and predicting the current and future supply from a
management unit. This has been done using Patchworks, a forest estate model that facilitates the
preparation of data, application of management practices and other rules, and produces outputs
describing the harvest flow and the future condition of the landbase with respect to timber and other
resource values. The results are presented in this document (the Analysis Report), along with the
results of many sensitivity analysis runs that examine the timber supply impacts of changes in
management assumptions and model input.
This Analysis Report will be circulated for public review in conjunction with a draft of Management Plan
(MP) #5 for the TFL. The MP will include a history of the TFL and a summary of the feedback received;
the final versions of the Information Package and Analysis Report will be included as Appendices.
Once this second public review process is complete, these documents will be submitted to the Chief
Forester to assist in making an AAC determination for the TFL. Upon completion of that review, the
AAC Rationale document will be appended to the finalized version of Management Plan #5. This
information will be used by the Chief Forester of British Columbia in determining a permissible harvest
level for TFL 55.
2.0 General Description of the Land Base and Tenure
Tree Farm Licence 55 (TFL 55) is located in the Selkirk Mountains between the Revelstoke Reservoir
and Kinbasket Lake (see Figure 1.1). The total area of the TFL is 92,642 hectares. Of this total, 53,585
hectares is considered to be productive forest land, and 29.7% (16,007 hectares) of that is available for
timber harvesting.
TFL 55 - MP#5 – Timber Supply Analysis Report Ecora File No: KE_15_060 05/08/2016 | Version 1.01
Ecora Engineering & Resource Group Ltd. Kelowna | Penticton | Prince George | Vancouver 2
Figure 2.1 Location of TFL 55
3.0 Timber Flow Objectives
Forest cover objectives and the biological capacity of the net THLB will dictate the harvest level. There
are however, a number of alternative harvest flows possible as many management objectives must be
met.
In this analysis, the proposed harvest flow reflects a balance of the following objectives:
• Maintain or increase an initial harvest level of 90,000m3/year for as long as possible;
TFL 55 - MP#5 – Timber Supply Analysis Report Ecora File No: KE_15_060 05/08/2016 | Version 1.01
Ecora Engineering & Resource Group Ltd. Kelowna | Penticton | Prince George | Vancouver 3
Decrease the periodic harvest rate in no greater than 10% steps when declines are required to
meet all objectives on the landbase;
• Achieve an even-flow long term supply over a 250-year time horizon; and
• Maintain a growing stock level at the end of the planning horizon that will support continuing
operations.
The current AAC for TFL 55 is 90,000 m3/year, including allocation to the British Columbia Timber
Sales Program (BCTS). In addition, an allowance must be made for non-recoverable losses. Since the
timber supply analysis is based on the net harvest plus NRLs, the initial gross harvest level for the Base
Case analysis has been set to 90,916 m3/year, providing a starting point for the analysis. (Unsalvaged
loss calculations are described in the Information Package.)
4.0 Land Base Information
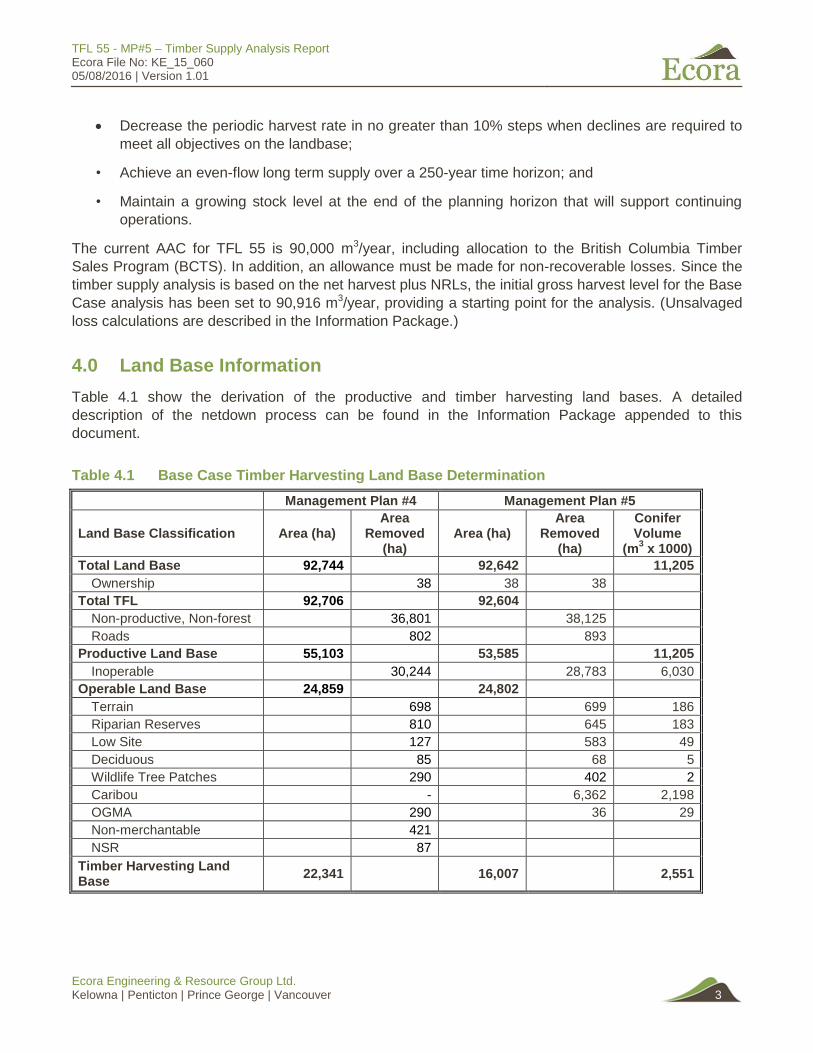
Table 4.1 show the derivation of the productive and timber harvesting land bases. A detailed
description of the netdown process can be found in the Information Package appended to this
document.
Table 4.1 Base Case Timber Harvesting Land Base Determination
Management Plan #4 Management Plan #5
Land Base Classification Area (ha) Area
Removed (ha)
Area (ha) Area
Removed (ha)
Conifer Volume
(m3 x 1000)
Total Land Base 92,744 92,642 11,205
Ownership
38 38 38
Total TFL 92,706 92,604
Non-productive, Non-forest 36,801 38,125
Roads 802 893
Productive Land Base 55,103 53,585 11,205
Inoperable
30,244
28,783 6,030
Operable Land Base 24,859 24,802
Terrain 698 699 186
Riparian Reserves 810 645 183
Low Site 127 583 49
Deciduous 85 68 5
Wildlife Tree Patches 290 402 2
Caribou - 6,362 2,198
OGMA 290 36 29
Non-merchantable 421
NSR 87
Timber Harvesting Land Base
22,341 16,007 2,551

TFL 55 - MP#5 – Timber Supply Analysis Report Ecora File No: KE_15_060 05/08/2016 | Version 1.01
Ecora Engineering & Resource Group Ltd. Kelowna | Penticton | Prince George | Vancouver 4
Figure 6.1 summarizes the productive and net area of the TFL by 10-year age class.
Figure 4.1 Age Class Distribution
Table 4.2 and Figure 4.2 summarize the distribution of area by leading species for both the productive
and timber harvesting land base.
Table 4.2 Leading Species Distribution
Species Code Productive Area (ha) THLB (ha)
None 849.9 605.4
AC 167.5 47.4
AT 71.8 0.0
BA 26.1 25.3
BL 14,625.9 637.7
CW 5,516.2 2,204.0
EP 53.7 3.9
FD 603.3 389.8
FDI 2,487.6 1,053.6
H 283.5 31.4
HM 1,283.3 256.3
HW 6,171.7 2,402.6
PA 13.2 0.0
PL 48.8 23.1

TFL 55 - MP#5 – Timber Supply Analysis Report Ecora File No: KE_15_060 05/08/2016 | Version 1.01
Ecora Engineering & Resource Group Ltd. Kelowna | Penticton | Prince George | Vancouver 5
Approximately half of the THLB is made up of spruce-leading stands. Hemlock-, cedar-, and Douglas-fir
make up most of the remaining THLB, in roughly equal amounts. Almost all of the THLB area without a
leading species in the forest cover data is comprised of recently harvested stands.
Figure 4.2 Leading Species Distribution
S 3.0 1.3
SE 15,696.2 2,929.2
SW 31.6 20.8
SX 5,651.8 5,312.9
TFL 55 - MP#5 – Timber Supply Analysis Report Ecora File No: KE_15_060 05/08/2016 | Version 1.01
Ecora Engineering & Resource Group Ltd. Kelowna | Penticton | Prince George | Vancouver 6
5.0 Timber Supply Analysis Methods
5.1 Model Description
Patchworks is a spatially explicit harvest scheduling optimization model developed by Spatial Planning
Systems in Ontario. It has been used to develop spatially explicit harvest allocations to explore the
trade-off between a broad range of conflicting management and harvest goals. Patchworks is a
multiple-objective goal-programming model and can be described as consisting of two components:
1. A GIS interface with map viewer and viewer functions; and
2. A harvest scheduler that runs continuously in the background - searching for improvements in
the allocation to improve the value of the objective function. The model seeks a solution that
maximizes the value of the total objective function. The objective function will be made up of
both the traditional (management plan) objectives and the additional requirements and
indicators. In areas of timber management, the harvest schedule will be optimized (both the
current and future forecasted land base) for timber flow requirements and to minimize the
environmental risk, as measured by the established indicators.
5.2 Timber Supply Modelling
Timber supply analysis for the full two hundred and fifty (250) year planning horizon was carried out
using a 250-year time horizon to ensure that short and medium term harvest targets do not compromise
long term growing stock stability. This was modeled in fifty five-year periods. Modelled harvest levels
included allowances for non-recoverable losses (NRLs). Harvest figures reported here include this
amount (916 m3/ha).
6.0 Timber Supply Analysis
This section provides an overview of the options that have been evaluated in the timber supply
analysis.
6.1 Base Case
The base case reflects current management performance as of 2015. The analysis will incorporate the
following:
Vegetation resource inventory (VRI) updated with harvest blocks and other updates that have
occurred since the original inventory mapping was completed;;
Operability mapping – reviewed and slightly amended for this project – that shows where timber
harvesting is operationally feasible;
Ecosystem-based analysis units and silvicultural prescriptions;
Improved managed stand site productivity estimates based on the most recent SIBEC data;
TFL 55 - MP#5 – Timber Supply Analysis Report Ecora File No: KE_15_060 05/08/2016 | Version 1.01
Ecora Engineering & Resource Group Ltd. Kelowna | Penticton | Prince George | Vancouver 7
Patch size modelling for the entire planning horizon;
Application of current genetic gains to managed stand yields;
Implementation of the Revelstoke Higher Level Plan Order (as amended in 2011); and
Implementation of Mountain Caribou GAR Order U-3-005 (2009, amended 2010).
The base case timber supply scenario has been run for TFL 55 using the Patchworks forest estate
model. The criteria laid out in the accepted Information Package have been adhered to.
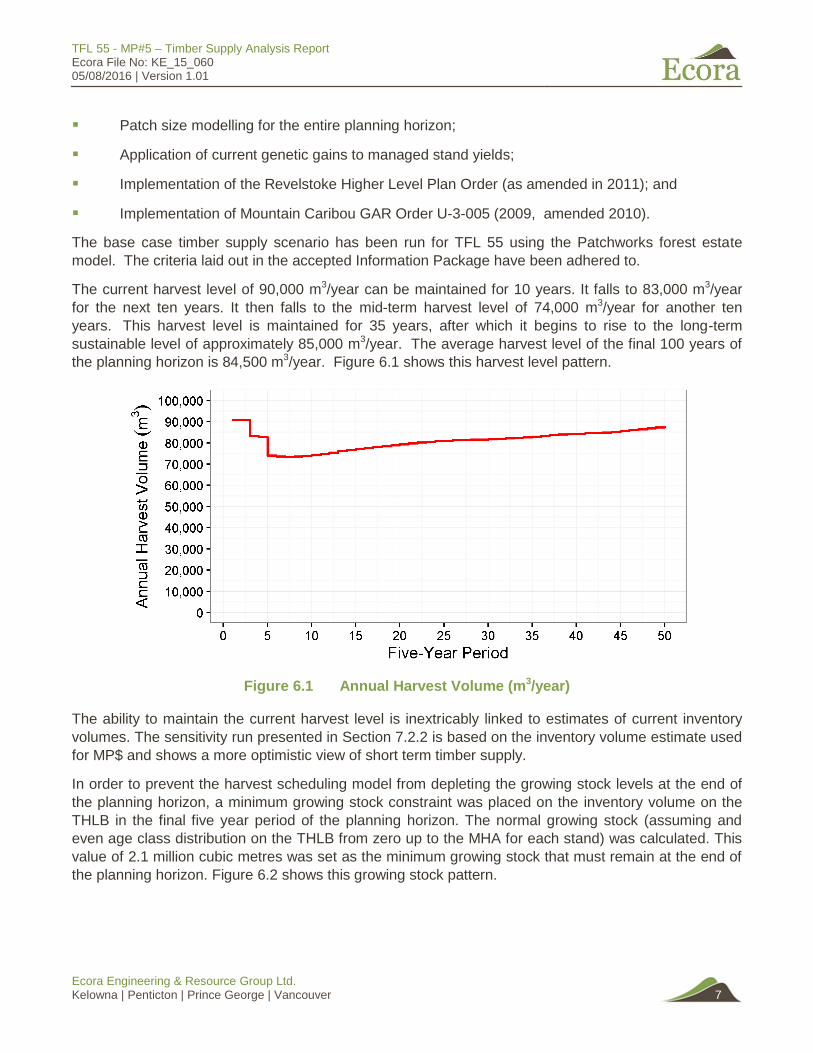
The current harvest level of 90,000 m3/year can be maintained for 10 years. It falls to 83,000 m3/year
for the next ten years. It then falls to the mid-term harvest level of 74,000 m3/year for another ten
years. This harvest level is maintained for 35 years, after which it begins to rise to the long-term
sustainable level of approximately 85,000 m3/year. The average harvest level of the final 100 years of
the planning horizon is 84,500 m3/year. Figure 6.1 shows this harvest level pattern.
Figure 6.1 Annual Harvest Volume (m3/year)
The ability to maintain the current harvest level is inextricably linked to estimates of current inventory
volumes. The sensitivity run presented in Section 7.2.2 is based on the inventory volume estimate used
for MP$ and shows a more optimistic view of short term timber supply.
In order to prevent the harvest scheduling model from depleting the growing stock levels at the end of
the planning horizon, a minimum growing stock constraint was placed on the inventory volume on the
THLB in the final five year period of the planning horizon. The normal growing stock (assuming and
even age class distribution on the THLB from zero up to the MHA for each stand) was calculated. This
value of 2.1 million cubic metres was set as the minimum growing stock that must remain at the end of
the planning horizon. Figure 6.2 shows this growing stock pattern.

TFL 55 - MP#5 – Timber Supply Analysis Report Ecora File No: KE_15_060 05/08/2016 | Version 1.01
Ecora Engineering & Resource Group Ltd. Kelowna | Penticton | Prince George | Vancouver 8
Figure 6.2 Growing Stock (m3) on the THLB
Figure 6.3 shows how the age class distribution on the THLB changes over the planning horizon.
Figure 6.3 Age Class Distribution of the THLB
Over-mature stands (i.e. above MHA) are harvested over the first 35 years of the planning horizon. The
area in the youngest age class increases while the harvest level is elevated, and the falls as the harvest
level declines through the mid-term. After 50 years, the age class distribution is well-balanced for the
remainder of the planning horizon.
Three harvest statistic summaries are particularly useful and commonly examined when considering
timber supply dynamics for a forest tenure: average annual harvest area, average volume per hectare

TFL 55 - MP#5 – Timber Supply Analysis Report Ecora File No: KE_15_060 05/08/2016 | Version 1.01
Ecora Engineering & Resource Group Ltd. Kelowna | Penticton | Prince George | Vancouver 9
harvested, and average harvest age. Changes in these parameters over the entire planning horizon
are presented in the following three charts.
The average annual harvest area is 194 hectares over the entire 250-year planning horizon. The
lowest annual harvest area is 169 hectares in period 7. Figure 6.4 shows these trends. Annual harvest
area is high initially as the model targets lower volume old growth stands for conversion to higher-
performing managed stands - the strategy that will maximize yield over the long term. Annual harvest
area in the first five-year period is 266 hectares – and averages 246 hectares over the first ten years. It
declines over the next four periods to the long-term average of approximately 191 hectares per year, as
shown in Figure 6.4.
Figure 6.4 Average Annual Area Harvested (ha)
Annual harvest age is high initially as old growth timber on the THLB is logged. Average harvest age is
216 years for the first 30 years and then falls to a fairly stable level of 82 years for the remainder of the
planning horizon (see Figure 6.5).

TFL 55 - MP#5 – Timber Supply Analysis Report Ecora File No: KE_15_060 05/08/2016 | Version 1.01
Ecora Engineering & Resource Group Ltd. Kelowna | Penticton | Prince George | Vancouver 10
Figure 6.5 Average Harvest Age (years)
Figure 6.6 shows how the average volume per hectare harvested varies over time. It is slightly above
336 m3/hectare initially, and climbs to 435 m3/hectare by period 7. It is stable for the remainder of the
planning horizon, ranging between 386 and 476 m3/hectare. The average over this period is 424
m3/hectare.
Figure 6.6 Average Harvest Volume (m3/ha)

TFL 55 - MP#5 – Timber Supply Analysis Report Ecora File No: KE_15_060 05/08/2016 | Version 1.01
Ecora Engineering & Resource Group Ltd. Kelowna | Penticton | Prince George | Vancouver 11
The only non-timber resource targets implemented in the base case are related to patch size. Patch
size is managed by landscape unit. Patches in five seral categories (shrub/herb, pole/sapling, young,
mature and old) are tracked, but targets are enforced for the first (shrub/herb) and last (old) seral
stages only. Four patch size class targets are defined for each landscape unit / seral category. Figure
6 shows the patch size distribution over time for shrub/herb patches in the R17 LU. For each period,
the percentage of area in each of the four patch size categories sums to 100%. The unshaded area of
each of the charts indicates the target range. The ‘0 to 40 ha’, ‘80 to 250 ha’ and ‘> 250 ha’ targets are
met for most of the planning horizon. The model has difficulty assembling ‘40 to 80 ha’ patches.
Figure 6.7 ‘Shrub/Herb’ Patch Size Distribution in the R17 Landscape Unit (%)

TFL 55 - MP#5 – Timber Supply Analysis Report Ecora File No: KE_15_060 05/08/2016 | Version 1.01
Ecora Engineering & Resource Group Ltd. Kelowna | Penticton | Prince George | Vancouver 12
Old patch targets in the R17 LU are not met. This is due to the fact that very little of the LU is THLB.
Over the planning horizon, most of the productive area ends up in large, old patches, as shown in
Figure 7. This is inevitable, and not necessarily a forest management problem.
Figure 6.8 ‘Old’ Patch Size Distribution in the R17 Landscape Unit (%)
The pattern for ‘shrub/herb’ patches in the R5 LU is similar to that seen in R17. ‘0 to 40 ha’, ‘80 to 250
ha’ and ‘> 250 ha’ patch targets are met, and the ‘40 to 80’ target is close, as shown in Figure 8

TFL 55 - MP#5 – Timber Supply Analysis Report Ecora File No: KE_15_060 05/08/2016 | Version 1.01
Ecora Engineering & Resource Group Ltd. Kelowna | Penticton | Prince George | Vancouver 13
Figure 6.9 ‘Shrub/Herb’ Patch Size Distribution in the R5 Landscape Unit (%)

TFL 55 - MP#5 – Timber Supply Analysis Report Ecora File No: KE_15_060 05/08/2016 | Version 1.01
Ecora Engineering & Resource Group Ltd. Kelowna | Penticton | Prince George | Vancouver 14
The problem with mature patch management in R5 is also similar to that seen in R17 - but it is not as
severe. The greater proportion of THLB in this LU provides flexibility to create patches less than 250
hectares in size (see Figure 9).
Figure 6.10 ‘Old’ Patch Size Distribution in the R5 Landscape Unit (%)
7.0 Sensitivity Analysis
Sensitivity analysis provides a measure of the upper and lower bounds of the base case harvest
forecast that reflects the uncertainty in the data and/or the management assumptions made in the base
case. The magnitude of the increase and decrease in the sensitivity variable reflects the degree of

TFL 55 - MP#5 – Timber Supply Analysis Report Ecora File No: KE_15_060 05/08/2016 | Version 1.01
Ecora Engineering & Resource Group Ltd. Kelowna | Penticton | Prince George | Vancouver 15
uncertainty surrounding the assumption associated with that specific variable. This provides a way to
gauge the extent to which the base case harvest level and other statistics might change with changes
to input data and assumptions.
Table 7.1 summarizes the sensitivity analyses that will be performed for this analysis. For each
scenario the data use and assumptions made will be documented.
Table 7.1 Sensitivity Analysis Runs
Scenario
Timber harvesting landbase +/- 5%
Natural stand yields +/- 10%
Managed stand yields +/- 10%
Minimum harvest ages +/- 10 years
Minimum harvest ages +/- 50 m3/ha
Increase / decrease genetic gains
Use SIA instead of SIBEC
Use VRI site index instead of SIBEC
Managed stand SI +/- 1 m
Estimate CMI Impacts
Add VRI Phase 2 Adjustment (VDYP 6)
IRM green-up constraint instead of patch size
7.1 Timber Harvesting Land Base
The timber harvesting land base determined for the base case was 16,007 hectares. While this
represents the best estimate of the portion of the land base on which forest operations are feasible in
the long term, the true value cannot be known with great precision. To test the potential impact on
timber supply of this uncertainty, the THLB was increased and decreased by 5%. The size of the
productive, non-contributing land base was adjusted accordingly so that the total productive area of the
TFL did not change. Figure 7.1 shows how the harvest level changes with changes in the size of the
THLB.

TFL 55 - MP#5 – Timber Supply Analysis Report Ecora File No: KE_15_060 05/08/2016 | Version 1.01
Ecora Engineering & Resource Group Ltd. Kelowna | Penticton | Prince George | Vancouver 16
Figure 7.1 Harvest Level Impact of THLB Uncertainty
7.2 Stand Yield
Stand yields are developed from forest inventory data, silvicultural surveys and growth and yield model.
Changes in stand yield assumptions can impact harvest levels in both the short and long term.
7.2.1 Natural Stands +/- 10%
Yield forecasts for natural stands were developed using VDYP7. If these yield estimates are increased
and decreased by 10%, the harvest level changes as shown in Figure 7.2.

TFL 55 - MP#5 – Timber Supply Analysis Report Ecora File No: KE_15_060 05/08/2016 | Version 1.01
Ecora Engineering & Resource Group Ltd. Kelowna | Penticton | Prince George | Vancouver 17
Figure 7.2 Harvest Level Impact of Natural Stand Yield Uncertainty
7.2.2 Natural Stands – VDYP Phase 2
There is considerable uncertainty regarding the current growing stock volume on TFL 55. As noted, the
base case has been run using natural stand yield curves compiled with VDYP7. No Phase 2 adjustment
has been applied. When the VDYP7 curves are replaced by Phase 2-adjusted VDYP6 yield curves, the
short-term timber supply picture improves significantly. It is possible to maintain the current harvest
level for 30 years before stepping down the mid-term harvest level. The long-term harvest levels are
similar because both scenarios rely on the same managed stand yield tables.
Figure 7.3 Harvest Level with VDYP6 Phase 2
7.2.3 Managed Stands +/- 10%
Managed stand yield estimate are compile using BatchTIPSY. Changes in assumptions about
managed yields (for both existing and future managed stands) to not have an immediate impact on
harvest levels; their impact is seen in the medium and long term when those stands contribute to the
harvest flow.

TFL 55 - MP#5 – Timber Supply Analysis Report Ecora File No: KE_15_060 05/08/2016 | Version 1.01
Ecora Engineering & Resource Group Ltd. Kelowna | Penticton | Prince George | Vancouver 18
Figure 7.4 Harvest Level Impact of Managed Stand Yield Uncertainty
7.2.4 Genetic Gain
One of the inputs required to forecast the yields for future managed stands is an estimate of the genetic
gain that will be realized on crop trees that originate from select seed. If assumed genetic gain is
increased and decreased by 5%, the future harvest flow changes as shown in Figure 7.5
Figure 7.5 Harvest Level Impact of Genetic Gain Assumptions
TFL 55 - MP#5 – Timber Supply Analysis Report Ecora File No: KE_15_060 05/08/2016 | Version 1.01
Ecora Engineering & Resource Group Ltd. Kelowna | Penticton | Prince George | Vancouver 19
7.3 Site Productivity
Site productivity is the major determinant of harvest levels in the long term. For the base case, VRI site
index was used for natural stands (all stands that regenerated in 1970 or earlier) and SIBEC was used
to develop managed stand yield tables. This set of sensitivity analyses examines the impact of
changes in site productivity assumptions on harvest flow.
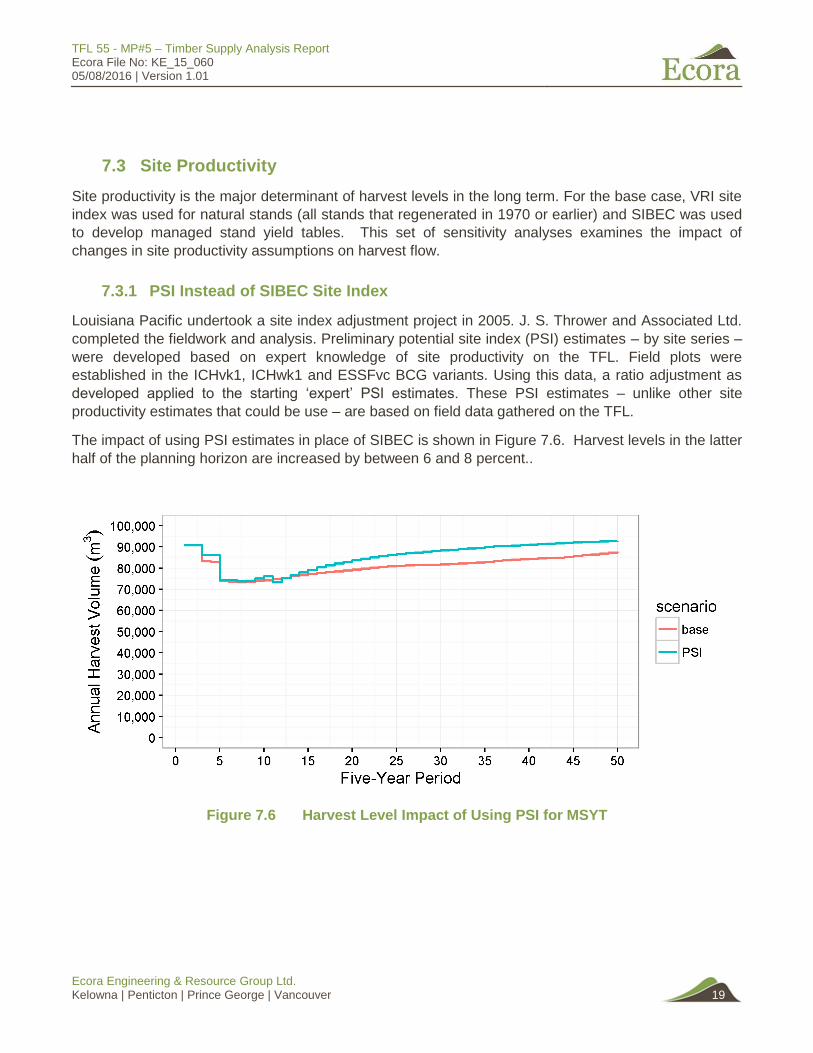
7.3.1 PSI Instead of SIBEC Site Index
Louisiana Pacific undertook a site index adjustment project in 2005. J. S. Thrower and Associated Ltd.
completed the fieldwork and analysis. Preliminary potential site index (PSI) estimates – by site series –
were developed based on expert knowledge of site productivity on the TFL. Field plots were
established in the ICHvk1, ICHwk1 and ESSFvc BCG variants. Using this data, a ratio adjustment as
developed applied to the starting ‘expert’ PSI estimates. These PSI estimates – unlike other site
productivity estimates that could be use – are based on field data gathered on the TFL.
The impact of using PSI estimates in place of SIBEC is shown in Figure 7.6. Harvest levels in the latter
half of the planning horizon are increased by between 6 and 8 percent..
Figure 7.6 Harvest Level Impact of Using PSI for MSYT

TFL 55 - MP#5 – Timber Supply Analysis Report Ecora File No: KE_15_060 05/08/2016 | Version 1.01
Ecora Engineering & Resource Group Ltd. Kelowna | Penticton | Prince George | Vancouver 20
7.3.2 VRI SI Instead of SIBEC
If VRI site index is used is place of SIBEC as a source of managed stand site productivity estimates,
the impact on long-term timber supply is significant.
Figure 7.7 Harvest Level Impact of Using VRI SI for MSYT
7.3.3 Managed Stand SI +/- 1 m
To more clearly understand the impact of site productivity estimates on manage stand yield, site index
was increase and decrease by 1 metre. The increase did not improve the timber supply situation
significantly, but is decrease in site index adversely affects the mid-term timber supply, as shown in
Figure 7.8.

TFL 55 - MP#5 – Timber Supply Analysis Report Ecora File No: KE_15_060 05/08/2016 | Version 1.01
Ecora Engineering & Resource Group Ltd. Kelowna | Penticton | Prince George | Vancouver 21
Figure 7.8 Harvest Level Impact of MSYT SI Variation
7.4 Management Assumptions
Since most the of non-timber resource values on TFL 55 are satisfied from stands outside of the THLB,
few variations in management assumptions need to be explored. Two are presented here: the
elimination of patch targets and changes in minimum harvest age assumptions.
7.4.1 IRM Instead of Patch Size
Harvest planning on TFL 55 is directed to achieving a target patch size distribution. The base case
results show that, for the most part, those patch size target are being achieved. However, timber supply
planning for most other forest tenures uses an integrated resource management constraint to
distribution harvesting for strategic planning purposes. For this sensitivity run, patch size targets have
been dropped and replaced with an IRM constraint. As Figure 7.9 shows, this change has virtually no
impact on timber supply.

TFL 55 - MP#5 – Timber Supply Analysis Report Ecora File No: KE_15_060 05/08/2016 | Version 1.01
Ecora Engineering & Resource Group Ltd. Kelowna | Penticton | Prince George | Vancouver 22
Figure 7.9 Harvest Level Impact – IRM Instead of Patch Size
7.4.2 Minimum Harvest Age Assumptions
Minimum harvest ages were varied (plus / minus 10 years) to gauge the impact on timber supply.
Decreasing MHA does not affect harvest levels. However, increasing MHA by 10 years leads to a
significant harvest shortfall in the midterm (after twenty years.) Figure 7.10 shows this pattern.
Figure 7.10 Harvest Level Impact of MHA Changes

TFL 55 - MP#5 – Timber Supply Analysis Report Ecora File No: KE_15_060 05/08/2016 | Version 1.01
Ecora Engineering & Resource Group Ltd. Kelowna | Penticton | Prince George | Vancouver 23
8.0 Discussion of Results
The base case presented shows that a harvest level of 90,000 m3/year is possible for the first ten
years. This is a net harvest level after the allowance for non-recoverable losses has been taken into
account. A review of the THLB growing stock trend and future age class distribution of the THLB shows
that the initial harvest level is justified. An excess of older growing stock is harvested over the first thirty
years of the planning horizon. After the point, the age class distribution is well balanced. The growing
stock at the end of planning horizon (2.1 million cubic metres) is sufficient to support continued
operations at the sustainable long-term harvest level of 185,000 m3/year.
Summary statistic of the harvest profile were compiled and presented. Average harvest age falls
sharply as over-mature growing stock is harvest. The long term average harvest age of 82 years is
slightly above the area-weighted average MHA of 80.3 years. Average harvest volume per hectare is
slightly depressed initially (a modelling artifact that that can easily be managed on the ground) and is
stable at operationally realistic levels.
The timber harvesting landbase is much reduced from the analysis for the previous MP (MP4 in 2007).
Although the previous THLB was larger, there were 5,601 hectares of age class 8 and 9 stands (i.e
older than 140 years) within THLB reserved aspatially for mountain caribou habitat. In MP 5 the
Mountain Caribou GAR order increased and spatialized caribou reserves for an area removal of 6,362
ha from the THLB. This reduction has impacted the ability to maintain the current AAC
Patch size targets have been used in place of an IRM constraint for this analysis. The original intention
was to implement patch size targets for both ‘shrub/herb’ and ‘mature’ seral classes. This proved
impractical in the latter case. Much of the productive landbase is outside of the THLB and is aging
continuously. This lead to significant old seral area in large (> 250 hectare) patches – a category with a
target of zero hectares. While this is not necessarily an adverse result, it made achieving the other
patch targets impossible. Old seral patch size performance is shown for the base case for information
only – they have not been used to limit harvesting in any way.
Target ranges were enforced for ‘shrub/herb’ patches. It is worth noting that the landbase is currently
quite close to the target ranges for all patch sizes. The model does a good job of maintaining the
landscape close to the target patch size distribution. The only exception to this is the ’40-80’ hectare
class. Although it is close – and is clearly impacting the harvest schedule – the 30% minimum area in
this class is being missed (very slightly) for much of the planning horizon. A review of the ‘0-40’ hectare
class shows that the model is finding much area in smaller, disjointed blocks that cannot readily be
aggregated into larger patches. This problem might be mitigated somewhat by relaxing the definition of
adjacency for patch creation. A threshold distance of 50 metres was used for this analysis. A larger
threshold distance would allow the model to more easily assemble disjointed blocks into larger patches
and might, perhaps, alleviate the ’40-80’ hectare issue observed in the base case.
The patch size charts shown in the base case results suggest that patch size creation was significantly
affecting the harvest schedule. It is a bit surprising therefore that the timber supply situation did not
improve when the patch size targets were replaced with an IRM constraint.
The base case shows that the current harvest level can be maintained for only ten years. This is a
significant departure from the last timber supply analysis. It indicated that a 90,000 m3/year harvest
level could be easily maintained for thirty years. The primary source of the discrepancy between the
two runs it the estimate of the current inventory volume. The previous analysis used VDYP6 to estimate

TFL 55 - MP#5 – Timber Supply Analysis Report Ecora File No: KE_15_060 05/08/2016 | Version 1.01
Ecora Engineering & Resource Group Ltd. Kelowna | Penticton | Prince George | Vancouver 24
natural stand yields – and applied the Phase 2 adjustment that was based on a significant amount of
field work collected on the TFL. This analysis used the current version of VDYP – VDYP7. Changes in
the way that it incorporates stocking (stems/ha, basal area versus crown closure) prevent the Phase 2
data from being employed to adjusted volume estimates. This has a significant negative impact on
short-term timber supply.
The base case relies on SIBEC estimate of productivity for MSYT construction. This is the provincial
standard. However, LP has separate estimates of productivity (Potential Site Index – or PSI) that are
the based on locally collected field data. A sensitivity analysis run using these PSI estimate shows an
increase in long-term timber supply.
The base case shows that the current harvest level can be maintained for ten years. Sensitivity
analyses suggest that in could be continued for at least an additional ten years. The use of PSI in
place of SIBEC to build MSYT’s show that the potential long-term timber supply is greater than the
85,000 m3/year shown in the base case. Non-timber resource values are being managed primarily
through removals from the THLB. LP is adequately managing patch size distribution and it does not
appear to be significantly impacting timber supply. The base case, as presented, is a conservative view
of timber availability on TFL FF
TFL 55 - MP#5 – Timber Supply Analysis Report Ecora File No: KE_15_060 05/08/2016 | Version 1.01
Ecora Engineering & Resource Group Ltd. Kelowna | Penticton | Prince George | Vancouver

TFL 55 - MP#5 – Timber Supply Analysis Report Ecora File No: KE_15_060 05/08/2016 | Version 1.01
Ecora Engineering & Resource Group Ltd. Kelowna | Penticton | Prince George | Vancouver
Appendix A Information Package

TFL 55 - MP#5 – Timber Supply Analysis Report Ecora File No: KE_15_060 05/08/2016 | Version 1.01
Ecora Engineering & Resource Group Ltd. Kelowna | Penticton | Prince George | Vancouver
TFL 55 - MP#5 – Timber Supply Analysis Report Ecora File No: KE_15_060 05/08/2016 | Version 1.01
Ecora Engineering & Resource Group Ltd. Kelowna | Penticton | Prince George | Vancouver

APPENDIX B Accepted Timber Supply Analysis Information
Package
Ecora Engineering & Resource Group Ltd. 601 West Broadway, Unit 14, Vancouver, BC V5Z 4C2 | P: 250.469.9757 Ext. 1031 | www.ecora.ca
Tree Farm Licence 55 Management Plan #5 Information Package
Presented To
Louisiana Pacific – Malakwa Division
Dated: August 2016
Ecora File No.: KE_15_060

TFL 55 - MP#5 - Information Package Ecora File No: KE_15_060 22/08/2016 | Version 1.04
Ecora Engineering & Resource Group Ltd. Kelowna | Penticton | Prince George | Vancouver
THIS PAGE IS INTENTIONALLY LEFT BLANK
TFL 55 - MP#5 - Information Package Ecora File No: KE_15_060 22/08/2016 | Version 1.04
Ecora Engineering & Resource Group Ltd. Kelowna | Penticton | Prince George | Vancouver
Presented To:
Louisiana Pacific Corporation 4872 Lybarger Road Malakwa, BC V0E2J0
Prepared by:
Jerry Miehm, RPF Senior Resource Analyst Direct Line: 250.469.9757 x1031 [email protected]
Date
]
Version Control and Revision History
Version Date Prepared By Reviewed By Notes/Revisions
1.01 28/01/2016 Miehm LP Staff Draft for LP review
1.02 05/02/2016 Miehm LP Staff Corrections following LP review
1.03 17/02/2016 Miehm MFLNRO Final Edit prior to submission
1.05 07/06/2016 Miehm LP Staff Final submisson
TFL 55 - MP#5 - Information Package Ecora File No: KE_15_060 22/08/2016 | Version 1.04
Ecora Engineering & Resource Group Ltd. Kelowna | Penticton | Prince George | Vancouver

TFL 55 - MP#5 - Information Package Ecora File No: KE_15_060 22/08/2016 | Version 1.04
Ecora Engineering & Resource Group Ltd. Kelowna | Penticton | Prince George | Vancouver i
Table of Contents
1.0 Introduction ................................................................................................................... 1
2.0 Timber Supply Analysis Process ................................................................................ 2
3.0 Timber Supply Options / Sensitivity Analyses ........................................................... 3
3.1 Base Case ...................................................................................................................... 3
3.2 Sensitivity Analysis ......................................................................................................... 3
3.3 Alternative Harvest Flows ............................................................................................... 4
4.0 Forest Estate Model ...................................................................................................... 4
4.1 Model Description ........................................................................................................... 4
4.2 Timber Supply Modelling ................................................................................................ 5
5.0 Current Forest Cover Inventory ................................................................................... 5
5.1 Base Mapping ................................................................................................................. 5
5.2 Vegetation Resource Inventory ....................................................................................... 5
5.3 Updating the Inventory Information ................................................................................. 6
5.4 Data Sources .................................................................................................................. 6
6.0 Description of the Land Base ...................................................................................... 7
6.1 Timber Harvesting Land Base Determination .................................................................. 7
6.2 Total Area ..................................................................................................................... 10
6.3 Ownership .................................................................................................................... 10
6.4 Non-Productive and Non-Forest ................................................................................... 11
6.5 Non-commercial ........................................................................................................... 11
6.6 Roads, Trails and Landings .......................................................................................... 11
6.7 Inoperable .................................................................................................................... 12
6.8 Terrain Stability ............................................................................................................. 12
6.9 Riparian Reserve and Management Zones ................................................................... 13
6.10 Low Site Productivity .................................................................................................... 14
6.11 Deciduous .................................................................................................................... 14
6.12 Non-merchantable Forest Types ................................................................................... 14
6.13 Stand-level Biodiversity (Wildlife Tree Patches) ............................................................ 15
6.14 Caribou Habitat ............................................................................................................. 15
6.15 Old Growth Management Areas .................................................................................... 15
TFL 55 - MP#5 - Information Package Ecora File No: KE_15_060 22/08/2016 | Version 1.04
Ecora Engineering & Resource Group Ltd. Kelowna | Penticton | Prince George | Vancouver ii
6.16 Cultural Resources ....................................................................................................... 15
7.0 Inventory Aggregation ................................................................................................ 16
7.1 Revelstoke Higher Level Plan Order ............................................................................. 16
7.2 Ecosystem Types ......................................................................................................... 16
7.3 Landscape Units ........................................................................................................... 17
7.4 Seral Zones .................................................................................................................. 17
7.5 Analysis Units ............................................................................................................... 18
8.0 Growth and Yield ........................................................................................................ 19
8.1 Site Productivity ............................................................................................................ 20
8.1.1 VRI Site Index ................................................................................................... 21
8.1.2 SIBEC Site Index .............................................................................................. 21
8.1.3 SIA Productivity Estimates ................................................................................ 21
8.2 Utilization Levels ........................................................................................................... 21
8.3 Volume Reductions ....................................................................................................... 22
8.4 VDYP Natural Stand Yield Tables ................................................................................. 22
8.4.1 Decay, Waste, and Breakage ............................................................................ 23
8.4.2 Dead Potential Volume...................................................................................... 23
8.5 TIPSY Managed Stand Yield Tables ............................................................................. 23
8.5.1 Species Composition ........................................................................................ 24
8.5.2 Stand Density .................................................................................................... 24
8.5.3 Regeneration Delay .......................................................................................... 25
8.5.4 Operational Adjustment Factors ........................................................................ 25
8.5.5 Genetic Gain ..................................................................................................... 25
8.6 Change Monitoring Inventory ........................................................................................ 25
9.0 Protection .................................................................................................................... 26
10.0 Integrated Resource Management ............................................................................ 27
10.1 Forest Cover Objectives ............................................................................................... 27
10.1.1 Landscape-Level Biodiversity ............................................................................ 27
10.1.2 Stand-level Biodiversity ..................................................................................... 29
10.1.3 Integrated Resource Management .................................................................... 29
10.2 Patch Size Objectives ................................................................................................... 30
10.3 Timber Harvesting ........................................................................................................ 30

TFL 55 - MP#5 - Information Package Ecora File No: KE_15_060 22/08/2016 | Version 1.04
Ecora Engineering & Resource Group Ltd. Kelowna | Penticton | Prince George | Vancouver iii
10.3.1 Minimum Harvest Age ....................................................................................... 30
10.3.2 Silviculture Systems .......................................................................................... 33
10.3.3 Initial Harvest Rate ............................................................................................ 34
10.3.4 Harvest Rule ..................................................................................................... 34
10.3.5 Harvest Flow Objectives .................................................................................... 34
10.3.6 Disturbing the Non-THLB .................................................................................. 34
List of Tables in Text
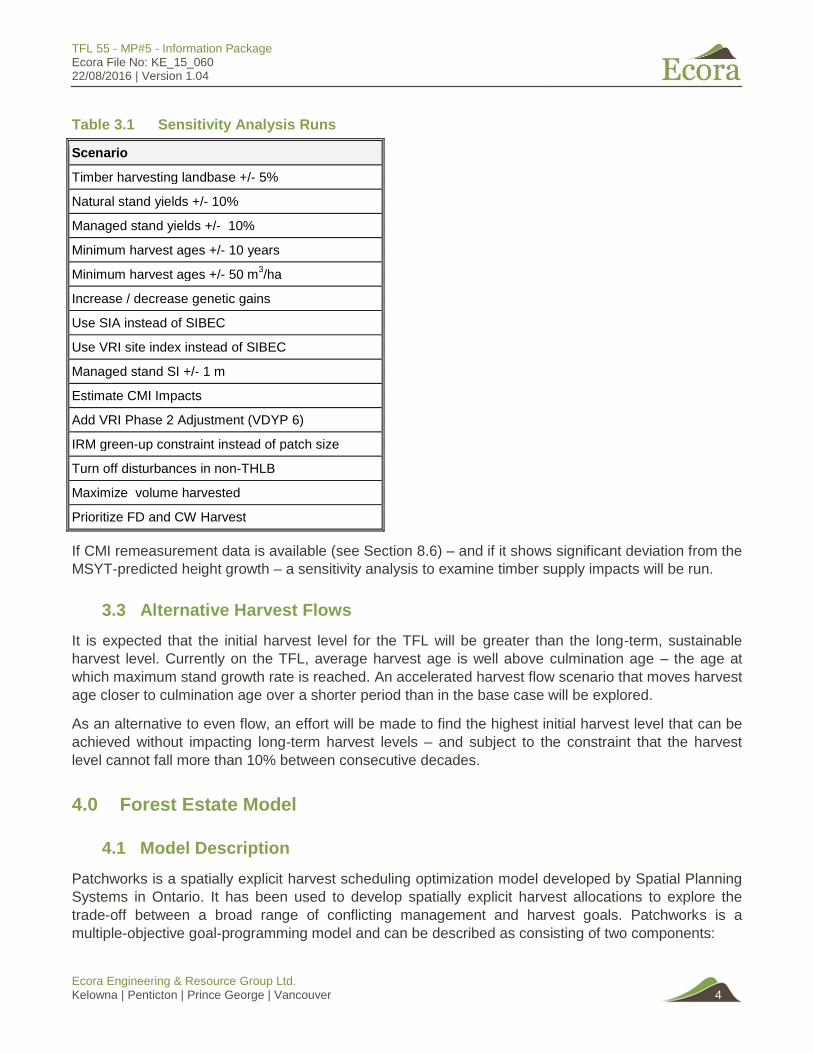
Table 3.1 Sensitivity Analysis Runs ................................................................................................ 4
Table 5.1 Phase 2 Adjustment ........................................................................................................ 6
Table 5.2 TFL 55 Source Data ....................................................................................................... 7
Table 6.1 Base Case Timber Harvesting Land Base Determination ............................................... 8
Table 6.2 Age Class Distribution .................................................................................................... 8
Table 6.3 Leading Species Distribution ........................................................................................ 10
Table 6.4 Non-TFL Land .............................................................................................................. 10
Table 6.5 Non-Productive and Non-Forest Land........................................................................... 11
Table 6.6 Roads Trails and Landings ........................................................................................... 12
Table 6.7 Operable Landbase Summary ...................................................................................... 12
Table 6.8 Terrain Stability ............................................................................................................. 13
Table 6.9 Riparian Management Buffer Widths ............................................................................ 13
Table 6.10 Low Site Productivity Reductions .................................................................................. 14
Table 6.11 Deciduous Stand Reduction ......................................................................................... 14
Table 6.12 Wildlife Tree Patches .................................................................................................... 15
Table 6.13 Caribou Habitat ............................................................................................................. 15
Table 6.14 Old Growth Management Areas .................................................................................... 15
Table 7.1 Landscape units on TFL 55 .......................................................................................... 17
Table 7.2 Landscape Units, Ecosystem Types, and Biodiversity Emphasis .................................. 17
Table 7.3 Analysis Unit Definitions ............................................................................................... 18
Table 8.1 TFL 55 Silviculture Summary – 1970 to 1986 ............................................................... 19
Table 8.2 Analysis Unit Area – Natural and Managed Stands....................................................... 20
Table 8.3 Utilization Levels ........................................................................................................... 22
Table 8.4 MP#4 and MP#5 Growing Stock Comparison ............................................................... 22
Table 8.5 Managed Stand Site Index and Species Composition ................................................... 24

TFL 55 - MP#5 - Information Package Ecora File No: KE_15_060 22/08/2016 | Version 1.04
Ecora Engineering & Resource Group Ltd. Kelowna | Penticton | Prince George | Vancouver iv
Table 8.6 Managed Stand Density at Free Growing ..................................................................... 24
Table 8.7 Average Genetic Gain – 2005 to 2012 .......................................................................... 25
Table 9.1 Unsalvaged Losses ...................................................................................................... 26
Table 10.1 Old and Mature Seral Definitions. ................................................................................. 28
Table 10.2 Revelstoke Higher Level Plan Order Old Seral Retention Targets ................................ 28
Table 10.3 Wildlife Tree Retention Requirements ........................................................................... 29
Table 10.4 Patch Size Targets for Natural Disturbance Type 1 ...................................................... 30
Table 10.5 Patch Seral Stage Definitions ....................................................................................... 30
Table 10.6 Minimum Harvest Age Attributes for Natural Stands ..................................................... 31
Table 10.7 Minimum Harvest Age Attributes for Future Managed Stands and Existing Managed
Stands (Era 2) .............................................................................................................. 32
Table 10.8 Minimum Harvest Age Attributes for Existing Managed Stands (Era 1) ......................... 32
Table 10.9 LRSY Estimates for Natural and Managed Stands........................................................ 33
Table 10.10 Summary Information for BEC Zones ........................................................................... 35
Table 10.11 Seral Stage Distribution for Fire Return Intervals of 250 years and 350 years .............. 35
Table 10.12 Disturbance Levels and Mature and Retention Requirements in non-THLB. ................. 36
List of Figures in Text
Figure 1.1 Location of TFL 55 .......................................................................................................... 1
Figure 6.1 Age Class Distribution .................................................................................................... 9
Figure 6.2 Leading Species Distribution ........................................................................................ 11
Figure 7.1 Area by BEC Variant ..................................................................................................... 17
Appendices
Appendix A
Appendix B
Appendix C
Appendix D
Vegetation Resources Inventory Statistical Adjustment
Site Index Adjustment Report
Harvest Profile – 2007 to 2014
OGMA Delineation Report
TFL 55 - MP#5 - Information Package Ecora File No: KE_15_060 22/08/2016 | Version 1.04
Ecora Engineering & Resource Group Ltd. Kelowna | Penticton | Prince George | Vancouver v
Acronyms and Abbreviations
BEC Biogeoclimatic Ecosystem Classification CMAI Culmination Mean Annual Increment DBH Diameter – Breast Height DIB Diameter Inside Bark LP Louisiana Pacific LRSY Long-run Sustained Yield MAI Mean Annual Increment MFLNRO Ministry of Forests, Lands and Natural Resource Operations MP Management Plan MSYT Managed Stand Yield Table NDT Natural Disturbance Type NROV Natural Range of Variation NSYT Natural Stand Yield Table RHLPO Revelstoke Higher Level Plan Order SIA Site Index Adjustment (J.S. Thrower and Associates Ltd.) SIBEC Site Index Estimates by BEC Site Series TFL Tree Farm Licence THLB Timber Harvesting Land Base TIPSY Table Interpolation for Stand Yields VDYP Variable Density Yield Prediction VRI Vegetation Resources Inventory WTP Wildlife Tree Patch

TFL 55 - MP#5 - Information Package Ecora File No: KE_15_060 22/08/2016 | Version 1.04
Ecora Engineering & Resource Group Ltd. Kelowna | Penticton | Prince George | Vancouver 1
1.0 Introduction
Tree Farm Licence 55 (TFL 55) is located in the Selkirk Mountains between the Revelstoke Reservoir
and Kinbasket Lake (see Figure 1.1). At the time that the last Management Plan (MP #4 in 2005) was
completed, the total area of the TFL was 92,706 hectares. Of this total, 55,103 hectares was
considered to be productive forest land, and 38.3% (22,341 hectares) of that was available for timber
harvesting.
Figure 1.1 Location of TFL 55

TFL 55 - MP#5 - Information Package Ecora File No: KE_15_060 22/08/2016 | Version 1.04
Ecora Engineering & Resource Group Ltd. Kelowna | Penticton | Prince George | Vancouver 2
This Information Package has been prepared on behalf of Louisiana Pacific Ltd. (LP) as part of the
timber supply analysis for Management Plan No. 5 (MP#5) for TFL 55. It provides a summary of the
inputs and assumptions made in preparing the timber supply analysis data model.
This document includes inventory and landbase summaries, growth and yield information, and
management assumptions for timber and non-timber resources as they relate to timber supply. The
Information Package allows the reader to consider the inputs and assumptions to be used in the timber
supply analysis. These include:
The documentation of inventory data and sources;
Classification of the land base according to each hectare's contribution to management
(harvest, resource management for wildlife, etc.);
Land productivity estimates and prediction of stand growth and timber yield;
Silviculture and harvesting regimes;
Action taken to model multi-resource requirements; and
Timber supply scenarios and sensitivity analyses to be evaluated.
The timber supply analysis involves modelling a Base Case that represents current management
practices. In addition, a number of sensitivity analyses will also be conducted to test the impact of
different assumptions on timber supply for TFL 55. All analysis simulations will be completed using
Patchworks – a forest estate model that schedules timber harvesting in a manner that best meets
environmental and timber flow objectives.
Upon acceptance by the British Columbia Ministry of Forests, Lands and Natural Resource Operations
(MFLNRO) Timber Supply Analyst, the assumptions and methodology provided in the Information
Package will be used by LP to prepare and submit a timber supply analysis to the MFLNRO. All
analysis results will be provided to the Chief Forester of British Columbia, or designate, for allowable
cut determination.
Some of the inputs and assumptions included in the timber supply analysis will be based on information
provided in the Revelstoke Higher Level Plan Order (BC MSRM 2005) as amended in 2011.
2.0 Timber Supply Analysis Process
The data summarized in this document is the most current available. Any assumptions made for
modelling and forecasting purposes are consistent with current forest management practices on the
TFL.
This Information Package will be advertised and made available for public review. The technical
approach to modelling will be reviewed with staff from MFLNRO Forest Analysis and Inventory Branch
(FAIB) before starting any forest estate modelling. Any necessary changes will be made to the
document based on the feedback received.
TFL 55 - MP#5 - Information Package Ecora File No: KE_15_060 22/08/2016 | Version 1.04
Ecora Engineering & Resource Group Ltd. Kelowna | Penticton | Prince George | Vancouver 3
This report will be included as Appendix I of the Timber Supply Analysis Report – which will itself be
advertised and made available for publics review. Prior to that public review process, the Analysis
Report must first be formally accepted by the Ministry for use in the AAC determination process.
The Analysis Report will be circulated for Public Review in conjunction with a draft of Management Plan
#5 for the TFL. This MP will include a history of the TFL and a summary of the feedback received; the
final versions of the Information Package and Analysis Report will be included as Appendices.
Once this second public review process is complete, these documents will be submitted to the Chief
Forester to assist in making an AAC determination for the TFL. Once this is complete, the AAC
Rationale document will be appended to the finalized version of Management Plan #5
3.0 Timber Supply Options / Sensitivity Analyses
This section provides an overview of the options that will be evaluated in the timber supply analysis.
3.1 Base Case
The base case reflects current management performance as of 2015. The analysis will incorporate the
following:
Vegetation resource inventory (VRI) (complete Phase 1 and Phase 2);
Operability mapping that show where timber harvesting is operationally feasible;;
Ecosystem-based analysis units;
Improved managed stand site productivity estimates;
Natural disturbance regimes in non –THLB stands;
Patch size and seral stage modelling for the entire planning horizon;
Application of current genetic gains to managed stand yields; and
Implementation of the Revelstoke Higher Level Plan Order (as amended in 2011).
3.2 Sensitivity Analysis
Sensitivity analysis provides a measure of the upper and lower bounds of the base case harvest
forecast that reflects the uncertainty in the data and/or the management assumptions made in the base
case. The magnitude of the increase and decrease in the sensitivity variable reflects the degree of
uncertainty surrounding the assumption associated with that specific variable. This provides a way to
gauge the extent to which the base case harvest level and other statistics might change with changes
to input data and assumptions.
Table 3.1 summarizes the sensitivity analyses that will be performed for this analysis. For each
scenario the data use and assumptions made will be documented.
TFL 55 - MP#5 - Information Package Ecora File No: KE_15_060 22/08/2016 | Version 1.04
Ecora Engineering & Resource Group Ltd. Kelowna | Penticton | Prince George | Vancouver 4
Table 3.1 Sensitivity Analysis Runs
Scenario
Timber harvesting landbase +/- 5%
Natural stand yields +/- 10%
Managed stand yields +/- 10%
Minimum harvest ages +/- 10 years
Minimum harvest ages +/- 50 m3/ha
Increase / decrease genetic gains
Use SIA instead of SIBEC
Use VRI site index instead of SIBEC
Managed stand SI +/- 1 m
Estimate CMI Impacts
Add VRI Phase 2 Adjustment (VDYP 6)
IRM green-up constraint instead of patch size
Turn off disturbances in non-THLB
Maximize volume harvested
Prioritize FD and CW Harvest
If CMI remeasurement data is available (see Section 8.6) – and if it shows significant deviation from the
MSYT-predicted height growth – a sensitivity analysis to examine timber supply impacts will be run.
3.3 Alternative Harvest Flows
It is expected that the initial harvest level for the TFL will be greater than the long-term, sustainable
harvest level. Currently on the TFL, average harvest age is well above culmination age – the age at
which maximum stand growth rate is reached. An accelerated harvest flow scenario that moves harvest
age closer to culmination age over a shorter period than in the base case will be explored.
As an alternative to even flow, an effort will be made to find the highest initial harvest level that can be
achieved without impacting long-term harvest levels – and subject to the constraint that the harvest
level cannot fall more than 10% between consecutive decades.
4.0 Forest Estate Model
4.1 Model Description
Patchworks is a spatially explicit harvest scheduling optimization model developed by Spatial Planning
Systems in Ontario. It has been used to develop spatially explicit harvest allocations to explore the
trade-off between a broad range of conflicting management and harvest goals. Patchworks is a
multiple-objective goal-programming model and can be described as consisting of two components:

TFL 55 - MP#5 - Information Package Ecora File No: KE_15_060 22/08/2016 | Version 1.04
Ecora Engineering & Resource Group Ltd. Kelowna | Penticton | Prince George | Vancouver 5
1. A GIS interface with map viewer and viewer functions; and
2. A harvest scheduler that runs continuously in the background - searching for improvements in
the allocation to improve the value of the objective function. The model seeks a solution that
maximizes the value of the total objective function. The objective function will be made up of
both the traditional (management plan) objectives and the additional requirements and
indicators. In areas of timber management, the harvest schedule will be optimized (both the
current and future forecasted land base) for timber flow requirements and to minimize the
environmental risk, as measured by the established indicators.
4.2 Timber Supply Modelling
Timber supply analysis for the full two hundred and fifty (250) year planning horizon will be carried out
using Patchworks. Harvest blocks will be scheduled in fifty 5-year periods.
5.0 Current Forest Cover Inventory
This section describes base mapping, forest cover inventory, and other data used in the analysis.
5.1 Base Mapping
All spatial information is registered to the Terrain Resource Inventory Mapping (TRIM), North American
Datum (NAD) 83 base. Inventory data has been prepared using the ArcGISTM geographic information
system (GIS).
5.2 Vegetation Resource Inventory
The current forest inventory (stand delineation and classification) was completed in 2002 by Atticus
Resource Consulting Ltd – using aerial photography that was taken in 1997. Stand volumes were
estimated (at that time) using VDYP 6. Over the intervening years, updates have been applied to the
spatial forest cover data using information from the RESULTS silviculture tracking system. For this
project, the version of the VRI released in December, 2014 has been used. The latest harvest blocks
that appear in that dataset are from are from 2012. The data set for this analysis was updated with
additional harvest information up to the end of 2015.
A ‘Phase 2’ inventory attribute adjustment was completed in 2005 using methods detailed in VRI
Procedures and Standards for Data Analysis, Attribute Adjustment and Implementation of Adjustment in
the Corporate Database (MFLNRO, 2004). The field data for this project had been collected in 2002. 80
Phase 2 VRI plot clusters were established at randomly selected locations (within five strata)
throughout the productive operable landbase of TFL 55. Using this information, the Phase 1 (i.e. photo-
interpreted) age, height and volume were adjusted following VRI standard procedures in the Fraser
Protocol. The ratios derived from this adjustment process are shown in Table 5.1
The adjustments were only calculated for stands over the age of 40 years. A detailed description of the
VRI Phase 2 adjustment procedure is documented in TFL 55 Vegetation Resources Inventory
Statistical Adjustment (Timberline, 2005). This adjustment procedure was carried out using VDYP6.
This is problematic, for reasons that will be discussed in Section 8.0.

TFL 55 - MP#5 - Information Package Ecora File No: KE_15_060 22/08/2016 | Version 1.04
Ecora Engineering & Resource Group Ltd. Kelowna | Penticton | Prince George | Vancouver 6
Table 5.1 Phase 2 Adjustment
Stratum Height Age Volume
Balsam 1.03775 0.7919 1.0456
Cedar 0.9665 1.9918 1.3673
Hemlock 0.9057 1.1998 1.2636
Other (Fd) 0.9665 1.4871 1.3673
Spruce 0.9780 0.8080 1.0274
For the base case, natural stand yield tables will be generated using VDYP7 and the Phase 2
adjustments will not be applied. A sensitivity analysis will be run to test the impact of the Phase 2
adjustments. These yield curves will be generated using VDYP6.
5.3 Updating the Inventory Information
For this timber supply analysis the inventory has been updated for disturbances to January 1, 2016.
The version of the VRI data available on the DataBC website was the starting point. Recent cutblocks
that are not present in the VRI data were provided by Louisiana Pacific and have also been included in
the analysis dataset. Updates have not been applied for any 2016 harvesting. The update procedure
was designed only to capture recent disturbances for the purpose of this analysis; the VRI data itself
was not formally updated. For the analysis, recently harvested blocks have been given an age 0 and
put on the appropriate managed stand yield curve.
The forest inventory ages, heights and volumes have been projected to January 1, 2016.
5.4 Data Sources
Many sources of data were compiled to provide input to the timber supply analysis for TFL 55 MP No.
4. These are listed in Table 5.2 Data was used for three general purposes:
to determine the productive and timber harvesting land base
to identify resource management zones (RMZ’s) for the protection and modelling of non-timber
resources; and
to group together stands with similar growth characteristics (analysis units) in order to forecast
managed stand yields.
The spatial resultant created by overlaying the input data sets is used to generate most of the input files
required by the forest estate model.
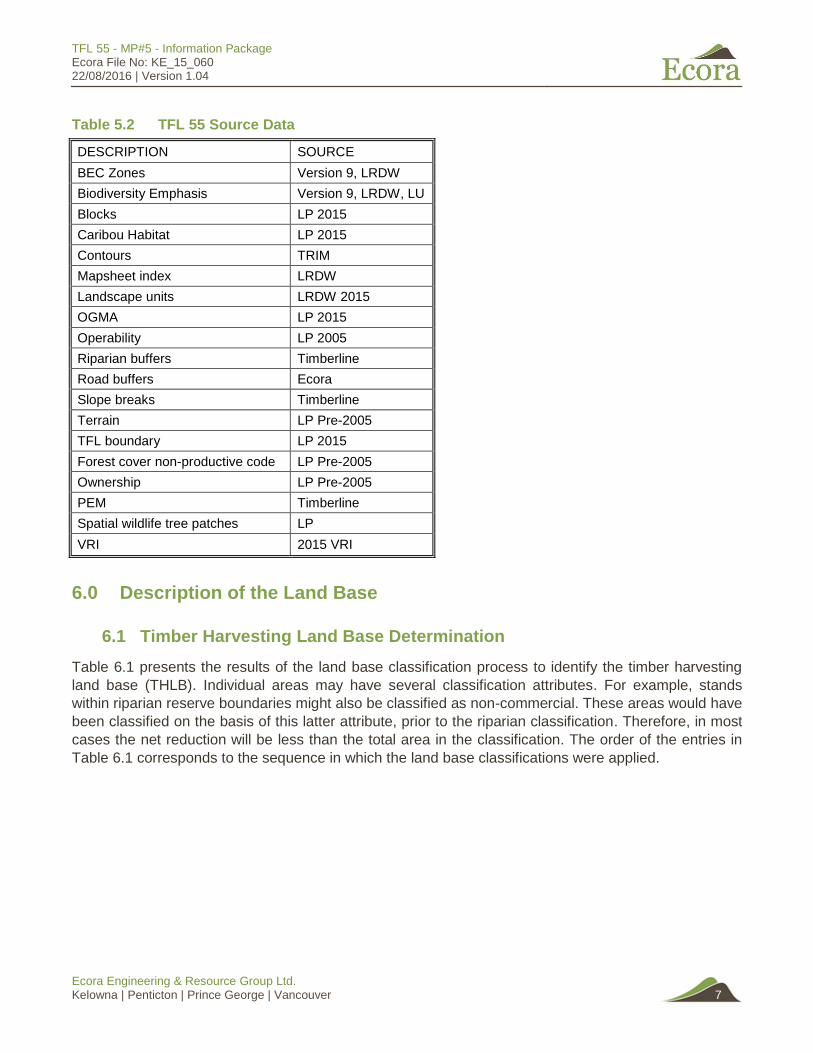
TFL 55 - MP#5 - Information Package Ecora File No: KE_15_060 22/08/2016 | Version 1.04
Ecora Engineering & Resource Group Ltd. Kelowna | Penticton | Prince George | Vancouver 7
Table 5.2 TFL 55 Source Data
DESCRIPTION SOURCE
BEC Zones Version 9, LRDW
Biodiversity Emphasis Version 9, LRDW, LU
Blocks LP 2015
Caribou Habitat LP 2015
Contours TRIM
Mapsheet index LRDW
Landscape units LRDW 2015
OGMA LP 2015
Operability LP 2005
Riparian buffers Timberline
Road buffers Ecora
Slope breaks Timberline
Terrain LP Pre-2005
TFL boundary LP 2015
Forest cover non-productive code LP Pre-2005
Ownership LP Pre-2005
PEM Timberline
Spatial wildlife tree patches LP
VRI 2015 VRI
6.0 Description of the Land Base
6.1 Timber Harvesting Land Base Determination
Table 6.1 presents the results of the land base classification process to identify the timber harvesting
land base (THLB). Individual areas may have several classification attributes. For example, stands
within riparian reserve boundaries might also be classified as non-commercial. These areas would have
been classified on the basis of this latter attribute, prior to the riparian classification. Therefore, in most
cases the net reduction will be less than the total area in the classification. The order of the entries in
Table 6.1 corresponds to the sequence in which the land base classifications were applied.

TFL 55 - MP#5 - Information Package Ecora File No: KE_15_060 22/08/2016 | Version 1.04
Ecora Engineering & Resource Group Ltd. Kelowna | Penticton | Prince George | Vancouver 8
Table 6.1 Base Case Timber Harvesting Land Base Determination
Management Plan #4 Management Plan #5
Land Base Classification Area (ha) Area
Removed (ha)
Area (ha) Area
Removed (ha)
Conifer Volume
(m3 x 1000)
Total Land Base 92,744 92,642 11,205
Ownership
38 38 38
Total TFL 92,706 92,604
Non-productive, Non-forest 36,801 38,125
Roads 802 893
Productive Land Base 55,103 53,585 11,205
Inoperable
30,244
28,783 6,030
Operable Land Base 24,859 24,802
Terrain 698 699 186
Riparian Reserves 810 645 183
Low Site 127 583 49
Deciduous 85 68 5
Wildlife Tree Patches 290 402 2
Caribou - 6,362 2,198
OGMA 290 36 29
Non-merchantable 421
NSR 87
Timber Harvesting Land Base
22,341 16,007 2,551
The total productive area on the TFL is 53,585 hectares and the THLB area is 16,007 hectares.
Table 6.2 summarizes the distribution of area and coniferous volume by 10-year age class for both the
productive and net timber harvesting land base.
Table 6.2 Age Class Distribution
Age Class
MFLNRO Age Class
Productive Area (ha)
Productive Volume (m
3)
THLB Area (ha)
THLB Volume (m
3)
0-10 0-19 3,628.0 0 2,754.3 0
10-20 0-19 1,815.5 326 1,679.9 312
20-30 20-39 2,313.4 5,109 2,123.5 4,910
30-40 20-39 2,819.0 38,333 2,454.5 34,021
40-50 40-59 758.7 10,391 37.3 1,578
50-60 40-59 853.7 52,281 50.0 4,732
60-70 60-79 733.2 43,397 20.6 2,395
70-80 60-79 591.5 81,593 55.1 23,329
80-90 80-99 1,264.1 155,834 76.2 24,224
90-100 80-99 835.7 128,397 107.8 26,210
100-110 100-119 1,954.1 372,382 259.2 115,643
110-120 100-119 1,522.4 302,352 96.5 32,144
120-130 120-139 700.4 133,741 105.1 38,871
130-140 120-139 502.1 119,551 106.6 36,159

TFL 55 - MP#5 - Information Package Ecora File No: KE_15_060 22/08/2016 | Version 1.04
Ecora Engineering & Resource Group Ltd. Kelowna | Penticton | Prince George | Vancouver 9
Age Class
MFLNRO Age Class
Productive Area (ha)
Productive Volume (m
3)
THLB Area (ha)
THLB Volume (m
3)
140-150 140-249 3,482.0 655,246 316.9 100,472
150-160 140-249 482.8 108,528 93.5 25,111
160-170 140-249 2,070.6 581,496 585.2 217,647
170-180 140-249 369.9 99,546 89.1 33,606
180-190 140-249 4,076.9 890,129 363.9 124,606
190-200 140-249 1,102.5 248,312 94.2 35,553
200-210 140-249 2,468.1 672,519 343.5 114,183
210-220 140-249 1,232.5 324,245 94.0 28,606
220-230 140-249 4,021.2 1,169,915 425.8 149,551
230-240 140-249 2,531.0 807,056 226.7 81,162
240-250 140-249 2,222.2 847,456 529.9 208,570
250+ 250+ 9,233.6 3,496,934 2,855.3 1,148,160
Total 53,585.1 11,345,068 15,944.7 2,611,756
Figure 6.1 summarizes the productive and net area of the TFL by 10-year age class.
Figure 6.1 Age Class Distribution
Table 6.3 and Figure 6.2 summarize the distribution of area by leading species for both the productive
and timber harvesting land base.

TFL 55 - MP#5 - Information Package Ecora File No: KE_15_060 22/08/2016 | Version 1.04
Ecora Engineering & Resource Group Ltd. Kelowna | Penticton | Prince George | Vancouver 10
Table 6.3 Leading Species Distribution
Species Code Productive Area (ha) THLB (ha)
None 849.9 605.4
AC 167.5 47.4
AT 71.8 0.0
BA 26.1 25.3
BL 14,625.9 637.7
CW 5,516.2 2,204.0
EP 53.7 3.9
FD 603.3 389.8
FDI 2,487.6 1,053.6
H 283.5 31.4
HM 1,283.3 256.3
HW 6,171.7 2,402.6
PA 13.2 0.0
PL 48.8 23.1
S 3.0 1.3
SE 15,696.2 2,929.2
SW 31.6 20.8
SX 5,651.8 5,312.9
Approximately half of the THLB is made up of spruce-leading stands. Hemlock-, cedar-, and Douglas-fir
make up most of the remaining THLB, in roughly equal amounts. Almost all of the THLB area without a
leading species in the forest cover data is comprised of recently harvested stands.
6.2 Total Area
The total area of TFL 55 is 92,642 hectares.
6.3 Ownership
Five small parcels totalling 38.5 hectares that fall within the outer TFL boundary are excluded from the
TFL (see Table 6.4). Several small mining tenures and the Canadian Mountain Holidays helicopter ski
lodge make up this exclusion.
Table 6.4 Non-TFL Land
Description Gross
(ha)
Productive
(ha)
Area
Removed (ha)
Excluded
Ownership 38.5 0 38.5
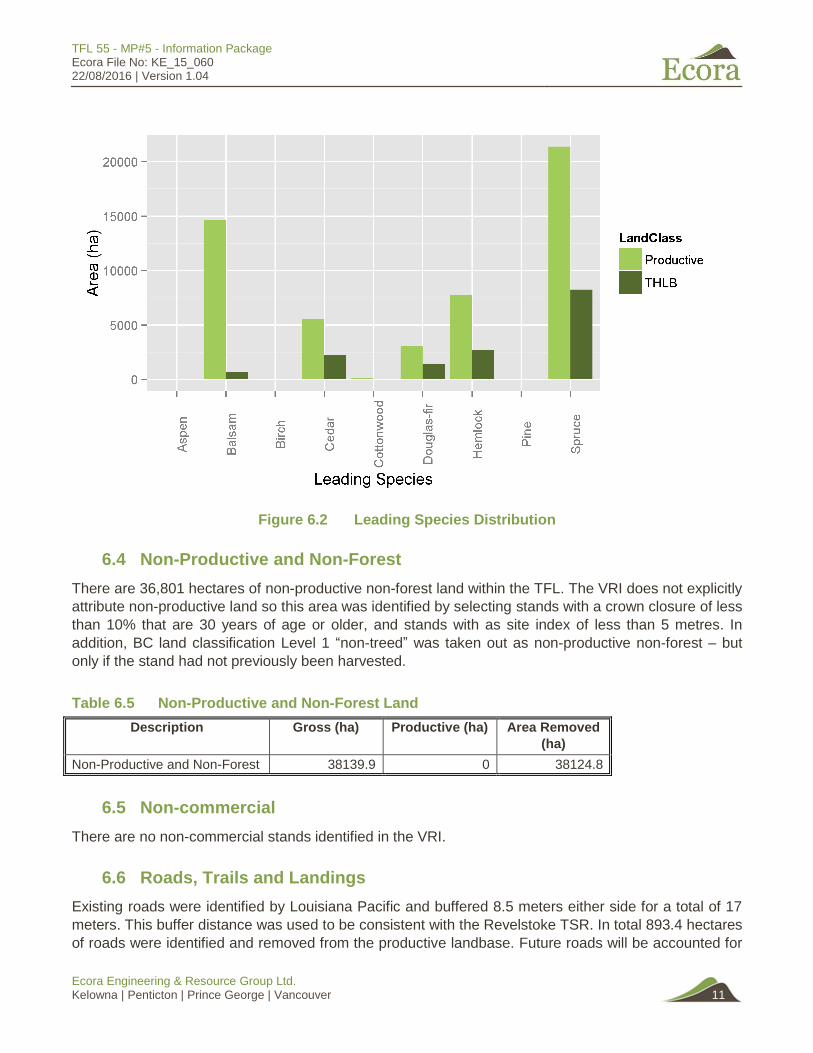
TFL 55 - MP#5 - Information Package Ecora File No: KE_15_060 22/08/2016 | Version 1.04
Ecora Engineering & Resource Group Ltd. Kelowna | Penticton | Prince George | Vancouver 11
Figure 6.2 Leading Species Distribution
6.4 Non-Productive and Non-Forest
There are 36,801 hectares of non-productive non-forest land within the TFL. The VRI does not explicitly
attribute non-productive land so this area was identified by selecting stands with a crown closure of less
than 10% that are 30 years of age or older, and stands with as site index of less than 5 metres. In
addition, BC land classification Level 1 “non-treed” was taken out as non-productive non-forest – but
only if the stand had not previously been harvested.
Table 6.5 Non-Productive and Non-Forest Land
Description Gross (ha) Productive (ha) Area Removed
(ha)
Non-Productive and Non-Forest 38139.9 0 38124.8
6.5 Non-commercial
There are no non-commercial stands identified in the VRI.
6.6 Roads, Trails and Landings
Existing roads were identified by Louisiana Pacific and buffered 8.5 meters either side for a total of 17
meters. This buffer distance was used to be consistent with the Revelstoke TSR. In total 893.4 hectares
of roads were identified and removed from the productive landbase. Future roads will be accounted for
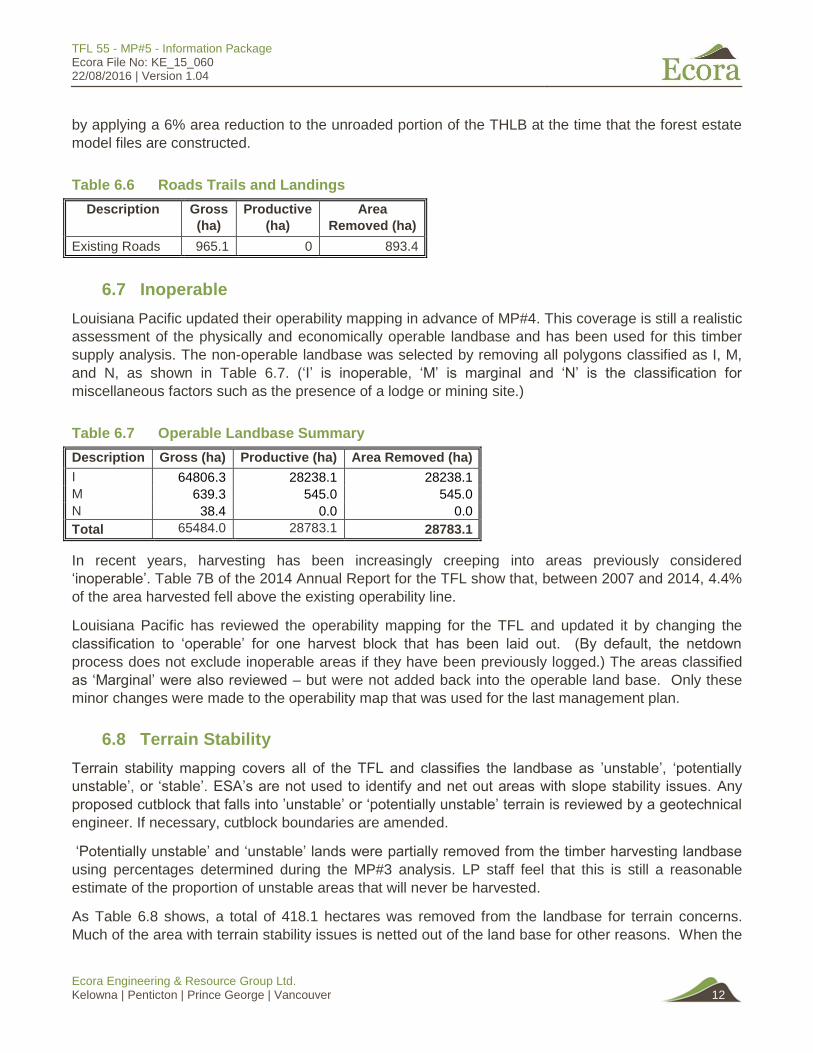
TFL 55 - MP#5 - Information Package Ecora File No: KE_15_060 22/08/2016 | Version 1.04
Ecora Engineering & Resource Group Ltd. Kelowna | Penticton | Prince George | Vancouver 12
by applying a 6% area reduction to the unroaded portion of the THLB at the time that the forest estate
model files are constructed.
Table 6.6 Roads Trails and Landings
Description Gross
(ha)
Productive
(ha)
Area
Removed (ha)
Existing Roads 965.1 0 893.4
6.7 Inoperable
Louisiana Pacific updated their operability mapping in advance of MP#4. This coverage is still a realistic
assessment of the physically and economically operable landbase and has been used for this timber
supply analysis. The non-operable landbase was selected by removing all polygons classified as I, M,
and N, as shown in Table 6.7. (‘I’ is inoperable, ‘M’ is marginal and ‘N’ is the classification for
miscellaneous factors such as the presence of a lodge or mining site.)
Table 6.7 Operable Landbase Summary
Description Gross (ha) Productive (ha) Area Removed (ha)
I 64806.3 28238.1 28238.1
M 639.3 545.0 545.0
N 38.4 0.0 0.0
Total 65484.0 28783.1 28783.1
In recent years, harvesting has been increasingly creeping into areas previously considered
‘inoperable’. Table 7B of the 2014 Annual Report for the TFL show that, between 2007 and 2014, 4.4%
of the area harvested fell above the existing operability line.
Louisiana Pacific has reviewed the operability mapping for the TFL and updated it by changing the
classification to ‘operable’ for one harvest block that has been laid out. (By default, the netdown
process does not exclude inoperable areas if they have been previously logged.) The areas classified
as ‘Marginal’ were also reviewed – but were not added back into the operable land base. Only these
minor changes were made to the operability map that was used for the last management plan.
6.8 Terrain Stability
Terrain stability mapping covers all of the TFL and classifies the landbase as ’unstable’, ‘potentially
unstable’, or ‘stable’. ESA’s are not used to identify and net out areas with slope stability issues. Any
proposed cutblock that falls into ’unstable’ or ‘potentially unstable’ terrain is reviewed by a geotechnical
engineer. If necessary, cutblock boundaries are amended.
‘Potentially unstable’ and ‘unstable’ lands were partially removed from the timber harvesting landbase
using percentages determined during the MP#3 analysis. LP staff feel that this is still a reasonable
estimate of the proportion of unstable areas that will never be harvested.
As Table 6.8 shows, a total of 418.1 hectares was removed from the landbase for terrain concerns.
Much of the area with terrain stability issues is netted out of the land base for other reasons. When the
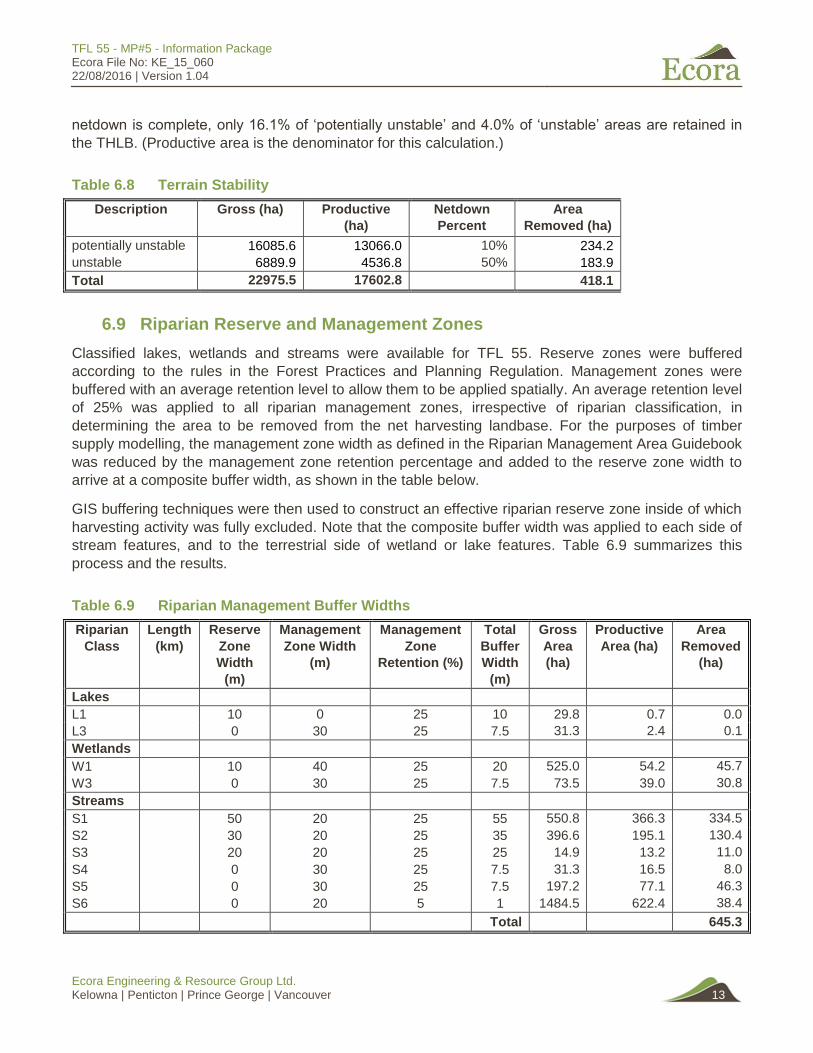
TFL 55 - MP#5 - Information Package Ecora File No: KE_15_060 22/08/2016 | Version 1.04
Ecora Engineering & Resource Group Ltd. Kelowna | Penticton | Prince George | Vancouver 13
netdown is complete, only 16.1% of ‘potentially unstable’ and 4.0% of ‘unstable’ areas are retained in
the THLB. (Productive area is the denominator for this calculation.)
Table 6.8 Terrain Stability
Description Gross (ha) Productive
(ha)
Netdown
Percent
Area
Removed (ha)
potentially unstable 16085.6 13066.0 10% 234.2
unstable 6889.9 4536.8 50% 183.9
Total 22975.5 17602.8 418.1
6.9 Riparian Reserve and Management Zones
Classified lakes, wetlands and streams were available for TFL 55. Reserve zones were buffered
according to the rules in the Forest Practices and Planning Regulation. Management zones were
buffered with an average retention level to allow them to be applied spatially. An average retention level
of 25% was applied to all riparian management zones, irrespective of riparian classification, in
determining the area to be removed from the net harvesting landbase. For the purposes of timber
supply modelling, the management zone width as defined in the Riparian Management Area Guidebook
was reduced by the management zone retention percentage and added to the reserve zone width to
arrive at a composite buffer width, as shown in the table below.
GIS buffering techniques were then used to construct an effective riparian reserve zone inside of which
harvesting activity was fully excluded. Note that the composite buffer width was applied to each side of
stream features, and to the terrestrial side of wetland or lake features. Table 6.9 summarizes this
process and the results.
Table 6.9 Riparian Management Buffer Widths
Riparian
Class
Length
(km)
Reserve
Zone
Width
(m)
Management
Zone Width
(m)
Management
Zone
Retention (%)
Total
Buffer
Width
(m)
Gross
Area
(ha)
Productive
Area (ha)
Area
Removed
(ha)
Lakes
L1 10 0 25 10 29.8 0.7 0.0
L3 0 30 25 7.5 31.3 2.4 0.1
Wetlands
W1 10 40 25 20 525.0 54.2 45.7
W3 0 30 25 7.5 73.5 39.0 30.8
Streams
S1 50 20 25 55 550.8 366.3 334.5
S2 30 20 25 35 396.6 195.1 130.4
S3 20 20 25 25 14.9 13.2 11.0
S4 0 30 25 7.5 31.3 16.5 8.0
S5 0 30 25 7.5 197.2 77.1 46.3
S6 0 20 5 1 1484.5 622.4 38.4
Total 645.3

TFL 55 - MP#5 - Information Package Ecora File No: KE_15_060 22/08/2016 | Version 1.04
Ecora Engineering & Resource Group Ltd. Kelowna | Penticton | Prince George | Vancouver 14
6.10 Low Site Productivity
Sites with low productivity were determined by calculating the net volume each stand would contain at
140 years old and removing it from the harvestable landbase if it did not achieve a minimum volume. All
stands were removed if they did not achieve 150 m3/ha. For the MP#4 analysis, cedar, hemlock stands
were removed if they did not achieve a volume of 200 m3/ha by year 140. This exception has not been
applied for this analysis; the volume limit for all leading species is 150 m3/ha. Stands with a logging
history were not removed from the THLB - regardless of whether or not they met the minimum volume
criteria. Table 6.10 summarizes this reduction.
Table 6.10 Low Site Productivity Reductions
Description Gross (ha) Productive (ha) Area Removed (ha)
Low Site 21156.0 9700.8 583.3
6.11 Deciduous
All deciduous-leading stands were removed from the harvestable landbase – except in cases where the
stand had a harvest history. Table 6.11 shows this reduction. Deciduous volume in conifer leading
stands is accounted for as a yield curve reduction.
Table 6.11 Deciduous Stand Reduction
Inventory Type Group Gross (ha) Productive (ha) Area Removed (ha)
Deciduous Leading 358.2 293.0 68.4
6.12 Non-merchantable Forest Types
For the MP#4 analysis, stands with a significant hemlock / balsam component were netted out of the
timber harvesting landbase. In total, 421 hectares were removed for this reason. However, timber
harvesting economics have changed over the intervening years, and these stands are no longer
considered economically infeasible; they have not been netted out of the THLB for this analysis.
The harvesting performance tables in Appendix C provide evidence that hemlock stands are now more
economically viable. The tables are reproduced from the TFL 55 2014 Annual Report. These were
prepared specifically to allay the Chief Foresters concerns – expressed in the last AAC determination –
regarding harvesting performance in hemlock stands. The first table (7A) shows that hemlock-leading
stands make up 17% of the THLB, but that they constitute 27.8% of the area harvested between 2007
and 2014. The second table (7C) profiles the THLB by three hemlock concentration categories (40-
60%, 60-80% and 80+%) and demonstrates that harvesting exceeds the targets for all three categories.
The final table (7D) compares mature growing stock volumes (by species) to harvest volumes. The two
sets of percentages are closely aligned. Hemlock harvest percentage is only slightly below the growing
stock percentage – 25.3% versus 27.1%.

TFL 55 - MP#5 - Information Package Ecora File No: KE_15_060 22/08/2016 | Version 1.04
Ecora Engineering & Resource Group Ltd. Kelowna | Penticton | Prince George | Vancouver 15
6.13 Stand-level Biodiversity (Wildlife Tree Patches)
Existing wildlife tree patches (WTPs) on TFL 55 have been explicitly mapped, and are incorporated into
the spatial database for this analysis. A total of 395.1 hectares of existing WTPs have been removed
from the THLB, but are retained in the modelling data set so that they may contribute to non-timber
resource objectives. This is shown in Table 6.12. The approach to modelling future wildlife tree patches
is described in Section 10.1.2.
Table 6.12 Wildlife Tree Patches
Description Gross (ha) Productive (ha) Area Removed (ha)
WTP 471.1 464.6 402.1
6.14 Caribou Habitat
Since the previous analysis, 18,838 hectares of caribou habitat has been established within the
boundaries of TFL 55. In December 2008, Ungulate Winter Range (UWR) U-3-005 was established.
No harvesting is permitting within this area. The net impact on the THLB is a reduction of 6,305
hectares, as shown in Table 6.13. This management area overlaps a significant portion of TFL 55.
Table 6.13 Caribou Habitat
Description Gross (ha) Productive (ha) Area Removed (ha)
Caribou Habitat 18838.1 18359.3 6361.5
6.15 Old Growth Management Areas
In 2008 LP engaged Timberline Natural Resource Group to delineate OGMA’s that met government
objectives for landscape-level biodiversity while minimizing harvest level impacts. A copy of the project
report and be found in Appendix D. These OGMA’s cover 3,868 hectares across the entire TFL.
Because they overlap significantly with netdowns for other reasons and resource values, the net impact
on the THLB is only 35.6 hectares (as shown in Table 6.14). As noted in Section 10.1 (Forest Cover
Objectives), these OGMA’s replace the landscape level biodiversity objectives (i.e. old seral
constraints) that were modeled in the base case for the last timber supply analysis.
Table 6.14 Old Growth Management Areas
Description Gross (ha) Productive (ha) Area Removed (ha)
OGMA 4059.8 3867.9 35.6
6.16 Cultural Resources
No netdown has been applied for cultural heritage or archaeological resources. These are only
infrequently encountered on the TFL, and can be managed at an operational level through the siting of
wildlife tree patches and other reserves. This approach to management does not impact strategic
timber supply.

TFL 55 - MP#5 - Information Package Ecora File No: KE_15_060 22/08/2016 | Version 1.04
Ecora Engineering & Resource Group Ltd. Kelowna | Penticton | Prince George | Vancouver 16
7.0 Inventory Aggregation
In order to reduce the complexity of the forest description for the purpose of timber supply analysis,
aggregation of individual forest stands is necessary.
7.1 Revelstoke Higher Level Plan Order
In March 2005 the Revelstoke Higher Level Plan Order was implemented as legislated in Section 3 of
the Forest Practices code of British Columbia Act. The Order established resource management zones
and objectives. The higher level plan order provides objectives for the mature and old seral
requirements for TFL 55.
An amendment to the RHLPO was published and came into force in 2011. This order modified the
mature seral definition and targets that were specified in the original order. The only changes relevant
to TFL 55 are:
1. ‘mature + old’ seral targets have been removed;
2. all references to an ‘operability line’ have been deleted (previously, seral targets had to be met
independently for areas above and below the line); and
3. a clarification that seral target must be met on the Crown Forest Land Base (CFLB) – not just on
the THLB.
All of the foregoing would not factor into the base case run. With the removal or ‘mature + old’ targets,
and the replacement of old seral targets with spatially defined OGMA’s, there is no need to model
retention constraints.
7.2 Ecosystem Types
Figure 7.1 shows the area in each BEC variant on TFL 55.
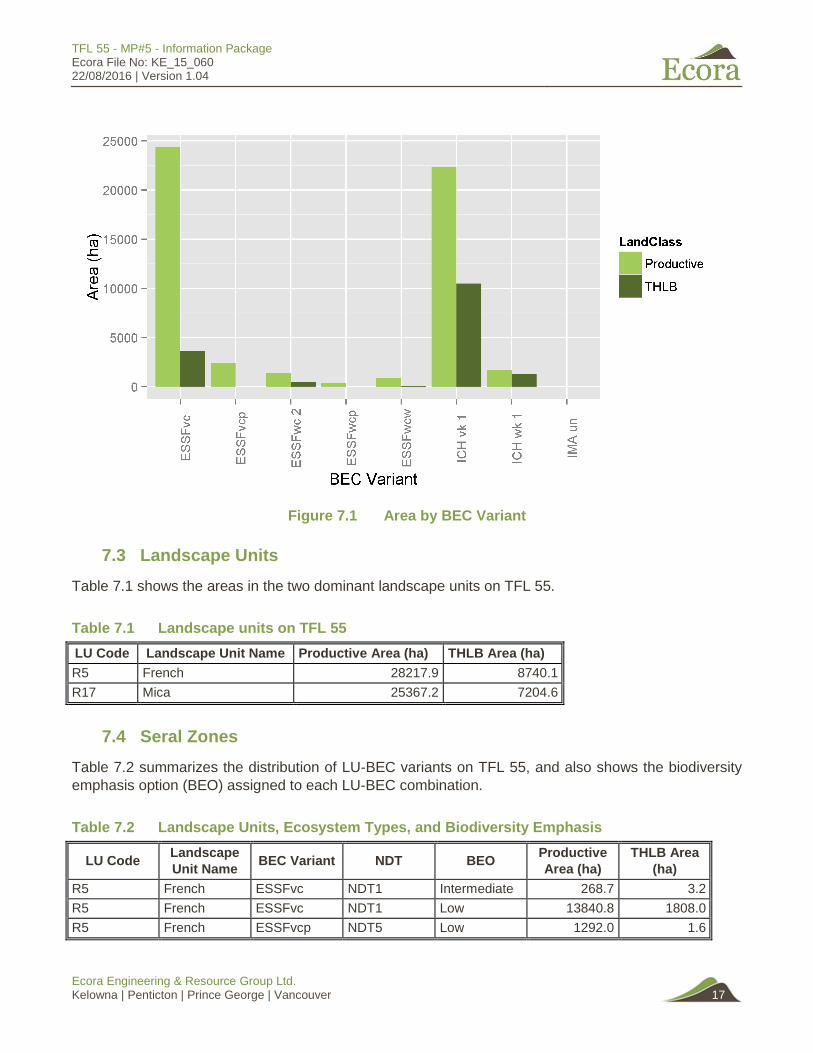
TFL 55 - MP#5 - Information Package Ecora File No: KE_15_060 22/08/2016 | Version 1.04
Ecora Engineering & Resource Group Ltd. Kelowna | Penticton | Prince George | Vancouver 17
Figure 7.1 Area by BEC Variant
7.3 Landscape Units
Table 7.1 shows the areas in the two dominant landscape units on TFL 55.
Table 7.1 Landscape units on TFL 55
LU Code Landscape Unit Name Productive Area (ha) THLB Area (ha)
R5 French 28217.9 8740.1
R17 Mica 25367.2 7204.6
7.4 Seral Zones
Table 7.2 summarizes the distribution of LU-BEC variants on TFL 55, and also shows the biodiversity
emphasis option (BEO) assigned to each LU-BEC combination.
Table 7.2 Landscape Units, Ecosystem Types, and Biodiversity Emphasis
LU Code Landscape
Unit Name BEC Variant NDT BEO
Productive
Area (ha)
THLB Area
(ha)
R5 French ESSFvc NDT1 Intermediate 268.7 3.2
R5 French ESSFvc NDT1 Low 13840.8 1808.0
R5 French ESSFvcp NDT5 Low 1292.0 1.6

TFL 55 - MP#5 - Information Package Ecora File No: KE_15_060 22/08/2016 | Version 1.04
Ecora Engineering & Resource Group Ltd. Kelowna | Penticton | Prince George | Vancouver 18
LU Code Landscape
Unit Name BEC Variant NDT BEO
Productive
Area (ha)
THLB Area
(ha)
R5 French ICH vk 1 NDT1 Intermediate 3137.9 1827.4
R5 French ICH vk 1 NDT1 Low 7979.8 3839.5
R5 French ICH wk 1 NDT1 Intermediate 1006.6 789.1
R5 French ICH wk 1 NDT1 Low 682.6 471.4
R5 French IMA un NDT5 Low 9.5 0.0
R17 Mica ESSFvc NDT1 Intermediate 226.7 162.7
R17 Mica ESSFvc NDT1 Low 10060.3 1627.8
R17 Mica ESSFvcp NDT5 Low 1162.1 0.0
R17 Mica ESSFwc 2 NDT1 Low 1381.7 505.3
R17 Mica ESSFwcp NDT5 Low 370.7 1.0
R17 Mica ESSFwcw NDT1 Low 930.0 60.9
R17 Mica ICH vk 1 NDT1 Intermediate 3621.1 1616.8
R17 Mica ICH vk 1 NDT1 Low 7573.6 3208.9
R17 Mica ICH wk 1 NDT1 Intermediate 40.8 21.1
R17 Mica IMA un NDT5 Low 0.0 0.0
7.5 Analysis Units
Stands are grouped into analysis units to reduce modelling complexity. For this analysis, an
ecologically-based system for grouping stands into analysis units has been used. This approach was
originally implemented for the last management plan because it integrates more closely with
ecologically-based productivity estimates. Additionally, many management and silviculture treatment
decisions are determined based on the ecological classification of the stand being treated.
Stands were grouped using the BEC system (PEM) at the site series level and (in some cases) further
broken down by leading species. Site series/species combinations that only represent a small
proportion of the landbase have been aggregated with a similar analysis unit. There are 25 existing
managed stand analysis units and another set of 25 analysis units for the future managed stands (the
later set includes genetic gains). Yield curves for existing natural stands have been generated on a
stand-by-stand basis.
Table 7.3 shows the analysis unit definitions and the area in each analysis unit.
Table 7.3 Analysis Unit Definitions
Analysis Unit Definition Area (hectares)
Analysis
Unit BEC Variant
Site
Series Species Productive THLB
1 ICHwk1 9,7,6 Spruce 177.8 91.6
2 ICHwk1 5 Spruce 175.0 144.9
3 ICHwk1 4 Hemlock-Cedar 153.1 122.2
4 ICHwk1 4 Douglas-fir 449.5 362.3
5 ICHwk1 4 Spruce 205.7 161.2
6 ICHwk1 1 Cedar 192.4 179.5

TFL 55 - MP#5 - Information Package Ecora File No: KE_15_060 22/08/2016 | Version 1.04
Ecora Engineering & Resource Group Ltd. Kelowna | Penticton | Prince George | Vancouver 19
Analysis Unit Definition Area (hectares)
Analysis
Unit BEC Variant
Site
Series Species Productive THLB
7 ICHwk1 1 Hemlock 107.0 80.8
8 ICHwk1 1 Spruce-Douglas-fir 97.7 79.7
9 ICHvk1 5 Spruce-Balsam 3,266.1 2,155.2
10 ICHvk1 5 Cedar-Hemlock 357.4 156.6
11 ICHvk1 4 Spruce-Balsam-Pine 3,873.4 1,700.1
12 ICHvk1 4,3 Cedar -Pine 3,465.5 1,113.7
13 ICHvk1 4 Douglas-fir 1,334.4 538.9
14 ICHvk1 4 Hemlock 3,202.2 1,032.9
15 ICHvk1 3,1 Spruce-Balsam-Hemlock 2,281.2 1,297.9
16 ICHvk1 1 Cedar 1,314.9 684.2
17 ICHvk1 1 Hemlock-Douglas-fir-Pine 3,071.7 1,433.3
18 ESSFwcw, & wc2 4,3 Spruce-Balsam 1,096.5 389.3
19 ESSFwcw & wc2 1 Spruce 1,662.5 288.1
20 ESSFvc 1 Balsam 8,685.3 388.7
21 ESSFvc 1 Cedar 236.1 100.1
22 ESSFvc 1 Hemlock 1,710.1 383.7
23 ESSFvc 1 Spruce 8,758.8 2,552.9
24 ESSFvc 6,4 Spruce 201.5 47.1
25 ESSFvc 3 All 7,499.9 460.0
Totals 53,585.1 15,944.7
8.0 Growth and Yield
A stand’s growth in terms of height, diameter and volume is predicted using growth and yield models.
The assumptions, inputs and outputs used in these models are documented in the following sections.
Stands are either classified as natural or managed depending on their silviculture history and the
origins of the stand. Stands that regenerated prior to1970 are considered to be ‘natural stands’.
Managed stands are those established in 1970 or later. Although 1987 is the year that legislated basic
silvicultural obligations came into force, the program of basic silviculture on the TFL predates that by
many years. Table 8.1 summarizes the area logged, planted and declared free-growing between 1970
and 1986.
Table 8.1 TFL 55 Silviculture Summary – 1970 to 1986
Activity Area (ha) Area (%)
Logged 3347.7 100
Planted 3034.7 91
Declared Free-Growing 3277.3 98
Managed stands are divided into two categories. Stands established between 1970 and 2004 have no
genetic gain applied. Those established in 2005 and later have genetic gain applied for spruce and
Douglas-fir.
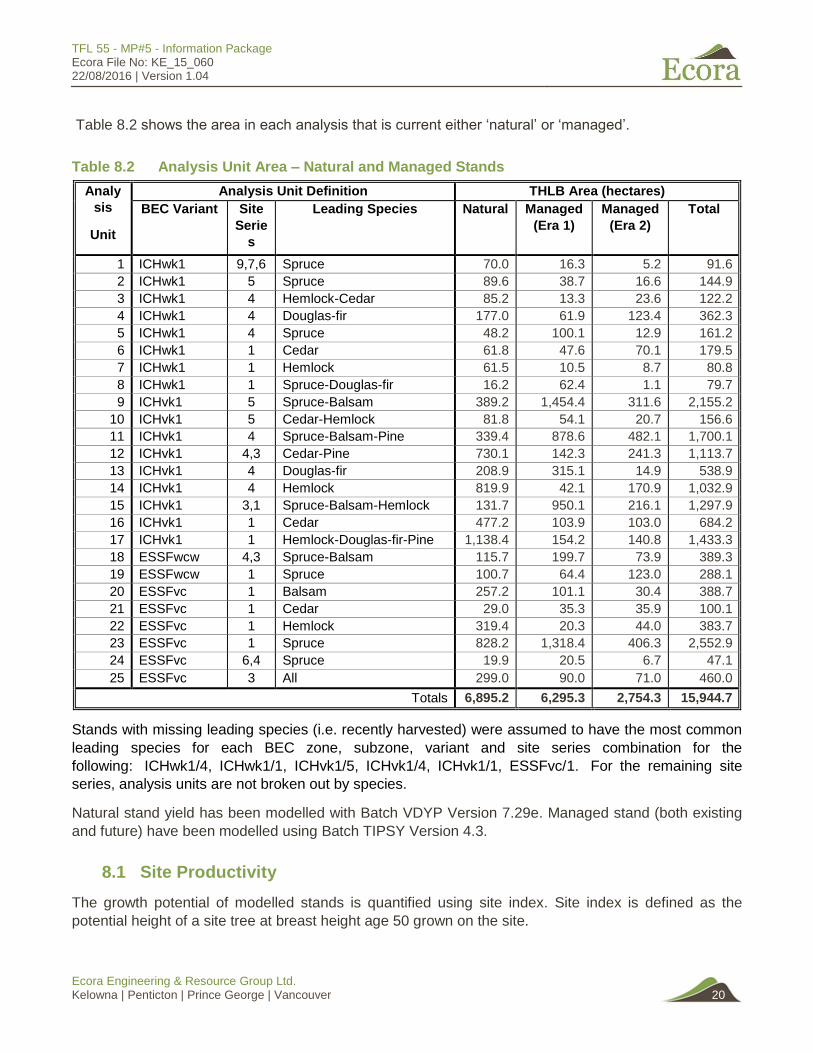
TFL 55 - MP#5 - Information Package Ecora File No: KE_15_060 22/08/2016 | Version 1.04
Ecora Engineering & Resource Group Ltd. Kelowna | Penticton | Prince George | Vancouver 20
Table 8.2 shows the area in each analysis that is current either ‘natural’ or ‘managed’.
Table 8.2 Analysis Unit Area – Natural and Managed Stands
Analy
sis
Unit
Analysis Unit Definition THLB Area (hectares)
BEC Variant Site
Serie
s
Leading Species Natural Managed
(Era 1)
Managed
(Era 2)
Total
1 ICHwk1 9,7,6 Spruce 70.0 16.3 5.2 91.6
2 ICHwk1 5 Spruce 89.6 38.7 16.6 144.9
3 ICHwk1 4 Hemlock-Cedar 85.2 13.3 23.6 122.2
4 ICHwk1 4 Douglas-fir 177.0 61.9 123.4 362.3
5 ICHwk1 4 Spruce 48.2 100.1 12.9 161.2
6 ICHwk1 1 Cedar 61.8 47.6 70.1 179.5
7 ICHwk1 1 Hemlock 61.5 10.5 8.7 80.8
8 ICHwk1 1 Spruce-Douglas-fir 16.2 62.4 1.1 79.7
9 ICHvk1 5 Spruce-Balsam 389.2 1,454.4 311.6 2,155.2
10 ICHvk1 5 Cedar-Hemlock 81.8 54.1 20.7 156.6
11 ICHvk1 4 Spruce-Balsam-Pine 339.4 878.6 482.1 1,700.1
12 ICHvk1 4,3 Cedar-Pine 730.1 142.3 241.3 1,113.7
13 ICHvk1 4 Douglas-fir 208.9 315.1 14.9 538.9
14 ICHvk1 4 Hemlock 819.9 42.1 170.9 1,032.9
15 ICHvk1 3,1 Spruce-Balsam-Hemlock 131.7 950.1 216.1 1,297.9
16 ICHvk1 1 Cedar 477.2 103.9 103.0 684.2
17 ICHvk1 1 Hemlock-Douglas-fir-Pine 1,138.4 154.2 140.8 1,433.3
18 ESSFwcw 4,3 Spruce-Balsam 115.7 199.7 73.9 389.3
19 ESSFwcw 1 Spruce 100.7 64.4 123.0 288.1
20 ESSFvc 1 Balsam 257.2 101.1 30.4 388.7
21 ESSFvc 1 Cedar 29.0 35.3 35.9 100.1
22 ESSFvc 1 Hemlock 319.4 20.3 44.0 383.7
23 ESSFvc 1 Spruce 828.2 1,318.4 406.3 2,552.9
24 ESSFvc 6,4 Spruce 19.9 20.5 6.7 47.1
25 ESSFvc 3 All 299.0 90.0 71.0 460.0
Totals 6,895.2 6,295.3 2,754.3 15,944.7
Stands with missing leading species (i.e. recently harvested) were assumed to have the most common
leading species for each BEC zone, subzone, variant and site series combination for the
following: ICHwk1/4, ICHwk1/1, ICHvk1/5, ICHvk1/4, ICHvk1/1, ESSFvc/1. For the remaining site
series, analysis units are not broken out by species.
Natural stand yield has been modelled with Batch VDYP Version 7.29e. Managed stand (both existing
and future) have been modelled using Batch TIPSY Version 4.3.
8.1 Site Productivity
The growth potential of modelled stands is quantified using site index. Site index is defined as the
potential height of a site tree at breast height age 50 grown on the site.
TFL 55 - MP#5 - Information Package Ecora File No: KE_15_060 22/08/2016 | Version 1.04
Ecora Engineering & Resource Group Ltd. Kelowna | Penticton | Prince George | Vancouver 21
8.1.1 VRI Site Index
The inventory site index from the VRI has been used to develop yield tables for all existing stands. VRI
site index values are developed using the age and height attributes for each stand in the inventory
which is at least 30 years old. Stands younger than 30 years of age at the time of inventory have a site
index estimated directly by the photo interpreter.
Inventory site index estimates have been used to generate yield curves for all stands that regenerated
in 1970 or earlier.
8.1.2 SIBEC Site Index
The Site Index by BEC Site Series - SIBEC Project was initiated by the provincial government in 1994.
It has developed a database of field measurements that has been used to develop relationships
between the ecological characteristics of a stand and its productivity. Data has been compiled to
provide tree species site index estimates that reflect the average growth potential of tree species in
forested site series. The inputs needed to use this database are biogeoclimatic subzone, site series
and leading species. These are available from provincial BGC mapping, the TFL 55 Predictive
Ecosystem Mapping project, and the VRI respectively.
SIBEC site index estimates have been used to generate yield curves for all stands that regenerated
after 1970.
8.1.3 SIA Productivity Estimates
Louisiana Pacific undertook a site index adjustment project in 2005. J. S. Thrower and Associated Ltd.
completed the fieldwork and analysis (see Appendix B). Preliminary potential site index (PSI) estimates
– by site series – were developed based on expert knowledge of site productivity on the TFL. Field
plots were established in the ICHvk1, ICHwk1 and ESSFvc BCG variants. Using this data, a ratio
adjustment as developed applied to the starting ‘expert’ PSI estimates.
The impact of using PSI (in place of SIBEC) to generate managed stand yield tables will be tested in a
sensitivity analysis.
8.2 Utilization Levels
The utilization level defines the maximum height of stumps that may be left on harvested areas and the
minimum top diameter (inside bark) and minimum diameter (dbh) of stems that must be removed from
harvested areas. These factors are needed to calculate merchantable stand volume for use in the
analysis. The utilization levels modelled are listed in Table 8.3. They reflect current standards and
performance.

TFL 55 - MP#5 - Information Package Ecora File No: KE_15_060 22/08/2016 | Version 1.04
Ecora Engineering & Resource Group Ltd. Kelowna | Penticton | Prince George | Vancouver 22
Table 8.3 Utilization Levels
Leading Species Minimum DBH (cm) Stump Height (cm) Minimum Top DIB (cm)
Pine 12.5 30.0 10.0
All species 17.5 30.0 10.0
Note: DBH = diameter breast height, DIB = diameter inside bark
8.3 Volume Reductions
Standing inventory volumes include the deciduous component – but this volume is not currently being
harvested or utilized. For the purposes of modelling, all yield tables are reduced by a percentage
reflecting the deciduous component of the stand.
Yield tables will also be reduced to account for future wildlife tree patches. These reductions are
discussed further in Section 10.3.1. The deciduous component of natural stands can contribute to the
wildlife tree patch percentage.
8.4 VDYP Natural Stand Yield Tables
Natural stand yield tables (NSYTs) were developed using the batch version of VDYP (Version 7.29e). A
separate yield curve has been run for each existing natural stand. The VDYP-generated yield curves
include both coniferous and deciduous volumes. When these curves are loaded into the forest estate
model, the volumes will be reduced to remove the deciduous component.
A second site of natural stand yield tables has been generated using VDYP 6. These will be used for a
sensitivity analysis. The difference between the starting growing stock for MP#4 and MP#5 is
significant, as is demonstrated in Table 8.4.
Table 8.4 MP#4 and MP#5 Growing Stock Comparison
Management Plan Productive Area
(ha)
Volume (m3)
VDYP 6 Unadjusted
VDYP 6 Adjusted
VDYP 7 Unadjusted
MP#4 55,103 16,262,127
MP#5 53,585 13,570,805 14,405,444 11,303,974
MP#5 - Unlogged 53,585 14,345,256 15,231,352 11,969,679
MP#5 - Unlogged - Area-Adjusted 55,103 14,751,640 15,662,838 12,308,766
Some of the difference can be explained by logging in the intervening years, and by the slight change in
the size of the productive land base. Most of the difference, however, appears to arise from the switch
from VDYP 6 to VDYP 7. It is especially problematic that the Phase 2 adjustment factors (Appendix A)
– which were calculated using VDYP 6 – cannot be applied to the VDYP 7 base case natural stand
yield tables.

TFL 55 - MP#5 - Information Package Ecora File No: KE_15_060 22/08/2016 | Version 1.04
Ecora Engineering & Resource Group Ltd. Kelowna | Penticton | Prince George | Vancouver 23
The VDYP 6 curves generated for the sensitivity analysis will be based on the Phase 2 adjusted data.
These adjustment factors will affect the analysis as follows:
Adjusted age and height are used to determine the inventory site index, which:
Are inputs to variable density yields program (VDYP) used for determining existing
volumes used for the netdown (i.e. low site);
Are inputs to VDYP used for creating natural stand yield curves;
Adjusted ages are updated and used as the starting age in the analysis; and
Volume adjustment factors are a VDYP input that adjust the natural stand yield curves.
New minimum harvest ages values will be computed for each stand based on these new yield curves.
8.4.1 Decay, Waste, and Breakage
Decay waste and breakage (DWB) has been included in this analysis via VDYP, which uses DWB
factors for each biogeoclimatic zone. Both VDYP and TIPSY apply these factors when compiling net
volume for yield curve construction.
For the sensitivity analysis based on the Phase 2 volumes, decay, waste and breakage factors are
recalibrated through the net volume adjustment factor (NVAF) process. These reflect actual ground-
truthed volumes from the plots established on the TFL.
8.4.2 Dead Potential Volume
A minor shortcoming of VDYP (all versions) is that it does not account for ‘dead potential’ volume in
stands. These are standing dead trees that are tallied as tree class ‘3’, ‘7’ or ‘9’ on a cruise tally card.
MFLNRO has studied this matter, and on recent determinations the Chief Forester has dealt with it as
an ‘upward pressure’ in the final stages of setting the AAC. LP will review cruise data for the past
several years and calculate the average dead potential volume found in recent cutting permits. If
necessary, natural stands yield tables will be adjusted for this added volume and as sensitivity analysis
will be run.
8.5 TIPSY Managed Stand Yield Tables
There are two sets of analysis units for managed stands specifically:
101 through 125 are future managed stands that include genetic gain; and
201 through 225 are existing managed stands that do not include genetic gain; and
301 through 325 are existing managed stands which have genetic gain applied.
Managed stand yield tables (MSYTs) were modelled using BatchTIPSY (Version 4.3). Table 8.5
presents the existing managed stand analysis units, species and site index values that were input to
TIPSY during yield curve preparation. The SIBEC site indices shown in Table 8.5 are used for the
MP#5 base case; a corresponding set of curves based on SIA site index will be generated for a
sensitivity analysis.

TFL 55 - MP#5 - Information Package Ecora File No: KE_15_060 22/08/2016 | Version 1.04
Ecora Engineering & Resource Group Ltd. Kelowna | Penticton | Prince George | Vancouver 24
8.5.1 Species Composition
Species composition for managed stands has been summarized by BEC subzone / variant from
silvicultural records, and is shown in Table 8.5.
Table 8.5 Managed Stand Site Index and Species Composition
Analysis
Unit
SIBEC
SI
(m)
sp1 sp2 sp3 sp4 sp5 pct1 pct2 pct3 pct4 pct5
1 21.0 Fd Cw Sx Pw Hw 32 29 25 12 2
2 24.0 Fd Cw Sx Pw Hw 32 29 25 12 2
3 18.0 Fd Cw Sx Pw Hw 32 29 25 12 2
4 24.7 Fd Cw Sx Pw Hw 32 29 25 12 2
5 21.0 Fd Cw Sx Pw Hw 32 29 25 12 2
6 19.0 Fd Cw Sx Pw Hw 32 29 25 12 2
7 20.3 Fd Cw Sx Pw Hw 32 29 25 12 2
8 24.0 Fd Cw Sx Pw Hw 32 29 25 12 2
9 21.0 Sx Cw Fd Pw Bl 50 30 10 6 4
10 18.0 Sx Cw Fd Pw Bl 50 30 10 6 4
11 24.0 Sx Cw Fd Pw Bl 50 30 10 6 4
12 18.0 Sx Cw Fd Pw Bl 50 30 10 6 4
13 27.0 Sx Cw Fd Pw Bl 50 30 10 6 4
14 18.0 Sx Cw Fd Pw Bl 50 30 10 6 4
15 21.0 Sx Cw Fd Pw Bl 50 30 10 6 4
16 21.0 Sx Cw Fd Pw Bl 50 30 10 6 4
17 24.0 Sx Cw Fd Pw Bl 50 30 10 6 4
18 12.0 Sx Bl Hm 68 23 9
19 15.0 Sx Bl Hm 68 23 9
20 15.0 Sx Bl Hm 68 23 9
21 15.0 Sx Bl Hm 68 23 9
22 12.0 Sx Bl Hm 68 23 9
23 15.0 Sx Bl Hm 68 23 9
24 18.0 Sx Bl Hm 68 23 9
25 18.0 Sx Bl Hm 68 23 9
8.5.2 Stand Density
Stands are planted to a target density of 1600 stems per hectare. Actual planting densities achieved
are shown in Table 8.6. These actual densities have been used for TIPSY modelling purposes.
Table 8.6 Managed Stand Density at Free Growing
Silvicultural Period Planting Density Achieved

TFL 55 - MP#5 - Information Package Ecora File No: KE_15_060 22/08/2016 | Version 1.04
Ecora Engineering & Resource Group Ltd. Kelowna | Penticton | Prince George | Vancouver 25
Era (#/ha)
1 1970 - 2004 1525
2 2005 - 2015 1525
Future 2016 + 1525
8.5.3 Regeneration Delay
Regeneration delay is the time elapsed between harvesting and the establishment of a new stand of
trees. The end of the regeneration delay is time zero for a yield table; it is the point in time when stand
growth begins. Regeneration delay is two years for all species and has been modelled using the
regeneration delay in Patchworks. This assumption has not changed from MP #4, and was confirmed
by taking the arithmetic average regeneration delay for all blocks harvested since 2006.
8.5.4 Operational Adjustment Factors
OAF1 is used to represent reduced yield due to gaps in stocking; and OAF2 is used to represent decay
and losses due to disease and pest when they are present in large magnitudes. OAF1 is a constant
reduction factor that shifts the yield curve down whereas the influence of OAF2 increases with age and
therefore alters the shape of the curve. For MP#4, standard operational adjustment factors were used:
OAF1 was 15% and OAF2 was 5%. The same OAF values will be used for this analysis.
8.5.5 Genetic Gain
For MP#4, genetic gains for spruce were estimated to be 9% in the ICH and 8% in the ESSF. These
factors were applied to future stands only; no genetic gain was assumed for existing managed stands.
Actual genetic gains for the period from 2005 to 2012 have been reviewed, and the weighted average
realized genetic gain is shown in Table 8.7. It is clear that actual genetic gains have exceeded MP#4
expectations – by approximately 5% for both spruce and Douglas-fir. It is likely that the estimates being
used for this analysis will also prove – in hindsight – to have been conservative. Sensitivity analyses will
be run to test the impact of different genetic gain assumptions on sustainable harvest levels.
Table 8.7 Average Genetic Gain – 2005 to 2012
BEC Subzone/Variant Area Planted
(ha)
‘A’ Class Seed Genetic Gain (Weighted Average (%)
Sx Fd
ESSF (all) 537 15
ICH vk1 797 12 4
ICH wk1 465 14 6
8.6 Change Monitoring Inventory
In the 2007 AAC rationale, the Deputy Chief Forester requested that LP:
“monitor growth in natural and managed stands to assess its site
productivity estimates and ensure the yield projections used in future
analyses appropriately reflect volumes per hectare realized in harvesting
operations”
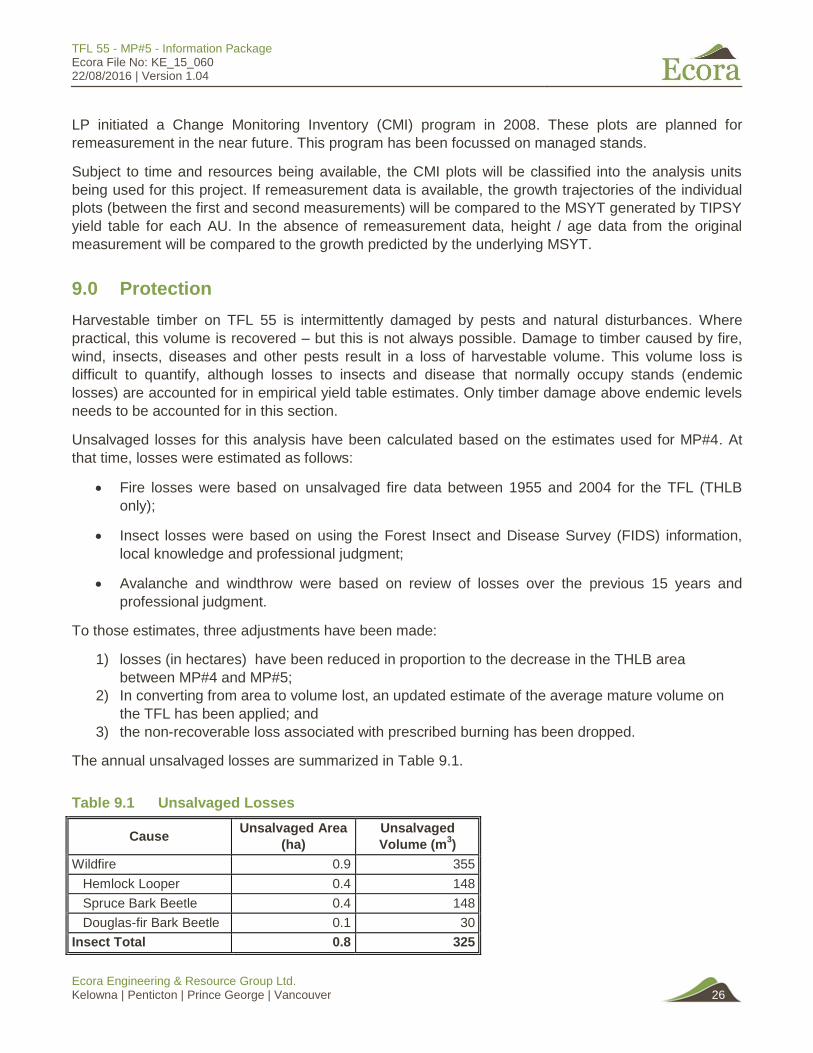
TFL 55 - MP#5 - Information Package Ecora File No: KE_15_060 22/08/2016 | Version 1.04
Ecora Engineering & Resource Group Ltd. Kelowna | Penticton | Prince George | Vancouver 26
LP initiated a Change Monitoring Inventory (CMI) program in 2008. These plots are planned for
remeasurement in the near future. This program has been focussed on managed stands.
Subject to time and resources being available, the CMI plots will be classified into the analysis units
being used for this project. If remeasurement data is available, the growth trajectories of the individual
plots (between the first and second measurements) will be compared to the MSYT generated by TIPSY
yield table for each AU. In the absence of remeasurement data, height / age data from the original
measurement will be compared to the growth predicted by the underlying MSYT.
9.0 Protection
Harvestable timber on TFL 55 is intermittently damaged by pests and natural disturbances. Where
practical, this volume is recovered – but this is not always possible. Damage to timber caused by fire,
wind, insects, diseases and other pests result in a loss of harvestable volume. This volume loss is
difficult to quantify, although losses to insects and disease that normally occupy stands (endemic
losses) are accounted for in empirical yield table estimates. Only timber damage above endemic levels
needs to be accounted for in this section.
Unsalvaged losses for this analysis have been calculated based on the estimates used for MP#4. At
that time, losses were estimated as follows:
Fire losses were based on unsalvaged fire data between 1955 and 2004 for the TFL (THLB
only);
Insect losses were based on using the Forest Insect and Disease Survey (FIDS) information,
local knowledge and professional judgment;
Avalanche and windthrow were based on review of losses over the previous 15 years and
professional judgment.
To those estimates, three adjustments have been made:
1) losses (in hectares) have been reduced in proportion to the decrease in the THLB area
between MP#4 and MP#5;
2) In converting from area to volume lost, an updated estimate of the average mature volume on
the TFL has been applied; and
3) the non-recoverable loss associated with prescribed burning has been dropped.
The annual unsalvaged losses are summarized in Table 9.1.
Table 9.1 Unsalvaged Losses
Cause Unsalvaged Area
(ha)
Unsalvaged
Volume (m3)
Wildfire 0.9 355
Hemlock Looper 0.4 148
Spruce Bark Beetle 0.4 148
Douglas-fir Bark Beetle 0.1 30
Insect Total 0.8 325

TFL 55 - MP#5 - Information Package Ecora File No: KE_15_060 22/08/2016 | Version 1.04
Ecora Engineering & Resource Group Ltd. Kelowna | Penticton | Prince George | Vancouver 27
Windthrow 0.5 207
Avalanche 0.1 30
Total 2.2 916
This volume is assumed to be lost each year, and will be subtracted from the final harvest level across
the entire planning horizon.
10.0 Integrated Resource Management
This section provides details on how the modelling methodology addresses non-timber resource
requirements.
10.1 Forest Cover Objectives
Forest cover objectives will be implemented to model the following resource objectives:
landscape level biodiversity
stand-level biodiversity
integrated resource management
These objectives will be met by controlling the future age class distribution of the forest. The rate of
harvesting can be limited in order to achieve an age class distribution target by applying forest cover
constraints when the forest estate model is run. Cover constraints typically work by capping the amount
of area that can be moved to a young age class (i.e. harvested), or by insisting that a minimum amount
of old timber exist at all times. Each has the effect of limiting the rate of harvest within the area to which
it is applied. Many cover constraints can be enforced within a given model run, and each may apply to
all or only to a specified portion of the landbase.
Cover constraints for caribou habitat – which were applied for the MP#4 timber supply analysis – will
not be enforced. Ungulate Winter Range (UWR) U-3-005 was established in December 2008. This
management area overlaps a significant portion of TFL 55. As no harvesting is permitted in this area, it
has been entirely removed from the THLB. In January 2009, the parts of the Revelstoke Higher Level
Plan Order that dealt with caribou were rescinded.
Landscape level biodiversity objectives (i.e. old seral constraints) will not be applied in the base case
(as OGMA’s have been identified and netted out of the THLB). A sensitivity analysis may be run in
which OGMA’s are returned to the THLB and old seral targets are enforced. In any event, no targets
would be enforced for mature seral (as the RHLPO no longer requires them).
There are no visual quality objectives in force or community watersheds established on the TFL, so no
modelling measures need to be taken on these accounts.
10.1.1 Landscape-Level Biodiversity
The management of landscape level biodiversity is legislated in the Revelstoke Higher Level Plan
Order (2005) and the Revelstoke Higher Level Plan Order Amendment 02 (2011). Seral zones are

TFL 55 - MP#5 - Information Package Ecora File No: KE_15_060 22/08/2016 | Version 1.04
Ecora Engineering & Resource Group Ltd. Kelowna | Penticton | Prince George | Vancouver 28
defined by Landscape Unit, biogeoclimatic subzone variant, biodiversity emphasis option (BEO) and
natural disturbance type (NDT).
Within TFL 55, almost all of the productive land falls within NDT 1. The remainder falls into NDT 5 – but
since NDT 5 has no THLB, no seral stage targets will be applied.
Table 10.1 shows the NDT 1 definition ‘Old’ for each of the seral zones in TFL 55.
Table 10.1 Old and Mature Seral Definitions.
NDT LU and BEC Old (years)
1 ESSF > 250
1 ICH > 250
BEO can fall into three categories (Low, Intermediate, and High) and is the basis for establishing old
seral target percentages. All of TFL 55 falls is classified as either ‘Low’ or ‘Intermediate’ BEO. The old
seral targets are the same in either case – but in the ‘Low’ BEO areas the target does not have to be
met for 240 years. A relaxed target – one-third of the full target percentage – will be applied for the
period prior to the 240-year mark in the planning horizon.
Table 10.2 shows the forest cover retention requirements for each of the seral zones in TFL 55. The old
seral targets listed are the long-term targets.
Table 10.2 Revelstoke Higher Level Plan Order Old Seral Retention Targets
BEO LU
Code
LU
Name BGC Unit
Produc-
tive
Area
(ha)
THLB
Area
(ha)
Old
Produc-
tive
Area
(ha)
Old
THLB
Area
(ha)
Old
Seral
Target
(%)
Old
Seral
Target
(ha)
Intermediate R5 French ESSFvc 268.7 3.2 14.0 0.0 19 51.1
Intermediate R5 French ICH wk 1 1,006.6 789.1 109.4 98.3 13 130.9
Intermediate R5 French ICH vk 1 3,137.9 1,827.4 692.1 373.8 13 407.9
Intermediate R17 Mica ESSFvc 226.7 162.7 5.1 3.9 19 43.1
Intermediate R17 Mica ICH vk 1 3,621.1 1,616.8 975.1 208.6 13 470.7
Intermediate R17 Mica ICH wk 1 40.8 21.1 6.7 0.0 13 5.3
Low R5 French ESSFvc 13,840.8 1,808.0 1,624.1 346.2 19 2,629.8
Low R5 French ICH vk 1 7,979.8 3,839.5 2,580.0 1,190.4 13 1,037.4
Low R5 French ICH wk 1 682.6 471.4 21.9 13.6 13 88.7
Low R17 Mica ESSFvc 10,060.3 1,627.8 523.0 48.2 19 1,911.5
Low R17 Mica ESSFwcw 930.0 60.9 39.4 0.0 19 176.7
Low R17 Mica ESSFwc 2 1,381.7 505.3 138.7 2.4 19 262.5
Low R17 Mica ICH vk 1 7,573.6 3,208.9 2,503.2 569.8 13 984.6
The foregoing calculations and summaries provide input for a sensitivity analysis related to old seral
targets. They will not be modeled in the base case because OGMA’s have been reserved to safeguard
landscape level biodiversity.

TFL 55 - MP#5 - Information Package Ecora File No: KE_15_060 22/08/2016 | Version 1.04
Ecora Engineering & Resource Group Ltd. Kelowna | Penticton | Prince George | Vancouver 29
The RHLPO seral targets were also meant to protect grizzly habitat. For TFL 55, this objective is
primarily achieved through operational planning around avalanche chutes.
10.1.2 Stand-level Biodiversity
Stand level biodiversity is addressed in the analysis by reserving wildlife tree patches (WTP). A base
target level of 7% was the starting point for these calculations. A portion of the WTPs can come from
areas already removed from the THLB, and the remainder is removed at the time of harvest. In order to
identify the net harvestable area requiring WTP reserves, productive stands netted out of the forest
landbase were identified.
These stands were then given a 250-metre buffer to reflect half of the maximum acceptable distance
between wildlife tree patches according to the Biodiversity Guidebook. THLB stands that did not fall
within these buffers were deemed to require additional wildlife tree retention. Table 10.3 summarizes
percentage reservations calculated.
Table 10.3 Wildlife Tree Retention Requirements
LU
Code
LU
Name BGC Unit THLB Area (ha) WTP Required (ha)
WTP %
Gross WTP % Net
R17 Mica ESSFvc 1,765.6 286.5 7 1.14
R17 Mica ESSFvcp 0.0 0.0 7 0.00
R17 Mica ESSFwc 2 494.4 113.0 7 1.60
R17 Mica ESSFwcp 1.0 0.0 7 0.00
R17 Mica ESSFwcw 61.7 6.0 7 0.68
R17 Mica ICH vk 1 4,776.0 729.4 7 1.07
R17 Mica ICH wk 1 20.6 0.0 7 0.00
R5 French ESSFvc 1,832.3 311.9 7 1.19
R5 French ESSFvcp 1.4 0.0 7 0.00
R5 French ICH vk 1 5,673.8 497.3 7 0.61
R5 French ICH wk 1 1,256.9 191.9 7 1.07
R5 French IMA un 0.0 0.0 7 0.00
15,883.8 2,136.1 84 0.94
THLB area is shown in the table by LU and BGC Unit. The next column shows the THLB area that
does not fall within 250 metres of existing mature non- THLB stands. This is the area in which WTP’s
must be established. The WTP gross requirement (7 %in every case) is multiplied by the ratio of WTP
required to THLB area. The area-weighted WTP net requirement for the TFL as a whole is 0.94
percent – the figure shown in the lower right-hand corner of the table.
A one percent reduction will be applied to all curves in order to meet the portion of the WTP
requirement expected to come from THLB stands.
10.1.3 Integrated Resource Management
The integrated resource management constraint is intended to distribute harvesting across the THLB
and prevent spatially concentrated harvesting in short time span. It is often implemented with the

TFL 55 - MP#5 - Information Package Ecora File No: KE_15_060 22/08/2016 | Version 1.04
Ecora Engineering & Resource Group Ltd. Kelowna | Penticton | Prince George | Vancouver 30
intention of modelling three- or four-pass harvesting of an area. For the latest timber supply analysis for
the Revelstoke TSA, a forest cover constraint that allowed no more than 25% of the THLB area to be
below a stand height of two meters was enforced at the Landscape Unit level
The IRM zone will not be specifically modelled in this analysis because it does not drive strategic or
operational planning on the TFL. Instead patch size targets will be modelled for the entire planning
horizon (see Section 10.2). The proportion of the THLB that is below two metres in stand height will be
tracked for information purposes only; no limits will be enforced.
10.2 Patch Size Objectives
All of the TFL will be managed as ‘natural disturbance type’ one for patch size purposes. Patch size
targets for NDT1 are shown in Table 10.4.
Table 10.4 Patch Size Targets for Natural Disturbance Type 1
Patch Size Class (ha)
Target Area (%)
0 to 40 30-40
40 to 80 30-40
80 to 250 20-40
> 250 0
Seral stage was defined by BEC from the Biodiversity Guidebook as shown in Table 10.5.
Table 10.5 Patch Seral Stage Definitions
Seral Class
Age Range
ICH ESSF
Shrub/Herb 0 - 19 0 - 19
Pole/Sapling 20 - 39 20 - 39
Young 40 - 99 40 - 119
Mature 100 - 249 120 - 249
Old 250 + 250 +
Previous analyses by LP show that the target patch size is not currently being met. In an effort to move
the land base towards the desired distribution, patches in all of the seral classes listed in Table 10.5 will
be tracked. Since harvesting activities can only directly and immediately affect shrub/herb and
mature/old seral patches directly, the targets for these classes only will be enforced during modelling.
10.3 Timber Harvesting
10.3.1 Minimum Harvest Age
The minimum harvest ages have been set at age at which 95% of CMAI is achieved providing that it
has achieved a minimum volume and minimum DBH. The minimum volume is 150m3/ha for all stands

TFL 55 - MP#5 - Information Package Ecora File No: KE_15_060 22/08/2016 | Version 1.04
Ecora Engineering & Resource Group Ltd. Kelowna | Penticton | Prince George | Vancouver 31
(MP#4 used a 200m3/hectare limit for cedar- and hemlock-leading stands). The minimum DBH limit is
25 centimetres (stand quadratic mean diameter).
Table 10.6 summarizes the average minimum harvest age (MHA) attributes for the natural stand yield
tables. This table has been compiled for information purposes only. Natural stand yield curves will be
compiled for each VRI polygon based on its attributes. Minimum harvest age will also be calculated
separately for each stand using criteria listed in the previous paragraph. Most natural stands are
currently older than their minimum harvest age (i.e. they are currently harvestable).
Table 10.6 Minimum Harvest Age Attributes for Natural Stands
AU Name THLB
(ha)
Min.
Harvest
Age
(years)
Diameter
(cm)
Volume
(m3/ha)
MAI
(m3/ha/yr)
1 ICHwk1-9,7,6-S 70.0 60 27.8 222 3.7 2 ICHwk1-5-S 89.6 70 29.6 201 2.9 3 ICHwk1-4-H-C 85.4 70 27.6 191 2.7 4 ICHwk1-4-S 177.0 70 26.0 152 2.2 5 ICHwk1-4-S 48.2 60 25.3 153 2.6 6 ICHwk1-1-C 61.8 80 27.4 222 2.8 7 ICHwk1-1-H 62.1 100 30.1 185 1.9 8 ICHwk1-1-S-Fd 16.2 70 28.0 245 3.5 9 ICHvk1-5-S-B 389.2 80 26.2 207 2.6
10 ICHvk1-5-C-H 95.7 80 29.6 202 2.5 11 ICHvk1-4-S-B-P 339.9 80 26.1 216 2.7 12 ICHvk1-4,3-C-Fd-P 730.2 80 26.9 162 2.0 13 ICHvk1-4-Fd 230.4 70 26.0 228 3.3 14 ICHvk1-4-H 822.0 90 28.3 169 1.9 15 ICHvk1-3,1-S-B-H 131.7 70 25.0 168 2.4 16 ICHvk1-1-C 477.2 70 26.2 158 2.3 17 ICHvk1-1-H-Fd-P 1,138.4 80 25.8 157 2.0 18 ESSFwcw, ESSFwc2-4,3-S-B 115.7 80 26.1 163 2.0 19 ESSFwcw, ESSFwc2-1-S 100.7 80 27.5 172 2.1 20 ESSFvc-1-B 257.2 90 29.4 180 2.0 21 ESSFvc-1-C 29.0 80 27.7 215 2.7 22 ESSFvc-1-H 319.4 100 28.7 191 1.9 23 ESSFvc-1-S 829.7 90 26.3 178 2.0 24 ESSFvc-6,4-S 19.9 90 32.3 180 2.0 25 ESSFvc-3-All 299.1 80 26.0 169 2.1
Table 10.7 summarizes the attributes for 95% CMAI for the TIPSY yield tables representing future
managed stands and existing managed stands established in 2005 or later.

TFL 55 - MP#5 - Information Package Ecora File No: KE_15_060 22/08/2016 | Version 1.04
Ecora Engineering & Resource Group Ltd. Kelowna | Penticton | Prince George | Vancouver 32
Table 10.7 Minimum Harvest Age Attributes for Future Managed Stands and Existing Managed
Stands (Era 2)
Analysis
Unit
Name THLB
(ha)
Min.
Harvest
Age (years)
Volume
(m3/ha)
Diameter
(cm)
MAI
(m3/ha/yr)
101 ICHwk1-9,7,6-S 106 72 376 25.0 5.2
102 ICHwk1-5-S 145 61 396 25.5 6.5
103 ICHwk1-4-H-C 204 91 377 25.1 4.1
104 ICHwk1-4-S 498 59 401 25.6 6.8
105 ICHwk1-4-S 385 72 376 25.0 5.2
106 ICHwk1-1-C 243 83 372 25.0 4.5
107 ICHwk1-1-H 127 76 378 25.1 5.0
108 ICHwk1-1-S-Fd 110 61 396 25.5 6.5
109 ICHvk1-5-S-B 2,632 68 376 25.0 5.5
110 ICHvk1-5-C-H 257 83 374 25.0 4.5
111 ICHvk1-4-S-B-P 2,658 57 382 25.1 6.7
112 ICHvk1-4,3-C-Fd-P 1,206 83 374 25.0 4.5
113 ICHvk1-4-Fd 718 49 388 25.2 7.9
114 ICHvk1-4-H 1,130 83 374 25.0 4.5
115 ICHvk1-3,1-S-B-H 1,574 68 376 25.0 5.5
116 ICHvk1-1-C 741 68 376 25.0 5.5
117 ICHvk1-1-H-Fd-P 1,837 57 382 25.1 6.7
118 ESSFwcw, ESSFwc2-4,3-
S-B
964 133 357 25.0 2.7
119 ESSFwcw, ESSFwc2-1-S 563 103 364 25.0 3.5
120 ESSFvc-1-B 418 103 364 25.0 3.5
121 ESSFvc-1-C 427 103 364 25.0 3.5
122 ESSFvc-1-H 743 133 357 25.0 2.7
123 ESSFvc-1-S 3,430 103 364 25.0 3.5
124 ESSFvc-6,4-S 53 82 366 25.0 4.5
125 ESSFvc-3-All 534 82 366 25.0 4.5
Table 10.8 summarizes for existing managed stands.
Table 10.8 Minimum Harvest Age Attributes for Existing Managed Stands (Era 1)
AU Name THLB
(ha)
Min.
Harvest
Age
(years)
Volume
(m3/ha)
Diameter
(cm)
MAI
(m3/ha/yr)
201 ICHwk1-9,7,6-S 21.5 70 384 25.1 5.5
202 ICHwk1-5-S 55.3 59 371 25.0 6.3
203 ICHwk1-4-H-C 36.8 89 366 25.0 4.1
204 ICHwk1-4-S 185.3 71 422 26.2 5.9
205 ICHwk1-4-S 113.0 70 368 25.1 5.3
206 ICHwk1-1-C 117.7 82 398 25.0 4.9

TFL 55 - MP#5 - Information Package Ecora File No: KE_15_060 22/08/2016 | Version 1.04
Ecora Engineering & Resource Group Ltd. Kelowna | Penticton | Prince George | Vancouver 33
AU Name THLB
(ha)
Min.
Harvest
Age
(years)
Volume
(m3/ha)
Diameter
(cm)
MAI
(m3/ha/yr)
207 ICHwk1-1-H 18.7 73 384 25.4 5.3
208 ICHwk1-1-S-Fd 63.5 59 365 25.1 6.2
209 ICHvk1-5-S-B 1,766.1 70 358 25.1 5.1
210 ICHvk1-5-C-H 60.9 86 430 26.1 5.0
211 ICHvk1-4-S-B-P 1,360.2 58 360 25.0 6.2
212 ICHvk1-4,3-C-Fd-P 383.4 85 379 25.2 4.5
213 ICHvk1-4-Fd 308.5 62 436 26.7 7.0
214 ICHvk1-4-H 210.9 85 396 25.5 4.7
215 ICHvk1-3,1-S-B-H 1,166.1 69 364 25.1 5.3
216 ICHvk1-1-C 207.0 71 429 26.1 6.0
217 ICHvk1-1-H-Fd-P 294.9 61 357 25.0 5.9
218 ESSFwcw, ESSFwc2-4,3-S-
B
273.6 136 338 25.0 2.5
219 ESSFwcw, ESSFwc2-1-S 187.4 107 346 25.0 3.2
220 ESSFvc-1-B 131.5 109 347 25.0 3.2
221 ESSFvc-1-C 71.2 107 451 26.5 4.2
222 ESSFvc-1-H 64.3 143 347 25.0 2.4
223 ESSFvc-1-S 1,723.3 108 346 25.0 3.2
224 ESSFvc-6,4-S 27.2 85 355 25.0 4.2
225 ESSFvc-3-All 160.9 90 353 25.0 3.9
Table 10.9 shows the LRSY estimates for TFL 55.
Table 10.9 LRSY Estimates for Natural and Managed Stands
THLB
Area
(ha)
Natural Managed
Average
CMAI
(m3/ha/yr)
LRSY
(m3/yr)
Average
CMAI
(m3/ha/yr)
LRSY
(m3/yr)
15,945 2.8 44,506 5.0 80,493
10.3.2 Silviculture Systems
The purpose of this section is to document the silviculture management regimes that are applied on the
TFL and how these regimes are reflected in the analysis. The analysis assumes that a clear cut or
patch cut silviculture system is carried out in every case throughout the TFL. There has been no
reduction for shading applied to managed stand yields in areas that are harvested using a patch cut
silviculture system.

TFL 55 - MP#5 - Information Package Ecora File No: KE_15_060 22/08/2016 | Version 1.04
Ecora Engineering & Resource Group Ltd. Kelowna | Penticton | Prince George | Vancouver 34
10.3.3 Initial Harvest Rate
The current AAC for TFL 55 is 90,000 m3/year, including allocation to the British Columbia Timber
Sales Program (BCTS). In addition, an allowance must be made for non-recoverable losses. As the
timber supply analysis is based on the net harvest plus NRLs, the initial gross harvest level for the Base
Case analysis will be set to 90,916 m3/year, providing a starting point for the analysis. (See Table 9.1
for unsalvaged loss calculations.)
10.3.4 Harvest Rule
Patchworks schedules harvesting is a way that best meets the specified timber and resource objectives
through a process of simulated annealing. As such, no simple ‘harvest rule’ can be enunciated.
However, during the analysis, the harvest profile (e.g. the species, age and volume class distribution of
the harvested volume) will be compared to the profile of the available timber and any discrepancies will
be investigated and explained.
10.3.5 Harvest Flow Objectives
In all phases of the analysis, the harvest flow will reflect a balance of the following objectives:
Maintain the current harvest level for as long as possible;
Limit changes in harvest level to less than 10% of the level prior to the reduction; and
Achieve a maximum stable long-term harvest level and while having a stable growing stock
profiles.
Forest cover requirements and biological capacity of the THLB will ultimately dictate the harvest level
determined in the analysis.
10.3.6 Disturbing the Non-THLB
When modelling, the entire productive landbase is available to fulfill various landbase requirements (i.e.
caribou and seral requirements). Traditionally, the only form of disturbance modelled is timber
harvesting in the THLB. This is a concern because eventually in the model all the non-THLB becomes
old and can lead to the non-THLB fulfilling an unrealistic portion of forest cover requirements, thereby
reducing the impact on the THLB. In reality, there will be some level of natural disturbance within the
non-THLB.
This section describes the theoretical process of disturbing the non-THLB used in the modeling of this
analysis. The intentions are to achieve the early, mature and old seral percentages for each BEC
variant in accordance with the natural range of variation (NROV) defined in the Biodiversity Guidebook.
The method used for this analysis is to: impose a seral requirement on the non-THLB of each BEC
variant, which will force the non-THLB to achieve a seral zone distribution similar to the NROV from the
Biodiversity Guidebook. From the non-THLB, the model will recruit the oldest stands first in order to
achieve seral requirements as soon as possible. Then, the model forces an annual harvest disturbance
to the non-THLB of each BEC zone using the oldest first harvest rule. The size of the disturbance will
be determined from the disturbance frequency in the Biodiversity Guidebook

TFL 55 - MP#5 - Information Package Ecora File No: KE_15_060 22/08/2016 | Version 1.04
Ecora Engineering & Resource Group Ltd. Kelowna | Penticton | Prince George | Vancouver 35
This process has been carried out by:
1. Determining the BEC zones and their area breakdown in TFL 55; 2. Using the Biodiversity Guidebook to determine the NDT, disturbance interval, mature and
old age for each BEC zone; 3. Estimate the seral stage distribution following the Biodiversity Guidebook procedure
(Appendix 4); 4. Determine the appropriate seral requirement (mature and old) for each BEC zone; and 5. Determine the annual disturbance for each BEC zone.
Table 10.10 provides the summary information for the BEC zones in TFL 55. All BEC variants shown
are NDT 1.
Table 10.10 Summary Information for BEC Zones
BEC
Variant
Disturbance
Interval
Old Age Productive
Area
THLB
Area
ESSFvc 350 250 20,794.9 3,601.7
ESSFwc 2 350 250 876.4 505.3
ICH vk 1 250 250 11,819.8 10,492.7
ICH wk 1 250 250 448.3 1,281.6
The seral stage distribution is estimated using the negative exponential equation from Appendix 4 of
the Biodiversity Guidebook. The negative exponential equation uses disturbance interval and gives the
percent older than the input age:
Percent older than specified age = exp (-age/return interval)
Table 10.11 shows the seral stage distribution for the two fire return intervals that occur in TFL 55 (250
years and 350 years).
Table 10.11 Seral Stage Distribution for Fire Return Intervals of 250 years and 350 years
Age 250 350
Greater
than
Less
than
Greater
than
Less
than
20 92% 8% 94% 6%
40 85% 15% 89% 11%
60 79% 21% 84% 16%
80 73% 27% 80% 20%
100 67% 33% 75% 25%
120 62% 38% 71% 29%
140 57% 43% 67% 33%
160 53% 47% 63% 37%

TFL 55 - MP#5 - Information Package Ecora File No: KE_15_060 22/08/2016 | Version 1.04
Ecora Engineering & Resource Group Ltd. Kelowna | Penticton | Prince George | Vancouver 36
180 49% 51% 60% 40%
200 45% 55% 56% 44%
220 41% 59% 53% 47%
240 38% 62% 50% 50%
250 37% 63% 49% 51%
Table 10.12 shows the area that will be disturbed each year in each BEC zone and also shows the
seral zone requirements that will be placed on the BEC zones in order to achieve the desired NROV.
Table 10.12 Disturbance Levels and Mature and Retention Requirements in non-THLB.
BEC Zone Disturbance
Interval (yrs)
Annual Disturb
(%)
Annual Dist
(area in ha)
Old Seral
Requirement
ESSFvc 350 0.29% 60.3 49% > 250
ESSFwc2 350 0.29% 2.5 49% > 250
ICHvk1 250 0.40% 47.3 37% > 250
ICHwk1 250 0.40% 1.8 37% > 250

TFL 55 - MP#5 - Information Package Ecora File No: KE_15_060 22/08/2016 | Version 1.04
Ecora Engineering & Resource Group Ltd. Kelowna | Penticton | Prince George | Vancouver
TFL 55 - MP#5 - Information Package Ecora File No: KE_15_060 22/08/2016 | Version 1.04
Ecora Engineering & Resource Group Ltd. Kelowna | Penticton | Prince George | Vancouver
Appendix A Vegetation Resources Inventory Statistical
Adjustment

TFL 55 - MP#5 - Information Package Ecora File No: KE_15_060 22/08/2016 | Version 1.04
Ecora Engineering & Resource Group Ltd. Kelowna | Penticton | Prince George | Vancouver
Appendix B Site Index Adjustment Report
TFL 55 - MP#5 - Information Package Ecora File No: KE_15_060 22/08/2016 | Version 1.04
Ecora Engineering & Resource Group Ltd. Kelowna | Penticton | Prince George | Vancouver
Appendix C Harvest Profile – 2007 to 2014

TFL 55 - MP#5 - Information Package Ecora File No: KE_15_060 22/08/2016 | Version 1.04
Ecora Engineering & Resource Group Ltd. Kelowna | Penticton | Prince George | Vancouver
The tables below are taken from the 2014 Annual Report for TFL 55. They are included here to show
harvesting performance in hemlock-leading stands.
Table: 7A - Harvest Profile – MP4 (using VRI inventory component)
Hectares Harvested on TFL
Leading
Species
MP4 profile
THLB area
by leading
species
2007-
2011
2012 2013 2014 Cumulative
Total (ha):
% of
Total
Cut
Balsam 7% 88 4.3 22.7 21.6 136.6 11.0
Cedar 18% 201.4 62.8 84.4 67.0 415.6 33.5
Douglas- Fir 8% 81.1 2 5.5 18.5 112.6 9.1
Hemlock 17% 166 38.5 69.5 70.8 344.8 27.8
Spruce 50% 208.7 37.8 26.1 82.3 230.7 18.6
Total: 100 745.2 145.4 266.6 260.2 1240.3 100
Table: 7C – Harvest Profile by Inventory Hemlock Content
Hectares Harvested
THLB THLB
(Ha) MP4
2007-
2011
2012 2013 2014 Cumulative
Total (ha):
% of
Total
Cut
Mature Timber 15744 667.2 147.2 266.5 260.2 1341.1
>80% Hemlock 0 60.7 0 2.7 0.7 64.1 4.8
60-79% Hemlock 1335 8% 88.7 7.3 18.6 26.3 140.9 10.5
40-59% Hemlock 1389 9% 94.8 19.6 37.8 9.3 161.5 12.0

TFL 55 - MP#5 - Information Package Ecora File No: KE_15_060 22/08/2016 | Version 1.04
Ecora Engineering & Resource Group Ltd. Kelowna | Penticton | Prince George | Vancouver
Table: 7D - MP4 Mature Species Profile vs. Harvest by Species
Volume Harvest by Species
Species MP4 Mature
Species
profile
THLB
2007-
2011
2012 2013 2014 Cumulative
Total :
Harvest %
by species
Balsam 8.0% 28,361 3,560 9,469 7,311 48,701 8.2
Cedar 29.3% 74,603 27,317 54,728 42,729 199,377 33.6
Douglas- Fir 6.6% 17,748 6,764 2,938 8,127 35,577 6.0
Hemlock 27.1% 83,741 19,114 22,000 25,416 150,271 25.3
Spruce 28.3% 89,873 12,456 32,481 19,393 154,203 26.0
Pine/Decid 0.7% 1436 716 964 2,069 5,185 0.9
Total: 100% 296,032 69,927 122,580 105,045 593,314 100%
TFL 55 - MP#5 - Information Package Ecora File No: KE_15_060 22/08/2016 | Version 1.04
Ecora Engineering & Resource Group Ltd. Kelowna | Penticton | Prince George | Vancouver
Appendix D OGMA Delineation Report

TFL 55 - MP#5 - Information Package Ecora File No: KE_15_060 22/08/2016 | Version 1.04
Ecora Engineering & Resource Group Ltd. Kelowna | Penticton | Prince George | Vancouver