self-storage investment trends to watch marcus & millichap research services, national...
TRANSCRIPT

Self-Storage Investment Trends to Watch
April 16, 2015

Economic Outlook UnderpinsSelf-Storage Sector

Hiring Makes Steady Gains –Supports Broader Economic Performance
-2.7
-1.8
-0.9
0.0
0.9
2000
2001
2002
2003
2004
2005
2006
2007
2008
2009
2010
2011
2012
2013
2014
2015
*
Qua
rter
ly J
ob G
row
th (M
illio
ns)
* Forecast** Through MarchSources: Marcus & Millichap Research Services, BLS
+8.2 Million +11.5 Million**
-8.7 Million
2015 Forecast: 3.1 Million - 3.5 Million

U.S. Employment Gains Broad-BasedY-O-Y Sector Change Through March 2015
Sources: Marcus & Millichap Research Services, BLS
U.S. Employment Sectors Absolute Change % Change
Prof. & Business Services 662,000 3.5%Trade, Transport & Utilities 607,000 2.3%Education and Health Services 541,000 2.5%Leisure & Hospitality 490,000 3.4%Construction 282,000 4.7%Manufacturing 188,000 1.5%Financial Activities 150,000 1.9%Other Services 73,000 1.3%Government 72,000 0.3%Information 59,000 2.2%Natural Resources & Mining 4,000 0.5%
Net Change 3,128,000 2.3%
Sources: Marcus & Millichap Research Services, BLS

National Employment Rank by MetroY-O-Y Absolute Change Through February 2015
Top 10Metros
Absolute Change
PercentChange
Dallas-Ft. Worth 132,200 4.1%
Atlanta 113,200 4.6%
New York 106,500 2.6%
Houston 97,700 3.4%
Los Angeles 94,500 2.3%
Chicago 67,400 1.5%
Phoenix 62,700 3.4%
Seattle 58,400 3.2%
Inland Empire 57,600 4.6%
Denver 55,600 4.2%
U.S. Total 3,227,000 2.3%
Bottom 10Metros
Absolute Change
PercentChange
Milwaukee 8,900 1.1%
Cleveland 10,800 1.0%
St. Louis 13,900 1.1%
Jacksonville 14,000 2.3%
Cincinnati 18,900 1.8%
Palm Beach 21,400 3.9%
Oakland 25,500 2.4%
Columbus 25,900 2.6%
Las Vegas 26,800 3.1%
Austin 27,500 3.0%
U.S. Total 3,227,000 2.3%
Sources: Marcus & Millichap Research Services, BLS

0
40
80
120
160
2003
2004
2005
2006
2007
2008
2009
2010
2011
2012
2013
2014
2015
*
80
90
100
110
120
Consumer Confidence Small Business Optimism
* Consumer confidence through March; small business optimism through FebruaryIndex: December 2002 = 100Sources: Marcus & Millichap Research Services, The Conference Board, NFIB
Con
sum
er C
onfid
ence
Inde
x Confidence Rising –
Will Support Economic Momentum
Small B
usiness Optim
ism Index

Year
-Ove
r-Ye
ar C
hang
e
$190
$230
$270
$310
$350
01 03 05 07 09 11 13 15*
Ret
ail S
ales
($ B
il.)
+19%
* Through MarchCore retail sales excludes auto and gasoline salesSources: Marcus & Millichap Research Services, U.S. Census Bureau
$869/person
$980/person
Rec
essi
on
20-YearAverage: 4.2%
U.S. Core Retail Sales Building Steady Momentum - Growth Lifting Economy
-8%
-4%
0%
4%
8%
07 08 09 10 11 12 13 14 15*

Economic Outlook UnderpinsSelf-Storage Sector

Emerging Housing and MigrationPatterns Influence Self-Storage

0.0
0.5
1.0
1.5
2.0
1993
1994
1995
1996
1997
1998
1999
2000
2001
2002
2003
2004
2005
2006
2007
2008
2009
2010
2011
2012
2013
201420
15*
Single-Family Construction Multifamily Construction Household Growth
* ForecastSources: Marcus & Millichap Research Services, U.S. Census Bureau
Hom
e C
ompl
etio
ns (M
il.)
and
Hou
seho
ld G
row
th (M
il.)
Plunge in Home Construction Supports Housing Recovery
1999-2007 Oversupply: 3.5M 2008-2015* Undersupply: 2.8M
250
350
450
550
650
2003
2004
2005
2006
2007
2008
2009
2010
2011
2012
2013
2014
2015
*
Single-Family and Condo
$150
$175
$200
$225
$250
2003
2004
2005
2006
2007
2008
2009
2010
2011
2012
2013
2014
2015
*
Single-Family Condo
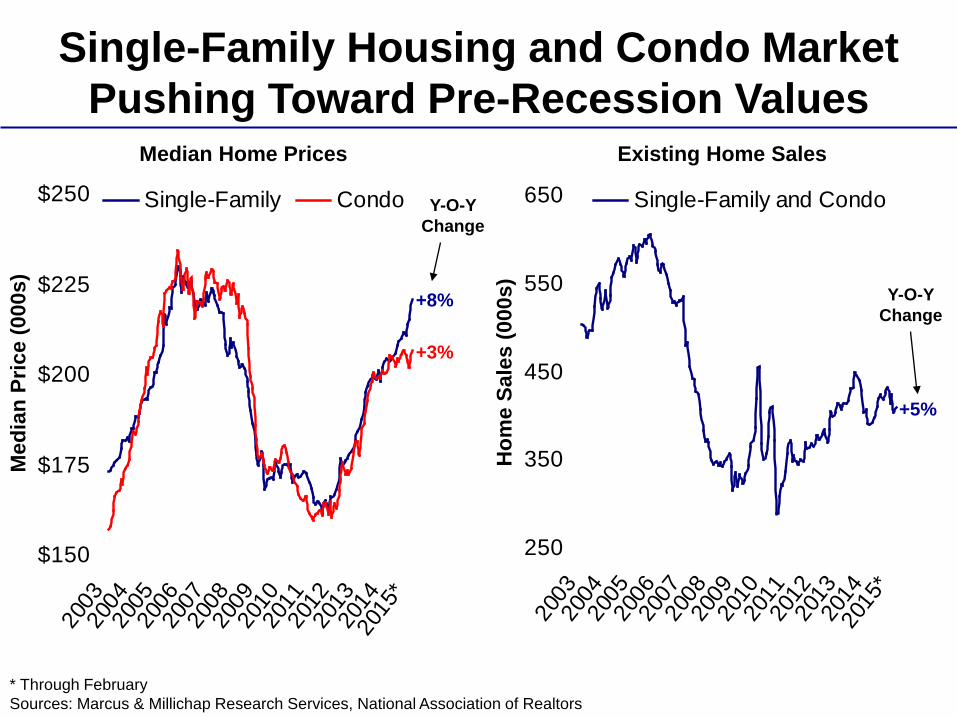
* Through FebruarySources: Marcus & Millichap Research Services, National Association of Realtors
+8%
+3%
Med
ian
Pric
e (0
00s)
+5%
Hom
e Sa
les
(000
s)
Median Home Prices Existing Home Sales
Y-O-Y Change
Y-O-Y Change
Single-Family Housing and Condo Market Pushing Toward Pre-Recession Values

Bottom 5DeparturesDestinationsTop 5
Sources: Marcus & Millichap Research Services, United Van Lines Migration Study
2014 Residential Migration Trends

National Metro RankingAbsolute Population Growth 10-Year Forecast*
Top 10 Markets
Population Growth
Percent Change
Dallas-Ft. Worth 1,467,000 20.9%
Phoenix 1,163,000 25.6%
Houston 1,111,700 17.0%
Atlanta 1,046,900 18.6%
Los Angeles 842,200 8.3%
Orlando 691,200 29.3%
Washington, D.C. 643,900 10.7%
Inland Empire 591,600 13.2%
Las Vegas 555,800 26.5%
Austin 509,800 25.9%
U.S. Total 27,700,000 8.6%
Bottom 10 Markets
Population Growth
Percent Change
Cleveland -57,000 -2.8%
Detroit -40,200 -0.9%
Milwaukee 33,300 2.1%
Cincinnati 133,500 6.1%
Columbus 161,700 8.4%
Philadelphia 169,200 2.8%
Kansas City 179,100 8.5%
San Francisco 185,400 9.9%
Indianapolis 202,000 10.8%
San Jose 212,100 10.8%
U.S. Total 27,700,000 8.6%
* 1Q 2015-1Q 2025Sources: Marcus & Millichap Research Services, U.S. Census Bureau

Emerging Housing and MigrationPatterns Influence Self-Storage

Capital Markets

0%
1%
2%
3%
4%
2010
2011
2012
2013
2014
2015
*
Core Inflation 10-Year Treasury10-Year Avg. Core Inflation 10-Year Avg. 10-Year Treasury
Rat
e
* Core inflation through February 2015; 10-year Treasury through April 6, 2015Sources: Marcus & Millichap Research Services, Federal Reserve, BLS
Inflation Generating Little Pressure10-Year Treasury Range-Bound
3.39%
1.91%
Core Inflation: 1.91%
10-Year Treasury: 3.39%
10-Year Average

* As of April 8, 2015Sources: Marcus & Millichap Research Services, Trading Economics
10-Year Treasury Rates by Country
Country 10-Year Treasury Rate*Germany 0.2%Japan 0.4%France 0.5%Canada 1.4%United Kingdom 1.6%United States 1.9%Australia 2.4%China 3.7%Russia 11.7%Brazil 12.8%

Includes sales of properties $2.5 million and greaterSources: Marcus & Millichap Research Services, Real Capital Analytics
1% 1%5% 7% 9%
15% 13% 12% 11%
16% 22% 23%27%
11%9% 11%
13%
15%8%
8% 7%8%
7%12%
13% 13%
18%14%
31% 27% 28%18% 16%
1%2%1%
5% 5%
20%
17%
0%
25%
50%
75%
100%
2010 2011 2012 2013 2014
Gov't Agency
National Bank
International Bank
Regional/Local Bank
CMBS
Insurance
Financial
Private/Other
Perc
ent o
f Tot
al D
olla
r Vol
ume
Commercial Real Estate Lender Composition by Percent of Total Dollar Volume

Capital Markets

Self-Storage Performance

0%
5%
10%
15%
20%
Self-Storage Apartment Retail Office Industrial
2006-2012 2013 2014 2015*
U.S. Commercial Property Vacancy Trends
Aver
age
Vaca
ncy
Rat
e
* ForecastSource: Marcus & Millichap Research Services, MPF Research, CoStar Group, Inc., Reis Services, LLC
17.9%
11.5%
8.0%
4.8%
8.1%6.0%
17.1%
14.5%
10.5%
6.5%

$1.0
$1.2
$1.4
$1.6
$1.8
2011 2012 2013 2014 2015*4%
8%
12%
16%
20%Asking Rent - Climate ControlledAsking Rent - Not Climate ControlledVacancy
National Self-Storage Vacancy and Rent Trends
* ForecastRent for 10X10 unitSources: Marcus & Millichap Research Services, Reis Services, LLC
Average Vacancy Rate
Aski
ng R
ent p
er S
quar
e Fo
ot

National Self-Storage Rank by Metro2014 Vacancy Rate
Top 10Markets
2014Vacancy
Y-O-YBps Chg.
San Francisco 7.3% -140
San Jose 7.3% -40
Oakland 8.9% -290
Denver 9.8% -50
San Diego 9.8% -310
Los Angeles 10.0% -240
Portland 10.2% -260
Miami 10.3% -30
Dallas-Ft. Worth 10.5% -150
Kansas City 10.6% -330
U.S. Average 12.0% -150
Bottom 10Markets
2014Vacancy
Y-O-YBps Chg.
Phoenix 17.1% -100
Las Vegas 16.4% -170
Inland Empire 15.6% -320
Columbus 13.8% 20
Orlando 13.6% -320
Minneapolis 13.1% -10
Atlanta 12.9% -270
Sacramento 12.9% -350
Detroit 12.8% -240
Tampa 12.8% -220
U.S. Average 12.0% -150
Sources: Marcus & Millichap Research Services, Reis Services, LLC
Self-Storage Performance

Self-Storage Investment

CRE Investor Sentiment Index Has Been a Strong Indicator of CRE Capital Flows
Includes all apartment, office, retail, and industrial sales $1 million and greaterSources: Marcus & Millichap Research Services, CoStar Group, Inc., Real Capital Analytics, M&M/NREI Investor Survey
$0
$150
$300
$450
$600
04 05 06 07 08 09 10 11 12 13 1440
80
120
160
200
CRE Sales Volume CRE Investor Sentiment
Tota
l Sal
es V
olum
e (B
il.)
Investor Sentiment Index

Self-Storage Price and Cap Rate Trends
* Preliminary estimate through 1QIncludes sales $1 million and greaterSources: Marcus & Millichap Research Services, CoStar Group, Inc.
$40
$50
$60
$70
$80
00 01 02 03 04 05 06 07 08 09 10 11 12 13 14 15*6%
7%
8%
9%
10%
Average Price Average Cap Rate
Average C
ap Rate
Ave
rage
Pric
e Sq
uare
Foo
t

Self-Storage Cap Rate Trends by Class and Market Type*
Sources: Marcus & Millichap Research Services, BLS
Primary Secondary Tertiary Average
Class A 4.5% - 5.5% 5.5% - 6.25% 6.5% - 7.5% 6.1%
Class B 5.5% - 7.0% 6.5% - 7.5% 7.5% - 8.5% 6.8%
Class C 6.5% - 8.0% 7.0% - 9.0% 8.0% - 10.0% 7.8%
Average 6.0% 6.9% 7.8% 6.6%
* Trailing 12-month through 1Q 2015Sources: Marcus & Millichap Research Services, CoStar Group, Inc.

0.0%
2.5%
5.0%
7.5%
10.0%
2000
2001
2002
2003
2004
2005
2006
2007
2008
2009
2010
2011
2012
2013
2014
2015
*
Self-Storage Cap Rate 10-Year Treasury Rate
Self-Storage Cap Rate vs. 10-Year Treasury
* Through March 6Includes sales $1 million and greaterSources: Marcus & Millichap Research Services, CoStar Group, Inc., Federal Reserve
Aver
age
Rat
e
10-Yr. Treasury Long-Term Average
Cap Rate Long-Term Average
270 bps
580 bps 470 bps
520 bps

0%
3%
6%
9%
12%
Self-Storage Apartment Retail Office Industrial
2000-2012 2013 2014
U.S. Commercial Property Cap Rate Trends
Aver
age
Cap
Rat
e
Source: Marcus & Millichap Research Services, CoStar Group, Inc., Real Capital Analytics
-30 bps +10 bps -10 bps +30 bps +30 bpsChange From Prior Cyclical Low

Self-Storage Investment

Self-Storage Investment Trends to Watch
April 16, 2015