self-report measures of intelligence: are they useful as...
TRANSCRIPT
Self-Report Measures of Intelligence:
Are They Useful as Proxy IQ Tests?
Delroy L. PaulhusDaria C. Lysy
Michelle S. M. YikUniversity of British Columbia
ABSTRACT Correlations between single-item self-reports of intelligenceand IQ scores are rather low (.20–.25) in college samples. The literaturesuggested that self-reports could be improved by three strategies: (1) aggrega-tion, (2) item weighting, and (3) use of indirect, rather than direct, questions. Toevaluate these strategies, we compared the validity of aggregated and unaggre-gated versions of direct measures with four indirect measures (Gough’s Intel-lectual efficiency scale, Hogan’s Intellect composite scale, Sternberg’s BehaviorCheck List, and Trapnell’s Smart scale). All measures were administered to twolarge samples of undergraduates (Ns = 310, 326), who also took an IQ test.Although results showed some success for both direct and indirect measures,the failure of their validities to exceed .30 impugns their utility as IQ proxies incompetitive college samples. The content of the most valid items referred toglobal mental abilities or reading involvement. Aggregation benefited indirectmore than direct measures, but prototype-weighting contributed little.
Journal of Personality66:4, August 1998.Copyright © 1998 by Blackwell Publishers, 350 Main Street, Malden, MA 02148, USA,and 108 Cowley Road, Oxford, OX4 1JF, UK.
This research was supported by a grant to the senior author from the Social Sciences andHumanities Research Council of Canada. We wish to thank Harrison Gough, RobertHogan, Robert Sternberg, Paul Trapnell, and several anonymous reviewers for commentson an earlier draft.
Correspondence should be addressed to Del Paulhus, Department of Psychology,University of British Columbia, Vancouver, Canada, V6T 1Z4. Electronic mail may besent via the Internet to [email protected]

Can people validly rate their own intelligence? Skeptics argue that suchself-reports are hopelessly contaminated with a variety of distortionsincluding self-deception, impression management, and reconstrual. Suchdefensive reactions may explain the low variance in self-ratings ofintelligence: Rarely do people rate themselves as “below average”(McCrae, 1990). Even the most forthright and insightful individuals,skeptics warn, can never confirm the veracity of their self-assessmentsbecause the concept itself is so elusive in nature.
Despite its elusiveness, the concept of intelligence plays a central rolein psychological research, particularly in such contexts as educationalevaluation, personnel selection, and child development. To facilitate suchresearch, considerable effort has been devoted to developing self-reportalternatives to cumbersome IQ tests of intelligence. Such approacheshave progressed well beyond a simple request to “rate how intelligentyou are.” Three strategies, in particular, have been recommended. Oneis the use of indirect assessment to bypass the inevitable defensivenessof a direct request for a self-rating. A second, the aggregation strategy,favors multiple-item over single-item measures. A third strategy, proto-type weighting, takes into account the differential importance of itemswithin a measure. In this report we evaluate these three strategies bydetermining their ability to improve prediction of performance on IQtests.
Use of IQ tests as the criterion for intelligence ratings has not yieldedhigh validities,1 particularly in college samples. The validities are some-what higher for observer-ratings than for self-ratings. Values in the rangeof .25 to .50 have been found when the judgment is made by spouses(Bailey & Mettetal, 1977), by friends and strangers (Borkenau, 1993),by adolescent acquaintances (Bailey & Hatch, 1979), and by long-termdiscussion-group colleagues (Paulhus & Morgan, 1997). Except in thecase of spouses, however, the achievement of these solid validitiesrequired aggregation across multiple observers.
Self-perceptions typically parallel other-perceptions but, to the extentthat the trait being evaluated is highly evaluative (e.g., intelligence), theformer are noticeably less valid (John & Robins, 1993). Studies using IQtest scores as the criterion have yielded single-item validities of .32(Borkenau & Liebler, 1993) and .38 (Reynolds & Gifford, 1996) in
1. The term “validity” is used to mean correlation with a specific criterion. Its use doesnot imply that IQ is the sole criterion for measuring intelligence.
526 Paulhus et al.
general population samples. But in college samples the validities neverexceed .30: for example, .26 (DeNisi & Shaw, 1977), .25 (Paulhus &Morgan, 1997), and .26 (Reilly & Mulhearn, 1995). This modest level ofvalidity is the starting point for the present report.
Improving Self-Report Measures of IQ
The literature contains a number of self-report instruments that showpotential as proxy IQ scales, that is, economical substitutes for IQ tests.If valid, such scales have great practical advantages over their traditionalcounterparts: rather than running subjects one-by-one in a tightly super-vised laboratory setting, researchers can administer such scales quicklyto large groups of subjects. Moreover, self-report questionnaires are lessthreatening than IQ tests and therefore more likely to elicit cooperation.
Of course, such advantages are pointless unless validities can beimproved over those values cited above. An ideal proxy scale wouldrepresent, in effect, a parallel measure showing a validity equal to thereliability of IQ tests, that is, upwards of .90. Given that standard IQ testsdiffer somewhat in emphasis, however, a more appropriate upper limit isthe correlation between two well-validated IQ tests, that is, roughly,.80–.85 (Thorndike, 1982). Even that level of validity seems unlikely forproxy tests, given that they emphasize typical performance as opposedto the maximal performance tapped by IQ tests (Ackerman & Heggestad,1997; Paulhus & Martin, 1987).
Potential proxy scales in the literature have relied on three strategiesfor improving the validity of self-report measures of intelligence. Firstis the reduction of evaluation-threat by using subtle, nonobvious ques-tions. We use the term “indirect measures” to describe test formats thatmask the purpose of the test. The second strategy involves aggregating aset of items to improve reliability. The third strategy is weighting theitems according to their importance.
Indirect Measurement Strategy
Rather than referring directly to intelligence, items on indirect measuresconcern interests, behaviors, personality, and the like. In this report, weexamined four such measures: Gough’s Intellectual efficiency (Ie) scale,Hogan’s Intellect composite scale, Sternberg’s Behavior Check List(BCL), and Trapnell’s Smart scale. All four have shown some validity in
Self-Report Measures of Intelligence 527

predicting criterion measures of intelligence. Although all have an indi-rect format, the rationale for each is rather different.
Gough’s Intellectual efficiency (Ie) scale.In the first such effort,Gough (1953) developed a set of self-report items for use as a proxymeasure of intelligence. He administered a pool of items assumed to tapaspects of personality associated with intelligence. Those 52 itemscorrelating most highly with an IQ test in a sample of high school studentswere assembled and labeled the Intellectual efficiency (Ie) scale. In fourcross-validation studies, Gough reported a mean validity of .47. In thefour educated samples reported in the latest manual, however, the medianvalidity is only .29 (Gough, 1996).
As for most tests derived from contrasted groups, the Ie items are ratherheterogeneous; topics included self-confidence, neuroticism, and socialskills as well as intellectual abilities and interests. The vast majority weresubtle indicators, that is, they lacked face-validity as indicators of intel-ligence. As such they are less likely to trigger self-presentation.
Hogan’s Intellect composite.Welsh (1975) developed the notion of“intellectance” to denote the “cognitive and interpersonal style thatcauses people to be perceived as bright.” Hogan and Hogan (1992, p. 12)followed this peer-perception notion of intellect in assembling a set ofitems. A factor analysis revealed two factors. One was labeled Intellec-tance: “the degree to which a person is perceived as bright, creative, andinterested in intellectual matters.” The other factor was labeled SchoolSuccess: “the degree to which a person seems to enjoy academic activi-ties and to value educational achievement for its own sake.”
Intellectance items refer to science ability, curiosity (about the world),thrill seeking, interest in intellectual games and generating ideas (idea-tional fluency), and interest in culture items, while School Success itemsconcern education (being a good student), math ability, good memory,and enjoyment of reading. Observers tend to see high scorers on theIntellectance scale as “imaginative, inventive, and quick-witted, buteasily bored and inattentive to detail” whereas low scorers tend to be“unimaginative, narrow, tolerant of boredom, and not needing muchstimulation.” In contrast, high scorers on the School Success scale areseen as “foresighted, thorough, and painstaking,” whereas low scorersare seen as “touchy, restless, and impulsive” (Hogan & Hogan, 1992,p. 40).
528 Paulhus et al.
Sternberg’s Behavior Check List (BCL).2 As part of his investigationinto conceptions of intelligence, Sternberg (1988) developed the Behav-ioral Check List (BCL), a list of 41 behaviors that lay judges associatedwith intelligence (p. 238). Factor analyses indicated three clusters ofitems labeled Practical Problem Solving (PS), Verbal Ability (VA), andSocial Competence (SC). In a community sample, correlations of thefull-scale BCL with an IQ test were found to be .24 with unit-weightingof all items, and .52 when items were weighted according to diagnostic-ity. All these results were later replicated by Cornelius, Kenny, and Caspi(1989).
Sternberg recommended the BCL as a valuable supplementary mea-sure of intelligence for a number of reasons. Compared to providing aglobal assessment of their ability, subjects should feel less-threatened byrating specific behaviors and, accordingly, be more accurate. A compos-ite of a large set of these specific behaviors could then yield a maximallyvalid self-report. Finally, the BCL coverage was designed to extendbeyond those aspects of intelligence measured by IQ tests (Sternberg,1988).
Trapnell’s Smart scale.The 4-item Smart scale assesses self-appraisedintelligence indirectly via statements about the respondent’s social repu-tation (Trapnell, 1994). The content of three of the items was based onthe assumption that range restriction in self-ratings due to desirableresponding can be reduced by the use of extreme qualifiers (e.g., “very,”“extremely,” “exceptionally”) and by shifting the implied locus of evalu-ation from the self to others (e.g., “I’m considered to be . . .” in place of“I am . . .”). A fourth item assessed self-reported school grades, based onthe assumption that grades provide an indirect but objective index ofmental ability that can be recalled and self-reported fairly accurately. TheSmart scale correlated .33 with an IQ test in a college sample (Trapnell& Scratchley, 1996).
Aggregation Strategy
Aggregation is a widely accepted strategy for improving the reliability(and therefore the predictive validity) of a measure by decreasing its error
2. Note that this instrument is not a checklist in the strict sense of requiring respondentsto check off answers. Instead, the items are rated in a Likert format.
Self-Report Measures of Intelligence 529

of measurement (for a strong case, see Epstein, 1983). Other things beingequal, the addition of items similar to those already included shouldincrease the validity of a self-report intelligence measure. In fact, theamount of improvement in reliability and validity can be estimated withavailable prophecy formulas (e.g., Gulliksen, 1967).
The reader may have noted, however, that the number of items in theindirect measures reviewed above varies dramatically (from 4 to 52). Thisnatural variation should allow us to evaluate the utility of aggregationbetween-measures as well as within-measures.
Weighting Strategy
Typically, aggregation is performed simply by summing or averaging theavailable items: That is, equal (unit) weights are applied to all items.Although psychometricians usually recommend such unit weights (seeThorndike, 1982), weighting of items by their importance remains anappealing strategy.
One variant of importance weighting was exploited by Sternberg,Conway, Ketron, and Bernstein (1981) in order to improve the validityof the Behavior Check List (p. 49). Their technique, which we will label“the prototype weighting procedure,” involved developing a set ofweights corresponding to the diagnosticity of each item. A set of judgeswas asked to rate each BCL item in terms of “how characteristic it is ofan ideally intelligent person” (p. 42). Instead of just adding up a respon-dent’s responses to yield a total score, the responses were correlated withthe corresponding diagnosticity ratings.
Note that a Pearson correlation is simply the mean of the item-by-itemproducts of the two standardized variables. Therefore this procedure isequivalent to standardizing the 41 weights, multiplying them by therespondent’s 41 standardized (within-subject) responses, and averagingthe 41 products. The average then represents the subject’s compositescore.3 Application of this weighting system by Sternberg et al. (1981)boosted the validity of the BCL up to the .50 range (values of .42–.46were obtained by Cornelius, Kenny, & Caspi [1989]). Sternberg and
3. A similar approach has been used for some time with Q-sort data where a subject’sself-sort is correlated with a particular criterion sort (e.g., Block, 1961, 1971). Again, ahigher score indicates that the respondent assigned his/her highest ratings to items thatwere weighted the highest.
530 Paulhus et al.

colleagues concluded that “a good estimate of IQ can be obtained, basedon correspondence between a person’s self-perceived pattern of behav-iors and the pattern of behaviors in an ideal person” (p. 50).
The Present Study
The self-report measures examined in this report differ with respect todirectness (direct vs. indirect) and aggregation (single-item vs. compos-ites). Thus each falls into one of the four categories of a 2 × 2 table (seeTable 1). The first category—single-item direct measures—is repre-sented by the adjective “intelligent” (Sample 1) and “clear-thinking,intelligent” (Sample 2). The composite direct measure combined a set offour conceptually similar items. The four indirect measures wereGough’s Ie, Hogan’s Intellect, Sternberg’s BCL, and Trapnell’s Smartscale. To evaluate the fourth category of measures—single-item indi-rect—we calculated the average item validity for each indirect measure.Finally, we compared weighted and unweighted versions of the BCL.
Within the composite indirect category, we also had a specific interestin the comparative validity of the four measures. Although there is someevidence for the validity of each scale, they have never been pitted againstone another in predicting a common criterion. A comparative validitystudy by nonpartisan researchers should provide much more convincingevidence than that offered by the authors of individual scales.
All measures were administered to two large and diverse samples ofundergraduates. The criterion for validity of the self-reports was theWonderlic Personnel Test, a 12-minute IQ test that compares favorablywith longer IQ tests. Our analyses focused on comparing the validitiesof the four categories of measures via correlation and regression tech-niques. To put all these validities in perspective, we also estimated theperformance of ideal proxy scales.4
METHOD
Subjects and Procedure
Data were collected from a total of 636 undergraduate students at the Universityof British Columbia. Sample 1 comprised 310 students (95 males; 208 females;
4. We did not include factor five measures such as Goldberg’s Intellect Scale becausethey were targeted at personality, not intelligence.
Self-Report Measures of Intelligence 531

7 did not specify their gender) enrolled in an introductory psychology course.Sample 2 comprised 326 students (87 males; 205 females; 34 did not specify)enrolled in a second year social-personality psychology course. Approximately55% of the two samples were liberal arts majors, 20% science or engineeringmajors, and 15% business majors. All participated for extra marks.
For both samples, subjects were first asked to complete a self-report inventoryin group sessions. It included all the direct self-ratings of intelligence. Later, aset of indirect measures of intelligence was distributed in a take-home package,which subjects were asked to complete privately and return for experimentalcredits. Finally, the IQ test was administered in a separate, supervised session.
Instruments
Direct measures.A number of intelligence-related items were included in thecontext of a larger personality inventory. They were selected a priori for theirconceptual relevance to intelligence. In Sample 1 they included the followingfour items: “Is intelligent”; “Is ingenious, a deep thinker”; “Is smart”; and “Isnot exceptionally gifted at academic things” (Reverse coded). In Sample 2 thedirect items included: “Is clear-thinking, intelligent”; “Wants things to be simpleand clear-cut”; “Is clever, sharp-witted”; and “Enjoys thinking about compli-cated problems.”5 Subjects were asked to rate their agreement with these itemson a scale ranging from “1” (“Disagree strongly”) to “5” (“Agree strongly”).For special consideration we identified the most face-valid item (“Is intelligent”in Sample 1; “Is clear-thinking, intelligent” in Sample 2).
Table 1A Two-Factor Taxonomy of Self-Report Measures of Intelligence
Aggregation Strategy
Single Item Aggregated Items
Directness StrategyDirect Global rating of Global rating of
intelligence intelligence plussimilar items
Indirect Average item from an Full indirect measuresindirect measure (BCL, Ie, Intellect, Smart)
5. Despite its conceptual relevance, we did not include the item “ingenious” in Sample2 because of confusion the item caused. Apparently, some of our subjects thought theitem meant “not a genius.”
532 Paulhus et al.

To evaluate the utility of aggregating items, we combined the four itemsjudged by three raters to be the most face-valid indicators of intelligence.Although the scale items differed somewhat in the two samples, the similarityof correlates (see Results section) suggests that the two direct compositesmeasured a similar construct.
Indirect measures.Given our review of the four indirect measures in the Intro-duction, we will provide only a basic description here. The Intellectual efficiency(Ie) scale of the California Psychological Inventory (Gough, 1953) included 52True-False statements. The content includes personality-related items, rangingin content from beliefs (e.g., “Success is a matter of will power”) and interests(e.g., “I like to read about history”) to bizarre items about experiences (e.g., “Ihave never seen a vision”).
Portions of two subscales of the Hogan Personality Inventory (Hogan &Hogan, 1992) were also included to represent the Intellect factor. All items arein True-False format and were developed from a peer-perception view ofintellect. For reasons of convenience and space, we limited our selection to 15items from the Intellectance subscale and 7 items from the School Successsubscale. Examples are “I’m good at inventing games, stories, and rhymes” fromthe Intellectance subscale, and “As a child I was always reading” from the SchoolSuccess subscale.6
The Sternberg BCL consists of short, specific, behavioral descriptions origi-nally selected by lay judges as prototypical of intelligent people (Sternberg etal., 1981). We used the final 41-item version provided by Sternberg (1988, pp.238–239). Our subjects rated from “1” (low) to “9” (high) the extent to whicheach item was an “accurate self-description.” The BCL includes three subscales:the 13-item Verbal Ability subscale (e.g., “Speaks clearly and articulately”), the15-item Problem Solving subscale (e.g., “Makes good decisions”), and the13-item Social Competence subscale (e.g., “Responds thoughtfully to others’ideas”).
The 4-item Smart scale measures self-appraised intelligence via simple traitdescriptive statements of high face validity (Trapnell, 1994). As with the BCL,subjects rated from “1” (low) to “9” (high) the extent to which each item wasan “accurate self-description.” The items are: (1) “I’m considered exceptionallyor unusually intelligent”; (2) “I’m considered a very ‘brainy,’scholarly person”;(3) “I’m considered extremely ‘gifted’ or talented at academic things”; and(4) “My school grades have usually been near the top of every class.”
Objective measure (IQ test).The 12-minute WonderlicPersonnel Testwas cho-sen to assess IQ (Wonderlic, 1992). It is a short-form test of general cognitive
6. Two of the Intellect–School Success items are identical to two of the Intellectualefficiency items: We only included them once in our inventory.
Self-Report Measures of Intelligence 533

ability, that is, “the level at which an individual learns, understands instructionsand solves problems” (Wonderlic, 1992, p. 5). Included are items sampled fromverbal, quantitative, and analytic domains. Although a time limit is imposed, theWonderlic behaves more like a power test than a speeded test7because the itemsare presented in ascending order (McKelvie, 1994).
The Wonderlic is very popular in applied settings because of its ease ofadministration and comprehensive norms combined with ample reliability andvalidity evidence. Expert reviews have been highly favorable (see Aiken, 1996;Hunter, 1989; Schmidt, 1985; Schoenfeldt, 1985).
The Wonderlic shows test-retest reliabilities ranging from .82 to .94 (Dodrill,1983; Wonderlic, 1992), and alternate-form reliabilities ranging from .73 to .95(Wonderlic, 1992). These findings are based on adult working populations,however. Because of restriction of range of ability, college samples should yieldlower standard deviations, and therefore lower reliabilities. McKelvie (1989)reported a high internal consistency of .87 (odd-even split-half correlation) in acollege sample. The fact that reliability is not increased by relaxing the timerequirement (McKelvie, 1994) indicates that the time limit does not inflate theestimate.
In support of concurrent validity, the Wonderlic shows correlations above .80with longer IQ tests such as the WAIS-R (Dodrill, 1981; Wonderlic, 1992). Infact, Dodrill (1981, p. 668) reported that the Wonderlic IQ scores were within10 points of the WAIS Full Scale IQ scores in 90% of the cases. Of particularnote for this report is the fact that correlations are high with measures of bothverbal and quantitative abilities (Wonderlic, 1992). Previous studies in collegepopulations have also shown useful predictive validity for college grades(McKelvie, 1994), performance tests (Kennedy, Baltzley, Turnage, & Jones,1989), and supervisory rankings (Wonderlic, 1992).
RESULTS
Descriptive Statistics
Means, standard deviations, ranges, and reliability coefficient alphas arepresented in Table 2. The values of these statistics in the two samples arevirtually identical. Alpha values for the full scales and subscales aregenerally quite acceptable, ranging from .61 to .93 in Sample 1 and from.55 to .92 in Sample 2. The reliability of the single-item “intelligent”8
was estimated from the mean intercorrelation of the four global itemsfrom the direct composite.
7. A true speeded test comprises all easy questions.8. The item was “intelligent, clear-thinking” in Study 2.
534 Paulhus et al.

Not in the table are the statistics for the Wonderlic IQ test. Our Sample1 and Sample 2 means (25.5, 26.3) were only slightly higher than themanual norms for college students (Wonderlic, 1992, p. 38). Our SDs(4.41, 4.72), however, were substantially lower than the manual norms
Table 2Descriptive Statistics
Rating Item StandardScale # Items Scale Mean DeviationaRangea Alpha
Global Intelligence RatingsComposite Scaleb 4 5-point 3.66 .67 3.75 .68
3.24 .69 3.50 .65Single-itemc 1 5-point 4.02 .77 4.00 .46d
3.94 .82 4.00 .39d
Gough Intellectual 52 True-False .68 .11 .62 .72efficiency (Ie) scale .68 .10 .54 .67
Trapnell Smart scale 4 9-point 5.45 1.54 8.00 .865.09 1.65 8.00 .88
Hogan Intellect composite 22 True-False .59 .19 .91 .73.58 .20 .91 .77
Intellectance 15 True-False .62 .21 1.00 .72.62 .23 1.00 .76
School Success 7 True-False .52 .27 1.00 .61.48 .26 1.00 .55
Sternberg Behavior Check 41 9-point 6.24 .82 4.63 .93List (BCL) 6.40 .75 4.10 .92
Verbal Ability 13 9-point 6.02 .96 5.15 .806.12 1.03 5.38 .82
Practical ProblemSolving 15 9-point 6.26 .92 5.87 .89
6.42 .80 4.13 .88
Social Competence 13 9-point 6.45 .84 4.38 .776.67 .72 4.31 .71
Note.Top row of each cell is from Sample 1 (N = 310); Bottom row is from Sample 2(N = 326).aStandard deviations and ranges are calculated across subject means ratherthan across item means.bIncludes “intelligent” and three conceptually similar items.c“intelligent” (Sample 1); “clear-thinking, intelligent” (Sample 2).dMean intercorrela-tions among the four global items.
Self-Report Measures of Intelligence 535
of 5.73 for college students.9 For comparison, note that the normscomputed on a representative adult working population (p. 38) exhibiteda substantially lower overall mean (21.6) and higher SD (7.1).
Although parallel forms is preferable for estimating the reliability ofthe Wonderlic, we did not have that information. Instead, reliabilities forthe Wonderlic were estimated in two ways. First, we estimated internalconsistency directly in our sample with the odd-even split half-reliabilityused by McKelvie (1989). Our values were .79 and .83 in Samples 1 and2, respectively. A second calculation involved extrapolating from theappropriate reliability estimates (.90) taken on the broad norm sample(Wonderlic, 1992). Applying the correction formula from Gulliksen(1967, p. 124), to the reduction in standard deviation from 7.12 to 4.41and 4.72, the alphas in our sample were estimated to be .74 and .77. Usingeither estimation formula, the reliabilities in our college sample werenoticeably lower than in the general population, but certainly within theuseful range for research instruments. We can expect that our validities,in turn, will be correspondingly lower than those calculated on thegeneral population.
Range of Responses
As noted earlier, the strong tendency for respondents to claim high levelsof intelligence tends to restrict the range of responses, skew the responsedistribution, and constrain correlations with other variables (McCrae,1990; Thorndike, 1982). Note that the SDs shown in Table 2 werecalculated on the subject means, rather than calculating the means of theitem SDs. Given that the latter figures are more relevant to whether ornot our subjects were using the entire range of our rating-scales, weproceeded to calculate those figures.
Recall that we measured the direct items on 1-to-5 rating scales: Theexact distribution of responses was (0, .05, .25, .40, .30) across the twosamples. The SD for the single direct item was only .80 and .85 inSamples 1 and 2, respectively. For the four items of the composite directscale, the average SDs were still small: .93 (Sample 1) and .98 (Sample2). Compare these values with the average SD of 1.12 for a set of
9. Estimated from the manual norms for mean and women weighted according to genderratio in our samples.
536 Paulhus et al.
personality items in the same test battery. In short, the direct items didshow some restriction in range.
For the indirect measures, the means of the item standard deviationsand ranges were not relevant for the two True-False scales (Gough’s Ieand Hogan’s Intellect composite) and were therefore not calculated. Theother two indirect measures were administered in identical 9-pointresponse format, but the variation of the Smart scale items was noticeablygreater than the BCL items. The average standard deviations were 1.82and 1.92 for Trapnell’s Smart scale, and 1.59 and 1.53 for the BCL. Theaverage range of the items of the Smart scale was fully 8.00 in bothsamples, higher than that for the BCL, 7.63 and 7.17.
Intercorrelations Among Predictors
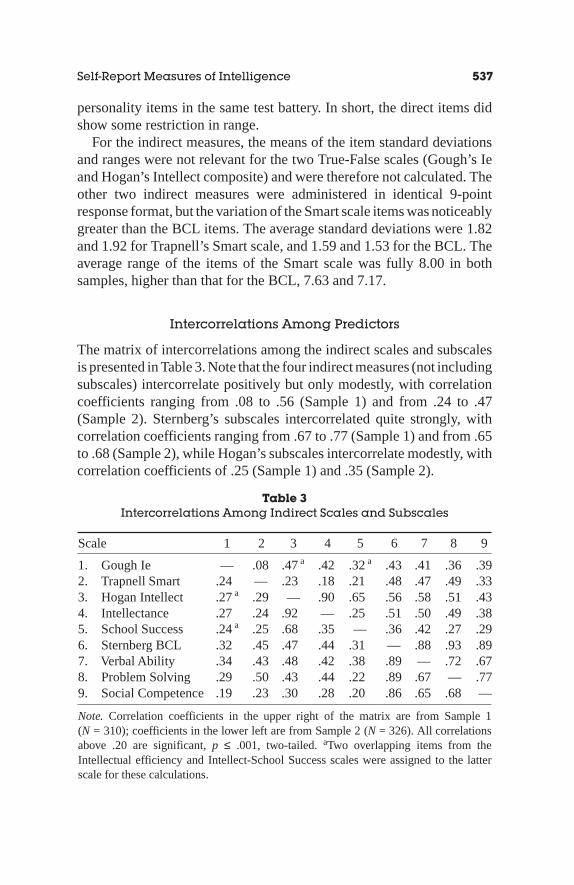
The matrix of intercorrelations among the indirect scales and subscalesis presented in Table 3. Note that the four indirect measures (not includingsubscales) intercorrelate positively but only modestly, with correlationcoefficients ranging from .08 to .56 (Sample 1) and from .24 to .47(Sample 2). Sternberg’s subscales intercorrelated quite strongly, withcorrelation coefficients ranging from .67 to .77 (Sample 1) and from .65to .68 (Sample 2), while Hogan’s subscales intercorrelate modestly, withcorrelation coefficients of .25 (Sample 1) and .35 (Sample 2).
Table 3Intercorrelations Among Indirect Scales and Subscales
Scale 1 2 3 4 5 6 7 8 9
1. Gough Ie — .08 .47a .42 .32a .43 .41 .36 .392. Trapnell Smart .24 — .23 .18 .21 .48 .47 .49 .333. Hogan Intellect .27a .29 — .90 .65 .56 .58 .51 .434. Intellectance .27 .24 .92 — .25 .51 .50 .49 .385. School Success .24a .25 .68 .35 — .36 .42 .27 .296. Sternberg BCL .32 .45 .47 .44 .31 — .88 .93 .897. Verbal Ability .34 .43 .48 .42 .38 .89 — .72 .678. Problem Solving .29 .50 .43 .44 .22 .89 .67 — .779. Social Competence .19 .23 .30 .28 .20 .86 .65 .68 —
Note. Correlation coefficients in the upper right of the matrix are from Sample 1(N = 310); coefficients in the lower left are from Sample 2 (N = 326). All correlationsabove .20 are significant,p ≤ .001, two-tailed.aTwo overlapping items from theIntellectual efficiency and Intellect-School Success scales were assigned to the latterscale for these calculations.
Self-Report Measures of Intelligence 537

Predictive Validity
Table 4 contains the validities, that is, the correlations of all self-reportintelligence measures with Wonderlic test scores. Our baseline validityis that of the single self-rated intelligence item: These values were .20(Sample 1) and .23 (Sample 2). The corresponding validities for thecomposite direct measure were slightly higher: .24 (Sample 1) and .26(Sample 2).
The ability of the four indirect measures to predict IQ test scores wasexamined in two ways. First we calculated and compared the validitiesof each predictor; then we performed regression analyses to determinewhich of the predictors made independent contributions.
Correlations. Table 4 indicates that all four indirect measures achievedsignificant validities in both samples. Of the indirect measures, Gough’sIe scale performed best, with validities of .20 (Sample 1) and .34 (Sample2), followed by Trapnell’s Smart scale, with validities of .24 (Sample 1)and .25 (Sample 2). Although not as successful overall, the other measures
Table 4Correlations of Self-Report Measures With IQ Test Scores
Scale Number of Items Sample 1 Sample 2
Direct MeasuresSingle-itema 1 .20*** .23***Composite scaleb 4 .24*** .26***Indirect MeasuresGough Ie 52 .20*** .34***Trapnell Smart 4 .24*** .25***Hogan Intellect 22 .15* .22***
Intellectance 15 .08 .13*School Success 7 .19** .27***
Sternberg BCL 41 .20*** .13*Verbal Ability 13 .24*** .18**Practical Problem Solving 15 .17** .10Social Competence 13 .14* .04
Note.*p < .05; **p < .01, ***p ≤ .001, two-tailed. Sample size ranges from 274 to 301(Sample 1) and from 241 to 265 (Sample 2) due to the subject matching across the threesources of data (i.e., direct, indirect, and IQ measures).a“Intelligent” (Sample 1);“clear-thinking, intelligent” (Sample 2).bRefers to the direct, global intelligence ratingsincluding “intelligent” and three conceptually similar items.
538 Paulhus et al.

each offered a successful subscale: Hogan’s School Success performedwell at .19 (Sample 1) and .27 (Sample 2), and so did Sternberg’s VerbalAbility subscale, at .24 (Sample 1) and .18 (Sample 2).
Recall that Sternberg (1988) found improved validity via a prototype-weighting procedure (see our Introduction). We followed this procedureby having five expert judges (research colleagues) rate each BCL itemfor diagnosticity of an ideally intelligent person. With strict adherenceto Sternberg’s method, however, we found no validity improvement.When we simply weighted without standardizing the BCL item scores,the correlations did improve slightly from .20 to .23 (Sample 1) and from.13 to .17 (Sample 2).
Regression analyses.To determine whether the indirect measures madeindependent contributions in predicting IQ, we conducted a regressionanalysis in each sample. When IQ score was regressed on all four indirectscales using simultaneous forced entry, significant weights appeared forGough’s Ie (.17, .29) and the Smart (.22, .19) across both samples.Hogan’s Intellect composite was also significant in one sample. Theresulting variance accounted for by the four indirect measures was 10%and 16% in the two samples.
A follow-up set of regression analyses was conducted to determine thepredictive power of the Intellect and BCL subscales. When the threeSternberg subscales alone were simultaneously force-entered, they ac-counted for a total of 6 and 4% of the variance in our two samples. Asimilar forced-entry with the Intellect subscales accounted for a total of7% of the variance in both samples. As might be expected, regression onthe subscales accounted for more of the variance than that achieved bythe composite Intellect or BCL scores.
A Two-Factor Organization of Strategies
Table 5 summarizes the key data for this report by displaying the meanvalidities of the four categories of measures of self-report intelligence.The performance of direct measures can easily be compared with thoseof indirect measures for both single items and the aggregated scales.
The entries in Table 5 (across the rows) are as follows: The single-itemdirect validities are the correlations of IQ with the single item “intelli-gent” (Study 1) or “clear-thinking, intelligent” (Study 2). The aggregateddirect entries are the validities of the 4-item direct scales including
Self-Report Measures of Intelligence 539

“intelligent” and closely related items. The single-item indirect validitiesare mean item validities across all 119 items of the four indirect scales.Finally, the aggregated indirect validities are the mean full-scale validi-ties across all four indirect measures.
In the case of the direct measures, aggregation boosts the validitiesfrom .20 and .23 to .24 and .26, respectively. This small improvementwith aggregation was disappointing. Validity prophecy formulas,10 forinstance, would predict values of .26 and .30 for a measure comprisingfour items equivalent to our baseline single items. Apparently, the validi-ties of our additional items did not parallel those of the original item(intelligent). Despite our best efforts to select conceptually similar items,aggregation provided only modest improvements in the validity of directmeasures.
For the indirect scales, however, Table 5 reveals a dramatic effect foraggregation. Here the comparison is between the mean of the 119 itemvalidities (.07 and .07) and the mean of the four full scale validities.Broken down scale by scale, aggregation raised the validities from .05 to.20, .20 to .24, .05 to .08, and from .11 to .20 for Ie, Smart, Intellect, andthe BCL, respectively, in Sample 1, and from .07 to .34, .21 to .25, .09
Table 5Correlations of Four Types of Predictors With IQ Test Scores
Aggregation Strategy
Single Item Aggregated Items
Directness StrategySample 1 Sample 2 Sample 1 Sample 2
Direct .20 .23 .24 .26Indirect .07 .07 .18 .24
Note.Single-item validities are correlations of IQ scores with the single item, “intelli-gent” (Study 1) or “clear-thinking, intelligent” (Study 2); the single-item indirectvalidities are mean item validities across all 119 items of the four indirect measures. Theaggregated items direct validities are based on the 4-item direct composite measure. Theaggregated items indirect validities are the mean full-scale validities across all fourindirect measures.
10. The prediction formula when only one measure is lengthened is presented byThorndike (1982, p. 153). An infinite number of equally good items would remove allunreliability to yield upper limits of .30 and .37 in the two samples.
540 Paulhus et al.

to .13, and .06 to .13 in Sample 2. In short, all indirect scales benefitedfrom aggregation.
A Closer Examination of the Indirect MeasuresUsing an Empirical Approach
Table 6 presents the 10 best performing items from the indirect scales,as defined by consistently good validities. Every measure is representedin the top 10. The fact that the Ie scale contributes the largest number ofrepresentatives probably derives from the fact that it has the most itemsand therefore the greatest opportunity to capitalize on chance. It isnoteworthy that the items with the highest validities are those relateddirectly to mental ability: After all, the rationale behind the creation ofthese indirect measures was that indirect items should exceed the validityof the more blunt, direct items such as “intelligent” or “smart.”
All four Smart items performed well in both samples, and two madethe top 10. Note that the top Intellect items are from the School Successsubscale and that all concern reading. Also note that the top items of theBCL both come from the Verbal Ability subscale.
Table 6The Top 10 Item Validities From Indirect Measures
Sample 1 Sample 2 Scale Item Content
.27 .32 BCL reads with high comprehension
.28 .26 BCL has a good vocabulary
.27 .20 Intellect As a child I was always reading
.21 .21 Ie/Intellect I am quite a fast reader
.18 .23 Ie/Intellect I read at least ten books a year
.20 .25 Smart Is considered a very “brainy,”scholarly person
.21 .21 Ie I was a slow learner in school
.20 .25 Smart considered exceptionally or unusuallyintelligent
.20 .20 Ie I seem to be at least as capable andsmart as most others around me
.22 .17 Intellect I would rather read than watch TV
Note. Values > .15 are significant at .01, while those > .20 are significant at .001,two-tailed.N = (275, 265). “Ie” refers to Gough’s Intellectual efficiency scale; “Smart”refers to Trapnell’s scale; “Intellect” refers to Hogan’s scale; “BCL” refers to Sternberg’sBehavior Check List.
Self-Report Measures of Intelligence 541

Summarizing the contents of Table 6, then, it appears that the top-performing items in the indirect scales were either (1) direct ability-related items, (2) indirect items about ability (i.e., Smart scale), or(3) items about reading behavior. If these 10 items are combined into anew “best items” composite scale, the correlation with IQ test is .34 inSample 1 and .38 in Sample 2.11
A Closer Examination of the Indirect MeasuresUsing a Theoretical Approach
Having discovered that the best performing items of the Sternberg,Hogan, and Gough scales were, in fact, the more direct and ability-relateditems, we decided to categorize the items of these indirect measurestheoretically. Four a priori categories were considered: mental abilities,personality-related, behaviors, and interests. Two judges showed 95%agreement on classification.
For each category, the mean validities were calculated; they arepresented here in Table 7. Mean item validities were .14 (Sample 1) and.12 (Sample 2) for the ability items. Means for next three categories(personality, interests, and behaviors) were in the .03 to .06 range—allsubstantially lower than the ability-related items.
Best of all, however, was the set of items addressing reading habits: “Iread at least ten books a year” from the Ie and Intellect scales, “As a child
11. These values are likely to be overestimates because of capitalization on chance.Unfortunately, cross-validation from one sample to the other is not feasible because theitems were chosen on the basis of consistent performance across both samples.
Table 7Validities of Indirect Items: Means Within Content Category
Category of Items # ItemsaSample 1Sample 2
Ability-related 23 .14 .12Personality-related 51 .05 .06Interest-related 26 .03 .06Behavior-related (Non-reading) 8 .05 .05Reading 5 .19 .18
Note. Ns = 275 (Sample 1) and 265 (Sample 2). Each entry is themean of all itemvaliditiesfor each category.aNumber of items refers to the number of item validities used incalculating the mean item validity.
542 Paulhus et al.
I was always reading” from Hogan’s Intellect composite scale, and “readswidely” and “Sets aside time for reading” from the BCL. In fact, thesereading items showed exceptional mean validities of .19 (Sample 1) and.18 (Sample 2).
In sum, it appears that items directly related to mental ability and itemsabout reading habits outperformed the other item content categories inpredicting IQ test scores. The other categories of items show positive,but low, item validities. Nonetheless, they can be aggregated, as in thecase of the Ie scale, to reach a reasonable level of validity.
DISCUSSION
We set out to evaluate whether IQ can be measured by proxy. That is, canthe handy self-report format be used as a substitute for a cumbersome IQtest? Because the validity of a single self-rating of intelligence has notproved adequate, researchers have advocated a number of strategies forimproving validity, namely, indirectness, aggregation, and prototype-weighting. Our results indicated that aggregated, direct measures werethe most effective, but none could consistently exceed .30. Prototypeweighting had minimal impact.
Performance of Direct Measures
We began by establishing the validity of our baseline, that is, a singleface-valid self-rating of intelligence. In two large samples, the single-item showed validities of .20 and .23—values that are typical of previousstudies. Some studies have reported higher validities but most of thosewere high-school or other samples with a wide range of talent. Competi-tive college samples, such as our own, suffer from a restricted range ofability, which limits potential validity values. In any case, our modestbaseline values left plenty of room for improvement via aggregation.
The empirical benefits of aggregation were evaluated by pooling thesingle item with other intelligence-related items12 in a composite directmeasure. An improvement in validity was observed with the addition ofthe 3–4 items most synonymous/antonymous to “intelligent,” namely,smart, clever, simple, and not gifted. The lack of improvement beyond
12. The items were selected by their conceptual similarity to “intelligent” (gifted, smart,clever, etc.).
Self-Report Measures of Intelligence 543

four items suggests that further aggregation added more noise than validvariance. Our battery of items contained 13 items selected for relevanceto mental ability. But few of these were able to capture that facet ofself-perception linked to IQ.
Even the validities of the 4-item composites (.24, .26) do not matchthe values predicted by the validity prophecy formula (26, .31) based onprojecting the validity of the single item “intelligent” (Thorndike, 1982,p. 152). Clearly that item plays a unique role, both conceptually andempirically.
Performance of Indirect Measures
Indirect measures promised to surpass the performance of direct mea-sures by providing a less threatening, less evaluative assessment atmos-phere. In terms of predicting IQ test scores, that promise was not fulfilledin our data. Given that the results for each indirect measure raiseddifferent issues, however, we will consider them one by one.
Gough Intellectual efficiency (Ie) scale.Recall that the Ie scale wasconstructed in a contrasted-groups fashion by selecting CPI items thatcorrelated with an IQ test (Gough, 1953). Given that it was developeddecades ago on California high-school students, its success in our con-temporary Canadian college sample—that is, validities of .20 and.34—might be considered remarkable. Nonetheless, a full 52 items wererequired to achieve those full-scale validities because the mean itemvalidity was low. Of course, True-False items are expected to show lowervalidities (but faster administration times) than corresponding Likertitems.
Contrary to the original intent of the Ie, however, it was primarily thedirect mental-ability items that correlated with IQ. The remaining items,concerned primarily with confidence and adjustment, were not as suc-cessful, although all items were originally selected because they corre-lated with IQ tests. Why the confidence and adjustment item validitiesdid not replicate is difficult to say. It is understandable that distractabilityrelated to maladjustment could hamper performance on IQ tests inde-pendent of actual ability. And this handicap of maladjustment may bemore true in high-school samples (where item-selection took place) thanin the college samples where we chose to validate the items.
544 Paulhus et al.

Perhaps the 4-decade gap in culture is somehow responsible. Evenacross a 10-year time span, Paulhus and Landolt (1994) found that thecriteria for nominating intelligent people had changed noticeablywhereas the criteria for the concept of intelligence had not changed. Wesuspect that, when criterion groups rather than rational methods are usedto develop scales, items measuring temporary societal influences aremore likely to intrude.
Sternberg’s Behavior Check List.As a unit, the BCL showed onlymodest predictive efficacy—slightly higher if an item-weighting proce-dure was applied. One of the subscales, the Verbal Ability subscale, waseffective. Sternberg et al. (1981) found the same pattern. Our detaileditem analyses revealed that the high-validity items carrying the subscalewere those concerning mental ability and items about reading habits.
Although the ability of the BCL to predict IQ was not impressive fora 41 Likert-item measure, we must call attention to its original purpose.Sternberg intended the BCL not as aproxy for IQ tests, but as asupplementary measure: It was designed to be administered along withan IQ test to tap components of intelligence that IQ tests were not capableof measuring (Sternberg, 1988, p. 239). From this perspective, highcorrelations with IQ tests should not be expected.
This supplementary role of the BCL is consistent with Sternberg’slong-standing complaint that IQ tests measure only a limited part of layconceptions of intelligence. Recently, we have followed up this notionin our work on “non-test intelligence” (Lysy & Paulhus, 1996). Bypartialing IQ and self-presentation out of self- and peer-ratings of intel-ligence, we formed a self-residual and a peer-residual to represent thatpart of intelligence that is “beyond IQ.” We then correlated the residualswith a battery of personality and interest measures. The top correlates ofthe self-residual were self-rated conscientiousness and openness,self-esteem, the Intellectual efficiency scale, and the Smart scale, whilethe top correlates of the peer residual were peer-rated conscientiousness,openness, physical attractiveness, and athletic ability. The different cor-relates of self and peer suggest that “non-test intelligence” is largely aperceiver-dependent idiosyncrasy. There was, however, a small overlap-ping component indicating that self and others systematically misattrib-ute intelligence to those who are conscientious and open. This componentmay be that facet of “true intelligence” that is not represented in IQ tests.
Self-Report Measures of Intelligence 545
Hogan’s Intellect composite.As a whole, the Intellect compositeshowed only a modest ability to predict IQ scores. Obscured in thisoverall figure, however, is the fact that the two subscales showed dra-matically different validities. Recall that the Intellectance subscale wasdesigned to capture an unconventional, creative conception of intellectwhereas School Success was aimed at the more conventional goal-oriented conception of intellect. Our results support this distinction inthat School Success was a distinctly better predictor of IQ with validitiesof .19 and .27 in our two samples. In fact, these are underestimatesbecause we used only a 7-item version. The validity of a 21-item version,as predicted by the prophecy formula (Thorndike, 1982), would havebeen .22 and .32 in our two samples.
Trapnell’s Smart scale.The newest instrument in the study, Trapnell’s(1994) Smart scale, performed well. It was designed to reduce range-restriction in two ways: (1) by diminishing the desirability of claimingthe item and (2) by shifting the implied locus of evaluation from self toothers. As intended, the Smart scale did show a reduced range restriction:Subjects utilized almost the entire range of the 9-point scale—noticeablymore than the range of Sternberg’s BCH.
The Smart scale is certainly efficient, requiring only four items tomatch or even outperform the other indirect measures. It is now evident,however, that the success of the Smart scale did not derive from itsindirect nature. Direct composites with four items of similar content(smart, clever, etc.) worked just as well as the Smart scale. Therefore itssuccess was more likely a function of content rather than of Trapnell’sstrategic contextualizing of the items.
The Content of Predictors
This scale-by-scale analysis of successful items helped clarify the sourceof their success. Although the four inventories derived from four dramati-cally different domains, the successful items within each were almostentirely ability-related. Of course, the direct measures were designed toaddress ability directly. But in the case of indirect measures, it is certainlyironic that their most direct items work best. This finding has the addedbenefit of refuting a potential alternative explanation for our finding oflower validities for indirect measures than direct measures, namely, thatthe indirect measures were administered later in a separate test battery
546 Paulhus et al.

from the direct measures. But even those direct items included in thesame battery as the indirect still outperformed the indirect items.
Out of all remaining item-content areas, the only one yielding consis-tently high validities was an interest in reading.13 Why a lifelong enjoy-ment of reading is associated with achieving high scores on IQ tests isnot clear. Many educational psychologists argue that reading behaviorpermanently boosts mental abilities (Rayner & Pollatsek, 1989) and isrightfully encouraged. Of course, other causal sequences are possible.High intelligence might make reading more enjoyable (Hogan & Hogan,1992). Or third variables such as social class or openness to experiencemight nurture both (McCrae & Costa, 1985).
The Value of Aggregation and Weighting
Administration of the single item “intelligent” is certainly efficient giventhe practical costs of adding more items to a test battery. And, across allitems administered in our studies, it was the most consistently valid.Addition of other direct items improved validities only up to five items.Beyond that, returns were marginal.14 Apparently, the items linked to IQscores have a limited semantic scope. The fact that the Ie scale benefitedmost from aggregation suggests that this strategy aids True-False morethan Likert-item composites. It is understandable that dichotomousitems, though potentially as valid as Likert items, require more aggrega-tion because of lower item reliability.
Sternberg et al. (1981) reported substantial improvement in BCLvalidities via a correlation-with-prototype approach. As we showed inthe Introduction, this approach is simply a form of weighting procedure,that is, counting certain items more than others in calculating total scalescores.15 The traditional psychometric wisdom is that unit weighting ofitems selected from regression or factor analysis is preferable to any otherweighting: That wisdom was not refuted by our data.
13. Interestingly, an instrument recently developed to predict school success containsthe same two categories of predictors (Giddan, Jurs, Andberg, & Bunnell, 1996).14. It seems that aggregation may pay off less in assessing intelligence than in assessingpersonality. However, our selection of intelligence items was not systematic enough tomake such a strong claim here.15. If the negatively keyed items have not yet been reversed, then the primary effect ofweighting is simply to reverse these items.
Self-Report Measures of Intelligence 547

A general-purpose inventory, such as Sternberg’s BCL, however, mayrepresent an interesting exception to that wisdom. Here, an eclectic setof items is to be used for a variety of purposes, in this case, all germaneto intelligence (see Cornelius et al., 1989). For predicting IQ, ouranalyses showed that the Social Competence items should be given zeroweights; in predicting some other criterion, a different set of items mightbe zero-weighted. In a sense, the weightings are used to “unload” theitems that are irrelevant for the current purpose. Thus a heterogeneousset of items can be retained but weighted in different ways to predictdifferent criteria.
According to this argument, the only instruments in our package withpotential for improvement via weighting are the BCL and the Ie scale.Unfortunately, although we tried various weighting procedures, weachieved only minimal improvements. Nonetheless, in appropriate in-struments, such weighting could prove useful.
Putting Our Results in Perspective
Are self-report measures useful as proxies for IQ tests in college sam-ples? Our data suggest not. Given that the validity of an ideal proxymeasure would be upwards of .5516 in college samples, our validity capof .30 is disappointing. We tried out the best available measures, as wellas the most highly touted improvement strategies.
Limitations in the criterion? The criterion measure, the Wonderlic IQtest, does not appear to be at fault. Previous studies have shown sufficientconstruct validation in college populations (e.g., Kennedy et al., 1989;McKelvie, 1994; Paulhus & Morgan, 1997; Wonderlic, 1992). Ratherthan being inappropriate for measuring IQ in college samples, its lack-luster performance here is directly attributable to its low standard devia-tion. It performed no better and no worse than any standard IQ test wouldhave in this situation.
16. This estimate begins with the median correlation (.83) of the Wonderlic with otherIQ tests in general populations (Wonderlic, 1992). Instead of 7.12, the general populationSD, the mean SD of our two samples was only 4.6. Adjustment of the validity for thisrestriction in range (Cohen & Cohen, 1983) yields .55.
548 Paulhus et al.

Contamination of self-reports?So why the poor correspondence be-tween self-rated intelligence and IQ tests? As Sternberg (1998) has noted,correspondence is limited by the common tendency to base one’s self-perceived intelligence on abilities different from those tapped by IQ tests.In addition, discordance is to be expected because of motivated as wellas unmotivated ignorance (Paulhus, 1986). The motivated portion in-volves inflated self-perceptions due to narcissism or self-deception.Previous research shows that this component contributes even more thanIQ scores—perhaps 20% of the reliable variance in self-perceived intel-ligence (Gabriel, Critelli, & Ee, 1994; Paulhus, Yik, & Lysy, 1996). Thismotivated component also includes idiosyncratic definitions of intelli-gence designed defensively to match the raters’ own abilities and there-fore ensure that they are intelligent (Dunning & Cohen, 1992). Theunmotivated portion of ignorance may include a lack of interest, concern,or insight into such matters (Campbell & Lavallee, 1993).
Restriction of range?Finally, we must remind readers of the severehandicap placed on all the validities reported here. The restriction ofrange created by our use of college samples is likely to have diminishedall validities as a function of the reduced variances (see Cohen & Cohen,1983). Compared with the SD of 4.6 that we found for our IQ test, SDsof 7.1 are more typical of the general populations (Wonderlic, 1992).Adjusted for restriction of range, our baseline validities for the singleitem “intelligent” (.20–.23) would have reached .30–.35. Similarly, in-stead of our ceiling of .30 for aggregated instruments, we could haveachieved values of .40–.45 in the normal population. The latter valuesappear strong enough to be useful in research, if not in diagnosingindividuals.
Limitations of IQ tests?Self-reports of intelligence, we argue, shouldnot be evaluated solely in terms of potential as proxies for IQ tests. Giventhat lay perceivers typically hold that there is more to intelligence thanIQ, our participants may well have based their self-ratings on theircreativity, their interpersonal sensitivity, their musical ability, or theirself-insight—none of which are tapped by the Wonderlic. And we agreewith the view of expert commentators such as Sternberg and Gardner thatwe must tie scientific conceptions of intelligence more closely to suchlay conceptions.
Self-Report Measures of Intelligence 549

Such arguments suggest an alternative criterion for evaluating self-reports of intelligence: the perceptions of knowledgeable peers. Insupport of this argument, we have elsewhere reported evidence thatself-ratings predict peer-ratings of intelligence independent of IQ scores(Lysy & Paulhus, 1996). That is, some portion of observers’ perceptionsof intelligence is detectable by self and observers but not by IQ tests.Thus self-report measures of intelligence have validity beyond their useas proxy IQ measures. From this perspective, it would actually besurprising to find high correlations between IQ tests and perceptions ofintelligence.
Some Promising Avenues
We see several potential avenues for clarifying the links between testperformance and self-perceptions of intelligence. First is the develop-ment of new intelligence tests to encompass more of everyday concep-tions of “intelligence.” To the extent that test content corresponds toeveryday conceptions, then associations should be higher. Wagner andSternberg (1986) have pursued this avenue by developing objectivemeasures of practical intelligence. Salovey and Mayer’s (1990) “emo-tional intelligence” is another measure that shifts the conceptual bordersof intelligence toward everyday conceptions.
A second avenue for future research is clarifying and perhaps improv-ing the other side of the relationship, namely, the self-perceptions. Whatcues are people using to judge their intelligence? The lens model isproving profitable in specifying proximal cues, that is, objective behav-iors that trigger attributions of intelligence (Reynolds & Gifford, 1996).We too are examining matches and mismatches between self- and peer-perceptions of intelligence and their correlates (Lysy & Paulhus, 1996).This research should help specify the missing content in current self-report measures.
In a third avenue of research, we have attempted to deal with theself-presentation typical of self-reported intelligence. The OverclaimingQuestionnaire exploits a sophisticated methodology with great potentialas a proxy IQ test (Paulhus, Bruce, & Lysy, 1996). Respondents are askedto rate their familiarity with a wide range of people, places, books, events,and so on. Because 20% of the items are fictitious, signal detectionstatistics can be used to separate accuracy from bias. In a series of collegesamples, the signal detection accuracy parameter (d ) correlated .44–.50'
550 Paulhus et al.

with scores on an IQ test. Considering that these were college samples,the validities are quite promising.
Finally, we encourage further research on the indirect measures stud-ied here. Their greatest potential asset has never been directly tested: theymay actually outperform direct measures in ego-threatening administra-tion conditions. Another issue worthy of study is whether the directability items work only when interspersed with a variety of other items.
CONCLUSIONS
The present paper constitutes the most comprehensive examination ofself-reports of intelligence to date. We have organized the availablemeasures into four categories of self-rated intelligence to investigate theeffects of employing indirect versus direct measures, and the effects ofaggregation, on predicting objectively scored intelligence. Administra-tion of these measures to two large samples led us to a few key conclusions.
1. Both direct and indirect self-report measures of intelligence canreliably predict IQ scores. Because of the restricted range of abili-ties in competitive college samples, however, the validity limitappears to be .30.
2. Direct items about global mental abilities are more valid thanindirect items. The one clear exception is the high validities ofindirect items referring to enjoyment/frequency of reading.
3. Aggregation of global ability items is beneficial up to a point. Withthe exception of reading items, aggregation doesn’t appear to helpbeyond 4–5 core items referring directly to close synonyms/antonyms of intelligence (e.g., smart, clever, simple, not gifted).
4. Prototype weighting is helpful only for excluding ineffective itemsin an inventory.
5. Among available measures, the most effective predictors of IQscores were Gough’s Intellectual efficiency and Trapnell’s Smartscale. Equally effective were Hogan’s School Success scale andSternberg’s Verbal Ability scale.
As a whole, our verdict is pessimistic about the utility of self-reportsas proxy measures of IQ in college samples. Our verdict is more optimistic
Self-Report Measures of Intelligence 551

about their utility for assessing intelligence as a broader concept, par-ticularly in the general population. Either way, researchers who requiresome proxy IQ test for their research should benefit from the guidelineswe have provided here.
REFERENCES
Ackerman, P. L., & Heggestad, E. D. (1997). Intelligence, personality, and interests:Evidence for overlapping traits.Psychological Bulletin, 121, 219–245.
Aiken, L. R. (1996).Assessment of intellectual functioning(2d ed.). New York: PlenumPress.
Bailey, R. C., & Hatch, V. (1979). Interpersonal perceptions of intelligence in latechildhood and early adolescent friendships.Journal of Genetic Psychology, 135,109–114.
Bailey, R. C., & Mettetal, G. W. (1977). Perceived intelligence in married partners.SocialBehavior and Personality, 5, 137–141.
Block, J. (1961).The Q-sort method in personality assessment and psychiatric research.Springfield, IL: Charles C. Thomas.
Block, J. (1971).Lives through time. Berkeley, CA: Bancroft Books.Borkenau, P. (1993). To predict some of the people more of the time: Individual traits
and the prediction of behavior. In K. H. Craik, R. Hogan, & R. N. Wolfe (Eds.),Fiftyyears of personality psychology: Perspectives on individual differences(pp. 237–249).New York: Plenum Press.
Borkenau, P., & Liebler, A. (1993). Convergence of stranger ratings of personality andintelligence with self-ratings, partner ratings, and measured intelligence.Journal ofPersonality and Social Psychology, 65, 546–553.
Campbell, J. D., & Lavallee, L. F. (1993). Who am I? The role of self-concept confusionin understanding the behavior of people with low self-esteem. In R. F. Baumeister(Ed.),Self-esteem: The puzzle of low self-regard(pp. 3–20). New York:Plenum Books.
Cohen, J., & Cohen, P. (1983).Applied multivariate regression/correlation for thebehavioral sciences. Hillsdale, NJ: Erlbaum.
Cornelius, S. W., Kenny, S., & Caspi, A. (1989). Academic and everyday intelligence inadulthood: Conceptions of self and ability tests. In J. D. Sinnott (Ed.),Everydayproblem-solving: Theory and applications(pp. 191–210). New York: Praeger.
DeNisi, A. S., & Shaw, J. B. (1977). Investigation of the uses of self-reports of abilities.Journal of Applied Psychology, 62, 641–644.
Dodrill, C. B. (1983). Long term reliability of the Wonderlic Personnel Test.Journal ofConsulting and Clinical Psychology, 51, 316–317.
Dunning, D., & Cohen, G. L. (1992). Egocentric definitions of traits and abilities in socialjudgment.Journal of Personality and Social Psychology, 63, 341–355.
Epstein, S. (1983). Aggregation and beyond: Some basic issues on the prediction ofbehavior.Journal of Personality, 51, 360–392.
Gabriel, M. T., Critelli, J. W., & Ee, J. S. (1994). Narcissistic illusions in self-evaluationsof intelligence and attractiveness.Journal of Personality, 62, 144–155.
552 Paulhus et al.

Giddan, N. S., Jurs, S. G., Andberg, M., & Bunnell, P. (1996). Noncognitive long-termprediction of college grades by the Academic Performance Scale.Assessment, 3,91–98.
Gough, H. G. (1953). A nonintellectual intelligence test.Journal of Consulting Psychol-ogy, 17, 242–246.
Gough, H. G. (1996).California Psychological Inventory(3rd. ed.). Palo Alto, CA:Consulting Psychologists.
Gulliksen, H. (1967).Theory of mental tests. New York: Wiley.Hogan, R., & Hogan, J. (1992).Hogan Personality Inventory manual. Tulsa, OK: Hogan
Assessment Systems.Hunter, J. E. (1989).The Wonderlic Personnel Test as a predictor of training success and
job performance. Technical report, Department of Psychology, Michigan State Uni-versity.
John, O. P., & Robins, R. W. (1993). Determinants of interjudge agreement on personalitytraits: The Big Five domain, observability, evaluativeness, and the unique propertiesof the self.Journal of Personality, 61, 521–551.
Kennedy, R. S., Baltzley, D. R., Turnage, J. J., & Jones, M. B. (1989). Factor analysisand predictive validity of microcomputer-based tests.Perceptual & Motor Skills, 69,1059–1074.
Lysy, D. C., & Paulhus, D. L. (1996, August).Beyond IQ: The search for non-testintelligence. Paper presented at the meeting of the American Psychological Associa-tion, Toronto.
McCrae, R. R. (1990). Traits and trait names: How well is openness represented in naturallanguages?European Journal of Personality, 4, 119–129.
McCrae, R. R., & Costa, P. T. (1985). Updating Norman’s “Adequate Taxonomy”:Intelligence and personality dimensions in natural language and in questionnaires.Journal of Personality and Social Psychology, 49, 710–721.
McKelvie, S. J. (1989). The Wonderlic Personnel Test: Reliability and validity in anacademic setting.Psychological Reports, 65, 161–162.
McKelvie, S. J. (1994). Validity and reliability findings for an experimental short formof the Wonderlic Personnel Test in an academic setting.Psychological Reports, 75,907–910.
Paulhus, D. L. (1986). Self-deception and impression management in test responses. InA. Angleitner & J. S. Wiggins (Eds.),Personality assessment via questionnaire(pp.143–165). New York: Springer-Verlag.
Paulhus, D. L., Bruce, M. N., & Lysy, D. C. (1996).The Over-Claiming Questionnaire(OCQ). Unpublished instrument, University of British Columbia.
Paulhus, D. L., & Landolt, M. (1994, June).Differential processes in accessing conceptsof intelligence. Paper presented at meeting of Canadian Psychological Association,Penticton, Canada.
Paulhus, D. L., & Martin, C. L. (1987). The structure of personality capabilities.Journalof Personality and Social Psychology, 52, 354–365.
Paulhus, D. L., & Morgan, K. L. (1997). Determinants of perceived intelligence inleaderless groups: The dynamic effects of shyness and familiarity.Journal of Person-ality and Social Psychology, 72, 99–107.
Self-Report Measures of Intelligence 553

Paulhus, D. L., Yik, M.S.M, & Lysy, D. C. (1996, August).Self- and peer-ratings ofintelligence: Accuracy or self-presentation?Paper presented at the meeting of theAmerican Psychological Association, Toronto.
Rayner, K., & Pollatsek, A. (1989).The psychology of reading. Englewood Cliffs, NJ:Prentice-Hall.
Reilly, J. & Mulhern, G. (1995). Gender differences in self-estimated IQ: The need forcare in interpreting group data.Personality and Individual Differences, 18, 189–192.
Reynolds, D., & Gifford, R. (1996).Measured and judged intelligence: A Brunswik lensanalysis of verbal and nonverbal cues. Manuscript in progress, University of Victoria.
Salovey, P., & Mayer, J. D. (1989–1990). Emotional intelligence.Imagination, Cogni-tion, and Personality, 9, 185–211.
Schmidt, F. L. (1985). Review of the Wonderlic Personnel Test. In J.V. Mitchell (Ed.),Ninth mental measurements yearbook(pp. 1755–1757). Lincoln, NE: Buros Instituteof Mental Measurement.
Schoenfeldt, L. F. (1985). Review of Wonderlic Personnel Test. In J. V. Mitchell (Ed.),Ninth mental measurements yearbook(pp.1757–1758). Lincoln, NE: Buros Instituteof Mental Measurement.
Sternberg, R. J. (1988).The triarchic mind: A new theory of human intelligence. NewYork: Penguin Books.
Sternberg, R. J., Conway, B. E., Ketron, J. L., & Bernstein, M. (1981). People’sconceptions of intelligence.Journal of Personality and Social Psychology, 41, 37–55.
Thorndike, R. L. (1982).Applied psychometrics. Boston: Houghton-Mifflin.Trapnell, P. D. (1994). Openness versus intellect: A lexical left turn.European Journal
of Personality, 8, 273–290.Trapnell, P. D., & Scratchley, L. (1996).Predictors of intellectual performance. Unpub-
lished data, University of British Columbia.Wagner, R. K, & Sternberg, R. J. (1986). Tacit knowledge and intelligence in the everyday
world. In R. J. Sternberg & R. K Wagner (Eds.),Practical intelligence: Nature andorigins of competence in the everyday world(pp. 51–83). New York: CambridgeUniversity Press.
Welsh, G. S. (1975).Creativity and intelligence: A personality approach. Chapel Hill,NC: Institute for Research in Social Science.
Wonderlic, E. F. (1992).Wonderlic Personnel Test and scholastic level exam user’smanual. Libertyville, IL: Wonderlic Personnel Test, Inc.
554 Paulhus et al.