self-organisation can explain the mapping of angular ... · pdf fileself-organisation can...
TRANSCRIPT

Self-Organisation Can Explain the Mapping of Angular
Whisker Deflections in the Barrel Cortex
Stuart P Wilson
s0679286
Supervised by Dr James Bednar
Master of Science
School of Informatics
University of Edinburgh
August 2007

Abstract
A topographic mapping of angular whisker deflections has recently been discovered in thebarrel cortex of rats (Andermann & Moore, 2006). Characteristics of this map suggestthat it could emerge in post-natal development, through self-organisation under a Heb-bian learning regime. This hypothesis was implemented in a self-organising computationalmodel, from which a remarkably similar mapping emerges when whisker deflections arecorrelated during training. The model is used to make novel predictions of the real system,and work towards a more sophisticated input system is documented.

Acknowledgements
I would like to express my sincere gratitude to my supervisor Jim Bednar for encouragingthe initial proposal of this work, for making me stop and think about whiskers whendesigning the model, and for being patient with me during its implementation.
I am very grateful to Tony Prescott and Ben Mitchinson of the Adaptive BehaviouralResearch Group (ABRG) at the University of Sheffield for their help with WhiskerBot,and particularly to Charles Fox who guided much of the groundwork.
I am also grateful to the EPSRC for funding my MSc, and to the School of Informatics atthe University of Edinburgh for funding the Webots software licence.
Furthermore, many thanks to attendees of the Developmental Computational Neurosciencemeetings for fruitful discussions related to this project.
i

For Mum, Dad & Rachel
ii

Declaration
I declare that this thesis was composed by myself, that the work contained herein is myown except where explicitly stated otherwise in the text, and that this work has not beensubmitted for any other degree or professional qualification except as specified.
(Stuart P Wilson)
iii

Contents
1 Introduction 1
1.1 Overview . . . . . . . . . . . . . . . . . . . . . . . . . . . . . . . . . . . . . 1
1.1.1 Topographic Maps in Sensory Cortex . . . . . . . . . . . . . . . . . 1
1.1.2 Self-Organisation . . . . . . . . . . . . . . . . . . . . . . . . . . . . . 4
1.2 Hypotheses . . . . . . . . . . . . . . . . . . . . . . . . . . . . . . . . . . . . 5
1.3 Objectives . . . . . . . . . . . . . . . . . . . . . . . . . . . . . . . . . . . . . 5
1.4 Report Summary . . . . . . . . . . . . . . . . . . . . . . . . . . . . . . . . . 6
1.4.1 Chapter 2: Background . . . . . . . . . . . . . . . . . . . . . . . . . 7
1.4.2 Chapter 3: Model Development . . . . . . . . . . . . . . . . . . . . . 7
1.4.3 Chapter 4: Results . . . . . . . . . . . . . . . . . . . . . . . . . . . . 7
1.4.4 Chapter 5: A Spatial-Temporal Model . . . . . . . . . . . . . . . . . 7
1.4.5 Chapter 6: W-LISSOMBot . . . . . . . . . . . . . . . . . . . . . . . 7
1.4.6 Chapter 7: Discussion . . . . . . . . . . . . . . . . . . . . . . . . . . 8
1.4.7 Chapter 8: Conclusion . . . . . . . . . . . . . . . . . . . . . . . . . . 8
2 Background 9
2.1 Overview . . . . . . . . . . . . . . . . . . . . . . . . . . . . . . . . . . . . . 9
2.2 The Whiskers . . . . . . . . . . . . . . . . . . . . . . . . . . . . . . . . . . . 9
2.2.1 Whisking . . . . . . . . . . . . . . . . . . . . . . . . . . . . . . . . . 10
2.2.2 The Primary Afferents . . . . . . . . . . . . . . . . . . . . . . . . . . 11
2.3 The Whisker-Barrel Pathway . . . . . . . . . . . . . . . . . . . . . . . . . . 15
iv
CONTENTS CONTENTS
2.3.1 Barrelettes . . . . . . . . . . . . . . . . . . . . . . . . . . . . . . . . 15
2.3.2 Barreloids . . . . . . . . . . . . . . . . . . . . . . . . . . . . . . . . 16
2.3.3 Barrels . . . . . . . . . . . . . . . . . . . . . . . . . . . . . . . . . . 17
2.4 LISSOM . . . . . . . . . . . . . . . . . . . . . . . . . . . . . . . . . . . . . . 18
2.5 Summary . . . . . . . . . . . . . . . . . . . . . . . . . . . . . . . . . . . . . 21
3 Whisker-LISSOM 22
3.1 Model Overview . . . . . . . . . . . . . . . . . . . . . . . . . . . . . . . . . 22
3.2 Generating Input Patterns . . . . . . . . . . . . . . . . . . . . . . . . . . . . 23
3.2.1 Stimulating Whiskers . . . . . . . . . . . . . . . . . . . . . . . . . . 23
3.2.2 The Ganglion Ring Network . . . . . . . . . . . . . . . . . . . . . . . 24
3.3 Whisker-LISSOM . . . . . . . . . . . . . . . . . . . . . . . . . . . . . . . . . 27
3.3.1 Ganglia/Barrelette Input Sheets . . . . . . . . . . . . . . . . . . . . 27
3.4 Self-Organisation . . . . . . . . . . . . . . . . . . . . . . . . . . . . . . . . . 29
3.4.1 The Self-Organising Algorithm . . . . . . . . . . . . . . . . . . . . . 31
3.4.2 The Afferent Projection . . . . . . . . . . . . . . . . . . . . . . . . . 31
3.4.3 Lateral Cortical Connections . . . . . . . . . . . . . . . . . . . . . . 33
4 Results 35
4.1 Network Testing . . . . . . . . . . . . . . . . . . . . . . . . . . . . . . . . . 35
4.2 Outward Radiating Pinwheels . . . . . . . . . . . . . . . . . . . . . . . . . . 36
4.3 Controls . . . . . . . . . . . . . . . . . . . . . . . . . . . . . . . . . . . . . . 41
4.3.1 Experiment 1: Uncorrelated Deflections . . . . . . . . . . . . . . . . 41
4.3.2 Experiment 2: Random Deflections . . . . . . . . . . . . . . . . . . . 43
4.3.3 Experiment 3: Anti-Correlated Deflections . . . . . . . . . . . . . . . 44
4.4 Summary . . . . . . . . . . . . . . . . . . . . . . . . . . . . . . . . . . . . . 44
5 A Spatial-Temporal Model 45
5.1 Representing Time . . . . . . . . . . . . . . . . . . . . . . . . . . . . . . . . 45
5.2 Results . . . . . . . . . . . . . . . . . . . . . . . . . . . . . . . . . . . . . . . 48
v

CONTENTS CONTENTS
6 Whisker-LISSOMBot 51
6.1 WhiskerBot Overview . . . . . . . . . . . . . . . . . . . . . . . . . . . . . . 52
6.2 Whisker-LISSOMBot . . . . . . . . . . . . . . . . . . . . . . . . . . . . . . 54
6.3 The Environment . . . . . . . . . . . . . . . . . . . . . . . . . . . . . . . . . 56
6.4 Simulation Details . . . . . . . . . . . . . . . . . . . . . . . . . . . . . . . . 59
6.4.1 Generating Whisker Strains . . . . . . . . . . . . . . . . . . . . . . . 59
6.4.2 Implementation Details . . . . . . . . . . . . . . . . . . . . . . . . . 60
6.4.3 Current W-LISSOMBot Limitations . . . . . . . . . . . . . . . . . . 60
6.5 Texture Discrimination . . . . . . . . . . . . . . . . . . . . . . . . . . . . . . 62
7 Discussion 67
7.1 Outcomes . . . . . . . . . . . . . . . . . . . . . . . . . . . . . . . . . . . . . 67
7.2 Predictions . . . . . . . . . . . . . . . . . . . . . . . . . . . . . . . . . . . . 68
7.3 Future Work . . . . . . . . . . . . . . . . . . . . . . . . . . . . . . . . . . . 69
7.4 An Integrated Neural System . . . . . . . . . . . . . . . . . . . . . . . . . . 71
8 Conclusions 75
vi
Chapter 1
Introduction
1.1 Overview
1.1.1 Topographic Maps in Sensory Cortex
Neurons in sensory cortex are tuned to respond preferentially to specific areas of the sen-sory input space (Hubel & Wiesel, 1962). A neuron’s receptive field, its window onto thesensory periphery, is typically related to its location in two-dimensional cortical space. Assuch neighbouring cortical regions will respond to stimuli in corresponding neighbouringregions of the input space. Neurons in the primary visual cortex (V1) of mammals respondto stimuli presented to neighbouring regions of the visual field so as to form a topographicmap of the surface of the retina. Coextensive with this retinotopic mapping exist finer-scale maps of individual dimensions by which the inputs can vary. For example, individualneurons in cat V1 fire maximally in response to the specific direction in which a visualpattern is swept across their receptive fields, and these preferences are mapped smoothlyacross the surface of the cortex (Weliky, Bosking & Fitzpatrick, 1996). Each neuron ac-tually participates in the mapping of multiple dimensions, such that a specific V1 neuronmight fire maximally when presented with a bar stimulus, oriented at 30o and moving at60o.
Interestingly, no systematic mapping for orientation or direction has been found across thesurface of rodent visual cortex (Ohki et al., 2005). However, in a region of the primarysomatosensory cortex, the barrel cortex, there exists a highly organised somatotopic mapof the whiskers on the animal’s snout (see figure 1.1). Distinctive neuronal clusters inlayer 4 barrel cortex, termed barrels, respond primarily to deflections of a single principalwhisker. The location of each whisker’s barrel in the cortical sheet is such as to preciselymap the arrangement of the whiskers on the animal’s snout. In a recent seminal paper
1

1.1. OVERVIEW CHAPTER 1. INTRODUCTION
Figure 1.1: The Rat Somatotopic Barrel Map. Left: The location of the whiskers onthe whiskerpad is typically described using a row (A-E, ventral-dorsal) and column (1-6caudal-rostral) co-ordinate system (straddlers are labelled α-δ). Right: The barrel cortexfaithfully reproduces the somatotopy of the whiskerpad (left frames) in distinctive columns.The larger, labelled barrels are approximately 400µm diameter (from Petersen, 2003, p129).
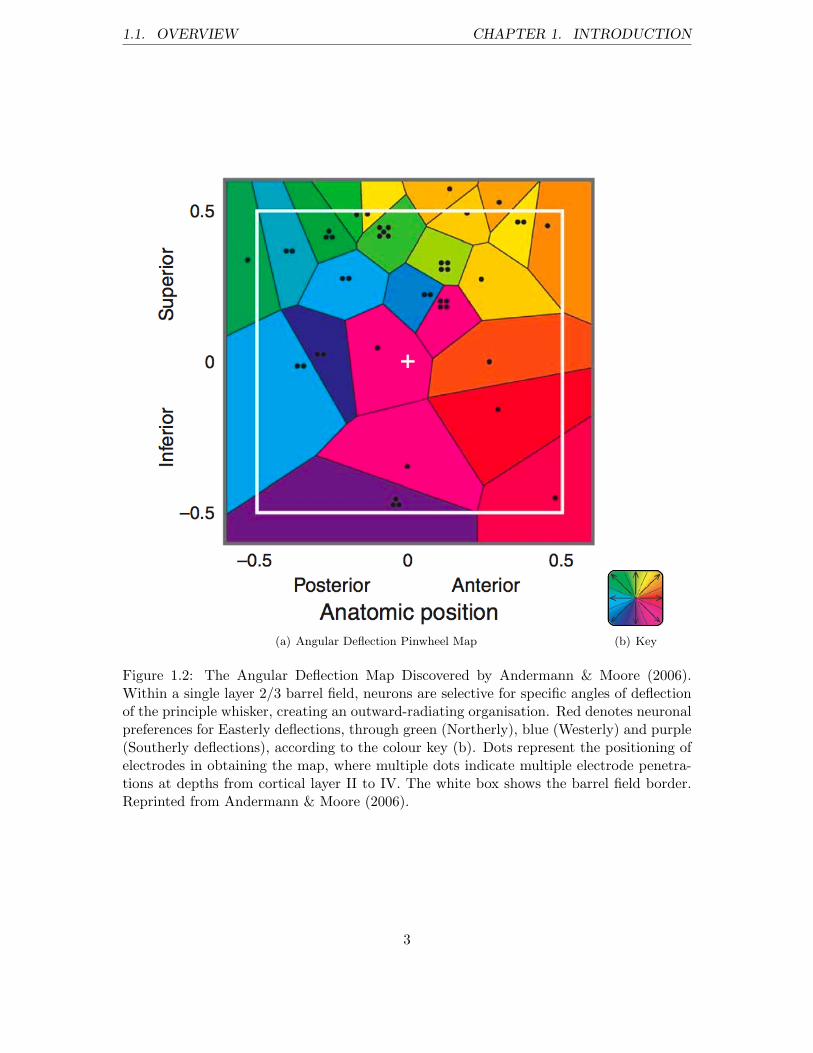
by Andermann & Moore (2006), an intra barrel-field mapping of angular deflection of theprincipal whisker has been discovered to lie coextensive with the global somatotopic map ofthe whiskerpad (see figure 4.1). They found that deflecting the principal whisker upwardsfor example, is manifested in activity in the Northerly-most cells in the corresponding layer2/3 barrel field. The angular deflection map is arranged in an outward-radiating pinwheelorganisation, such that deflection of the principal whisker towards a secondary whisker onthe snout mediates activity in cells of the principal barrel field that are aligned with thesecondary barrel.
This organisation supports a correlated model of barrel cortex development whereby Heb-bian learning mechanisms might serve to capture correlated whisker activity, i.e. as inducedby similar angular deflections of neighbouring whiskers during development. This projectwill investigate whether a neural network trained under such a regime can give rise toa similar pinwheel mapping. Hence it aims to contribute to a more fundamental ques-tion in developmental neuroscience; to what extent is self-organisation a general-purpose,across-species hypothesis for cortical development?
2
1.1. OVERVIEW CHAPTER 1. INTRODUCTION
(a) Angular Deflection Pinwheel Map (b) Key
Figure 1.2: The Angular Deflection Map Discovered by Andermann & Moore (2006).Within a single layer 2/3 barrel field, neurons are selective for specific angles of deflectionof the principle whisker, creating an outward-radiating organisation. Red denotes neuronalpreferences for Easterly deflections, through green (Northerly), blue (Westerly) and purple(Southerly deflections), according to the colour key (b). Dots represent the positioning ofelectrodes in obtaining the map, where multiple dots indicate multiple electrode penetra-tions at depths from cortical layer II to IV. The white box shows the barrel field border.Reprinted from Andermann & Moore (2006).
3

1.1. OVERVIEW CHAPTER 1. INTRODUCTION
1.1.2 Self-Organisation
In its essence Hebbian learning postulates that ‘cells that fire together wire together’ (afterHebb, 1949). More specifically, two neurons whose activity is highly correlated will developa strong association such that stimulation of one will facilitate activity in the other andvice versa. Such an association is likely achieved through the strengthening and additionof synaptic connections. Networks of artificial neurons that are inter-connected with ar-tificial synapses, can be used to model learning in real neural networks. Operating undera Hebbian learning regime, artificial neural networks can give rise to complex behaviour.Over the course of training they can develop collective properties which parallel those ob-served in cortical networks. One such emergent phenomenon is self-organisation, wherebya low (often two) -dimensional sheet of neural elements presented with examples of someinput space, can distribute the representation of that space across two dimensions. Thisis achieved by assigning neighbouring neurons to neighbouring features. In this way self-organising networks can map a high-dimensional space to a low-dimensional space, withmore principal components of the data commanding more global topographic properties.
Self-organisation therefore represents an hypothesis for the development of sensory cortex:Cortical space is distributed according to a feudal system, with the most strongly corre-lated dimensions of the input space dominating (see Elman et al., 1996). This hypothesis isattractive for a number of reasons. Firstly, it relieves the necessity for a ‘genetic blueprint’to explicitly code for cortical specialisation, instead allowing the environment to guide de-velopment. Secondly, it can explain experimental observations whereby deprivation andover-representation of sensory features leads to under and over-representations of those fea-tures in cortical maps, i.e. by affecting the statistical properties of the input space. Thirdlyit can explain how transplanted cortical regions can adopt properties of their locations inareas encoding a different sensory modality. Similarly it can explain how cortical targets,re-wired to receive thalamic inputs that are driven by an alternative sensory system, canbecome selective for the new afferents (Sharma et al., 2000). Moreover it can explain howvarious discontinuities can arise in somatosensory maps (Kaas et al, 1981; Stafford & Wil-son, 2007). These observations support a view of early cortex as equipotential functionalmachinery, upon which is superimposed specific function in an activity-dependent learningprocess.
To summarise, large networks of simple computational elements interacting under a Heb-bian learning regime can organise themselves topographically to capture the statistics ofthe environment. In the context of cortical development, self-organisation can be thoughtof as the process whereby ‘environmental features that fire together wire together’. Thethesis underpinning this investigation is that self-organisation in the whisker-barrel systemcould give to rise to the mapping of angular deflection selectivity, observed in the barrel
4

1.2. HYPOTHESES CHAPTER 1. INTRODUCTION
cortex, given coincident firing of neighbouring whiskers and correlated angular deflections.To put it crudely, ‘whiskers that fire together might wire together’.
1.2 Hypotheses
There is one major hypothesis underpinning this investigation, which is that stated in thetitle of this report:
‘Self-organisation can explain the mapping of angular whisker deflections inthe barrel cortex.’
This main hypothesis can be deconstructed into several component hypotheses:
1. A network trained on exemplar inputs from an array of model whiskers can, undera Hebbian learning regime, develop artificial neurons which are selective for inputsassociated with a single whisker.
2. Such a network, trained on exemplars of directed deflections of model whiskers, canself-organise a sheet of cortical units to be selective for specific angular deflections ofthose whiskers.
3. The network will organise, or at least maintain organisation of, a gross somatotopy-preserving mapping of model whiskers with respect to their spatial locations on thewhiskerpad.
4. Given an isotropic encoding of angular deflection in the input space, the networkwill organise to capture the topography of the angular deflection input dimension,mapping adjacent angular deflections to adjacent cortical space.
5. The combination of hypotheses 2 and 3 will result in a global somatotopic whiskerpadmapping and a coextensive pinwheel mapping of angular whisker deflection, like thatdiscovered by Andermann & Moore (2006) in the rat barrel cortex.
1.3 Objectives
To investigate the main and component hypotheses, this project will be driven by five mainobjectives:
5

1.4. REPORT SUMMARY CHAPTER 1. INTRODUCTION
1. The first will be to simulate the process by which the rat’s whisker-mediated experi-ence with the environment is represented in patterns of neural firing in the primaryafferents.
2. The second will be to design an appropriate representation of the neural architecturethat supports processing of the afferent inputs, within a framework that implementsthe self-organising hypothesis. Due to the novelty of the project aims, fulfillment ofobjectives 1 & 2 will necessarily be achieved by way of a highly simplified representa-tion of the rat lemniscal system (see chapter 2 for details of this system). Hence anysuccess in this endeavour will lay the foundations for development of a more com-prehensive model in the near future. Development of this model will be guided byan established model (LISSOM, see the following chapter) which has enjoyed muchsuccess in research with V1 cortical maps.
3. The third will be to investigate the hypothesis that an appropriately constrainedself-organising neural network model can give rise to the outward-radiating pinwheelmapping of angular deflection selectivity, as discovered in the rat barrel cortex. Themodel will first be trained using inputs that represent correlated angles of whiskerdeflections, with the expectation that such a regime best captures the experience ofthe real animal, and is therefore most likely to support the pinwheel mappings.
4. If the main hypothesis is confirmed, the fourth objective will be to design and conducta series of experiments with the model, so that it might make predictions of the realsystem. Thus it is hoped that the self-organising hypothesis represented by thesystem can be re-formulated as a falsifiable one.
5. Subject to time-constraints, the final objective will be to work towards improving themethods adopted for the first two objectives, working towards a more sophisticatedrepresentation of the neural system, to support tactile information processing.
However, if the model fails to provide a reasonable account of the organisation of angulardeflection selectivity in the barrel cortex, it will be critically analysed, redesigned accord-ingly, and if appropriate will be used to investigate why self-organisation cannot explainbarrel cortex maps.
1.4 Report Summary
The rest of this report will be organised as follows:
6
1.4. REPORT SUMMARY CHAPTER 1. INTRODUCTION
1.4.1 Chapter 2: Background
Chapter two will present the empirical literature that is being used to guide this investiga-tion and to constrain the model. The primary neural pathway by which information fromthe whiskers of the post-natal rat arises at the barrel cortex will be detailed.
1.4.2 Chapter 3: Model Development
Chapter three outlines the development of the Whisker-LISSOM model of the barrel cortex.‘Images’ are constructed to represent whisker-mediated firing rates in the afferent projectionto the cortex. Reflecting the topographic properties of the lemniscal system, input patternsmake explicit the somatotopy of the whiskerpad but make implicit the angular deflectiontopology. The network component is essentially the reduced LISSOM model (Miikkulainenet al., 2005), with appropriately constrained cortical unit receptive fields and connections.Network learning is achieved through the adaptation of afferent and lateral connectionweights, governed by Hebbian learning principles.
1.4.3 Chapter 4: Results
Chapter four presents the results of training the network. The main finding is that themodel does indeed self-organise to represent the angular deflection of the whiskers in anoutward-radiating pinwheel structure, whilst preserving the somatotopy of the whiskerpad.The organisation of the network confirms that self-organisation can explain how the angu-lar deflection mapping found in the real system might emerge under a Hebbian learningregime. The degree of correlation between the deflections of the whiskers is manipulatedin three experimental paradigms that afford novel predictions, which should be validatedwith experiments in the real system.
1.4.4 Chapter 5: A Spatial-Temporal Model
Chapter five describes the implementation and results of a more sophisticated trainingparadigm. The new model is an augmented version of that presented in chapters 2 and 3,and supports input patterns which can be defined both spatially and temporally. Resultsobtained with the new model are less conclusive, but afford a viable proof-of-concept.
1.4.5 Chapter 6: W-LISSOMBot
Chapter six presents W-LISSOMBot, a virtual reality simulation that will in future worksupport a much more flexible input pattern generator. An existing robot rat model is
7

1.4. REPORT SUMMARY CHAPTER 1. INTRODUCTION
further developed in a physics simulation environment to support a more realistic meansof generating whisker deflection data. The simulation provides a platform for rigoroustesting of the role of the environment in cortical map development, and will support futureintegration of W-LISSOM with existing systems-level models of neural function.
1.4.6 Chapter 7: Discussion
Chapter seven summarises and discusses the work documented in this report. An emphasisis placed on how this project can support some promising future research.
1.4.7 Chapter 8: Conclusion
Conclusions are drawn. The project was very successful and results support the self-organising hypothesis.
8

Chapter 2
Background
2.1 Overview
The lemniscal system of rodents encodes the angular deflection of the whiskers at each levelof processing. The whiskers are innervated by ganglion cells, each of which is tuned fordeflection of the principal whisker at a specific angle. These cells project to somatotopicallyorganised cell clusters in the brain-stem called barrelettes, which are also sensitive toangular deflection. Barrelettes project to corresponding regions of the thalamus, termedbarreloids, which in turn project to the barrel fields in cortical layer 4.
2.2 The Whiskers
The vibrissae (whiskers) are embedded in the whiskerpad, in a highly conserved grid-likemosaic on both sides of the snout of many mammals, most notably in felines, rodents andcetaceans (sea-dwelling mammals such as the seal). In rodents, the focus of this report, themystacial vibrissae provide the primary source of sensory information. Rats and mice relyon the somatosensory modality in a similar way to how other mammals rely on their visualsystems, for locating and discriminating objects in their surroundings (Carvell & Simons,1990). The precision of tactile information afforded to the animal by the trigeminal system(from whiskers to somatosensory cortex) is at least equivalent to that of the hands andfingertips for primates (Simons, 1995).
The vibrissae are hair-like, regularly-structured deposits of keratin which taper and curvetoward the tip (from Pearson et al., 2005). Whisker size varies as a function of positionon the whiskerpad such that larger, longer whiskers are situated progressively further fromthe animal’s nose. Traversing the rostral-caudal axis (from front to back), whisker length
9

2.2. THE WHISKERS CHAPTER 2. BACKGROUND
increases exponentially and the density and stiffness of the tip decreases. Whiskers protrudefrom the snout perpendicular to this axis (based on the observations of Brecht, Preilowski& Merzenich, 1997).
Whisker size also underpins two classes of processing in the behaving rat. The largewhiskers (the macro-vibrissae) are involved in detecting gross properties of the environ-ment such as the presence, location, and orientation of objects, whereas the small whiskers(micro-vibrissae) are used for making fine scale discriminations, e.g. for identifying tex-tures. A third class of ‘straddlers’, present only in rats and mice, consists of four vibrissaesituated behind the rest on the snout, whose orientations and location on the whiskerpadare not as regular as the others.
Of these classes, properties and topography of the neurons associated with the macro-vibrissae have been most rigorously characterised. Thus in a modelling effort grounded inthe biological data, it follows that the macro-vibrissae provide the principal focus. Accord-ingly, subsequent use of the word “whisker” will be used to refer only to the approximately30 macro-vibrissae (on each side of the snout). Unless explicitly stated, further discussionof the micro-vibrissae and straddlers is omitted. Furthermore, for clarity this review willconsider the rat as the model organism, although it should be noted that in many casesrelevant data is obtained from mice and other species. Where data do not directly mapfrom these species to the rat, the species from which they originate will be stated.
2.2.1 Whisking
The whiskers are not stationary in the behaving rat. Instead, the animal actively pro-tracts and retracts (whisks) the vibrissae of each pad in unison. A useful analogy is thatthe whiskers are to the rat as a blind man’s stick is to him, and whisking is conductedin a motion analogous to the sweeping action of the stick in exploration. The whisker isable to move fully in three-dimensional space. However, during active whisking the vib-rissae primarily occupy a one-dimensional arc, pivoted at the whiskerpad, and orientedperpendicular to the rostral-caudal axis.
Whisking is controlled by the facial nerve (see figure 2.1), which innervates two mus-cle classes, intrinsic and extrinsic to the whiskerpad. They are responsible for whiskerprotraction and retraction respectively. Interactions between the phases of intrinsic andextrinsic muscle contraction govern the trajectory of the whiskers in space. Numerouswhisking profiles have been identified, selection of which is ultimately controlled by thesuperior colliculus acting as a ‘whisking pattern generator’ (Gao et al, 2001). However,two broad categories are generally recognised based on the frequency of protractions undervarious behavioural paradigms: ‘exploratory whisking’ at 5-15Hz, and ‘foveal whisking’ at
10
2.2. THE WHISKERS CHAPTER 2. BACKGROUND
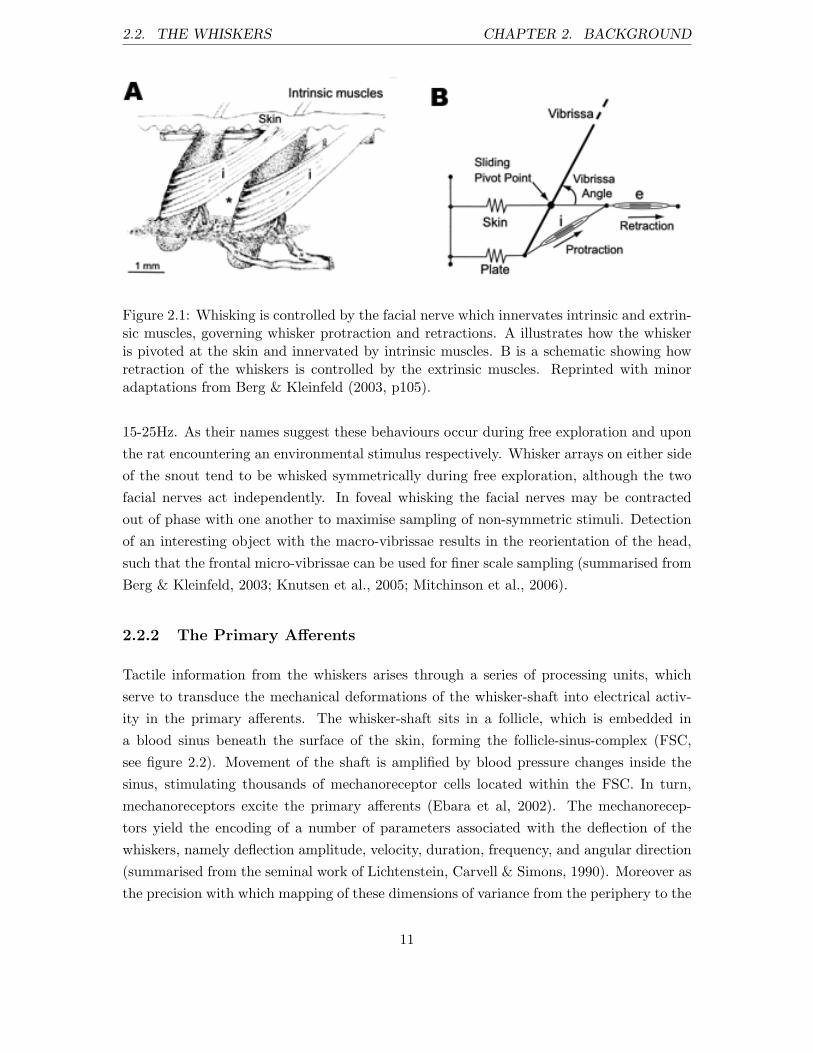
Figure 2.1: Whisking is controlled by the facial nerve which innervates intrinsic and extrin-sic muscles, governing whisker protraction and retractions. A illustrates how the whiskeris pivoted at the skin and innervated by intrinsic muscles. B is a schematic showing howretraction of the whiskers is controlled by the extrinsic muscles. Reprinted with minoradaptations from Berg & Kleinfeld (2003, p105).
15-25Hz. As their names suggest these behaviours occur during free exploration and uponthe rat encountering an environmental stimulus respectively. Whisker arrays on either sideof the snout tend to be whisked symmetrically during free exploration, although the twofacial nerves act independently. In foveal whisking the facial nerves may be contractedout of phase with one another to maximise sampling of non-symmetric stimuli. Detectionof an interesting object with the macro-vibrissae results in the reorientation of the head,such that the frontal micro-vibrissae can be used for finer scale sampling (summarised fromBerg & Kleinfeld, 2003; Knutsen et al., 2005; Mitchinson et al., 2006).
2.2.2 The Primary Afferents
Tactile information from the whiskers arises through a series of processing units, whichserve to transduce the mechanical deformations of the whisker-shaft into electrical activ-ity in the primary afferents. The whisker-shaft sits in a follicle, which is embedded ina blood sinus beneath the surface of the skin, forming the follicle-sinus-complex (FSC,see figure 2.2). Movement of the shaft is amplified by blood pressure changes inside thesinus, stimulating thousands of mechanoreceptor cells located within the FSC. In turn,mechanoreceptors excite the primary afferents (Ebara et al, 2002). The mechanorecep-tors yield the encoding of a number of parameters associated with the deflection of thewhiskers, namely deflection amplitude, velocity, duration, frequency, and angular direction(summarised from the seminal work of Lichtenstein, Carvell & Simons, 1990). Moreover asthe precision with which mapping of these dimensions of variance from the periphery to the
11

2.2. THE WHISKERS CHAPTER 2. BACKGROUND
Figure 2.2: Systems-Level Decomposition of the Follicle-Sinus-Complex, as implementedin the FSC model of Mitchinson et al. (2004). (a) Simplified FSC anatomy, (b) effect ofdeflection and (c) exploded FSC mechanical model. Ellipses indicate regions of coupling be-tween modelled components and unmodelled components. Illustration and supplementarytext from Mitchinson et al. (2004, p2510).
primary afferents is becoming better understood, speculation is increasing as to how muchinformation is made available to the rat through its whiskers. For example the whiskersmay play a role in vibration detection detailed enough to supplement processing in boththe auditory and olfactory sensory systems (Szwed & Ahissar, 2006).
The next stage of information processing in the rat somatosensory system takes place inthe trigeminal ganglion. These cells innervate the mechanoreceptors of a single FSC andproject myleinated axons to the principal sensory nucleus of the trigeminal brain-stemcomplex. Between 150 and 400 neurons with cell bodies in the trigeminal ganglion receiveexcitatory inputs from thousands of associated mechanoreceptors (Pali et al., 2000). Theafferent projection is strictly feed-forward (Lichtenstein, Carvell & Simons, 1990).
The trigeminal ganglion cells can be classified as either rapidly adapting (RA) or slowlyadapting (SA) types, according to their rate of adaptation to whisker inputs. RA cellsspike rapidly as soon as the whiskers are stimulated, with a large sharp peak of activitythat quickly diminishes. They fire again with a significant, yet lower frequency firing rateupon disengagement of the whiskers from the stimulus. SA cells fire with a greater latency
12

2.2. THE WHISKERS CHAPTER 2. BACKGROUND
Figure 2.3: The Rapidly Adapting ON (red line) and OFF (yellow line), and Slowly Adapt-ing (purple) spiking profile of rat trigeminal ganglion cells after onset of a whisker deflectionat 0ms. From Szwed et al. (2003, p623).
but maintain firing for the duration of whisker-stimulus contact (figure 2.3).
Thus it is generally agreed that the RA profile encodes changes in the stimulus, suchas engagement and disengagement of the whiskers with an object, whereas SA responsesencode continuous information about a stimulus (most notably deflection angle), as mightbe used for discriminating textures (Carvell & Simons, 1990). Both groups encode thedeflection velocity of a stimulus as a consequence of different cells having different spikingthresholds (Shoykhet, Doherty & Simons, 2000).
RA and SA profiles can be mapped to behavioural data. Stuttgen, Ruter & Schwarz (2006)showed that latency in the onset of rats’ operantly conditioned response to high-amplitudeand low-amplitude whisker stimulations maps almost perfectly to the latency of RA andSA cell spikings, respectively. This match suggests that the rat will perform a conditionedresponse to salient input as RA cells fire, and will perform a second response to lessersalient inputs only when SA cells are firing.
Traditionally the properties of the primary afferents have been measured under a passivescheme, by deflecting whiskers whilst making extra-cellular recordings. However ‘artificialwhisking’, whereby the muscles of the snout are electrically stimulated at the frequencyof exploratory whisking, allows precise recordings from an anaesthetised animal during amore naturalistic whisking pattern (after Zucker & Welker, 1969). Using this technique,Szwed, Bagdasarian & Ahissar (2003) made extra-cellular recordings from 80 neurons inthe trigeminal ganglion during artificial whisking. Their results confirmed the passivedeflection data described. However the authors’ most striking discovery was that manytrigeminal cells are involved in the precise encoding of whisker position on the rostral-caudal whisking arc. Cells begin to spike at individual temporal phases relative to theonset of whisker protraction. Thus the location of the whiskers in space is quite precisely
13

2.2. THE WHISKERS CHAPTER 2. BACKGROUND
mapped.
Furthermore, almost all trigeminal ganglion cells display a significant selectivity for whiskerdeflections of a particular angle. Lichtenstein, Carvell & Simons (1990) provide compre-hensive data on trigeminal neuron properties, in response to angular deflections of thewhiskers. They recorded from 123 cells, all of which had a single-whisker receptive field,with all but ten responding to the macro-vibrissae. Invoked by 80 randomly distributed,well controlled ramp-and-hold whisker deflections in eight cardinal angles, each cell consis-tently fired maximally for deflections in a specific range of cardinal angles. Each ganglioncell can therefore be described as having a ‘maximally effective angle’ (MEA). Each aredirectionally consistent such that an individual cell’s MEA is not dependent on the pre-deflection orientation of the whisker in space. The distribution of MEAs is approximatelyuniform amongst the SA population, however the dorsal angles in RA cells were repre-sented disproportionately. Also, the authors found no relationship between the location ofa whisker on the whiskerpad, and the distribution of maximally effective angles amongstits associated ganglion.
In the most comprehensive mapping of the primary afferents to date, Leiser & Moxon(2006) found that the two cell types are evenly dispersed amongst the whiskers. Eachwhisker invokes a constant ratio (˜60%:40%, RA:SA) which does not differ significantly asa function of rostral-caudal position on the whiskerpad, or consequently of the whiskers’size. However with the increasing size of the more caudal whiskers comes a larger folliclesize and a subsequently greater number of mechanoreceptors, trigeminal ganglion cells, andafferent axons. Unfortunately, Leiser & Moxon (2006) did not map the trigeminal ganglionin terms of their angular deflection preferences, and such a study has not been conductedelsewhere. Therefore the model must not assume that such a topographic mapping exists(see chapter 3 for the significance of this for constructing model input patterns).
It should be noted that RA and SA spiking profiles are not mutually exclusive, as ap-proximately two out of five trigeminal ganglion cells display both RA and SA responses.The spiking characteristics of these dynamic cells varies as a function of deflection angle,i.e. whiskers deflected in one direction induce an RA response, yet deflection in a differentdirection invokes an SA response (Jones et al, 2004). However, the model brain-stem neu-rons will be innervated only by static RA and SA types. Investigations into the functionalsignificance of the dynamic cell type is left for future work.
14

2.3. THE WHISKER-BARREL PATHWAY CHAPTER 2. BACKGROUND
2.3 The Whisker-Barrel Pathway
2.3.1 Barrelettes
The primary afferents synapse in distinctive circular segregations in the primary sensorynuclei of the brain-stem. The two-dimensional organisation of these regions reproducesthat of the whiskers on the whiskerpad, forming fields that are commonly referred to as‘barrelettes’ (after Ma & Woolsey, 1984).
According to Erzurumlu, Chen & Jacquin (2006), barrelette patterns in the trigeminalnerve are a ‘template’ for similar patterns in subsequent thalamus and primary somatosen-sory cortex. Indeed, a prominent theory in the developmental literature, ‘domino theory’(after Killackey, 1980), postulates that the formation of these patterns is a serial process,in which somatotopic maps develop sequentially along the neuraxis, from periphery to cor-tex. This hypothesis has received support from recent methodological advances (Ohsaki& Nakamura, 2006). The dominance of somatotopy throughout the lemniscal pathway af-fords a viable constraint for the model and hence the lemniscal system will be the subjectof this investigation.
It should be noted, however, that the whisker-cortex pathway diverges at the brain-stem,by way of a secondary architecture. In this, the paralemniscal system, projections fromperiphery to thalamus are mediated by interpolaris neurons rather than those of the prin-cipal sensory nucleus. A striking property of interpolaris neurons, of particular relevancein the context of this project, is an almost exclusive preference for dorsal deflections oftheir respective whiskers (Furuta et al., 2006). The paralemniscal system however hasbeen comparatively understudied, and its functional significance is at present unclear. Onesuggestion is that the lemniscal system processes spatial information, whilst the paralem-niscal system processes temporal information (Ahissar et al., 2000). While it is beyond thescope of this project to model the dual pathways of the system, any successes in simulat-ing the spatial, lemniscal pathway will provide a framework for elucidating the role of theparalemniscal pathway in future work.
As is the case with the trigeminal ganglion, there has to date been no documented testof a relationship between the maximally effective angle of the brain-stem nuclei, and theirtopographic locations within the barrelette. It may prove to be the case that such amapping is already inherent in the afferent projection, but this can not be assumed in themodel. Hence, the spatial distribution of the model barrelette neurons will be uniformlyrandom with respect to each cell’s maximally effective angle.
Approximately two thirds of the principal nuclei receive input exclusively from trigeminalganglion cells responding to a single, principal whisker. In turn there is a strict corre-
15
2.3. THE WHISKER-BARREL PATHWAY CHAPTER 2. BACKGROUND
spondence between cells with a single-whisker receptive field in the barrelette, and theiraxonal projections to the associated barreloid in the ventral posteromedial nucleus of thethalamus (VPM, see the following section). The remaining cells have multi-whisker recep-tive fields which project to secondary sub-cortical areas, such as the thalamic posteriorgroup (Veinante & Deschenes, 1999). These latter structures are not part of the lemniscalpathway. Hence it is the one-to-one projection from a single whisker, through a singlebarrelette, to a single thalamic barreloid that will be reproduced in initial simulations.
2.3.2 Barreloids
Barrelette cell clusters are mirrored in similar structures in the thalamus, with spinaltrigeminal neurons (the lemniscal system) projecting to the posterior-medial (POM) tha-lamic nucleus, and the paralemniscal projection to the ventral-posterial-medial (VPM)thalamic nucleus. In turn, the thalamus projects to layer 4 of the barrel cortex and it isthought that this projection plays a key role in temporal processing of whisker deflections,by tuning the afferent input in response to cortical feedback.
The temporal rather than spatial properties of the thalamo-cortical projection have beenstudied in detail, although a clear picture of either system’s role in whisker processingis lacking. Brecht & Sakmann (2002), for example, classified two populations of bar-reloid neurons according to their temporal response properties: Single-whisker-excitationcells respond to whisker deflections with precisely timed action potentials, whereas multi-whisker-excitation cells respond less precisely for stimulation of the principal whisker, andto an extent also respond to stimulation of the immediate whiskerpad neighbours. HenceVPM neurons behave similarly to RA and SA ganglion cells, but have multi-whisker re-ceptive fields. Kwegyir-Afful et al. (2005) showed by lesioning the interpolaris projectionthat multi-whisker receptive fields emerge at the thalamic level, and Minnery et al. (2003)show that only a relatively small number of interpolaris neurons are required to mediatethese thalamic receptive fields. Temereanca & Simons (2004) show that cortico-thalamicfeedback sharpens receptive field properties of VPM neurons. They suggest that the so-matosensory cortex can engage topographically specific excitatory and inhibitory mech-anisms in the thalamus to selectively regulate its response. Bruno et al. (2003) foundthat neurons projecting from VPM to layer 4 barrel cortex have similarly aligned angulardeflection preferences, suggesting a role of thalamus in directing processing of inputs tothe cortex.
POM neurons appear to have more broadly tuned multi-whisker receptive-fields (see Pe-tersen, 2003) that could play a role in self-organisation. However, ascertaining the role ofthe thalamus in processing whisker deflections is currently an active and open research area
16

2.3. THE WHISKER-BARREL PATHWAY CHAPTER 2. BACKGROUND
Figure 2.4: Anatomical Reconstructions of the Axonal and Dendritic Projections throughRodent Barrel Columns. A: All the structures superimposed, B: The different projectionsdecomposed. Colours show: (red) the dendrites of layer 2/3 pyramidal cells and their axons(blue), and layer 4 excitatory neuronal dendrites (black) and axons (green). From Petersen(2003, p131).
and one that will be examined only briefly in this project (although see the discussion fora more comprehensive consideration of this issue for future work). It is certainly unclearhow the temporal thalamic channels and multi-whisker receptive fields would transformthe feed-forward cortical projection with regards to the self-organisation hypothesis, sincemost research has been focused on cortico-thalamic feedback projections. As a first passat modelling this complex system, it is reasonable to adopt a null hypothesis, modellingthe thalamus only implicitly, i.e. as a passive relay station.
2.3.3 Barrels
Afferent projections to the barrel cortex and lateral connectivity are depicted in figure 2.4.When a whisker is stimulated a rapid response can be recorded from layer 4 barrel neurons.Milliseconds afterwards, excitation propagates into layer 2/3, bounded by the cortical barrelcolumn defined in layer 4. After a few tens of milliseconds, excitation spreads laterally andis no longer bound to a single barrel column (summarised from Petersen, 2003; see section7.2.2 for an explanation of why this spread is not isotropic).
As discussed in section 1.1.1, the inspiration for this project comes from the recent discoveryof an angular deflection map of motion direction found within a barrel column (Andermann& Moore, 2006). In this study, a multi-electrode array was used to record from regular-spiking neurons at several laminae depths and across the barrel column, whilst a highlycontrolled whisker stimulator was used to deflect the whiskers. Local regions of the barrelfield elicited a greater response for a specific angular deflection, in such a way as to form anoutward-radiating pinwheel mapping of angular deflection selectivity, which is presumably
17

2.4. LISSOM CHAPTER 2. BACKGROUND
complemented by similar mappings for the other whiskers. Andermann & Moore (2006)suggest that
“When a vibrissae is deflected in a given direction, it moves into the spatial,somatotopic region represented by a neighbouring vibrissae. Consistent syn-chrony of the neural activity evoked by these two inputs as they sample similaror identical regions of space could, under a Hebbian mechanism, lead to thebinding of these features. [...] The current findings provide specific support forthe hypothesis that when vibrissae are deflected toward each other, they occupycommon sensory space and generate synchronous firing in regions where theirspatial receptive fields overlap. In turn Hebbian correlation mechanisms could‘wire’ regions of somatotopic overlap to predictive direction tuning” (p543 andp549).
2.4 LISSOM
Various computational models have been used to investigate how ‘Hebbian correlationmechanisms’ might lead to such a ‘binding of input features’ in cortical space, however mostof which focus on the visual system. The LISSOM (Laterally Interconnected SynergeticallySelf-Organising Map) family of network models has rigorously and successfully applied self-organisational principles to a range of visual system phenomena (Sirosh, Miikkulainen &Bednar, 1996; Bednar & Miikkulainen, 2003; Miikkulainen et al, 2005). LISSOM operatesin line with a general thesis that cortex organises to represent correlations in the sensoryinputs. Accordingly, LISSOM should enjoy equal success in modelling the developmentof topographic maps in cortical areas that process non-visual sensory modalities, and theangular deflection mapping represents one such problem that should prove tractable.
The basic LISSOM visual-system model consists of a hierarchy of neuronal ‘sheets’, roughlycorresponding to the retina at the input level, ON and OFF thalamic cell channels (in lat-eral geniculate nucleus LGN of the thalamus) at the intermediate layer, and V1 at thecortical layer. Sheets are a two-dimensional arrangement of processing units, akin to cor-tical columns in V1. LGN units in both channels receive a difference-of-Gaussians patternof weighted connections to neighbouring units, as a sum of LGN ON and OFF weightedactivity. Cortical units project lateral excitatory connections to their neighbouring unitsin cortical space, and inhibit more distal neighbours. On presentation of inputs (activitypatterns in the retinal sheet), afferent and lateral-cortical weights are updated accordingto a Hebbian learning rule (see the following chapter for details). Networks are trained
18

2.4. LISSOM CHAPTER 2. BACKGROUND
Figure 2.5: General LISSOM Architecture for Visual System Models. An input sheetof neural elements, corresponding to retinal photoreceptors, receive patterns of activityequivalent to a visual image. Intermediate layers correspond to separate channels of thelateral geniculate nucleus (LGN) of the thalamus. Activity propagates through these layersto the cortical units (representing V1 and higher cortical areas) via localized, retinotopicconnections.
over many pattern presentations and connections are pruned if they are sufficiently inac-tive. The result is networks whose weights self-organise to support a variety of topographicmappings that share many characteristics with those in V1. One such characteristic is pin-wheel mappings of orientation selectivity (Sengpiel & Bonhoeffer, 2002; Godde et al., 2002).Whilst its architecture was designed as an explicit representation of the major structuresof the primary visual processing pathway, the principles of Hebbian learning and lateralinter-connectivity are not domain specific.
A number of parallels can be drawn between the architecture of the rat primary somatosen-sory system and the visual system (see figure 2.6, and for a comprehensive comparison seeFox & Wong, 2005). Therefore the approach here will be to draw inspiration where ap-propriate from LISSOM’s account of visual system development. Research using LISSOMis supported by the Topogaphica (topographica.org) neural map simulator project, whichwill be used throughout this work.
19

2.4. LISSOM CHAPTER 2. BACKGROUND
Figure 2.6: Comparing the Visual and Whisker Systems. Neuroanatomical similarities inthe projection to the primary cortex in both systems justify the approach here to ‘borrow’from LISSOM as a model primarily of the visual system. Reprinted from Fox & Wong(2005).
20
2.5. SUMMARY CHAPTER 2. BACKGROUND
2.5 Summary
In the lemniscal system, mechanoreceptor cells innervate the base of the whiskers and,when stimulated by a movement of the whisker, support the encoding of the strain andangle at which it is deflected in the activity of a population of trigeminal ganglion cells.Ganglion cells project axons to clusters of neurons in the brain-stem which themselvesform a highly ordered mapping of the whiskerpad. This somatotopic mapping is conservedalong the neuraxis in similarly organised regions of the thalamus and layer 4 barrel cortex.Topography of angular deflection, however, is not known to be organised in the afferentprojection, although some such mapping might be manifest in thalamic regions. In layer2/3 barrel cortex, angular deflection selectivity for each whisker is mapped in an outward-radiating pinwheel organisation from the barrel column centre. This project will makeuse of the successes of LISSOM in the visual domain, to investigate the potential for aself-organising barrel cortex.
21

Chapter 3
Whisker-LISSOM
This chapter documents the design of a self-organising computational model, used to in-vestigate the role of afferent activity in the maturation of barrel neocortex (layer 2/3). Thetask of modelling the whisker-barrel pathway can be deconstructed into four sub-problems.These are:
1. Capturing the statistics of whisker-environment interactions, to represent the sensoryexperience of the rat during post-natal development.
2. Approximating the encoding of a whisker deflection by the primary afferents.
3. Reconstructing the activity of the primary afferents into an input pattern, to capturethe topographic characteristics of the projection from whiskers to cortex.
4. Devising a suitable receptive field and neuronal inter-connectivity regime.
The following section gives an overview of the system designed to investigate the hypothesisthat self-organisation can give rise to the angular deflection mapping discovered by Ander-mann & Moore (2006). This is followed by an account of how each of the four sub-problemswas addressed in constructing Whisker-LISSOM.
3.1 Model Overview
To summarise the basic model architecture, the W-LISSOM model consists of two layers:An input sheet representing the activity of brain-stem barrelette cells, and a cortical sheetrepresenting barrel neocortex. Deflection of nine model whiskers is represented as ninespatial vectors, whose distance and direction from the origin correspond to the strain
22

3.2. GENERATING INPUT PATTERNS CHAPTER 3. WHISKER-LISSOM
and angle at which each whisker is stimulated. Afferent activity resulting from a whiskerdeflection is represented as firing rates in a network of ganglion cells (one network perwhisker). Each artificial ganglion cell is assigned a maximally effective angle (MEA) ofwhisker deflection, represented here by a spatial vector from the origin, each with constantunit length. The firing rate of each ganglion cell is computed as a half-wave rectified dot-product between its MEA and the principal-whisker deflection vector. The firing rate ofeach ganglion cell associated with each of nine whiskers is mapped to the input sheet sothat the somatotopic arrangement of the whiskers on the whiskerpad is made explicit, butangular deflection is not (see figure 3.2). Cortical units are assigned to an individual barrelfield according to their location on the sheet, and receive input from the correspondingbarrelette region on the input sheet. The network is trained by presenting many whiskerdeflections to the input sheet, and adapting weights according to a Hebbian learning rule.
3.2 Generating Input Patterns
This section will discuss in more detail how input patterns are generated.
3.2.1 Stimulating Whiskers
For simplicity, the angular deflection of a whisker is represented as a spatial vector, orig-inating at Cartesian co-ordinates (0, 0). The length of this deflection vector correspondsto the magnitude of a whisker deflection, and the angle of the vector corresponds to theangle at which the whisker is deflected. To simulate the tactile experience of the rat medi-ated through its whiskers, the model will be trained by presenting to it many examples ofstimulation to the whiskerpad, covering the full range of possible deflection angles. Two as-sumptions are made about how the whiskerpad is normally stimulated, and the statisticalproperties of the training set reflect this. The first assumption is that when the whiskersmake contact with an environmental stimulus, the whiskers that encounter the stimulusfirst, i.e., those at the front of the whiskerpad if the contact occurs head-on, are deflectedto a greater extent than those that make contact slightly later, i.e., those located furtherfrom the stimulus on the whiskerpad. In the model, this is implemented by making thedeflection vector slightly larger for the whiskers that would, given the angle at which themodel whiskerpad is ‘swept’ over the stimulus, make contact with it first. The secondassumption is that when the whiskers contact a stimulus, they are deflected in exactly theopposite direction to the angle of incidence.
23

3.2. GENERATING INPUT PATTERNS CHAPTER 3. WHISKER-LISSOM
3.2.2 The Ganglion Ring Network
By way of a reminder, the trigeminal ganglion cells receive input from mechanoreceptorssituated around the base of the whisker. Action potentials are induced in the ganglioncells when the mechanoreceptors are stretched, as occurs when the principal whisker isdeflected. Individual ganglion cells respond maximally to a localised range of angulardeflections. Rapidly adapting ganglion cells display peaked activity in response to theonset and offset of a stimulus being applied to the whiskers.
To approximate this processing, inspiration can be drawn from the cercal system of thecricket. As described in Dayan & Abbott (2001), many insects have small extrusions ontheir hind legs. These ‘cerci’ are covered in hairs, each of which is innervated by a singleprincipal neuron, which in turn are innervated by interneurons. These interneurons respondaccording to a standard tuning curve when the hair is stimulated by an air current in aspecific direction (Theunissen & Miller, 1991, described in Dayan & Abbott 2001, ch3). Asmall population of interneurons is therefore able to map the entire input space of directedair current experienced by the cercal hairs. The profile of the tuning curves supportingthis system is well approximated by a half-wave rectified cosine function,
fa(s) = rmaxa [cos(s− sa)]+ (3.1)
Here rmax is a constant determining interneuron a’s maximum firing rate, s is the directionof the air current relative to the cercal hairs, and sa is the preferred direction of interneurona.
Following Dayan & Abbott (2001, ch3), this can be reformulated for use with a Cartesianco-ordinate system by denoting the stimulus as a spatial vector −→v , pointing parallel tothe direction of the air current and having unit length |−→v | = 1. Using this notation, thepreferred air current direction of interneuron a can be written −→ca . A dot-product of thetwo spatial vectors gives −→v �−→ca = cos(s− sa) and hence,
fa(s) = rmaxa [~v · ~ca]+ (3.2)
This description of the cricket cercal system can be adapted to model the general responseof a population of trigeminal ganglion cells, when ‘air current direction’ is substituted with‘deflection vector’. Firstly let ~v instead be the direction of a whisker-mediated stimulus,with unit length proportional to whisker strain. Secondly, a network of trigeminal ganglioncells can be defined as a ring, such that each cell is assigned a preferred spatial vector fromthe origin (a maximally effective angle (MEA)), distributed uniformly around a ring withunit length 1.
24

3.2. GENERATING INPUT PATTERNS CHAPTER 3. WHISKER-LISSOM
If each ganglion cell innervates a collection of mechanoreceptors distributed within a localregion of the whisker base, then each will be activated most strongly by a deflection ofthe whiskers oriented towards this local region of the follicle. Thus each ganglion cell ican be assigned a preferred deflection vector (−→cwi), based on the position of its associatedmechanoreceptors in the follicle-sinus complex with respect to the centre. Therefore themodel of the cricket cercal system can be directly reimplemented as a high-level model ofthe trigeminal ganglion response to whisker mediated inputs.
When presented with simulated strain inputs the ganglion ring network will respond suchthat cells whose MEA is close to that of the stimulus vector will be most strongly activated,and therefore neighbouring cells in the network will be highly correlated with one another.
As a mathematical description of the early trigeminal system, the ring network model af-fords two major practical advantages. Firstly, it is very simple and so should make analysisof resulting map structure more viable. Secondly, it is computationally inexpensive, whichshould allow it to support large-scale simulations. In meeting these two model requirementsthe ring model must necessarily make a number of assumptions.
Firstly, it assumes an isotropic distribution of the mechanoreceptors around the folliclebase, and as an extension it assumes an isotropic mapping of angular whisker deflectionin the primary afferents. Secondly it assumes that the preferred direction of a ganglioncell remains constant over time (on both short and ontogenetic scales). On both of theseconsiderations the empirical data is inconclusive, so a uniform spatial coverage of angulardeflection preference as well as constant temporal properties is appropriate.
Moreover, the model makes no dissociation between RA and SA cell types. This is jus-tifiable as to do so would be to represent an hypothesis as to the role for each type inself-organisation. It is reasoned instead that the artificial cells here are analogous with theRA trigeminal cells, thought to encode the most salient information about the experienceof the whiskers.
Schematic 3.1 (a) begs the question as to how the depressed mechanoreceptors on theopposite side of the ring to the whisker base should be modelled. For example, a non-rectified cosine function (3.1 (d)) would model the associated ganglion cells as havingnegated activity, which could be construed in real terms as the depression of activity belowsome tonic firing rate. It is reasoned here that whilst adding this complexity into thesystem is a logical next step for the model, it is unnecessary for the first implementation.The simpler half-wave rectified model does not require re-scaling (i.e. to represent tonicfiring as a positive value), and is more compatible with the self-organising platform to bepresented shortly. It is therefore considered sufficient for the present purposes, and willbe used for the simulations documented in the remainder of this report (although see the
25

3.2. GENERATING INPUT PATTERNS CHAPTER 3. WHISKER-LISSOM
(a) Schematic Ganglion Ring Network (b) Directed Strain Vector
(c) Half-Wave Rectified Ring Network Response (d) Ring Ganglion Network Model (Non-Rectified)
Figure 3.1: The Ganglion Ring Network Model. (a): Schematic interpretation of thetransduction process. When the whisker is deflected (B) from its origin (A), populationsof mechanoreceptors innervated by trigeminal ganglion cells are strained, resulting in firingrates proportional to the strain. (b): Directed whisker strains can be represented as aspatial vector from a stationary origin (dark line). 64 ganglion cells (circles) are distributeduniformly around the whisker base, in a ring of constant unit length, according to theirmaximally effective angle (MEA in radians). (c): The firing rate of each ganglion cell isapproximated by a half-wave rectified cosine function, or dot product between the stimulusvector and the MEA. (d): An alternative model, without half-wave rectification, producesnegative firing rates.
26

3.3. WHISKER-LISSOM CHAPTER 3. WHISKER-LISSOM
discussion for a return to this issue).
3.3 Whisker-LISSOM
The ganglion cell firing rates can now be used to construct training patterns for the self-organising component of the model. This section describes how the firing rates can beremapped to form an image of the whisker sweep, in line with how this might be achievedby the lemniscal system.
3.3.1 Ganglia/Barrelette Input Sheets
The LISSOM model typically takes as inputs patterns held by a two-dimensional arrayof artificial neurons, with firing rates for each unit ranging between 0 (no firing) and 1(maximal firing). This is well-suited to visual system models, whereby the input sheetcan represent firing of cells associated with the retina, and thus input patterns resemble atwo-dimensional visual image. Therefore the approach here is to construct an ‘image’ ofthe afferent inputs, based on the firing rates produced by the ganglion ring network.
As previously discussed, ganglion cells from a single whisker project axons to a single bar-relette sub-region in the brain-stem. Within a barrelette cluster there is no evidence tosuggest that the distribution of angular deflection sensitive cells is such as to topographi-cally map angles of deflection. However, the spatial arrangement of barrelette cell clustersin the brain-stem preserves the somatotopic organisation of the whiskers on the whisker-pad. This tight global somatotopy is conserved along the neuraxis until layer 4 of thebarrel cortex. These known topographic properties of the lemniscal system can be used toconstrain the model, giving rise to the following mapping scheme from the ring topologyof the ganglion network to the somatotopy of the brain-stem barrelettes.
Firstly, the input sheet can be subdivided into nine regions corresponding to the bar-relettes for each of the nine whiskers; the location of which on the input sheet preservesthe relational arrangement of the whiskers on the snout. Each barrelette region receivesprojections from the ganglion cells associated with a single whisker. Within an 8 by 8barrelette region, each of the 64 ganglion cells from a single whisker projects to a randominput sheet co-ordinate. This co-ordinate remains consistent throughout simulation suchthat each barrelette cell is assigned the same firing rate as a single ganglion cell (see fig-ure 3.2). The number 64 was chosen arbitrarily, with the constraint that it give a goodcoverage of the input space, and should be a square integer to make remapping simple.
It should be made clear that reference to the input sheet as representing barrelette cellactivity might also be construed as arbitrary. More accurately, the input sheet represents
27

3.3. WHISKER-LISSOM CHAPTER 3. WHISKER-LISSOM
Figure 3.2: Remapping the Ganglion Ring Network into a Ganglion/Barrelette Input Sheet.The 64 ganglion cells associated with each whisker are remapped to a sub-region of atwo-dimensional input sheet. The input sheet is divided into nine equal regions; one foreach whisker, with the somatotopy of the whiskerpad maintained (superimposed blue linesdenote the borders between each and do not constitute part of the training pattern). Forinstance, the upper-left 8x8 sub-matrix corresponds to whisker A1. Within a barreletteregion, ganglion cells are assigned to a random co-ordinate. This co-ordinate remainsconstant throughout model training and testing. The firing rate of each barrelette cellis exactly that of the associated ganglion cell, as calculated previously, and is shown ingrey scale ranging 0 to 1. (Note that in the present instantiation of the model, it is moreaccurate to interpret the sheet as representing the entire one-to-one feed-forward projectionfrom the afferents through nine separate barrelette-barreloid-barrel pathways).
28

3.4. SELF-ORGANISATION CHAPTER 3. WHISKER-LISSOM
simply a transformation from the explicit topography of angular deflection encoded in thering network, to the locally disordered but globally ordered re-mapping available to thebarrel neocortex. Local disorder here represents a null hypothesis as to how angular deflec-tion topography might be remapped in sub-cortical processing. Global order represents thewell established somatotopy of the one-to-one barrelette-barreloid projection, maintainedthroughout the afferent projection to the cortex. Given that firing rates are computed byanalogy with the ganglion and reshaped to a spatially organised pattern by analogy withthe barrelette cells, it is appropriate to refer to the afferent projection as one from theganglion/barrelette cells.
3.4 Self-Organisation
Each component of the model represents an hypothesis as to how the whisker-barrel systemmight ultimately support sensory perception. As a first pass at simulating this complexsystem, the guiding design principle has been to keep the extent of these hypotheses to aminimum. The most salient outcome of this approach is the lack of an hypothesis regardingthe role of the thalamus. Given the novel application of self-organisation to the whisker-barrel system, there is no consensus, a) as to how the VPM nucleus of the thalamus mightaffect self-organisation and b) whether such an effect would be critical for self-organisation.Therefore the model will assume that the thalamus is a passive relay station and it willnot be modelled explicitly. This is of course very unlikely to be the case in vivo.
The architecture therefore consists of two layers: the input layer as described in the previoussection, and the barrel cortex. Together they form the structure depicted in figure 3.3.
Self-organisation of the barrel cortex will be governed by essentially the same algorithmand equations as that of the standard, reduced LISSOM model for developing orienta-tion preference maps in V1 (Miikkulainen et al., 2005). A significant difference betweenW-LISSOM and the original model is what each cortical unit represents. In standard LIS-SOM models, the fundamental cortical unit represents a vertical micro-column throughall six cortical laminae, and hence it represents a small population of cells. This supportsLISSOM’s reduction of the cortex to a two-dimensional plane, postulating that it is at thisresolution that self-organisation operates. In the barrel cortex however, the barrel clusteritself is usually considered as a cortical micro-column. Therefore it is more appropriateto refer to the fundamental cortical unit in W-LISSOM as an individual neuron in theneocortex only. This calls for no augmentation to the mathematics; rather it is a subtlebut noteworthy distinction from the original.
29
3.4. SELF-ORGANISATION CHAPTER 3. WHISKER-LISSOM
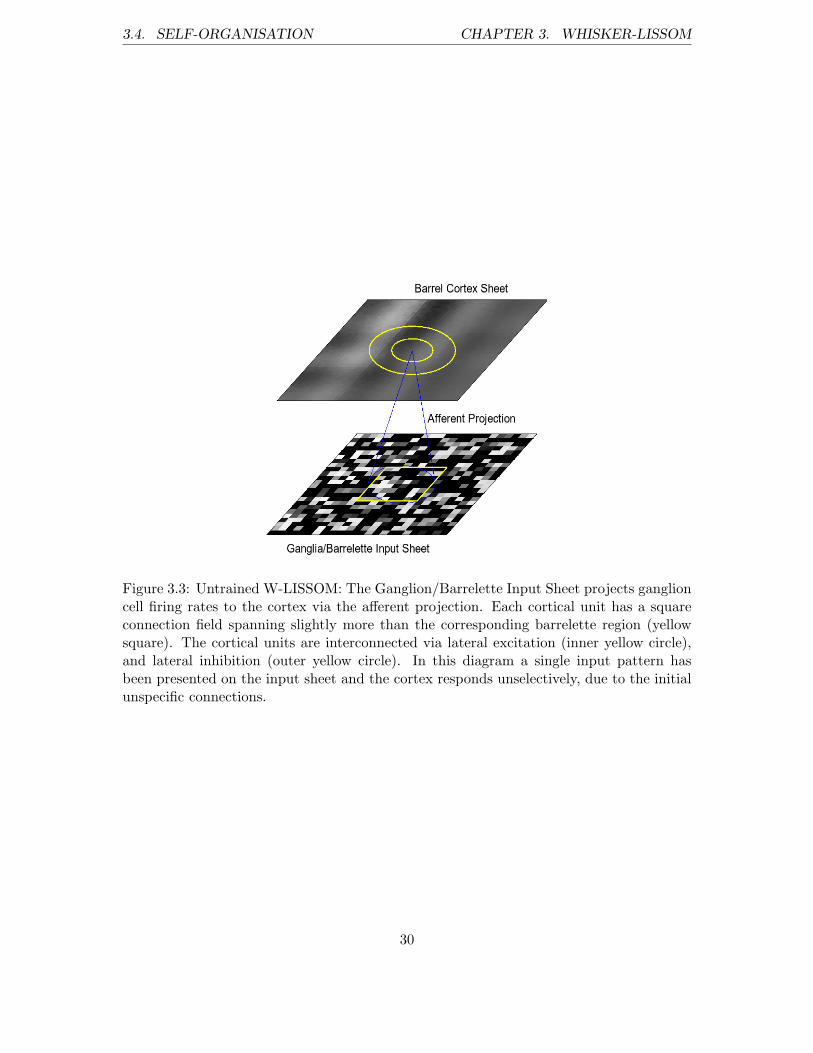
Figure 3.3: Untrained W-LISSOM: The Ganglion/Barrelette Input Sheet projects ganglioncell firing rates to the cortex via the afferent projection. Each cortical unit has a squareconnection field spanning slightly more than the corresponding barrelette region (yellowsquare). The cortical units are interconnected via lateral excitation (inner yellow circle),and lateral inhibition (outer yellow circle). In this diagram a single input pattern hasbeen presented on the input sheet and the cortex responds unselectively, due to the initialunspecific connections.
30

3.4. SELF-ORGANISATION CHAPTER 3. WHISKER-LISSOM
3.4.1 The Self-Organising Algorithm
The self-organising process, detailed in the following sections, updates weighted afferent andlateral connections according to Hebbian learning principles, in response to presentation ofmany input patterns. When each pattern is presented on the input sheet, a weighted sumof the activity in the connection field of each cortical unit conveys the afferent activations.Activity then spreads laterally as excitation to local cortical units and inhibition to moredistal units. As lateral activity propagates the network is allowed to stabilise. Afferentand lateral weights are then updated according to the same Hebbian learning rule. Aftersettling the network is presented with a new input pattern, generated in this case from arandomly directed sweep of the whiskerpad across the stimulus, and the process is iteratedmany times.
3.4.2 The Afferent Projection
Neurons in layer 2/3 barrel cortex receive excitation through axonal projections which arechanneled tightly through the layer 4 barrel column. Afferent axons terminate at this levelwith negligible lateral spreading. With respect to this, the model cortical sheet is dividedinto nine barrel subregions just like the barrelette sub-regions of the ganglion/barreletteinput sheet. The connection field onto the input sheet of all cells falling within one suchsubregion is identical, encompassing an entire barrelette, centred at the barrelette centre,with a small overlap into neighbouring barrelette regions. Cortical units that fall into thebarrel field for whisker A1 for example, each receive input from the entire A1 barreletteregion of the input sheet (see figure 3.4). In this way model cortical inputs are alsochannelled through a single barrel clustering. Given that the ganglion/barrelette sub-regions are necessarily square on the input sheet the connection fields of cortical units arecorresponding squares on the input sheet. Afferent weights are set initially to uniformrandom values.
In the reduced LISSOM model (Miikkulainen et al., 2005: i.e. the model without anythalamic component), the activity sij for a cortical unit at location (i, j) is calculated asthe weighted sum of the units in its afferent connection field:
sij = γA
(∑ab
χabAab,ij
)(3.3)
where χab is the activation of neuron (a, b) in the afferent receptive field of neuron (i, j),Aab,ij is the corresponding afferent weight, and γA is a constant scaling factor. The afferentstimulation is squashed using a piecewise linear approximation to a sigmoidal function,given by:
31
3.4. SELF-ORGANISATION CHAPTER 3. WHISKER-LISSOM
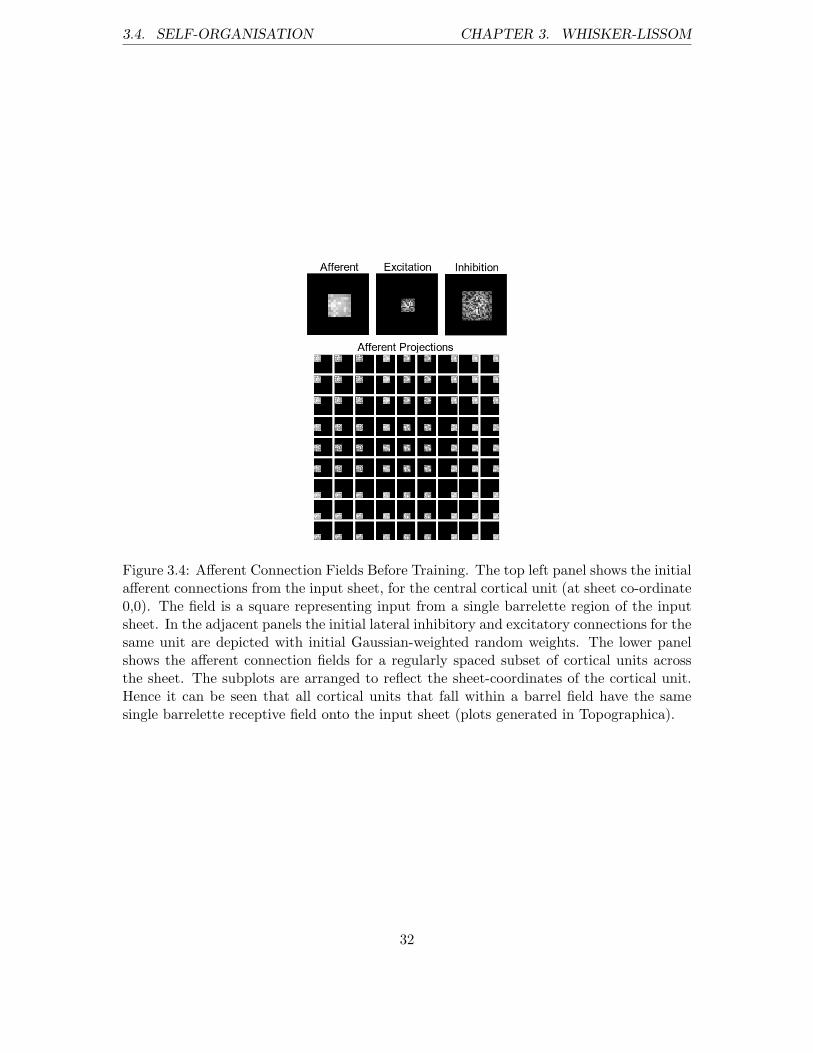
Figure 3.4: Afferent Connection Fields Before Training. The top left panel shows the initialafferent connections from the input sheet, for the central cortical unit (at sheet co-ordinate0,0). The field is a square representing input from a single barrelette region of the inputsheet. In the adjacent panels the initial lateral inhibitory and excitatory connections for thesame unit are depicted with initial Gaussian-weighted random weights. The lower panelshows the afferent connection fields for a regularly spaced subset of cortical units acrossthe sheet. The subplots are arranged to reflect the sheet-coordinates of the cortical unit.Hence it can be seen that all cortical units that fall within a barrel field have the samesingle barrelette receptive field onto the input sheet (plots generated in Topographica).
32

3.4. SELF-ORGANISATION CHAPTER 3. WHISKER-LISSOM
σ(s) =
{ 0(s− θl)/(θu − θl)
1
s ≤ θl,
θl < s < θu,
s ≥ θu
(3.4)
where σ(s) is the squashing function, θl is a lower-bound threshold, and θu is the upperbound, i.e., the saturation point of the (linearly approximated) sigmoidal region. Theafferent stimulation is therefore given by:
ηij(0) = σ(sij) (3.5)
3.4.3 Lateral Cortical Connections
One of the defining features of LISSOM is that cortical units interact laterally, mediatingan excitatory effect on their immediate neighbours and an inhibitory effect on more distalcortical units. Such a regime is inspired by the computations thought to be performedby real cortical networks (although see discussion for problems with this approach). Thisscheme supports self-organised mappings, forcing local cortical regions to respond to sim-ilar input features. W-LISSOM follows suit. The lateral neighbourhoods are isotropic incortical space and are centred on the location of the cortical unit to which they connect.Like the afferent projections, the lateral weights are initially random and normalised. Un-like the afferent projections there is no discontinuity in the range of lateral connections,i.e., they are unconstrained by the barrel field borders.
After the initial response of a cortical unit to the afferent stimulus is calculated and thenetwork settles, activation propagates laterally among the cortical units through a numberof iterations until the network settles. The effect of lateral interactions on the activity η
of a single cortical unit at (i, j) is governed by:
ηij(t) = σ
(sij + γE
∑kl
ηkl(t− 1)Ekl,ij − γI
∑kl
ηkl(t− 1)Ikl,ij
)(3.6)
where ηkl(t − 1) is the activity of another cortical neuron (k, l) during the previous timestep, Ekl,ij is the excitatory lateral connection weight from that neuron to neuron (i, j),and Ikl,ij is the inhibitory connection weight. The scaling factors γE and γI represent therelative strengths of excitatory and inhibitory interactions.
Lateral interactions enforce competitive dynamics, focusing the initial afferent-mediatedresponse of the network, into one localized in cortical space. Afferent and lateral weighted
33

3.4. SELF-ORGANISATION CHAPTER 3. WHISKER-LISSOM
connections are updated during training according to a Hebbian learning rule with divisivenormalisation:
w′pq,ij =wpq,ij + αXpqηij∑
uv(wuv,ij + αXuvηij)(3.7)
where wpq,ij is the current afferent or lateral connection weight, from (p, q) to (i, j), w′pq,ij
is the new weight throughout the subsequent settling process, α is the learning rate, Xpq isthe presynaptic activity after settling and ηij is the activity of neuron (i, j) after settling.The afferent, excitatory, and inhibitory connections are normalized separately.
During the course of training the extent of lateral excitatory connections is manually re-duced, as are the learning rates. These dynamics are held the same for all simulationsreported here, and identical, standard LISSOM parameters are used for all simulationsunless otherwise stated.
Shrinking the radius of lateral excitation relative to a constant inhibition during trainingperforms a function similar to gradient descent. It helps the network to find a balancebetween the global and local structure of the input space. Whilst this is computation-ally expensive, where alternatives such as homeostatic mechanisms are less so, it is morecomplete in finding a global/local compromise in the input space and therefore is a usefulstrategy in probing a new network such as this.
34
Chapter 4
Results
In this chapter the results from the network as it self-organises are presented. The maindiscovery is that pinwheel organisations of deflection preference emerge from the network,similar to that found by Andermann & Moore (2006) in the rat barrel cortex. Hence, thehypothesis that self-organisation can explain the angular deflection map in barrel cortex,is validated.
4.1 Network Testing
To visualise how the network has learned, patterns are presented on the input sheet andthe response of the cortical units is computed according to equation 3.3. Each corticalcell is labelled with a colour or grey-scale value according to the input pattern to which itresponds maximally. Learning is switched off during this process.
To estimate the angular deflection preference of each cortical unit, the network is testedby deflecting each artificial whisker in turn at a full range of angles, and generating inputpatterns according to the same method as for the training patterns. The deflection vectorfor network testing is of full unit length, to gauge the response of the network to a maximaldeflection at each angle. Each of the angular deflection maps presented here are obtainedby testing on 100 angles, i.e., one at every 3.6o.
Measuring the cortical units’ preference for an input from a specific whisker is achievedusing the same procedure, but deflection and whisker preference are computed indepen-dently.
35

4.2. OUTWARD RADIATING PINWHEELS CHAPTER 4. RESULTS
4.2 Outward Radiating Pinwheels
The W-LISSOM network was trained according to the procedure outlined in the precedingchapter. In all simulations reported here, 64 ganglion units for nine whiskers arranged in a3x3 array were used to construct the input sheets, i.e. assigning an 8x8 sub-region to eachbarrelette. The cortical sheet consists of 48x48 units, i.e. assigning a 16x16 sub-region toeach barrel.
The resulting network organisation of this training paradigm is threefold:
1. The network is able to maintain the ‘hard-wired’ whiskerpad somatotopy. Corticalunits are initially selective for inputs from the principal whisker to which they areassigned. This is not surprising given the one-to-one barrelette-barrel projection.Global somatotopy is maintained by the network as expected. Sub-plots c, d & eof figure 4.2 demonstrate the preservation of somatotopy during learning. This isconsistent with the somatotopic barrel map in real barrel cortex.
2. The network self-organises very quickly to become selective to angular deflectionsof the whiskers. By as few as 50 iterations cortical units display a preference for abroad but topologically defined range of deflections. The units that delineate thesquare barrel fields are relatively unselective to angular deflections. After a hundrediterations, delineating unit unselectivity disappears and is replaced by relative unse-lectivity in the units located at the centre of the barrel fields. As the network learns,barrel centre unselectivity sharpens, and rather curiously becomes manifest in twosmall clusters, delineating for most barrels a small central fracture. This might bean artifact of the square receptive fields, although it would certainly be interestingto find a similar central fracture in the real barrel cortex.
3. The organisation of deflection preference emerges to be remarkably similar to thatdiscovered in real layer 2/3 barrel cortex. Each of the nine barrel field populationsdevelops a complementary structure whereby deflection of the principal whisker to-wards its whiskerpad neighbour mediates activity in the barrel field that is alignedwith that neighbour’s barrel field. This follows precisely the outward radiating pin-wheel organisation of barrel cortex neurons as discovered by Andermann & Moore(2006). This organisation is confirmed by probing the network further: W-LISSOMdevelops connection fields to the ganglion/barrelette units whose maximally effectiveangles span a local region of the angular deflection space for the principal whisker.Similarly, the lateral connections reflect the map organisation such that units prefer-ring a specific angular defection are connected to similarly tuned units.
36

4.2. OUTWARD RADIATING PINWHEELS CHAPTER 4. RESULTS
Figure 4.1: Emerging Pinwheel Organisations of Angular Deflection Preference: The angu-lar deflection preference of the cortical units was tested as the model organises, as outlinedin the text. A: Outward-radiating complementary pinwheel maps emerge from the networkover time (iterations). B: The grey scale diagrams beneath show the corresponding selec-tivity of each cortical unit to angular deflections. The Selectivity plots are independentlynormalised such that black is unselective and white is highly selective. See text for a fulldiscussion of the emerging structure. C: The angular deflection mapping measured byAndermann & Moore (2006, axes as in previous figure ). D: Angular deflection colour key(adapted from Andermann & Moore, 2006), where cells are coloured red if they respondpreferentially for an Easterly-directed deflection, through green/yellow for a Northerly (i.e.dorsal) angle, through blue as a Westerly angle, and purple as a ventral deflection. The keycolouring is continuous. E: The model B2 barrel field is blown up for comparison with theoriginal map. Colorization is non-normalised. Plots C and E show striking resemblance toone-another, confirming that self-organisation can give rise to the angular deflection mapfound in barrel cortex. This is the major finding of the report (see text for full discussion).
37

4.2. OUTWARD RADIATING PINWHEELS CHAPTER 4. RESULTS
Figure 4.2: Preservation of Somatotopy from the Untrained to the Organised Network.Untrained (top row: 0 iterations) and Organised network (bottom row, the same network asin the previous figure after 20000 iterations). In the untrained network deflection preference(A) and selectivity (B) is measured as previously and reveals the underlying somatotopicmapping of the connection fields, but no such meaningful organisation for deflection. Theexplicit somatotopy is confirmed by plots C, D and E for the pre-trained network. In C, theunits are assigned a grey scale value according to the whisker from which they prefer inputs,whereby black to white corresponds to the following progression along the whiskerpad [A1A2 A3 B1 B2 B3 C1 C2 C3] where A1 is black and C3 is white. Hence whisker selectivityis made explicit in the system. Plot D shows the selectivity of the cortical units to inputfrom each whisker. The strange pattern observed in this plot for the pre-trained network ismerely an artifact of normalisation, but it confirms the explicit nature of the somatotopicprojections. Plot E shows the centre of gravity of the afferent weights for each cortical unit,where links are made between neighbouring units in cortical space. The afferent weightvector for all cortical units is aligned with the centres of their corresponding barrelettes.The corresponding plots C,D, and E show that global whiskerpad topography is maintainedby the network whilst it organises, confirming that the pinwheels of deflection selectivityin panel A indeed correspond to the original principal whisker for each barrel field.
38

4.2. OUTWARD RADIATING PINWHEELS CHAPTER 4. RESULTS
Figure 4.3: Barrel Sheet Response to Three Inputs in the Trained Network. Three examplecorrelated-whisker input patterns (left column) are presented to the network after trainingfor 20,000 iterations. Each unit on the input sheet is colourised according to its maximallyeffective angle, with brighter units being more highly activated. When presented to thetrained network, inputs cause activity on the cortical sheet within a local region of each ofthe nine barrel fields (central column). The active cortical units are colourised accordingto the angle of whisker deflection to which they respond preferentially, confirming theoutward-radiating pinwheel organisation of the deflection map (right column). The samecolour key (far right) applies to each of the plots.
39

4.2. OUTWARD RADIATING PINWHEELS CHAPTER 4. RESULTS
(a) Afferent Connections (b) Lateral Connections
Figure 4.4: Deflection-Selective Cortical Connections after 20,000 Iterations. (a) The affer-ent connection fields for eight individual cortical units from the B2 barrel field are shown.Single unit plots are arranged around the deflection map to show the locus of those unitsin cortical space, indicated by black dots. The afferent cells have been colourised by theirMEA’s following the same convention as for labelling deflection preference. Hence the net-work can be seen to develop afferent connections between the ganglion and cortical unitsthat represent a local region of the angular deflection space (i.e. all connected cells aresimilar colours). (b) The same eight cortical units also develop lateral connections withcells that prefer similar deflection angles (same color-coding). There is close agreementbetween the angular deflection preference in the afferent (a) and lateral (b) connections,confirming the angular deflection map at the centre of both plots. Sheet co-ordinates clock-wise from top left; (x=-0.12,y=0.12) (green/blue); (x=0, y=0.12) (yellow/orange/green);(0.12, 0.12); (0.12,0); (0.12, -0.12); (0,-0.12); (-0.12,-0.12); (-0.12,0).
40
4.3. CONTROLS CHAPTER 4. RESULTS
4.3 Controls
The complementary-pinwheels mapping (where each are oriented similarly) results from anetwork trained on correlated whisker deflections. This training type was chosen for thebasic network to reflect an assumed correlation in how real whiskers will be stimulated, i.e.,with all the whiskers usually being deflected at similar angles. The network can now be usedto make predictions as to how altered sensory experiences might affect the representationof angular deflections in real barrel cortex. Network predictions can be tested empirically,and therefore the model and the self-organising hypothesis that it represents is falsifiable.Presented here are the results from three model experiments, whereby the correlation ofwhisker deflections during training is manipulated.
4.3.1 Experiment 1: Uncorrelated Deflections
In the first experiment, henceforth the uncorrelated deflections model, the angle at whichthe central whisker (B2) is deflected on a given training pattern was randomised, whereasall others were correlated. There are three foreseeable outcomes to this manipulation:
1. That the B2 barrel field will organise independently of its neighbours into a pinwheelstructure that is uncorrelated with that of the other barrels. Although unlikely, thisorganisation could by chance appear to be complementary for some models run.
2. That the cortical sheet will organise the deflection preferences of the B2 barrel unitsto converge with the preferences of the neighbouring barrel fields. This would giverise to an anti-correlated organisation of the B2 barrel such that its Easterly unitswill have the same preference as the Westerly units of barrel field B3, for example.
3. That the opposite of 2. will happen. The B2 barrel could organise as in the correlatedcase, and all other barrel fields could be convergent on it. Hence all but the centralwhisker would have anti-correlated pinwheel organisations.
4. That the deflection preference mapping will be the same as for the correlated case.
The results from uncorrelated deflections support the second hypothesis (see figure 4.5(b)). The B2 barrel field organisation becomes merged with its neighbours, forming ananti-correlated pinwheel mapping. The network maximises the global continuity of an-gular deflection preference such that neighbouring cortical units prefer similar deflectionsregardless of the barrel field borders. Hence with reduced information about somatotopypresent in the input space, the network instead prioritises global angular deflection topog-raphy.
41

4.3. CONTROLS CHAPTER 4. RESULTS
Figure 4.5: Experimental Conditions (see next page).
42
4.3. CONTROLS CHAPTER 4. RESULTS
Caption for Figure 4.5.Experimental Results for Correlated (first column), Un-correlated (second column), Ran-dom (third column), and Anti-Correlated (final column) Deflections Conditions: The toprow shows a cartoon of how these conditions would be manifest as whisker deflections inthe rat. The second row of plots shows an example input pattern that would be presentedunder each condition, with colors indicating the MEA of the ganglion cells that are firing toproduce that input (again, the colourising scheme is the same as for the deflection maps).In the standard, correlated deflections condition the whiskers are all stimulated at exactlythe same deflection vector to produce each input pattern (i.e. a North-Westerly green). Inthe uncorrelated deflections condition the deflection vector of the central whisker is ran-domised independently (in this case to a North-Westerly, i.e. green deflection) of the otherswhich are all subject to the same Southerly deflection. In the random deflections condi-tion, each whisker deflection vector is independently randomised, resulting in the patternof firing for each barrelette region of the input sheet to be unrelated to that of the others(and hence all nine afferent projections are colorized differently). In the anti-correlatedcondition the central whisker is offset by 180o from the others (i.e. its red firing patternis the opposite of the common blue for all the other barrelettes). In the next row thefully-trained (20,000 iterations) cortical activity is shown, in response to the input pat-terns depicted above them. As expected the green inputs in the correlated case propagateactivity in a local ‘green neighbourhood’ of units with similar deflection preferences, foreach barrel field. The resulting activity patterns, deflection maps and selectivity plots foreach of the experimental conditions (the final two rows of figures) have been detailed inthe main text.
4.3.2 Experiment 2: Random Deflections
In the second experiment, henceforth the random deflections model, the network is trainedwith independently randomised angular deflections of the whiskers. An example trainingpattern might be generated from whiskers [A1, A2, A3, B1, B2, B3, C1, C2, C3] deflectedat [10o, 289o, 313o, 56o, 101o, 98o, 21o, 45o, 7o] respectively. Based on the observations fromexperiment 1 the random deflections network should not learn local deflection organisation.The self-organising algorithm should still enforce topological angular deflection preferences,i.e., with continuity and coverage of the input space, but in the absence of somatotopiccorrelations there is unlikely to be complementarity between the organisations for eachbarrel field.
The results from random deflections support confirm the prediction (see figure 4.5). Thenetwork becomes locally disordered and relatively unselective for angular deflections. De-flection preference maps still fracture at the barrel field borders, most likely due to thesingle-barrelette afferent projections. Moreover the network can clearly be seen to max-imise continuity of deflection preference, respecting less the barrel field borders.
43

4.4. SUMMARY CHAPTER 4. RESULTS
4.3.3 Experiment 3: Anti-Correlated Deflections
In the third experiment, henceforth the anti-correlated deflections model, all except whiskerB2 are deflected in exactly the opposite direction from B2, which is deflected as normal.Hence the whiskers are now deflected at the angle of incidence, except for B2 which isdeflected, as previously, in the opposite direction. With the results of experiments one andtwo in mind, there are two foreseeable outcomes in this case:
1. That the organisation of deflection in the central barrel field will be anti-correlatedwith that of the surrounding barrel fields. The organisation of the B2 barrel fieldshould be oriented as in the correlated case, but all others will be oriented in theopposite direction, i.e., inward radiating.
2. That the network will behave as in experiment 1. The resulting map will appearsimilar to that of the first hypothesis, but the borders of the central barrel fieldwill be less delineated by fractured deflection preferences, and the pinwheels will beinward-radiating.
The resulting map concurs with the first hypothesis. The central barrel field is organised asin the correlated case whereas the others are inward-radiating. Therefore, the orientationof each of the pinwheel mappings depends on the angle at which the whiskers are deflectedwith respect to the angle at which the stimulus is encountered by the whiskerpad. Thisresult highlights the importance of the assumption in the model, that the rat’s whiskersare always deflected away from the stimulus as it is encountered.
4.4 Summary
Trained on correlated whisker deflections, W-LISSOM self-organises to assign complemen-tary pinwheel organisations of angular deflection preference to each of the whiskers. Themapping is remarkably similar to that found in real barrel cortex, supporting the hypothe-sis that self-organisation can give rise to this organisation in the rat brain. The model wasused to make several predictions of the real barrel cortex, and as such the self-organisinghypothesis represented by W-LISSOM has been reformulated as a falsifiable one.
44
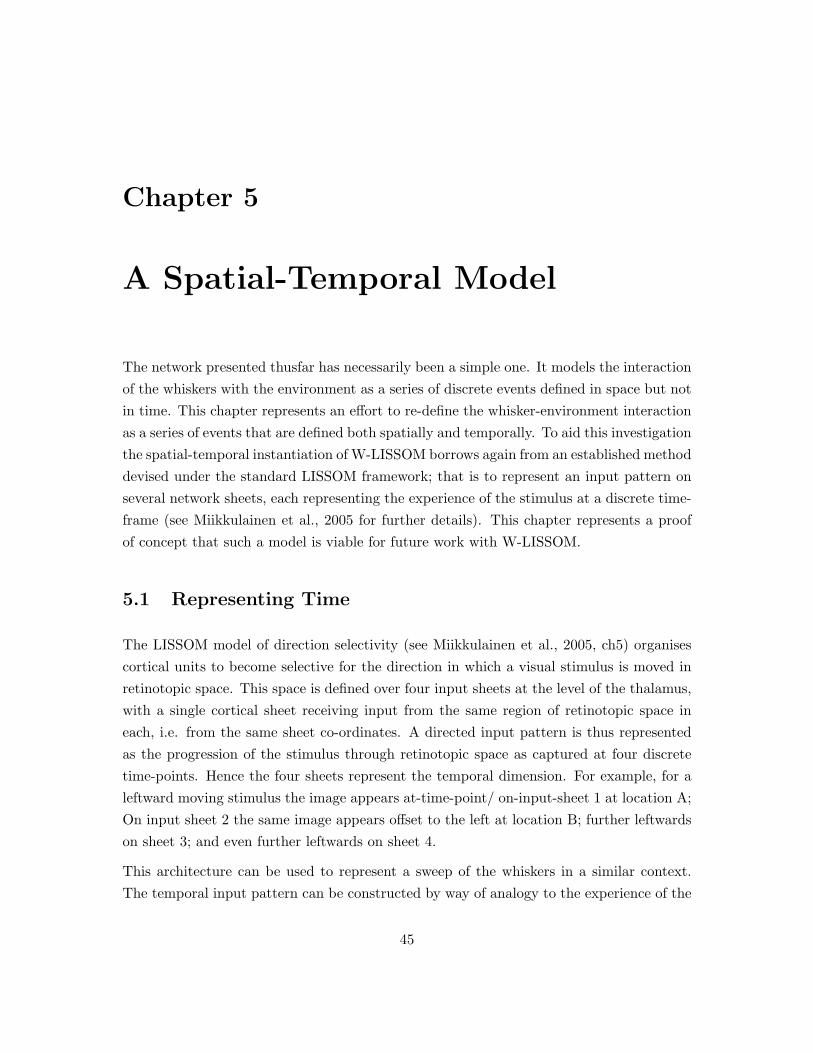
Chapter 5
A Spatial-Temporal Model
The network presented thusfar has necessarily been a simple one. It models the interactionof the whiskers with the environment as a series of discrete events defined in space but notin time. This chapter represents an effort to re-define the whisker-environment interactionas a series of events that are defined both spatially and temporally. To aid this investigationthe spatial-temporal instantiation of W-LISSOM borrows again from an established methoddevised under the standard LISSOM framework; that is to represent an input pattern onseveral network sheets, each representing the experience of the stimulus at a discrete time-frame (see Miikkulainen et al., 2005 for further details). This chapter represents a proofof concept that such a model is viable for future work with W-LISSOM.
5.1 Representing Time
The LISSOM model of direction selectivity (see Miikkulainen et al., 2005, ch5) organisescortical units to become selective for the direction in which a visual stimulus is moved inretinotopic space. This space is defined over four input sheets at the level of the thalamus,with a single cortical sheet receiving input from the same region of retinotopic space ineach, i.e. from the same sheet co-ordinates. A directed input pattern is thus representedas the progression of the stimulus through retinotopic space as captured at four discretetime-points. Hence the four sheets represent the temporal dimension. For example, for aleftward moving stimulus the image appears at-time-point/ on-input-sheet 1 at location A;On input sheet 2 the same image appears offset to the left at location B; further leftwardson sheet 3; and even further leftwards on sheet 4.
This architecture can be used to represent a sweep of the whiskers in a similar context.The temporal input pattern can be constructed by way of analogy to the experience of the
45
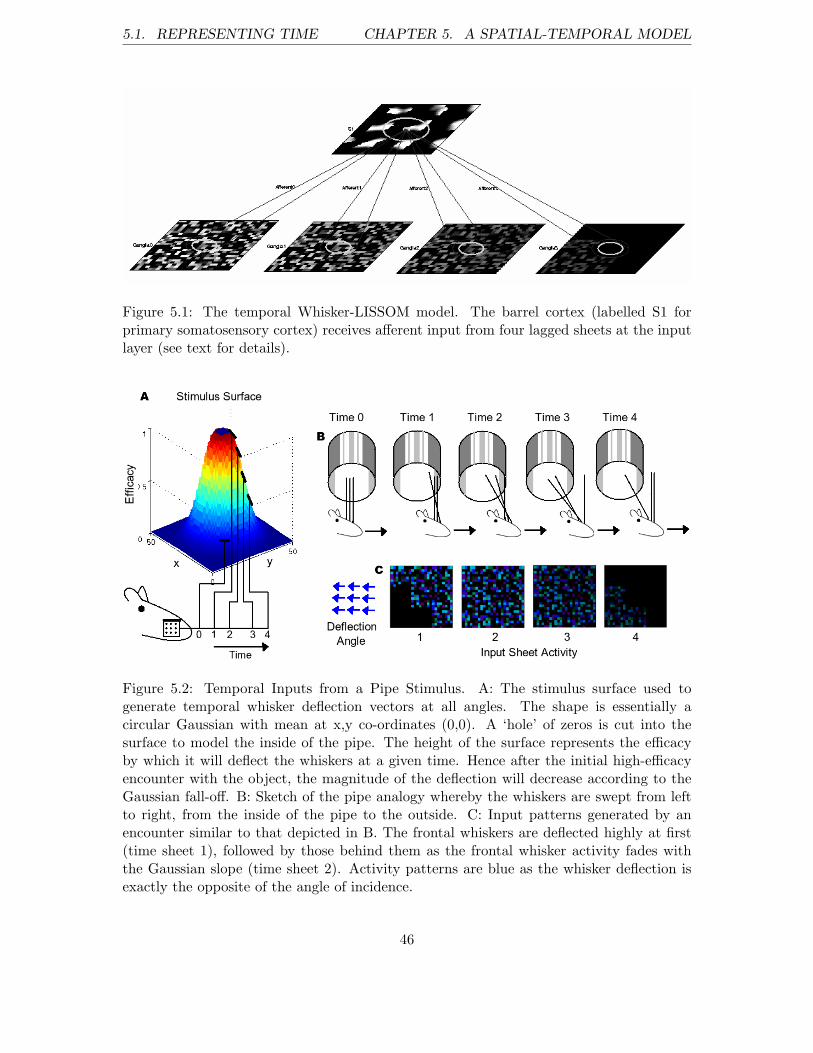
5.1. REPRESENTING TIME CHAPTER 5. A SPATIAL-TEMPORAL MODEL
Figure 5.1: The temporal Whisker-LISSOM model. The barrel cortex (labelled S1 forprimary somatosensory cortex) receives afferent input from four lagged sheets at the inputlayer (see text for details).
Figure 5.2: Temporal Inputs from a Pipe Stimulus. A: The stimulus surface used togenerate temporal whisker deflection vectors at all angles. The shape is essentially acircular Gaussian with mean at x,y co-ordinates (0,0). A ‘hole’ of zeros is cut into thesurface to model the inside of the pipe. The height of the surface represents the efficacyby which it will deflect the whiskers at a given time. Hence after the initial high-efficacyencounter with the object, the magnitude of the deflection will decrease according to theGaussian fall-off. B: Sketch of the pipe analogy whereby the whiskers are swept from leftto right, from the inside of the pipe to the outside. C: Input patterns generated by anencounter similar to that depicted in B. The frontal whiskers are deflected highly at first(time sheet 1), followed by those behind them as the frontal whisker activity fades withthe Gaussian slope (time sheet 2). Activity patterns are blue as the whisker deflection isexactly the opposite of the angle of incidence.
46

5.1. REPRESENTING TIME CHAPTER 5. A SPATIAL-TEMPORAL MODEL
real whiskers as they might contact a circular object such as a pipe from the inside out(see figure 5.2). The order in which the whiskers will encounter the edge of the pipe willbe determined by their location on the whiskerpad, such that whiskers situated towardsthe front of the pad, as defined by the direction of motion, will be deflected before thosesituated behind them. The magnitude of a deflection will be maximal on initial contactwith the stimulus, and will decrease over time.
To model this experience, an object similar to the pipe can be defined mathematically.The stimulus surface used to train the temporal W-LISSOM model is defined in threedimensions: x and y corresponding to the two spatial dimensions depicted in figure 5.2(i.e. the whiskers are assumed to be maintained at a constant distance from the stimulusand thus there is no whisker compression), and ξxy which corresponds to the magnitude ofdeflection affected by the surface at location (x, y). On each of the four discrete time-framesthe activity mediated by each whisker on the whiskerpad:
A1 A2 A3B1 B2 B3C1 C2 C3
(5.1)
is defined by the location of whisker B2 at angle and distance in (x, y) co-ordinates, relativeto the within-pipe origin:
ξx−1,y+1 ξx,y+1 ξx+1,y+1
ξx−1,y ξx,y ξx+1,y
ξx−1,y−1 ξx,y−1 ξx+1,y−1
(5.2)
where (x, y) is the location of the central whisker at a given time-point. ξx,y is defined asan outward radiating Gaussian profile over dimensions (x, y) with mean at (x = 0, y = 0).
A Gaussian profile is chosen to simulate the diminishing affect of the stimulus on thewhiskers and is easy to adjust, although a sine-wave function might also be appropriate.However to represent the centre of the pipe, which will affect no deflection, a circular ‘hole’of zeros slightly larger than the size of the whisker array is ‘cut’ into the central area ofthe surface (x = 0, y = 0).
Therefore a sweep of the whiskers beginning inside the pipe, (at x = 0, y = 0) and endingoutside it, can be modelled with the deflection vector for a given whisker being definedwith unit length = ξij and deflection angle being the opposite to the direction of the sweep,i.e. the angle of deflection is assumed here to always be exactly opposite to the angle ofincidence. As with the case for directed visual stimuli, the whisker-sweep can be depicted
47
5.2. RESULTS CHAPTER 5. A SPATIAL-TEMPORAL MODEL
as a series of snapshots of whisker-mediated activity as the array is moved over the objectin a given direction.
The network can therefore be trained on many different whisker sweeps at all angles and thetemporal co-incidence of neighbouring whiskers can be conveyed to the network, accordingto their spatial arrangement on the whiskerpad.
5.2 Results
Besides the altered representation of the inputs, the model specification and training isexactly as in the previous correlated deflections model, with network parameters identicalto those used before. Testing of angular deflection preference is performed in the same wayas reported previously, but with the testing patterns on all four time-sheets being identical.That is, the whisker being tested is deflected at full unit length for the duration of timerepresented by the four input sheets. In this sense, testing is equivalent to performing aramp-and-hold deflection of the whiskers, as is common practice for empirical testing ofneuronal responses in the real system.
Adding a spatial-temporal dimension to the input space adds complexity to the systemthat makes qualitative analysis more difficult. The notable change in mapping structurefrom 5,000 to 20,000 iterations suggests that a more regular structure might be realisedby a full search of the parameter space, larger simulations, and a more suitable spatial-temporal testing paradigm. Thus investigation of the more sophisticated W-LISSOM modelwill direct future work. However, a degree of preliminary success is credited here by thegeneral resemblance between the basic and temporal W-LISSOM-mediated mappings.
48
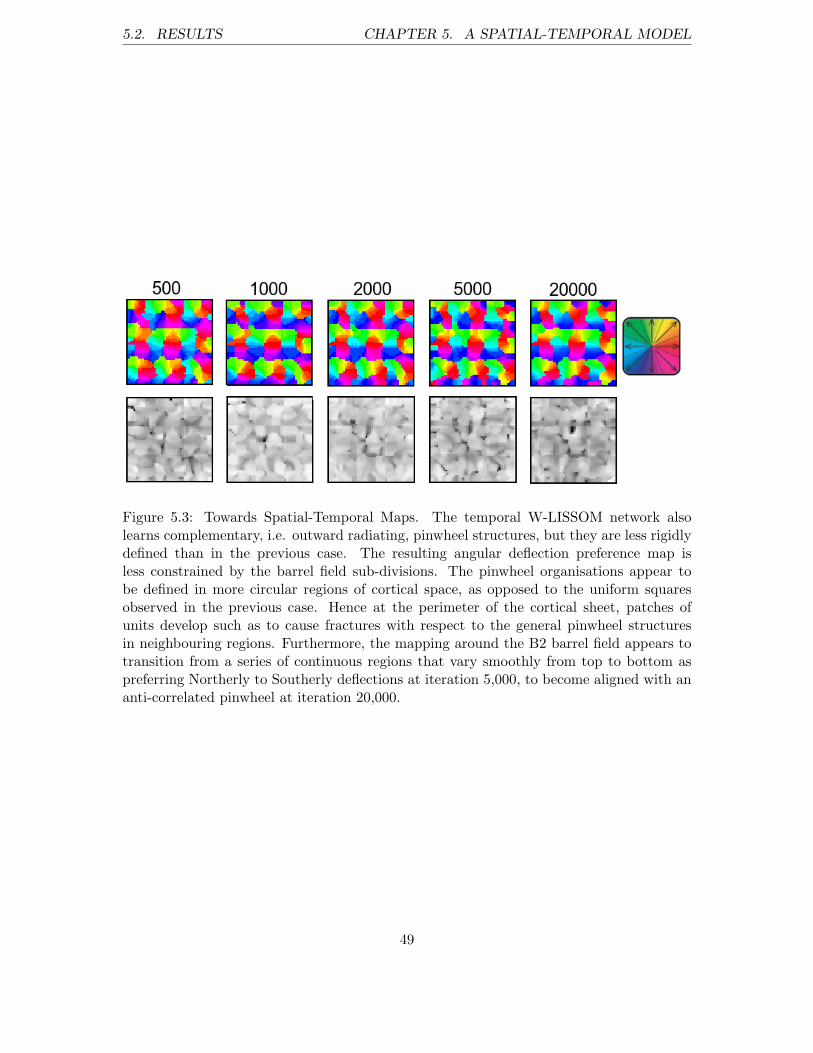
5.2. RESULTS CHAPTER 5. A SPATIAL-TEMPORAL MODEL
Figure 5.3: Towards Spatial-Temporal Maps. The temporal W-LISSOM network alsolearns complementary, i.e. outward radiating, pinwheel structures, but they are less rigidlydefined than in the previous case. The resulting angular deflection preference map isless constrained by the barrel field sub-divisions. The pinwheel organisations appear tobe defined in more circular regions of cortical space, as opposed to the uniform squaresobserved in the previous case. Hence at the perimeter of the cortical sheet, patches ofunits develop such as to cause fractures with respect to the general pinwheel structuresin neighbouring regions. Furthermore, the mapping around the B2 barrel field appears totransition from a series of continuous regions that vary smoothly from top to bottom aspreferring Northerly to Southerly deflections at iteration 5,000, to become aligned with ananti-correlated pinwheel at iteration 20,000.
49
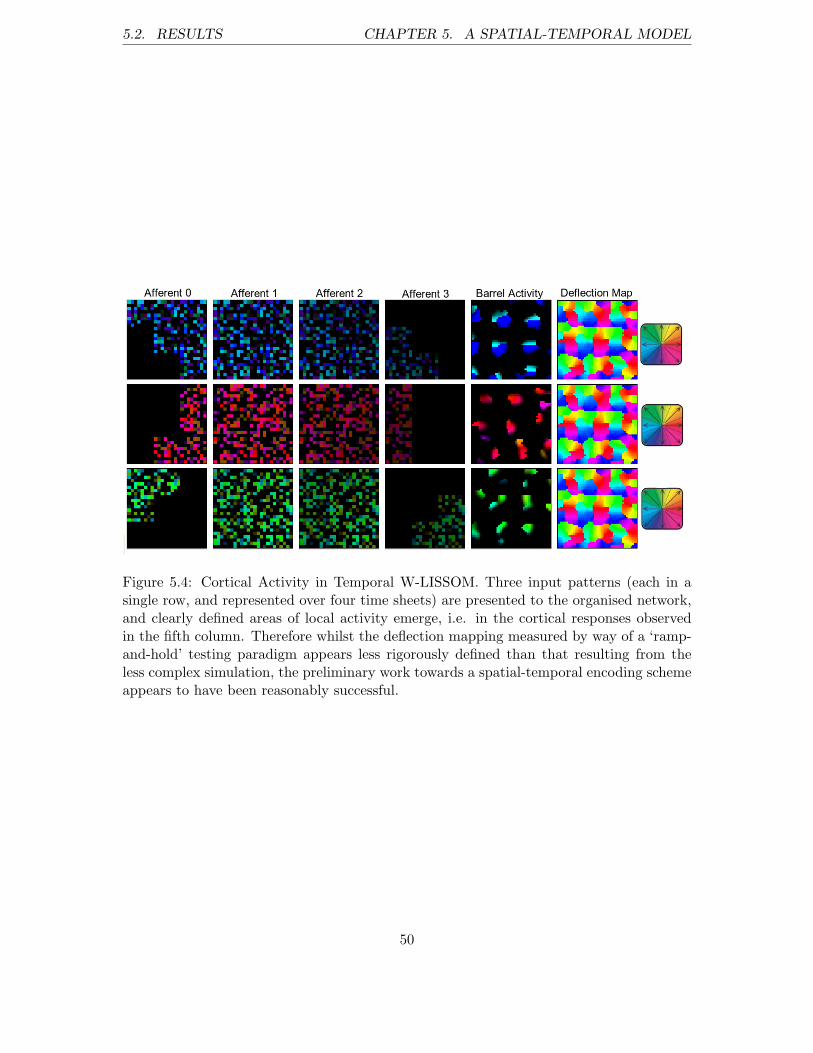
5.2. RESULTS CHAPTER 5. A SPATIAL-TEMPORAL MODEL
Figure 5.4: Cortical Activity in Temporal W-LISSOM. Three input patterns (each in asingle row, and represented over four time sheets) are presented to the organised network,and clearly defined areas of local activity emerge, i.e. in the cortical responses observedin the fifth column. Therefore whilst the deflection mapping measured by way of a ‘ramp-and-hold’ testing paradigm appears less rigorously defined than that resulting from theless complex simulation, the preliminary work towards a spatial-temporal encoding schemeappears to have been reasonably successful.
50

Chapter 6
Whisker-LISSOMBot
The whisker strain generator presented in chapter 3 is highly constrained. As an approxi-mation to the tactile experiences of the rat in its first weeks of postnatal life, the exemplartraining patterns each represent whisker mediated activity via a highly simplified anal-ogy of a whisker deflection. This is an appropriate strategy for simulating the aggregatesensory experience in the first few weeks of the rat’s postnatal development. However, amore detailed physical description of the whiskers will support future investigation intotactile sensory perception using Whisker-LISSOM. In this chapter the development of sucha system is documented, and preliminary results of porting it to Whisker-LISSOM arepresented.
A number of remarkable methods have been used to combine realistic whisker inputs withcomputational modelling. Hafner (2005) for example uses real whiskers glued to a capac-itor microphone to record deflections, whereas Kyriazi & Simons (1993) drive their moredetailed single-barrel model with spike-trains recorded directly from barreloid cells. How-ever, under the time constraints of the current work, it was decided to implement a moredetailed model of the whiskers in virtual reality.
Much of the interest in this field stems from robotics, whereby construction of an artificialwhisker system for object detection and discrimination represents a very tractable problemwith wide-ranging application in the control of autonomous agents. One such project,WhiskerBot (Pearson et al., 2005), has been developing an active whisking array of flexiblevibrissae for use on a real mobile robot platform. To aid the process, a parallel projectfor developing WhiskerBot in software is also being undertaken. The work presented herewas supported throughout by collaborators at the Adaptive Behavioural Research Group(ABRG) at the University of Sheffield, and in part by the Intelligent Autonomous SystemsLaboratory (IASL) at the University of the West of England. The work reported herethus represents the adaptation of an existing system. All simulations are run using the
51

6.1. WHISKERBOT OVERVIEW CHAPTER 6. WHISKER-LISSOMBOT
commercial software tool Webots 5 (www.cyberbotics.com), a prototyping tool for robotsimulation and development. Further acknowledgements are made to the Bioinformaticsdepartment, School of Informatics at the University of Edinburgh for funding the Webotslicence.
6.1 WhiskerBot Overview
The WhiskerBot simulation consists of a three-dimensional agent and a virtual environ-ment. To distinguish the WhiskerBot simulation developed by the ABRG from thatadapted for the present purposes the latter will be referred to as W-LISSOMBot (Whisker-LISSOM-WhiskerBot).
The template simulation supplied by the ABRG1 consists of an agent with a cylindricalbody supporting two small wheels and a cubic head; which in turn support six whiskerson two opposite faces, see figure 6.1.
All components are joined via servo hinges. The physical specifications of the WhiskerBotsub-components, as well as those governing the interaction between parts at the respectiveservos, approximate the design of a physical WhiskerBot robot, housed at the IASL.
Whiskers each consist of three cylindrical subsections of equal dimensions, and are attachedto one another in an end-to-end fashion by spring servos. Whiskers are attached to thehead by one-dimensional spring servos (e.g. supporting a rostral-caudal whisking arc) suchthat application and subsequent release of a force to the array produces a protraction andsubsequent retraction of the whiskers respectively.
Properties of the whisker servos and subsections are largely assigned by hand to supportphysically realistic movement under stimulation, and are subject to the limitations of theWebots physics engine. The most notable of these is that the size-to-mass discrepancybetween the whisker element and the body element of WhiskerBot can make for a delicatesimulation. Very small values that would otherwise be appropriate for simulating thewhiskers are supported by Webots, but using them requires a very precise tuning of relatedvariables, such as the dampness and spring constants acting on the servos. Aside from beinga lengthy and difficult process, fine-tuning these variables means that they are not robustto a relatively large range of force that can act on the body component when the controlof WhiskerBot is not highly constrained.
The solution is to define the whiskers with a relatively large mass, but this has the limitationthat whiskers can have too great an affect on the body component, for example causing
1For clarity, the simulation is referred to as WhiskerBot whenever the text describes work which hasbeen implemented by the original designers, and as W-LISSOMBot when the work was my own.
52
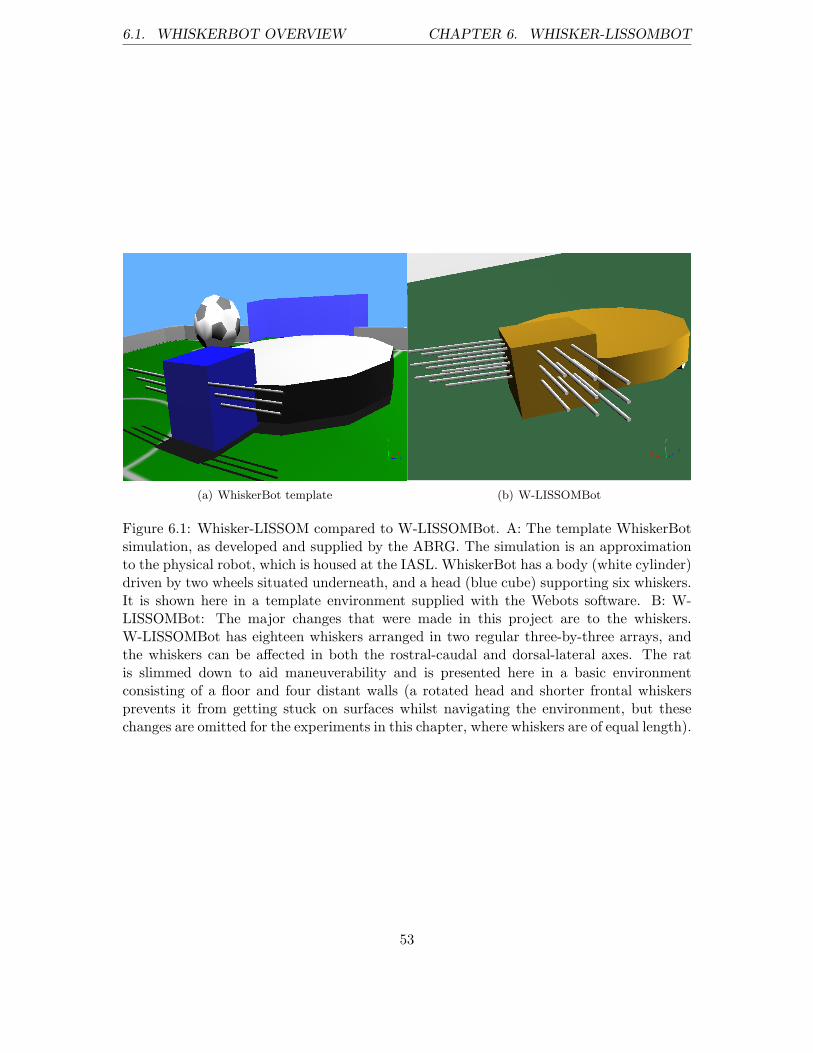
6.1. WHISKERBOT OVERVIEW CHAPTER 6. WHISKER-LISSOMBOT
(a) WhiskerBot template (b) W-LISSOMBot
Figure 6.1: Whisker-LISSOM compared to W-LISSOMBot. A: The template WhiskerBotsimulation, as developed and supplied by the ABRG. The simulation is an approximationto the physical robot, which is housed at the IASL. WhiskerBot has a body (white cylinder)driven by two wheels situated underneath, and a head (blue cube) supporting six whiskers.It is shown here in a template environment supplied with the Webots software. B: W-LISSOMBot: The major changes that were made in this project are to the whiskers.W-LISSOMBot has eighteen whiskers arranged in two regular three-by-three arrays, andthe whiskers can be affected in both the rostral-caudal and dorsal-lateral axes. The ratis slimmed down to aid maneuverability and is presented here in a basic environmentconsisting of a floor and four distant walls (a rotated head and shorter frontal whiskersprevents it from getting stuck on surfaces whilst navigating the environment, but thesechanges are omitted for the experiments in this chapter, where whiskers are of equal length).
53
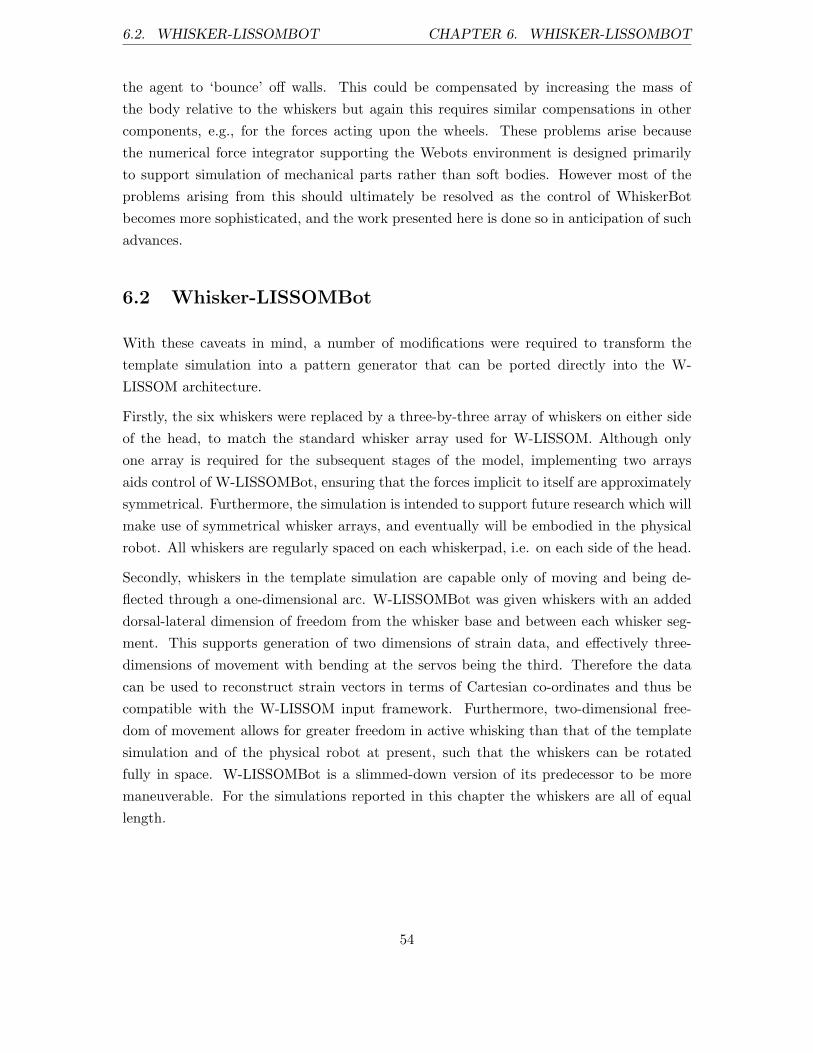
6.2. WHISKER-LISSOMBOT CHAPTER 6. WHISKER-LISSOMBOT
the agent to ‘bounce’ off walls. This could be compensated by increasing the mass ofthe body relative to the whiskers but again this requires similar compensations in othercomponents, e.g., for the forces acting upon the wheels. These problems arise becausethe numerical force integrator supporting the Webots environment is designed primarilyto support simulation of mechanical parts rather than soft bodies. However most of theproblems arising from this should ultimately be resolved as the control of WhiskerBotbecomes more sophisticated, and the work presented here is done so in anticipation of suchadvances.
6.2 Whisker-LISSOMBot
With these caveats in mind, a number of modifications were required to transform thetemplate simulation into a pattern generator that can be ported directly into the W-LISSOM architecture.
Firstly, the six whiskers were replaced by a three-by-three array of whiskers on either sideof the head, to match the standard whisker array used for W-LISSOM. Although onlyone array is required for the subsequent stages of the model, implementing two arraysaids control of W-LISSOMBot, ensuring that the forces implicit to itself are approximatelysymmetrical. Furthermore, the simulation is intended to support future research which willmake use of symmetrical whisker arrays, and eventually will be embodied in the physicalrobot. All whiskers are regularly spaced on each whiskerpad, i.e. on each side of the head.
Secondly, whiskers in the template simulation are capable only of moving and being de-flected through a one-dimensional arc. W-LISSOMBot was given whiskers with an addeddorsal-lateral dimension of freedom from the whisker base and between each whisker seg-ment. This supports generation of two dimensions of strain data, and effectively three-dimensions of movement with bending at the servos being the third. Therefore the datacan be used to reconstruct strain vectors in terms of Cartesian co-ordinates and thus becompatible with the W-LISSOM input framework. Furthermore, two-dimensional free-dom of movement allows for greater freedom in active whisking than that of the templatesimulation and of the physical robot at present, such that the whiskers can be rotatedfully in space. W-LISSOMBot is a slimmed-down version of its predecessor to be moremaneuverable. For the simulations reported in this chapter the whiskers are all of equallength.
54

6.2. WHISKER-LISSOMBOT CHAPTER 6. WHISKER-LISSOMBOT
Figure 6.2: W-LISSOMBot Deflection Vector. A deflection vector can be constructed fromthe X and Y strains. The deflection vector can be plugged into the ganglion ring networkand hence be ported directly into W-LISSOM.
55
6.3. THE ENVIRONMENT CHAPTER 6. WHISKER-LISSOMBOT
Figure 6.3: A Simple Stimulation Environment
6.3 The Environment
A number of environmental stimuli were constructed in Webots, and used to design threedistinct environments in which W-LISSOMBot can be used in future efforts to drive self-organisation through W-LISSOM2. In the first, geometric solids form convex and concavesurfaces and a regularly repeating ‘texture’ constitute a simple stimulation environment(figure 6.3). In the second, some irregular surfaces were added to constitute a mediumstimulation environment (figure 6.4). In the third, many irregular and varying objects andtextures constitute a complex stimulation environment (figure 6.5).
2MPEG clips demonstrating how W-LISSOMBot interacts with these environments are available onrequest.
56

6.3. THE ENVIRONMENT CHAPTER 6. WHISKER-LISSOMBOT
Figure 6.4: A Medium Stimulation Environment
57
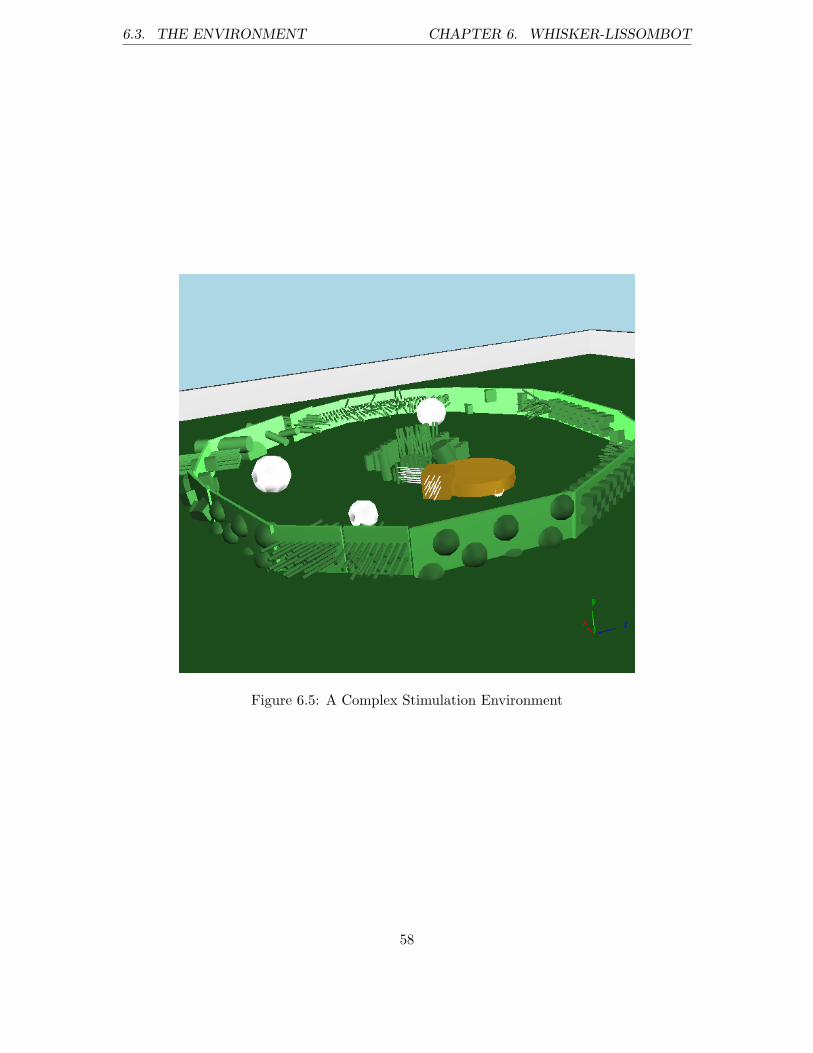
6.3. THE ENVIRONMENT CHAPTER 6. WHISKER-LISSOMBOT
Figure 6.5: A Complex Stimulation Environment
58
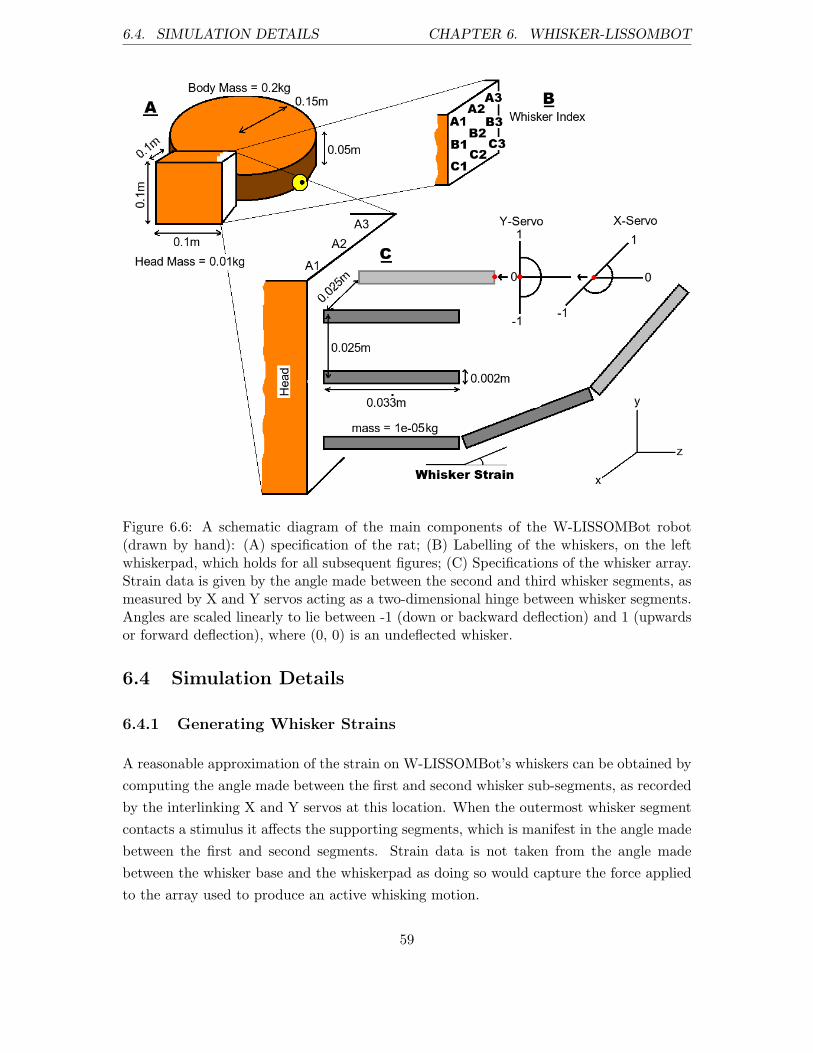
6.4. SIMULATION DETAILS CHAPTER 6. WHISKER-LISSOMBOT
Figure 6.6: A schematic diagram of the main components of the W-LISSOMBot robot(drawn by hand): (A) specification of the rat; (B) Labelling of the whiskers, on the leftwhiskerpad, which holds for all subsequent figures; (C) Specifications of the whisker array.Strain data is given by the angle made between the second and third whisker segments, asmeasured by X and Y servos acting as a two-dimensional hinge between whisker segments.Angles are scaled linearly to lie between -1 (down or backward deflection) and 1 (upwardsor forward deflection), where (0, 0) is an undeflected whisker.
6.4 Simulation Details
6.4.1 Generating Whisker Strains
A reasonable approximation of the strain on W-LISSOMBot’s whiskers can be obtained bycomputing the angle made between the first and second whisker sub-segments, as recordedby the interlinking X and Y servos at this location. When the outermost whisker segmentcontacts a stimulus it affects the supporting segments, which is manifest in the angle madebetween the first and second segments. Strain data is not taken from the angle madebetween the whisker base and the whiskerpad as doing so would capture the force appliedto the array used to produce an active whisking motion.
59
6.4. SIMULATION DETAILS CHAPTER 6. WHISKER-LISSOMBOT
6.4.2 Implementation Details
The actions of W-LISSOMBot during a simulation are determined by a custom Webotscontroller file (written in C), a template of which was supplied with the original WhiskerBotsimulation.
Strain data is recorded by Webots at discrete time-points and passively collected by Mat-Lab at the end of a simulation (see figure 6.7). Interface between the two software packagesis by way of a purpose-built3 TCP-IP link supported by Brahms (BRain And Head Mod-elling System, http://brahms.pbwiki.com). Brahms is an open source project developedby the ABRG as a multi-purpose software and hardware platform for integrating neuralsystems models. The use of Brahms in this project is limited, but this work will eventuallybe integrated with existing models of the Follicle-Sinus-Complex (Mitchinson et al. 2004),Basal Ganglia (Redgrave et al., 1999; Gurney et al., 2001a; 2001b), Superior Colliculus(Hemelt & Keller, 2007) and Hippocampus (parallel ABRG project, personal communica-tions), each of which is currently supported by Brahms (see discussion for proposal of sucha project).
In the current implementation the interface between the Webots simulation and W-LISSOMoperates off-line. Strains from an entire Webots simulation are recorded and subsequentlysent to Topographica via mlabwrap (http://malabwrap.sourceforge.net), a high-level bridgefrom Python (in which Topographica is written) to Matlab that lets Matlab appear as anormal Python library. In future efforts the system will be implemented on line, probablywith Topographica overseeing the entire process, such that cortical maps can be drivenby a simulation in real time. Under this scheme the entire self-organisational process cantherefore be later embodied in the physical robot at the IASL, a proposal of which is in itsearly stages.
6.4.3 Current W-LISSOMBot Limitations
Due to time constraints, implementation of an original idea to self-organise W-LISSOMwith W-LISSOMBot generated inputs turned out not to be viable. The two complicatingfactors which gave rise to this are as follows.
1. The major issue with the simulation is that dorsal and ventral whisker deflectionsare difficult to obtain. In a basic set-up W-LISSOMBot navigates its environmentprimarily by moving forwards. In a simple environment this will tend to affect thewhiskers by deflecting them caudally. If it is made to turn left or right, or forced to
3Purpose-built by Charles Fox with the ABRG, and hence not by myself.
60
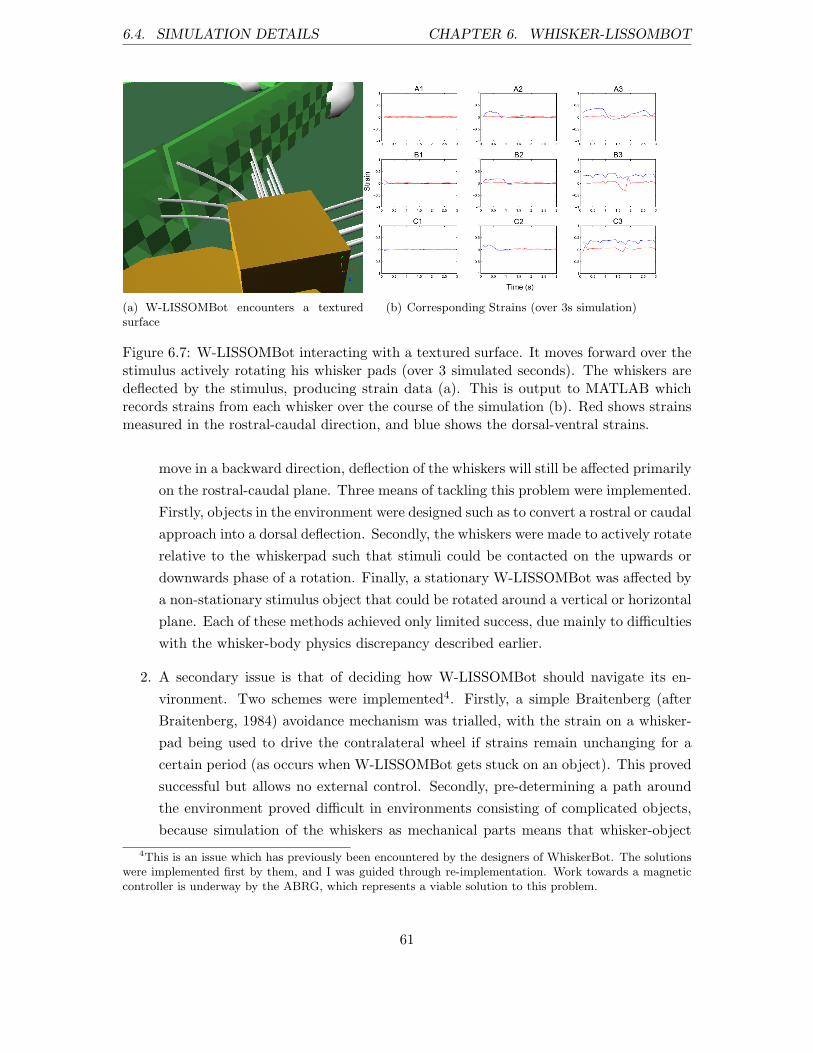
6.4. SIMULATION DETAILS CHAPTER 6. WHISKER-LISSOMBOT
(a) W-LISSOMBot encounters a texturedsurface
(b) Corresponding Strains (over 3s simulation)
Figure 6.7: W-LISSOMBot interacting with a textured surface. It moves forward over thestimulus actively rotating his whisker pads (over 3 simulated seconds). The whiskers aredeflected by the stimulus, producing strain data (a). This is output to MATLAB whichrecords strains from each whisker over the course of the simulation (b). Red shows strainsmeasured in the rostral-caudal direction, and blue shows the dorsal-ventral strains.
move in a backward direction, deflection of the whiskers will still be affected primarilyon the rostral-caudal plane. Three means of tackling this problem were implemented.Firstly, objects in the environment were designed such as to convert a rostral or caudalapproach into a dorsal deflection. Secondly, the whiskers were made to actively rotaterelative to the whiskerpad such that stimuli could be contacted on the upwards ordownwards phase of a rotation. Finally, a stationary W-LISSOMBot was affected bya non-stationary stimulus object that could be rotated around a vertical or horizontalplane. Each of these methods achieved only limited success, due mainly to difficultieswith the whisker-body physics discrepancy described earlier.
2. A secondary issue is that of deciding how W-LISSOMBot should navigate its en-vironment. Two schemes were implemented4. Firstly, a simple Braitenberg (afterBraitenberg, 1984) avoidance mechanism was trialled, with the strain on a whisker-pad being used to drive the contralateral wheel if strains remain unchanging for acertain period (as occurs when W-LISSOMBot gets stuck on an object). This provedsuccessful but allows no external control. Secondly, pre-determining a path aroundthe environment proved difficult in environments consisting of complicated objects,because simulation of the whiskers as mechanical parts means that whisker-object
4This is an issue which has previously been encountered by the designers of WhiskerBot. The solutionswere implemented first by them, and I was guided through re-implementation. Work towards a magneticcontroller is underway by the ABRG, which represents a viable solution to this problem.
61

6.5. TEXTURE DISCRIMINATION CHAPTER 6. WHISKER-LISSOMBOT
interactions result in a significant force on the body component, causing deviationsfrom the set path that are problematic to correct.
Resolving issues with simulated physics and control systems is beyond the immediate scopeof this project. However when the solutions are fully realised W-LISSOMBot will provea useful tool for investigating how the rat’s environment effects cerebral processing (seediscussion).
6.5 Texture Discrimination
As a proof-of-concept for the potential success of an integrated W-LISSOM/W-LISSOMBotmodel, this section presents results whereby strain data generated in the Webots simulationare used to construct static input patterns resulting from interaction with three environ-mental objects. Figures 6.9, 6.10 & 6.11 illustrate how the entire system outlined in thisreport can give rise to a cortical image of W-LISSOM’s tactile environment.
62

6.5. TEXTURE DISCRIMINATION CHAPTER 6. WHISKER-LISSOMBOT
(a) A Diamond Texture (b) A Concave Surface
(c) A Studded Texture (d) Vertical Ridges
Figure 6.8: W-LISSOMBot Experiences Textures with its Whiskers. For reference, the‘diamond’ texture in the first sub-figure is an example of an unsuccessful attempt to affectdorsal-lateral deflections.
63

6.5. TEXTURE DISCRIMINATION CHAPTER 6. WHISKER-LISSOMBOT
Figure 6.9: W-LISSOMBot Inputs to W-LISSOM. As it moves forwards over the repeatingtexture depicted in A, W-LISSOMBot’s three rostral whiskers are released whilst the caudalones are still in contact with the first surface. Whiskers are colour-coded; A3 is red, B2 ispurple and C1 is blue, showing how activity mediated by the whiskerpad shown in panelA correspond with the coloured ganglion in panel B. Strain data generated by each is usedto construct deflection vectors, which are presented to the corresponding ring ganglionnetwork (i.e., those coloured the same, panel B). In panel C, W-LISSOMBot’s strains areconverted into firing rates, and in D rates are remapped onto the input sheet (with ganglioncells colourised as in previous figures). In E, the resulting activity is captured in modelcortical activity which represents the backwards deflection of the caudal whiskers in redpatches of activity, and the rostral three in blue regions of the pre-organised mapping (F).Thus W-LISSOM can ‘see’ the environment mediated to it via W-LISSOMBot. Axes forpanels B and C as for previous figures.
64

6.5. TEXTURE DISCRIMINATION CHAPTER 6. WHISKER-LISSOMBOT
Figure 6.10: W-LISSOMBot reverses over an angled surface, which is manifested in thedeflection map as activity in the blue, Westerly units of the pinwheels for the whiskersbeing deflected at this time point. See previous figure for an individual breakdown of theplots.
65

6.5. TEXTURE DISCRIMINATION CHAPTER 6. WHISKER-LISSOMBOT
Figure 6.11: Here W-LISSOMBot’s most dorsal and ventral six whiskers are deflected bycontact with an unusual object. Again, cortical ‘images’ of the interaction (E) emerge inthe angular deflection map (F).
66
Chapter 7
Discussion
This chapter will summarise and discuss the project. The discussion will be directed byproposals for future work with Whisker-LISSOM and Whisker-LISSOMBot.
7.1 Outcomes
The major outcomes of the project can be summarised as follows:
1. A systems level model of the processing pathway from the whiskers to the barrel cor-tex has been constructed. The model, W-LISSOM, is the only known application of aself-organising neural network to investigate barrel cortex development at the time ofwriting. The basic model is trained on patterns produced by directed spatial vectorsrepresenting the strains on an array of whiskers as the rat interacts with a simplestimulus. Units arranged in a ring compute firing rates as a dot-product betweenthe stimulus vector and a pre-assigned preferred vector (or MEA), approximatingthe rapidly-adapting response of trigeminal ganglion cells to a whisker deflection.Firing rates are re-mapped to have global whiskerpad topography but local disor-der, producing input pattern images which are used to construct the training set. Atwo-layer LISSOM-based neural network, presented with many such input patterns,updates afferent and inter-cortical weights under a Hebbian learning regime. Thenetwork self-organises to topographically map angular deflections of the whiskerslocally within a global somatotopic map.
2. The angular deflection mapping reproduced in simulation bears striking resemblanceto that discovered recently in the rat barrel cortex. A correlated, outward-radiatingpinwheel organisation of deflection preference emerges for each model whisker, coex-tensive with maintenance of a global somatotopic mapping.
67

7.2. PREDICTIONS CHAPTER 7. DISCUSSION
3. A series of experimental manipulations to the correlations in the training set resultin altered mapping which afford novel predictions of the physical system.
4. A more sophisticated training paradigm was designed in which input patterns aregenerated via analogy with a sweep of the whiskers against a specially-designed ob-ject. In this way input patterns can be defined as events in both space and time. Anaugmented W-LISSOM network organises deflection selectivity structures in a simi-lar way to that of the simple model, but is more complex and needs further probingto elucidate the underlying network behaviour.
5. A less abstract representation of the whiskers was developed in a virtual realityplatform. The Whisker-LISSOMBot simulation has limitations in its current instan-tiation but has the potential to support a rigorous investigation into the effect of theenvironment on self-organisation. Results from a pilot investigation support propos-als for future integration of the model with a physical robot simulation.
6. Extension of the basic LISSOM model to a non-visual sensory domain has been shownto be realisable. The self-organisational hypothesis for sensory cortical developmentas an activity-mediated learning process, is further validated.
7.2 Predictions
Computational models of neural systems can at best provide an existence proof for theplausibility of the theory that they represent. However, models can be used to formulatehypotheses as to how the system of subject will behave under experimental conditions. Ifthese predictions can be confirmed or rejected by experimental methods, the assumptionsof the model can be evaluated accordingly.
The model presented here predicts that the tactile experiences of the rat in the first fewweeks of life will guide the functional organisation of layer 2/3 barrel cortex. It makes threespecific predictions as to how altered tactile experiences would be manifest in topographicbarrel maps. Firstly, it predicts that if the angle at which a central whisker is deflectedduring cerebral maturation is un-correlated with that of its neighbours on the whiskerpad,its corresponding barrel field in layer 2/3 will organise into an inward-radiating pinwheeldeflection map. Secondly, the model predicts that if whisker deflections are uncorrelated,the cortex will maximise continuity in the representation of angular deflections on a moreglobal scale, merging representation across neocortical barrel fields to result in a far lessregimented mapping. Thirdly, results from the anti-correlated deflections experiment pre-dict that the orientation of the pinwheel organisations depends on the angle at which the
68
7.3. FUTURE WORK CHAPTER 7. DISCUSSION
whiskers are deflected with respect to the angle at which environmental stimuli are encoun-tered, and that an inward-radiating pinwheel mapping will emerge from whiskers deflectedtowards, rather than away from the stimulus.
Similar experiments could be performed on rats to evaluate these predictions, by lesion-ing the whiskers or re-wiring the primary afferents appropriately and investigating theresulting deflection selectivity maps. These experiments could easily be piloted using W-LISSOMBot.
Moreover, an intrinsic prediction stems from the correlated model itself. Andermann &Moore (2006) observed the deflection mapping in the barrel field for whisker D3, whichon the whiskerpad is surrounded on all sides by neighbouring whiskers. One might haveexpected only the central whisker, B2, to organise a well-defined barrel map in simulationgiven that it has immediate somatotopic neighbours and hence a source of correlation in alldirections. Indeed this is why the model was implemented with a minimum of nine whiskersin the first place, with the expectation that the B2 barrel would be the most promisingfor replicating the pinwheel map. However the simulation results prove otherwise, andtherefore one might predict discovery of maps for whiskers located on the whiskerpadperiphery which match that for D3. To explore this further, Whisker-LISSOM can easilybe scaled up to represent more whiskers.
7.3 Future Work
With little augmentation to the model, several properties of barrel cortex which mightarise from Hebbian self-organisation can be tested.
Firstly, the model should be applied to investigate other proposed topographic maps inthe barrel cortex. For example, a mapping of resonant frequency in arcs spanning entirecolumns of barrel fields has been reported to exist throughout the neocortex. Cells whoseprincipal whiskers are the larger caudal vibrissae respond to lower frequency whisker stim-ulation than do those for the more rostral vibrissae (Andermann et al., 2004). W-LISSOMwould certainly provide a good tool for investigating how Hebbian mechanisms might self-organise new mappings as they are likely to discovered, to be coextensive with one another.
Secondly the model can be used to investigate cortical plasticity. The somatotopic barrelcortex map is known to be highly plastic to environmental perturbation (for a comprehen-sive review of barrel cortex plasticity see Feldman & Brecht, 2005). For example, increasedstimulation of the whiskers due to development in an enriched environment results in alayer 2/3 response to controlled whisker stimulation that is more localised within the barrelfields defined in layer 4 (Polley et al., 2004; Frostig, 2006). This finding lends itself well
69
7.3. FUTURE WORK CHAPTER 7. DISCUSSION
to investigation under W-LISSOMBot, whereby the simple and complex virtual environ-ments that were developed as part of this project could be used to represent the controland enriched natural environments. Once the various limitations of the Webots simula-tion have been resolved, developing deflection maps under these two conditions could wellresult in the differential cortical responses found in real barrel cortex. The effect couldbe explained by the lateral connections, whereby over-stimulation would be expected toincrease a net inhibiting effect and thus sharpen cortical neighbourhoods. Hence a usefulpilot experiment could simply observe the network after increasing the strength of lateralinhibitory connections. It should be noted that what Polley et al. (2004) and later Frostig(2006) term an enriched environment, actually translates to a naturalistic environment,as it is enriched relative to that for controls bred in the laboratory. Therefore it is moreappropriate to refer to the complex simulation environment as the control condition, andthe simple environment as a deprivation condition.
Results from other deprivation paradigms might also be expected to be reproduced byW-LISSOM. For example, isolation of a single whisker on the whiskerpad (by removing allothers) results in a much wider-ranging propagation of lateral activity which originates fromthe principal barrel field (Fox, 2002). This too would likely be observed in a W-LISSOMmodel whereby inputs from all but one whisker are removed, as this would effectivelyremove extra-barrel competition for dominance of cortical space. The reverse effect wouldsimilarly be expected in a model with added whiskers representing the artificial whiskeraddition technique designed by Ohsaki et al., (2002). This technique allows growing extrawhiskers in the early stages of foetal development, with the result of the emergence of extrasomatotopy preserving barrelettes, barreloids and barrels.
Thirdly the model can be used to ascertain in greater detail the role of the lateral corticalconnections. The lateral connections in layer 2/3 barrel cortex are becoming more of afocus for experimentalists, and their properties uncovered thus far appear to agree withthe emphasis placed on them by LISSOM, and thus inherited by W-LISSOM. For exampleAjima & Tanaka (2005) investigated the spatial distribution of glutamate, GABAa andGABAb-mediated lateral connections in barrel neocortex in response to electrode stimu-lation of individual neurons. They measured synaptic efficacy as a function of distancefrom the stimulation site, and found that excitatory (glutamate) and GABAb inhibitoryactivations propagate further along the barrel rows than across them (GABAa propaga-tion was essentially isotropic). In line with the self-organisation hypothesis, the anisotropicspread of lateral connections could result from a similar anisotropic experience of whiskerdeflections in the developing rat, whereby the primary motion of active whisking and theresulting deflections is biased along the rostral-caudal axis. As an aside, this might actu-ally have been exaggerated in the problem encountered with the Webots simulation, where
70

7.4. AN INTEGRATED NEURAL SYSTEM CHAPTER 7. DISCUSSION
dorsal-ventral whisker deflections were difficult to obtain from W-LISSOMBot’s rostral-caudal motion. The anisotropic-experience hypothesis could quite easily be tested withW-LISSOM by biasing its training set for rostral-caudal deflections, and again novel pre-dictions for map development might emerge. The model would be expected to reproducethe lateral connectivity patterns of the real system, although the effect would likely alsobe manifested in the pinwheel organisation.
It is worth noting at this point that W-LISSOM has inherited an outstanding issue fromits antecedent, with regards its lateral cortical connections. That is that whilst long-rangelateral inhibition and short range lateral excitation support self-organisation, the reversescheme is actually in place in real cortical circuitry. This issue is currently being resolved inthe development of a new model, whereby long-range excitatory connections can facilitatea net inhibitory effect through inhibitory interneurons (Law & Bednar, 2007). As thisimproved model is developed, its strengths will be incorporated into W-LISSOM towardsa more complete description of the barrel cortex circuitry.
7.4 An Integrated Neural System
Outlined here is a proposal to build W-LISSOM into a more complete neural systemsmodel, by placing it in its immediate neuro-anatomical cortex. The idea is that an orderedtopological encoding of the whiskers’ experiences could provide a common language bywhich sub-cortical structures could communicate. More specifically, such a representationmight facilitate communication between complementary computational models of the basalganglia and thalamus.
The basal ganglia are a collection of highly interconnected sub-cortical structures, whichhave been implicated in a wide range of cognitive processes. It has recently been proposed(Redgrave et al., 1999) that the basal ganglia afford a solution to the problem of ‘actionselection’: To select and appropriately switch between requests for access to limited re-sources, based on the saliency attributed to those requests. Starting from a bottom-updecomposition of the basal ganglia circuitry (Gurney et al., 2001a), Gurney et al. (2001b)have devised a full computational model of the system (henceforth the GPR model), whichfulfills the criteria for an action selection device as outlined by Redgrave et al. (1999).
The GPR model affords two major hypotheses, which could support processing of theW-LISSOM deflection preference map to produce appropriate actions for W-LISSOMBot.First, channels representing ‘requests’ for common resources are topographically main-tained in discrete cell populations throughout processing. In the GPR model this is as-sumed to be achieved via a scheme of off-centre on-surround feed-forward connections.
71
7.4. AN INTEGRATED NEURAL SYSTEM CHAPTER 7. DISCUSSION
Second, requests are represented in terms of a common currency of salience. The proposalis that whisker-mediated activity in the deflection map could be used to represent theserequests. For example, when the whiskers interact with a texture, a cortical representationof that texture will emerge in the map as a topologically defined firing pattern (as shown infigures 6.9, 6.10 and 6.11). The cortical response associated with texture A could thereforebe processed in basal ganglia channel A, whereas that for texture B would be processedin a separate channel B. By associating an action request (i.e. switching from exploratoryto foveal whisking perhaps) with the cortical patterns produced by the experience of eachtexture, the GPR model could channel W-LISSOMBot’s actions accordingly and hence itcould respond to novelty in its environment. In terms of a control system this could ofcourse be ‘hacked’ very easily by other means. However action selection through texturediscrimination, in a hybrid model grounded in neurophysiological observations, would bea significant achievement.
A major omission from the model thus far is the lack of an hypothesis regarding thecontribution of the thalamus to whisker processing. An extension of the proposed hybridGPR-W-LISSOM system could include a simple model of the thalamus as an attentionalmechanism, bridging sub-cortical and cortical processing. As a theoretical motivation fordoing so, Crick’s (1984) influential ‘searchlight hypothesis’ postulates that
“If the thalamus is the gateway to the cortex, the reticular complex mightbe described as the guardian of the gateway” (page 4587).
Thus it suggests that the reticular complex controls a metaphorical searchlight, intensify-ing processing for selected areas of the cortex. The claim is based on the following neuro-anatomical observations, amongst others. Firstly, all dorsal thalamo-cortical axons passthrough the reticular complex of the thalamus, as do all cortico-thalamic axons. Secondly,reticular inputs and outputs are topographically arranged, such that both thalamo-corticaland cortical-thalamic projections pass through it in similar local areas. Thirdly there isat least a crude topographic map of the entire sensory cortex on the reticular complex.Hartings et al. (2000) have provided direct electrophysiological evidence for this general-purpose hypothesis of thalamic function in the whisker system. They suggest that byregulating the baseline activity of VPM neurons, the reticular thalamic complex may indi-rectly enhance the response selectivity of layer 4 barrel neurons to synchronous thalamicfiring.
The thalamic reticular complex could be represented in W-LISSOM as an intermediarysheet between those for the barrelettes and the cortex. Channeled output from the basalganglia could then be used to direct activity to salient cortical regions and therefore serve
72

7.4. AN INTEGRATED NEURAL SYSTEM CHAPTER 7. DISCUSSION
as an attention system. In support of such a scheme, the Kyriazi-Simons model (Kyriazi& Simons, 1993) of intra-barrel thalamo-cortical processing predicts a function of thalamicrelay neurons for biasing cortical responses to temporal correlates between whisker inputs.This more detailed model describes the thalamo-cortical system by incorporating nonlinearneuronal properties to a similar cortical interconnectivity scheme to that of W-LISSOM.In the model, cortical outputs are governed by a system of differential equations, definingsynaptic efficacy by integrating spatial and temporal spiking data recorded from real neu-rons. Perhaps there is a middle ground between the details of the Kyriazi-Simons modelregarding the thalamus, and the successes of LISSOM as a model of cortex, that could oneday be implemented in W-LISSOM.
Perhaps the most exciting research with an integrated systems platform would stem fromthe interaction between barrel cortex and a model of the hippocampus, which is currently indevelopment by the ABRG (personal communications, August 2007). If whisker-mediatedtextures can be made available to the network, then a comprehensive model of hippocam-pus might be able to learn associations between experiences of a specific texture and W-LISSOMBot’s spatial location during that experience. If such a system proves viable,W-LISSOMBot could be subjected to spatial learning experiments, to help elucidate thepotential role of the cortex in the encoding of texture cues, in their spatial context. Ina similar scheme, reinforcement learning could be investigated through the basal gangliamodel, which uses separate D1 and D2 dopamine receptors sites to channel action requests.
Integration of W-LISSOM with these various models would likely require a more sophis-ticated afferent encoding scheme than that which has been used in the present work. Apotential limitation of the current afferent projection is that the representation of the in-put space is based on a rate-coding scheme. Rate-coding lends itself well to capturing thetopography of the input space, which is clearly very important when investigating topo-graphic maps. However, it limits the extent to which temporal dimensions of the inputspace can be conveyed to the network. This has implications less for self-organisation itself,but more so for extending the network as a texture classifier. An initial improvement to thecurrent afferent encoding regime would be to remove the half-wave rectification imposedon the ganglion ring network. In this way the contribution of depressed mechanoreceptorsto the firing rate of the ganglion cells can be evaluated. A further step towards a morecomplete temporal-encoding regime could re-define the stimulus surface used to producespatial-temporal firing pattern in the model presented in chapter 5. Instead of using aGaussian function to represent the diminishing whisker deflection, a function that approx-imates the RA-SA response curve (figure 2.3) over time during a deflection could be used.Returning to the former analogy, this would mean that the ganglion cells would fire ac-cording to an RA-SA profile when they are swept outwards from the pipe. However a more
73

7.4. AN INTEGRATED NEURAL SYSTEM CHAPTER 7. DISCUSSION
substantial improvement to the encoding regime would be to integrate the basic systemwith the follicle-sinus-complex (FSC) model of Mitchinson et al. (2004). This model takesas input a deflection vector, and outputs a spike-train in a population of artificial ganglioncells, which agrees well with the RA-SA spiking data, and is also based on a bottom-updecomposition of the system. The FSC model is already supported under Brahms, so inte-gration with W-LISSOM should be a simple and fruitful exercise1. Outputs from the FSCmodel could be ported directly into an augmented version of W-LISSOM (spike-train inputis supported in Topographica, under SLISSOM or Spiking-LISSOM; Choe & Miikkulainen,1998). Hence the potential contribution of the RA and SA spiking cells to self-organisationcould be systematically evaluated.
1Preliminary steps in doing this are underway at the time of writing. Acknowledgments to Ben Mitchin-son for supporting this work.
74

Chapter 8
Conclusions
This project has been very successful. The core finding is that self-organisation drivenby correlated whisker deflections can give rise to remarkably similar mappings of angulardeflection preference as that found in the barrel cortex. Therefore it is felt that the workin this project represents a significant contribution to the literature on cortical map de-velopment and on self-organising neural systems. Moreover, preliminary work has beenconducted towards a spatial-temporal model that can be embodied in a robot platform,and hence a potential for future contributions has been established.
This investigation has provided an existence-proof for the plausibility of the self-organisinghypothesis of barrel cortex development. It has further validated LISSOM as a powerfulmodel of sensory cortical development, and confirms that the principles by which it isgoverned can, and should, be applied to research in the somatosensory domain.
Moreover this project has validated self-organisation as a general-purpose tool for elicitingthe contribution of sensory experiences to the structure and function of the brain. AsElman et al. (1996) phrase it,
“Sensory neocortex appears to consist of a basic structure held in com-mon by all cortical areas, on which are superimposed a number of area specificdifferences. A reasonable hypothesis is that similar areas are intrinsically deter-mined, perhaps before interaction with extrinsic influences (via afferent inputs)have occurred. Conversely, differences between areas may arise from extrin-sic or afferent-induced factors, presumably at the latter stage of development.”Elman et al., 1996, p270. Original parentheses.
I agree.
75

CHAPTER 8. CONCLUSIONS
76
CHAPTER 8. CONCLUSIONS
Bibliography
Ahissar, E., Sosnik, R., & Haidarliu, S. (2000) Transformation from temporal to ratecoding in a somatosensory thalamocortical pathway. Nature, 406, 302-306.
Ajima, A., & Tanaka, S. (2005) Spatial patterns of excitation and inhibition evoked bylateral connectivity in layer 2/3 of rat barrel cortex. Cerebral Cortex, 16, 1202-1211.
Andermann, M.L., & Moore, C.I., (2006) A somatotopic map of vibrassa motiondirection within a barrel column. Nature Neuroscience, 9(4), 543-551.
Andermann, M.L., Ritt, J., Neimark., M.A., & Moore, C.I. (2004) Neural correlates ofvibrassa resonance; band-pass and somatotopic representation of high-frequency stimuli.Neuron, 42, 451-463.
Bednar J.A. & Miikkulainen, R. (2003) Self-organization of spatiotemporal receptive fieldsand laterally connected direction and orientation maps. Neurocomputing, 52-54, 473-480.
Berg, R.W., & Kleinfeld, D. (2003) Rhythmic whisking by rat: retraction as well asprotraction of the vibrissae is under active muscular control. The Journal ofNeurophysiology, 89, 104-117.
Braitenberg V. (1984) Vehicles: Experiments in Synthetic Psychology. Cambridge, MA:MIT Press.
Brecht, M., Preilowski, B., & Merzenich, M.M. (1997) Functional architecture of themystacial vibrissae. Behavioural Brain Research, 84, 81-97.
Brecht, M., & Sakmann, B. (2002) Whisker maps of neuronal subclasses of the rat ventralposterior medial thalamus, identified by whole-cell voltage recording and morphologicalreconstruction. The Journal of Physiology, 538, 495-515.
Bruno, R.M., Khatri, V., Land, P.W., & Simons, D.J. (2003) Thalamocortical angulartuning domains within individual barrels of rat somatosensory cortex. The Journal ofNeuroscience, 23, 9565-9574.
Carvell, G.E. & Simons, D.J., (1990) Biometric analyses of vibrissal tactile discriminationin the rat. The Journal of Neuroscience, 10, 2638-2648.
77
CHAPTER 8. CONCLUSIONS
Crick, F. (1984) Function of thalamic reticular complex: The searchlight hypothesis.Proceedings of the National Academy of Sciences, USA, 81, 4586-4590.
Dayan, P. & Abbott, L.F. (2001) Theoretical Neuroscience. Cambridge, MA: MIT Press.
Ebara, S., Kumamoto, K., Matsuura, T., Mazurkiewicz, J.E., and Rice, F.L. (2002).Similarities and differences in the innervation of mystacial vibrissal follicle-sinuscomplexes in the rat and cat: a confocal microscopic study. The Journal of ComparativeNeurology, 449, 103-119.
Elman, L.J., Bates, E.A., Johnson, M.H., Karmiloff-Smith, A., Parisi D. & Plunkett K.Rethinking Innateness: A Connectionist Perspective on Development. Cambridge, MA:MIT Press, 1996.
Erzurumlu, R.S., Chen, Z., & Jacquin, M.F. (2006) Molecular determinants of the facemap development in the trigeminal brainstem. The Anatomical Record Part A, 288A,121-134.
Feldman, D.E. & Brecht, M.B. (2005) Map plasticity in somatosensory cortex. Science,310, 810-815.
Fox, K. & Wong, R.O.L. (2005) A comparison of experience-dependent plasticity in thevisual and somatosensory systems. Neuron, 48, 465-477.
Furuta, T., Nakamura, K., & Deschenes, M. (2006) Angular tuning bias ofvibrissa-responsive cells in the paralemniscal pathway. The Journal of Neuroscience26(41), 10548-10557.
Fox, K. (2002) Anatomical pathways and molecular mechanisms for plasticity in thebarrel cortex. Neuroscience, 111(4), 799-814.
Frostig, R.D. (2006) Functional organisation and plasticity in the adult rat barrel cortex:moving out-of-the-box. Current Opinion in Neurobiology, 16, 445-450.
Gao, P., Bermejo, R., Zeigler, H.P. (2001) Whisker deafferentation and rodent whiskingpatterns: behavioral evidence for a central pattern generator. The Journal ofNeuroscience 21, 5374-5380.
78

CHAPTER 8. CONCLUSIONS
Godde, B. Leonhardt, R., Cords, S.M., & Dinse, H.R. (2002). Plasticity of orientationpreference maps in the visual cortex of adult cats. Proceedings of the National Academyof Sciences, USA, 99(9), 6352-6357.
Gurney, K., Prescott, T.J., & Redgrave, P. (2001a). A computational model of actionselection in the basal ganglia I: A new functional anatomy. Biological Cybernetics, 84(6),401-410.
Gurney, K., Prescott, T.J., & Redgrave, P. (2001b). A computational model of actionselection in the basal ganglia II: Analysis and simulation of behaviour. BiologicalCybernetics, 84(6), 411-423.
Hafner, V.V. (2005) Cognitive maps in rats and robots. Adaptive Behaviour, 13, 87-96.
Hartings, J.A., Temereanca S., & Simons, D.J. (2000) High responsiveness and directionsensitivity of neurons in the rat thalamic reticular nucleus to vibrissa deflections. TheJournal of Neurophysiology, 83, 2791-2801.
Hebb, D.O. The organisation of behaviour. New York: John Wiley, 1949.
Hemelt, M., & Keller, A. (2007) Superior sensation: superior colliculus participation inrat vibbrissae system. BMC Neuroscience, 8(12).
Hubel, D., & Wiesel, T. (1962) Receptive fields, binocular interaction and functionalarchitecture in the cat’s visual cortex. The Journal of Physiology, 160, 106-154.
Jones, L.M., Depireux, D.A., Simons, D.J., & Keller, A. (2004) Robust temporal codingin the trigeminal system. Science, 304, 1989-1993.
Kaas, J.H., Nelson, R.J., Sur, M., & Merzenich, M.M. (1981) Organisation ofsomtosensory cortex in primates. In Schmitt F.O., Worden F.G., Adelman G., & DennisS.G. (Eds) The organisation of the cerebral cortex (237-261) Cambridge, MA: MIT Press.
Killackey, H.P. (1980) Pattern formation in the trigeminal system of the rat. Trends inNeurosciences, 3, 303-306.
Knutsen, P.M., Derdikman, D., & Ahissar, E. (2005) Tracing whisker head movements inunrestrained behaving rodents. The Journal of Neurophysiology, 93, 2294-2301.
79

CHAPTER 8. CONCLUSIONS
Kwegyir-Afful, E., Bruno R.M., Simons D.J., & Keller A. (2005) The role of thalamicinputs in surround receptive fields of barrel neurons. The Journal of Neuroscience,25(25), 5926-5934.
Kyriazi, H.T. & Simons, D.J. (1993) Thalamocortical response transformations insimulated whisker barrels. The Journal of Neuroscience, 13(4), 1601-1615.
Law, J.S. & Bednar, J.A. (2007) Reconciling models of surround modulation and V1feature map development. Presented at the Sixteenth Annual ComputationalNeuroscience Meeting: CNS 2007, Toronto, Canada, July 7-12.
Leiser, S.C. & Moxon, K.A. (2006) Relationship between physiological response type (RAand SA) and vibrissal receptive field of neurons within the rat trigeminal ganglion. TheJournal of Neurophysiology, 95, 3129-3145.
Lichtenstein, S.H., Carvell, G.E. & Simons, D.J., (1990) Responses of rat trigeminalganglion neurons to movements of vibrissae in different directions. Somatosensory &Motor Research, 7, 47-65.
Ma, P.M. & Woolsey, T.A. (1984) Cytoarchitectonic correlates of the vibrissae in themedullary trigeminal complex of the mouse. Brain Research, 306, 374-379.
Miikkulainen, R., Bednar, J.A., Choe, Y., & Sirosh, J. (2005) Computational Maps in theVisual Cortex. Springer, Berlin.
Minnery, B.S. & Simons, D.J., (2003) Response properties of whisker-associatedtrigeminothalamic neurons in rat nucleus principalis. The Journal of Neurophysiology,89, 40-56.
Mitchinson, B., Gurney, K.N., Redgrave, P., Melhuish, C., Pipe, A.G., Pearson, M.,Gilhespy, I. & Prescott, T.J. (2004) Empirically inspired simulated electro-mechanicalmodel of the rat mystacial follicle-sinus complex. Proceedings of the Royal Society ofLondon B, 271, 2509-2516.
Mitchinson, B., Pearson, M., Melhuish, C. & Prescott, T.J. (2006) A model ofsensorimotor co-ordination in the rat whisker system, In From Animals to Animats 9:Proceedings of the Ninth International Conference on Simulation of Adaptive Behaviour,(Lecture Notes in Artificial Intelligence, 4095), 77-88, Springer-Verlag: Berlin.
80

CHAPTER 8. CONCLUSIONS
Ohki, K., Chung, S., Ch’ng, Y.H., Kara, P. & Reid, R. (2005) Functional imaging withcellular resolution reveals precise micro-architecture in visual cortex. Nature, 7026, 597-603.
Ohsaki, K., Noriko, O., & Nakamura, S. (2002) Altered whisker patterns induced byectopic expression of Shh are topographically represented by barrels. DevelopmentalBrain Research, 137, 159-170.
Pali, J., Rencz, B., & Hamori, J. (2000) Innervation of a single vibrissa in thewhisker-pad of rats. Neuroreport 11, 849-851.
Pearson, M., Gilhespy, I., Melhuish, C., Mitchinson, B., Nibouche, M., Pipe, A., Prescott,T. (2005) A biomimetic haptic sensor. International Journal of Advanced RoboticSystems 2, 335-343.
Petersen, C.H. (2003) The barrel cortex—integrating molecular, cellular and systemsphysiology. Pflugers Arch, The European Journal of Physiology, 447, 126-134.
Polley, D.B., Kvasnak, E. & Frostig, R.D. (2004) Naturalistic experience transformssensory maps in the adult cortex of caged animals. Nature, 429, 67-71.
Redgrave, P., Prescott, T.J., & Gurney, K.N. (1999). The basal ganglia: a vertebratesolution to the selection problem? Neuroscience, 89, 1009-1023.
Sengpiel, F. & Bonhoeffer, T. (2002) Orientation specificity of contrast adaptation tovisual cortical pinwheel centres and iso-orientation domains. European Journal ofNeuroscience, 15(5), 876-886.
Sharma, L., Angelucci, A, & Sur, M. (2000) Introduction of visual orientation modules inauditory cortex. Nature, 404(6780), 841-847.
Shoykhet, M., Doherty, D. & Simons, D.J., (2000) Coding of deflection velocity andamplitude by whisker primary afferent neurons: implications for higher level processing.Somatosensory & Motor Research, 17, 171-180.
Simons, D.J. (1995) Neuronal integration in the somatosensory whisker/ barrel cortex.In: The Barrel Cortex of Rodents, edited by Jones EG and Diamond IT. New York:Plenum, 262-298.
81

CHAPTER 8. CONCLUSIONS
Sirosh, J., Miikkulainen, R., & Bednar, J.A. Self-organization of orientation maps, lateralconnections, and dynamic receptive fields in the primary visual cortex. In Sirosh et al.editors, Lateral Interactions in the Cortex: Structure and Function. UTCS NeuralNetworks Research Group, 1996.
Stafford, T. & Wilson, S. P. (2007) Self-organisation can generate the discontinuities inthe somatosensory map, Neurocomputing, 70(10-12), 1932-1937.
Stuttgen, M.C., Ruter, J. & Schwarz, C. (2006) Two psychophysical channels of whiskerdeflection in rats align with two neuronal classes of primary afferents. The Journal ofNeuroscience, 26(30), 7933-7941.
Szwed, M. & Ahissar E. (2006) Mapping the gates. Focus on “Relationship betweenphysiological response type (RA and AS) and vibrissal receptive field of neurons withinthe rat trigeminal ganglion”. Journal of Neurophysiology, 95, 2729-2730.
Szwed, M., Bagdasarian, K., & Ahissar, E. (2003) Encoding of vibrissal active touch.Neuron 40, 621-630.
Temereanca, S. & Simons, D.J. (2004) Functional topography of corticothalamic feedbackenhances thalamic spatial response tuning in the somatosensory whisker/barrel system.Neuron, 41, 639-651.
Theunissen, F.E. & Miller, J.P. (1991) Representation of sensory information in thecricket cercal sensory system. II. Information theoretic calculation of system accuracyand optimal tuning-curve widths of four primary interneurons. Journal ofNeurophysiology, 66, 1690-1703.
Veinante, P. & Deschenes, M. (1999) Single- and multi-whisker channels in the ascendingprojections from the principal trigeminal nucleus of the rat. The Journal of Neuroscience19, 5085-5095.
Weliky, M., Bosking, W.H. & Fitzpatrick, D. (1996) A systematic map of direction prefer-ence in primary visual cortex. Nature, 379, 725-728.
Zucker, E. & Welker, W.I. (1969) Coding of somatic sensory input by vibrissae neurons inthe rat’s trigeminal ganglion. Brain Research, 12, 138-156.
82