self- introduction
DESCRIPTION
Self- introduction. Name: 鲍鹏 (Peng Bao) Research Interests: Popularity Prediction, Information Diffusion, Social Network , etc… Grade: In the third year pursuing for the PhD. Group: NASC(Network Analysis and Social Computing) Lab: Research Center of Web Data Science & Engineering - PowerPoint PPT PresentationTRANSCRIPT
Self-introduction
Name: 鲍鹏 (Peng Bao)
Research Interests: Popularity Prediction, Information Diffusion, Social Network , etc…
Grade: In the third year pursuing for the PhD.
Group: NASC(Network Analysis and Social Computing)
Lab: Research Center of Web Data Science & Engineering
Doctoral supervisor: Prof. Xue-Qi Cheng
popularity prediction in Microblogging Network
——An empirical study
Authors: Peng Bao, Hua-Wei Shen, Junming Huang, Xue-Qi Cheng
Previous Work
Outline
Background & Motivation Problem definition Related works Preliminary study Structural characteristics Prediction & Results Conclusions and Discussions
Background
BURST of SNS Everyone is a member in
the We the Media age! Sina Weibo plays an more and
more important social role. Opportunities and Challenges
Special issues in Sci./Nat. Computational social science
[D. Lazer et al. Science 323, 721-724 (2009)]

Challenging
An interesting and fundamental question How to track, to understand, and to predict the
information flow on the network? To predict the long-term popularity of online
content is very HARD! Popularity is unequally distributed.
high interaction among users intrinsic interestingness of content external influence from traditional media active period of users

Motivation
Popularity prediction is USEFUL! From technology view
Drive enterprises to design a cost-effective cache and content distribution mechanism system
From business view Help journalists, content providers, advertisers, news
recommend systems to provide information services and to design viral marketing strategy
From sociology view Reveal the human collective behavior Facilitate governors to supervise and to guide public opinion
Increasing availability of data
increase Predictability!
Increasing availability of data
increase Predictability!

Problem definition
Popularity prediction: Given a tweet and its forward information before an indicating time ti, We want to predict the popularity p(tr) at a reference time tr. Indicating time ti : The time at which we observe the
information of a tweet. Reference time tr : The time at which we intend to
predict the popularity of a tweet. Popularity p(t) : The number of times that a tweet is
re-tweeted at time t.

Related works
Temporal correlation based[SzaBo et al. C ACM 2010]
Strong correlation between
Early and later log popularity Linear regression
Visibility and Interestingness based[Lerman et al. WWW 2010]
User behavior modeling Estimate the interestingness

Related works cont.’
Matrix Factorization based[Cui et al. SIGIR 2011]
Estimate the latent factor
of user and item Feature based[Hong et al. WWW 2011]
Formalized to classification problem Logistic regression
Temporal pattern based [Matsubara et al. KDD 2012]
Periodical Avoid infinity Power-law decay
Existing methods mainly focused on the quality of content, the interface of the social media site, the collective behavior of users.
We focus on the structural characteristicsof the networks spanned by early adopters We focus on the structural characteristicsof the networks spanned by early adopters

Preliminary study
Popularity distribution
The popularity of tweets roughly follows a power-law distribution, distributes very unequally. The popularity of tweets roughly follows a power-law distribution, distributes very unequally.
Preliminary study
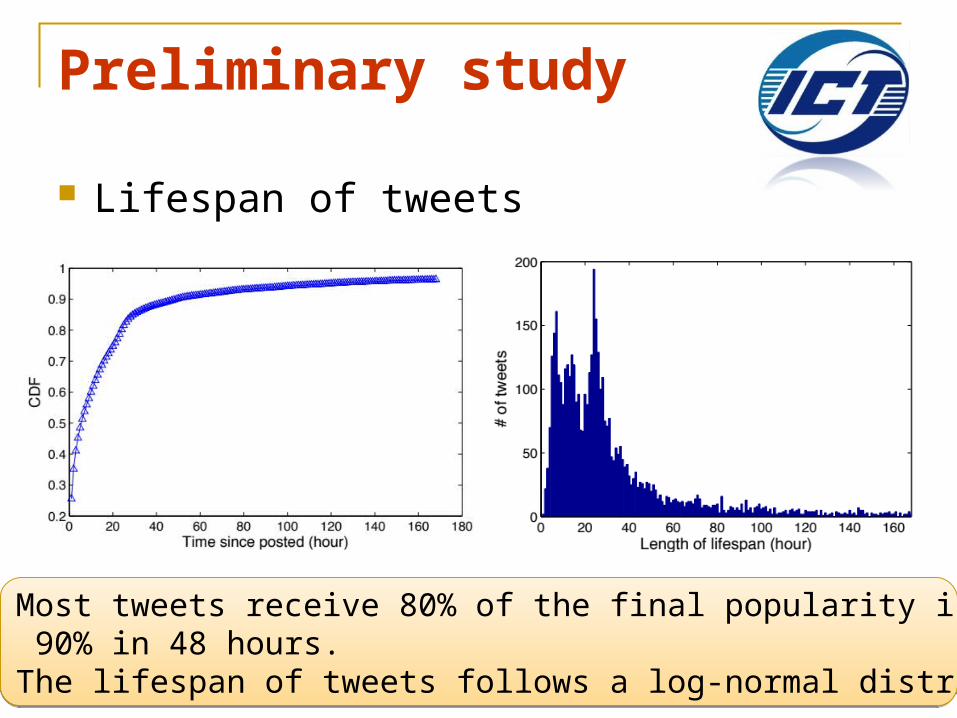
Lifespan of tweets
Most tweets receive 80% of the final popularity in 24 hours and 90% in 48 hours. The lifespan of tweets follows a log-normal distribution.
Most tweets receive 80% of the final popularity in 24 hours and 90% in 48 hours. The lifespan of tweets follows a log-normal distribution.

Preliminary study
Active period
We should consider the variation in hourly activity cycles The daily variation has no obvious relationship with week cycle and are event-related.
We should consider the variation in hourly activity cycles The daily variation has no obvious relationship with week cycle and are event-related.
“Wenzhou train collision”“Wenzhou train collision”

Temporal correlation of logarithmic popularity
The correlation is weak with large deviation. The Pearson Correlation Coefficients is 0.74 It is less reliable to predict the popularity of a tweet if we just use its earlier popularity alone.
The correlation is weak with large deviation. The Pearson Correlation Coefficients is 0.74 It is less reliable to predict the popularity of a tweet if we just use its earlier popularity alone.

Structural characteristics
We explore the network consisting of early adopters Link density: the ratio of
the number of existing follow-
ship links and the number of
all possible links. Diffusion depth: the length
of the longest path from the
submitter to anyone of them.

Structural characteristics
Empirical found
The structural characteristics provide strong evidence to help estimate the final popularity The structural characteristics provide strong evidence to help estimate the final popularity

Prediction and Results
Comparison approaches: Evaluation methods:
Experiment results

Conclusions
We empirically study structural characteristics, which can provide critical indicators
The prediction accuracy can be significantly improved by incorporating the factor of structural diversity
The conclusion capture the intuition It provides us INSIGHTS to further study
Discussions
Accumulative effect Temporal characteristics Event-based prediction

accumulative Effect of Multiple Exposure in Information
Diffusion on Social Network
On-Going Work

Exposures and Adoptions
Exposures: Node’s neighbor exposes the
node to the contagion Adoption: The node acts (e.g. re-tweet) on
the contagion
t3
t1
t2
Time: t1 < t2 < t3 < … < tn

Problem definition
Exposure Curve: Probability of
re-tweeting a tweet for a user
depends on the number of friends
who have already re-tweeted. Dependence

Example Application
Marketing agency: would like you to adopt/buy product X
They estimate the adoption curve
Should they expose you to X three times? Or, is it better to expose you X, then Y and
then X again?

What we are doing
Classify the TWEETS by Has URL or not Has Event or not Has Multiple Events or not Deeper analysis on the ME for different event
Classify the USERS by User’s degree User’s active period Local clustering coefficient

What we are doing cont.’
Structural diversity between the source of multiple exposures Fix the number of exposure times, check
Link density Number of connected components Temporal effect
Temporal motif
You will see the results soon!You will see the results soon!

Closing Remarks
We should do MORE…
We knew A LITTLE.
We have done MANY!
This field is a piece of WILD but Fertile mineral land.

Acknowledgement
Thank to all members in the NASC group (www.groupnasc.org) for helpful discussions and suggestions
Collaborators
Xue-Qi Cheng, Hua-Wei Shen, Junming Huang
