self-desiccation and its importance in …ciks.cbt.nist.gov/~bentz/lund2005/tvbm-3126hp1.pdfconcrete...
TRANSCRIPT
Proceedings of the Fourth International Research Seminar, Gaithersburg, Maryland, USA, June, 2005
Report TVBM-3126
SELF-DESICCATIONAND ITS IMPORTANCE IN CONCRETE TECHNOLOGY
Editors: B Persson, D Bentz and L-O Nilsson
LUND INSTITUTE OF TECHNOLOGY LUND UNIVERSITY
Division of Building Materials

ISRN LUTVDG/TVBM--05/3126--SE(1-270) ISSN 0348-7911 TVBM ISBN 91-631-7102-3
Lund Institute of Technology Telephone: 46-46-2227415 Division of Building Materials Telefax: 46-46-2224427 Box 118 www.byggnadsmaterial.lth.se SE-221 00 Lund, Sweden

PREFACEThis is the fourth Research Seminar on Self-Desiccation in Concrete organized by the Building Materials Division of Lund University. The three previous seminars were held in 19971, 19992, and 2002.3 While the fourth seminar has a change in locale to the National Institute of Standards and Technology (NIST), it is hoped that the enthusiasm of the participants and the high technical quality of the presentations that have characterized the first three seminars will be maintained.
RILEM TC 196-ICC has defined self-desiccation as “the reduction in internal relative humidity of a sealed system when empty pores are generated. This occurs when chemical shrinkage takes place at the stage where the paste matrix has developed a self-supportive skeleton, and the chemical shrinkage is larger than the autogenous shrinkage.” While self-desiccation will thus occur in any concrete cured under sealed conditions, its effects are quite dependent on the sizes of the generated empty pores. These pore sizes in turn are dependent on the initial water-to-binder ratio (w/b), the particle size distributions of the binder components, and their achieved degree of hydration. The continuing trends towards finer cements and much lower w/b have significantly reduced the capillary pore “diameters” (spacing) in the paste component of the fresh concrete, and have often resulted in materials and structures where the effects of self-desiccation are all to visible as early-age cracking. Many strategies for minimizing the detrimental effects of self-desiccation (mainly the high internal stresses and strains that may lead to early-age cracking), such as internal curing, rely on providing a “sacrificial” set of larger water-filled pores within the concrete microstructure that will empty first while the smaller pores in the hydrating binder paste will remain saturated. It must be kept in mind that the effects of self-desiccation are not always detrimental, as exemplified by the benefits offered by self-desiccation in terms of an earlier RH reduction for flooring applications and an increased resistance to frost damage.
As this volume of proceedings contains contributions from authors representing nine different countries, it is obvious that the high level of international interest and ongoing research on this topic exhibited in the first three seminars is continuing. The understanding of the mechanisms by which self-desiccation occurs is now on a strong scientific foundation, and thus the research in this area is rapidly advancing from a basic to an applied phase, from the research laboratory to the field, and from concrete researchers to concrete practitioners. It is hoped that this volume will contribute both strength and durability to this technology transfer.
Gaithersburg, MD USA, May 2005
Dale Bentz
1 Persson, B., Fagerlund, G. (Eds.), Self-Desiccation and Its Importance in Concrete Technology, Report TVBM-3075, Div. Building Materials, Lund Institute of Technology, Lund University, Lund, 255 pp. (1997). 2 Persson, B., Fagerlund, G. (Eds.), Self-Desiccation and Its Importance in Concrete Technology, Report TVBM-3085, Div. Building Materials, Lund Institute of Technology, Lund University, Lund, 171 pp. (1999). 3 Persson, B., Fagerlund, G. (Eds.), Self-Desiccation and Its Importance in Concrete Technology, Report TVBM-3104, Div. Building Materials, Lund Institute of Technology, Lund University, Lund, 250 pp. (2002).

ii
Lund University, Lund, Sweden Photo: Madeleine Persson, 2005.
iii
TABLES OF CONTENTS PAGE
Part I - Basic topics
J.-H. Moon, F. Rajabipour, B. Pease, and J. Weiss 1
AUTOGENOUS SHRINKAGE, RESIDUAL STRESS, AND CRACKINGIN CEMENTITIOUS COMPOSITES: THE INFLUENCE OF INTERNAL AND EXTERNAL RESTRAINT
V. Baroghel-Bouny and P. Mounanga 21
EFFECTS OF SELF-DESICCATION ON AUTOGENOUS DEFORMATIONS, MICROSTRUCTURE AND LONG-TERM HYGRAL BEHAVIOUR
L.-O. Nilsson and K. Mjörnell 49
A MACRO-MODEL FOR SELF-DESICCATION IN HIGH PERFORMANCE CONCRETE
T. Noguchi, P. Sun-Gyu, and I. Maruyama 67
MECHANICAL PROPERTIES OF HIGH-PERFORMANCE CONCRETEWITH EXPANSIVE ADDITIVE AND SHRINKAGE REDUCING ADMIXTURE UNDER SIMULATED COMPLETELY-RESTRAINEDCONDITION AT EARLY AGE
Z.C. Grasley, D.A. Lange, A.J. Brinks, and M.D. D’Ambrosia 78
MODELING AUTOGENOUS SHRINKAGE OF CONCRETEACCOUNTING FOR CREEP CAUSED BY AGGREGATE RESTRAINT
B. Persson 95
ON THE TEMPERATURE EFFECT ON SELF-DESICCATION OFCONCRETE
S. Miyazawa and E.-i. Tazawa 125
PREDICTION MODEL FOR AUTOGENOUS SHRINKAGE OF CONCRETE WITH DIFFERENT TYPE OF CEMENT
Part II - Consequences
M. Suzuki, M. Tanimura, and R. Sato 139
THE EFFECT OF AUTOGENOUS SHRINKAGE ON FLEXURALCRACKING BEHAVIOR OF REINFORCED HSC BEAMS AND IMPROVEMENT BY USING LOW-SHRINKAGE HSC

iv
M.-C. Han and C.-G. Han 153
THE EFFECT OF SPECIMEN SIZE ON THE SHRINKAGE PROPERTIES OF HIGH PERFORMANCE CONCRETE
P. Lura, Y. Guang, K. Tanaka, and O.M. Jensen 165
MICROCRACK DETECTION IN HIGH-PERFORMANCE CEMENTITIOUS MATERIALS
M. Qin and B. Ni 179
MOISTURE DISTRIBUTION IN CEMENT PASTE CONSIDERING SELF-DESICCATION
Part III - Utilization
D. P. Bentz 189
CAPITALIZING ON SELF-DESICCATION FOR AUTOGENOUSDISTRIBUTION OF CHEMICAL ADMIXTURES
J.W. Roberts 197
CURRENT AND FUTURE TRENDS IN THE APPLICATION OF INTERNAL CURING OF CONCRETE
H. Lam and R. D. Hooton 210
EFFECTS OF INTERNAL CURING METHODS ON RESTRAINED SHRINKAGE AND PERMEABILITY
B.J. Mohr, L. Premenko, H. Nanko, and K.E. Kurtis 229
EXAMINATION OF WOOD-DERIVED POWDERS AND FIBERS FOR INTERNAL CURING OF CEMENT-BASED MATERIALS
M. Tanimura, Y. Mitani, and R. Sato 245
AN INVESTIGATION OF PREDICTION MODEL FOR AUTOGENOUS SHRINKAGE/EXPANSION STRAIN OF LOW-SHRINKAGE HSC
I. Maruyama and R. Sato 264
A TRIAL OF REDUCING AUTOGENOUS SHRINKAGE BY RECYCLED AGGREGATE

1
AUTOGENOUS SHRINKAGE, RESIDUAL STRESS, AND
CRACKING IN CEMENTITIOUS COMPOSITES: THE
INFLUENCE OF INTERNAL AND EXTERNAL
RESTRAINT
J.-H. Moon, F. Rajabipour, B. Pease, and J. Weiss Purdue University, West Lafayette, Indiana, USA
Abstract
The premise of this paper is that low water-to-cement ratio (w/c), higher strength concrete may undergo substantial volume changes, especially at early ages (< 24 hours), and the prevention of these volume changes can lead to invisible micro-cracking as well as visible through-cracking. This paper compares the predicted response of concrete undergoing autogenous shrinkage using two different models. The first model considers the concrete as a homogeneous material with effective elastic properties. The second model considers the concrete as a heterogeneous two-phase composite. The paper begins with an overview of common effective elastic property computations. These effective properties are then used to compute residual stresses when external restraint is provided. Heterogeneous system simulations were performed to quantify the effect of both internal and external restraint on shrinkage. Internal restraint may be caused by aggregate particles while the structure surrounding the concrete composite may produce external restraint. These simulations considered a series of ‘model systems’ ranging from a single aggregate particle, to an assembly of hexagonal unit cells containing aggregate particles, to a more realistic system consisting of various sizes and shapes of aggregate particles. The finite element analysis (FEA) simulations illustrate how localized stresses develop, how effective equivalent properties can be determined for heterogeneous composites, and how localized stresses can lead to cracking.
1. Research approach and motivation
This paper provides an overview of a research program that is currently being conducted at Purdue University. The objective of the overall program is to develop procedures to enable information from sensors placed in a concrete structure or pavement to be utilized efficiently as real-time feedback for updating performance simulation models [1]. While this project has many facets, one aspect of this work is to better understand how an embedded stress sensor may be used to quantify residual stresses in concrete. Toward this end, a series of preliminary computations have been performed to better understand the residual stresses that develop in a heterogeneous composite system when one phase (the paste phase) shrinks and the other phase (the aggregate phase) does not. Subsequent computations have been performed to investigate stresses that develop when both phases experience differential movement, though they will not be discussed in this paper.

2
The overall research program is being conducted to try to resolve a few key questions that need to be answered to enable residual stress sensors to be used more efficiently in concrete. This paper describes work to address the following potential concerns:
Numerous researchers and engineers frequently simplify concrete by assuming it behaves like a homogeneous material by using ‘effective material properties’. While this is commonly done, the impact of simplifications made to implement ‘effective material properties’ remain unclear, especially as these simplifications relate to micro-cracking which influences system compliance and durability.
While residual stress sensors are being developed, research is needed to address how the external boundary conditions influence the stress fields that develop around an aggregate with respect to directionality and magnitude.
Numerous studies are being conducted to assess how the mixture proportions of concrete can be optimized. The majority of these studies utilize parameters that can be easily measured like strength or free shrinkage to optimize mixture proportions. This study takes a more fundamental look at the influence of aggregate volume, shape, bond, and stiffness on resulting stress development, micro-cracking, and through-cracking. It is the goal of this research that through further studies, improved guidelines may be available to suggest how mixtures can be designed more efficiently to improve field performance.
This paper is divided into five main components. The first portion of the paper describes the overview and motivation for the research. The second section describes the typical computations that are used for determining the effective material properties of a composite by using the properties of each constituent. The following three sections of the paper (sections three, four, and five) discuss preliminary investigations aimed at understanding how external restraint influences the stresses around an aggregate and how micro-cracking develops in these systems. Section three discusses simulations and experiments that were performed in which a single aggregate is considered in a shrinking matrix. Section four considers a collection of hexagonal unit cells, each consisting of an aggregate in a paste matrix. Section five considers variable aggregate sizes and distributions. Finally section six provides an overview of the preliminary observations that can be made from this work.
It should be noted that the majority of the calculations in this paper assume the paste and aggregate to behave as non-aging, linear-elastic materials. This approximation enables the models to remain relatively simple. As the models are refined over time, age and time-dependent rheological material properties will be incorporated into these models.
2. Effective material property calculations
Concrete shrinks in response to drying, self-desiccation, and chemical reactions. The paste component is generally recognized as the component responsible for the shrinkage, while the aggregate component is frequently thought of as an ‘inert-filler’ that reduces the overall shrinkage of the concrete system. Several researchers in the 1950’s discussed how the shrinkage of a concrete ( Concrete) could be described as a

3
fraction of the shrinkage of the paste [2,3,4]. Pickett developed an expression that is frequently used to describe the relationship between the shrinkage of the paste and the shrinkage of the concrete (Equation 1).
nAggPasteConcrete )V1( (1)
where Paste is the shrinkage of the paste, VAgg is the volume fraction of the aggregate, and n is a constant for a particular system. To arrive at this formulation, Pickett considered the effect of spherical aggregate particles in a concrete composite. Pickett computed the restraining effect of aggregates by assuming that the aggregate and the concrete act elastically. Pickett assumed that the exponent n would be related to the relative elastic properties of the aggregate and the concrete. He developed a theoretical expression that showed that the value of n could range from 0 to approximately 2. This theoretical expression is somewhat difficult to use apriori however, as it requires a measure of the elastic modulus of the concrete composite. Pickett experimentally determined that the exponent n would have a value of 1.7 for mortars made using Ottawa sand [5].
L’Hermite [4] wrote an extensive summary of research on shrinkage and summarized the work of Dutron [6] where Equation 1 had been written in a slightly different form. In re-analyzing the results of Dutron using Equation 1, L’Hermite found that the exponent n ranged between 1.2 and 1.7 for normal strength mortars and concretes made using different aggregate. Recently, simulations were performed (using the planar geometry as described in section 4) where the exponent, n was related to the elastic modulus of the aggregates (figure 1). A hyperbolic equation (Equation 2) was fit to the data shown in figure 1
Agg
Paste1 E
EC1
1nn (2)
where n refers to the value of n for an infinitely stiff aggregate which can be taken as 1.405 and C1 is a constant that can be taken as 0.25. EPaste and EAgg are the elastic moduli of paste and aggregate, respectively. While Equation 2 may need to be modified to account for low paste moduli, different aggregate geometries, or differences in the Poisson’s ratio between the two materials, it appears possible to use this expression to estimate the free shrinkage of a concrete composite. It should be noted however that this simulation was performed for a planar geometry (assuming plane stress) and some differences may exist for a truly three-dimensional composite geometry.
This suggests that the overall shrinkage of a concrete can be reasonably estimated using Equation 1. Neville [7] points out that the aggregate restrains the shrinkage and this restraint causes residual stress to develop in the paste. However, while many authors use Equation 1 [8,9] to approximate the overall shrinkage, others [10] have cautioned against relying on such approximations. An objection that has been raised to the use of

4
Equation 1 may be attributed in part to the role of residual stresses that result in non-linearities associated with creep and microcracking in the system.
To measure the residual stresses that develop in a composite system, Dela and Stang [11] introduced an ‘aggregate sensor’ to measure the pressure on a spherical embedded inclusion inside a cement paste. They concluded that the effects of stress relaxation were substantial at very early ages while the subsequent stress development could lead to cracking. The authors of this paper have also previously attempted to measure the extent of microcracking in cement mortars using acoustic emission measurements [12,13].
Figure 2 shows the results of early-age measurements in terms of cumulative acoustic activity in externally unrestrained sealed mortar samples with different water-to-cement ratios (w/c) [13]. Substantial acoustic activity occurs in the specimens with the lower w/c at early ages. The specimens with a w/c of 0.30 showed the greatest number of acoustic events followed by the specimens with a w/c of 0.35, 0.40, and 0.50 respectively. It was hypothesized that the lower w/c mixtures undergo more autogenous shrinkage and as a result, they are more likely to experience higher residual stresses generated by the internal restraint from the aggregates. This implies that concrete made using a lower w/c would be more prone to microcracking due to the internal restraint of aggregates against autogenous shrinkage. The current paper builds on these observations and describes a series of experiments [13] in which the role of aggregate inclusions is investigated by using different model systems.
To understand how micro-cracking occurs in low w/c pastes, Pease et al. [13,14] used a low w/c cylindrical paste specimen. A steel rod was placed in the center of the paste specimen. This system was used to simulate the shrinkage of paste around an aggregate. Specimens were prepared with different paste-to-aggregate diameter ratios. An elastic “shrink-fit theory” [15] was used to try to interpret the results from the test. It was concluded that the maximum residual stress that develops in the paste could be computed using Equation 3 (after correcting the elastic modulus of paste to account for creep):
2OA
2OP
2OA
2OP
Paste
Agg
PasteAgg
2OA
2OP
2OA
2OP
PastePaste
RR
RR
E
tE1
RR
RR
tE (3)
where corresponds to Poisson’s ratios of paste (denoted with a subscript Paste) and aggregate (denoted with a subscript Agg), and R corresponds to the outer radius of the aggregate (denoted with a subscript OA) and the paste cylinder (denoted with a subscript OP), respectively.

5
0.01 0.1 1 10 100 1000Ratio of Aggregate and
Paste Stiffnesses (EAgg/EPaste)
0.00
0.25
0.50
0.75
1.00
1.25
1.50
Sh
rin
kag
e E
xp
on
en
t, n
0 4 8 12 16 20 24
0
50
100
150
200
250
300
3500.30 W/C0.35 W/C
0.40 W/C 0.50 W/C
Age of Specimen (hrs) C
um
ula
tive
Even
ts (
hit
s)
Figure 1 - Shrinkage exponent n as a Figure 2 - Acoustic activity in mortars function of the aggregate to paste at early ages (50% aggregate volume) stiffness ratio
Equation 3 was used to estimate the maximum stress level that could develop around the aggregate and to compare the cracking behavior of different specimens. As the aggregate volume increased (i.e., lower ROP/ROA) there was an increase in both the average residual stress level and the acoustic activity. As the paste radius decreased, the potential for through-cracking increased. Through-cracking was observed to correspond to a sudden rise in acoustic energy in these specimens.
Previous research assumed that acoustic activity is synonymous with the development of microcracking. To measure this more directly Lura et al. [16] are investigating the cracking around an idealized aggregate using gallium impregnation. The main benefit of gallium impregnation is that it could be performed without inducing additional cracking into the system; thereby, cracks are imaged as they were in the unperturbed specimen, before damage from preparation could occur.
As mentioned earlier, a composite system can be described by equivalent material properties such as the equivalent elastic modulus. Hansen [17] proposed an equation for calculating equivalent elastic modulus of a spherical composite which contains a spherical inclusion at the center of a sphere of the paste matrix (Equation 4).
Paste
AggAggPasteAgg
AggAggPasteAggcomposite E
E)V1(E)V1(
E)V1(E)V1(E (4)
To provide a simplified solution, Hansen assumed that the Poisson’s ratio was the same for each phase (0.20). Such equivalent material properties can be used directly to estimate the residual stress that would develop when concrete is completely restrained from shrinking freely by multiplying Equation 1 and Equation 4. This will be discussed in greater detail later in the paper.
6
3. Single aggregate prism systems
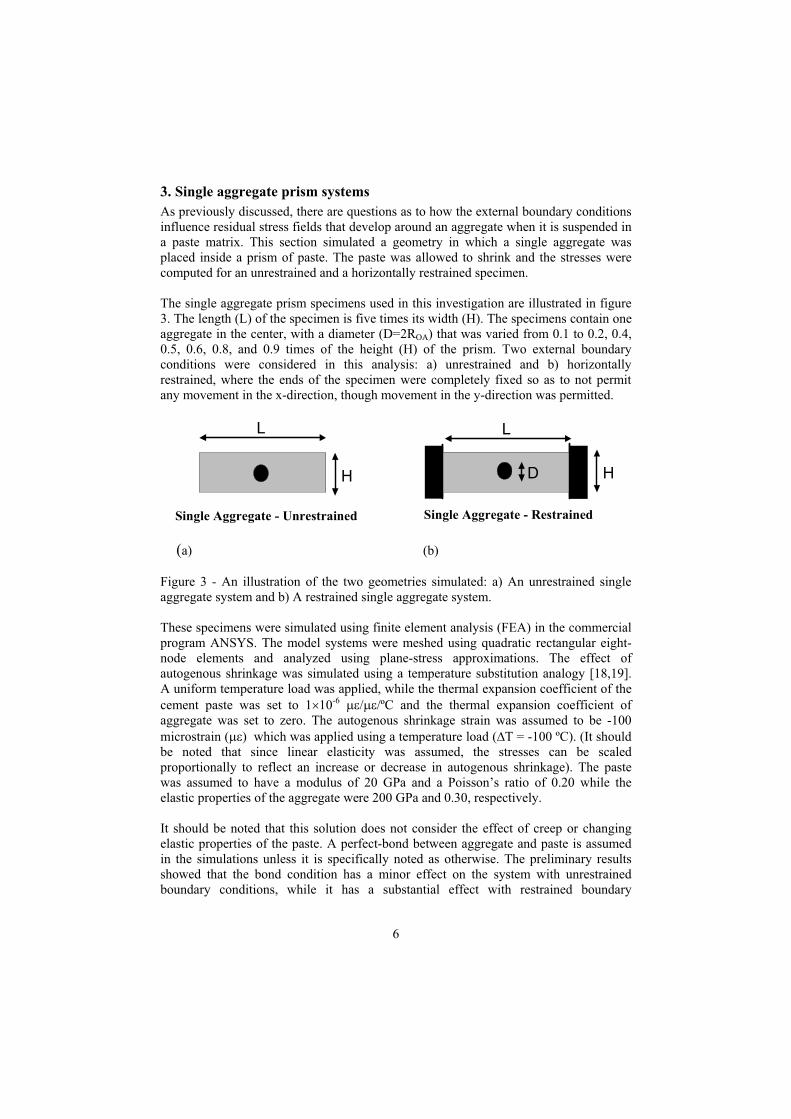
As previously discussed, there are questions as to how the external boundary conditions influence residual stress fields that develop around an aggregate when it is suspended in a paste matrix. This section simulated a geometry in which a single aggregate was placed inside a prism of paste. The paste was allowed to shrink and the stresses were computed for an unrestrained and a horizontally restrained specimen.
The single aggregate prism specimens used in this investigation are illustrated in figure 3. The length (L) of the specimen is five times its width (H). The specimens contain one aggregate in the center, with a diameter (D=2ROA) that was varied from 0.1 to 0.2, 0.4, 0.5, 0.6, 0.8, and 0.9 times of the height (H) of the prism. Two external boundary conditions were considered in this analysis: a) unrestrained and b) horizontally restrained, where the ends of the specimen were completely fixed so as to not permit any movement in the x-direction, though movement in the y-direction was permitted.
H
Single Aggregate - Unrestrained
L
D
L
H
Single Aggregate - Restrained
(a) (b)
Figure 3 - An illustration of the two geometries simulated: a) An unrestrained single aggregate system and b) A restrained single aggregate system.
These specimens were simulated using finite element analysis (FEA) in the commercial program ANSYS. The model systems were meshed using quadratic rectangular eight-node elements and analyzed using plane-stress approximations. The effect of autogenous shrinkage was simulated using a temperature substitution analogy [18,19]. A uniform temperature load was applied, while the thermal expansion coefficient of the cement paste was set to 1 10-6 / /ºC and the thermal expansion coefficient of aggregate was set to zero. The autogenous shrinkage strain was assumed to be -100 microstrain ( which was applied using a temperature load ( T = -100 ºC). (It should be noted that since linear elasticity was assumed, the stresses can be scaled proportionally to reflect an increase or decrease in autogenous shrinkage). The paste was assumed to have a modulus of 20 GPa and a Poisson’s ratio of 0.20 while the elastic properties of the aggregate were 200 GPa and 0.30, respectively.
It should be noted that this solution does not consider the effect of creep or changing elastic properties of the paste. A perfect-bond between aggregate and paste is assumed in the simulations unless it is specifically noted as otherwise. The preliminary results showed that the bond condition has a minor effect on the system with unrestrained boundary conditions, while it has a substantial effect with restrained boundary

7
conditions. A further discussion with respect to the bonding effect will be presented later in this paper.
Figure 4 shows stresses that developed along the x-axis and along the y-axis for two different external boundary conditions when the diameter of the aggregate (2ROA) is 0.1H. In the case of the unrestrained specimens, the residual stress level decreases as the distance from the aggregate increases (figure 4-a). This solution is similar to the stresses that develop in the ring test [13,20] although a slight correction is needed in the case of the larger aggregates to account for the top and bottom edges of the prism specimen. Very similar stresses develop in the x and y directions. It should be noted that, for this particular geometry, the bond between the aggregate and the matrix has little influence on the developed stresses. Numerical simulations have shown that the difference between the bonded and unbonded case is less than 7%. In pure cement paste specimens (i.e., no aggregate), the specimen will not experience any internal stress development under unrestrained boundary conditions. However, when aggregates are present, internal stresses develop at the interface between the two phases could result in internal microcracking.
In the externally restrained specimen (fully restrained in one direction) a stress gradient develops along the x-axis (i.e., for element A in figure 4) that is similar to the stress gradient in the unrestrained specimen. However, the externally restrained specimen develops a stress gradient along the y-axis (i.e., for element B in figure 4) that is much greater than the stresses that develop in the unrestrained specimen. This is not unexpected, however it should be noted that if a pure paste specimen were restrained, the residual stress in elements along the y-axis would be constant and equal to 2 MPa. As a result, the maximum stresses that develop in figure 4-b are approximately 14% higher than the specimen without aggregate at a small distance from the aggregate surface and similar to the specimen without aggregate at a sufficient distance away from the aggregate.
The results indicate that the inclusion of aggregate may increase the cracking potential of a specimen by combining the influence of internal restraint with the stresses that develop from the external restraint. It can also be noted that in the case of the unrestrained boundary conditions the stress level reduces quickly by moving away from the aggregate. However, in the case of the specimen with externally restrained boundary conditions, a high stress level is maintained even when moving away from the aggregate (in the y-direction). It can be imagined that if a small crack develops in the unrestrained specimen, this crack could reduce a substantial amount of the stored residual stress. As a result a microcrack could initiate yet there may not be enough stored energy to cause this crack to propagate across the specimen. However, the externally restrained specimen stores substantial energy which may not substantially decrease as the crack develops. Therefore, the externally restrained specimen will have the higher potential of through cracking when the crack initiates.

8
0 10 20 30
Distance from an aggregate (mm)
-2
-1
0
1
2
3
Str
ess (
MP
a) A
B
H
DOA
Unrestrained SingleAggregate Specimen
A
B
X
Y
0 10 20 30
Distance from an aggregate (mm)
-2
-1
0
1
2
3
Str
ess (
MP
a) A
B
Restrained SingleAggregate Specimen
A
B
H
DOA
X
Y
(a) (b)
Figure 4 - Stress development in an (a) Unrestrained single aggregate specimen and b) The externally restrained single aggregate specimen.
As previously discussed, the bond between the aggregate and paste has an important role on the stress development in a composite system when the composite is externally restrained. Figure 4-b shows that the maximum stress that develops along the y-axis (element B) is not at the aggregate-paste interface. This may be explained by the fact that the actual maximum stress develops along a diagonal (approximately 55o from the y-axis for the geometry shown) when the aggregate is perfectly bonded with cement paste (figure 5-a), whereas it develops along the y-axis when the aggregate is perfectly unbonded (figure 5-b). Assuming that the aggregate and paste are initially perfectly bonded, it could be expected that the tensile stresses that develop at the paste-aggregate interface could lead to microcracking (debonding). Therefore, it can be expected that the initial debonding initiates at the interface at approximately 55º (for the geometry shown) from the y-axis and grows along the interface between the paste and aggregate until the aggregate becomes fully debonded from the paste.

9
Agg. Agg.
Max. Stress
Development
Agg.
Externally Restrained
Boundary Condition Externally Unrestrained
Boundary Condition
(a) (b) (c)
Figure 5 - Stress localization for different boundary conditions; (a) Perfectly bonded aggregate for the externally restrained specimen, (b) Perfect unbonded aggregate for the externally restrained specimen, and (c) Perfectly bonded/unbonded aggregate for the externally unrestrained specimen
This debonding causes a redistribution of stresses. Figure 6 shows the residual stresses along the y-axis for different bond conditions (specimen externally restrained in horizontal direction). In a perfectly bonded condition, a lower stress is observed at the aggregate-paste interface. This can be attributed to the fact that the aggregate is participating in transferring stress through the system. The local variations in stress arise due to the differences in elastic properties of the aggregate and the paste. When the aggregate is unbonded, tensile stresses can no longer be transferred through the aggregate. This results in the development of a maximum stress at the aggregate-paste interface (element B). Figure 6 also shows the stress development around a spherical air void which can be considered as an aggregate with zero stiffness. The main difference between an air void and an unbonded aggregate is the ability of the unbonded aggregate to transfer compressive stress. In a system containing an unbonded aggregate, a radial pressure develops at the top and bottom of aggregate as the paste shrinks. This effectively implies that the aggregate ‘wedges’ the void open. In the case of an air void, no such stresses develop since the deformation of the paste in the y-axis direction is not restrained by the presence of aggregate. This explains the slight difference between the stress development in the paste around an air void and around an unbonded aggregate inclusion (figure 6).

10
0 4 8 12Distance from the Agg. (mm)
1
2
3
4
5
6
Str
es
s (
MP
a)
Perfectly BondedPerfectly UnbondedAir VoidNo Agg.
Figure 6 - Stress development along the ‘Y-axis of a restrained prism specimen over an aggregate (restrained boundary condition)
To provide a physical model that is similar to the simulations, a prism specimen was restrained in one direction with a single aggregate. It is believed that this physical model will be able to be used to calibrate material parameters for future modeling developments. The physical model consisted of a prismatic specimen that had a length of 250 mm, a width of 50 mm, and a height of 25 mm. This specimen geometry is similar to the passive dog-bone restraint frame described in the literature [21]. A cement paste specimen was placed in the frame with a water to cement ratio (w/c) of 0.3. Specific details on the cement and the free shrinkage of this cement paste are described in the literature [13]. In addition to the cement paste, the specimen had an ‘instrumented aggregate’ that was placed in the center of the prism. The ‘instrumented aggregate’ consisted of a thin-walled copper cylinder with an outer diameter of 15.8 mm, a height of 25 mm, and a wall thickness of 0.6 mm. Two strain gages were placed on the inner surface of the copper cylinder at 90° from one another to measure the strain that develops on the aggregate in different directions, as illustrated in figure 7.
The specimen was sealed to prevent drying for the duration of the experiment. As illustrated by figure 7, the ‘instrumented aggregate’ (copper ring) recorded a strain development caused by the autogenous shrinkage of the cement paste. These strains were measured by the strain gages and recorded by a Strainsmart acquisition system every 5 minutes.
The results show an initial compressive strain recorded by both strain gages. Since the paste is still in a plastic phase, it is highly unlikely that these strains are attributed to a stress development in the system. Rather these strains could be thought to be due to a slight temperature rise in the system (approximately 2°C). After the time of setting (approximately 7 hours) a tensile strain is measured in the direction of the y-axis (B) and a compression strain in the direction of the x-axis (A) is observed. This can be

11
attributed to the development of a radial pressure at point B accompanied by aggregate-paste debonding at point A. The strain increased over time due to the increase in autogenous shrinkage. At an age of 27 hours a visible crack was observed from the aggregate to one of the specimen edges. It should be noted that the strain in the copper ring does not drop to zero after cracking presumably due to the bond between the ring and paste and continued stress transfer from the mortar to the copper ring.
0 10 20 30 40Time (Hours)
-400
-300
-200
-100
0
100
200
Str
ain
()
Position APosition B
A
B
Copper Ring(with strain gages)
0 10 20 30 40
Time (Hours)
0
0.2
0.4
0.6
Cu
mm
ula
tiv
e A
co
us
tic
E
mis
sio
n E
ne
rgy
(n
Vs
) Copper Ring(with strain gages)
Jump in Acoustic Activityto 10.3
nVS
(a) (b)
Figure 7 - Experimental data from a restrained specimen containing an ‘Instrumented aggregate’: a) Strain development and b) Acoustic activity
In addition to measuring strain development, acoustic emission was used to estimate the extent of cracking that occurred in the specimen. Acoustic emission describes a class of testing that relies on the use of piezo-electric transducers to measure the vibration (or acoustic activity) that occurs when a disturbance (i.e., crack) occurs in a material. This disturbance results in the release of energy and the propagation of an elastic wave. For the sake of brevity the reader is referred to existing literature on the specific details of the acoustic emission equipment and the testing approach employed herein [22].
Figure 7-b shows the cumulative acoustic emission energy recorded during this experiment. The first acoustic event was recorded shortly after setting. During the initial period after setting, microcracking is expected at the aggregate-paste interface which corresponds to a continuous release of acoustic energy [13]. When the visible through-crack propagated, a rapid increase of the acoustic energy was observed.
4. Multiple aggregate systems
A model was developed using a combination of hexagonal unit cells (figure 8-a) each consisted of a cylindrical aggregate particle surrounded by a hexagon of the paste matrix. This model system was used to begin to assess the behavior of a multi-aggregate system. The model system consisted of approximately 16 unit cells. Simulation results

12
for residual stress were acquired from the center hexagonal unit cell to avoid boundary effects at the edges of the specimen. The length of each side of the hexagon (lHex) was fixed as 16.7 % of the length of the system while the size of the aggregates was varied to investigate the effect of aggregate volume fraction on stress development. For this purpose, simulations were performed by varying the aggregate radius (ROA) from 0.1ROP, to 0.2ROP, 0.4ROP, 0.5ROP, 0.6ROP, 0.8ROP, and 0.9ROP where ROP is the equivalent radius of hexagon corresponding to the same cross-sectional area as a cylinder (figure 8-a) [13]. The elastic modulus of the cement paste was assumed to be 20 GPa while the elastic modulus of aggregate was varied to observe the effect of aggregate stiffness on stress development. The Poisson’s ratio of paste and aggregate was assumed to be 0.2 and 0.3 respectively. Two external boundary conditions, unrestrained and horizontally restrained (figure 8-b) were applied in the simulations.
First, a series of simulations were performed to obtain the equivalent elastic modulus of the composite system. A pseudo displacement load of -100 was applied to the horizontal direction and the reaction force was obtained. The overall average section stress and average section strain were used along with Hooke’s law to determine the equivalent elastic modulus of the composite. Figure 9 show the results of the simulations for different aggregate volume fractions. Figure 9-a provides a comparison between the simulation results and the results obtained by using a series and a parallel composite model as well as the model used by Hansen [17] (Equation 4). The results shown correspond to a case when the ratio of Eagg to Epaste is 10. Figure 9-b provides a comparison between the simulation results (shown as data points) and results obtained from the Hansen’s model (shown as lines) for different Eagg/Epaste values. It can be observed in both figures that the simulation results are in good agreement with the results from the Hansen’s model despite the differences in Poisson’s ratio and the differences in the 2d versus 3d model assumptions.

13
Hexagonal Unit Cell Model
Single Unit Cell Equivalent Cylinder
lHex
ROP
ROA
Unrestrained
Restrained
x
y
Agg.
(a) (b)
Figure 8 - Multiple aggregate system composed of unit cell matrix
0 20 40 60 80 100Vol. of Agg. (%)
0
40
80
120
160
200
Eq
uiv
ale
nt
Eco
mp
osit
e (
GP
a)
Parallel ModelSeries ModelHansen's ModelSimulation
EAgg / EPaste = 10
0 20 40 60 80 100
0
40
80
120
160
200
Eq
uiv
ale
nt
E
co
mp
osi
te (
GP
a)
Vol. of Agg. (%)
Eagg/EPaste
105210.50.1Hansen's Model
Simulation
(a) (b)
Figure 9 - Comparisons of equivalent elastic modulus of composites.
A second series of simulations were performed to obtain the internal stress development inside the composite system as the cement paste shrinks around the aggregates. The autogenous shrinkage of the cement paste was assumed to be -100 microstrain ( Figure 10 shows the maximum stresses that develop in an externally unrestrained

14
system as a function of aggregate volume fraction. Figure 10-a shows the maximum principal stress in the cement paste for different values of Eagg/Epaste ranging from 0.1 to 10. A higher level of stress is observed as the volume fraction and the stiffness of aggregate increase. Figure 10-b provides a comparison between the simulation results and the maximum residual stress of the paste determined using Equation 3. A good agreement between the two is observed for composites with an aggregate volume less than 60 percent. However, at higher volume fractions, the two methods predict stress levels that are slightly different. This is mainly due to the fact that Equation 3 is derived for a single aggregate system (a cylindrical paste shrinking around a cylindrical aggregate). As the volume fraction of aggregate increases the distance between the aggregates becomes smaller and the aggregates begin influencing one another.
0 20 40 60 80 100Vol. of Agg. (%)
0
1
2
3
Ma
x.
Pri
nc
ipa
l S
tre
ss
(MP
a)
1052
10.50.1
Externally Unrestrained
EAgg/EPaste (Simulation)
0 20 40 60 80 100Vol. of Agg. (%)
1.2
1.4
1.6
1.8
2
2.2
Str
es
s (
MP
a)
Eq. 3EAgg 10EPaste 5 2
Simulation
Externally Unrestrained
(a) (b)
Figure 10 - Maximum stress development in an externally unrestrained composite
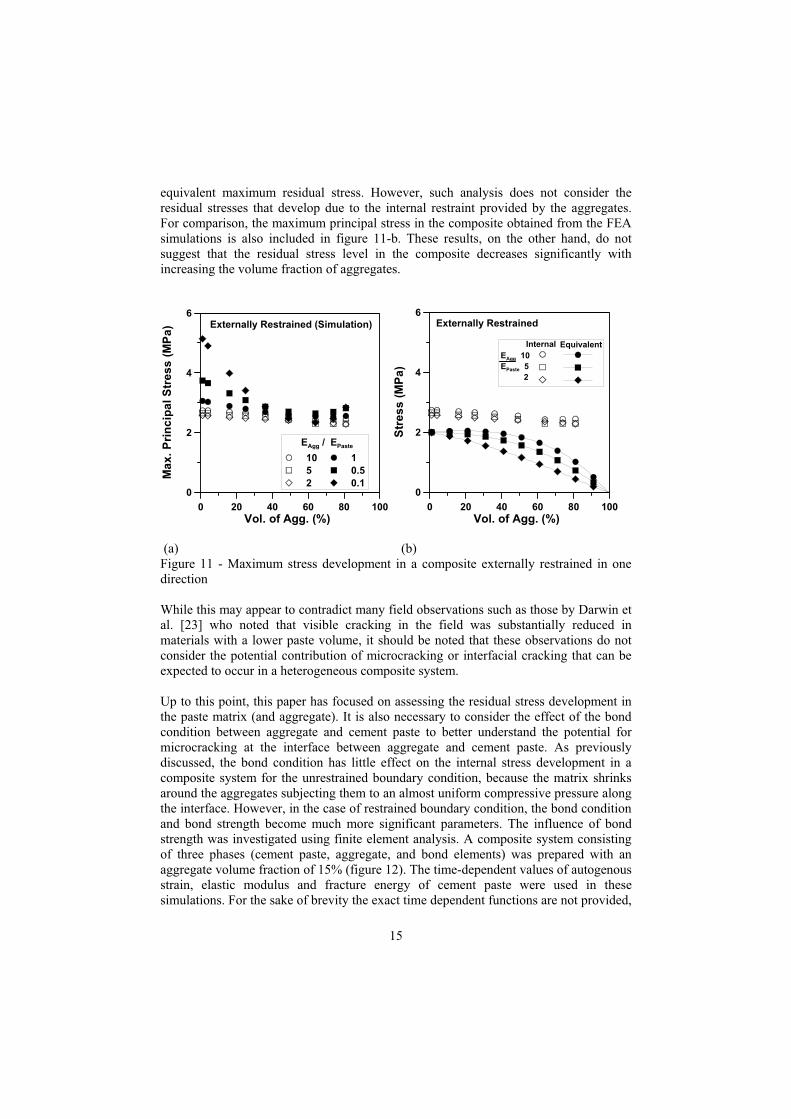
Figures 11 show the maximum residual stresses that develop in the composite system when it is horizontally restrained. In figure 11-a, the maximum principal stress that develops in the paste is shown as a function of the aggregate volume fraction. It is observed that for a value of Eagg/Epaste higher than 2, the maximum stress level is relatively independent of the aggregate volume fraction. However, for lower stiffness aggregates, the maximum stress initially decreases with increasing the volume fraction of aggregates and reaches a minimum around a 65% volume fraction. After this point, a slight increase in the stress level is observed as the volume of aggregates increases. Alternatively, the maximum residual stress in concrete can be computed by considering the system as a homogenous material with equivalent properties. In this case, the equivalent shrinkage strain can be determined by applying Equations 1 and 2, while Equation 4 could determine the equivalent elastic modulus of the composite. The equivalent maximum residual stress is determined by the application of Hooke’s law. Figure 11-b shows the results for composites with different volume fractions of aggregate. As the aggregate volume increases, the equivalent shrinkage strain (calculated using Equations 1 and 2) decreases, which leads to a decrease in the
15
equivalent maximum residual stress. However, such analysis does not consider the residual stresses that develop due to the internal restraint provided by the aggregates. For comparison, the maximum principal stress in the composite obtained from the FEA simulations is also included in figure 11-b. These results, on the other hand, do not suggest that the residual stress level in the composite decreases significantly with increasing the volume fraction of aggregates.
0 20 40 60 80 100Vol. of Agg. (%)
0
2
4
6
Ma
x.
Pri
nc
ipa
l S
tre
ss
(M
Pa
)
1052
10.50.1
Externally Restrained (Simulation)
EAgg / EPaste
0 20 40 60 80 100Vol. of Agg. (%)
0
2
4
6
Str
es
s (
MP
a)
EAgg 10EPaste 5 2
Internal Equivalent
Externally Restrained
(a) (b) Figure 11 - Maximum stress development in a composite externally restrained in one direction
While this may appear to contradict many field observations such as those by Darwin et al. [23] who noted that visible cracking in the field was substantially reduced in materials with a lower paste volume, it should be noted that these observations do not consider the potential contribution of microcracking or interfacial cracking that can be expected to occur in a heterogeneous composite system.
Up to this point, this paper has focused on assessing the residual stress development in the paste matrix (and aggregate). It is also necessary to consider the effect of the bond condition between aggregate and cement paste to better understand the potential for microcracking at the interface between aggregate and cement paste. As previously discussed, the bond condition has little effect on the internal stress development in a composite system for the unrestrained boundary condition, because the matrix shrinks around the aggregates subjecting them to an almost uniform compressive pressure along the interface. However, in the case of restrained boundary condition, the bond condition and bond strength become much more significant parameters. The influence of bond strength was investigated using finite element analysis. A composite system consisting of three phases (cement paste, aggregate, and bond elements) was prepared with an aggregate volume fraction of 15% (figure 12). The time-dependent values of autogenous strain, elastic modulus and fracture energy of cement paste were used in these simulations. For the sake of brevity the exact time dependent functions are not provided,

16
however they describe the behavior of a paste with a w/c of 0.30 which is similar to that measured by Pease [12]. For the trials described in this paper, the bond elements were assigned stiffness and fracture energy that were 10% of the values for cement paste. Further work is needed to characterize the bond stiffness and strength more thoroughly for further simulations. To determine whether interfacial cracking occurred, a fracture energy analysis was performed to determine whether the stored strain energy in each element exceeded the fracture energy. When the stored strain energy exceeded the fracture energy, the stiffness and fracture energy of those elements was decreased to 10% of the previous values and the simulation was re-run until a stable geometric configuration was obtained. This simulation technique is typically used when a model has high non-linearity such as cracking. The elastic modulus of aggregate that was used was 100 GPa and cracking of aggregate was not considered in this study in an effort to focus on observing the cracking tendency of cement paste with low bond strength.
For the analysis shown in figures 12 and 13 the shrinkage strain was applied incrementally and the stress development and cracking was monitored. Figure 12-a shows the initial status of microcracking, where crack coalescence can be observed during loading as visible as black-colored regions. These debonded regions developed along the edges of the aggregates under horizontally restrained boundary condition. The debonding between the aggregate and the paste increased until the debonding reached the ‘y-axis position’ (i.e., the top and bottom of the aggregate as shown in figure 12-b) at which time a vertical through crack developed (figure 12-b).
(a) (b)
Figure 12 - Cracking tendency of a composite (Horizontally restrained boundary conditions)
5. Multiple aggregate systems – variable size and spacing
It was previously discussed that the distance between the aggregates has an important role in the internal stress development and cracking tendencies. However, it is impossible to think that the simple hexagonal unit cell composite model can completely represent a complex system like a concrete composite. In real cementitious composites the shape of the aggregate, size distribution of the aggregate, and spacing between the
17
aggregates would influence the internal stress development [24]. Therefore, additional modeling approaches are needed.
The National Institute of Standards and Technology (NIST) has been developing a new finite element analysis program named Object-Oriented Finite Element Analysis (OOF) which enables to use real images of heterogeneous composites to develop the meshes and models for finite element analysis [25].
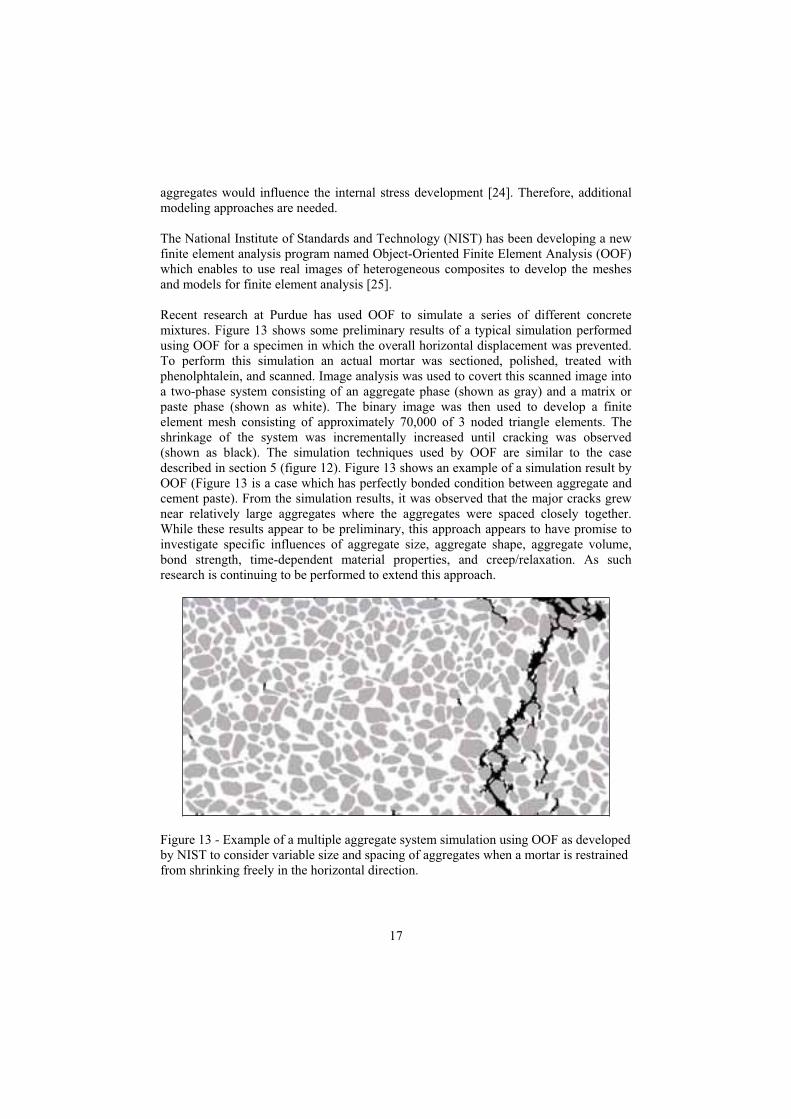
Recent research at Purdue has used OOF to simulate a series of different concrete mixtures. Figure 13 shows some preliminary results of a typical simulation performed using OOF for a specimen in which the overall horizontal displacement was prevented. To perform this simulation an actual mortar was sectioned, polished, treated with phenolphtalein, and scanned. Image analysis was used to covert this scanned image into a two-phase system consisting of an aggregate phase (shown as gray) and a matrix or paste phase (shown as white). The binary image was then used to develop a finite element mesh consisting of approximately 70,000 of 3 noded triangle elements. The shrinkage of the system was incrementally increased until cracking was observed (shown as black). The simulation techniques used by OOF are similar to the case described in section 5 (figure 12). Figure 13 shows an example of a simulation result by OOF (Figure 13 is a case which has perfectly bonded condition between aggregate and cement paste). From the simulation results, it was observed that the major cracks grew near relatively large aggregates where the aggregates were spaced closely together. While these results appear to be preliminary, this approach appears to have promise to investigate specific influences of aggregate size, aggregate shape, aggregate volume, bond strength, time-dependent material properties, and creep/relaxation. As such research is continuing to be performed to extend this approach.
Figure 13 - Example of a multiple aggregate system simulation using OOF as developed by NIST to consider variable size and spacing of aggregates when a mortar is restrained from shrinking freely in the horizontal direction.

18
6. Summary
This paper describes the effect of internal and external restraint on residual stress development in a concrete composite. Three “model systems” were evaluated including 1) a single aggregate, 2) a composition of hexagonal unit cells, and 3) a real composite image system. The following observations can be made:
The increase in aggregate volume reduces the overall free shrinkage of a cementitious composite.
The addition of aggregate results in the generation of internal residual stresses.
The bond condition between aggregate and cement paste has little role on stress development when a composite is not externally restrained. The bond condition becomes more critical for describing the behavior of the system when external restraint is provided.
In the case of externally unrestrained boundary condition, it was observed that higher internal stresses develop with higher volume fraction of aggregate and higher stiffness of aggregate.
In the case of externally restrained (in one direction) boundary condition, the maximum residual stress level is not observed to vary significantly with increasing the volume fraction of aggregates.
The local residual stresses that develop in a composite are higher than the equivalent stresses that are computed using the equivalent shrinkage strain and equivalent elastic modulus of a composite. This is due to the fact that the latter technique does not consider the stresses generated by the internal restraint of the aggregates. This indicates that it is possible to underestimate the microcracking and cracking potential of concrete if estimation is performed only using equivalent parameters.
Acknowledgements
The authors gratefully acknowledge support received from the National Science Foundation (NSF). This material is based in part on work supported by the NSF Grant No. 0134272: a CAREER AWARD. This work was conducted in the Charles Pankow Concrete Materials Laboratory, as such the authors gratefully acknowledge the support which has made this laboratory and its operation possible.
References
[1] Weiss, W.J., Linking insitu monitoring with damage modeling for life-cycle performance simulations of the concrete infrastructure, NSF Career Development Plan, National Science Foundation, (2001)
[2] Carlson, R.W., Drying Shrinkage of Large Concrete Members, Journal of the

19
American Concrete Institute, pp. 327-336,( Jan.~Feb 1937)
[3] Pickett, G., Effect of Aggregate on Shrinkage of Concrete and Hypothesis Concerning Shrinkage, Journal of the American Concrete Institute, Vol. 56, pp. 581-90, (January 1956)
[4] L’Hermite, R.G., Volume Changes of Concrete, Fourth International Symposium on the Chemistry of Cement, Washington D.C., pp. 659-702, (1960)
[5] ASTM C-190, Standard Test Method for Tensile Strength of Hydraulic Cement Mortars, ASTM International, (1985)
[6] Dutron, R., Le retrait des ciments et betons, Ann. Trav. Publ. de Belgique, (1934) (Based on the interpretation of this paper as discussed in reference 3)
[7] Neville, A.M., Properties of Concrete, Longman, 4th edition, (1996)
[8] Mindess, S., Young, J.F., and Darwin, D., Concrete, Prentice Hall, 2nd edition, (1996)
[9] Mehta, P. K. and Monteiro, P. J.M., Concrete, Prentice Hall, 2nd edition, (1986)
[10] Swazye, M. A., Discussion of the paper of L’Hermite, R.G., Volume Changes of Concrete, Fourth International Symposium on the Chemistry of Cement, Washington D.C., pp. 700-702, (1960)
[11] Dela, B.F., and Stang, H., Two-dimensional analysis of crack formation around aggregates in high-shrinkage cement paste, Engineering Fracture Mechanics, Vol. 65, pp.149-164, (2000)
[12] Pease, B. J., Hossain, A. B., and Weiss, W. J., Quantifying Volume Change, Stress Development, and Cracking Due to Self-Desiccation, ACI SP-220, Autogenous Deformation of Concrete, pp.23-39, (March 2004)
[13] Pease, B., Neuwald, A., and Weiss, W. J., The Influence of Aggregates on Early Age Cracking in Cementitious Systems, Celebrating Concrete: Role of Concrete in Sustainable Development, An International Sympoium dedicated to Professor Surendra Shah, Northwestern University, pp. 329~338, (September 2003)
[14] Moon, J.H., Pease, B., Rajabipour, F., Weiss, W.J., Residual Stress Development and Fracture in Portland Cement Composites – Insitu Stress and Passive Asoustic Emission Measurements, Presantaion for the 106th American ceramic Society Meeting, Indianapolis, (April 2004)
[15] Timoshenko, S.P. and Goodier, J.N., Theory of Elasticity, McGraw Hill, 3rd edition, (1970)
[16] Lura, P., Jensen, O.M., Ye, G., and Tanaka, K., Micro-crack detection in high-performance cementitious materials, 4th Seminar on Self-Desiccation and Its Importance in Concrete Technology, 2005 (Submitted)

20
[17] Hansen, T.C., Influence of Aggregate and Voids on Modulus of Elasticity of Concrete, Cement Mortar, and Cement Paste, ACI Journal, Vol. 62, No. 2, pp. 193-216, (February 1965)
[18] Moon, J.H., Rajabipour, F., and Weiss, W. J., Incorporating Moisture Diffusion In The Analysis Of The Restrained Ring Test, CONSEC (Concrete under severe conditions - Environment & Loading), Seoul Korea , pp. 1973-1980, (June 2004)
[19] Moon, J.H., and Weiss, W.J., Estimating Residual Stress in the Restrained Ring Test under Circumferential Drying, Journal of Cement and Concrete Composites, (submitted)
[20] Weiss, W.J., Prediction of Early-Age Shrinkage Cracking in Concrete, Ph.D. thesis, Northwestern University, (1999)
[21] Chariton, T., and Weiss, W. J., Using Acoustic Emission to Monitor Damage Development in Mortars Restrained from Volumetric Changes, Concrete: Material Science to Application, A Tribute to Surendra P. Shah, eds. P. Balaguru, A. Namaan, W. Weiss, ACI SP-206, pp. 205-218, (2002)
[22] Kim, B., and Weiss, W. J., Using Acoustic Emission to Quantify Damage in Restrained Fiber Reinforced Cement Mortars, Cement and Concrete Research, Feb., 2003, vol. 33, no. 2, pp. 207-214, (2003)
[23] Darwin, D., Browning, J., and Lindquist, W.D., Control of Cracking in Bridge Decks: Observations from the Field, Cement, Concrete, and Aggregates, ASTM, Vol. 26, No. 2, pp. 148-154, (Dec. 2004)
[24] Jones, R. and Kaplan, M. F., The effects of coarse aggregate on the mode of failure of concrete in compression and flexure, Magazine of Concrete Research, Vol. 9, No. 26, pp. 89~94, (1957)
[25] Langer, S. A., Fuller, E. R., and Carter, W. C., OOF: An Inage-Based Finite-Element Analysis of Material Microstructures, Computing in Science and Engineering, pp. 15~23, (2001)

21
EFFECTS OF SELF-DESICCATION ON AUTOGENOUS
DEFORMATIONS, MICROS TRUCTURE AND LONG-
TERM HYGRAL BEHAVIOUR
Véronique Baroghel-Bouny1 and Pierre Mounanga2
1Laboratoire Central des Ponts et Chaussées – Paris – France 2GeM-IUT de Saint-Nazaire, Civil Engineering Department – Saint-Nazaire – France
Abstract
The influence of W/C has been investigated on the internal RH measured at a given age in sealed conditions, and on the resulting degree of hydration of the cement. The consequences of the significant internal RH decrease and of the resulting low degree of hydration recorded in cementitious materials with low W/C, typically the HPCs, have been analyzed both at early age, for example on autogenous deformations, and in the long term as regards microstructure and hygral behaviour. In this last case, moisture profiles in cementitious materials exposed to various laboratory and natural environments have been assessed by means of gamma-ray attenuation measurements. In addition, water vapour desorption-adsorption isotherms have been determined at room temperature by means of the saturated salt solution method. The very similar moisture profiles and the high saturation ratio recorded in the various HP materials, whatever the age and the environmental conditions within a broad RH range, can be mainly attributed to the peculiar shape of their water vapour desorption-adsorption isotherms. In addition, and as expected, the total shrinkage, induced by a lower environmental RH than the internal one, of materials affected by a strong self-desiccation will be reduced.
1. Introduction
In recent years, the durability of reinforced or prestressed concrete structures has become a main concern, since engineers have to take into account the target service life when selecting the concrete mixture and designing the structure. It is now well recognized that high-performance concretes (HPCs) have an enhanced durability compared to ordinary concretes, due to their compactness. Their finer pore structure and hence their reduced permeability and diffusion coefficients (to gaseous and liquid phases), and also their lower calcium hydroxide content, compared to ordinary materials, offer a better resistance to water and aggressive agents ingress, and chemical deterioration. Moreover, their smaller mean pore radius diminishes the freezing temperature of pore water, which can induce a better frost resistance. The low water content of these materials can also be an advantage to prevent them from alkali-silica reaction, for example [1].
A specific feature of HP materials is their early and marked self-desiccation (internal drying due to cement hydration) [2]. As an example, it is well known that the particularly high autogenous shrinkage of these materials can generate tensile stresses likely to induce micro- or macro- cracking under hindered conditions [3, 4]. Early-age cracking is able to affect mechanical properties and also to reduce the durability properties of HPCs. It is therefore important to accurately examine the effects of self-

22
desiccation, not only under laboratory conditions but also in real structures, and to evaluate their importance and their positive or negative feature with respect to various properties. This will insure an appropriate taking into account of the self-desiccation effects in the prediction of the behaviour of concrete structures and will allow improvement of the mix-design of HPCs.
The purpose of this paper is to investigate the possible consequences of the significant internal relative humidity (RH) decrease recorded in cementitious materials with low W/C, typically the HPCs. The analysis has been performed both at early age, for example as regards autogenous deformations, and in the long term as regards the degree of hydration of the cement, the microstructure, the moisture properties and the deformations. In particular, it will be examined whether the self-desiccation process, besides a refined pore structure, contributes significantly to explain the specific long-term hygral behaviour of HPCs, as compared to ordinary materials.
2. Materials
A broad range of ordinary and high-performance cement pastes and concretes has been tested. First, a set of plain cement pastes prepared with the same type I OPC, CEM I - 52.5 according to the EN 197-1 European standard (cement 1), and with W/C ranging from 0.25 up to 0.60, has been studied in laboratory (see the mix-composition of the paste CO with W/C = 0.35 in Table 1). The mix-composition and the main characteristics of the other materials tested in laboratory are summarized in Table 1. The aggregate and cement depend on the mixture. The mineral composition, calculated by Bogue's formula from the chemical composition, and the Blaine fineness of the two cements used are given in Table 2. In addition to these mixtures, some concretes have been exclusively studied in field conditions. Details on these mixtures and on the exposure sites can be found in [1, 5, 6].
Table 2 - Mineralogical composition and Blaine fineness of the cements Content (%) Blaine
Cement C3S C2S C3A C4AF gypsum CaCO3 free CaO Na2Oeq. fineness (m2.kg-1)
1 70.2 7.8 3.8 6.0 5.2 1.8 0.53 0.48 332 2 57.6 17.8 2.2 12.6 6.2 2.0 0.71 Na2O=0.12
K2O=0.30357

23
Table 1 - Mix-composition and main characteristics of materials studied in laboratory Material reference CO CH BO BH M25 B80-S Cement reference 1 1 1 1 2 2 Gravel (G) (in kg.m-3)(min/max grain size in mm)
1192 (4/20)
1265 (4/20)
1007 (5/20)
980 (6/14)
Sand (S) (in kg.m-3)(min/max grain size in mm)
744 (0/5)
652 (0/5)
899 (0/5)
790 (0/4)
Cement CEM I 52.5 (C) (in kg.m-3) 1502 1757 353 421 230 420 Silica fume (SF) (in kg.m-3) 176 42.1 35 Water (W) (in kg.m-3) 523 344 172 112.3 193 147 Superplasticizer (SP) (in kg.m-3) 32 7.59 7.28 Water-to-cement ratio (W/C) 0.35 0.20 0.48 0.26 0.84 0.35 Water-to-binder ratio (W/B) 0.35 0.18 0.24 0.84 0.32 Silica fume to cement ratio (SF/C) 0.10 0.10 0.08 Gravel-to-sand ratio (G/S) 1.6 1.9 1.1 1.2 MIP porosity (%) (age = 3 months) 11.1(2) 15.8(2) 12.5(1) 3.3(1) 15.9(1) 7.3(1)
Water porosity(3) (%) (age = 3 months) 29.2 13.9 12.0 7.0 14.9 10.528-day cylinder average compressive strength (MPa)
49.4 115.5 25.1 76.9
(1): after 14-day vacuum oven drying at T = 45 °C and in the presence of silica-gel
(2): after freeze-drying
(3): measured by means of hydrostatic weighing [7]
3. Internal RH, degree of hydratio n of the cement and microstructural
aspects
3.1 Measurements
The internal RH decrease (due to self-desiccation) has been monitored in various cementitious materials hydrating in sealed conditions at the constant temperature T = 20 ± 0.5 °C. The samples have been enclosed immediately upon casting into sealed cells that contained a RH-sensor (capacitive sensor with an accuracy of ± 1% RH) previously calibrated with saturated salt solutions over the whole RH range [8]. This method was first applied by Copeland and Bragg [9].
The evolution of the non-evaporable water content of the cement pastes has been measured as a function of time (age) by means of thermogravimetric analysis (TGA) conducted between 20 and 1100 °C, in an inert N2 atmosphere (1 bar). The non-evaporable water amount is defined here as the mass loss recorded between 145 and 1050 °C, minus the mass loss due to CO2 release caused by calcite decomposition between 600 and 800 °C [10]. This non-evaporable water amount has been used to calculate the degree of hydration of the cement ( ). The testing and calculation procedures applied are described in [11].

24
The microstructure has been investigated by means of backscatter mode scanning electron microscopy (BSE-SEM) on polished sections after vacuum drying, along with energy dispersive X-ray (EDX) semi-quantitative analysis.
Moreover, porosity and pore size distribution have been determined by mercury intrusion porosimetry (MIP), after 14-day vacuum oven drying (at T = 45° C in the presence of silica gel) or freeze-drying of the specimens (see Table 1).
3.2 Experimental results
The internal RH values measured at some given ages in sealed samples of ordinary concrete BO and HPC BH, prepared with the same constituents, are compared in Table 3. When the materials do not contain enough water in their pore system for the unrestricted hydration of the cement, the internal RH decreases, while water is consumed in the chemical reactions. Therefore, as expected [12, 13, 14], strong self-desiccation for the high-performance concrete BH, and weak self-desiccation for the ordinary concrete BO, are pointed out in Table 3. The RH decrease measured in BH is particularly high in the first two months.
Table 3 - Internal RH values measured in sealed conditions by RH-sensors at T = 20 °C. Internal RH (%) Age BO BH 28 days 97 77.5 50 days 2 months
96.5 96
7675.5
3 months 95.5 74.5 6 months 95 72 1 year 2 years
9493
6964
The evolution of the degree of hydration of the cement vs. the age, measured on the set of cement pastes cast with cement 1 and various W/C, hydrating in sealed conditions at T = 20 °C, is displayed in Fig. 1 (see [11] for results obtained at other temperatures). The correlation between the "ultimate" (at 2 years) degree of hydration and the autogenous internal RH is displayed in Fig. 2 for this set of cement pastes.
In the materials where strong self-desiccation takes place, a significant and very early slowing down of the chemical reactions (requiring water), in particular of the hydration reactions, takes place (see Figs. 1 and 2). The "ultimate" value of the degree of hydration can be very low. This means that the materials remain poorly hydrated even in the long term. Nevertheless, this induces positive consequences as regards the long-term evolution of the microstructure.

25
0
20
40
60
80
100
0 100 200 300 400 500 600 700
Age (days)
De
gre
e o
f h
yd
rati
on
(%
)
W/C=0.25
W/C=0.35
W/C=0.45
W/C=0.50
W/C=0.60
0
10
20
30
40
50
0 6 12 18 24Age (hours)
De
gre
e o
f h
yd
rati
on
(%
) W/C=0.25
W/C=0.30
W/C=0.35
W/C=0.40
a) 0 - 2 years b) zoom at early age: 0 - 24 hours Figure 1 - Degree of hydration of the cement vs. age for cement pastes cast with the same cement CEM I 52.5 (cement 1) and with various W/C, cured in sealed conditions at T = 20 °C.
20
40
60
80
100
70 75 80 85 90Internal RH (%)
De
gre
e o
f h
yd
rati
on
(%
)
Figure 2 - "Ultimate" (at 2 years) degree of hydration of the cement vs. internal RH for cement pastes cast with the same cement CEM I 52.5 (cement 1) and with various W/C, cured in sealed conditions at T = 20 °C. The W/C values are also reported in the figure.
For example, BSE-SEM observations of the microstructure of concrete specimens taken from several years old structures, reveal the existence of many prints of entirely consumed cement grains, which left the place to porous spaces (Hadley grains [15]), in the case of ordinary concretes with medium W/C (but with W/C 0.40). Hadley grains appear as dark zones in a rather dense matrix, as shown in Fig. 3a as regards the 3-year old ordinary concrete B30 of the Twin Bridges in Bourges, in France (CEM II/A-L 52.5; W/C = 0.46 ; 28-d cylinder average comp. strength = 39.0 MPa [16]). The hydration process occurred under conditions such that the grain cores remained empty, since no hydration product has filled this zone.
0.20 (SF/C=0.10)
0.25
0.60
0.35
0.500.45

26
a) concrete B30 - Internal zone
b) concrete B70FS - Internal zone Figure 3 - BSE-SEM pictures (G = 250X) on polished sections of specimens drilled out from the 3-year old ordinary concrete B30 and high-performance concrete B70FS of the Twin Bridges (Bourges, France).
During cement hydration, the capillary porosity decreases as the amount of outer hydrates increases. A reduction in the pore volume associated to the main mode (peak) and a shift of this mode towards the smaller pore sizes are thus observed on the mercury intrusion pore size distribution [8]. However, in the more or less long term, depending on the mixture (main influence of W/C and of the initial size of the cement grains), the appearance of Hadley grains of significant size and proportions can counterbalance the reduction in capillary porosity, and even induce an increase in total porosity. This effect can be detected by the appearance and the increase in the course of time on the mercury intrusion pore size distribution of a secondary pore mode (between 102 and 103 nm), as illustrated in Fig. 4 for concrete B30.

27
0
20
40
60
80
100
10 100 1000 10000 100000 1000000Pore radius (Å)
V/
log
(r)
(mm
3.Å
-1.g
-1)
B30 (28-d water curing)
B30 (90-d water curing)
B30 (3 years in situ)
B70FS (28-d water curing)
B70FS (90-d water curing)
B70FS (3 years in situ)
Figure 4 - MIP pore size distributions (after oven drying at T = 45 °C) on concretes B30 and B70FS from the Twin Bridges (water-cured laboratory samples and cores drilled out from the bridges in an intermediate zone between internal zone and "skin"). The MIP porosity is also reported in the figure. Apparatus (Pmax = 200 MPa) allowing the investigation of pore radii ranging from 3.7 nm up to 60 µm.
Conversely to concrete B30, which seemed internally completely hydrated at 3 years (see Fig. 3a), in the case of HPCs (W/C < 0.40) as in any cementitious material with low W/C, a significant proportion of unreacted cement can be observed even in the long term (owing to the insufficiency of the initial water amount). This is illustrated by the numerous white areas revealed by the BSE-SEM pictures at the age of 3 years (see Fig. 3b) in the internal zone of concrete B70FS of the Twin Bridges in Bourges (CEM II/A-D 52.5 ; W/C = 0.37 ; 28-d average comp. strength = 84.0 MPa [16]). This has also been detected even at the age of 14 years, in cores drilled out from the concrete deck of the Ré Island Bridge between La Rochelle and Ré Island, in France (concrete B60FS: CEM I 52.5 ; W/C = 0.38 ; 28-d average comp. strength = 68.0 MPa [1]), in the surface zone (see Fig. 5b) as well as in the internal zone (see Fig. 5a). These observations were confirmed by the measurement of the degree of hydration of the cement: 0.75 was obtained for the B60FS at 14 years. Note that the presence of large-sized anhydrous grains at 14 years in B60FS can result not only from the low quantity of mixing water (W/C), but also from the moderate fineness of the cement used. No Hadley grain and no significant increase of porosity have been detected in these HPCs (see Figs. 3, 4 and 5). It can be deduced that the microstructure of the HPCs becomes denser (the porosity decreases and the pore structure is refined) with age, whatever the environmental conditions.
MIP porosity10.7%11.3%8.4%
7.6%7.3%5.3%

28
a) internal zone b) surface zone Figure 5 - BSE-SEM pictures (G = 250X) on polished sections of specimens drilled out from the 14-year old high-performance concrete B60FS from the deck of the Ré Island Bridge.
4. Monitoring of early-age hydration: chemical shrinkage measurement
4.1 Measurement
(Total) chemical shrinkage has been measured on the set of cement pastes cast with cement 1 (W/C ranging from 0.25 up to 0.60) by using a weighing method [17, 18]. The testing and calculation procedures applied are detailed in [11]. The specimens are thin enough (7 mm), in order to allow absorption of water from the bath at the rate that the water is being consumed by the chemical reactions, whatever the W/C. The whole system, including the cement paste sample in its flask, is hung from a balance and is immersed in distilled water at the required temperature, 10, 20, 30, 40, or 50 °C ( 0.1 °C). The measurements started 10 minutes after water-cement contact and last for 24 hours.
4.2 Experimental results
The chemical shrinkage of the set of cement pastes is plotted vs. the age in Fig. 6, from about 10 minutes after water-cement contact up to 24 hours, at T = 20 °C. Each plot is obtained from the mean value of two measurements. The variations of the "ultimate" (at 24 hours) chemical shrinkage value vs. W/C are displayed for various temperatures (10, 20, 30, 40, or 50 °C) in Fig. 7. As depicted in Figs. 6 and 7, at a given temperature, very slight and unsystematic variations are recorded as a function of W/C on the "ultimate" (at 24 hours) chemical shrinkage value. The "ultimate" chemical shrinkage doesn't seem to depend on the W/C. This result is in agreement with previously published works [18, 19, 20] and extends the temperature range (10-50 °C) as well as the W/C range (0.25-0.60 in the case of T = 20 °C) where this statement has been checked. In addition, it has been shown in [21] that W/C influenced (accelerated) the rate of chemical shrinkage development (kinetic effect) only within the range 0.25-0.30, for a given curing temperature within the range 10-50 °C. Moreover, according to [21], the temperature has also a kinetic effect (at W/C = 0.25). Nevertheless, Fig. 7 shows that, whatever the W/C, for T 30 °C, the temperature has no more influence on the "ultimate" chemical shrinkage value.

29
0
5
10
15
20
25
30
35
0 3 6 9 12 15 18 21 24Age (hours)
Ch
em
ica
l s
hri
nk
ag
e (
mm
3 / g
of
init
ial c
em
en
t)
W/C= 0.25
W/C= 0.30
W/C =0.45
W/C= 0.50
W/C= 0.60
Figure 6 - Chemical shrinkage vs. age for cement pastes cast with the same cement CEM I 52.5 (cement 1) and with various W/C, cured at T = 20 °C.
0
5
10
15
20
25
30
35
0,20 0,30 0,40 0,50 0,60W/C
"Ult
ima
te"
ch
em
ica
l s
hri
nk
.
(mm
3 / g
of
init
ial c
em
en
t)
T=10°C
T=20°C
T=30°C
T=40°C
T=50°C
Figure 7 - "Ultimate" (at 24 hours) chemical shrinkage values vs. W/C for cement pastes cast with the same cement CEM I 52.5 (cement 1) and with various W/C, for various curing temperatures.
5. One-dimensional autogenous deformations
5.1 Measurement
Unrestrained one-dimensional autogenous deformations have been measured on Ø20x160-mm samples of the set of cement pastes cast with cement 1 (W/C ranging from 0.25 up to 0.60) by using a simple technique, allowing length change measurement by means of dial gauge, from initial Vicat setting time up to 1 year, at T = 20 °C ( 1 °C). The set-up and the test procedure are detailed in [22]. Just after demoulding, the samples were sealed by wrapping them in three self-adhesive aluminium foil sheets, in order to avoid moisture exchange with the surroundings. The specimens were weighed at each length change measurement time.

30
5.2 Experimental results
The unrestrained 1-D autogenous deformations measured on the Ø20x160-mm sealed samples of cement pastes at T = 20 °C are plotted vs. the age in Fig. 8, from initial Vicat setting time (this moment is taken as the zero point on the time scale of the curves) up to 1 year. The results are the mean values obtained from at least six samples. Note that a good "repeatability" was recorded, since the standard deviation was of the order of magnitude of the device accuracy.
-400
-200
0
200
400
600
800
1000
1200
1400
0 50 100 150 200 250 300 350 400Age (days)
Au
tog
en
ou
s s
hri
nkag
e (
10-6
)
W/C=0.25
W/C=0.30
W/C=0.35
W/C=0.40
W/C=0.45
W/C=0.50
W/C=0.60
Figure 8 - 1-D autogenous deformations (length changes) vs. age, measured from initial Vicat setting time up to 1 year on Ø20x160-mm sealed samples of cement pastes cast with cement 1 and various W/C, at T = 20 °C (zero point of the time scale: t0 = initial Vicat setting time).
The experimental results point out that, at a given age, the magnitude of autogenous shrinkage increases linearly as W/C decreases from 0.60 down to 0.25 (an increase of 1025 µm/m has been recorded on the "ultimate", i.e. 1-year, value, see Figs. 8 and 9a). Various physical and chemical processes linked to cement hydration are involved in the unrestrained isothermal autogenous deformations measured on cement paste samples [3, 22, 23]. These deformations include in the general case three components: (total) chemical shrinkage (see section 4), structural (chemical) swelling due to crystal growth [21], and self-desiccation shrinkage. The component which is prominent depends on the age at which the system is observed and on the mix-composition of the cement paste [22]. In the long term, another component may be added: the matrix creep under hygral stress [24]. The clear dependence on W/C observed on the deformations recorded here from setting time (see Figs. 8 and 9a) indicates that the (total) chemical shrinkage has no more significant influence (see section 4), even from the early measuring times. Chemical shrinkage is thus prominent only before setting time. The starting time of the period where self-desiccation shrinkage is the major component, the third component (structural chemical swelling) becoming negligible, can be assumed for each mixture to be the time when the relationship between autogenous shrinkage and internal RH becomes linear, as experimentally exhibited for ordinary and HP cement pastes and concretes (including SF) in [8] and [13]. This relationship remains true until reaching the "ultimate" value of autogenous shrinkage, whatever the W/C (and SF), as shown in Fig. 9b (where the 1-year autogenous shrinkage of the cement paste samples has been plotted vs. the internal RH measured by RH-sensors on duplicates). The linear
swelling
shrinkage

31
correlation observed confirms that the autogenous deformations recorded at this time are exclusively the result of the self-desiccation process. Within this period, the correlation between W/C and autogenous deformations can thus be mainly explained by the self-desiccation process.
-500
0
500
1000
1500
0,20 0,30 0,40 0,50 0,60W/C
Au
to.
sh
rin
ka
ge
(1
0-6)
1 y ear
28 day s
a) 28-d and 1-year 1-D autogenous deformations vs. W/C (SF/C = 0)
0
500
1000
1500
2000
2500
3000
60 65 70 75 80 85 90
Internal RH (%)
1-y
ea
r a
uto
. s
hri
nk
ag
e
(10
-6)
b) 1-year 1-D autogenous shrinkage vs. internal RH Figure 9 - Correlation between 1-D autogenous deformations and W/C (a) or internal RH (b), for cement pastes cast with cement 1, various W/C (range 0.25-0.60), and various SF/C (range 0-0.20), at T = 20 °C. The W/C values are also reported in figure (b).
6. Water vapour desorption-adsorption isotherms
6.1 Experimental procedure
6.1.1 The saturated salt solution method
The water vapour desorption and adsorption isotherms quantify the equilibrium moisture properties of hardened materials. Some of the first data on cement pastes were published by Feldman in 1968 [25]. Various methods can be used for the determination of these data: the flow division method that mixes dry and saturated air, the method altering temperature or pressure or both, the volumetric method that isothermally changes the vapour pressure in a vacuum system, and gravimetric methods. Most of
0.25 (+ SF)
0.300.40
0.450.50
0.60
0.25

32
these methods are rather used in chemistry and physics laboratories. Here, water vapour desorption and adsorption experiments have been performed by means of the saturated salt solution method [8, 26], which belongs to the gravimetric type, at the constant temperature T = 23 ± 0.1 °C on specimens of various hardened materials. The saturated salt solution method is particularly suitable to concrete specimens and to the study performed here. The fact that it is a discontinuous method can appear as a drawback. But in fact this method provides easily a dozen of RH points, which prove to be sufficient to draw and to fit accurately the sorption isotherms.
The experiments consist in enclosing the specimens in sealed cells (desiccators), where the relative humidity is kept constant by means of a saturated salt solution (or silica gel), and in submitting these specimens to step-by-step desorption and adsorption processes (stepwise changes in RH). The desiccators are laid in a thermo-regulated bath at T = 23 ± 0.1 °C. The desiccator volume is high enough, compared to the volume and the number of specimens, in order that the specimen load doesn't disturb the ambience controlled by the saturated salt solution and doesn't delay the set up of equilibrium. The total gas pressure of the cell is not imposed. It is therefore assumed to be equal to the atmospheric pressure during the whole experiment. In the test conditions (temperature stability, pureness of the salt used, early preparation of the solution, ...), it can be assumed that the saturated salt solution method induces a RH precision of 0.1%.
The mass water content of the specimens is determined by weighing. After removing the desiccator small upper stopper, each specimen is hung inside the desiccator from the bottom hock of an electronic balance beam. The precision of the balance is 0.001 g. As the desiccator is not completely open during the weighing procedure, its ambience and the specimens themselves are only lightly disturbed. Each RH step lasts until moisture "equilibrium" is reached inside the specimen (i.e. constant mass, see section 6.1.5).
6.1.2 Specimens
As regards the specimen dimensions, note that in these experiments it is not necessary to insure representativeness of concrete, as aggregates don't play any role in the sorption process (see [8] and section 6.2). Therefore, very thin specimens are used, in order to be able to reach moisture "equilibrium" (see section 6.1.5) in the test conditions.
The concrete specimens are 2 or 3-mm thick slices, with a diameter of about 90 mm. The mass of each concrete specimen is between 20 and 40 g, depending on the mixture. The hardened cement paste (hcp) specimens studied here are crushed slices (e.g. 0.8 < d
1 mm, where d is the mean size of the particles) laid in stainless steel baskets. The mass of the hcp specimens is around 8 g. The slices were wet sawed from cylinders after sealed curing without water exchange.
6.1.3 Initial state
Stable materials, from a chemical standpoint, are required, in order to be able to quantify "pure" physical effects, not affected by chemical reactions during the experiments. Otherwise, delayed hydraulic or pozzolanic reactions are likely to change the microstructure during the test and hence the sorption isotherms. Therefore, given the long duration of these chemical reactions and of water sorption processes, the

33
specimens were chosen to be at least 1-year old at the beginning of the test. At this time, very slow kinetics are expected for the chemical reactions, due to the lack of water, space or unreacted cement and a very slight further evolution of the degree of hydration of the cement is expected from this age (see Table 3 and Fig. 1a). The cement hydration (and pozzolanic) processes can therefore be assumed to be negligible for the whole duration of the sorption test.
Here, the sorption experiments start by a desorption process, since in field conditions real concrete structures undergo external drying from their virgin state (i.e. from the time when the formworks are removed, after casting and curing). This procedure provides in addition a (first) desorption curve that is representative of the virgin material (without any pre-drying except self-desiccation, which affects the high RH range).
After this first step-by-step desorption process, some of the materials were submitted to a subsequent step-by-step adsorption process. Various RH values were selected as the starting point of the adsorption process, in order to perform desorption-adsorption cycles within different RH ranges. In particular, cycles were performed within the high RH range, since 70% is the average RH value for most of the environments of concrete structures in European countries.
6.1.4 "Dry" reference state
The choice of the "dry" reference state is of major importance, as it is in particular used for the water content calculations: a change in the method used to obtain this state may induce large changes in the isotherms.
The "dry" reference state (at the test temperature) is defined here as the "equilibrium" state reached at RH = 3%. The specimens are laid in this case in desiccators which contain virgin silica gel. It is the lowest RH the specimens are subjected to during the test. This choice avoids submitting the specimens to any more or less controlled drying process carried out in different conditions from that of the isothermal desorption process (e.g. oven drying at high temperature and in non-controlled RH conditions). The same temperature is maintained during the whole sorption test, including the "dry" state. In addition, the drying method used here is milder than the more conventional D-drying or drying in dry air at a dew point temperature of -76 °C.
6.1.5 "Equilibrium" state and kinetic aspect
Each experimental point of the isotherm must correspond to an equilibrium state between the pore gaseous phase and the environmental conditions (RH and temperature). Here, a so-called "equilibrium" state is assumed, when the specimen mass is stabilized for several weeks, at the precision of the measurement (0.001 g).
In order to assess valuable water vapour sorption isotherms, it is necessary to take into account the very slow kinetics of moisture transport in nano-meso-micro porous media such as cementitious materials, and where the diffusion process is slowed down by water-matrix interactions. The time required to reach moisture equilibrium in a specimen depends on its thickness and on the RH step [8, 27]. As a matter of fact, moisture "equilibrium" was not reached before several months in the few-millimetre

34
specimens tested here. It has even been reached only after more than 1 year, in some cases. Vacuum or low gas pressure, likely to accelerate the process, were not applied here, as the aim was to analyse the actual moisture transport rates in concrete, and to deduce the material behaviour in natural environments.
Note that the choice of very thin specimens, of avoiding pre-drying, of varying the surrounding RH slowly and gradually allows one to limit significantly cracking during the process.
6.2 Experimental results
The water vapour desorption-adsorption isotherms, obtained from the experiments described in section 6.1, on the high-performance cement paste CH (crushed specimens) and concrete BH (slices), mixed with the same constituents (including SF) but with different W/C (see Table 1), are presented in Fig. 10. Each point of the curves is the average of experimental values obtained on at least three specimens. The water contents are expressed here in percentage per unit mass of "dry" hcp (i.e. at "equilibrium" state at RH = 3%) contained in the materials; this allows a direct comparison between the results obtained on concretes and hcps. The results exhibit an hysteresis extending over the whole RH range, but more significant within the mid RH range. In addition, there is a range where the curves obtained on CH and BH matches perfectly (RH 44%).
0
2
4
6
8
10
12
14
0 20 40 60 80 100Relative humidity (%)
Ma
ss
wa
ter
co
nte
nt
(%)
BH des.
BH ads.
CH des.
CH ads.
Figure 10 - Water vapour desorption and adsorption isotherms of the high-performance cement paste CH and concrete BH, at T = 23 °C. The water contents are expressed in percentage per unit mass of "dry" hcp contained in the materials.
The water vapour desorption isotherms obtained on the high-performance concrete B80-S and on the low-grade concrete M25 cast with cement 2 (see Table 1) are compared in Fig. 11. Here again, the isotherms are identical within a given RH range (RH 53.5%).

35
0
10
20
30
40
50
60
0 20 40 60 80 100Relative humidity (%)
Mass w
ate
r co
nte
nt
(%)
B80-S
M25
Figure 11 - Water vapour desorption isotherms of the high-performance concrete B80-S and of the low-grade concrete M25, at T = 23 °C. The water contents are expressed in
percentage per unit mass of "dry" hcp contained in the materials.
The influence of mix-parameters on the equilibrium moisture properties provided by the sorption isotherms can be analysed.
It is clear from Figs. 10 and 11 that the water-to-cement ratio has a great influence on the water vapour desorption isotherms. But, the influence of this parameter is restricted to the high RH region. More precisely, within the range RH 50%, the water contents, i.e. the pore volumes, are significantly affected by this mix-parameter (wide spreading of the curves). When W/C decreases, the "capillary" porosity is reduced and the pore network becomes finer ; the less porous the material, the lower the equilibrium water contents. Furthermore, this is mainly W/C which determines the "equilibrium" desorption water content values for RH 76%. As a matter of fact, a linear relationship has been pointed out between "equilibrium" desorption water contents at RH = 90.4% and W/C (see Fig. 12). For RH 76%, no linear relationship can be exhibited ; the influence of W/C is no more prominent [8]. This is consistent with the fact that below RH 76% (pore radii below 5 nm, according to BJH calculation [28]), water from the external porosity of the C-S-H clusters is removed by the desorption process, as deduced from the pore size distributions derived from the sorption isotherms [8, 29].
Conversely, for RH 50%, the desorption isotherms are identical. This finding illustrates that within this RH range, moisture equilibrium takes place in a pore structure (pore radii below 2 nm, according to BJH calculation [28]) not affected by mix-parameters: the porosity internal to C-S-H gel [8, 30].

36
y = 44,562x
R2 = 0,9804
0
10
20
30
40
0,00 0,20 0,40 0,60 0,80 1,00W/C
Ma
ss
wa
ter
co
nte
nt
(%)
Figure 12 - Correlation between "equilibrium" mass water contents (expressed in percentage per unit mass of "dry" hcp) obtained by desorption at RH = 90.4% and W/C, for various hcps and concretes studied here.
Fig. 10 points out that the same sorption values are obtained on hcps and concretes, within the range RH 44%. Note that identical isotherms are obtained for hcps and concretes over the whole RH range, when the hcp and the concrete have same W/C [8, 30]. This means that the presence of aggregates doesn't influence the isotherms. This can be explained by the fact that the pore size range, in which the moisture equilibrium processes described by the isotherms occur, is much smaller than the paste/aggregate interfacial heterogeneities and the specific voids of this zone. Concrete and hcp textures, in the micro- and the meso-pore ranges investigated by water vapour sorption processes, are therefore quite similar. Moisture equilibrium takes place in the bulk cement paste pores, which are identical in hcps and concretes.
Furthermore, Figs. 10 and 11 exhibit the peculiarities of the hygral behaviour of HP materials within the range RH 50%. It can be seen that a low W/C and the use of SF, which induce a very narrow pore network, as deduced from MIP and water sorption pore size distributions (see Fig. 4 and [8, 30]), modify the hygral behaviour of the hardened material. Within the high RH range, significantly lower water contents are measured for HP materials than for ordinary materials. Moreover, within this RH range, large RH changes induce slight variations of water content for HP materials (see for example the cycles performed within this range and displayed in Fig. 10). This indicates that these materials are rather insensitive to environmental hygral changes within a broad range. In particular, it can be deduced from the water vapour sorption isotherms that HPCs will display reduced moisture losses and deformations associated to external drying at RH 50% (see section 8). These results are of interest to people concerned with the mechanical behaviour and the durability of HPCs. These results are in particular useful for explaining the behaviour of structures submitted to daily and season fluctuations in various environments where the average conditions are most of the time RH 70% (see section 7).
CHBH
M25
COB80-S
hcp (0.45)
BOhcp (0.60)

37
7. Drying behaviour: evolution of moisture profiles
7.1 Experiments
External drying takes place in concrete when the material is submitted to a lower environmental RH than its internal one. This process affects the surface zone of many engineering structures. In order to confirm the findings deduced from the water vapour sorption isotherms with respect to the hygral behaviour, moisture profiles have been measured by gamma-ray attenuation [8] in reinforced concrete (RC) test specimens under natural conditions [6] and in the concrete deck of the Ré Island Bridge. Likewise, the evolution of the moisture profile as a function of time has been monitored in mature samples of ordinary and HP materials submitted to isothermal 1-D drying experiments in laboratory.
7.1.1 Investigations carried out under natural conditions
Cores have been drilled out from RC test specimens exposed for 4 years to two types of natural environments [5, 6]:
a urban environment (Melun, France): the average temperature (within a year) is about 11.6 °C and the average RH is 77-80% (it ranges from 40 to 95%). The structural elements are not sheltered from rain. Core sampling was performed on the face oriented southwest, a road and cold environment (Maurienne, French Alps): the structural elements are installed along the road. They are exposed to freezing and thawing cycles and to the spraying of deicing salts. On this site, the minimum (resp. maximum) temperature (within a year) is about 3 °C (resp. 33 °C) and the average temperature (within a year) ranges from 7.5 to 8.8 °C. The concrete elements are covered by snow about 30 days a year.
In addition, cores have been drilled out from the concrete deck of the Ré Island Bridge at the age of 14 years [1]. The average temperature (within a year) is about 13.5 °C on this site and the average RH (within a year) ranges from 76 to 79%.
7.1.2 Isothermal drying experiments carried out under laboratory conditions
Ø160x100mm samples of concretes BO and BH, and of hcps CO and CH, have been submitted to isothermal external drying at RH = 50 ± 5% and T = 20 ± 1 °C. According to Table 3, self-desiccation effects can be expected even in the long term, for some mixtures. Therefore, the materials were 2-year old at the beginning of the drying experiment, in order to avoid any influence of self-desiccation during the external drying process. The samples were thus sawn from cylinders previously protected from moisture exchange for 2 years. Before submitting the samples to drying, they were wrapped in two superposed aluminium foil sheets, except the two symmetrical plane surfaces, in order to perform one-dimensional drying tests.
Same types of experiments have been performed on cylinders of the porous concrete M25 and of the HPC B80-S: isothermal external drying process at RH = 53.5% (and at RH = 71.5% in the case of M25), but after water saturation.

38
7.2 Experimental results under natural conditions
The moisture profiles obtained by gamma-ray measurements on cores drilled out from the RC test specimens after 4-year exposure on the site of Melun are presented in Figs. 13a (liquid water saturation ratio) and 13b (mass water content expressed in percentage by unit mass of concrete), for various concretes prepared with the same constituents: M25 (see Table 1), M30CV (fly ash / C = 0.43), M50, and M75FS (SF/C = 0.06). The W/C of the last three mixtures are respectively 0.74, 0.48, and 0.38. Their 28-day cylinder average compressive strengths are respectively 48.5, 55.5, and 85.5 MPa [5, 6]. The moisture profiles obtained on the HPCs M75FS, from Melun and Maurienne sites after 4 years, and B60FS from the Ré Island Bridge after 14 years (see section 3.2), are presented in Fig. 13c. The "random" variations that appear on the profiles can be allotted to heterogeneities of the cores.
The natural drying of concrete, which starts from the surface zone exposed to the environmental conditions, as well as the resulting microstructural characteristics and their gradient vs. the depth, explain the reduction in the saturation ratio in the surface zone whose thickness depends on the mixture. The more porous the material, the more sensitive to the environmental conditions (in particular to the drying-wetting cycles). The more porous the material, the more affected by these cycles within a significant thickness. In this last case, the saturation ratio will thus depend on the site. Conversely, HPCs, such as for example concretes M75FS (porosity accessible to water measured on cores equal to 8.4%) and B60FS (porosity 10.8%), are weakly sensitive to the environmental conditions. Gradients (and possible associated cracks) take place within the first millimetres from the exposed surface. In addition, at a given depth, the saturation ratios of the various concretes obtained in various environments (Melun and Maurienne sites, and Ré Island Bridge) and at various ages are very similar. HPCs keep in the course of time a very high liquid water saturation ratio, within the surface and the internal zones (0.80-0.85 within the surface zone and 0.95-1 within the internal zone), and even in the Melun site despite an average external RH of 77-80% (see Fig. 13c). The very similar moisture profiles and the high saturation ratios recorded in the various HPCs, whatever the age and the environmental conditions, can be mainly attributed to the peculiar shape of their water vapour desorption-adsorption isotherms (the isotherms are rather flat within a broad RH range from RH = 100%, see section 6.2). A significant RH change within this range induces only a slight change in water content. And as the residual water content is close to that prevailing at saturation state, the saturation ratio remains close to 1.
After 4-year exposure in the Melun site, the water content of the M25 test specimen is about 5% (by unit mass of concrete) in its internal zone and 1.5% at 5 mm from the surface (see Fig. 13b). For M75FS in the same conditions, the respective values are 3.25% and 2.5% (see Fig. 13b). It can be deduced from these in-situ data and from the desorption isotherms of the materials (see Fig. 11, as M75FS is a similar concrete as B80-S) that the associated internal RH are respectively 90% and 50% for M25, and 70% and 55% for M75FS. These results are consistent with the environmental conditions and show that:

39
0,0
0,2
0,4
0,6
0,8
1,0
0 20 40 60 80 100 120 140Depth (mm)
Sa
tura
tio
n r
ati
o (
-)
M25M30CVM50M75FS
Surface
a) saturation ratio - Melun site - Various concretes - 4 years
0
1
2
3
4
5
6
0 20 40 60 80 100 120 140Depth (mm)
Ma
ss
wa
ter
co
nte
nt
(%)
M25M30CVM50M75FS
Surface
b) mass water content - Melun site - Various concretes - 4 years
0,0
0,2
0,4
0,6
0,8
1,0
0 20 40 60 80 100 120 140
Depth (mm)
Sa
tura
tio
n r
ati
o (
-)
M75FS - Maurienne site - 4 y ears
M75FS - Melun site - 4 y ears
B60FS - Ré Island Bridge - 14 y ears
Surface
c) saturation ratio - HPCs - Various environments and agesFigure 13 - Moisture profiles (expressed as liquid water saturation ratio or as mass water content in percentage per unit mass of "dry" hcp vs. depth) of various concretes obtained by gamma-ray attenuation measurements on cores drilled out from structures.

40
the external RH was probably around 50-55% at the drilling time (by assuming that the microstructural changes induced by any early-age drying are negligible), self-desiccation yielded RH 70% within the internal zone of the HPC, since this zone does not seem affected by external drying. This highlights that strong self-desiccation is compatible with high saturation ratio (as a result of the very fine pore network of HPCs, see Fig. 4 and [1, 8, 30]).
7.3 Experimental and numerical res ults under laboratory conditions
The moisture profiles obtained on CO, CH, BO and BH, according to the procedure described in section 7.1.2, are displayed in Fig. 14 for the hcps and in Fig. 15 for the concretes, for different values of drying time. The results highlight a very different behaviour under the same drying conditions (RH = 50% and T = 20 °C) for the HP materials, compared to CO and BO. The moisture content distributions obtained on CO and BO display gradients shifting as a function of drying time, while the profiles obtained on CH and BH are flat and show nearly no evolution from 7-day to 1-year drying (see Figs. 14 and 15).
a) CO b) CH Figure 14 - Comparison between numerical and experimental (gamma-ray) moisture profiles in drying samples of hcps (RH = 50% and T = 20 °C).
a) BO b) BH Figure 15 - Comparison between numerical and experimental (gamma-ray) moisture profiles in drying samples of hardened concretes (RH = 50% and T = 20 °C).
41
This difference can be attributed first to the fact that ordinary and HP materials are in a very different moisture state at the starting time of this drying experiment. For example, since the drying experiment began after 2-year storage without moisture exchange with the environment, it can be deduced that the self-desiccation process has induced at the starting time of this test an internal RH value of 93% for BO and 64% for BH (see Table 3, and see Fig. 2 for CO and CH). Therefore, when the materials are submitted to RH = 50%, the prevailing moisture gradient between the surface and the internal zones of the sample is very small in HP materials, compared to ordinary ones. As a matter of fact, the difference in mass water content between the surface and the internal zones is about 2% (by unit mass of concrete) for BO, according to its isotherm (see [26]), and 0.5% for BH. The moisture flow is hence respectively reduced.
Moreover, the pore structure involved in the drying test described here (for example, RH range 93-50% for BO, and 64-50% for BH) is finer in the HP mixtures, according to the sorption results. This is another cause of slowing the drying kinetics. As a matter of fact, the moisture diffusivity of the materials decreases with RH within the range involved in this test [30, 31]. Hence, there is a zone and a period (corresponding to RH > 64%) during the drying process, where the moisture diffusivity will be higher for BO than for BH and where the drying kinetics will consequently be faster.
The experimental data have been compared to the numerical results provided by a thermodynamics-based macroscopic model of isothermal moisture transport [26]. This model takes into account the transport mechanisms governed by Fick's law (diffusion) and Darcy's law, without adopting the hypothesis of constant gas pressure [32] contrary to more usual approaches [33, 34]. The numerical moisture profiles of the samples predicted by the model are compared to the experimental data in Fig. 14 for the hcps and in Fig. 15 for the concretes, for different values of drying time. Figs. 14 and 15 illustrate that the moisture profiles predicted by the model during the isothermal drying process at RH = 50% are very similar to that obtained experimentally through gamma-ray attenuation measurements. The model confirms the flat shape of the moisture profiles of HP materials and the influence of the initial moisture gradient between the surface and the internal zones of the sample, as suggested by the experimental results. Nevertheless, the small moisture gradient prevailing in HP materials is rather the result of the peculiar shape of the isotherm (i.e. pore structure) than that of the strong self-desiccation (i.e. low internal RH).
Saturation of the samples before drying doesn't change significantly this finding, as a result of the shape of the isotherms. This is illustrated in Fig. 16 by the results obtained on concrete B80-S (see Table 1) submitted to RH = 53.5% after saturation. The profile at equilibrium at RH = 100% is also reported in the figure. From the short drying times and until 1 year, a flat profile along with a high saturation ratio are observed. The lowest water content recorded is 4.5% (or 19% by unit mass of "dry" hcp), which is far from the equilibrium value 2.5% (or 11% by unit mass of "dry" hcp) at RH = 53.5%, according to the desorption isotherm (see Fig. 11).

42
0,5
0,6
0,7
0,8
0,9
1,0
0 10 20 30 40 50 60 70Height (mm)
Sa
tura
tio
n r
ati
o (
-)RH=100%1 month
3 months6 months1 year
Figure 16 - Moisture profiles obtained by gamma-ray measurements at various drying times in samples of concrete B80-S submitted to RH = 53.5% at T = 20 °C. The profile at equilibrium at RH = 100% is also reported in the figure.
Again, these results are very different from that obtained on laboratory samples of M25 submitted to RH = 53.5% or RH = 71.5% after saturation. In the case of M25, as a result of the high porosity of this material (see Table 1), a low saturation ratio is observed after 2.5-year drying (see Fig. 17a) and very large differences are observed between the profiles measured at saturation state and after 2.5-year drying at RH = 53.5% (or at RH = 71.5%) (see Fig. 17b). A flat profile is also observed, but here only in the long term and as a result of an efficient drying which yields a state close to equilibrium within the sample. As a matter of fact, the water content in the sample submitted to RH = 53.5% is 1.5% (or 11.5% by unit mass of "dry" hcp) within the surface zone, and 2% (or 17% by unit mass of "dry" hcp) within the internal zone, whereas the "equilibrium" value at RH = 53.5% is 1.5% (or 11.5% by unit mass of "dry" hcp), according to the desorption isotherm, see Fig. 11).
Finally, same conclusions can be drawn as those previously deduced from the study carried out under natural conditions (where external and internal drying are concomitant). HP materials are rather insensitive to environmental hygral changes over a broad RH range. This can mainly be attributed to the peculiar water vapour sorption isotherms of these materials, which depict a very fine pore network: a very small pore volume corresponds to the RH range 50-100% (which corresponds to pore radii above 2 nm, according to BJH calculation [8, 28, 29]), which means in particular a very small capillary porosity.

43
0,0
0,1
0,2
0,3
0,4
0,5
0,6
0,7
0,8
0,9
1,0
0 20 40 60 80 100
Height (mm)
Satu
rati
on
rati
o (
-)
RH=71.5% - 2 years
RH=71.5% - 2.5 years
RH=53.5% - 2 years
RH=53.5% - 2.5 years
a) saturation ratio
0
2
4
6
8
0 10 20 30 40 50 60 70 80 90 100Height (mm)
Ma
ss
wa
ter
co
nte
nt
(%) v acuum sat. (n°2)
RH=71.5% - 2 y ears (n°2)RH=71.5% - 2.5 y ears (n°2)v acuum sat. (n°1)RH=53.5% - 2 y ears (n°1)RH=53.5% - 2.5 y ears (n°1)
b) mass water content (% per unit mass of concrete) Figure 17 - Moisture profiles obtained by gamma-ray measurements in samples of concrete M25 submitted to RH = 53.5% and RH = 71.5% at T = 20 °C. The profiles obtained at saturation state are also reported in the figure.
8. "Pure" drying shrinkage and total shrinkage
8.1 Experimental procedure
It can be deduced from Fig. 2 that the internal RH decreases down to 75% for the cement paste with W/C = 0.25, after 2-year sealed curing. Therefore, the first RH step selected for the subsequent external drying test applied to the cement pastes previously submitted to 1-year curing in autogenous conditions (see section 5) was RH = 71.5% at T = 20 °C (obtained by means of SrCl2 saturated solution). Once the "equilibrium" state was reached at this RH, the hcp samples were then submitted to RH = 63.2% (NH4NO3
saturated solution).

44
8.2 Experimental results
The length changes registered on the Ø20x160-mm hcp samples submitted to RH = 63.2% at T = 20 °C, from "equilibrium" state at RH = 71.5%, are plotted vs. drying time in Fig. 18a. It can be seen that, contrary to autogenous deformations, the magnitude (at "equilibrium" state) of "pure" drying shrinkage at RH=63.2% decreases when W/C decreases from 0.60 down to 0.25. More precisely, the relationship between the "equilibrium" drying shrinkage values at RH = 63.2% and W/C seems to be linear above and below a threshold value located at W/C = 0.40 (see Fig. 18b). This result is in agreement with the threshold pointed out for various properties of the cement pastes, at the micro- and the macro-scale, both at early age and in the long term [21]. As expected, it is found that the "pure" drying shrinkage of low W/C materials is significantly reduced.
a) kinetics
0
200
400
600
800
0,20 0,30 0,40 0,50 0,60W/C
Dry
ing
sh
rin
k. b
etw
ee
n
RH
=7
2%
an
d 6
3%
(1
0-6)
b) "equilibrium" values at RH=63.2% vs. W/C Figure 18 - "Pure" drying shrinkage (length changes) measured at T = 20 °C on Ø20x160-mm hcp samples submitted to RH=63.2%, after 1-year sealed curing and equilibrium at RH=71.5%.
An upper limit of the total shrinkage of the set of cement pastes at RH = 71.5% and RH = 63.2% (at T = 20 °C) can be calculated as follows: "equilibrium" value of drying shrinkage at RH = 63.2% (or at RH = 71.5%) added to "ultimate" (i.e. 1-year) value of autogenous shrinkage (see Fig. 19). The superposition principle can be applied here,
0
200
400
600
800
80706050403020100
W/C = 0.25
W/C = 0.30
W/C = 0.35
W/C = 0.40
W/C = 0.45
W/C = 0.50
W/C = 0.60
Drying time (days)
Drying shrinkage between RH=71.5% and RH=63% (10-6)

45
since the RH reached after 1-year sealed curing is higher than 71.5% (see Fig. 2), and since autogenous and drying deformations don't occur in a concomitant way.
0
1000
2000
3000
4000
0,20 0,30 0,40 0,50 0,60W/C
To
tal
sh
rin
ka
ge
(1
0-6) at RH=71.5%
at RH=63.2%
Figure 19 - "Equilibrium" total shrinkage values vs. W/C measured at T = 20 °C on Ø20x160-mm cement paste samples submitted to RH = 71.5% and RH = 63.2%, after 1-year sealed curing.
It can be deduced from Fig. 19 that, in real conditions (when considering no microstructural changes), the total shrinkage of cementitious materials affected by strong self-desiccation (typically HPCs) will be equal or lower than that of ordinary materials, when the environmental RH is lower than the residual internal RH induced by self-desiccation, as illustrated in [16] and [35].
9. Concluding remarks
Various experimental results have been presented in this paper on cement pastes prepared with the same type I OPC and on concretes exposed to laboratory or natural conditions. In particular, the influence of W/C has been investigated on various properties. These results constitute a database useful for further researches and for developing engineering models, capable of predicting both early-age and delayed behaviour of concrete, from the mix-parameters and/or from the microstructural characteristics of the material.
It can be concluded from this study that the autogenous shrinkage recorded in cementitious materials is a direct consequence of self-desiccation, from a given age. As far as the long-term behaviour is concerned, a strong self-desiccation affects the microstructure only through the low degree of hydration of the cement it has induced. The peculiar hygral behaviour of HP materials can rather be attributed to the shape of their water vapour desorption-adsorption isotherms than to the low residual internal RH induced by a strong self-desiccation. The liquid water saturation ratio remains very high, whatever the environmental conditions, within a broad RH range in these materials, as a result of the very small pore volume involved in the wetting-drying process. HPCs are thus very slightly affected by the environmental conditions. They exhibit reduced moisture transfers and associated deformations.

46
Acknowledgments
The authors are grateful to Josette Gawsewitch, Jean-François Bouteloup and Pierre Roussel (LCPC, Paris, France), who took part to the experiments.
References
[1] Baroghel-Bouny, V., Specificities of high-performance concretes - Microstructural characteristics and durability-related properties, evaluated in laboratory and in natural conditions (in French), Etudes et Recherches des LPC, Série Ouvrages d'art, OA 44 (LCPC, Paris, sept. 2004), 76 p.
[2] Persson, B., Consequences of cement constituents, mix composition and curing conditions for self-desiccation in concrete, Mat. and Struct., 33, 2000, pp 352-362.
[3] Sellevold, E.J., Bjøntegaard, Ø., Justnes, H., Dahl, P.A., High-performance concrete: early volume change and cracking tendency, in Proc. of the Int. RILEM Symp. on Thermal cracking at early ages, Munich, Germany (E. & F.N. Spon, London, 1994), pp 229-236.
[4] Pease, B., Hossain, A.B., Weiss, J., Quantifying volume change, stress development and cracking due to early-age autogenous shrinkage, in Proc. of theACI Fall 2002 Convention, Session "Autogenous deformation of concrete", oct. 27 - nov. 1, 2002, Phoenix, Arizona, USA (Ed. by O.M. Jensen, D.P. Bentz and P. Lura, ACI, march 2004), SP-220, pp 23-38.
[5] Baroghel-Bouny, V., De Larrard, F., In place durability assessment for the next millenium - Long-term study, in Proc. of the 5th CANMET/ACI Int. Conf. on Durability of Concrete, june 4-9, 2000, Barcelona, Spain (Ed. by V.M. Malhotra, ACI, 2000), vol. I, SP 192, pp 319-338.
[6] Baroghel-Bouny, V., Gawsewitch, J., Belin, P., Ounoughi, K., Arnaud, S., Olivier, G., Bissonnette, B., Ageing of concretes in natural environments: an experiment for the 21st century. IV - Results on cores extracted from field-exposed test specimens of various sites at the first times of measurement, Bull. des Labo. des Ponts et Chaussées, n° 249, march-april 2004, pp 49-100.
[7] Recommended test methods for measuring the parameters associated to durability (in French), in Proc. of Journées Techniques AFPC-AFREM "Durabilité des Bétons", 11-12 dec. 1997, Toulouse, France (LMDC, Toulouse, 1998).
[8] Baroghel-Bouny, V., Characterization of cement pastes and concretes - Methods, analysis, interpretations (in French) (LCPC Publ., Paris, 1994), 468 p.
[9] Copeland, L.E. and Bragg, G.H., Self-desiccation in Portland cement paste, Bull. Portland Cem. Assoc., 52 (1955) pp 1-11.
[10] Taylor, H.F.W., Cement chemistry, Academic Press Ltd., New York, 1990, 475 p.
[11] Mounanga, P., Khelidj, A., Loukili, A., Baroghel-Bouny, V., Predicting Ca(OH)2
content and chemical shrinkage of hydrating cement pastes using analytical approach, Cem. Conc. Res. 34 (2) (2004) pp 255-265.
[12] Jensen, O. M. and Hansen, F., Autogenous relative humidity change in silica-fume-modified cement paste, Advances in Cem. Res., vol. 7, n° 25, 1995, pp 33-38.

47
[13] Baroghel-Bouny, V., Experimental investigation of self-desiccation in high-performance materials - Comparison with drying behaviour, in Proc. of the 2nd Int. Research Seminar “Self-desiccation and its importance in Concrete Technology”, Lund, Sweden (Ed. by B. Persson and G. Fagerlund, 1997), pp. 72-87.
[14] Persson, B., Hydration and strength of high performance concrete, ACBM, 3, 1996, pp 107-123.
[15] Hadley, D.W., Dolch W.L., Diamond S., On the occurrence of hollow-shell hydration grains in hydrated cement paste, Cem. Conc. Res., vol. 30, 2000, pp 1-6.
[16] Baroghel-Bouny, V., Rougeau, P., Chaussadent, T., Caré, S., Comparative Study of the Durability of Ordinary and High-Performance concretes as part of the "BHP 2000" French National Project, in Proc. of Int. Symp. on High-Performance and Reactive Powder Concretes SHERBROOKE' 98, august 16-20, 1998, Sherbrooke (Québec), Canada (Ed. by P.C. Aïtcin and Y. Delagrave, 1998), vol. 2, pp 281-301.
[17] Paulini, P., A weighing method for cement hydration, in: A.K. Mullick (Ed.), in Proc. of the 9th Int. Congress on the Chemistry of Cement, 1992, National Council for Cement and Building Materials, New Delhi, India, pp. 248-254.
[18] Boivin, S., Acker, P., Rigaud, S., Clavaud, B., Experimental assessment of chemical shrinkage of hydrating cement pastes, in: E.-i. Tazawa (Ed.), in Proc. of the Int. Workshop on Autogenous Shrinkage of Concrete AUTOSHRINK’98, Hiroshima, Japan, 1998 (E and FN Spon, London,1998), pp 81-92.
[19] Justnes, H., Van Gemert, A., Verboven, F., Sellevold, E.J., Total and external chemical shrinkage of low W/C ratio cement pastes, Advances in Cem. Res. 8 (31) (1996) pp 121-126.
[20] Justnes, H., Clemmens, F., Depuydt, P., Van Gemert, D., Sellevold, E.J., Correlating the deviation point between external and total chemical shrinkage with the setting time and other characteristics of hydrating cement paste, in Proc. of the Int. RILEM Workshop on Shrinkage of Concrete "Shrinkage 2000", Paris, France, 2000 (Ed. by V. Baroghel-Bouny and P.C. Aïtcin, RILEM Publ., Cachan, 2000), pp. 57-73.
[21] Baroghel-Bouny, V., Mounanga, P., Khelidj, A., Loukili, A., Rafai, N., Autogenous deformations of cement pastes. Part II: W/C effects, micro-macro correlations, and threshold values, Cem. Conc. Res., 2005.
[22] Baroghel-Bouny, V., Kheirbek, A., Effect of mix-parameters on autogenous deformations of cement pastes - Microstructural interpretations, Conc. Science and Eng., 3 (9) (2001) pp 23-38.
[23] Jensen, O.M., Hansen, P.F., Autogenous deformation and change of the relative humidity in silica-fume-modified cement paste, ACI Mat J 95 (6) (1996) pp 539-543.
[24] Ulm, F.J., Le Maou, F., Boulay, C., Creep and shrinkage coupling: new review of some evidence, Rev Fr Genie Civ 3 (3/4) (1999) pp 21-37.
[25] Feldman, R.F., Sorption and length-change scanning isotherms of methanol and water on hydrated Portland cement, in Proc. of the 5th Int. Congress on the Chemistry of Cement (Cem. Assoc. of Japan, Tokyo, 1968), vol. 3, pp 53-66.
48
[26] Baroghel-Bouny, V., Mainguy, M., Coussy, O., Isothermal drying process in weakly permeable cementitious materials - Assessment of water permeability, Materials science of concrete: transport in cement-based materials, Special volume (Ed. by R.D. Hooton, J.J. Beaudoin, M.D.A. Thomas, J. Marchand and J.P. Skalny, American Ceramic Society, 2001), pp 59-80.
[27] Baroghel-Bouny, V., Perrin, B., Chemloul, L., Experimental determination of moisture properties of hardened cement pastes, showing hysteresis effects (in French), Mat. and Struc., vol. 30, n° 200, july 1997, pp 340-348.
[28] Barrett, E.P., Joyner, L.G., Halenda, P.P., The determination of pore volume and area distributions in porous substances. I - Computations from nitrogen isotherms. J. Amer. Chem. Soc., 73, 1951, pp 373-380.
[29] Baroghel-Bouny, V., Chaussadent, T., Pore structure and moisture properties of cement-based systems from water vapour sorption isotherms, in Proc. of MRS 1994 Fall Meeting, nov. 28 - dec. 2, 1994, Boston, USA, vol. 370 (Materials Research Society, 1995), pp 245-254.
[30] Baroghel-Bouny, V., Texture and moisture properties of ordinary and high-performance cementitious materials, in Proc. of the Int. RILEM Conf. "Concrete: from material to structure", 11-12 sept., 1996, Arles, France (Ed. by J.P. Bournazel and Y. Malier, RILEM, Cachan, 1998), pp 144-165.
[31] Xi, Y., Bazant, Z.P., Molina, L., Jennings, H.M., Moisture Diffusion in Cementitious Materials. Moisture capacity and diffusivity, ACBM, 1 (1994) pp 258-266.
[32] Mainguy, M., Coussy, O., Baroghel-Bouny, V., Role of air pressure in drying of weakly permeable materials, ASCE's Journal of Engineering Mechanics, vol. 127, n° 6, june 2001, pp 582-592.
[33] Bazant Z.P., Najjar L.N., Nonlinear water diffusion in nonsaturated concrete, Mat. et Cons., 5 [25] (1972) pp 3-20.
[34] Xi, Y., Bazant, Z.P., Jennings, H.M., Moisture Diffusion in Cementitious Materials. Adsorption isotherms, ACBM, 1 (1994) pp 248-257.
[35] Baroghel-Bouny, V., Godin, J., Experimental study on drying shrinkage of ordinary and high-performance cementitious materials, Conc. Science and Eng., vol. 3, n° 9, march 2001, pp 13-22.

49
A MACRO-MODEL FOR SELF-DESICCATION IN HIGH
PERFORMANCE CONCRETE
Lars-Olof Nilsson1 & Kristina Mjörnell2
1Lund Institute of Technology, Lund University, Sweden 2Swedish National Testing and Research Institute, Borås, Sweden
Abstract
A model for self-desiccation has been developed by expressing the state of the pore water as relative humidity RH as a function of the remaining free water content and the degree of hydration. The water content and degree of hydration are both determined based on the amount of chemically bound water. The rate of hydration is calculated as a rate of hydration at reference conditions at +20° and 100 % RH multiplied by rate factors. The RH is then derived from the desorption isotherm, which is a function of the degree of hydration.
The paper describes the theoretical model and gives examples of desorption isotherms as functions of age and the humidity effect on the rate of hydration. Examples are also given of the prediction of RH versus time and compared with measurements.
1. Introduction
The use of High Performance Concrete (HPC) in Sweden is almost exclusively in two applications. Firstly, for a few important concrete structures where a service-life of some 100 years is required in harsh marine environments a SRPC/silica fume HPC is used in the cover for the steel reinforcement. Secondly, and much more frequent, a significant portion of all concrete floor slabs where a moisture sensitive flooring is to be used is made by OPC HPC. In both cases the common w/C is around 0.40 or somewhat lower. In the second case, floor slabs, the main reason for using HPC is the controlled and rapid drying by self-desiccation.
Drying of HPC is completely different from drying of ordinary concrete, see Figure 1.
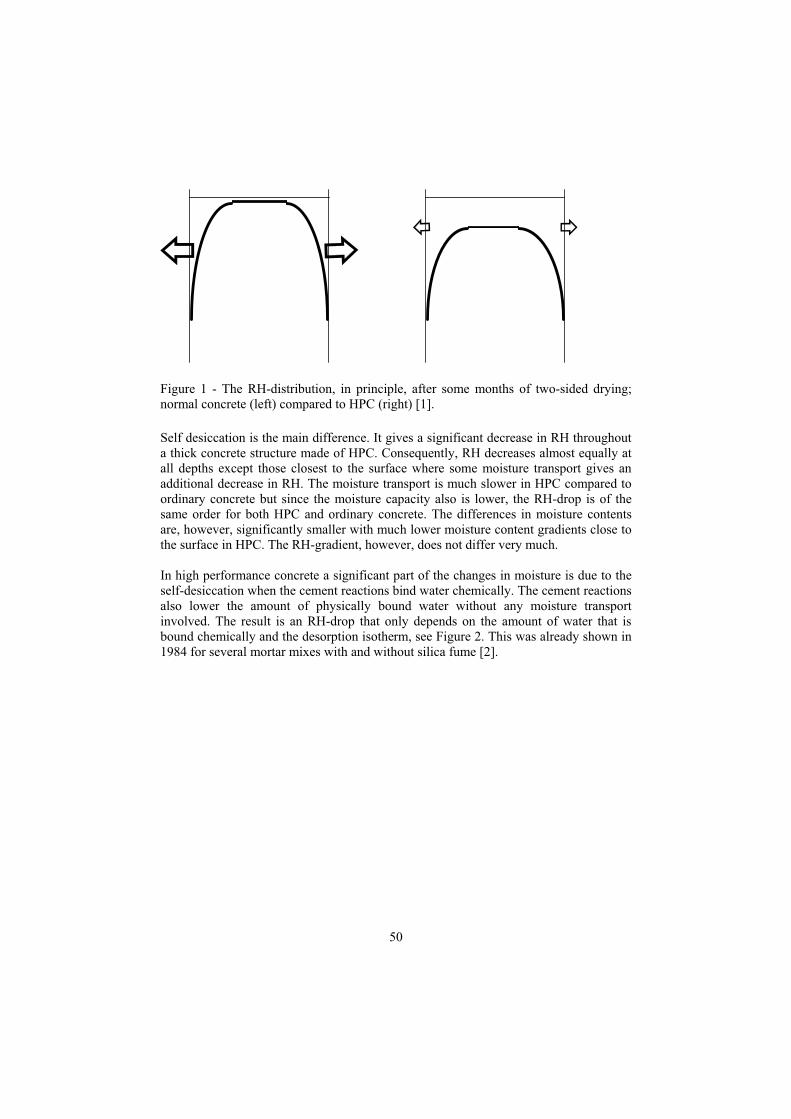
50
Figure 1 - The RH-distribution, in principle, after some months of two-sided drying; normal concrete (left) compared to HPC (right) [1].
Self desiccation is the main difference. It gives a significant decrease in RH throughout a thick concrete structure made of HPC. Consequently, RH decreases almost equally at all depths except those closest to the surface where some moisture transport gives an additional decrease in RH. The moisture transport is much slower in HPC compared to ordinary concrete but since the moisture capacity also is lower, the RH-drop is of the same order for both HPC and ordinary concrete. The differences in moisture contents are, however, significantly smaller with much lower moisture content gradients close to the surface in HPC. The RH-gradient, however, does not differ very much.
In high performance concrete a significant part of the changes in moisture is due to the self-desiccation when the cement reactions bind water chemically. The cement reactions also lower the amount of physically bound water without any moisture transport involved. The result is an RH-drop that only depends on the amount of water that is bound chemically and the desorption isotherm, see Figure 2. This was already shown in 1984 for several mortar mixes with and without silica fume [2].

51
RH [%]0 100
W [kg/m3]
W0
Wn
We
RHself
RH [%]0 100
W [kg/m3]
W0
Wn
We
RHself
Figure 2 - The self desiccation in high performance concrete, in principle.
The self-desiccation gives an RH-drop without any moisture leaving the concrete. The rate and final RH level depends only on the water cement ratio, type of cement and temperature conditions during curing, but not on the thickness of the concrete structure or the drying conditions. The effects of the two dominating parameters for self-desiccation, cement type and water-binder ratio, from several measurements on Swedish Portland cement concretes are shown in Figure 3. Early data on modern concretes from Denmark [8] and Canada [9] gave similar decreases in RH.
There is a tremendous difference in self-desiccation for the two types of cements, with similar fineness, in Figure 3. For a certain RH-drop a w/C of 0.25 is required for the SRPC concrete while the corresponding self-desiccation is obtained at a w/C of 0.40 with the OPC concretes. This difference depends partly on the more rapid hydration of the OPC cement, since the self-desiccation depends on the degree of hydration. Consequently, this difference between the cement types is somewhat reduced with time. Another part of the difference between cements is the difference in alkali contents. At the same w/C a concrete with the Swedish OPC’s have a much higher alkali concentration than with the SRPC. The significant part of the differences in self-desiccation, however, is due to differences in the desorption isotherms for the various cement types [10]-[15].
Silica fume also has an effect on self-desiccation, sometimes very large, but the effect is much smaller than from the type of cement. The effect of silica fume is also less reproducible, i.e. careful pre-testing is required if the silica fume effect is to be used to achieve a certain self-desiccation.

52
SRPC
OPC
70
75
80
85
90
95
100
0.2 0.3 0.4 0.5 0.6
w/C
RH
(%
), 2
8 d
ays
Self-desiccation 28 days,
Norling-Mjörnell (1997)
Figure 3 - Self desiccation at an equivalent age of 28 days at +20°C as a function of w/C and type of cement. Data for Swedish cements from Atlassi et al (1991), Persson (1992) & (1992), Norling Mjörnell (1994) and Hedlund (1996).
Self-desiccation reduces the rate of hydration to such an extent that the hydration eventually stops. According to Figure 2, self-desiccation cannot reach below some 70 % RH for any concrete. A few measurements do exist in the literature where larger RH-drops are indicated for “extreme” concretes. However, it is probable that this is due to measurement difficulties. It is very difficult to measure RH of low-w/C concrete, because the moisture capacity of such a concrete is very low. Any loss of moisture or absorption of moisture by the RH-sensor will result in a systematic error in measured RH. It can not be excluded that a part of the differences between cement types in Figure 2 is due to such measurement difficulties.
2. The model for self-desiccation
A model for self-desiccation was originally developed by Norling Mjörnell in 1994 [6][14], and somewhat revised in 1997 [16] to its present state. The model is based on the principle in Figure 2 and is expressed in, at first sight, a simple equation
wwwwRHwRH neeself 0)( (1)
where we is the evaporable moisture content, w0 is the mixing water, wn is the non-evaporable moisture content and w is any additional water contributed to the cement paste, for instance from “internal curing” in various ways. To get the time-course of the self-desiccation, the parameters must be described as a function of time

53
))(),(()),(),(()( ttTttTwRHtRH Ceself (2)
where T(t) and (t) are the temperature and humidity history respectively up to time tand C is the degree of cement reaction.
To evaluate relations in equation (2) extensive data is required on the moisture effects on rate of hydration and data on the desorption isotherms at different ages. That kind of data is now available for some concretes [1][14].
The moisture content we in equation (2) is obtained from the differences between the original water content w0, corrected for bleeding, early drying in the plastic stage or additional curing water, the chemically bound water developing with time and the additional water w from any internal curing measure
)()(),()( 0 twttTwwtw ne (3)
Equation (3) is not only applicable in experiments on small specimens but is also valid inside concrete structures of HPC at a depth of larger than a few centimetres. The time course will be somewhat different at different depths because of the different temperatures achieved during the first few days [16].
With the last term, the effect of internal curing measures could be included. This, however, requires a description of the exchange of water with time between the paste and the internal curing compounds.
3. Physical binding of water
The mixing water in concrete is bound chemically to the cement but also physically in the cement gel and the capillary pores. The relation between these two binding types is very different in HPC and ordinary concrete. Since the amount of capillary pores is smaller in HPC the amount of physically bound water per kg of cement will be lower, cf. the left part of Figure 4. Per volume of concrete, however, the moisture content is higher in HPC, cf. the middle part of Figure 4 due to a typically higher cement factor in HPC.
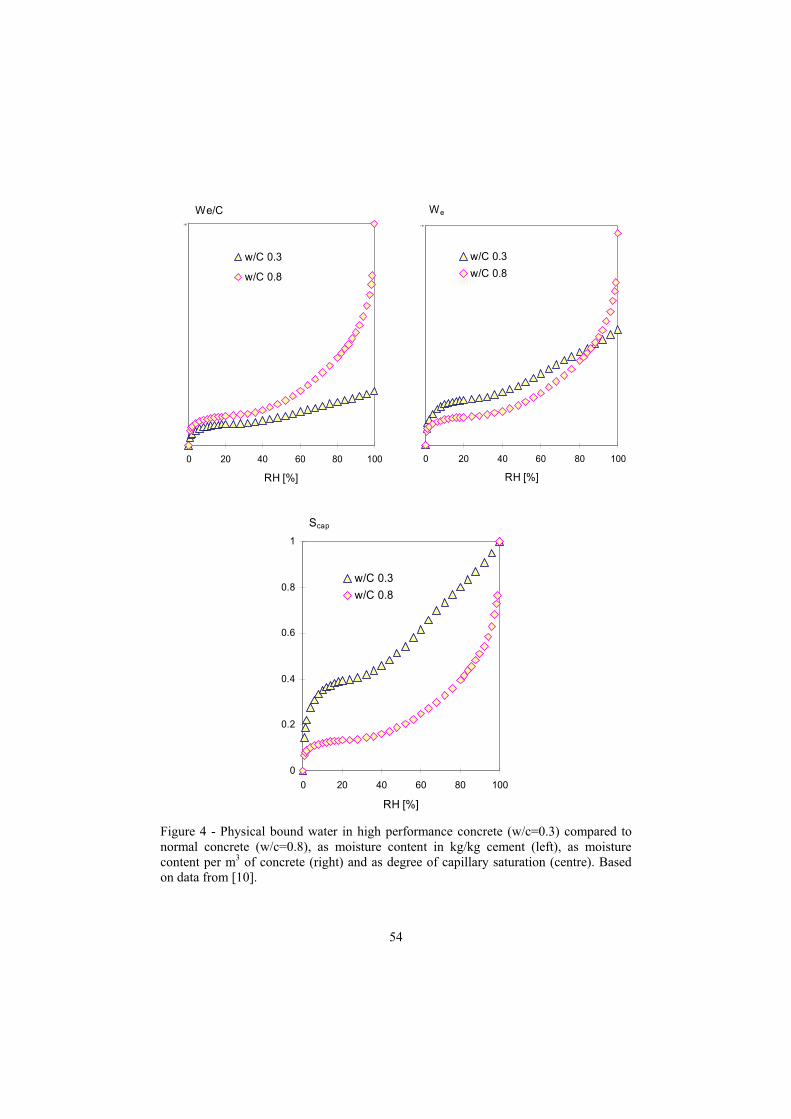
54
0
300
0 20 40 60 80 100
RH [%]
We/C
w/C 0.3
w/C 0.8
0
7 00
0 20 40 60 80 100
RH [%]
We
w/C 0.3
w/C 0.8
0
0.2
0.4
0.6
0.8
1
0 20 40 60 80 100
RH [%]
Scap
w/C 0.3
w/C 0.8
Figure 4 - Physical bound water in high performance concrete (w/c=0.3) compared to normal concrete (w/c=0.8), as moisture content in kg/kg cement (left), as moisture content per m3 of concrete (right) and as degree of capillary saturation (centre). Based on data from [10].

55
In Figure 4 the amount of physically bound water is also shown in relation to saturation, i.e. as degree of capillary saturation Scap or degree of pore filling, which is 1.0 at 100 % RH. High Performance Concrete has a significantly larger portion of the pore system filled with water at a given RH.
A certain RH-drop, from 100 % RH, in saturated concrete due to a high alkali concentration [17] has been neglected in Figure 4. The alkali effect is of course included in the measurements of the desorption isotherms but the visible effect is concentrated to RH in the interval 95-100 % RH.
The decisive mix parameters for the desorption isotherms are mainly the water-binder ratio w/B and the silica fume content. The effects of those two parameters are shown in Figure 5. For HPC with w/B 0.30 and lower the slope of the desorption isotherm is close to zero for RH’s larger than some 75 %. Consequently, the capillary pore system is very limited in those concretes. A consequence of this is that in this RH interval a very small decrease in moisture content will significantly reduce the RH. Another consequence is that RH measurements must be done without any moisture loss in this region to produce a reliable RH.

56
0
0.05
0.1
0.15
0.2
0.25
0.3
0.35
0 20 40 60 80 100
RH [%]
We/C
4005 V
3005 V
2505 V
w /B=0.25, 0.30 & 0.40; 5% Si
data f rom Helsing-At lassi
0
0.05
0.1
0.15
0.2
0.25
0.3
0 20 40 60 80 100
RH [%]
We/C
2510 V
2505 V
2500 V
w /B=0.25; 0, 5 & 10% Si
data f rom Helsing-At lassi
Figure 5 - An example of desorption isotherms for different w/b (with 5 % silica fume) and for different silica fume contents (at w/b 0.25) [12]. The two first digits give the w/B and the last two give the silica fume content in per cent by weight of cement.
For calculations at early ages the desorption properties must be known as functions of age or degree of reaction. Extensive measurements have been done [16] to simultaneously determine RH and physically and chemically bound water on samples with different curing for various times. An example is shown in Figure 6 for one concrete composition. The pore system is clearly becoming finer as the hydration proceeds.

57
0
0.1
0.2
0.3
0.4
0 20 40 60 80 100
RH (%)
We
/C
0.1 0.4 0.70.1-0.2 0.2-0.3 0.3-0.40.4-0.5 0.5-0.6 0.6-0.70.7-0.8
w/C=0.40
Data from Norling M jörnell (1997)
Figure 6 - Calculated and measured desorption isotherms at different ages (as degree of hydration ) for a mortar with w/c 0.40 and SRPC. Data from Norling Mjörnell (1997)[16].
Each point represents one individual sample. The points at different degrees of hydration are compared to calculated desorption isotherms from a model by Norling Mjörnell (1997) [16].
The desorption isotherms are now predictable for HPC for various mix compositions, with and without silica fume, at different ages and curing. Equations, further examples and comparisons with data are found in [16].
4. Chemical binding of water
The amount of chemically bound water in HPC can be calculated [18] from the degree of reaction C of the cement and the degree of reaction s of the silica fume
S0.34C0.25w SCn (4)

58
where C is the cement content and S is the silica fume content. Consequently, the chemical binding of water is proportional to the cement content and the degree of hydration. The cement content is normally much higher in HPC than in ordinary concrete, but the degree of hydration is lower. Silica fume also plays an important role in chemical binding of water. The silica fume pozzolanic reaction actually liberates some chemically bound water.
How fast the chemical binding of water will proceed depends on the concrete composition, mainly the type of cement and w/C, temperature and humidity. The expression used to include these parameters is an expression for the rate of cement reaction, and a similar one for the rate of silica fume reaction [16].
ref
CTCw
C
t
t
t
t )()(/ (5)
where w/c gives the effect of available space for further reaction products, T gives the effect of temperature and the effect of moisture. The right hand factor is the rate of reaction for very “diluted” cement grains in a reference climate, here selected as +20°C and 100 % RH.
4.1 The effects of lack of pore space
Lack of space for the reaction products will eventually make the reactions stop at relatively low degrees of reaction. The effect on the rate of reaction of increasingly smaller and smaller available space for further reaction products is modelled by
a
C
CC
Cw
max,
max,/ (6)
where C,max is the maximum possible degree of cement reaction for the particular w/C and the exponent a is a constant. The C,max is estimated from measurements. The maximum possible degree of reaction is lower than 1 also for w/C much higher than 0.40, contradictory to what is traditionally expected. Because of inhomogeneities, the space somewhere in the system is not available for non-reacted cement grains at some distance. Instead, capillary pores also remain in a system where not all of the cement grains have reacted.
The effect of available space on the cement reaction according to equation (6) is shown in Figure 7 for some water-cement ratios.

59
0.0
0.1
0.2
0.3
0.4
0.5
0.6
0.7
0.8
0.9
1.0
0 0.2 0.4 0.6 0.8 1
Degree of cement reaction,
w/C
w/C = 0.70.4
0.25
Figure 7 - The effect of w/C and degree of hydration on the rate of cement hydration in a reference climate, from [16].
4.2 The moisture effects
Moisture affects the rate of cement reaction in two ways. Firstly, eventually there will be lack of water for the cement reaction in such a way that water that is present might not necessarily be easily available for cement reactions at some distance from that water. Secondly, the available water is more and more firmly bound in the capillary and gel pores and is not available as a reactant in the reaction. These two factors could not be separated in measurements, not in previous [19][20] or later work [21], and not in this study.
Instead, the combined effect of moisture is modelled by a empirical factor w that is equal to 1.0 when the concrete is saturated. That factor depends to some extent on the degree of hydration, see equation (7) and Figure 8.
4
0
,19.0/ CwgC
Cwge
wkCw
kC
w
(7)
where kwg is the amount of water in the gel at saturation and complete hydration. A typical value of kwg is 0.25 [16]. The moisture content we( ) is determined from the desorption isotherm. The value in the parenthesis is an estimate of the portion of the capillary pores that are water filled at a certain RH.

60
The exponent in equation (7) should depend on e.g. the degree of reaction but due to lack of data a constant value has been assumed. A value of 4 fits the measured data fairly well.
0
0.2
0.4
0.6
0.8
1
50 60 70 80 90 100
RH [%]
w/C=0.4 SRPC
0.7
0.1
, w
Figure 8 - The total effect of moisture on the rate of chemical binding of water for degrees of hydration in the interval 0.1-0.7 for concrete with w/c 0.4 and SRPC, from [16].
According to Figure 8, no further cement hydration will occur below 70 % RH and the rate of reaction is significantly slowed down at low humidity, especially at low degrees of hydration, i.e. if the concrete surface can dry the first hours or day. The cement hydration might even stop completely if the concrete surface significantly dries too early [22].
4.3 Temperature effects
The effect of temperature is described with a more traditional expression, cf. equation (8), see e.g. [7].
273
11
TT
T
refe where 3
10
30
Tref (8)
where Tref is the reference temperature +20°C and ref and 3 are empirical constants derived from experimental data.

61
5. Internal curing
Self-desiccation will induce early shrinkage and possibly early cracking or at least contribute to the risk of early temperature cracking. Sometimes the self-desiccation is controlled by “internal curing”, i.e. adding a well distributed moisture source into the cement paste. Such a moisture source must not contribute to the original water content of the paste but contribute its water with time, preferably in the same time-course as the self-desiccation. That means in practice that such an internal source of moisture will be the source of moisture flow into the self-desiccating paste, driven by the differences in the state of water in the paste pore system and in the internal source. Depending on the moisture properties of this moisture source, and its distribution in the material, the additional water content w(t) in equation (3) will to a large or small extent compensate for the changes in evaporable water content due to cement hydration.
The moisture transport from the internal source to the paste must be quantified, especially if the source consists of porous grains or another water-containing media that is distributed in the paste with a certain, large “spacing factor”, cf. the spacing factor of the air-void system to achieve frost resistance. The most important parameters to include into such a prediction are the desorption isotherm of the internal moisture source, the distribution of the “local” internal moisture sources, the moisture transport properties of the paste and the moisture transport properties of the source material.
6. Predictions with the model for self-desiccation
With the self-desiccation model the development of cement reactions and self-desiccation can be predicted. Some examples are shown in this section.
First, the model was tested on data for cement hydration in various humidities. For very thin specimens of one cement mortar cured from a very early age in a constant humidity, ranging from 59 % RH to saturated conditions, the degree of reaction was predicted, cf. Figure 9. The humidity history was estimated to change rapidly from originally wet conditions, 100 % RH, to the desired RH in less than a day. Because this moisture history was not “perfect”, some reactions do occur also in the very low humidity 59 % RH. The specimens, even though they were very thin, did not dry to equilibrium with the intended RH quick enough. The required time to equilibrium was longer and longer the lower the RH, as can be seen from the data points in Figure 9.
The discrepancies between the data points and the predicted curves in Figure 9 are more due to experimental difficulties than errors in the prediction model.

62
w/C 0.4 OPC
100%
95%
85%
75%
59%
0
0.1
0.2
0.3
0.4
0.5
0.6
0.7
0.8
0 14 28 42 56 70Time (days)
c
Figure 9 - Predicted and measured evolution of degree of reaction of the cement in different curing conditions at +20°C, OPC with w/c 0.4.
With the model, self-desiccation of three concretes with different cement types and water cement ratios was predicted, see Figure 10.
OPC w/C=0.4
SRPC
w/C=0.4
SRPC
w/C=0.25
70
75
80
85
90
95
100
0 100 200 300 400
Time (days)
RH (%)
Figure 10 - Predicted and measured changes of RH due to pure self-desiccation for three concrete qualities at +20°C, from [16].
The predictions are remarkably good, compared with the measured data, bearing in mind all the parameters that were independently determined for each cement type.

63
The effect of temperature is shown in Figures 11 and 12. The cement hydration during sealed conditions at the two temperatures is predicted fairly well, when compared to measured data, cf. Figure 11. The predicted self-desiccation at +20°C compares well with the data, also shown in Figure 10. The prediction for curing at +5°C was not compared to measurements.
water cured
seal cured
seal cured at 5°C
0
0.2
0.4
0.6
0.8
1
0.01 0.1 1 10 100 1000
Time (days)
C
Figure 11 - Predicted and measured degree of reaction of cement for water and sealed curing at different temperature levels, SRPC with w/c 0.4, from [16].
measuredat 20 C

64
20°C
5°C
80%
82%
84%
86%
88%
90%
92%
94%
96%
98%
100%
0 200 400 600 800
Time (days)
RH
Figure 12 - Predicted and measured changes of RH due to pure self- desiccation at different temperature levels, SRPC with w/c 0.4.
The effect of temperature on the desorption isotherms is, however, not considered in the model. This means that the predicted difference between curing at 20°C and 5°C is only due to the different degree of reaction of cement, which is not fully correct. The model predicts the RH at +20°C for a concrete cured at various temperature histories. This is what is needed for estimating the drying of interior floor slabs.
7. Conclusion
The model for self-desiccation seems very promising and potentially useful for many applications of High Performance Concrete, even though it was especially designed for concrete floor slabs, where self-desiccation is beneficial. It could very well be applied to concrete structures of HPC were the main concern of self-desiccation is shrinkage and early age cracking. The model can easily be integrated into a model that includes moisture transport, i.e. for any application where the moisture conditions in HPC are important. Such a model was also suggested in previous work [16].
The most uncertain part of the model is the moisture effect on rate of reaction, where more research is needed, especially at very early ages. The technique should be further improved for that special purpose.
measuredat 20 C
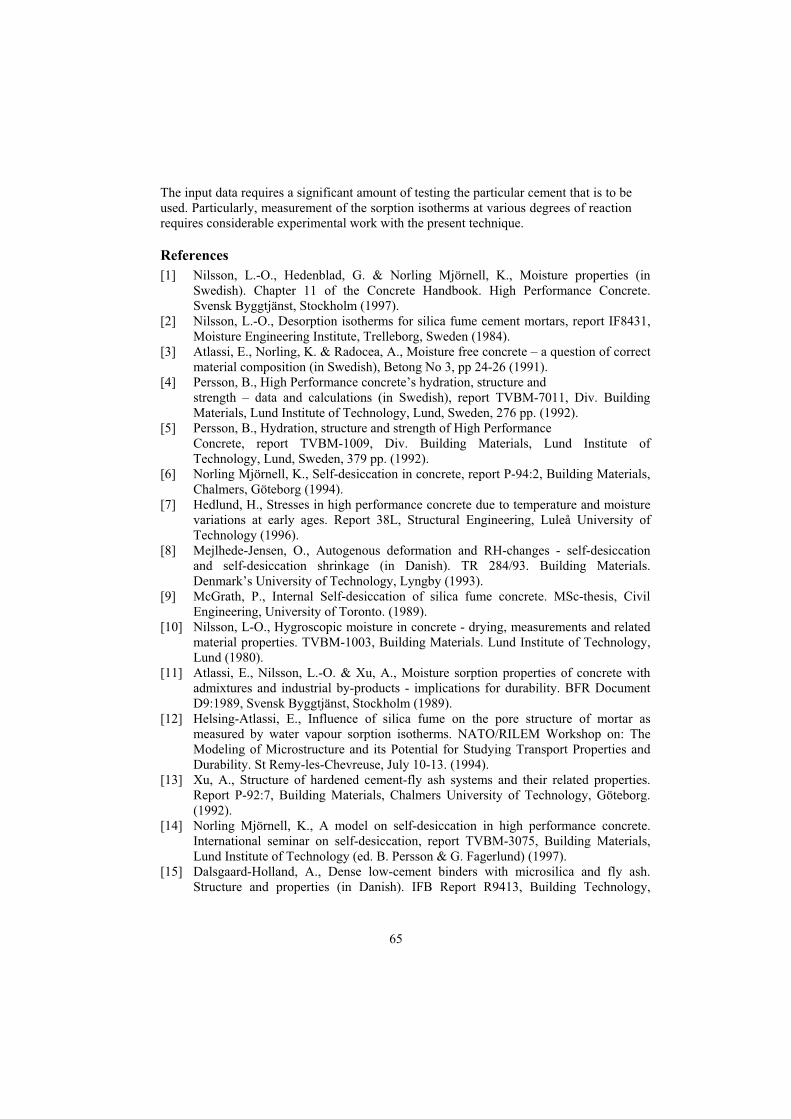
65
The input data requires a significant amount of testing the particular cement that is to be used. Particularly, measurement of the sorption isotherms at various degrees of reaction requires considerable experimental work with the present technique.
References
[1] Nilsson, L.-O., Hedenblad, G. & Norling Mjörnell, K., Moisture properties (in Swedish). Chapter 11 of the Concrete Handbook. High Performance Concrete. Svensk Byggtjänst, Stockholm (1997).
[2] Nilsson, L.-O., Desorption isotherms for silica fume cement mortars, report IF8431, Moisture Engineering Institute, Trelleborg, Sweden (1984).
[3] Atlassi, E., Norling, K. & Radocea, A., Moisture free concrete – a question of correct material composition (in Swedish), Betong No 3, pp 24-26 (1991).
[4] Persson, B., High Performance concrete’s hydration, structure and strength – data and calculations (in Swedish), report TVBM-7011, Div. Building Materials, Lund Institute of Technology, Lund, Sweden, 276 pp. (1992).
[5] Persson, B., Hydration, structure and strength of High Performance Concrete, report TVBM-1009, Div. Building Materials, Lund Institute of Technology, Lund, Sweden, 379 pp. (1992).
[6] Norling Mjörnell, K., Self-desiccation in concrete, report P-94:2, Building Materials, Chalmers, Göteborg (1994).
[7] Hedlund, H., Stresses in high performance concrete due to temperature and moisture variations at early ages. Report 38L, Structural Engineering, Luleå University of Technology (1996).
[8] Mejlhede-Jensen, O., Autogenous deformation and RH-changes - self-desiccation and self-desiccation shrinkage (in Danish). TR 284/93. Building Materials. Denmark’s University of Technology, Lyngby (1993).
[9] McGrath, P., Internal Self-desiccation of silica fume concrete. MSc-thesis, Civil Engineering, University of Toronto. (1989).
[10] Nilsson, L-O., Hygroscopic moisture in concrete - drying, measurements and related material properties. TVBM-1003, Building Materials. Lund Institute of Technology, Lund (1980).
[11] Atlassi, E., Nilsson, L.-O. & Xu, A., Moisture sorption properties of concrete with admixtures and industrial by-products - implications for durability. BFR Document D9:1989, Svensk Byggtjänst, Stockholm (1989).
[12] Helsing-Atlassi, E., Influence of silica fume on the pore structure of mortar as measured by water vapour sorption isotherms. NATO/RILEM Workshop on: The Modeling of Microstructure and its Potential for Studying Transport Properties and Durability. St Remy-les-Chevreuse, July 10-13. (1994).
[13] Xu, A., Structure of hardened cement-fly ash systems and their related properties. Report P-92:7, Building Materials, Chalmers University of Technology, Göteborg. (1992).
[14] Norling Mjörnell, K., A model on self-desiccation in high performance concrete. International seminar on self-desiccation, report TVBM-3075, Building Materials, Lund Institute of Technology (ed. B. Persson & G. Fagerlund) (1997).
[15] Dalsgaard-Holland, A., Dense low-cement binders with microsilica and fly ash. Structure and properties (in Danish). IFB Report R9413, Building Technology,

66
Aalborg University Centre (1994). [16] Norling Mjörnell, K., Moisture conditions in high performance concrete –
mathematical modelling and measurements, report P-97:6, Building Materials, Chalmers, Göteborg (1997).
[17] Hedenblad, G. & Janz, M., The influence of alkali on measured RH in concrete. Report TVBM-3057, Building Materials. Lund Institute of Technology, Lund (1993).
[18] Helsing-Atlassi, E. A quantitative thermo gravimetric study on the non-evaporable water in mature silica fume concrete - Influence of carbonation and moisture conditions. Report P-93:6, Building Materials, Chalmers, Göteborg (1993).
[19] Powers, T. C., A discussion of cement hydration in relation to the curing of concrete, Highway Research Board (1947).
[20] Parrott, L.J., Killoh, D.C. & Patel, R.G., Cement hydration under partially saturated curing conditions, 8th International Congress on Chemistry of Cement, Rio de Janeiro (1986).
[21] Yang, S & Mejlhede-Jensen, O., Hydration of Cement Clinker Minerals in Reduced Relative Humidity Gas Phases. Journal of Building Materials: Vol. 4, Nr. No. 2. s. pp. 101-105 (2001).
[22] Snyder, K.A., and Bentz, D.P., Suspended Hydration and Loss of Freezable Water in Cement Pastes Exposed to 90 % Relative Humidity, Cement and Concrete Research, Vol. 34, No. 11, pp. 2045-2056 (2004).

67
MECHANICAL PROPERTIES OF HIGH-PERFORMANCE
CONCRETE WITH EXPANSIVE ADDITIVE AND
SHRINKAGE REDUCING ADMIXTURE UNDER
SIMULATED COMPLETELY-RESTRAINED CONDITION
AT EARLY AGE
Takafumi NoguchiThe University of Tokyo, Tokyo, Japan Park Sun-GyuYonsei University, Seoul, Korea Ippei Maruyama Hiroshima University, Hiroshima, Japan
Abstract
This paper shows a study of the efficiency of expansive additive and shrinkage reducing admixture in controlling restrained shrinkage cracking of high-performance concrete at early age. Free autogenous shrinkage test of 100 x 100 x 400 mm concrete specimens and simulated completely-restrained test with VRTM (Variable Restraint Testing Machine) were performed. Creep and autogenous shrinkage of high-performance concrete with and without expansive additive and shrinkage reducing admixture were investigated by experiments that provided data on free autogenous shrinkage and restrained shrinkage. The results showed that the addition of expansive additive and shrinkage reducing admixture effectively reduced autogenous shrinkage and tensile stress in the restrained conditions. Also, it was found that the shrinkage stress was relaxed by 90 % in high-performance concrete with expansive additive and shrinkage reducing admixture at early age.
1. Introduction
A development of high-performance concrete with high-performance and improved durability has brought new opportunities to the construction industry. However, some attention was given to characteristics of such concrete, in particular with respect to their cracking sensitivity. It has been argued and demonstrated experimentally that a low water-to-cement ratio concrete may undergoes shrinkage due to self-desiccation. If this shrinkage is restrained, the concrete may crack. This autogenous shrinkage cracking is a major concern for the durability and aesthetic of concrete structures [1]. One possible method to reduce the adverse effects of cracking due to autogenous shrinkage is the addition of expansive additive and shrinkage reducing admixture. Tests conducted by many researchers have shown the beneficial effects of addition of expansive additive and shrinkage reducing admixture [2, 3]. However, much of the study on this problem has been based on determination of free shrinkage strain. In order to assess the problem properly, stresses developed under restrained conditions should be evaluated. This paper aims at evaluating mechanical properties of concrete such as various types of strain, shrinkage stress and creep behaviour with and without expansive additive and shrinkage reducing admixture at early age. Finally, the paper discusses on the control of

68
shrinkage cracking by means of expansive additive and shrinkage reducing admixture in high-performance concrete.
2. Variable Restraint Testing Machine
The VRTM system is a modification of TSTM (Temperature Stress Testing Machine) developed by Springenshmid [4]. Figure 1 shows a schematic of the experimental device. The concrete is freshly cast into the framework of the testing machine. Specimen, whose size is 1500 mm in length and 100 mm x 100 mm in cross sectional area among the original gauge length, is mounted horizontally in a frame. The ends of specimen are fixed to the cross-head. Two cross-head claws hold the concrete specimen and are able to exert tensile or compressive force. The cross-head holding the concrete specimen is fixed to the frame. The other cross-head is controlled according to the information of load and deformation of concrete specimen. The load through the specimen is monitored by a load cell with accuracy of 1 N placed at the fixed cross-head. And the longitudinal deformation of
Figure 1 - Schematic of VRTM (Variable Restraint Testing Machine)

69
Figure 2 - Program flow of simulated completely-restrained test for controlling cross head and schematic graphs of stress and strain of specimen.

70
concrete specimen is monitored by four LVDTs (Linear Variable Differential Transducers with accuracy of 0.125 µm) with two embedded bars that are placed at the center part of specimen keeping 500 mm distance at initial casting. Since the concrete has no sufficient stiffness in the first few hours, the experiment is commenced after the concrete exhibit setting.
3. Simulated completely-restrained test by VRTM
The program flow of simulated completely-restrained test and relation of displacement and load, which are expressed as strain and stress, respectively, is shown in Figure 2. The restrained condition is simulated by maintaining the total deformation of the restrained specimen within a threshold, which is defined as the permissible change in the length of the specimen. There are two controlling trigger for simulating completely-restrained condition. One is for keeping constant stress in the specimen. This trigger, named as stress trigger, realized semi-constant load deformation with stepping stress controlling. And the other, named as strain trigger, is for keeping constant strain condition of the specimen. After several iteration of stress trigger control, strain of specimen together with autogenous shrinkage, drying shrinkage, creep, and elastic deformation can be seen eventually. In order to keep the semi-constant completely-restrained condition, the cross-head is fixed to get the initial distance of embedded bar. Therefore, iteration of strain trigger control including sub-iteration of stress trigger realizes the “simulated completely-restrained condition”. While repeating this process in VRTM, a simulated completely-restrained condition is achieved and the stress generated by shrinkage is measured. The stress trigger and strain trigger are set as parameters for the investigation on creep behaviour of the specimen. The VRTM system is a modification of TSTM (Temperature Stress Testing Machine).
4. Experimental program
4.1 Materials and mix proportion of concrete
Normal high-performance concrete (NHC) and high-performance concrete with 20 kg/m3 of expansive additive (EHC) or 6 kg/m3 of shrinkage reducing admixture (SHC) were investigated. Materials used were ordinary Portland cement, crushed limestone coarse aggregate with maximum size of 20 mm, and natural sand. The grading of coarse aggregate satisfied the requirement of JIS A 1102, and the fine aggregate had a fineness modulus of 2.73. The NHC, EHC and SHC were made using high-range water-reducing admixture to show slump-flow of 600 ± 50 mm in fresh state and their water-to-cement ratio was 0.30. The mix proportions of concrete are presented in Table 1. Concrete were mixed in a pan type mixer and cast into 100 × 200 mm mould for the test on compressive strength, elastic modulus and tensile splitting strength.

71
Table 1 - Mix Proportions of Concrete (W/C=0.3)
Composition NHC EHC SHC
Cement (kg/m3) 550 530 550
Expansive additive (kg/m3) 0 20 0
Shrinkage reducing admixture (kg/m3) 0 0 6
Water (kg/m3) 165 165 165
Fine aggregate (kg/m3) 781 781 781
Coarse aggregate (kg/m3) 869 869 869
High-range water-reducing admixture (cement weight %) 0.7 0.7 0.7
4.2 Autogenous shrinkage test and VRTM test
Measurements of free autogenous shrinkage were performed using LVDTs whichstiffness is very soft. Concrete for free autogenous shrinkage was cast in a steel mould of 100 × 100 × 400 mm. Length changes of the restrained concrete by VRTM were measured using LVDTs which were provided at the both ends of two external quartz rods and connected to steel bars embedded in the concrete. The embedded steel bars move along with the displacements of concrete specimen. In this research, the triggers of load and deformation in simulated completely-restrained test were 100 N at a maximum, which was defined as an unloading level soon after tensile stress detection, and 4 µm, respectively. The completely-restrained condition of VRTM was simulated by maintaining the total deformation of specimen within a threshold value of 4 µm, which is defined as the permissible change in the length of the concrete specimen before restoration to original length. After casting, the top surface of the concrete was covered with a polyester film in order to avoid moisture loss from the specimen to environment. The autogenous deformation up to 5 days after casting was recorded on sealed specimens cured at 20 °C.
5. Test results
5.1 Mechanical properties
Test results of compressive strength, splitting tensile strength and elastic modulus are shown in Table 2. The results represent the average value of three 100 × 200 mm concrete specimens. NHC shows the fastest strength development and the highest value during first 5 days. The compressive strength, splitting tensile strength and elastic modulus of EHC and SHC show analogous values with those of NHC.
Table 2 - Properties of Concrete Specimens
Comp. Strength (MPa) Tensile Strength (MPa) Elastic Modulus (GPa)
1 day 3 days 5 days 1 day 3 days 5 days 1 day 3 days 5 days
NHC 25.6 56.5 65.4 2.2 4.4 4.9 22.5 30.6 32.3
EHC 25.1 51.4 57.7 2.4 3.6 4.1 22.6 29.7 33.1
SHC 24.9 53.8 64.1 2.3 3.1 3.8 23.1 29.9 33.0
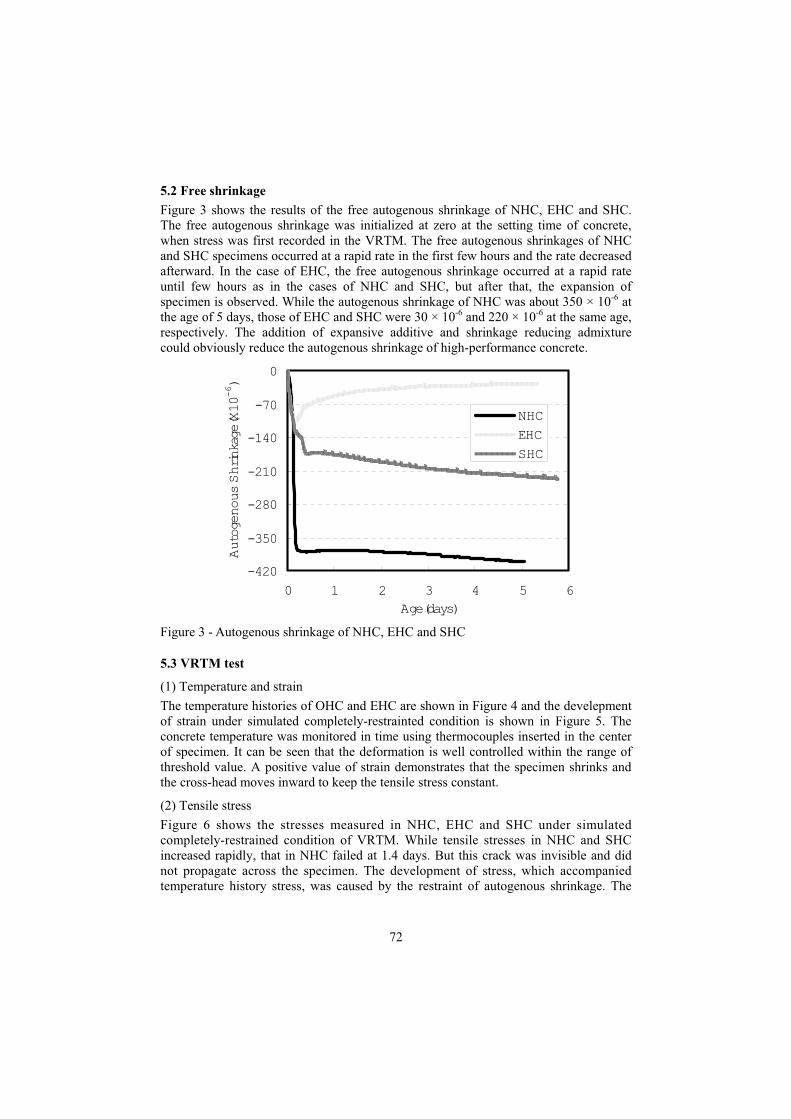
72
5.2 Free shrinkage
Figure 3 shows the results of the free autogenous shrinkage of NHC, EHC and SHC. The free autogenous shrinkage was initialized at zero at the setting time of concrete, when stress was first recorded in the VRTM. The free autogenous shrinkages of NHC and SHC specimens occurred at a rapid rate in the first few hours and the rate decreased afterward. In the case of EHC, the free autogenous shrinkage occurred at a rapid rate until few hours as in the cases of NHC and SHC, but after that, the expansion of specimen is observed. While the autogenous shrinkage of NHC was about 350 × 10-6 at the age of 5 days, those of EHC and SHC were 30 × 10-6 and 220 × 10-6 at the same age, respectively. The addition of expansive additive and shrinkage reducing admixture could obviously reduce the autogenous shrinkage of high-performance concrete.
-420
-350
-280
-210
-140
-70
0
0 1 2 3 4 5 6
Age(days)
Autogenous Shrinkage(X10-6)
NHC
EHC
SHC
Figure 3 - Autogenous shrinkage of NHC, EHC and SHC
5.3 VRTM test
(1) Temperature and strain
The temperature histories of OHC and EHC are shown in Figure 4 and the develepment of strain under simulated completely-restrainted condition is shown in Figure 5. The concrete temperature was monitored in time using thermocouples inserted in the center of specimen. It can be seen that the deformation is well controlled within the range of threshold value. A positive value of strain demonstrates that the specimen shrinks and the cross-head moves inward to keep the tensile stress constant.
(2) Tensile stress
Figure 6 shows the stresses measured in NHC, EHC and SHC under simulated completely-restrained condition of VRTM. While tensile stresses in NHC and SHC increased rapidly, that in NHC failed at 1.4 days. But this crack was invisible and did not propagate across the specimen. The development of stress, which accompanied temperature history stress, was caused by the restraint of autogenous shrinkage. The

73
calculated ratio of tensile stress to splitting tensile strength was approximately 0.7 as already observed by other researchers [5]. On the other hand, tensile stress in EHC and SHC showed that no cracking occurred and tensile stress generated was lower than that
0
5
10
15
20
25
30
0 1 2 3 4 5 6
Age(days)
Temperature(�
)
NHC
EHC
SHC
Figure 4 - Temperature histories of NHC, EHC and SHC
-4
-3
-2
-1
0
1
2
3
4
0 1 2 3 4 5 6
Age(days)
Strain(x10-6)
NHC
EHC
SHC
Figure 5 - Strain of NHC, EHC and SHC in VRTM
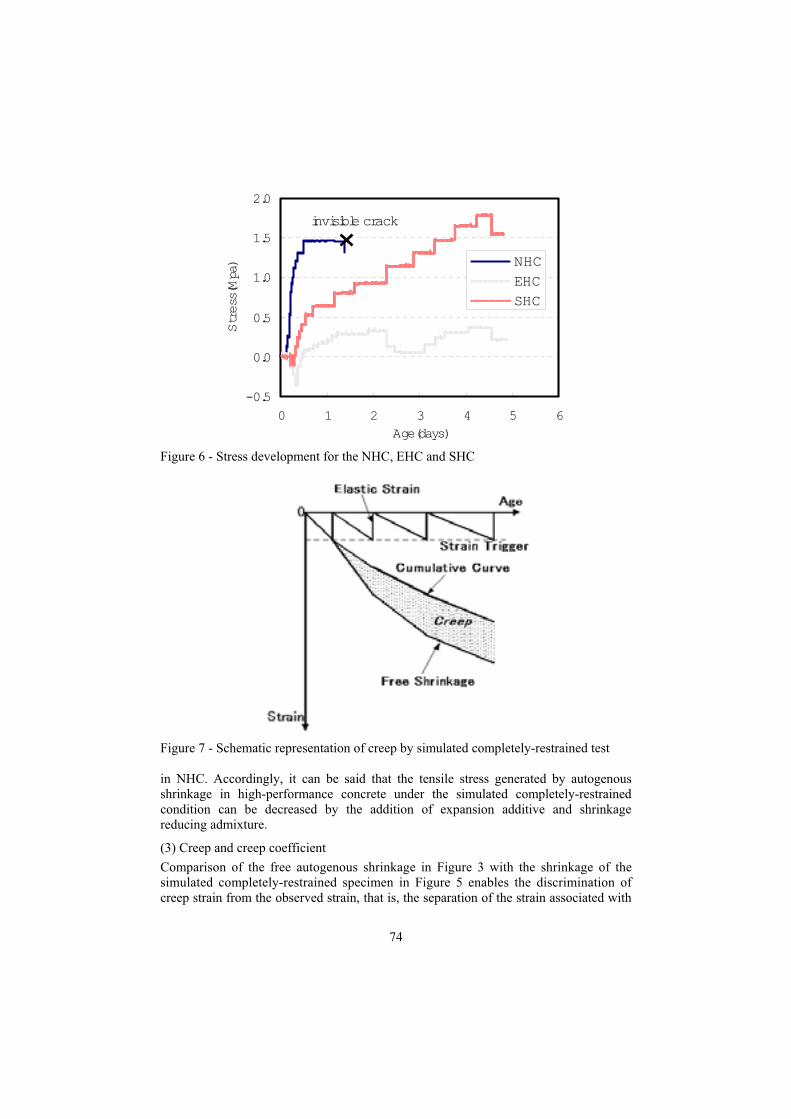
74
-0.5
0.0
0.5
1.0
1.5
2.0
0 1 2 3 4 5 6
Age(days)
Stress(Mpa) NHC
EHC
SHC
invisible crack
Figure 6 - Stress development for the NHC, EHC and SHC
Figure 7 - Schematic representation of creep by simulated completely-restrained test
in NHC. Accordingly, it can be said that the tensile stress generated by autogenous shrinkage in high-performance concrete under the simulated completely-restrained condition can be decreased by the addition of expansion additive and shrinkage reducing admixture.
(3) Creep and creep coefficient
Comparison of the free autogenous shrinkage in Figure 3 with the shrinkage of the simulated completely-restrained specimen in Figure 5 enables the discrimination of creep strain from the observed strain, that is, the separation of the strain associated with

75
creep in the restrained specimen from that due to shrinkage and elastic deformation. Figure 7 shows how creep strain can be obtained on the basis of the restrained test and the free autogenous shrinkage test. The cumulative curve, which is obtained by
-400
-350
-300
-250
-200
-150
-100
-50
0
0 1 2 3 4 5
Age(days)
Creep(x10-6)
NHC
EHC
SHC
Figure 8 - Creep strain of NHC, EHC and SHC
0
4
8
12
16
20
0 1 2 3 4 5
Age(days)
Creep coefficient
NHC
EHC
SHC
Figure 9 - Creep coefficient of NHC, EHC and SHC
accumulation of the elastic strain measured from the recovery cycles of VRTM test. This creep calculation is based on the hypothesis that the free shrinkage can be simply subtracted from the deformation of the simulated completely-restrained specimen. This approach is common in the different researches [6, 7]. Creep coefficient is generally defined as ultimate creep deformation (total deformation subtracted with elastic

76
deformation and shrinkage deformation) divided by initial elastic deformation. In this paper, the creep strain and the creep coefficient in each step, which contains the contribution of the previous stress and time steps, are calculated as follows:
i,creep = i,free - i,elastic (1)
i,co-creep = i,creep / i,elastic (2)
where i,creep is creep strain in each step, i,free is free shrinkage strain in each step, i,elastic is elastic strain in each step and i,co-creep is creep coefficient in each step.
Figure 8 shows the development of the creep strain in NHC, EHC and SHC calculated according to equation 1. The creep is a significant portion of the deformation in high-performance concrete at early age. The creep strain showed the tendency to increase rapidly from immediately after the beginning of measurement up to 10 hours, and increased slightly afterwards. The creep strain corresponded to approximately 90 % of the strain of free shrinkage in all concretes. It is assumed that a considerable tensile stress in high-performance concrete can be relaxed under restrained condition at early age. The creep coefficients in NHC, EHC and SHC calculated according to equation 2 are shown in Figure 9. The creep coefficient decreased rapidly in a few hours due to the high rate of creep strain development, and then decreased at a lower rate. While the creep coefficient of NHC was lower than those of EHC and SHC in the beginning, it became approximately the same level afterward. This indicates that the tensile stress in restrained EHC and SHC has lower than that in NHC at early age.
6. Conclusion
Based on the analysis of the results on the measurement of stress of high-performance concrete with and without expansive additive and shrinkage reducing admixture using VRTM, the following conclusions can be drawn.
1. The variable restraint testing machine could show how tensile stress and strain develop under simulated completely-restrained condition in high-performance concrete with and without expansive additive and shrinkage reducing admixture.
2. The tensile stress in the concrete with expansive additive or shrinkage reducing admixture under simulated completely-restrained condition at early ages was lower than that of normal high-performance concrete.
3. Concrete with water-to-cement ratio of 0.3 was sensitive to autogenous shrinkage cracking which might occur at early age. However, addition of expansive additive or shrinkage reducing admixture showed a crack prevention effect in high-performance concrete at early age.
4. Creep strain in normal high-performance concrete was larger than that of concrete with expansive additive or shrinkage reducing admixture. Creep coefficient of normal high-performance concrete was lower than that of concrete with expansive additive or shrinkage reducing admixture at early age.

77
References
[1] Japan Concrete Institute (2002), “Report of Technical Committee on Autogenous Shrinkage of Concrete“ (in Japanese)
[2] Sato, R. et al. (2000), “An Investigation of Reducing Shrinkage of High-performance Concrete”, Proceeding of Japan Concrete Institute, Vol.22, No.2, pp.991-996 (in Japanese)
[3] Tanimura, M. et al. (2001), “Experimental Study on Reduction of Shrinkage Stress of High-performance Concrete”, Proceeding of Japan Concrete Institute, Vol.23, No.2, pp.1075-1080 (in Japanese)
[4] Springenshmid, R., Gierlinger, E. and Kienozycki, W. (1985), “Thermal Stresses in Mass Concrete: New Testing Method and the Influence of Different Cements”, 5th International Conference on Large Dams (ICOLD), Lausanne, CH, pp.57-72
[5] Maruyama, I., Park S. G. and Noguchi, T. (2002), “Time-dependent Mechanical Properties of Concrete under Simulated Completely-restrained Condition at Early Age”, Proceeding of Japan Concrete Institute, Vol.24, No.1, pp.357-362 (in Japanese)
[6] Kovler, K. (1994),”Testing System for Determining the Mechanical Behaviour of Early Age Concrete under Restrained and Free Uniaxial Shrinkage”, Materials and Structures, pp.324-330
[7] Altoubat, S. A. and Lange, D. A. (2001), “Creep, Shrinkage, and Cracking of Restrained Concrete at Early Age”, ACI Materials Journal, July-August, pp.323-331

78
MODELING AUTOGENOUS SHRINKAGE OF CONCRETE
ACCOUNTING FOR CREEP CAUSED BY AGGREGATE
RESTRAINT
Z.C. Grasley, D.A. Lange, A.J. Brinks, M.D. D’Ambrosia University of Illinois at Urbana-Champaign
Abstract
Linear elastic models involving paste shrinkage and aggregate restraint interaction have been developed by previous researchers for predicting the drying shrinkage of portland cement concrete. These models may also be useful for predicting the autogenous shrinkage of concrete induced by self-desiccation of the cement paste. A limitation of elastic models, however, is their inability to account for the viscoelastic behavior of cement paste. This limitation may become more pronounced when modeling concrete with high paste content. Self-consolidating concrete often employs relatively high paste content in order to achieve the desired rheological properties. In this paper, a new model is developed that is analogous to Pickett’s model, but accounts for creep of concrete caused by aggregate restraint. The measured autogenous shrinkage of two self-consolidating concretes is compared to both the elastic Pickett’s model as well as the new viscoelastic model predictions. Results indicate a significant improvement in fit using the viscoelastic model.
1. Introduction
For durability, structural, and aesthetic reasons researchers and practitioners have long sought reliable means to assess the potential for concrete to crack due to shrinkage. Accurate shrinkage prediction models are an important tool for carrying out such an assessment. Since the 1950’s, many researchers have modeled drying shrinkage of concrete as a function of the mechanical properties of the aggregates and paste fractions, along with the measured paste shrinkage [1]-[4]. One of the first such models was developed by Pickett [2]. Pickett modeled concrete shrinkage by considering the effect of the addition of a single small, spherical particle of aggregate in a large spherical body of concrete. By treating the concrete as homogenous and expressing the function as a differential equation, the problem was solved in terms of the given aggregate content, g, as
( ) ( )
( ) (1 )
dS g dg
S g g (1)
where S is the shrinkage and dS is the differential in shrinkage due to the increase in the aggregate volume fraction g. The term was expressed as
gg EE /)21(21
)1(3 (2)
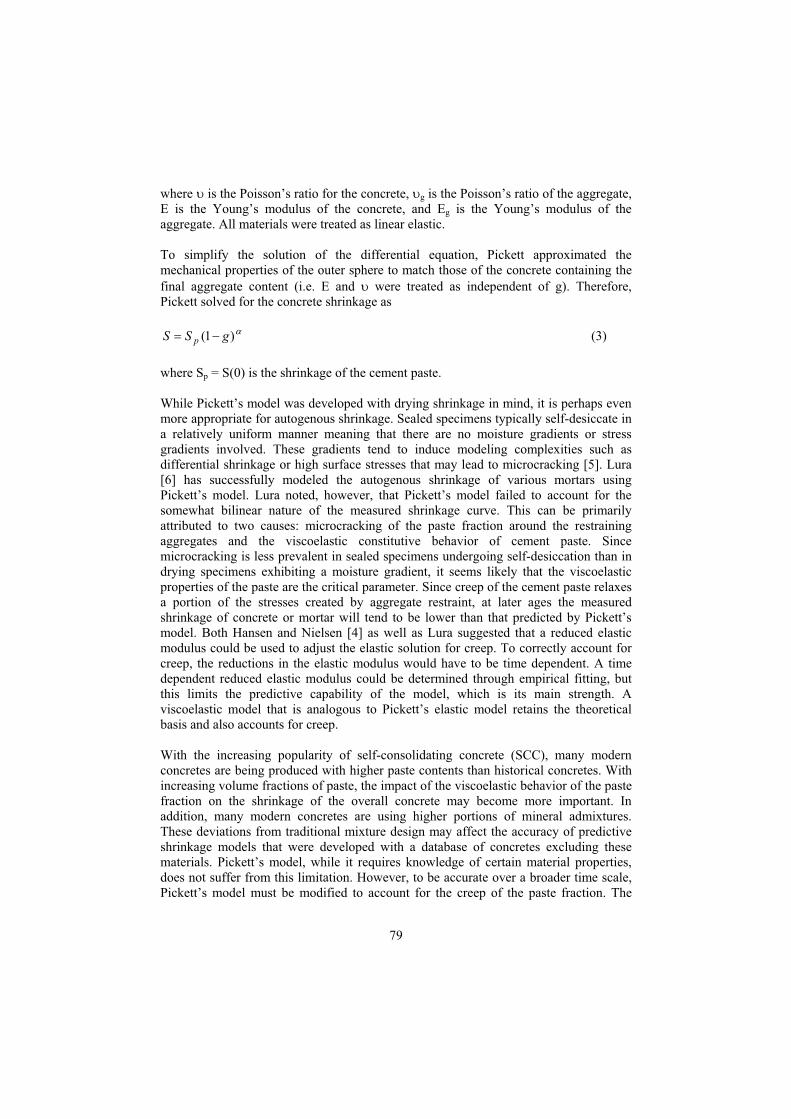
79
where is the Poisson’s ratio for the concrete, g is the Poisson’s ratio of the aggregate, E is the Young’s modulus of the concrete, and Eg is the Young’s modulus of the aggregate. All materials were treated as linear elastic.
To simplify the solution of the differential equation, Pickett approximated the mechanical properties of the outer sphere to match those of the concrete containing the final aggregate content (i.e. E and were treated as independent of g). Therefore, Pickett solved for the concrete shrinkage as
)1( gSS p (3)
where Sp = S(0) is the shrinkage of the cement paste.
While Pickett’s model was developed with drying shrinkage in mind, it is perhaps even more appropriate for autogenous shrinkage. Sealed specimens typically self-desiccate in a relatively uniform manner meaning that there are no moisture gradients or stress gradients involved. These gradients tend to induce modeling complexities such as differential shrinkage or high surface stresses that may lead to microcracking [5]. Lura [6] has successfully modeled the autogenous shrinkage of various mortars using Pickett’s model. Lura noted, however, that Pickett’s model failed to account for the somewhat bilinear nature of the measured shrinkage curve. This can be primarily attributed to two causes: microcracking of the paste fraction around the restraining aggregates and the viscoelastic constitutive behavior of cement paste. Since microcracking is less prevalent in sealed specimens undergoing self-desiccation than in drying specimens exhibiting a moisture gradient, it seems likely that the viscoelastic properties of the paste are the critical parameter. Since creep of the cement paste relaxes a portion of the stresses created by aggregate restraint, at later ages the measured shrinkage of concrete or mortar will tend to be lower than that predicted by Pickett’s model. Both Hansen and Nielsen [4] as well as Lura suggested that a reduced elastic modulus could be used to adjust the elastic solution for creep. To correctly account for creep, the reductions in the elastic modulus would have to be time dependent. A time dependent reduced elastic modulus could be determined through empirical fitting, but this limits the predictive capability of the model, which is its main strength. A viscoelastic model that is analogous to Pickett’s elastic model retains the theoretical basis and also accounts for creep.
With the increasing popularity of self-consolidating concrete (SCC), many modern concretes are being produced with higher paste contents than historical concretes. With increasing volume fractions of paste, the impact of the viscoelastic behavior of the paste fraction on the shrinkage of the overall concrete may become more important. In addition, many modern concretes are using higher portions of mineral admixtures. These deviations from traditional mixture design may affect the accuracy of predictive shrinkage models that were developed with a database of concretes excluding these materials. Pickett’s model, while it requires knowledge of certain material properties, does not suffer from this limitation. However, to be accurate over a broader time scale, Pickett’s model must be modified to account for the creep of the paste fraction. The

80
purpose of this research is to develop a new viscoelastic model analogous to Pickett’s elastic model that more accurately predicts concrete shrinkage over a broad time scale.
2. Methods for developing viscoelastic solutions
The most common method for developing viscoelastic solutions to mechanics problems is utilization of the correspondence principle. This method was first developed in the 1960’s and has been described by Lee [7]. The method allows elastic solutions to be converted to viscoelastic solutions using either Laplace or Fourier transforms. The principle states that linear viscoelastic materials can be described in operator form as
QP (4)
where P and Q are linear differential operators expressed as
a
rr
r
rt
pP
0
and a
rr
r
rt
0
. (5)
The variables pr and qr are material constants (internal or hidden variables). If the differential operator can be eliminated from the viscoelastic formulation, then the form will match the elastic solution. This can be accomplished by taking the Laplace or Fourier transform of the constitutive equation. The transformed viscoelastic constitutive equation is expressed as
)(
)(
sP
sQ (6)
where s is the transform variable and the superscript bar denotes the transformed function. The viscoelastic constitutive equation is now analogous to the elastic equation. Also, if the equilibrium, strain-displacement, and boundary condition equations are transformed they remain in the same form as the elastic solutions (with some restrictions on time-dependent boundaries). This allows any elastic solution to be used to determine the viscoelastic solution. The procedure involves taking the elastic solution and replacing the elastic moduli, strain, and stress terms with the corresponding transformed viscoelastic variables. The inverse transform is then performed to return the solution to the time domain.
A limitation of the correspondence principle is encountered when one considers time dependent internal material variables. In this case, Eq. (5) is expressed as
a
rr
r
rt
tpP
0
)( and a
rr
r
rt
tqQ
0
)( . (7)
As a result, the transform of Eq. (7) would be expressed as

81
)()( sQsP (8)
which is not analogous to the elastic solution. This creates an impasse for using this method for modeling concrete or cement paste since the materials are known to age, i.e. the creep properties are age dependent. Despite this limitation, the correspondence principle has been used previously in conjunction with Pickett’s model to calculate shrinkage stress development [8].
Other elastic-viscoelastic analogies have been developed that allow material properties to be time dependent, a summary of which can be found in [9]-[10]. McHenry [11] was perhaps the first to develop an elastic-viscoelastic analogy for aging materials. McHenry’s method utilizes the integral representation of creep and requires that Poisson’s ratio be constant. Unlike the elastic Poisson’s ratio which may be dependent on age of loading [12], the viscoelastic Poisson’s ratio ( ) is a time dependent property influenced by the stress history of the material [13]-[14]. Some experiments have indicated that at constant moisture content and temperature, the viscoelastic of concrete is relatively constant [15]-[17]. A time-independent viscoelastic Poisson’s ratio indicates that the dilatational and deviatoric creep rates are identical.
The elastic-viscoelastic analogy used in this paper to derive the viscoelastic model was described by Bazant [18]. Bazant recognized that linear Volterra integral operators can be manipulated algebraically in much the same fashion as elastic moduli. This method allows aging materials to be modeled using elastic solutions since, as stated previously, all other governing equations for viscoelasticity already match those in elasticity. The main limitation to this method is that one must be careful in applying the integral operators since they must operate on the same quantities as in the viscoelastic constitutive equation.
3. Development of viscoelastic model
For aging linear viscoelasticity, the constitutive equation can be written as
')'()',()(
0
dttttWt
t
klijklij (9)
where Wijkl represents the components of the compliance tensor, t is time, t’ is the time of stress application, and the superscript dot represents the time derivative [19]. For uniaxial loading,
')'()',()(
0
dttttJt
t
(10)
where J(t,t’) is the viscoelastic compliance. For non-aging linear viscoelasticity, this relation can be represented by

82
')'()'()(
0
dttttJt
t
(11)
where J is now a function of a single variable t-t’. Aging viscoelasticity can also be written in a similar form by utilizing the solidification theory [20]-[22]. The solidification theory is an attractive solution to the aging problem for several reasons. First, it is physically justifiable for concrete. Second, it avoids complexities (arising from higher order derivatives) in fitting numerical data using mechanical models such as the Kelvin model. From solidification theory,
t
t
h dtJ
ataEttJ
'0
)',(
)(
1
)'(
1)',( (12)
where a(t’) is an aging function, E0 is the instantaneous elastic Young’s modulus of the solidified hydration product, and Jh is the non-aging compliance of the solidified hydration product. Inserting Eq. (12) into Eq. (10) one obtains
')'()',(
)(
1
)'(
)'()(
0 0 '0
dttdtJ
ataE
tt
t t t
t
h . (13)
For the elastic case, Eq. (13) reduces to
)(
)()(
0 taE
tt (14)
which is appropriate for a solidifying elastic material.
The procedure for the development of the viscoelastic model is very much like the method that Pickett used in developing his elastic model except that the viscoelastic constitutive relations are used rather than the elastic. Pickett’s method utilized the elastic solution for stresses, strains, and displacements for a spherical particle within a larger sphere of shrinking material as shown in Figure 1. The final solution was obtained by equating the pressure the shrinking outer sphere places on the inner sphere with the equal and opposite pressure the inner sphere places on the outer sphere. The stresses in the outer sphere are
33
33
3
3
cb
rb
r
qcr (15)
33
33
3
3 2
2 cb
rb
r
qct (16)

83
where r is the radial stress, t is the tangential stress, r is the radial coordinate, c is the radius of the inner sphere, b is the radius of the outer sphere, and q is the pressure applied to the inside surface of the outer sphere. The radial displacement, ur, for either the inner or outer sphere is defined as
])1[( rtrE
ru (17)
where is the Poisson’s ratio for the sphere in question. If we approximate the viscoelastic Poisson’s ratio as time independent and substitute in the time dependent stresses, the viscoelastic radial displacement in the outer sphere can be expressed as
t
r dttqttJcb
rb
cb
rb
r
ctu
033
33
33
33
2
3
')'()',(2
2
1)( . (18)
Figure 1 - Diagram of spherical aggregate in spherical concrete outer shell defining model geometry
Multiplying ur by 4 b2 we obtain the reduction in volume shrinkage of the total body caused by the restraint of the inner sphere as
INTcb
bVqub fbr 33
32 3
2
134 (19)
where )()( tfqtq f , V is the volume of the inner sphere (4/3 c3), and
')'()',(
0
t
dttfttJINT . (20)

84
If restraint were not present, the entire body would have been reduced in volume by 3SV, so the reduction in volume shrinkage can be designated as -3 SV so that Eq. (19) can be expressed as
INTcb
bVqSV f 33
33
2
133- . (21)
The stresses on the inner sphere exerted by the pressure of the outer sphere are
qr
qt , (22)
so ur is expressed as
)21( grE
qru . (23)
The reduction in the volume of the inner sphere caused by the pressure q on it is equal to the reduced space available to it within the outer sphere, or
INTcb
cbqcVSVS
E
Vtfqfg
g
fg
33
333 2
2
1
2
1433
)()21(3 (24)
By equating qf from Eq. (21) and Eq. (24) and assuming b/c , we get
SVVSS g )( (25)
where
t
g
g
dttfttJE
tf
0
')'()',(
)21)((21
)1(3 (26)
The differential form of Eq. (25) is the same as Eq. (1) so that if we neglect the dependence of Jc on g (in the same way that Pickett ignored the dependence of E on g), the solution is
)1( gSS p . (27)

85
4. Experimental procedure and materials
Two SCC mixtures were chosen to evaluate the new viscoelastic model. The mixture designs for the two materials, denoted Mix-1 and Mix-2, are shown in Table 1. To determine the paste properties for each of these materials, paste specimens were prepared separately and did not include any of the chemical admixtures. The experimental methods used to determine the relevant paste and concrete properties are listed in the following subsections.
Table 1 - Mixture proportions for self-consolidating concretes used in the model
SG Unit Mix-1 Mix-2
Cement (Type I) 3.15 lb/yd3 661 679
kg/m3 392 403
Fly Ash (Class C) 2.65 lb/yd3 157 151
kg/m3 93 90
Coarse Aggregate, 3/4" (20 mm) 2.70 lb/yd3 367 579
kg/m3 218 343
Coarse Aggregate, 3/8" (10 mm) 2.70 lb/yd3 1075 1018
kg/m3 638 604
Fine Aggregate (FM = 2.57) 2.64 lb/yd3 1403 1389
kg/m3 832 824
Water 1.00 lb/yd3 311 267
kg/m3 185 158
Superplasticizer (CAE) 1.06 fl oz/yd3 63 36
l/m3 2.44 1.38
Paste content by Volume % 37% 34%
FA/CA ratio 0.97 0.87
Slump flow in 30 27
mm 750 700
Air Content % 1.0% 3.0%
w/cm 0.38 0.32
4.1 Concrete elastic modulus
Concrete specimens were cast in 4” (100 mm) diameter by 8” (200 mm) height molds and sealed for the first 24 h after casting. The cylinders were then demolded and wet cured until the time of testing. Two cylinders were tested at 1, 3, 5, 7, 14, and 28 d for each material. Deformation during loading was measured using a clip mounted extensometer with a 4” (100 mm) gage length. The loading rate was 1.25 mm/min.
4.2 Concrete creep
The creep specimens were standard 6” (150 mm) diameter, 12” (300 mm) height cylinders with a Measurements Group 4” (100 mm) embedment strain gage model EGP-

86
5-350 placed longitudinally in the center of the cylinder. The specimens were kept sealed from casting in the laboratory over night. The following day the cylinders were demolded and placed in a 100% relative humidity moist curing room for 28 days.
The creep specimens were sealed with aluminum-coated adhesive tape and loaded after 28 days as shown in Figure 2. The compressive creep testing racks used conform to ASTM C512 and consist of triangular plates in series with the concrete specimens and a high-stiffness spring. A load was imposed on the spring and transferred to the specimens using a 25-ton hydraulic jack. The spring was secured in a compressed state, maintaining a compressive load on the specimens, freeing the jack to be used for more than one specimen. For each specimen, the applied load corresponded to ten percent of the measured compressive strength of the concrete at the time of loading.
Figure 2 - Basic creep specimens loaded with a hydraulic jack in the center spring-loaded frame
4.3 Paste autogenous shrinkage
Cement paste specimens were cast in 4” (100 mm) diameter by 8” (200 mm) height cylinder molds with embedment strain gages inside. The molds were enclosed with a plastic cap sealed with silicone from the time of casting. For at least 12 h after casting
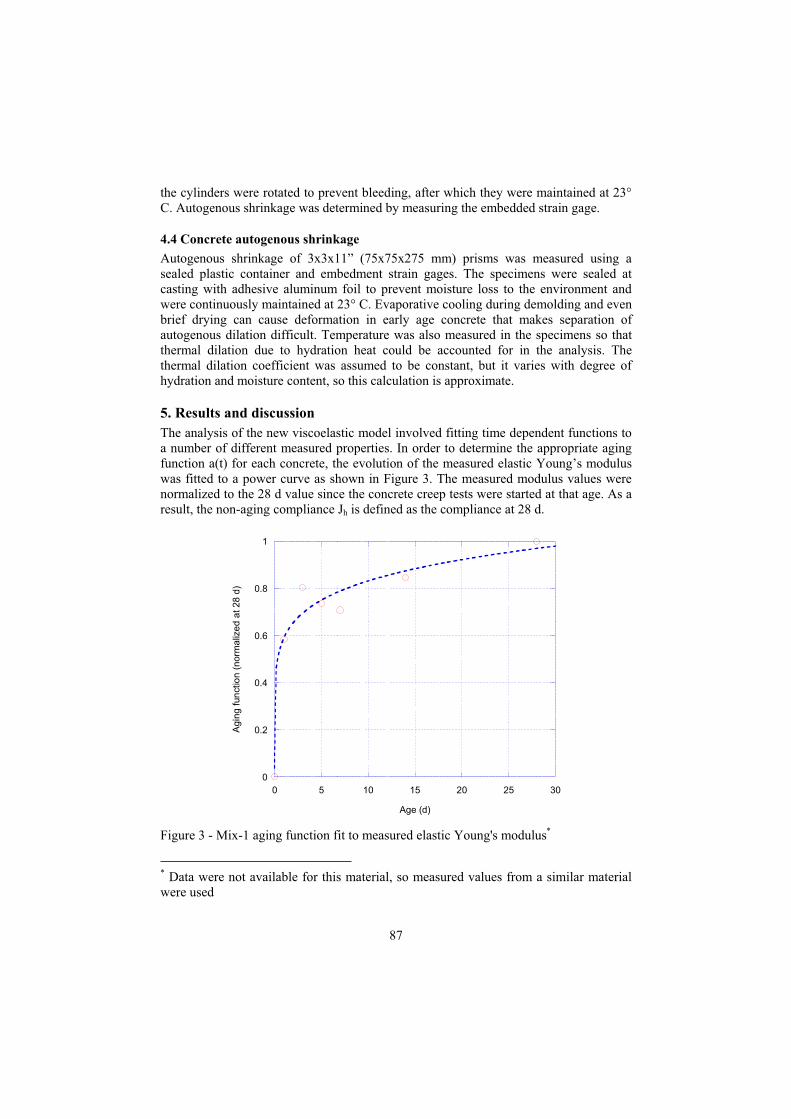
87
the cylinders were rotated to prevent bleeding, after which they were maintained at 23° C. Autogenous shrinkage was determined by measuring the embedded strain gage.
4.4 Concrete autogenous shrinkage
Autogenous shrinkage of 3x3x11” (75x75x275 mm) prisms was measured using a sealed plastic container and embedment strain gages. The specimens were sealed at casting with adhesive aluminum foil to prevent moisture loss to the environment and were continuously maintained at 23° C. Evaporative cooling during demolding and even brief drying can cause deformation in early age concrete that makes separation of autogenous dilation difficult. Temperature was also measured in the specimens so that thermal dilation due to hydration heat could be accounted for in the analysis. The thermal dilation coefficient was assumed to be constant, but it varies with degree of hydration and moisture content, so this calculation is approximate.
5. Results and discussion
The analysis of the new viscoelastic model involved fitting time dependent functions to a number of different measured properties. In order to determine the appropriate aging function a(t) for each concrete, the evolution of the measured elastic Young’s modulus was fitted to a power curve as shown in Figure 3. The measured modulus values were normalized to the 28 d value since the concrete creep tests were started at that age. As a result, the non-aging compliance Jh is defined as the compliance at 28 d.
0
0.2
0.4
0.6
0.8
1
0 5 10 15 20 25 30
Ag
ing
fun
ctio
n (
norm
aliz
ed
at
28
d)
Age (d)
Figure 3 - Mix-1 aging function fit to measured elastic Young's modulus*
* Data were not available for this material, so measured values from a similar material were used

88
In order to determine the viscoelastic compliance of each concrete as a function of time, the measured creep data were fitted to a Dirichlet series (Kelvin chain), which can be expressed as
n
i
tt
ih
iem
ttJ
1
/)'( )1(1
)'( (28)
where mi are the internal, hidden moduli, and i are the retardation times. As suggested by Bazant [9], to avoid an ill-conditioned equation system a range of retardation times over the log time scale of interest were prescribed. These retardation times as well as the model fit mi (internal spring constants in Kelvin chain) are listed in Table 2. For fitting the creep data it was assumed, as expressed in Eq. (12), that all mi aged according to the same function such that the viscoelastic strain is expressed as
')'()1(1
)(
1
)'(
)'()(
0 0 ' 1
/)'(
0
dttdemataE
tt
t t t
t
n
i
tt
i
i (29)
where )'(t is equal to )'(0 ttH since the load was a constant load placed at 28 d.
H(t-t’) is the Heaviside function. Since 1)'( ttH in the range of integration, Eq. (29)
can now stated as
t t
t
n
i
tt
i
demataE
t i
0 ' 1
/)'(0
0
0 )1(1
)(
1
)'(
1)( (30)
where t’ is 28 days. Since the creep specimens were moist cured until the time of loading at 28 days, it was approximated that all deformation of the specimens after that time was due to creep (i.e. no autogenous shrinkage). The fitted data for Mix-1 are shown in Figure 4.
The measured autogenous shrinkage of the paste specimens was also fitted to a power function. This function was used as a loading function for the model (i.e. q(t)) where qf
was chosen to equal the 28 day shrinkage value. The raw paste shrinkage data were also fitted as shown in Figure 5 to use in calculating Pickett’s model predictions for comparison purposes.

89
Table 2 - Summary of fitting parameters for creep (mi in 106 psi, 1 psi = 6.9 kPa)
Parameter Mix-1 Mix-2
1 (d) 10 10
2 (d) 100 100
3 (d) 1000 1000
m1 7.1671 4.0648
m2 19.162 8.5632
m3 5.9146 9.5834
m4 2.7839 1.2013
R2 value 0.9924 0.9927
In order to solve Eq. (26) to determine for each material, it was approximated that = g=constant=0.20. The integral was numerically approximated using the Midpoint
Riemann Sum method with 500 partitions. Figure 6 and Figure 7 show the resulting plotted predictions for Mix-1 and Mix-2 for both Pickett’s elastic model and the new viscoelastic model versus the measured values. In both models, Eg was taken as a weighted average of the limestone modulus (10.8 x 10⁶ psi, from [21] ) and the sand modulus (10.2 x 10⁶ psi -- 7 x 10¹⁰ Pa from [24]) based on the relative volume fraction of each in g. From the figures, it is clear that Pickett’s model dramatically over-predicts concrete shrinkage as time progresses. On the other hand, the viscoelastic model provides a much closer prediction to the measured values. By accounting for creep, the viscoelastic model provides a more accurate prediction of the shrinkage curve that tends to flatten out as time goes on.
100
150
200
250
300
350
400
0 50 100 150 200 250
Cre
ep S
tra
in x
10
6
Age (d)
Figure 4 - Mix-1 creep function fit to measured concrete compressive creep data

90
0
100
200
300
400
500
10 20 30 40 50 60 70
Pa
ste
Sh
rin
ka
ge
Str
ain
x 1
06
Age (d)
Figure 5 - Mix-1 paste autogenous shrinkage function fit to measured free shrinkage
Also shown on Figure 6 and Figure 7 is the predicted shrinkage if is considered to be constant at 1.7. Pickett noticed that this value seemed to give a quality empirical fit for the materials he tested. The autogenous shrinkage of Mix-1 and Mix-2 is fit exceptionally well using this value as well. For Mix-2, the prediction with =1.7 is almost identical to the viscoelastic prediction, which implies that the viscoelastic for the material is also relatively constant at 1.7. Indeed, Figure 8, showing the evolution of the viscoelastic and elastic alphas for each material, indicates this is true. The viscoelastic model presented in this paper provides evidence as to why a constant =1.7gives a good fit for typical materials. The reason is relatively constant is because the affect of creep negates the affect of increasing elastic modulus with age. The elastic mirrors the aging function since no creep is considered, and thus dramatically over-predicts shrinkage.

91
-140
-120
-100
-80
-60
-40
-20
0
0 20 40 60 80 100
MeasuredPickett's modelViscoelastic modelPickett's empirical fit (Alpha=1.7)
Sh
rin
ka
ge
Str
ain
x 1
06
Age (d)
Figure 6 - Comparison of Pickett's elastic model and new viscoelastic model predictions for Mix-1 autogenous shrinkage
-150
-100
-50
0
0 10 20 30 40 50 60
MeasuredPickett's modelViscoelastic modelPickett's empirical fit (Alpha=1.7)
Sh
rin
ka
ge
Str
ain
x 1
06
Age (d)
Figure 7 - Comparison of Pickett's elastic model and new viscoelastic model predictions for Mix-2 autogenous shrinkage

92
While the new model shows no improvement in fit versus Pickett’s suggested empirical equation using =1.7, the new model does have the advantage that it is theoretically based and has no fitting parameter involved in the shrinkage prediction. This property of the viscoelastic model may be particularly attractive when usin g non-standard materials. Alpha is likely to change if aggregates or paste fractions are used that have nontraditional elastic or creep properties. It is also possible that at very high or low paste contents that would need to change. L’Hermite [25] found that can range from 1.20 to 1.70 based on reported shrinkage values, while Neville reported that can range from 1 to 2 [26]. In these circumstances, the theoretical viscoelastic model should provide more reliable results than the empirical fit.
While the new model developed in this paper improves on Pickett’s elastic model, there are still a number of potential sources of error (modeling and experimental) that leave room for improvement:
Linear (rather than nonlinear) viscoelasticity is assumed for concrete As in Pickett’s model, dependence of E (or J) on g is ignored No damage such as microcracking is considered around aggregates The aging function for creep was determined using the evolution of elastic Young’s modulus rather than from measured creep at different loading ages Any autogenous shrinkage of the creep specimens was ignored (specimens were wet cured) Creep was measured on wet cured specimens whereas shrinkage specimens were sealed Superplasticizer was used in concrete specimens, but not paste specimens A time-independent, stress history independent Poisson’s ratio was assumed.
1
1.2
1.4
1.6
1.8
2
0 20 40 60 80 100
Mix-1 Viscoelastic Alpha
Mix-1 Elastic AlphaMix-2 Viscoelastic AlphaMix-2 Elastic Alpha
Alp
ha
Age (d)
Figure 8 - Evolution of alpha for Mix-1 and Mix 2 using elastic and viscoelastic models

93
6. Summary
Pickett’s model for predicting concrete shrinkage has been modified to account for the viscoelastic properties of concrete. By accounting for creep caused by aggregate restraining stresses, the model shows significant improvement over Pickett’s elastic model. A theoretical basis is given for the empirical adaptation to the elastic model suggested by Pickett. While the empirical equation gives adequate fit for the materials included in this paper, it is likely that the empirical equation would not adequately fit materials with nonstandard elastic/viscoelastic properties or paste contents. The viscoelastic model developed in this paper, as a theoretical model, should not be limited by widely varying material properties.
Acknowledgements
The authors would like to thank Pietro Lura for his insightful comments and discussion regarding Pickett’s model. His contributions helped spawn the idea for this work.
References
[1] Hobbs, D.W., Bulk modulus, shrinkage and thermal expansion of a two phase material, Nature 222/5196 849-51 (1969).
[2] Pickett, G., Effect of aggregate on shrinkage of concrete and hypothesis concerning shrinkage, American Concrete Institute Journal 27/5 581-590 (1956).
[3] Hansen, W., Constitutive Model for Predicting Ultimate Drying Shrinkage of Concrete, Journal of the American Ceramic Society, 70/5 329-332 (1987).
[4] Hansen, T.C., Nielsen, K.E.C., Influence of aggregate properties on concrete shrinkage, American Concrete Institute Journal, 62/7 783-794 (1965).
[5] Grasley, Z.C., D'Ambrosia, M.D., and Lange, D.A., Internal Relative Humidity and Drying Stress Gradients in Concrete, Concrete Science and Engineering, Accepted for Publication (2004).
[6] Lura, P., Autogenous Deformation and Internal Curing of Concrete, Delft University: Delft, The Netherlands (2003).
[7] Lee, E.H., Stress Analysis in Visco-Elastic Bodies, Quarterly of Applied Mathematics, 13/2 183-190 (1955).
[8] Kawamura, M., Shrinkage Stresses in Concrete as a Viscoelastic Material, American Concrete Institute Journal, 66/12 968-71 (1969).
[9] Bazant, Z.P., Creep and Shrinkage in Concrete, in Mechanics Today, S. Nemat-Nasser, Ed., Pergamon Press. 1-93 (1975).
[10] Bazant, Z.P., Material Models for Structural Creep Analysis, in Mathematical Modeling of Creep and Shrinkage of Concrete, Z.P. Bazant, Ed., John Wiley and Sons, 99-215 (1988).
[11] McHenry, D., A New Aspect of Creep in Concrete and its Application to Design, Proc. ASTM, 43 1069-1086 (1943).
[12] Persson, B., Quasi-instantaneous and long-term deformations of high-performance concrete with some related properties, Report no. TVBM-1016, Lund University (1998).
[13] Hilton, H.H., Yi, S., The Significance of (An)Isotropic Viscoelastic Poisson Ratio Stress and Time Dependencies, Int. J. of Solids & Structures, 35/23 3081-3095 (1998).
94
[14] Hilton, H.H., Implications and Constraints of Time-Independent Poisson Ratios in Linear Isotropic and Anisotropic Viscoelasticity. Journal of Elasticity, 63 221-251 (2001).
[15] Gopalakrishnan, K.S., Neville, A.M., Ghali, A., Creep Poisson's Ratio of Concrete Under Multiaxial Compression, American Concrete Institute Journal, 66 1008-1019 (1969).
[16] Neville, A.M., and Dilger, W., Creep of Concrete: Plain, Reinforced, Prestressed., Amsterdam: North-Holland (1970).
[17] Meyer, H.G., On the Influence of Water Content and of Drying Conditions on Lateral Creep of Plain Concrete, Materials and Structures/Materiaux et Constructions, 2 125-131 (1969).
[18] Bazant, Z.P., Phenomenological Theories for Creep of Concrete Based on Rheological Models, Acta Technica CSAV, 11 82-109 (1966).
[19] Volterra, V., Theory of Functionals and of Integral and Integrodifferential Equations, Dover, New York (1959).
[20] Bazant, Z.P., Viscoelasticity of Solidifying Porous Material – Concrete, J. of Eng. Mech. Div., ASCE, 103(EM6) 1049-1067 (1977).
[21] Bazant, Z.P., Solidification Theory for Concrete Creep I: Formulation, ASCE Journal of Engineering Mechanics, 115/8 1691-1703 (1989).
[22] Bazant, Z.P., Solidification Theory for Concrete Creep. II: Verification and Application, ASCE Journal of Engineering Mechanics, 115/8 1704-1725 (1989).
[23] Popovics, J.S., personal communication, January (2004). [24] Alexander, M.G., Aggregates and the Deformation Properties of Concrete, ACI
Materials Journal, 93/6 569-577 (1996). [25] L'Hermite, R.G., Volume Changes of Concrete, in Proc. of 4th Int. Symp. on the
Chemistry of Cement, Washington, D.C (1960). [26] Neville, A.M., Creep of concrete as function of its cement paste content.
Magazine of Concrete Research, 16/46 21-30 (1964).

95
ON THE TEMPERATURE EFFECT ON SELF-
DESICCATION OF CONCRETE
Bertil Persson Division Building Materials, Lund Institute of Technology, Lund, Sweden
Abstract
This article outlines an experimental and numerical study on the effect of temperature on self-desiccation of concrete. For this purpose concrete with water to cementitious material ratios of 0.38, 0.43 and 0.55 was cast in cylinders, sealed by the PVC form-work or by thick polyethylene foil and aluminum foil. The specimens were cured at either 8 °C or 30 °C for one month. The internal relative humidity of the specimens was studied at 20 °C from ages of 1 month to 8 months. In parallel the desiccation of water-cured specimens or drying specimens (both with and without wind) of the same con-crete was studied. The results show a significant effect of temperature on self-desiccation of concrete probably mainly due to the finer pore structure developed during low-temperature curing (lower relative humidity after curing at low temperature). The project was performed at Lund Institute of Technology, Lund, Sweden, 2004.
1. Introduction and objective
The consequences of self-desiccation became obvious after the development of concrete with low water to cementitious material ratios, w/c [1-10]. Self-desiccation has been used in order to avoid moisture-related problems when applying plastic or rubber floor-ing with adhesives on concrete with or without plaster [11-29]. Moisture-related reac-tions between concrete and the flooring material may produce volatile organic com-pounds, which in turn may cause allergic health injuries on human beings [30]. In the case of a relative humidity, RH < 0.85, at the equivalent depth of measurement, i.e. 40% of the concrete thickness in the drying direction, moisture-related additional volatile organic compounds more or less were avoided. A NORDTEST method has been intro-duced in order to verify self-desiccation in concrete [31]. It became quite clear that the chemical shrinkage of water when attached to cement, about 25% by volume, causes an under-pressure in the pore water and subsequently compression in the aggregate of concrete with volumetric external shrinkage as an obvious technical disadvantage [32]. Over time, long-term explorations became available correlating the affects of self-desiccation, such as autogenous shrinkage, mainly to w/c and content of silica fume in the concrete [33]. Self-desiccation became an important topic of many international workshops, congresses and conferences coupled to the use of High Performance Con-crete, HPC [34-45]. Models for shrinkage of normal concrete have been adjusted, more or less successfully for HPC with low w/c [46-52]. A major source of volatile organic compounds coming from the flooring was eliminated by the use of self-desiccation [53]. During curing, the temperature often varies from the indoor one and this difference substantially affects the self-desiccation. With low temperature curing a much finer pore structure is formed with lower RH than with high temperature curing. The objective of this study was to present the temperature effect on self-desiccation.

96
2. Experience of self-desiccation
2.1 General
Normal concrete is regarded as a porous material affected by the ambient climate. Self-desiccation hardly affects the moisture state of normal concrete with w/c > 0.40. In HPC, with w/c < 0.40, the rate of hydration is decreased substantially due to self-desiccation. The pore volume created in the concrete due to the chemical shrinkage that takes place when the water is chemically bound to the cement [1] decreases RH as low as 0.70 at low w/c. This low RH may affect several characteristics, first of all hydration and curing. The maximum ambient RH in dwelling houses is normally restricted to RH < 0.70. For houses made of concrete it was considered essential to estimate the time required for the drying of the concrete to achieve a certain level of RH. When wood is placed directly on the concrete, RH of the concrete must not exceed 0.75 [53] or else the moisture of the concrete can cause mouldy fungus between the concrete and the wood. These organisms will have secondary effects such as bad smell in the house, allergic reactions etc. When RH > 0.80 the wood starts to rot [53]. At RH > 0.85 fungus may also occur between the plastic carpet and the concrete [53]. Finally, when RH > 0.90 glued carpets may loosen from the concrete due to saturation of the pores (no space for the glue resin to enter or penetrate concrete pores) [53].
2.2 Fundamental practical application of self-desiccation in concrete
The self-desiccating effect has been used in practice in Sweden since 1990 to avoid these problems with building moisture [11,34]. Until now about seven million m2 of sub flooring have been made using concrete with w/c < 0.38 for the purpose of obtaining fast desiccation [54]. The method is also used in Finland [9]. The first application of a self-desiccating concrete slab was done at an annexe of the residence of the author in Bara even though contractors and experts foresaw that concrete with low w/c would never dry out especially if the concrete was subjected to early rain [11,54]. The concrete was produced with low-alkali cement and 15% silica fume with w/b = 0.28 and 39-day strength of 100-mm cube of 126 MPa and 90-day strength of 133 MPa. The reason to use low-alkali cement was to obtain good workability with high slump of 210 mm, which was impossible with concrete that contained normal-alkali cement [11]. The 175-mm concrete slab application was subjected to 174 mm of rain, more of less continu-ously during three weeks and then covered with the roof for one week before the heat-ing was applied at one month’s age. Already 10 days after casting RH = 90% was reached in the slab at 40% depth of the slab thickness, RH = 91% at 24 days after cast-ing, RH = 89% at 30 days after casting, and then RH = 83% at 39 days’ age. The first successful application lead to a rapid break-through to solve the building moisture-related problems in Sweden since slab anyhow are covered with self-levelling com-pounds on the concrete towards the adhesive and therefore avoiding an aggressive al-kali-effect on the flooring system [55-84]. The slab was sealed two months after casting with about RH = 80% in the slab and then self-desiccated to RH = 72% at half a year after casting. Since the slab was cast on 200 mm of double layers of extruded expanden polystyrene plastic no moisture moved to or from the foundation under slab. After 13 years RH = 72% was measured in the slab, i.e. the self-desiccation ceased.
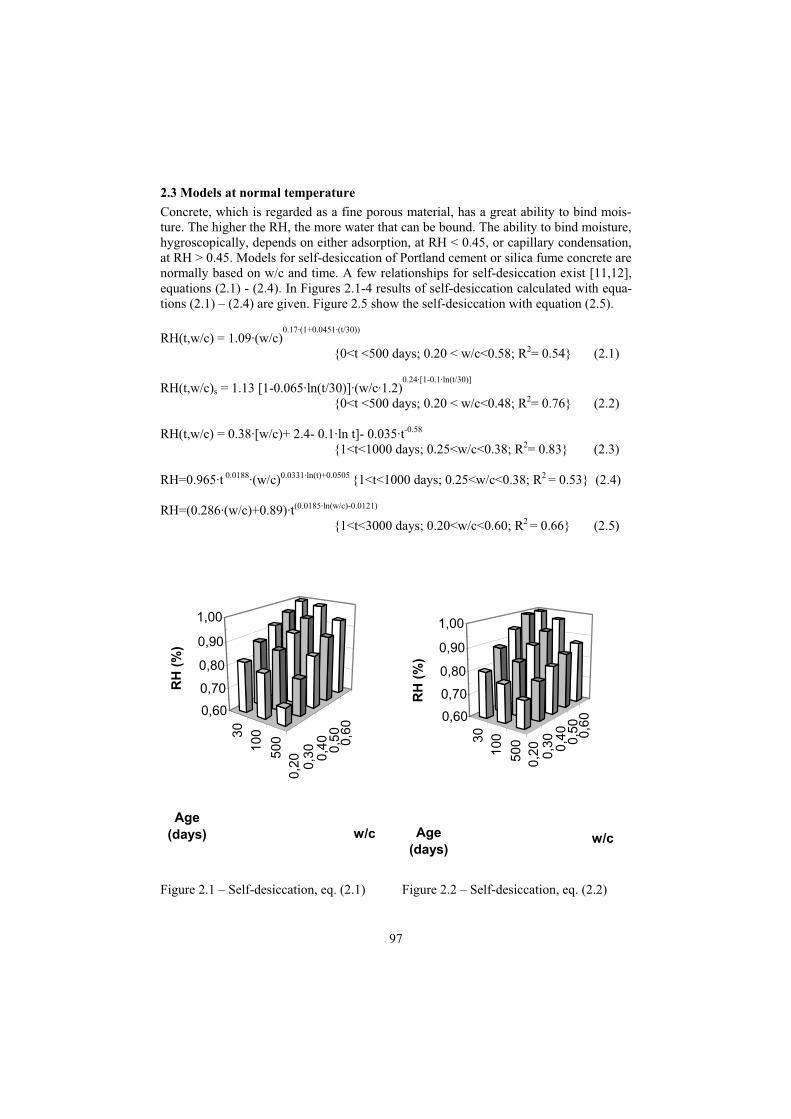
97
2.3 Models at normal temperature
Concrete, which is regarded as a fine porous material, has a great ability to bind mois-ture. The higher the RH, the more water that can be bound. The ability to bind moisture, hygroscopically, depends on either adsorption, at RH < 0.45, or capillary condensation, at RH > 0.45. Models for self-desiccation of Portland cement or silica fume concrete are normally based on w/c and time. A few relationships for self-desiccation exist [11,12], equations (2.1) - (2.4). In Figures 2.1-4 results of self-desiccation calculated with equa-tions (2.1) – (2.4) are given. Figure 2.5 show the self-desiccation with equation (2.5).
RH(t,w/c) = 1.09·(w/c)0.17·(1+0.0451·(t/30))
{0<t <500 days; 0.20 < w/c<0.58; R2= 0.54} (2.1)
RH(t,w/c)s = 1.13 [1-0.065·ln(t/30)]·(w/c·1.2)0.24·[1-0.1·ln(t/30)]
{0<t <500 days; 0.20 < w/c<0.48; R2= 0.76} (2.2)
RH(t,w/c) = 0.38·[w/c)+ 2.4- 0.1·ln t]- 0.035·t-0.58
{1<t<1000 days; 0.25<w/c<0.38; R2= 0.83} (2.3)
RH=0.965·t 0.0188·(w/c)0.0331·ln(t)+0.0505 {1<t<1000 days; 0.25<w/c<0.38; R2 = 0.53} (2.4)
RH=(0.286·(w/c)+0.89)·t(0.0185·ln(w/c)-0.0121)
{1<t<3000 days; 0.20<w/c<0.60; R2 = 0.66} (2.5)
30
10
0
50
0
0,2
0 0
,30
0,4
0 0
,50
0,6
0
0,60
0,70
0,80
0,90
1,00
RH
(%
)
Age(days) w/c
30
10
0
50
0
0,2
00
,30
0,4
00
,50
0,6
00,60
0,70
0,80
0,90
1,00
RH
(%
)
Age(days)
w/c
Figure 2.1 – Self-desiccation, eq. (2.1) Figure 2.2 – Self-desiccation, eq. (2.2)

98
30
10
0
10
00
0,2
00
,30
0,4
00
,50
0,6
00,60
0,70
0,80
0,90
1,00
RH
(%
)
Age(days) w/c
10
10
0
10
00
0,2
00
,30
0,4
00
,50
0,6
00,60
0,70
0,80
0,90
1,00
RH
(%
)
Age(days) w/c
Figure 2.3 – Self-desiccation, eq. (2.3) Figure 2.4 – Self-desiccation, eq. (2.4)
10
30
18
0
36
0
75
0
15
00
30
00
0,2
0
0,3
0
0,4
0
0,5
0
0,6
0
0,60
0,70
0,80
0,90
1,00
RH
at
se
lf-d
es
icc
ati
on
Age (days)w/c
Figure 2.5 – Average self-desiccation with equation (2.5).
2.4 Alkali effect
The chemical composition of the cement had a substantial influence on the measured self-desiccation mainly due to the so-called alkali-effect. It was shown that a significant relationship exists mainly between the C3A, C4AF and K2O cement constituents and autogenous shrinkage [29,48,85]. The influence of these components was ten times as large as that of C2S and C3S. Based on estimations of RH and the degree of hydration shown in Table 1 the following equation was obtained [29,48,85]:

99
RH = - 6· (C3A)· C3A- 8.6· (C4AF)· C4AF + k· (K2O) (2.6)
C3A = 0.77·w/c + 0.44 (2.7)
C4AF = 0.85·w/c + 0.19 (2.8)
k =-15.8·w/c + 0.74 (2.9)
k denotes constant given in Table 2.1 and equation (2.9) denotes difference in a property between low-alkali and normal-alkali cement
with cement constituents given in Table 2.2 denotes degree of hydration of the cement constituent given in Table 2.1 and
equation (2.7) – (2.8) RH denotes the internal relative humidity
Table 2.1- Adopted 28-day hydration degree in estimation of equation (2.9) [29,48,85]. w/c C3A C4AF k0.32 0.67 0.45 -5 0.38 0.74 0.53 -4.7 0.50 0.83 0.62 -6.6 0.65 0.93 0.74 -9.9
Table 2.2 – Cement constituent of filler cement (B), low-alkali cement (A) and normal- alkali cement (S) Components A, Cement Deger-
hamn Std, CEM I 42.5 BV/SR/LA
B, Byggcement, CEM II/A-L 42.5 R Skövde
S, Snabbcement SH, CEM
CaO 64.6 63.4 63.8 SiO2 21.6 19.4 20.2 Al2O3 3.5 3.5 4.65 Fe2O3 4.4 2.6 2.46 K2O 0.58 1.4 1.13 Na2O 0.05 0.30 0.27 MgO 0.78 2.9 3.01 SO3 2.07 3.4 3.29 Ignition losses 0.47 7.0 2.71 CO2 0.14 4.4 2.0 Clinker minerals: C2S 21 12.6 14.8 C3S 57 51 65.8 C3A 1.7 7 6.7 C4AF 13 6 7.6 Water demand 25% 28.2% 31.6% Initial setting time 145 min. 151 min. 114 Density 3214 kg/m3 3065 kg/m3 3124 kg/m3
Specific surface 305 m2/kg 475 m2/kg 550 m2/kg

100
Practical correction relationships of RH due to the alkali effect were also developed to correlate the alkali effect on RH as compared with RH with low-alkali cement, A. The following relationships were obtained [31], Figure 2.6:
RH cement S = 0.191·w/c- 13.5 (2.10)
RH cement S+5% silica fume = 0.048·w/c- 7 (2.11)
RH denotes correction of RH due to the alkali effect (%)
Without silica fume the alkali correction of RH was larger at lower RH, Figure 2.7 [31]:
-10
-8
-6
-4
-2
0
30 35 40 45 50
Water-cement ratio (%)
Co
rre
cti
on
of
RH
co
mp
are
d w
ith
RH
in
c
on
cre
te b
as
ed
on
lo
w-a
lka
li c
em
en
t,
A (
%)
Slite Cement, S
S+5% silica fume
0,80
0,85
0,90
0,95
1,00
0,85 0,90 0,95 1,00RH with low-alkali
cement,A
RH
wit
h n
orm
al-
alk
ali
ce
me
nt,
S
Cement, S S+5% silica fume
0%
-5%
-10%
Figure 2.6- RH comparison between low-alkali cement and Slite Cement, S [31].
Figure 2.7 - - Alkali correction cement, S, without or with 5% silica fume [31].
RH cement S = 1.16·RH cement A- 0.20 (2.12)
RH cement S+5% silica fume = 0.95 RH cement A – 0.01 (2.13)
The effect of the alkali content on RH was partly also related to the temperature. In contrary to the maturity concept, which says that higher curing temperature gives higher strength at a given age, it was clearly observed that higher temperature gives lower strength for a temperature range of 17 oC to 23 oC , about 1.6% lower 28-day strength as per °C higher curing temperature, Figure 2.8 [31]. This statement is made given the uncertainty in the compressive strength measurements of ± 1 MPa.

101
fc =-1.016· T (2.14)
Again, Figure 2.9 shows a substantial difference between 28-day RH with low-alkali cement and RH with normal-alkali cement without and with 5% silica fume [10]:
RH A,28 = 0.272·(w/c) + 0.82 (2.15)
RH S,28 = 0.412·(w/c) + 0.71 (2.16)
RH S+5% silica fume,28 = 0.272·(w/c) + 0.77 (2.17)
0
20
40
60
80
17,0 19,0 21,0 23,0Temperature (°C)
28-d
ay s
tren
gth
(M
Pa)
32A 32S 32Ss
38A 38S 38Ss
50A 50S 50Ss
0,80
0,85
0,90
0,95
1,00
0,30 0,35 0,40 0,45 0,50
Water-cement ratio, w/c
RH
aft
er
1 m
on
th (
se
ale
d)
Low-alkali cement, ANormal-alkali cement, SS+5% silica fume, Ss
A
S
Ss
Figure 2.8- Strength vs curing tempera-ture [31]. A = low-alkali, S = normal alkali, s = 5% silica fume. 32=w/c.
Figure 2.9 – 28-day RH with low-alkali cement and RH with normal-alkali cement with 5% silica fume [10].

102
Figure 2.10 shows a substantial difference between 180-day RH with low-alkali cement and RH with normal-alkali cement without and with 5% silica fume [10]:
RH A,90 = 0.203·(w/c) + 0.76 (2.18)
RH S,90 = 0.294·(w/c) + 0.69 (2.19)
RH S+5% silica fume,90 = 0.182·ln(w/c) + 0.73 (2.20)
Figure 2.11 shows RH with equation (2.5) and RH with equations (2.15) and (2.18) for low-alkali cement [10,31]. At 30 days’ age the difference between RH with the two methods was within the accuracy of measurement, i.e. ± 1.5%. However, at 180 days’ age RH at w/c = 0.50 with equation (2.18) was significantly lower than RH with large elements, which may depend on water losses during measurement, Figure 2.11 [10,31]. The results at w/c = 0.30 and 0.40 seemed within the accuracy of measurement. For low-alkali cement equation (2.5) seemed correct to model long-term self-desiccation. The long-term alkali effect was modelled with equations (2.15) –(2.20) [10]. The alkali effect of cement S compared with low-alkali cement was estimated with equation (2.21) and alkali effect of cement S plus 5% silica fume with equation (2.22), Figure 2.12-13:
0,75
0,80
0,85
0,90
0,30 0,35 0,40 0,45 0,50
Water-cement ratio, w/c
RH
aft
er
6 m
on
ths
(s
ea
led
)
Low-alkali cement, A
Normal-alkali cement, S
S+5% silica fume, Ss
A
S
Ss
0,80
0,85
0,90
0,95
0,30 0,35 0,40 0,45 0,50
Water-cement ratio, w/c
Re
lati
ve
hu
mid
ity
Equation (2.5)-30d
Equation (2.5)-180d
Eqs. (2.15) and (2.18)-30d
Eqs. (2.15) and (2.18)-180d
Figure 2.10 – 180-day RH with low-alkali cement and RH with normal-alkali cement S with and without 5% silica fume [10].
Figure 2.11 – RH with equations (2.5) - (2.15) and (2.18) for concrete with low-alkali cement [31]. d = days’ age.
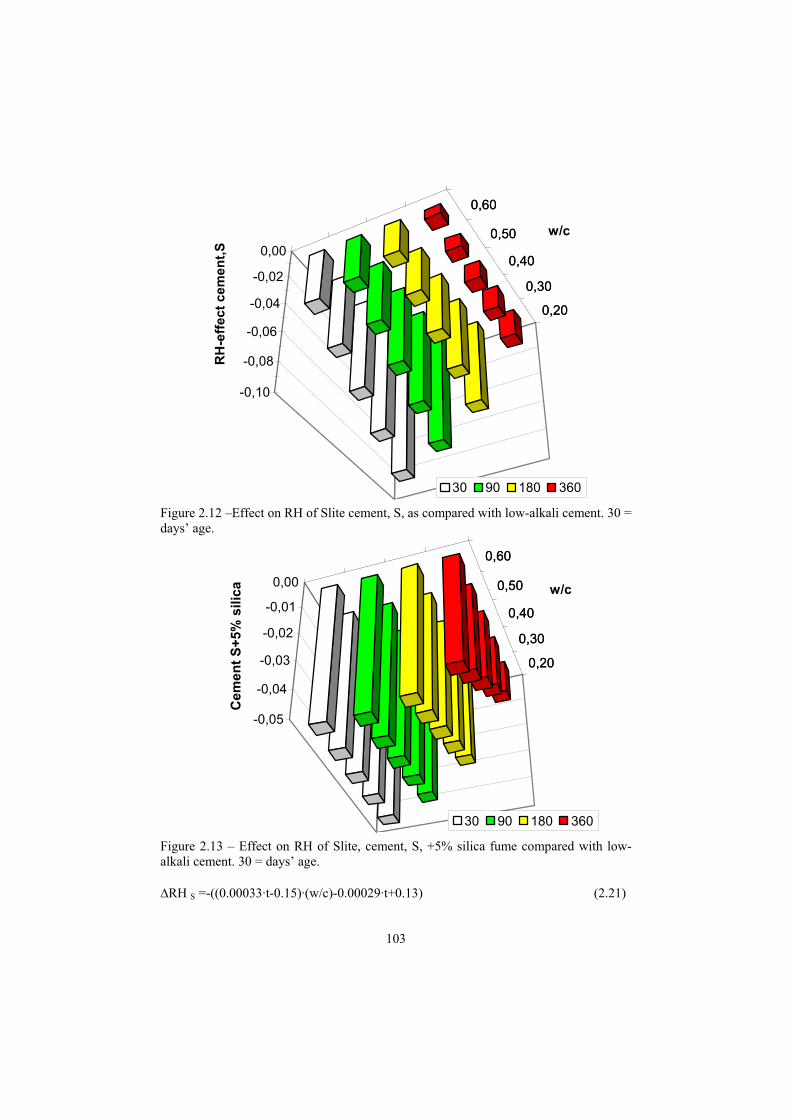
103
0,20
0,30
0,40
0,50
0,60
-0,10
-0,08
-0,06
-0,04
-0,02
0,00
RH
-eff
ec
t c
em
en
t,S
0,20
0,30
0,40
0,50
0,60
w/c
30 90 180 360
Figure 2.12 –Effect on RH of Slite cement, S, as compared with low-alkali cement. 30 = days’ age.
0,20
0,30
0,40
0,50
0,60
-0,05
-0,04
-0,03
-0,02
-0,01
0,00
Ce
me
nt
S+
5%
sil
ica
0,20
0,30
0,40
0,50
0,60
w/c
30 90 180 360
Figure 2.13 – Effect on RH of Slite, cement, S, +5% silica fume compared with low-alkali cement. 30 = days’ age.
RH S =-((0.00033·t-0.15)·(w/c)-0.00029·t+0.13) (2.21)

104
RH S + 5% silica fume =-((0.00014·t-0.0045)·(w/c)-0.00016·t+0.056) (2.22)
t denotes age (days) S denotes Slite cement
According to latest code of practice in Sweden and also in Denmark the effect of silica fume was calculated with a double influence as compared to the cement, the equivalent water-cement ratio, w/(c+2·s), which makes the alkali effect of silica fume on RH even less than the alkali effect of cement S. The silica fume reacts pozzolanically with the alkali in the gel which then is reduced, equations (2.23) and (2.24), Figures 2.14-15. However, the influence on RH remains more or less the same at constant w/c, equation (2.25), Figure 2.16. It should also be mentioned that the air content of the concrete did not influence self-desiccation, Figure 2.17 [10,31]. However, the loss of air between fresh and hardened state of the concrete was quite substantial, Figure 2.17.
RH S+5% silica fume,28 = 0.299·(w/c) + 0.77 (2.23)
RH S+5% silica fume,90 = 0.200·ln(w/c) + 0.73 (2.24)
RH S + 5% silica fume =-((0.0002·t-0.0034)·(w/c)-0.00016·t+0.056) (2.25)
0,80
0,85
0,90
0,95
1,00
0,25 0,35 0,45 0,55
Equivalent water-cement ratio
RH
aft
er
1 m
on
ths
(s
ea
led
)
Low-alkali cement, A
Normal-alkali cement, S
S+5% silica fume, Ss
A
S
Ss
0,75
0,80
0,85
0,90
0,25 0,35 0,45 0,55
Equivalent water-cement ratio
RH
aft
er
6 m
on
ths (
seale
d)
Low-alkali cement, A
Normal-alkali cement, S
S+5% silica fume, Ss
A
S
Ss
Figure 2.14 – RH at 1 month’s age vs equivalent water-cement ratio.
Figure 2.15 – RH at 6 month’s age vs equiva-lent water-cement ratio.

105
0,20
0,30
0,40
0,50
0,60
-0,05
-0,04
-0,03
-0,02
-0,01
0,00C
em
en
t S
+5
% s
ilic
a
0,20
0,30
0,40
0,50
0,60
w/c
30 90 180 360
Figure 2.16– Effect on RH of Slite, cement, S, +5% silica fume compared with low-alkali cement. 30 = days’ age.
0
2
4
6
8
10
12
14
16
Fresh Air loss Harden
Air
co
nte
nt
(%)
32 A 32 S 32 Ss 38 A 38 S 38 Ss 50 A 50 S 50 Ss
Figure 2.17– Air content of tested concrete. A = low-alkali cement, S = silica fume, Ss = S + 5% silica fume.

106
2.5 Long-term self-desiccation
A 7-year study of the effect of aging on self-desiccation 50 mm from the surface of simulated concrete columns 1 m diameter is shown in Figure 2.18 [15,17,22,28]. The shortage of space in concrete with low w/c will actually stop both hydration and chlo-ride ingress hand in hand with the effect of self-desiccation in the cover layer of the reinforcement. The cover layer of reinforcement exceeds 50 mm in severe conditions. Figure 2.19 shows the 13-year development of RH at self-desiccation of the same type of columns (9 drilled cores of each concrete, 250 mm from the surface of the 1-m simu-lated column [51]. Figure 2.19 shows RH at the same location of drilled cores taken 250 mm from the surface of the 1-m simulated column as a function of w/c. After 13 years of curing the following relationships for RH were obtained, 250 mm from the surface of concrete columns, 1 m in diameter at self-desiccation (S), air (A).or water (W).curing versus w/c:
RHA = 0.905·(w/c)0.232 {R2= 0.93} (2.26)
RHS = 0.956·(w/c)0.199 {R2= 0.82} (2.27)
RHW = 0.844·(w/c)-0.0152 {R2= 0.53} (2.28)
0,75
0,80
0,85
0,90
0,95
1,00
10 100 1000
Age (days)
RH
50 m
m f
rom
wate
r cu
red
su
rface
22S 24 24S 33 36S 47
48S 58
Figure 2.18- RH 50 mm from water of 1-m simulated columns vs age [15,17,22,28].

107
0,65
0,70
0,75
0,80
0,85
0,90
0,95
1,00
1 10 100 1000
Age (months)
RH
at
se
lf-d
es
icc
ati
on
22S 24 24S 33 36S 47
48S 58
Figure 2.19– RH at 13 year-self-desiccation. S = 10% silica fume; 20 = w/c (%) [51].
2.6 Effect of measurement temperature on RH
An external increase of temperature by 1 °C in the air decreases RH by about 6%. An internal increase of temperature works in the opposite direction, i.e. increases RH in concrete. Since water expands more than the concrete matrix, RH in concrete will increase with the temperature, anyhow between 0 °C and 100 °C. The most extreme example of this phenomenon is the formation of water in concrete during explosive fire spalling [98]. Even in dry concrete free water is formed during accidental fire. When temperature increases also RH increases and the water moves from the concrete surface towards the inner part of the concrete. Once RH = 1 the water vapour is transformed into water and the pressure increases in the concrete pores above the external. The pres-sure may increase until the tensile strength is reached in the concrete, Figure 2.20 [98]. RH-increase with temperature may also affect other concrete properties such as shrink-age, chloride migration, thermal dilatation coefficient and so forth. RH due to chemical shrinkage and autogenous shrinkage certainly are temperature-dependent properties [16,88]. At 20 °C the influence of temperature on RH is given in Figures 2.21 and 2.22, varying between -0.02 %RH/°C (w/c = 0.80, RH = 0.95).and 0.3 %RH/°C (w/c = 0.40, RH = 75%) [100]. In Figure 2.23 average of 5 tests of concrete with w/c = 0.37, 0.48 and 0.76 each are shown [87]. At low w/c, where self-desiccation occurs in concrete the influence of temperature may be even larger than 0.3 %RH/°C. A modelling gave the following equation for the effect of temperature on RH at different w/c (%/°C, 75% < RH < 95%, 20 °C< T < 30 °C) [100]:
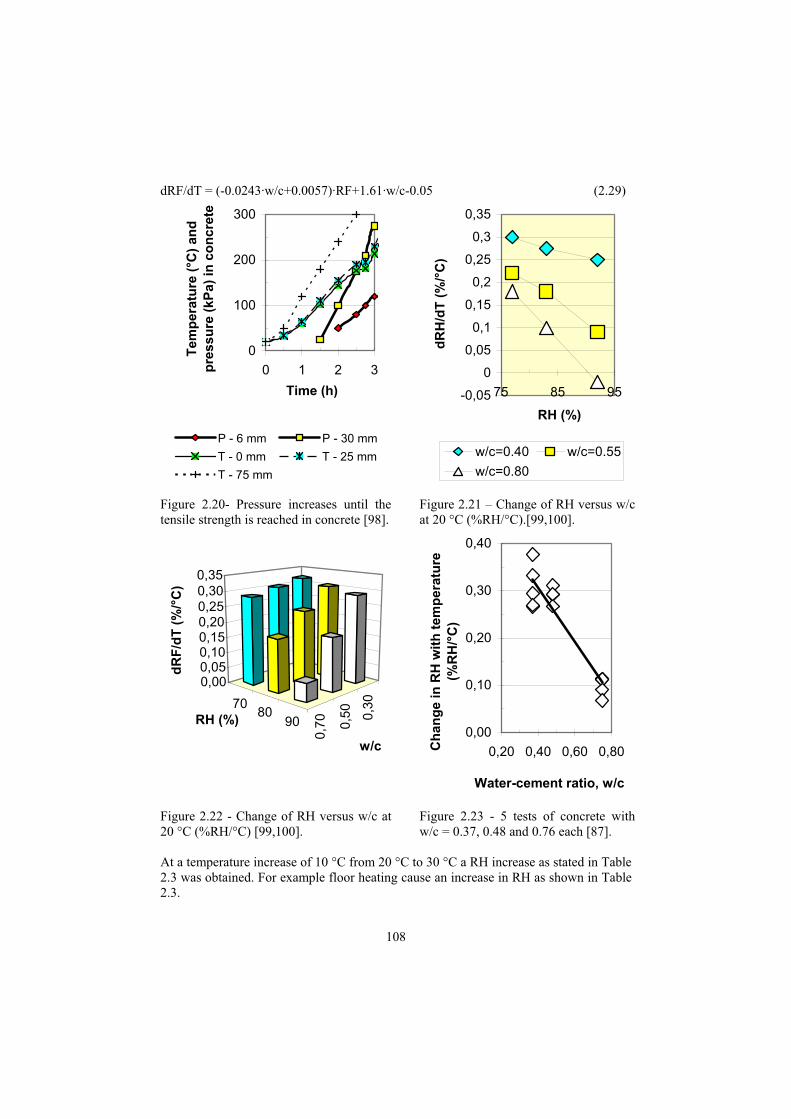
108
dRF/dT = (-0.0243·w/c+0.0057)·RF+1.61·w/c-0.05 (2.29)
0
100
200
300
0 1 2 3
Time (h)
Tem
pe
ratu
re (
°C)
an
d
pre
ss
ure
(k
Pa
) in
co
nc
rete
P - 6 mm P - 30 mm
T - 0 mm T - 25 mm
T - 75 mm
-0,05
0
0,05
0,1
0,15
0,2
0,25
0,3
0,35
75 85 95
RH (%)
dR
H/d
T (
%/°
C)
w/c=0.40 w/c=0.55
w/c=0.80
Figure 2.20- Pressure increases until the tensile strength is reached in concrete [98].
Figure 2.21 – Change of RH versus w/c at 20 °C (%RH/°C).[99,100].
0,3
0
0,5
0
0,7
0
7080
90
0,000,050,100,150,200,25
0,30
0,35
dR
F/d
T (
%/°
C)
w/c
RH (%)0,00
0,10
0,20
0,30
0,40
0,20 0,40 0,60 0,80
Water-cement ratio, w/c
Ch
an
ge in
RH
wit
h t
em
pera
ture
(%
RH
/°C
)
Figure 2.22 - Change of RH versus w/c at 20 °C (%RH/°C) [99,100].
Figure 2.23 - 5 tests of concrete with w/c = 0.37, 0.48 and 0.76 each [87].
At a temperature increase of 10 °C from 20 °C to 30 °C a RH increase as stated in Table 2.3 was obtained. For example floor heating cause an increase in RH as shown in Table 2.3.

109
Table 2.3 - Increase of RH at an increase of temperature from 20 °C to 30 °C (%/10°C). w/c/(RH) 70 80 900.30 3.2 3.1 2.90.50 3.0 2.4 1.70.70 2.9 1.7 0.6
2.7 Effect of earl y curing temperature
However, the tests shown in Figures 2.21-23 only cover a limited temperature field. The influence of temperature on RH may be different for other temperatures. Knowledge in this field is lacking but required in order to fully understand the effect of self-desiccation on autogenous shrinkage. The influence on RH due to the curing conditions for different kinds of studies are also quite different from experience in production of full scale concrete as shown in Table 2.4. Once the maximum temperature of concrete is estimated the initial RH may be calculated with equation (2.29).
Table 2.4- Influence on RH of curing conditions for different kinds of studies. Influence Laboratory Cast on site Prefabricated elementTemperature (max, °C) 25 40 55 Long-term temperature (°C) 20 10 15 Difference from curing (°C) -5 -30 -40 Influence on RH (%) -1.5 -9 -12
3. Experimental methods
3.1 RH measurement procedure on cut concrete
The following procedure applies [10,31,46]:
1. Fragments from a specimen, minimum 75 mm in diameter, which is drilled out of the concrete, are used for the self-desiccation measurements.
2. The use of fragments eliminates possible errors, which may arise from differences in the development of self-desiccation within the specimen, Figure 3.1 [10,46].
3. Fragments are put in a glass tube with a minimum length 10 times the diameter of the sensor, Figure 3.2 [10,46].
4. The diameter of the glass tube is slightly bigger than the diameter of the sensor. 5. The glass tubes are each quickly filled with fragments obtained from different
depths from the surface of the concrete specimen, each placed in its own tube. 6. After filling the glass tube a rubber plug is placed directly and so forth, Figure 3.3. 7. The temperature of all of the materials and the equipment is held at 20 0.1 °C. 8. One day in advance of the measurement the fragments are to be held at 20 0.1 °C. 9. When a capacity sensor is used the measurement time of RH is 1 day, Figure 3.2. 10. When a dew point meter is used the measurement time of RH is 2 days.
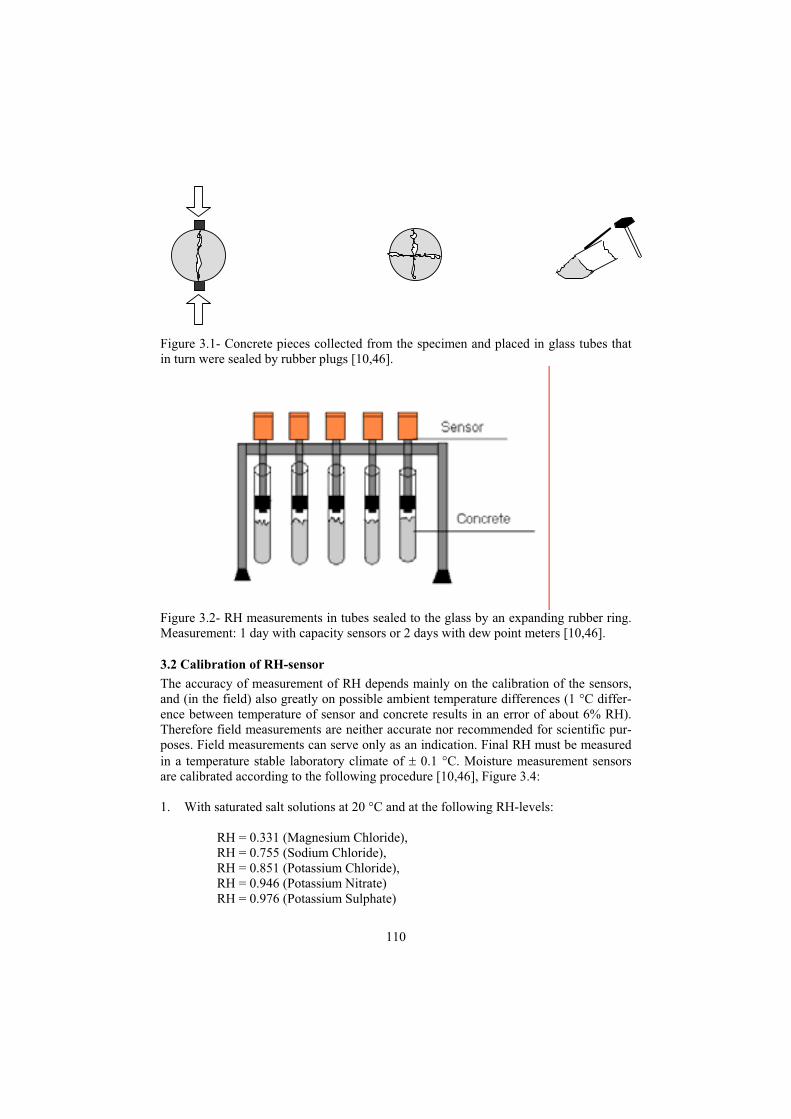
110
Figure 3.1- Concrete pieces collected from the specimen and placed in glass tubes that in turn were sealed by rubber plugs [10,46].
Figure 3.2- RH measurements in tubes sealed to the glass by an expanding rubber ring. Measurement: 1 day with capacity sensors or 2 days with dew point meters [10,46].
3.2 Calibration of RH-sensor
The accuracy of measurement of RH depends mainly on the calibration of the sensors, and (in the field) also greatly on possible ambient temperature differences (1 °C differ-ence between temperature of sensor and concrete results in an error of about 6% RH). Therefore field measurements are neither accurate nor recommended for scientific pur-poses. Field measurements can serve only as an indication. Final RH must be measured in a temperature stable laboratory climate of 0.1 °C. Moisture measurement sensors are calibrated according to the following procedure [10,46], Figure 3.4:
1. With saturated salt solutions at 20 °C and at the following RH-levels:
RH = 0.331 (Magnesium Chloride), RH = 0.755 (Sodium Chloride), RH = 0.851 (Potassium Chloride), RH = 0.946 (Potassium Nitrate) RH = 0.976 (Potassium Sulphate)

111
2. A saturated solution of the salts mentioned above is used. 3. Calibration takes place 1 month within the time of measurement [10,46]. 4. The temperature of the material and the equipment is held constant at 20 0.1 °C. 5. The calibration time is to be ample for RH to stabilize at each level, normally 1
day. 6. The accuracy of the sensors is to be within 0.015 RH. 7. No drift of the sensors is to be observed or systematic errors may occur. 8. Mechanical humidity generators must be calibrated by salt solutions once a year.
Figure 3.3 –Pipe to be filled to 2/3 and tightened at once [10,46].
Figure 3.4 – Set up for salt container and sensor during calibra-tion [10,46].
The sensors used in the present tests were of brand Vaisala HMP 44, which were cali-brated in a humidity generator in turn calibrated at the deliverer within one year of measurement. Once the sensors were calibrated, the calibration was linearly modelled so that the results were obtained directly from a formula giving less risk for mistakes and measurement faults. The accuracy in this case was supposed to be ± 1%.
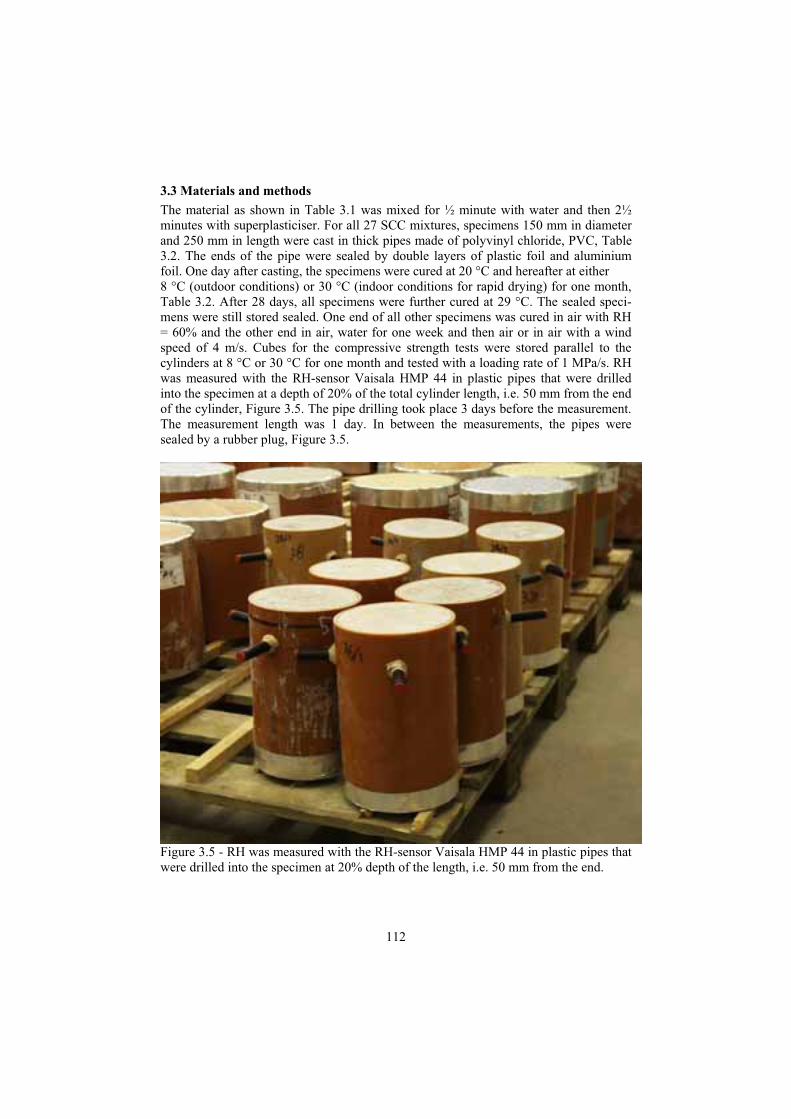
112
3.3 Materials and methods
The material as shown in Table 3.1 was mixed for ½ minute with water and then 2½ minutes with superplasticiser. For all 27 SCC mixtures, specimens 150 mm in diameter and 250 mm in length were cast in thick pipes made of polyvinyl chloride, PVC, Table 3.2. The ends of the pipe were sealed by double layers of plastic foil and aluminium foil. One day after casting, the specimens were cured at 20 °C and hereafter at either 8 °C (outdoor conditions) or 30 °C (indoor conditions for rapid drying) for one month, Table 3.2. After 28 days, all specimens were further cured at 29 °C. The sealed speci-mens were still stored sealed. One end of all other specimens was cured in air with RH = 60% and the other end in air, water for one week and then air or in air with a wind speed of 4 m/s. Cubes for the compressive strength tests were stored parallel to the cylinders at 8 °C or 30 °C for one month and tested with a loading rate of 1 MPa/s. RH was measured with the RH-sensor Vaisala HMP 44 in plastic pipes that were drilled into the specimen at a depth of 20% of the total cylinder length, i.e. 50 mm from the end of the cylinder, Figure 3.5. The pipe drilling took place 3 days before the measurement. The measurement length was 1 day. In between the measurements, the pipes were sealed by a rubber plug, Figure 3.5.
Figure 3.5 - RH was measured with the RH-sensor Vaisala HMP 44 in plastic pipes that were drilled into the specimen at 20% depth of the length, i.e. 50 mm from the end.

113
Table 3.1 – Mixture proportions and properties of Self-Compacting Concrete, SCC
Material - w/c 0.38 0.43 0.55 Crushed 11-18 mm 385 538 431 Crushed 4-8 mm 538 205 425 Sand 0-2 mm 696 713 709 Sand 0-1 mm 98 214 175 Glass filler 58 58Byggcement, CEM II/A-L 42.5 R Skövde 484 424 355 (of which limestone powder) (68) (59) (50) Water 184 182 195 Superplasticiser 8.8 6.4 2.8 Density 2392 2342 2351Slump flow (mm) 660 680 690 28-day strength (MPa), 8 °C 83 70 5230 °C 72 59 41
Table 3.2 – Number of SCC specimens and curing. w/c 0.38 0.43 0.53 Curing -temp. (°C) 8 30 8 30 8 30Sealed 1 1 1 1 1 1Air 2 1 2 1 2 1Water, 1 week 2 2 2Wind, 4 m/s 2 2 2
4. Results
4.1 Self-desiccation and strength
Figures 4.1-3 show results of strength and self-desiccation [101,102]. Figure 4.1 shows strength versus maturity. Strength became higher at lower maturity. Figure 4.2 shows self-desiccation versus w/c, at 8 °C and at 30 °C. Self-desiccation became somewhat pronounced at 8 °C as compared to 30 °C. It was thus of little benefit to increase the temperature in order to obtain self-desiccation. Figure 4.3 shows self-desiccation versus strength at different w/c. The results of Figure 4.3 were consistent with Figures 4.1-2 [93,101,102].
4.2 Effect of water curing, wind and curing temperature
Figures 4.4-6 show the effect of water curing, wind and heating on the drying of con-crete [93,101]. Figure 4.4 shows the effect of curing at 20 °C at RH = 60% for speci-mens first sealed 1 month at 30 °C or for specimens first sealed for 3 weeks and then water cured for 1 week. One week of water leakage during construction caused about 4% higher RH also for concrete with low w/c = 0.38. It is therefore important to inves-tigate RH at lower areas of a slab and at other places of a building site where water leakage may occur, for example at windows or open shafts in the building.
(kg/m³).

114
0
20
40
60
80
100
0 10000 20000
Maturity (°C·h)
Str
en
gth
(1
mo
nth
,MP
a)
w/c= 0.38 w/c= 0.43
w/c= 0.55
8 °C 30 °C
80
85
90
95
0,35 0,45 0,55
Water-cement ratio, w/c
RH
at
se
lf-d
es
icc
ati
on
(1
m
on
th,%
) 8 °C
30 °C
Figure 4.1 - Strength versus maturity. Strength was higher at lower maturity.
Figure 4.2 - Self-desiccation versus w/c, at 8 °C and at 30 °C
80
85
90
95
0 20 40 60 80 10
0
Strength (1 month,MPa)
RH
at
se
lf-d
es
icc
ati
on
(1
m
on
th,%
)
w/c= 0.38 w/c= 0.43
w/c= 0.55
80
85
90
95
0,35 0,45 0,55
Water-cement ratio, w/c
RH
, 2
mo
nth
s
(se
ale
d+
RH
=6
0%
,1m
on
th,%
)
Sealed 3 weeks, 30 °C, plus 1week water curingSealed 1 month, 30 °C
Figure 4.3 - Self-desiccation versus strength at different w/c.
Figure 4.4 - Curing at 20 °C at RH = 60%. Specimens sealed 1 month at 30 °C or sealed 3 weeks + water 1 week.
Figure 4.5 shows RH after 1 month drying at 20 °C after sealed curing at 8 °C, with or without wind. Sealed curing at 8 °C simulates well outdoor conditions after which wind or a fan may cause movements of the air during the drying period. Wind with 4 m/s-speed did not affect the drying at all, neither at low or high w/c. Figure 4.6 shows a substantial temperature effect on RH after 1 month of drying of concrete cured at 8 °C or at 30 °C.

115
80
85
90
95
0,35 0,40 0,45 0,50 0,55
Water-cement ratio, w/c
RH
(s
ea
led
1
mo
nth
+R
H=
60
% 1
mo
nth
,%)
Without wind
With wind
80
85
90
95
0,35 0,45 0,55
Water-cement ratio, w/c
RH
(s
elf
-de
sic
ca
tio
n
1 m
on
th+
RH
=6
0%
, 1
m
on
th.,
%)
Sealed 1 month, 8 °C
Sealed 1 month, 30 °C
Figure 4.5 - RH after 1 month drying at 20 °C after sealed curing at 8 °C, with or without wind.
Figure 4.6 - Substantial temperature effect on RH after 1 month of drying of concrete cured at 8 °C or at 30 °C.
Maturity and therefore also the degree of hydration of concrete at 1 month’ age was lower after curing at 8 °C than after curing at 30 °C. Therefore, also more non-hydrated cement was available in the concrete after curing 1 month at 8 °C than after curing at 30 °C. When the drying (desiccation) started at 1 month’ s age more hydration took place in concrete cured at 8 °C than in concrete cured at 30 °C which difference explains lower RH in concrete cured at 8 °C than in concrete cured at 30 °C even after another month. The pore structure in the 8-°C cured concrete could be much finer than that in the 30- °C cured concrete - emptying these smaller pores during drying will result in a substantially lower RH in the 8- °C cured material. The effect of curing at 8 °C on RH was more pronounced for concrete with low w/c since the pore structure then was finer. The 8- °C cured concrete will also have a finer structure than the 30- °C cured concrete at any fixed w/c. Figure 4.7 shows RH with w/c = 0.38 after curing 1 month at 8 °C or 30 °C, then in the air, sealed or in wind (water curing 1 week). Figure 4.8 shows RH with w/c = 0.43 after curing 1 month at 8 °C or 30 °C, then in air, sealed or in wind (water curing 1 week). Figure 4.9 shows RH with w/c = 0.55 after curing 1 month at 8 °C or 30 °C, then in the air, sealed or in wind (water curing 1 week). The effect of early curing temperature was modelled in the following way, Figure 4.10 [101,102] (%/°C):
dRH/dT=1/22·((103.2·(w/c)²-96.3·(w/c)+22.5)·ln(t)-526.3·(w/c)²+465.6·(w/c)-101.2 (4.1)
t denotes age (days) and T denotes curing temperature during the first month (°C).
The lower RH obtained at the lower curing temperature was maintained even after dry-ing for 7 months. For these SCC mixtures, the maturity concept may not be applied to

116
strength nor to self-desiccation. Curing at a lower temperature causes a finer pore struc-ture that gives higher strength and lower RH as shown by the these results [101,102].
75
80
85
90
95
100
10 100 1000
Age (days)
RH
at
w/c
=0
.38
(2
0 °
C,%
)
Sealed-8 °C Sealed-30 °C Air-8 °C
Air-30 °C Water-30 °C Wind-8 °C
Figure 4.7 – RH with w/c = 0.38. Curing 1 month at 8 °C or 30 °C, then in the air, sealed or in wind (water curing 1 week).
75
80
85
90
95
100
10 100 1000Age (days)
RH
at
w/c
=0
.43
(2
0 °
C,%
)
Sealed-8 °C Sealed-30 °C Air-8 °C
Air-30 °C Water-30 °C Wind-8 °C
Figure 4.8 – RH with w/c = 0.43. Curing 1 month at 8 °C or 30 °C, then in air, sealed or in wind (water curing 1 week).

117
75
80
85
90
95
100
10 100 1000
Age (days)
RH
at
w/c
=0
.55
(2
0 °
C,%
)
Sealed-8 °C Sealed-30 °C Air-8 °C
Air-30 °C Water-30 °C Wind-8 °C
Figure 4.9 – RH with w/c = 0.55. Curing 1 month at 8 °C or 30 °C, then in the air, sealed or in wind (water curing 1 week).
30
18
0
36
0 0,3
5
0,4
0
0,4
5
0,5
0
0,5
5
-0,10
0,00
0,10
0,20
0,30
dR
F/d
T (
%/°
C)
Age (days) w/c
Figure 4.10 - The effect of early curing temperature was modelled versus age and w/c [101,102] (%/°C).
5. Summary and conclusions
Twenty-seven specimens of Self-Compacting Concrete, SCC, 150 mm in diameter and 250 mm in length with w/c = 0.38, 0.43 and 0.55 were studied with reference to the effects of heating, sealing, water and wind for up to 7 months. The following conclu-sions were drawn:

118
1. Twenty-eight-day strength became about 20% higher after curing at 8 °C than after curing at 30 °C.
2. Self-desiccation, as indicated by the reduction in internal relative humidity, was notably more pronounced after curing at 8 °C than at 30 °C.
3. One week of water curing caused 4% higher RH for low w/c =0.38 and for w/c =0.55.
4. Wind of 4 m/s had no influence on the drying of SCC, except for w/c =0.55. 5. The maturity concept could not be applied to strength nor to self-desiccation. 6. The pore structure with low temperature curing became finer and thus higher
strengths and more pronounced self-desiccations were observed after curing at 8 °C than after curing at 30 °C.
7. The effect of low temperature curing was modelled with a high degree of accuracy.
Acknowledgements
The research was financed by THE CONSORTIUM FOR RESEARCH ON HIGH-PERFORMANCE CONCRETE, that consisted of BFR (the Swedish Council of Build-ing Research), NUTEK (the Swedish Board of Technical Development), Cementa, Elkem, Euroc Beton, NCC Bygg, SKANSKA and Strängbetong, which I hereby grate-fully acknowledge. Part of the research was also financed by NORDTEST Oy, Finland and Peab Sweden Ltd, which also is gratefully acknowledged.
References
[1] Powers, T.C., Brownyard, T.L., Studies of Physical Properties of Hardened Port-land Cement Paste, Research Laboratories, PCA 22, 194, 473-488, 845-864 (1946-1948).
[2] Copeland, L.E., Bragg, R.H., Self Desiccation in Portland Cement Pastes, ASTM Bulletin 204 (1955).
[3] Tazawa, E., Miyazawa, S., Effect of Constituents and Curing Conditions on Autogenous Shrinkage of Concrete, Proc. Int. Workshop, Hiroshima, 269-280 (1998).
[4] Sellevold, E., Bager, D., Klitgaard-Jensen, E., and Knudsen, T., Silica Fume-cement pastes: hydration and pore structure, Proceedings of a Nordic Seminar on Silica Fume in Concrete, Cement and Concrete Research Institute, The Norwe-gian Institute of Technology, Trondheim, Norway (1981).
[5] Nilsson, L.-O., Desorption Isotherms for Silica-Fume/Cement Mortars, Report IF 8431, Institute of Moisture Issues on Material & Building Technology, Trelle-borg, Sweden, 2-11 (1984).
[6] Christoffersen, A. K., Sørensen, T. B., and Nielsen, A., Self-Desiccation of Con-crete, Danish Concrete Magazine Beton, No 4 (1988).
[7] Penttala, V., Merikallio, T., and Wirtanen, L., Early Floor Covering of Concrete Slabs and Adhesion between Concrete and Floor Covers, Proc. 5th Nordic Con-crete Research Meeting: Helsinki, Ed: Norsk Betongforening, Oslo, 107-108 (1996).
[8] Geiker, M., Studies of Portland Cement Hydration, Measurement of Chemical Shrinkage and a Systematic Evaluation of Hydration Curves by Means of Dis-persion model, PhD Thesis, The Institute of Mineral Industry, The Technical

119
University of Denmark, Lyngby, 107-117 (1983). [9] Hooton, D., Chemical Shrinkage of Cement Pastes with or without Silica Fume,
93rd Annual Meeting of the American Ceramic Society, Westerville (1991). [10] Hansen, E. J., Hansen, K. K., and Persson, B., Concrete, hardened: Self-
desiccation, Nordtest Method NT Build 490, NORDTEST OY, Espoo, Finland, 8 pp. (1999).
[11] Persson, B., Hydration, Structure and Strength of High-Performance Concrete, Report TVBM-1009, Division of Building Materials, Lund Institute of Technol-ogy, Lund University, Lund, 379 pp. (1992).
[12] Persson, B., Quasi-instantaneous and Long-term Deformations of High-Performance Concrete with Some Related Properties, Report TVBM-1016, Divi-sion of Building Materials, Lund Institute of Technology, Lund University, Lund, 500 pp. (1998).
[13] Aevarsson, M. and Rahim, A., High-Performance Concrete – Time of Desicca-tion as Compared to Normal Concrete, Report TVBM-5025, Division of Build-ing Materials, Lund Institute of Technology, Lund University, Lund, 50 pp. (1993).
[14] Persson, B., Hydration and Strength of High-Performance Concrete, Advanced Cement Based Materials 3, 107-123 (1996).
[15] Persson, B., Seven-year Study of the Effect of Silica Fume in Concrete, Ad-vanced Cement Based Materials 7, 139-155 (1998).
[16] Persson, B., Self-desiccation and Its Importance in Concrete Technology, Mate-rials and Structures 30, 293-305 (1997)
[17] Persson, B., Moisture in Concrete Subjected to Different Kinds of Curing, Mate-rials and Structures 30, 533-544 (1997).
[18] Persson, B., Long-term Effect of Silica Fume on the Principal Properties of Low-Temperature-Cured Ceramic, Cement and Concrete Research 27, 1667-1680 (1997).
[19] Persson, B., Experimental Studies on Shrinkage in High-Performance Concrete, Cement and Concrete Research, 28, 1023-1036, (1997).
[20] Persson, B., Chemical Shrinkage and Self-Desiccation in Portland Cement Based Mortars, Concrete Science and Engineering 1, 228-237 (1999).
[21] Persson, B., Basic Deformations of High-Performance Concrete at Early Ages, Nordic Concrete Research 20, 59-74 (1997).
[22] Persson, B., Self-desiccation and Its Importance in Concrete Technology, Nordic Concrete Research 20, 1998 (120-129).
[23] Persson, B., Effect of Cement Type, Silica Fume, Water-cement Ratio, Age and Moderate Shift in Temperature on Self-desiccation in Concrete, Nordic Concrete Research, 21,97-116 (1999).
[24] Persson, B., Pozzolanic Interaction between Portland Cement and Silica Fume in Concrete, Sixth CANMET/ACI International Conference on Fly Ash, Silica Fume, Slag and Natural Pozzolans in Concrete, Ed.: M.V. Malhotra, 631-660 (1998).
[25] Persson, B., Shrinkage of High-Performance Concrete, Proceedings of an Inter-national Workshop on Autogenous Shrinkage of Concrete, Hiroshima, Ed: E Tazawa, 101-118 (1998).
[26] Persson, B., Long-term Shrinkage of High-Performance Concrete, Proceedings

120
of the 10th International Congress on the Chemistry of Cement, Contribution 2ii073, Gothenburg, Ed. by H Justnes, 9 pp. (1997).
[27] Persson, B., Strength and Shrinkage of Self-compacting Concrete, Proceedings of an International RILEM Workshop on Shrinkage in Concrete, Paris, Ed. by V Baroghel-Bouny and P-C Aïtcin, 81-99 (2000).
[28] Persson, B., Shrinkage of High Performance Concrete. Proceedings of an Inter-national RILEM Conference on early Age Cracking in Concrete. Haifa, Ed. by A Bentur, 301-311 (2001).
[29] Persson, B., Consequence of Cement Constituents, Mix Composition and Curing Conditions for Self-Desiccation in Concrete, Materials and Structures 33, 352-362 (2000).
[30] Persson, B., Compatibility between Flooring Materials and Concrete. Materials and Structures 35, 170-182 (2002).
[31] Persson, B., A NORDTEST Method for Verification of Self-desiccation in Con-crete, Cement and Concrete Research, 31, 199-203 (2001).
[32] Persson, B., On the Under-Pressure in the Pore Water of Sealed High Perform-ance Concrete, Concrete Science and Engineering 2, 213-221, (2000).
[33] Persson, B., Eight-Year Exploration of Shrinkage in High-Performance Con-crete, Cement and Concrete Research, 32, 1229-1237 (2002).
[34] Persson, B., Self-Desiccation of High-Strength Concrete Slabs, Proceedings at the 3rd International Symposium of High-Strength Concrete in Lillehammer, Norway, The Norwegian Concrete Association, Oslo, Ed. by I Holand and E Sellevold, 882-889 (1993).
[35] Persson, B., Self-Shrinkage and Reversible Creep of High-Strength Concrete, Proceedings of the Nordic Research Meeting Gothenburg, The Norwegian Con-crete Association, Oslo, Ed. by L-O Nilsson, 59-61 (1993).
[36] Persson, B., Self-Desiccation of High-Strength Concrete Slabs, Proceedings of the Nordic Research Meeting, Gothenburg, The Norwegian Concrete Associa-tion, Oslo, Ed. by L-O Nilsson, 62-64 (1993).
[37] Persson, B., Shrinkage of Filler-Optimised High-Performance Concrete, Contri-bution at the 16th Symposium on Nordic Concrete Research, Helsinki, Finland, The Norwegian Concrete Association, Oslo, Ed. by K Söderlund, 85-87, (1996).
[38] Persson, B., Effect of Silica Fume on Self-Desiccation and Strength, Contribu-tion at the 16th Symposium on Nordic Concrete Research, Helsinki, Finland, The Norwegian Concrete Association, Oslo, Ed. by K Söderlund, 128-130 (1996).
[39] Persson, B., Experimental Studies of the Effect of Silica Fume on Chemical Shrinkage and Self-Desiccation in Portland Cement Mortars, Proceedings of an International Research Seminar on Self-Desiccation and Its Importance in Con-crete Technology, Division of Building Materials, Lund Institute of Technology, Lund University, Lund, Ed. by B Persson and G Fagerlund, 116-131, (1997).
[40] Persson, B., The Effect of Silica Fume on the Principal Properties of Concrete, Symposium on Advanced Design of Concrete Structures, Gothenburg, CIMNE, Barcelona, Spain, Ed. by K Gylltoft; B Engström; L-O Nilsson, N-E Wiberg and P Åhman, 161-168 (1997).
[41] Persson, B., Creep and Shrinkage in Young or Mature High Performance Con-crete, Proceedings of the 5th International Symposium on Utilisation of High-strength/High-performance Concrete, Sandefjord, The Norwegian Concrete As-

121
sociation, Oslo, Ed. by I Holand and E Sellevold, 1272-1281 (1999). [42] Persson, B., Influence of Mix Design on Self-desiccation in Concrete, Self-
Desiccation and Its Importance in Concrete Technology, Ed.: B. Persson and G. Fagerlund, Report TVBM-3085, Division of Building Materials, Lund Institute of Technology, Lund University, Lund, 85-108 (1999).
[43] Persson, B., Specific volume of chemically bound water and Self-desiccation in silica fume and Portland Cement Based Mortars, Contribution at a Nordic Mini Seminar on Hydration of Cement, Skagen, 19 pp. (1999).
[44] Persson, B., Ninety-month Pozzolanic Interaction between Portland Cement and Silica Fume in Concrete, Contribution at a Nordic Mini Seminar on Hydration of Cement, Skagen, 25 pp. (1999).
[45] Persson, B., Ten Years with Concrete Free of Construction Moisture, “Byggfuktfri betong 10 år,” Husbyggaren 2/2001, 8-12 (2001).
[46] Persson, B., Chemical Shrinkage and RH Tests, Contribution to the RILEM Technical Committee EAC, Early Age Cementitious Systems Ed.: Arnon Bentur 257-275 (2002).
[47] Persson, B., Shrinkage of Concrete, Contribution to the RILEM Technical Com-mittee EAC, Early Age Cementitious Systems, Ed.: Arnon Bentur, 102-114 (2002).
[48] Persson, B., Self-desiccation, Chapter 9.4, Contribution to the fib Technical Committee 8.2, Ed.: Harald Müller, 16 pp. (2001).
[49] Persson, B., Validation of Fédération International de Béton, fib, 2000 Model for Shrinkage in Normal and High-Performance Concrete, HPC, Proceedings of CONCREEP 6, Boston, Ed. by F-J Ulm, Z Bazant and F.H. Whittmann, Elsevier, 741-746 (2001).
[50] Persson, B., Validation of Fédération International de Béton, fib, 2000 Model for Shrinkage in Normal and High-Performance Concrete, HPC, Report TVBM-7157, Division of Building Materials, Lund Institute of Technology, Lund Uni-versity, Lund, 108 pp. (1999).
[51] Persson, B., Thirteen-year Pozzolanic Interaction between Portland Cement and Silica Fume in Concrete, Supplementary Proceedings of the Eight CAN-MET/ACI International Conference on Fly Ash, Silca Fume, Slag and Natural Pozzolans in Concrete, Compiled by P. Gupta and P. Gupta, 455-480 (2004).
[52] Fagerlund, G., The Critical Degree of Saturation Method- A General Method of Estimating the Frost Resistance of Materials and Structures, Report Fo 12:76,The Cement and Concrete Research Inst., Stockholm (1976).
[53] Nilsson, L.-O., Moisture Problems at Concrete Floors, TVBM-3002, Lund Inst. of Technology, Div. of Building Materials: Lund, 36-51 (1980).
[54] Persson, B., Hydration, Structure and Strength of HPC, Laboratory Data, TVBM-7011, Lund Inst. of Technology, Div. of Building Materials, Lund, 37-58 (1992).
[55] Persson, B., Hydration and Strength of High-Performance Concrete, Proceedings of the Nordic Concrete Research Meeting, Trondheim, Norway, The Norwegian Concrete Association, Oslo, Ed. by J J Jensen, 100-102 (1990).
[56] Persson, B., Fagerlund, G., Hydration of High-Performance Concrete, 93rd An-nual Meeting, Cincinnati, The American Ceramic Society, Westerville, 257 (1991).

122
[57] Persson, B., High Profit for Floors with High-Performance Concrete, ”Hög lön-samhet med högpresterande betong,” Bygg & Teknik 07/2001, 22-25 (2001).
[58] Fagerlund, G., Persson, B., High-Performance Concrete without Moisture, “Hög-presterande betong utan byggfukt,” Cementa 3/90, Stockholm, 18-19 (1990).
[59] Persson, B., High-Strength Concrete – Self-desiccation and Strength, “Höghåll-fast betong – självuttorkning och hållfasthet,” Bygg & Teknik 90/7, Stockholm, 21-25 (1990).
[60] Persson, B., High-Performance Concrete – A Match for Management, “Hög-presterande betong – en match för management,” Byggforskning 90/6, Stock-holm, 26-27 (1990).
[61] Persson, B., A Floating Ground Slab Free of Moisture, “En fuktfri platta på mark,” Cementa 91/1, Stockholm, 11-13 (1991).
[62] Persson, B., High-Performance Concrete Produces a Floating Ground Slab Free of Moisture, “Högpresterande betong ger fuktfri platta på mark,” Betong 91/1, Stockholm, 8-10 (1991).
[63] Persson, B., High-Performance Concrete – A Material with Potentialities, “Hög-presterande betong – möjligheternas material,” Byggforskning 91/5, Stockholm, 26-27 (1991).
[64] Persson, B., High-Performance Concrete – Building Material for the Future, “Högpresterande betong – framtidens byggnadsmaterial,” Bygginformation Norr, 91/4, Stockholm, 14-15 (1991).
[65] Persson, B., High-Performance Concrete Dries Even in Water, “Högpresterande betong torkar även i vatten,” Betong 92/1, Stockholm, 14-16 (1992).
[66] Persson, B., The Optimum Concrete for Building during the Nineties, “Optimal betong i 90-talets byggande,” Byggforskning 93/5, 16-17 (1993).
[67] Persson, B., Fifteen Slabs in Research on Desiccation of High-Performance Con-crete, “15 bjälklagsplattor i uttorkningsförsök med högpresterande betong,” Co-author, Bygg & Teknik 93/7, Stockholm, 37-39 (1993).
[68] Persson, B., Autogenous Shrinkage of High-Performance Concrete, “Autogen krympning hos högpresterande betong,” Betong 94/2, Stockholm, 17-20, 29 (1994, with English summary).
[69] Persson, B., High-Strength Concrete Slabs without Moisture, “Fuktsäkra betongbjälklag,” Betong 94/3, Stockholm, 14-16, 29 (1994, with English sum-mary).
[70] Persson, B., High-Performance Concrete without Formaldehyde, “Högprester-ande betong utan formaldehyde,” Bygg & Teknik 94/7, Stockholm, 13-16 (1994).
[71] Persson, B., Computer Program DRY for Estimation of the Water-cement Ratio in Concrete Free of Construction Moisture, “Beräkningsprogram TORK för val av vct i byggfuktfri betong,” Bygg & Teknik, 95/7, Stockholm, 22-25 (1995).
[72] Persson, B., Rapid Drying Concrete Did Not Cause Sick Buildings, “Snabbtorkande betong gav ej upphov till sjuka hus,” Betong 4/95, Stockholm, 20-21 (1995).
[73] Persson, B., Desiccation of Surface Moisture in Concrete Free of Construction Moisture, “Uttorkning av ytfukt i byggfuktfri betong,” AMA-nytt Informations-del AF – Mark – Hus 1/96, Stockholm, 20-23 (1996).
[74] Persson, B., Concrete Adjusted to an Efficient Building Process, “Betong anpas-

123
sad för ett effektivt byggande,” Bygg & Teknik 7/96, Stockholm, 27-31 (1996). [75] Persson, B., Problems Related to Flooring of High-Performance Concrete – The
Effect of the Moisture State of the Surface, “Problem vid mattläggning på hög-presterande betong – inverkan av ytans fukttillstånd,” Betong 96/4, Stockholm, 21-23, 45 (1996).
[76] Persson, B., Self-desiccation in Practice, “Självuttorkning i praktiken,” Bygg & Teknik 7/97, 12-16 (1997).
[77] Persson, B., Long-term Desiccation of Filigree Slabs, “Långtidsuttorkning av filigranbjälklag,” Report U94.03, Division of Building Materials, Lund Institute of Technology, Lund University, Lund, 11 pp. (1994).
[78] Persson, B., High-Perfomance Concrete on Remaining Form-Work of Concrete – Desiccation Properties, “Högpresterande betong på samverkansplåt – uttorkn-ingsförhållanden,” Report U94.08, Division of Building Materials, Lund Institute of Technology, Lund University, Lund, 4 pp. (1994).
[79] Persson, B., Moisture in Rapid Drying Concrete, “Fukt i snabbtorkande betong,” Report U96.04, Division of Building Materials, Lund Institute of Technology, Lund University, Lund, 11 pp. (1996).
[80] Persson, B., Self-Desiccation of Concrete with Slag Additives, “Självtorkning hos betong med tillsats av slagg,” Report U96.07, Division of Building Materi-als, Lund Institute of Technology, Lund University, Lund, 2 pp. (1996).
[81] Persson, B., Influence of Cement Type, Silica Fume, Water-Cement Ratio and Moderate Shift of Temperature on Self-Desiccation in Concrete, Report U97.17, Division of Building Materials, Lund Institute of Technology, Lund University, Lund, 20 pp. (1997).
[82] Persson, B., Self-Desiccation of High-Strength Concrete Slabs, Proceedings of the Nordic Research Meeting, Gothenburg, The Norwegian Concrete Associa-tion, Oslo, Ed. by Nilsson, L.-O., 62-64 (1993).
[83] Persson, B., Ten Years with Concrete Free of Construction Moisture, “Byggfuktfri betong 10 år,” The Association of Swedish Building Inspectors, 2/2001, 27-28 (2001).
[84] Persson, B., High Concrete Quality Excludes Moisture Problems, “Hög betong-kvalitet utesluter fuktproblem,” Husbyggaren 5/2001, 10-14 (2001).
[85] Tazawa, E. and Miyazawa, S., Effect of Cement Composition on Autogenous Shrinkage in Concrete, Proceedings of the 10th International Congress on the Chemistry of Cement, Gothenburg, Ed.: H. Justnes, Contribution 2ii072 (1997).
[86] Persson, B., Compatibility between flooring material on concrete and moisture, volatile organic compound and adhesion, “Kompatibilitet mellan golvmaterial och betong – Effekt av produktionsmetoder på emissioner, fukt och karbonatiser-ing,” Report TVBM-7149, LTH Building Materials, Lund 133 pp. (2000).
[87] Persson, B., Flooring on Concrete – A Synthesis as Concerns Moisture, Chemi-cal Volatile Compound and Adhesion, “Golvsystem på betong – fuktpåverkan, kemisk emission och vidhäftning,” Report TVBM-7165, ISBN 91-631-1993-5, Div. Building Materials, Lund Institute of Technology, Lund, 157 pp. (2003).
[88] Persson, B., Silica fume concrete – after 13 years, “Silikastoftbetong – efter 13 år,” Bygg & Teknik 2003/07, 42-47 (2003).
[89] Persson, B., Silica fume concrete – after 13 years, “Silikastoftbetong – efter 13 år,” Bygg & Teknik 2003/08, 69-71 (2003).

124
[90] Persson, B., Flooring system on Concrete – Effect of Moisture, Emissions and Adhesion, “Alkalibeständigt lim, avjämningsmassa och homogen plastmatta bästa kombinationen på betonggolv,” Betong 2/2004, 60-62 (2004).
[91] Nilsson, L.-O., Hedenblad, G., and Norling-Mjörnell, K., Suction after Long Time, HPC Handbook, Svensk Byggtjänst, 209-226 (2000).
[92] Persson, B., Plastic shrinkage of concrete without building moisture, “Plastisk krympning hos självkompakterande betong utan byggfukt,” Bygg & Tek-nik2004/07, 41-43 (2004).
[93] Persson, B., Drying of concrete free of construction moisture after water curing, wind and heating, ”Uttorkning av byggfuktfri självkompakterande betong efter vattenlagring, vind eller värme,” Bygg & Teknik 2005/07 (in Press).
[94] Persson, B., Unexpected volatile organic compound from flooring materials, “Oväntade egenemissioner från golvmaterial,” Husbyggaren 1/2003, 20-28 (2003).
[95] Persson, B., Pre-testing of Flooring Systems on Concrete Secures a Good Indoor Environment, “Förprovning av golvsystem borgar för en god innemiljö,” Hus-byggaren 6/2002, 10-18 (2002).
[96] Persson, B., Mould in Foundations of Small Housing May be Avoided at Rea-sonable Costs, “Mögel i småhusgrunder kan undvikas till rimliga kostnader,” Husbyggaren 5/2002, 10-17 (2002).
[97] Persson, B., Desiccation of Concrete with Construction Cement, ”Betonguttorkn-ing med Byggcement,” Bygg & Teknik 07/2000, 30-32 (2000).
[98] Persson, B., Self-Compacting Concrete at Fire Temperatures, Report TVBM-3110, ISBN 91-631-3301-6, Division of Building Materials, Lund Institute of Technology, Lund University, Lund, 200 pp. (2003).
[99] Persson, B., Moisture distribution in concrete slabs with heating pipes – effect of concrete type, depth of pipe, temperature, drying and surface flooring, “Fuktför-delning i betonggolv med värmerör – effekt av betongtyp, rördjup, temperatur, uttorkning och ytbeläggning,” Working report 0501:3, Division of Building Materials, Lund Institute of Technology, Lund University, Lund, 28 pp. (2005).
[100] Sjöberg, A, Nilsson, L.-O., and Rapp, T., Moisture Measurement in Concrete Flooring with Floor Heating, ”Fuktmätning i betonggolv med golvvärme,” Stage 1: Pre-study, Publ. P-02:1, CTH Building Materials, Gothenburg, 54 pp. (2002).
[101] Ivansson, K., Lagerblad, S., Larsson, E., and Undén, E., Drying after water dam-age and the effect of wind on drying of concrete, “Uttorkning efter fuktskada samt vindens inverkan på uttorkningsförloppet, Laboration No 8,” Div. Building Materials, Lund Institute of Technology, Lund University, Lund, 8 pp. (2004).
[102] Persson, B., Moisture Classification of Buildings Favours Property Owners and Insurance Companies, ”Fuktklassning av byggnader gynnar husägare och försäk-ringsbolag,” Husbyggaren 1/2002, 16-24 (2002).

125
PREDICTION MODEL FOR AUTOGENOUS SHRINKAGE
OF CONCRETE WITH DIFFERENT TYPE OF CEMENT
Shingo Miyazawa
Department of Civil Engineering, Ashikaga Institute of Technology, Ashikaga, Japan
Ei-ichi Tazawa
Research and Development Initiative, Chuo University, Tokyo, Japan
Abstract
Autogenous shrinkage of concrete with different type of cement and with different
water-cement ratio was measured from initial setting time. Ordinary Portland cement,
moderate-heat Portland cement, high-early-strength Portland cement and low-heat
Portland cement were used. A prediction model for autogenous shrinkage of concretes
was studied on the basis of the observed values.
1. Introduction
It has passed about 15 years since autogenous shrinkage was recognized to be one of the
causes of cracking in concrete structures. During that time, many studies on autogenous
shrinkage have been carried out in many countries. In 1998, Japan Society for Civil
Engineers (JSCE) specified that autogenous shrinkage should be considered in order to
calculate thermal stress in massive concrete, long term deflection in RC members and
time dependent loss of prestressing force [1][2]. In order to estimate these behaviours,
some prediction models for autogenous shrinkage have been proposed [3][4][5]. A
prediction model for autogenous shrinkage which was given by JSCE [2] can be applied
only to ordinary Portland cement. As the type of cement has great influence on
autogenous shrinkage, it should be taken into account in prediction models. In this
study, autogenous shrinkage of concrete with various types of cement and different
water-cement ratio was measured from initial setting time up to the age of two years.
JSCE prediction model has been improved on the basis of experimental results so that it
can be applicable to concretes with various types of cement.
2. Influence of mineral composition of cement on autogenous shrinkage
Autogenous shrinkage of cement paste with various types of cement is shown in Figure
1, where N indicates ordinary Portland cement, M indicates moderate-heat Portland
cement, H indicates high-early-strength Portland cement, L indicates low-heat Portland
cement, W indicates white Portland cement, A indicates calcium-aluminate cement, O
indicates oil-well cement, S indicates sulphate-resistant cement, G indicates geothermal-
well cement, B indicates Portland blast-furnace slag cement [6]. Mineral composition
of these cements is also shown in the figure. It can be seen from the figure that
autogenous shrinkage of cement paste is strongly dependent on type of cement. It
should be noticed that this is not the case in drying shrinkage. Autogenous shrinkage of
moderate-heat Portland cement (M) and low-heat Portland cement (L) is much less than
ordinary Portland cement (N). High-early-strength Portland cement (H) resulted in
greater autogenous shrinkage than ordinary Portland cement. The authors reported that
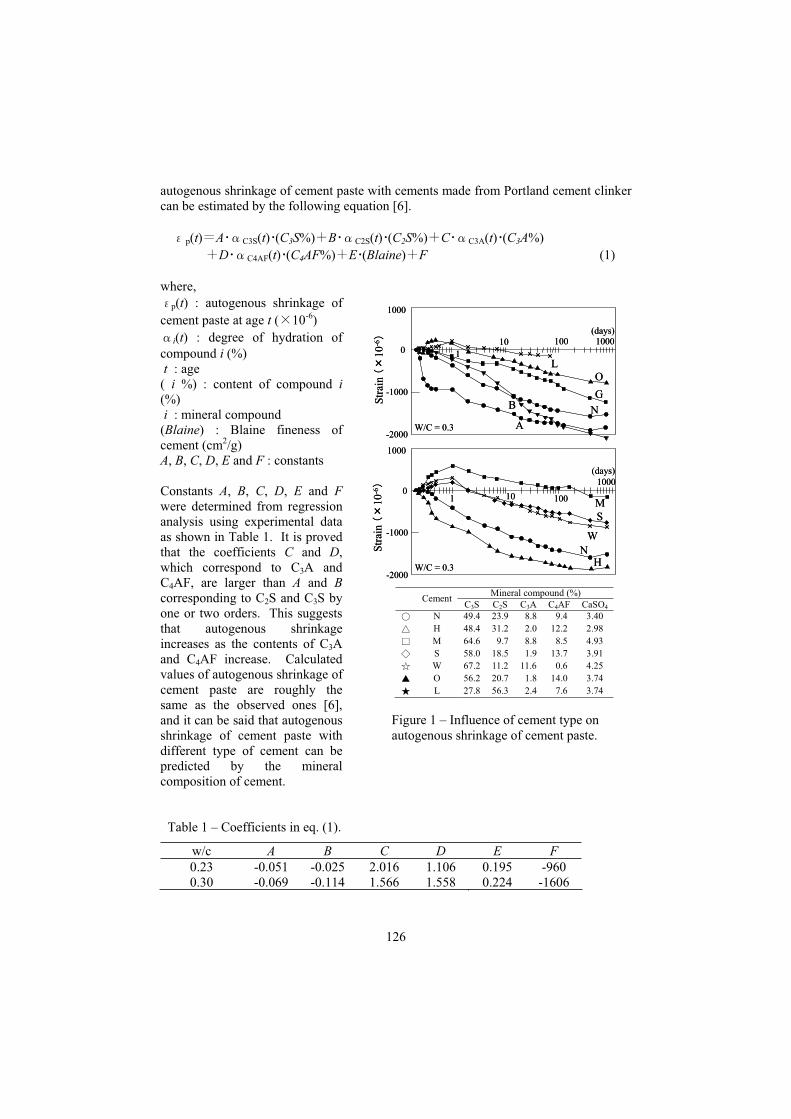
126
autogenous shrinkage of cement paste with cements made from Portland cement clinker
can be estimated by the following equation [6].
p(t) A C3S(t) (C3S%) B C2S(t) (C2S%) C C3A(t) (C3A%)
D C4AF(t) (C4AF%) E (Blaine) F (1)
where,
p(t) : autogenous shrinkage of
cement paste at age t ( 10-6)
i(t) : degree of hydration of
compound i (%)
t : age
( i %) : content of compound i
(%)
i : mineral compound
(Blaine) : Blaine fineness of
cement (cm2/g)
A, B, C, D, E and F : constants
Constants A, B, C, D, E and F
were determined from regression
analysis using experimental data
as shown in Table 1. It is proved
that the coefficients C and D,
which correspond to C3A and
C4AF, are larger than A and B
corresponding to C2S and C3S by
one or two orders. This suggests
that autogenous shrinkage
increases as the contents of C3A
and C4AF increase. Calculated
values of autogenous shrinkage of
cement paste are roughly the
same as the observed ones [6],
and it can be said that autogenous
shrinkage of cement paste with
different type of cement can be
predicted by the mineral
composition of cement.
Table 1 – Coefficients in eq. (1).
w/c A B C D E F
0.23 -0.051 -0.025 2.016 1.106 0.195 -960
0.30 -0.069 -0.114 1.566 1.558 0.224 -1606
1000
1 10 100
W/C = 0.3
1000
-2000
-1000
1000
1
10 100
W/C = 0.3
1000
-2000
-1000
(days)
L
O
G
NB
A
M
S
W
NH
0
0
Str
ain
10
-6S
trai
n
10
-6
(days)
1000
1 10 100
W/C = 0.3
1000
-2000
-1000
1000
1
10 100
W/C = 0.3
1000
-2000
-1000
(days)
L
O
G
NB
A
M
S
W
NH
0
0
Str
ain
10
-6S
trai
n
10
-6
(days)
Figure 1 – Influence of cement type on
autogenous shrinkage of cement paste.
Mineral compound (%) Cement
C3S C2S C3A C4AF CaSO4
N 49.4 23.9 8.8 9.4 3.40
H 48.4 31.2 2.0 12.2 2.98
M 64.6 9.7 8.8 8.5 4.93
S 58.0 18.5 1.9 13.7 3.91
W 67.2 11.2 11.6 0.6 4.25
O 56.2 20.7 1.8 14.0 3.74
L 27.8 56.3 2.4 7.6 3.74
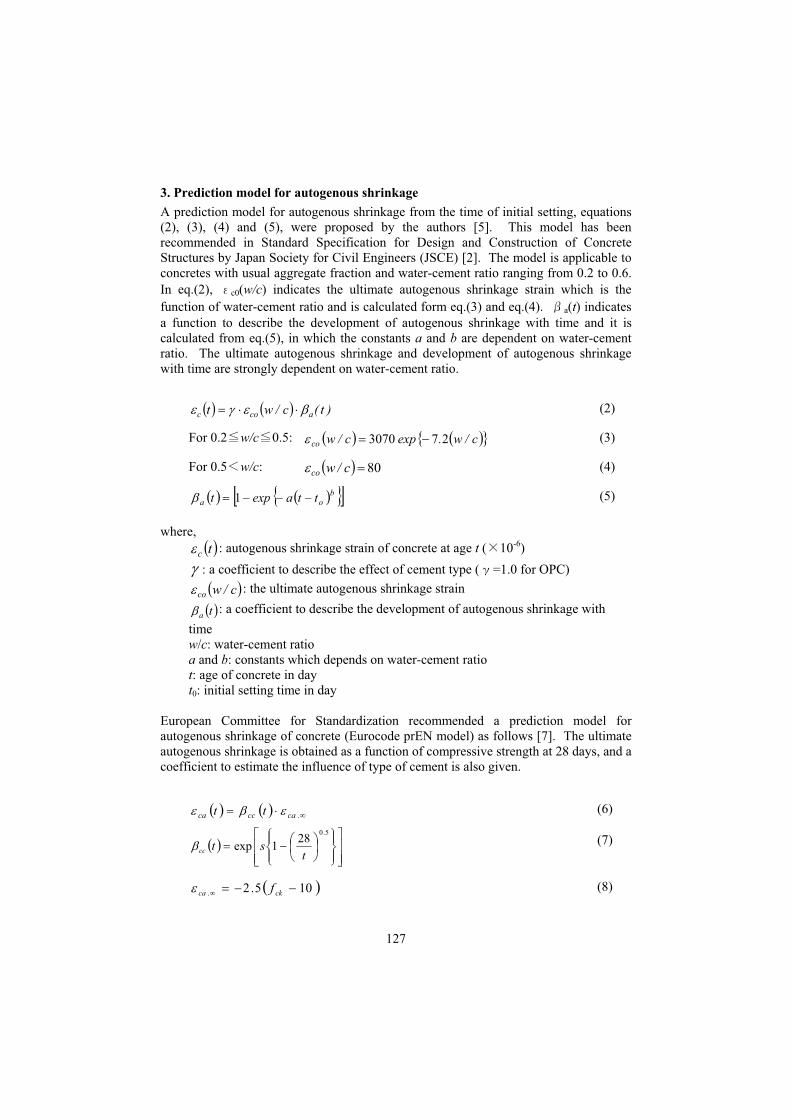
127
3. Prediction model for autogenous shrinkage
A prediction model for autogenous shrinkage from the time of initial setting, equations
(2), (3), (4) and (5), were proposed by the authors [5]. This model has been
recommended in Standard Specification for Design and Construction of Concrete
Structures by Japan Society for Civil Engineers (JSCE) [2]. The model is applicable to
concretes with usual aggregate fraction and water-cement ratio ranging from 0.2 to 0.6.
In eq.(2), c0(w/c) indicates the ultimate autogenous shrinkage strain which is the
function of water-cement ratio and is calculated form eq.(3) and eq.(4). a(t) indicates
a function to describe the development of autogenous shrinkage with time and it is
calculated from eq.(5), in which the constants a and b are dependent on water-cement
ratio. The ultimate autogenous shrinkage and development of autogenous shrinkage
with time are strongly dependent on water-cement ratio.
)t(c/wt acoc (2)
For 0.2 w/c 0.5: c/w.expc/wco 273070 (3)
For 0.5 w/c: 80c/wco (4)
boa ttaexpt 1 (5)
where,
tc: autogenous shrinkage strain of concrete at age t ( 10-6)
: a coefficient to describe the effect of cement type ( =1.0 for OPC)
c/wco: the ultimate autogenous shrinkage strain
ta: a coefficient to describe the development of autogenous shrinkage with
time
w/c: water-cement ratio
a and b: constants which depends on water-cement ratio
t: age of concrete in day
t0: initial setting time in day
European Committee for Standardization recommended a prediction model for
autogenous shrinkage of concrete (Eurocode prEN model) as follows [7]. The ultimate
autogenous shrinkage is obtained as a function of compressive strength at 28 days, and a
coefficient to estimate the influence of type of cement is also given.
.caccca tt (6)
5.028
1expt
stcc
(7)
105.2. ckca f (8)
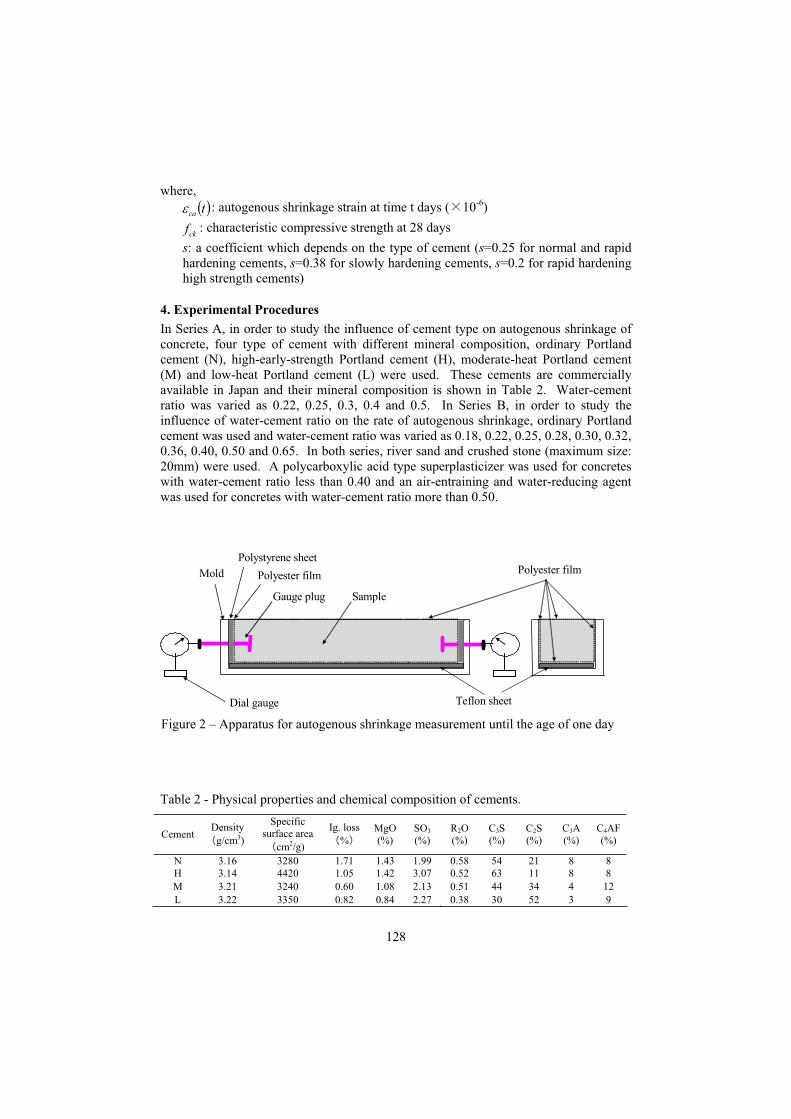
128
where,
tca: autogenous shrinkage strain at time t days ( 10-6)
ckf : characteristic compressive strength at 28 days
s: a coefficient which depends on the type of cement (s=0.25 for normal and rapid
hardening cements, s=0.38 for slowly hardening cements, s=0.2 for rapid hardening
high strength cements)
4. Experimental Procedures
In Series A, in order to study the influence of cement type on autogenous shrinkage of
concrete, four type of cement with different mineral composition, ordinary Portland
cement (N), high-early-strength Portland cement (H), moderate-heat Portland cement
(M) and low-heat Portland cement (L) were used. These cements are commercially
available in Japan and their mineral composition is shown in Table 2. Water-cement
ratio was varied as 0.22, 0.25, 0.3, 0.4 and 0.5. In Series B, in order to study the
influence of water-cement ratio on the rate of autogenous shrinkage, ordinary Portland
cement was used and water-cement ratio was varied as 0.18, 0.22, 0.25, 0.28, 0.30, 0.32,
0.36, 0.40, 0.50 and 0.65. In both series, river sand and crushed stone (maximum size:
20mm) were used. A polycarboxylic acid type superplasticizer was used for concretes
with water-cement ratio less than 0.40 and an air-entraining and water-reducing agent
was used for concretes with water-cement ratio more than 0.50.
Table 2 - Physical properties and chemical composition of cements.
Cement Density
g/cm3)
Specific
surface area
cm2/g)
Ig. loss
%
MgO
(%)
SO3
(%)
R2O
(%)
C3S
(%)
C2S
(%)
C3A
(%)
C4AF
(%)
N 3.16 3280 1.71 1.43 1.99 0.58 54 21 8 8
H 3.14 4420 1.05 1.42 3.07 0.52 63 11 8 8
M 3.21 3240 0.60 1.08 2.13 0.51 44 34 4 12
L 3.22 3350 0.82 0.84 2.27 0.38 30 52 3 9
Figure 2 – Apparatus for autogenous shrinkage measurement until the age of one day
Mold
Gauge plug Sample
Polyester film
Teflon sheet
Polystyrene sheet
Polyester film
Dial gauge

129
Table 3 – Mix proportion and properties of concrete.
Unit content kg/
SeriesCement
type
W/C
(%)
s/a
(%) W C S G Ad
(%)
Slump
or
slump
flow
cm
Air
(%)
Initial
setting
(day)
f ’c28
(N/mm2)
N 661 890 1.20 70×69 3.1 0.180 92.5
H 660 888 1.10 51×50 1.2 0.194 106.8
M 665 896 1.00 56×54 2.1 0.167 118.0
L
22.0 43.0 165 750
666 897 1.10 72×70 2.6 0.272 109.5
N 735 890 1.00 70×68 0.9 0.167 94.2
H 733 888 1.20 54×52 2.3 0.139 103.0
M 739 895 0.80 65×62 2.5 0.167 111.0
L
25.0 45.6 165 660
739 896 0.80 70×70 1.1 0.218 101.2
N 827 888 0.70 44×44 3.0 0.178 72.5
H 825 886 1.00 52×52 3.1 0.212 76.1
M 830 891 0.80 51×51 3.5 0.208 74.1
L
30.0 48.6 165 550
831 892 0.70 65×65 1.3 0.231 88.9
N 174 435 761 1018 0.25 8.0 4.0 0.199 60.1
H 174 435 760 1016 0.25 8.0 2.0 0.176 57.9
M 184 461 743 994 0.25 11.5 2.7 0.316 53.5
L
40.0 43.2
184 461 743 994 0.25 13.0 3.1 0.366 57.5
N 185 371 806 995 0.25 8.5 3.1 0.197 44.0
H 185 370 806 995 0.25 8.0 3.2 0.181 46.1
M 174 348 830 1024 0.25 8.0 3.2 0.219 43.6
A
L
50.0 45.2
174 348 831 1025 0.25 8.0 4.0 0.316 45.7
18.0 40.0 165 917 546 831 1.85 80×79 2.5 0.132 132.8
22.0 43.0 165 750 646 869 1.00 69×69 2.8 0.160 106.3
22.0 43.0 165 750 646 869 1.20 60×59 3.1 0.160 108.3
25.0 45.6 170 680 705 854 0.90 69×69 2.9 0.174 103.6
28.0 43.8 165 589 704 918 0.70 63×62 3.9 0.153 88.1
30.0 43.8 170 567 718 936 0.65 48×48 2.1 0.169 78.7
32.0 40.5 180 563 668 937 0.50 7.0 3.0 0.306 72.8
36.0 41.3 170 472 677 977 0.45 7.2 4.0 0.253 55.4
40.0 43.1 170 425 723 970 0.45 7.0 4.4 0.241 46.0
50.0 46.1 162 324 822 975 0.45 8.5 4.8 0.257 29.8
B N
65.0 49.1 170 262 890 937 0.35 6.7 4.5 0.247 26.4
22.0 43.0 165 750 646 880 1.00 68×65 4.0 0.153 87.4
25.0 45.6 165 660 720 880 0.70 53×52 3.4 0.201 89.6
30.0 48.6 165 550 809 880 0.80 52×52 2.1 0.167 73.5
40.0 43.0 158 395 746 1015 0.50 9.5 5.9 0.299 46.4
C N
50.0 45.0 160 320 805 1011 0.50 11.0 4.4 0.278 40.7

130
Mix proportion and the properties of tested concretes are shown in Table 3.
Measurements of autogenous shrinkage were carried out in accordance with the test
method proposed by Japan Concrete Institute [8]. Figure 2 shows the test apparatus for
autogenous shrinkage measurement during the first 24 hours. In order to eliminate
restraint by the mold, a Teflon sheet was put on the bottom of the mold. After casting
the top surface of concrete was sealed with polyester film to prevent evaporation. The
measurements were started at the time of initial setting. After being demolded at the
age of 24 hours, all the surfaces of specimens were sealed with aluminium adhesive tape,
and autogenous shrinkage was measured with contact gauge method at specified ages
up to two years. Dimension of the specimens was 100x100x400mm in beam and three
specimens were prepared for each mixture.
5. Results and discussions
Autogenous shrinkage versus time curve for concrete with different water-cement ratio
using ordinary Portland cement (N), moderate-heat Portland cement (M), high-early-
strength Portland cement (H) and low-heat Portland cement (L) are shown in Figure 3.
Although the specimens were stored in a room at 20 during the measurements,
temperature of the specimens rose a little bit due to cement hydration. Therefore, the
value of autogenous shrinkage was obtained by subtracting thermal strain from the
observed strain, assuming that the coefficient of thermal expansion of the tested
concretes is 10x10-6/ .
It can be seen from Figure 3.1 and 3.2 that autogenous shrinkage increases as water-
cement ratio decreases for any type of cement. It can be also seen that autogenous
shrinkage is strongly dependent on type of cement. Compared with ordinary Portland
cement (N), high-early-strength Portland cement (H) results in larger autogenous
shrinkage and moderate-heat Portland cement (M) results in smaller shrinkage.
Autogenous shrinkage of low-heat cement (L) is much less than that of the other types
of cement. These experimental results coincide with previous studies reported by many
researchers. In the prediction model by JSCE (eq.(2)), it is possible to predict
autogenous shrinkage of ordinary Portland cement, where the value of is taken to be
1.0. However the JSCE model can not be applied to the other types of cement such as
cements M, H and L, because the value of for these types of cement has not been
specified. In this study, the values of for cements M, H and L were determined as
follows. The ratio of ultimate autogenous shrinkage of a particular cement to that of
ordinary Portland cement is calculated from eq.(1). The ratio for cement paste is taken
to be the same as that for concrete, and then the value of in Table 4 is obtained. In
this discussion, it is assumed that the value of is 100% and that is not dependent
on water-cement ratio.
Table 4 – Coefficient in eq. (2).
Type of cement N H M L
1.0 1.2 0.85 0.4

131
(a) Ordinary Portland cement
(b) High-early-strength Portland cement
Figure 3.1 – Autogenous shrinkage of concrete with different type of cement.
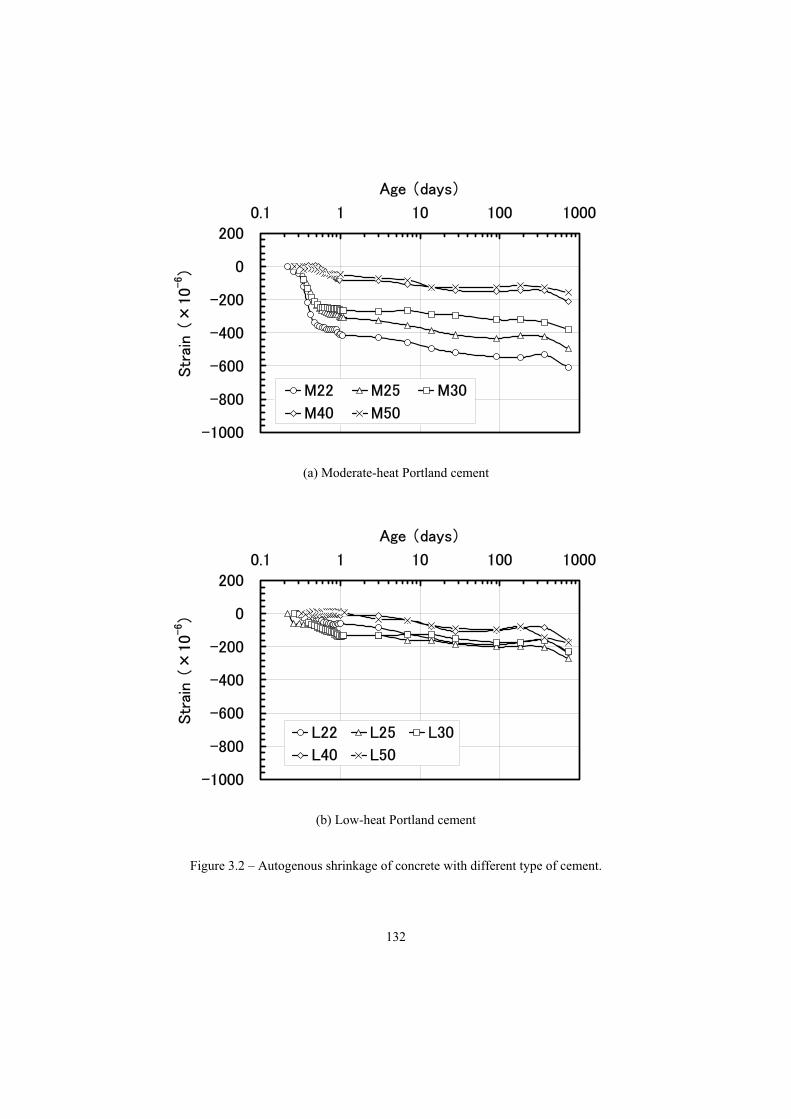
132
(a) Moderate-heat Portland cement
(b) Low-heat Portland cement
Figure 3.2 – Autogenous shrinkage of concrete with different type of cement.

133
(a) Ordinary Portland cement
(b) High-early-strength Portland cement
Figure 4.1 - Relation between water-cement ratio and autogenous shrinkage.
obs. (Series A)
proposed model
- - - pre EN model
obs. (Series A)
obs. (Series B)
obs.
proposed model
- - - pre EN model

134
(a) Moderate-heat Portland cement
(b) Low-heat Portland cement
Figure 4.2 - Relation between water-cement ratio and autogenous shrinkage.
1.1 .1 .1 .
obs. (Series A)
proposed model
- - - pre EN model
obs. (Series A)
proposed model
- - - pre EN model

135
(a) w/c = 0.18
(b) w/c = 0.3
Figure 5.1 - Development of autogenous shrinkage with time (Ordinary Portland cement).

136
(a) w/c = 0.5
(b) w/c = 0.65
Figure 5.2 - Development of autogenous shrinkage with time (Ordinary Portland cement).
137
Development of autogenous shrinkage with time is strongly dependent on water-cement
ratio. For concrete with low water-cement ratio, autogenous shrinkage increases rapidly
at early ages. For concrete with high water-cement ratio, on the other hand, it increases
gradually for a long time. Therefore, in the JSCE model, the values of the coefficients a
and b in eq.(5) are given to concretes with water-cement ratios of 0.2, 0.23, 0.3, 0.4, and
more than 0.5. However, it is desirable that the coefficients a and b should be given as
functions of water-cement ratio. In this study, the coefficients a and b were determined
with regression analysis, where it is assumed that the ultimate autogenous shrinkage is
equal to the observed value at 91 days. Then the values of a and b for the tested
concretes were plotted in relation to water-cement ratio and the following equations
were obtained by regression analysis.
c/w.exp.a 836273 (9)
c/w.exp.b 4922510 (10)
Figure 4.1 and 4.2 show observed autogenous shrinkage at the age of 91 days and the
calculated values by JSCE model where the coefficients , a and b are obtained from
Table 3, eq.(9) and eq.(10) respectively. Since the proposed model has made it possible
to determine these coefficients for concrete with any water-cement ratio and with
various types of cement, it can be said that JSCE prediction model for autogenous
shrinkage has been improved from a practical point of view. It can be seen from the
figures that autogenous shrinkage of concrete with various types of cement and with
water-cement ratios ranging from 0.18 to 0.6 can be predicted with adequate accuracy
for practical purposes.
Predicted values of autogenous shrinkage calculated from prEN model (eq.(6)) are also
shown in Figure 4.1 and 4.2. In the calculations of eq. (8), the observed values for
compressive strength of concrete at 28 days which are shown in Table 2 were used. It
can be seen from the figures that the European model gives underestimations for
concretes with Japanese cements such as ordinary Portland cement (N) and high-early-
strength Portland cement (H).
Figure 5.1 and 5.2 show autogenous shrinkage versus time, where the observed value at
the age of 91 days is taken to be 1.0. Predicted values by JSCE model (eq.(5))
combined with the proposed model for coefficients a and b in this study (eq.(9) and
eq.(10)), by the existing JSCE model and by prEN model (eq.(7)) are also shown in this
figure. It can be seen from the figures that the development of autogenous shrinkage
with time can be predicted by the proposed model for concrete with any water-cement
ratio.
6. Conclusions
Autogenous shrinkage of concrete with ordinary Portland cement, moderate-heat
Portland cement, high-early-strength Portland cement and low-heat Portland cement
was measured from initial setting time up to two years. A prediction model for
138
autogenous shrinkage of concrete with various types of cement has been studied on the
basis of JSCE model, and the findings of this paper are provided as follows.
1. Autogenous shrinkage of concrete is strongly dependent on type of cement. The
coefficient in JSCE model, which describes the influence of cement type, has
been determined on the basis of mineral composition of cement.
2. Development of autogenous shrinkage with time is strongly dependent on water-
cement ratio. The coefficients a and b in JSCE model, which describe the
development of autogenous shrinkage with time, have been proposed as functions
of water-cement ratio.
3. Autogenous shrinkage calculated form the proposed model was compared with the
observed values, and it is proved that the model has adequate accuracy for practical
purposes.
References
[1] Japan Society for Civil Engineers, Standard Specifications for Concrete Structures
“Construction”, 2002 (in Japanese)
[2] Japan Society for Civil Engineers, Standard Specifications for Concrete Structures,
“Structural Performance Verification” (2002).
[3] Jonasson, J.-E., Groth, P. and Hedlund, H., Modelling of temperature and moisture
field in concrete to study early age movement as a basis for stress analysis,
Thermal Cracking in Concrete at Early Ages, E & FN SPON, 45-52 (1994).
[4] Le Roy, R., de Larrard, F. and Pons, G., The AFREM code type model for creep
and shrinkage of high-performance concrete, Proceedings of the 4th International
Symposium on Utilization of High-strength/High-performance Concrete, 387-396
(1996).
[5] Tazawa, E. and Miyazawa, S., Effect of Constituents and Curing Conditions on
Autogenous Shrinkage of Concrete, Autogenous Shrinkage of Concrete, E & FN
SPON, 269-280 (1999).
[6] Tazawa, E. and Miyazawa, S., Effect of Cement Composition on Autogenous
Shrinkage in Concrete, Proceedings of the 10th International Congress on the
Chemistry of Cement, 2 ii072 (1997).
[7] European Committee for Standardization, European Standard prEN 1992-1(2001).
[8] Japan Concrete Institute, JCI Committee Report, Autogenous Shrinkage of
Concrete, E & FN SPON, 56-59 (1999).

139
THE EFFECT OF AUTOGENOUS SHRINKAGE ON FLEXURAL CRACKING BEHAVIOR OF REINFORCED HSC BEAMS AND IMPROVEMENT BY USING LOW-SHRINKAGE HSC Masahiro Suzuki Technical Research Institute, P.S. Mitsubishi Construction Co., Ltd., Japan Makoto Tanimura Research & Development Center, Taiheiyo Cement Corporation, Japan Ryoichi Sato Department of Civil and Environmental Engineering, Graduate School of Engineering, Hiroshima University, Japan
Abstract
This study experimentally investigates the effect of autogenous shrinkage on flexural cracking behaviors under short-term service loads of reinforced W/C=0.3 high-strength concrete (HSC) beams, and also the effectiveness of low-shrinkage HSCs (LS-HSC) that are made by using expansive additive and/or shrinkage-reducing chemical agent and/or Belite-rich low heat Portland cement with regards to the improvement of flexural cracking performances of the beams. General evaluation method for maximum crack width of RC flexural members considering the shrinkage/expansion effect before loading is discussed. The results show that autogenous shrinkage of HSC is able to affect the cracking behaviors of the RC beams significantly, while LS-HSC can markedly improve its behaviors. In addition, it is demonstrated that flexural crack widths of the RC beams made with conventional HSC have a high autogenous shrinkage, LS-HSCs have a less autogenous shrinkage and also a potential of expansion can be integrally evaluated by the JSCE Code equation. This equation takes into account the strain change in the reinforcing bars from the state where the stress in concrete at the depth of tension reinforcements is zero.
1. Introduction
High-strength concrete (HSC) has been widely studied over the last decade and has been increasingly applied in order to enhance the durability and structural performance of concrete structures. However, low water-to-binder ratio concretes are known to shrink significantly at early ages, which is likely to be caused by autogenous shrinkage, which results in increasing the sensitivity to early-age cracking [1,2]. Control of cracking in RC members is always important because the durability of concrete structures declines with crack formation. HSC is expected to yield more durable structural members, therefore, the control of cracking for HSC, compared to traditional concrete, is essential. Thus, the establishment of a technique for minimizing autogenous shrinkage in HSC is an important task. Recently, comprehensive experimental investigations on how to control autogenous shrinkage have been carried out from a material point of view [2-4]. These studies reveal that expansive additives, shrinkage-reducing chemical agents, as well as Portland cement containing higher C2S content and

140
lower C3A or C4AF content are effective in reducing autogenous shrinkage. Additionally, the effect of the combination of the above-mentioned materials on reducing autogenous shrinkage has been investigated, and HSCs with lower crack sensitivity have been developed [5-7]. However, only a few studies on the structural performance of RC members using low-shrinkage HSC (LS-HSC) have been performed. Further, there are only a few reports on methods for evaluating the serviceability performance of RC members considering the effect of shrinkage/expansion before loading [8-10]. Considering the above-described background, the present study aims to experimentally investigate the effectiveness of LS-HSC using ordinary/Belite-rich low heat Portland cement and/or expansive additive and/or shrinkage-reducing chemical agent on the improvement of cracking performance of reinforced HSC flexural members under short-term loading. Additionally, general methods for evaluating the maximum crack width of the beams considering the effect of shrinkage/expansion before loading are discussed and proposed on the basis of JSCE Design Code of 2002 [11].
2. Experimental program
2.1 Materials and mix proportions
Table 1 lists the materials used for the experiments and Table 2 lists the mix proportions of concrete as well as the slump flow value, air content, and temperature measured just before placing the concrete. Eight HSCs with fixed water-to-binder ratios of 0.3 were prepared in order to investigate the shrinkage/expansion effect on the cracking behaviors of RC beams. The concrete quality, referred to as NC, represents a reference HSC made from using OPC with no additives. NE, NS, and NES denote HSC made from using OPC with EX, SRA, and EX and SRA, respectively. LC denotes concrete with LPC, and LE, LS, and LES correspond to concretes consisting of LPC with EX, SRA, and EX and SRA, respectively.
Table 1 – Materials Material Type (Designation) / Characteristics
Ordinary Portland cement (OPC) / density: 3.16 g/cm3,SSA: 3310 cm2/g
Cement Low-heat Portland cement (LPC) / density: 3.22 g/cm3,SSA: 3280 cm2/g
Expansive additive Calcium-sulfoaluminate based (EX) / density: 2.96 g/cm3,SSA: 3050 cm2/g
Shrinkage reducer Lower-alcohol alkyleneoxide adduct (SRA)
Fine aggregate Land sand (S) / density: 2.62 g/cm3, absorption: 1.66%, F.M.: 2.84
Coarse aggregate Crushed sand stone (G) / maximum size: 20mm, density: 2.64 g/cm3, absorption: 0.85%, F.M.: 6.61
Water reducer Polycarboxylic acid based high-range water-reducing agent (SP) / density: 1.05 g/cm3
SSA: Specific surface area measured by Blaine’s Method, F.M.: Fineness modulus

141
Table 2 – Mix proportions, fresh properties of concrete Designation of concrete Mix proportions and
fresh properties NC NE NS NES LC LE LS LES Type of cement OPC LPC
W/(C+EX) 0.3 W* (kg/m3) 175 169 175 169 C (kg/m3) 583 543 583 543 583 543 583 543
EX (kg/m3) - 40 - 40 - 40 - 40 SRA (kg/m3) - - 6 6 - - 6 6
S (kg/m3) 800 798 800 798 809 806 809 806 G (kg/m3) 832 SP (kg/m3) 5.25 5.42 5.83 6.70 2.92 3.38 2.97 3.50
Slump flow (mm) 623 423 630 625 520 570 530 635 Air content (%) 1.0 0.6 1.5 1.3 2.1 1.3 1.2 1.4
Temperature (oC) 19.9 21.2 18.0 19.0 18.2 17.0 18.2 17.6 (*) The unit water content includes SP.
2.2 Specimens
The RC beam specimens for investigating the shrinkage/expansion-restrained stress as well as cracking behaviors are shown in Figure 1. One specimen was prepared for each mixture. The specimen dimension is 200 mm (width) x 250 mm (height) x 2700 mm (length). The reinforcing bars with nominal diameter of 19 mm and Young’s modulus of 190 kN/mm2 were set at a depth of 210 mm from the extreme upper fiber. The tension reinforcement ratio is 1.16 %. The self-temperature compensated wire strain gauges were attached to the upper and bottom sides of the tension reinforcement at mid-span by which the reinforcement strain was measured until loading the beam. One prismatic specimen with the same cross-section as that of the RC beams was prepared for each mixture, as shown in Figure 2. In order to measure the free deformation, an embedded strain gauge with a reference length of 100 mm and an elastic modulus of 39 N/mm2 and a thermocouple were placed at the center of the specimens. The shrinkage/expansion strain of concrete was determined by subtracting thermal strain from measured strain, in which the coefficient of thermal expansion of concrete was assumed to be 10 x 10-6/oC. The measurement began immediately after the concrete was placed. In order to minimize the friction between the mold and concrete specimen, Teflon sheet of 1.0 mm thickness was placed at the bottom of the mold. Further, polystyrene board of 3 mm thickness was placed on both ends of the mold. The beam specimen mold was supplied with 0.1 mm thick polyester film on all surfaces. In addition, three cylindrical specimens of 100 x 200 mm for each mixture were prepared to measure the compressive strength and Young’s modulus, besides, three cylindrical specimens of 150 x 200 mm were also prepared for each mixture in order to measure the splitting tensile strength. The compressive strength, Young’s modulus, and the splitting tensile strength of concrete were measured in accordance with JIS A 1108, JIS A 1149, and JIS A 1113, respectively. After demolding, all the specimens were promptly sealed with a 0.05 mm thick aluminum adhesive tape to prevent evaporation
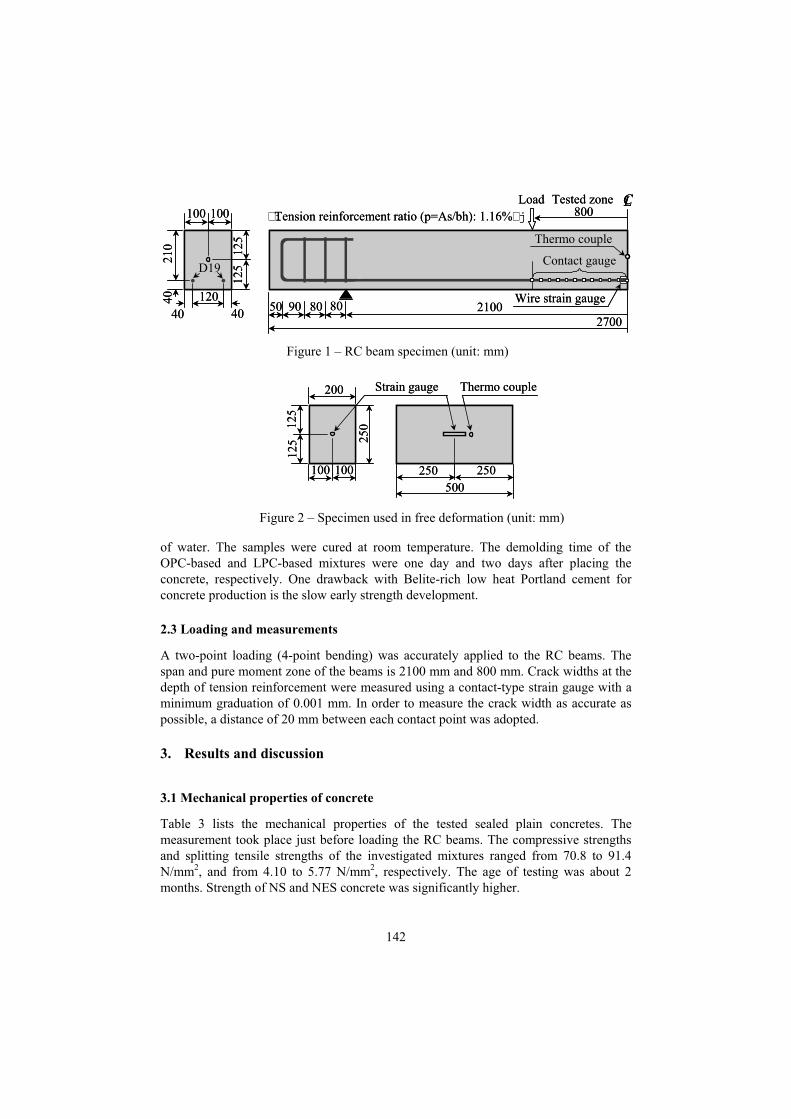
142
of water. The samples were cured at room temperature. The demolding time of the OPC-based and LPC-based mixtures were one day and two days after placing the concrete, respectively. One drawback with Belite-rich low heat Portland cement for concrete production is the slow early strength development.
2.3 Loading and measurements
A two-point loading (4-point bending) was accurately applied to the RC beams. The span and pure moment zone of the beams is 2100 mm and 800 mm. Crack widths at the depth of tension reinforcement were measured using a contact-type strain gauge with a minimum graduation of 0.001 mm. In order to measure the crack width as accurate as possible, a distance of 20 mm between each contact point was adopted.
3. Results and discussion
3.1 Mechanical properties of concrete
Table 3 lists the mechanical properties of the tested sealed plain concretes. The measurement took place just before loading the RC beams. The compressive strengths and splitting tensile strengths of the investigated mixtures ranged from 70.8 to 91.4 N/mm2, and from 4.10 to 5.77 N/mm2, respectively. The age of testing was about 2 months. Strength of NS and NES concrete was significantly higher.
125
CL
40
125
210
40
120
40
100
21002700
Thermo couple
�iTension reinforcement ratio (p=As/bh): 1.16%�j
Wire strain gauge
Tested zone
Contact gauge
Load
50 90 80 80
D19
800100
125
CLCL
40
125
210
40
120
40
100
21002700
Thermo couple
�iTension reinforcement ratio (p=As/bh): 1.16%�j
Wire strain gauge
Tested zone
Contact gauge
Load
50 90 80 80
D19
800100
Figure 1 – RC beam specimen (unit: mm)
100
Strain gauge Thermo couple
25012
5
100
200
125
250 250
500
100
Strain gauge Thermo couple
25012
5
100
200
125
250 250
500
Figure 2 – Specimen used in free deformation (unit: mm)

143
Table 3 - Mechanical properties of plain concretes just before loading the RC beamsDesignation NC NE NS NES LC LE LS LES
Loading age (days) 63 65 57 70 70 64 64 61 Compressive
strength (N/mm2)79.1 70.8 91.4 90.2 73.9 79.6 74.4 75.5
Young’s modulus (kN/mm2)
37.3 36.7 40.4 38.4 38.8 38.9 38.1 36.7
Splitting tensile strength (N/mm2)
4.77 5.07 5.47 5.77 4.58 4.50 4.16 4.10
3.2 Autogenous shrinkage/expansion properties
The experimental results on autogenous shrinkage/expansion strains for all the investigated mixtures are shown in Figure 3. The data are plotted as a function of temperature-adjusted concrete age calculated by the following equation (1) [12], that is, from the viewpoint of the hydration process:
n
1i 0ii
T/)t(T273
400065.13exptt (1)
where, t : temperature adjusted concrete age, it : number of days when a temperature T ( oC ) prevails, 0T =1 oC. OPC-based concretes containing expansive additive and/or shrinkage-reducing agent show a smaller autogenous shrinkage than that
-600
-400
-200
0
200
400
600
0.1 1 10 100 1000
NC
NE
NS
NES
LC
LE
LS
LES
Au
togen
ou
s sh
rin
ka
ge/e
xp
an
sion
str
ain
(x
10
-6)
Temperature adjusted concrete age (days)
(Shrinkage)
(Expansion)
Figure 3 – Autogenous shrinkage/expansion strain of concrete

144
of the reference NC mixture. The autogenous shrinkage observed with LC is markedly small when compared with that observed with NC; almost zero until the age of 100 days. LPC-based concretes that use expansive additive (LE and LES) show expansion rather than shrinkage even though there is no difference in unit content of expansive additive between the OPC-based and the LPC-based concretes. A synergistic effect of using both expansive additive and shrinkage-reducing agents was observed for the concrete with LPC cement; i.e., the compensation quantity in the strain of LES, which is 395 x 10-6,was more than the summation of those of LE and LS corresponding to 323 x 10-6 and 17 x 10-6, respectively, as shown in Table 4.
Table 4 - Restrained stress at extreme bottom fiber and autogenous strain just before loading
Designation NC NE NS NES LC LE LS LES Loading age (days) 63 65 57 70 70 64 64 61 Restrained stress
(N/mm2)1.27 0.11 1 -0.03 0.16 -1.45 -0.06 -1.52
Autogenous strain (x10-6)
-397 -174 -313 -175 -12 311 5 383
3.3 Restrained stress in RC beams
Figure 4 shows the restrained stress histories in concrete at the extreme bottom fiber due to the restraint of reinforcements, determined by equation (2). This equation is derived from the equilibrium of the force among concrete and reinforcement as well as Navier’s assumption, in which the stress is positive in tension and negative in compression.
�ssss EAP , �cc
gg
c
sc
A/I
)Ch)(Cd(1
A
P (2)
where, sP : axial force in reinforcement, sE : Young’s modulus of reinforcement, s :measured strain in reinforcement, sA : cross-sectional area of reinforcement, c :stress on the extreme bottom fiber, cI : moment of inertia of gross concrete section,
cA : cross-sectional area of concrete, d : effective depth, h : height of beam, and gC :distance from the extreme upper fiber to the centroid of the gross concrete section.
NC showed the highest tensile stress of about 1.3 N/mm2. On the other hand, the tensile stresses of NE, NES, LC, and LS were controlled to be negligible compared with that of NC. LE and LES showed restrained stress in compression of about 1.5 N/mm2. The tendency of compensation for restrained stress corresponds to the tendency of compensation for shrinkage strain. Thus, using Belite-rich low heat Portland cement, expansive additive, shrinkage reducing agent, or a combination of these is effective for compensating autogenous shrinkage and resultant induced stresses. Their effects on compensation of tensile stress are cumulative because their mechanisms are different and independent. The restrained stress just before loading is listed in Table 4.

145
3.4 Flexural cracking moment
Figure 5 shows the flexural cracking moments (Mcr), determined from the bending moment for a case where the deflection was changed obviously. The Mcr, calculated by using the measured splitting tensile strength and neglecting the restrained stress at the extreme bottom fiber, is shown in the same figure. The measured Mcr of the NC-RC beam is reduced to about 60% of that of the calculated Mcr. This means that the effect of autogenous shrinkage on Mcr cannot be ignored. On the other hand, the measured Mcrs of NE-, NES-, LC-, and LS-RC beams are approximately 1.5 to 2 times higher than that of the NC-RC beam, indicating a marked increase in Mcr caused by reducing autogenous shrinkage. This is the effect even though the difference in the calculated Mcrs among mixtures is considered. In the case of LE- and LES-RC beams with the compressive stress located at the extreme bottom fiber, the measured Mcr is increased to about 2.5 times of that of the NC-RC beam.
-2
-1
0
1
2
0.1 1 10 100
NC
NE
NS
NES
LC
LE
LS
LES
Rest
ra
ined
str
ess
at
ex
trem
e b
ott
om
fib
er
(N
/mm
2)
Temperature adjusted concrete age (days)
(Compression)
(Tension)
Figure 4 – Restrained stress in concrete at extreme bottom fiber

146
3.5 Crack width
Figure 6 shows the relationship between maximum crack width and stress in tension reinforcement calculated by conventional RC theory, neglecting shrinkage/expansion effects on crack width. The maximum crack widths calculated by using aforementioned reinforcement stress is also illustrated in the same figure. According to the results presented in the figure, it is confirmed that difference among mixtures on crack width is significant. The more shrinkage/expansion-restrained stress in tension reinforcement, the wider/smaller the maximum crack width can be measured in RC beams.
Figure 7 shows the maximum crack width and maximum crack spacing measured when the stress in tension reinforcement calculated by conventional RC theory is 200 N/mm2.
The maximum crack widths of low-shrinkage HSC-RC beams are reduced to about 20-40% of that of reference NC-RC beam, while the maximum crack spacing of the former are increased to approximately 10-40% of that of the latter. This result differs from the conventional concept; hence wider crack spacing results in a wider crack width. Thus, it can be demonstrated that the low-shrinkage HSCs are markedly effective for improving the cracking properties that declined due to autogenous shrinkage. In the range of this study, the combined use of Belite-rich low heat Portland cement and expansive additive is particularly effective for enhancing cracking performance.
0
0.5
1
1.5
2
2.5
3
NC NE NS NES LC LE LS LES
Measured valueCalculated value neglecting restrained stress
Ra
tio
of
flex
ura
l cra
ck
ing
mo
men
t (N
C=
1.0
)
Mixture
6.6kNm
11kNm
Figure 5 – Flexural cracking moment

147
0
0.05
0.1
0.15
0.2
0.25
0.3
0 100 200 300 400
NC
NE
NS
NES
LC
LE
LS
LES
Ma
xim
um
crack
wid
th (
mm
)
Reinforcement stress (N/mm2)
ConventionalRC theory
Figure 6 – Maximum crack width versus reinforcement stress based on conventional RC theory
0
0.2
0.4
0.6
0.8
1
1.2
1.4
1.6
NC NE NS NES LC LE LS LES
Maximum crack widthMaximum crack spacing
Ra
tio
of
ma
xim
um
crack
wid
th o
r c
rack
sp
acin
g
(N
C=
1.0
)
Mixture
Reinforcement stress=200N/mm2
0.16mm
165mm
Figure 7 – Maximum crack width and maximum crack spacing
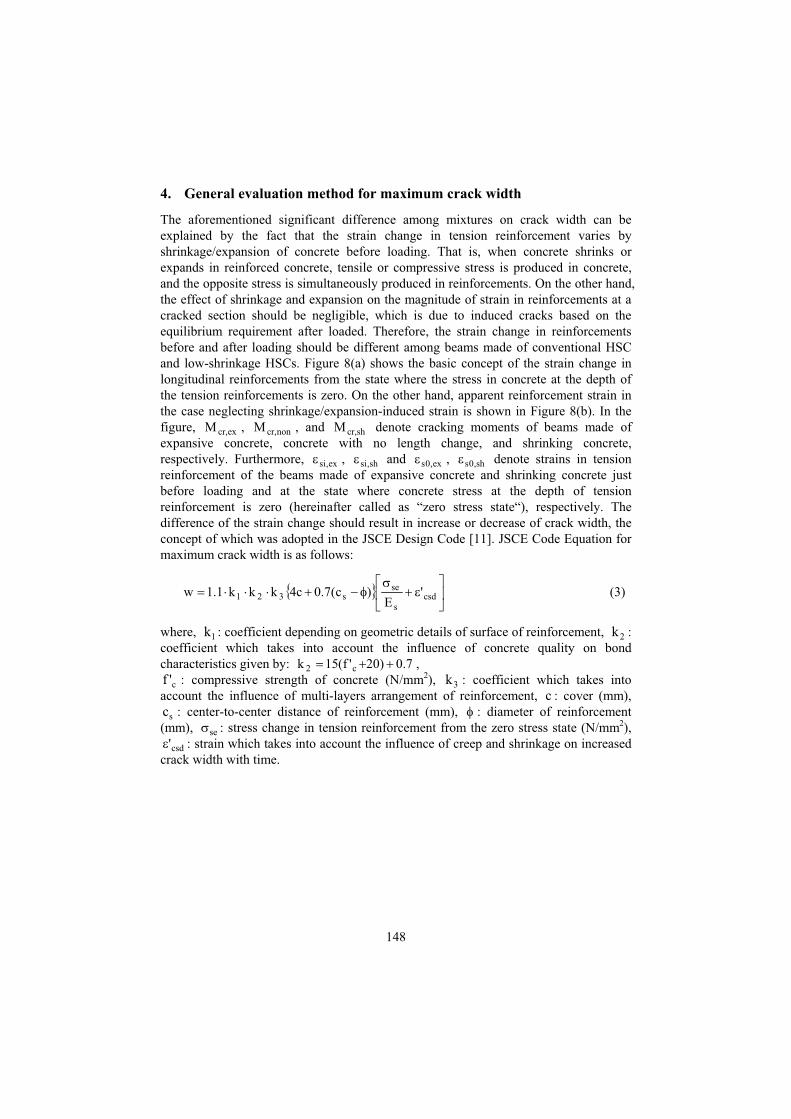
148
4. General evaluation method for maximum crack width
The aforementioned significant difference among mixtures on crack width can be explained by the fact that the strain change in tension reinforcement varies by shrinkage/expansion of concrete before loading. That is, when concrete shrinks or expands in reinforced concrete, tensile or compressive stress is produced in concrete, and the opposite stress is simultaneously produced in reinforcements. On the other hand, the effect of shrinkage and expansion on the magnitude of strain in reinforcements at a cracked section should be negligible, which is due to induced cracks based on the equilibrium requirement after loaded. Therefore, the strain change in reinforcements before and after loading should be different among beams made of conventional HSC and low-shrinkage HSCs. Figure 8(a) shows the basic concept of the strain change in longitudinal reinforcements from the state where the stress in concrete at the depth of the tension reinforcements is zero. On the other hand, apparent reinforcement strain in the case neglecting shrinkage/expansion-induced strain is shown in Figure 8(b). In the figure, excr,M , noncr,M , and M shcr, denote cracking moments of beams made of expansive concrete, concrete with no length change, and shrinking concrete, respectively. Furthermore, ex,si , sh,si and ex,0s , sh,0s denote strains in tension reinforcement of the beams made of expansive concrete and shrinking concrete just before loading and at the state where concrete stress at the depth of tension reinforcement is zero (hereinafter called as “zero stress state“), respectively. The difference of the strain change should result in increase or decrease of crack width, the concept of which was adopted in the JSCE Design Code [11]. JSCE Code Equation for maximum crack width is as follows:
csds
ses321 '
E)c(7.0c4kkk1.1w (3)
where, 1k : coefficient depending on geometric details of surface of reinforcement, 2k :coefficient which takes into account the influence of concrete quality on bond characteristics given by: 7.0)20'f(15k c2 ,
c'f : compressive strength of concrete (N/mm2), 3k : coefficient which takes into account the influence of multi-layers arrangement of reinforcement, c : cover (mm),
sc : center-to-center distance of reinforcement (mm), : diameter of reinforcement (mm), se : stress change in tension reinforcement from the zero stress state (N/mm2),
csd' : strain which takes into account the influence of creep and shrinkage on increased crack width with time.

149
Figure 9 shows the relationship between maximum crack width and stress change in tension reinforcement calculated by considering the aforementioned zero stress state; it is seen that the difference in the results between mixtures becomes small.
Figure 10 shows the comparison between measured maximum crack width and maximum crack width calculated by considering or neglecting the effect of restrained stress, when load-induced stress in tension reinforcement calculated by conventional RC theory is 200 N/mm2. The value of csd' , which the JSCE Code recommends to be 100 x 10-6 for long-term loading, is set to zero, considering the loading time in the present study. Further, Figure 11 shows the relationship between maximum crack width and reinforcement strain when the concrete stress at the depth of reinforcing bars change to be zero in order to make the effect of reinforcement strain accumulated before loading on crack width clear.
According to Figure 11, the measured values of maximum crack width proportionately change with a variation of accumulated reinforcement strain. In addition, it is obvious that this tendency on maximum crack width can well be evaluated by considering the strain change in reinforcing bars from the zero stress state. As a result, the ratios of maximum crack widths for the cases of considering and neglecting the restrained stresses are 1.1-1.5 and 1.0-2.0, respectively, as shown in Figure 10. Thus, it is demonstrated that crack widths of RC beams made of HSC have a shrinkage/expansion
Cracked section
Full section
Apparent steel strain
Expansion
Restrained stress intension
non,s
Expansion
No length change
Shrinkage
� œ� FStress in concrete at the depth of tension reinforcement is zero� ›� FStrain in tension reinforcement just before loading
Restrained stressin compression
Cracked section
M
ex,crM
non,crM
sh,crM
sh,s
non,s
ex,ssh,0s
ex,0ssh,si
ex,si sh,si-
ex,siexs0, -
sh,sishs0, -
Full section
ex,0M
sh,0M
Steel strain
Ben
ding
mom
ent
M
a,s
M
No length change
Shrinkage
s sh,si-
Cracked section
Full section
Apparent steel strain
Expansion
Restrained stress intension
non,s
Expansion
No length change
Shrinkage
� œ� FStress in concrete at the depth of tension reinforcement is zero� ›� FStrain in tension reinforcement just before loading
Restrained stressin compression
Cracked section
M
ex,crM
non,crM
sh,crM
sh,s
non,s
ex,ssh,0s
ex,0ssh,si
ex,si sh,si-
ex,siexs0, -
sh,sishs0, -
Full section
ex,0M
sh,0M
Steel strain
Ben
ding
mom
ent
M
a,s
M
No length change
Shrinkage
s sh,si-
(a) Considering length change (b) Neglecting length change Figure 8 – Concept of the effect of length change on strain change in reinforcement

150
before loading can be predicted with acceptable accuracy by applying the proposed concept of stress change in tension reinforcement.
0
0.05
0.1
0.15
0.2
0.25
0.3
0 100 200 300 400
NC
NE
NS
NES
LC
LE
LS
LES
Ma
xim
um
crack
wid
th (
mm
)
Reinforcement stress (N/mm2)
ConventionalRC theory
Figure 9 – Maximum crack width versus reinforcement stress based on the proposed concept
0
0.5
1
1.5
2
NC NE NS NES LC LE LS LES
Considering restrained stressNeglecting restrained stress
Ra
tio
of
ca
lcu
late
d W
max t
o m
aesu
red
Wm
ax
Mixture
Reinforcement stress=200N/mm2
Figure 10 – Effect of restrained-shrinkage/expansion stress on maximum crack width

151
5. Conclusions
The following conclusions can be drawn from the present study: 1. It is demonstrated that autogenous shrinkage of HSC can significantly affect the
cracking performances of the RC flexural members. 2. Low shrinkage-HSCs using Belite-rich low heat Portland cement and/or expansive
additive and/or shrinkage-reducing chemical agent can markedly improve the flexural cracking performances; the combined use of Belite-rich low heat Portland cement and expansive additive is particularly effective in enhancing cracking performance.
3. The flexural crack widths of the RC beams made with conventional HSC have a high autogenous shrinkage, LS-HSCs have a less autogenous shrinkage and also a potential of expansion can be integrally evaluated with acceptable accuracy by JSCE Code equation, which takes into account the strain change in the tension reinforcement from the state where the stress in concrete at the depth of tension reinforcements is zero.
References
[1] Paillere, A.M., Buil, M. and Serrano, J.J., Effect of Fiber Addition on the Autogenous Shrinkage of Silica Fume Concrete, ACI Materials Journal (1989),
0
0.05
0.1
0.15
0.2
0.25
0.3
-300 -200 -100 0 100 200 300
Measured valueCalculated value considering restrained stressCalculated value neglecting restrained stress
Ma
xim
um
crack
wid
th (
mm
)
Reinforcement strain at zero stress state (x10-6
)
Reinforcement stress=200N/mm2
(Shrinkage) (Expansion)
Figure 11 – Maximum crack width versus reinforcement strain at zero stress state

152
Vol.86, No.2, pp.139-144. [2] Tazawa, E. and Miyazawa, S., Autogenous Shrinkage of Cement Paste with
Condensed Silica Fume, Fourth CANMET/ACI International Conference on Fly Ash, Silica Fume, Slag, and Natural Pozzolans in Concrete (1992), Istanbul, Turkey, pp.875-894.
[3] Tazawa, E. and Miyazawa, S., Influence of Cement and Admixture on Autogenous Shrinkage of Cement Paste, Cement and Concrete Research (1995), Vol.25, No.2, pp.281-287.
[4] JCI, Autogenous Shrinkage of Concrete (ed. E. Tazawa), E & FN SPON (1999), London, pp.21-26.
[5] Sato, R., Tanaka, S., Hayakawa, T. and Tanimura, M., Experimental Studies on Reduction of Autogenous Shrinkage and Its Induced Stress in High Strength Concrete, Proceedings of the 2nd International Research Seminar on Self-Desiccation and Its Importance in Concrete Technology (1999), Lund, Sweden, pp.163-171.
[6] Kameta, S., Sato, R. and Abe, Y., Stresses at Joint Interface between Existing Continuously Reinforced Concrete Pavement and Overlay Concrete with Expansive Additive and Shrinkage Reducing Agent, 4th International Workshop on Design Theories and Their Verification of Concrete Slabs for Pavements and Rail Roads (2000), pp.305-320.
[7] Tanimura, M., Hyodo, H., Nakamura, H. and Sato, R., Effectiveness of Expansive Additive on Reduction of Autogenous Shrinkage Stress in High-Strength Concrete, Proceedings of the Third International Research Seminar on Self-Desiccation and Its Importance in Concrete Technology (2002), Lund, Sweden, pp.205-216.
[8] Tanimura, M., Sato, R., Shimoyama, Y. and Omori, H., Improvement of Flexural Behavior of Reinforced High Strength Concrete Members by Reducing Autogenous Shrinkage, Concrete Science and Engineering (2001), Vol.3, No.11, pp.179-184.
[9] Tanimura, M., Hiramatsu, Y., Hyodo, H. and Sato, R., Flexural Performance of RC Members Made of Low Shrinkage-High Strength Concrete, 6th International Symposium on Utilization of High Strength/High Performance Concrete (2002), Vol. 2, Leipzig, Germany, pp.1437-1452.
[10] Sato, R., Masaki, S., Hiramatsu, Y. and Kodama, K., Serviceability Performance Evaluation of Reinforced High Strength Concrete Beams, 2nd International Specialty Conference on the Conceptual Approach to Structural Design (2003), Cl-Premier, Italy, pp.763-770.
[11] Japan Society of Civil Engineers (JSCE), Standard specifications for design and construction of concrete structures (2002), pp.100-102. (in Japanese)
[12] CEB-FIP MODEL CODE, Thomas Telford (1990), pp.61-62.
153
THE EFFECT OF SPECIMEN SIZE ON THE SHRINKAGE
PROPERTIES OF HIGH PERFORMANCE CONCRETE
Min-Cheol Han, Cheon-Goo Han
Division of Architectural Engineering, Cheongju University, Cheongju, Republic of Korea
Abstract
This paper investigates experimentally the effect of specimens size on the drying and autogenous shrinkage of High Performance Concrete (HPC) incorporating fly ash (FA), silica fume (SF), expansive admixture (EA) and shrinkage reducing agent (SRA). Prism specimens were prepared with the size of 75×75×400 mm, 100×100×400 mm, 150×150×400 mm and 400×400×400 mm, respectively. Two types of HPC mixture incorporating OPC-FA-SF (control HPC) and FA-SF-EA-SRA (LSHPC) were fabricated, respectively. For the effect of specimen size on the drying shrinkage, an increase in specimen size resulted in a reduction in drying shrinkage due to the difficulty in water evaporation and water movement between concrete and exterior environment as a result of large section size, regardless of mixture type. LSHPC exhibited a smaller drying shrinkage than control HPC due to the coupled effect of expansion by EA and reduction of capillary pore pressure by SRA. On the other hand, for the effect of specimen size on the autogenous shrinkage, autogenous shrinkage may not be affected by the specimen size. This may be explained by the fact that autogenous shrinkage occurs without water movement between concrete and exterior environment. LSHPC exhibited smaller autogenous shrinkage than control HPC due to the contribution of EA and SRA to reduction of autogenous shrinkage.
1. Introduction
The demand for High Performance Concrete (HPC) has been gradually increased since its development. HPC can be defined as the concrete that achieves specific performance requirements involved with higher fluidity, higher strength and higher durability and HPC is highlighted as a new generation concrete from all over the world. HPC needs low water to cement ratio (W/C), high amount of cement and superplasticizer, which causes thermal cracking induced by excessive hydration heat, large drying and autogenous shrinkage. Autogenous shrinkage has emerged as one of the serious concerns to consider at the stage of design in HPC. In other words, due to the difficulty in preparing HPC with cement only, HPC involves incorporating supplementary mineral admixture such as fly ash (FA), ground granulated blast furnace slag (BS) and silica fume (SF) and employs the use of expansive admixture (EA) and shrinkage reducing admixture (SRA) to reduce drying and autogenous shrinkage. The authors reported the effect of combination of EA and SRA with specific proportion on reducing autogenous shrinkage of HPC [1], [3]. The results indicated that the combination of EA and SRA was of better effect on the achievement of the stability against shrinkage induced by drying and self desiccation than individual use.
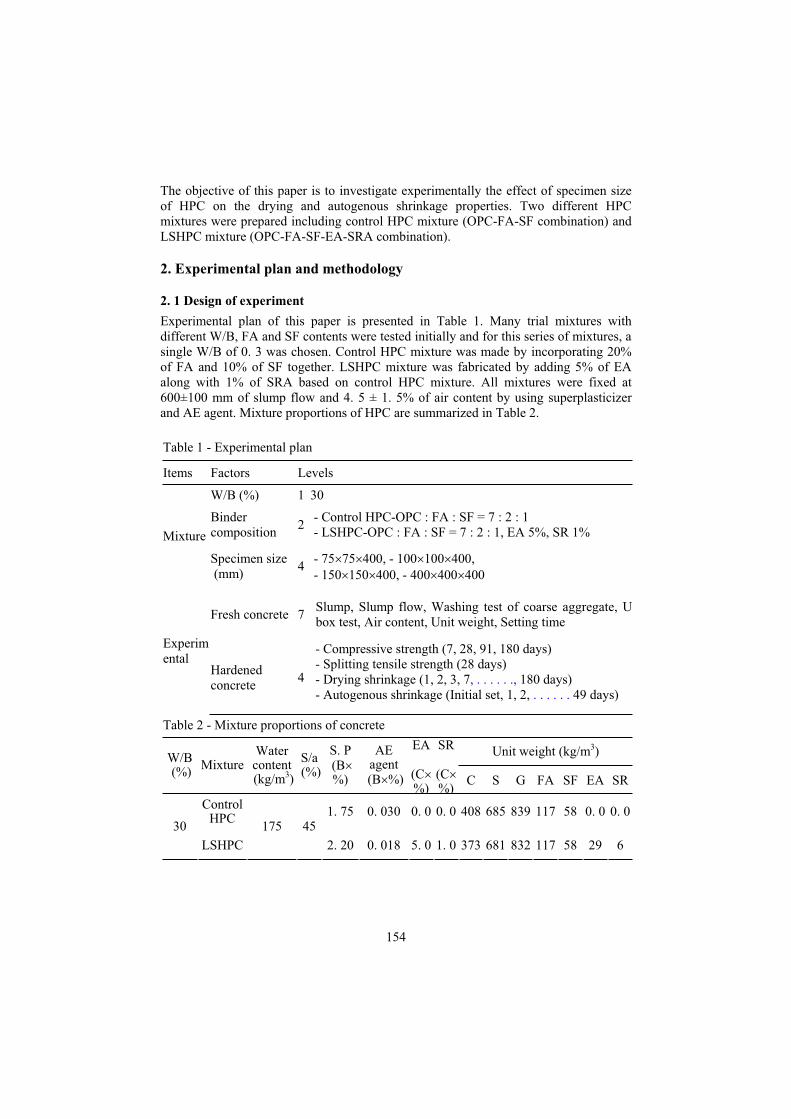
154
The objective of this paper is to investigate experimentally the effect of specimen size of HPC on the drying and autogenous shrinkage properties. Two different HPC mixtures were prepared including control HPC mixture (OPC-FA-SF combination) and LSHPC mixture (OPC-FA-SF-EA-SRA combination).
2. Experimental plan and methodology
2. 1 Design of experiment
Experimental plan of this paper is presented in Table 1. Many trial mixtures with different W/B, FA and SF contents were tested initially and for this series of mixtures, a single W/B of 0. 3 was chosen. Control HPC mixture was made by incorporating 20% of FA and 10% of SF together. LSHPC mixture was fabricated by adding 5% of EA along with 1% of SRA based on control HPC mixture. All mixtures were fixed at 600±100 mm of slump flow and 4. 5 ± 1. 5% of air content by using superplasticizer and AE agent. Mixture proportions of HPC are summarized in Table 2.
Table 1 - Experimental plan
Items Factors Levels
W/B (%) 1 30
Binder composition
2 - Control HPC-OPC : FA : SF = 7 : 2 : 1 - LSHPC-OPC : FA : SF = 7 : 2 : 1, EA 5%, SR 1% Mixture
Specimen size (mm)
4 - 75 75 400, - 100 100 400, - 150 150 400, - 400 400 400
Fresh concrete 7 Slump, Slump flow, Washing test of coarse aggregate, U box test, Air content, Unit weight, Setting time
Experimental
Hardened concrete
4
- Compressive strength (7, 28, 91, 180 days) - Splitting tensile strength (28 days) - Drying shrinkage (1, 2, 3, 7, . . . . . ., 180 days) - Autogenous shrinkage (Initial set, 1, 2, . . . . . . 49 days)
Table 2 - Mixture proportions of concrete
Unit weight (kg/m3)W/B (%)
Mixture Watercontent (kg/m3)
S/a (%)
S. P (B%)
AEagent
(B %)
EA
(C%)
SR
(C%)
C S G FA SF EA SR
Control HPC
1. 75 0. 030 0. 0 0. 0 408 685 839 117 58 0. 0 0. 0 30
LSHPC
175 45
2. 20 0. 018 5. 0 1. 0 373 681 832 117 58 29 6

155
2. 2 Materials
Cement used in this experiment was Ordinary Portland Cement (OPC) produced in Korea. River sand was used as fine aggregates produced in Chungnam and crushed stone with maximum size of 25 mm was used as coarse aggregates produced in Chungbuk in Korea. As mineral admixture, FA produced in Korea was used and SF produced in Norway was also used. As chemical admixtures, CSA based EA produced in Japan was used and Glycol based SRA produced in Germany was also used. Physical properties of materials are given in Table 3.
Table 3 - Physical properties of materials used
Materials Major properties
Cement Type : Ordinary Portland cementDensity : 3. 15 g/cm3
Blaine : 3,413 cm2/g
Fine aggregate River sandDensity : 2. 67 g/cm3
Fineness modulus : 2. 58
Coarse aggregate 25 mm crushed aggregate Density : 2. 67 g/cm3
Fineness modulus : 6. 87
Superplasticiser Naphthalene Based
AE agent Negative ion Based
Fly ash Density : 2. 22 g/cm3
Blaine : 3,850 cm2/g
Silica fume Density : 2. 20 g/cm3
Blaine : 240,000 cm2/g
Expansive additive CSA basedDensity : 2. 90 g/cm3
Shrinkage reducing agent Glycol basedDensity : 1. 02 g/cm3
2. 3 Test Method
Concrete was mixed in a forced horizontal pan type mixer. Slump test was carried out in accordance with Korean Industrial Standards (KS) F 2402. As for fresh concrete test, slump flow was measured at 5 minute after slump cone was withdrawn. Air content was measured in accordance with KS F 2421. Segregation resistance was evaluated using coarse aggregate washing test in accordance with Japanese Concrete Institute (JCI). U box filling test of HPC was performed according to the JCI. Setting time was measured according to KS F 2436. As for hardened concrete test, compressive strength specimens were prepared using 10×20 cm cylindrical moulds in accordance with KS F 2403 and splitting tensile strength was measured according to KS F 2423. Drying shrinkage was measured in accordance with KS F 2424. Autogenous shrinkage test was conducted by following JCI [2]. Four different size prisms were prepared to measure autogenous

156
shrinkage as well as drying shrinkage. To measure autogenous shrinkage, two studs for mounting a detachable mechanical gauge were glued 200 mm apart onto the two side surfaces for all the specimens. The autogenous shrinkage specimens were sealed with two layers of polyester film to prevent moisture loss from specimens. Measurements were conducted at the controlled room with a temperature of 20 ± 3 °C and a relative humidity of 60 - 80%. First measurement was taken approximately after initial setting completed because autogenous shrinkage is assumed to occur at the beginning of hydration reaction [2]. After final setting, specimens were demoulded and then were sealed with aluminium tape to prevent moisture movement from specimens. Mass loss was also measured to determine the termination of autogenous shrinkage measurement in accordance with JCI. Namely, according to JCI, it is stipulated that measurement of autogenous shrinkage can be terminated if mass loss of specimens exceeds above 0. 05% of its initial value [2]. Figure 1 shows the test set up for monitoring autogenous shrinkage. Autogenous shrinkage was measured using both length change and embedded strain gauge.
Gauge setup to measure autogenous shrinkage
Data logging for autogenous shrinkage data using embedded strain gauge
Figure 1 - Test setup to monitor autogenous shrinkage
3. Results and discussion
3. 1 Properties of fresh concrete
Table 4 summarized the test results at fresh state of control HPC mixture and LSHPC mixture, respectively. Both mixtures were carried out to achieve the target slump flow and air content with 600±100 mm and 4. 5±1. 5% by trial batch. The test results mentioned above were obtained based on the mixture adjustment by using superplasticiser and AE agent to achieve the same target slump flow. The effect of superplasticiser on the slump flow of LSHPC and control HPC is presented in Figure 2. Based on trial batches, when the same amount of superplasticiser with control HPC was added to LSHPC, LSHPC exhibited a reduction in slump flow, which was not satisfied with target slump flow compared with that of control HPC. Thus, an increase in dosage of superplasticiser was required to achieve target slump flow in LSHPC. In Figure 3, the relationships between AE agent and air content of each mixture are illustrated. LSHPC needed to reduce a dosage of AE agent due to comparably larger air content than target value.
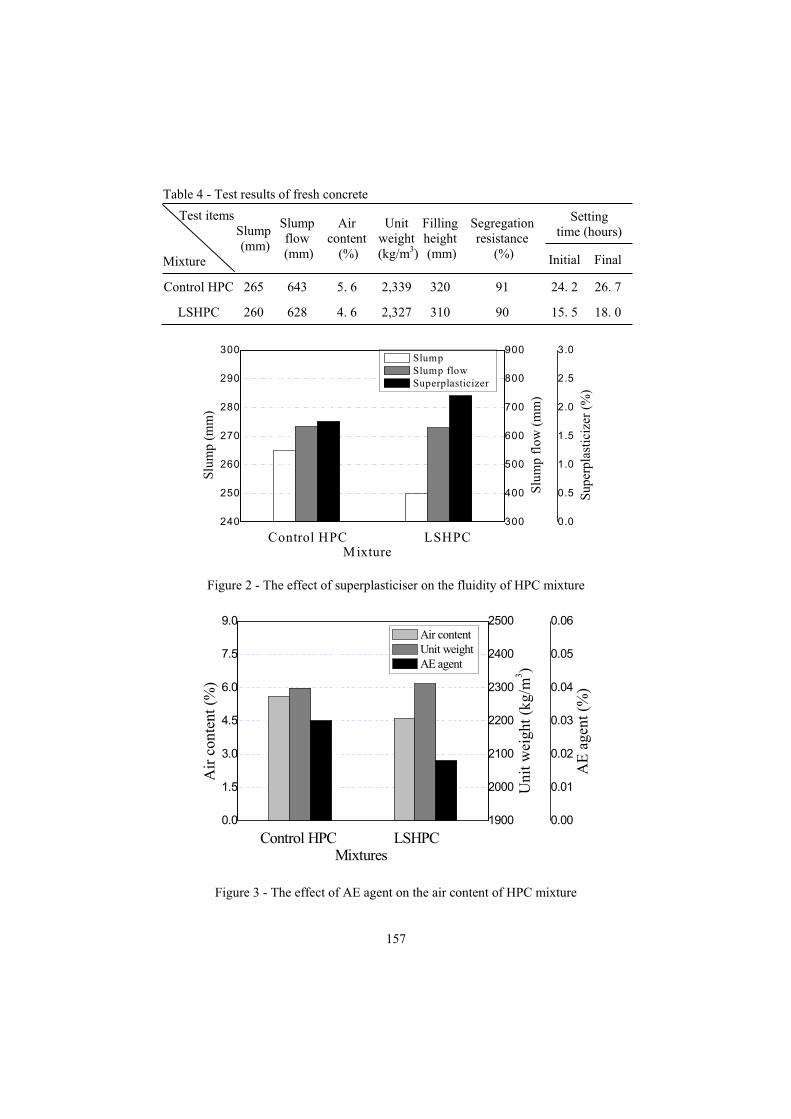
157
Table 4 - Test results of fresh concrete
Setting time (hours)
Test items
Mixture
Slump (mm)
Slump flow
(mm)
Aircontent
(%)
Unit weight
(kg/m3)
Filling height (mm)
Segregationresistance
(%) Initial Final
Control HPC 265 643 5. 6 2,339 320 91 24. 2 26. 7
LSHPC 260 628 4. 6 2,327 310 90 15. 5 18. 0
0.0
0.5
1.0
1.5
2.0
2.5
3.0
0.0
0.5
1.0
1.5
2.0
2.5
3.0
240
250
260
270
280
290
300
Control HPC LSHPC
Slu
mp
(mm
)
M ixture
Slump Slump flow Superplasticizer
300
400
500
600
700
800
900
Slu
mp
flow
(m
m)
Sup
erpl
asti
cize
r (%
)Figure 2 - The effect of superplasticiser on the fluidity of HPC mixture
0.0
1.5
3.0
4.5
6.0
7.5
9.0
Control HPC LSHPC
Air
con
tent
(%
)
Mixtures
Air content Unit weight AE agent
1900
2000
2100
2200
2300
2400
2500
Uni
t w
eigh
t (k
g/m
3 )
0.00
0.01
0.02
0.03
0.04
0.05
0.06
AE
age
nt (
%)
Figure 3 - The effect of AE agent on the air content of HPC mixture

158
For U box filling height, the results meet the minimum value, regardless of mixture type. The ratio of resistance to segregation obtained from the wash test of aggregates in given mixture exhibited above 90%, regardless mixture type. For setting time, it took between 24. 2 hours and 26. 7 hours to reach initial and final setting in control HPC mixture, which was retarded markedly by as much as 10 hours compared with that of normal concrete. Excessive dosage of superplasticizer with 2. 20% to achieve target slump flow which delays the hydration may be responsible for remarkable setting retard of control HPC mixture. LSHPC mixture also needs more than 15. 2 to 18. 0 hours to achieve initial and final setting. Hence, LSHPC had much faster setting time than control HPC by as much as 6 hours. This can be explained that CSA based EA contributes to accelerate setting time by helping OPC make hydration product effectively at early stage.
3. 2 Properties of hardened concrete
Figure 4 presents the results of compressive strength and splitting tensile strength between LSHPC and control HPC with age. Compressive strength of both mixtures exhibited more than 40 MPa at 7 days, 60 MPa at 28 days and 70 MPa at 91 days, respectively. As expected, LSHPC showed higher compressive strength than control
0
20
40
60
80
100
Com
pres
sive
str
engt
h (M
Pa) Adge (days)
7days 28days 9days
0
2
4
6
8
10
Spl
itti
ng t
ensi
le s
tren
gth
(MP
a)
Control HPC LSHPC
Mixture
28days
Figure 4 - Compressive strength and splitting tensile strength with mixture type

159
HPC. This is due to the contribution of comparably larger hydration product by CSA based EA to the formation of dense microstructure. Tensile strength showed similar tendency with compressive strength. The ratio of tensile strength to compressive strength is about 8~10%.
3. 3 Effect of specimen size on the shrinkage properties
3. 3. 1 Drying shrinkage
Figures 5 and 6 present the effect of specimen size on the length change by drying shrinkage and mass loss with age, respectively. Specimens were cured in water for first
7 days and then moved to air chamber controlled with 20 3 °C of curing temperature
and 60 10% of R. H. Both control HPC and LSHPC exhibited swelling within first 7 days of immersion in water and then, they began to shrink after moving to air curing chamber. The larger the size of specimens was, the smaller the swelling was during immersion in water. Furthermore, shrinkage was observed to occur with specimen of
400 400 400 mm in size even within first 7 days of water curing. This can be explained that larger section of high performance concrete makes it difficult to progress water movement between the surface of concrete and exterior environment and self desiccation by hydration reaction occurred. Under the air curing condition, an increase in specimen size led to a decrease in drying shrinkage and mass loss due to less water evaporation from specimen mass. LSHPC exhibited a larger swelling than control HPC within first water curing period as a result of the use of EA. After water curing, LSHPC had less shrinkage than control HPC by as much as 40%. This is due to the coupled effect of larger expansion at early stage by EA and decreased capillary pore tension by SRA.

160
-800
-600
-400
-200
0
200
400
600
0 30 60 90 120 150 180-800
-600
-400
-200
0
200
400
AirWater
Control HPC
Dyi
ng s
hrin
kage
(x1
0-6)
Specimen size (cm)
7.5*7.5*40
10*10*40
15*15*40
40*40*40
AirWater
Dyi
ng s
hrin
kage
(x1
0-6)
Age (days)
LSHPC
Figure 5 - Drying shrinkage with age

161
-5
-4
-3
-2
-1
0
1
2
0 30 60 90 120 150 180-5
-4
-3
-2
-1
0
1
2
AirWater
Control HPC
Mass loss (
%)
Specimen size (cm)
7.5*7.5*40
10*10*40
15*15*40
AirWater
Mass loss (
%)
Age (days)
LSHPC
Figure 6 - Mass loss with specimen size and specimen size and age
3. 3. 2 Autogenous shrinkage
Figure 7 shows the effect of specimen size and method of measurement on the autogenous shrinkage of LSHPC and control HPC with age. Control HPC had a drastic shrinkage within first 3 days and then it showed slow tendency in shrinkage. Although autogenous shrinkage increased slightly with an increase in specimen size, it appears that the slight increase in autogenous shrinkage with the increase of specimen size may be negligible and be attributed to the presence of error in measuring the readings of autogenous shrinkage. Accordingly, it appeared that autogenous shrinkage was probably not affected by the specimen size. LSHPC had a swelling within first 7 days due to the contribution of CSA based EA, regardless of specimen size. After 7 days, shrinkage was observed. The amount of autogenous shrinkage of LSHPC was half of that of control HPC. The specimen size of LSHPC probably did not affect autogenous shrinkage as well.

162
-800
-600
-400
-200
0
200
400
600
-800
-600
-400
-200
0
200
400
0 7 14 21 28 35 42 49 56
Control HPC
Aut
ogen
ous
shri
nkag
e (x
10-6)
Strain gauge method 75*75*400 100*100*400 150*150*400 400*400*400
Dial gauge method 75*75*400 100*100*400 150*150*400 400*400*400
Aut
ogen
ous
shri
nkag
e (x
10-6) LSHPC
Age (days)
Figure 7 - Autogenous shrinkage with specimen size and age
As for mass loss of control HPC and LSHPC, an increase in specimen size resulted in a decrease in mass loss with elapse of age. According to the JCI, it is stipulated that the amount of autogenous shrinkage can be negligible if mass loss reaches above 0. 05% of its initial value. After 49 days since first measurement, many readings on mass loss exceeded the limit value by JCI. Hence, autogenous shrinkage readings after 49 days were not included in this paper. For the effect of measuring method on autogenous shrinkage, although autogenous shrinkage readings by dial gauge exhibited slightly higher than those by embedded strain gauge, difference in readings of autogenous shrinkage between using dial gauge and embedded strain gauge could be negligible because its difference was attributed to measuring error, regardless of specimen size, as seen in Figure 8.

163
0
-100
-200
-300
-400
-500
100 0 -100 -200 -300 -400 -500100
0
-100
-200
-300
-400
-500
Control HPCS
trai
n ga
uge
met
hod
Y=-31.486+0.81745*X (R=0.9605)
Str
ain
gaug
e m
etho
d
LSHPC
Dial gauge method
Y=15.68565+0.89605 (R=0.95419)
Figure 8 – Comparison of shrinkage readings between by strain gauge and dial gauge
4. Conclusion
This paper investigated experimentally the effect of specimen size on the shrinkage properties of HPC. Followings could be drawn as conclusion:
1) LSHPC needed high dosage SP agent due to less fluidity than that of control HPC, while it required less dosage of AE agent due to increased air content. The segregation resistance index of LSHPC exhibited above 90% and setting time of LSHPC accelerated as a result of CSA based EA.
2) LSHPC achieved beyond 70 MPa of compressive strength at 91 days. This is due to the contribution of CSA based EA to improve microstructure of concrete by helping the formation of hydration product effectively.
3) The larger the specimen size was, the smaller the drying shrinkage was. This is because larger section of specimen hinders water movement between concrete and exterior environment and self desiccation occurs. LSHPC had a larger

164
swelling than control HPC during first water curing period, and it had less drying shrinkage than control HPC at air curing.
4) It appeared that autogenous shrinkage was probably not affected by specimen size. Remarkable difference in readings of autogenous shrinkage was not found between measuring method (dial gauge method and embedded strain gauge). Autogenous shrinkage of LSHPC exhibited half of that of control HPC due to combined effect of EA and SRA.
References
[1] Han, C. G., Kim, S. W., Koh, K. T., Han, M. C., Fundamental Properties and Autogenous Shrinkage of High Performance Concrete with the Combination of Expansive Additives and Shrinkage Reducing Admixture, Journal of KCI, Vol. 16,No. 5, 605~612 (2004).
[2] Japanese concrete Institute, Technical Report on Autogenous Shrinkage of Concrete, JCI, 1~111 (2002).
[3] Han, C. G., Bahn, H. Y., Cheon, B. C., Hong, S. H., A Study on the Properties of High Performance Concrete with CSA Expansive Additive and Mineral Admixture, Journal of KCI, Vol. 11, No. 1, 141~148 (1998).
[4] Bentz, D. P., Jensen, O. M., Hansen, K. K., Olsen, J. F., Stang, H., Haecker, C. -J., Influence of Cement Particle Size Distribution on Early Age Autogenous Strain and Stress in Cement-Based Materials, Journal of American Ceramic Society, Vol. 84, No. 1 (2001).
[5] Persson, B., Experimental Studies on Shrinkage of High Performance Concrete, Cement and Concrete Research, Vol. 28, No. 7, 1023~1036 (1998).
[6] Holt, E., Contribution of Mixture Design to Chemical and Autogenous Shrinkage of Concrete at Early Ages, Cement and Concrete Research, Vol. 35, 464~472 (2005).
[7] Yang, Y., Sato, R., Kawai, K., Autogenous Shrinkage of High-Strength Concrete Containing Silica Fume under Drying at Early Ages, Cement and Concrete Research, Vol. 35, 449~456 (2005).
[8] Tazawa, E., Miyazawa, S., Experimental Study on Mechanism of Autogenous Shrinkage of Concrete, Cement and Concrete Research, Vol. 18, No. 8, 1633~1638 (1995).

165
MICROCRACK DETECTION IN HIGH-PERFORMANCE
CEMENTITIOUS MATERIALS
Pietro Lura1, Ye Guang2, Kyoji Tanaka3, and Ole Mejlhede Jensen1
1Technical University of Denmark, Lyngby, Denmark 2Delft University of Technology, Delft, The Netherlands 3Tokyo Institute of Technology, Yokohama, Japan
Abstract
Detection and quantification of microcracks caused by restrained autogenous shrinkage in high-performance concrete is experimentally difficult. Available techniques either lack the resolution needed to detect the microcracks or they may require sample preparation that causes further cracking indistinguishable from the original cracks. A new technique presented in this paper allows detection of microcracks in cement paste while avoiding artefacts induced by unwanted restraint, drying or temperature variations. The technique consists of casting small circular cylindrical samples of high-performance cement pastes in silicone moulds. Steel rods with different diameters are cast into the cement paste to restrain the autogenous shrinkage and cause crack formation during hardening. Subsequent gallium intrusion allows controllable impregnation of the formed cracks in the cement paste. The intruded crack size is determined by the applied intrusion pressure; after solidification of the gallium, the crack pattern is frozen and can be analyzed after plane polishing of the samples. The microcracks are identified by optical microscopy and scanning electron microscopy, SEM.This paper is a progress report about applicability and potentialities of the gallium-intrusion technique. Preliminary results of microcrack detection in cement pastes with different autogenous shrinkage are shown; a more detailed analysis will follow.
1. Introduction
A characteristic feature of modern, high-performance concrete is a low porosity and a discontinuous capillary pore structure of the cement paste. This is obtained by keeping a low water/cement ratio (w/c) and by adding silica fume. Modern concretes possess some advantageous properties compared to traditional concrete, such as good workability, high strength from early ages, low permeability, and improved durability. However, these types of concrete also possess some problematic properties, such as autogenous strain. Autogenous strain is the bulk strain of a closed, isothermal cementitious material system not subjected to external forces [1]. Autogenous strain is thus the self-created strain of a cement paste, mortar or concrete during hardening. In traditional concretes, autogenous shrinkage strain is generally negligible [2] whereas it may be significant – up to 50 times higher – in modern concretes [1]. Restraint of the autogenous strain due to aggregate particles or adjoining structural members is unavoidable in concrete structures and may result in formation of micro and macro cracks. Such cracks constitute a serious problem for strength, durability and aesthetics. In particular, eigenstresses developing around aggregates in hardening high-performance concrete may lead to diffuse microcracking in the cement paste [3, 4].

166
Considering a simplified 2-dimensional system with a circular aggregate embedded in a uniform, infinite matrix, as the cement paste shrinks due to self-desiccation, the aggregates are compressed hydrostatically, while the cement paste is compressed radially and develops tensile stresses in the tangential direction [4]. These stresses may lead to crack formation when the tensile strength is exceeded. In the present study, microcrack formation due to autogenous shrinkage is studied by means of a simplified, 2-dimensional model. Circular cylindrical samples of high-performance cement pastes, 10-mm in diameter and 12-mm thick, are cast in flexible moulds that exert minimal external restraint. Coaxial cast-in steel rods restrain the autogenous shrinkage and lead to crack formation; the rods have three different diameters to observe the influence of the size of the restraining inclusion on crack formation. Dimensions of the steel rods are chosen to be comparable with the maximum aggregate size of an ultra-high-performance concrete. Steel was preferred to rock because the mechanical properties and surface characteristic of steel are more defined and reproducible. Three widely different cement pastes were used: 2 high-performance cement pastes with low w/c and silica fume addition, one with the addition of superabsorbent polymers, SAP, and a plain cement paste of higher w/c. A central element in this study is the technique used to detect microcracks. It requires special precautions to maintain the sample in autogenous conditions, i.e., constant temperature, no moisture loss, and no external restraint, throughout the whole preparation procedure. Conventional techniques based on crack impregnation typically require drying of the samples, which may introduce further cracks [3]. On the other hand, direct observation of microcracking in an environmental scanning electronic microscope influences the moisture condition of the sample [5]. Other non-destructive techniques, such as x-ray tomography, do not allow sufficient resolution of microcracks and do not generally allow control of temperature and moisture conditions during the measurement. The gallium-intrusion technique was originally developed to study porosity and pore-size distribution of cement paste [6]. This technique is in the present study applied to investigate microcracking due to autogenous shrinkage, because it allows fast and controllable impregnation of cracks in the virgin cement paste. After solidification of the gallium, the crack pattern due to autogenous shrinkage is frozen and can be analyzed with a number of techniques, including optical microscopy, electron probe micro analysis, EPMA, and scanning electron microscopy, SEM. All of these techniques ensure distinct contrast between gallium and the surrounding material and a µm-resolution. This research takes a starting point in work carried out at the Tokyo Institute of Technology [7], which showed encouraging preliminary results. The present study aims at improving the intrusion technique, subsequent sample preparation and methods to examine the gallium-intruded cracks. A few examples of microcrack detection in cement pastes with different autogenous shrinkage are shown; more results and a detailed analysis will follow in a later paper.
167
2. Materials and methods
2.1 Cement pastes
The following cement paste compositions were investigated: A: w/c=0.35, 0% silica fume; B: w/c=0.30, 20% silica fume addition; C: w/c=0.30, 20% silica fume addition, 0.6% superabsorbent polymer, SAP, by weight of cement. The cement used is a low-alkali Danish white Portland cement from Aalborg Portland, with Blaine fineness 420 m2/kg. The Bogue phase composition (in wt.%) is: C3S: 66.1,
C2S: 21.2, C3A: 4.3, C4AF: 1.1, C S : 3.5, free CaO: 1.96, Na2O eq.: 0.17. The silica fume was added as a dry powder at a rate of 20 wt.% of cement. The BET specific surface of the silica fume is 17.5 m2/g. The chemical composition is (in wt.%): SiO2: 94.1, Fe2O3: 1.00, Al2O3: 0.13, MgO: 0.71, SO3: 0.43, and Na2O eq.: 1.09. In pastes B and C, a naphtalene-based dry powder superplasticizer is added at a rate of 1.0 wt.% of cement+silica fume. The SAP used are suspension-polymerized covalently cross-linked acrylamide/acrylic acid copolymers. The spherical particles were about 100-150 µm in the dry state. The size of the swollen SAP particles in the cement pastes and mortars is about three times larger due to pore fluid absorption. The dry SAP was added at a rate of 0.6 wt.% of cement. The cement pastes were mixed in a 5-l epicyclic mixer. Total mixing time from first water addition was 5 minutes. Initially, cement and other admixtures were put into the bowl. Mixing was done at low speed for 1 minute, while gradually adding about 3/4 of the demineralised water; it continued at high speed for 1 minute, after which it was stopped and the paste was scraped off from blade and walls of the bowl for 1 minute. Mixing was resumed for 1 minute at low speed while the rest of the water was added; a last minute of mixing at high speed followed.
2.2 Autogenous relative humidity
Autogenous relative humidity (RH) of cement paste was measured by Rotronic Hygroscope DT (Rotronic, Basserdorf, Switzerland) stations equipped with WA-14TH and WA-40TH measuring cells (Figure 1), which were built into a thermostatically controlled box. The temperature during the experiment was maintained at 32±0.2°C. Measurements were automatically data-logged every 15 minutes. Before and after every experiment, the equipment was calibrated with saturated salt solutions in the range 75–100% RH. The measuring accuracy is ±1% RH.
2.3 Linear autogenous strain
Linear autogenous strain of cement pastes was measured by a specially developed measuring technique, where the cement paste is encapsulated in thin, corrugated polyethylene moulds with length:diameter ratio of approximately 300:30 mm [8]. The technique ensures insignificant restraint of the hardening cement paste and permits measurements to start at 30 minutes after water addition. The cement paste was cast under vibration into the moulds; the specimens were then placed in a dilatometer equipped with electronic linear displacement transducers (Figure 2). The dilatometer with samples was immersed into a temperature-controlled glycol bath at 32±0.1 C.

168
Measurements with the dilatometer have shown good repeatability; measuring accuracy is ±5 m/m. Autogenous strain measurements started 30 minutes after water addition and were automatically data-logged every 15 minutes.
Figure 1 – Rotronic Hygroscope DT station for measurements of autogenous relative humidity of cement pastes.
Figure 2 – Dilatometer with corrugated moulds for measurements of autogenous strain of cement pastes.
2.4 Samples for crack detection
Cement pastes samples with different restraint conditions were studied: 1) unrestrained; 2) Ø1.5 mm cast-in steel rod; 3) Ø3 mm cast-in steel rod; 4) Ø6 mm cast-in steel rod. The first type of samples deformed freely apart form internal, self-restraint due to e.g. unhydrated cement particles. In the other samples, internal restraint was induced by means of a cast-in longitudinal stainless steel rod in the centre of the specimen. During hardening, the steel rod induced restraint and, potentially, crack formation in the cement paste [4]. Three different diameters of steel rods were used, since cracking may only be initiated beyond a certain minimum size of the inclusion [3]. Stainless steel was preferred to avoid rust formation and to minimize bond with the cement paste; a good surface bond would in fact reduce the crack opening at the interface [4]. The cement pastes studied should harden with a minimum of external restraint. This was ensured by specially-produced 0.5-mm-thick moulds of silicone rubber (Figure 3). The very low elastic modulus and thinness of the silicone rubber guaranteed insignificant restraint from the mould. Moreover, the cement pastes do not bind to the silicone rubber, i.e. in the case of autogenous shrinkage the cement pastes would automatically be disengaged from the mould. The cement pastes were cast directly into the moulds, resulting in samples with diameter 10 mm and height about 12 mm (Figure 4). The small sample size was selected to minimize temperature gradients and external restraint during hardening. On the other hand, the small size made the samples more delicate to produce and more sensitive to moisture loss. The newly cast samples were stored in small, sealable glass containers, of volume about 8 cm3 (Figure 5); they were kept for 1 month in a temperature controlled box at 32±0.2°C, i.e. slightly above the melting point of gallium, 29.8°C. A few minutes before the gallium intrusion, the sealed containers with samples were moved to a temperature controlled room at 32±0.5°C.
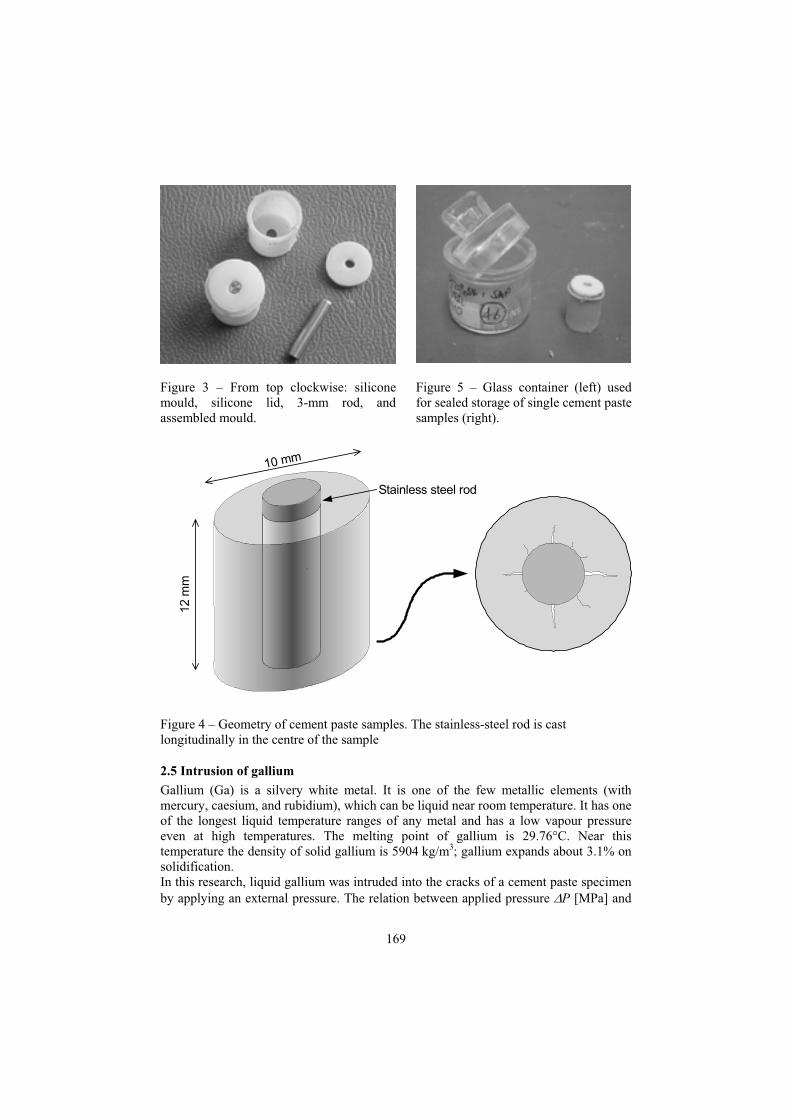
169
Figure 3 – From top clockwise: silicone mould, silicone lid, 3-mm rod, and assembled mould.
Figure 5 – Glass container (left) used for sealed storage of single cement paste samples (right).
Stainless steel rod
12 m
m
10 mm
Figure 4 – Geometry of cement paste samples. The stainless-steel rod is cast longitudinally in the centre of the sample
2.5 Intrusion of gallium
Gallium (Ga) is a silvery white metal. It is one of the few metallic elements (with mercury, caesium, and rubidium), which can be liquid near room temperature. It has one of the longest liquid temperature ranges of any metal and has a low vapour pressure even at high temperatures. The melting point of gallium is 29.76°C. Near this temperature the density of solid gallium is 5904 kg/m3; gallium expands about 3.1% on solidification. In this research, liquid gallium was intruded into the cracks of a cement paste specimen by applying an external pressure. The relation between applied pressure P [MPa] and

170
intruded pore diameter d [m] can be described by the Washburn equation [9], based on a model of cylindrical pores intruded by a non-wetting liquid:
P
cosd
4 (1)
where [N/m] is the surface tension of the gallium and [ ] is the contact angle between the liquid gallium and the solid surface, in this case cement paste.The surface tension of liquid gallium measured at 30°C varies from 0.704 to 0.725 N/m according to different authors [10]. In this research, a value of 0.716 N/m was used. The contact angle between liquid gallium and cement paste is about 130° [6]. Results of eq.(1) are plotted in Figure 6. Based on Figure 6, an intrusion pressure of 1.6 MPa was used for the cement paste samples, which enables filling pores that are connected to the surface with a diameter larger than 1.2 µm. After 1 month of hardening in sealed conditions, the rubber moulds were removed and the cement-paste samples were embedded in liquid gallium within a few seconds. Subsequently, the gallium was intruded into the samples with glycerol as a pressure-transmitting medium. The pressure was kept constant while gallium intruded the microcracks in the samples; the gallium intrusion is expected to reach equilibrium within about 1 minute, cf. mercury intrusion experiments reported in the literature [11]. Due to thermal inertia it took several minutes to cool the intrusion unit below the freezing point of gallium. After 10 minutes, water at 22 C was poured around the intrusion unit, leading to solidification of the gallium within 5 minutes. Once the temperature was lowered and the gallium had solidified in the cracks, the specimens could be stored in any condition, provided the temperature did not rise beyond the melting point of gallium. The intrusion procedure is illustrated in Figure 7.
0.01
0.1
1
10
0.1 1 10 100
Intrusion pressure [MPa]
Po
re d
iam
ete
r [µ
m]
1.2 µm
1.6 MPa
Figure 6 – Relationship between intrusion pressure for liquid gallium and intruded pore sizes in cement paste.

171
Glycerol
32°C
Gallium1
Water
22°C
2 3
Cement
pasteCement
paste
W=78 kg
(p=1.6 MPa)
W=78 kg
(p=1.6 MPa)
Figure 7 – Schematics of gallium intrusion, illustrating the 3-step process: 1) gallium is poured over the sample in a silicone container; 2) the silicone container is introduced in the intrusion unit and pressure is applied; 3) cold water is poured on the intrusion unit leading to solidification of the gallium.
2.6 Techniques for quantification of cracks
The gallium-intruded samples were cast into epoxy resin and ground and polished until the end surface of the cement paste was laid open. The polished surfaces of the impregnated samples were examined by two different methods: 1) Optical microscope analysis was performed with a Nikon stereo microscope with magnification between 10 and 63 times. Digital images were captured using a Nikon DN camera mounted on the stereo microscope. A global view of the sample was taken first, with a resolution of about 10 m, followed by details of cracks or other features on the samples, with maximum resolution about 1.5 m. The optical microscope has sufficient resolution to study the relevant microcracks in the present project. However, detection of gallium in the cracks was based only on colour differences and was difficult in the case of the smaller cracks. 2) Backscattered electron (BE) imaging was performed with an environmental scanning electron microscope, ESEM. Cement paste, steel rod and gallium were mapped on the end surfaces of the samples. The brightness in the BE image is dependent on the average atomic number (Z) of the single phases. Higher Z phases appear brighter than lower Z phases. For the samples examined, the steel rod and the gallium appear brightest, followed by the cement paste. Porosity filled with embedding epoxy resin appears dark. Recognition of the single materials might in case of doubt be helped by energy dispersive x-ray (EDAX), also provided by the instrument. Low resolution images of the sample were first scanned for cracks; subsequently, higher magnification pictures were taken of the cracks intruded with gallium. Melting of the gallium during observation was avoided by using a low acceleration voltage of 10 KV in the water vapour mode. The temperature in the sample chamber was lower than 20 C.
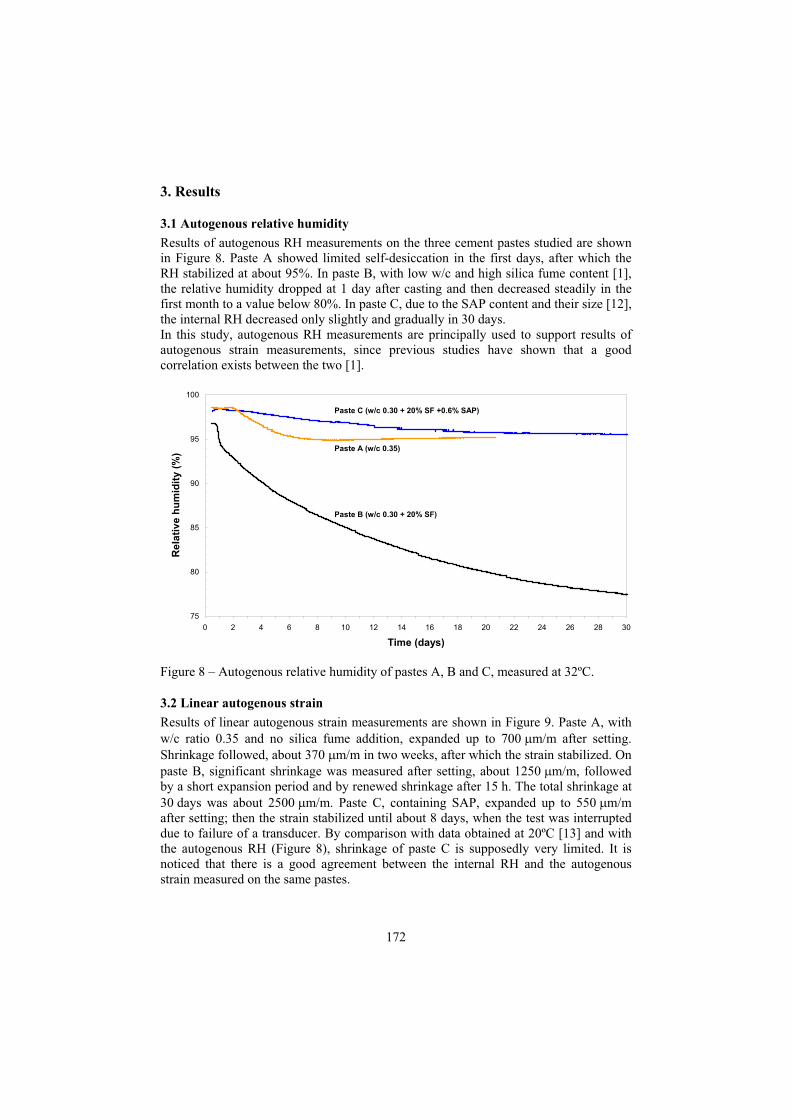
172
3. Results
3.1 Autogenous relative humidity
Results of autogenous RH measurements on the three cement pastes studied are shown in Figure 8. Paste A showed limited self-desiccation in the first days, after which the RH stabilized at about 95%. In paste B, with low w/c and high silica fume content [1], the relative humidity dropped at 1 day after casting and then decreased steadily in the first month to a value below 80%. In paste C, due to the SAP content and their size [12], the internal RH decreased only slightly and gradually in 30 days. In this study, autogenous RH measurements are principally used to support results of autogenous strain measurements, since previous studies have shown that a good correlation exists between the two [1].
75
80
85
90
95
100
0 2 4 6 8 10 12 14 16 18 20 22 24 26 28 30
Time (days)
Re
lati
ve h
um
idit
y (
%) Paste A (w/c 0.35)
Paste C (w/c 0.30 + 20% SF +0.6% SAP)
Paste B (w/c 0.30 + 20% SF)
Figure 8 – Autogenous relative humidity of pastes A, B and C, measured at 32ºC.
3.2 Linear autogenous strain
Results of linear autogenous strain measurements are shown in Figure 9. Paste A, with w/c ratio 0.35 and no silica fume addition, expanded up to 700 m/m after setting. Shrinkage followed, about 370 m/m in two weeks, after which the strain stabilized. On paste B, significant shrinkage was measured after setting, about 1250 m/m, followed by a short expansion period and by renewed shrinkage after 15 h. The total shrinkage at 30 days was about 2500 m/m. Paste C, containing SAP, expanded up to 550 m/m after setting; then the strain stabilized until about 8 days, when the test was interrupted due to failure of a transducer. By comparison with data obtained at 20ºC [13] and with the autogenous RH (Figure 8), shrinkage of paste C is supposedly very limited. It is noticed that there is a good agreement between the internal RH and the autogenous strain measured on the same pastes.

173
-3000
-2500
-2000
-1500
-1000
-500
0
500
1000
0 3 6 9 12 15 18 21 24 27 30
Time (days)
Au
tog
en
ou
s s
train
(µ
m/m
) Paste A (w/c 0.35)
Paste C (w/c 0.30 + 20% SF +0.6% SAP)
Paste B (w/c 0.30 + 20% SF)
Figure 9 - Linear autogenous strain of pastes A, B and C, measured with the dilatometer at 32ºC. Strains were zeroed at setting (2.5 h for paste A, 4.5 h for paste B, 5.5 h for paste C). Shrinkage is plotted as negative strain.
3.3 Crack pattern
In this section, preliminary results of crack patterns detected by optical microscopy and ESEM are presented. All samples were first examined with the optical microscope. Samples where microcracks were observed were analyzed further by ESEM, to confirm or exclude presence of gallium in the cracks. Samples of paste B, with low w/c and high silica fume content, showed the highest number of gallium-intruded microcracks. Microcracks were observed in samples with all dimensions of the steel rod, but mostly in samples with 6-mm rods. In these samples, cracks propagated from the central rod to the outer surface. As the dimension of the rods diminished, smaller and shorter cracks were observed, which did not reach the external surface. Pastes A and B showed almost no gallium-intruded microcracks. Some examples of the different features observed in the micrographs are shown and commented on in the following.

174
Figure 10 – Optical microscope image of sample of paste A (w/c 0.35) with 1.5-mm steel rod. The picture is 10 mm across.
Figure 11 – Optical microscope image of sample of paste A (w/c 0.35) with 6-mm steel rod. The picture is 10 mm across.
Figure 10 and 11 show optical microscope pictures of samples made of paste A, with 1.5-mm and 6-mm steel rods respectively. The dark circle in the centre of the sample is the steel rod; the cement paste appears white due to the use of white Portland cement; the surrounding dark area is the solidified gallium, which totally enclosed the cement paste. In the sample with a 1.5-mm steel rod (Figure 10), no cracks are visible; in the centre of the sample, next to the rod, a small air void intruded with gallium is present. In the sample with a 6-mm steel rod (Figure 11), two through cracks radiating from the rod are visible, one above the rod and one to the right. Optical microscopy at high resolution shows that these cracks are not intruded with gallium. The microcracks are connected with the external surface of the cement paste cylinder and gallium could also have penetrated from the bottom surface of the sample, if the cracks had been present at the moment of intrusion. Therefore, it is concluded that these microcracks were generated after gallium impregnation, during subsequent drying. Figure 12 shows a global view of a sample made of paste B with a 1.5-mm steel rod. Two cracks radiate from the rod in the centre of the sample. In Figure 13, a magnification of the central region of the same sample is shown. The cracks appear to be dark, especially the lower one, and might be intruded with gallium. These microcracks are not propagating to the external surface of the sample; gallium could therefore have penetrated the crack from the bottom surface of the sample. Analysis of the sample with ESEM is needed to verify presence of gallium in the microcracks.

175
Figure 12 – Optical microscope image of sample of paste B (w/c 0.3, 20% silica fume) with 1.5-mm steel rod. The picture is 10 mm across.
Figure 13 – Optical microscope image of sample of paste B (w/c 0.3, 20% silica fume) with 1.5-mm steel rod, showing gallium-intruded microcracks. The picture is about 2 mm across.
Figure 14 – Optical microscope image of sample of paste B (w/c 0.3, 20% silica fume) with 6-mm steel rod. The picture is 10 mm across.
Figure 15 – Optical microscope image of sample of paste B (w/c 0.3, 20% silica fume) with 1.5-mm steel rod, showing a gallium-intruded microcrack. The picture is about 2 mm across.
A global view and a magnification of a paste-B sample with a 6-mm steel rod are shown in Figure 14 and 15. A crack radiating from the steel rod and reaching the external
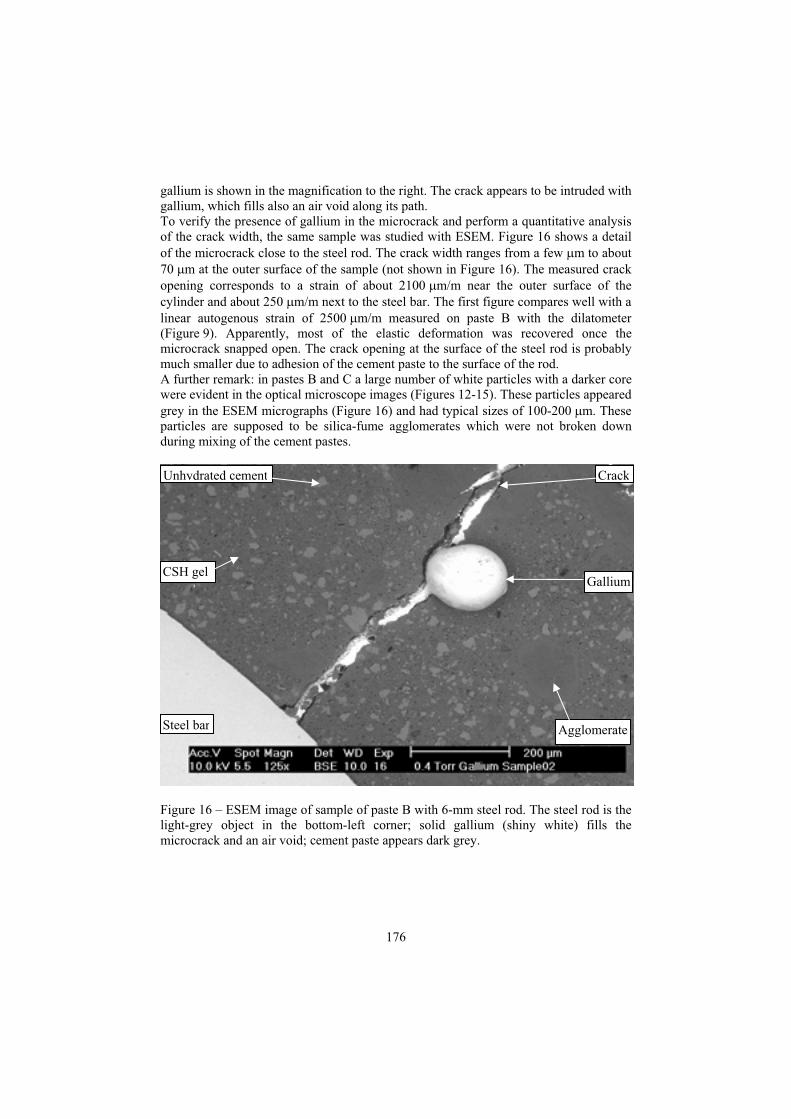
176
gallium is shown in the magnification to the right. The crack appears to be intruded with gallium, which fills also an air void along its path. To verify the presence of gallium in the microcrack and perform a quantitative analysis of the crack width, the same sample was studied with ESEM. Figure 16 shows a detail of the microcrack close to the steel rod. The crack width ranges from a few m to about 70 m at the outer surface of the sample (not shown in Figure 16). The measured crack opening corresponds to a strain of about 2100 m/m near the outer surface of the cylinder and about 250 m/m next to the steel bar. The first figure compares well with a linear autogenous strain of 2500 m/m measured on paste B with the dilatometer (Figure 9). Apparently, most of the elastic deformation was recovered once the microcrack snapped open. The crack opening at the surface of the steel rod is probably much smaller due to adhesion of the cement paste to the surface of the rod. A further remark: in pastes B and C a large number of white particles with a darker core were evident in the optical microscope images (Figures 12-15). These particles appeared grey in the ESEM micrographs (Figure 16) and had typical sizes of 100-200 m. These particles are supposed to be silica-fume agglomerates which were not broken down during mixing of the cement pastes.
Figure 16 – ESEM image of sample of paste B with 6-mm steel rod. The steel rod is the light-grey object in the bottom-left corner; solid gallium (shiny white) fills the microcrack and an air void; cement paste appears dark grey.
Agglomerate
Gallium
Steel bar
CSH gel
Unhydrated cement Crack

177
4. Final remarks
The gallium-intrusion technique described in this paper enables investigation of microcracks formed during restrained, autogenous hardening. With this technique it is possible to distinguish cracks present in the sample at the moment of gallium impregnation from cracks caused by the subsequent sample preparation. A preliminary investigation on three cement pastes shows that the observed microcracking depends on the autogenous shrinkage of the cement paste and on the dimension of the restraining steel rod. Further research to be performed within this project includes:
A large number of cement-paste samples for microcrack detection will be cast and analysed: due to the apparently stochastic nature of crack formation, it is expected that a clear picture about formation of autogenous-shrinkage microcracks will emerge only when a sufficiently high number of samples are examined. Analysis of the crack patterns will be done also with electron probe microanalysis, EPMA. This technique was successfully applied to examination of gallium-intruded porosity of cement paste [6]. On the basis of the measured autogenous strain, eigenstresses around the restraining steel rod will be calculated. Cracking predictions based on the developed stresses [4] will be compared to the observed microcracks. Microcrack formation will be detected by acoustic emission [14] on samples with the same geometry in the same curing condition.
Acknowledgements
The work described in this paper was carried out thanks to kind support from the “Ingeborg og Leo Dannins Legat for Videnskabelig Forskning” (Ingeborg and Leo Dannin’s grant for Scientific Research).
References
[1]
[2]
[3]
[4]
[5]
[6]
[7]
Jensen, O.M., Hansen, P.F., Autogenous Deformation and RH-Change in Perspective, Cem. Con. Res. 31 (12) 1859-1865. Davis, H.E., Autogenous Volume Changes of Concrete, Proc. 43rd Annual Meeting ASTM, Philadelphia 40 (32) (1940) 1103-1112. Bisschop, J., Lura, P., van Mier, J., Shrinkage Microcracking in Cement-Based Materials with Low Water-Cement Ratio, Concr. Science Eng. 3 (2001) 151-156. Dela, B.F., Stang, H., Two-Dimensional Analysis of Crack Formation Around Aggregates in High-Shrinkage Cement Paste, Eng. Fract. Mech. 65 (2) (2000) 149-164. Kjellsen, K.O., Jennings, H.M., Observations of Microcracking in Cement Paste upon Drying and Rewetting by Environmental Scanning Electron Microscopy, Adv. Cem. Based Mater. 3 (1) (1996) 14-19. Tanaka, K., Kurumisawa, K., Development of Technique for Observing Pores in Hardened Cement Paste, Cem. Concr. Res. 32 (9) (2002) 1435-1441. Jensen, O.M., Micro-Crack Detection in High-Performance Cementitious Materials, Preliminary report, Tokyo Institute of Technology, April 2003, 6 pp.

178
[8]
[9]
[10]
[11]
[12]
[13]
[14]
Jensen, O.M., Hansen, P.F., A Dilatometer for Measuring Autogenous Deformation in Hardening Portland Cement Paste, Mater. Struct. 28 (181) (1995) 406-409. Washburn, E.W., Note on a Method of Determining the Distribution of Pore Sizes in a Porous Material, Proc. Nat. Acad. Sci. 7 (1921) 115–116. Surface Tension of Liquid Elements, Handbook of Chemistry and Physics, CRC Press, 1973-1974, 54th ed., p. F-27. Cook, R.A., Hover, K.C., Mercury Porosimetry of Hardened Cement Pastes, Cem. Concr. Res. 29 (6) (1999) 933-943. Jensen, O.M., Hansen, P.F., Water-Entrained Cement-Based Materials – I. Principles and Theoretical Background, Cem. Concr. Res. 31 (4) (2001) 647-654. Lura, P., Jensen, O.M., Measuring Techniques for Autogenous Strain of Cement Paste, Knud Højgaard Conference on Advanced Cement-Based Materials – Research and Teaching, Technical University of Denmark, Lyngby, Denmark, June 2005. Pease, B., Neuwald, A., Weiss, W.J., The Influence of Aggregates on Early Age Cracking in Cementitious Systems, Celebrating Concrete: Role of Concrete in Sustainable Development, An International Sympoium dedicated to Professor Surendra Shah, Northwestern University, September 2003, pp. 329-338.

179
MOISTURE DISTRIBUTION IN CEMENT PASTE
CONSIDERING SELF-DESICCATION
Menghao QIN 1, Bo NI 2
1 LEPTAB, Université de La Rochelle, 17042 La Rochelle Cedex 1, France 2Donghua University, Shanghai, China
Abstract
Experimental and theoretical research of internal relative humidity (IRH) distribution in cement pastes with different water to cement ratios (W/C) and cementitious material systems, and IRH changes in paste resulted from self-desiccation at different ages were carried out in the present paper. The results indicated, for low W/C cement pastes, IRH distributions were mainly affected by moisture diffusion as well as self-desiccation and the IRH decreased with the reduction of W/C. These phenomena were amplified by the addition of silica fume and fine slag. Theoretical analyses of the self-desiccation mechanism indicated that the reduction of IRH in high performance cement paste was due to the fact that the evaporable water in the cement paste was not evaporated freely. The self-desiccation was mainly caused by the reduction of pore size or the increase in the fraction of micro-pore water in the total evaporable water and the increase in mole concentration of soluble ions in cement paste
1. Introduction
Moisture has a profound effect on the performance of concrete structures. Material properties of concrete (i.e., concrete strength, elastic modulus, creep, and shrinkage) are significantly influenced by the internal moisture and hydration in the concrete [1, 2]. Reduction of internal moisture in concrete structure in dry service environment will increase the risk of shrinkage and even cracking. Therefore, it is important to control internal moisture variation and distribution during drying in concrete structure for durability [3, 4].
In normal concrete structures exposed to ambient air, the variation of IRH is mainly governed by moisture diffusion. However, for high performance concrete, variation of its IRH is affected not only by moisture diffusion but also by self-desiccation. Self-desiccation normally means unhydrated cement in hardened concrete hydrates continuously after hardening and results in moisture consumption, which consequently causes reduction of its IRH. Especially for low W/C concrete at early age, self-desiccation has more significant effect on it [5].
In the first part of this study, IRH of uniaxial drying specimens was measured at different ages. Additionally, variation of IRH of specimens resulting from self-desiccation was also measured. The effect of W/C and blend types on the variation of IRH of cement paste at different ages was studied. In the second part, our research focuses on the theoretical analysis of the self-desiccation mechanism in high performance cement paste.

180
2. Experimental Details
2.1 Raw Materials and Paste Composition
Portland cement is used in the experiment. The specific area of fine ground slag is 650 m²/kg and the specific area of silica fume is 19 800 m²/kg. Chemical components of cement, silica fume and fine ground slag are shown in Table 1.
Table 1 - Chemical component of mineral blends and cement Raw materials SiO2 Al2O3 CaO MgO Fe2O3 SO3 TiO2 K2O Na2OCement 19.38 4.3 64.8 1.09 1.95 1.92 0.38 0.25 0.54 Silica Fume 96.1 0.4 0.3 0.3 0.5 0.5 -- 0.6 0.6 Fine ground Slag
37.4 16.7 28.6 6.2 4.0 0.6 0.8 0.9 --
The composition and compressive strength at 28 days of cement pastes with different W/C and cementitious material systems employed in the experiment are shown in Table 2.
Table 2 - Composition of cement pastes with different W/C and cementitious material systems
Cementitious materials (%)No. W/C
C SF* FS*
28 d compressive Strength(MPa)
CS1 0.55 90 10 0 53.2 C1 0.55 100 0 0 49.5
CS2 0.45 90 10 0 73.5 C2 0.45 100 0 0 68.3
CS3 0.35 90 10 0 92.0 CSF3 0.35 70 10 20 91.7
C3 0.35 100 0 0 81.0 CS4 0.25 90 10 0 123.2 C4 0.25 100 0 0 115.0
* SF is defined as Silica fume, and FS as fine ground slag.
2.2 Specimen Preparation and Measurement Method
At the age of 1 day, the moulds were removed from specimens and the initial IRH was measured. Then specimens were moved to a climatic chamber with constant-temperature and constant-humidity for drying experiment. The drying environment is at a temperature of 20 ± 0.5 °C and a relative humidity of 50 ± 1%.
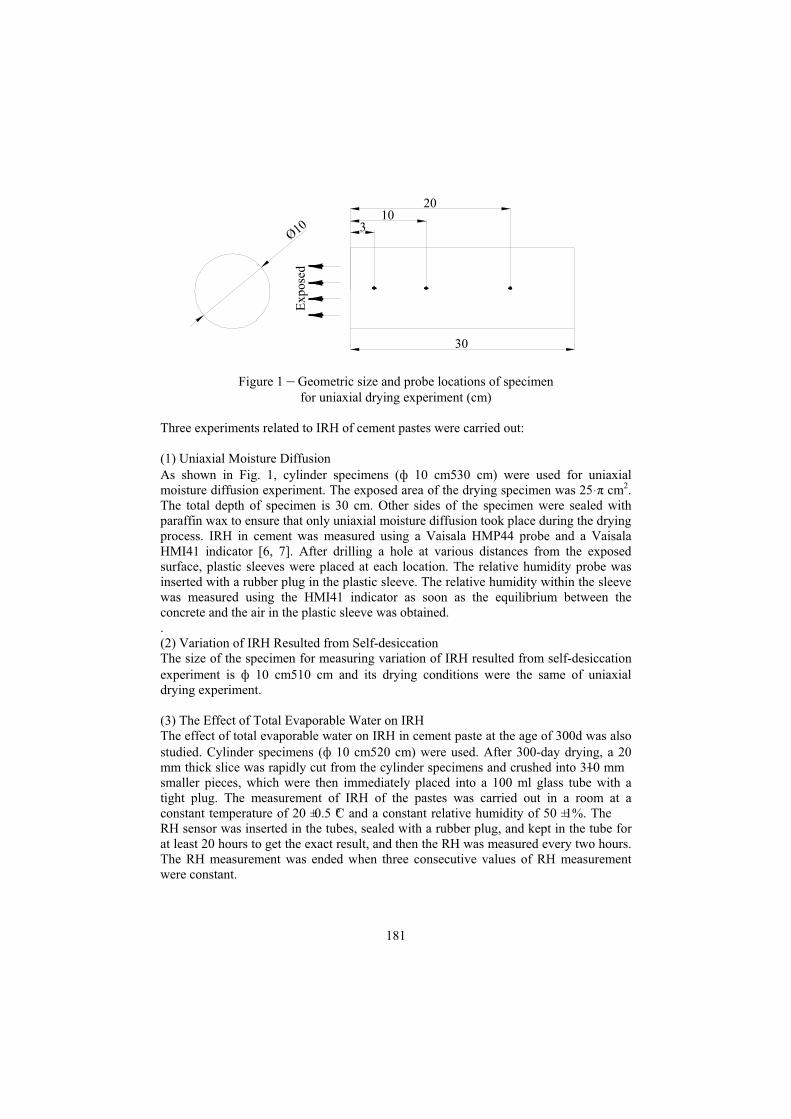
181
30
1020
Exp
osed
Ø10 3
Figure 1 – Geometric size and probe locations of specimen for uniaxial drying experiment (cm)
Three experiments related to IRH of cement pastes were carried out:
(1) Uniaxial Moisture Diffusion As shown in Fig. 1, cylinder specimens ( 10 cm 30 cm) were used for uniaxial moisture diffusion experiment. The exposed area of the drying specimen was 25 cm2.The total depth of specimen is 30 cm. Other sides of the specimen were sealed with paraffin wax to ensure that only uniaxial moisture diffusion took place during the drying process. IRH in cement was measured using a Vaisala HMP44 probe and a Vaisala HMI41 indicator [6, 7]. After drilling a hole at various distances from the exposed surface, plastic sleeves were placed at each location. The relative humidity probe was inserted with a rubber plug in the plastic sleeve. The relative humidity within the sleeve was measured using the HMI41 indicator as soon as the equilibrium between the concrete and the air in the plastic sleeve was obtained. .(2) Variation of IRH Resulted from Self-desiccation The size of the specimen for measuring variation of IRH resulted from self-desiccation experiment is 10 cm 10 cm and its drying conditions were the same of uniaxial drying experiment.
(3) The Effect of Total Evaporable Water on IRH The effect of total evaporable water on IRH in cement paste at the age of 300d was also studied. Cylinder specimens ( 10 cm 20 cm) were used. After 300-day drying, a 20 mm thick slice was rapidly cut from the cylinder specimens and crushed into 3~10 mm smaller pieces, which were then immediately placed into a 100 ml glass tube with a tight plug. The measurement of IRH of the pastes was carried out in a room at a constant temperature of 20 ± 0.5 °C and a constant relative humidity of 50 ± 1%. The RH sensor was inserted in the tubes, sealed with a rubber plug, and kept in the tube for at least 20 hours to get the exact result, and then the RH was measured every two hours. The RH measurement was ended when three consecutive values of RH measurement were constant.

182
The total evaporable water (Tew) and the residual evaporable water at a vacuum of 25 mm Hg in the specimen (Tr) could be calculated as follows:
%1000
0
M
MMT d
ew
%1000M
MMT dr
r
Where, M0 is the weight of specimen before IRH measurement; After the IRH measurement, the specimen was dried and pumped in a vacuum of 25 mm Hg for 24 hours and then weighed (Mr) again. Finally, the specimen was dried at 105 C for 1 day to constant weight and weighted (Md),
3. Results and Discussion
3.1 Self-desiccation
Fig. 2 shows IRH distribution of cement pastes resulted from self-desiccation. As seen from Fig. 2(a), at the age of 300 d, IRH of cement paste with W/C of 0.25 decreases to 0.78, however, IRH of cement paste with W/C of 0.55 only decreases to 0.93. It shows that the reduction of IRH of cement pastes resulted from self-desiccation increases with the decrease of W/C, especially at early age. Seen from Fig. 2(b), for the same water to cementitious material ratio, cement paste with single addition of 10% silica fume or with composite addition of 10% silica fume and 20% fine ground slag has lower IRH than that of control paste at the same ages.
3.2 Internal Relative Humidity Distribution in Cement Paste
IRH distributions in cement paste at 3, 10, 20 cm from the exposed surface are shown in Fig. 3(a), (b), (c) respectively. Fig. 3(a) indicates that, for the same W/C, IRH of cement pastes decreases rapidly at early age and then decreases slowly at later age. At the distance of 3 cm from the exposed surface, IRH of cement pastes with different W/C decrease at the same age with the decrease of W/C, which shows apparently at early ages. With the decrease of W/C, the proportion of IRH reduction resulted from self-desiccation increases gradually, however, the proportion of IRH reduction resulted from moisture diffusion decreases. For low W/C, moisture diffusion in cement paste becomes more and more difficult due to its compact structure. It could be concluded that for high W/C cement paste, its IRH reduction mainly affected by moisture diffusion but for low W/C cement paste, its IRH reduction is dependent not only on moisture diffusion but also on self-desiccation. For a certain W/C paste, the trends of IRH distribution of cement pastes at different ages at the distance of 3, 10, 20 cm are the same, but for the same age, the value of IRH in cement paste is related with the distance from the exposed surface. The reduction of cement IRH at the distance of 3 cm is higher than those at the distance of 10 and 20 cm. For high W/C paste, despite the little reduction of IRH resulting from self-desiccation, the differences of IRH of specimens between different distances is higher than those of paste with low W/C. It points out that the reduction of IRH in paste resulting from moisture diffusion increases with the increase

183
of W/C. It also indicates that the reduction of IRH in paste is dependent not only on moisture diffusion but also on self-desiccation. The lower the W/C is, the higher the self-desiccation effect on the reduction of IRH in paste is.
0 30024018012060
Time (d)
70
76
82
88
94
100
C1 C2 C3 C4
Rel
ativ
e hu
mid
ity
(%
)
(a) Different W/C ratio
0
100
95
90
85
8030024018012060
Time (d)
CS3C3 CSF3
Rel
ativ
e hu
mid
ity
(%
)
(b) Different cementitious materials.
Figure 2 – IRH distribution of cement pastes resulted from self-desiccation.
4. Mechanisms of Self-desiccation
In the following section, we will discuss the mechanisms of self-desiccation namely why is IRH decreased with the reduction of W/C and the addition of silica fume? Discussions were based on the experimental data of cement pastes at the age of 300 d.
4.1 Evaporable Water
Results on the effect of total evaporable water Tew on IRH in high-performance cement paste were shown in Fig.4, which clearly indicated that IRH of cement pastes was reduced with Tew, and that the effect of Tew on IRH of pastes with 10% SF was larger than that in pastes without SF. Their regression equations were as follows:
IRH=6.93 T ew +65 (Without SF, correlativ e coefficient r=0.97) (1) IRH=8.36 T ew +60 (With 10% SF, r=0.98) (2)

184
60 240
Rel
ativ
e hu
mid
ity
(%
) 100
70
75
80
85
90
95
180120 3000
C4C3C2C1
Time (d)
(a) at the distance of 3 cm
0 240 30018012060
Time (d)
C1 C2 C3 C4
95
90
85
80
75
100
70Rel
ativ
e hu
mid
ity
(%
)
(b) at the distance of 10 cm
0 180
Time (d)
C1 C2 C3 C4
Rel
ativ
e hu
mid
ity
(%
)
95
90
85
80
75
70
100
30024012060
c) at the distance of 20 cm
Figure 3 – IRH distribution of cement pastes.

185
When the specimen was placed in the 100 ml glass tube, the RH and temperature of the air in the tube was about 50% and 20 °C a nd the amount of water needed to increase IRH in the specimen from 50% to 100% can be calculated: W=(1-0.5)×17.3 (g/m3)×100×10 -6 (m3)=8.65×10 -4 g, (17.3 g/m3 is the vapor content in air at 100% IRH and 20 °C). However, based on the measurement, the minimum amount of evaporable water in the specimen for measuring IRH was 0.13 g.
Therefore, even for HPC with W/C of 0.25, there was enough evaporable water to maintain 100% IRH in paste if the evaporable water was pure water and could be evaporated freely. HPC only needed very little water to keep 100% IRH.
The above analysis shows that the reduction of IRH in high performance cement pastes was not due to shortage of water, but because the evaporable water in cement pastes was not evaporated freely.
With SF 10%
Rel
ativ
e hu
mid
ity
(%
)
T (%)
100
94
88
82
76
7043.532.521.5
ew
Without SF
Figure 4 – Effect of total evaporable water Tew on IRH
4.2 Mole Concentration of Soluble Ions
Based on the Raoult’s law, the vapor pressu re of a volatile component in an ideal solution is equal to the product of the mole fraction of the component in the solution and the vapor pressure of the pure component at the same temperature. Namely, the increase in the molar concentration of soluble ions in the specimen will cause the reduction of IRH in the specimen.
Some assumptions [8] have been adopted to simplify the calculation: 1) The number of moles of all ions in one-year concrete that are soluble into water, such as Na+, K+, Ca2+, OH-, SO4
2-, etc., is equivalent to that of 0.6% Na2O in cement weight. 2) All evaporable water of various states (in pores with various sizes) has the same concentration of the soluble ions and the same evaporating ability.

186
The concentration of the ions in the pore solution of the concrete can be calculated and expressed as the molar concentration of soluble ions of NaOH can be expressed as follows:
dT
C101.94S
ew
4 (3)
Where, C is the cement content, d is the density (g/cm3).
The relationship between the IRH and the calculated molar concentration S of soluble ions in cement paste can be expressed as follows:
IRH=-3.12S+97.62 (Without SF, corr elative coefficient r=0.97) (4) IRH=-4.58S+96.46 (With 10% SF, r=0.99) (5)
These results showed that a part of the reduction of the IRH in pastes was certainly due to the increase of the molar concentration. However, according to the calculation based on Raoult’s law, only 16%~19% reduction of the IRH was caused by the increase of Sfor cement pastes without SF, and 12%~15 % for cement pastes with 10% SF. This indicated that factors other than the mole concentration had larger influence on the IRH of cement paste, which maybe related to the pore structure of cement paste.
4.3 Pore Structure
Kelvin’s law also indicates that: vapor pressure of evaporable water in the pore decreases with the reduction of pore diameter. The evaporation of water in the pore becomes more and more difficult when the IRH in the pore is very low. Namely, evaporable water in smaller pore has smaller effect in enhancing the IRH in pastes. The evaporable water includes the interlayer water, absorbed water, gel water, capillary water and air-bubble water. Obviously, the interlayer water, absorbed water and gel water were more difficult to be evaporated than the capillary water and air-bubble water.
Actually, after being dried in a vacuum of 25 mm Hg for 24 h, a part of the total evaporable water in the specimen is not evaporated. So the effect of the residual evaporable water on IRH is negligible and therefore this part of water must be taken out during calculation of the mole concentration. And the solvent and the amount of total evaporable water must be adjusted during calculation of the mole concentration of soluble ions. Consequently, a dummy molar concentration Se can be calculated as follows:
rew
ewe
TT
TSS (6)
The relationship between IRH and the effective molar concentration of soluble ions in cement paste shows that IRH only depends on the effective molar concentration of soluble ions regardless of the paste with or without SF, and that IRH decreases linearly with the increase of Se.

187
IRH=-1.48S e+ 96.61 (With 0~10% SF, r=0.98) (7)
If S in Eq.(3) and Se in Eq. (6) are taken into Eq.(7), a new equation is obtained:
96.61)TT
1(
d
C1087.2-IRH
rew
4 (8)
Eq.(8) shows that the IRH decreases with the increase of 1/( Tew – Tr), and therefore the increase in the fraction of Tr in Tew reduces the IRH. The comparison between the calculated IRH and the measured data shows that about 80%~90% of reduction of the IRH was caused by the increase of 1/( Tew – Tr) for specimens without SF, about 84%~95% for specimens with 10% SF.
The research of Sellevold and Justnes [9] shows that the lower the W/C is and the higher the amount of silica fume is, the finer is the pore structure. From Kelvin’s law it can be deduced that the fraction Tr in Tew increases much more when the pore structure becomes finer, and therefore the IRH decreases more. Furthermore, the experiments also indicate that the effect of silica fume on the reduction of pore size in HPC is greater than that of W/C.
In short, the reduction of IRH or self-desiccation of high performance cement paste is mainly caused by the reduction of pore size or the increase in the fraction of micro-pore water (such as gel water, interlayer water, etc.) in the total evaporable water and the increase in mole concentration of soluble ions in the pastes.
5. Conclusions
Based on the results obtained from the experiments and theoretical analysis, the main conclusions can be summarized as follows:
(1) For high W/C cement paste, its IRH reduction mainly affected by moisture diffusion, but for low W/C cement paste, its IRH reduction was dependant not only on moisture diffusion but also on self-desiccation.
(2) With the decrease of W/C, the reduction of IRH due to self-desiccation increased, and the reduction of IRH due to moisture diffusion decreased.
(3) Theoretical analyses and calculation showed that the reduction of IRH in high performance cement paste was not due to shortage of water, but due to the fact that the evaporable water in the paste was not evaporated freely. The main reasons resulting in self-desiccation were the reduction of pore size or the increase in the fraction of micro-pore water in the total evaporable water (the fraction of Tr in Tew) and the increase in mole concentration of soluble ions.
(4) The addition of silica fume and fine ground slag made the reduction of IRH due to self-desiccation increased and the reduction of IRH due to moisture diffusion decreased.

188
References
[1] Nilsson, L., Hygroscopic Moisture in Concrete-drying, Measurements & Related Material Properties, Report TVBM-1003. Division of Building Materials, Lund Institute of Technology, Lund, Sweden. (1980).
[2] Persson, B., Fagerlund, G., Inter. Research Seminar on Self-desiccation and Its Importance in Concrete Technology, Report TVBM-3075. Division of Building Materials, Lund Institute of Technology, Lund, Sweden (1997).
[3] Persson, B., Moisture in concrete subjected to different kinds of curing, Materials and structure, 30, (203), 533-544 (1997).
[4] Andrade, C., Sarra, J., Alonso C., Relative humidity in the interior of concrete exposed to natural and artificial weathering, CCR, 29 (1999).
[5] Uchikawa, H., Hanehara, S., Hirao, H., Influence of structural and humidity changes at the inner part of hardened cement paste on autogenous shrinkage, ACI special publications, 949 (1997).
[6] Comite Euro-International du Beton, CEB-FIP Model Code 1990, (1993). [7] Terrill, J.M., Richardson, M., Selby, A.R., Non-linear moisture profiles and
shrinkage in concrete members, Magazine of Concrete Research, 38(137), 220-225, (1986).
[8] Yang, Q., Zhang, S., Self-desiccation mechanism of high-performance concrete, Chinese Journal of Zhejiang University, 5(12), 1517-1523, (2003).
[9] Sellevold, E.J., Justnes, H., High Strength Concrete Binders Part B: Nonevaporable Water, Self-desiccation and Porosity of Cement Pastes with and without Condensed Silica Fume, 4th Inter. Conf. on the Use of Fly Ash, Silica Fume, Slag and Natural Pozzolans in Concrete, ACI SP-132, 891-902, (1992).

189
CAPITALIZING ON SELF-DESICCATION FOR
AUTOGENOUS DISTRIBUTION OF CHEMICAL
ADMIXTURES
Dale P. Bentz Building and Fire Research Laboratory, NIST, Gaithersburg, MD USA
Abstract
For many concretes and mortars, self-desiccation results in the creation of empty capillary porosity within the cement paste microstructure, accompanied by a decrease in achieved hydration, an increase in internal stresses, and an increased propensity for early age cracking. One solution to this problem for low water-to-cement ratio concretes where external curing is ineffective has been the development of internal curing. In internal curing, water reservoirs, typically being either fine lightweight aggregates with a high moisture content or superabsorbent polymer particles, are distributed uniformly throughout the concrete microstructure and undergo desiccation themselves, while maintaining saturated conditions within the hydrating cement paste. Since these reservoirs typically contain pores that are much larger than those in the hydrating cement paste, the internal stresses are significantly reduced and early age cracking can be avoided. To date, these internal reservoirs have been filled with water only. Here, it is proposed to fill them with solutions of chemical admixtures such as shrinkage-reducing admixtures or corrosion inhibitors. Two possible advantages of the autogenous distribution of chemical admixtures over delivery by conventional addition to the mixing water are the mitigation or avoidance of possible detrimental interactions between chemical admixtures or detrimental influences of the admixture on fresh concrete properties and a potentially more efficient delivery of admixtures that are partially absorbed by the cement during hydration and in the resulting hydration products. Preliminary results for the FLAIR (Fine Lightweight Aggregates as Internal Reservoirs) system are presented for the case of a shrinkage-reducing admixture. It is envisioned that the FLAIR technology will have the greatest applicability to chemical admixtures that effect the properties of the hardened concrete (as opposed to the fresh concrete), such as shrinkage-reducing admixtures, corrosion inhibitors, and admixtures employed to mitigate alkali-silica reactions.
1. Introduction and objective
The effects of self-desiccation on concrete performance can be either beneficial or detrimental. For example, the reduced internal relative humidity produced during self-desiccation can be beneficial for concrete floors, where higher internal relative humidities can contribute to problems with mildew, mold, and other detrimental chemical reactions with carpeting and other flooring materials [1]. For intermediate water-to-binder ratio (w/b) concretes (e.g., 0.4 to 0.45), sealed curing and self-desiccation may actually result in an earlier depercolation of the capillary pores, as hydration will not occur in the larger pores emptied during self-desiccation, being instead concentrated in the water-filled smaller pores and pore entryways [2]. This should lead to lower transport coefficients and greater durability. Conversely, for high-
190
performance concretes with lower w/b, self-desiccation often leads to repercolation of the capillary pores at later ages [2], (early age) cracking [3], and poor durability. To avoid self-desiccation within the hydrating cement paste component of mortar or concrete, internal curing, utilizing either water-filled fine lightweight aggregates (LWA) or superabsorbent polymers (SAP), has been proposed [4-6], and a methodology for mixture proportioning for internal curing presented recently [7]. In this case, the initially water-filled LWA or SAP particles sacrificially self-desiccate while the hydrating cement paste, with its smaller pore diameters, remains saturated. The objective of this study is to investigate the extension of internal curing to the autogenous distribution of solutions of chemical admixtures, as opposed to simply water. In this preliminary study, results for utilizing fine LWA to distribute a shrinkage-reducing admixture (SRA) into a high-performance mortar will be presented. The proposed technology has been given the acronym FLAIR (Fine Lightweight Aggregates as Internal Reservoirs).
2. Experimental
Three mortar mixtures were prepared: 1) a control low w/b mixture with neither SRA nor fine LWA, 2) a mixture with fine LWA prewetted with a 10 % by mass fraction solution of the SRA (FLAIR delivery), and 3) a mixture with fine LWA prewetted with only water while the same quantity of SRA as in the previous mixture was now added directly to the mixing water (conventional delivery). The LWA used in this study was an expanded shale, passing through a #8 sieve, but retained on a #16. It had a saturated surface dry specific gravity of 1.67 and a water absorption of 20 % per unit dry mass LWA. The prewetted LWA was prepared by first oven drying, cooling to room temperature, and then mixing in a sealed plastic container with the appropriate volume of either water or the SRA solution. The prewetted LWA in the sealed container was then placed in a chamber maintained at 23 oC for a minimum of 24 h. The details for the prepared mortar mixture proportions are provided in Table 1. Cement and Concrete Reference Laboratory (CCRL) proficiency cement sample 152 [8] was used for all three mixtures. The mortars were prepared in an epicyclic mixer, with the water and chemical admixtures being placed in the mixing bowl first. Then, the cement was added and mixing performed on low speed for 30 s. All of the sands were added during 30 s of further mixing on low speed, followed by 30 s of mixing on medium speed. After a rest of 90 s, final mixing on medium speed for 1 min was performed. Mixtures 2 and 3 were prepared with the prewetted LWA replacing an equal volume of the S15 coarse sand.
The air content of the fresh mortar was determined according to ASTM C185 [9], and the following specimens were prepared: 50 mm cubes for compressive strength testing, 25 mm diameter by 400 mm corrugated tubes for evaluation of autogenous deformation [10], and 25 mm by 25 mm by 285 mm prisms for measurement of drying shrinkage. All specimens were placed in an environmental chamber maintained at 23 oC. The capped corrugated tubes were removed periodically and their length determined using a digital dilatometer [10]. The cube and prism molds were first sealed in two plastic bags and then placed in the environmental chamber. After 1 d of curing, the cube and prism specimens were demolded and placed in a new set of double plastic bags. After 3 d of sealed curing, the prisms to be used in the evaluation of drying shrinkage were removed
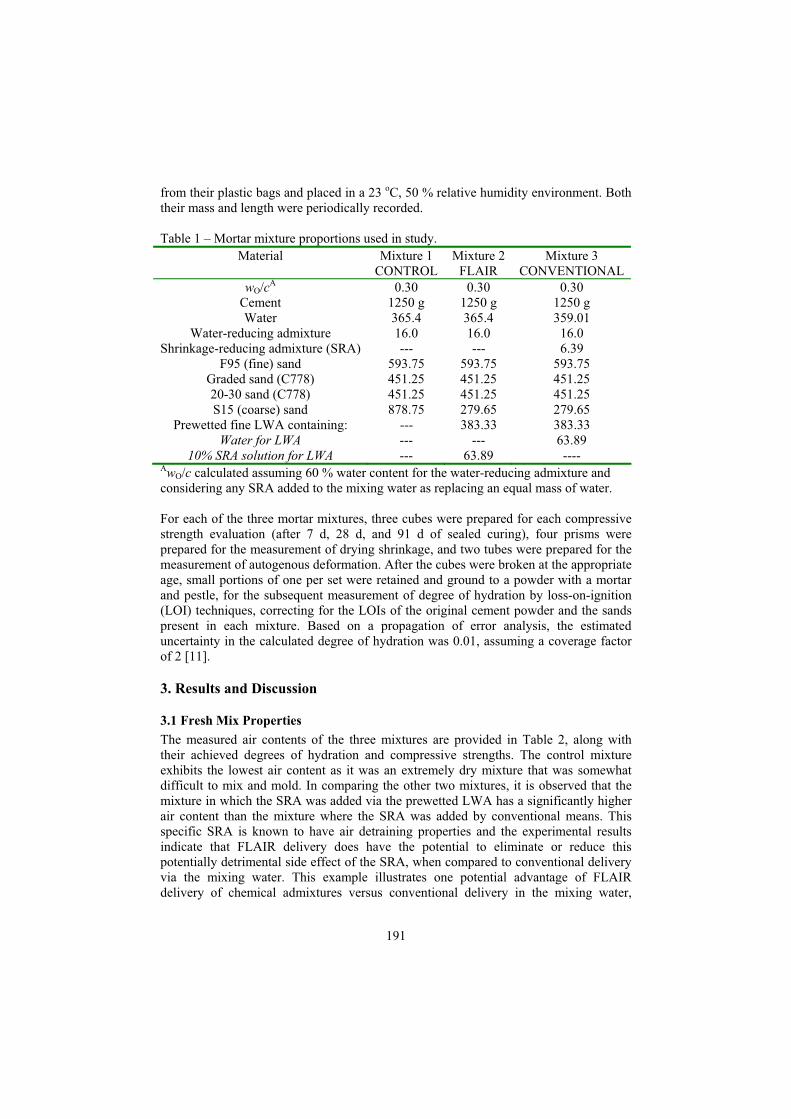
191
from their plastic bags and placed in a 23 oC, 50 % relative humidity environment. Both their mass and length were periodically recorded.
Table 1 – Mortar mixture proportions used in study. Material Mixture 1
CONTROL Mixture 2
FLAIRMixture 3
CONVENTIONAL wO/cA 0.30 0.30 0.30
Cement 1250 g 1250 g 1250 g Water 365.4 365.4 359.01
Water-reducing admixture 16.0 16.0 16.0 Shrinkage-reducing admixture (SRA) --- --- 6.39
F95 (fine) sand 593.75 593.75 593.75 Graded sand (C778) 451.25 451.25 451.25 20-30 sand (C778) 451.25 451.25 451.25 S15 (coarse) sand 878.75 279.65 279.65
Prewetted fine LWA containing: --- 383.33 383.33 Water for LWA --- --- 63.89
10% SRA solution for LWA --- 63.89 ---- AwO/c calculated assuming 60 % water content for the water-reducing admixture and considering any SRA added to the mixing water as replacing an equal mass of water.
For each of the three mortar mixtures, three cubes were prepared for each compressive strength evaluation (after 7 d, 28 d, and 91 d of sealed curing), four prisms were prepared for the measurement of drying shrinkage, and two tubes were prepared for the measurement of autogenous deformation. After the cubes were broken at the appropriate age, small portions of one per set were retained and ground to a powder with a mortar and pestle, for the subsequent measurement of degree of hydration by loss-on-ignition (LOI) techniques, correcting for the LOIs of the original cement powder and the sands present in each mixture. Based on a propagation of error analysis, the estimated uncertainty in the calculated degree of hydration was 0.01, assuming a coverage factor of 2 [11].
3. Results and Discussion
3.1 Fresh Mix Properties
The measured air contents of the three mixtures are provided in Table 2, along with their achieved degrees of hydration and compressive strengths. The control mixture exhibits the lowest air content as it was an extremely dry mixture that was somewhat difficult to mix and mold. In comparing the other two mixtures, it is observed that the mixture in which the SRA was added via the prewetted LWA has a significantly higher air content than the mixture where the SRA was added by conventional means. This specific SRA is known to have air detraining properties and the experimental results indicate that FLAIR delivery does have the potential to eliminate or reduce this potentially detrimental side effect of the SRA, when compared to conventional delivery via the mixing water. This example illustrates one potential advantage of FLAIR delivery of chemical admixtures versus conventional delivery in the mixing water,

192
namely the mitigation or avoidance of potentially detrimental interactions between multiple admixtures or detrimental side effects of the admixture in the fresh concrete.
Table 2- Measured physical properties of mortar mixtures. Numbers in parentheses for air contents indicate the standard deviation between two or three batches of fresh mortar, for compressive strengths indicate the measured coefficient of variation for three specimens, and for degree of hydration indicate the estimated uncertainty, as specified above.
Physical Property Mixture 1 CONTROL
Mixture 2 FLAIR
Mixture 3 CONVENTIONAL
Air content 3.4 % (0.6 %) 8.3 % (0.4 %) 5.1 % (0.4 %) 7 d compressive strength (MPa) 38.8 (2.8 %) 36.5 (4.6 %) 40.4 (6.0 %)
28 d comp. strength (MPa) 42.1 (6.7 %) 41.0 (3.7 %) 41.0 (4.5 %) 91 d comp. strength (MPa) 43.7 (4.5 %) 42.6 (9.9 %) 42.7 (11.4 %)
7 d degree of hydration 0.53 (0.01) 0.57 (0.01) 0.59 (0.01) 28 d degree of hydration 0.57 (0.01) 0.66 (0.01) 0.66 (0.01) 91 d degree of hydration 0.59 (0.01) 0.68 (0.01) 0.68 (0.01)
3.2 Degree of Hydration and Strength Development
Table 2 also provides the measured values of compressive strength and degree of hydration at ages of 7 d, 28 d, and 91 d for the three mortars. Degrees of hydration in the mixtures with the prewetted LWA (#2 and #3) were greater than that in mixture 1 at all ages, due to the extra water provided by the internal curing, in agreement with previous observations [12]. The compressive strengths of the three mixtures are nominally identical within the measured variation of the testing. The expected compressive strength reduction due to the increased air contents of mortar mixtures 2 and 3 are basically offset by the beneficial effects of their increased degrees of hydration. These results indicate that the FLAIR delivery of the SRA is equivalent to delivery by conventional means in terms of achieved hydration and strength.
3.3 Autogenous Deformation and Drying Shrinkage
The measured autogenous deformation curves for the three mortar mixtures are provided in Figure 1. Previously, it has been demonstrated that the addition of either water-filled fine LWAs or an SRA results in substantial decreases in the measured autogenous shrinkage at ages beyond 1 d [3]. Thus, it is no surprise that including both in the same mixture, whether via FLAIR or conventional delivery of the SRA, results in a substantial reduction in the measured autogenous deformation. The two delivery mechanisms provide equivalent reductions in autogenous shrinkage, suggesting that the extra internal curing water and the presence of the SRA are functioning similarly with respect to autogenous deformation, regardless of how they are introduced into the mortar mixtures.

193
-400
-300
-200
-100
0
100
200
0 400 800 1200 1600 2000 2400 2800 3200
Time (h)
Mic
rostr
ain
Mixture 1
Mixture 2
Mixture 3
Figure 1- Measured (average of two samples) autogenous deformations vs. time for the three mortar mixtures. Error bars on lower curve indicate range of values for the two mixture 1 specimens.
The curves for drying shrinkage microstrain vs. time are provided in Figure 2. For both mixtures with internal curing and SRA, less drying shrinkage is observed, despite their higher overall water content and greater mass loss during drying. As shown in Figure 3, for each of the three mortar mixtures, a nearly linear relationship was observed between measured mass losses and measured drying shrinkage microstrains. For the two mixtures with internal curing and SRA, the slope of the drying shrinkage microstrain vs. mass loss curve is less at early ages (< 7 d), as indicated in Table 3. The SRA reduces the surface tension of the pore solution [13, 14], leading to a reduced saturation level and reduced strain within the three-dimensional microstructure when exposed to a constant (reduced) relative humidity drying environment. Because there is a greater quantity of total water in mixtures 2 and 3 relative to mixture 1, they do exhibit a greater mass loss during drying but with less accompanying shrinkage. In terms of the early (< 7 d) and later (> 7 d) age shrinkage, as indicated in Table 3 and Figure 2, mixture 2 with FLAIR delivery exhibits slightly more shrinkage at early ages, but less subsequent shrinkage at later ages when compared to mixture 3 with conventional delivery of the SRA. This would be expected as the SRA would be released (drawn out) from the prewetted fine LWA during the first few days of hydration under sealed conditions. As some of the SRA may be absorbed by the cement hydration products, delaying its introduction into the hydrating cement paste system may potentially improve its efficiency at later ages. This is the second potential benefit of FLAIR vs. conventional delivery of chemical admixtures. Because the FLAIR-delivered admixtures are not initially distributed throughout the cement paste component of the fresh concrete, it is envisioned that the FLAIR technology will be most readily applicable to admixtures that influence the properties of the hardened concrete, such as SRAs, corrosion inhibitors, and admixtures employed to mitigate alkali-silica reactions. Further research is needed to evaluate the FLAIR technology in such systems.
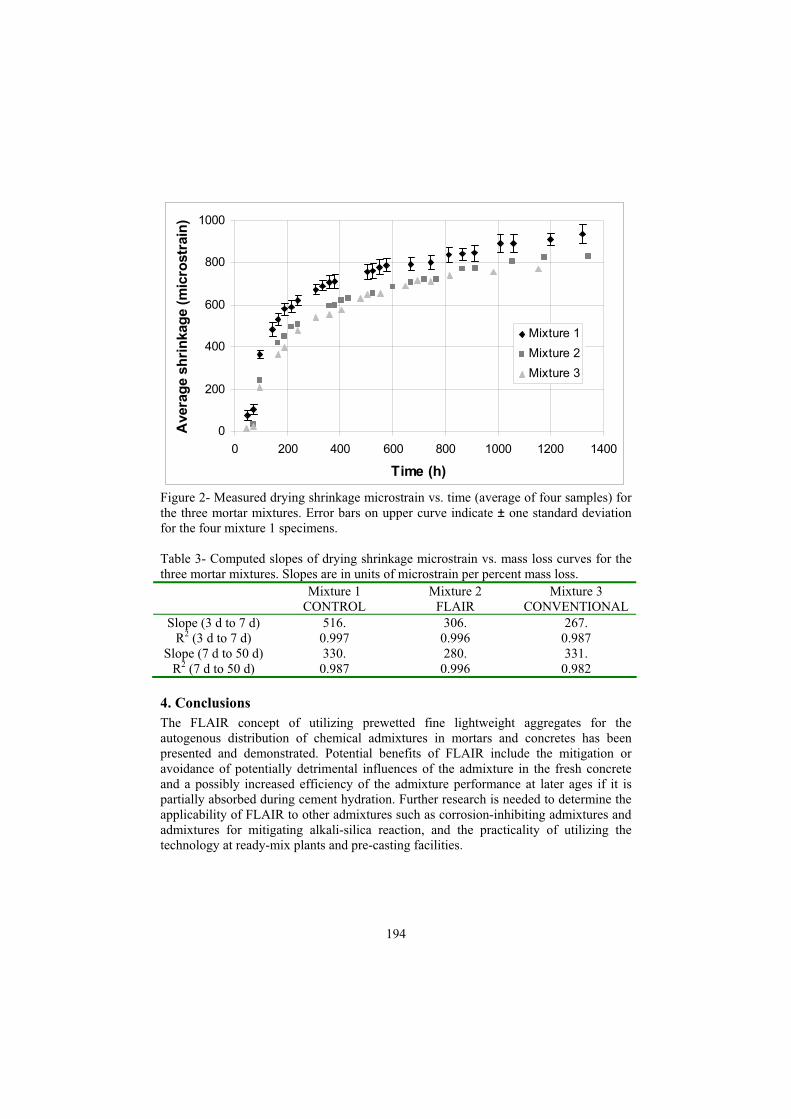
194
0
200
400
600
800
1000
0 200 400 600 800 1000 1200 1400
Time (h)
Avera
ge s
hri
nkag
e (
mic
rostr
ain
)
Mixture 1
Mixture 2
Mixture 3
Figure 2- Measured drying shrinkage microstrain vs. time (average of four samples) for the three mortar mixtures. Error bars on upper curve indicate ± one standard deviation for the four mixture 1 specimens.
Table 3- Computed slopes of drying shrinkage microstrain vs. mass loss curves for the three mortar mixtures. Slopes are in units of microstrain per percent mass loss.
Mixture 1 CONTROL
Mixture 2 FLAIR
Mixture 3 CONVENTIONAL
Slope (3 d to 7 d) 516. 306. 267. R2 (3 d to 7 d) 0.997 0.996 0.987
Slope (7 d to 50 d) 330. 280. 331. R2 (7 d to 50 d) 0.987 0.996 0.982
4. Conclusions
The FLAIR concept of utilizing prewetted fine lightweight aggregates for the autogenous distribution of chemical admixtures in mortars and concretes has been presented and demonstrated. Potential benefits of FLAIR include the mitigation or avoidance of potentially detrimental influences of the admixture in the fresh concrete and a possibly increased efficiency of the admixture performance at later ages if it is partially absorbed during cement hydration. Further research is needed to determine the applicability of FLAIR to other admixtures such as corrosion-inhibiting admixtures and admixtures for mitigating alkali-silica reaction, and the practicality of utilizing the technology at ready-mix plants and pre-casting facilities.

195
-200
0
200
400
600
800
1000
0.0 0.5 1.0 1.5 2.0 2.5 3.0
Average mass loss (%)
Aver
age s
hri
nka
ge
(mic
rostr
ain
)
Mixture 1
Mixture 2
Mixture 3
Figure 3- Measured drying shrinkage microstrain vs. measured mass loss (average of four samples) for the three mortar mixtures.
Acknowledgements
The author would like to thank Northeast Solite Corporation* and W.R. Grace & Co. - Conn. for supplying the fine lightweight aggregates and chemical admixtures used in this study, respectively, Mr. Max Peltz (BFRL/NIST) for assistance with preparing the mortar mixtures, and Dr. Kenneth Snyder (BFRL/NIST) and Mr. Thomas Holm of the Expanded Shale, Clay, and Slate Institute for their thorough reviews of the manuscript.
References
[1] Persson, B., Compatibility between Flooring Materials and Concrete. Materials and Structures 35, 170-182 (2002).
[2] Bentz, D.P., Stutzman, P.E., Curing, Hydration, and Microstructure of Cement Paste. submitted to ACI Materials Journal, 2005.
[3] Bentz, D.P., Geiker, M., Jensen, O.M., On the Mitigation of Early Age Cracking. Self-Desiccation and Its Importance in Concrete Technology, Report TVBM-3104. Division of Building Materials, Lund Institute of Technology. Lund University, Lund, Sweden, Ed. by B. Persson and G. Fagerlund, 195-203 (2002).
[4] Geiker, M.R., Bentz, D.P., Jensen, O.M., Mitigating Autogenous Shrinkage by Internal Curing. High-Performance Structural Lightweight Concrete, ACI SP-218. ACI, Farmington Hills, MI, Ed. by J.P. Ries and T.A. Holm, 143-154 (2004).
* Certain commercial products are identified in this paper to specify the materials used. In no case does such identification imply endorsement by the National Institute of Standards and Technology, nor does it indicate that the products are necessarily the best available for the purpose.
196
[5] Jensen, O.M., Hansen, P.F., Water-entrained Cement-based Materials I. Principle and Theoretical Background. Cement and Concrete Research 31, 647-654 (2001).
[6] Jensen, O.M., Hansen, P.F., Water-entrained Cement-based Materials II. Experimental Observations. Cement and Concrete Research 32, 973-978 (2002).
[7] Bentz, D.P., Lura, P., Roberts, J.W., Mixture Proportioning for Internal Curing. Concrete International 27 (2), 35-40 (2005).
[8] Cement and Concrete Reference Laboratory, “Cement and Concrete Reference Laboratory Proficiency Sample Program: Final Report on Portland Cement Proficiency Samples Number 151 and 152,” Gaithersburg, MD, April 2004.
[9] ASTM Annual Book of Standards, Vol. 04.01 Cement; Lime; Gypsum, American Society for Testing and Materials, West Conshohocken, PA, 2004.
[10] Jensen, O.M., Hansen, P.F., A Dilatometer for Measuring Autogenous Deformation in Hardening Portland Cement Paste. Materials and Structures 28,406-409 (1995).
[11] Bentz, D.P., Three-Dimensional Computer Simulation of Cement Hydration and Microstructure Development. Journal of the American Ceramic Society 80 (1), 3-21 (1997).
[12] Lura, P., Bentz, D.P., Lange, D.A., Kovler, K., Bentur, A., Pumice Aggregates for Internal Water Curing. PRO 36: Proc. Int. RILEM Symp. On Concrete Science and Engineering – A Tribute to Arnon Bentur, RILEM Publications S.A.R.L., Bagneux, France, Ed. by K. Kovler, J. Marchand, S. Mindess, and J. Weiss, 137-151 (2004).
[13] Bentz, D.P., Geiker, M.R., Hansen, K.K., Shrinkage-Reducing Admixtures and Early Age Desiccation in Cement Pastes and Mortars. Cement and Concrete Research 31, 1075-1085 (2001).
[14] Bentz, D.P., Jensen, O.M., Mitigation Strategies for Autogenous Shrinkage Cracking. Cement and Concrete Composites 26 (6), 677-685 (2004).

197
CURRENT AND FUTURE TRENDS IN THE APPLICATION
OF INTERNAL CURING OF CONCRETE
John W. Roberts Northeast Solite Corporation, Richmond, Virginia, USA
Abstract
The concept of Internal Curing (IC) has come into the marketplace after 50 years of unobtrusively improving concrete [1, 2] through the use of lightweight aggregate (which was absorbent) in many different applications for purposes other than that of providing absorbed water for the hydration of cement. For instance, lightweight block have sharper edges, and bridges have less cracking through the incorporation of lightweight aggregates in their concrete mixtures.
Observations, as a result of successful and recent tests and research [3-19], have recently put IC in the forefront of breakthroughs of ideas of how to make good concrete better. It improves the results obtained by low water/cement (w/c) ratios, the use of silica fume, the advent of high-performance concrete, and the benefits from certain admixtures.
In the last 100 years [20] there has been placed a certain amount of long-lasting, good performing and economical concrete. However, the deficiencies of much of the concrete have been obvious. In the last 75 years [20] there has been a great amount of knowledge generated of how to make concrete better through the incorporation of specifically engineered ingredients and methods of batching and mixing. There have even been studies of the best means of curing. ACI Committee 308 has studied the subject since Bryant Mather [8, 21, 22] called the industry’s attention to “self-curing.” It was he who reconstituted and chaired the Committee on Curing. The Guide to Curing Concrete (ACI 308R-01) is being rewritten to recognize the value of internal curing as an adjunct to external curing.
Internal curing can make good concrete better [23]. It can make up for some of the deficiencies brought on by human beings’ not following the best practices with external curing. It can even make up for some of the problems brought on by hot or windy weather. For very low w/c ( 0.35) concretes, IC may be a necessity [24], but research makes it obvious that there are benefits from IC in many low w/c ratio ( 0.43) mixtures. The need for it became obvious with the advent of high performance concrete (HPC). Because of it, more of the cement in a mixture is hydrated in a timely fashion. It results in greater early age strength, much lower autogenous shrinkage and cracking, lower permeability, greater internal relative humidity with elimination of self-desiccation, and other beneficial characteristics. It can benefit many different applications, among which the most obvious are bridges, parking structures, high performance concrete, pavements, precast concrete and high fly-ash concrete. Because its benefits are unique to different applications, other uses will be developed.

198
In order to use the optimum amount of internal curing agent, a rationale has been developed for mixture proportioning for Internal Curing [25], based on the chemical shrinkage and desorption of readily available water as it migrates to the hydrating cement.
Because of the deficiencies occurring in normal weight concrete, a number of candidates (applications, uses) for internal curing have been identified [26]. These may benefit in accordance with their needs for internal water and in accordance with the
amount of IC vehicle used. It is envisioned that in the 21st Century some method of
internal curing will be incorporated in all better quality concrete.
1. Introduction and objectives of Internal Curing
1.1 General
What are the purposes of Internal Curing (IC)? What is the present status of internal curing in the market place? The more we delve into how IC improves concrete, the more we have answers to the questions and the more we understand the magnitude of the list of potential applications. Preordained usage is insignificant in 2004, but interest is high and usage will grow because there are many problems involved with concrete that internal curing can resolve.
Internal Curing (Purposes):
A. A means to provide the water to hydrate all the cement [10, 23], accomplishing what the mixing water alone cannot do. In low w/c ratio mixes (under 0.43 and increasingly those below 0.40) absorptive lightweight aggregate, replacing some of the sand, provides water that is desorbed into the mortar fraction (paste) to be used as additional curing water. The cement, not hydrated by the low amount of mixing water, has more water available to it.
B. Provides water to keep the relative humidity (RH) high, keeping self-desiccation from occurring.
C. Largely eliminates autogenous shrinkage [10, 25]. D. Keeps the strength of the mortar and the concrete in the early age (12 to 72
hrs.) above the level where internally induced and externally induced strains can cause cracking [10, 25].
E. Makes up for some of the deficiencies of external curing, both human related (because the most critical time that curing is required is the first 12 to 72 hours) and hydration related (because hydration products clog the passageways needed for the fluid curing water to travel to the cement particles thirsting for water).
Internal curing works, because the thirst for water by the hydrating cement particles is so intense, because the capillary action of the pores in the concrete is so strong, and because the water in the properly distributed particles of lightweight aggregate sand is so fluid [27]. These factors establish the dynamics of water movement to the unhydrated cement particles.

199
1.2. Internal Curing (present status)
Although we have inadvertently cured concrete from the inside for the past fifty (50) years [1] with lightweight concrete, now we must consciously use agents (vehicles, carriers) to bring water into the concrete mixture on purpose by providing it through absorbent lightweight aggregate sand (LWAS) [28]. In doing so we will improve the characteristics of normal weight concrete by using a small amount of absorbent lightweight aggregate in the mixture.
2. Concrete deficiencies that IC can address
The applications that benefit from IC include those in which cracking of the concrete can provide passageways which result in the deterioration of the reinforcing steel, in which low early-age strength is a problem, where permeability or durability must be improved, and even where the rheology of the concrete mixture, the modulus of elasticity of the finished product or the durability of high fly-ash concretes are considerations. IC can help them all. IC can even help reduce the amount of cement consumed and aid in the GREEN effect, such as that promulgated by LEED (Leadership in Energy and Environmental Design). IC can contribute to the elimination of excessive construction time (ACTT), provide quicker turnaround time in precast plants, lower maintenance cost and provide greater performance and predictability.
3. Procedures for optimum Internal Curing
3.1 General
Internal curing results depend on the agent used, the procedure, the methodology, the other ingredients (including cement, aggregates and admixtures), the amount of vehicle used, and how the vehicle is incorporated into the mixture. The key is to design the mixture with the materials which will assist in making the entire process simple and predictably reliable. The material used, itself, needs to be predictable in its effects and uniform in its characteristics.
The material must be able to be batched easily. The concrete must be able to be mixed and transported without degradation of the IC agent. The agent needs to not release its water until needed for internal curing purposes. The concrete with the IC material incorporated should be as easily pumped, placed and finished as without the IC material.
The purpose of the whole IC process is to make good concrete better.
Whether the absorbed water is supplied by the inclusion in normal weight concrete of absorptive lightweight aggregate, (with strong, cubical particle shape) or of superabsorbent polymers, it should have the characteristic of desorbing its water at the instant the water is needed. Whichever is used, the objective is to have concrete in its plastic, in its hardening, and in its service condition with the characteristics desired by the engineer/designer/specifier. To achieve this, it must have sufficient internal water to satisfactorily cure the concrete, reduce autogenous shrinkage to an allowable minimum

200
and retain relative humidity (RH) at a level needed to eliminate self desiccation.
Lightweight aggregate sand (LWAS), as the material providing absorbed water, is in the forefront in 2005 [29]. As more and more projects are designed and constructed, the amount of the LWAS per cubic yard of concrete will be revised to achieve certain purposes. Additionally, other appropriate IC agents or even admixtures might be included, either separately or absorbed into the lightweight sand. Choices will be made for certain uses and others specified for general use. For instance, to further improve the characteristics of the outside millimeter or two, where outside curing might not be sufficient, additional lightweight aggregate sand might provide the additional absorbed water needed to provide the curing necessary near the surface. The relationship of the carrier of water for internal curing with admixtures is important. Admixtures have their own mission; water carriers have theirs. Combined, the absorption of the water and admixtures together can have a salient effect on the final result. Aggregate, silica fume, fly ash, water/binder ratios, and cement/aggregate ratios have their own effects and even limitations. Internal curing can have a beneficial effect on them all. Their relationship with each other, brought about by internal curing, can optimize the influence each has and bring about a synergistic effect on the concrete end product.
3.2 Mixture proportioning for Internal Curing
The paper authored by Bentz, Lura and Roberts in the February issue of Concrete International [25] sets forth the rationale for a methodology for “Mixture Proportioning for Internal Curing.” The rationale is based on the chemical shrinkage and the desorption of readily available water as it migrates to the hydrating cement. A formula of Bentz and Snyder [10] is presented for the Internal Curing Water that is required:
3.3. Required Internal Curing water
MLWA
= Cf CS
max
S LWA
Where
MLWA
= mass of (dry) LWA needed per unit of volume of concrete (kg/m3
or lb/yd3)
Cf = cement factor (content) for concrete mixture (kg/m
3or lb/yd
3)
CS = chemical shrinkage of cement (g of water/g of cement or lb/lb)
max= maximum expected degree of hydration of cement
S = degree of saturation of aggregate (0 to 1)

201
LWA = absorption of lightweight aggregate (kg water/kg dry LWA or lb/lb)
The cement factor (Cf) is known, and the chemical shrinkage (CS) of the cement is
easily computed from its composition. These two parts of the equation are fixed. The maximum expected degree of hydration of the cement ( max) depends on the water available. The other two factors vary with different lightweight aggregates. A less than optimum lightweight aggregate will desorb water at a lower rate such that the maximum amount of hydration of the cement is not achieved. Certain lightweight aggregates are unable to achieve saturation or desorption quickly enough. The ASTM C128 test for absorption has a time of 24 hours. Since desorption is especially important in the initial and final setting stages, an absorption at 30 minutes [29] has been accepted as a measure of early availability of absorbed water. As far as the absorption of the lightweight aggregate is concerned, each shale, clay or slate out of which the aggregate is made has its own characteristic expansion with resulting void or pore configuration. Some voids are large, some infinitesimally small, some are interconnecting, some are not. The result is that 24 hour absorptions vary from 5% or less to 25% or more. Consequently, the same mass of lightweight aggregate might have widely varying ability to provide water for the hydration of the cement.
The formula is designed for a simple computation. All that is necessary is to know the characteristics of the lightweight aggregate sand through testing. The absorption is ascertained through ASTM C128 and it is suggested that aggregate be tested for 30 minutes, 1, 2, 4 hours, 15 hours (AASHTO) and 24 hours (ASTM) so the desorption rate and effective degree of saturation can be ascertained. Substituting numbers in the equation for a particular lightweight aggregate sand, whose absorption is in the middle of the range of 5 to 25% and a degree of saturation of 95%, we obtain the following for a maximum degree of hydration of 0.94 for 588 pounds (267 kg) of cement per cubic yard of concrete with a water/cement ratio of 0.34.
M = 588 0.065 0.94 M = 267 0.065 0.940.95 0.15 or 0.95 0.15
= 252 lbs. LWAS = 114 kg LWAS
The required lightweight sand that is to be substituted for the natural sand is therefore in this example 252 pounds or 114 kg. The absorbed water that can be desorbed is 37.8 pounds or 17.1 kg. This internal water does not affect the w/c ratio amount, but instead adds to the water which the cement needs for hydration, and is in addition to the mixing water. The internal absorbed and desorbed water has no adverse effect on the permeability, strength or durability but instead has a beneficial effect on all these characteristics.
It is recommended that the practitioner determine the required parameters of all of the ingredients of the concrete mixture, not only of those involved in the formula, but also of the other aggregates and admixtures. For instance, if the stone has an absorption of 1% or more it has been shown that the shrinkage of the concrete made from it is

202
improved [30]. Absorbent lightweight aggregate is a proven benefit to curing, but there are other materials that also might have an added beneficial effect. It is important that the absorbed water be distributed throughout the concrete (use sand size rather than coarse), that the LWAS have particle shape, mechanical strength and grading which can improve the characteristics of the mortar rather than detract from them, and that the LWAS be completely saturated (SSD) when incorporated into the mixture [29].
4. Candidates (applications, uses) for IC
4.1 General
We can no longer not address curing of concrete in all its facets. For 100 years we have addressed curing “after the fact,” after the concrete is mixed and placed and finished. That is too late.
There are few concrete applications that cannot benefit from IC. Those obvious candidates were addressed in the paper “The 2004 Practice and Potential of Internal Curing of Concrete Using Lightweight Sand” presented at Northwestern University, Evanston, Illinois March 2004 at “Advances in Concrete through Science and Engineering” [26]. Identified in that paper were the following applications that would benefit from IC:
Architectural Concrete Precast Bridges Pavements Concrete Pipe Parking Structures
High Performance Concrete Self Consolidating Concrete High Fly-ash Concrete Tilt-up Mass concrete Walls
4.2 Benefits and drawbacks of IC
Thinking “outside the box,” in order to predict the potential benefits from internal curing, we can review the list of concrete problems and ascertain which of them IC can address. Proper curing, including having the water in the proper place at the proper time, can and does benefit even the best engineered concrete, the best mixture design, and the best and even the less-than-best ingredients. Internal curing enables the practitioner to have the proper amount of water in the proper place at the proper time. Huge benefits result from adding a small amount of saturated surface dry (SSD) lightweight aggregate sand to conventional concrete.
The list of improvements to concrete because of optimum internal curing:
reduces autogenous cracking, largely eliminates autogenous shrinkage, reduces permeability, protects reinforcing steel,
203
increases mortar strength, increases early age strength sufficient to withstand strain, provides greater durability, higher 3-day flexural strength 7 day compressive strength in 3 days, lower turnaround time, improved rheology greater utilization of cement, lower maintenance, use of higher levels of fly ash, higher modulus of elasticity, or through mixture designs, lower modulus sharper edges, greater curing predictability, higher performance, improves contact zone, does not adversely affect finishability, does not adversely affect pumpability, reduces effect of insufficient external curing.
Some of these are interrelated and have a synergistic effect. All of them occur through the hydration of the cement not hydrated by the mixing water and/or through the higher relative humidity imparted to the concrete by IC.
There are potential drawbacks, as have been pointed out in the research [3-41]. However, if the materials have been chosen wisely for the purposes (uses, applications) intended, and if the procedures outlined have been followed, the characteristics wanted can be achieved. The realization will be to make good concrete better.
4.3. Applications where IC is critically needed
The applications for internal curing are many. We know that external curing, as practiced for the last 100 years and improved for the last decade, is not sufficient. For a few extra dollars the proven technology will pay off. IC is an investment, not a cost. Certain uses need certain benefits. Properly chosen IC agents can provide all the benefits, but they are especially needed for the critical problems that need to be addressed. Almost all applications need IC for its beneficial effect on strength, cracking, shrinkage, and permeability. Seven-day compressive strengths may be achieved in three day [26].
High performance concrete (HPC) is being used in increasingly more applications.
IC can make it H+
PC. The proper IC agent will help optimize concrete’s dimensional stability, and reduce its autogenous shrinkage.
Silica fume has been used in many instances to densify and provide earlier strength. IC should be able to reduce the amount required per cubic yard, and at the same time
204
impart the desired characteristics.
The 21st Century of Concrete will be the century of curing concrete, inside as well as outside; of not leaving curing to chance, but by incorporating curing in the mixture ingredients, by not leaving it up to the finishing foreman at midnight.
The life cycle of normal weight concrete structures, for instance parking garages, and outside walls, can be lengthened by making the concrete more durable, and durability is linked to low permeability and absence of cracking. IC with structural lightweight aggregate sand is a solution, Table 1.
Society wants the materials used to be ecologically correct, making the cement used be totally effective and not just serve as a filler, and making the structure last longer. Both support the Green effect.
Mass concrete is not cured appreciably by external curing. Internal curing will hydrate the interior cement by providing water when and where it is needed.
Concrete pipe and reinforced structural concrete need low permeability. The hydration of the cement not hydrated by the mixing water fills the pores and reduces the permeability. Desorbed water from LWAS can reduce the permeability 25% [27,29].
In most applications, the mortar is the weakest link in the strength of the concrete. Consequently, it is well to improve the mortar. This can be done through internal curing and can be further accomplished by using an IC agent that improves the rheology and the mortar strength. The choice of the optimum LWAS can assure both of these objectives. The object is to improve rather than detract from the mortar characteristics through the choice of the agent bringing IC water into the concrete mixture. Uses such as bridges, parking structures, pavements, walls and high-performance concrete are candidates for improvement of the mortar.

205
Table 1 – Applications of Internal Curing.
LO
W A
UT
OG
EN
OU
S S
HR
INK
AG
E
LE
SS
CR
AC
KIN
G
HIG
HE
R E
AR
LY
AG
E S
TR
EN
GT
H
HIG
HE
R 3
-DA
Y F
LE
XU
RA
L S
TR
EN
GT
H
7-D
AY
CO
MP
RE
SS
IVE
ST
RE
NG
TH
IN
3 D
AY
S
LO
WE
R T
UR
NA
RO
UN
D T
IME
LO
WE
R P
ER
ME
AB
ILIT
Y
IMP
RO
VE
D R
HE
OL
OG
Y
UT
ILIZ
AT
ION
OF
CE
ME
NT
LO
WE
R M
AIN
TE
NA
NC
E
GR
EA
TE
R D
UR
AB
ILIT
Y
US
E O
F H
IGH
ER
LE
VE
LS
OF
FL
Y A
SH
HIG
HE
R M
OD
UL
US
OF
EL
AS
TIC
ITY
SH
AR
PE
R E
DG
ES
GR
EA
TE
R C
UR
ING
PR
ED
ICT
AB
ILIT
Y
HIG
HE
R P
ER
FO
RM
AN
CE
ARCHITECTURAL CONCRETE * * * * * * BRIDGES
* * * * * * * * * * CONCRETE BLOCK
* * * * * * CONCRETE PIPE
* * * HIGHPERFORMANCE CONCRETE * * * * * * * * * * * HIGH FLY-ASH CONCRETE
* * * * * * MASS CONCRETE
* PAVEMENTS
* * * * * * * * * PARKING STRUCTURES
* * * * * * * * * PRECAST
* * * * * * * PRESTRESSED
* * * * * SELF-CONSOLIDATING CONCRETE * TILT-UP
* * *WALLS
* * * * *
All 14 uses receive all 16 benefits. The (*) indicates the most critical.
APPLICATIONS (USES) BENEFITTED BY INTERNAL CURING
USES BENEFITS
206
5. Summary and conclusions IC can contribute to accelerated construction technology transfers (ACTT), quicker turnaround times, higher performance, lower maintenance cost and more predictability. There is a pronounced trend away from prescriptive specifications for concrete to performance specifications (P2P). Since curing is an integral part of concrete performance, decision makers will incorporate internal curing in their requirements. Prime applications are concrete pavements. precast concrete operations, parking structures, bridges, Jersey barriers, HPC projects, and architectural concrete.
Concrete, in the 21st century, will be more controlled through the choice of ingredients rather than the uncertainties of construction practices and the weather. Instead of after-the-fact curing of concrete through external applications of water, concrete quality will be engineered through the incorporation of water absorbed within the internal curing agent. In the future, some lightweight aggregate will be incorporated in all better quality concrete.
References
[1] Hoff, G. C., The Use of Lightweight Fines for the Internal Curing of Concrete, Northeast Solite Corporation, Richmond, Va., USA, August 20, 2002, 37 pp., available at www.nesolite.com/reports/solitepaper.pdf (2002).
[2] Hoff, G.C., Internal Curing of Concrete Using Lightweight Aggregates, Theodore Bremner Symposium, Sixth CANMET/ACI, International Conference on Durability, Thessaloniki, Greece, June 1-7 (2003).
[3] Self-Desiccation and its Importance in Concrete Technology, Proceedings, International Research Seminar in Lund, Eds: B. Persson and G. Fagerlund, Report TVBM 3075, June 10, 20 papers, 255 pp. (1997).
[4] Self-Desiccation and its Importance in Concrete Technology, Proceedings, Second International Research Seminar in Lund, Eds: B. Persson and G. Fagerlund, Report TVBM 3085, June 18, 13 papers, 171 pp. (1999).
[5] Philleo, R., Concrete Science and Reality, Materials Science of Concrete II, Eds: J.P. Skalny, Mindess, American Ceramic Society, Westerville, Ohio, 1-8 (1991).
[6] Weber, S., Reinhardt, H.W., A New Generation of High Performance Concrete: Concrete with Autogenous Curing, Advanced Cement Based Materials, Vol. 6,No. 2, August, 59-68 (1997).
[7] Powers, T.C., Brownyard, T.L., Studies of the Physical Properties of Hardened Portland Cement Paste, Bulletin 22, Portland Cement Association, Skokie, Illinois, 992 pp. (1948).
[8] Mather, B., Hime, W.G., Amount of Water Required for Complete Hydration of Portland Cement, Concrete International, Vol. 24, No. 6, June, 56-58 (2002).
[9] Bonneau, O., Aitcin, P-C, Importance of Water Curing to Control the Initial Shrinkage Cracking and Durability of High Performance Concrete (HPC) Structures, Proceedings, Third International Conference on Concrete Under Severe Conditions, CONSEC ’01, Eds: N. Banthia, K. Sakai, O.E. Gjorv, University of British Columbia, Vancouver, Canada, 18-20 June, Vol. 2, 1271-1278 (2001).
[10] Bentz, D.P, Snyder, K. A., Protected paste volume in concrete – Extension to

207
internal curing using saturated lightweight fine aggregate, Cement and Concrete Research, Vol. 29, 1863-1867 (1999).
[11] van Breugel, K., de Vries, H., Potential of Mixtures with Blended Aggregates for Reducing Autogenous Deformation in Low Water/Cement Ratio Concrete,
Proceedings, 2nd
International Symposium on Structural Lightweight Aggregate Concrete, Eds: S. Helland, I. Holand, S. Smeplass, June 18-22, Kristiansand, Norway, 463-472 (2000).
[12] van Breugel, K., Kaptijin, N., de Bruijn, W. A., Effect of Paste Composition on
Autogenous and Drying Shrinkage of HSC – Grade B65, Proceedings, 6th
International Symposium on Utilization of High Strength/High Performance Concrete, Eds: G. Konig, F. Dehn, T. Faust, Leipzig, Germany, Vol. 2, 1477-1488 (2002).
[13] Lura, P., van Breugel, K., The Influence of the Moisture Flow from the LWA to
the Paste on the Early-Age Deformation of LWAC, Proceedings, 6th
International Symposium on Utilization of High Strength/High Performance Concrete, Eds: G. Konig, F. Dehn, T. Faust, Leipzig, Germany, Vol. 2, pp. 1149-1160 (2002).
[14] van Breugel, K., Lura, P., Effect of Initial Moisture Content and Particle Size Distribution of Lightweight Aggregates on Autogenous Deformation,
Proceedings, 2nd
International Symposium on Structural Lightweight Aggregate Concrete, Eds: S. Helland, I. Holand, S. Smeplass, June 18-22, Kristiansand, Norway, pp. 453-462 (2000).
[15] Tasdemir, M.A., Tasdemir, C., Grimm, R., Konig, G., Role of Aggregate Fraction in the Fracture of Semi-Lightweight High Strength Concrete,
Proceedings, 6th
International Symposium on Utilization of High Strength/High Performance Concrete, Eds: G. Konig, F. Dehn, T. Faust, Leipzig, Germany, Vol. 2, pp. 1453-1466 (2002).
[16] Bentur, A., Igarashi, S., Kovler, K., Prevention of autogenous shrinkage in high-strength concrete by internal curing using wet lightweight aggregates, Cement and Concrete Research, Vol. 31, No. 11, November, 1587-1591 (2001).
[17] Kohno, K., Okamoto, T., Isikawa, Y., Sibata, T., Mori, H., Effects of artificial lightweight aggregate on autogenous shrinkage of concrete, Cement and Concrete Research, Vol. 29, No. 4, April, 611-614 (1999).
[18] Roberts, J. W., McWhorter, Jr., J. F., Internal Curing, Northeast Solite Corporation, Saugerties, New York, 6 pp.
[19] Test Report from Professional Service Industries (PSI), Sterling, Virginia to Northeast Solite Corporation, Saugerties, New York, April 11 (2001).
[20] ACI, A Century of Progress, Supplement to Concrete International, American Concrete Institute, 123 pp. (2004).
[21] Mather, Bryant, Self Curing Concrete, Why Not? Concrete International, January pp. 46-47 (2001).
[22] Mather, Bryant, How Much W in – w/cm? Concrete International, December pp. 60-62 (2001).
[23] Weber, S., Reinhardt, H. W., Modeling the Internal Curing of High Strength Concrete Using Lightweight Aggregates, Theodore Bremner Symposium on

208
High Performance Lightweight Concrete, Sixth CANMET/ACI, International Conference on Durability, Thessaloniki, Greece, pp. 45 – 64, June 1-7 (2003).
[24] Bentz, D. P., Stutzman, P. E., Effects of Early Age Curing on Long Term Microstructure, April, ACI Spring Convention, New York (2005).
[25] Bentz, D. P., L., Petro, Roberts, J. W., Mixture Proportioning for Internal Curing, Concrete International, February, available at www.nesolite.com/icresearch.pdf (2005).
[26] Roberts, J., The 2004 Practice and Potential of Internal Curing of Concrete Using Lightweight Sand, Advances in Concrete Through Science and Engineering, March 2004, Northwestern University, Evanston, Illinois (2004).
[27] Roberts, J. W., Improving Concrete Pavements Through Internal Curing, Presented at the Open Session, American Concrete Institute Annual Convention, Detroit, Michigan, April 23, 12 pp. (2002).
[28] Bentz, D. P., Jensen, O. M., Mitigation Strategies for Autogenous Shrinkage Cracking, Cement and Concrete Composite, Vol. 26 (6), 677-685 (2004).
[29] Roberts, John, Internal Curing in Pavements, Bridge Decks and Parking Structures, Using Absorptive Aggregates to Provide Water to Hydrate Cement not Hydrated by Mixing Water, Concrete Materials and Placement Techniques Committee, A2E05 of Transportation Research Board, January, available at www.nesolite.com/reports/trb.materials.ic.pdf (2004).
[30] Crawl, D., Sutek, M., A Survey of High Performance Concrete Bridge Decks, Volume IV. District 12, Ohio DOT, 24 pp. (2002).
[31] Hoff, G. C., The Use of Structural Lightweight Aggregates in Offshore Concrete Platforms, Proceedings, International Symposium on Structural Lightweight Aggregate Concrete, Sandefjord, Norway, June 20-24, 349-362 (1995).
[32] Walum, R., Weng, J.K., Hoff, G.C., Nunez, R.A., The Use of High-Strength Modified Density Concrete in Offshore Structures, Proceedings, International Conference on Concrete Under Severe Conditions, Sapporo, Japan, August 1-4, Vol. 2, pp 1368-1377 (1995).
[33] Bentz, D. P., Geiker, M., Jensen, O.M., On the Mitigation of Early Age Cracking, International Seminar on Self-Desiccation and Its Importance in Concrete Technology, Lund, Sweden, 15 June, 195-204 (2002).
[34] Weber, S., Reinhardt, H. W., Manipulating the Water Content and Micro-structure of High Performance Concrete Using Autogenous Curing, Modern Concrete Materials: Binders, Additions and Admixtures, Eds: R.K. Dhir, T.D. Dyer, Thomas Telford, London, 567-577 (1999).
[35] van Breugel, K., de Vries, H., Mixture Optimization of Low Water/Cement Ratio, High-Strength Concretes in View of Reduction of Autogenous Shrinkage, Proceedings, International Symposium on High-Performance and Reactive Powder Concretes, Eds: P. C. Aitcin, Y. Delagrave, University of Sherbrooke, Quebec, Canada, 365-382 (1998).
[36] Bloem, D. L, Gaynor, R.D., Meininger, R.C., Concrete Strength Measurement – Cores vs. Cylinders, ASTM Vol. 65, pp. 668-696 (1965).
[37] Reinhardt, H.W., Zero-Curing High Performance Concrete, Proceedings, 2nd
Concrete and Masonry Symposium, SEI-ASCE, Paper No. T168-5 (1998). [38] Weber, S., Reinhardt, H. W., A Blend of Aggregates to Support Curing of
209
Concrete, Proceedings, International Symposium on Structural Lightweight Aggregate Concrete, Eds: I. Holand, T. A. Hammer, F. Fluge, 20-24 June, Sandefjord, Norway, 662-671 (1995).
[39] Lam, Hoa, Effects of Internal Curing Methods on Restrained Shrinkage and Permeability, University of Toronto, Thesis, February (2005).
[40] ACI 308, Standard Practice for Curing Concrete, ACI Manual of Concrete Practice, Part 2, American Concrete Institute, Farmington Hills, Michigan, 2002
[41] ACI 308R, Guide to Curing Concrete, American Concrete Institute, Farmington Hills, Michigan.

210
EFFECTS OF INTERNAL CURING METHODS ON
RESTRAINED SHRINKAGE AND PERMEABILITY
Hoa Lam, Dept. of Civil Engineering, University of Toronto, Canada R. Douglas Hooton, Professor, Dept. of Civil Engineering, University of Toronto, Canada
Abstract
Early age properties of concrete are vital to its long-term performance. In this study, the ability of internal curing methods was investigated including the use of super-absorbent polymers (SAP) and saturated lightweight aggregate to mitigate autogenous shrinkage and restrained shrinkage. The changes in properties of concrete and mortar, such as permeability, when SAP, lightweight aggregate or shrinkage reducing admixtures (SRA) are introduced to the mix, were also studied. The results showed that mortar containing SAP was able to minimize the amount of restrained shrinkage, but reduced the compressive and tensile strength similar to the effect of air-entraining concrete. SAP was also able to leave voids in the concrete, which simulate normal entrained air. SRA was most effective at reducing drying shrinkage. Lightweight aggregate resulted in an interlocking bond with the paste at the interfacial transition zone; thus increased its tensile strength properties. Concrete mixtures that contained the lightweight aggregate and SAP produced higher coulomb values using ASTM C1202. Proper dispersion of the SAP was difficult to achieve as evidenced by the SEM images.
1. Introduction
During hydration, the cement particles react with water to produce primarily calcium silicate hydrate (C-S-H), which is a nearly amorphous layered material that has the properties of a rigid gel. Hydration proceeds by a gradual reduction in the size of the anhydrous cement particles and the formation of a thickening layer, or shell, of C-S-H around the cement grains. The concrete is said to be ‘set’ once the shells from adjacent cement grains begin to interlink and develop shear strength. The continued hydration of the cement will gradually fill in the capillary pores, which are the remnants of the initially water-filled space. Therefore, it is vital that moisture is available to the concrete past setting to allow the cement to continue to hydrate.
T.C. Powers [1, 2] has shown that for complete hydration of the cement, the w/cm should be ~0.42 and above, however, it is almost impossible to hydrate all of the cement. As the w/cm decreases below ~0.42, the cement undergoes self-desiccation which leads to autogenous shrinkage. Autogenous shrinkage can also increase with the presence of supplementary cementing materials (SCM) such as silica fume which is commonly added to high performance concrete (HPC). Combined with mediocre curing methods at the construction site, the risk of forming cracks (micro or macro) can be extremely high. Concrete that cracks at such early ages will be detrimentally affected in terms of its permeability and strength during its life-cycle. To combat concrete cracking at early ages, contractors have utilized different forms of curing the concrete to maintain a high internal relative humidity (RH). Having high internal RH averts the build up of tensile forces in the voids within the concrete which are the key components in autogenous and

211
drying shrinkage. This scheme proved successful when the concrete elements were thin, high in w/cm, had lower binder contents and lacked SCM such as silica fume. Once this scheme is reversed, the concrete surface became denser and thus penetration of moisture to cure the mass of the concrete became difficult. The rationale for internal curing is to provide internal sources of water so that as the cement paste within the concrete hydrates, it will have continued access to sufficient moisture, even if the cement particles are deep within the mass of the concrete.
Concrete undergoes a considerable amount of deformation especially at early ages. Most of the deformation occurs within the paste fraction of the concrete due to water lost to the environment or through chemical reactions. Shrinkage in concrete would not pose any detrimental effect if the material was homogenous and was allowed to deform freely. However, concrete is a heterogeneous material and in real world scenario, concrete is usually restrained internally and externally, thus, micro and macro cracking may occur.
Restrained shrinkage in concrete can be categorized into three different scales: macroscopic, mesoscopic and microscopic [3]. The macroscopic scale defines the confinement of the surrounding materials such as subgrade, formwork or adjacent structural components. The macroscopic scale of restrained shrinkage may also be referred to as external restraint. The mesoscopic scale of restraint refers to restraint brought about by the aggregate or self-restraint due to the moisture gradient within the cement-paste matrix. Mesoscopic scale is also referred to as self-restraint. The microscopic level of restraint describes the hard phases in the cement paste such as hydrated cement grains or calcium hydroxide crystals.
Even though the visible cracks in concrete are usually formed by external restraints, the microcracks brought about by meso and micro restraints can be just as detrimental to the service life as that of external restraint cracks. Microcracks impact the concrete structure by means of “increasing the permeability and facilitating crack initiation and propagation under load” [3].
The simplest means of mitigating shrinkage is to increase the aggregate percentage in the concrete mix. Since it is the paste fraction of the concrete that undergoes the shrinkage process, minimizing the primary source of the deformation will result in a decrease of the shrinkage in the bulk concrete. Research [3] has indicated that the amount of drying shrinkage is 6-8 times smaller for concrete compared with just plain cement paste due to the restraint by aggregate fraction. Some of the construction methods of minimizing the amount of shrinkage in low w/cm and high binder concrete consist of: limiting the slab size with contraction joints; use of reinforced concrete or fiber-reinforced concrete; and extending the period of curing, or use of pre-stressed concrete.
Shrinkage of concrete can also be minimized by controlling the chemical composition of the cement powder. Tazawa [4] showed that by minimizing the amount of C3Scontent within the cement that is being used, the amount of chemical shrinkage that occurs will decrease. By minimizing chemical shrinkage, the amount of autogenous

212
shrinkage will also decrease. Tazawa [4] also showed that by utilizing cement that has a lower content of aluminate phases, the amount of autogenous shrinkage also decreases even when chemical shrinkage values are similar. In construction, however, it may not be feasible to obtain the optimum phase composition of cement powder to reduce the shrinkage levels; thus, chemical admixtures may help. These chemical admixtures consist of an additive that either minimizes the shrinkage (shrinkage reducing admixtures) or undergoes early expansion to counter the effects of shrinkage (shrinkage compensating concrete).
One way of mitigating shrinkage is by use of internal curing. Internal curing involves placing a material within the bulk concrete that will release water as needed by the surrounding paste. One method for internal curing is the replacement of the normal aggregate in the concrete with saturated lightweight aggregate. As well, Jensen and Hansen [5] successfully utilized super-absorbent polymers (SAP) (similar to those found in baby diapers) to effectively provide water at early ages to the cement paste internally.
The key factors for the success of internal curing are the dispersion of the internal curing products, the quantity of water that the product can hold in its reservoir, and the release time of the water.
Lightweight aggregates have been used in concrete for many years on bridges and buildings; however, their main benefit and reason for being utilized was due to their reduction in dead load, and improved heat and sound insulation, and the ability to better resist fire compared with normal weight concrete. The property of lightweight aggregate that allows for the above mentioned benefits is its vast network of internal capillaries and pores. In the early 1990’s Philleo [6] showed how saturated lightweight fine aggregate could improve the curing of the concrete. The vast network of internal capillaries is the key component to the ability of lightweight aggregate to store and release the necessary water. K. Kohno et al, [7] showed that as the level of moisture absorbed by the lightweight aggregate increased, the amount of autogenous shrinkage decreased. Other researchers [8] also came to the conclusion that saturated lightweight aggregate decreased both autogenous shrinkage and restrained shrinkage.
The drawback of using lightweight aggregate as a method of internal curing is the potential for decreases in strength and stiffness of the concrete. Increasing the replacement levels of lightweight aggregate may decrease the strength of the concrete as the lightweight aggregate is usually weaker than normal weight aggregate. In addition, lightweight aggregates must be fully saturated to prevent absorption of moisture from the paste, which may cause an increase in shrinkage.
Absorptions of water by lightweight aggregate can range from 5 to 25% [9] in 24 hours. Bentz and Snyder [10] in their study derived an equation to determine the adequate amount of lightweight fine aggregate replacement levels in HPC. The equation is based upon the amount of water that is needed to compensate for the chemical shrinkage.

213
Super-absorbent polymers, primarily used in personal care products such as disposable diapers as a medium for liquid storage, are chains of polymers interconnected with each other and have dissociated, ionic functional groups. In contact with water, the SAP with its high affinity for water will swell in to a gel-like substance. The SAP will continue to swell, until it has reached its threshold for absorption, which can vary from 20 times to 2000 times its own mass in water [11]. Jensen and Hansen [11] were the first to publish on the use of SAP as a ‘water entrainment’ additive to concrete to prevent self-desiccation. In their experimental findings [5], they concluded that the entrained SAP was able to mitigate autogenous deformation and maintain a high relative humidity within the bulk cement pastes.
As mentioned earlier, the main mechanism for drying shrinkage is the build up of internal negative pressure within the capillary network of the bulk cement paste as water menisci form. Shrinkage-reducing admixtures (SAP) were recently developed which reduce the surface tension of water to lower the capillary pressure (~40 dynes/cm [12]). SRA can be mixtures of different chemicals such as propylene glycol derivatives (eg. EclipseTM from Grace), or polyoxyalkylene alkyl ethers [13]. The advantage of SRA over competing products like shrinkage compensating concrete is that SRA does not undergo any early age expansion to compensate for the shrinkage [12]. In addition, SRA can also be used as a topical application to prevent shrinkage [13]. Bentz et al. [14] showed that the use of SRA as a curing layer was also very effective at preventing water loss compared to specimens that had SRA added during mixing.
2. Experimental program
The cements used were CSA Type 10 Portland cement and Type 10SF blended silica fume cement (~8% SF) from Lafarge Canada. The cement compositions are shown in Table 1.
Table 1-Oxide and compound compositions of cement for tested concrete and mortar. Typical Oxide
Comp. (%) CaO SiO2 Al2O3 Fe2O3 MgO SO3
Equiv.Alkalis
LOIBlaine(m2/kg)
Type 10 64.7 20.4 5.0 2.5 2.6 2.9 0.4 1.4 398 Type 10SF 58.7 26.7 4.4 2.6 2.5 2.8 0.4 1.4 634
The normal weight aggregates used in the concrete mixes consisted of a local glacial sand and crushed 10 mm limestone. The fineness of the glacial sand was 2.82. The lightweight aggregate (LWA) and sand (LWS) were supplied by Northeast Solite and consisted of 19 mm sized stone and coarse sand (from expanded shale). The absorption, bulk and apparent density values for these aggregates are shown in Table 2. Figure 1 illustrates the sieve size distribution in percent passing of the aggregate.
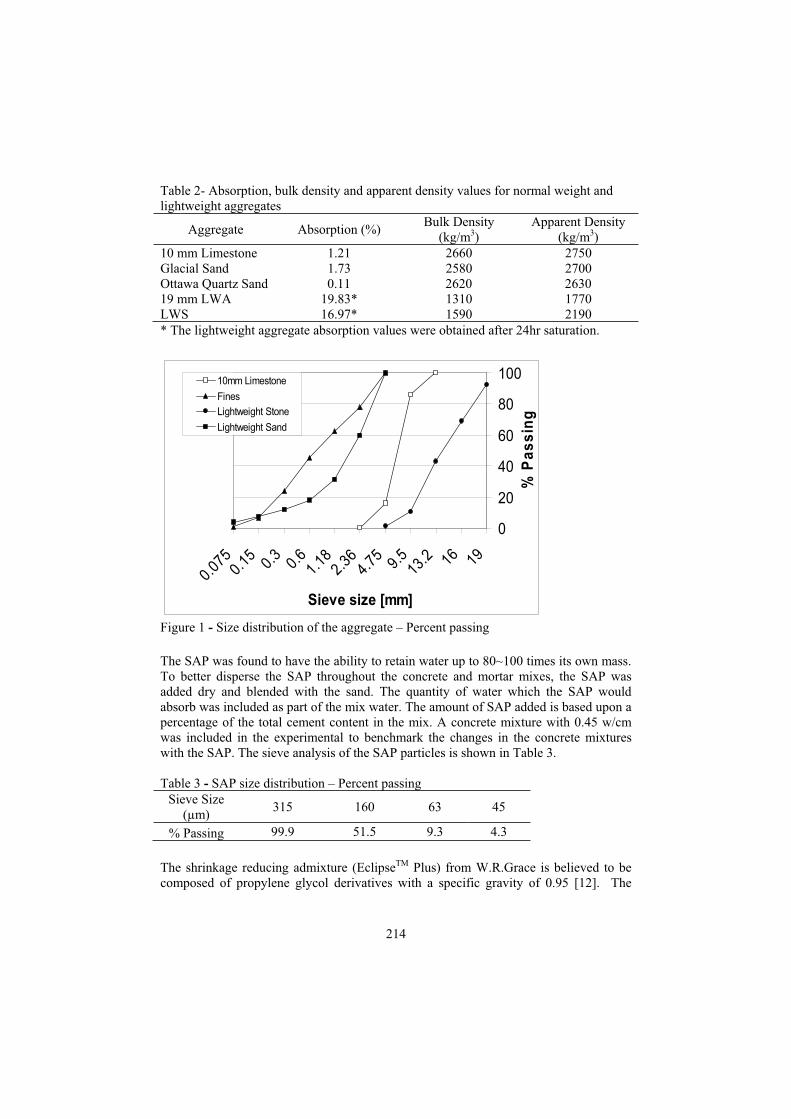
214
Table 2- Absorption, bulk density and apparent density values for normal weight and lightweight aggregates
Aggregate Absorption (%) Bulk Density
(kg/m3)Apparent Density
(kg/m3)10 mm Limestone 1.21 2660 2750 Glacial Sand 1.73 2580 2700 Ottawa Quartz Sand 0.11 2620 2630 19 mm LWA 19.83* 1310 1770 LWS 16.97* 1590 2190 * The lightweight aggregate absorption values were obtained after 24hr saturation.
0
20
40
60
80
100
191613
.29.54.
752.3
61.
180.6
0.30.
15
0.075
Sieve size [mm]
% P
as
sin
g
10mm Limestone
Fines
Lightweight Stone
Lightweight Sand
Figure 1 - Size distribution of the aggregate – Percent passing
The SAP was found to have the ability to retain water up to 80~100 times its own mass. To better disperse the SAP throughout the concrete and mortar mixes, the SAP was added dry and blended with the sand. The quantity of water which the SAP would absorb was included as part of the mix water. The amount of SAP added is based upon a percentage of the total cement content in the mix. A concrete mixture with 0.45 w/cm was included in the experimental to benchmark the changes in the concrete mixtures with the SAP. The sieve analysis of the SAP particles is shown in Table 3.
Table 3 - SAP size distribution – Percent passing Sieve Size
(µm) 315 160 63 45
% Passing 99.9 51.5 9.3 4.3
The shrinkage reducing admixture (EclipseTM Plus) from W.R.Grace is believed to be composed of propylene glycol derivatives with a specific gravity of 0.95 [12]. The
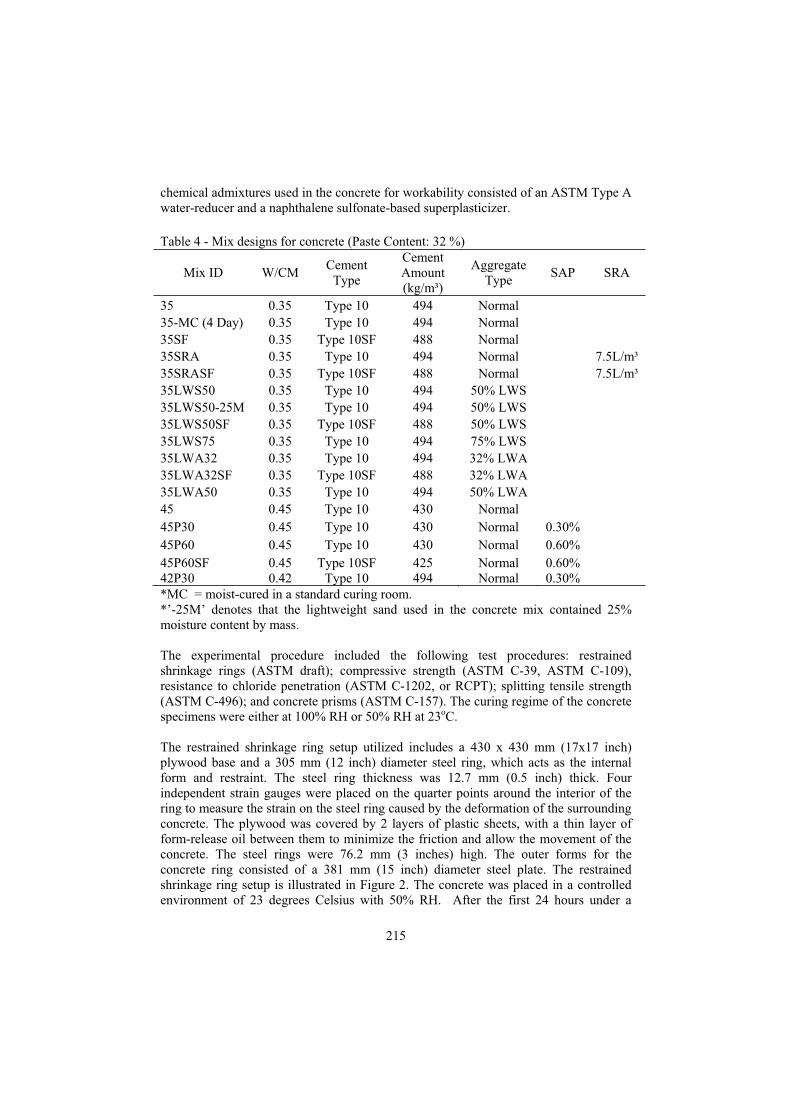
215
chemical admixtures used in the concrete for workability consisted of an ASTM Type A water-reducer and a naphthalene sulfonate-based superplasticizer.
Table 4 - Mix designs for concrete (Paste Content: 32 %)
Mix ID W/CM Cement
Type
Cement Amount (kg/m³)
AggregateType
SAP SRA
35 0.35 Type 10 494 Normal 35-MC (4 Day) 0.35 Type 10 494 Normal 35SF 0.35 Type 10SF 488 Normal 35SRA 0.35 Type 10 494 Normal 7.5L/m³ 35SRASF 0.35 Type 10SF 488 Normal 7.5L/m³ 35LWS50 0.35 Type 10 494 50% LWS 35LWS50-25M 0.35 Type 10 494 50% LWS 35LWS50SF 0.35 Type 10SF 488 50% LWS 35LWS75 0.35 Type 10 494 75% LWS 35LWA32 0.35 Type 10 494 32% LWA 35LWA32SF 0.35 Type 10SF 488 32% LWA 35LWA50 0.35 Type 10 494 50% LWA 45 0.45 Type 10 430 Normal
45P30 0.45 Type 10 430 Normal 0.30%
45P60 0.45 Type 10 430 Normal 0.60%
45P60SF 0.45 Type 10SF 425 Normal 0.60% 42P30 0.42 Type 10 494 Normal 0.30% *MC = moist-cured in a standard curing room. *’-25M’ denotes that the lightweight sand used in the concrete mix contained 25% moisture content by mass.
The experimental procedure included the following test procedures: restrained shrinkage rings (ASTM draft); compressive strength (ASTM C-39, ASTM C-109), resistance to chloride penetration (ASTM C-1202, or RCPT); splitting tensile strength (ASTM C-496); and concrete prisms (ASTM C-157). The curing regime of the concrete specimens were either at 100% RH or 50% RH at 23oC.
The restrained shrinkage ring setup utilized includes a 430 x 430 mm (17x17 inch) plywood base and a 305 mm (12 inch) diameter steel ring, which acts as the internal form and restraint. The steel ring thickness was 12.7 mm (0.5 inch) thick. Four independent strain gauges were placed on the quarter points around the interior of the ring to measure the strain on the steel ring caused by the deformation of the surrounding concrete. The plywood was covered by 2 layers of plastic sheets, with a thin layer of form-release oil between them to minimize the friction and allow the movement of the concrete. The steel rings were 76.2 mm (3 inches) high. The outer forms for the concrete ring consisted of a 381 mm (15 inch) diameter steel plate. The restrained shrinkage ring setup is illustrated in Figure 2. The concrete was placed in a controlled environment of 23 degrees Celsius with 50% RH. After the first 24 hours under a
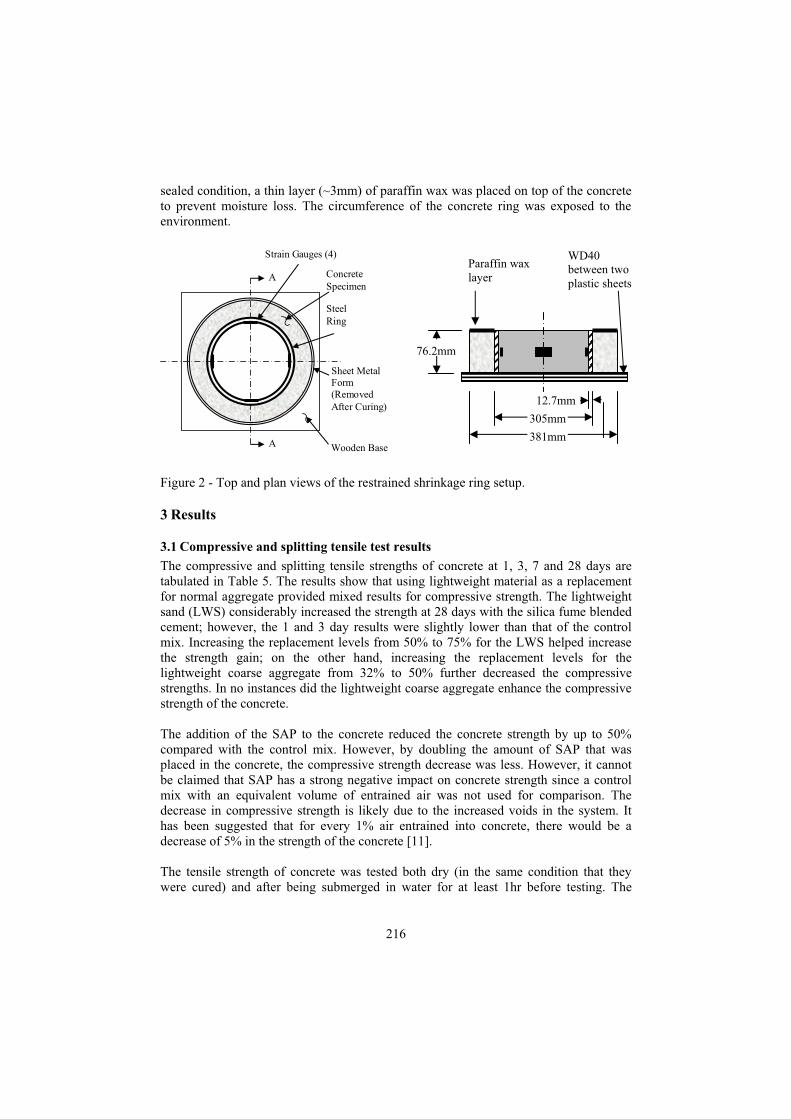
216
sealed condition, a thin layer (~3mm) of paraffin wax was placed on top of the concrete to prevent moisture loss. The circumference of the concrete ring was exposed to the environment.
Strain Gauges (4)
Concrete Specimen
Steel Ring
Sheet Metal Form (Removed After Curing)
Wooden Base A
A
Figure 2 - Top and plan views of the restrained shrinkage ring setup.
3 Results
3.1 Compressive and splitting tensile test results
The compressive and splitting tensile strengths of concrete at 1, 3, 7 and 28 days are tabulated in Table 5. The results show that using lightweight material as a replacement for normal aggregate provided mixed results for compressive strength. The lightweight sand (LWS) considerably increased the strength at 28 days with the silica fume blended cement; however, the 1 and 3 day results were slightly lower than that of the control mix. Increasing the replacement levels from 50% to 75% for the LWS helped increase the strength gain; on the other hand, increasing the replacement levels for the lightweight coarse aggregate from 32% to 50% further decreased the compressive strengths. In no instances did the lightweight coarse aggregate enhance the compressive strength of the concrete.
The addition of the SAP to the concrete reduced the concrete strength by up to 50% compared with the control mix. However, by doubling the amount of SAP that was placed in the concrete, the compressive strength decrease was less. However, it cannot be claimed that SAP has a strong negative impact on concrete strength since a control mix with an equivalent volume of entrained air was not used for comparison. The decrease in compressive strength is likely due to the increased voids in the system. It has been suggested that for every 1% air entrained into concrete, there would be a decrease of 5% in the strength of the concrete [11].
The tensile strength of concrete was tested both dry (in the same condition that they were cured) and after being submerged in water for at least 1hr before testing. The
76.2mm
12.7mm
305mm
381mm
Paraffin wax layer
WD40between two plastic sheets

217
results for the concrete that were tested dry were not expected to have tensile strength decrease either on the 3rd or 7th day. This did not occur in all the specimens, but was rather common in the control mixes (35 and 35SF) and in a few mixes with the internal curing materials. An explanation of this occurrence may be linked to the moisture that is within the concrete. By the 3rd to 7th day of age, there exists a large moisture gradient from the center of the cylinder to the surface, thus, affecting the tensile strength of the concrete. When testing the concrete submerged in water for 1 hour prior to testing, the phenomenon was not as noticeable.
Even though the SAP had a negative effect on the compressive strengths of concrete, it did significantly improve the tensile strength properties at 28 days compared to the control mix. The LWS and SRA mix also increased the tensile strength of the concrete at both 1 and 28 days. As expected, the concrete mix with the blended silica fume cement had the highest early strength gain due to the high reactivity of the silica fume in the paste. The moist cured specimen did not show any noticeable improvement until 3 days.
Table 5 - Compressive and Splitting Tensile Test Results for Concrete Compressive Strength (MPa) Tensile Strength (MPa)
Curing: 23 degree/50%
humidity
Curing:MoistCuringRoom
Curing: 23 degree/50%
humidity
*Tested After 1hr Submerged
in Water Mix ID
1 3 7 28 7 28 1 3 7 28 3 7 28
35 28 46 51 57 57 67 2.3 3.5 3.8 3.6 3.8 4.0 3.9
35-MC 28 47 55 65 N/A N/A 2.3 4.1 4.4 4.7 N/A 4.6 4.1
35SF 34 48 55 62 63 76 3.1 3.8 4.0 4.2 4.5 4.0 4.2
35SRA 30 40 44 50 47 54 2.9 3.5 3.8 4.5 3.6 4.3 4.0
35SRASF 29 42 51 59 51 63 2.9 3.8 3.9 4.3 3.4 4.5 4.4
35LWS75 26 44 53 60 50 61 2.7 3.7 4.2 4.1 4.1 4.9 4.0
35LWS50SF 33 46 56 70 59 71 3.2 4.1 4.0 4.6 4.7 4.8 4.4 35LWS50-
25M25 40 47 53 45 53 2.4 4.0 4.3 4.5 3.3 4.8 3.5
35LWS50 29 48 53 58 53 63 2.8 3.9 4.1 4.7 3.9 4.2 4.3
35LWA32 25 38 45 50 41 51 2.6 3.2 3.9 3.9 3.0 3.8 3.7
35LWA32SF 23 43 47 54 51 61 2.7 3.4 3.6 4.5 4.4 4.5 3.1
35LWA50 25 36 41 44 40 43 2.5 3.3 3.3 3.5 3.3 4.1 3.5
45 22 34 42 48 43 53 2.2 2.9 3.8 4.0 3.4 2.9 3.0
45P30 14 29 35 41 35 43 2.0 3.0 3.2 4.1 3.0 3.7 3.9
45P60 18 31 41 44 38 48 1.9 3.1 3.7 4.9 3.0 3.7 4.1
45P60SF 23 38 44 53 45 56 2.5 4.0 4.0 4.4 3.8 3.6 4.2
42P30 22 36 43 47 40 52 2.5 3.4 3.6 3.5 3.6 3.4 4.3
* Curing: 23 degree/50% humidity

218
To narrow down the factors that contributed to the increase in strength with the replacement of normal sand by lightweight sand, compressive strength tests were also done on mortar specimens with lightweight sand sieved to match the size distribution of standard ASTM C-109 Ottawa sand. The results shown in Figure 3 clearly illustrate that size distribution of the aggregate was an important factor in the strength increase when using lightweight sand replacement since the LWS material that was sieved to match the sieve profile of the Ottawa sand had compressive strengths that were within the same range as that of the control mix.
Figure 3 - Compressive strength of mortar cubes comparing lightweight sands *Mix ID that end with the letter ‘S’ are mortar mixtures that used lightweight sand that was sieved to the same size distribution as Ottawa sand.
3.2 Concrete and mortar prisms (drying shrinkage)
The results (Figure 4) for shrinkage of concrete prisms span from 1 day to 90 days. The concrete that showed the least amount of drying shrinkage was the SRA mix. The uncured SRA mix results were similar to that of the control mix which was externally moist cured for 4 days. The lightweight aggregate along with the SAP only showed a slight improvement in the drying shrinkage results.
Silica fume cement resulted in a decrease in shrinkage when compared to an identical mix with just Type 10 cement. It is generally believed that the addition of silica fume to concrete will increase its shrinkage; however, from those results, silica fume prevented some of the shrinkage.
20
30
40
50
60
70
80
90
0 5 10 15 20 25 30
Age [days]
Co
mp
res
siv
e S
tre
ng
th [
MP
a]

219
-0.10
-0.08
-0.06
-0.04
-0.02
0.00
0.02
0 20 40 60 80 100
Age [days]
Pe
rce
nt
sh
rin
ka
ge
35 35-MC 35SF
45P60 35LWS50 35SRA
Figure 4 - Length change of concrete prisms due to drying shrinkage (exposed to drying on all surfaces).
Figure 5 illustrates the results from shrinkage of mortar bars. The results show that the size distribution of the aggregate did not influence the amount of shrinkage that occurs. In addition, Figure 5 also illustrates that by increasing the replacement levels of the lightweight sand from 40 to 60%, the amount of shrinkage did not decrease.
-0.20
-0.16
-0.12
-0.08
-0.04
0.00
0 20 40 60 80 100
Age [days]
Perc
ent shri
nkage
M35
M35LWS40
M35LWS40S
M35LWS60
M35LWS60S
M35LWS40SF
M35LWS40SFS
Figure 5 - Percent shrinkage of mortar bars due to drying shrinkage exposed to 23oCand 50% RH with different replacement levels of lightweight sand (LWS). *Mix ID that end with the letter ‘S’ are mortar mixtures that used lightweight sand that was sieved to the same size distribution as Ottawa sand.

220
3.3 Restrained shrinkage rings
To compare the results from the restrained shrinkage rings, a series of procedures had to be performed. These included determining the strain at cracking, the time to cracking, and calculation for the parameters 1 and G. These procedures follow that of See et al [15]. The time to cracking and the strain at cracking was determined by analyzing the plot of steel ring strain versus time (Figure 6).
-50
-40
-30
-20
-10
0
10
20
30
40
0 2 4 6 8 10 12 14
Time after casting [days]
Ste
el
rin
g s
tra
in [
-str
ain
]
Strain at cracking
Time to cracking
Figure 6 - Typical determination of strain and time to cracking for the restrained shrinkage rings (mix 35SF)
Initial positive strain on the steel ring, as illustrated in Figure 6, could have been caused by small increases in concrete temperature resulting from hydration of the cement, thus leading to thermal deformation of the steel ring.
The results from Table 6 and Figure 7 clearly depict that the concrete that had the longest time to cracking was the one containing the SRA. The control mixes with both the Type 10 and Type 10SF cements cracked within 7 days. Increasing the w/cm from 0.35 to 0.45 extended the cracking time to 11-14 days. Using lightweight sand to substitute for half of the sand in the mix doubled the time to cracking compared to the control mix. The results from using lightweight sand were similar to moist curing control specimens for 4 days. The concrete mix with the SAP further extended the time to cracking to about 25 days. The maximum induced tensile stress due to drying was calculated using equation (1):
maxmax G (1)
where max is the max strain of the steel at time of cracking of the concrete.

221
Table 6 - Summary of restrained shrinkage ring test for concrete. Curing: 23oC/50% RH
Mix ID Time-to-Cracking(Days)
Steel Ring Strain @ Cracking (µ-strain)
Stress rate @ cracking (MPa/day)
StrainRate
Factor, 1
Maximum Tensile
Stress ( max)(MPa)
35-Ring1 4.8 -35.6 0.56 -33.6 2.6 35-Ring2 6.1 -34.6 0.33 -22.5 2.5 35MC-Ring1 14.9 -47.8 0.21 -22.6 3.5 35LWS50-Ring1 13.7 -40.0 0.15 -15.7 2.9 35LWS50-Ring2 15.2 -59.7 0.18 -19.7 4.3 35SRA-Ring1 53.7 -51.1 0.03 -6.4 3.7 35SRA-Ring2 47.0 -37.8 0.03 -5.5 2.7 35SF-Ring1 3.3 -37.7 0.98 -48.6 2.7 35SF-Ring2 6.4 -37.7 0.54 -37.3 2.7 45-Ring1 11.7 -56.4 0.20 -19.1 4.1 45-Ring2 14.6 -27.6 0.10 -11.0 2.0 45P60-Ring1 24.0 -66.6 0.11 -14.6 4.8
45P60-Ring2 26.3 -44.0 0.07 -9.7 3.2
-60
-50
-40
-30
-20
-10
0
10
20
30
40
0 10 20 30 40 50 60
Time after casting [days]
Ste
el r
ing
str
ain
[µ-s
train
]
45-Ring2 35LWS50-Ring1 35SF-Ring2
45P60-Ring2 35-Ring2 35SRA-Ring2
35MC-Ring1
Figure 7 - Summary of restrained shrinkage ring test. Curing: 23oC/50% RH
3.4 Rapid Chloride Permeability Test, RCPT
In Table 7, the RCPT results reflect the benefits of adding silica fume to concrete. With the addition of silica fume, the RCPT values were reduced by a factor of more than 8. Other important factors that improved the RCPT values included: decreasing w/cm ratio, increasing the age of the concrete, and moist curing the specimens.

222
At 28 days, the mix that had the lowest RCPT values, when cured at 23oC/50% RH, was 35SRASF. It is interesting to note that all the SRA mixes increased in RCPT value when the specimen was subjected to moist curing. All other mixes decreased in coulomb value when moist cured for 28 days. The reason maybe related to the SRA washing out from the specimen.
Use of the lightweight aggregate resulted in lower RCPT values, as was also found elsewhere [16]. The reason is likely associated with the added benefit of increased C-S-H and the improved ITZ between the paste fraction and the aggregate.
Table 7 - Rapid chloride permeability test results at 28 and 90 days
RCPT (Coulombs) @ 6 Hours 28 Days 90 Days Mix ID
23oC/50% RH
Moist Curing Room
23oC/50% RH
Moist Curing Room
35 6412 6141 4740 3964 35SF 1532 614 2236 552 35SRA 4191 5895 1660 3435 35SRASF 497 800 445 549 35LWS75 5867 4105 5537 1969 35LWS50-25M 7516 6135 6044 3004 35LWS50 6409 5106 4225 2572 35LWA32 8047 6981 5844 3806 35LWA32SF 1827 999 1986 571 35LWA50 5566 6334 5158 4158 45 8569 5449 7254 4836 45P30 13769 7030 7671 4506 45P60 8395 5584 6321 3873 45P60SF 1844 674 1205 874 42P30 9515 6369 6456 4108
As expected, the RCPT results at 90 days were lower than those at 28 days. However, the mixes that contained silica fume and were left to cure in the 23oC/50% RH environment had higher coulomb values. This might be attributed to microcracks formed due to self-desiccation. The coulomb values for the SRA mix increased when the specimens were moist cured compared to 23oC/50% RH for 90 days.
4 Discussions
4.1 Super-absorbent polymer
The SAP was initially included in the concrete mix pre-saturated with the entrained water by an amount of 0.10 w/cm thus, providing the concrete that was initially 0.35 w/cm with an equivalent amount of water to equal that of 0.45 w/cm. In theory, the entrained water in the SAP would have acted like a reservoir to the cement particles

223
during hydration to offset the water consumed by earlier hydration of the cement particles. The SAP particles tended to adhere to one another due to the chemical properties of the SAP (ionic charges) which lead to the problem of particle dispersion in the bulk concrete. This issue was resolved by adding the SAP particles in a dry state with the aggregate in the initial mixing. The dry aggregate particles assisted in the dispersion of the SAP particles. Mixing water of 0.45 w/cm was used in the expectation that the SAP would consume the excess mixing water and preserve it for later stages of hydration, thus making the 0.45 w/cm mix behave similar to one of 0.35 w/cm.
Even though care was taken to disperse the SAP particles, it was evident that some of the SAP particles had flocculated as shown in Figure 8. The image shows a large void in the mortar that seems to have been inhabited previously by a cluster of attached SAP. Selected specimens of mortars were studied using scanning electron microscopy (SEM) and energy-dispersive X-ray (EDX) analysis to observe their microstructural properties. The specimens for SEM were air cured at 23oC and 50% relative humidity 1 day after casting. The SEM specimens were prepared using epoxy impregnation and polishing using materials and methods that are non-damaging to water-sensitive materials.
Figure 8 - SEM image of a mortar mix containing 0.6% SAP by mass of cement, illustrating the dispersion problems with SAP.
SEM images (Figure 9 and 10) showed that by mixing the concrete with SAP, the concrete gets the added benefit of being air-entrained due to the small voids that the SAP leaves behind upon drying. Tests performed according to ASTM C-457 on one specimen (45P60) indicated that the air content of the concrete was equivalent to 4% with an acceptable bubble spacing factor as 0.208 mm.

224
Figure 9 and 10 - SEM image of a mortar mix containing 0.6% SAP by mass of cement with detailed look at the void and rim of the relic of the SAP particle.
EDX microanalysis of the chemical composition from the remnants of SAP particle’s rim (Figure 9) indicates that the two major inorganic constituents were Ca2+ and K+. The Ca2+ and K+ may have attached to the SAP at early ages due to the negative charges from the COO- molecules on the SAP. Doing so, may mean that the Ca2+ and K+
dissociated the water molecules from the COO- molecules, thus, assisting in the freeing of the entrained water from the SAP particles.
In general, SAP has potential as an additive to internally cure concrete via ‘water entrainment’. Similar to the chemical admixtures used in concrete, SAP also needs to be tested with the mixture prior to use to ensure compatibility. The SAP’s ability to entrain water resides in its physical and ionic properties thus, different cementitious materials and chemical admixtures could react differently with the SAP than found here. In addition, different SAP manufacturers may produce a SAP that has different physical and ionic properties as well, which may or may not have added value for internal curing.
4.2 Lightweight aggregates
Even though the lightweight sand aggregate could potentially absorb moisture up to 25% at 7 days, it was found that the optimum absorption value was 17%. It may seem that the additional water in the lightweight aggregate can provide additional curing for the paste; however, the effect might be that the additional water prevents the cement paste from forming the interlocking interface along the aggregate face. This occurrence would create more voids along the aggregate face as the water is drawn from the lightweight aggregate to the paste. Results from the density, absorption, and void test for concrete showed that the absorption value for mix 35LWS50-25M had an absorption value of 8.5% while mix 35LWS50 was only 6.6%. The volume of permeable pore space for the 35LWS50-25M mix also increased from 14.6% to 18.4% compared with mix 35LWS50. This also resulted in the 35LWS50-25M mix having higher RCPT values, and slightly lower compressive and tensile strengths.
Rim from the
remnants of SAP

225
Figures 11 - Optical microscope image of the ITZ interface of lightweight aggregate in concrete. (Mix 35LWA50). Image size approximately 2.8 mm x 2.6 mm.
Figure 12 - Optical microscope image of the ITZ interface of lightweight sand in concrete. (Mix 35LWS50). Image size approximately 1.9 mm x 1.8 mm
Microcracks due to self-desiccation usually propagate from capillaries and ITZ of the concrete matrix. The ITZ is one of the weakest components in the bulk concrete because the porosity is generally higher and because of the increased amount of Ca(OH)2 found there. Many studies [9], including this one have found that the ITZ with lightweight aggregate is comprised of interlocking paste and aggregate. Figures 11 and 12 illustrate that it is difficult to distinguish the separation between the lightweight aggregate and the paste. When the paste is in a plastic state, it would seem that some of the paste is drawn into the lightweight aggregate by suction. As the cement hydrates, the voids in the lightweight aggregate allow the C-S-H structure to form and grow with minimal hindrance. This occurrence may explain the increase in compressive and tensile strengths of the lightweight aggregate concretes. As well, the RCPT values of the lightweight aggregate were slightly lower than that of the control mix which would indicate that the pores of the lightweight aggregate were blocked off or that the ITZ was less permeable. Chandra and Berntsson [17] suggested that the lightweight aggregate also had the ability to absorb internal bleed water that is commonly trapped on the face of the aggregate as it tries to rise to the surface. The phenomenon of absorption by the lightweight aggregate is supposed to decrease the porosity of the concrete at the interface between the aggregate with the cement paste.
Lightweight aggregate comes in different physical shapes, sizes and mechanical properties; thus the use of lightweight aggregate for use as an internal curing product needs to be tested prior to use. However, since there are minimal chemical reactions that occur to the aggregate when in contact with the cement paste, then the lightweight aggregate acts only as a water reservoir within the system. It was also found that lightweight sand is favorable over lightweight coarse aggregate for internally curing concrete. The lightweight sand was better dispersed within the concrete system and had little effect on the permeability and strength properties of the concrete.
Lightweight Sand
Paste
Transition Zone Lightweight Stone
Transition ZonePaste

226
4.3 Shrinkage reducing admixture
The SRA mix resulted in a significant reduction in drying shrinkage in both the mortar and concrete, which coincides with results found by others [18]. During drying, menisci form in the fine capillary pore network. These menisci can cause micro-cracking in the cement paste due to the resultant tensile stresses, especially at early ages.
Compared with the internal-curing products (SAP and lightweight aggregate) used, the SRA was the easiest to handle and prepare. There were no problems with preparation or dispersion. The drawback of using SRA as an admixture is the decrease in compressive strength properties. To compensate for the decrease in compressive strength, a reduction in the w/cm of the mix can offset this change.
5. Conclusions and recommendations
The expanded use of HPC containing low w/cm and a higher percentage of cement binder material in concrete has further accelerated the need to better understand the chemical and mechanical consequences of early age shrinkage and a means of mitigating it. The use of SAP, lightweight aggregate and SRA were experimentally investigated in this research to determine their effectiveness in mitigating autogenous and drying shrinkage while improving the mechanical and physical properties of the bulk concrete.
The following conclusions were drawn from this research:
1. SRA reduced the drying shrinkage significantly under ASTM C-157 and prolonged the net-time to cracking in the restrained shrinkage ring test. However, the moist-cured SRA specimen increase the RCPT values compared to the non-moist cured specimens.
2. Lightweight sand was more effective at internal curing than lightweight coarse aggregate as evidenced by the decrease in permeability and increase in tensile and compressive strengths.
3. In general, the use of lightweight aggregate and SAP produced higher coulomb values using RCPT, this may be due to the increase in pore volume and sizes brought about by these IC products.
4. The use of silica fume blended cement, when applied in the same paste volume, did not show a significant increase in drying shrinkage compared with CSA Type 10 portland cement.
5. The restrained shrinkage ring test was effective at determining the tensile and drying shrinkage properties of concrete.
6. It was found that the ITZ of lightweight aggregate concrete was superior to that of normal weight aggregate concrete due to the interlocking exhibited by paste with the pores at the surfaces of the aggregate.
7. The use of SRA may be most favorable for use in construction because of its ease of inclusion and dispersion in the concrete mixture.
8. The effect of doubling the dosage of the SAP from 0.3% by mass of cement to 0.6%, increased the ultimate drying shrinkage, and increased the compressive strength of the concrete. The use of 0.6% SAP resulted in better improvements to the properties of concrete mortar compared to 0.3% SAP.

227
9. Lightweight sand size distribution did not influence the ultimate drying shrinkage of mortar. However, it did influence the compressive strength of mortar cubes.
The following recommendations are made:
1. Further studies on the interaction of SAP particles with cement to better understand the movement of moisture to and from the SAP.
2. Further studies to better disperse and water-entrain SAP for use in concrete and mortar.
3. Investigation of the physical effects on silica fume at early age and its influence on autogenous shrinkage and chemical shrinkage
Acknowledgements
The authors would like to thank the Portland Cement Association for providing the fellowship to Hoa Lam. They would like to also thank Ole Mejhede Jensen for supplying the SAP as well as advice on its use, John Roberts for supply of lightweight aggregates, and for his assistance, Grace Construction Products for supply of the shrinkage reducing admixture, and Lafarge for the cements.
References
[1] Powers, T.C., A Discussion of Cement Hydration in Relation to the Curing of Concrete. Proceedings of the Highway Research Board. 1947. Vol. 27. Washington D.C.
[2] Powers, T.C., The Nonevaporable Water Content of Hardened Portland-Cement Paste—Its Significance for Concrete Research and Its Method of Determination. 1949. ASTM Bulletin No. 158: p. 68-76.
[3] Bisschop, J., Drying Shrinkage Microcracking in Cement-Based Materials. 2002, Delft University Press, Netherlands.
[4] Tazawa, E., Autogenous Shrinkage of Concrete. Proceedings of the International Workshop Organized by JCI. 1998
[5] Jensen, O.M. and Hansen, P.F., Water-Entrained Cement-Based Materials II. Experimental Observations. Cement and Concrete Research, 2002. 32: p. 973-978
[6] Philleo, R., Concrete science and reality, Materials Science of Concrete II, American Ceramic Society, J.P. Skalny, S. Mindess (Editors), Westerville, OH, 1991. p. 1-8
[7] Kohno, K., Okamoto, T., Isikawa, Y., Sibata, T., Mori, H.. Effects of Artificial Lightweight Aggregate on Autogenous Shrinkage of Concrete. Cement and Concrete Research, 1999. 29: p. 611-614
[8] Bentur, A., Igarashi, S., Kovler, K., Prevention of Autogenous Shrinkage in High-Strength Concrete by Internal Curing Using Wet Lightweight Aggregates. Cement and Concrete Research, 2001. 31: p. 1587-1591
[9] Hoff, G.C., The Use of Lightweight Fines for the Internal Curing of Concrete. Prepared for Northeast Solite Corporation. 2002
[10] Bentz, D.P., and Snyder, K.A., Protected Paste Volume in Concrete: Extension to Internal Curing Using Saturated Lightweight Fine Aggregate. Cement and Concrete

228
Research, 1999. 29: p. 1863-1867 [11] Jensen, O.M. and Hansen, P.F., Water-Entrained Cement-Based Materials I.
Principles and Theoretical Background. Cement and Concrete Research, 2001. 31:
p. 647-654 [12] Folliard, K.J. and Berke, N.S., Properties of High-Performance Concrete Containing
Shrinkage-Reducing Admixture. Cement and Concrete Research, 1997. 27(9): p. 1357-1364
[13] Nmai, C.K., Tomita, R., Hondo, F. and Buffenbarger, J., Shrinkage-Reducing Admixtures. Concrete International, 1998. 20(4): p. 31-37
[14] Bentz, D.P., Geiker, M.R., and Hansen, K.K., Shrinkage-Reducing Admixtures and Early-Age Desiccation in Cement Pastes and Mortars. Cement and Concrete Research, 2001. 31: p. 1075-1085
[15] See, H.T., Attiogbe, E.K., and Miltenberger, M.A., Potential for Restrained Shrinkage Cracking of Concrete and Mortar. ASTM Cement, Concrete and Aggregates, 2004. 26(2): p. 123-130
[16] Chia, K.S. and Zhang, M., Water Permeability and Chloride Penetrability of High-Strength Lightweight Aggregate Concrete. Cement and Concrete Research, 2002. 32: p. 639-645
[17] Chandra, S. and Berntsson, L., Lightweight Aggregate Concrete – Science, Technology and Applications. Noyes Publications, New York. 2002.
[18] Weiss, W.J. and Shah, S.P., Restrained Shrinkage Cracking: The Role of Shrinkage Reducing Admixtures and Specimen Geometry. Materials and Structures, 2002. 35
(March): p. 85-91

229
EXAMINATION OF WOOD-DERIVED POWDERS AND
FIBERS FOR INTERNAL CURING OF CEMENT-BASED
MATERIALS
B.J. Mohr1, L. Premenko1, H. Nanko2, K.E. Kurtis1,*1 School of Civil and Environmental Engineering, Georgia Institute of Technology, 790 Atlantic Drive, Atlanta, GA 30332, USA 2 Institute of Paper Science and Technology at Georgia Tech, 500 10th Street, Atlanta, GA 30332, USA * Corresponding author. Tel.: 1-404-385-0825; Fax: 1-404-894-0211; Email: [email protected]
Abstract
Wood-derived powders and fibers have been investigated for use as internal curing agents in cement-based materials to mitigate self-desiccation and autogenous shrinkage. Kraft and thermomechanical pulp (TMP) fibers as well as cellulose and wood powders – which vary in size and morphology – are the subjects of this investigation. It was theorized that such materials may provide a reservoir of internal curing water to mitigate self-desiccation during early hydration. This research examines whether free water (i.e., water held in large pores and the lumen of wood-derived materials) and weakly bound water will be released into the surrounding, self-desiccating cement matrix over time, potentially providing relief from autogenous shrinkage and subsequent cracking. Results show that thermomechanical pulp fibers and wood powders are the most effective wood-derived materials, mitigating autogenous shrinkage more so than superabsorbent polymers. The rate of moisture migration from the powders or fibers is proposed to be an important factor in the effectiveness of these materials. Thus, the development of protein and polymer coating technologies to control the time and rate of moisture release are also being investigated. In addition, it is suggested that future research investigate the long-term mechanical properties of high-performance concrete containing these wood-derived materials.
1. Introduction
When concrete experiences substantial autogenous shrinkage, cracking results, which compromises both mechanical properties and durability [1]. Portland cement hydration products occupy a lesser volume than the reactants, producing a net chemical shrinkage. In the plastic state, the material is able to contract to accommodate this strain, but, after setting, the chemical shrinkage induces an increase in internal capillary porosity (i.e, those voids ~50µm or smaller) [2]. When the internal relative humidity of the concrete decreases, shrinkage results. Changes in surface tension, disjoining pressure, and capillary tension in the water/air menisci created in these capillary pores have each been proposed as mechanisms leading to this autogenous or self-desiccation shrinkage [3]. If the member is subject to internal (i.e., by aggregate or reinforcing steel) or external restraint, cracking can result from tensile stresses induced during shrinkage. Autogenous shrinkage is particularly problematic in higher strength concrete due to its inherently fine pore structure, use of very fine reactive particles, high cement content, and low water content [4].

230
Thus, to overcome autogenous shrinkage and related cracking, some have recently proposed “internal curing” of concrete, whereby moisture-rich materials are introduced to the fresh mixture [1,5,6]. The objective is to provide an adequate internal reservoir of water to compensate for the water lost by self-desiccation.
One well-recognized approach is the use of saturated highly porous minerals or aggregate (e.g., pumice, perlite, expanded clay aggregate, expanded shale aggregate, expanded slate aggregate) in the mixture [7]. These materials may, over time, release water to the hydrating paste, mitigating the effects of autogenous shrinkage. However, control of moisture content with these variable materials is difficult, leading to problems in maintaining consistency. Also, due to their large porosity and relatively large size, their use substantially reduces the strength and elastic modulus of concrete. Due to their ability to adsorb water, clays have been proposed for this purpose, but their tendency for agglomeration in high ionic media precludes their use [6]. Thus, alternative materials which may also act as moisture reservoirs, but which are expected to less negatively impact strength and durability been proposed. These include superabsorbent polymers (SAPs) and diatomaceous earth [1,5,6].
Wood-derived fibers and powders may also be likely suitable for this application and may be able to provide internal curing water at lower cost than SAPs and with more control over concrete performance as compared to lightweight aggregate. Wood-derived fibers and powders contain both free and bound water. The free water (i.e., water held in large pores and in the lumen) and weakly bound water may be released into the surrounding, self-desiccating cement matrix over time, providing relief from self-desiccation and subsequent autogenous shrinkage. The objective of this research, then, was to assess the suitability of wood-derived fibers and powders for internal curing.
2. Experimental study
2.1 Materials
High performance cement pastes were prepared with a water-to-cementitious materials (w/cm) ratio of 0.30, ASTM Type I portland cement, 10% metakaolin by mass of cement, and deionized water (resistivity of 18.2 M ·m) were used. The metakaolin (Kaorock) was provided by Thiele Kaolin Company in Sandersville, Georgia. Oxide analysis and Bogue potential composition for the cement and oxide analysis of metakaolin are listed in Table 1. Metakaolin was chosen as it was previously found to induce more autogenous shrinkage than silica fume [8].

231
Table 1 - Oxide analysis and Bogue potential composition of Type I portland cement and metakaolin (n/a: not available or not applicable).
Type I portland cement
Metakaolin
SiO2 21.26 51.5 Al2O3 4.79 44.7 Fe2O3 3.14 0.4 CaO 64.10 n/a MgO 2.35 n/a Na2O 0.02 n/a K2O 0.36 n/a TiO2 0.19 2.1 Mn2O3 0.04 n/a P2O5 0.03 n/a SrO 0.03 n/a BaO 0.04 n/a SO3 2.63 n/a Loss on ignition 1.04 n/a Insoluble residue 0.11 n/a C3S 55.24 n/a C2S 19.28 n/a C3A 7.38 n/a C4AF 9.54 n/a
The wood powder, obtained from J. Rettenmaier in Schoolcraft, Michigan, has an average fiber length of approximately 0.5-1.0 mm. The two types of cellulose powders have average fiber lengths of 10 µm (Vitacel) and 700 µm (Arbocel) and were also obtained from J. Rettenmaier in Schoolcraft, Michigan. The fiber length of the unbleached kraft fibers is approximately 4-5 mm while average thermomechanical (TMP) fiber length is 1-2 mm. The TMP of Loblolly pine was obtained from Augusta Newsprint Company in Augusta, Georgia. The unbleached kraft pulp of Slash pine was obtained from Buckeye Technologies in Plant City, Florida. LiquiBlock 80HS superabsorbent polymers (sodium salt of cross-linked polyacrylic acid) have a particle size distribution of 1-100 µm and were obtained from Emerging Technologies, Inc. in Greensboro, North Carolina.
The internal curing materials were added at differing fiber mass fractions in order to entrain equivalent amounts of water. It has been previously shown [5,7] that at a basic (no supplementary cementitious materials) water-to-cement ratio of 0.30, additional entrained water approximately equal to 0.050 (w/ce = 0.050) should mitigate autogenous shrinkage by providing enough water to prevent self-desiccation. For this research, this critical water entrainment dosage has been used. However, the addition of metakaolin creates a worst-case scenario for autogenous shrinkage. Thus, the actual critical water entrainment value may be higher than 0.050 due to increased chemical shrinkage/self-desiccation.

232
Based on image analysis during environmental scanning electron microscopy (ESEM), it was found that the average cement pore solution absorption capacity (k) of the TMP fibers and wood powder was 3.3, while kaverage = 1.0 for the kraft fibers and cellulose powders. These differences are illustrated in Figures 1 and 2. For the SAPs, the absorption capacity was assumed to be 15.0, based on [1,6].
However, though wood powder has the same average absorption capacity as TMP fibers (i.e., 3.3), this material has been shown – by previously determined moisture isotherm curves – to release water during drying twice as fast as TMP fibers. This occurs as the shorter wood powders have, on average, twice as many open ends as the longer TMP fibers. In other words, for the wood powders and TMP fibers, water release rate is inversely proportional to fiber length (i.e., shorter fiber length leads to increased release rate).
Thus, the TMP fibers and SAPs were added at dosages such that w/cme = 0.025, 0.050, 0.075, and 0.100. These entrained water dosage rates corresponded to material mass fractions of 0.75, 1.5, 2.25, 3.0% and 0.25, 0.50, 0.75, 1.0%, respectively.
In addition, wood powder was added at dosages of 1.5, 3.0, and 4.5% by mass corresponding to water entrainment values of 0.050, 0.10, and 0.15. Cellulose powders and kraft pulp fibers proved to be difficult to mix at low mass fractions, as expected. In addition, these materials only absorb their exact mass in water (i.e., kaverage=1.0). The maximum dosage rate possible was 1.0%, corresponding to w/cme = 0.010.
Figure 1 - Environmental scanning electron microscopy (ESEM) micrograph of kraft pulp fibers (kaverage = 1.0).

233
Figure 2 - Environmental scanning electron microscopy (ESEM) micrograph of TMP fibers (kaverage = 3.3).
2.2 Isothermal calorimetry
Cement paste samples were prepared with a water-to-cement ratio of 0.50 and 3% fibers/powder by mass. ASTM Type I portland cement and deionized water (resistivity of 18.2 M ·m) was used. Pastes were prepared by mixing the fibers or powder and the entirety of the water for 1 minute with a hand mixer. Subsequently, the cement was added and mixing continued for another 4 minutes. After zeroing the mass of the polyethylene ampules, 18-20 grams of paste was added to the ampule. The time between the end of mixing and placement of ampule in the calorimeter was 2 minutes. Superplasticizer was not used as to not adversely influence cement hydration.
Hydration data was obtained using an 8-channel Thermometric TAM Air isothermal calorimeter. Samples were maintained at 25.0±0.1° C and automatic measurements were recorded every 2 minutes for 48 hours, disregarding the first 10 minutes of data due to heat generated during ampule placement.
2.3 Autogenous deformation
Pastes were prepared by mixing the internal curing materials and approximately 50% of the water for 3 minutes at 60 rpm in a 1.5L-capacity Hobart mixer to ensure separation of the materials, particularly the wood-derived fibers and powders. Subsequently, the cement was added, followed by the remaining water. Mixing continued at 120 rpm for another 5 minutes to allow for uniform dispersion. ADVA Flow superplasticizer, obtained from WR Grace, was added at a dosage rate of 1.5-2.0 µL/g cement for all
234
mixes. The superplasticizer dosage rate was kept fairly consistent as to minimize capillary water surface tension differences.
Autogenous deformation was measured by the technique described by Jensen and Hansen [9]. This technique involves taking frequent linear deformation measurements of cement paste sealed in a rigid polyethylene mold with low friction. Measurements began at final set (as determined by Vicat needle penetration – ASTM C 191 [10]) and continued periodically along a logarithmic scale. The initial measurement was taken at final set to exclude plastic deformation.
2.4 Compressive strength
Compressive strength samples were prepared in conjunction with the autogenous shrinkage samples. In order to assure no moisture exchange during curing, strength samples were cast in the same polyethylene molds as the autogenous shrinkage samples. After 3, 7, or 14 days of curing, the polyethylene tubing was removed from the hardened cement paste. The hardened paste was cut into pieces with a length of approximately 45 mm. Thus, the height-to-diameter ratio was approximately 2:1. The samples were tested in compression using a 98 kN (22 kip) screw driven test frame (Satec model 22EMF) at a loading rate of 2.67 kN/min (600 lbs/min). A minimum of 6 specimens were tested at each age. It should be noted that since this specimen geometry does not conform to any existing standards only the relative differences in strengths should be compared. It is suggested that future research investigate the long-term mechanical properties (e.g., strength, elastic modulus, creep) of high-performance concrete containing these wood-derived materials. Current research shows that certain wood-derived fiber-cement paste composites exhibit losses in flexural strength and toughness with wet/dry cycling [11,12]. However, for internal curing applications in concrete, this durability concern may be negligible as the fibers provide minimal toughening in the presence of coarse aggregate (i.e., in concrete), due to a short fiber length. Thus, fiber degradation may have a minimal impact on concrete behavior in the long-term. In addition, self-desiccation may be mitigated at an early age, prior to any degradation.
3. Results and discussion
3.1 Isothermal calorimetry
Calorimetry was performed to assess the effect of the addition of the wood-derived materials on the rate of cement paste hydration. Results in Figures 3 and 4 show that differences between the control and the samples containing the fibers or powder are likely negligible in practice. TMP fibers showed little effect on the rate of hydration. However, wood powder appears to delay setting by approximately 3 hr. Though, by 48 hr, the cumulative heat evolved is similar to the other materials. In addition, overall hydration (i.e., heat evolved) for all wood-derived materials is only slightly suppressed (4-5% lower) after 48 hr, as compared to the control. Therefore, the inclusion of any of these materials within the cement matrix will likely not present any notable incompatibilities that would prohibit their use, although testing on concretes may be further investigated.

235
0.0
0.5
1.0
1.5
2.0
2.5
3.0
0 12 24 36 48
Time after water addition (hr)
Po
we
r E
vo
lve
d (
mW
/g c
em
en
t)
Control3% Wood Powder3% TMP Fiber3% Kraft Fiber
3% TMP Fiber
3% Wood Powder
3% Kraft Fiber
Control
Figure 3 - Isothermal calorimetry results (power evolved) for composites containing internal curing materials.
0
50
100
150
200
250
300
0 12 24 36 48
Time after water addition (hr)
No
rma
lize
d C
um
ula
tiv
e
He
at
Ev
olv
ed
(J
)
Control3% Wood Powder3% TMP Fiber3% Kraft Fiber
Control
3% Wood Powder
3% TMP Fiber
3% Kraft
Figure 4 - Isothermal calorimetry results (cumulative heat evolved) for composites containing internal curing materials.

236
3.2 Autogenous Shrinkage
Autogenous deformations were measured for cement pastes containing TMP fibers, kraft pulp fibers, cellulose powder, wood powder, and superabsorbent polymers (SAPs). The mass fractions varied between materials as discussed previously. Final setting times were also measured for the autogenous shrinkage samples. Length measurements began at this time (i.e., zero measurements were taken at final set).
Kraft fibers and cellulose powder did not prove to be effective wood-derived materials for internal curing. This is due to poor workability at low water-to-cement ratios and minimal absorption of pore solution by these materials. The maximum mass fraction achieved with both materials was only 1.0%, equivalent to w/ce = 0.010. At higher addition rates, the cement paste mix was clumpy and was not workable. Additional superplasticizer, up to the maximum dosage rate, did not produce any improvements in workability.
After 40 days, as seen in Figure 5, the kraft fiber composites exhibited autogenous shrinkage of -1021.8 ± 62.1 µ (µ = 10-6 mm/mm). The cellulose powders exhibited slightly less shrinkage of -861.8 ± 44.1 µ and -848.8 ± 43.0 µ for the two types of powders, respectively. Thus, because similar behavior was observed for the fibers and powders, it is realized that fiber length does not seem to influence autogenous shrinkage. That is, there does not appear to be any mechanical effect (i.e., internal restraint) of fiber addition, at least for the lower dosage rates and short fiber lengths (i.e, less than 1.0 mm).
TMP fibers were previously found to be more easily incorporated into fresh cement due to a stiffer fiber cell well (due to the presence of lignin) and shorter fiber length [13]. Thus, good workability was easily achieved at relatively high mass fractions. Results are shown in Figures 6 and 7 for TMP and wood powder composites, respectively. It can be seen that as the addition rate increased, autogenous shrinkage decreased for both the TMP fiber and wood powder composites. All TMP and wood powder composites exhibited noticeable expansion during the first several days. Sample length expansion and time of observed expansion increased with increasing dosage rates, up to 2.25%, as well. After 40 days, the minimum shrinkage observed was -196.6 ± 25.9 µ and -211.0 ± 53.1 µ , for the TMP fiber and wood powder pastes, respectively. This appears to indicate that the entrained water contained within the fiber/powder lumen and cell wall is being slowly released to the self-desiccating matrix and providing the water needed for continued internal curing. It is interesting to note that the 3.0% TMP composite did not provide additional benefits as compared to the 2.25% TMP composite. This behavior will be addressed later as this behavior was also observed for pastes containing SAPs.
The previous results have shown the effectiveness of certain wood-derived materials at mitigating autogenous shrinkage. However, one of the most commonly used materials for this application has been SAPs. These polymers were tested in conjunction with the wood-derived materials in order to provide a basis for comparison. As seen in Figure 8, the addition of SAPs to cement did provide some reduction in autogenous shrinkage.

237
However, after 40 days, minimum autogenous shrinkage strains were reduced to -763.3 ± 114.2 µ , as compared to -1427.3 ± 45.1 µ in the control at this age.
As with the TMP results, there appears to be a threshold water entrainment dosage above which the addition of water does not lead to increased benefits. For SAPs, this water entrainment threshold value is 0.05 (0.50% SAP) and for the TMP fiber composites, it is 0.075 (2.25% TMP). The differences in threshold values may be related to the water release rate of the particular material. That is, the TMP fibers are thought to release water more slowly than SAPs, thus explaining initial TMP expansion and subsequent minimal shrinkage. In addition, the threshold value may also be a function of material distribution and spacing. In this situation, the SAPs achieve maximum spacing at lower water entrainment rates than the TMP fibers. Further research in under way to elucidate this threshold mechanism. It is anticipated that the use of coatings for the wood-derived materials – used to control the water release rate – will provide insight into this mechanism.
-1600
-1200
-800
-400
0
400
0.1 1 10 100Time (days)
Au
tog
en
ou
s d
efo
rmati
on
(m
icro
str
ain
)
Control 1% kraft fibers 1% Vitacel 1% Arbocel
Figure 5 - Autogenous shrinkage for pastes containing kraft fibers and cellulose powder (Vitacel and Arbocel).
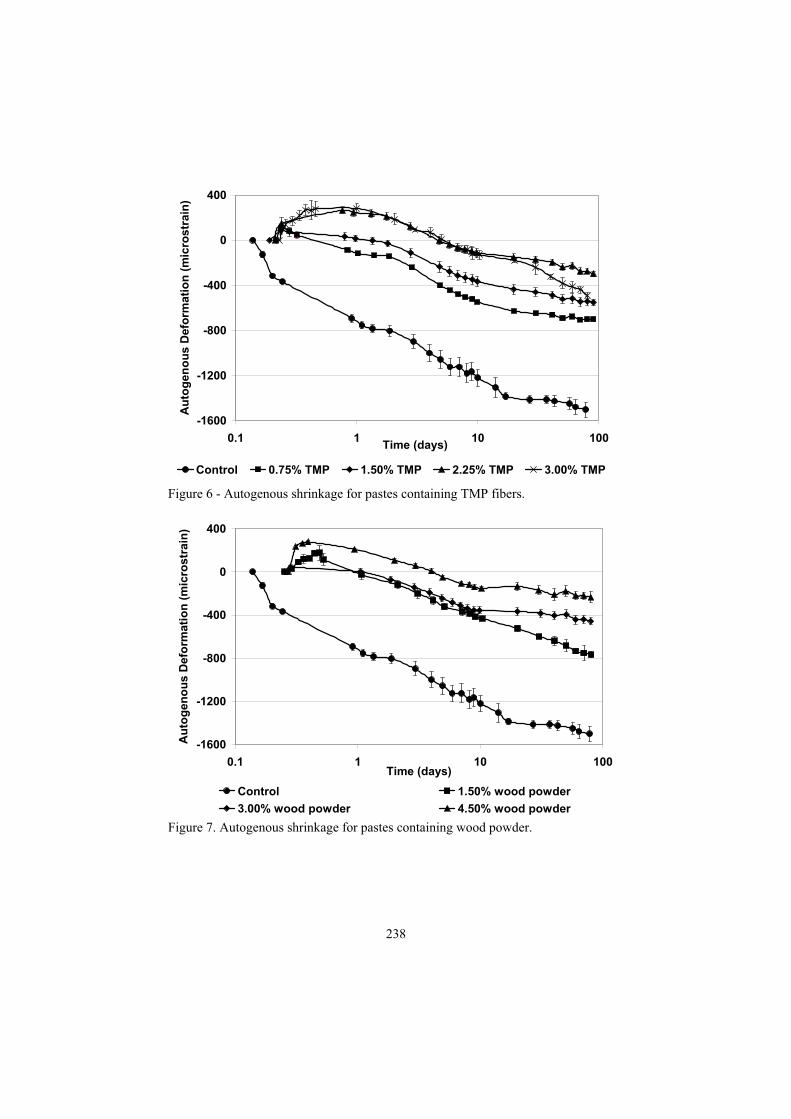
238
-1600
-1200
-800
-400
0
400
0.1 1 10 100Time (days)
Au
tog
en
ou
s D
efo
rmati
on
(m
icro
str
ain
)
Control 0.75% TMP 1.50% TMP 2.25% TMP 3.00% TMP
Figure 6 - Autogenous shrinkage for pastes containing TMP fibers.
-1600
-1200
-800
-400
0
400
0.1 1 10 100Time (days)
Au
tog
en
ou
s D
efo
rmati
on
(m
icro
str
ain
)
Control 1.50% wood powder
3.00% wood powder 4.50% wood powder
Figure 7. Autogenous shrinkage for pastes containing wood powder.

239
-1600
-1200
-800
-400
0
400
0.1 1 10 100Time (days)
Au
tog
en
ou
s D
efo
rmati
on
(m
icro
str
ain
)
Control 0.25% SAP 0.50% SAP 0.75% SAP 1.00% SAP
Figure 8. Autogenous shrinkage for pastes containing SAPs.
3.3 Compressive Strength
Compressive strength was measured to probe the efficiency of the internal curing materials at increasing the degree of hydration of the cement paste as well as to identify any incompatibilities between the internal curing materials and cement hydration. As stated previously, only relative strength differences should be considered due to the non-standard specimen geometry. Specimens were tested in compression at 3, 7, and 14 days and at the same dosage rates as that evaluated for autogenous shrinkage.
Figure 9 illustrates the strength trends for the kraft fiber and cellulose powder cement composites. It can be seen that the addition of kraft fibers led to a decrease in strength at all ages. The cellulose powder sample strengths were similar to the control beyond 3 days. As realized in the previous section concerning autogenous shrinkage, the differences between the two types of cellulose powders, varying in fiber length only, are negligible.
As for the wood-derived materials that decreased autogenous shrinkage, the compressive strength results for the TMP fiber and wood powder composites are shown in Figures 10 and 11, respectively. In Figure 10, it appears that the 0.75% and 1.5% TMP dosage rates led to a similar decrease (~15-20%) in strength as compared to the control at 14 days. As the dosage rate incrementally increased above 1.5%, further progressive decreases in strength were observed. The addition of 3% TMP fibers by mass led to an approximate 30% decrease in strength at 14 days compared to the control. Similarly in Figure 11, the strength of the wood powder composites

240
progressively decreased with increased dosage rate. However, there is no clear strength leveling with the wood powder data, as was observed with TMP fibers. This may be due to the increased water entrainment amounts relative to the TMP samples.
In Figure 12, the strength of the cement samples containing SAPs is shown. At lower dosage rates – water entrainment less than 0.05 – there is no decrease in strength relative to the control. This was expected, as previously shown as the equivalence of competing mechanisms (i.e., increased porosity versus increased degree of hydration) by [5]. At higher dosage rates, strength decreased noticeably due to increased porosity and no change in the degree of hydration at these early ages. These strength values were similar to the TMP composites entraining the same amount of water. That is, at 14 days, the compressive strength of the 0.75% and 1.0% SAP samples were approximately 25% less than the control.
0
10
20
30
40
50
60
70
80
3 7 14Age (days)
Avera
ge C
om
pre
ssiv
e S
tren
gth
(M
Pa)
Control 1% kraft fibers 1% Vitacel 1% Arbocel
Figure 9 - Compressive strength for pastes containing kraft fibers and cellulose powder Vitacel and Arbocel).
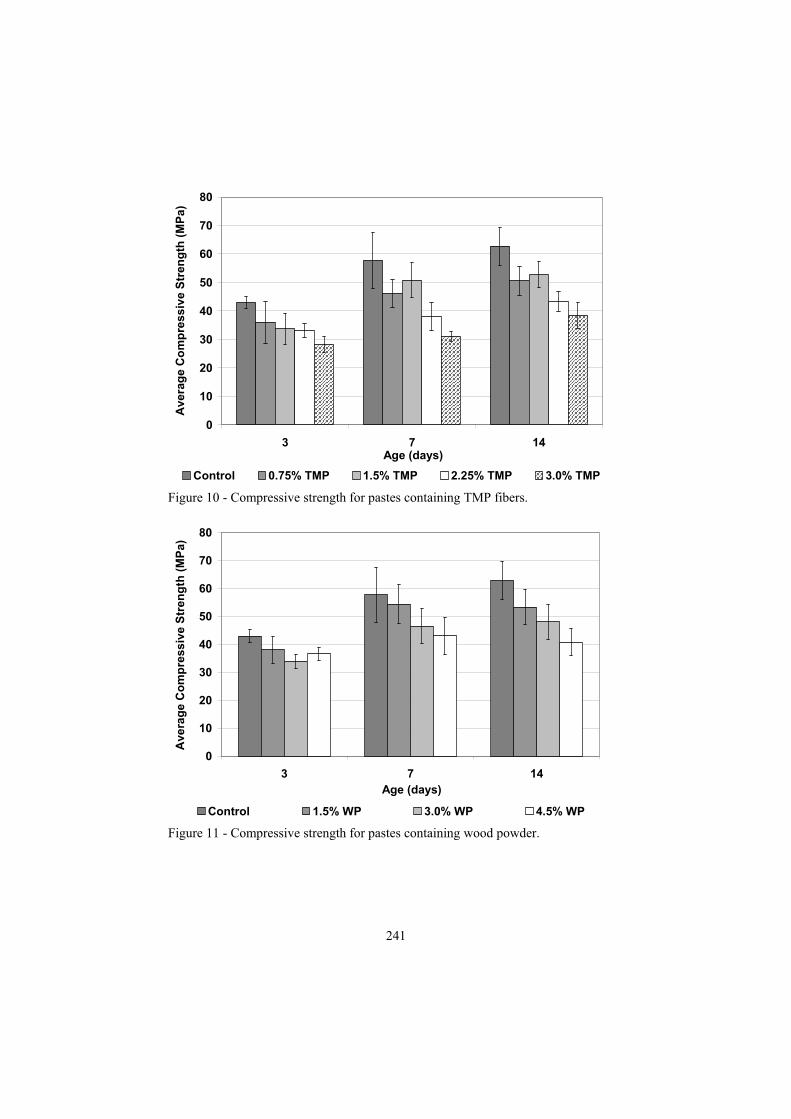
241
0
10
20
30
40
50
60
70
80
3 7 14Age (days)
Ave
rag
e C
om
pre
ss
ive S
tren
gth
(M
Pa
)
Control 0.75% TMP 1.5% TMP 2.25% TMP 3.0% TMP
Figure 10 - Compressive strength for pastes containing TMP fibers.
0
10
20
30
40
50
60
70
80
3 7 14
Age (days)
Ave
rag
e C
om
pre
ss
ive S
tre
ng
th (
MP
a)
Control 1.5% WP 3.0% WP 4.5% WP
Figure 11 - Compressive strength for pastes containing wood powder.
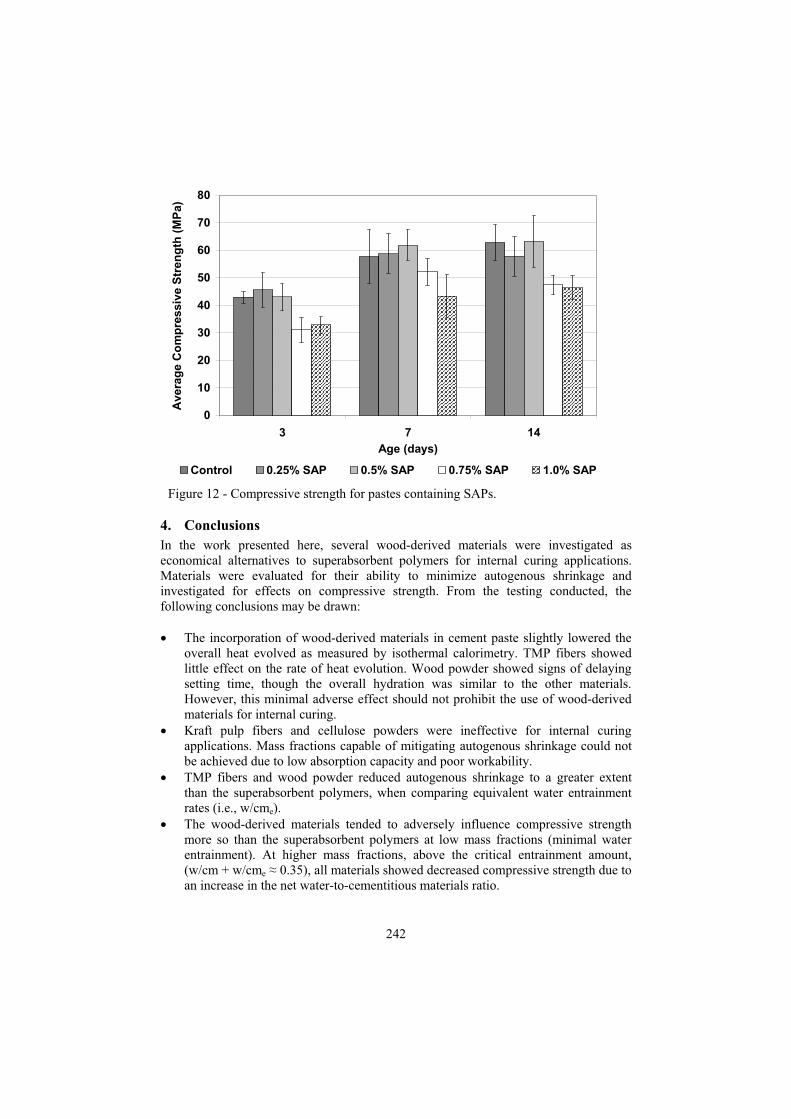
242
0
10
20
30
40
50
60
70
80
3 7 14
Age (days)
Avera
ge C
om
pre
ssiv
e S
tren
gth
(M
Pa)
Control 0.25% SAP 0.5% SAP 0.75% SAP 1.0% SAP
Figure 12 - Compressive strength for pastes containing SAPs.
4. Conclusions
In the work presented here, several wood-derived materials were investigated as economical alternatives to superabsorbent polymers for internal curing applications. Materials were evaluated for their ability to minimize autogenous shrinkage and investigated for effects on compressive strength. From the testing conducted, the following conclusions may be drawn:
The incorporation of wood-derived materials in cement paste slightly lowered the overall heat evolved as measured by isothermal calorimetry. TMP fibers showed little effect on the rate of heat evolution. Wood powder showed signs of delaying setting time, though the overall hydration was similar to the other materials. However, this minimal adverse effect should not prohibit the use of wood-derived materials for internal curing. Kraft pulp fibers and cellulose powders were ineffective for internal curing applications. Mass fractions capable of mitigating autogenous shrinkage could not be achieved due to low absorption capacity and poor workability. TMP fibers and wood powder reduced autogenous shrinkage to a greater extent than the superabsorbent polymers, when comparing equivalent water entrainment rates (i.e., w/cme).The wood-derived materials tended to adversely influence compressive strength more so than the superabsorbent polymers at low mass fractions (minimal water entrainment). At higher mass fractions, above the critical entrainment amount, (w/cm + w/cme 0.35), all materials showed decreased compressive strength due to an increase in the net water-to-cementitious materials ratio.

243
For this particular cementitious system, based solely on autogenous shrinkage performance, the optimum TMP fiber and wood powder dosage rates were found to be 2.25% and 4.50%, respectively. However, these rates led to a 31-35% reduction in compressive strength at 14 days.
Acknowledgements
The authors would like to acknowledge the National Science Foundation (CMS-0122068) and the Institute of Paper Science and Technology (IPST) All Member Research Consortium (AMRC) for their financial support.
References
[1] Jensen, O.M., Hansen, P.F., Water entrained cement-based materials, II: Experimental observations, Cement and Concrete Research 32, 973-8 (2002).
[2] Bentz, D. P., Jensen, O. M., Hansen, K. K., Olesen, J. F., Stang, H., Haecker, C. J., Influence of cement particle-size distribution on early age autogenous strains and stresses in cement-based materials. Journal of the American Ceramic Society 84, 129-135 (2001).
[3] Lura, P., Jensen O.M., Van Breugel, K. Autogenous shrinkage in high performance cement paste: An evaluation of basic mechanisms. Cement and Concrete Research 33, 223-32 (2003).
[4] Bentz, D.P., Jensen, O.M., Mitigation strategies for autogenous shrinkage cracking. Cement and Concrete Research 26, 677-685 (2004).
[5] Jensen, O.M., Hansen, P.F., Water entrained cement-based materials, I: Principles and theoretical background. Cement and Concrete Research 31,647-54 (2001).
[6] Jensen, O.M., Lura, P., Techniques for internal water curing of concrete. Proc. ECI Advances in Cement and Concrete: Copper Mountain, Colorado, USA, Eds: Lange, D.A., Scrivener, K.L., Marchand, J., 67-78 (2003).
[7] Bentz, D.P., Lura, P., Roberts, J.W., Mixture proportioning for internal curing. Concrete International 27, 35-40 (2005).
[8] Justice, J.M, Kennison, L.H., Mohr, B.J., Beckwith, S., McCormick, L., Wiggins, B., Zhang, Z.Z., Kurtis, K.E., Comparison of two metakaolins and silica fume used as supplementary cementitious materials. Proc. ACI Seventh International Symposium on Utilization of High-Strength/High Performance Concrete: Washington, D.C., USA (2005).
[9] Jensen, O.M., Hansen, P.F., A dilatometer for measuring autogenous deformation in hardening cement paste. Materials and Structures 28, 406-409 (1995).
[10] ASTM C 191, Standard test method for time of setting of hydraulic cement by Vicat needle, American Society for Testing and Materials, West Conshohocken, Pennsylvania, USA (2003).
[11] Mohr, B.J., Nanko, H., Kurtis, K.E. Durability of kraft pulp fiber-cement composites to wet/dry cycling. Cement and Concrete Composites 27, 435-448 (2005).
244
[12] Mohr, B.J., Nanko, H., Kurtis, K.E. Durability of thermomechanical pulp fiber-cement composites to wet/dry cycling. Cement and Concrete Research, accepted for publication (2005).
[13] McDonough, T.J., Aziz, S., Rankin, K.L., The strength of mechanical pulp fibers, ICP Technical Paper Series #267, The Institute of Paper Chemistry, Appleton, WI (1987).

245
AN INVESTIGATION OF PREDICTION MODEL FOR AUTOGENOUS SHRINKAGE/EXPANSION STRAIN OF LOW-SHRINKAGE HSC Makoto Tanimura, Yuji Mitani Research & Development Center, Taiheiyo Cement Corporation, Japan Ryoichi Sato Department of Civil and Environmental Engineering, Graduate School of Engineering, Hiroshima University, Japan
Abstract
The present study investigates the autogenous shrinkage/expansion strain of W/C=0.3 low shrinkage-HSCs experimentally, using ordinary/Belite-rich low heat Portland cement by widely varying the replacement dosage of expansive additive and shrinkage-reducing chemical agent. In addition, the empirical prediction equations of autogenous shrinkage/expansion strain of low-shrinkage/expansive HSCs are studied on the basis of the observed values. As a result, it is surely confirmed that HSCs with various low shrinkage/expansion strain properties can be produced by sole/combined use of above-mentioned materials. In addition, it is demonstrated that the investigated equations have the accuracy of 20% for predicting autogenous shrinkage/expansion strain of low-shrinkage/expansive HSCs.
1. Introduction
High-strength concrete (HSC) has been widely studied over the last decade and has been increasingly applied in order to enhance the durability and structural performance of concrete structures. However, low water-to-binder ratio concretes are known to shrink significantly at early ages, which is likely to be caused by autogenous shrinkage, and results in increasing the sensitivity to early-age cracking [1,2]. Since HSC is expected to yield more durable structural members, the establishment of a technique for minimizing autogenous shrinkage is an important task. Regarding this point, comprehensive experimental investigations on how to control the autogenous shrinkage have been carried out from a material point of view [2-4]. It has already been well known that expansive additive and shrinkage-reducing chemical agent were certainly effective in reducing the autogenous shrinkage of HSC, and the autogenous shrinkage shown by Belite-rich low heat Portland cement is obviously less than the ordinary Portland cement. One drawback with Belite-rich Portland cement for concrete production is the slow early strength development. In addition, authors have already reported that HSCs with low shrinkage-restrained stress could be produced by sole/combined use of above-mentioned materials, and HSCs with expansion rather than shrinkage, resulting restrained stress in compression, could be readily produced by combined use of expansive additive and Belite-rich Portland cement [5,6]. On the other hand, insufficient investigations on the effect of such shrinkage-reducing materials, as a result, no investigations have been carried out to prepare the prediction model for autogenous shrinkage/expansion strain of low-shrinkage HSCs, even though it is

246
required in practice.
Considering the above description, the present study focuses on the investigation of autogenous shrinkage/expansion strain of W/C=0.3 low shrinkage-HSCs experimentally, using ordinary/Belite-rich low heat Portland cement by widely varying the replacement dosage of expansive additive and shrinkage-reducing chemical agent. Additionally, the empirical prediction equations of autogenous shrinkage/expansion strain of low-shrinkage/expansive HSCs were studied on the basis of the observed values.
2. Experimental program
2.1 Materials and mix proportions
The materials used in the study are summarized in Table 1. The contents of C3S, C2S, C3A and C4AF of ordinary Portland cement (OPC), calculated using Bogue’s equations, were 52%, 24%, 9%, and 9%, respectively. On the other hand, those of Belite-rich low heat Portland cement (LPC) were 26%, 55%, 3%, and 9%, respectively. Previous study revealed that the mineral composition of cement affects the autogenous shrinkage significantly [7,8]. Based on the following equation (1), which derived by Miyazawa & Tazawa [9], LPC-based mixtures have less autogenous shrinkage.
%)AFC(5.48%)AC(7.68%)SC(49.5%)SC(15.2 4323p (1)
where, p : the end value of autogenous shrinkage strain (original length: 24 hours from casting) of cement paste with W/C=0.3 (x 10-6), %)SC( 3 , %)SC( 2 , %)AC( 3 ,and %)AFC( 4 : %mass content of C3S, C2S, C3A, and C4AF, respectively.
Table 1 – Materials Material Type (Designation) / Characteristics
Ordinary Portland cement (OPC) / density: 3.16 g/cm3,SSA: 3310 cm2/g
Cement Low-heat Portland cement (LPC) / density: 3.22 g/cm3,SSA: 3280 cm2/g
Expansive additive Lime-based (EX) / density: 3.14 g/cm3, SSA: 3310 cm2/g Shrinkage reducer Lower-alcohol alkyleneoxide adduct (SRA)
Fine aggregate Land sand / density: 2.60 g/cm3, absorption: 1.44%, F.M.: 2.64
Coarse aggregate Crushed sand stone / maximum size: 20mm, density: 2.64 g/cm3, absorption: 0.82%, F.M.: 6.68
Water reducer Polycarboxylic acid based high-range water-reducing agent (SP) / density: 1.05 g/cm3
SSA: Specific surface area measured by Braine’s Method, F.M.: Fineness modulus
Table 2 shows the combinations of the shrinkage-reducing materials for all of the investigated mixtures. The replacement dosages of expansive additive and shrinkage-reducing chemical agent systematically ranged from 30 to 60 kg/m3 and from 6 to 12

247
kg/m3, respectively. For example, “N-40-9” represents the HSC made by using ordinary Portland cement (N) with expansive additive of 40 kg/m3 and shrinkage-reducing agent of 9 kg/m3. N-0-0 denotes the reference mixture using OPC cement with no additives. When Belite-rich low heat Portland cement (LPC) is used, symbol “N” is replaced with “L”.
Table 2 – Combinations of key-materials Cement EX (kg/m3) 0 30 40 50 60
0 N-0-0 N-30-0 N-40-0 N-50-0 N-60-0 6 N-0-6 N-30-6 N-40-6 N-50-6 N-60-6 9 N-0-9 N-30-9 N-40-9 N-50-9 N-60-9
N
12 N-0-12 N-30-12 N-40-12 N-50-12 N-60-12 0 L-0-0 L-30-0 L-40-0 L-50-0 L-60-0 6 L-0-6 L-30-6 L-40-6 L-50-6 L-60-6 9 L-0-9 L-30-9 L-40-9 L-50-9 L-60-9
L
SRA(kg/m3)
12 L-0-12 L-30-12 L-40-12 L-50-12 L-60-12
The water/(C+EX) ratio is set at 0.3 regardless of the type of cement and the replacement dosage of admixtures. The unit water content is fixed at 175 kg/m3, which includes SRA and SP. The coarse aggregate content is fixed at 832 kg/m3 (0.315 m3/m3
by volume) in order to provide a good passing ability for obstacle. The dosage of SP is adjusted to achieve a concrete mixture with a slump flow of 600 100 mm. The air content of all of the investigated mixtures is controlled to be lower than 2%. The ambient temperature during mixing and placing of concrete is at 20 oC.
2.2 Specimens and curing condition
Two prismatic specimens for each mixture, that has dimension of 100 mm (width) x 100 mm (height) x 400 mm (length), were made to measure the autogenous shrinkage/expansion strain. In order to minimize the friction between the mold and concrete specimen, Teflon sheet of 1.0 mm thickness was placed at the bottom of the mold. Furthermore, polystyrene board of 3 mm thickness was placed on both ends of the mold. The beam specimen mold was supplied with 0.1 mm thick polyester film on all surfaces. Thus, how to make the specimens for autogenous strain measurement was carried out in accordance with practices proposed by JCI [4]. In addition, nine cylindrical specimens of 100 x 200 mm for each mixture were prepared to measure the compressive strength. All the specimens were demolded at 24 hours after placing the concrete and promptly sealed with a 0.05 mm thick aluminum adhesive tape in order to prevent evaporation of water. All specimens were stored in the laboratory under the temperature of 20 2 oC.
2.3 Measurements
The length changes that occur from initial setting time to 24 hours are measured in accordance with practices proposed by JCI [4] by displacement transducers with a
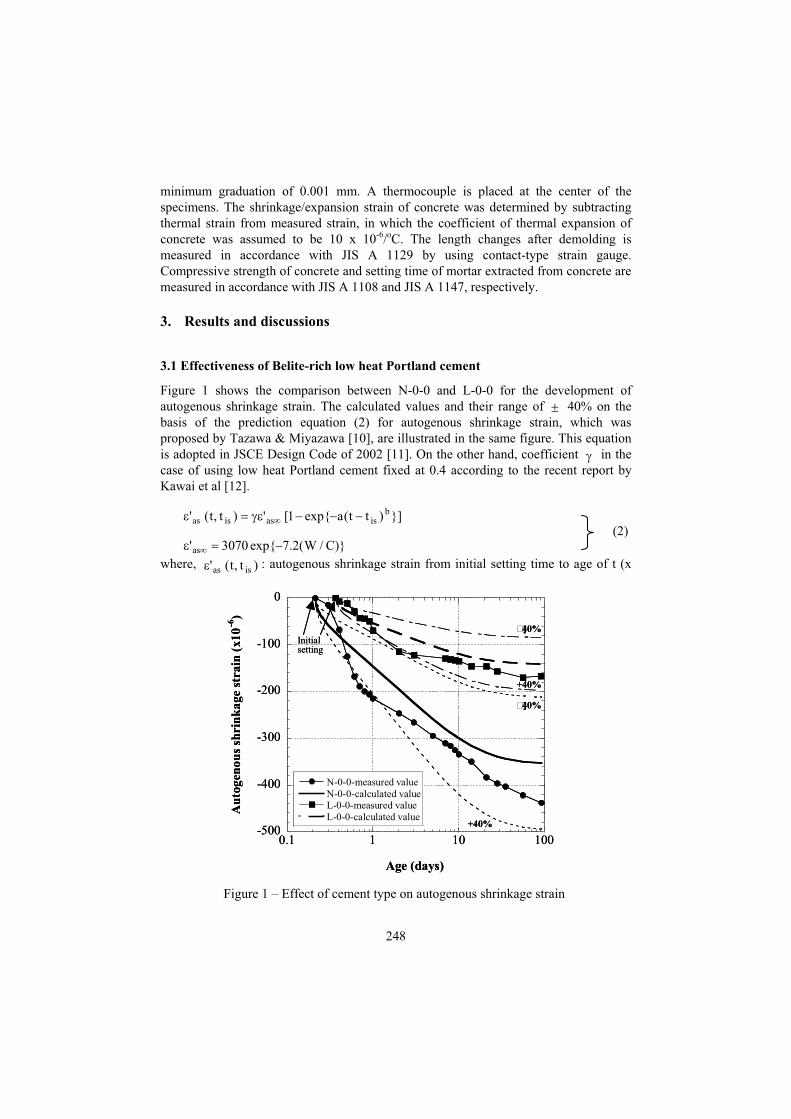
248
minimum graduation of 0.001 mm. A thermocouple is placed at the center of the specimens. The shrinkage/expansion strain of concrete was determined by subtracting thermal strain from measured strain, in which the coefficient of thermal expansion of concrete was assumed to be 10 x 10-6/oC. The length changes after demolding is measured in accordance with JIS A 1129 by using contact-type strain gauge. Compressive strength of concrete and setting time of mortar extracted from concrete are measured in accordance with JIS A 1108 and JIS A 1147, respectively.
3. Results and discussions
3.1 Effectiveness of Belite-rich low heat Portland cement
Figure 1 shows the comparison between N-0-0 and L-0-0 for the development of autogenous shrinkage strain. The calculated values and their range of 40% on the basis of the prediction equation (2) for autogenous shrinkage strain, which was proposed by Tazawa & Miyazawa [10], are illustrated in the same figure. This equation is adopted in JSCE Design Code of 2002 [11]. On the other hand, coefficient in the case of using low heat Portland cement fixed at 0.4 according to the recent report by Kawai et al [12].
}])tt(aexp{1[')t,t(' bisasisas
)}C/W(2.7exp{3070'as
where, )t,t(' isas : autogenous shrinkage strain from initial setting time to age of t (x
-500
-400
-300
-200
-100
0
0.1 1 10 100
N-0-0-measured valueN-0-0-calculated valueL-0-0-measured valueL-0-0-calculated value
Au
tog
eno
us
shri
nk
ag
e st
rain
(x1
0-6
)
Age (days)
+40%
�]40%
�]40%
+40%
Initial setting
-500
-400
-300
-200
-100
0
0.1 1 10 100
N-0-0-measured valueN-0-0-calculated valueL-0-0-measured valueL-0-0-calculated value
Au
tog
eno
us
shri
nk
ag
e st
rain
(x1
0-6
)
Age (days)
+40%
�]40%
�]40%
+40%
Initial setting
Figure 1 – Effect of cement type on autogenous shrinkage strain
(2)
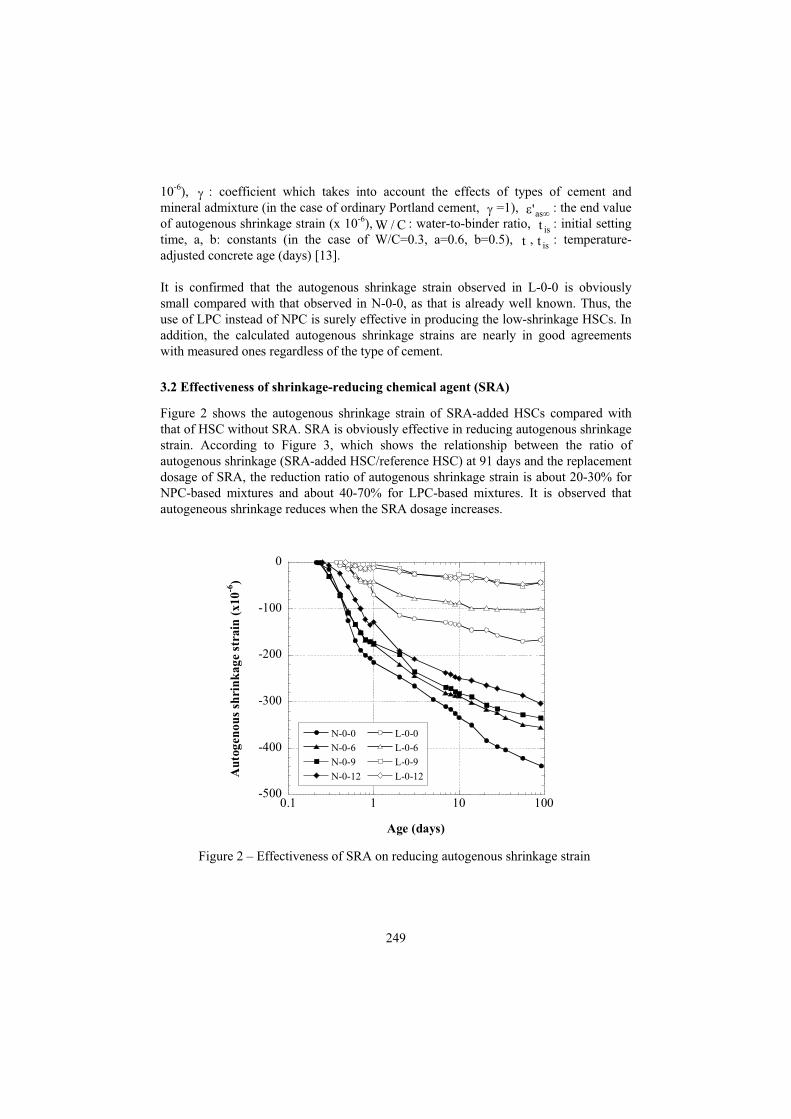
249
10-6), : coefficient which takes into account the effects of types of cement and mineral admixture (in the case of ordinary Portland cement, =1), as' : the end value of autogenous shrinkage strain (x 10-6), C/W : water-to-binder ratio, ist : initial setting time, a, b: constants (in the case of W/C=0.3, a=0.6, b=0.5), t , ist : temperature-adjusted concrete age (days) [13].
It is confirmed that the autogenous shrinkage strain observed in L-0-0 is obviously small compared with that observed in N-0-0, as that is already well known. Thus, the use of LPC instead of NPC is surely effective in producing the low-shrinkage HSCs. In addition, the calculated autogenous shrinkage strains are nearly in good agreements with measured ones regardless of the type of cement.
3.2 Effectiveness of shrinkage-reducing chemical agent (SRA)
Figure 2 shows the autogenous shrinkage strain of SRA-added HSCs compared with that of HSC without SRA. SRA is obviously effective in reducing autogenous shrinkage strain. According to Figure 3, which shows the relationship between the ratio of autogenous shrinkage (SRA-added HSC/reference HSC) at 91 days and the replacement dosage of SRA, the reduction ratio of autogenous shrinkage strain is about 20-30% for NPC-based mixtures and about 40-70% for LPC-based mixtures. It is observed that autogeneous shrinkage reduces when the SRA dosage increases.
-500
-400
-300
-200
-100
0
0.1 1 10 100
N-0-0
N-0-6
N-0-9
N-0-12
L-0-0
L-0-6
L-0-9
L-0-12Au
tog
en
ou
s sh
rin
ka
ge
stra
in (
x1
0-6
)
Age (days)
Figure 2 – Effectiveness of SRA on reducing autogenous shrinkage strain

250
3.3 Effectiveness of expansive additive (EX)
Figure 4 shows the autogenous expansion/shrinkage strain of EX-added HSCs. In the case of OPC-based mixtures, the autogenous shrinkage strain of reference HSC (N-0-0) at 91 days is reduced to 50% and 80% by adding 30 kg/m3 and 40 kg/m3 of EX, respectively. When EX content is increased to 50 kg/m3, the autogenous shrinkage strain is almost compensated. It is also observed in the figure that the time when the EX-added HSCs obviously shows expansion almost correspond to the time when the autogenous shrinkage strain of reference HSC develops significantly (from about final setting time, which is about two hours after initial setting time, to some days), thus, expansive additives effectively compensate the autogenous shrinkage from early ages. In the case of LPC-based mixtures, EX content of 30 kg/m3 contribute to occurring expansion strain of about 100 x 10-6 because autogenous shrinkage of LPC is originally small. When EX content is increased to 50 kg/m3, the expansion strain of about 400 x 10-6 occurs. Thus, absolute expansion strain of EX-added HSC is significantly dependent upon the autogenous shrinkage behavior of the reference concrete without EX. The combined use of Belite-rich low heat Portland cement and expansive additive is effective in achieving the expansive HSCs.
Figure 5 shows relationship between the compensation of autogenous shrinkage strain at 91 days and replacement dosage of EX. The definition of “compensation of autogenous shrinkage strain” is shown in Figure 6, which represents the difference in autogenous strain between EX-added concrete and concrete without EX. The starting point of the compensation of autogenous shrinkage strain is fixed at the final setting time when
0
0.2
0.4
0.6
0.8
1
0 3 6 9 12 15
Ordinary Portland cement
Low-heat Portland cement
Ra
tio
of
au
togen
ou
s sh
rin
kag
e st
rain
(x
10
-6)
Unit SRA content (kg/m3)
Age: 91days
1SRA035.0SRA0008.0R 2as
1SRA094.0
SRA0024.0R 2as
0
0.2
0.4
0.6
0.8
1
0 3 6 9 12 15
Ordinary Portland cement
Low-heat Portland cement
Ra
tio
of
au
togen
ou
s sh
rin
kag
e st
rain
(x
10
-6)
Unit SRA content (kg/m3)
Age: 91days
1SRA035.0SRA0008.0R 2as
1SRA094.0
SRA0024.0R 2as
Figure 3 – Ratio of autogenous shrinkage strain versus dosage of SRA

251
these values begin to occur obviously. According to Figure 5, the increase in compensation of autogenous shrinkage strain with increase in EX content of LPC-based mixtures is more significant than that of OPC-based mixtures.
-600
-400
-200
0
200
0.1 1 10 100
N-0-0N-30-0N-40-0N-50-0N-60-0
Au
tog
en
ou
s ex
pa
nsi
on
/sh
rin
ka
ge
stra
in (
x1
0-6
)
Age (days)
(Expansion)
(Shrinkage)
-600
-400
-200
0
200
0.1 1 10 100
N-0-0N-30-0N-40-0N-50-0N-60-0
Au
tog
en
ou
s ex
pa
nsi
on
/sh
rin
ka
ge
stra
in (
x1
0-6
)
Age (days)
(Expansion)
(Shrinkage)
(c) Ordinary Portland cement
-200
0
200
400
600
800
0.1 1 10 100
L-0-0L-30-0L-40-0L-50-0L-60-0
Au
tog
eno
us
exp
an
sion
/sh
rin
ka
ge
stra
in (
x1
0-6
)
Age (days)
(Expansion)
(Shrinkage)
-200
0
200
400
600
800
0.1 1 10 100
L-0-0L-30-0L-40-0L-50-0L-60-0
Au
tog
eno
us
exp
an
sion
/sh
rin
ka
ge
stra
in (
x1
0-6
)
Age (days)
(Expansion)
(Shrinkage)
(d) Low-heat Portland cement Figure 4 – Effectiveness of EX on compensating autogenous shrinkage strain

252
3.4 Effectiveness of the combined use of EX and SRA
Figure 7 shows the relationship between the compensation of autogenous shrinkage for
HSCs using EX with SRA and replacement dosage of EX. The definition of
0
200
400
600
800
0 10 20 30 40 50 60 70 80
Ordinary Portland cement
Low-heat Portland cementC
om
pen
sati
on
of
au
togen
ou
s sh
rin
kag
e (
x10
-6)
Unit EX content (kg/m3)
Age: 91days
EX82.5
EX061.0 2ex
EX47.4
EX144.0 2ex
0
200
400
600
800
0 10 20 30 40 50 60 70 80
Ordinary Portland cement
Low-heat Portland cementC
om
pen
sati
on
of
au
togen
ou
s sh
rin
kag
e (
x10
-6)
Unit EX content (kg/m3)
Age: 91days
EX82.5
EX061.0 2ex
EX47.4
EX144.0 2ex
Figure 5 – Compensation of autogenous shrinkage strain versus dosage of EX
: autogenous shrinkage strain from initial setting time of reference HSC
: autogenous expansion/shrinkage strain from initial setting time of EX-added HSC
: compensation of autogenous shrinkage strain from final setting time of EX-added HSC
ist
Age
t
)t,t(' isas
)t,t( isex
fst
)t,t(' isas
)t,t( isex
)t,t( fsex
)t,t( fsex
Exp
ansi
onS
hrin
kage
(Initial setting)
(Final setting)
Figure 6 – Definition of compensation of autogenous shrinkage strain

253
compensation of autogenous shrinkage for the case of combined use of EX and SRA is
shown in Figure 8, which represents the difference in autogenous strain between
0
200
400
600
800
1000
1200
0 10 20 30 40 50 60 70 80
N-0
N-6
N-9
N-12
Co
mp
ensa
tio
n o
f a
uto
gen
ou
s sh
rin
kag
e (x
10
-6)
Unit EX content (kg/m3)
EX08.3
EX142.0 2sraex
Unit SRA content
Age: 91days
0
200
400
600
800
1000
1200
0 10 20 30 40 50 60 70 80
N-0
N-6
N-9
N-12
Co
mp
ensa
tio
n o
f a
uto
gen
ou
s sh
rin
kag
e (x
10
-6)
Unit EX content (kg/m3)
EX08.3
EX142.0 2sraex
Unit SRA content
Age: 91days
(c) Ordinary Portland cement
0
200
400
600
800
1000
1200
0 10 20 30 40 50 60 70 80
L-0
L-6
L-9
L-12
Co
mp
en
sati
on
of
au
togen
ou
s sh
rin
kag
e (
x10
-6)
Unit EX content (kg/m3)
EX039.0
EX278.0 2sraex
Age: 91days
Unit SRA content
0
200
400
600
800
1000
1200
0 10 20 30 40 50 60 70 80
L-0
L-6
L-9
L-12
Co
mp
en
sati
on
of
au
togen
ou
s sh
rin
kag
e (
x10
-6)
Unit EX content (kg/m3)
EX039.0
EX278.0 2sraex
Age: 91days
Unit SRA content
(d) Low-heat Portland cement Figure 7 – Compensation of autogenous shrinkage strain for EX+SRA-added HSC
versus dosage of EX

254
EX+SRA-added concrete and SRA-added concrete. According to Figure 7, the
synergistic effect for reducing autogenous shrinkage strain is observed by the combined
use of EX and SRA when EX content is more than 40 kg/m3.
Most of strain that increased with synergistic effect appears at early ages when the hydration reaction of expansive additive is much active. Therefore, it may be considered that the hydration reaction of cement and expansive additive is delicately changed by the addition of SRA, indeed, setting time and strength development is somewhat late by adding SRA. Consequently, the stiffness of paste matrix is probably decreased by SRA and the deformation against expansive stress becomes larger in the case of combined use of EX and SRA than the case of sole use of EX. In any case, further investigations from the both chemical and mechanical point of view are needed for the detailed explanation of occurring synergistic effect.
4. Prediction model for autogenous shrinkage/expansion strain
This chapter investigates the prediction model for autogenous shrinkage/expansion strain of low-shrinkage HSCs by considering the reduction of autogenous shrinkage strain by SRA and the autogenous expansion strain by EX. The investigations are carried out on the basis of the prediction model for autogenous shrinkage strain adopted in JSCE Design Code [11], as shown in equation (2).
Exp
ansi
on
: autogenous shrinkage strain from initial setting time of SRA-added HSC
: autogenous expansion/shrinkage strain from initial setting time of EX+SRA-added HSC
: compensation of autogenous shrinkage strain from final setting time of EX+SRA-added HSC
Age
Shr
inka
ge
(Initial setting)
(Final setting)
istt
)t,t(' isas
)t,t( issraex
fst
)t,t(' isas
)t,t( issraex
)t,t( fssraex
)t,t( fssraex
Figure 8 – Definition of compensation of autogenous shrinkage strain for EX+SRA-added HSC

255
4.1 Prediction equation considering the effect of SRA
The influence of shrinkage-reducing agent on the end value of autogenous shrinkage strain is considered by adding the coefficient, which takes into account the reduction of autogenous shrinkage strain by SRA, into the equation (2). The constants regarding the development properties of autogenous shrinkage strain are determined as the same as the JSCE Code equation (2), in according to Figure 9. The constants obtained from least square method by using the measured values of autogenous shrinkage strain are listed in Table 3. Consequently, an empirical prediction equation for autogenous shrinkage strain considering the effect of SRA is given by the following equation (3):
}])tt(aexp{1['R)t,t(' bisasasisas (3)
where, asR : coefficient which takes into account the reduction of end value of autogenous shrinkage strain by SRA, given by:
1SRA035.0SRA0008.0R 2as for OPC
1SRA094.0SRA0024.0R 2as for LPC
SRA : unit shrinkage reducer content (kg/m3) (6 kg/m3 SRA 12 kg/m3), a, b: constants (in the case of W/C=0.3, a=0.6, b=0.5).
0
0.2
0.4
0.6
0.8
1
1.2
0.1 1 10 100
N-0-0N-0-6N-0-9N-0-12N-0-0 (Eq.(2))L-0-0L-0-6L-0-9L-0-12L-0-0 (Eq.(2))
Age (days)
)t,91('/)t,t(' isasisas
0
0.2
0.4
0.6
0.8
1
1.2
0.1 1 10 100
N-0-0N-0-6N-0-9N-0-12N-0-0 (Eq.(2))L-0-0L-0-6L-0-9L-0-12L-0-0 (Eq.(2))
Age (days)
)t,91('/)t,t(' isasisas
Figure 9 – Effect of SRA on the development of autogenous shrinkage strain
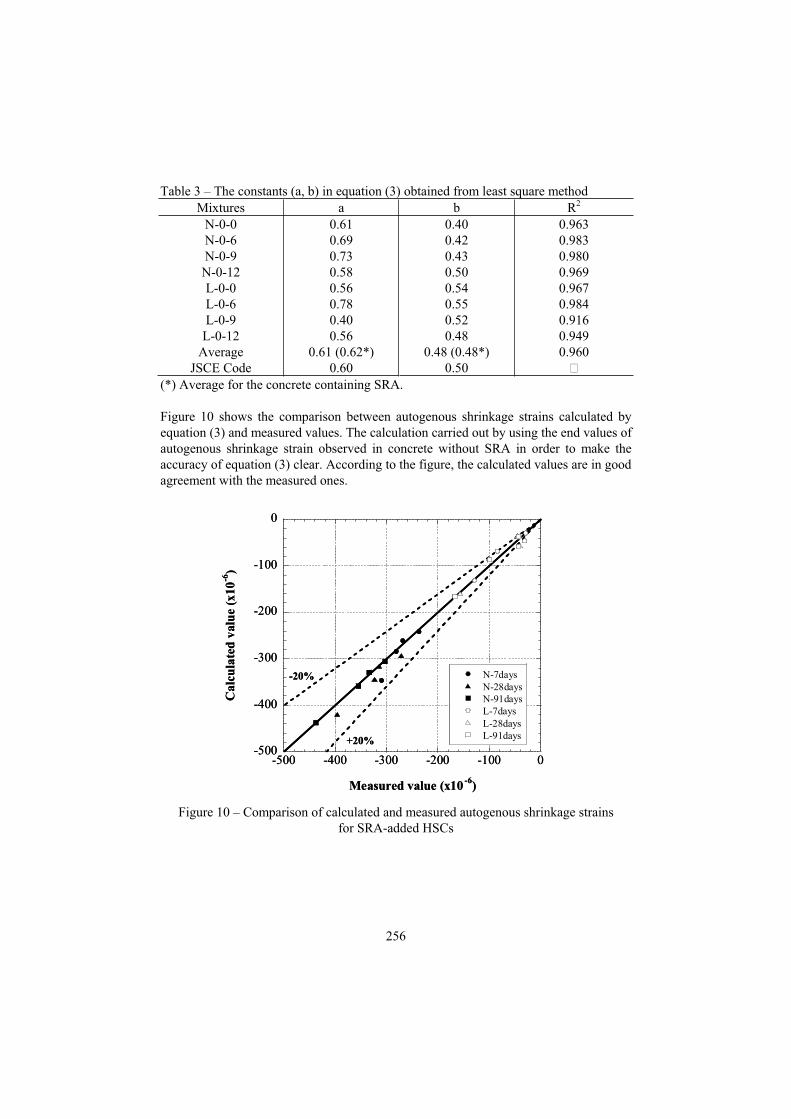
256
Table 3 – The constants (a, b) in equation (3) obtained from least square method Mixtures a b R2
N-0-0 N-0-6 N-0-9 N-0-12 L-0-0 L-0-6 L-0-9
L-0-12 Average
JSCE Code
0.61 0.69 0.73 0.58 0.56 0.78 0.40 0.56
0.61 (0.62*) 0.60
0.40 0.42 0.43 0.50 0.54 0.55 0.52 0.48
0.48 (0.48*) 0.50
0.963 0.983 0.980 0.969 0.967 0.984 0.916 0.949 0.960
�(*) Average for the concrete containing SRA.
Figure 10 shows the comparison between autogenous shrinkage strains calculated by equation (3) and measured values. The calculation carried out by using the end values of autogenous shrinkage strain observed in concrete without SRA in order to make the accuracy of equation (3) clear. According to the figure, the calculated values are in good agreement with the measured ones.
-500
-400
-300
-200
-100
0
-500 -400 -300 -200 -100 0
N-7daysN-28daysN-91daysL-7daysL-28daysL-91days
Ca
lcu
late
d v
alu
e (
x1
0-6
)
Measured value (x10-6
)
+20%
-20%
-500
-400
-300
-200
-100
0
-500 -400 -300 -200 -100 0
N-7daysN-28daysN-91daysL-7daysL-28daysL-91days
Ca
lcu
late
d v
alu
e (
x1
0-6
)
Measured value (x10-6
)
+20%
-20%
Figure 10 – Comparison of calculated and measured autogenous shrinkage strains for SRA-added HSCs

257
4.2 Prediction equation considering the effect of EX
The effect of the addition of EX on reducing autogenous shrinkage strain is evaluated by the compensation of autogenous shrinkage strain, which defined in 3.3 and shown in Figure 5. Namely, the autogenous expansion/shrinkage strain of EX-added HSCs is calculated by superposing the compensation of autogenous shrinkage strain obtained from the equation (4) to the autogenous shrinkage strain of concrete without EX based on the equation (2). The constants regarding the development properties of the compensation of autogenous shrinkage strain is determined, as given in equation (4), inaccording to Figure 11. The constants obtained from least square method by using the measured compensation of autogenous shrinkage strain are listed in Table 4.
}])tt(cexp{1[)t,t( dfsexfsex (4)
where, ex : the end value of the compensation of autogenous shrinkage strain (x 10-6), given by:
EX82.5EX061.0 2ex for OPC
EX47.4EX144.0 2ex for LPC
EX : unit expansive additive content (kg/m3) (30 kg/m3 EX 60 kg/m3), c, d: constants, given by:
c=0.8, d=0.5 for OPC c=0.5, d=0.6 for LPC
fst : final setting time (days).
0
0.2
0.4
0.6
0.8
1
1.2
0.1 1 10 100
N-30-0N-40-0N-50-0N-60-0N-40-0 (Eq.(4))L-30-0L-40-0L-50-0L-60-0L-40-0 (Eq.(4))
Age (days)
)t,91(/)t,t( fsexfsex
0
0.2
0.4
0.6
0.8
1
1.2
0.1 1 10 100
N-30-0N-40-0N-50-0N-60-0N-40-0 (Eq.(4))L-30-0L-40-0L-50-0L-60-0L-40-0 (Eq.(4))
Age (days)
)t,91(/)t,t( fsexfsex
Figure 11 – Development of compensation of autogenous shrinkage strain
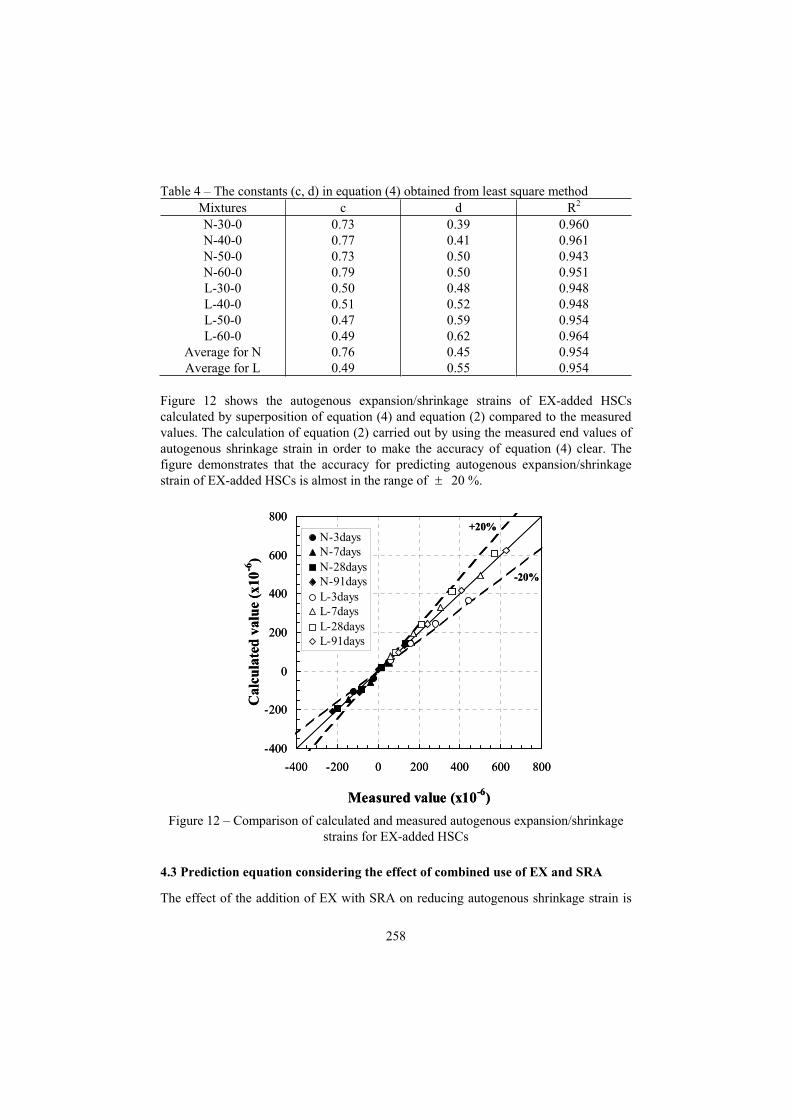
258
Table 4 – The constants (c, d) in equation (4) obtained from least square method Mixtures c d R2
N-30-0 N-40-0 N-50-0 N-60-0 L-30-0 L-40-0 L-50-0 L-60-0
Average for N Average for L
0.73 0.77 0.73 0.79 0.50 0.51 0.47 0.49 0.76 0.49
0.39 0.41 0.50 0.50 0.48 0.52 0.59 0.62 0.45 0.55
0.960 0.961 0.943 0.951 0.948 0.948 0.954 0.964 0.954 0.954
Figure 12 shows the autogenous expansion/shrinkage strains of EX-added HSCs calculated by superposition of equation (4) and equation (2) compared to the measured values. The calculation of equation (2) carried out by using the measured end values of autogenous shrinkage strain in order to make the accuracy of equation (4) clear. The figure demonstrates that the accuracy for predicting autogenous expansion/shrinkage strain of EX-added HSCs is almost in the range of 20 %.
4.3 Prediction equation considering the effect of combined use of EX and SRA
The effect of the addition of EX with SRA on reducing autogenous shrinkage strain is
-400
-200
0
200
400
600
800
-400 -200 0 200 400 600 800
Measured value (x10-6
)
Ca
lcu
late
d v
alu
e (x
10
-6)
N-3daysN-7daysN-28daysN-91daysL-3daysL-7daysL-28daysL-91days
+20%
-20%
-400
-200
0
200
400
600
800
-400 -200 0 200 400 600 800
Measured value (x10-6
)
Ca
lcu
late
d v
alu
e (x
10
-6)
N-3daysN-7daysN-28daysN-91daysL-3daysL-7daysL-28daysL-91days
+20%
-20%
Figure 12 – Comparison of calculated and measured autogenous expansion/shrinkage strains for EX-added HSCs
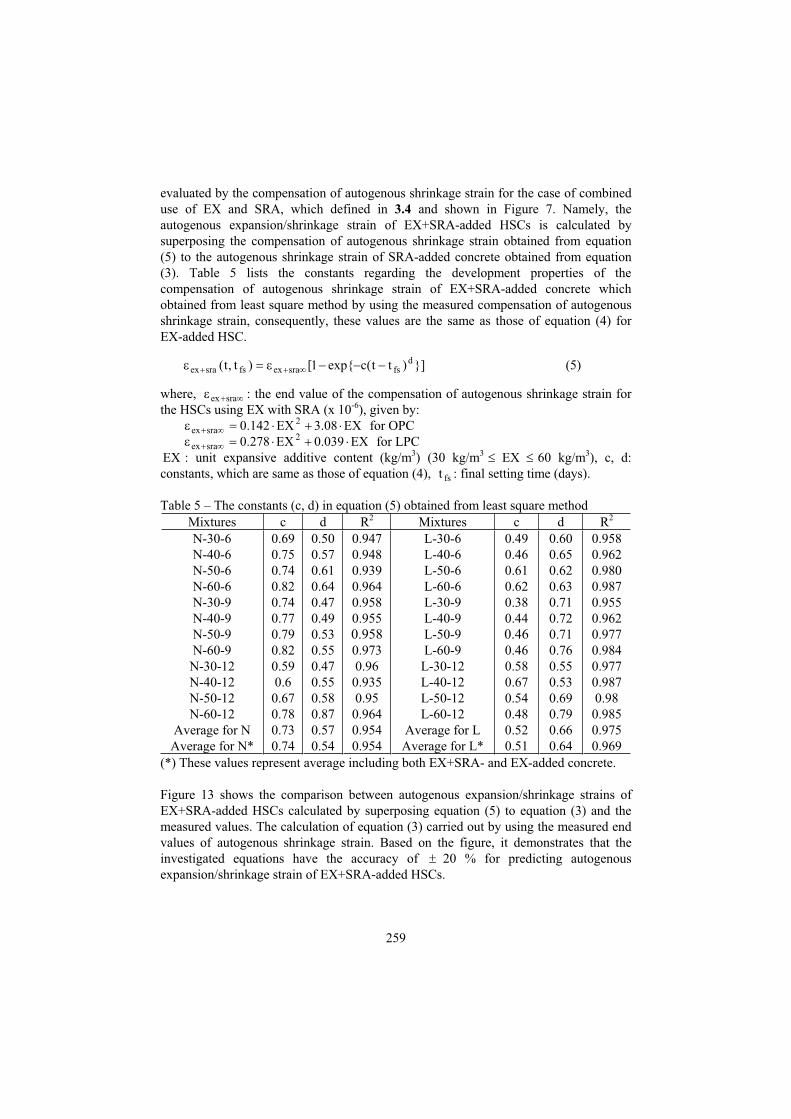
259
evaluated by the compensation of autogenous shrinkage strain for the case of combined use of EX and SRA, which defined in 3.4 and shown in Figure 7. Namely, the autogenous expansion/shrinkage strain of EX+SRA-added HSCs is calculated by superposing the compensation of autogenous shrinkage strain obtained from equation (5) to the autogenous shrinkage strain of SRA-added concrete obtained from equation (3). Table 5 lists the constants regarding the development properties of the compensation of autogenous shrinkage strain of EX+SRA-added concrete which obtained from least square method by using the measured compensation of autogenous shrinkage strain, consequently, these values are the same as those of equation (4) for EX-added HSC.
}])tt(cexp{1[)t,t( dfssraexfssraex (5)
where, sraex : the end value of the compensation of autogenous shrinkage strain for the HSCs using EX with SRA (x 10-6), given by:
EX08.3EX142.0 2sraex for OPC
EX039.0EX278.0 2sraex for LPC
EX : unit expansive additive content (kg/m3) (30 kg/m3 EX 60 kg/m3), c, d: constants, which are same as those of equation (4), fst : final setting time (days).
Table 5 – The constants (c, d) in equation (5) obtained from least square method Mixtures c d R2 Mixtures c d R2
N-30-6 N-40-6 N-50-6 N-60-6 N-30-9 N-40-9 N-50-9 N-60-9
N-30-12 N-40-12 N-50-12 N-60-12
Average for N Average for N*
0.69 0.75 0.74 0.82 0.74 0.77 0.79 0.82 0.59 0.6
0.67 0.78 0.73 0.74
0.50 0.57 0.61 0.64 0.47 0.49 0.53 0.55 0.47 0.55 0.58 0.87 0.57 0.54
0.947 0.948 0.939 0.964 0.958 0.955 0.9580.973 0.96 0.935 0.95 0.964 0.954 0.954
L-30-6 L-40-6 L-50-6 L-60-6 L-30-9 L-40-9 L-50-9 L-60-9
L-30-12 L-40-12 L-50-12 L-60-12
Average for L Average for L*
0.49 0.46 0.61 0.62 0.38 0.44 0.460.46 0.58 0.67 0.54 0.48 0.52 0.51
0.60 0.65 0.62 0.63 0.71 0.72 0.71 0.76 0.55 0.53 0.69 0.79 0.66 0.64
0.958 0.962 0.980 0.987 0.955 0.962 0.977 0.984 0.977 0.987 0.98 0.985 0.975 0.969
(*) These values represent average including both EX+SRA- and EX-added concrete.
Figure 13 shows the comparison between autogenous expansion/shrinkage strains of EX+SRA-added HSCs calculated by superposing equation (5) to equation (3) and the measured values. The calculation of equation (3) carried out by using the measured end values of autogenous shrinkage strain. Based on the figure, it demonstrates that the investigated equations have the accuracy of 20 % for predicting autogenous expansion/shrinkage strain of EX+SRA-added HSCs.

260
5. Compressive strength properties
Figure 14 shows the experimental results for compressive strength. The compressive strength was tested at 7, 28 and 91 days’ age. It confirms a tendency that the compressive strength decreases when the replacement dosage of EX and SRA increases. The strength decrease due to the pure expansive additive and shrinkage reducing additive was about 10%, which means that the water/binder ratio has to be lowered in order to maintain the strength at required level in real ready mix production. The compressive strength in the case of combined use of EX and SRA is much smaller than that of sole use of each additive. Therefore, water/binder ratio to achieve the required strength should be varied by the addition of EX and/or SRA, while all of the investigations in this study are performed by fixing the water/binder ratio. Thus, indeed, suitable dosage of EX and/or SRA as well as water/binder ratio must be determined by considering both low-shrinkage performance and high-strength performance.
-200
0
200
400
600
800
1000
-200 0 200 400 600 800 1000
Measured value (x10-6
)
Calc
ula
ted
valu
e(x
10
-6)
N-3daysN-7daysN-28daysN-91daysL-3daysL-7daysL-28daysL-91days
+20%
-20%
-200
0
200
400
600
800
1000
-200 0 200 400 600 800 1000
Measured value (x10-6
)
Calc
ula
ted
valu
e(x
10
-6)
N-3daysN-7daysN-28daysN-91daysL-3daysL-7daysL-28daysL-91days
+20%
-20%
Figure 13 – Comparison of calculated and measured autogenous expansion/shrinkage strains for EX+SRA-added HSCs

261
0
20
40
60
80
100
120
N-0
-0
N-3
0-0
N-4
0-0
N-5
0-0
N-6
0-0
N-0
-6
N-3
0-6
N-4
0-6
N-5
0-6
N-6
0-6
N-0
-9
N-3
0-9
N-4
0-9
N-5
0-9
N-6
0-9
N-0
-12
N-3
0-1
2
N-4
0-12
N-5
0-12
N-6
0-12
N-A
vera
ge
91days
28days
7daysC
om
press
ive s
tren
gth
(N
/mm
2)
(c) Ordinary Portland cement
0
20
40
60
80
100
120
L-0
-0
L-3
0-0
L-4
0-0
L-5
0-0
L-6
0-0
L-0
-6
L-3
0-6
L-4
0-6
L-5
0-6
L-6
0-6
L-0
-9
L-3
0-9
L-4
0-9
L-5
0-9
L-6
0-9
L-0
-12
L-3
0-12
L-4
0-12
L-5
0-12
L-6
0-12
L-A
vera
ge
91days
28days
7days
Co
mp
ress
ive s
tren
gth
(N
/mm
2)
(d) Low-heat Portland cement
Figure 14 – Experimental results for compressive strength
262
6. Conclusions
The following conclusions can be drawn from the present study: 1. It is surely confirmed that HSCs with W/C=0.3 and various low shrinkage/expansion
strain properties can be produced by sole/combined use of ordinary/Belite-rich low heat Portland cement, expansive additive and shrinkage-reducing chemical agent; the combined use of Belite-rich low heat Portland cement and expansive additive is effective in achieving the expansive HSCs.
2. It is demonstrated that the suggested and investigated equations have the accuracy of 20% for predicting autogenous shrinkage/expansion strain of low-
shrinkage/expansive HSCs.
References
[1] Paillere, A.M., Buil, M. and Serrano, J.J., Effect of Fiber Addition on the Autogenous Shrinkage of Silica Fume Concrete, ACI Materials Journal (1989), Vol.86, No.2, pp.139-144.
[2] Tazawa, E. and Miyazawa, S., Autogenous Shrinkage of Cement Paste with Condensed Silica Fume, Fourth CANMET/ACI International Conference on Fly Ash, Silica Fume, Slag, and Natural Pozzolans in Concrete (1992), Istanbul, Turkey, pp.875-894.
[3] Tazawa, E. and Miyazawa, S., Influence of Cement and Admixture on Autogenous Shrinkage of Cement Paste, Cement and Concrete Research (1995), Vol.25, No.2, pp.281-287.
[4] JCI, Autogenous Shrinkage of Concrete (ed. E. Tazawa), E & FN SPON (1999), London, pp.21-26, pp.56-59.
[5] Sato, R., Tanaka, S., Hayakawa, T. and Tanimura, M., Experimental Studies on Reduction of Autogenous Shrinkage and Its Induced Stress in High Strength Concrete, Proceedings of the 2nd International Research Seminar on Self-Desiccation and Its Importance in Concrete Technology (1999), Lund, Sweden, pp.163-171.
[6] Tanimura, M., Hyodo, H., Nakamura, H. and Sato, R., Effectiveness of Expansive Additive on Reduction of Autogenous Shrinkage Stress in High-Strength Concrete, Proceedings of the Third International Research Seminar on Self-Desiccation and Its Importance in Concrete Technology (2002), Lund, Sweden, pp.205-216.
[7] Tazawa, E., Miyazawa, S. and Sato, T., Influence of Cement Composition on Autogenous Shrinkage, JCA Proceedings of Cement & Concrete (1993), No.47, pp.528-533 (in Japanese).
[8] Tazawa, E. and Miyazawa, S., Influence of Constituents and Composition on Autogenous Shrinkage of Cementitious Materials, Magazine of Concrete Research (1997), 49, No.178, pp.15-22.
[9] Miyazawa, S. and Tazawa, E., Influence of Cement Composition on Autogenous shrinkage of Cementitious materials, Proceedings of the Japan Concrete Institute (1996), Vol.18, No.1, pp.699-704 (in Japanese).
[10] Tazawa, E. and Miyazawa, S., Estimation of Autogenous Shrinkage of Concrete, Journal of Materials, Concrete Structures and Pavements, Japan Society of Civil
263
Engineers (1997), No.571/V-36, pp.211-219 (in Japanese). [11] Japan Society of Civil Engineers (JSCE), Standard specifications for design and
construction of concrete structures (2002), pp.30-34 (in Japanese). [12] Kawai, M., Miyazawa, S., Kuroi, T. and Saitou, T, Study on the Prediction Model
for Autogenous Shrinkage of Concrete, Proceedings of the Japan Concrete Institute (2003), Vol.25, No.1, pp.491-496 (in Japanese).
[13] CEB-FIP MODEL CODE, Thomas Telford (1990), pp.61-62.
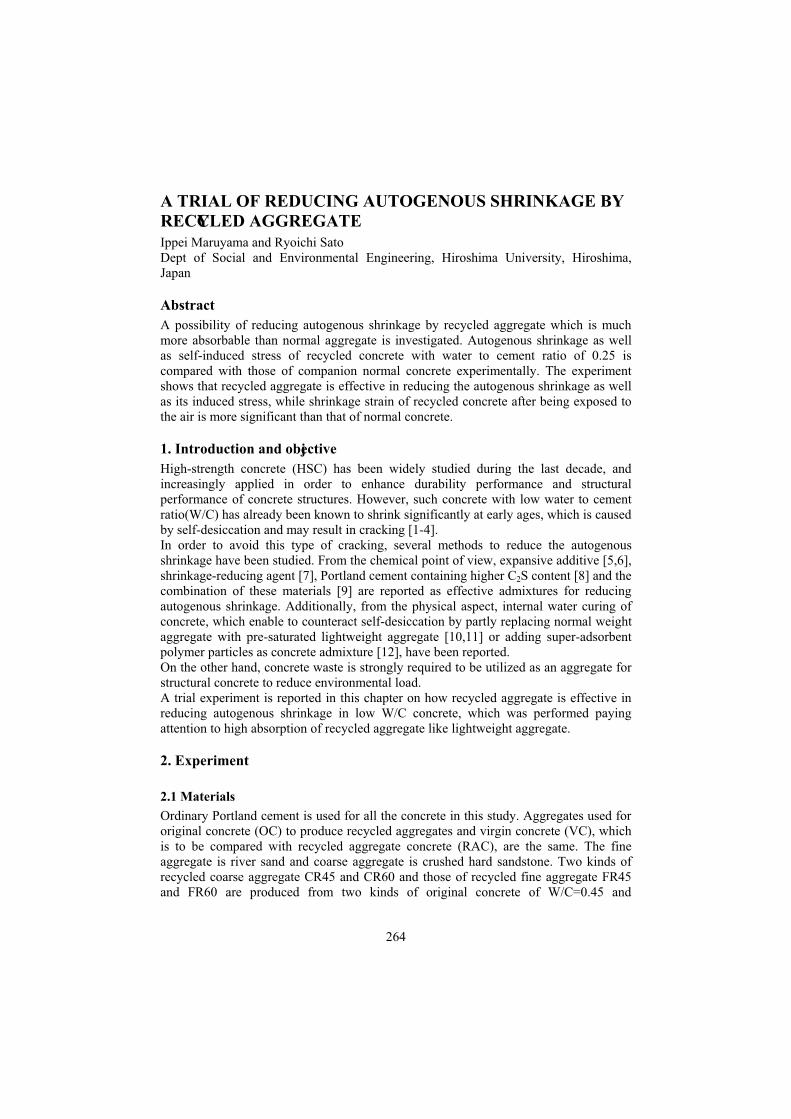
264
A TRIAL OF REDUCING AUTOGENOUS SHRINKAGE BY
RECYCLED AGGREGATE
Ippei Maruyama and Ryoichi Sato Dept of Social and Environmental Engineering, Hiroshima University, Hiroshima, Japan
Abstract
A possibility of reducing autogenous shrinkage by recycled aggregate which is much more absorbable than normal aggregate is investigated. Autogenous shrinkage as well as self-induced stress of recycled concrete with water to cement ratio of 0.25 is compared with those of companion normal concrete experimentally. The experiment shows that recycled aggregate is effective in reducing the autogenous shrinkage as well as its induced stress, while shrinkage strain of recycled concrete after being exposed to the air is more significant than that of normal concrete.
1. Introduction and objective
High-strength concrete (HSC) has been widely studied during the last decade, and increasingly applied in order to enhance durability performance and structural performance of concrete structures. However, such concrete with low water to cement ratio(W/C) has already been known to shrink significantly at early ages, which is caused by self-desiccation and may result in cracking [1-4]. In order to avoid this type of cracking, several methods to reduce the autogenous shrinkage have been studied. From the chemical point of view, expansive additive [5,6], shrinkage-reducing agent [7], Portland cement containing higher C2S content [8] and the combination of these materials [9] are reported as effective admixtures for reducing autogenous shrinkage. Additionally, from the physical aspect, internal water curing of concrete, which enable to counteract self-desiccation by partly replacing normal weight aggregate with pre-saturated lightweight aggregate [10,11] or adding super-adsorbent polymer particles as concrete admixture [12], have been reported. On the other hand, concrete waste is strongly required to be utilized as an aggregate for structural concrete to reduce environmental load. A trial experiment is reported in this chapter on how recycled aggregate is effective in reducing autogenous shrinkage in low W/C concrete, which was performed paying attention to high absorption of recycled aggregate like lightweight aggregate.
2. Experiment
2.1 Materials
Ordinary Portland cement is used for all the concrete in this study. Aggregates used for original concrete (OC) to produce recycled aggregates and virgin concrete (VC), which is to be compared with recycled aggregate concrete (RAC), are the same. The fine aggregate is river sand and coarse aggregate is crushed hard sandstone. Two kinds of recycled coarse aggregate CR45 and CR60 and those of recycled fine aggregate FR45 and FR60 are produced from two kinds of original concrete of W/C=0.45 and

265
W/C=0.63, respectively. Recycled coarse aggregate includes coarse aggregate made of mortar only. Compressive strength of these original concrete cured in water of 20 oC are 50 N/mm2 in case of W/C=0.45 and 30 N/mm2 in case of W/C=0.63 at the age of 28 days. In Table 1, details of aggregates are shown. This table also gives the ratios of mortar content to total coarse aggregate in recycled coarse aggregate (CR) and cement paste content to total fine aggregate in recycled fine aggregate (FR) at ages at crushing. The ratios of mortar and cement paste contents were made higher up to 30%-50%, in attempt to recycle concrete waste as effectively as possible. These values are obtained by a test method for insoluble residue in recycled aggregate using hydrochloric acid.Table 2 shows mix proportions of high strength concrete with virgin aggregate (HVC) and high strength concrete with recycled aggregate (HCFRC). Their water to cement ratios is 0.25. HCFRC denote concrete made of both recycled coarse aggregate and recycled fine aggregate in the proportion that CR45:CR60 is 2:1 for coarse aggregate and that FR45:FR60 is 2:1 for fine aggregate.
Table 1 – Properties of aggregate. Kinds of aggregate Age at
crushing(days)
Density
sat
Density
dry
Absorption(%)
Finenessmodulus
Mortar/Pastecontent in mass (%)
Virgin fine aggregate - 2.63 2.56 2.63 2.97 - Virgin coarse
aggregate- 2.66 2.64 0.69 6.73 -
39 2.42 2.28 5.96 6.67 34.5 Recycled coarse aggregate-45 (CR45) 655 2.41 2.29 5.13 6.62 50.8
291 2.37 2.23 6.27 6.59 42.3 Recycled coarse aggregate-60 (CR60) 655 2.41 2.29 5.28 6.53 50.3
Recycled fine aggregate-45 (FR45)
655 2.32 2.11 9.94 3.17 38.2
291 2.34 2.14 9.11 3.24 34.2 Recycled fine aggregate-60 (FR60) 655 2.30 2.07 11.02 3.27 33.0
Table 1 – Mix proportion of concrete. Unit content (kg/m
3) W/C s/a
W C S G
SP*(g/m
3)
Pigment(g/m
3)
HVC 0.25 0.40 161 645 656 996 9679 - HCFRC 0.25 0.40 161 645 581 902 9674 5859
*:Superplasticizer
2.2 Specimens and experiments
Sealed specimens of 100 x 200 mm for compressive strength and Young’s modulus are prepared and tested at the age of 3, 7, 14, 28 days. Splitting tensile strength tests are carried out with sealed specimens of 200 x 150 mm at the age of 28 days. These specimens are cured in room temperature. In order to investigate the effects of recycled coarse and fine aggregates on shrinkage

266
strain, 3 specimens for each concrete are prepared with the cross section of 150 mm x 200 mm and length of 500 mm, which are sealed until 28 days and then exposed to drying. Embedded strain gauges whose size is 20 × 104 mm and reference length is 100 mm with low elastic modulus of 39 N/mm2 are used for measuring. Two different RC beams, namely series B and S, are prepared for each HVC and HCFRC in order to measure the shrinkage induced stress. Curing condition of these beams are the same as that of shrinkage specimens. Aluminum adhesive tape is used for sealed condition. The details of the each specimen are shown in Figure 1. The B series beam specimens have the reinforcement ratio of 1.06 % and the S series have the value of 2.39 %.
3. Experimental results
3.1 Compressive strength, Young’s modulus and tensile splitting strength
Developments of compressive strength and Young’s modulus of HVC and HCFRC are shown in Figure 2 and Figure 3, respectively. In these figures, compressive strength and Young’s modulus of HVC and HCFRC cured in a condition of saturated and 20 oC.Until the age of 7 days, HVC and HCFRC under sealed condition show almost the same development of compressive strength, though HCFRC shows the slightly smaller increase at later ages. The compressive strength of HCFRC is 8 % smaller than that of HVC in sealed and room temperature condition, while it is 23 % smaller in saturated and 20 oC condition [13,14]. Young’s modulus of HCFRC is also smaller than those of HVC in sealed and room temperature condition as well as saturated and 20 oC condition. 15 % difference in sealed and room temperature condition and 17 % difference in saturated and 20 oCcondition are observed. Tensile splitting strength of HVC and HCFRC are compared in Figure 4. In this figure, 36% difference in tensile splitting strength is marked in the condition of saturated and 20oC condition, while 30% difference is marked in the condition of sealed and room temperature condition [13,14].
Figure 1 – Details of reinforce concrete beams.
(unit:mm)
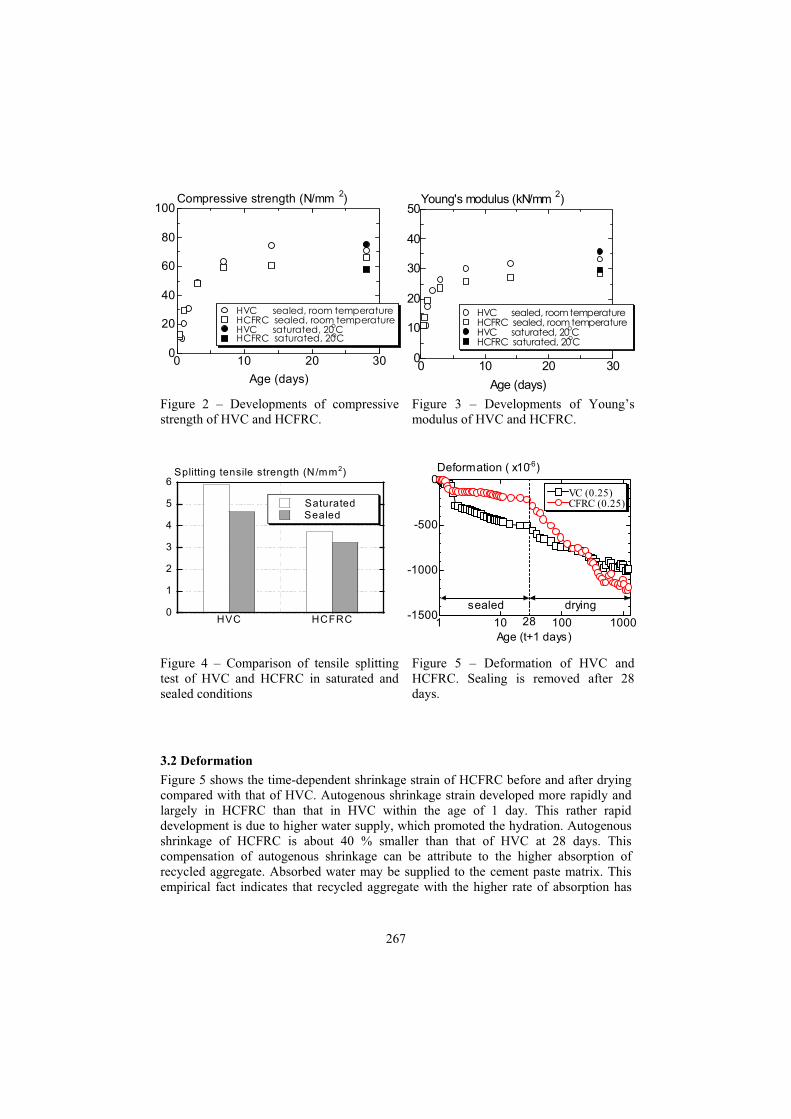
267
3.2 Deformation
Figure 5 shows the time-dependent shrinkage strain of HCFRC before and after drying compared with that of HVC. Autogenous shrinkage strain developed more rapidly and largely in HCFRC than that in HVC within the age of 1 day. This rather rapid development is due to higher water supply, which promoted the hydration. Autogenous shrinkage of HCFRC is about 40 % smaller than that of HVC at 28 days. This compensation of autogenous shrinkage can be attribute to the higher absorption of recycled aggregate. Absorbed water may be supplied to the cement paste matrix. This empirical fact indicates that recycled aggregate with the higher rate of absorption has
0 10 20 300
20
40
60
80
100
Age (days)
Compressive strength (N/mm2)
HVC sealed, room temperature HCFRC sealed, room temperature HVC saturated, 20
oC
HCFRC saturated, 20oC
0 10 20 300
10
20
30
40
50
Age (days)
Young's modulus (kN/mm2)
HVC sealed, room temperature HCFRC sealed, room temperature HVC saturated, 20
oC
HCFRC saturated, 20oC
Figure 2 – Developments of compressive strength of HVC and HCFRC.
Figure 3 – Developments of Young’s modulus of HVC and HCFRC.
0
1
2
3
4
5
6
HVC HCFRC
Splitting tensile strength (N/mm2)
SaturatedSealed
1 10 100 1000-1500
-1000
-500
0
Age (t+1 days)
Deformation ( x10-6)
VC (0.25)CFRC (0.25)
sealed drying
28
Figure 4 – Comparison of tensile splitting test of HVC and HCFRC in saturated and sealed conditions
Figure 5 – Deformation of HVC and HCFRC. Sealing is removed after 28 days.

268
eminent properties to control autogenous shrinkage at early ages. On the contrary, under drying environment after removing the seal, the whole shrinkage strain of HCFRC developed rapidly and exceeds HVC’s strain at 120 days after drying, and the former reaches 1200x10-6 at 1100 days after drying which is 20% larger than that of the latter. This could be resulted from the increase of porosity and the smaller Young’s modulus of HCFRC.
3.3 Shrinkage induced stress
Figures 6 and 7 illustrate shrinkage induced stress of concrete on the bottom of RC beams, which is calculated by using nominal cross sectional area and Young’s modulus of 200 kN/mm2 for reinforcing bar. Self-induced stress in concrete at the extreme bottom fiber due to restraint of reinforcing bar is determined by considering equilibrium requirement between concrete and reinforcing bars as well as the assumption of linear strain distribution:
1 /c st c c g g c
st st st st
P A A d C h C I
P A E (1)
where
stP : force in the tensile reinforcing bars,
cA : Cross sectional area of concrete in section of beam,
stA : Cross sectional area of tensile reinforcing bars,
stE :Young’s modulus of tensile reinforcing bars,
st : strain in tensile reinforcing bars,
c : stress of concrete at extreme bottom fiber.
1 100
1
2
3
Shrinkage-induced stress (N/mm2)
Age (t+1 days)
HVC-BHCFRC-B
dryingSealed
28 1 100
1
2
3
Shrinkage-induced stress (N/mm2)
Age (t+1 days)
HVC-SHCFRC-S
dryingsealed
28
Figure 6 – Shrinkage induced stress of HVC-B and HCFRC-B (Reinforcement ratio: 1.06 %)
Figure 7 – Shrinkage induced stress of HVC-S and HCFRC-S (Reinforcement ratio: 2.39 %)

269
Nominal cross sectional area and Young’s modulus of 200 kN/mm2 are used for calculation of stress in concrete.Self-induced stress in HCFRC-B and HCFRC-S is larger than in HVC-S and HVC-B in response to the rapid shrinkage development before 1 day. However, the later stress developed slowly. At 28 days, the stress in HCFRC is smaller than that in HVC in both B and S series. The difference is about 0.5 N/mm2 in B series, while about 1 N/mm2
difference is obtained in S series.After drying started, shrinkage stress in HCFRC was produced with approximately the same rate as that in HVC and the former resulted in 70% of the latter at 30 days after drying in both series. The reason for this could be explained by small Young’s modulus and large creep of recycled concrete, compared with those of virgin concrete. This confirms that recycled aggregate would make drying shrinkage increase and restrained stress decrease to the contrary.
4. Summary and conclusions
The possibility of reducing autogenous shrinkage by the absorbed recycled aggregate, which has much pore than normal aggregate, is examined. The following conclusions were drawn within the limit of the present trials. 1. HCFRC shrunk 80 % larger at the age of 0.8 day and 60 % smaller at the age of 28
days than HVC in sealed condition. This empirical fact indicates the effectiveness of recycled aggregate on controlling autogenous shrinkage at early ages.
2. Under dry environment after removing the seal, the total shrinkage strain of HCFRC reached almost the same shrinkage strain as HVC after 120 days drying period. And HCFRC reaches 1200x10-6 at 1100 days after drying which is 20% larger than that of HVC.
3. Shrinkage-induced stress in HCFRC by reinforcing steel bars with the ratio of 2.39 % on the bottom of RC beam was 1.1 N/mm2 and that in HVC was 2.0 N/mm2 at the age of 28 days, while 0.8 and 1.2 N/mm2 are marked with HCFRC and HVC at the ratio of 1.06, respectively. Even after drying started, though the rate of shrinkage in HCFRC is twice of that in HVC, the rate of stress development is approximately the same and HCFRC shows smaller shrinkage-induced stress. This could be explained by the smaller Young’s modulus and the larger creep strain of recycled concrete. This confirms that recycled aggregate would make drying shrinkage increase and restrained stress decrease to the contrary.
4. The optimum quantity of absorbed recycled aggregate is the problem for future study. This problem should be solved from several points of view, i.e., durability properties and mechanical properties.
References
[1] Paillere, A.M., Buil, M. and Serrano, J.J., Effect of fiber addition on the autogenous shrinkage of silicafume concrete. ACI Materials Journal, 86(2), pp. 139-144 (1989).
[2] Tazawa, E. and Miyazawa, S., Autogenous shrinkage of cement paste with condensed silica fume. Fourth CANMET/ACI International Conference on Fly Ash, Silica Fume, Slag, and Natural Pozzolans in Concrete, Istanbul, Turkey, SUPPLEMENTARY PAPERS, pp. 875-894 (1992).
270
[3] Schrage, I., Mangold, M. and Sticha, J., An approach to high-performance concrete in Germany. Fourth CANMET/ACI International Conference on Fly Ash, Silica Fume, Slag, and Natural Pozzolans in Concrete, Istanbul, Turkey, SUPPLEMENTARY PAPERS, pp. 493-511 (1992).
[4] Tazawa, E., Matsuoka, S., Miyazawa, S. and Okamoto, S., Effect of autogenous shrinkage on self stress in hardening concrete. International RILEM Symposium on Thermal Cracking in Concrete at Early Ages, pp. 221-228 (1994).
[5] Tazawa, E. and Miyazawa,S., Autogenous shrinkage caused by self desiccation in cementitious material. 9th International Congress on the Chemistry of Cement, Vol.4, New Delhi, India, pp. 712-718 (1992b).
[6] Hori, I., Morioka, M., Sakai, E. and Daimon, M., Influence of Expansive Additives on Autogenous Shrinkage. International Workshop on Autogenous Shrinkage of Concrete, JCI, Edited by Tazawa, E., Hiroshima, Japan, E & FN SPON, pp. 187-194 (1998).
[7] Weiss, W.J., Borichevsky, B.B. and Shah, S.P., The Influence of a Shrinkage Reducing Admixture on Early-Age Shrinkage Behavior of High Performance Concrete. 5th International Symposium on Utilization of High Strength/High Performance Concrete, Vol.2, Sandefjord, Norway, pp. 1339-1350 (1999).
[8] Tazawa,E. and Miyazawa,S., Influence of Cement and Admixture on Autogenous Shrinkage of Cement Paste. Cement and Concrete Research, 25 (2), pp. 281-287 (1995).
[9] Sato, R., Tanaka, S., Hayakawa, T., and Tanimura, M., Experimental Studies on Reduction of Autogenous Shrinkage and Its Induced Stress in High-strength Concrete, Proceedings of the Second International Research Seminar in Lund, pp.163-171 (1999).
[10] Philleo, R., Concrete Science and Reality. In: J.P. Skalny and S. Mindess Editors, Materials Science of Concrete II, American Ceramic Society, Westerville, OH, USA, pp. 1–8 (1991).
[11] Weber, S., and Reinhardt, H.W., A Blend of Aggregates to Support Curing of Concrete, Proceedings of International Symposium on Structural Lightweight Concrete, Edited by I. Holand, T.A. Hammer and F. Fluge, Sandefjord, Norway, pp. 662-671(1996).
[12] Jensen, O.M. and Hansen, P.F., Water-Entrained Cement-Based Materials: I. Principle and Theoretical Background, Cement and Concrete Research, 31, pp. 647-654 (2001).
[13] Sato, R., Kawai, K., and Baba, Y., Mechanical performance of reinforced recycled concrete beams, Proceedings of International Workshop on Recycled Concrete, JSPS76 Committee on Construction Materials, Tokyo, Japan, pp. 127-146 (2000).
[14] Sato, R., Kawai, K., and Baba, Y., Mechanical properties of reinforced concrete members made of recycled aggregate, Cement Science and Concrete Technology, No. 54, pp. 291-298 (2000).
