self-assembly behaviour of hetero-nuclear janus...
TRANSCRIPT

This journal is©The Royal Society of Chemistry 2017 Soft Matter, 2017, 13, 7141--7153 | 7141
Cite this: SoftMatter, 2017,
13, 7141
Self-assembly behaviour of hetero-nuclearJanus dumbbells†
Patrick O’Toole, *a Gianmarco Munao, bc Achille Giacometti d andToby S. Hudson a
We investigate the fluid structure and self-assembly of a system of Janus dumbbells by means
of aggregation-volume-bias Monte Carlo simulations and Simulated Annealing techniques. In our
approach, Janus dumbbells model asymmetric colloidal particles constituted by two tangent (touching)
spheres (labelled as h and s) of different sizes and interaction properties: specifically, the h spheres
interact with all other spheres belonging to different dumbbells via hard-sphere potentials, whereas two
s spheres interact via a square-well potential. By introducing a parameter a A [0,2] that controls the size
ratio between the h and s spheres, we are able to investigate the overall phase behaviour of Janus
dumbbells as a function of a. In a previous paper (O’Toole et al., Soft Matter, 2017, 13, 803) we focused
on the region where the s sphere is larger than the h sphere (a 4 1), documenting the presence of a
variety of phase behaviours. Here we investigate a different regime of size ratios, predominantly where
the hard sphere is larger than (or comparable to) the attractive one. Under these conditions, we observe
the onset of many different self-assembled super-structures. Depending on the specific value of a we
document the presence of spherical clusters (micelles) progressively evolving into more exotic
structures including platelets, filaments, networks and percolating fluids, sponge structures and lamellar
phases. We find no evidence of a gas–liquid phase separation for a r 1.1, since under these conditions
it is pre-empted by the development of self-assembled phases.
1 Introduction
Recent advances in the study of colloidal particles have shownthat anisotropies in their molecular geometry and in theirinteraction potential can give rise to a large variety of self-assembled structures.1–5 In particular, dumbbell-shaped particleshave attracted a great volume of attention prompted by nascentinnovation in colloidal synthetic techniques.6–8 These particles aretypically constituted by two monomers, one of which is solvophilicand the other one is solvophobic; in essence, these colloids can beviewed as the molecular counterpart of Janus spheres9–17 and arealso known as Janus dumbbells.18,19 These particles also can beconceived of as prototypical surfactants, given their amphiphilicsurface character, molecular geometry, and their assembly
behaviours.20 Very recently, theoretical and numerical studiesof anisotropic colloids are arousing increasing interest; inparticular, computer simulations of trimers,21,22 dumbbells20,23–30
and their mixtures31 have documented a large variety of super-structures including micelles, lamellae, vesicles, and tubes. Hetero-nuclear dumbbell shaped Janus colloids offer the ability to controlthe self-assembly via two routes: potential effects through surfacechemistries; and packing through bead asymmetry and moleculargeometry.
In a previous paper, that we shall refer to as ‘Paper I’, wereport in detail how the phase behaviour of hetero-nuclearJanus dumbbells (HJD) is controlled by the relative size of theinteraction sites.20 In order to properly account for their sizeratios, we introduced a parameter a A [0,2] (see the followingeqn (1) for its mathematical definition), so that a = 2 and a = 0correspond to the single square well spherical bead and thesingle hard spherical bead, respectively (see Fig. 1). In theregion approaching the homo-nuclear Janus limit (a - 1,where the interaction site cores have comparable sizes) wedemonstrated that the gas–liquid phase separation becomesmetastable with respect to the formation of bilayer structures.Under these conditions, curved structures tend to possessincreasing characteristic length, beginning to flatten out intoinfinite planar lamellar structures which eventually dominate
a School of Chemistry, University of Sydney, NSW 2006, Australia.
E-mail: [email protected] Dipartimento di Scienze Matematiche e Informatiche, Scienze Fisiche e Scienze
della Terra, Universita degli Studi di Messina, Viale F. Stagno d’Alcontres 31,
98158 Messina, Italyc Dipartimento di Chimica e Biologia ‘‘Adolfo Zambelli’’, Universita di Salerno,
via Giovanni Paolo II 132, 84084, Fisciano, SA, Italyd Dipartimento di Scienze Molecolari e Nanosistemi, Universita Ca’ Foscari Venezia,
Edificio Alfa Campus Scientifico, via Torino 155, Venezia-Mestre I-3010, Italy
† Electronic supplementary information (ESI) available. See DOI: 10.1039/c7sm01401e
Received 14th July 2017,Accepted 28th August 2017
DOI: 10.1039/c7sm01401e
rsc.li/soft-matter-journal
Soft Matter
PAPER
Publ
ishe
d on
29
Aug
ust 2
017.
Dow
nloa
ded
by U
NIV
ER
SIT
A C
A F
OSC
AR
I V
EN
EZ
IA o
n 12
/10/
2017
15:
18:5
1.
View Article OnlineView Journal | View Issue

7142 | Soft Matter, 2017, 13, 7141--7153 This journal is©The Royal Society of Chemistry 2017
the phase diagram.20,25,26 Upon decreasing a we observed threedifferent regimes: a conventional gas–liquid phase separation(1.3 o a o 2); low temperature formation of inverse micelles(a E 1.3); and a competition between gas–liquid formation andthe appearance of bilayer structures (1.1 r a r 1.2). Curvedbilayer structures observed in this region range from vesicles tobi-continuous sponge-like structures.20
In this paper we extend the analysis of Paper I to include themost interesting region corresponding to 0.25 o ao 1.1, whereself-assembled structures are expected to dominate the scene.Since no gas–liquid critical point has been found for a o 1.1,the formation of a conventional liquid is not possible belowthis critical value. However, there is still a significant portion ofthe potential to engage in bonding. Our aim is to address thefollowing important question: given that no conventional liquid ispresent here, and bonding is directed by the steric influence of thepurely repulsive bead, what low temperature structures areexpected to dominate the a space region (0.25 o a o 1.1)?
We perform our investigation by means of a combination ofthe Aggregation-Volume-Bias Monte Carlo (AVBMC)32 techniquecoupled with Simulated Annealing (SA) to study the structuralvariations of aggregates. We remark that while AVBMC waspreviously applied to perform extensive simulations of analo-gous systems with highly directional interactions,33 none ofthe previous studies have addressed the present model, norunderpinned the crucial role played by kinetic bottlenecking inthe formation of aggregates, with the only notable exceptionof ref. 22.
Our study is then contrasted with other recent theoretical, aswell as experimental studies on analogous systems in the lastpart of the paper. Before that, the paper is arranged as follows:in Section 1.1 we briefly discuss the model and the interactionpotential; in Section 2 we introduce the AVBMC algorithm(Section 2.1) and the SA protocol (Section 2.2). The reader isreferred to the previous Paper I20 for a more thorough descriptionof both model and methods. In Section 3 we discuss the for-mation of self-assembled aggregates, characterise the differencesbetween them, elucidate the effect of packing on continuousstructures and present the phase diagrams. In Section 4 wecompare our major findings with already existing experimentaland theoretical works, finally drawing conclusions in Section 5.The ESI† contain a formulation to model packing constraintsimposed on structures by the hard non-attractive bead and
develop simple packing arguments that broadly predict thebehaviour of layered structures as a function of a.
1.1 Model
In our approach, HJDs (with characteristic length parameter s),are composed by two spherical interaction sites, referred to asbeads s and h, with diameters, ss and sh, each modifiedthrough a size ratio parameter aA [0,2]. This parameter definesthe relative size of each bead core by
ss ¼as ao 1
s a4 1;
(
sh ¼s ao 1
ð2� aÞs a4 1
(;
(1)
where sh is the diameter of a purely repulsive hard-sphere (HS),denoted h, and ss is the diameter of the core of a square-well(SW) sphere, denoted s, with interaction range in addition to itshard-core, parametrised as l(= 0.5), such that the resultantinteraction range is
g = ss + lss. (2)
Neighbouring particles whose s sphere’s centre comes within gof the s sphere centre have a bonding energy of �e. The total site-wise interaction potential between two particles is defined as
Vtotal = VSW(rs,s) + VHS(rh,s) + VHS(rs,h) + VHS(rh,h), (3)
i.e. as the sum of contributions from the s and h beads, wherethe potentials VSW and VHS are defined by
VSW rssð Þ ¼
1 rss oss
�e ss o rss � g
0 rss 4 g
8>>><>>>:
;
VHS rabð Þ ¼1 rab o sa þ sbð Þ=2
0 rab 4 sa þ sbð Þ=2
(;
ða; bÞ 2 fðs; hÞ; ðh; sÞ; ðh; hÞg;
(4)
where a and b correspond to the interaction sites along withthe corresponding particle diameters. Therefore, in the case
Fig. 1 Sketch of the particle at different points along the a parameter: (a) pure HS; (b) a = 0.25, such that sh = 1 and ss = 0.25; (c) a = 2/3; (d) the Janusdumbbell where a = 1.0; (e) a = 4/3, where ss = 1 and sh = 2/3; (f) a = 7/4, where ss = 1 and sh = 1/4; (g) pure SW. The shaded regions denote the range ofthe interaction of each s bead. Regions of the a space considered in this work are contained in the blue rectangle, i.e. 0.25 r a r 1.3.
Paper Soft Matter
Publ
ishe
d on
29
Aug
ust 2
017.
Dow
nloa
ded
by U
NIV
ER
SIT
A C
A F
OSC
AR
I V
EN
EZ
IA o
n 12
/10/
2017
15:
18:5
1.
View Article Online

This journal is©The Royal Society of Chemistry 2017 Soft Matter, 2017, 13, 7141--7153 | 7143
corresponding to ss = sh (the Janus limit), particles take theform denoted in panel d) of Fig. 1. The interaction energyparameter e (set to unity for all a) provides the unit of energy, interms of which we define the reduced temperature T* � kBT/e.We also make use of the reduced number density r* � (N/V)s3,where N is the total number of particles and V the volume of thesimulation box.
2 Methods2.1 Aggregation-volume-bias Monte Carlo
In our study we make use of a suitable version of the AggregationVolume Bias Monte Carlo (AVBMC) algorithm.32,34 The imple-mentation can be found in Paper I20 that focused on the regiona 4 1. Where a o 1 the smaller ss sphere forces assembledclusters to generally have a closed topology (with the stickycomponents facing toward a centroid (either point, or forelongated structures toward a centroid ‘line’ or plane section,depending on the geometry of the cluster, i.e. a globe orfilament or a plane). These inward facing cluster topologiesoften cause relaxation to an ‘equilibrium’ structure to be slow,and percolation to depend upon the diffusion of clustersthrough the simulation box. Cluster structures at low tempera-ture are long-lived and thus using naıve particle move algo-rithms requires long simulation times to adequately samplecluster configurations. In order to facilitate the relatively quicksampling of cluster size distributions and geometries an imple-mentation of the AVBMC algorithm is employed to increaseequilibrium relaxation rates and also improve the gathering ofcluster related statistics.32 AVBMC moves are attempted 50% ofthe time, with the remaining attempts split equally betweenrotations and translations.
2.2 Simulated annealing
Since T* must be sufficiently low to encourage an aggregationprocess, and in order to traverse the large length-scale variationin a sensible manner, the parameter a, which determines ss
and thus lss, the interaction range, implies that the corres-ponding T* that encourages an aggregation process will alsovary with a (consider Fig. 2). In this context, particle systems ofN = 1000 with a o 1.3 are subjected to Monte Carlo (MC)simulations in the canonical ensemble incorporating anannealing process with initial temperature, Tinit* above thecorresponding Boyle temperature, TB(a).26 The latter is definedas the temperature where the second virial coefficient B2
vanishes, thus indicating that attractive interactions becomeprevailing. A (T*) descent algorithm was chosen such that theprogression was linear in b(=(kT*)�1) and the length of eachsimulation chosen such that the descent rate was approxi-mately consistent between simulations run at different Tfinal*.Once the systems have reached the desired temperature,the resulting structures were allowed to locally equilibrate foranother 107 Monte Carlo steps (MCS) before sampling overanother 107 MCS commenced. Total simulation lengths variedbetween 108 and 2 � 108 MCS. This process was applied across
the range 0.25 r a r 1.3. The total set of T* and a explored isdepicted in Fig. 3. We note that the method of annealing here isconsistent with a slow cool rate and should yield reasonableapproximations to the global thermodynamic minima at thecorresponding densities. The highest density considered hereis r* = 0.3, the volume fraction, f* = pr[ss
3 + sh3]/6, naturally
varies across a consistent with the variation in bead volumesum. Restricting the maximum number density r* has theeffect of probing liquid and low r* aggregation behaviour.Dense liquid (f* - 0.454, the corresponding first point ofcrystallisation for pure hard spheres) and dense crystalline
Fig. 2 Proposed T* � a phase diagram demonstrating the high densityphases observed in this work. Regions bound by solid lines are obtained inthis paper and Paper I,20 while regions bound by dashed lines indicate likelybehaviour for low temperature structures based on packing arguments fora 4 1.3. FCCoct indicates an FCC crystal structure of s beads withoctahedral site interstitial spaces occupied by the h bead. Likewise,the ‘‘oct-tet’’ indicates substitutional disorder over the octahedral andtetrahedral interstices.
Fig. 3 Summary of all T* examined at each a by SA employing the AVBMCalgorithm (black squares). Coloured circles around each square indicatethe degree of structure developed in assemblies at each (a,T*) point.Also located here for reference, various temperatures considered whendetermining the temperature descent protocol: TB, TB – scaled to meetTc*(a = 2), Tc*(a) as obtained by SUS technique. The right legend indicatesthe degree of structure in the bonding networks of s beads.
Soft Matter Paper
Publ
ishe
d on
29
Aug
ust 2
017.
Dow
nloa
ded
by U
NIV
ER
SIT
A C
A F
OSC
AR
I V
EN
EZ
IA o
n 12
/10/
2017
15:
18:5
1.
View Article Online
7144 | Soft Matter, 2017, 13, 7141--7153 This journal is©The Royal Society of Chemistry 2017
phases (f* - 0.545, the last point of fluid order in the samesystem)35 require special methods to elucidate their structureand thermodynamic properties and cannot be obtainedmeaningfully from the present methodology. Nevertheless,structures that are observed to have long range order or aconsistent dominant environment, as measured by certain metrics(see Section 2.3), are termed crystalline in the corresponding sense.
2.3 Metrics
In order to analyse our simulations we employ a group ofmetrics. As some of these metrics rely on a concept of a ‘bond’we define two particles to be connected by a bond if thedistance between their s beads is less than the interactionrange i.e. d(-ris
� -rjs
) o g (eqn (2)). Firstly the radial distributionfunction gij(r) = (g(r))ij, taken separately over each of: the particlecentroids; the s beads; and the h beads. For instance the s–sradial distribution function is defined as
gssðrÞ ¼1
4pr2rN
XNs
is¼1
XNs
js¼1;jsais
d r� ris;js� �* +
(5)
where is, js are all the particle pairs in the system, andris,js
= |ris� rjs
|. Similar definitions hold true for ghh(r), andghs(r) = gsh(r). These correlation functions can be inspected foreach state-point to identify persistent structure in any of theliquid or self-assembled phases.
Secondly we obtain the radius of gyration computed as:
Rg2 ¼ 1
Ns
XNs
i¼1ri � Cð Þ2 (6)
where C is the cluster centroid. This value can then be comparedto the cluster sizes to find the fractal dimension of the system (seeSection 3.4.2).
Thirdly, we collect values of bond-orientation over eachparticle in a state-point via distributions of q6(Nb),36 where Nb
is the number of bonds per particle. This is the l = 6 case of thegeneral bond-orientation order parameters36
ql ¼ffiffiffiffiffiffiffiffiffiffiffiffiffi4p
2l þ 1
r Xþlm¼�l
1
Nb
Xbonds
Ylm Oð Þ�����
�����2
(7)
that is routinely used to identify close-packing crystallinestructures. Here Nb is the number of bonds and Ylm(O) arethe usual spherical harmonics. We also monitor the corres-ponding distributions of bonds (P(Nb)) and of q6.
Fourthly, distributions P(Ns) of cluster sizes Ns are collectedand presented for some state-points with finite structures, toidentify morphological characteristics associated with eachcluster. It is possible to carry out an analysis of the complexityof aggregates by using a relation between the number ofparticles in a cluster, Ns, and the gyration radius of the cluster, Rg.The resulting relation can be expressed as a power law:37
Ns ¼ kfRg
a0
� �Df
: (8)
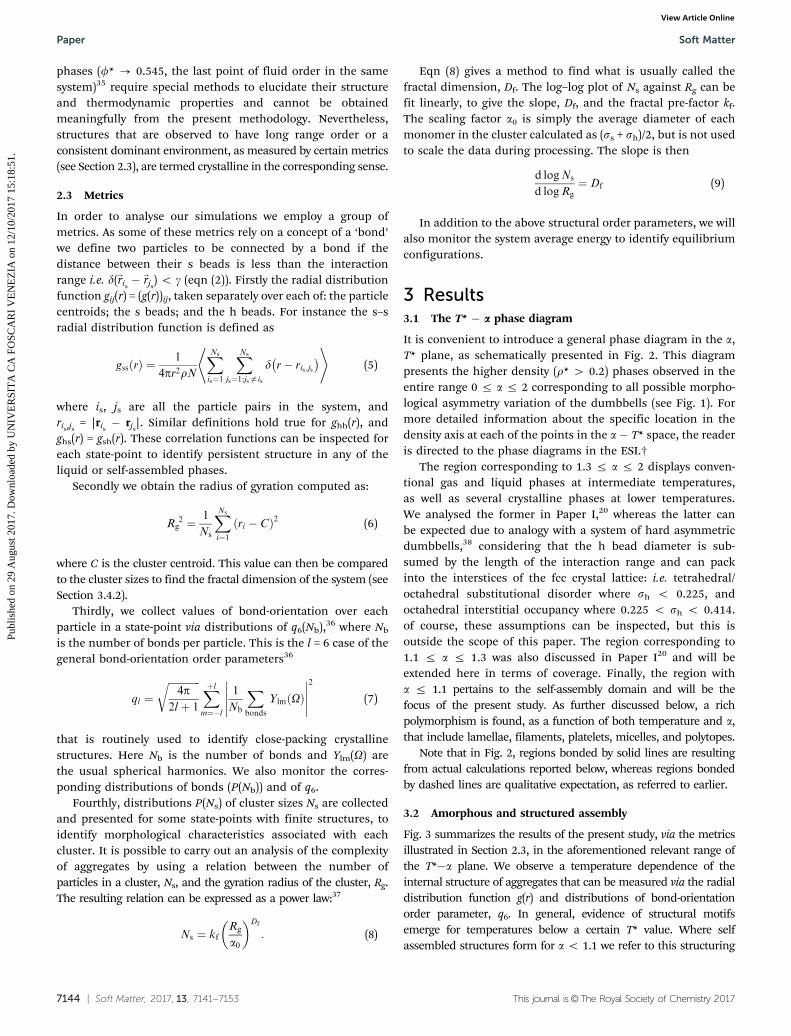
Eqn (8) gives a method to find what is usually called thefractal dimension, Df. The log–log plot of Ns against Rg can befit linearly, to give the slope, Df, and the fractal pre-factor kf.The scaling factor a0 is simply the average diameter of eachmonomer in the cluster calculated as (ss + sh)/2, but is not usedto scale the data during processing. The slope is then
d logNs
d logRg¼ Df (9)
In addition to the above structural order parameters, we willalso monitor the system average energy to identify equilibriumconfigurations.
3 Results3.1 The T* � a phase diagram
It is convenient to introduce a general phase diagram in the a,T* plane, as schematically presented in Fig. 2. This diagrampresents the higher density (r* 4 0.2) phases observed in theentire range 0 r a r 2 corresponding to all possible morpho-logical asymmetry variation of the dumbbells (see Fig. 1). Formore detailed information about the specific location in thedensity axis at each of the points in the a � T* space, the readeris directed to the phase diagrams in the ESI.†
The region corresponding to 1.3 r a r 2 displays conven-tional gas and liquid phases at intermediate temperatures,as well as several crystalline phases at lower temperatures.We analysed the former in Paper I,20 whereas the latter canbe expected due to analogy with a system of hard asymmetricdumbbells,38 considering that the h bead diameter is sub-sumed by the length of the interaction range and can packinto the interstices of the fcc crystal lattice: i.e. tetrahedral/octahedral substitutional disorder where sh o 0.225, andoctahedral interstitial occupancy where 0.225 o sh o 0.414.of course, these assumptions can be inspected, but this isoutside the scope of this paper. The region corresponding to1.1 r a r 1.3 was also discussed in Paper I20 and will beextended here in terms of coverage. Finally, the region witha r 1.1 pertains to the self-assembly domain and will be thefocus of the present study. As further discussed below, a richpolymorphism is found, as a function of both temperature and a,that include lamellae, filaments, platelets, micelles, and polytopes.
Note that in Fig. 2, regions bonded by solid lines are resultingfrom actual calculations reported below, whereas regions bondedby dashed lines are qualitative expectation, as referred to earlier.
3.2 Amorphous and structured assembly
Fig. 3 summarizes the results of the present study, via the metricsillustrated in Section 2.3, in the aforementioned relevant range ofthe T*�a plane. We observe a temperature dependence of theinternal structure of aggregates that can be measured via the radialdistribution function g(r) and distributions of bond-orientationorder parameter, q6. In general, evidence of structural motifsemerge for temperatures below a certain T* value. Where selfassembled structures form for a o 1.1 we refer to this structuring
Paper Soft Matter
Publ
ishe
d on
29
Aug
ust 2
017.
Dow
nloa
ded
by U
NIV
ER
SIT
A C
A F
OSC
AR
I V
EN
EZ
IA o
n 12
/10/
2017
15:
18:5
1.
View Article Online

This journal is©The Royal Society of Chemistry 2017 Soft Matter, 2017, 13, 7141--7153 | 7145
temperature as Ts*. This value varies over a due to structure specificvariations.
A few solid lines have been drawn because they are convenientto identify some characteristic regions. The top (red) line, labelledwith TB, represents the Boyle temperature separating attraction-dominated regions (below the line) from a region where repulsiondominates (above the line).25,26 When scaled to meet the a = 2critical point, corresponding to the single bead square-wellgas–liquid critical point, the (yellow) line TB-scaled is obtainedas a reasonable approximation to the gas–liquid critical points(in blue) as previously computed by the successive umbrellasampling (SUS) technique.20 Around the point where self-assembled phases begin to appear on the phase diagrams thisapproximation breaks down, observable as the divergence ofthe blue and yellow lines. For a o 1.1, the gas–liquid criticaltemperature line (blue) seems to yield to the location of theonset of structured aggregates.
Black squares with coloured coronas also appear in Fig. 3.Above the Boyle temperature line TB, the correspondingcomputed state points (with red coronas) are found to showno sign of assembly, as expected. For the other points, wedivide them in two different classes: in the case of assemblieswhere the local environment around each particle is amor-phous, g(r) is consistent with a fluid phase; these state pointswill be denoted as amorphous and appear in Fig. 3 with yellowcoronas. The alternative case corresponds to state points wherepeaks resolve in g(r) and strong peaks also develop in bond-wisedistributions of q6. These points will be denoted as structuredand appear in Fig. 3 as black squares with green coronas.Notice that both amorphous and structured state points displaya non-monotonic behaviour as a function of a prompting thatcare must be exercised in their interpretation.
Let us first consider amorphous structures (yellow points).They appear both for a o 1 and a 4 1. In the a o 1 case, it isevident that they roughly lay above a continuation of theprojected gas–liquid critical temperature curve (the blue Tc linein Fig. 3) indicating these state points to be of a gas phase thatis eventually driven to a metastable condensed phase uponcooling, the occurrence of this phase being pre-empted by theonset of other, energetically favoured, self-assembled phases.In the a 4 1 case, they also appear below the stable gas–liquidcritical line, indicating these to be part of a stable liquid havinga strong tendency to self-assembly, however.
Next we consider structured (green) state points, also appearingabove and below a = 1. In the a o 1 case, these points are thecounterparts of the previous case, as they lay below the projectedgas–liquid critical temperature. As no stable liquid is present here,as remarked, we suggest these to be ‘‘crystalline’’ structures drivenby a self-assembly process. In the a 4 1 case, the interpretation isnot quite as simple, as we shall see next.
3.3 Structures for a 4 1
From Fig. 3 it is apparent that in the region 1.1 r ar 1.3 thereis a gas–liquid transition at T* E 0.4 (whose detailed valuedepends on a) and an additional structural transition on coolingfrom T* E 0.3 to T* E 0.2 where the structures change from
amorphous (yellow coronas) to structured (green coronas). Thiscan be explicitly checked by our metrics.
Fig. 4 demonstrates long range order developing in gss(r) oncooling T*: 0.3 - 0.2 across the region 1.05 r a r 1.3. Somesnapshots of typical structures obtained can be viewed in Fig. 5:bilayer structures observed at T* = 0.3 (top two panels of Fig. 5),demonstrate a g(r) similar to the liquid (compare the first panelof Fig. 4 with the g(r) for liquid state reported in Fig. 9 of PaperI20). Conversely, corresponding state-points at T* = 0.2 for thesame r* (bottom panels of Fig. 5), show the development of aconsistent long range order (second panel of Fig. 4).
Further insights can be obtained by identifying the localenvironment around the dominant bonding structure viabond-wise distributions of q6 taken over the s beads, as inFig. 6. These distributions are selected from a = 1.2, r* = 0.3 andvarious T*. The left-most two panels (T* = 0.4 and 0.3) corre-spond to bond distributions consistent with liquid structurearound each particle, whereas the right-most two panels(T* = 0.2 and 0.1), where the presence of a few local environmentsis signalled by the development of a strong peak in the distribu-tions of q6, indicate the onset of a dominant local environmentswith Nb A (13,16).
In the snapshots of the bottom two panels of Fig. 5,distributions corresponding to the ‘‘crystalline’’ local orderare seen as the 16, 15, and 14 coordinate systems, whichcorrespond to different environments on the curved bilayer.Where Nb = 16 the local environment is consistent with a flatsection of the bilayer structure, and where Nb o 16, the particleresides on a portion of the bilayer with higher curvature.
Further interesting continuous structures are observed inthis region (as indicated in Fig. 7), the left-most a ‘‘liquid-like’’configuration from a = 1.15, and the right-most a ‘‘crystalline-like’’configuration from a = 1.2. These high curvature structures can beinterpreted via simple geometric arguments (see ESI†).
Fig. 4 Onset of crystalline order developing in the low temperature fluidacross 1.1 r a r 1.3 (indicated in the legend). The top two panels collectgss(r) at r* = 0.3 for T* = 0.3 and T* = 0.2, respectively; the bottom twopanels collect gss(r) at r* = 0.1 for T* = 0.3 and T* = 0.2, respectively. ForT* = 0.3 and several a values, the self-assembled structures clearly showa fluid order, despite being arranged into various bilayer structures.Additional peaks resolve upon cooling.
Soft Matter Paper
Publ
ishe
d on
29
Aug
ust 2
017.
Dow
nloa
ded
by U
NIV
ER
SIT
A C
A F
OSC
AR
I V
EN
EZ
IA o
n 12
/10/
2017
15:
18:5
1.
View Article Online

7146 | Soft Matter, 2017, 13, 7141--7153 This journal is©The Royal Society of Chemistry 2017
3.4 Structures for a o 1
As anticipated in Fig. 2, a plethora of different morphologiesare found where a o 1, whose detailed properties stronglydepend on the specific a value. In order to facilitate thediscussion, we will illustrate our findings below by groupingthem by common characteristics rather than by specific valuesof a. A correspondence between morphologies and a values canbe read off from Fig. 2. While finite size effects were considered
as a major factor in the systems that form structures thatpercolate across the simulation cell, we did not perform athorough study of finite size effects here. We expect that finitesize effects—which are discussed at length in Paper 1—don’tallow us to pin the exact values for the percolation locii, in factthe study here was kept to the relatively low density results inorder to observe low density aggregation and how the smallscale structures might build to larger structures. In our opinionthere is scope for a large scale stand-alone finite-size effectsstudy, especially for regions where the fractal dimension iseither low dimensional (filaments) or perhaps non-integer(networks and sponges).
3.4.1 Amorphous-structured transition for a = 2/3.Reducing a below 1, we observe distinctly different behaviours,but with similar features in g(r) and q6. Fig. 8 depicts the radialdistribution functions for a = 2/3, both for the center-to-centercorrelation (top), and for the single components gss(r), ghh(r),and ghs(r) = gsh(r) (from top to bottom). As T* is graduallyreduced from 0.3 to 0.1, a marked increase of all correlations is
Fig. 5 Snapshots of bilayer structures obtained for r* = 0.3 and differentvalues of a and �T*. Top panels: a = 1.1, T* = 0.3 (left) and a = 1.2, T* = 0.3(right); bottom panels: a = 1.1, T* = 0.2 (left) and a = 1.2, T* = 0.2 (right).
Fig. 6 Distributions of bond orientation order parameter q6 for a = 1.2and r* = 0.3, a typical liquid density for this value of a. Temperatures areindicated at the top of each panel. For high T* (left panels) no significantstructure is observed, whereas for low T* (right panels) we detect a clearbond-orientation order, that shows a dominant local environment withNb A (13,16).
Fig. 7 Orthographic snapshots of continuous phases obtained at liquiddensities at a = 1.15 (left) a = 1.2 (right). 2nd nearest images are included forclarity with simulation box overlay. The right panel takes edge on in the110 plane; due to the orthographic camera the tubes through the structureappear linear, but are in fact curved.
Fig. 8 Radial distribution functions for a = 2/3, reporting the formation offinite structures as a function of the temperature (indicated in the legend):at low T*, platelet develop as indicated by the peaks that resolve forss o r o Rg. Also developing here are peaks corresponding to the h beadson neighbouring particles pushing against one another (third panel), andalso neighbouring s beads (last panel).
Paper Soft Matter
Publ
ishe
d on
29
Aug
ust 2
017.
Dow
nloa
ded
by U
NIV
ER
SIT
A C
A F
OSC
AR
I V
EN
EZ
IA o
n 12
/10/
2017
15:
18:5
1.
View Article Online

This journal is©The Royal Society of Chemistry 2017 Soft Matter, 2017, 13, 7141--7153 | 7147
observed, with a progressive development of additional peaksat larger r/s that are indicators of the onset of long-rangespatial ordering. Fig. 9 displays snapshots of representativeconfigurations corresponding to T* = 0.3 (left) and T* = 0.1(right), where a gradual transition from a less structured,amorphous to a highly structured, crystalline-like configuration,is clearly visible. It is worth emphasizing that this region is studiedfairly extensively in experiments,1,2,4,6,9,12,39,40 in terms of asym-metry between the h (representing the solvophobic moiety) and thes (representing the solvophilic). However certain differences inthe modelled potential and the scales at which the experiments arecarried out limit direct comparison, in particular in terms of therange of interactions that is of the order of 10% of s in experi-ments, as compared with the values of 50% used here. A similarissue is also present in Janus fluids,41,42 and it is due to thenumerical difficulties associated with a very short range attraction(and hence very low temperatures), albeit some special techniqueshave been implemented to cope with this problem.43
It has been observed elsewhere20,24–28 that equal diameterspheres (a = 1) yield only lamellar structures at moderate andhigher r*, whereas at lower densities micelles and plateletsform due to systems residing below the percolation locus.Moving away from this limit we observe a progression of thestructural variation that proceeds by limiting the spacial extentof bilayer structures. Where a E 1 bilayers adopt continuoustwo-dimensional lamellar topologies, whereas at the other endof this progression (a = 2/3) structures are topologicallycompact. On decreasing a between these points the h beadsof each contiguous co-planar particles eventually enforce a limiton the spacial extent of a cluster in at least one dimension.This behaviour has effects on the structure of aggregates, suchas to restrict packing in one to three dimensions, depending onthe particular a (see the ESI† for more details). In a similarfashion to the a4 1 cases (with the appearance of ‘‘structured’’patterns) in this case we document the onset of plateletsand micelles, demonstrated by peaks resolving in gss(r). At theend of the progression mentioned above, where a E 2/3, weobserve that g(r) develops peaks consistent with the formationof finite structures (see the large dip in all gss(r) at r E 2.5 for allT*, in the second panel of Fig. 8). These features are also visiblein the relative snapshots of micelles and platelets at a = 2/3from above and below the structuring transition depictedin Fig. 9.
3.4.2 Onset of fractal aggregates for 1/2 r a o 1. In theregion 2/3 o a o 1, the progression from continuous bilayerstructures to finite micelles and platelets is preceded by twodifferent major regions of aggregate formation, due to densifi-cation and packing constraints (see ESI†). To explore the effectson the structure of aggregates we make use of the gyrationradius Rg, defined in eqn (6).
Additional insights can be obtained from the calculation ofthe fractal dimension Df of the aggregates, as discussed inSection 2.3.
From this formulation we presume that linear clusters willhave a Df E 1, lamellar structures will have Df E 2, approxi-mately spherical clusters and networks will have a Df of E 3,presumably (but not necessarily) with different fractal pre-factor kf. If Df takes integer values the system is characterizedby a relatively simple geometry; on the other hand, if Df attainsnon-integer values, the geometry is more difficult to rationalise.Cases of Df close to integer values imply that the proximaldimension dominates. This means that a system composed ofone-dimensional filaments that have some curvature in thelong axis will have fractional Df. If that curvature lies in oneadditional dimension, Df lies in (1,2), if it lies in two additionaldimensions, the cluster system will have 2 o Df o 3. A systemthat possesses some 2D structure that bends will have 2 o Df o 3.
Fig. 10 compiles histograms of Rg indexed by Ns collectedover all structures observed in every simulation for all a A(0.5,1.0). Structures that have percolated across the cell areomitted from the diagram as these may have Df that are notrepresentative of the primitive cluster. Clusters can have anRg 4 Lbox/2 and still not have ‘‘percolated’’, in the sense thatthe cluster connects to its next periodic image, so as an addedprecaution structures with Rg c Lbox/2 are also omitted. Thisdoes introduce the limitation that legitimately compact 1Dstructures that align along the space diagonal of the simulation
Fig. 9 Representative structures for a = 2/3 at r* = 0.2 with T* indicatedunderneath each cluster. Notice the difference in internal structure of the sbead bonding environments – left amorphous, right structured.
Fig. 10 Cluster size Ns as a function the radius of gyration Rg/s along thewhole range of densities and temperatures studied and for all a values,indicated by the colour-bar (colour on-line). The slope gives the fractaldimension Df of the system. The red, green and blue lines guide the eye forDf = 3, 2, and 1, respectively.
Soft Matter Paper
Publ
ishe
d on
29
Aug
ust 2
017.
Dow
nloa
ded
by U
NIV
ER
SIT
A C
A F
OSC
AR
I V
EN
EZ
IA o
n 12
/10/
2017
15:
18:5
1.
View Article Online

7148 | Soft Matter, 2017, 13, 7141--7153 This journal is©The Royal Society of Chemistry 2017
box (with Rg !ffiffiffi3p
=2Lbox) or flat bilayer structures that align
along the 110 plane (with Rg !ffiffiffi2p
=2Lbox) are not included.However the low density aggregates give enough information toallow us insight into the structure of smaller aggregates thatmerge or percolate to form larger structures on increasing r*.Analysing Fig. 10 we see that structures between 2/3 r a r 1cross several regions with differing Df. At small cluster sizes(Ns o 20) aggregates have Df E 3 regardless the specific valueof a. As aggregates grow larger (Ns 4 20), Df depends stronglyon a. For 0.65 r a r 0.775 most aggregates have Df E 1,consistently with elongation in a single dimension, and we willrefer to these structures as elongated micelles and filaments(see the Section 3.4.4). For 0.775 r a r 0.90 most aggregatesare formed by merging curved filaments into branching networks(for a o 0.85), or by merging platelets into sponge-like structures(for a Z 0.85). For a - 1 all aggregates have Df E 2, consistentwith platelets and lamellar structures. All these different regionsare schematically summarized in the phase diagram of Fig. 2 andfurther detailed below.
3.4.3 Branching networks and sponge-like structures for0.85 o a o 0.95. Network structure and sponge-like structurescan be distinguished by the lengths of component pieces. Whilethe characteristic substructures in each type are determined bythe interplay of packing and potential effects, network structureshave smaller minimum diameter, which we describe as mergedfilaments, whereas a sponges appear as merged platelets. Snapshotsdemonstrating the substructures in the branching network and thesponge can be viewed in Fig. 11.
3.4.4 Filaments and networks for 0.75 o a o 0.85. Whileone-dimensional aggregates are found across 0.7 o a o 0.9,
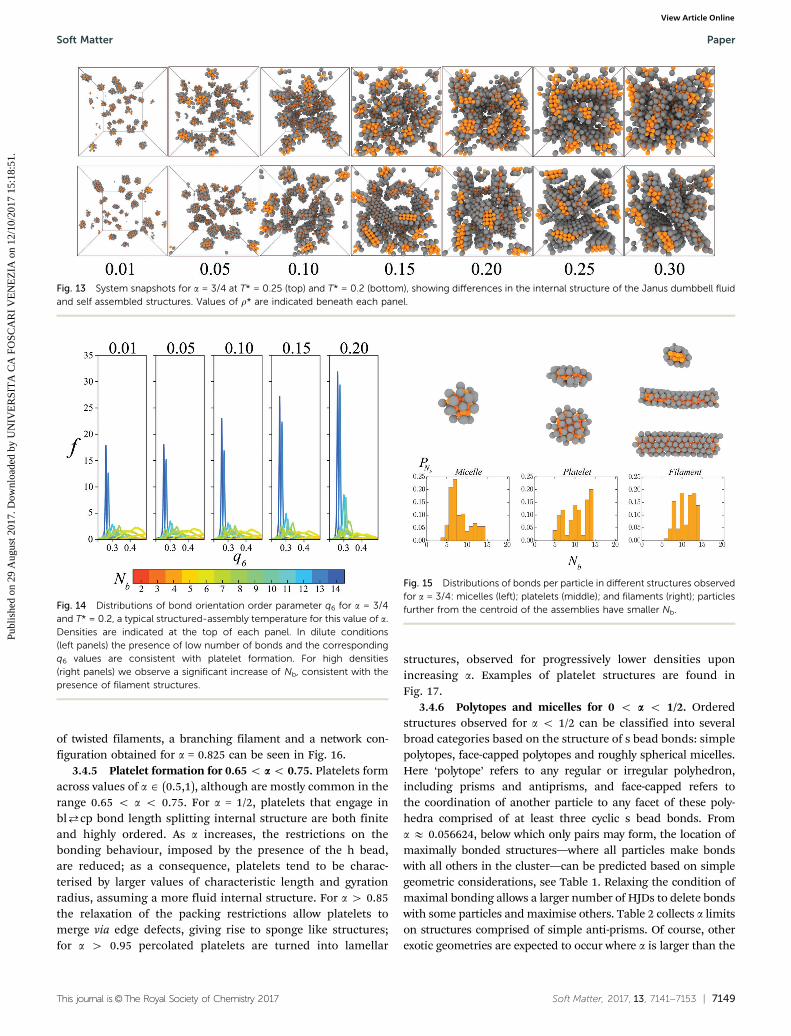
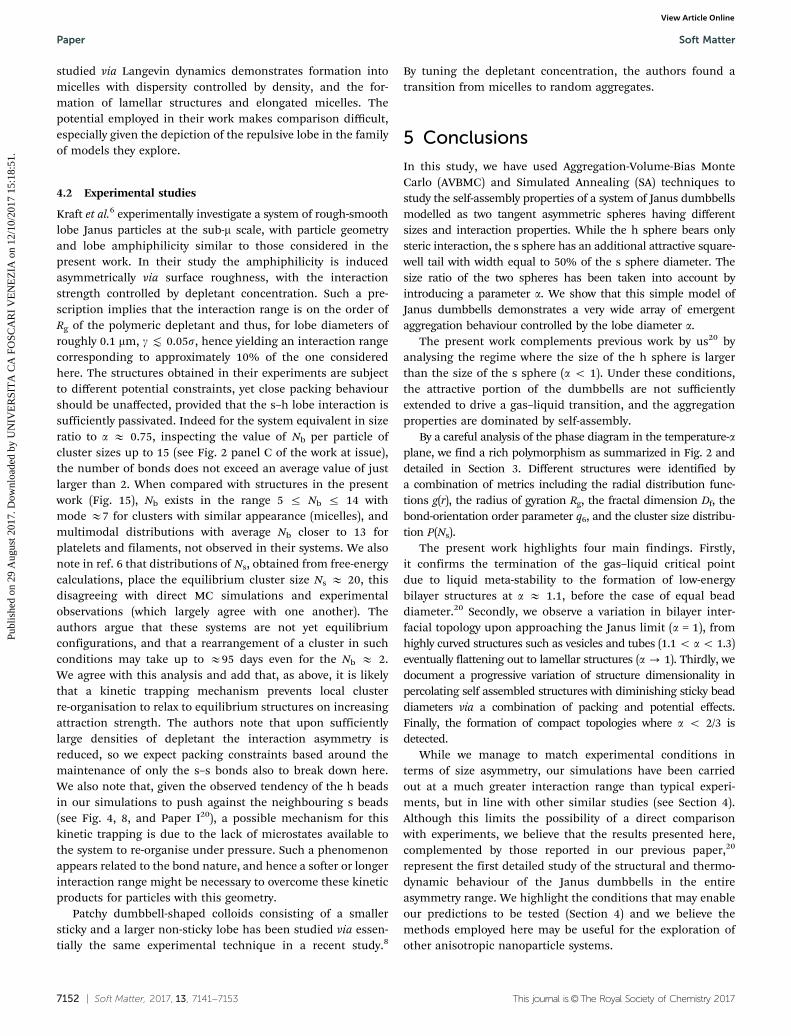
they are most readily identifiable where aE 3/4 (due to packingeffects, see the ESI†). Their formation below Ts* can be inferredby looking at the behaviour of g(r) reported in Fig. 12: weobserve that long-range filament order develops on cooling, assignalled by the resolution of peaks at r E wfilament, wherewfilament corresponds to the filament width. Snapshots of fullisotherms of the fluid and self-assembled phases can be viewedin Fig. 13. The increase in filament formation upon increasingthe density is accompanied by a consistent bond-orientationsignature in q6 (Fig. 14), corresponding to a progression fromplatelet-dominated state points, with r* o 0.15, to filamentdominated state-points, with r* Z 0.15. Interestingly, theappearance of similar structures has been documented alsoin patchy models with patch coverage fraction slightly lessthan the Janus case.44 Differences between micelles, plateletsand filaments in the distributions of Nb can be viewed inFig. 15.
The increase of the number of stripes, made by close-packed(cp) particles with Nb A 14, 13, 12, 10, 8, indicates that particlescan pack finitely due to the steric effect of the h bead, but canstack together (on a diagonal) infinitely in one dimension,engaging in bonding between i and i + 1 successive stackinglayers (consistently with the bond-limited (bl) case in packingmodel in the ESI.† On the other hand, a decrease in Nb
corresponds to a particle location further from the centroid ofthe aggregate. Distances between filament bonding environmentscan be viewed by the location of the cp 2 bl distances at r \ ss
and r t g for nearest neighbours.For a A (0.775,0.85), the additional volume of the potential
available for bonding allows filaments to tolerate twisting andmore curvature (see the ESI†). Structures at moderate densitiesin this region have Df E 1, however depending upon the extentof twisting and filament curvature, separate nucleation sites canmerge to form branched structures with Df A (1,3). Percolatingbranching filament structures are referred to as networks, andare found across this region at the higher r* studied. An example
Fig. 11 Snapshots of configurations with a branching network at a = 0.85,r* = 0.15 and T* o Ts* (top) and a sponge structure at a = 0.875 (bottom)for the same r*, T*. Left panels show the whole configuration, and rightpanels show only the s beads.
Fig. 12 Comparison between radial distribution functions gss(r) ofdumbbells, respectively, in a percolating elongated micelle phase (a = 0.75,T* = 0.25, r* = 0.15), and in an ordered 1D filament-dominated phase(a = 0.75, T* = 0.2, r* = 0.15).
Paper Soft Matter
Publ
ishe
d on
29
Aug
ust 2
017.
Dow
nloa
ded
by U
NIV
ER
SIT
A C
A F
OSC
AR
I V
EN
EZ
IA o
n 12
/10/
2017
15:
18:5
1.
View Article Online
This journal is©The Royal Society of Chemistry 2017 Soft Matter, 2017, 13, 7141--7153 | 7149
of twisted filaments, a branching filament and a network con-figuration obtained for a = 0.825 can be seen in Fig. 16.
3.4.5 Platelet formation for 0.65 o a o 0.75. Platelets formacross values of a A (0.5,1), although are mostly common in therange 0.65 o a o 0.75. For a = 1/2, platelets that engage inbl$cp bond length splitting internal structure are both finiteand highly ordered. As a increases, the restrictions on thebonding behaviour, imposed by the presence of the h bead,are reduced; as a consequence, platelets tend to be charac-terised by larger values of characteristic length and gyrationradius, assuming a more fluid internal structure. For a 4 0.85the relaxation of the packing restrictions allow platelets tomerge via edge defects, giving rise to sponge like structures;for a 4 0.95 percolated platelets are turned into lamellar
structures, observed for progressively lower densities uponincreasing a. Examples of platelet structures are found inFig. 17.
3.4.6 Polytopes and micelles for 0 o a o 1/2. Orderedstructures observed for a o 1/2 can be classified into severalbroad categories based on the structure of s bead bonds: simplepolytopes, face-capped polytopes and roughly spherical micelles.Here ‘polytope’ refers to any regular or irregular polyhedron,including prisms and antiprisms, and face-capped refers tothe coordination of another particle to any facet of these poly-hedra comprised of at least three cyclic s bead bonds. Froma E 0.056624, below which only pairs may form, the location ofmaximally bonded structures—where all particles make bondswith all others in the cluster—can be predicted based on simplegeometric considerations, see Table 1. Relaxing the condition ofmaximal bonding allows a larger number of HJDs to delete bondswith some particles and maximise others. Table 2 collects a limitson structures comprised of simple anti-prisms. Of course, otherexotic geometries are expected to occur where a is larger than the
Fig. 13 System snapshots for a = 3/4 at T* = 0.25 (top) and T* = 0.2 (bottom), showing differences in the internal structure of the Janus dumbbell fluidand self assembled structures. Values of r* are indicated beneath each panel.
Fig. 14 Distributions of bond orientation order parameter q6 for a = 3/4and T* = 0.2, a typical structured-assembly temperature for this value of a.Densities are indicated at the top of each panel. In dilute conditions(left panels) the presence of low number of bonds and the correspondingq6 values are consistent with platelet formation. For high densities(right panels) we observe a significant increase of Nb, consistent with thepresence of filament structures.
Fig. 15 Distributions of bonds per particle in different structures observedfor a = 3/4: micelles (left); platelets (middle); and filaments (right); particlesfurther from the centroid of the assemblies have smaller Nb.
Soft Matter Paper
Publ
ishe
d on
29
Aug
ust 2
017.
Dow
nloa
ded
by U
NIV
ER
SIT
A C
A F
OSC
AR
I V
EN
EZ
IA o
n 12
/10/
2017
15:
18:5
1.
View Article Online

7150 | Soft Matter, 2017, 13, 7141--7153 This journal is©The Royal Society of Chemistry 2017
corresponding limit, allowing a sufficient volume of micro-statesavailable to that structure to be thermodynamically stable. This isdemonstrated via the fact that, while the limit for a pentagonalanti-prism, which allows another particle to face-cap one of theconstituent pentagonal faces where ao 0.25, the structure is notobtained (Fig. 18) in simulations until a E 1/3 (Fig. 19). Thisindicates that while structures may be thermodynamically stable atlow r*, they may not be mechanically stable upon compression,
where additional packing effects will play a significant role. Forshort range potentials a structure that can maximise the totalnumber of contacts between particles in the cluster might befavoured and, away from the regular polytope limits, structuresthat can distort to achieve this maximum are more likely todominate. This behaviour presents the problem of many possiblenearby minima in the potential energy surface of a cluster
Fig. 16 Structures obtained for a = 0.825, T* = 0.2 and r* = 0.25, showingfilament twisting (left), branching (middle) and network (right).
Fig. 17 Platelet structures obtained across a indicated underneath eachplatelet. In general platelets diameters increase with a.
Table 1 Summary of small polytope structure limits imposed by the presence of the h bead. The values of a for which these structures are possible arereported. Only maximally bonded structures are considered. Face-capping of distorted structures where a is larger than the corresponding limit is expected
Perfect polytope structure limits
Ns Geometry a(l) l = 0.5 Nbonds Nbonds/i
2 Linear o
1ffiffiffi3p � 1
2
1
2þ 1þ lffiffiffi
3p
o0.056624 1 1
3 Equilateral triangle
1ffiffiffi3p � 1
2
1
2þ 1þ lffiffiffi
3p
E0.056624 3 2
4 Tetrahedron
ffiffiffi3
8
r� 1
2ffiffiffi3
8
rlþ
ffiffiffi3
8
rþ 1
2
E0.079216 6 3
4, 5, 6 Square, Sq. base pyramid, octahedron
ffiffiffi2p� 1ffiffiffi
2p
lþffiffiffi2pþ 1
E0.132705 6, 10, 15 3, 4, 5
Table 2 Summary of anti-prism structure limits. The values of a for whichthese structures are possible are reported. Face-capping of the open sitesis likewise expected for these structures. Numbers greater than five in eachlayer are better described as platelets
Perfect polytope structure limits
Ns Geometry a Nbonds Nbonds/i
6 Triangle E0.132704 12 48 (9,10) Square (facecapped �2) E0.186081 16(24) 4(5,4)10 (11,12) Pentagon (facecapped �2) E0.234122 20(30) 4(5)
Fig. 18 Variation in structures for a = 1/4, with Ns A 4, 5, 6, 7, 8, 9 (fromleft to right). The most common structures for the lowest T*(=0.1),are distorted octahedron, distorted square anti-prism, and a 7-memberstructure. The largest aggregate is a monoface-capped distorted squareantiprism (right-most).
Fig. 19 Variation in structures for a = 1/3, with Ns A 6, 7, 8, 9, 10, 11, 12(from left to right). The most common structure for the lowest T*(=0.1)is a face-capped square antiprism. The largest structure is an axiallycompressed icosahedron (right-most).
Paper Soft Matter
Publ
ishe
d on
29
Aug
ust 2
017.
Dow
nloa
ded
by U
NIV
ER
SIT
A C
A F
OSC
AR
I V
EN
EZ
IA o
n 12
/10/
2017
15:
18:5
1.
View Article Online

This journal is©The Royal Society of Chemistry 2017 Soft Matter, 2017, 13, 7141--7153 | 7151
undergoing reorganisation, and it is likely to be a source ofkinetic trapping in experiments of Janus particles at the largerscales (E mm) where assembly is driven by size exclusion effectsvia depletion.
4 Comparison with other simulationand experimental studies
The current findings bear comparison to similar systems whichhave attracted some attention recently.
4.1 Simulation studies
Whitelam et al.23 explore an essentially similar model (ofpeanuts) by a method that approximates the dynamical evolutionof assembly via a Monte Carlo process. The authors provide akinetic phase diagram, exploring the effect of size ratio and siteseparation. The most relevant difference between their modeland the one adopted in the present study is the use of acontinuous attractive interaction (unlike the discrete potentialemployed here). Despite differences in model and approach,several key features are found to agree with the present work.For thermodynamic states categorised by site separationd/(R1 + R0) = (ss + sh)/2, attraction strength e p T*�1 and sizeratio range 0.2 t R1/R0 t 2 (where R1 and R0 correspond to theradii of the solvophilic and solvophobic particles, respectively,whence 0.5 t a t 1.8) broad agreement about the low densitymicellisation is found. Micelle polydispersity is observed to varywith lobe size ratio, even if different structural properties areobserved: for instance, cluster size distributions calculated byWhitelam et al. are distinctly smaller than those obtained in thepresent work. Broadly, they observe crystalline clusters andfaceted polyhedra, in addition to micelles and bilayers; it maybe worth noting that for the first two identified structures thesite separation is too small to warrant a valid comparison withthe present work, and a better point of reference is the work ofAvvisati et al.28 Nonetheless, the formation of similar phases forsite separations equivalent to ours is an encouraging result.The authors also note that a longer square-well attraction, thatthey used for exploratory simulations, allowed the formationof structures not realised by adopting the relatively shortinteraction ranges presented in the paper and that it is likelythat smaller particles may therefore have structures available tothem that their larger counterparts do not. We agree with thisintuition, and recommend any experimental work that wishesto test these predictions do so with as small a particle aspossible—in Whitelam et al. they suggest a particle size ofaround s = 5 nm, however it is likely that double that might besufficient. We also note that functionalising a dumbbell-shapedparticle to be amphiphilic at that scale may prove difficult,though some promising results from AuPS (gold–polystyrene)nano-scale particles may pave the way to probe these lengthscales (admittedly with inverted hydrophilicity for comparisonto a o 1), however proper choice of solvent conditions canmitigate this.4
Other theoretical studies of similar systems, including ‘‘Mickey-Mouse’’ particles (constituted by trimers with two h lobes per s)and patchy dumbbells can be found, respectively, in ref. 21 and 28.In the trimer case they identify essentially similar behaviour withrespect to the variation in critical parameters on increasing theparticle shape anisotropy (the h–s lobe distance), as described inour previous Paper I.20 In ref. 28, the authors explore the effectof site separation, parametrized as l = 2d/(ss + sh), in the range0.07 r l r 0.5 (at maximum, half of ours (l = (ss + sh)/2)), and lobesize ratios q = sh/ss A 0.95, 1.035, 1.25, equivalent to our a A 1.05,E 0.966, 0.8. Due to the incorporation of non-tangent beadseparations, the Kern–Frenkel model45 is employed to restrictthe potential evaluation to only those interactions that do notdirectly pass through the h bead. For the tangent configuration, anextremum of the parameter space included in the model but notexplored in their study, accounting for the mutual orientationcomponent is unnecessary due to the geometry of the particle.State diagrams are presented in the volume fraction (f) and sphereseparation for the three diameter ratios explored. In particular, forq = 1.035(a E 0.966) they increase the site separation from asystem that resembles the Janus sphere (l t 0.05 with patchcoverage w t 0.4) up to a more conventional dumbbell shape(l E 0.5, w - 0.5). In the limit of large sphere separation, for thisq value, their model provides lamellar structures agreeing in trendwith the extension to tangent systems; however, upon reducing theinternuclear separation, they observe compact aggregates withhigh curvature, such as vesicles (l E 0.2) and micelles of elongatedand spherical shape. For q = 1.25 (related to our point a = 0.8),the observation of elongated micelles for all l \ 0.3, except forhigh volume fractions (where bilayer structures are found) seemsto agree, at least in principle, with the formation of filament likestructures. The authors present neither diagrams of structures, norstructural properties of these elongated micelles, and hence amore rigorous comparison can hardly be performed. We also notethat the attraction strength used in their study (T* E 0.28) isslightly higher than the corresponding Ts*(t0.25) for this parti-cular size ratio; this implies that the highly structured filamentsmay have just been missed, although we acknowledge that thepacking behaviour is slightly different do to the intra-particle s–hinter-nuclear distance (see ESI†).
Finally, Hatch et al.22 study a model system of trimercolloids models by means of AVBMC technique and Configu-ration Bias Monte Carlo simulations to explore a set of modelsupon varying lobe diameters and distribution lobe angles. Wenote that, despite the differences in models, similar structuralbehaviours are found for certain combinations of their parameters,including filament structures, micelles, and vesicles. The occur-rence of similar structures and behaviours in models resemblingthe one investigated in the present study suggests the existence ofsome overarching rules concerning the nature of self-assembledphases for these simple colloids.
As a further interesting consideration, dynamical studies ofsoft Janus dimers in the bulk30 or confined between plates46
document the presence of density driven clustering behaviourand diffusion anomaly, this resembling some water-like properties.Confined in cylindrical pores,47 a related model of Janus dumbbells
Soft Matter Paper
Publ
ishe
d on
29
Aug
ust 2
017.
Dow
nloa
ded
by U
NIV
ER
SIT
A C
A F
OSC
AR
I V
EN
EZ
IA o
n 12
/10/
2017
15:
18:5
1.
View Article Online
7152 | Soft Matter, 2017, 13, 7141--7153 This journal is©The Royal Society of Chemistry 2017
studied via Langevin dynamics demonstrates formation intomicelles with dispersity controlled by density, and the for-mation of lamellar structures and elongated micelles. Thepotential employed in their work makes comparison difficult,especially given the depiction of the repulsive lobe in the familyof models they explore.
4.2 Experimental studies
Kraft et al.6 experimentally investigate a system of rough-smoothlobe Janus particles at the sub-m scale, with particle geometryand lobe amphiphilicity similar to those considered in thepresent work. In their study the amphiphilicity is inducedasymmetrically via surface roughness, with the interactionstrength controlled by depletant concentration. Such a pre-scription implies that the interaction range is on the order ofRg of the polymeric depletant and thus, for lobe diameters ofroughly 0.1 mm, g t 0.05s, hence yielding an interaction rangecorresponding to approximately 10% of the one consideredhere. The structures obtained in their experiments are subjectto different potential constraints, yet close packing behaviourshould be unaffected, provided that the s–h lobe interaction issufficiently passivated. Indeed for the system equivalent in sizeratio to a E 0.75, inspecting the value of Nb per particle ofcluster sizes up to 15 (see Fig. 2 panel C of the work at issue),the number of bonds does not exceed an average value of justlarger than 2. When compared with structures in the presentwork (Fig. 15), Nb exists in the range 5 r Nb r 14 withmode E7 for clusters with similar appearance (micelles), andmultimodal distributions with average Nb closer to 13 forplatelets and filaments, not observed in their systems. We alsonote in ref. 6 that distributions of Ns, obtained from free-energycalculations, place the equilibrium cluster size Ns E 20, thisdisagreeing with direct MC simulations and experimentalobservations (which largely agree with one another). Theauthors argue that these systems are not yet equilibriumconfigurations, and that a rearrangement of a cluster in suchconditions may take up to E95 days even for the Nb E 2.We agree with this analysis and add that, as above, it is likelythat a kinetic trapping mechanism prevents local clusterre-organisation to relax to equilibrium structures on increasingattraction strength. The authors note that upon sufficientlylarge densities of depletant the interaction asymmetry isreduced, so we expect packing constraints based around themaintenance of only the s–s bonds also to break down here.We also note that, given the observed tendency of the h beadsin our simulations to push against the neighbouring s beads(see Fig. 4, 8, and Paper I20), a possible mechanism for thiskinetic trapping is due to the lack of microstates available tothe system to re-organise under pressure. Such a phenomenonappears related to the bond nature, and hence a softer or longerinteraction range might be necessary to overcome these kineticproducts for particles with this geometry.
Patchy dumbbell-shaped colloids consisting of a smallersticky and a larger non-sticky lobe has been studied via essen-tially the same experimental technique in a recent study.8
By tuning the depletant concentration, the authors found atransition from micelles to random aggregates.
5 Conclusions
In this study, we have used Aggregation-Volume-Bias MonteCarlo (AVBMC) and Simulated Annealing (SA) techniques tostudy the self-assembly properties of a system of Janus dumbbellsmodelled as two tangent asymmetric spheres having differentsizes and interaction properties. While the h sphere bears onlysteric interaction, the s sphere has an additional attractive square-well tail with width equal to 50% of the s sphere diameter. Thesize ratio of the two spheres has been taken into account byintroducing a parameter a. We show that this simple model ofJanus dumbbells demonstrates a very wide array of emergentaggregation behaviour controlled by the lobe diameter a.
The present work complements previous work by us20 byanalysing the regime where the size of the h sphere is largerthan the size of the s sphere (a o 1). Under these conditions,the attractive portion of the dumbbells are not sufficientlyextended to drive a gas–liquid transition, and the aggregationproperties are dominated by self-assembly.
By a careful analysis of the phase diagram in the temperature-aplane, we find a rich polymorphism as summarized in Fig. 2 anddetailed in Section 3. Different structures were identified bya combination of metrics including the radial distribution func-tions g(r), the radius of gyration Rg, the fractal dimension Df, thebond-orientation order parameter q6, and the cluster size distribu-tion P(Ns).
The present work highlights four main findings. Firstly,it confirms the termination of the gas–liquid critical pointdue to liquid meta-stability to the formation of low-energybilayer structures at a E 1.1, before the case of equal beaddiameter.20 Secondly, we observe a variation in bilayer inter-facial topology upon approaching the Janus limit (a = 1), fromhighly curved structures such as vesicles and tubes (1.1 o ao 1.3)eventually flattening out to lamellar structures (a- 1). Thirdly, wedocument a progressive variation of structure dimensionality inpercolating self assembled structures with diminishing sticky beaddiameters via a combination of packing and potential effects.Finally, the formation of compact topologies where a o 2/3 isdetected.
While we manage to match experimental conditions interms of size asymmetry, our simulations have been carriedout at a much greater interaction range than typical experi-ments, but in line with other similar studies (see Section 4).Although this limits the possibility of a direct comparisonwith experiments, we believe that the results presented here,complemented by those reported in our previous paper,20
represent the first detailed study of the structural and thermo-dynamic behaviour of the Janus dumbbells in the entireasymmetry range. We highlight the conditions that may enableour predictions to be tested (Section 4) and we believe themethods employed here may be useful for the exploration ofother anisotropic nanoparticle systems.
Paper Soft Matter
Publ
ishe
d on
29
Aug
ust 2
017.
Dow
nloa
ded
by U
NIV
ER
SIT
A C
A F
OSC
AR
I V
EN
EZ
IA o
n 12
/10/
2017
15:
18:5
1.
View Article Online
This journal is©The Royal Society of Chemistry 2017 Soft Matter, 2017, 13, 7141--7153 | 7153
Conflicts of interest
There are no conflicts to declare.
Acknowledgements
We would like to thank the Sydney Informatics Hub at theUniversity of Sydney for providing access to HPC facilityArtemis.
References
1 S.-M. Yang, S.-H. Kim, J.-M. Lim and G.-R. Yi, J. Mater.Chem., 2008, 18, 2177–2190.
2 J.-W. Kim, D. Lee, H. C. Shum and D. A. Weitz, Adv. Mater.,2008, 20, 3239.
3 F. Li, D. P. Josephson and A. Stein, Angew. Chem., Int. Ed.,2011, 50, 360–388.
4 J. Du and R. K. O’Reilly, Chem. Soc. Rev., 2011, 40,2402–2416.
5 I. Buttinoni, J. Bialke, F. Kuemmel, H. Loewen, C. Bechingerand T. Speck, Phys. Rev. Lett., 2013, 110, 238301.
6 D. J. Kraft, R. Ni, F. Smallenburg, M. Hermes, K. Yoon,D. A. Weitz, A. van Blaaderen, J. Gronewold, M. Dijkstra andW. K. Kegel, Proc. Natl. Acad. Sci. U. S. A., 2012, 109, 10787.
7 T. S. Skelhon, Y. Chen and S. A. F. Bon, Langmuir, 2014,30, 13525.
8 J. R. Wolters, J. E. Verweij, G. Avvisati, M. Dijkstra andW. K. Kegel, Langmuir, 2017, 33, 3270–3280.
9 K. Roh, D. Martin and J. Lahann, Nat. Mater., 2005, 4,759–763.
10 N. Glaser, D. J. Adams, A. Boeker and G. Krausch, Langmuir,2006, 22, 5227–5229.
11 L. Hong, A. Cacciuto, E. Luijten and S. Granick, Nano Lett.,2006, 6, 2510–2514.
12 Z. Nie, W. Li, M. Seo, S. Xu and E. Kumacheva, J. Am. Chem.Soc., 2006, 128, 9408–9412.
13 M. Lattuada and T. A. Hatton, J. Am. Chem. Soc., 2007, 129,12878–12889.
14 S. Jiang, Q. Chen, M. Tripathy, E. Luijten, K. S. Schweizerand S. Granick, Adv. Mater., 2010, 22, 1060–1071.
15 A. B. Pawar and I. Kretzschmar, Macromol. Rapid Commun.,2010, 31, 150–168.
16 Janus Particle Synthesis, Self-Assembly and Applications,ed. S. Jiang and S. Granick, RSC Publishing, London, 1st edn,2012.
17 J. Hu, S. Zhou, Y. Sun, X. Fang and L. Wu, Chem. Soc. Rev.,2012, 41, 4356–4378.
18 B. J. Park and D. Lee, ACS Nano, 2012, 6, 782.19 F. Tu, B. J. Park and D. Lee, Langmuir, 2013, 29, 12679.20 P. O’Toole, A. Giacometti and T. Hudson, Soft Matter, 2017,
13, 803–813.21 G. Avvisati and M. Dijkstra, Soft Matter, 2015, 11, 8432–8440.
22 H. W. Hatch, S.-Y. Yang, J. Mittal and V. K. Shen, Soft Matter,2016, 12, 4170–4179.
23 S. Whitelam and S. A. F. Bon, J. Chem. Phys., 2010, 132,074901.
24 G. Munao, D. Costa, A. Giacometti, C. Caccamo andF. Sciortino, Phys. Chem. Chem. Phys., 2013, 15, 20590–20599.
25 G. Munao, P. O’Toole, T. S. Hudson, D. Costa, C. Caccamo,A. Giacometti and F. Sciortino, Soft Matter, 2014, 10,5269–5279.
26 G. Munao, P. O’Toole, T. S. Hudson, D. Costa, C. Caccamo,F. Sciortino and A. Giacometti, J. Phys.: Condens. Matter,2015, 27, 234101.
27 G. Munao, F. Gamez, D. Costa, C. Caccamo, F. Sciortino andA. Giacometti, J. Chem. Phys., 2015, 142, 224904.
28 G. Avvisati, T. Vissers and M. Dijkstra, J. Chem. Phys., 2015,142, 084905.
29 L. B. Krott, C. Gavazzoni and J. R. Bordin, J. Chem. Phys.,2016, 145, 244906.
30 J. R. Bordin, Phys. A, 2016, 459, 1–8.31 G. Munao, D. Costa, S. Prestipino and C. Caccamo, Phys.
Chem. Chem. Phys., 2016, 18, 24922–24930.32 B. Chen and J. I. Siepmann, J. Phys. Chem. B, 2001, 105,
11275–11282.33 L. Rovigatti, J. Russo and F. Sciortino, Phys. Rev. Lett., 2011,
107, 237801.34 B. Chen and J. I. Siepmann, J. Phys. Chem. B, 2000, 104,
8725–8734.35 W. G. Hoover and F. H. Ree, J. Chem. Phys., 1968, 49,
3609–3617.36 P. J. Steinhardt, D. R. Nelson and M. Ronchetti, Phys. Rev. B:
Condens. Matter Mater. Phys., 1983, 28, 784–805.37 C. M. Sorensen, J. Cai and N. Lu, in Optical Characterization
of Fractal Aggregate Size and Morphology Parameters, ed.G. C. Hadjipanayis and R. W. Siegel, Springer, Netherlands,Dordrecht, 1994, pp. 221–224.
38 K. Milinkovic, M. Dennison and M. Dijkstra, Phys. Rev. E:Stat., Nonlinear, Soft Matter Phys., 2013, 87, 032128.
39 D. Dendukuri and P. S. Doyle, Adv. Mater., 2009, 21, 4071–4086.40 A. Walther and A. H. E. Mueller, Chem. Rev., 2013, 113,
5194–5261.41 F. Sciortino, A. Giacometti and G. Pastore, Phys. Rev. Lett.,
2009, 103, 237801.42 F. Sciortino, A. Giacometti and G. Pastore, Phys. Chem.
Chem. Phys., 2010, 12, 11869.43 Z. Preisler, T. Vissers, F. Smallenburg and F. Sciortino,
J. Chem. Phys., 2016, 145, 064513.44 T. Vissers, F. Smallenburg, G. Munao, Z. Preisler and
F. Sciortino, J. Chem. Phys., 2014, 140, 144902.45 N. Kern and D. Frenkel, J. Chem. Phys., 2003, 118, 9882–9889.46 L. B. Krott, C. Gavazzoni and J. R. Bordin, J. Chem. Phys.,
2016, 145, 244906.47 J. R. Bordin and L. B. Krott, J. Phys. Chem. B, 2017, 121,
4308–4317.
Soft Matter Paper
Publ
ishe
d on
29
Aug
ust 2
017.
Dow
nloa
ded
by U
NIV
ER
SIT
A C
A F
OSC
AR
I V
EN
EZ
IA o
n 12
/10/
2017
15:
18:5
1.
View Article Online