selenium in dog foods - ghent university · selenium in dog foods mariëlle van zelst dissertation...
TRANSCRIPT


Selenium in dog foods
Mariëlle van Zelst

Printing
University Press
Zelzate, Belgium
www.universitypress.be
Cover drawing
Emma Scheltema
Auckland, New Zealand
www.drawingescape.com
The studies in this PhD thesis were performed in collaboration with
© 2015 M. van Zelst

Selenium in dog foods
Mariëlle van Zelst
Dissertation submitted in fulfilment of the requirements for the degree of
Doctor of Philosophy (PhD) in Veterinary Sciences
Faculty of Veterinary Medicine
Ghent University
2015
Guidance Committee:
Prof. Dr. Ir. Geert P.J. Janssens (Supervisor)
Ghent University
Prof. Dr. Myriam Hesta (Supervisor)
Ghent University
Dr. Kerry Gray
WALTHAM® Centre for Pet Nutrition
Department of Nutrition, Genetics and Ethology
Faculty of Veterinary Medicine, Ghent University
Heidestraat 19, 9820 Merelbeke, Belgium
WALTHAM® Centre for Pet Nutrition
Freeby lane, Waltham-on-the-Wolds,
Leicestershire, England


"If you can look at a dog and not feel vicarious excitement and affection,
you must be a cat"
- Carrie Latet -


TTTTable of contentsable of contentsable of contentsable of contents
Table of contents
List of figures
List of tables
List of acronyms, abbreviations and symbols
1. General introduction____________________________________________________________________________ 23
1.1 History of selenium _______________________________________________________________________________ 25
1.2 Geological distribution of selenium ___________________________________________________________ 25
1.3 Selenium metabolism in monogastric animals ________________________________________________ 27
1.3.1 Absorption __________________________________________________________________________________ 27
1.3.2 Distribution __________________________________________________________________________________ 28
1.3.3 Excretion _____________________________________________________________________________________ 31
1.4 Selenoproteins ____________________________________________________________________________________ 33
1.4.1 Glutathione peroxidase ___________________________________________________________________ 37
1.4.2 Thioredoxin reductase ____________________________________________________________________ 39
1.4.3 Iodothyronine deiodinase ________________________________________________________________ 40
1.4.4 Selenoprotein P _____________________________________________________________________________ 41
1.5 Selenium related diseases ______________________________________________________________________ 41
1.5.1 Cancer _______________________________________________________________________________________ 42
1.5.2 Cardiovascular disease ___________________________________________________________________ 43
1.5.3 Diabetes mellitus type II __________________________________________________________________ 44
1.5.4 Joint conditions _____________________________________________________________________________ 45
1.5.5 Urolithiasis ___________________________________________________________________________________ 46
1.6 Selenium in pet foods____________________________________________________________________________ 46
1.7 Bioaccessibility, -availability, and -activity of selenium ____________________________________ 49
1.8 Current recommendations on selenium intake for adult dogs ____________________________ 54
1.9 Biomarkers of selenium status __________________________________________________________________ 56
1.10 References _______________________________________________________________________________________ 59
2. Scientific aims ____________________________________________________________________________________ 77
3a. In vitro selenium accessibility in dog foods ____________________________________________ 81
3a.1 Abstract___________________________________________________________________________________________ 83
3a.2 Introduction ______________________________________________________________________________________ 83
3a.3 Experimental methods __________________________________________________________________________ 84

Table of contentsTable of contentsTable of contentsTable of contents
3a.3.1 Diet selection ______________________________________________________________________________ 84
3a.3.2 Sample preparation ______________________________________________________________________ 85
3a.3.3 In vitro digestion__________________________________________________________________________ 85
3a.3.4 Chemical analyses ________________________________________________________________________ 86
3a.3.5 Calculations ________________________________________________________________________________ 87
3a.3.6 Statistical analyses _______________________________________________________________________ 88
3a.4 Results ____________________________________________________________________________________________ 88
3a.5 Discussion ________________________________________________________________________________________ 91
3a.6 Conclusions ______________________________________________________________________________________ 93
3a.7 Acknowledgements _____________________________________________________________________________ 93
3a.8 References _______________________________________________________________________________________ 93
3b. Predictive equations of in vitro selenium accessibility in dry pet foods ________ 97
3b.1 Abstract __________________________________________________________________________________________ 99
3b.2 Introduction ______________________________________________________________________________________ 99
3b.3 Experimental methods __________________________________________________________________________ 99
3b.3.1 Diets and chemical analyses ___________________________________________________________ 99
3b.3.2 Calculations ________________________________________________________________________________ 100
3b3.3 Statistical analyses ________________________________________________________________________ 100
3b.4 Results ____________________________________________________________________________________________ 101
3b.5 Discussion ________________________________________________________________________________________ 104
3b.6 References _______________________________________________________________________________________ 105
4. Association between diet type and selenium bioavailability and -activity
in dogs _________________________________________________________________________________________________ 107
4.1 Abstract ____________________________________________________________________________________________ 109
4.2 Introduction _______________________________________________________________________________________ 109
4.3 Experimental methods ____________________________________________________________________________ 110
4.3.1 Study design ________________________________________________________________________________ 110
4.3.2 Dogs __________________________________________________________________________________________ 111
4.3.3 Diets __________________________________________________________________________________________ 111
4.3.4 Blood samples_______________________________________________________________________________ 113
4.3.5 Urine samples _______________________________________________________________________________ 114
4.3.6 Faeces samples _____________________________________________________________________________ 114
4.3.7 Chemical analyses _________________________________________________________________________ 114
4.3.8 Statistical analyses _________________________________________________________________________ 115
TTTTable of contentsable of contentsable of contentsable of contents
4.4 Results ______________________________________________________________________________________________ 117
4.5 Discussion __________________________________________________________________________________________ 117
4.6 Acknowledgements ______________________________________________________________________________ 121
4.7 References _________________________________________________________________________________________ 121
5. Biomarkers of selenium status in dogs _____________________________________________________ 125
5.1 Abstract ____________________________________________________________________________________________ 127
5.2 Introduction _______________________________________________________________________________________ 127
5.3 Experimental methods ____________________________________________________________________________ 129
5.3.1 Study design ________________________________________________________________________________ 129
5.3.2 Dogs __________________________________________________________________________________________ 129
5.3.3 Diets __________________________________________________________________________________________ 131
5.3.4 Blood samples_______________________________________________________________________________ 131
5.3.5 Urine samples _______________________________________________________________________________ 132
5.3.6 Hair growth measurements _______________________________________________________________ 132
5.3.7 Chemical analyses _________________________________________________________________________ 132
5.3.8 Statistical analyses _________________________________________________________________________ 137
5.4 Results ______________________________________________________________________________________________ 137
5.5 Discussion __________________________________________________________________________________________ 139
5.6 Conclusion _________________________________________________________________________________________ 145
5.7 Acknowledgements ______________________________________________________________________________ 145
5.8 References _________________________________________________________________________________________ 145
6. General discussion ______________________________________________________________________________ 149
6.1 Methods to measure selenium availability ___________________________________________________ 151
6.2 Factors affecting selenium availability ________________________________________________________ 152
6.2.1 Dietary selenium concentration _________________________________________________________ 152
6.2.2 Selenium speciation ________________________________________________________________________ 154
6.2.3 Processing conditions _____________________________________________________________________ 157
6.3 Bioavailability versus bioactivity _______________________________________________________________ 158
6.4 Factors affecting measurement of glutathione peroxidase activity _______________________ 159
6.4.1 Expressing glutathione peroxidase activity ___________________________________________ 160
6.4.2 Serum versus whole blood glutathione peroxidase activity _______________________ 161
6.5 Other factors to consider when assessing selenium requirements of dogs _____________ 163
6.5.1 Gender _______________________________________________________________________________________ 163
6.5.2 Age ___________________________________________________________________________________________ 164

Table of contentsTable of contentsTable of contentsTable of contents
6.5.3 Breed _________________________________________________________________________________________ 165
6.5.4 Metabolic changes associated with selenium status ________________________________ 166
6.6 Future perspectives ______________________________________________________________________________ 167
6.7 Conclusions ________________________________________________________________________________________ 168
6.8 References _________________________________________________________________________________________ 169
Supplement. Storage of whole blood for glutathione peroxidase activity
analysis ________________________________________________________________________________________________ 173
S.1 Abstract ____________________________________________________________________________________________ 175
S.2 Introduction ________________________________________________________________________________________ 175
S.3 Experimental methods ____________________________________________________________________________ 175
S.4 Results and discussion ___________________________________________________________________________ 176
S.5 References _________________________________________________________________________________________ 179
Summary ______________________________________________________________________________________________ 181
Samenvatting ________________________________________________________________________________________ 187
Curriculum vitae ____________________________________________________________________________________ 193
Bibliography _________________________________________________________________________________________ 197
Doctoral training programme ___________________________________________________________________ 201
Acknowledgements ________________________________________________________________________________ 205

List of figuresList of figuresList of figuresList of figures
List of figures
Figure 1.1 World map indicating areas with low, adequate and high
selenium concentrations in vegetation ____________________________________________________________ 26
Figure 1.2 Metabolic pathway of selenium ____________________________________________________ 29
Figure 1.3 Selenocysteine incorporation into selenoproteins _______________________________ 33
Figure 1.4 Activity of glutathione peroxidase _________________________________________________ 38
Figure 1.5 Activity of thioredoxin reductase ___________________________________________________ 38
Figure 1.6 The involvement of iodothyronine deiodinases in the deiodination
of thyroid hormones __________________________________________________________________________________ 40
Figure 1.7 Influence of selenium on components of the insulin
signalling cascade ____________________________________________________________________________________ 44
Figure 1.8 Fractionation of ingested selenium into bioaccessible,
-available and -active fractions_____________________________________________________________________ 50
Figure 3a.1 Correlations (r) between in vitro selenium accessibility (%) and
crude protein digestibility (%) of pet foods _______________________________________________________ 89
Figure 3a.2 Correlations (r) between in vitro selenium accessibility (%) and
parameters of canned (black bars, n=16) and kibble (grey bars, n=19) diets in
g/100g DM, except where specified _______________________________________________________________ 90
Figure 3b.1 Predicited versus observed in vitro selenium accessibility in kibble
and pelleted diets (n=27) _____________________________________________________________________________ 103
Figure 3b.2 Predicited versus observed in vitro selenium accessibility in kibble
diets (n=19) _____________________________________________________________________________________________ 103

List of figuresList of figuresList of figuresList of figures
Figure 4.1 Selenium digestibility (A), serum selenium (B), serum isoprostanes (C)
and serum T3:T4 ratio (D) in dogs in relation to crude protein intake of four
canned and four kibble diets ______________________________________________________________________ 116
Figure 4.2 Whole blood glutathione peroxidase responses in dogs in relation
to crude protein intake of four canned and four kibble diets ________________________________ 118
Figure 4.3 Urinary selenium to creatinine ratio relative to selenium intake in
dogs in relation to crude protein intake of four canned and four kibble diets ___________ 119
Figure 5.1 Urinary selenium to creatinine ratio of dogs fed a low or
adequate selenium diet _____________________________________________________________________________ 138
Figure 5.2 Glutathione peroxidase activity (U/L) in whole blood of dogs
fed a low or adequate selenium diet _____________________________________________________________ 138
Figure 5.3 Cumulative hair growth (mm) of dogs fed a low or adequate
selenium diet __________________________________________________________________________________________ 139
Figure 6.1 In vitro and in vivo selenium availability and apparent dry matter
and crude protein digestibility coefficients ______________________________________________________ 152
Figure 6.2 Dietary selenium and apparent in vivo and corrected† in vitro selenium
availability coefficients of canned and kibble pet foods ______________________________________ 154
Figure 6.3 Supplemented selenite and selenium from ingredients in
kibble diets (n=18) _____________________________________________________________________________________ 156
Figure 6.4 Effect of selenite supplementation on apparent in vivo and
corrected† in vitro selenium availability coefficients in kibble diets (n=18) _________________ 156
Figure 6.5 Effect of digestible crude protein on in vitro selenium accessibility
and apparent in vivo selenium bioavailability ___________________________________________________ 158
List of figuresList of figuresList of figuresList of figures
Figure 6.6 Effect of dog age on serum selenium (A), whole blood glutathione
peroxidase (B), serum T3:T4 ratio (C) and urinary selenium:creatinine ratio (D) _____________ 165
Figure S.1 Mean differences in glutathione peroxidase activity (U/L) between
fresh and stored canine heparinised whole blood _____________________________________________ 178


List of tablesList of tablesList of tablesList of tables
List of tables
Table 1.1 Selenoproteins currently identified in humans and their validation
number in dogs _______________________________________________________________________________________ 34
Table 1.2 Typical ingredients of dog foods and their selenium concentration
in mg/kg dry matter* _________________________________________________________________________________ 48
Table 1.3 Dietary factors affecting selenium bioavailability and/or bioactivity __________ 51
Table 1.4 Current recommended selenium intakes for adult dogs by FEDIAF
and the NRC __________________________________________________________________________________________ 55
Table 3a.1 Chemical composition (g/100g DM, except where specified),
gross energy content (MJ/kg DM) and in vitro digestibility (%) of
pet foods (n=60) per diet type ______________________________________________________________________ 86
Table 3a.2 In vitro selenium accessibility of pet foods (%) per diet type _________________ 88
Table 3a.3 In vitro selenium accessibility (%) in processed versus
unprocessed canned and kibble diets ____________________________________________________________ 91
Table 3b.1 Chemical composition (g/100g DM, except where specified),
gross energy content (MJ/kg DM), in vitro digestibility and selenium accessibility
(%) of dry pet foods (n=27) ___________________________________________________________________________ 102
Table 4.1 Gender, age, body weight and energy intake of the study dogs
per dog group ________________________________________________________________________________________ 111
Table 4.2 Analysed chemical composition (g/MJ ME, except where specified),
dry matter (DM) and metabolisable energy concentration (ME) of four canned
and four kibble single batch dietsa with differing protein concentrations __________________ 112
Table 4.3 Energy, selenium and crude protein intakes per diet type of four
canned and four kibble diets ______________________________________________________________________ 115

List of List of List of List of tablestablestablestables
Table 5.1 Gender*, age, body weight and energy intake of the study
dogs per dog group _________________________________________________________________________________ 129
Table 5.2 Analysed* chemical composition of two semi-purified diets with an
adequate or low selenium concentration _________________________________________________________ 130
Table 5.3 Primer and probe sequences used for positive control and
qPCR assays ___________________________________________________________________________________________ 134
Table 5.4 Serum biomarker concentrations in dogs fed a diet with a low or
adequate selenium concentration _________________________________________________________________ 136
Table 5.5 Relative† mRNA expression in dogs fed a diet with a low or
adequate selenium concentration _________________________________________________________________ 140
Table 6.1 Effect of diet type on selenium intake and biomarkers __________________________ 162
Table 6.2 Effect of gender* on selenium parameters __________________________________________ 164
Table S.1 Mean glutathione peroxidase activity and coefficient of variation
of fresh and stored (-80°C) canine blood _________________________________________________________ 177
List of acronyms, abbreviations and symbolsList of acronyms, abbreviations and symbolsList of acronyms, abbreviations and symbolsList of acronyms, abbreviations and symbols
List of acronyms, abbreviations and symbols
6-PGDL 6-phospho-glucono-δ-lactone
AAFCO association of American feed control officials
AI adequate intake
Akt protein kinase B
Ala alanine
Arg arginine
B2M beta-2-microglobulin
BCS body condition score
BW body weight
BW0.75 metabolic body weight
C Celsius
Ca2+ calcium
cDNA complementary deoxyribonucleic acid
CK creatine kinase
CP crude protein
Ct threshold value
CT creatinine
Cu copper
CV coefficient of variation
Cys cysteine
DIO iodothyronine deiodinase
DM dry matter
DMSe dimethylselenide
DNA deoxyribonucleic acid
EDTA ethylenediaminetetraacetic acid
EFSec selenocysteine-specific translation elongation factor
e.g. exempli gratia, for example
eIF4a3 eukaryotic translation initiation factor 4a3
ELISA enzyme-linked immunosorbent assay
et al. et alia, and others
FEDIAF European pet food industry federation
FoxO1a forkhead box class O 1a

List of acronyms, abbreviations and symbolsList of acronyms, abbreviations and symbolsList of acronyms, abbreviations and symbolsList of acronyms, abbreviations and symbols
g gram
G6-P glucose 6-phosphate
G6PD glucose 6-phosphate dehydrogenase
GAPDH glyceraldehyde 3-phophate dehydrogenase
Glut4 glucose transporter 4
GPx glutathione peroxidase
GR glutathione reductase
GS glutathione-sulphur conjugation
GSH glutathione
H hydrogen
H2O water
H2O2 hydrogen peroxide
HPRT1 hypoxanthine phosphoribosyltransferase 1
ID identification
i.e. id est, in other words
IR insulin receptor
IRS insulin receptor substrate
IsoPs isoprostanes
ISO international organization for standardization
IU international unit
kcal kilo calorie
kDa kilodalton
kg kilogram
L30 ribosomal protein for selenocysteine incorporation
LC-HR-MS liquid chromatography-high resolution mass spectrometry
Leu leucine
Lys lysine
ME metabolisable energy
Met methionine
mg milligram
min minutes
MJ mega joule
ml millilitre
mRNA messenger ribonucleic acid
MSe methylselenol
List of acronyms, abbreviations and symbolsList of acronyms, abbreviations and symbolsList of acronyms, abbreviations and symbolsList of acronyms, abbreviations and symbols
N nitrogen
n number
n.a. not applicable
NADP+ nicotinamide adenine dinucleotide phosphate
NADPH reduced nicotinamide adenine dinucleotide phosphate
NEFA non-esterified fatty acids
NFκB nuclear factor kappa-light-chain-enhancer of activated B cells
ng nanogram
nm nanometer
Nox4 NADPH oxidase 4
nr number
NRC national research council
O2 dioxygen
O2·- superoxide
OM organic matter
oxLDLs oxidized low-density lipoproteins
P phosphorus
PGC-1a proliferator-activated receptor gamma coactivator 1a
Phe phenylalanine
PI3K phosphoinositide-3-kinase
PIP2 phosphatidylinositol diphosphate
PIP3 phosphatidylinositol triphosphate
ppm parts per million
pred. predicted
PTEN phosphatase and tensin homolog
PTP-1B protein tyrosine phosphatase 1B
qPCR quantitative polymerase chain reaction
RA recommended allowance
ROH alcohol
ROOH hydroperoxide
RT reverse transcription
rT3 reversed triiodothyronine
SAH S-adenosyl homocysteine
SAM S-adenosyl methionine
SBP2 selenocysteine insertion sequence (SECIS)-binding protein

List of acronyms, abbreviations and symbolsList of acronyms, abbreviations and symbolsList of acronyms, abbreviations and symbolsList of acronyms, abbreviations and symbols
SD standard deviation
SE standard error
Se selenium
SECIS selenocysteine insertion sequence
SeCys selenocysteine
Sel selenoprotein (H, I, K, M, N, O, R, S, T, V)
SeMet selenomethionine
SEM standard error of the mean
Sep15 15 kilodalton selenoprotein
SepP selenoprotein P
SepW1 selenoprotein W
Ser serine
SHAPE size, health and physical evaluation
SPS2 selenophosphate synthetase 2
T2 diiodithyronine
T3 triiodothyronine
T4 thyroxine
TDF total dietary fibre
TiO2 titanium dioxide
TMSe trimethylselenonium
TNF-α tumor necrosis factor alpha
tRNA transfer ribonucleic acid
TrxR thioredoxin reductase
U unit
UGA uracil, guanine, adenine, genetic (stop) codon, coding for selenocysteine
UK United Kingdom
USA United States of America
< less than
> more than
% percent
° degrees
g gravitational force
µg microgram
µl microlitre

List of acronyms, abbreviations and symbolsList of acronyms, abbreviations and symbolsList of acronyms, abbreviations and symbolsList of acronyms, abbreviations and symbols
α alpha
β beta
γ gamma
δ delta
κ kappa
ᴅ dexter, spatial configuration of an isomer
ᴸ laevus, spatial configuration of an isomer
® registered
™ trademark


_____________________________________________________________________________________________________________
General introduction_____________________________________________________________________________________________________________
Chapter 1
General introduction _____________________________________________________________________________________________________________


Chapter 1
General introductionGeneral introductionGeneral introductionGeneral introduction
25
Selenium (Se) is a non-metal, or less commonly considered a metalloid with both metallic and
nonmetallic properties. It has atomic number 34, which lies between sulphur (S) and tellurium
(Te) in group VI of the periodic table. The atomic weight of Se is 78.96 and it has six
naturally occurring stable isotopes; 74Se (natural abundance 0.82 %), 76Se (natural
abundance 8.66 %), 77Se (natural abundance 7.31 %), 78Se (natural abundance 23.21 %), 80Se
(natural abundance 50.65 %), and 82Se (natural abundance 8.35 %)(1).
1.1 History of selenium
Selenium was discovered in 1817 in Uppsala by the Swedish chemist Jöns Jacob Berzelius
(1779 - 1848), in collaboration with the chemists J.G. Gahn and M.H. Klaproth. They were
examining a reddish deposit that remained in the lead chambers after roasting copper
pyrites. This was first thought to be tellurium, which was recently discovered by Klaproth as
a residue of copper ore roasting. When Berzelius examined the material, he found no trace
of tellurium, but instead, he found an unknown substance with properties very much like
tellurium. Since tellurium has been named after the Latin word tellus (earth), Berzelius
decided to name the new chemical after the Greek goddess of the moon, selênê(2-3). In hind
sight, Marco Polo may already have come across the less desirable qualities of selenium on
his travels in western China around 1295. He documented the hoofs of animals to drop off
after eating poisonous plants. This was later called "alkali disease" and even much later
found to be caused by Se accumulation in plants due to high Se levels in the soil. Until the
late 1950's Se was merely known as a toxicant, causing diseases, like alkali disease, in farm
animals(4). It was not until 1957 that Se was first recognised as an essential nutrient, when it
was found to spare the anti-oxidant action of vitamin E in the diets of rats and chicks(5-7).
Since then, more research was conducted on this trace mineral and more beneficial
properties were discovered.
1.2 Geological distribution of selenium
Quantitatively, Se is the 70th of the 88 elements that naturally occur in the earth's crust(8).
However, geologically it is very unevenly distributed. Research on soil Se content focuses
on specific parts of the world where either Se deficiencies or toxicities in farm animals have
been reported, and therefore, is rather limited.
Selenium in soils is mainly present as the water-soluble selenate in well-drained alkaline
soils, which is a highly available chemical form for plant roots, and thus can lead to toxic
amounts of Se in vegetation(9). Several plants can accumulate Se, such as plants from the
Brassica (e.g. rapeseed), Astragalus (e.g. milk-vetch root) and Allium (e.g. onion) genera(10-12),

26 Chapter 1
General introductionGeneral introductionGeneral introductionGeneral introduction
but Brazil nuts are the richests known food source of Se(13). In some parts of the world, the
soil contains high levels of Se, but the water-soluble Se, and thus the risk of toxic quantities
in vegetation, is low(9). These soils are often acidic and poorly drained and contain Se in the
form of selenides and elemental Se, which are unavailable to plant roots(9). This indicates
that absolute soil Se levels do not necessarily reflect a level of toxicity to animals.
Vegetation containing more than 0.1 mg Se/kg prevents livestock from Se deficiency
disorders(14), while dietary levels above 1 mg Se/kg may lead to toxicity(15-16). Figure 1.1
shows an overview of seleniferous and Se deficient areas in the world based on
documented Se deficiencies and toxicities and on Se levels in the vegetation. Low Se areas
(yellow) are defined as areas where the vegetation has a concentration of 0.1 mg Se/kg
vegetation or less, or where deficiency diseases were reported. Seleniferous areas (red) are
those where vegetation contains 1 mg Se/kg vegetation or more, or where signs of Se
toxicity have been reported. Serum Se concentrations of inhabitants were not taken into
consideration, as it was not clear if their diet was solely from their own region.
Figure 1.1 World map indicating areas with low, adequate and high selenium
concentrations in vegetation
Yellow represents low selenium areas, ≤ 0.1 mg Se/kg vegetation or reported deficiencies; green
adequate, 0.1-1 mg Se/kg vegetation; red seleniferous, ≥ 1 mg Se/kg vegetation or reported toxicities.
For white areas, no information was available. Based on Fleming(17), Rosenfeld & Beath(4), NRC(9), Combs
& Combs(18-19), Gissel-Nielsen(20), Fordyce et al.(21), Murphy & Cashman(22), Oldfield(23), Dhillon & Dhillon(24),
Surai & Taylor-Pickard(25), Garcia Moreno et al.(26), and De Temmerman et al.(27).
Chapter 1
General introductionGeneral introductionGeneral introductionGeneral introduction
27
In general, plants with a deficient Se concentration for animals are produced in large parts
of Canada(28), Scandinavia(23; 29-31), United Kingdom(23; 32-33), Italy(34), Greece(35-36), Serbia(37),
Russia(25), China(19; 38-39), Sri Lanka(21), Australia(40) and New Zealand(23; 41). The Se concentration
in plants in large areas of Africa are not mapped, but are likely to be Se-deficient as well(42-
45). American plant derived products are generally considered to contain adequate or even
toxic amounts of Se(23; 46). There are only a few seleniferous areas in the world, but this can
have severe implications to the health of livestock, but also on humans and pets consuming
their meat. Beside parts of America, other seleniferous areas are the Limerick, Tipperary and
Meath counties in Ireland(4; 17), Enshi county in China(47), Punjab area in India(48) and the
northern part of Queensland(23). This shows that it is important to know from which geological
area pet food ingredients originate to get an understanding of its Se concentration.
1.3 Selenium metabolism in monogastric animals
Unlike plants, Se is an essential trace mineral for all mammals(49). There are quite some
discrepancies in literature about the metabolism of Se. The majority of studies on Se
metabolism have been performed in humans and rats. In this paragraph an overview is
given of the current knowledge, with the assumption that Se metabolism is similar for all
monogastric animals. Although there are many different Se species present in foods, focus is
placed on the organic Se species selenomethionine and selenocysteine and the inorganic
species selenite and selenate. The metabolic pathway is schematically displayed in Figure
1.2.
1.3.1 Absorption
Selenoaminoacids are released from the protein during protein digestion. The main
absorption site of Selenomethionine (SeMet) and selenite is the duodenum(50), while that of
selenate is the ileum, as investigated in rats(51-52). SeMet is absorbed transcellularly through
active transport by a sodium-dependent transporter, as depicted in Figure 1.2. This energy
requiring transport is the common absorption mechanism for neutral amino acids, and
therefore, methionine (Met) and SeMet compete for absorption(53). Wolffram et al.(53) also
showed an important inhibition of SeMet uptake in pig brush border membranes by
addition of cysteine (Cys), leucine (Leu), phenylalanine (Phe), alanine (Ala) and serine (Ser).
Selenocysteine (SeCys) is similarly absorbed (Figure 1.2), but then by the sodium-dependent
transport mechanism of basic amino acids and it competes for absorption with Cys, lysine
(Lys) and arginine (Arg)(53).

28 Chapter 1
General introductionGeneral introductionGeneral introductionGeneral introduction
Selenate is also actively absorbed by a transcellular co-transport pathway with sodium-ions
in pig brush border membranes(54-55) and competes for absorption with sulphur compounds(55).
It has been proven to compete with sulphate and thiosulphate in pig brush border
membranes(54). The same research group found that selenate can also be absorbed by
active anion exchange(55), as shown in Figure 1.2.
Selenite is absorbed passively, by paracellular diffusion, as studied in rats and humans(51; 56).
However, there are indications that a large part of selenite is bound to the brush border
membranes instead of being absorbed into the circulation(54). Selenite can also form a
covalent adduct with glutathione (GSH) in the intestine (Figure 1.2) to form
selenodiglutathione, which seems to be more readily absorbed in rats and human caco-2
cells than selenite(51; 57).
Absorption of SeMet in the human intestinal tract is also better than of selenite(58). SeMet is
reported to be the most efficiently absorbed Se species at 97% in humans and 83-97% in
rats(59). SeCys has an apparent absorption of 81% in rats(60). The level of absorption of
selenate is similar to that of SeMet. It has been determined that the absorption rate of
selenate in humans is approximately 91% and that of selenite only 50%(61) of the total
intake. However, selenite seems to be better absorbed in rats(59) and dogs(62), with absorption
levels of 75-93% and 90%, respectively. It is unlikely that this difference is caused by
differences in Se status between the subjects used in the different studies, as it is known
that Se absorption is not homeostatically mediated(51; 63). However, there are several other
factors that may underlie this difference, one of them being the amount of GSH present in
the gut to be able to transform selenite to selenodigluthatione. Another possibility is that the
bioavailability of the dietary Se differed between the studies. Factors affecting Se
bioavailability, such as diet composition, will be discussed in paragraph 1.7.
1.3.2 Distribution
After absorption, SeMet can potentially be non-specifically incorporated into body proteins
in the place of Met, as shown in Figure 1.2. The genetic code and tRNA do not discriminate
between the two(64). Non-specific incorporation of SeCys also occurs, as found in rats, but
this is believed to be an unimportant metabolic pathway(65). Skeletal muscle is the major site
of SeMet storage in the human body (28-46% of the total Se pool)(66-67). However, kidneys
contain the highest amount of Se on a per-weight basis; the average human kidney Se
concentration is 470 ng/g as is, compared to 51 ng/g as is in skeletal muscle(66). This finding
was verified in dogs(68-70). Kidney Se concentrations may be high because this is the primary
organ of urinary excretion.

Figure 1.2 Metabolic pathway of selenium
Na+, sodium; A-, anion; GSH, glutathione;
tRNA, transfer ribonucleic acid; GS, gluta
1. Glutathione reductase, 2. Thioredoxin reductase, 3
Methyltransferase, 7. Selenophosphate synthetase,
kinase, 10. Selenocysteine synthase. After passing the intestinal barrier, the majority of the processes
take place in the liver, except for transformation from sel
selenomethionine incorporation into body prote
and all other cells, respectively. The g
brain and testes. Based on Levander & Bauman
& Pannier(73), Suzuki(74), Lu et al.(75)
General introductionGeneral introductionGeneral introductionGeneral introduction
Metabolic pathway of selenium
GSH, glutathione; SAM, S-adenosylmethionine; SAH, S-adenosylhomocysteine;
ic acid; GS, glutathione-sulphur conjugation. Numbers represent the enzymes;
. Thioredoxin reductase, 3. β-lyase, 4. γ-lyase,
nophosphate synthetase, 8. Seryl-tRNA synthetase, 9
. Selenocysteine synthase. After passing the intestinal barrier, the majority of the processes
take place in the liver, except for transformation from selenite to selenodiglutathione and
selenomethionine incorporation into body proteins, which can also take place in the erythrocytes
s, respectively. The grey area represents selenoprotein formation
Based on Levander & Bauman(71), Wolffram et al.(53; 55), Gyurasics
(75), Hoefig et al.(76), Thiry et al.(77), Roman et al.(78), and
Chapter 1
General introductionGeneral introductionGeneral introductionGeneral introduction
29
adenosylhomocysteine;
represent the enzymes;
, 5. Demethylase, 6.
9. Phosphoseryl-tRNA
. Selenocysteine synthase. After passing the intestinal barrier, the majority of the processes
enite to selenodiglutathione and
ich can also take place in the erythrocytes
resents selenoprotein formation in liver, kidney,
, Gyurasics et al.(72), Francesconi
and Jäger et al.(79).
30 Chapter 1
General introductionGeneral introductionGeneral introductionGeneral introduction
The average residence time of Se in the tissue pool is 115-285 days as measured by the
stable isotope 74Se in humans(80). However, results may be taken with caution, as the Se
status of the subject and the Se species ingested may have had an influence on retention.
Selenium turn-over is also organ specific, with a much longer retention in muscle than in
kidney, as investigated in rats(81). In addition, there may be a gender difference in the tissue
retention of Se. Se deprived female rats showed a higher tissue Se retention than males(82).
In humans this gender difference is also recognized and is believed to be mainly caused
by the increased demand of Se from the male reproductive tract(83). Studies in dogs,
although numerically higher in males than females (neuter status not reported), did not show
significant differences in tissue Se concentrations based on gender(68; 70). Age did seem to
have an impact on liver and kidney Se concentrations. They were reported to be higher in
middle aged dogs (4 - 10 years) compared to young (<4 years) and older dogs (>10
years)(68). However, dietary nutrient intake of the dogs was unknown.
After degradation of regenerating proteins (so not those of hair and nails), SeMet can again
be used in Se metabolism and be transselenated to SeCys (in a similar manner to the
transsulphuration pathway)(64), which in turn is transformed into hydrogen selenide via
reductive cleavage of the C-Se bond by β-lyase, as studied in rats(84). This has been
depicted in Figure 1.2. Hydrogen selenide is used for the incorporation of Se into
selenoproteins (discussed in paragraph 1.4), but can also be transformed to methylselenol by
a S-adenosylmethionine (SAM)-mediated methylation(85) or be converted to selenosugars(74).
Another possible route for SeMet is to be directly metabolised into methylselenol by γ-
lyase(74; 86). However, this is demonstrated in mice and rats to only occur with high Se
intakes(84; 86). Methylselenol can subsequently be demethylated into hydrogen selenide by
demethylase(84; 87-88) (Figure 1.2).
Uptake of selenite by erythrocytes is very rapid. An in vitro study using human erythrocytes
showed an uptake of 50-70% of the administered selenite within 1 minute(89). Selenite is
taken up via a specific anion exchange carrier, band 3 protein(90-91). Thereafter, it is reduced
to hydrogen selenide(74; 92), either via the thioredoxin system by thioredoxin reductase(93) or
after the formation of a covalent adduct with GSH to selenodiglutathione, which can be
reduced to hydrogen selenide by glutathione reductase(78; 94). Studies in humans show that
the hydrogen selenide is effluxed into the blood stream and immediately bound to
albumin(95-96) or hemoglobin(91) to be transported to the liver.
Selenate, on the other hand, is believed to be directly taken up by hepatocytes from the
blood stream, as studied in rats(97). In the liver, it can be reduced to selenite(98) and
subsequently metabolised to hydrogen selenide, or, as demonstrated in rat and human
Chapter 1
General introductionGeneral introductionGeneral introductionGeneral introduction
31
studies and shown in Figure 1.2, it is excreted in the urine(79; 97). Studies in mice have
demonstrated that the liver synthesizes most of the selenoproteins(99-100). Selenoprotein P
(SepP) is one of those proteins. SepP is an important transporter of Se to the testes, brain and
kidneys, where other selenoproteins can be synthesized(100-101). The liver also regulates Se
excretion(99-100).
1.3.3 Excretion
The main route of Se excretion is via the urine(73; 102). Urinary Se excretion is dependent on
the amount of dietary Se intake in rats(103-104). The majority of human urinary Se exists of
selenosugars(73-74), which are formed from hydrogen selenide, via an intermediate
glutathione-sulphur conjugated selenosugar(105), as depicted in Figure 1.2. Three different
selenosugars have been identified in human and rat urine; methyl 2-acetamido-2-deoxy-1-
seleno-β-ᴅ-glucopyranoside (selenosugar 1), methyl 2-acetamido-2-deoxy-1-seleno- β-ᴅ-
galactopyranoside (selenosugar 2), and methyl 2-amino-2-deoxy-1-seleno- β-ᴅ-
galactopyranoside (selenosugar 3)(73). Selenosugars are detected in both, urine from rats fed
with selenite(105-106) and SeMet(107), and in humans supplemented with selenized yeast(108-110),
which suggests that urinary selenosugar excretion is not specific to a certain dietary Se
species.
Selenosugar 2 has been reported to provide the highest Se concentration in human urine(109;
111). However, the studies reporting this have used supra-nutritional (3.6 to 36.4x the
European recommended intake for humans, which is 55 µg/day) levels of Se. It is known
from a study in humans that selenosugar 2 can be deacylated to selenosugar 3(112) and that
urinary excretion of selenosugar 3 is not increased by Se supplementation(108). This suggest
that selenosugar 3 is the main selenosugar in Se adequacy and that excess Se is excreted
as selenosugar 2. Gammelgaard & Bendahl(109) reported that selenosugar 1 only consisted of
2% of the concentration of selenosugar 2 in the urine of human subjects supplemented with
selenized yeast (1000 or 2000 µg).
Selenium can also be excreted in the urine as the monomethylated methylselenol (MSe)(104)
and trimethylselenonium (TMSe) (Figure 1.2), as found in rats(74; 104). In case of excessive Se
intake, the excretion of TMSe in the rat urine increases(113). However, in some cases urinary
TMSe is even excreted with adequate Se intake. It has recently been reported in humans
that TMSe excretion seems to be affected by genetic variation(111) and that, in the German
human population, 18% eliminates TMSe in Se adequacy(114).
A small fraction of selenite(73) and selenate(79; 97; 115) from the diet may not even be
metabolised and is directly excreted in the urine (Figure 1.2). A study in which 40 µg of
32 Chapter 1
General introductionGeneral introductionGeneral introductionGeneral introduction
labeled 75Se was administered to humans per day, showed that selenate is more quickly
excreted in the urine than selenite (90% of total after 40 and 121 hours, respectively)(61).
In rats administered with labeled 75Se as SeCys or SeMet (max. 5 µg), the urinary excretion
after one week was more than twice as high in SeCys (13.9% of administered Se) than
SeMet administered rats (5.8% of administered Se), while the intestinal absorption was similar
for both Se species (81 and 86%, respectively)(60). This is in accordance with findings of
Nahapetian et al.(116), who reported that urinary Se excretion after 48 hours was similar in
rats administered with a single dose of 16 µg labeled 75Se/kg BW as selenite or SeCys
(approximately 45%), but was significantly lower when SeMet was administered in the same
amount (approximately 30%). Interestingly, the percentage of urinary Se excretion at high
intakes of selenite (1500 µg Se/kg BW) decreased to the percentage excreted with SeMet
administration(116). This is probably caused by an alternative route of excretion, possibly
respiratory.
Studies in rats and humans showed that, in subtoxic Se status, a small amount of Se may be
eliminated via exhaled breath(117-119). The primary form of respiratory excretion is
dimethylselenide (DMSe)(117-118), as shown in Figure 1.2. Se expiration is higher in subjects fed
selenite than SeMet(119). However, the exhalation via breath is generally negligible(58; 103) and
was found not to be dose-dependent in adequate levels in rats(103). With excess dietary Se
intakes, on the other hand, DMSe excretion increases in humans(117). DMSe is responsible for
the characteristic garlic-like smell in Se intoxication(84; 119).
A few percent of the dietary Se is also excreted via the bile, as demonstrated in rats(71) and
dogs(120). Enterohepatic recycling occurs, where the Se that is excreted via the bile can in
turn be absorbed in the intestine (Figure 1.2). Selenodiglutathione seems to be the major Se
metabolite in bile of rats when selenite is the source of dietary Se(72). It is not known in what
form Se is excreted when other Se species are in the diet. There are indications that it may
be bound to the erythrocyte catabolism product, bilirubin(120-121). Organically-bound Se may
also be converted to selenotaurine, in the same manner as sulphur-containing Cys would be
converted(122), and excreted in the bile as taurine conjugate. Over 99% of the bile acids of
dogs are taurine conjugated, like taurocholic acid, taurodeoxycholic acid, and
taurochenodeoxycholic acid(123). No information is available on the amount of biliary Se
excretion from the organically-bound Se species. However, selenite and selenate are
excreted in similar amounts in the bile of steers when administered in the same quantity(124).
Selenite is proven in rats and steers to be excreted in the bile in a dose-dependent
manner(72; 124), but again, for the other Se species this is unknown.

Chapter 1
General introductionGeneral introductionGeneral introductionGeneral introduction
33
1.4 Selenoproteins
The existence of between 30 and 50 selenoproteins have been estimated(125) based on
electrophoretic separation studies like that of Behne et al.(126). So far, 25 have been
identified in humans(3; 78; 127-128), and 21 of them have been validated in dogs(129) (Table 1.1).
However, studies into the selenoproteome identification of dogs are limited. In this
paragraph, an overview will be given of the selenoproteins and some will be briefly
described.
All selenoproteins contain SeCys as their active centre(130). Interestingly, SeCys from the diet
cannot immediately be incorporated, but similar to other dietary Se species, are first
converted to hydrogen selenide(94; 131), as indicated in figure 1.2. Consequently, hydrogen
selenide is transformed into selenophosphate by selenophosphate synthetase 2 (SPS2) and
combined with phosphoseryl-tRNA to form selenocysteine-tRNA. The latter reaction is
mediated by selenocysteine synthase(132). Figure 1.3 shows an overview of the factors
involved in selenoprotein formation. When the selenoproteins are catabolised, the released
SeCys is recycled and again transformed to hydrogen selenide(78).
Figure 1.3 Selenocysteine incorporation into selenoproteins
Factors that are currently known to be required for selenocysteine
incorporation are; eukaryotic initiation factor eIF4a3, nucleolin,
selenocysteine insertion sequence (SECIS), SECIS binding protein 2
(SBP2), SeCys-specific translation elongation factor (EFsec), and
ribosomal protein L30. From Labunskyy et al.(133).
Figure 1.3 shows an overview of the factors involved in selenoprotein formation. SeCys is
inserted into the peptide chain encoded by a specific UGA codon, which is genetically
encoded in the ribosome-mediated system and is recognized as the 21st amino acid(78). UGA
is generally a stop codon, but a conserved stem-loop structure, called the SeCys insertion

34 Chapter 1
General introductionGeneral introductionGeneral introductionGeneral introduction
Ta
ble
1.1
Se
lenopro
tein
s cu
rrently identified in h
um
ans
and their v
alid
ation n
um
ber in
dogs
Ge
nB
an
k I
D
nr
for
do
gs
NM
_001115119
NM
_001115135
NM
_001164454
- NM
_001256320
NM
_001007126
NM
_001122645
NM
_001164188
NM
_001122673
Pre
d. transc
ript
variants:
XM
_005636584,
XM
_005636585,
XM
_005636586,
XM
_845088
NM
_001122778
Tis
sue
dis
trib
uti
on
Ubiq
uitous, c
yto
sol
Live
r, e
pithelium
, gastro
inte
stin
al
tract
Pla
sma
Cell
mem
bra
ne
Olfacto
ry e
pithelium
, em
bry
o's
Live
r, k
idney, th
yro
id,
pituitary
gla
nd, ova
ry
Thyro
id, heart, bra
in, sp
inal cord
,
skele
tal m
usc
le, pla
centa
, kid
ney,
pancre
as, b
row
n a
dip
ose
tissu
e
Pla
centa
, fe
tus, b
rain
, sk
in
Ubiq
uitous
Ubiq
uitous
Testes
Fu
ncti
on
Antioxi
dant pro
tection
Antioxi
dant pro
tection
Main
tenance o
f cellu
lar re
dox
statu
s
Lipid
hydro
pero
xide d
eto
xification
Antioxi
dant pro
tection
Conve
rsio
n o
f T4 to T
3
Conve
rsio
n o
f T4 to T
3
Conve
rsio
n o
f T4 to reve
rse T
3
NA
DPH-d
ependent re
duction o
f
oxi
dized thio
redoxi
n
NA
DPH-d
ependent re
duction o
f
oxi
dized thio
redoxi
n
NA
DPH-d
ependent re
duction o
f
oxi
dized thio
redoxi
n
Ab
bre
via
tio
n
GPx1
GPx2
GPx3
GPx4
GPx6
DIO
1
DIO
2
DIO
3
Trx
R1
Trx
R2
Trx
R3
Se
len
op
rote
in
Glu
tath
ione p
ero
xidase
1
Glu
tath
ione p
ero
xidase
2
Glu
tath
ione p
ero
xidase
3
Glu
tath
ione p
ero
xidase
4
Glu
tath
ione p
ero
xidase
6
Iodoth
yro
nin
e d
eio
din
ase
1
Iodoth
yro
nin
e d
eio
din
ase
2
Iodoth
yro
nin
e d
eio
din
ase
3
Thio
redoxi
n reducta
se 1
Thio
redoxi
n reducta
se 2
Thio
redoxi
n reducta
se 3

Chapter 1
General introductionGeneral introductionGeneral introductionGeneral introduction
35
Ge
nB
an
k I
D
nr
for
do
gs
NM
_001114736
NM
_001114760
NM
_001164506
NM
_001164486
NM
_001114878
NM
_001115014
- NM
_001137603
NM
_001115118
NM
_001114749
(SelX
)
NM
_001114757
Tis
sue
dis
trib
uti
on
Live
r
Pro
state
, th
yro
id, lu
ng, bra
in,
kid
ney, H9 T
cells
Various, m
ain
ly in e
mbry
o's a
nd
tum
or cells
Various, m
ain
ly in b
rain
Various, m
ain
ly in h
eart
Various, m
ain
ly in b
rain
, kid
ney
and lung
Ubiq
uitous, e
ndopla
smic
reticulu
m
Ubiq
uitous
Pla
sma, live
r, h
eart, bra
in, kid
ney
Heart, live
r, s
kele
tal m
usc
le, kid
ney
Ubiq
uitous, p
lasm
a, endopla
smic
reticulu
m
Fu
ncti
on
Form
ation o
f se
lenophosfate
fro
m
hydro
gen s
ele
nid
e
Thio
redoxi
n-lik
e, ro
le in u
nfo
lded
pro
tein
resp
onse
DN
A b
indin
g p
rote
in, re
gula
tion o
f
glu
tath
ione s
ynth
esis
genes
Unknow
n
Poss
ible
antioxi
dant pro
tection in
card
iom
yocyte
s
Pro
tein
fold
ing in the e
ndopla
smic
reticulu
m, antioxi
dant pro
tection
Unknow
n, m
ay b
e im
portant in
musc
le
and d
eve
lopm
ent
Unknow
n
Se h
om
eostasis
and tra
nsp
ort o
f
Se to tissu
es, a
ntioxi
dant pro
tection
Reduction o
f oxi
dized m
eth
ionin
e
residues
in d
am
aged p
rote
ins,
antioxi
dant pro
tection
Regula
tion o
f in
flam
ato
ry c
yto
kin
es
(inte
rleukin
1β a
nd 6
, and tum
or
necro
sis
facto
r α),
rem
ova
l of
misfo
lded p
rote
ins
from
the
endopla
smatic reticulu
m
Ab
bre
via
tio
n
SPS2
Sep15
SelH
SelI
SelK
SelM
SelN
SelO
SepP
SelR
SelS
Ta
ble
1.1
(c
ontinued)
Se
len
op
rote
in
Sele
nophosp
hate
synth
eta
se 2
Sele
nopro
tein
15
Sele
nopro
tein
H
Sele
nopro
tein
I
Sele
nopro
tein
K
Sele
nopro
tein
M
Sele
nopro
tein
N
Sele
nopro
tein
O
Sele
nopro
tein
P
Sele
nopro
tein
R
Sele
nopro
tein
S

36 Chapter 1
General introductionGeneral introductionGeneral introductionGeneral introduction
Ge
nB
an
k I
D
nr
for
do
gs
NM
_001164487
- NM
_001115012
ID, id
entification; nr., num
ber; T
3, triiodoth
yro
nin
e; T4, th
yro
xine; N
ADPH, re
duced n
icotinam
ide a
denin
e d
inucle
otide p
hosp
hate
; pre
d.,
pre
dic
ted; DN
A, deoxy
ribonucle
ic a
cid
; Se, se
leniu
m, Ca
2+ ,
calc
ium
. A
dapte
d fro
m P
appas
et al.(1
27) , Fairw
eath
er-Tait e
t al.(1
28) , Tanguy e
t
al.(1
34) , Rom
an e
t al.(7
8) , El-Ram
ady e
t al.(3
) , G
enBank
(129) .
Tis
sue
dis
trib
uti
on
Ubiq
uitous, m
ain
ly e
ndopla
smic
reticulu
m
Testes
Various, m
ain
ly m
usc
le
Fu
ncti
on
Unknow
n, poss
ibly
intracellu
lar
Ca
2+ h
om
eostasis
and a
ntioxi
dant
pro
tection
Unknow
n, poss
ible
role
in redox
regula
tion
Invo
lved in s
kele
tal and c
ard
iac
musc
le m
eta
bolism
, antioxi
dant
pro
tection
Ab
bre
via
tio
n
SelT
SelV
SepW
1
Table
1.1
(continued)
Se
len
op
rote
in
Sele
nopro
tein
T
Sele
nopro
tein
V
Sele
nopro
tein
W

Chapter 1
General introductionGeneral introductionGeneral introductionGeneral introduction
37
sequence (SECIS), can distinguish between the UGA for amino acid incorporation and the
UGA for termination(135). In addition to SECIS, there are five other factors required for
efficient recoding of UGA as SeCys. SECIS binding protein 2 (SBP2) binds the SECIS element
with high affinity and specificity and interacts with the SeCys-specific translation elongation
factor (EFSec), which recruits SeCys-tRNA and facilitates its incorporation into proteins(133).
Ribosomal protein L30 is also involved in SeCys incorporation, while eukaryotic translation
initiation factor 4a3 (eIF4a3) and nucleolin regulate selenoprotein synthesis and are
involved in deciding the hierarchy of selenoprotein expression(133). However, the underlying
mechanism for selenoprotein hierarchy is not yet fully understood(136). When the
selenoproteins are catabolised, the released SeCys is recycled and again transformed to
hydrogen selenide(78).
1.4.1 Glutathione peroxidase
The main function of GPx is to reduce hydrogen peroxide (H2O2) and non-esterified fatty
acid hydroperoxides(137), thereby preventing the formation of free radicals(138). Free radicals
may cause oxidative damage, and destruction of cell membranes and deoxyribonucleic acid
(DNA)(139). GPx uses GSH as a reducing agent to form two water molecules and glutathione
disulfide (GSSG)(140). The nicotinamide adenine dinucleotide phosphate (NADPH) and
hydrogen (H+) generated by the pentose phosphate cycle is consequently used to reduce
the glutathione disulfide back to two GSH molecules, catalysed by glutathione reductase
(GR)(140) (Figure 1.4). Vitamin E (α-tocopherol) and Se can partially spare each other(138). Vitamin
E is located in cell membranes and scavenges free radicals that may attack the
membrane(138). Thus, both Se and vitamin E serve the same purpose, namely the prevention of
lipid peroxidation, but act at different points in the sequence.
There are three homologs of the GPx family which are not selenoproteins (GPx5, 7 and 8).
They contain Cys in their active site instead of SeCys(133). Also, GPx6 in mice and rats
contains Cys instead of SeCys in the active centre(141). In dogs, GPx6 does contain SeCys(129)
(Table 1.1). The non-Se-dependent GPx homologs also act as anti-oxidants, but show very
little affinity for H2O2(142) and thus function slightly different compared to the Se-dependent
GPx's. The various Se-dependent isoforms of GPx vary in their protein structure, but have
overlapping substrate specificity and tissue distibution(133).
GPx1 is the most abundant isoform in mammals(133; 143). It is an intracellular enzyme and its
only known function is the reduction of H2O2(144). GPx1 knockout mice are characterized by
a higher susceptibility to oxidative stress(145). Overexpression of GPx1, on the other hand,

38 Chapter 1
General introductionGeneral introductionGeneral introductionGeneral introduction
Figure 1.4 Activity of glutathione peroxidase
ROOH, hydroperoxide; H2O2, hydrogen peroxide; ROH, alcohol;
H2O, water; GPx, glutathione peroxidase; GSH, glutathione; GSSG,
glutathione disufide; GR, glutathione reductase; NADP+,
nicotinamide adenine dinucleotide phosphate; NADPH, reduced
nicotinamide adenine dinucleotide phosphate; H+, hydrogen; G6-P,
glucose 6-phosphate; G6PD, glucose 6-phosphate dehydrogenase;
6-PGDL, 6-phospho-glucono-δ-lactone. Adapted from Lehninger et
al.(140).
Figure 1.5 Activity of thioredoxin reductase
TrxR, thioredoxin reductase; NADP+, nicotinamide adenine
dinucleotide phosphate; NADPH, reduced nicotinamide adenine
dinucleotide phosphate; H+, hydrogen; G6-P, glucose 6-phosphate;
G6PD, glucose 6-phosphate dehydrogenase; 6-PGDL, 6-phospho-
glucono-δ-lactone. Adapted from Roman et al.(78).

Chapter 1
General introductionGeneral introductionGeneral introductionGeneral introduction
39
may disrupt H2O2 signalling(133). It has a low position in the hierarchy of selenoprotein
expression(133), and thus is highly regulated by Se availability(146).
GPx1 and 4 are expressed in all cells(143), while GPx2 is primarily found in the epithelium of
the gastrointestinal tract(133) and GPx3 is primarily synthesized in the kidneys(147) and
secreted into the blood stream(143). As GPx3 is the major isoform of GPx in plasma, it is often
referred to as plasma GPx. Plasma GPx is well correlated with GPx tissue levels(148) and with
Se intake at low dietary concentrations(148). GPx4 reduces complex phospholipid
hydroperoxides. In studies with mice, GPx4 is proven to be essential for embryonic
development(149) and is associated with disulfide bond formation during spermiogenesis(150).
GPx6 is closely related to GPx3(78), but can merely be found during embryonic development
and in the olfactory epithelium(141). It is assumed to also act as antioxidant, but its specific
function is unknown(78).
1.4.2 Thioredoxin reductase
Together with the GSH system, the thioredoxins are the major systems of cellular redox
homeostasis(143). In mammals, three isoforms of TrxR are identified and all contain SeCys(75), as
listed in Table 1.1. However, not much is known about the individual functions of these
isoforms. TrxR1 and 2 are found to be essential for mammalian embryonic development(143).
TrxR3 contains an additional glutaredoxin domain, and is therefore also called thioredoxin
glutathione reductase(151). It has been suggested to be involved in sperm maturation(152).
Like GR for GSH, thioredoxin reductase (TrxR) uses NADPH and H+ for the reduction of
thioredoxin(78), as shown in Figure 1.5. Next to thioredoxin, TrxR's reduce selenite,
selenodiglutathione, lipoic acid, lipid hydroperoxides, Ca-binding proteins and many other
endogenous substrates(152-155). TrxR can also reduce ascorbyl free radicals(156), which suggests
the involvement of TrxR in the recycling of ascorbic acid (vitamin C). However, this function
will be of less importance to dogs who can synthesize ascorbic acid in the liver(157),
compared to for example humans, who evolutionary lost that ability(158). The action of
riboflavin (vitamin B2) is also associated with TrxR, as TrxR includes flavin adenine
dinucleotide (FAD) as a cofactor, of which riboflavin is the central component(159).
Since TrxR's are the only enzymes known to reduce oxidised thioredoxin(78), it is likely that
changes in TrxR activity have an impact on the functioning of thioredoxin. Thioredoxin is
involved in cell growth, inhibition of apoptosis and it facilitates the reduction of several
enzymes by cysteine thiol-disulfide exchange(78). Ribonucleotide reductase, thioredoxin
peroxidase and some transcription factors are examples of such enzymes, making

40 Chapter 1
General introductionGeneral introductionGeneral introductionGeneral introduction
thioredoxin an important factor in DNA synthesis, anti-oxidant potential and gene
transcription, respectively(78).
1.4.3 Iodothyronine deiodinase
There are three isoforms of the selenium-dependent iodothyronine deiodinase (DIO) family,
as indicated in Table 1.1, which are all involved in the thyroid hormone metabolism by
reductive deiodination(133). Thyroid hormones are involved in the regulation of various
important metabolic processes such as growth, thermogenesis, and lipid metabolism(78). DIO1
and -3 can be found on plasma membranes and DIO2 in the endoplasmic reticulum(160). Both
DIO1 and -2 can be mainly found in the thyroid and pituitary gland. Aditionally, DIO1 is
expressed in liver and kidney, and DIO2 in the central nervous system and skeletal
muscle(161). DIO3, on the other hand, is considered a foetal enzyme and is mainly present in
embryonic and neonatal tissues(161).
Figure 1.6 The involvement of iodothyronine deiodinases in the
deiodination of thyroid hormones
Selenoprotein iodothyronine deiodinase 1 (DIO1) unspecifically catalyzes the
deiodination of thyroid hormones. Iodothyronine deiodinase 2 (DIO2)
deiodinates thyroxine (T4) into triiodothyronine (T3) and reversed
triiodothyronine (rT3) into diiodothyronine (T2). Iodothyronine deiodinase 3
(DIO3) catalyzes the deiodination of T4 into rT3 and T3 into T2. Adapted from
Roman et al.(78).

Chapter 1
General introductionGeneral introductionGeneral introductionGeneral introduction
41
DIO1 mainly controls circulating triiodothyronine (T3) concentrations by unspecifically
catalysing monodeiodination of thyroid hormones, whereas DIO2 and 3 locally regulate
deiodination(162). DIO2 catalyses monodeiodination of thyroxine (T4) to form T3 and of
reversed T3 (rT3) to form diiodothyronine (T2), while DIO3 catalyses deiodination of T4 and
T3 to form rT3 and T2, respectively(78), as shown in Figure 1.6. The DIO family is highly
ranked in the selenoprotein hierarchy(161) and thus is not quickly affected by Se deficiency.
1.4.4 Selenoprotein P
Selenoprotein P (SepP) is the most abundant form of Se in plasma, it makes up more than
60% of plasma Se in rats with an adequate Se status(163). In humans this is approximately
50%(164) and the exact concentration of SepP compared to total plasma Se in dogs is
unknown. SepP is mainly synthesized in the liver(101), but the brain may also synthesize it(165).
In humans, SepP contains up to 10 SeCys' per SepP molecule(166), while in dogs this seems to
be 15(129). The half life of labelled 75Se in plasma SepP is only 3-4 hours(137), suggesting a
rapid turn-over.
SepP primarily functons as a Se transporter(167). In SepP knockout mice, transport of Se from
the liver to peripheral tissues was found to be interrupted(168). SepP is particularly important
for Se supply to brain and testes and in Se deficiency Se transport to these organs is
prioritised(169). At the brain and testes, SepP is taken up via the apolipoprotein E receptor-
2(170). Uptake in the kidney is performed via the lipoprotein receptor megalin(171). When SepP
has entered the tissue, it is catabolised by β-lyase to Ala and hydrogen selenide(172) and the
latter can be reused in Se metabolism to form other selenoproteins.
In addition to its function as Se transporter, there are indications that SepP is involved in
anti-oxidant defence. In an in vitro study, SepP has been demonstrated to protect low
density lipoproteins against oxidation(164). The binding of SepP to endothelial cells, as found
in rats(173), is also an indication of its function as anti-oxidant. Endothelial cells are assumed
to be sites of oxidative stress, as they release free radicals such as nitric oxide and super
oxide(78).
1.5 Selenium related diseases
Because too much Se in the diet can be toxic, and too little can cause chronic and
sometimes fatal deficiency, and the range between the two is very narrow, Se has been
called "the essential poison"(18). Selenium deficiency signs in dogs include muscular
weakness, anorexia, subcutaneous oedema, dyspnea, coma, muscular degeneration and
kidney mineralisation(174). Toxicity in dogs can be recognized by refusal of food, anorexia,
42 Chapter 1
General introductionGeneral introductionGeneral introductionGeneral introduction
nausea, vomiting, diarrhoea, apprehension, respiratory stimulation, cardiovascular changes,
nervous disorders, pathological lesions, especially in liver and spleen(175), and severe toxicity
may lead to death(176).
No clinical cases of either Se deficiency or toxicity are reported in dogs(177). However, the
lack of short term clinical signs does not imply that a suboptimal Se status may not be
involved in the onset of long-term diseases. There are indications that Se, due to its large
scala of functions, is involved in a broad spectrum of diseases, such as cancer(178-180),
neurological/brain diseases(181-182) and an impaired immune function(139; 183-185). In this
paragraph, some of the Se-related conditions which can also occur in dogs are briefly
described.
1.5.1 Cancer
Cancer is reported to be one of the major causes of death in UK and Swedish insured
dogs(186). The incidence rate for neoplasia in UK insured dogs was 2671 per 100,000 dogs
per year(186). In Italy, the number of malignant neoplasm in dogs was investigated between
1985 and 2002 and the incidence was 272 per 100,000 dogs per year in female dogs and
in 99 males(187). The incidence increased with age(187). The most common forms in dogs were
mammary cancer, non-Hodgkin's lymphoma and skin cancer(187).
In the last decades, many studies on the relationship between Se and cancer have been
described(188-193), however, only a limited amount of research has been in dogs(178-180; 194). The
results on the success of Se supplementation on the reduction of cancer incidence are
inconsistent(195). There are even indications that SeMet may promote cellular proliferation in
human cancer cells, by which it induces cancer growth(196). The effect of Se supplementation
seems to be, amongst other things, dependent on the Se status and amount of
supplementation. A quadratic (U-shaped) realtionship was found between toenail Se
concentration (i.e. Se status) and DNA damage in canine prostate cells (i.e. prostate cancer
risk)(193). Another study reported Se supplementation to reduce the risk of lung cancer in
human subjects with a baseline serum Se concentration of <106 ng/ml, while people with a
baseline serum Se concentration of >122 ng/ml had an increased risk(197). The reducing
effect of Se on the formation of cancer is mainly attributed to its anti-oxidant function(78), and
thus the prevention of DNA damage. In addition, the capacity of Se to bind and excrete
carcinogenic compounds, such as mercury(198-200) and arsenic(71; 175), may reduce cancer
formation.
Se does not only prevent cancer formation, but there are also indications that it acts as a
cancer specific cytotoxic agent(201). Selenite and, to a lesser extent, selenate are more potent

Chapter 1
General introductionGeneral introductionGeneral introductionGeneral introduction
43
than organic Se species to act as a prooxidant and cause apoptosis in cancer cells. Selenite
can oxidize thiol-containing cellular substrates to form superoxide (O2-) and other reactive
oxygen species (ROS), where SeMet and SeCys lack oxidation capacity(191). Cancer cells are
particularly sensitive to this prooxidative apoptosis, because of their activated oncogenes,
leaving the healthy cells unharmed(75). It should be noted, however, that a supranutritional
concentration of selenite (in humans 200 µg/day, which is approximately four times the daily
recommended allowance) is required for this process(191).
1.5.2 Cardiovascular disease
Cardiovascular disease and congestive heart failure are common conditions in dogs. A
study in the USA showed that 9 to 11% of dogs had reliable signs of heart disease and also
in Italy in 11% of the dogs suffered from hart disease(177). Studies into chronic heart failure in
humans have revealed that dietary Se intake and serum Se levels are negatively correlated
with the severity of chronic heart failure(202). Also, the recovery after ischaemia was improved
at adequate (0.16 mg Se/kg diet as sodium selenite) compared to deficient Se intake (0.01
mg Se/kg diet), as studied in rat hearts(203). This protection of Se against heart failure and its
consequences is, amongst other selenoproteins, related to the action of GPx(204). GPx1 knock-
out mice were more sensitive to reperfusion injury after myocardial ischaemia than the
control mice(205), while mice which overexpressed the GPx1 gene were more resistant than
the controls(206).
TrxR also has an important function in the prevention of cardiovascular diseases via its
involvement in cellular redox control(207). TrxR1 was upregulated in human artherosclerotic
plaques and dose-dependently by oxidized low-density lipoproteins in the mRNA of human
macrophages(208). Knock-out of the mitochondrial TrxR2 caused fatal cardiomyopathy directly
after birth in mice(209). The symptoms reported in this study were similar to that of an
endemic cardiomyopathy that occurs in some parts of China, which is called Keshan
disease. This disease is named after the region in North-East China, where the disease was
first described. Myocardial necrosis and eventually congestive heart failure are typical
symptoms of this disease. So it may be that underexpression of TrxR is a factor in the
incidence of Keshan disease. The underlying mechanisms for the preventive effect and the
enhanced recovery after cardiovascular damage are only partly understood(210). Based on a
study in rats, it is thought to be related to the anti-oxidant properties of TrxR and GPx(211).
Additionally, the reduction of thioredoxin by TrxR enables thioredoxin to perform its
regulatory function in ventricular remodelling(212). DIO1 is also associated with cardiovascular
disease, through its action in thyroid metabolism (converting T4 into T3) and thereby

44 Chapter 1
General introductionGeneral introductionGeneral introductionGeneral introduction
playing a key role in lipid metabolism. Hypothyroidism leads to changes in lipoproteins,
which increases their artherogenicity(78).
1.5.3 Diabetes mellitus type II
Diabetes mellitus type II is hallmarked by insulin resistance, which causes dyslipidemia,
hyperglycemia and an increased insulin secretion by pancreatic beta cells(213). The
incidence of diabetes in American dogs was 58 per 10,000 dogs in 1999 and seemed to
have increased since the 1970's, when it was only 19 in 10,000 dogs(214). The effect of Se on
Figure 1.7 Influence of selenium on components of the insulin
signalling cascade
O2, oxygen; O2·-, superoxide; H2O2, hydrogen peroxide; Nox4, NADPH oxidase
4; IR, insulin receptor; p, phosphorus; IRS, insulin receptor substrate; PIP2,
phosphatidylinositol diphosphate; PI3K, phosphoinositide-3-kinase; PIP3,
phosphatidylinositol triphosphate; Akt, protein kinase B; Glut4, glucose
transporter 4; PTP-1B, protein tyrosine phosphatase 1B; PTEN, phosphatase and
tensin homolog; GPx1, glutathione peroxidase 1; SeP, selenoprotein P; FoxO1a,
forkhead box class O 1a; PGC-1a, proliferator-activated receptor gamma
coactivator 1a. From Steinbrenner et al.(215).

Chapter 1
General introductionGeneral introductionGeneral introductionGeneral introduction
45
the onset of type II diabetes mellitus is two-fold. It has long been thought of as an anti-
diabetic agent(215), due to its anti-oxidant function which inhibits reactive oxygen species
that result from hyperglycemia and is associated with the progression of diabetes mellitus(216).
Interest in the diabetogenic effect of Se is relatively recent. During a large human cancer
prevention trial by the Nutritional Prevention of Cancer study group, an unexpected
increase in the incidence of type II diabetes was found in subjects supplemented with 200
µg Se/day compared to subjects assigned to a placebo(217). Diabetes incidence increased
with increasing baseline plasma Se concentrations(217). These findings may be attributed to
the insulin mimetic properties of Se(218-219), which may accelerate insuline resistance
development. Also, overexpression of GPx1 has been associated with an impaired contol of
insulin release by beta cells in mice(220) and a decreased phosphorylation (activation) of
protein kinase B(221), which enables glucose to enter the cell via the glucose transporter 4. A
study in rats showed a higher liver GPx1 activity and an increased activity of protein
tyrosine phosphatase 1B (PTP-1B) in Se supplemented animals compared to rats on a Se
deficient diet(222). PTP-1B dephosphorylates the insulin receptor and its substrate, and
therefore has an antagonistic effect on the insulin signaling pathway(223).
An overview of the current knowledge on Se involvement in the onset of diabetes mellitus
type II is given in Figure 1.7. However, the mechanisms are not exactly understood yet. A
more detailed explanation of these mechanisms can be found in the review of Steinbrenner
et al.(215).
1.5.4 Joint conditions
In humans, several positive associations were reported between serum and toenail Se
concentrations and osteo- and rheumatoid arthritis(224). Symptoms of the Se and iodine
deficiency disease "Kashin-Beck disease", which are for example joint deformation,
decreased joint mobility and necrosis of joint cartilage(225), also indicate involvement of Se in
joint conditions.
A study in rats indicated that a combination of Se and iodine is necessary for normal
growth and repair of bone and cartilage(226). This study revealed that type X collagen was
decreased in the hypertrophic zones in growth plate cartilage in Se deficient rats. Collagen
type X is only expressed in hypertrophic chondrocytes, which is the terminal differentiation
step during endochondral ossification(227). The study also found that a Se or iodine
deficiency or a deficiency in both resulted in an increase of the parathyroid hormone-
related protein(226). Overexpression of this protein delays the appearance of hypertrophic
chondrocytes(228) and it can regress hypertrophic chondrocytes to a prehyperthrophic
46 Chapter 1
General introductionGeneral introductionGeneral introductionGeneral introduction
proliferating stage(229), which indicates an impaired cell maturation during bone development
in Se deficiency.
Also, a large range of selenoproteins were found in human mesenchymal stem cells(230),
which can differentiate to osteoblasts, chondrocytes and adipocytes, strengthening the idea
that Se is involved in bone and cartilage formation. However, the exact action of the
selenoproteins in these cells is unknown(230). To our knowledge, there are no studies on the
association between Se and joint conditions performed in dogs.
1.5.5 Urolithiasis
A few recent studies in rats and dogs have reported a reducing effect of Se
supplementation on the formation of calcium oxalate urolithiasis(231-232), which is a common
urological disease in dogs(233). One of the possible mechanisms behind these findings is that
antioxidants, such as the Se-dependent GPx, inhibit renal tubular damage caused by free
radicals, which is a key factor in the formation of calcium oxalate calculi(234). Oxalic acid is a
constituent of calcium oxalate calculi and may act as a free radical to damage the renal
tubular epithelial cells(234). Se supplementation in rats have been reported to decrease the
urinary oxalic acid concentration(231), but this was not confirmed in dogs(232).
Se has also been reported to inhibit osteopontin, an acidic glycoprotein involved in the
formation of calcium oxalate calculi. Liu et al.(232) showed that osteopontin was significantly
lower in Se supplemented dogs (0.3 mg/kg diet, as sodium selenite or Se yeast) than in dogs
without Se supplementation (Se concentration in basal diet not mentioned), reducing the
formation of calium oxalate calculi. Dogs supplemented with Se yeast showed a larger
decrease in osteopontin than sodium selenite supplemented dogs(232).
1.6 Selenium in dog foods
Safety, nutritional adequacy and health promoting effects of dog foods are an important
issue for dog owners(235). Although clinical cases of dietary-induced selenium deficiency and
toxicity have not been reported in dogs(177), it is important for the dogs' health to estimate
the requirements as reliably as possible. Also, long-term effects of dietary Se provision
should be investigated, because no such information has ever been published.
Diet types differ in the way they are processed and in the type of ingredients that are
used. Kibble and canned dog foods are the most popular diet types(235). Canned diets are
produced by retorting, which is a time/temperature dependent heat and pressure-cooking
and sterilisation process(236). Fresh and or frozen meats are ground, and potentially mixed
with pre-ground or blanched grains, starches, gums, vitamin and mineral premixes and

Chapter 1
General introductionGeneral introductionGeneral introductionGeneral introduction
47
water. This mixture is heated to 25 to 85°C to gelatinize starches and start protein
denaturation(177). The heated mixture is transferred into cans by a filler/seamer machine that
also places the lids on the cans. Before the can is closed, steam is injected over the product
to displace air and create a vacuum when the can is cooled. The closed cans are sterilised
in a retort to preserve the food and get rid of harmful pathogens. The retorting process
includes three steps; in the first step hot water heats the contents of the cans to
approximately 80 to 100°C. The second step uses pressurised steam of between 116 and
129°C in order to raize the core temperarture of the product to above 116°C for 60 to 90
minutes. In the final step, the product is cooled to a temperature between 38 and 49°C
using water of 18 to 25°C(177).
Kibble diets are produced by extrusion. Grains, meat meals, vitamin and minerals are often
ground together in a hammer mill, to achieve a uniform particle size, and are then
thoroughly mixed. The dry mixture is transferred into a pre-conditioner where water and
steam is added and potentially fat or meat slurries can be added. In the pre-conditioner the
ingredients are further mixed and starches are started to gelatinise(177). The pre-conditioned
mixture is transferred into an extruder barrel where a combination of friction, shear, and
indirect heat gelatinise the starch. The residence time in the extruder (cooking time) can be
influenced by screw speed or type (single or double screw), insertion rate from the pre-
conditioner and the composition of the mixture (e.g. fat lubricates the extruder, resulting in
less friction and a shorter residence time). Generally, residence times vary between 10 to
270 seconds, temperatures between 80 and 200°C, moisture contents between 25 and 27%
and pressure between 34 and 37 atmospheres(177). Kibbles are formed at the end of the
extruder barrel when they expand by reaching atmospheric pressure after passing a die
and been cut off by a knife(236). After extrusion, the kibbles are dried to reach a moisture
content between 8 and 10% and coated with fat and/or palatants(177).
The retorting and extrusion processes also influence the ingredients that can be used for
the different diet types. For extrusion, the mixture should contain a certain amount of starch.
Therefore, kibble diets mainly contain plant derived ingredients, like wheat(236). Animal
protein in kibble diets is mainly present in the form of meat meal(237-238), due to their lower
moisture content as compared to fresh or frozen meat. Canned diets, on the other hand,
have a much higher moisture content than kibble diets. They mainly contain fresh or frozen
animal derived ingredients(236).
Selenium is not essential for plants, so the Se content of plants reflects the Se content of the
soil(64). As a consequence of the Se availability in soils (see paragraph 1.2), Se levels of plant-
derived dog food ingredients may vary greatly. A plant-derived ingredient may have more

48 Chapter 1
General introductionGeneral introductionGeneral introductionGeneral introduction
Table 1.2 Typical ingredients of dog foods and their selenium concentration in mg/kg dry
matter*
Plant derived Animal derived
Ingredient Average Ingredient Average
Rice bran 0.20 Chicken meat and skin 0.37
Rice brewers, broken 0.30 Chicken gizzard 2.35
Rice flour, white 0.17 Chicken liver 2.42
Corn bran 0.18 Turkey, mechanically deboned 0.87
Corn distillers grain, dried 0.37 Egg, dried 1.24
Corn gluten feed, dried 0.19 Fish meal, menhaden 2.26
Corn gluten meal 0.40 Fish meal, tuna 4.30
Corn grits 0.19 Fish meal, white 1.71
Corn grain 0.15 Shrimp meat 1.58
Corn meal, degermed 0.09 Beef meat 0.52
Corn meal, whole kernel 0.18 Beef heart 0.90
Corn starch 0.03 Beef kidney 6.48
Wheat flour, whole grain 0.79 Beef liver 1.32
Wheat flour, white 0.39 Beef tripe 2.47
Wheat germ 0.89 Pork, cured 0.37
Wheat germ meal 0.67 Lamb meat 0.47
Wheat middlings 0.50 Lamb liver 2.87
Sorghum grain 0.23 Poultry by-product meal 0.83
Oats grain 0.48 Meat meal 0.45
Barley 0.17 Meat and bone meal 0.27
Cereal by-product 0.45 Whey, dried 0.07
Flaxseed 0.07
Soybean flour, roasted 0.08
Soybean hulls 0.21
Soybean meal 0.21
Soybean meal without hulls 0.13
Brewers' yeast, Torula, dried 1.08
Chicory root 0.05
Beet pulp, dried 0.14
Sugar, granulated 0.01
Patato, flesh and skin 0.00
Carrots 0.08
Peas 0.09
Average 0.28 Average 1.63 * For all ingredients applies that Se concentration is largely dependent on the origin. These data are
assumed to be based on products with American origin and may overestimate the selenium
concentration in European produced ingredients. From NRC(236).

Chapter 1
General introductionGeneral introductionGeneral introductionGeneral introduction
49
than a 10-fold difference in Se concentration, depending on where it was produced(239). In
contrast, Se is essential for animals, so meat will always contain a minimum amount of Se, but
depending on the part of the animal (muscle, kidney, liver) it contains more or less Se; the
kidney cortex contains the highest Se concentration and skeletal muscle contains
considerably less Se(240-241). The amount of Se in the feed (the area in which the animal is
raised) can also have an impact on the Se concentration of the meat(242). Fish is also known
to contain high amounts of Se(243) and pet foods with seafood-based flavours are found to
contain more Se than differently flavoured pet foods(244).
Table 1.2 gives an overview of the Se concentration in typical plant and animal derived
dog food ingredients. Considering the fact that the major part of Se in food ingredients is
incorporated into proteins(10) and that canned dog foods have higher protein concentrations
than kibble diets(236), it is generally assumed that canned diets contain more Se than kibble
diets. This was, however, not confirmed in a study by Simcock et al.(244). Although canned
dog foods available in New Zealand had a numerically higher Se concentration than kibble
dog foods (approximately 0.45 and 0.35 mg/kg DM, respectively, estimated from a figure),
this was not significantly different. Canned cat foods, on the other hand, did contain
significantly more Se than kibble cat foods and canned and kibble dog foods(244).
It is known that SeMet, and possibly to some extent also SeCys, are incorporated into
proteins in both animals(64-65) and plants(245). Selenium in meat products is for over 90%
organically bound(246), while plants contain both, organic and inorganic forms(48; 247-250). This
potentially results in a higher amount of organically bound Se in canned diets compared to
kibble diets. Due to the variable Se concentrations in dog food ingredients, diets may also
be supplemented with sodium selenite(236). This is more likely in kibble compared to canned
diets, due to their generally lower Se concentration in the ingredients.
1.7 Bioaccessibility, -availability, and -activity of selenium
Bioavailability and -activity are often used interchangeably. In this thesis, bioavailability will
be defined as the fraction of the dietary Se that reaches the systemic circulation(251)
(including digestibility, absorption, blood Se levels). Apparent bioavailability will be defined
as the amount of dietary Se that is apparently absorbed (intake minus faecal excretion). A
part of the dietary Se may be physiologically inert, such as SeMet that is non-specifically
incorporated into body proteins or Se that directly after absorption is methylated and
excreted. Bioactive Se is defined as the Se that is incorporated into selenoproteins (e.g. GPx).
Dietary Se that is potentially available for gastrointestinal absorption will be called
bioaccessible Se(251). These definitions are briefly summarised in Figure 1.8.

50 Chapter 1
General introductionGeneral introductionGeneral introductionGeneral introduction
It should be noted that the bioavailable fraction may also have an impact on metabolism of
Se, even if it does not increase the bioactivity. It may, for example, be involved in the
detoxification process of heavy metals; binding the metals for excretion. Also important to
emphasise is that Se may also be active in the intestine without being absorbed. For
example, when protecting epithelial cells from DNA oxidative damage in the protection
against intestinal cancer(251). Therefore, it should be kept in mind that the bioactivity and
bioavailability may slightly underestimate the actual effect of Se in the body.
Figure 1.8 Fractionation of ingested selenium into
bioaccessible, -available and -active fractions
Adapted from Thiry et al.(77).
The bioavailability and -activity of Se from pet foods is generally considered to be low.
Wedekind et al.(252) reported Se bioactivities (in the article called bioavailability) of 30% and
53% in canned and kibble petfoods, respectively, using GPx measurements in a chicken
bioassay. Todd et al. reported Se bioavailabilities of the same canned cat food in two
different studies of 25.3%(253) and 21.2%(69) in cats. Interestingly, this cat food had a higher
bioavailability in dogs (37.4%). The exact bioavailability and -activity from complex matrices
like pet food are, however, difficult to determine, as these may be influenced by various
factors.
The type of Se species (chemical form) is often reported to have an effect on the
bioavailability and -activity of Se(77; 254). The organically-bound Se species SeMet and SeCys
are generally accepted to have a higher bioavailability than inorganic Se(58; 255-256), but
selenite has been reported to have a higher bioactivity than organically-bound Se(257-258).
However, there are large differences in Se bioavailability and -activity within Se species(77).
This variation indicates that other factors also play an important role in the bioavailability
and -activity of Se. Some of these possible factors are summarised in Table 1.3.

Chapter 1
General introductionGeneral introductionGeneral introductionGeneral introduction
51
Table 1.3 Dietary factors affecting selenium bioavailability and/or bioactivity
Factor Animal model Effect ref.
Type of ingredient
Chicken Plant-derived ingredients had a higher Se bioactivity (60-90%) than animal-derived ingredients (15-25%).
(259)
Chicken Plant-derived ingredients had a higher Se bioactivity (47%) than animal-derived ingredients (28%).
(252; 260)
Chicken Fish-derived ingredients had a Se bioactivity of 9-28%. (260-261) Rat Se bioavailability and -activity were higher in Se from wheat
and selenite than from tuna, at dietary Se concentrations of 0.05, 0.10, and 0.15 mg/kg diet.
(262)
Selenium species Human SeMet had a higher bioavailability than selenite when supplemented at 100 µg/day.
(255)
Human SeMet (2 µg radiolabeled Se) had a higher bioavailability
than selenite (10 µg radiolabeled Se).
(58; 256)
Rat Selenite had a higher bioactivity than SeMet at dietary Se concentrations <0.5 mg/kg diet.
(257)
Rat Selenite had a higher bioactivity than SeCys at dietary Se concentrations of 0.1 and 0.2 mg/kg diet.
(258)
Heat processing Cat Bioavailability of inorganic Se and retention of organic Se in a canned diet decreased after heat processing.
(263)
Sheep Heat processed soy beans at 130°C for 45 min. had a higher
Se bioavailability than unprocessed soy beans or soy beans processed for 30 min at 150°C.
(264)
Dietary protein Rat Se bioactivity decreased with increasing dietary protein (range 5.3-13.4%) with a Se concentration of 0.03 mg/kg diet.
(265)
Chicken Se from a low protein diet (16.9%) had a higher bioactivity than from an adequate protein diet (22.5%).
(266)
Dietary methionine
Rat Se bioavailability decreased with increasing Met supplementation (0, 4, or 9 g/kg), but bioactivity maintained or increased.
(267)
Rat Bioactivity of SeMet was higher on a diet with 0.64% Met compared to a diet containing 0.24% Met.
(257)
Dietary sulphur Sheep Se bioavailability decreased with increasing dietary sulphur (25 vs. 37%).
(268)
Dietary fat Chicken Bioactivity, but not bioavailability, of selenite increased with increasing concentration of butter or olive oil (from 4 to 20%).
(269)
Dietary fibre Human Guar gum supplementation (2.5g/day) decreased Se bioavailability and bioactivity regardles of dietary Se concentration (range: 124-155 µg/day).
(270)
α-Tocopherol
(vit. E)
Chicken Increased Se bioavailability when an α-tocopherol-free diet
containing 0.05-0.07 mg Se/kg was supplemented with 100 IU α-tocopherol/kg diet.
(271)
Chicken Increased Se bioactivity when an α-tocopherol-free diet
containing <0.02 mg Se/kg diet was supplemented with 100
IU α-tocopherol/kg diet.
(272)
Retinol (vit. A) Chicken Increased Se bioactivity when an α-tocopherol-free diet
containing 0.04-0.08 mg Se/kg diet was supplemented with 1,000,000 IU retinyl palmitate/kg diet.
(273)
Chicken Increased Se bioavailability when an α-tocopherol-free diet
containing <0.02 mg Se/kg diet was supplemented with
1,500,000 IU retinyl palmitate/kg diet.
(272)

52 Chapter 1
General introductionGeneral introductionGeneral introductionGeneral introduction
Table 1.3 (continued)
Factor Animal model Effect ref.
Pyridoxine (vit. B6)
Rat The bioavailability of SeMet was less than for selenite when pyridoxine-deficient, but equal when receiving an adequate intake of pyridoxine (2.5 µg/g diet).
(274)
Riboflavin (vit. B2) Pig Bioactivity was decreased when feeding a riboflavin-free diet compared to a diet containing 25 mg/kg diet.
(275)
Ascorbic acid (vit. C)
Human Bioavailability of selenate was increased by the supplementation of ascorbic acid (600 mg/day). Bioactivity also increased, but not significantly.
(276)
Chicken Increased Se bioavailability and -activity with ascorbic acid supplementation (from 10 mg/kg) to a Se-deficient and α-
tocopherol-free diet.
(271)
Mercury LNCaP cells
In vitro bioactivity of selenite, but not SeMet and methylated SeCys, decreased after administration of mercury (0-100 µM
HgCl2).
(198)
Copper Rat A copper deficient diet (7.9 nmol Cu/g diet) decreased Se bioactivity compared to a diet containing 125.9 nmol Cu/g diet.
(277)
Sheep Se bioavailability decreased with increasing dietary copper (8 vs. 25 mg/kg DM).
(268)
ref., reference; Se, selenium; SeMet, selenomethionine; SeCys, selenocysteine; min, minutes; Met, methionine; vit, vitamin; LNCaP cells, androgen-sensitive human prostate adenocarcinoma cells.
Fish generally contains high amounts of Se (see paragraph 1.6) and the bioavailability of Se
from fish is high(278). However, the bioactivity is sometimes reported to be low(261; 279). This may
be due to the potential of fish to accumulate heavy metals in their muscle tissue(280). In the
presence of heavy metals, Se will likely be used for detoxification (binding and excretion)
instead of being used for the incorporation into selenoproteins.
Processing can reduce the Se concentration of diets and ingredients. The Se content of
milled wheat and corn products may decrease to 70% of the original crop(281). Dry heating
of cereals appears to result in a reduction to 77-93% of the original selenium content(282).
Not only the Se concentration is affected by processing, but also the bioavailability. In cats,
Todd et al.(263) found that the bioavailability of selenite was reduced from 83.3% to 53.7%
when Se was added before retorting a canned cat food compared to addition after
processing. Also, the retention of Se from Se-yeast in the cats was lower when the Se was
added before the diet was processed. Hendriks et al.(283) showed that heat processing of
canned diets reduces the digestibility of amino acids, also of the sulphur- or Se-containing
amino acid Met, suggesting that heat processing may reduce the bioavailability of Se. The
protein digestibility after extrusion processing pet foods, on the other hand, is not
affected(284-285) or can even be increased(286).

Chapter 1
General introductionGeneral introductionGeneral introductionGeneral introduction
53
Protein concentration of a diet may have a negative effect on Se bioactivity(265-266). This
seems to have to do with the Met and Cys levels in the diet, because when human subjects
were given a diet low in protein supplemented with Met and Cys, Se retention was lower
than when given the same diet without supplementation(287). Also in rats, the negative effect
of Met on Se bioavailability was reported(267). This is possibly due to the competition of Met
with SeMet for absorption. However, in the same study Met had a positive effect on Se
bioactivity. If the percentage SeMet of the whole dietary Met pool reduces (by Met
supplementation), the chance of non-specific SeMet incorporation is lower and Se bound to
Met can be used for selenoprotein formation.
Sulphur may also play a role in the bioavailability and -activity of Se. Although this is an
apparently logical statement, as Se and sulphur compete for absorption and organically-
bound Se may replace the S-amino acids in body proteins, by which it becomes unavailable
for incorporation into biologically active selenoproteins, there are only limited amount of
reports specifically studying the effect of sulphur on Se bioavailability and -activity. Ganther
& Bauman(288) reported in rats that sulphate in the diet (1%) or an injection with sodium
sulfate (2.5 mg) significantly increased urinary selenate excretion, indicating a potential
reduction in bioactivity.
Shen et al.(289) reported that the removal of milk fat increased the in vitro Se accessibility of
the milk. This suggests a negative impact of fat on Se bioavailability. This was however, not
found in a study with chickens(269), in which 4 and 20% of the diets consisted of butter, olive
oil, rape oil, corn oil or sunflower oil. On the contrary, the 20% butter and olive oil diets
increased the Se bioactivity compared to the 4% butter and olive oil diets, respectively.
Fibre depresses overall nutrient digestibility(290-291), by making the absorption surface smaller,
which also may lead to a decrease in Se bioavailability. This was verified by a study of
Choe & Kies(270) who reported a decrease in Se bioavailability and -activity in humans after
supplementation with the soluble non-starch polysaccharide guar gum. In dogs, guar gum
(3.4% and 7% DM) was reported to decrease apparent protein digestibility(292-293), which may
cause a decrease in the bioavailability of protein-bound Se.
Van Vleet(174) showed that Se-deficiency signs were more severe when beagle puppies were
fed a Se- and α-tocopherol-deficient diet compared to a diet only deficient in Se, which
indicates that α-tocopherol is an important factor in the biological action of Se or may spare
Se partly. A deficiency in pyridoxine and riboflavin were also reported to reduce the
bioavailability in rats and the bioactivity in pigs, respectively. In chickens, high
concentrations of retinyl palmitate (1,000,000 and 1,500,000 IU/kg diet) are shown to have a
positive effect on Se bioavailability and -activity. The Se-vitamin E deficiency disease

54 Chapter 1
General introductionGeneral introductionGeneral introductionGeneral introduction
exudative diathesis in chicks, was effectively prevented with 100 mg ascorbic acid/kg diet,
with a basal diet containing <0.02 mg Se/kg and was free of α-tocopherol(271). This was
possibly due to the increased plasma GPx concentration which was also reported. Both,
ascorbic acid (200 mg/kg) and α-tocopherol (100 IU/kg) supplementation decreased Se
accumulation in the liver(271), indicating that the Se is excreted or used for selenoprotein
formation. The anti-oxidants GPx, TrxR, α-tocopherol and ascorbic acid all work together in
the anti-oxidant cascade and thereby can partially spare each other. When α-tocopherol
reduces lipid peroxides it is converted into an α-tocopheroxyl radical, which can be
recycled by ascorbic acid resulting in dehydroascorbate. Dehydroascorbate can, in turn, be
recycled into ascorbate by the thiol cycle, which includes the selenoproteins GPx and
TrxR(294-295).
Selenium is involved in the detoxification of heavy metals(77). Heavy metals like arsenic(71; 175),
cadmium(92), mercury(198-200), and copper(268) form Se-metal bonds and, therefore, are likely to
decrease Se bioactivity. As Se will be occupied to bind and excrete these metals, it cannot
be used for the formation of selenoproteins. However, in an in vitro model with human
LNCaP cells (an androgen-sensitive human prostate adenocarcinoma cell line), mercury only
seemed to decrease Se bioactivity when selenite was the Se species used and not when
organically-bound Se was used(198). Copper was reported to also have a beneficial effect on
the presence of GPx in rat plasma(277). The mechanism behind this finding is not understood,
but may be due to a reduction in copper-zinc-superoxide dismutase (CuZn-SOD) activity
leading to a decrease in substrate for GPx, by which there is a reduced need for GPx. As
some of these metals are essential to dogs, more research is required to determine the exact
effects of heavy metals on Se bioavailability and -activity. In general, the current knowledge
on dietary factors that affect Se bioavailability and -activity and their interactions are not
enough understood to be able to estimate the bioactive Se fraction from pet foods.
1.8 Current recommendations on selenium intake for adult dogs
The guidelines for Se inclusion in pet foods for European pet food producing companies are
created by the European Pet Food Industry Federation (FEDIAF), and by the National
Research Council (NRC) and the Association of American Feed Control Officials (AAFCO) for
American companies. Generally, nutritional recommendations by FEDIAF and AAFCO are
based on state-of-the-art scientific research. However, research on the optimal intake of Se
in adult dogs is lacking. Current recommendations of Se intake for adult dogs by FEDIAF
and the NRC are shown in Table 1.4. These are extrapolated from data of growing cats and
dogs(261), respectively. In rats, it has been demonstrated that the Se requirement of adults is

Chapter 1
General introductionGeneral introductionGeneral introductionGeneral introduction
55
at least 50% lower than that of growing rats(296-297). In addition, liver Se concentrations in
dogs were highest in adult dogs compared to young and geriatric dogs(68), which is an
indication for lower Se requirements of adult dogs.
The current recommendations do not take into account the highly variable Se bioavailability
and -activity of pet food ingredients. One fixed "bioavailability" (=bioactivity) correction
factor is used, which is adapted from a study in which purified pet foods were fed to
chickens(252). In this study the bioactivity, calculated with breakpoint analysis, was 30% for
canned diets and 53% for kibble diets. These values are not species-specific and their
relevance for dogs may be questioned. In the minimum recommendation of FEDIAF, not only
the correction factor is not species-specific, but also their requirement, which was based on
data from cats. Studies by Todd et al.(69) showed that there are significant differences in Se
availability and retention between dogs and cats, indicating that an extrapolation of these
data to adult dogs may not be correct.
Table 1.4 Current recommended selenium intakes for adult dogs by FEDIAF and the NRC
unit FEDIAF(298)a NRC(236)b
Recommended allowance µg/MJ n.a. 20.9
Min. recommended allowance µg/MJ 17.9 n.a.
Based on
kitten study(261) puppy study(261)
Assumed ME concentrationc MJ/kg diet 16.7 16.7
Minimum adequate concentration in study
µg/kg diet 120 210
µg/MJd 7.2 12.6
Assumed bioavailabilitye % 40 60 FEDIAF, European Pet Food Industry Federation; NRC, national research council; n.a., not applicable; MJ, megajoule.
a based on a maintenance energy requirement of 110 kcal/kg BW0.75 b based on a maintenance energy requirement of 130 kcal/kg BW0.75 c Energy concentration of the diets used in the studies is not mentioned and therefore
an assumption is made. d Dietary selenium concentration is calculated by deviding the selenium concentration
per kg by the assumed ME concentration. e Assumed bioavailability is calculated by deviding the recommendation by the
dietary selenium concentration of the study diet (µg/MJ) multiplied by 100.
Wedekind et al.(299) have attempted to define the minimum and maximum requirements of
adult dogs. This study was performed in Se depleted beagles using SeMet supplements in a
Se deficient synthetic basal canned diet. Results indicated a minimum requirement of 110
µg/kg diet. A maximum was not specified. This study may have overestimated the
requirements because SeMet may be non-specifically incorporated into proteins. Also, it is

56 Chapter 1
General introductionGeneral introductionGeneral introductionGeneral introduction
not likely that dogs will be Se depleted, as commercially available diets always contain
some Se. It is plausible that Se is more efficiently used in depleted dogs than in dogs with
an adequate Se status. Therefore, the use of Se depleted dogs may give an inaccurately
higher requirement of adult dogs. As SeMet was supplemented after the diet had been
processed (retorted), the recommended minimum was corrected for the chicken bioassay
bioactivity for canned diets (30%)(252) and resulted in a recommendation of 0.33 mg/kg
diet(299).
High dietary Se concentrations may increase its health-beneficial properties, but it may also
have a negative effect on health, like diabetes mellitus type II (see paragraph 1.4.3) or other
unknown consequences. A legal upper limit of 0.5 mg Se/kg diet for pet foods is set by the
European Commision (70/524/EEC, 2004)(300). This accounts for 12% moisture in the diet and
thus is 0.568 mg Se/kg on a DM basis. This upper limit is only applicible to the total dietary
Se concentration in diets to which Se is supplemented. Sodium selenite is the main Se
species used to supplement diets(236) of which the calculated amount of Se from the
ingredients is not sufficient to reach the recommended minimum. In addition to sodium
selenite, sodium selenate, selenium yeast and selenomethionine are also approved Se
supplements by the European Union(301). It is not specified on which research the legal upper
limit is based. However, Wedekind et al.(299) have reported decreased hair growth in dogs as
a sign of Se toxicity at a SeMet intake of 5 mg Se/kg, while at intakes of 1 mg Se/kg no
such signs were reported.
Due to the extrapolations of data from animals with presumable different requirements and
the lack of accounting for variations in bioavailability and -activity, it can be concluded that
the current recommendations on Se intake for adult dogs are premature and need further
research.
1.9 Biomarkers of selenium status
Dietary recommendations for dogs are currently based on the optimisation of serum Se(302)
and GPx activity(252; 261). These are frequently used biomarkers in Se studies in dogs(69; 303-307).
However, it is not known whether these are the most sensitive markers for Se status. A
biomarker is defined as a characteristic that can be objectively measured and evaluated as
an indicator of normal biological processes, pathogenic processes or as a pharmacological
response to a therapeutic intervention(308). Se status refers to the amount of bioactive Se or
potentially bioactive Se in the body and may be used to assess the risk of Se deficiency,
potential health beneficial properties of Se, or Se toxicity(309).
Chapter 1
General introductionGeneral introductionGeneral introductionGeneral introduction
57
Se retention can be calculated by the difference between Se intake and the sum of urinary
and faecal excretion(309) and is useful as an indicator of the degree to which requirements
have been met and the presence of potential Se reserves. Other mechanisms of Se excretion
from the body, such as expired breath(117), and hair and toenail Se may be negligible when
estimating Se retention(309). Urinary Se excretion can be conveniently measured in a single
void sample by correcting the Se concentration by the urinary creatinine concentration, to
reduce the error associated with variation in urinary output. This method has been
validated against 24-hour urinary Se excretion by Hojo(310) in humans. No validation has
been done in dogs, but urinary concentrations corrected for urinary creatinine
concentration are widely accepted for other urinary excretion products, such as protein(311-
312) and aldosterone(313).
It was previously believed that the excretion of TMSe in urine was a valid urinary marker
for excess Se intake(116). However, since the finding of Kuehnelt et al.(111), the excretion of
TMSe should be interpreted with caution. These authors found that TMSe can also be
excreted in Se adequacy, possibly depending on genetic variation(111). There is no support
for the findings of Kuehnelt et al. in dogs. From an exploratory study in preparation to the
study reported in chapter 4 of this thesis, a small number of urine samples (n=5) from dogs
that have been fed a commercially available kibble diet (approximately 20 µg Se/MJ) have
been analysed and TMSe was not detected in any of the samples (detection limit of 50
ng/ml, unpublished data). Also, because it is known that the excretion of high dietary Se
levels shifts partly from urinary to respiratory excretion(117), the measurement of urinary Se
should be interpreted with care in dietary Se concentrations that exceed the minimum
recommendation.
Hair and toenail Se concentrations may also be measured as excretory products, as the Se
is no longer accessible to the body. This is a measure of long-term Se status and correlates
well with blood Se concentrations(47; 314). However, they should be interpreted with caution as
Se intake should be stable for an extended period before hair and toenail Se
concentrations could be accurately measured, and also, contamination with Se from outside
the body may occur, for example by anti-dandruff shampoos that contain Se(309).
Retention of Se can occur in many organs, with the highest concentrations in kidney(68) and
liver(59). Tissue Se concentrations contain only non-specifically incorporated Se and thus may
be used as a measure of Se reserves. Tissue Se concentrations have been reported to
correlate well with whole blood Se concentrations(314). However, whole blood contains Se
that could be used for selenoproteins as well as non-specific incorporation(309). Plasma/serum
Se also consist of both specific and non-specifically incorporated Se(309) and ar highly

58 Chapter 1
General introductionGeneral introductionGeneral introductionGeneral introduction
correlated with Se intake(315). Plasma and serum deviate in that serum does not contain
clotting proteins such as fibrinogen, and plasma does. Forrer et al.(307) indicated a reference
range for serum Se in healthy dogs between 1.90 and 4.31 µmol/L.
More specific biomarkers of Se bioactivity may also be useful in the assessment of Se status.
Selenoprotein activity or concentration may be measured in whole blood, plasma, serum or
tissues like the liver. In humans, erythrocyte GPx activity is 25 to 100 times higher than
plasma GPx activity(316). It may be most applicable in determining Se deficiency rather than
high Se concentrations, as selenoprotein activity level plateaus at adequate Se intake(317), as
the enzyme protein becomes the limiting factor instead of selenium(318).
Selenoproteins can also be measured by means of their mRNA expression. However,
responses of mRNA concentrations do not necessarily reflect the response of the
corresponding selenoprotein, as a complex mechanism at post-transcriptional and -
translational level regulates protein expression(319). Yet, these markers can offer an early
prediction of individuals at risk for disease and disease progression(320). mRNA transcripts of
selenoproteins can be determined in tissue biopsies, but also in blood, as this shares more
than 80% of the selenoprotein transcriptome with major tissues(320-321). Not all mRNA
transcripts respond to changes in Se intake. Sunde et al.(322) found that SelH, SepW1, and
GPx1 in mice liver and kidney are most decreased compared to other selenoproteins by a
decreasing dietary Se intake (0 or 0.05 vs. 0.2 µg/g diet). While also in rats most
selenoprotein mRNA concentrations were down-regulated in Se deficiency, SPS2 was up-
regulated(323). This is understandable, because this enzyme is involved in the first step of
selenoprotein formation, namely by transforming hydrogen selenide into
selenophosphate(132). So the up-regulation of SPS2 mRNA may facilitate enhanced recycling
of limiting Se. Unfortunately, no dog-specific information on the effect of dietary Se intake
on selenoprotein mRNA expression is yet available.
Non-specific biomarkers of Se status are markers that may indirectly be altered by Se.
These may be useful as secondary marker to get an idea of the adequacy of the Se status.
Examples of non-specific biomarkers for Se status are thyroid hormone ratio (T3:T4),
isoprostanes (IsoP) as marker for lipid peroxidation, and creatine kinase (CK) as a marker of
muscle damage. Van Vleet(174) reported increased plasma CK activities in combination with
muscular degeneration in puppies fed a vitamin E and Se deficient diet.
In conclusion, more research is needed into specific biomarkers for Se status in dogs to
accurately assess their Se requirements. Also, the effect of these biomarkers with different
dietary Se concentrations and their relation to the incidence of disease in dogs should be
studied.

Chapter 1
General introductionGeneral introductionGeneral introductionGeneral introduction
59
1.10 References
1. Combs Jr GF, Combs SB (1986) Chemical aspects of selenium. In The Role of Selenium in
Nutrition, pp. 1-14. New York: Academic Press. 2. Reilly C (2006) Introduction. In Selenium in Food and Health, pp. 1-19. New York: Springer
Science & Business Media. 3. El-Ramady HR, Domokos-Szabolcsy E, Shalaby TA et al. (2015) Selenium in agriculture:
water, air, soil, plants, food, animals and nanoselenium. In CO2 sequestration, biofuels and
depollution, pp. 154-232 [E Lichtfouse, J Schwarzbauer and D Robert, editors]. Heidelberg: Springer International Publishing.
4. Rosenfeld I, Beath OA (1964) Selenium geobotany, biochemistry, toxicity, and nutrition.
New York: Academic Press Inc. 5. Schwarz K, Bieri JG, Briggs GM et al. (1957) Prevention of exudative diathesis in chicks by
factor 3 and selenium. Proceedings of the Society for Experimental Biology and Medicine 95959595, 621-625.
6. Schwarz K, Foltz CM (1957) Selenium as an integral part of factor 3 against dietary necrotic liver degeneration. Journal of the American Chemical Society 79797979, 3292-3293.
7. Patterson EL, Milstrey R, Stokstad ELR (1957) Effect of selenium in preventing exudative diathesis in chicks. Proceedings of the Society for Experimental Biology and Medicine 95959595, 617-620.
8. Shriver DF, Atkins PW (1999) Inorganic Chemistry. 3rd ed. Oxford: Oxford University Press. 9. National Research Council (1983) Selenium in Nutrition. Washington D.C.: National
Academies Press. 10. Dumont E, Vanhaecke F, Cornelis R (2006) Selenium speciation from food source to
metabolites: a critical review. Analytical and Bioanalytical Chemistry 385385385385, 1304-1323. 11. White PJ, Bowen HC, Marshall B et al. (2007) Extraordinarily High Leaf Selenium to Sulfur
Ratios Define ‘Se-accumulator’ Plants. Annals of Botany 100100100100, 111-118. 12. Ellis D, Salt DE (2003) Plants, selenium and human health. Current Opinion in Plant Biology
6666, 273-279. 13. Thomson CD, Chisholm A, McLachlan SK et al. (2008) Brazil nuts: an effective way to
improve selenium status. American Journal of Clinical Nutrition 87878787, 379-384. 14. Gupta UC, Gupta SC (2010) Selenium Deficiency in Soils and Crops and its Impact on
Animal and Human Health. Current Nutrition & Food Science 6666, 268-280. 15. Lobinski R, Edmonds JS, Suzuki KT et al. (2000) Species-selective determination of
selenium compounds in biological materials. Pure and Applied Chemistry 72727272, 447-461. 16. Puls R (1988) Mineral levels in animal health. Diagnostic data. Clearbrook, British
Columbia V2T 4X2: Sherpa International. 17. Fleming GA (1962) Selenium in Irish soils and plants. Soil Science 94949494, 28-35. 18. Combs Jr GF, Combs SB (1986) Selenium in the environment. In The Role of Selenium in
Nutrition, pp. 15-40. New York: Academic Press. 19. Combs Jr GF, Combs SB (1986) Selenium in foods and feeds. In The Role of Selenium in
Nutrition, pp. 41-126. New York: Academic Press. 20. Gissel-Nielsen G (1998) Effects of selenium supplementation of field crops. In
Environmental chemistry of selenium, pp. 99-112 [JT Frankenberger and RA Engberg, editors]. New York: Marcel Dekker Inc.
21. Fordyce FM, Johnson CC, Navaratne URB et al. (2000) Selenium and Iodine in Soil, Rice and Drinking Water in Relation to Endemic Goiter in Sri Lanka. Science of the Total
Environment 263263263263, 127-142.

60 Chapter 1
General introductionGeneral introductionGeneral introductionGeneral introduction
22. Murphy J, Cashman KD (2001) Selenium content of a range of Irish foods. Food Chemistry 74747474, 493-498.
23. Oldfield JE (2002) Selenium world atlas. Grimbergen: Selenium-Tellurium Development Association.
24. Dhillon KS, Dhillon SK (2003) Distribution and management of seleniferous soils. Advances
in Agronomy 79797979, 119-184. 25. Surai PF, Taylor-Pickard JA (2008) Current Advances in Selenium Research and
Applications. Wageningen: Wageningen Academic Publishers. 26. Garcia Moreno R, Burdock R, Cruz Diaz Alvarez M et al. (2013) Managing the selenium
content in soils in semiarid environments through the recycling of organic matter. Applied
and Environmental Soil Science 2013201320132013, 1-10. 27. De Temmerman L, Waegeneers N, Thiry C et al. (2014) Selenium content of Belgian
cultivated soils and its uptake by field crops and vegetables. Science of the Total
Environment 468468468468––––469469469469, 77-82. 28. National Research Council (1983) Selenium in Nutrition. Washington D.C.: National
Academies Press. 29. Sippola J (1979) Selenium content of soil and timothy (Phleum pratense) in Finland.
Annales Agriculturae Fenniae 18181818, 182-187. 30. Eurola M, Ekholm P, Ylinen M et al. (1990) Effects of selenium fertilization on the selenium
content of cereal grains, flour, and bread produced in Finland. Cereal Chemistry 67676767, 334-337.
31. Eurola MH, Ekholm PI, Ylinen ME et al. (1991) Selenium in Finnish foods after beginning the use of selenate-supplemented fertilisers. Journal of the Science of Food and
Agriculture 56565656, 57-70. 32. Adams ML, Lombi E, Zhao F-J et al. (2002) Evidence of low selenium concentrations in UK
bread-making wheat grain. Journal of the Science of Food and Agriculture 82828282, 1160-1165. 33. Thorn J, Robertson J, Buss DH et al. (1978) Trace nutrients. Selenium in British food. British
Journal of Nutrition 39393939, 391-396. 34. Spadoni M, Voltaggio M, Carcea M et al. (2007) Bioaccessible selenium in Italian
agricultural soils: Comparison of the biogeochemical approach with a regression model based on geochemical and pedoclimatic variables. Science of the Total Environment 376376376376, 160-177.
35. Pappa EC, Pappas AC, Surai PF (2006) Selenium content in selected foods from the Greek market and estimation of the daily intake. Science of the Total Environment 372372372372, 100-108.
36. Bratakos MS, Zafiropoulos TF, Siskos PA et al. (1987) Selenium in Foods Produced and Consumed in Greece. Journal of Food Science 52525252, 817-822.
37. Maksimovic Z, Djujic I (1998) Selenium research in Serbia, Yugoslavia. Journal of
Environmental Pathology, Toxicology and Oncology 17171717, 165-171. 38. Dermience M, Li XW, Mathieu F et al. (2014) Minerals and trace elements in traditional
foods of rural areas of Lhasa Prefecture, Tibet Autonomous Region (P.R. China). Journal of
Food Composition and Analysis 33335555, 67-74. 39. Fordyce FM, Guangdi Z, Green K et al. (2000) Soil, grain and water chemistry in relation to
human selenium-responsive diseases in Enshi District, China. Applied Geochemistry 15151515, 117-132.
40. Tinggi U, Reilly C, Patterson CM (1992) Determination of selenium in foodstuffs using spectrofluorometry and hydride generation atomic absorption spectrometry. Journal of
Food Composition and Analysis 5555, 269-280.

Chapter 1
General introductionGeneral introductionGeneral introductionGeneral introduction
61
41. Andrews ED, Hartley WJ, Grant AB (1968) Selenium-responsive diseases of animals in New Zealand. New Zealand Veterinary Journal 16161616, 3-17.
42. Alamin MB, Bejey AM, Kučera J et al. (2006) Determination of mercury and selenium in consumed food items in Libya using instrumental and radiochemical NAA. Journal of
Radioanalytical and Nuclear Chemistry 270270270270, 143-146. 43. Dermauw V, De Cuyper A, Duchateau L et al. (2014) A disparate trace element metabolism
in zebu (Bos indicus) and crossbred (Bos indicus × Bos taurus) cattle in response to a copper-deficient diet. Journal of Animal Science 92929292, 3007-3017.
44. Chilimba ADC, Young SD, Black CR et al. (2011) Maize grain and soil surveys reveal suboptimal dietary selenium intake is widespread in Malawi. Scientific Reports 1111.
45. Courtman C, van Ryssen JBJ, Oelofse A (2012) Selenium concentration of maize grain in South Africa and possible factors influencing the concentration. South African Journal of
Animal Science 42424242, 454-458. 46. Moxon AL (1937) Alkali disease or selenium poisoning. Annual Report of the South Dakota
Agricultural Experiment Station. Brookings: South Dakota State University. 47. Yang G, Zhou R, Yin S et al. (1989) Studies of safe maximal daily dietary selenium intake in
a seleniferous area in China. 1. Selenium intake and tissue selenium levels of the inhabitants. Journal of Trace Elements and Electrolytes in Health and Disease 3333, 77-87.
48. Cubadda F, Aureli F, Ciardullo S et al. (2010) Changes in Selenium Speciation Associated with Increasing Tissue Concentrations of Selenium in Wheat Grain. Journal of Agricultural
and Food Chemistry 58585858, 2295-2301. 49. Combs Jr GF, Combs SB (1986) Selenium deficiency diseases of animals. In The Role of
Selenium in Nutrition, pp. 265-326. New York: Academic Press. 50. Whanger PD, Pedersen ND, Hatfield J et al. (1976) Absorption of Selenite and
Selenomethionine from Ligated Digestive Tract Segments in Rats. Experimental Biology
and Medicine 153153153153, 295-297. 51. Vendeland SC, Butler JA, Whanger PD (1992) Intestinal absorption of selenite, selenate,
and selenomethionine in the rat. Journal of Nutritional Biochemistry 3333, 359-365. 52. Wolffram S, Ardüser F, Scharrer E (1985) In vivo intestinal absorption of selenate and
selenite by rats. Journal of Nutrition 115115115115, 454-459. 53. Wolffram S, Berger B, Grenacher B et al. (1989) Transport of selenoamino acids and their
sulfur analogues across the intestinal brush border membrane of pigs. Journal of Nutrition 119119119119, 706-712.
54. Wolffram S, Anliker E, Scharrer E (1986) Uptake of selenate and selenite by isolated intestinal brush border membrane vesicles from pig, sheep, and rat. Biological Trace
Element Research 10101010, 293-306. 55. Wolffram S, Grenacher B, Scharrer E (1988) Transport of selenate and sulphate across the
intestinal brush-border membrane of pig jejunum by two common mechanisms. Quarterly
Journal of Experimental Physiology 73737373, 103-111. 56. Thomson CD, Robinson MF (1986) Urinary and fecal excretions and absorption of a large
supplement of selenium: superiority of selenate over selenite. American Journal of Clinical
Nutrition 44444444, 659-663. 57. Gammelgaard B, Rasmussen L, Gabel-Jensen C et al. (2012) Estimating Intestinal
Absorption of Inorganic and Organic Selenium Compounds by in Vitro Flux and Biotransformation Studies in Caco-2 Cells and ICP-MS Detection. Biological Trace Element
Research 145145145145, 248-256. 58. Griffiths NM, Stewart RDH, Robinson MF (1976) The metabolism of
[75Se]selenomethionine in four women. British Journal of Nutrition 35353535, 373-382.

62 Chapter 1
General introductionGeneral introductionGeneral introductionGeneral introduction
59. Combs Jr GF, Combs SB (1986) Absorption, excretion, and metabolism of selenium. In The
Role of Selenium in Nutrition, pp. 179-204. New York: Academic Press. 60. Thomson CD, Robinson BA, Stewart RDH et al. (1975) Metabolic studies of
[Se]selenocystine and [Se]selenomethionine in the rat. British Journal of Nutrition 34343434, 501-509.
61. van Dael P, Davidsson L, Muñoz-Box R et al. (2001) Selenium absorption and retention from a selenite- or selenate-fortified milk-based formula in men measured by a stable-isotope technique. British Journal of Nutrition 85858585, 157-163.
62. Furchner JE, London JE, Wilson JS (1975) Comparative metabolism of radionuclides in mammals-IX. Retention of 75Se in the mouse, rat, monkey and dog. Health Physics 29292929, 641-648.
63. Xia Y, Hill KE, Byrne DW et al. (2005) Effectiveness of selenium supplements in a low-selenium area of China. American Journal of Clinical Nutrition 81818181, 829-834.
64. Schrauzer GN (2000) Selenomethionine : A Review of Its Nutritional Significance , Metabolism and Toxicity. Journal of Nutrition 130130130130, 1653-1656.
65. Beilstein MA, Whanger PD (1986) Chemical Forms of Selenium in Rat Tissues after Administration of Selenite or Selenomethionine. Journal of Nutrition 116116116116, 1711-1719.
66. Zachara BA, Pawluk H, Bloch-boguslawska E et al. (2001) Tissue Level, Distribution and Total Body Selenium Content in Healthy and Diseased Humans in Poland. Archives of
Environmental Health: An International Journal 56565656, 461-466. 67. Oster O, Schmiedel G, Prellwitz W (1988) The Organ Distribution of Selenium in German
Adults. In Selenium, pp. 23-45 [GN Schrauzer, editor]. New York: Humana Press. 68. Paßlack N, Mainzer B, Lahrssen-Wiederholt M et al. (2015) Concentrations of strontium,
barium, cadmium, copper, zinc, manganese, chromium, antimony, selenium, and lead in the liver and kidneys of dogs according to age, gender, and the occurrence of chronic kidney disease. Journal of Veterinary Science 16161616, 57-66.
69. Todd SE, Thomas DG, Bosch G et al. (2012) Selenium status in adult cats and dogs fed high levels of dietary inorganic and organic selenium. Journal of Animal Science 90909090, 2549-2555.
70. López-Alonso M, Miranda M, García-Partida P et al. (2007) Toxic and trace metal concentrations in liver and kidney of dogs. Biological Trace Element Research 116116116116, 185-202.
71. Levander OA, Baumann CA (1966) Selenium metabolism: VI. Effect of arsenic on the excretion of selenium in the bile. Toxicology and Applied Pharmacology 9999, 106-115.
72. Gyurasics Á, Perjési P, Gregus Z (1998) Role of glutathione and methylation in the biliary excretion of selenium. the paradoxical effect of sulfobromophthalein. Biochemical
Pharmacology 56565656, 1381-1389. 73. Francesconi KA, Pannier F (2004) Selenium Metabolites in Urine: A Critical Overview of
Past Work and Current Status. Clinical Chemistry 50505050, 2240-2253. 74. Suzuki KT (2005) Metabolomics of Selenium: Se Metabolites Based on Speciation Studies.
Journal of Health Science 51515151, 107-114. 75. Lu J, Berndt C, Holmgren A (2009) Metabolism of selenium compounds catalyzed by the
mammalian selenoprotein thioredoxin reductase. Biochimica et Biophysica Acta 1790179017901790, 1513-1519.
76. Hoefig CS, Renko K, Köhrle J et al. (2011) Comparison of different selenocompounds with respect to nutritional value vs. toxicity using liver cells in culture. Journal of Nutritional
Biochemistry 22222222, 945-955. 77. Thiry C, Ruttens A, de Temmerman L et al. (2012) Current knowledge in species-related
bioavailability of selenium in food. Food Chemistry 130130130130, 767-784.

Chapter 1
General introductionGeneral introductionGeneral introductionGeneral introduction
63
78. Roman M, Jitaru P, Barbante C (2014) Selenium biochemistry and its role for human health. Metallomics 6666, 25-54.
79. Jäger T, Drexler H, Göen T (2015) Human metabolism and renal excretion of selenium compounds after oral ingestion of sodium selenite and selenized yeast dependent on the trimethylselenium ion (TMSe) status. Archives of Toxicology, 1-12.
80. Patterson BH, Levander OA, Helzlsouer K et al. (1989) Human selenite metabolism: a kinetic model. American Journal of Physiology 257257257257, R556-R567.
81. Thomson CD, Stewart RDH (1973) Metabolic studies of [75Se]selenomethionine and [75Se]selenite in the rat. British Journal of Nutrition 30303030, 139-147.
82. Brown DG, Burk RF (1973) Selenium Retention in Tissues and Sperm of Rats Fed α Torula Yeast Diet. Journal of Nutrition 103103103103, 102-108.
83. Schomburg L (2012) Variations in Selenium Metabolism in Males and Females. In Selenium
It's molecular biology and role in human health, pp. 419-432 [DL Hatfield, MJ Berry and VN Gladyshev, editors]. New York: Springer New York.
84. Suzuki KT, Doi C, Suzuki N (2006) Metabolism of 76Se-methylselenocysteine compared with that of 77Se-selenomethionine and 82Se-selenite. Toxicology and Applied
Pharmacology 217217217217, 185-195. 85. Ohta Y, Suzuki KT (2008) Methylation and demethylation of intermediates selenide and
methylselenol in the metabolism of selenium. Toxicology and Applied Pharmacology 226226226226, 169-177.
86. Okuno T, Kubota T, Kuroda T et al. (2001) Contribution of Enzymic α,γ-Elimination Reaction in Detoxification Pathway of Selenomethionine in Mouse Liver. Toxicology and
Applied Pharmacology 176176176176, 18-23. 87. Suzuki KT, Ohta Y, Suzuki N (2006) Availability and metabolism of 77Se-methylseleninic
acid compared simultaneously with those of three related selenocompounds. Toxicology
and Applied Pharmacology 217217217217, 51-62. 88. Suzuki KT, Kurasaki K, Suzuki N (2007) Selenocysteine β-lyase and methylselenol
demethylase in the metabolism of Se-methylated selenocompounds into selenide. Biochimica et Biophysica Acta 1770177017701770, 1053-1061.
89. Lee M, Dong A, Yano J (1969) Metabolism of 75Se-selenite by human whole blood in vitro. Canadian Journal of Biochemistry 47474747, 791-797.
90. Suzuki KT, Shiobara Y, Itoh M et al. (1998) Selective uptake of selenite by red blood cells. Analyst 123123123123, 63-67.
91. Haratake M, Fujimoto K, Hirakawa R et al. (2008) Hemoglobin-mediated selenium export from red blood cells. Journal of Biological Inorganic Chemistry 13131313, 471-479.
92. Gasiewicz TA, Smith JC (1978) Properties of the cadmium and selenium complex formed in rat plasma in vivo and in vitro. Chemico-Biological Interactions 23232323, 171-183.
93. Weekley CM, Aitken JB, Vogt S et al. (2011) Metabolism of selenite in human lung cancer cells: X-ray absorption and fluorescence studies. Journal of the American Chemical Society 133133133133, 18272-18279.
94. Ganther HE (1999) Selenium metabolism, selenoproteins and mechanisms of cancer prevention: complexities with thioredoxin reductase. Carcinogenesis 20202020, 1657-1666.
95. Shiobara Y, Suzuki KT (1998) Binding of selenium (administered as selenite) to albumin after efflux from red blood cells. Journal of Chromatography B 710710710710, 49-56.
96. Haratake M, Hongoh M, Miyauchi M et al. (2008) Albumin-Mediated Selenium Transfer by a Selenotrisulfide Relay Mechanism. Inorganic Chemistry 47474747, 6273-6280.
97. Kobayashi Y, Ogra Y, Suzuki KT (2001) Speciation and metabolism of selenium injected with 82Se-enriched selenite and selenate in rats. Journal of Chromatography B 760760760760, 73-81.
64 Chapter 1
General introductionGeneral introductionGeneral introductionGeneral introduction
98. Shiobara Y, Ogra Y, T. Suzuki K (1999) Speciation of metabolites of selenate in rats by HPLC-ICP-MS. Analyst 124124124124, 1237-1241.
99. Suzuki Y, Hashiura Y, Matsumura K et al. (2010) Dynamic pathways of selenium metabolism and excretion in mice under different selenium nutritional statuses. Metallomics 2222, 126-132.
100. Burk RF, Hill KE (2009) Selenoprotein P – Expression, Functions, and Roles in Mammals. Biochimica et Biophysica Acta 1790179017901790, 1441-1447.
101. Motsenbocker MA, Tappel AL (1982) A selenocysteine-containing selenium-transport protein in rat plasma. Biochimica et Biophysica Acta 719719719719, 147-153.
102. Sanz Alaejos M, Díaz Romero C (1993) Urinary selenium concentrations. Clinical Chemistry 39393939, 2040-2052.
103. Burk RF, Brown DG, Seely RJ et al. (1972) Influence of Dietary and Injected Selenium on Whole-body Retention, Route of Excretion, and Tissue Retention of 75SeO32- in the Rat. Journal of Nutrition 102102102102, 1049-1055.
104. Itoh M, Suzuki KT (1997) Effects of dose on the methylation of selenium to monomethylselenol and trimethylselenonium ion in rats. Archives of Toxicology 71717171, 461-466.
105. Kobayashi Y, Ogra Y, Ishiwata K et al. (2002) Selenosugars are key and urinary metabolites for selenium excretion within the required to low-toxic range. Proceedings of the National
Academy of Sciences 99999999, 15932-15936. 106. Ogra Y, Ishiwata K, Takayama H et al. (2002) Identification of a novel selenium metabolite,
Se-methyl-N-acetylselenohexosamine, in rat urine by high-performance liquid chromatography–inductively coupled plasma mass spectrometry and –electrospray ionization tandem mass spectrometry. Journal of Chromatography B 767767767767, 301-312.
107. Diaz Huerta V, Szpunar J, Lobinski R et al. (2003) Sample preparation for identification of selenocompounds in urine by electrospray-MS/MS. Journal of Analytical Atomic
Spectrometry 18181818, 1471-1476. 108. Bendahl L, Gammelgaard B (2004) Separation and identification of Se-
methylselenogalactosamine-a new metabolite in basal human urine-by HPLC-ICP-MS and CE-nano-ESI-(MS)2. Journal of Analytical Atomic Spectrometry 19191919, 950-957.
109. Gammelgaard B, Bendahl L (2004) Selenium speciation in human urine samples by LC- and CE-ICP-MS-separation and identification of selenosugars. Journal of Analytical Atomic
Spectrometry 19191919, 135-142. 110. Gammelgaard B, Grimstrup Madsen K, Bjerrum J et al. (2003) Separation, purification and
identification of the major selenium metabolite from human urine by multi-dimensional HPLC-ICP-MS and APCI-MS. Journal of Analytical Atomic Spectrometry 18181818, 65-70.
111. Kuehnelt D, Juresa D, Kienzl N et al. (2006) Marked individual variability in the levels of trimethylselenonium ion in human urine determined by HPLC/ICPMS and HPLC/vapor generation/ICPMS. Analytical and Bioanalytical Chemistry 386386386386, 2207-2212.
112. Kuehnelt D, Kienzl N, Traar P et al. (2005) Selenium metabolites in human urine after ingestion of selenite, L-selenomethionine, or DL-selenomethionine: a quantitative case study by HPLC/ICPMS. Analytical and Bioanalytical Chemistry 383383383383, 235-246.
113. Janghorbani M, Rockway S, Mooers CS et al. (1990) Effect of Chronic Selenite Supplementation on Selenium Excretion and Organ Accumulation in Rats. Journal of
Nutrition 120120120120, 274-279. 114. Jäger T, Drexler H, Göen T (2013) Ion pairing and ion exchange chromatography coupled
to ICP-MS to determine selenium species in human urine. Journal of Analytical Atomic
Spectrometry 28282828, 1402-1409.

Chapter 1
General introductionGeneral introductionGeneral introductionGeneral introduction
65
115. Van Paemel M, Dierick N, Janssens GPJ et al. (2010) Selected trace and ultratrace
elements: Biological role, content in feed and requirements in animal nutrition - Elements
for risk assessment. Technical Report submitted to EFSA. Ghent: Ghent University. 116. Nahapetian AT, Janghorbani M, Young VR (1983) Urinary Trimethylselenonium Excretion
by the Rat: Effect of Level and Source of Selenium-75. Journal of Nutrition 113113113113, 401-411. 117. Kremer D, Ilgen G, Feldmann J (2005) GC–ICP–MS determination of dimethylselenide in
human breath after ingestion of 77Se-enriched selenite: monitoring of in-vivo methylation of selenium. Analytical and Bioanalytical Chemistry 383383383383, 509-515.
118. McConnell KP, Portman OW (1952) Excretion of dimethyl selenide by the rat. Journal of
Biological Chemistry 195195195195, 277-282. 119. McConnell KP, Roth DM (1966) Respiratory Excretion of Selenium. Experimental Biology
and Medicine 123123123123, 919-921. 120. McConnell KP, Martin RG (1952) Biliary excretion of selenium in the dog after
administration of sodium selenate containing radioselenium. Journal of Biological
Chemistry 194194194194, 183-190. 121. Ghosh B, Lightner DA, McDonagh AF (2004) Synthesis, Conformation, and Metabolism of a
Selenium Bilirubin. Chemical Monthly 135135135135, 1189-1199. 122. Brosnan JT, Brosnan ME (2006) The Sulfur-Containing Amino Acids: An Overview. Journal
of Nutrition 136136136136, 1636S-1640S. 123. Smeets-Peeters M, Watson T, Minekus M et al. (1998) A review of the physiology of the
canine digestive tract related to the development of in vitro systems. Nutrition research
reviews 11111111, 45-69. 124. Symonds HW, Mather DL, Vagg MJ (1981) The excretion of selenium in bile and urine of
steers: the influence of form and amount of Se salt. British Journal of Nutrition 46464646, 487-493.
125. Köhrle J, Brigelius-Flohe R, Bock A et al. (2000) Selenium in biology: facts and medical perspectives. Biological Chemistry 381381381381, 849-864.
126. Behne D, Kyriakopoeulos A, Weiss-Nowak C et al. (1996) Newly found selenium-containing proteins in the tissues of the rat. Biological Trace Element Research 55555555, 99-110.
127. Pappas AC, Zoidis E, Surai PF et al. (2008) Selenoproteins and maternal nutrition. Comparative Biochemistry and Physiology Part B 151151151151, 361-372.
128. Fairweather-Tait SJ, Collings R, Hurst R (2010) Selenium bioavailability : current knowledge and future research. American Journal of Clinical Nutrition 91919191, 1484S-1491S.
129. GenBank (2015) Genetic Sequence Data Bank. http://www.ncbi.nlm.nih.gov/nuccore/ (accessed 6 July 2015).
130. Lobanov AV, Hatfield DL, Gladyshev VN (2009) Eukaryotic selenoproteins and selenoproteomes. Biochimica et Biophysica Acta 1790179017901790, 1424-1428.
131. Vanda Papp L, Lu J, Holmgren A et al. (2007) From Selenium to Selenoproteins: Synthesis, Identity, and Their Role in Human Health. Antioxidants & Redox Signaling 9999, 775-814.
132. Turanov AA, Xu X-M, Carlson BA et al. (2011) Biosynthesis of Selenocysteine, the 21st Amino Acid in the Genetic Code, and a Novel Pathway for Cysteine Biosynthesis. Advances
in Nutrition: An International Review Journal 2222, 122-128. 133. Labunskyy VM, Hatfield DL, Gladyshev VN (2014) Selenoproteins: molecular pathways and
physiological roles. Physiological Reviews 99994444, 739-777. 134. Tanguy Y, Arthaud S, Falluel-Morel A et al. (2012) Selenoprotein T. In Selenoproteins and
Mimics, pp. 89-95: Springer Berlin Heidelberg.

66 Chapter 1
General introductionGeneral introductionGeneral introductionGeneral introduction
135. Martin GW, Harney JW, Berry MJ (1996) Selenocysteine incorporation in eukaryotes: insights into mechanism and efficiency from sequence, structure, and spacing proximity studies of the type 1 deiodinase SECIS element. RNA 2222, 171-182.
136. Sunde RA, Raines AM (2011) Selenium Regulation of the Selenoprotein and Nonselenoprotein Transcriptomes in Rodents. Advances in Nutrition 2222, 138-150.
137. Wolffram S (1999) Absorption and metabolism of selenium: differences between inorganic and organic sources. In Biotechnology in the Feed Industry, pp. 547-566 [TP Lyons and KA Jacques, editors]. Nottingham: Nottingham University Press.
138. Combs Jr GF, Combs SB (1986) Biochemical functions of selenium. In The Role of Selenium
in Nutrition, pp. 205-263. New York: Academic Press. 139. Michalková Z, Mojžišová J, Hromada R et al. (2004) The effect of dietary selenium and
vitamin E on non-specific immune response in healthy puppies after vaccination. Folia
Veterinaria 48484848, 157-160. 140. Lehninger A, Nelson DL, Cox MM (2008) Lehninger Principles of Biochemistry. 5 ed. New
York: W.H. Freeman. 141. Kryukov GV, Castellano S, Novoselov SV et al. (2003) Characterization of Mammalian
Selenoproteomes. Science 300300300300, 1439-1443. 142. Lawrence RA, Burk RF (1976) Glutathione Peroxidase Activity in Selenium-Deficient Rat
Liver. Biochemical and Biophysical Research Communications 71717171, 952-958. 143. Gladyshev VN (2012) Selenoproteins and Selenoproteomes. In Selenium It's molecular
biology and role in human health, pp. 109-123 [DL Hatfield, MJ Berry and VN Gladyshev, editors]. New York: Springer New York.
144. Lubos E, Loscalzo J, Handy DE (2011) Glutathione Peroxidase-1 in Health and Disease: From Molecular Mechanisms to Therapeutic Opportunities. Antioxidants & Redox
Signaling 15151515, 1957-1997. 145. Fu Y, Cheng W-H, Porres JM et al. (1999) Knockout of cellular glutathione peroxidase gene
renders mice susceptible to diquat-induced oxidative stress. Free Radical Biology and
Medicine 27272727, 605-611. 146. Weiss Sachdev S, Sunde RA (2001) Selenium regulation of transcript abundance and
translational efficiency of glutathione peroxidase-1 and -4 in rat liver. Biochemical Journal 357357357357, 851-858.
147. Avissar N, Ornt DB, Yagil Y et al. (1994) Human kidney proximal tubules are the main source of plasma glutathione peroxidase. American Journal of Physiology 266266266266, C367-C375.
148. Omaye ST, Tappel AL (1974) Effect of Dietary Selenium on Glutathione Peroxidase in the Chick. Journal of Nutrition 104104104104, 747-753.
149. Seiler A, Schneider M, Förster H et al. (2008) Glutathione Peroxidase 4 Senses and Translates Oxidative Stress into 12/15-Lipoxygenase Dependent- and AIF-Mediated Cell Death. Cell Metabolism 8888, 237-248.
150. Ursini F, Heim S, Kiess M et al. (1999) Dual function of the selenoprotein PHGPx during sperm maturation. Science 285285285285, 1393-1396.
151. Sun Q-A, Kirnarsky L, Sherman S et al. (2001) Selenoprotein oxidoreductase with specificity for thioredoxin and glutathione systems. Proceedings of the National Academy
of Sciences of the United States of America 98989898, 3673-3678. 152. Su D, Novoselov SV, Sun Q-A et al. (2005) Mammalian selenoprotein thioredoxin-
glutathione reductase: roles in disulfide bond formation and sperm maturation. Journal of
Biological Chemistry 280280280280, 26491-26498.

Chapter 1
General introductionGeneral introductionGeneral introductionGeneral introduction
67
153. Hill KE, McCollum GW, Boeglin ME et al. (1997) Thioredoxin Reductase Activity Is Decreased by Selenium Deficiency. Biochemical and Biophysical Research Communications 234234234234, 293-295.
154. Zhong L, Arnér ESJ, Ljung J et al. (1998) Rat and Calf Thioredoxin Reductase Are Homologous to Glutathione Reductase with a Carboxyl-terminal Elongation Containing a Conserved Catalytically Active Penultimate Selenocysteine Residue. Journal of Biological
Chemistry 273273273273, 8581-8591. 155. Arnér ESJ, Holmgren A (2000) Physiological functions of thioredoxin and thioredoxin
reductase. European Journal of Biochemistry 267267267267, 6102-6109. 156. Mustacich D, Powis G (2000) Thioredoxin reductase. Biochemical Journal 346346346346, 1-8. 157. Hishiyama N, Kayanuma H, Matsui T et al. (2006) Plasma concentration of vitamin C in
dogs with a portosystemic shunt. Canadian Journal of Veterinary Research 70707070, 305-307. 158. Drouin G, Godin J-R, Pagé B (2011) The Genetics of Vitamin C Loss in Vertebrates. Current
Genomics 12121212, 371-378. 159. Powers HJ (2003) Riboflavin (vitamin B-2) and health. The American Journal of Clinical
Nutrition 77777777, 1352-1360. 160. Baqui M, Botero D, Gereben B et al. (2003) Human Type 3 Iodothyronine
Selenodeiodinase Is Located in the Plasma Membrane and Undergoes Rapid Internalization to Endosomes. Journal of Biological Chemistry 278278278278, 1206-1211.
161. St Germain DL, Hernandez A, Schneider MJ et al. (2005) Insights into the role of deiodinases from studies of genetically modified animals. Thyroid 15151515, 905-916.
162. Zavacki AM, Marsili A, Reed Larsen P (2012) Control of Thyroid Hormone Activation and Inactivation by the Iodothyronine Deiodinase Family of Selenoenzymes. In Selenium It's
molecular biology and role in human health, pp. 369-381 [DL Hatfield, MJ Berry and VN Gladyshev, editors]. New York: Springer New York.
163. Read R, Bellew T, Yang JG et al. (1990) Selenium and amino acid composition of selenoprotein P, the major selenoprotein in rat serum. Journal of Biological Chemistry 265265265265, 17899-17905.
164. Traulsen H, Steinbrenner H, Buchczyk DP et al. (2004) Selenoprotein P Protects Low-density Lipoprotein Against Oxidation. Free Radical Research 38383838, 123-128.
165. Schweizer U, Streckfuß F, Pelt P et al. (2005) Hepatically derived selenoprotein P is a key factor for kidney but not for brain selenium supply. Biochemical Journal 386386386386, 221-226.
166. Steinbrenner H, Alili L, Stuhlmann D et al. (2007) Post-translational processing of selenoprotein P: implications of glycosylation for its utilisation by target cells. In Biological
Chemistry, vol. 388, pp. 1043. 167. Burk RF, Hill KE (2005) Selenoprotein P: An Extracellular Protein with Unique Physical
Characteristics and a Role in Selenium Homeostasis. Annual Review of Nutrition 25252525, 215-235.
168. Hill KE, Zhou J, McMahan WJ et al. (2003) Deletion of Selenoprotein P Alters Distribution of Selenium in the Mouse. Journal of Biological Chemistry 278278278278, 13640-13646.
169. Schomburg L, Schweizer U, Holtmann B et al. (2003) Gene disruption discloses role of selenoprotein P in selenium delivery to target tissues. Biochemical Journal 370370370370, 397-402.
170. Olson GE, Winfrey VP, NagDas SK et al. (2007) Apolipoprotein E Receptor-2 (ApoER2) Mediates Selenium Uptake from Selenoprotein P by the Mouse Testis. Journal of
Biological Chemistry 282282282282, 12290-12297. 171. Olson GE, Winfrey VP, Hill KE et al. (2008) Megalin Mediates Selenoprotein P Uptake by
Kidney Proximal Tubule Epithelial Cells. Journal of Biological Chemistry 283283283283, 6854-6860.

68 Chapter 1
General introductionGeneral introductionGeneral introductionGeneral introduction
172. Esaki N, Nakamura T, Tanaka H et al. (1982) Selenocysteine lyase, a novel enzyme that specifically acts on selenocysteine. Mammalian distribution and purification and properties of pig liver enzyme. Journal of Biological Chemistry 257257257257, 4386-4391.
173. Arteel GE, Franken S, Kappler J et al. (2000) Binding of Selenoprotein P to Heparin: Characterization with Surface Plasmon Resonance. Biological Chemistry 381381381381, 265-268.
174. van Vleet JF (1975) Experimentally induced vitamin E-selenium deficiency in the growing dog. Journal of the American Veterinary Medical Association 166166166166, 769-774.
175. Rhian M, Moxon AL (1943) Chronic selenium poisoning in dogs and its prevention by arsenic. Journal of Pharmacology and Experimental Therapeutics 77778888, 249-264.
176. Anderson HD, Moxon AL (1942) Changes in the blood picture of the dog following subcutaneous injections of sodium selenite. Journal of Pharmacology and Experimental
Therapeutics 76767676, 343-354. 177. Hand MS, Thatcher CD, Remillard RL et al. (2000) Small Animal Clinical Nutrition. 4th ed.
Marceline, MO: Walsworth Publishing Company. 178. Kuchan MJ, Fico Santoro M, Milner JA (1990) Consequences of selenite supplementation
on the growth and metabolism of cultures of canine mammary cells. Journal of Nutritional
Biochemistry 1111, 478-483. 179. Fico ME, Poirier KA, Watrach AM et al. (1986) Differential Effects of Selenium on Normal
and Neoplastic Canine Mammary Cells. Cancer Research 46464646, 3384-3388. 180. Waters DJ, Shen S, Glickman LT et al. (2005) Prostate cancer risk and DNA damage:
translational significance of selenium supplementation in a canine model. Carcinogenesis 26262626, 1256-1262.
181. Cardoso BR, Roberts BR, Bush AI et al. (2015) Selenium, selenoproteins and neurodegenerative diseases. Metallomics.
182. Reilly C (2006) Selenium in health and disease V: Selenium deficiency in search of a disease? In Selenium in Food and Health, pp. 149-157. New York: Springer Science & Business Media.
183. Shrimali RK, Irons RD, Carlson BA et al. (2008) Selenoproteins Mediate T Cell Immunity through an Antioxidant Mechanism. Journal of Biological Chemistry 283283283283, 20181–20185.
184. Carlson BA, Yoo M-H, Shrimali RK et al. (2010) Role of selenium-containing proteins in T-cell and macrophage function. Proceedings of the Nutrition Society 69696969, 300-310.
185. Thomson CD (2004) Assessment of requirements for selenium and adequacy of selenium status: a review. European Journal of Clinical Nutrition 58585858, 391-402.
186. Dobson JM, Samuel S, Milstein H et al. (2002) Canine neoplasia in the UK: estimates of incidence rates from a population of insured dogs. Journal of Small Animal Practice 43434343, 240-246.
187. Merlo DF, Rossi L, Pellegrino C et al. (2008) Cancer Incidence in Pet Dogs: Findings of the Animal Tumor Registry of Genoa, Italy. Journal of Veterinary Internal Medicine 22222222, 976-984.
188. Clark LC, Combs GF, Turnbull BW et al. (1996) Effects of selenium supplementation for cancer prevention in patients with carcinoma of the skin a randomized controlled trial - A randomized controlled trial. Journal of the American Medical Association 276276276276, 1957-1963.
189. Klein EA, Thompson IM, Lippman SM et al. (2001) SELECT: the next prostate cancer prevention trial. Journal of Urology 166166166166, 1311-1315.
190. Abdulah R, Miyazaki K, Nakazawa M et al. (2005) Chemical forms of selenium for cancer prevention. Journal of trace elements in medicine and biology : organ of the Society for
Minerals and Trace Elements (GMS) 19191919, 141-150.

Chapter 1
General introductionGeneral introductionGeneral introductionGeneral introduction
69
191. Drake EN (2006) Cancer chemoprevention: Selenium as a prooxidant, not an antioxidant. Medical Hypotheses 67676767, 318-322.
192. Lippman SM, Klein EA, Goodman PJ et al. (2009) Effect of selenium and vitamin E on risk of prostate cancer and other cancers: the Selenium and Vitamin E Cancer Prevention Trial (SELECT). Journal of the American Medical Association 301301301301, 39-51.
193. Chiang EC, Shen S, Kengeri SS et al. (2010) Defining the Optimal Selenium Dose for Prostate Cancer Risk Reduction: Insights from the U-Shaped Relationship between Selenium Status, DNA Damage, and Apoptosis. Dose-response 8888, 285-300.
194. Waters DJ, Shen S, Cooley DM et al. (2003) Effects of Dietary Selenium Supplementation on DNA Damage and Apoptosis in Canine Prostate. Journal of the National Cancer Institute 95959595, 237-241.
195. Steinbrenner H, Speckmann B, Sies H (2013) Toward Understanding Success and Failures in the Use of Selenium for Cancer Prevention. Antioxidants & Redox Signaling 19191919, 181-191.
196. Verma A, Atten MJ, Attar BM et al. (2004) Selenomethionine stimulates MAPK (ERK) phosphorylation, protein oxidation, and DNA synthesis in gastric cancer cells. Nutrition
and Cancer 49494949, 184-190. 197. Fritz H, Kennedy D, Fergusson D et al. (2011) Selenium and Lung Cancer: A Systematic
Review and Meta Analysis. PLoS ONE 6666, e26259. 198. Bulato C, Bosello V, Ursini F et al. (2007) Effect of mercury on selenium utilization and
selenoperoxidase activity in LNCaP cells. Free Radical Biology and Medicine 42424242, 118-123. 199. Falnoga I, Tušek-Žnidarič M (2007) Selenium–Mercury Interactions in Man and Animals.
Biological Trace Element Research 119119119119, 212-220. 200. Yang D-Y, Chen Y-W, Gunn JM et al. (2008) Selenium and mercury in organisms:
Interactions and mechanisms. Environmental Reviews 16161616, 71-92. 201. Wallenberg M, Olm E, Hebert C et al. (2010) Selenium compounds are substrates for
glutaredoxins: a novel pathway for selenium metabolism and a potential mechanism for selenium-mediated cytotoxicity. Biochemical Journal 429429429429, 85-93.
202. de Lorgeril M, Salen P, Accominotti M et al. (2001) Dietary and blood antioxidants in patients with chronic heart failure. Insights into the potential importance of selenium in heart failure. European Journal of Heart Failure 3333, 661-669.
203. Toufektsian M-C, Boucher F, Pucheu S et al. (2000) Effects of selenium deficiency on the response of cardiac tissue to ischemia and reperfusion. Toxicology 148148148148, 125-132.
204. de Lorgeril M, Salen P (2006) Selenium and antioxidant defenses as major mediators in the development of chronic heart failure. Heart Failure Reviews 11111111, 13-17.
205. Yoshida T, Maulik N, Engelman R et al. (1997) Glutathione peroxidase knockout mice are susceptible to myocardial ischemia reperfusion injury. Circulation 96969696, 216-220.
206. Yoshida T, Watanabe M, Engelman DT et al. (1996) Transgenic Mice Overexpressing Glutathione Peroxidase are Resistant to Myocardial Ischemia Reperfusion Injury. Journal
of Molecular and Cellular Cardiology 28282828, 1759-1767. 207. World C, Yamawaki H, Berk B (2006) Thioredoxin in the cardiovascular system. Journal of
Molecular Medicine 84848484, 997-1003. 208. Furman C, Rundlöf AK, Larigauderie G et al. (2004) Thioredoxin reductase 1 is upregulated
in atherosclerotic plaques: specific induction of the promoter in human macrophages by oxidized low-density lipoproteins. Free Radical Biology and Medicine 37373737, 71-85.
209. Conrad M, Jakupoglu C, Moreno SG et al. (2004) Essential Role for Mitochondrial Thioredoxin Reductase in Hematopoiesis, Heart Development, and Heart Function. Molecular and Cellular Biology 24242424, 9414-9423.
70 Chapter 1
General introductionGeneral introductionGeneral introductionGeneral introduction
210. Benstoem C, Goetzenich A, Kraemer S et al. (2015) Selenium and Its Supplementation in Cardiovascular Disease—What do We Know? Nutrients 7777, 3094-3118.
211. Tanguy S, Rakotovao A, Jouan M-G et al. (2011) Dietary selenium intake influences Cx43 dephosphorylation, TNF-α expression and cardiac remodeling after reperfused infarction. Molecular Nutrition & Food Research 55555555, 522-529.
212. Ago T, Sadoshima J (2006) Thioredoxin and Ventricular Remodeling. Journal of Molecular
and Cellular Cardiology 41414141, 762-773. 213. Schinner S, Scherbaum WA, Bornstein SR et al. (2005) Molecular mechanisms of insulin
resistance. Diabetic Medicine 22222222, 674-682. 214. Guptill L, Glickman L, Glickman N (2003) Time Trends and Risk Factors for Diabetes
Mellitus in Dogs: Analysis of Veterinary Medical Data Base Records (1970–1999). The
Veterinary Journal 165165165165, 240-247. 215. Steinbrenner H, Speckmann B, Pinto A et al. (2011) High selenium intake and increased
diabetes risk: experimental evidence for interplay between selenium and carbohydrate metabolism. Journal of Clinical Biochemistry and Nutrition 48484848, 40-45.
216. Roberts CK, Sindhu KK (2009) Oxidative stress and metabolic syndrome. Life Sciences 84848484, 705-712.
217. Stranges S, Marshall JR, Natarajan R et al. (2007) Effects of Long-Term Selenium Supplementation on the Incidence of Type 2 DiabetesA Randomized Trial. Annals of
Internal Medicine 147147147147, 217-223. 218. Beckett GJ, Arthur JR (2005) Selenium and endocrine systems. Journal of Endocrinology
184184184184, 455-465. 219. McNeill JH, Delgatty HLM, Battell ML (1991) Insulinlike Effects of Sodium Selenate in
Streptozocin-Induced Diabetic Rats. Diabetes 40404040, 1675-1678. 220. McClung JP, Roneker CA, Mu W et al. (2004) Development of insulin resistance and
obesity in mice overexpressing cellular glutathione peroxidase. Proceedings of the
National Academy of Sciences of the United States of America 101101101101, 8852-8857. 221. Nasr MA, Fedele MJ, Esser K et al. (2004) GPX-1 modulates Akt and p70S6K
phosphorylation and Gadd45 levels in MCF-7 cells. Free Radical Biology and Medicine 37373737, 187-195.
222. Mueller AS, Klomann SD, Wolf NM et al. (2008) Redox Regulation of Protein Tyrosine Phosphatase 1B by Manipulation of Dietary Selenium Affects the Triglyceride Concentration in Rat Liver. The Journal of Nutrition 138138138138, 2328-2336.
223. Cheng A, Dubé N, Gu F et al. (2002) Coordinated action of protein tyrosine phosphatases in insulin signal transduction. European Journal of Biochemistry 269269269269, 1050-1059.
224. Rayman MP, Pattison DJ (2008) Dietary manipulation in musculoskeletal conditions. Best
Practice & Research Clinical Rheumatology 22222222, 535-561. 225. Moreno-Reyes R, Suetens C, Mathieu F et al. (1998) Kashin–Beck Osteoarthropathy in
Rural Tibet in Relation to Selenium and Iodine Status. New England Journal of Medicine 339339339339, 1112-1120.
226. Ren FL, Guo X, Zhang RJ et al. (2007) Effects of selenium and iodine deficiency on bone, cartilage growth plate and chondrocyte differentiation in two generations of rats. Osteoarthritis and Cartilage 15151515, 1171-1177.
227. Schmid TM, Linsenmayer TF (1987) Type X Collagen. In Structure and Function of Collagen
Types, pp. 223-259 [RME Burgeson, editor]: Academic Press. 228. Kronenberg HM (2003) Developmental regulation of the growth plate. Nature 423423423423, 332-
336.

Chapter 1
General introductionGeneral introductionGeneral introductionGeneral introduction
71
229. Zerega B, Cermelli S, Bianco P et al. (1999) Parathyroid Hormone [PTH(1–34)] and Parathyroid Hormone–Related Protein [PTHrP(1–34)] Promote Reversion of Hypertrophic Chondrocytes to a Prehypertrophic Proliferating Phenotype and Prevent Terminal Differentiation of Osteoblast-like Cells. Journal of Bone and Mineral Research 14141414, 1281-1289.
230. Ebert R, Jakob F (2007) Selenium deficiency as a putative risk factor for osteoporosis. International Congress Series 1297129712971297, 158-164.
231. Kumar MS, Selvam R (2003) Supplementation of vitamin E and selenium prevents hyperoxaluria in experimental urolithic rats. Journal of Nutritional Biochemistry 14141414, 306-313.
232. Liu Y, Xu H, Zhong W et al. (2015) Organic Selenium Alleviated the Formation of Ethylene Glycol-Induced Calcium Oxalate Renal Calculi by Improving Osteopontin Expression and Antioxidant Capability in Dogs. Biological Trace Element Research, 1-9.
233. Osborne CA, Lulich JP, Kruger JM et al. (2008) Analysis of 451,891 Canine Uroliths, Feline Uroliths, and Feline Urethral Plugs from 1981 to 2007: Perspectives from the Minnesota Urolith Center. Veterinary Clinics of North America: Small Animal Practice 39393939, 183-197.
234. Selvam R (2002) Calcium oxalate stone disease: role of lipid peroxidation and antioxidants. Urological Research 30303030, 35-47.
235. Zentek J (2007) A changing landscape: the pet food market in Europe. http://en.engormix.com/MA-feed-machinery/formulation/articles/changing-landscape-pet-food-t423/p0.htm (accessed 13 July 2015).
236. National Research Council (2006) Nutrient requirements of dogs and cats. [Rev. ed, Animal
nutrition series. Washington D.C.: National Academies Press. 237. Aldrich G (2006) Rendered products in pet food. In Essential rendering All about the
animal by-product industry, pp. 159-177 [DL Meekers, editor]. Virginia: National Renderers Association.
238. Raghavan M, Glickman NW, Glickman LT (2006) The Effect of Ingredients in Dry Dog Foods on the Risk of Gastric Dilatation-Volvulus in Dogs. Journal of the American Animal Hospital
Association 42424242, 28-36. 239. Reilly C (2006) Selenium in foods. In Selenium in Food and Health, pp. 158-172. New York:
Springer Science & Business Media. 240. Handreck KA, Godwin KO (1970) Distribution in the sheep of selenium derived from 75Se-
labelled ruminal pellets. Australian Journal of Agricultural Research 21212121, 71-84. 241. Choe M (1987) Nutritional aspects of selenium. PhD thesis, University of Nebraska. 242. Hintze KJ, Lardy GP, Marchello MJ et al. (2002) Selenium Accumulation in Beef: Effect of
Dietary Selenium and Geographical Area of Animal Origin. Journal of Agricultural and Food
Chemistry 50505050, 3938-3942. 243. Mumma RO, Rashid KA, Shane BS et al. (1986) Toxic and protective constituents in pet
foods. American Journal of Veterinary Research 47474747, 1633-1637. 244. Simcock SE, Rutherfurd SM, Wester TJ et al. (2005) Total selenium concentrations in
canine and feline foods commercially available in New Zealand. New Zealand Veterinary
Journal 53535353, 1-5. 245. Rayman MP, Infante HG, Sargent M (2008) Food-chain selenium and human health:
spotlight on speciation. British Journal of Nutrition 100100100100, 238-253. 246. Bierla K, Dernovics M, Vacchina V et al. (2008) Determination of selenocysteine and
selenomethionine in edible animal tissues by 2D size-exclusion reversed-phase HPLC-ICP MS following carbamidomethylation and proteolytic extraction. Analytical and
Bioanalytical Chemistry 390390390390, 1789-1798.
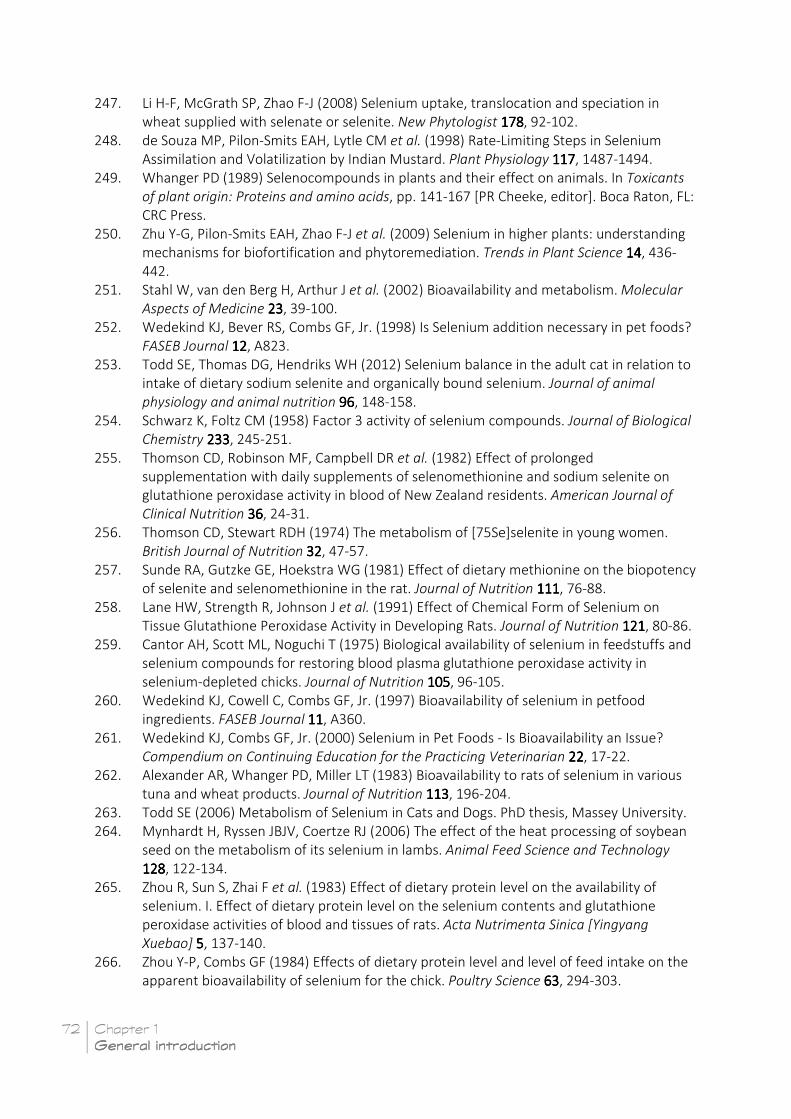
72 Chapter 1
General introductionGeneral introductionGeneral introductionGeneral introduction
247. Li H-F, McGrath SP, Zhao F-J (2008) Selenium uptake, translocation and speciation in wheat supplied with selenate or selenite. New Phytologist 178178178178, 92-102.
248. de Souza MP, Pilon-Smits EAH, Lytle CM et al. (1998) Rate-Limiting Steps in Selenium Assimilation and Volatilization by Indian Mustard. Plant Physiology 117117117117, 1487-1494.
249. Whanger PD (1989) Selenocompounds in plants and their effect on animals. In Toxicants
of plant origin: Proteins and amino acids, pp. 141-167 [PR Cheeke, editor]. Boca Raton, FL: CRC Press.
250. Zhu Y-G, Pilon-Smits EAH, Zhao F-J et al. (2009) Selenium in higher plants: understanding mechanisms for biofortification and phytoremediation. Trends in Plant Science 14141414, 436-442.
251. Stahl W, van den Berg H, Arthur J et al. (2002) Bioavailability and metabolism. Molecular
Aspects of Medicine 23232323, 39-100. 252. Wedekind KJ, Bever RS, Combs GF, Jr. (1998) Is Selenium addition necessary in pet foods?
FASEB Journal 12121212, A823. 253. Todd SE, Thomas DG, Hendriks WH (2012) Selenium balance in the adult cat in relation to
intake of dietary sodium selenite and organically bound selenium. Journal of animal
physiology and animal nutrition 96969696, 148-158. 254. Schwarz K, Foltz CM (1958) Factor 3 activity of selenium compounds. Journal of Biological
Chemistry 233233233233, 245-251. 255. Thomson CD, Robinson MF, Campbell DR et al. (1982) Effect of prolonged
supplementation with daily supplements of selenomethionine and sodium selenite on glutathione peroxidase activity in blood of New Zealand residents. American Journal of
Clinical Nutrition 36363636, 24-31. 256. Thomson CD, Stewart RDH (1974) The metabolism of [75Se]selenite in young women.
British Journal of Nutrition 32323232, 47-57. 257. Sunde RA, Gutzke GE, Hoekstra WG (1981) Effect of dietary methionine on the biopotency
of selenite and selenomethionine in the rat. Journal of Nutrition 111111111111, 76-88. 258. Lane HW, Strength R, Johnson J et al. (1991) Effect of Chemical Form of Selenium on
Tissue Glutathione Peroxidase Activity in Developing Rats. Journal of Nutrition 121121121121, 80-86. 259. Cantor AH, Scott ML, Noguchi T (1975) Biological availability of selenium in feedstuffs and
selenium compounds for restoring blood plasma glutathione peroxidase activity in selenium-depleted chicks. Journal of Nutrition 105105105105, 96-105.
260. Wedekind KJ, Cowell C, Combs GF, Jr. (1997) Bioavailability of selenium in petfood ingredients. FASEB Journal 11111111, A360.
261. Wedekind KJ, Combs GF, Jr. (2000) Selenium in Pet Foods - Is Bioavailability an Issue? Compendium on Continuing Education for the Practicing Veterinarian 22222222, 17-22.
262. Alexander AR, Whanger PD, Miller LT (1983) Bioavailability to rats of selenium in various tuna and wheat products. Journal of Nutrition 113113113113, 196-204.
263. Todd SE (2006) Metabolism of Selenium in Cats and Dogs. PhD thesis, Massey University. 264. Mynhardt H, Ryssen JBJV, Coertze RJ (2006) The effect of the heat processing of soybean
seed on the metabolism of its selenium in lambs. Animal Feed Science and Technology 128128128128, 122-134.
265. Zhou R, Sun S, Zhai F et al. (1983) Effect of dietary protein level on the availability of selenium. I. Effect of dietary protein level on the selenium contents and glutathione peroxidase activities of blood and tissues of rats. Acta Nutrimenta Sinica [Yingyang
Xuebao] 5555, 137-140. 266. Zhou Y-P, Combs GF (1984) Effects of dietary protein level and level of feed intake on the
apparent bioavailability of selenium for the chick. Poultry Science 63636363, 294-303.

Chapter 1
General introductionGeneral introductionGeneral introductionGeneral introduction
73
267. Waschulewski IH, Sunde RA (1988) Effect of dietary methionine on tissue selenium and glutathione peroxidase (EC 1.11.1.9) activity in rats given selenomethionine. British
Journal of Nutrition 60606060, 57-68. 268. Netto AS, Zanetti MA, Correa LB et al. (2014) Effects of dietary selenium, sulphur and
copper levels on selenium concentration in the serum and liver of lamb. Asian-
Australasian Journal of Animal Sciences 27272727, 1082-1087. 269. Mutanen ML, Mykkänen HM (1984) Effect of Dietary-Fat on Plasma Glutathione-
Peroxidase Levels and Intestinal-Absorption of 75Se-Labeled Sodium Selenite in Chicks. Journal of Nutrition 114114114114, 829-834.
270. Choe M, Kies C (1989) Selenium bioavailability: the effect of guar gum supplementation on selenium utilization by human subjects. Nutrition reports international 39393939, 557-565.
271. Combs GF, Jr., Pesti GM (1976) Influence of ascorbic acid on selenium nutrition in the chick. Journal of Nutrition 106106106106, 958-966.
272. Combs GF, Jr. (1976) Differential effects of high dietary levels of vitamin A on the vitamin E-selenium nutrition of young and adult chickens. Journal of Nutrition 106106106106, 967-975.
273. Combs GF, Scott ML (1974) Antioxidant effects on selenium and vitamin E function in the chick. Journal of Nutrition 104104104104, 1297-1303.
274. Yasumoto K, Iwami K, Yoshida M (1979) Vitamin B6 dependence of selenomethionine and selenite utilization for glutathione peroxidase in the rat. Journal of Nutrition 109109109109, 760-766.
275. Brady PS, Brady LJ, Parsons MJ et al. (1979) Effects of riboflavin deficiency on growth and glutathione peroxidase system enzymes in the baby pig. Journal of Nutrition 109109109109, 1615-1622.
276. Mutanen M, Mykkänen HM (1985) Effect of ascorbic acid supplementation on selenium bioavailability in humans. Human Nutrition Clinical Nutrition 39393939, 221-226.
277. Olin KL, Walter RM, Keen CL (1994) Copper deficiency affects selenoglutathione peroxidase and selenodeiodinase activities and antioxidant defense in weanling rats. American Journal of Clinical Nutrition 59595959, 654-658.
278. Fox TE, Van den Heuvel EGHM, Atherton CA et al. (2004) Bioavailability of selenium from fish, yeast and selenate: a comparative study in humans using stable isotopes. European
Journal of Clinical Nutrition 58585858, 343-349. 279. Combs Jr GF, Combs SB (1986) The biological availability of selenium in foods and feeds. In
The Role of Selenium in Nutrition, pp. 127-177. New York: Academic Press. 280. Rahman MS, Molla AH, Saha N et al. (2012) Study on heavy metals levels and its risk
assessment in some edible fishes from Bangshi River, Savar, Dhaka, Bangladesh. Food
Chemistry 134134134134, 1847-1854. 281. Young VR, Nahapetian A, Janghorbani M (1982) Selenium bioavailability with reference to
human nutrition. American Journal of Clinical Nutrition 35353535, 1076-1088. 282. Higgs DJ, Morris VC, Levander OA (1972) Effect of cooking on selenium content of foods.
Journal of Agricultural and Food Chemistry 20202020, 678-680. 283. Hendriks WH, Emmens MM, Trass B et al. (1999) Heat processing changes the protein
quality of canned cat foods as measured with a rat bioassay. Journal of Animal Science 77777777, 669-676.
284. Hullar I, Fekete S, Szöcs Z (1998) Effect of extrusion on the quality of soybean-based catfood. Journal of Animal Physiology and Animal Nutrition 80808080, 201-206.
285. Øverland M, Romarheim OH, Ahlstrøm Ø et al. (2007) Technical quality of dog food and salmon feed containing different bacterial protein sources and processed by different extrusion conditions. Animal Feed Science and Technology 134134134134, 124-139.

74 Chapter 1
General introductionGeneral introductionGeneral introductionGeneral introduction
286. Egaña JI, López A, Quezada Q (1991) The effect of extrusion on the acceptability and digestibility of diets for growing dogs. Archivos Latinoamericanos de Nutricion 41414141, 111-120.
287. Greger JL, Marcus RE (1981) Effect of dietary protein, phosphorus, and sulfur amino acids on selenium metabolism of adult males. Annals of Nutrition and Metabolism 25252525, 97-108.
288. Ganther HE, Baumann CA (1962) Selenium metabolism: II. Modifying effects of sulfate. Journal of Nutrition 77777777, 408-414.
289. Shen L, Van Dael P, Luten J et al. (1996) Estimation of selenium bioavailability from human, cow's, goat and sheep milk by an in vitro method. International Journal of Food
Sciences and Nutrition 47474747, 75-81. 290. Fairweather-Tait SJ (1997) Bioavailability of selenium. European Journal of Clinical
Nutrition 51515151, S20-S23. 291. Boisen S, Eggum BO (1991) Critical evaluation of in vitro methods for estimating
digestibility in simple-stomach animals. Nutrition research reviews 4444, 141-162. 292. Diez M, van Eenaeme C, Hornick JL et al. (1997) Dietary fibre in dogs diet: comparisons
between cellulose, pectin, guar gum, and between two incorporation rates of guar gum. Journal of Animal Physiology and Animal Nutrition 78787878, 220-229.
293. Diez M, Hornick JL, Baldwin P et al. (1998) The influence of sugar-beet fibre, guar gum and inulin on nutrient digestibility, water consumption and plasma metabolites in healthy Beagle dogs. Research in Veterinary Science 64646464, 91-96.
294. Lazo-de-la-Vega-Monroy M-L, Fernández-Mejía C (2013) Oxidative Stress in Diabetes Mellitus and the Role Of Vitamins with Antioxidant Actions. In Oxidative Stress and Chronic
Degenerative Diseases - A Role for Antioxidants, pp. 209-232 [JA Morales-Gonzalez, editor]. Rijeka: InTech.
295. Li X, Hill KE, Burk RF et al. (2001) Selenium spares ascorbate and alpha-tocopherol in cultured liver cell lines under oxidant stress. FEBS Letters 508508508508, 489-492.
296. Sunde RA, Thompson KM (2009) Dietary selenium requirements based on tissue selenium concentration and glutathione peroxidase activities in old female rats. Journal of Trace
Elements in Medicine and Biology 23232323, 132-137. 297. Sunde RA, Evenson JK, Thompson KM et al. (2005) Dietary Selenium Requirements Based
on Glutathione Peroxidase-1 Activity and mRNA Levels and Other Se-Dependent Parameters Are Not Increased by Pregnancy and Lactation in Rats. Journal of Nutrition 135135135135, 2144-2150.
298. FEDIAF (2014) Nutritional Guidelines for Complete and Complementary Pet Food for Cats
and Dogs. Brussels: European Pet Food Industry Federation. 299. Wedekind KJ, Kirk CA, Yu S et al. (2002) Defining the safe lower and upper limit for
selenium (Se) in adult dogs. FASEB Journal 15151515, A992-A993. 300. European Commission (2004) List of the authorised additives in feedingstuffs (1)
published in application of Article 9t (b) of Council Directive 70/524/EEC concerning additives in feedingstuffs. Official Journal of the European Union C 50C 50C 50C 50, 1-144.
301. European Union (2014) Register of Feed Additives, pursuant to Regulation (EC) No 1831/2003, pp. 1-201.
302. Wedekind KJ, Yu S, Combs GF, Jr. (2004) The selenium requirement of the puppy. Journal
of Animal Physiology and Animal Nutrition 88888888, 340-347. 303. Wedekind KJ, Kirk CA, Nachreiner RF et al. (2001) Effect of varying selenium (Se) intake on
thyroid hormone metabolism in dogs. FASEB Journal 15151515, A953.

Chapter 1
General introductionGeneral introductionGeneral introductionGeneral introduction
75
304. Yu S, Howard KA, Wedekind KJ et al. (2002) A low-selenium diet increases thyroxine and decreases 3,5,3'triiodothyronine in the plasma of kittens. Journal of Animal Physiology and
Animal Nutrition 86868686, 36-41. 305. Yu S, Wedekind KJ, Kirk CA et al. (2006) Primary hair growth in dogs depends on dietary
selenium concentrations. Journal of Animal Physiology and Animal Nutrition 90909090, 146-151. 306. Pilarczyk B, Tomza-Marciniak A, Pilarczyk R et al. (2013) Relationship between serum Se
concentration in dogs and incidence of some disease conditions. Central European Journal
of Biology 8888, 527-533. 307. Forrer R, Gautschi K, Lutz H (1991) Comparative determination of selenium in the serum
of various animal species and humans by means of electrothermal atomic absorption spectrometry. Journal of Trace Elements and Electrolytes in Health and Disease 5555, 101-113.
308. Biomarkers Definitions Working Group (2001) Biomarkers and surrogate endpoints: Preferred definitions and conceptual framework. Clinical Pharmacology and Therapeutics 69696969, 89-95.
309. Combs GF (2015) Biomarkers of Selenium Status. Nutrients 7777, 2209-2236. 310. Hojo Y (1981) Evaluation of the expression of urinary selenium level as ng Se/mg
creatinine and the use of single-void urine as a sample for urinary selenium determination. Bull Environm Contam Toxicol 27272727, 213-220.
311. Lees GE, Brown SA, Elliott J et al. (2005) Assessment and Management of Proteinuria in Dogs and Cats: 2004 ACVIM Forum Consensus Statement (Small Animal). Journal of
Veterinary Internal Medicine 19191919, 377-385. 312. LeVine DN, Zhang D, Harris T et al. (2010) The use of pooled vs serial urine samples to
measure urine protein:creatinine ratios. Veterinary Clinical Pathology 39393939, 53-56. 313. Gardner SY, Atkins CE, Rausch WP et al. (2007) Estimation of 24-h aldosterone secretion in
the dog using the urine aldosterone:Creatinine ratio. Journal of Veterinary Cardiology 9999, 1-7.
314. Longnecker MP, Stram DO, Taylor PR et al. (1996) Use of selenium concentration in whole blood, serum, toenails, or urine as a surrogate measure of selenium intake. Epidemiology 7777, 384-390.
315. Combs GF, Jr., Watts JC, Jackson MI et al. (2011) Determinants of Selenium Status in Healthy Adults. Nutrition journal 10101010, 75.
316. Rucker RB, Fascetti AJ, Keen CL (2008) Trace Minerals. In Clinical Biochemistry of Domestic
Animals (Sixth Edition), pp. 663-693 [JJKWHL Bruss, editor]. San Diego: Academic Press. 317. Brown KM, Pickard K, Nicol F et al. (2000) Effects of organic and inorganic selenium
supplementation on selenoenzyme activity in blood lymphocytes, granulocytes, platelets and erythrocytes. Clinical Science 99999999, 579-581.
318. Horvath PM, Ip C (1983) Synergistic Effect of Vitamin E and Selenium in the Chemoprevention of Mammary Carcinogenesis in Rats. Cancer Research 43434343, 5335-5341.
319. Glanemann C, Loos A, Gorret N et al. (2003) Disparity between changes in mRNA abundance and enzyme activity in Corynebacterium glutamicum:implications for DNA microarray analysis. Applied Microbiology and Biotechnology 61616161, 61-68.
320. Sunde RA (2010) mRNA transcripts as molecular biomarkers in medicine and nutrition. The
Journal of nutritional biochemistry 21212121, 665-670. 321. Evenson JK, Wheeler AD, Blake SM et al. (2004) Selenoprotein mRNA Is Expressed in Blood
at Levels Comparable to Major Tissues in Rats. Journal of Nutrition 134134134134, 2640-2645.

76 Chapter 1
General introductionGeneral introductionGeneral introductionGeneral introduction
322. Sunde RA, Raines AM, Barnes KM et al. (2009) Selenium status highly-regulates selenoprotein mRNA levels for only a subset of the selenoproteins in the selenoproteome. Bioscience Reports 29292929, 329-338.
323. Barnes KM, Evenson JK, Raines AM et al. (2009) Transcript analysis of the selenoproteome indicates that dietary selenium requirements of rats based on selenium-regulated selenoprotein mRNA levels are uniformly less than those based on glutathione peroxidase activity. Journal of Nutrition 139139139139, 199-206.

________
Scientific aims_____________________________________________________________________________________________________________
Chapter 2
Scientific aims _____________________________________________________________________________________________________


Chapter 2
Scientific aimsScientific aimsScientific aimsScientific aims
79
Selenium is an essential trace mineral in dogs and due to the many biological functions in
which it is involved via its selenoproteins, it is important to optimize Se intake in dogs. Acute
deficiencies and toxicities are rare in dogs. However, there is growing concern for the long-
term health effects, such as cancer, of Se over- and underfeeding in dogs. Bioavailability
and -activity are important indicators for the amount of Se that is available for the many
biological processes in which Se plays a role. The bioavailability and -activity of dietary Se
may be subject to many dietary factors, such as Se concentration and diet type. To
accurately assess the (potential) bioactivity of a diet and its effect on Se status, valid
biomarkers need to be determined. The current lack of a "gold-standard" assay method for
Se status in dogs makes it difficult to assess effects of Se status on long-term disease
development. In order to define accurate minimum recommendations on Se for dogs,
biomarkers that are sensitive to a change in Se status need to be determined.
The overarching objective of this PhD was to identify selected dietary factors that contribute
to the biological utilisation of dietary Se in dogs, by studying the following:
1. As a first step, the impact of a broad range of dietary factors will be assessed on
in vitro selenium accessibility.
2. The predominant factors resulting from this study will be used to determine their
effect on in vivo Se bioavailability and -activity.
3. To monitor selenium status, a large range of potential selenium biomarkers are
evaluated for their quickness of response.
The studies in this thesis will provide information on which factors contribute to the
bioavailability and -activity of selenium and how this can be measured. This is important to
provide a tool to determine long-term health effects in dogs.


In vitro seleniu _____________________________________________________________________________________________________________
Chapter 3
selenium accessibility in dog foo_____________________________________________________________________________________________________________
Chapter 3a
in dog foods _____________________________________________________________________________________________________________

"In vitro selenium accessibility in dog foods is affected by diet composition and type"
Mariëlle van Zelst1, Myriam Hesta1, Lucille G. Alexander2, Kerry Gray2, Guido Bosch3, Wouter
H. Hendriks3,4, Gijs Du Laing5, Bruno De Meulenaer6, Klara Goethals7, Geert P.J. Janssens1
1 Department of Animal Nutrition, Genetics and Ethology, Faculty of Veterinary Medicine, Ghent
University, Merelbeke, Belgium
2 WALTHAM® Centre for Pet Nutrition, Waltham-on-the-Wolds, Leicestershire, United Kingdom
3 Animal Nutrition Group, Department of Animal Sciences, Wageningen University, Wageningen,
the Netherlands
4 Department of Animal Nutrition, Faculty of Veterinary Medicine, Utrecht University, Utrecht, The
Netherlands
5 Department of Applied Analytical & Physical Chemistry, Faculty of Bioscience Engineering, Ghent
University, Ghent, Belgium
6 Department of Food Safety & Food Quality, Faculty of Bioscience Engineering, Ghent University,
Ghent, Belgium
7 Department of Comparative Physiology & Biometrics, Faculty of Veterinary Medicine, Ghent
University, Merelbeke, Belgium
Adapted from British Journal of Nutrition (2015) 113: 1888-1894.

Chapter 3a
In vitroIn vitroIn vitroIn vitro selenium accessibilityselenium accessibilityselenium accessibilityselenium accessibility
83
3a.1 Abstract
Selenium (Se) bioavailability in commercial pet foods has been shown to be highly variable.
The aim of this study was to identify dietary factors associated with in vitro accessibility of
Se (Se Aiv) in pet foods. Selenium Aiv is defined as the percentage of Se from the diet that is
potentially available for absorption after in vitro digestion. Sixty-two diets (dog, n=52; cat,
n=10) were in vitro enzymatically digested: 54 were commercially available (kibble, n=20;
pellet, n=8; canned, n=17; raw meat, n=6; steamed meat, n=3) and eight were unprocessed
(kibble, n=4; canned, n=4) from the same batch as the corresponding processed diets. The
effect of diet type, dietary protein, methionine, cysteine, lysine and Se content, DM, organic
matter (OM), and crude protein (CP) digestibility on Se Aiv was tested. Se Aiv differed
significantly among diet types (p<0.001). Canned and steamed meat diets had a lower Se
Aiv than pelleted and raw meat diets. Se Aiv correlated positively with CP digestibility in
extruded diets (kibbles, n=19; r= 0.540, p=0.017) and negatively in canned diets (n=16; r= -
0.611, p=0.012). Moreover, the canning process (n=4) decreased Se Aiv (p=0.001), whereas
extrusion (n=4) revealed no effect on Se Aiv (p=0.297). These differences in Se Aiv between
diet types warrant quantification of diet type effects on in vivo Se bioavailability.
3a.2 Introduction
Selenium (Se) is an essential micronutrient that is required by dogs and cats to sustain the
basic functions of life, such as antioxidant, immune, and thyroid functions(1). There is a large
variability in Se content within and between raw materials used in pet foods(2). For example
beef muscle contains on average 11.9 µg Se/MJ with a range of 6.6 - 22.0 µg Se/MJ and
whole grain wheat contains on average 1.7 µg Se/MJ, ranging between 0.8 and 4.6 µg
Se/MJ(2). Moreover, the bioavailable Se fraction, i.e. the Se fraction that reaches the systemic
circulation(3), can also vary considerably between raw ingredients and processed pet foods,
although information is limited. Wedekind et al.(4) used a chicken bioassay and found Se
bioavailability (BA) relative to the Na2SeO3 content of pet food ingredients ranged from 9%
in mackerel to 38% in beef spleen. These authors found Se BA in a canned dog and cat
food to be 25 and 17%, respectively. In subsequent studies, using the same methodology,
greater relative Se BAs of canned (30%) and dry pet foods (53%) were reported(5). Todd et
al.(6-7) reported the Se BA of two canned cat foods, as measured in Se balance studies in
adult cats, of 25.3 and 21.2%, respectively. The reason for these variable and often low
values is unknown.
There are several factors that might underlie the variation in Se BA. An important factor is
the chemical form of Se, with organic Se being absorbed in the intestine through active

84 Chapter 3a
In vitroIn vitroIn vitroIn vitro seleniumseleniumseleniumselenium accessibilityaccessibilityaccessibilityaccessibility
transport, whereas sodium selenite appears to be absorbed through diffusion(8). Due to
competition for absorption sites, sulphur and methionine can also influence Se absorption(3; 9).
Moreover, Se BA might also be affected by factors such as fibre content(10-14) and food
processing(15-16) due to their effect on overall nutrient digestibility. Dietary fat is another
potential factor since it correlates negatively with the concentration of Se containing
enzymes (Glutathione Peroxidase, GPx) in plasma of chickens(17), suggesting that dietary fat
reduces the intestinal transport of Se. In vitro, dietary fat is also negatively associated with
Se accessibility (Se Aiv) , i.e. the dietary Se fraction in the filtrate after in vitro digestion in
milk(18).
The aim of this study was to identify dietary factors that affect the Se Aiv in commercial pet
foods. Selenium Aiv was used as an estimate for Se BA. For this study, 62 pet foods were
selected based on their variability in nutrient content and diet type.
3a.3 Experimental Methods
3a.3.1 Diet selection
A set of 54 commercial (dog, n=44; cat, n=10) and 8 unprocessed pet foods were sourced to
meet a broad range of diet types (kibble [extruded], n=24; pellet [pressed], n=8; can [retorted],
n=21; meat, n=9, [6 raw/frozen and 3 steamed]) and nutrient composition (protein content,
mean 34.4% of DM, range 7.9-93.8%; fat content, mean 20.7% of DM, range 3.1-52.4%; and
fibre content, mean 4.0% of DM, range 0.7-13.2%). A broad range in nutrient composition
was achieved based on listing label information of the parameters mentioned above. A
small number of cat foods were included to broaden the range of dietary protein content.
The number of diets per diet type was chosen to reflect the market availability of these diet
types. Diet types differed by virtue of both their processing (heat and pressure treatment)
and raw ingredients (cereals, fresh meat products, meat and/or bone meal). As the majority
of pet food producers did not include Se content or speciation on the package or website,
this information was not available for diet selection. It is possible that diet types differ in
their typical amount and speciation of Se, but this was considered as an inherent trait of the
diet types.
In addition to the commercially available diets, eight standard recipes of unprocessed diets
(kibble, n=4; can, n=4) were included in the diet selection to assess the effect of processing.
The unprocessed diets came from the same batch as the corresponding commercially
available diet that was selected. Each of the 62 diets was analysed for DM, crude ash,
crude protein (CP, 6.25× nitrogen), crude fat (Cfat), sulphur (S), amino acid profile, total dietary

Chapter 3a
In vitroIn vitroIn vitroIn vitro selenium accessibilityselenium accessibilityselenium accessibilityselenium accessibility
85
fibre (TDF), gross energy (GE), and total selenium (Se) (methodologies as described in
"chemical analyses").
3a.3.2 Sample preparation
Dry diets were ground over a 1 mm sieve in a centrifugal mill (Retsch ZM200, Retsch GmbH,
Haan, Germany). The wet diets (canned and meat) were homogenised using a hand mixer
(Philips HR1561) and then frozen at -20°C until in vitro digestion. A portion of each wet diet
was also freeze dried and ground over a 1 mm sieve for chemical analyses.
3a.3.3 In vitro digestion
Stomach and small intestinal digestion were simulated using a modified procedure
described by Hervera et al.(19). The method consisted of a 2 h pepsin (2000 FIP U/g,
International Pharmaceutical Federation, expressed as micromoles of tyrosine equivalents
liberated per minute at 25°C, Merck art no. 7190) incubation step at a pH of 2.0 and a
second pancreatin (Porcine pancreas grade VI, Sigma no. p-1750) incubation step for 4 h at
a pH of 6.8. The method was scaled up tenfold to increase the amount of residue required
for chemical analyses. The amount of fresh matter required that equated to 10 g of DM (±
0.75) was calculated, to account for the different moisture contents of each diet. De-
mineralised water was added to all diets to achieve a moisture content of 85%. A hypoxic
environment was used by addition of CO2 for 30 seconds before every incubation step, to
prevent Se oxidation, which might have an influence on the Se Aiv(20-22). Glass covers were
placed over the beakers during incubation and pH was measured after every incubation
step. As dietary fat content may influence Se Aiv(18), samples were not defatted before
incubation, as was done in the original method, but 1.5 g bile extract (Sigma Porcine Bile
Extract B8631, Sigma Aldrich, St.Louis, MO, USA) was added to the small intestine incubation
step to mimic fat digestion. Type and amount of bile extract is based on publications of
Hedrén et al.(23), Clegg et al.(24), and Intawongse and Dean(25). Due to the larger amount of
sample, the filtration step as described by Hervera et al.(19) was not feasible. Filtration was
performed with a Büchner funnel and a nylon cloth, based on a method of Jha et al.(26),
resulting in a digested (filtrate) and undigested (residue) fraction.
The filtrates were stored at -20°C for total Se analysis. Residues were scraped from the cloth
and dried overnight in an oven at 70°C and stored at room temperature. Residues were
pooled per diet and ground to a powder before analyses for DM, crude ash, and CP. In
order to obtain at least 3 g of residue for analyses, in vitro digestion was repeated two to
nine times according to the digestibility of the diets. Diets with an in vitro DM digestibility

86 Chapter 3a
In vitroIn vitroIn vitroIn vitro seleniumseleniumseleniumselenium accessibilityaccessibilityaccessibilityaccessibility
higher than 97% were eliminated from the study, because more than ten repeats would
have been necessary. With every new batch of buffers, quality controls (blanks and one of
the pelleted study diets) were incubated for assessment of repeatability between runs. The
CV for DM digestibility over the incubation runs was 0.5%. Diet filtrates were corrected for
total Se in the blank filtrates (2.31 µg/l, only containing de-mineralised water, buffers, pepsin,
pancreatin and bile solutions).
Table 3a.1 Chemical composition (g/100g DM, except where specified), gross energy content
(MJ/kg DM) and in vitro digestibility (%) of pet foods (n=60) per diet type
Kibble
(n=23)†
Pellet
(n=8)
Canned
(n=20)†
Raw Meat
(n=6)
Steamed
Meat (n=3)
Component Mean SD Mean SD Mean SD Mean SD Mean SD
DM (g/100 g as is) 92.3 1.4 90.7 0.7 24.6 7.6 35.4 3.1 27.3 4.1
Crude ash 7.5 1.8 7.6 1.4 8.9 3.0 6.9 2.5 11.2 1.1
Crude protein (N×6.25) 30.9 11.4 24.1 5.0 42.6 17.8 38.0 4.2 45.6 5.0
Lysine 1.5 0.7 1.2 0.5 2.4 1.4 2.3 0.3 3.3 0.5
Methionine 0.5 0.2 0.3 0.2 0.9 0.5 0.8 0.1 1.1 0.2
Cysteine 2.9 1.0 2.3 0.6 4.3 1.8 4.4 0.4 5.6 1.2
Crude fat 14.6 4.9 13.1 2.8 20.9 7.7 39.1 3.5 36.6 3.9
Total dietary fibre 12.6 4.8 13.1 5.7 10.5 3.6 13.6 4.5 11.3 0.8
Sulphur (mg/100 g DM) 8.0 3.0 6.1 1.9 2.6 1.2 2.8 0.7 2.7 0.4
Selenium (µg/100 g DM) 47.6 24.7 39.0 15.3 81.1 66.0 461.4 562.9 36.9 4.6
Gross energy 21.2 1.2 20.4 0.8 23.3 1.7 27.6 1.1 26.2 0.8
DM digestibility 87.8 5.7 87.0 5.8 91.4 2.6 82.8 5.3 87.1 2.1
OM digestibility 87.8 5.8 87.3 5.6 91.7 2.7 83.1 5.5 87.8 2.3
CP digestibility 93.0 3.9 93.3 2.1 95.9 2.1 92.1 3.1 96.4 0.4
DM, dry matter; MJ, megajoule; SD, standard deviation; N, nitrogen; OM, organic matter; CP, crude
protein
† Including 4 unprocessed diets
3a.3.4 Chemical analyses
Diet sample preparation for total Se analysis was adapted from Lavu et al.(27). Diets were
prepared Filtrates resulting from the in vitro digestion were pooled per sample and
transferred into a 20 ml centrifuge tube. Samples were centrifuged for 10 min at 10,000 ×g
(Sorvall RC-5B Refrigerated Superspeed Centrifuge, SA-600 rotor). Supernatants were

Chapter 3a
In vitroIn vitroIn vitroIn vitro selenium accessibilityselenium accessibilityselenium accessibilityselenium accessibility
87
pipetted into 1.5 ml Eppendorf tubes and stored at -20°C until analysis. Samples were
analysed for total Se using inductively coupled plasma-MS (ICP-MS, Elan DRC-e, PerkinElmer,
Waltham, MA, USA), as described by Lavu et al.(27). Spikes with Certipur® selenium standard
solution (SeO2 in HNO3, 1000 mg Se/l, Merck art no. 119796) at a concentration of 200 or
400 µg/l were added as a quality control to 4 samples before and 3 samples after
microwave destruction. Selenium recoveries of 87.7% (standard deviation, SD 1.1%) and
82.6% (SD 4.5%) were obtained when spikes were added after or before microwave
destruction, respectively.
Diets and residues were analysed in duplicate for DM and crude ash by drying to a
constant weight at 103°C and combusting at 550°C, respectively. The Kjeldahl method (ISO
5983-1, 2005)(28) was used to determine CP (6.25× nitrogen). Crude fat in the diets was
assayed according to the Berntrop-method (ISO 6492, 1999)(29) and GE was analysed by
bomb calorimetry. The microwave digests prepared for Se analyses in diets, were also
analysed for S using inductively coupled plasma-optical emission spectrometry (ICP-OES, Iris
intrepid II XSP, Thermo Fisher Scientific Inc., Waltham, MA, USA) according to ISO 11885
(2007)(30). Diets were defatted by fat extraction with petroleum ether and extracted in line
with the procedure of the Commission Directive (98/64/EC)(31) for amino acid analyses; an
HPLC method was used (Agilent 1100; Fluorescence Detector; ZORBAX eclipse AAA Rapid
Resolution 4.6 × 150 mm, 3.5 micron column, PN 963400-902, Agilent Technologies, Santa
Clara, USA) according to the method of Henderson et al.(32). TDF analyses were performed
using the enzymatic-gravimetric method described by Prosky et al. (AOAC 985.29)(33).
3a.3.5 Calculations
Se Aiv was calculated with the following formula:
SeAiv�%
=Seinthe�iltrate�μ g L⁄ × [dilutionduring������ digestion �ml 1000]⁄
sampleweighedinfor������ digestion�gDM × 100Seinthediet�μg/gDM,
Digestibility coefficients were calculated with the formulae:
DMdigestibility�% = 100 −residue�gDM × 100
sampleweighedinfor������ digestion�gDM
Organicmatter�OMdigestibility�%
= 100 −residue�gDM × �100 − ashinresidue �%DM 100⁄ × 100
sampleweighedinfor������ digestion�gDM × [100 − ashinthediet �%DM 100⁄ ]
88 Chapter 3a
In vitroIn vitroIn vitroIn vitro seleniumseleniumseleniumselenium accessibilityaccessibilityaccessibilityaccessibility
CPdigestibility�% = 100 − CPintheresidue�gDM × 100CPinsampleweighedinfor������ digestion�gDM
3a.3.6 Statistical analyses
Data were analysed using the Statistical Analysis System (SAS) version 9.3 for Windows (SAS
Institute Inc., Cary, NC). Data were initially screened for linearity, normality, outliers and
homogeneity of variance. The effect of diet type on Se Aiv was analysed using analysis of
variance (proc glm). Pairwise comparisons between diet types were tested at a total
significance level of 0.05 using the Tukey-Kramer adjustment for multiple comparisons. The
effect of the variables GE, CP, Fat, TDF, S, Se, lysine (Lys), cysteine (Cys), and methionine
(Met) of the diets, and calculated variables CP (g/MJ), Met/CP, Met (g/MJ), Cys/CP, Cys (g/MJ),
Lys/CP, Lys (g/MJ), Se (µg/MJ), DM digestibility, OM digestibility, and CP digestibility on Se
Aiv was analysed, per diet type, using regression (proc reg). The effect of processing was
analysed with a paired Student's t-test. In all cases statistical significance was evaluated at
p≤0.05.
Table 3a.2 In vitro selenium accessibility of pet foods (%) per diet type
Range
Diet type n mean min max SD
Kibble† 19 72a,b 37 97 17
Pellet 8 79a 62 101 13
Canned† 16 58b 29 91 16
Raw Meat 6 91a 79 98 23
Steamed Meat 3 47b 39 54 8
n, number of animals; min, minimum; max, maximum; SD, standard deviation
a,b Groups with a common letter in superscript do not significantly differ
† Unprocessed diets are not included in the data
3a.4 Results
One commercial canned diet and one commercial extruded diet were eliminated for further
analyses based on an in vitro DM digestibility >97%. The inter-assay CV for DM
digestibility over the incubation runs was 0.5%. pH remained constant within each
incubation step. Total Se in the blank samples was on average 2.31 µg/l, which was used to
correct Se in filtrates. Selenium analyses had a recovery of 87.7% as measured using spiked

Chapter 3a
In vitroIn vitroIn vitroIn vitro selenium accessibilityselenium accessibilityselenium accessibilityselenium accessibility
89
Figure 3a.1 Correlations (r) between in vitro selenium accessibility (%) and
crude protein digestibility (%) of pet foods
Solid trend line, all diets (n=52); dotted trend line and ♦, kibble (n=19); ƒ, pellet (n=8);
striped trend line and ∆, canned (n=16); o, raw meat (n=6); X, steamed meat (n=3).
Values with an asterisk show a significant correlation (p<0.05). Unprocessed diets are
not included in the data.
samples after microwave destruction and 82.6% when samples were spiked before
microwave destruction.
Table 3a.1 provides an overview of the chemical composition and digestibility results of the
diets per diet type. The high variation in CP, Cfat and TDF reflect the diet selection criteria.
The large range in Se content of the diets was mainly due to two high values from raw
meat diets (1173.2 and 1195.5 µg/100 g DM), which also increased the mean value over all
diets (98.4 µg/100 g DM, results not shown). The median for dietary Se over all diets was
44.8 µg/100 g DM (results not shown).
Selenium Aiv differed among diet types (p< 0.001) (Table 3a.2). Canned and steamed meat
diets had lower Se Aiv than pelleted and raw meat diets. Within all diet types, a large range
of Se Aiv was found, but the range was largest for kibble and canned diets. There was no
significant correlation between Se Aiv and CP digestibility when all diet types were pooled
(Figure 3a.1: r= -0.095, p= 0.504). However, when diet type was considered, there was a
positive correlation between Se Aiv and in vitro CP digestibility within the kibble diets (r=
0.540, p= 0.017) versus a negative correlation within the canned diets (r= -0.611, p= 0.012).
r = - 0.095all diets
r = 0.540*kibble
r = - 0.611*canned
0
20
40
60
80
100
120
80 85 90 95 100 105
In v
itro
sele
niu
m a
ccess
ibili
ty (%
)
Crude protein digestibility (%)

90 Chapter 3a
In vitroIn vitroIn vitroIn vitro seleniumseleniumseleniumselenium accessibilityaccessibilityaccessibilityaccessibility
Figure 3a.2 Correlations (r) between in vitro selenium accessibility (%) and parameters of
canned (black bars, n=16) and kibble (grey bars, n=19) diets in g/100g DM, except where
specified
dig, digestibility; MJ, megajoule. Asterisks indicate the level of significance: * p<0.05, **p<0.001.
Unprocessed diets are not included in the data.
Selenium Aiv was not significantly correlated to any of the measured parameters in the
pelleted diets. Raw meat diets showed a negative correlation between the amount of Se in
the diet and the Se Aiv (in µg/g DM: r = -0.823, p= 0.044; in µg/MJ: r = -0.843, p= 0.035). For the
steamed meat diets a positive correlation was found between Se Aiv and the amount of
cysteine per MJ (r = 0.999, p= 0.012). The correlations for the canned and kibble diets are
displayed in Figure 3a.2. Among the kibble diets a negative correlation was found between
Se Aiv and dietary CP, Lys, Cys, Met, S, ash, CP/MJ, Cys/MJ, and Lys/MJ. In canned diets Se
Aiv was negatively correlated with dietary TDF.
The extrusion process did not affect Se Aiv (p=0.297, Table 3a.3). In contrast, retorting almost
halved Se Aiv (p=0.001). Dietary Se concentrations did not differ before and after processing
(canned p=0.863, kibble p=0.335; results not shown). In the canned diets, the S content was
higher before processing (p=0.028) and the TDF content tended to be higher after
processing (p=0.085).
-0.061
0.187
-0.258
-0.548*
0.038
-0.063
-0.054
-0.071
0.245
0.230
-0.382
0.102
0.086
-0.272
0.174
0.161
0.389
0.363
-0.169
-0.205
-0.422
-0.545*
-0.052
-0.016
-0.479*
-0.056
-0.100
0.237
-0.443
-0.480*
0.261
-0.749**
-0.765**
-0.077
-0.808**
-0.802**
-0.752**
-0.769**
0.317
0.288
-1.0 -0.8 -0.6 -0.4 -0.2 0.0 0.2 0.4 0.6
Gross energy (MJ/kg DM)
Crude ash
Crude fat
Total dietary fibre
Sulphur (mg/100g DM)
Se (µg/MJ)
Se (µg/g DM)
Met/Crude protein
Met (g/MJ)
Met
Cys/Crude protein
Cys (g/MJ)
Cys
Lys/Crude protein
Lys (g/MJ)
Lys
Crude protein (g/MJ)
Crude protein
Organic matter dig (%)
Dry matter dig (%)
Correlation (r) with in vitro selenium accessibility

Chapter 3a
In vitroIn vitroIn vitroIn vitro selenium accessibilityselenium accessibilityselenium accessibilityselenium accessibility
91
Table 3a.3 In vitro selenium accessibility (%) in processed versus
unprocessed canned and kibble diets
Range
Diet category n mean min max SD p*
Unprocessed kibble 4 60 53 68 8 0.297
Processed kibble 4 67 52 77 11
Unprocessed canned 4 102 83 112 13 0.001
Processed canned 4 53 29 67 17
n, number of animals; min, minimum; max, maximum; SD, standard deviation * p-value from paired Student's t-test
3a.5 Discussion
To verify the factors that may contribute to the Se BA of pet foods, this study examined a
large range of commercially available pet foods differing in diet type and protein, fat, and
fibre content. There was a clear difference in Se Aiv between diet types (canned and
steamed meat Se Aiv < pellet and raw meat Se Aiv) which may have been due to the way
the diets were processed. A number of factors that influence the processing of pet foods
may have contributed to the observed variation such as time, temperature, pressure and
shear. Typically, raw meat diets and pelleted diets, which undergo no or relatively low heat
treatment, showed a higher Se Aiv (91 and 79%, respectively) compared to steamed meat
and canned diets (47 and 58%, respectively). These findings suggest a negative effect of
heat processing on Se accessibility. This is in accordance with findings of Todd(16), who
found that non-processed inorganic Se in canned diets had a higher apparent Se
absorption in cats (83.3%) than processed inorganic Se (53.7%)(16). Canned diets had a
higher Se Aiv before, compared to after processing, which also indicates an effect of
processing on Se Aiv, which was not demonstrated in the kibble diets. The differences in the
effect of processing on Se Aiv between canned and kibble diets may be due to variations
in Maillard reactions caused by the different processing types. In the baking process, some
Se may be lost because the Maillard reaction of SeMet and glucose yields volatile
seleniferous compounds(34). This did not appear to have a major influence on total Se in this
study because total dietary Se did not differ before and after processing. Processing did
decrease the S content in canned diets, which might be due to the conversion of dietary S
to volatile compounds and volatilisation after opening the processed cans. Another possible
effect in heat processed diets is that cross-linkages between amino acids, within and

92 Chapter 3a
In vitroIn vitroIn vitroIn vitro seleniumseleniumseleniumselenium accessibilityaccessibilityaccessibilityaccessibility
between proteins occur. Cross-linking reduces the rate of protein digestion by preventing
enzyme penetration or by masking the sites of enzyme attack(35). Cysteine seems to be one
of the most susceptible amino acids for cross-linking(36), by which Se linked to Cys might be
less available for digestion.
Hendriks et al.(15) showed that heat processing a cat food at 121°C for 80-120 minutes did
not destroy amino acids, but that it did decrease ileal apparent digestibility of the diet. In
this study, there was no impact on CP digestibility when comparing the same diets pre- and
post-processing. However, the effect of CP digestibility on Se Aiv differed between canned
and kibble diets. In kibble diets, there was a positive relationship between CP digestibility
and Se Aiv. This may indicate that when more protein is digested, more protein bound-Se
becomes available. Similar findings were reported by Shen et al. in milk products(18).
Interestingly, the opposite effect was found for canned diets. The lack of correlation
between Se Aiv and Cys, Met and Lys suggests that they are not an explanation for the
negative correlation between CP digestibility and Se Aiv in canned diets. Therefore, this
correlation is likely due to a factor that was not accounted for in this study.
The source of TDF in the canned diets could play a role in Se Aiv, because fibre is known
to reduce nutrient digestibility(10-14). Total dietary fibre in canned diets in the present study
was negatively correlated with Se Aiv and tended to be increased in canned diets after
processing compared to TDF in unprocessed diets (p=0.085). Azizah and Zainon(37) also found
an increase in TDF after roasting wheat, rice, mung beans and soya beans at 80°C for 5
min. During heat treatment, fibre-protein complexes can be formed(38) which might be the
cause for the negative impact on Se Aiv and the tended increase in TDF. A particular TDF
component that is commonly used in canned diets is the soluble non-starch polysaccharide
guar gum. Guar gum increases viscosity and has been shown to decrease the digestibility
of protein in diets in cats(39) and dogs(40), which can be an additional explanation for the
negative relationship between TDF and Se Aiv in canned diets, because protein bound-Se
may then not become available. Choe and Kies(41) reported an increase in faecal Se
excretion by 14% and a decreased Se balance (53%) and whole blood GPx activity (9%) in
humans when guar gum was supplemented to a standardised diet, although, in their study
both Se and guar gum where not processed.
The difference in Se Aiv between the diet types might also be explained by a difference in
the raw materials that are used in their manufacture, and consequently, the Se species in
the diets. Supplemental Se in the form of sodium selenite or sodium selenate is commonly
employed in dry pet foods (pellet and kibble), whereas, in canned diets Se is mainly present
in the form of SeMet from raw materials. Furthermore, reactions of sodium selenite with other

Chapter 3a
In vitroIn vitroIn vitroIn vitro selenium accessibilityselenium accessibilityselenium accessibilityselenium accessibility
93
components during storage may change its speciation, possibly to elemental Se(42). Due to
detection limit issues, Se speciation was not analysed in this study, however it may have an
effect on the Se BA(6; 20-22; 43).
Finally, the very high Se content in two of the raw meat diets could be due to the type of
raw materials used. Tissues with a high rate of protein synthesis such as erythrocytes,
skeletal muscle, pancreas, liver and kidney generally contain high amounts of Se(44).
This study aimed to identify factors that influence Se Aiv. It is possible that in vitro Se Aiv
from the pet foods in this study may differ quantitatively from what may be found in vivo.
Hervera et al.(45) confirmed that apparent in vivo CP digestibility is lower than when
measured in vitro. The current European recommended allowance (RA) set by the European
Pet Food Industry Federation (FEDIAF)(46) and the adequate intake of the National Research
Council (NRC)(1) for Se in dogs and cats only take into account a fixed Se BA percentage,
despite the large number of factors that influence the BA. The Association of American
Feed Control Officials (AAFCO)(47) do not give any information on which bioavailability
factor they have used for the RA of Se in pet foods. The results of this study can be used to
help design in vivo studies to confirm and quantify the impact of diet composition and type
on Se Aiv found in this study. This may enable the pet food industry to formulate diets that
meet canine Se requirements by taking into account the Se BA for each specific diet type.
3a.6 Conclusions
This study reported that diet type and processing affect Se Aiv. Among other factors, crude
protein digestibility is positively correlated with Se Aiv in kibble diets, but negatively in
canned diets. Retorting strongly decreased Se Aiv. In vivo work is warranted to confirm
these in vitro data and to verify if recommendations of Se inclusion levels in complete and
balanced diets need to take such factors into account.
3a.7 Acknowledgements
Special thanks to Joachim Neri of the Department of Applied Analytical and Physical
Chemistry at the Faculty of Bioscience Engineering of Ghent University for total Se analyses
and Sofie Coelus of the Department of Food Safety and Food Quality at the Faculty of
Bioscience Engineering of Ghent University for assistance during amino acid analyses.
3a.8 References
1. National Research Council (2006) Nutrient requirements of dogs and cats. [Rev. ed, Animal
nutrition series. Washington D.C.: National Academies Press.

94 Chapter 3a
In vitroIn vitroIn vitroIn vitro seleniumseleniumseleniumselenium accessibilityaccessibilityaccessibilityaccessibility
2. Souci SW, Fachmann W, Kraut H (2008) Food Composition and Nutrition Tables. vol. 7th revised and completed edition. Stuttgart: MedPharm Scientific Publishers.
3. Stahl W, van den Berg H, Arthur J et al. (2002) Bioavailability and metabolism. Molecular
Aspects of Medicine 23232323, 39-100. 4. Wedekind KJ, Cowell C, Combs GF, Jr. (1997) Bioavailability of selenium in petfood
ingredients. FASEB Journal 11111111, A360. 5. Wedekind KJ, Bever RS, Combs GF, Jr. (1998) Is Selenium addition necessary in pet foods?
FASEB Journal 12121212, A823. 6. Todd SE, Thomas DG, Bosch G et al. (2012) Selenium status in adult cats and dogs fed high
levels of dietary inorganic and organic selenium. Journal of Animal Science 90909090, 2549-2555. 7. Todd SE, Thomas DG, Hendriks WH (2011) Selenium balance in the adult cat in relation to
intake of dietary sodium selenite and organically bound selenium. Journal of Animal
Physiology and Animal Nutrition 96969696, 148-158. 8. Reasbeck PG, Barbezat GO, Weber FL et al. (1985) Selenium absorption by canine
jejunum. Digestive Diseases and Sciences 30303030, 489-494. 9. Wolffram S, Berger B, Grenacher B et al. (1989) Transport of selenoamino acids and their
sulfur analogues across the intestinal brush border membrane of pigs. Journal of Nutrition 119119119119, 706-712.
10. Reeves PG, Leary PD, Gregoire BR et al. (2005) Selenium bioavailability from buckwheat bran in rats fed a modified AIN-93G torula yeast-based diet. Journal of Nutrition 135135135135, 2627-2633.
11. Muir HE, Murray SM, Fahey GC et al. (1996) Nutrient digestion by ileal cannulated dogs as affected by dietary fibers with various fermentation characteristics. Journal of Animal
Science 74747474, 1641-1648. 12. Fairweather-Tait SJ (1997) Bioavailability of selenium. European Journal of Clinical
Nutrition 51515151, S20-S23. 13. Silvio J, Harmon DL, Gross KL et al. (2000) Influence of fiber fermentability on nutrient
digestion in the dog. Nutrition 16161616, 289-295. 14. Smits CHM, Veldman A, Verstegen MWA et al. (1997) Dietary Carboxymethylcellulose with
High Instead of Low Viscosity Reduces Macronutrient Digestion in Broiler Chickens. Journal of Nutrition 127127127127, 483-487.
15. Hendriks WH, Emmens MM, Trass B et al. (1999) Heat processing changes the protein quality of canned cat foods as measured with a rat bioassay. Journal of Animal Science 77777777, 669-676.
16. Todd SE (2006) Metabolism of Selenium in Cats and Dogs. PhD thesis, Massey University. 17. Mutanen ML, Mykkänen HM (1984) Effect of Dietary-Fat on Plasma Glutathione-
Peroxidase Levels and Intestinal-Absorption of 75Se-Labeled Sodium Selenite in Chicks. Journal of Nutrition 114114114114, 829-834.
18. Shen L, Van Dael P, Luten J et al. (1996) Estimation of selenium bioavailability from human, cow's, goat and sheep milk by an in vitro method. International Journal of Food
Sciences and Nutrition 47474747, 75-81. 19. Hervera M, Baucells MD, Blanch F et al. (2007) Prediction of digestible energy content of
extruded dog food by in vitro analyses. Journal of Animal Physiology and Animal Nutrition 91919191, 205-209.
20. Swanson CA, Patterson BH, Levander OA et al. (1991) Human [74Se] selenomethionine metabolism: A kinetic model. American Journal of Clinical Nutrition 54545454, 917-926.

Chapter 3a
In vitroIn vitroIn vitroIn vitro selenium accessibilityselenium accessibilityselenium accessibilityselenium accessibility
95
21. Thomson CD, Robinson MF (1986) Urinary and fecal excretions and absorption of a large supplement of selenium: superiority of selenate over selenite. American Journal of Clinical
Nutrition 44444444, 659-663. 22. Young VR, Nahapetian A, Janghorbani M (1982) Selenium bioavailability with reference to
human nutrition. American Journal of Clinical Nutrition 35353535, 1076-1088. 23. Hedrén E, Diaz V, Svanberg U (2002) Estimation of carotenoid accessibility from carrots
determined by an in vitro digestion method. European Journal of Clinical Nutrition 56565656, 425-430.
24. Clegg ME, Thondre PS, Henry CJK (2011) Increasing the fat content of pancakes augments the digestibility of starch in-vitro. Food Research International 44444444, 636-641.
25. Intawongse M, Dean JR (2008) Use of the physiologically-based extraction test to assess the oral bioaccessibility of metals in vegetable plants grown in contaminated soil. Environmental pollution 152152152152, 60-72.
26. Jha R, Bindelle J, Van Kessel A et al. (2010) In vitro fibre fermentation of feed ingredients with varying fermentable carbohydrate and protein levels and protein synthesis by colonic bacteria isolated from pigs. Animal Feed Science and Technology 165165165165, 191-200.
27. Lavu RVS, Willekens K, Vandecasteele B et al. (2012) Fertilizing soil with Selenium fertilizers: impact on concentration, speciation and bioaccessibility of Selenium in leek (Allium ampeloprasum). Journal of Agricultural and Food Chemistry 60606060, 10930-10935.
28. ISO (2005) Animal Feeding Stuffs - Determination of nitrogen content and calculation of
crude protein content - Part 1: Kjeldahl method (ISO 5983-1). Geneva, Switzerland: International Organization for Standardization.
29. ISO (1999) Animal Feeding Stuffs - Determination of fat content (ISO 6492). Geneva, Switzerland: International Organization for Standardization.
30. ISO (2007) Determination of selected elements by inductively coupled plasma optical
emission spectrometry (ICP-OES, ISO 11885). Geneva, Switzerland: International Organization for Standardization.
31. Commission Directive (1998) Establishing Community methods of analysis for the determination of aminoacids, crude oils and fats, and olaquindox in feedingstuffs and amending, Directive 71/393/EEC. Official Journal of the European Communities L 257L 257L 257L 257, 14-28.
32. Henderson JW, Ricker RD, Bidlingmeyer BA et al. (2000) Rapid, acurate, sensitive and reproducible HPLC analysis of amino acids. In Application note 5980-1193E: Agilent Technologies.
33. Prosky L, Asp NG, Furda I et al. (1985) Determination of Total Dietary Fiber in Foods and Food Products - Collaborative Study. Journal of the Association of Official Analytical
Chemists 68686868, 677-679. 34. Tsai JD, Hiserodt RD, Ho CT et al. (1998) Determination of Volatile Organic Selenium
Compounds from the Maillard Reaction in a Selenomethionine-Glucose Model System. Journal of Agricultural and Food Chemistry 46464646, 2541-2545.
35. Hurrel RF, Finot PA (1985) Effects of food processing on protein digestibility and amino acid availability. In Digestibility an Amino Acid Availability in Cereals and Oilseeds, pp. 233-246 [JW Finley and DT Hopkins, editors]. St. Paul, MN: American Association of Cereal Chemists.
36. Singh H (1991) Modification of food proteins by covalent crosslinking. Trends in Food
Science & Technology 2222, 196-200. 37. Azizah AH, Zainon H (1997) Effect of processing on dietary fiber contents of selected
legumes and cereals. Malaysian Journal of Nutrition 3333, 131-136.

96 Chapter 3a
In vitroIn vitroIn vitroIn vitro seleniumseleniumseleniumselenium accessibilityaccessibilityaccessibilityaccessibility
38. Dhingra D, Michael M, Rajput H et al. (2012) Dietary fibre in foods: a review. Journal of
Food Science and Technology 49494949, 255-266. 39. Harper EJ, Siever-Kelly C (1997) The Effect of Fibre on Nutrient Availability in Cats of
Different Ages. Recent Advances in Animal Nutrition in Australia, 110-116. 40. Diez M, Hornick JL, Baldwin P et al. (1998) The influence of sugar-beet fibre, guar gum and
inulin on nutrient digestibility, water consumption and plasma metabolites in healthy Beagle dogs. Research in Veterinary Science 64646464, 91-96.
41. Choe M, Kies C (1989) Selenium bioavailability: the effect of guar gum supplementation on selenium utilization by human subjects. Nutrition reports international 39393939, 557-565.
42. Stadlober M, Sager M, Irgolic KJ (2001) Identification and quantification of selenium compounds in sodium selenite supplemented feed by HPLC-ICP-MS. Die Bodenkultur 52525252, 233-241.
43. Todd SE, Thomas DG, Hendriks WH (2012) Selenium balance in the adult cat in relation to intake of dietary sodium selenite and organically bound selenium. Journal of animal
physiology and animal nutrition 96969696, 148-158. 44. Schrauzer GN (2000) Selenomethionine : A Review of Its Nutritional Significance ,
Metabolism and Toxicity. Journal of Nutrition 130130130130, 1653-1656. 45. Hervera M, Baucells MD, González G et al. (2009) Prediction of digestible protein content
of dry extruded dog foods: comparison of methods. Journal of Animal Physiology and
Animal Nutrition 93939393, 366-372. 46. FEDIAF (2013) Nutritional Guidelines for Complete and Complementary Pet Food for Cats
and Dogs. Brussels: European Pet Food Industry Federation. 47. AAFCO (2013) Official publication of the Association of American Feed Control Officials.
Champaign, IL, USA: AAFCO Inc.

Predictive equations ofselenium
___________________________________________________
Chapter 3b
Predictive equations ofselenium accessibility in dry pet foods
_____________________________________________________________________________________________________________
Chapter 3b
Predictive equations of in vitro dry pet foods
__________________________________________________________

"Predictive equations of selenium accessibility in dry pet foods"
Mariëlle van Zelst1, Myriam Hesta1, Kerry Gray2, Klara Goethals3, Geert P.J. Janssens1
1 Department of Animal Nutrition, Genetics and Ethology, Faculty of Veterinary Medicine, Ghent
University, Merelbeke, Belgium
2 WALTHAM® Centre for Pet Nutrition, Waltham-on-the-Wolds, Leicestershire, United Kingdom
3 Department of Comparative Physiology & Biometrics, Faculty of Veterinary Medicine, Ghent
University, Merelbeke, Belgium
Submitted as short communication to Journal of Animal Physiology and Animal
Nutrition

Chapter 3b
PredictiPredictiPredictiPredictiveveveve equationsequationsequationsequations
99
3b.1 Abstract
The trace element selenium is essential to both dogs and cats. Dry diets are formulated with
a large range of ingredients, which may vary in selenium concentration and accessibility.
This paper reports equations to predict the average in vitro selenium accessibility from dry
pet foods based on essential dietary nutrient concentrations, including crude protein, amino
acids and crude fat. Predictive equations were made using stepwise linear regression for
extruded and pelleted diets. The equations can be used to aid diet formulation to optimize
selenium accessibility within the diet and to prevent selenium deficiency or toxicity.
3b.2 Introduction
Selenium (Se) is an essential micro-mineral involved in anti-oxidant protection, thyroid
metabolism and other biological processes(1). Acute Se deficiency in puppies has been
reported to cause muscular weakness, depression, subcutanous oedema, dyspnoea and
eventual coma(2). High Se intake may be associated with reduced food intake, hypochromic
microcytic anemia and severe liver damage in dogs(3). No deficiency and toxicity signs have
been reported for cats(4).
Dry pet foods are the most popular commercial diet type selected for pet dogs(5). Dry pet
foods can be processed by either extruding to kibbles or pelleting. Pellets and kibbles are
formulated with a large range of both plant and animal derived ingredients. Depending on
the region of origin and type of ingredient, the Se concentration in pet food ingredients
can differ(6-7). In addition, the bio-availability of Se from pet foods has been reported to be
low(8) and dependent on various factors such as protein, fat, sulphur, and fibre content of the
diet(9). Therefore, the total dietary Se concentration may not reflect the amount of Se that is
available to the animal.
This study aimed to develop equations to predict the average availability of Se from dry
pet foods, expressed as in vitro accessibility (Aiv). This formed an estimation for in vivo
availability. Accessibility here is defined as the percentage of dietary Se that is potentially
available for absorption after in vitro digestion.
3b.3 Experimental methods
3b.3.1 Diets and chemical analyses
Commercially available dry pet foods (23 dog, 4 cat); 19 extruded (15 dog, 4 cat) and 8
pelleted (all dog), were in vitro digested according to a method adapted from Hervera et
al.(10). Full sample preparation and analysis methods for Se are described in van Zelst et al.(7).
Residues (undigested fractions) were analysed for DM, ash, and N, and filtrates (digested

100 Chapter 3b
PredictiPredictiPredictiPredictive equationsve equationsve equationsve equations
fractions) for total Se. Diets were analysed for dry matter (DM, % as is), ash (% DM), nitrogen
(N, ×6.25 = crude protein (CP) % DM), crude fat (Cfat, % DM), sulphur (S, mg/100g DM), amino
acids (% DM), total dietary fibre (TDF, % DM), gross energy (GE, MJ/kg), and total Se (mg/kg
DM). Total Se concentration was determined using inductively coupled plasma-mass
spectrometry (ICP-MS, Elan DRC-e, PerkinElmer, Waltham, MA, USA). Diets and residues were
analysed in duplicate for DM and crude ash by drying to a constant weight at 103°C and
combusting at 550°C, respectively. The Kjeldahl method (ISO 5983-1)(11) was used to
determine CP (6.25× nitrogen). Cfat in the diets was assayed according to the Berntrop-
method (ISO 6492)(12) and GE was analysed by bomb calorimetry. Sulphur was determined
using inductively coupled plasma-optical emission spectrometry (ICP-OES, Iris intrepid II XSP,
Thermo Fisher Scientific Inc., Waltham, MA, USA) according to ISO 11885(13). Diets were
defatted by fat extraction with petroleum ether and extracted in line with the procedure of
the Commission Directive (98/64/EC)(14) for amino acid analyses; an HPLC method was used
(Agilent 1100; Fluorescence Detector; ZORBAX eclipse AAA Rapid Resolution 4.6 × 150 mm,
3.5 micron column, PN 963400-902, Agilent Technologies, Santa Clara, USA) according to the
method of Henderson et al.(15). TDF analyses were performed using the enzymatic-gravimetric
method described by Prosky et al.(16).
3b.3.2 Calculations
Se Aiv was calculated with the following formula:
SeAiv�% = 4567895�6:8;<85�=> ?⁄ ×[@6:A86B7@A;67>CDECFGH@6>5I86B7�J: KLLL]⁄I<JM:5N56>95@67OB;CDECFGH@6>5I86B7�>PQ×KLL Seinthediet�μg/gDM,
Digestibility coefficients were calculated with the formulae:
DMdigestibility�% = 100 − ;5I6@A5�>PQ×KLLI<JM:5N56>95@67OB;CDECFGH@6>5I86B7�>PQ
Organicmatter�OMdigestibility�% =100 − ;5I6@A5�>PQ×�KLLR<I967;5I6@A5�%PQ KLL⁄ ×KLL
I<JM:5N56>95@67OB;CDECFGH@6>5I86B7�>PQ×[KLLR<I967895@658�%PQ KLL⁄ ]
CPdigestibility�% = 100 − ST67895;5I6@A5�>PQ×KLLST67I<JM:5N56>95@67OB;CDECFGH@6>5I86B7�>PQ
4.3.3 Statistical analyses
Data were initially screened for normality, outliers and homogeneity of variance. All data
were analysed using stepwise linear regression in Statistical Analysis System (SAS) software

Chapter 3b
PredictiPredictiPredictiPredictiveveveve equationsequationsequationsequations
101
version 9.3 for Windows (SAS Institute Inc., Cary, NC) to construct predictive equations. A
simple equation, excluding in vitro digestibility coefficients and amino acids, and a complex
equation, including all measured parameters, were constructed for all dry diets and
separately for the extruded diets. Differences in nutrient composition between the diet types
was analysed by an analysis of variance in SPSS version 21.0, with diet type as factor and
dietary and digestibility parameters as dependent variables. In all cases statistical
significance was evaluated at p≤0.05. Results are reported as mean ± standard error.
3b.4 Results
The chemical composition, in vitro digestibility coefficients and Se Aiv of the diets are shown
in Table 3b.1. Neither dietary Se concentration nor Se Aiv differed between the diet types
(p=0.289 and 0.303, respectively). Se Aiv was on average 73.8% (Kibble: 71.7%; pellet: 78.9%).
Dry matter, methionine, Cfat and GE content were higher in the kibble diets compared to
the pellets (p=0.005, 0.037, 0.046, and 0.017, respectively).
The variables in the complex predictive equation for dry diets were shown to be good
predictors of Se Aiv (n=27; R2=0.86; p<0.001):
Se Aiv (%) = -151 (±37) - 19 (±2) lysine (% DM) + 2.1 (±0.5) CP digestibility (%) + 0.6 (±0.3) DM
digestibility (%).
When only extruded diets were considered, a different predictive equation with a higher
coefficient of determination was obtained (n=19; R2=0.92; p<0.001):
Se Aiv (%) = -90 (±34) - 1.6 (±0.7) ash (% DM) - 18.0 (±1.9) lysine (% DM) + 2.1 (±0.3) CP
digestibility (%).
Coefficients of determination were lower for the simple predictive equations. For all dry
diets (n=27; R2=0.59; p<0.001):
Se Aiv (%) = 104 (±6) + 2.6 (±1.3) S (mg/100g DM) - 1.8 (±0.4) CP (% DM).
For extruded diets a similar predictive equation was found (n=19; R2=0.71; p<0.001):
Se Aiv (%) = 104 (±7) + 3.5 (±1.4) S (mg/100g DM) - 2.0 (±0.4) CP (% DM).

102 Chapter 3b
PredictiPredictiPredictiPredictive equationsve equationsve equationsve equations
Table 3b.1 Chemical composition (g/100g DM, except where specified), gross energy
content (MJ/kg DM), in vitro digestibility and selenium accessibility (%) of dry pet foods
(n=27)
Kibble (n=19) Pellet (n=8)
Component Mean SE min max Mean SE min max p
Dry matter (g/100 g as is) 92.4 0.3 89.9 95.1 90.7 0.3 89.9 92.3 0.005
Crude ash 7.3 0.4 3.1 9.3 7.6 0.5 6.2 10.0 0.664
Crude protein (N×6.25) 29.7 2.6 11.2 49.2 24.1 1.8 14.4 30.7 0.193
Methionine 0.5 0.1 0.1 0.9 0.3 0.1 0.1 0.7 0.037
Cysteine 2.9 0.2 1.3 4.8 2.3 0.2 1.2 3.1 0.187
Lysine 1.5 0.2 0.6 3.3 1.2 0.2 0.5 1.8 0.234
Crude fat 16.2 0.9 8.5 22.6 13.1 1.0 8.5 16.4 0.046
Total dietary fibre 12.3 1.0 6.0 22.3 13.1 2.0 6.5 26.1 0.681
Sulphur (mg/100 g DM) 7.6 0.7 3.0 14.5 6.1 0.7 3.2 8.6 0.208
Selenium (µg/100 g DM) 49.9 6.1 20.9 129.6 39.0 5.4 22.6 56.2 0.289
Gross energy 21.4 0.2 19.0 23.4 20.4 0.3 19.2 21.4 0.017
Dry matter digestibility 89.0 1.1 79.5 96.6 87.0 2.0 73.8 91.7 0.351
Organic matter digestibility 89.0 1.1 79.5 96.6 87.3 2.0 74.5 92.0 0.444
Crude protein digestibility 93.6 0.8 84.7 99.7 93.3 0.7 90.2 96.5 0.842
Selenium Aiv 71.7 4.0 36.9 97.4 78.9 4.8 62.2 101.0 0.303
p-values indicate whether dietary components differ between the kibble and pelleted diets, true at
p≤0.05. DM, dry matter; MJ, megajoule; n, number of animals; SE, standard error; min, minimum
value; max, maximum value; N, nitrogen; Aiv, in vitro accessibility
The predicted versus observed data has been plotted in Figures 3b.1 and 3b.2.

Chapter 3b
PredictiPredictiPredictiPredictiveveveve equationsequationsequationsequations
103
Figure 3b.1 Predicited versus observed in vitro selenium
accessibility in kibble and pelleted diets (n=27)
Solid trend line and solid bullets, complex predictive equation; dotted
trend line and open bullets, simple predictive equation.
Figure 3b.2 Predicited versus observed in vitro selenium
accessibility in kibble diets (n=19)
Solid trend line and solid bullets, complex predictive equation; dotted
trend line and open bullets, simple predictive equation.
Complex: R² = 0.86
Simple: R² = 0.59
0
20
40
60
80
100
120
0 20 40 60 80 100 120
Pre
dic
ted in v
itro
sele
niu
m
acc
ess
ibili
ty (%
)
Observed in vitro selenium accessibility (%)
Complex: R² = 0.92
Simple: R² = 0.71
0
20
40
60
80
100
120
0 20 40 60 80 100 120
Pre
dic
ted in v
itro
sele
niu
m
acc
ess
ibili
ty (%
)
Observed in vitro selenium accessibility (%)

104 Chapter 3b
PredictiPredictiPredictiPredictive equationsve equationsve equationsve equations
3b.5 Discussion
This study reported average predictive equations of Se Aiv of dry pet foods. The large
range of Se Aiv in this study is evidence for the highly variable Se provision in dry pet
foods. The complex equations constructed in this study can be used in nutrition research for
the formulation of new diets to optimize Se accessibility. For cases where in vitro
digestibility and/or amino acids cannot be determined, such as in routine food formulation
in practice, the simple predictive equations were formulated. These can be used to obtain
an indication of the dietary Se availability to prevent Se deficiency or toxicity caused by a
diet.
The negative intercepts of the predictive equations suggest a negative Se Aiv when all
parameters are zero. This is, however, very unlikely. Although this study has been performed
with a wide range in all dietary parameters measured, it should be kept in mind that the
predictive equations only apply for parameters within this range.
The equations based only on the extruded diets provided a prediction with a higher
confidence than the model for all dry diets. Therefore, these can best be used for extruded
diets, which is the majority of commercially available dry pet foods(17). The lower coefficients
of determination of the equations for pelleted plus extruded dry diets compared to
extruded diets only, may be due to a difference in ingredients used or the different
conditions under which the diets are processed. Pellets are processed using lower
temperatures and less shear compared to kibbles(18), which may have a beneficial effect on
the protein quality(19). However, no difference in crude protein digestibility was found in this
study. Tran et al.(18) reported a lower dietary Cfat and starch concentration in pellets than
kibbles, but only four diets per diet type were included in their study. The current study
found the opposite for Cfat. Starch concentration was not analysed in this study. The
difference in Cfat, DM, methionine and GE content between the diet types may have
contributed to the lower coefficients of determination when both diet types were included
for the formation of the equation, although this study does not allow attribution of causality.
Although the parameters in the equations do not necessarily have a causal relationship
with Se Aiv, some of the parameters have previously been associated with the biological
availability of Se, meaning the amount of dietary Se that reaches the systemic circulation.
Sulphur for example, has been reported to decrease the Se availability in sheep(20). In both
simple models of this study it was however positively associated with Se Aiv. An explanation
for this may be that a larger amount of S-containing amino acids may provide more binding
sites for Se, in the case of organically bound (selenomethionine and selenocysteine) dietary
Se. Also, the incorporation of DM and CP digestibility (+) in the complex equations may be

Chapter 3b
PredictiPredictiPredictiPredictiveveveve equationsequationsequationsequations
105
caused by a higher amount of Se that becomes available from digested amino acids. A
reduction in digestibility may result from an increase in dietary collagen(21), which increases
ash concentration, and thus, may be the cause for inclusion of ash (-) in the complex
equation for extruded diets. Lysine is involved in the Maillard reaction(22), which decreases
the protein quality(23). A reduction in protein quality may reduce the release of protein-
bound Se, which may be a reason for lysine (-) to be in the complex predictive equations.
The inclusion of CP (-) in the simple equations cannot be explained in this context, but
again, the relationship between the factors in the models and Se Aiv might not be causal.
The in vivo Se bioavailability of diets is expected to be somewhat lower than the Se Aiv.
This is because in vitro digestion mimics in vivo gastro-intestinal digestion, but does not
contain all facets, such as luminal absorption. Nevertheless, this study provided useful tools
to predict differences in availability of Se from dry pet foods.
3b.6 References
1. Roman M, Jitaru P, Barbante C (2014) Selenium biochemistry and its role for human health. Metallomics 6666, 25-54.
2. van Vleet JF (1975) Experimentally induced vitamin E-selenium deficiency in the growing dog. Journal of the American Veterinary Medical Association 166166166166, 769-774.
3. Levander O (1986) Selenium. In Trace elements in human and animal nutrition, 5th ed., pp. 209-279 [W Mertz, editor]. Orlando: Academic Press.
4. National Research Council (2006) Nutrient requirements of dogs and cats. [Rev. ed, Animal
nutrition series. Washington D.C.: National Academies Press. 5. Pet Food Manufacturers' Association (2015) Market Data.
http://www.pfma.org.uk/market-data (accessed 8 August 2015). 6. Reilly C (2006) Selenium in food and health. 2nd ed. New York: Springer Science and
Business Media LLC. 7. van Zelst M, Hesta M, Alexander LG et al. (2015) In vitro selenium accessibility in dog
foods is affected by diet composition and type. British Journal of Nutrition 113113113113, 1888-1894.
8. Wedekind KJ, Cowell C, Combs GF, Jr. (1997) Bioavailability of selenium in petfood ingredients. FASEB Journal 11111111, A360.
9. Thiry C, Ruttens A, de Temmerman L et al. (2012) Current knowledge in species-related bioavailability of selenium in food. Food Chemistry 130130130130, 767-784.
10. Hervera M, Baucells MD, Blanch F et al. (2007) Prediction of digestible energy content of extruded dog food by in vitro analyses. Journal of Animal Physiology and Animal Nutrition 91919191, 205-209.
11. ISO (2005) Animal Feeding Stuffs - Determination of nitrogen content and calculation of
crude protein content - Part 1: Kjeldahl method (ISO 5983-1). Geneva, Switzerland: International Organization for Standardization.
12. ISO (1999) Animal Feeding Stuffs - Determination of fat content (ISO 6492). Geneva, Switzerland: International Organization for Standardization.

106 Chapter 3b
PredictiPredictiPredictiPredictive equationsve equationsve equationsve equations
13. ISO (2007) Determination of selected elements by inductively coupled plasma optical
emission spectrometry (ICP-OES, ISO 11885). Geneva, Switzerland: International Organization for Standardization.
14. Commission Directive (1998) Establishing Community methods of analysis for the determination of aminoacids, crude oils and fats, and olaquindox in feedingstuffs and amending, Directive 71/393/EEC. Official Journal of the European Communities L 257L 257L 257L 257, 14-28.
15. Henderson JW, Ricker RD, Bidlingmeyer BA et al. (2000) Rapid, acurate, sensitive and reproducible HPLC analysis of amino acids. In Application note 5980-1193E: Agilent Technologies.
16. Prosky L, Asp NG, Furda I et al. (1985) Determination of Total Dietary Fiber in Foods and Food Products - Collaborative Study. Journal of the Association of Official Analytical
Chemists 68686868, 677-679. 17. Spears JK, Fahey GC (2004) Resistant Starch as Related to Companion Animal Nutrition.
Journal of AOAC International 87878787, 787-791. 18. Tran QD, van Lin CGJM, Hendriks WH et al. (2007) Lysine reactivity and starch
gelatinization in extruded and pelleted canine diets. Animal Feed Science and Technology 138138138138, 162-168.
19. Hendriks WH, Emmens MM, Trass B et al. (1999) Heat processing changes the protein quality of canned cat foods as measured with a rat bioassay. Journal of Animal Science 77777777, 669-676.
20. Netto AS, Zanetti MA, Correa LB et al. (2014) Effects of dietary selenium, sulphur and copper levels on selenium concentration in the serum and liver of lamb. Asian-
Australasian Journal of Animal Sciences 27272727, 1082-1087. 21. El SN (1995) Evaluating protein quality of meats using collagen content. Food Chemistry
53535353, 209-210. 22. Moughan PJ, Rutherfurd SM (1996) A New Method for Determining Digestible Reactive
Lysine in Foods. Journal of Agricultural and Food Chemistry 44444444, 2202-2209. 23. Rutherfurd SM, Moughan PJ (1997) Application of a New Method for Determining
Digestible Reactive Lysine to Variably Heated Protein Sources. Journal of Agricultural and
Food Chemistry 45454545, 1582-1586.

Association between selenium bioavailability
______________________________________________________________
ssociation between diet typeavailability and -activity
_____________________________________________________________________________________________________________
Chapter 4
diet type and activity in dogs
_______________________________________________
"Selenium digestibility and bioactivity in dogs: what the can can, the kibble
can’t"
Mariëlle van Zelst1, Myriam Hesta1, Kerry Gray2, Karen Beech2, An Cools1, Lucille G.
Alexander2, Gijs Du Laing3, Geert P.J. Janssens1*
1 Department of Animal Nutrition, Genetics and Ethology, Faculty of Veterinary Medicine, Ghent
University, Merelbeke, Belgium
2 WALTHAM® Centre for Pet Nutrition, Waltham-on-the-Wolds, Leicestershire, United Kingdom
3 Department of Applied Analytical & Physical Chemistry, Faculty of Bioscience Engineering, Ghent
University, Ghent, Belgium
Submitted to PLOS ONE
Chapter 4
SSSSelenium bioavailabilityelenium bioavailabilityelenium bioavailabilityelenium bioavailability and and and and ----activityactivityactivityactivity
109
4.1 Abstract
There is a growing concern for the long-term health effects of selenium (Se) over- or
underfeeding. The efficiency of utilization of dietary Se is subject to many factors. Our study
in dogs evaluated the effect of diet type (canned versus kibble) and dietary protein
concentration on Se bioavailability and -activity. Canned and kibble diets are commonly
used formats of dog food, widely ranging in protein concentration. Twenty-four Labrador
retrievers were used and four canned and four kibble diets were selected with crude
protein concentrations ranging from 10.1 to 27.5 g/MJ. Crude protein concentration had no
influence on the bioavailability of Se in either canned or kibble diets, but a lower Se
bioavailability was observed in canned compared to kibble diets. However, the biological
activity of Se, as measured by whole blood glutathione peroxidase, was higher in dogs fed
the canned diets than in dogs fed the kibble diets and decreased with increasing crude
protein intake. These results indicate that selenium recommendations in dog foods need to
take diet type into account.
4.2 Introduction
Selenium (Se) is an essential trace element, primarily to protect against oxidative stress(1).
Current dietary recommendations include a safety margin to avoid loss of antioxidant
protection at low concentrations(2) and the risk of Se toxicity at high concentrations(3). In
addition, data on the importance of Se intake on long-term health are emerging that give
rise to other concerns. There are indications that Se is involved in the prevention of
diseases such as cancer(4-7) and cardiovascular diseases(8-10) and impaired immune function(11-
12), etc. On the other hand, the Se and vitamin E cancer prevention trial (SELECT) reported an
increased risk of diabetes mellitus type 2 in humans with a high Se intake (200 µg
selenomethionine/day)(13). The effects of selenium intake on the health and longevity of
companion animals such as the dog is now also coming under scrutiny(14-15). The current
recommended allowance for Se in dog food takes into account a bioavailability factor, but
is not diet type specific(16), despite several studies reporting a large variation in Se
bioavailability between diet types(17-20). We have previously shown in 20 canned and 23
kibble diets, the average amount of Se was higher in canned than kibble diets (34.8 vs. 22.5
µg/MJ, respectively). Also, apparent crude protein (CP) digestibility had a significant effect
on in vitro Se accessibility(20), i.e. the dietary Se fraction in the filtrate after in vitro digestion.
The reasons for the differences in Se bioavailability between canned and kibble diets may
be due to the way the diets are processed or the raw materials used during manufacture.
The raw materials used for pet foods vary greatly in their Se concentration(21-22) and

110 Chapter 4
SSSSelenium bioavailabilityelenium bioavailabilityelenium bioavailabilityelenium bioavailability and and and and ----activityactivityactivityactivity
availability(23). Canned diets typically contain higher concentrations of meat and/or meat
by-products, whilst kibble diets contain mainly cereal grains and cereal grain by-products(22).
Wedekind et al.(18) tested the availability of Se in several pet food ingredients and found a
range of 9% in mackerel to 38% in beef spleen when compared to the availability of
sodium selenite. Due to the differences in ingredients, it is likely that the chemical form of Se
in the diet will also be different between canned and kibble diets, which is known to be an
important factor for the bioavailability of Se(24-25).
Canned and kibble diets also differ in the way of processing. Kibble diets are extruded and
canned diets are retorted, resulting in differential effects of heat, pressure and shear which
may also impact on Se bioavailability. The differences between canned and kibble diets
may not only cause a variation in Se bioavailability between diet types, but also the
bioactivity, defined as the amount of Se that can be used for the incorporation into
selenoproteins. The antioxidant glutathione peroxidase (GPx) is often used as a measure of
Se bioactivity(26-30). In addition, serum isoprostanes (IsoPs) are a measure for lipid
peroxidation(31) and are used as an indicator of total antioxidant status. Selenium is not only
incorporated into GPx, but also into iodothyronine deiodinases, of which type I and II are
involved in the transformation of thyroxine (T4) into triiodothyronine (T3)(32-33). Olivieri et al.(33)
has shown that selenium status was positively correlated with the ratio of T3:T4 in humans
and Wedekind et al.(29) have reported similar results in puppies.
Based on the in vitro results(20), it was hypothesized that canned diets have a lower Se
bioavailability than kibble diets and that CP concentration (as the main factor for the
ingested amount of digestible protein) is positively associated with Se bioavailability in
kibble diets and negatively in canned diets in vivo. To test this hypothesis, two different
diet types (canned and kibble) and four different concentrations of CP per diet type were
selected.
4.3 Experimental methods
4.3.1 Study design
The study consisted of four feeding periods with six transition days and experimental
periods of between 29-43 days. Four groups of each six dogs were selected. Each dog
group was fed four of the eight experimental diets (2 canned, 2 kibble) in a randomised
incomplete cross-over design. Blood, urine and faecal samples were taken at the end of
every feeding period. This study (HO0647) was approved by the WALTHAM Centre for Pet
Nutrition Animal Welfare and Ethical Review Body and was conducted under Home Office
Project License authorisation.
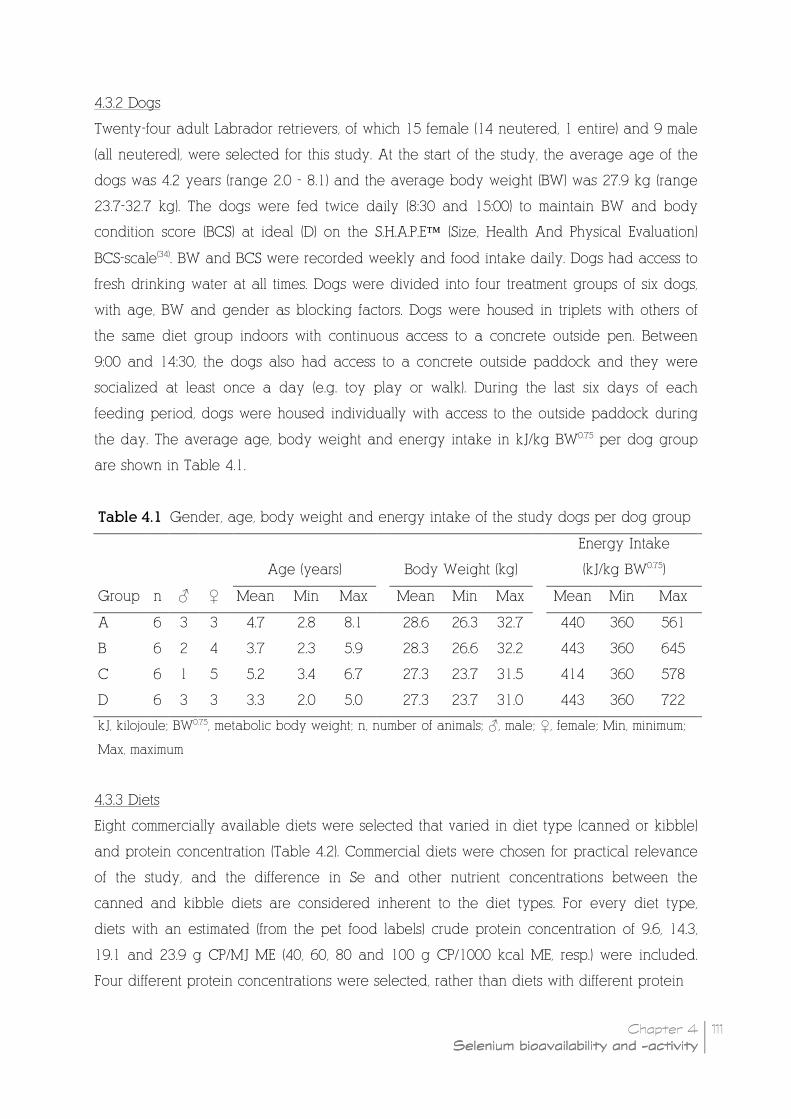
Chapter 4
SSSSelenium bioavailabilityelenium bioavailabilityelenium bioavailabilityelenium bioavailability and and and and ----activityactivityactivityactivity
111
4.3.2 Dogs
Twenty-four adult Labrador retrievers, of which 15 female (14 neutered, 1 entire) and 9 male
(all neutered), were selected for this study. At the start of the study, the average age of the
dogs was 4.2 years (range 2.0 - 8.1) and the average body weight (BW) was 27.9 kg (range
23.7-32.7 kg). The dogs were fed twice daily (8:30 and 15:00) to maintain BW and body
condition score (BCS) at ideal (D) on the S.H.A.P.E™ (Size, Health And Physical Evaluation)
BCS-scale(34). BW and BCS were recorded weekly and food intake daily. Dogs had access to
fresh drinking water at all times. Dogs were divided into four treatment groups of six dogs,
with age, BW and gender as blocking factors. Dogs were housed in triplets with others of
the same diet group indoors with continuous access to a concrete outside pen. Between
9:00 and 14:30, the dogs also had access to a concrete outside paddock and they were
socialized at least once a day (e.g. toy play or walk). During the last six days of each
feeding period, dogs were housed individually with access to the outside paddock during
the day. The average age, body weight and energy intake in kJ/kg BW0.75 per dog group
are shown in Table 4.1.
Table 4.1 Gender, age, body weight and energy intake of the study dogs per dog group
Age (years) Body Weight (kg)
Energy Intake
(kJ/kg BW0.75)
Group n ♂ ♀ Mean Min Max Mean Min Max Mean Min Max
A 6 3 3 4.7 2.8 8.1 28.6 26.3 32.7 440 360 561
B 6 2 4 3.7 2.3 5.9 28.3 26.6 32.2 443 360 645
C 6 1 5 5.2 3.4 6.7 27.3 23.7 31.5 414 360 578
D 6 3 3 3.3 2.0 5.0 27.3 23.7 31.0 443 360 722
kJ, kilojoule; BW0.75, metabolic body weight; n, number of animals; ♂, male; ♀, female; Min, minimum;
Max, maximum
4.3.3 Diets
Eight commercially available diets were selected that varied in diet type (canned or kibble)
and protein concentration (Table 4.2). Commercial diets were chosen for practical relevance
of the study, and the difference in Se and other nutrient concentrations between the
canned and kibble diets are considered inherent to the diet types. For every diet type,
diets with an estimated (from the pet food labels) crude protein concentration of 9.6, 14.3,
19.1 and 23.9 g CP/MJ ME (40, 60, 80 and 100 g CP/1000 kcal ME, resp.) were included.
Four different protein concentrations were selected, rather than diets with different protein

112 Chapter 4
SSSSelenium bioavailabilityelenium bioavailabilityelenium bioavailabilityelenium bioavailability and and and and ----activityactivityactivityactivity
Table 4.2 Analysed chemical composition (g/MJ ME, except where specified), dry matter (DM) and metabolisable energy concentration (ME) of four canned and four kibble single batch dietsa with differing protein concentrations
Canned Kibble
Calculated protein concentration* 9.6b,d,h 14.3c,f 19.1b,d,f 23.9c,e,g 9.6c,i 14.3 19.1 23.9
DM (g/100g as is) 36.1 30.2 24.9 26.9 92.8 91.0 91.4 91.0
Crude protein 10.1 15.0 21.5 27.5 11.3 14.3 18.5 23.2
Crude fat 9.2 11.0 11.3 13.0 9.2 7.6 10.1 8.1
Total dietary fibre† 4.7 4.3 4.5 6.1 4.5 4.6 4.0 26.6
Crude ash 2.8 5.5 3.4 3.7 2.8 4.3 4.7 4.7
Selenium (µg/MJ ME) 34.8 39.3 47.5 40.7 13.9 25.5 19.4 30.3
Selenium (µg/100 g DM) 60.7 69.0 83.9 74.1 24.9 42.9 34.0 35.3
Iodine (µg/MJ ME) 255.7 138.6 74.1 14.3 219.6 374.4 300.4 348.9
d-α-tocopherol (mg/MJ ME) 24.0 21.6 20.7 21.1 29.0 31.6 32.4 83.5
ME (MJ/kg DM)‡ 17.5 17.5 17.7 18.2 17.9 16.8 17.5 11.6
Amino acids
Methionine 0.24 0.41 0.38 0.57 0.23 0.29 0.49 0.41
Cysteine 0.13 0.11 0.18 0.18 0.18 0.20 0.27 0.36
Lysine 0.41 0.94 1.18 1.51 0.49 0.71 0.83 0.92
Fatty acids
Linoleic acid 2.78 1.23 1.53 1.95 1.84 1.26 1.55 1.61
Arachidonic acid 0.04 0.20 0.18 0.14 0.04 0.04 0.04 0.05
Alpha-linolenic acid 0.09 0.10 0.13 0.15 0.16 0.10 0.13 0.14
Docosahexaenoic acid 0.01 0.17 0.20 0.32 0.05 0.03 0.03 0.07
Eicosapentaenoic acid 0.00 0.28 0.31 0.49 0.08 0.06 0.07 0.17
MJ, megajoule; ME, metabolisable energy a All diets were supplemented with 516 mg choline/dog/day, Choline chloride 78% solution, Taminco BVBA, Gent, Belgium b Supplemented with 89.7 mg magnesium/dog/day, Super magnesium, Metabolics Ltd, Eastcott, Wiltshire, England c Supplemented with 206.3 mg magnesium/dog/day, Super magnesium, Metabolics Ltd, Eastcott, Wiltshire, England d Supplemented with 2.2 mg copper/dog/day, Copper citrate, Metabolics Ltd, Eastcott, Wiltshire, England e Supplemented with 4.4 mg copper/dog/day, Copper citrate, Metabolics Ltd, Eastcott, Wiltshire, England f Supplemented with 3.8 µg vitamin D/dog/day, Pet-Cal™, Pfizer Animal Health, New York, USA g Supplemented with 0.43 mg iodine/dog/day, Iodine 11, Metabolics Ltd, Eastcott, Wiltshire, England h Supplemented with 1.19 g methionine/dog/day, synthetic methionine, Evonik Industries, Essen, Germany i Supplemented with 1.03 g methionine/dog/day, Evonik Industries, Essen, Germany * The diets are from left to right: Royal Canin® Canine Veterinary Diet Hepatic, Sensitivity Control
Duck & Rice, Canine Veterinary Care Nutrition Senior Consult Mature, Canine Veterinary Diet Recovery, Renal, Gastro Intestinal moderate calorie, Canine Veterinary Care Nutrition Pediatric Junior Large Dog and Canine Veterinary Diet Satiety Weight Management,
† Obtained from the pet
food producer, ‡ Calculated using predictive equations for ME(22).

Chapter 4
SSSSelenium bioavailabilityelenium bioavailabilityelenium bioavailabilityelenium bioavailability and and and and ----activityactivityactivityactivity
113
digestibility coefficients. This resulted in a range of the absolute amount of digestible
protein, as the limited differences in protein digestibility in commercially available diets are
usually overruled by the protein concentration per se. All diets were single-batch, to
prevent differences in nutrients over time due to variations in ingredients. Selected canned
diets were Royal Canin® Canine Veterinary Diet Hepatic, Sensitivity Control Duck & Rice,
and Recovery and Canine Veterinary Care Nutrition Senior Consult Mature. Selected kibble
diets were Royal Canin® Canine Veterinary Diet Renal, Gastro Intestinal Moderate Calorie,
and Satiety Weight Management and Canine Veterinary Care Nutrition Pediatric Junior
Large Dog. The canned diets contained Se solely from the ingredients, whereas Se in the
form of sodium selenite was supplemented in all kibble diets before processing (standard,
not specifically for this study). Supplemented amounts of sodium selenite were 0.05, 0.08,
0.08, and 0.08 mg/kg, respectively. As veterinary diets were used in this study, some of the
diets were supplemented with additional nutrients in order to be nutritionally complete and
balanced for healthy adult dogs with energy requirements of 397 kJ (95 kcal)/kg BW0.75.
Details of the supplementation are included in Table 4.2. Each dog was fed individually to
maintenance requirements.
4.3.4 Blood samples
At the end of every feeding period, blood samples (13ml) were taken at 13:00 h from each
dog by jugular venipuncture using a 21 gauge needle. Blood was put into 2 Microvette®
500 µl lithium-heparin tubes, one 300 µl fluoride-heparin tube, one 200 µl Tri-Kalium-EDTA
tube and 2 Vacuette® z serum clot activator tubes (1× 9 ml and 1× 4 ml). One of the lithium-
heparin tubes was used for whole blood GPx analysis immediately after collection. The
remaining heparin tubes were centrifuged (accuSpin™ Micro R, Thermo Fisher Scientific Inc.)
immediately after collection at 1680 g and 4°C for 10 min. Lithium-heparin plasma was
analysed for general biochemistry parameters and fluoride-heparin plasma for glucose
(Spectrophotometry, Olympus AU400). Tri-Kalium-EDTA tubes were placed on a roller at room
temperature until analysis for haematology parameters (Mythic 18 Vet analyser, Orphée
S.A.). Biochemistry and haematology measurements were used as a general health check to
confirm that all dogs were in good health. Serum tubes were incubated for 30 min on ice
and then centrifuged (Sigma 6K15, rotor 11150, cups 13550, Sigma GmbH) for 10 min. at
2000 ×g and 4°C. Serum samples were divided into centrifuge tubes and stored at -80°C for
analysis of Se, IsoPs and triiodothyronine (T3) and thyroxine (T4) at the end of the study.
114 Chapter 4
SSSSelenium bioavailabilityelenium bioavailabilityelenium bioavailabilityelenium bioavailability and and and and ----activityactivityactivityactivity
4.3.5 Urine samples
Free catch urine was collected in the section of the day between meals at the end of each
feeding period, using a Uripet urine collection device (Rocket Medical plc., Watford,
England). 1 ml of urine was stored in at -80°C and analysed for creatinine (CT) within one
month after sampling (IDEXX laboratories, UK). The rest of the sample was stored at -20°C
and analysed for Se content (ICP-MS).
4.3.6 Faeces samples
During the last six days of each feeding period, titanium dioxide (TiO2) was added to the
diets as a digestibility marker at a concentration of 0.45 g/day (mean 1.5 g/kg DM, range
0.67-2.14 g/kg DM). Total faeces were collected during four consecutive days at the end of
each diet phase. Faeces were homogenised with a mixer (Kenwood professional PM900,
Kenwood LTD) for 1 minute and a sample of approximately 350 g (mean 346, range 245-410
g) was taken. Samples were freeze-dried (SuperModulyo®, Thermo Fisher Scientific Inc.) until
a stable weight, at -50°C. Faeces were analysed for TiO2, DM, ash, nitrogen (N) and Se. Se
and N were used for the calculation of apparent Se bioavailability and CP (N×6.25)
digestibility coefficients, respectively, with the use of TiO2 as a marker by means of the
following formula:
Apparentdigestibility/bioavailability%= 100 − U100 × V %markerindiet%markerinfaeces× %nutrientinfaeces%nutrientindiet XY
4.3.7 Chemical analyses
Biochemistry and glucose analyses were carried out using spectrophotometry (Olympus
AU400, Olympus Inc.) with Beckman Coulter reagents (Beckman Coulter Biomedical LTD)
within 20 mins of sampling. Whole blood GPx was also analysed within 20 mins of sampling
using the Ransel kit (Randox laboratories LTD) on the Olympus AU400 spectrophotometer. A
4-point calibration curve was used as control. Whole blood GPx analysis had an average
CV of 1.4% in the samples and the 4-point calibration curve showed a recovery of 83.1,
93.7, 98.5, and 96.4%, respectively. Haematology parameters were analysed using a Mythic
18 Vet analyser (Orphée S.A.). Thyroid hormone analyses (T3 and T4) were performed
according to the method of Darras et al.(35) and the IsoPs were analysed using an enzyme-
linked immunosorbent assay (8-isoprostane EIA kit, Cayman Chemical Co.). Serum, urine and
faeces samples were prepared for total Se analyses with closed vessel microwave
destruction as described in van Zelst et al.(20). Se was analysed using inductively coupled

Chapter 4
SSSSelenium bioavailabilityelenium bioavailabilityelenium bioavailabilityelenium bioavailability and and and and ----activityactivityactivityactivity
115
plasma-MS (ICP-MS, Elan DRC-e, PerkinElmer), as described by Lavu et al.(36). Urine CT was
determined using a creatinine kit based on the Jaffe reaction (OSR6178, Beckman Coulter
Biomedical LTD, IDEXX Laboratories, UK). Faeces samples were analysed for DM and crude
ash by drying to a constant weight at 103°C and combusting at 550°C, respectively. The
Kjeldahl method (ISO 5983-1, 2005)(37) was used to determine CP (N×6.25). TiO2 was analysed
according to the method of Myers et al.(38).
4.3.8 Statistical analyses
Data were analysed using linear mixed effect models in RStudio (version 0.98.507,
RStudio,Inc.)(39) using the nlme package(40). Two primary response variables were measured:
GPx and urinary Se:CT ratio relative to the Se intake (relative urinary Se:CT ratio). To
account for two primary response variables, the statistical test level was corrected to
0.05/2=0.025 for these two parameters. The secondary response variables in this study were:
Energy intake, Se intake, serum Se, serum IsoP, serum T3:T4 ratio, Se bioavailability, apparent
CP digestibility, bioavailable Se intake (the absolute amount of bioavailable Se), digestible
CP intake and urinary Se:CT ratio relative to the bioavailable Se intake. For these response
variables a p-value of <0.05 was used as the threshold for significance.
The model contained a fixed effects structure of actual CP intake (g/kg BW0.75), diet type
and their interaction and a random structure of dog. If the interaction was not significant
(p≥0.05), the model was reduced to CP intake and format as fixed effects and dog as
random effect. For energy, Se, bioavailable Se and digestible CP intake, the model consisted
only of diet type as fixed, and dog as random effect. Distributional assumptions were
checked by visual inspection of residuals. Results are reported as means (± SEM).
Table 4.3 Energy, selenium and crude protein intakes per diet type of four canned
and four kibble diets
Canned Kibble p-value
mean SEM mean SEM diet type
Energy intake (kJ/ kg BW0.75) 428.8 11.7 442.9 11.7 0.325
Se intake (µg/kg BW0.75) 17.3 0.4
10.1 0.6
<0.001
Bioavailable Se intake (µg/kg BW0.75) 7.7 0.4
6.6 0.4
0.043
Digestible CP intake (g/kg BW0.75) 6.6 0.5 6.5 0.3 0.860
SEM, standard error of the mean; BW0.75, metabolic body weight; Se, selenium; CP, crude protein.

116 Chapter 4
SSSSelenium bioavailabilityelenium bioavailabilityelenium bioavailabilityelenium bioavailability and and and and ----
To assess the impact of time between a dog’s last meal and urine collection on the relative
urinary Se:CT ratio, a likelihood ratio test was carried out by including time
effects structure of the model. No significant differences were found when time was
included as a parameter; consequently, time was omitted from the structure of the mixed
effects model for relative urinary Se:CT ratio.
Figure 4.1 Selenium bioavailability (A), serum selenium (B), serum isoprostanes (C) and
serum T3:T4 ratio (D) in dogs in relation to crude protein intake of four canned and four
kibble diets. Black squares and solid line are canned diets, open triangles and dashed line
kibble diets. Symbols represent the means and error bars indicate their standard errors, based on the
raw data. BW0.75, metabolic body weight;
hormones.
----activityactivityactivityactivity
To assess the impact of time between a dog’s last meal and urine collection on the relative
urinary Se:CT ratio, a likelihood ratio test was carried out by including time
effects structure of the model. No significant differences were found when time was
included as a parameter; consequently, time was omitted from the structure of the mixed
effects model for relative urinary Se:CT ratio.
enium bioavailability (A), serum selenium (B), serum isoprostanes (C) and
serum T3:T4 ratio (D) in dogs in relation to crude protein intake of four canned and four
Black squares and solid line are canned diets, open triangles and dashed line
Symbols represent the means and error bars indicate their standard errors, based on the
, metabolic body weight; T3:T4 ratio, ratio between triiodothyronine and thyroxine
To assess the impact of time between a dog’s last meal and urine collection on the relative
urinary Se:CT ratio, a likelihood ratio test was carried out by including time into the fixed
effects structure of the model. No significant differences were found when time was
included as a parameter; consequently, time was omitted from the structure of the mixed
enium bioavailability (A), serum selenium (B), serum isoprostanes (C) and
serum T3:T4 ratio (D) in dogs in relation to crude protein intake of four canned and four
Black squares and solid line are canned diets, open triangles and dashed line are
Symbols represent the means and error bars indicate their standard errors, based on the
T3:T4 ratio, ratio between triiodothyronine and thyroxine

Chapter 4
SSSSelenium bioavailabilityelenium bioavailabilityelenium bioavailabilityelenium bioavailability and and and and ----activityactivityactivityactivity
117
4.4 Results
All biochemistry and haematology results were within the normal range for healthy dogs
(data not shown). The average Se concentration of the kibble diets was 22.3 µg/MJ (range
13.9 - 30.3) and 40.6 µg/MJ (range 34.8 - 47.5) for canned diets. Energy intake did not differ
between the diet types, hence the Se intake was approximately two-fold lower on kibble
than canned diets (Table 4.3).
Apparent CP digestibility showed a significant diet type by CP intake interaction (p<0.001).
Apparent CP digestibility increased with increasing CP intake, but only in canned diets. The
digestible CP intake did not differ between diet types (Table 4.3). Kibble diets had a higher
Se bioavailability on average than canned diets (p<0.001) and Se bioavailability did not
significantly change with CP intake (p=0.753, Figure 4.1A). On average, Se bioavailability
was 62.3% (± 1.5) in kibble and 44.9% (± 1.9) in canned diets. The average bioavailable Se
intake was lower in kibble than canned diets (Table 4.3).
The GPx response (U/g Hb) was lower on average in kibble compared to canned diets
(p<0.001) and decreased with an increasing CP intake (p<0.001, Figure 4.2). Serum Se
concentrations did not change significantly with diet type (p=0.158), but did with CP intake,
whereby serum Se concentrations decreased with increasing CP intake (p<0.001, Figure
4.1B). No association of diet type (p=0.069) or CP intake (p=0.216) on IsoPs was found (Figure
4.1C), nor with the T3:T4 ratio (p=0.102 and 0.960, respectively, Figure 4.1D).
The relative urinary Se:CT ratio was higher on average in kibble diets than in the canned
diets (p<0.001). No association of CP intake with urinary Se:CT ratio was found (p=0.059,
Figure 4.3). When urinary Se excretion was expressed per absolute amount of bioavailable
Se, dogs on kibble diets excreted more Se in their urine than dogs on canned diets
(p=0.001) and excretion decreased with increasing CP intake (p=0.017, data not shown).
4.5 Discussion
This study showed that the availability of Se through digestion and metabolism changed
considerably with diet type. The higher apparent Se bioavailability in kibble compared to
canned diets suggests that the use of a single recommendation for Se inclusion levels in pet
foods for both diet types needs reconsideration. Previous in vitro findings showed that Se in
canned diets was more susceptible to a decrease in Se accessibility, i.e. the amount that is
available for absorption in the gastro-intestinal tract, due to processing(20). The average Se
accessibility was also lower in canned than kibble diets(20). In the in vitro study(20), canned
diets had an average Se accessibility of 58% (± 4.01, n=20), while the Se accessibility of

118 Chapter 4
SSSSelenium bioavailabilityelenium bioavailabilityelenium bioavailabilityelenium bioavailability and and and and ----activityactivityactivityactivity
Figure 4.2 Whole blood glutathione peroxidase responses in dogs in
relation to crude protein intake of four canned and four kibble diets.
Black squares and solid line are canned diets, open triangles and dashed
line are kibble diets. Symbols represent the means and error bars indicate
their standard errors, based on the raw data. Hb, hemoglobin; BW0.75,
metabolic body weight.
kibble diets was 72% (± 3.95, n=23). Accordingly, in the present study canned diets showed
a lower Se bioavailability than kibble diets. The difference in apparent Se bioavailability
observed between the diet types may be caused by the Se species used in these diets. The
meat and meat-by-products that are used in canned diets, mainly contain organically
bound Se (e.g. selenomethionine)(41). Therefore, it may be that the dietary sulphur-containing
amino acids (methionine and cysteine) compete for absorption with the organically bound
Se(42). Sodium selenite, which is often used (as in the kibble study diets) to supplement pet
foods that do not comply to the recommended allowance (mainly kibble diets), is absorbed
through diffusion(43) and thus does not have to compete for absorption with organically
bound sulphur.
Interestingly, bioactivity in this study measured as GPx (U/g Hb), was higher in canned than
kibble diets. This may be explained by a higher amount of bioavailable Se in canned diets.
However, this finding should be interpreted with caution, as the range in dietary CP
concentration may also have affected the Hb concentration(44), which in turn may affect the
GPx results. Even though the apparent Se bioavailability of canned diets was much lower
than kibble diets (44.9% vs. 62.3%, respectively), the absolute amount of bioavailable Se was
still higher in canned diets (7.7 ± 0.4 vs. 6.6 ± 0.4 µg/kg BW0.75, respectively). Both this study
325
350
375
400
425
450
475
500
525
550
0 2 4 6 8 10 12 14 16 18
Glu
tath
ione p
ero
xidase
(U/g
Hb)
Crude protein intake (g/kg BW0.75)
0

Chapter 4
SSSSelenium bioavailabilityelenium bioavailabilityelenium bioavailabilityelenium bioavailability and and and and ----activityactivityactivityactivity
119
Figure 4.3 Urinary selenium to creatinine ratio relative to selenium
intake in dogs in relation to crude protein intake of four canned and
four kibble diets.
Black squares and solid line are canned diets, open triangles and dashed
line are kibble diets. Symbols represent the means and error bars indicate
their standard errors, based on the raw data. BW0.75, metabolic body weight.
and the in vitro study(20) were performed with commercially available diets and in both
studies a higher dietary Se concentration was found in canned than in kibble diets. In the
in vitro work, canned diets contained on average 34.8 µg Se/MJ (± 6.25, n=20) and kibble
diets 22.5 µg Se/MJ (± 2.42, n=23)(20). In this study, similar contents were measured (canned
diets: 40.6 µg Se/MJ, kibble diets: 22.3 µg/MJ). This indicates that the ingredients for canned
diets tend to contain a higher amount of Se, which suggests this may be inherent to this diet
type.
In addition to the higher amount of bioavailable Se in canned diets, the urinary Se
excretion relative to Se intake was lower in canned compared to kibble diets, even per
absolute amount of bioavailable Se. This suggests that the percentage of retained Se per
bioavailable Se is higher in canned than kibble diets. Consequently, a higher amount of
bioavailable Se from the canned diets can be used for either non-specific incorporation into
body proteins, or incorporation into the Se-dependent antioxidant GPx. In the latter
situation, this results in a higher bioactivity of Se from canned diets, as demonstrated in this
study (at least in U/g Hb). A difference in speciation is the most likely explanation for the
differences between the diet types. Unfortunately, efforts to determine Se speciation were
0
20
40
60
80
100
120
0 2 4 6 8 10 12 14 16 18
Urinary
Se:C
T rel.
to S
e inta
ke
Crude protein intake (g/kg BW0.75)

120 Chapter 4
SSSSelenium bioavailabilityelenium bioavailabilityelenium bioavailabilityelenium bioavailability and and and and ----activityactivityactivityactivity
unsuccessful due to detection limit issues. However, it is known that the kibble diets in this
study are supplemented with inorganic sodium selenite while the Se in the canned diets in
this study derives solely from the ingredients, which consist mainly of meat and meat by-
products, and thus it is primarily organically bound(41).
It should be acknowledged that apparent digestibility/bioavailability was calculated in this
study. Some of the absorbed Se is excreted via the bile into the faeces(45), which may cause
an underestimation of the Se bioavailability. However, it is not known whether there was a
difference in biliary Se excretion between the diet types. Given the higher dietary fat
concentration in canned diets, it may be assumed that bile excretion is higher in canned
compared to kibble diets, but this does not necessarily mean a higher Se excretion via bile.
Gregus et al.(46) suggest that Se excretion via bile is enhanced by binding to an organic
acid. So, if there was a difference in the amount of Se excreted via the bile, this may also
be due to a difference in Se speciation.
Taking blood GPx concentration as a measure for bioactivity may suggest a superior
antioxidant function of canned diets, but this was not associated with a higher
concentration of the oxidative stress parameter, isoprostanes. It cannot be excluded that a
difference between diet types may be found if other parameters of oxidative stress were
measured or if IsoP’s were measured during a longer period.
Like GPx, iodothyronine deiodinases are also Se-dependent proteins. Several studies have
shown that a higher dietary Se concentration has a positive influence on the T3:T4 ratio in
humans(33), kittens(17; 32) and dogs(17; 47). In this study, no effect on T3:T4 ratio was found and
they were shown to be within a clinically normal range(48). This may be because the
difference in bioavailable Se was not large enough between diet types. Remarkably, no
interactions were found for any of the parameters measured in this study. However, there
was a negative association between CP intake and both GPx and serum Se, irrespective of
diet type. It is unlikely that Se intake was responsible for these results as there was no
negative, but actually a positive association between Se and CP intake. Se bioavailability
was also not significantly associated with CP intake, therefore, unlikely to be responsible for
the negative association between bioactivity and CP intake. Furthermore, urinary Se
excretion corrected for bioavailable Se decreased with increasing CP intake, which suggests
a higher retention with increasing CP intake. The higher amount of retained Se was not
incorporated into GPx, but left in the blood stream as serum Se or excreted via the urine.
Therefore, taken together it is very likely that a part of the Se from canned diets was
incorporated into body proteins as selenomethionine instead of methionine. The negative

Chapter 4
SSSSelenium bioavailabilityelenium bioavailabilityelenium bioavailabilityelenium bioavailability and and and and ----activityactivityactivityactivity
121
association between CP intake and GPx (U/g Hb) may also have been attributed by a
positive effect of dietary CP on the Hb concentration of the blood.
To clarify whether the effects found in this study were attributed to the absolute amount of
Se or the Se species, semi-purified diets could be used in the future. However, it is a
challenge and maybe even impossible to manufacture diets with two different processing
types, using exactly the same ingredients. Furthermore, such a study would not be relevant
for the Se bioavailability and -activity of commercially available diets.
In conclusion, the diet type, whether this is caused by processing, Se speciation, or
otherwise, causes canned diets to have a lower apparent Se bioavailability, but a higher
amount of the bioavailable Se is retained in the body, which possibly enhanced Se
bioactivity (at least in U/g Hb). So the can can, what the kibble can't. This study suggests
that the recommendation for Se inclusion levels in pet foods should take diet type into
account. Further studies are warranted to quantify the exact origin of the difference
between the diet types, but this requires valid and sensitive parameters to monitor Se
adequacy. The impact of processing conditions and protein sources on Se bioavailability
and -activity is another topic that warrants more investigation. It should be noted that it is
not sufficient to solely measure Se bioavailability, because bioactivity and urinary excretion
measurements may give a different picture. Therefore, the choice of parameters can be
crucial for the conclusion when studying nutritional modulation of Se status in animals.
4.6 Acknowledgements
The authors express their special thanks to Joachim Neri of the Department of Applied
Analytical and Physical Chemistry at the Faculty of Bioscience Engineering of Ghent
University for total Se analyses and to Daniel Vermeulen of the Division of Livestock,
Nutrition and Quality at the Science, Engineering and Technology group of the Catholic
University of Leuven for the thyroid hormone analyses.
4.7 References
1. Tinggi U (2008) Selenium: its role as antioxidant in human health. Environmental Health
and Preventive Medicine 13131313, 102-108. 2. van Vleet JF (1975) Experimentally induced vitamin E-selenium deficiency in the growing
dog. Journal of the American Veterinary Medical Association 166166166166, 769-774. 3. Schneider HA (1936) Selenium in Nutrition. Science 83838383, 32-34. 4. Clark LC, Combs GF, Turnbull BW et al. (1996) Effects of selenium supplementation for
cancer prevention in patients with carcinoma of the skin a randomized controlled trial - A randomized controlled trial. Journal of the American Medical Association 276276276276, 1957-1963.

122 Chapter 4
SSSSelenium bioavailabilityelenium bioavailabilityelenium bioavailabilityelenium bioavailability and and and and ----activityactivityactivityactivity
5. Clark LC, Dalkin B, Krongrad A et al. (1998) Decreased incidence of prostate cancer with selenium supplementation: Results of a double-blind cancer prevention trial. British
Journal of Urology 81818181, 730-734. 6. Selenius M, Rundlöf AK, Olm E et al. (2010) Selenium and the selenoprotein thioredoxin
reductase in the prevention, treatment and diagnostics of cancer. Antioxidants & Redox
Signaling 12121212, 867 - 880. 7. Hughes DJ, Fedirko V, Jenab M et al. (2015) Selenium status is associated with colorectal
cancer risk in the European prospective investigation of cancer and nutrition cohort. International Journal of Cancer 136136136136, 1149-1161.
8. de Lorgeril M, Salen P, Accominotti M et al. (2001) Dietary and blood antioxidants in patients with chronic heart failure. Insights into the potential importance of selenium in heart failure. European Journal of Heart Failure 3333, 661-669.
9. Toufektsian M-C, Boucher F, Pucheu S et al. (2000) Effects of selenium deficiency on the response of cardiac tissue to ischemia and reperfusion. Toxicology 148148148148, 125-132.
10. World C, Yamawaki H, Berk B (2006) Thioredoxin in the cardiovascular system. Journal of
Molecular Medicine 84848484, 997-1003. 11. Shrimali RK, Irons RD, Carlson BA et al. (2008) Selenoproteins Mediate T Cell Immunity
through an Antioxidant Mechanism. Journal of Biological Chemistry 283283283283, 20181–20185. 12. Carlson BA, Yoo M-H, Shrimali RK et al. (2010) Role of selenium-containing proteins in T-
cell and macrophage function. Proceedings of the Nutrition Society 69696969, 300-310. 13. Lippman SM, Klein EA, Goodman PJ et al. (2009) Effect of selenium and vitamin E on risk
of prostate cancer and other cancers: the Selenium and Vitamin E Cancer Prevention Trial (SELECT). Journal of the American Medical Association 301301301301, 39-51.
14. Zentek J (2007) A changing landscape: the pet food market in Europe. http://en.engormix.com/MA-feed-machinery/formulation/articles/changing-landscape-pet-food-t423/p0.htm (accessed 13 July 2015).
15. Aldrich G (2006) Rendered products in pet food. In Essential rendering All about the
animal by-product industry, pp. 159-177 [DL Meekers, editor]. Virginia: National Renderers Association.
16. FEDIAF (2013) Nutritional Guidelines for Complete and Complementary Pet Food for Cats
and Dogs. Brussels: European Pet Food Industry Federation. 17. Wedekind KJ, Combs GF, Jr. (2000) Selenium in Pet Foods - Is Bioavailability an Issue?
Compendium on Continuing Education for the Practicing Veterinarian 22222222, 17-22. 18. Wedekind KJ, Cowell C, Combs GF, Jr. (1997) Bioavailability of selenium in petfood
ingredients. FASEB Journal 11111111, A360. 19. Todd SE, Thomas DG, Bosch G et al. (2012) Selenium status in adult cats and dogs fed high
levels of dietary inorganic and organic selenium. Journal of Animal Science 90909090, 2549-2555. 20. van Zelst M, Hesta M, Alexander LG et al. (2015) In vitro selenium accessibility in dog
foods is affected by diet composition and type. British Journal of Nutrition 113113113113, 1888-1894.
21. Souci SW, Fachmann W, Kraut H (2008) Food Composition and Nutrition Tables. vol. 7th revised and completed edition. Stuttgart: MedPharm Scientific Publishers.
22. National Research Council (2006) Nutrient requirements of dogs and cats. [Rev. ed, Animal
nutrition series. Washington D.C.: National Academies Press. 23. Wedekind KJ, Bever RS, Combs GF, Jr. (1998) Is Selenium addition necessary in pet foods?
FASEB Journal 12121212, A823.

Chapter 4
SSSSelenium bioavailabilityelenium bioavailabilityelenium bioavailabilityelenium bioavailability and and and and ----activityactivityactivityactivity
123
24. Todd SE, Thomas DG, Hendriks WH (2011) Selenium balance in the adult cat in relation to intake of dietary sodium selenite and organically bound selenium. Journal of Animal
Physiology and Animal Nutrition 96969696, 148-158. 25. Dumont E, Vanhaecke F, Cornelis R (2006) Selenium speciation from food source to
metabolites: a critical review. Analytical and Bioanalytical Chemistry 385385385385, 1304-1323. 26. Koller G, Patka E, Huck B et al. (1984) Abbild und Emotion : österreichischer Realismus
1914-1944. Wien: Edition Tusch. 27. Rotruck JT, Pope AL, Ganther HE et al. (1972) Selenium: Biochemical Role as a Component
of Glutathione Peroxidase. Science 179179179179, 588-590. 28. Payne RL, Southern LL (2005) Changes in glutathione peroxidase and tissue selenium
concentrations of broilers after consuming a diet adequate in selenium. Poultry Science 84848484, 1268-1276.
29. Wedekind KJ, Yu S, Combs GF, Jr. (2004) The selenium requirement of the puppy. Journal
of Animal Physiology and Animal Nutrition 88888888, 340-347. 30. Todd SE (2006) Metabolism of Selenium in Cats and Dogs. PhD thesis, Massey University. 31. Basu S (2007) The enigma of in vivo oxidative stress assessment: isoprostanes as an
emerging target. Scandinavian Journal of Food and Nutrition 51515151, 48-61. 32. Yu S, Howard KA, Wedekind KJ et al. (2002) A low-selenium diet increases thyroxine and
decreases 3,5,3'triiodothyronine in the plasma of kittens. Journal of Animal Physiology and
Animal Nutrition 86868686, 36-41. 33. Olivieri O, Girelli D, Azzini M et al. (1996) Low selenium status in the elderly influences
thyroid hormones. Clinical Science 89898989, 637-642. 34. German AJ, Holden SL, Moxham GL et al. (2006) A simple, reliable tool for owners to
assess the body condition of their dog or cat. Journal of Nutrition 136136136136, 2031S-2033S. 35. Darras VM, Visser TJ, Berghman LR et al. (1992) Ontogeny of type I and type III deiodinase
activities in embryonic and posthatch chicks: relationship with changes in plasma triiodothyronine and growth hormone levels. Comparative Biochemistry and Physiology 103A103A103A103A, 131-136.
36. Lavu RVS, Willekens K, Vandecasteele B et al. (2012) Fertilizing soil with Selenium fertilizers: impact on concentration, speciation and bioaccessibility of Selenium in leek (Allium ampeloprasum). Journal of Agricultural and Food Chemistry 60606060, 10930-10935.
37. ISO (2005) Animal Feeding Stuffs - Determination of nitrogen content and calculation of
crude protein content - Part 1: Kjeldahl method (ISO 5983-1). Geneva, Switzerland: International Organization for Standardization.
38. Myers WD, Ludden PA, Nayigihugu V et al. (2004) Technical Note: A procedure for the preparation and quantitative analysis of samples for titanium dioxide. Journal of Animal
Science 82828282, 179-183. 39. RStudio (2013) RStudio: Integrated development environment for R, 0.98.507 ed. Boston,
MA: RStudio. 40. Pinheiro J, Bates D, DebRoy S et al. (2014) nlme: Linear and Nonlinear Mixed Effects
Models, 3.1-117 ed. Vienna: R Foundation for Statistical Computing. 41. Young VR, Nahapetian A, Janghorbani M (1982) Selenium bioavailability with reference to
human nutrition. American Journal of Clinical Nutrition 35353535, 1076-1088. 42. Waschulewski IH, Sunde RA (1988) Effect of dietary methionine on tissue selenium and
glutathione peroxidase (EC 1.11.1.9) activity in rats given selenomethionine. British
Journal of Nutrition 60606060, 57-68. 43. Reasbeck PG, Barbezat GO, Weber FL et al. (1985) Selenium absorption by canine
jejunum. Digestive Diseases and Sciences 30303030, 489-494.

124 Chapter 4
SSSSelenium bioavailabilityelenium bioavailabilityelenium bioavailabilityelenium bioavailability and and and and ----activityactivityactivityactivity
44. Edozien JC, Switzer BR (1977) Effects of Dietary Protein, Fat and Energy on Blood Hemoglobin and Hematocrit in the Rat. The Journal of Nutrition 107107107107, 1016-1021.
45. McConnell KP, Martin RG (1952) Biliary excretion of selenium in the dog after administration of sodium selenate containing radioselenium. Journal of Biological
Chemistry 194194194194, 183-190. 46. Gregus Z, Perjési P, Gyurasics Á (1998) Enhancement of selenium excretion in bile by
sulfobromophthalein: elucidation of the mechanism. Biochemical Pharmacology 56565656, 1391-1402.
47. Wedekind KJ, Kirk CA, Nachreiner RF et al. (2001) Effect of varying selenium (Se) intake on thyroid hormone metabolism in dogs. FASEB Journal 15151515, A953.
48. Kantrowitz LB, Peterson ME, Melián C et al. (2001) Serum total thyroxine, total triiodothyronine, free thyroxine, and thyrotropin concentrations in dogs with nonthyroidal disease. Journal of the American Veterinary Medical Association 219219219219, 765-769.

Biomarkers of _______________________________________________________
Biomarkers of selenium status in dogs_____________________________________________________________________________________________________________
Chapter 5
selenium status in dogs______________________________________________________

"Biomarkers of selenium status in dogs"
Mariëlle van Zelst1, Myriam Hesta1, Kerry Gray2, Ruth Staunton2, Gijs Du Laing3, Geert P.J.
Janssens1*
1 Department of Nutrition, Genetics and Ethology, Faculty of Veterinary Medicine, Ghent
University, Merelbeke, Belgium
2 WALTHAM® Centre for Pet Nutrition, Waltham-on-the-Wolds, Leicestershire, United Kingdom
3 Department of Applied Analytical & Physical Chemistry, Faculty of Bioscience Engineering, Ghent
University, Ghent, Belgium
Submitted to BMC Veterinary Research

Chapter 5
Biomarkers of seleniumBiomarkers of seleniumBiomarkers of seleniumBiomarkers of selenium statusstatusstatusstatus
127
5.1 Abstract
Inadequate dietary selenium (Se) intake in humans and animals can lead to long-term
health problems, such as cancer. In view of the owner’s desire for healthy longevity of
companion animals, the impact of dietary Se provision on long-term health effects warrants
investigation. Little is currently known regards biomarkers, and rate of change of such
biomarkers in relation to dietary selenium intake in dogs. In this study, selected biomarkers
were assessed for their suitability to detect changes in dietary Se in adult dogs within eight
weeks.
Twenty-four dogs were fed a semi-purified diet with an adequate amount of Se (46.1 µg/MJ)
over an 8 week period. They were then divided into two groups. The first group remained
on the adequate Se diet, the second were offered a semi-purified diet with a low Se
concentration (6.5 µg/MJ; 31% of the FEDIAF minimum) for 8 weeks. Weekly urine and blood
was collected and hair growth measurements were performed. The urinary Se to creatinine
ratio and serum Se concentration were significantly lower in dogs consuming the low Se
diet from week 1 onwards, by 84% and 7% respectively. Serum and whole blood
glutathione peroxidase were also significantly lower in dogs consuming the low Se diet from
weeks 6 and 8 respectively. None of the other biomarkers (mRNA expression and serum
copper, creatine kinase, triiodothyronine:thyroxine ratio and hair growth) responded
significantly to the low Se diet over the 8 week period.
This study demonstrated that urinary Se to creatinine ratio, serum Se and serum and whole
blood glutathione peroxidase can be used as biomarkers of selenium status in dogs. Urinary
Se to creatinine ratio and serum Se concentrations responded faster to decreased dietary
Se than the other parameters. This makes these biomarkers candidates for early screening
of long-term effects of dietary Se provision on canine health.
5.2 Introduction
Selenium (Se) is an essential trace element in dogs(1). It is involved in many aspects of canine
physiology, such as anti-oxidant protection(2), thyroid hormone metabolism(3), and immune
function(4). Although no naturally occurring clinical cases of Se deficiency or toxicity have
been reported in dogs(1), an inadequate Se status is associated with long-term health effects,
such as calcium oxalate calculi(5-6) and cancer(7-8) formation.
Considering the importance dog owners place on the healthy longevity of their pets(9-10), the
health effects of dietary Se intake should be studied in more detail. Measuring only the
dietary Se content is not sufficient to study effects of Se on metabolism as the bioactivity of
Se, defined as the amount of dietary Se that can be incorporated into selenoproteins such

128 Chapter 5
Biomarkers of seleniumBiomarkers of seleniumBiomarkers of seleniumBiomarkers of selenium statusstatusstatusstatus
as glutathione peroxidase (GPx), is affected by many factors(11). Long-term studies are costly
and difficult to perform, and therefore biomarkers are needed which can identify Se-
induced changes in metabolism at an early stage.
There is currently no literature on specific and sensitive biomarkers of dietary Se intake in
dogs, which confounds the accurate assessment of Se status. The main tissues and body
fluids for minimally-invasive measurement of Se concentration are whole blood, plasma,
serum, erythrocytes, urine, hair, and nails(12). In this study biomarkers were selected to assess
their sensitivity to a manipulation of dietary Se concentration in adult dogs.
Glutathione peroxidase (GPx) is the biomarker most often measured to estimate Se
bioactivity(13-15). GPx is a selenoprotein that acts as an anti-oxidant(16) and is currently used as
a proxy of selenium status, although has never been verified as the gold standard. GPx
measurements in chicks receiving different concentrations of Se supplement(17) was used to
inform the existing European minimum recommendation for the Se concentration in dog
foods, which is 17.9 µg/MJ(18).
Secondly, Levander et al.(19) reported that urinary Se excretion in humans consuming a low
Se diet (intake of approximately 35 µg/day) stabilised after 12 days. In cats, urinary Se
concentrations increased dose-dependently within 2 days of Se supplementation with either
sodium selenite or Se yeast at 1.5 and 2.0 mg Se/kg dry matter (DM) compared to 0.45 and
1.0 mg Se/kg DM(20).
The mRNA expression of one of the isoforms of GPx (GPx1) from liver tissue has also been
reported to be a biomarker of Se status in rats(21-22), together with selenoprotein H (SelH),
selenoprotein W (SepW1), thioredoxin reductase 1 (TrxRd1), thioredoxin reductase 2 (TrxRd2),
iodothyronine deiodinase 1 (DIO1), selenoprotein K (SelK), selenoprotein T (SelT), and 15 kDa
selenoprotein (Sep15)(21-22). Although selenoprotein P is the most abundant selenoprotein(23)
and is important in the transport of Se throughout the body(24), its mRNA has been shown to
not be significantly down-regulated in Se deficiency(25).
Data from rats indicates that mRNA from whole blood can be used to measure mRNA
biomarkers for Se status(26). RNA isolated from whole blood for the determination of GPx1
mRNA was expressed at levels comparable to the levels found in liver, kidney and heart
mRNA(26). The expression of GPx1 mRNA in rats on a Se deficient torula yeast diet (0.007 µg
Se/g diet) was only 14% of the GPx1 mRNA expression in rats on a diet supplemented with
0.2 µg sodium selenite/g diet, which was comparable to the fall in liver mRNA(26).
Additionally, hair growth can be included as a biomarker because it has been reported to
be reduced in beagles consuming a dietary Se concentration of 0.09 mg/kg DM (=
approximately 5.5 µg/MJ) after 11 weeks(27). Other indirect measures of Se status, such as

Chapter 5
Biomarkers of seleniumBiomarkers of seleniumBiomarkers of seleniumBiomarkers of selenium statusstatusstatusstatus
129
serum creatine kinase (CK) and the thyroid hormones triiodothyronine (T3) and thyroxine (T4)
were also included. Se is involved in the conversion of T4 into the active form T3(28) and the
T3:T4 ratio has been reported to decrease in puppies(29) and kittens(30) fed low compared to
adequate Se concentrations. Finally, serum CK was increased in piglets fed either a diet
containing no Se, although vitamin E levels were also manipulated in these studies(31).
5.3 Experimental methods
5.3.1 Study design
A longitudinal, controlled and blinded study was performed using 24 adult Labrador
retrievers. The dogs were assigned into 2 groups of 12 dogs, with age, gender and hair
colour as blocking criteria. To ensure an adequate and stable selenium status in both
groups at the start of the experimental period, the dogs received a Se adequate diet for 8
weeks before the experimental period. During this adaptation period, they were sampled
three times (at weeks 2, 5 and 8) for baseline levels of blood and urine parameters and
weekly hair growth measurements were performed. After the adaptation period, one group
continued to receive the adequate Se diet and the other group received a diet with a low
Se concentration for further 8 weeks. Weekly blood and urine samples were taken. In
addition, weekly hair growth was measured. This study was approved by the WALTHAM®
Centre for Pet Nutrition Animal Welfare and Ethical Review Body and was conducted under
UK Home Office Project Licence authorisation.
Table 5.1 Gender*, age, body weight and energy intake of the study dogs per dog group
n
♂
♀
Age (years)
Body weight (kg)
Energy intake (kJ/kg BW0.75)
mean min max mean min max mean min max
Group A 12 6 6 4.6 2.4 6.3 26.7 23.3 30.6 471 361 611
Group B 12 4 8 4.1 2.4 6.3 26.1 22.6 31.2 424 346 525 kJ, kilojoule; BW0.75, metabolic body weight; n, number of dogs; ♂, male; ♀, female; min, minimum;
max, maximum * All dogs were spayed/neutered. Both dog groups received the adequate Se diet in the 8-week pre-feeding period. Dog group A continued to receive the adequate Se diet in the 8-week experimental period and dog group B switched to the low Se diet.
5.3.2 Dogs
Twenty-four adult Labrador retrievers (14 female and 10 male) were selected for this study.
The average age, body weight (BW) and energy intake in kJ/kg metabolic body weight
(BW0.75) per dog group are shown in Table 5.1. All dogs had an ideal body condition score

130 Chapter 5
Biomarkers of seleniumBiomarkers of seleniumBiomarkers of seleniumBiomarkers of selenium statusstatusstatusstatus
Table 5.2 Analysed* chemical composition of two semi-purified diets with an adequate or low selenium concentration
Component (g/MJ, except where specified)
Adequate Se diet
Low Se diet
Dry matter (g/100g as is) 92.8 92.7
Crude protein 14.9 14.9
Crude fat 5.8 5.8
Crude fibre 1.6 1.5
Nitrogen free extract† 35.5 35.4
Starch 13.6 13.1
Crude ash 2.5 2.4 Metabolisable energy (MJ/kg DM)‡ 16.6 16.7
Amino acids
Lysine 0.36 0.38
Methionine 0.32 0.36
Cysteine 0.36 0.36
Fatty acids
Linoleic acid 1.35 0.96
α-Linolenic acid (mg/MJ ME) 91 113
Arachidonic acid (mg/MJ ME) 22.6 9.3
EPA & DHA (mg/MJ ME) 6.9 6.5
Minerals (mg/MJ ME)
Calcium 383 388
Phosphorus 299 304
Zinc 6.5 6.5
Iron 3.4 3.9
Copper 0.48 0.68
Iodine 0.08 0.08
Selenium (µg/MJ ME) 46.1 6.5
Selenium (µg/100 g DM) 76.5 10.8
Vitamins (mg/MJ ME)
d-α-tocopherol 1.8 1.8
Riboflavin 0.45 0.44
Pyridoxine 0.14 0.22
Retinol 0.16 0.16 MJ, megajoule; ME, metabolisable energy; EPA, Eicosapentaenoic acid; DHA, docosahexaenoic acid * All analyses were performed by Eurofins Food Testing, Wolverhampton, UK
† Calculated by substracting the amount (as g/100g as is) of crude fat, protein, ash and fibre from the percentage dry matter and dividing this by the metabolisable energy concentration (MJ/kg as is) ‡ Calculated using predictive equations for ME(1) Both dog groups received the adequate Se diet in the 8-week pre-feeding period. Dog group A continued to receive the adequate Se diet in the 8-week experimental period and dog group B switched to the low Se diet.
Chapter 5
Biomarkers of seleniumBiomarkers of seleniumBiomarkers of seleniumBiomarkers of selenium statusstatusstatusstatus
131
(BCS) of D on the S.H.A.P.E™ BCS-scale(32). Body weight and BCS was recorded before the
start of the adaptation period and thereafter every week. The dogs were fed individually,
once a day at 8:30 h, to energy requirements in order to maintain BW and BCS. They had
access to fresh drinking water at all times. Food intake was also recorded throughout the
study. Dogs were housed indoors in triplets with others of the same diet group with
continuous access to an outside pen and access to an outside paddock during the day.
5.3.3 Diets
Two semi-purified diets (Ssniff spezialdiäten GmbH, Soest, Germany) were used, one Se-
adequate and one containing a low amount of Se (Table 5.2). Diets were formulated to be
nutritionally complete for dogs with energy requirements of at least 397 kJ (95 kcal)/kg
BW0.75. Both diets had the same nutritional formulation, except for Se concentration. The Se
adequate diet contained 46.1 µg Se/MJ and the low Se diet 6.5 µg Se/MJ, which is 31% of
the FEDIAF recommended minimum for dogs with an energy intake of 95 kcal/kg BW0.75(18).
Se concentration from the ingredients was approximately 0.75 µg/MJ. Supplementary Se was
in the form of sodium selenite.
5.3.4 Blood samples
At weeks 2, 5 and 8 of the pre-feed period and weekly during the experimental period,
blood samples (10.5 ml) were taken from each dog by jugular venipuncture using a 21
gauge needle. Blood was collected into a 2.5 ml PAXgene tube, 2 Microvette® 500 µl
lithium-heparin tubes, one 300 µl fluoride-heparin tube, one 200 µl Tri-Kalium-EDTA tube
and two 4 ml Vacuette® z serum clot activator tubes (one of them filled with only 2.5ml of
blood). The PAXgene tubes were incubated at room temperature for 2 hours and stored at -
20°C for mRNA expression analysis. One of the lithium-heparin tubes was immediately
stored at -80°C and used for whole blood glutathione peroxidase (GPx) analysis at the end
of the study, which is considered to be more valid than analysing the fresh samples
immediately (see Supplement). The other heparin tubes were centrifuged (accuSpin™ Micro
R, Fisher Scientific™, Pittsburgh, PA, USA) immediately after collection at 1680 ×g and 4°C for
10 min. Lithium-heparin plasma was analysed for general biochemistry parameters and
fluoride-heparin plasma for glucose (Spectrophotometry, Olympus AU400). EDTA tubes were
placed on a roller at room temperature until analysis for haematology parameters (Orphée
Mythic 18 Vet analyser) within 4 hours of collection. Serum tubes were incubated for 30 min
on ice and then centrifuged (Sigma 6K15, rotor 11150, cups 13550, Sigma GmbH, Osterode
am Harz, Germany) for 10 min. at 2000 ×g and 4°C. Serum samples were divided into

132 Chapter 5
Biomarkers of seleniumBiomarkers of seleniumBiomarkers of seleniumBiomarkers of selenium statusstatusstatusstatus
Eppendorfs and stored at -80°C for analysis of GPx, Se, triiodothyronine (T3), thyroxine (T4),
copper (Cu) and creatine kinase (CK) at the end of the study.
5.3.5 Urine samples
Free catch urine was collected weekly after feeding (between 8:30 and 16:00 h), using a
Uripet urine collection device (Rocket Medical plc. Watford, England). From all urine samples,
1 ml was stored in an Eppendorf at -80°C and analysed for creatinine (CT) within one month
after sampling (IDEXX laboratories, UK). The rest of the samples were stored at -20°C and
analysed for total Se content (ICP-MS, PerkinElmer DRC-e, Waltham, USA).
5.3.6 Hair growth measurements
Hair growth was measured according to a method adapted from Yu et al.(27). Due to
practical issues only chocolate and black Labradors were used for the hair growth
measurements (5 black, 1 chocolate for the adequate Se diet and 6 black, 1 chocolate for
the low Se diet). At the start of the pre-feed and experimental period, an area in the groin
of approximately 5 x 5 cm was shaved with a 40 mm blade (Andis Super AGR+ cordless
clipper; Andis Company Corporate, Sturtevant, Wisconsin, USA). Directly after shaving, the
area was marked with a Duramark permanent marker. The shaved area was covered with a
glass slide with a ruler attached to it, and a picture was taken using a Canon EOS 1000D
digital camera with EF50mm f/2.5 compact-macro lens (Canon Inc., Melville, New York, USA)
and Hoya PRO1 Digital Polarising Filter (HOYA Optics, Milpitas, California, USA). The glass
slide was also used to flatten the hairs, when it had grown back in the following weeks to
accurately measure them. Pictures were taken weekly during the pre-feed and experimental
periods and were analysed with ImageJ analysing software(33). Hair growth (mm/week) was
measured as the difference of the average length of the hairs within the marked box
between two consecutive pictures.
5.3.7 Chemical analyses
Biochemistry and glucose analyses were carried out using spectrophotometry (Olympus
AU400, Olympus Inc.) with Beckman Coulter reagents (Beckman Coulter Biomedical) within
20 mins of sampling. Haematology parameters were analysed using a Mythic 18 Vet
analyser (Orphée S.A.). Serum and urine samples were prepared for total Se analyses with
closed vessel microwave destruction as described in van Zelst et al.(34). Se was analysed
using inductively coupled plasma-MS (ICP-MS, Elan DRC-e, PerkinElmer), as described by

Chapter 5
Biomarkers of seleniumBiomarkers of seleniumBiomarkers of seleniumBiomarkers of selenium statusstatusstatusstatus
133
Lavu et al.(35). Urine CT was determined using a creatinine kit based on the Jaffe reaction
(OSR6178, Beckman Coulter Biomedical, IDEXX Laboratories, London, UK).
Serum Cu and CK were analysed with the Randox copper and CK NAC-activated kit
(Randox laboratories, London, UK), respectively, as per the manufacturer’s instructions.
Thyroid hormones were analysed with canine T3 and T4 enzyme-linked immunosorbent
assay (ELISA) kits (Cusabio, Wuhan, China). Whole blood GPx was analysed using the Ransel
kit (Randox laboratories) and an Olympus AU400 spectrophotometer as per the
manufacturer’s instructions. A 4-point calibration curve was used as control, with a 1:11, 1:21,
1:41 and 1:61 dilution. Whole blood and serum GPx analysis of the samples had an average
coefficient of variation of 1.9% and 2.0%, respectively. The 4-point calibration curve showed
a recovery of 74.5, 87.1, 98.6, and 100.6%, respectively.
mRNA expression was performed for the three baseline samples and the samples of weeks
2, 4, 6, and 8 of the experimental period. Total RNA, for mRNA expression, was isolated from
the PAXgene tubes using the PAXgene blood RNA kit (Qiagen, Manchester, UK) as per the
manufacturer’s instructions. The RNA was eluted in 2 x 40 µl of the elution buffer. Further
DNase digestion of the RNA solution was carried out using RQ1 RNase-Free DNase
(Promega, Southampton, UK) as per the manufacturer's instructions with the sample incubated
for 30 min at 37°C. In order to remove the DNase and reaction buffer from the purified
RNA, it was passed through the RNeasy Mini Kit using the RNA clean-up protocol and was
eluted in 2 x 40µl of elution buffer (10mM Tris HCl, pH 8.4). The RNA concentration in the
eluate was measured using the Qubit RNA Assay Kit (Invitrogen, Paisley, Scotland).
Primers and probes were designed using Primer3(36) and M-Fold using the canine specific
GenBank (37) sequences for GPx1, SelH, SepW1, TrxRd1, TrxRd2, DIO1, SelK, SelT, Sep15,
tumor necrosis factor alpha (TNF-α), and nuclear factor kappa-light-chain-enhancer of
activated B cells (NFκB) as described by Peters et al.(38). The assays for the potential
housekeeper genes were the same as described in Peters et al.(39).
Synthesis of complementary DNA (cDNA) was carried out with 750ng of random hexamers
using the ImProm-II Reverse Transcription System (Promega, Southampton, UK) and 750 ng of
total RNA (as measured by the Qubit) in a final volume of 30 µl. All reactions were
prepared according to the manufacturer’s instructions giving a final magnesium chloride
concentration of 3 mM. The cDNA synthesis was carried out by mixing the RNA with the
random primers in a reaction tube. Samples were heated to 70°C for 5 min in the PTC-200
DNA engine (Bio-Rad Laboratories, Hemel Hempstead, UK) before cooling to 4°C for 5 min.
Tubes were placed in a cold block before addition of the reaction buffer, deoxynucleotides
(dNTP’s), magnesium chloride, reverse transcriptase enzyme mix and water to make a total

134 Chapter 5
Biomarkers of seleniumBiomarkers of seleniumBiomarkers of seleniumBiomarkers of selenium statusstatusstatusstatus
Ta
ble
5.3
Prim
er and p
robe s
equence
s use
d for positive
control and q
PCR a
ssays
Pro
du
ct
Siz
e
114
113
148
116
60
95
84
65
79
84
124
99
90
123
qPCR, quantita
tive
poly
mera
se c
hain
reaction; G
Px1
, glu
tath
ione p
ero
xidase
1; SelH
, se
lenopro
tein
H; SepW
1, se
lenopro
tein
W; Trx
Rd1,
thio
redoxi
n reducta
se 1
; Trx
Rd2, th
iore
doxi
n reducta
se 2
; DIO
1, io
doth
yro
nin
e d
eio
din
ase
1; SelK
, se
lenopro
tein
K; SelT
, se
lenopro
tein
T; Sep15,
15 k
Da s
ele
nopro
tein
; TN
F-α
, tu
mor necro
sis
facto
r alp
ha; N
FκB
1, nucle
ar fa
cto
r kappa-lig
ht-chain
-enhancer of activa
ted B
cells
; B2M
, beta
-2-
mic
roglo
bulin; G
APDH, gly
cera
ldehyde 3
-phosp
hate
dehydro
genase
; HPRT1, hypoxa
nth
ine p
hosp
horibosy
ltra
nsfera
se 1
Pro
be
AA
GTTG
GG
CTCG
AA
CC
CG
CC
CTTG
AG
TTTG
CG
TG
GG
GG
CC
AA
AG
AA
GCCG
GTG
GCC
TG
GG
TG
GCTCA
GA
GG
CTTTA
TG
CTG
GC
AG
AG
GG
GCG
GCCCG
AG
CT
AG
GTG
GCCG
TG
GG
CA
AA
GTG
TG
ATG
GA
AG
AG
GG
CCA
CCA
GG
TG
TG
TTTCC
TG
AG
GTTA
TA
GG
CG
GG
CG
GG
GCA
GA
GTTTTCA
TCA
GA
AG
C
CG
CTTCG
CCG
TCTCC
TA
CCA
TG
GTCG
GCTTTG
CA
AA
CCTG
GG
AG
ACCTG
TC
TTTCA
GCA
AG
GA
CTG
GA
CC
CA
GG
GCTG
CTTTTA
AC
TC
TG
GCA
AA
GTG
GA
TG
CTG
GTG
AA
AA
GG
ACCCC
TCG
Re
ve
rse
Pri
me
r
TTCA
CC
TCG
CA
CTTCTCA
AA
CTTCTG
CC
CA
AA
CA
CC
CTA
C
CC
TCTCTTC
TTG
GA
GTG
AA
CCA
CA
GG
CA
CCA
TA
TTC
CA
AA
GG
CCA
TTA
TA
GCCG
TG
GG
TG
TC
CCA
CG
ATG
TG
TTG
CTTG
ACT
TTA
ATTCG
ACC
CA
TTCTTC
TG
G
CCG
CA
TG
TA
CTC
CTCA
AA
CA
CA
AG
TTG
CTG
GA
GA
AG
CCTA
A
AG
GG
CTCTTG
ATG
GCA
GA
GA
CTCTG
TCA
TTCG
TG
CTTC
CA
CC
TG
CTCA
TTG
GG
AG
TG
AA
TG
AA
GG
GG
TCA
TTG
ATG
GCG
ACA
AA
GTCA
GG
TTTA
TA
GCCA
ACA
Fo
rwa
rd P
rim
er
GTTCG
GG
CA
TCA
GG
AA
AA
C
GG
AG
CTTTG
GA
CTG
GG
ATT
GG
CTA
CA
AG
TC
CA
AG
TA
CC
TTCA
G
GTA
GCA
ATCCA
GG
CA
GG
AA
G
TTTA
TG
CCA
TCG
GA
GA
CG
TA
G
GA
GG
CTCTG
GG
TC
CTCTTG
AG
GCTA
TG
GA
AA
CTCCTCTG
ATT
CG
CTG
CTCA
AG
TTC
CA
GA
TT
GG
TCCTTCA
AG
CG
GTG
TCT
CA
TG
TG
CTC
CTCA
CC
CA
CA
C
TG
AG
GA
TG
GG
ATCTG
CA
CT
ACG
GA
AA
GG
AG
ATG
AA
AG
CA
TCA
ACG
GA
TTTG
GC
CG
TA
TTG
G
CA
CTG
GG
AA
AA
CA
ATG
CA
GA
Ge
ne
GPx
1
SelH
SepW
1
Trx
Rd1
Trx
Rd2
DIO
1
SelK
SelT
Sep15
TN
F-α
NF
κB1
B2M
GA
PDH
HPRT1

Chapter 5
Biomarkers of seleniumBiomarkers of seleniumBiomarkers of seleniumBiomarkers of selenium statusstatusstatusstatus
135
volume of 20 µl. Reverse transcription (RT) was undertaken by heating the samples to 25°C
for 5 min, 42°C for 30 min and finally 75°C for 10 min in the PTC-200 DNA engine (Bio-Rad
Laboratories, Hemel Hempstead, UK). Duplicate RT reactions were performed for each RNA
sample. All cDNAs were diluted 1:5 (v/v) for the genes of interest and housekeeper genes
using EB Buffer (10mM Tris-HCl pH-8.4, Qiagen, Manchester, UK) and then stored at -20°C for
future use. No template controls were performed by addition of nuclease-free water in
place of RNA.
Quantitative polymerase chain reaction (qPCR) was performed using GoTaq Colourless
Master Mix (Promega, Southampton, UK) as described by Van de Velde et al.(40). The absence
of genomic contamination of the RNA samples was confirmed prior to the RT reactions and
none of the samples showed evidence of amplifiable genomic DNA with the succinate
dehydrogenase complex, subunit A qPCR assay. One qPCR reaction was run for each RT
repeat resulting in two threshold values (Ct) for each RNA sample. A mean Ct value was
calculated for each sample using the two measured Ct values for each dog for each of the
potential housekeeper genes. The mean Ct value was converted to a relative copy number
value using the EδCt method (E: reaction efficiency as determined from a standard curve) with
δCt values calculated relative to the sample with the largest Ct (fewest gene copies). The
geNorm visual basics for applications applet for Microsoft Excel was used to determine the
most stable genes from the set of tested genes(41). The three most stable housekeeper genes
for the blood samples were beta-2-microglobulin (B2M), glyceraldehyde 3-phosphate
dehydrogenase (GAPDH), and hypoxanthine phosphoribosyltransferase 1 (HPRT1). The
primer and probe sequences of the genes of interest and these housekeeper genes are
shown in Table 5.3.
Relative copy number expression values were calculated for each sample and normalised
against the housekeeper gene results using the qBase applet for Microsoft Excel which
employs the methodology described by Vandesompele et al.(41). The sample with the fewest
gene copies (latest Ct value) is given a relative copy number of 1 and all other samples are
given values relative to this sample.
In order to assess reaction efficiency of the newly designed assays, a set of primers were
designed for the gene target to amplify a larger fragment, which included the portion
amplified by the qPCR assay. These assays were tested against a cDNA obtained from
RNA extracted from canine blood. Products were separated by 2% agarose gel
electrophoresis, purified by NucleoSpin Extract II kit (Macherey-Nagel, Düren, Germany) and
then quantified by QBit (Invitrogen, Paisley, Scotland). The number of copies per µl of
purified product was calculated and then a 1:10 dilution series from 107 to 1 copy per qPCR

136 Chapter 5
Biomarkers of seleniumBiomarkers of seleniumBiomarkers of seleniumBiomarkers of selenium statusstatusstatusstatus
Table 5.4 Serum biomarker concentrations in dogs fed a diet with a low or adequate selenium concentration
diet adequate-Se low-Se week n mean SE n mean SE p-value
Serum Se (µg/L) 0 12 263 5.3 12 263 4.7 0.987
1 12 271 5.8 11 252 6.1 0.030
2 12 263 3.6 12 245 6.0 0.029
3 12 266 4.5 12 249 6.1 0.050
4 12 261 4.5 12 236 3.5 0.000
5 12 247 5.1 12 240 8.3 0.853
6 12 248 4.6 12 230 6.4 0.024
7 11 254 5.8 12 230 5.7 0.000
8 12 243 4.7 12 224 4.1 0.013
Serum GPx (U/L) 0 12 14884 383 12 15027 323 0.778
1 12 14754 355 11 14175 251 0.228
2 12 15274 353 12 14563 380 0.101
3 12 14726 309 12 14066 296 0.143
4 12 14215 315 12 13644 304 0.250
5 12 14421 304 12 14330 255 0.998
6 12 14968 287 12 14007 313 0.012
7 11 15052 349 12 14459 232 0.232
8 12 15755 375 12 14579 271 0.001
Serum CK (U/L) 0 12 76 5.6 12 75 6.1 0.912
1 10 79 6.3 10 75 5.2 1.000
2 12 73 7.2 12 72 6.7 1.000
3 12 84 10.7 11 75 5.9 0.965
4 12 61 7.7 12 58 3.3 1.000
5 12 45 4.4 12 54 5.2 0.837
6 12 60 8.8 12 51 4.6 0.858
7 11 52 3.8 11 56 4.5 1.000
8 12 52 2.9 12 54 4.0 1.000
Serum T3:T4 0 12 0.031 0.001 12 0.029 0.001 0.093
1 11 0.031 0.001 11 0.029 0.001 0.998
2 12 0.031 0.001 12 0.031 0.001 0.987
3 12 0.034 0.001 11 0.033 0.001 1.000
4 12 0.038 0.001 12 0.033 0.001 0.144
5 12 0.034 0.001 12 0.033 0.001 0.999
6 12 0.034 0.001 12 0.031 0.001 0.900
7 11 0.035 0.001 12 0.033 0.001 0.997
8 12 0.036 0.001 12 0.035 0.001 0.996
Serum Cu:Cu intake 0 12 15.8 1.0 12 19.3 1.2 0.033
1 7 32.1 2.5 8 22.8 3.5 0.985
2 8 21.4 1.5 11 18.2 1.0 1.000
3 12 23.2 1.6 10 20.0 1.0 0.944
4 11 26.7 2.2 12 20.2 1.3 0.919
5 12 17.4 0.8 12 14.8 0.7 0.999
6 11 16.4 1.0 10 13.5 0.7 1.000
7 8 17.5 1.0 6 13.1 1.0 1.000
8 12 19.6 1.3 11 15.4 0.7 1.000 Se, selenium; n, number of dogs; SE, standard error; GPx, glutathione peroxidase; CK, creatine kinase; T3, triiodothyronine; T4, thyroxine; Cu, copper. Values at weeks zero indicate the average baseline values. Means and standard errors are based on the raw data.

Chapter 5
Biomarkers of seleniumBiomarkers of seleniumBiomarkers of seleniumBiomarkers of selenium statusstatusstatusstatus
137
was analysed in duplicate using the qPCR assay and the reaction efficiency calculated
using the MxPro software.
5.3.8 Statistical analyses
The two primary parameters were whole blood GPx and urinary Se:CT ratio. The secondary
parameters in this study were: Se intake, serum Se, serum GPx, serum CK, serum T3:T4 ratio,
serum Cu relative to Cu intake, hair growth, and mRNA expression for GPx1, SelH, SepW1,
TrxRd1, TrxRd2, DIO1, SelK, SelT, Sep15, TNF-α, and NFκB.
The average of the three baseline measurements were analysed between dog groups with
two-sample Student's t-tests. Using the entire dataset, each parameter was analysed
univariately with a linear mixed effects model in R version 3.1.1 using the nlme package (R
Foundation for Statistical Computing, Vienna, Austria). The fixed effects were diet, week, diet
x week interaction, and baseline of the parameter (the average of the dogs’ three pre-feed
measurements). The random effect was dog. The assumption of normality was assessed for
each model by visual inspection of the residuals and urinary Se:CT, serum Cu and all mRNA
parameters were log transformed. Between diet contrasts were applied in each week and
between week contrasts were applied within each diet. Contrasts on the two primary
parameters were Bonferroni corrected to an overall significance level of 5% (i.e. threshold p-
value of 0.025).
5.4 Results
Se intake during the pre-feed period was similar in the two experimental groups (Group A:
average 22.9 µg/kg BW0.75, range 19.0 - 29.5 µg/kg BW0.75, Group B: average 20.6 µg/kg
BW0.75, range 16.8 - 25.2 µg/kg BW0.75). During the experimental period, average Se intake
for the dogs on the adequate Se diet was 21.7 µg/kg BW0.75 (range 16.6 - 28.2 µg/kg BW0.75)
and for the dogs on the low Se diet was 2.7 µg/kg BW0.75 (range 2.2 - 3.4 µg/kg BW0.75)
which was significantly different comparing each week (p<0.001). There were no significant
differences between the groups for any of the parameters at baseline, except for the serum
Cu:Cu intake ratio (p=0.033).
Urinary Se:CT ratio significantly decreased in dogs on the low Se diet from week 1 onwards
and on average decreased by 84% (Figure 5.1). Whole blood GPx activity was significantly
lower (by 7%) in dogs fed the low Se diet at week 8 (Figure 5.2). Cumulative hair growth
results are shown in Figure 5.3 and no differences between the diets were found. An
overview of the results of all serum measurements is given in Table 5.4. Serum Se
significantly decreased by 7% in dogs fed the low compared to the adequate Se diet from
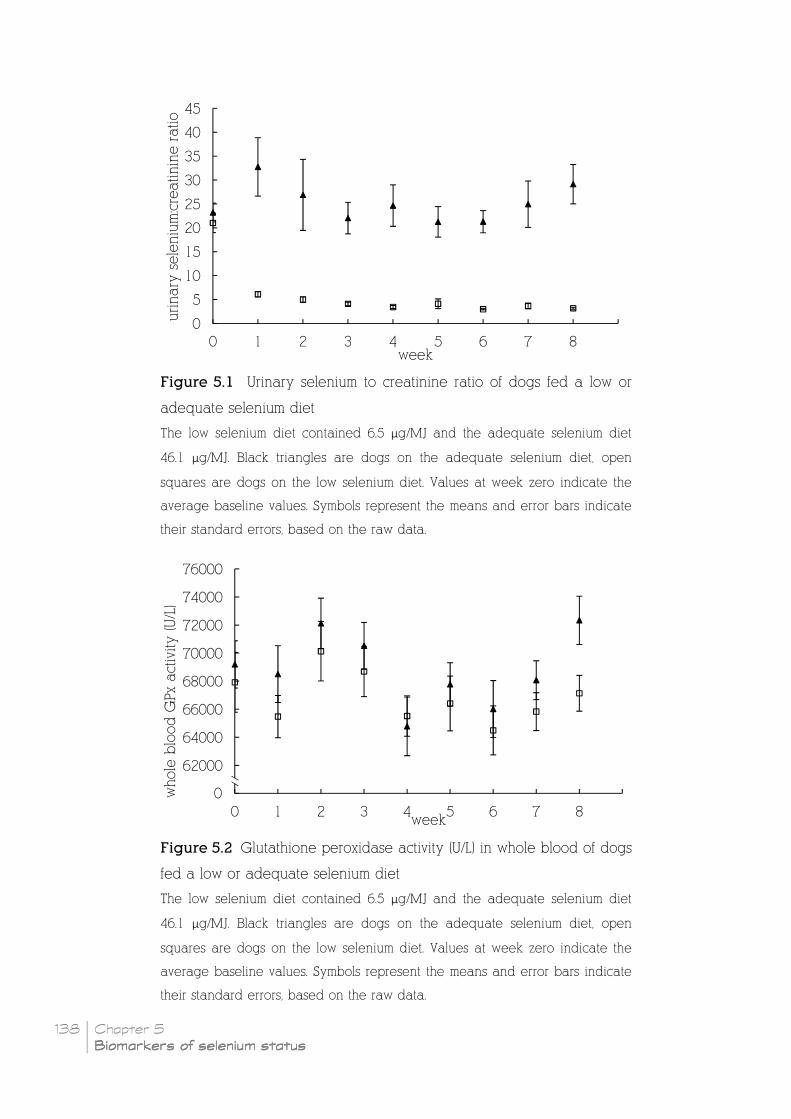
138 Chapter 5
Biomarkers of seleniumBiomarkers of seleniumBiomarkers of seleniumBiomarkers of selenium statusstatusstatusstatus
Figure 5.1 Urinary selenium to creatinine ratio of dogs fed a low or
adequate selenium diet
The low selenium diet contained 6.5 µg/MJ and the adequate selenium diet
46.1 µg/MJ. Black triangles are dogs on the adequate selenium diet, open
squares are dogs on the low selenium diet. Values at week zero indicate the
average baseline values. Symbols represent the means and error bars indicate
their standard errors, based on the raw data.
Figure 5.2 Glutathione peroxidase activity (U/L) in whole blood of dogs
fed a low or adequate selenium diet
The low selenium diet contained 6.5 µg/MJ and the adequate selenium diet
46.1 µg/MJ. Black triangles are dogs on the adequate selenium diet, open
squares are dogs on the low selenium diet. Values at week zero indicate the
average baseline values. Symbols represent the means and error bars indicate
their standard errors, based on the raw data.
0
5
10
15
20
25
30
35
40
45
0 1 2 3 4 5 6 7 8 9
urinary
sele
niu
m:cre
atinin
e ratio
week
60000
62000
64000
66000
68000
70000
72000
74000
76000
0 1 2 3 4 5 6 7 8 9
whole
blo
od G
Px
act
ivity (U/L
)
week
0

Chapter 5
Biomarkers of seleniumBiomarkers of seleniumBiomarkers of seleniumBiomarkers of selenium statusstatusstatusstatus
139
Figure 5.3 Cumulative hair growth (mm) of dogs fed a low or adequate
selenium diet
Hair growth was measured weekly in the groin of Labrador retrievers fed a
diet containing a low (6.5 µg/MJ) or adequate (46.1 µg/MJ) concentration of
selenium. Black triangles are dogs on the adequate selenium diet, open
squares are dogs on the low selenium diet. Values at week zero indicate the
average baseline values at weeks 2, 5 and 8 of the pre-feed period, where
hair had been removed at week 0. Symbols represent the means and error
bars indicate their standard errors, based on the raw data.
week 1 onwards. A significant difference in serum GPx was detected from week 6 (6%
mean decrease from first significance).
None of the mRNA measures were significantly changed by the consumption of the low Se
diet (see Table 5.5). Interestingly, there was an upregulation in both groups in mRNA
expression of SelK, SelT, and Sep15 during the second half of the experimental period
(weeks 2 & 4 vs. weeks 6 & 8) and a downregulation in the expression of SelH, TrxRd1,
TrxRd2, TNF-α, and NFκB (p<0.05).
5.5 Discussion
This study indicated that there was a potential difference in the reaction of biomarkers to
changes in dietary Se concentration. Some of the measured biomarkers reacted within one
week, whilst others did not significantly change within the 8 week study period. The
estimated biomarker reaction time will be dependent on the power for each biomarker and
so, more biomarkers might have been identified as significantly reacting if more dogs were
0
2
4
6
8
10
12
14
16
0 1 2 3 4 5 6 7 8 9
cum
ula
tive
hair g
row
th (m
m)
week

140 Chapter 5
Biomarkers of seleniumBiomarkers of seleniumBiomarkers of seleniumBiomarkers of selenium statusstatusstatusstatus
Table 5.5 Relative� mRNA expression in dogs fed a diet with a low or adequate selenium
concentration
diet adequate-Se low-Se week n mean SE n mean SE p-value
GPx1 0 12 5.52 0.90 12 6.29 1.17 0.611
2 12 5.93a 1.15 12 6.03a 1.35 0.956
4 12 4.80a 0.77 12 4.62a 0.59 1.000
6 12 4.42a 0.49 12 5.92a 1.24 0.950
8 12 5.30a 0.48 12 6.27a 1.28 0.992
SelH 0 12 2.68 0.19 12 3.12 0.23 0.154
2 12 3.58a 0.36 12 4.08a 0.26 0.972
4 12 3.05a 0.29 12 3.38a 0.46 0.993
6 12 2.20b 0.27 12 2.37b 0.19 1.000
8 12 2.27b 0.36 12 2.20b 0.18 0.954
SepW1 0 12 2.16 0.24 12 2.62 0.35 0.286
2 12 2.41a 0.31 12 2.41a 0.26 0.870
4 12 2.48a 0.41 12 2.41a 0.44 0.581
6 12 2.07a 0.26 12 2.05a 0.20 0.868
8 12 2.61a 0.72 12 2.03a 0.30 0.468
TrxRd1 0 12 2.00 0.09 12 1.96 0.06 0.721
2 12 5.54a 0.23 12 4.77a 0.38 0.259
4 12 3.97b 0.26 12 3.89a 0.37 0.995
6 12 1.89bc 0.15 12 1.67b 0.11 0.681
8 12 1.64bc 0.09 12 1.65b 0.15 1.000
TrxRd2 0 12 2.86 0.19 12 3.01 0.20 0.615
2 12 4.04a 0.40 12 3.84a 0.21 1.000
4 12 3.75a 0.40 12 3.61ac 0.42 0.993
6 12 2.25b 0.27 12 2.48bc 0.24 0.910
8 12 3.17ab 0.64 12 2.31b 0.26 0.452
SelK 0 12 13.10 0.78 12 13.72 0.77 0.575
2 12 2.78a 0.25 12 2.95a 0.23 0.998
4 12 2.68a 0.25 12 2.80a 0.33 1.000
6 12 11.42b 0.58 12 12.89b 1.17 0.982
8 12 17.96c 2.01 12 15.91b 1.61 0.538
SelT 0 12 9.72 1.17 12 10.25 1.11 0.746
2 12 4.27a 0.52 12 4.72a 0.52 0.921
4 12 4.85a 0.63 12 5.05a 0.67 0.998
6 12 7.12b 0.74 12 7.97b 1.07 1.000
8 12 7.57b 0.86 12 7.92b 0.85 1.000
Sep15 0 12 2.37 0.15 12 2.47 0.19 0.693
2 12 1.90ac 0.14 12 1.97a 0.11 0.996
4 12 1.87a 0.20 12 1.71a 0.15 0.788
6 12 2.44b 0.16 12 2.66b 0.21 0.962
8 12 2.42bc 0.25 12 2.67b 0.31 0.953

Chapter 5
Biomarkers of seleniumBiomarkers of seleniumBiomarkers of seleniumBiomarkers of selenium statusstatusstatusstatus
141
Table 5.5 continued
diet adequate-Se low-Se week n mean SE n mean SE p-value
TNF-αααα 0 12 3.28 0.30 12 3.54 0.38 0.597
2 12 6.73a 0.91 12 7.03a 0.67 0.990
4 12 6.73a 0.54 12 6.95a 0.66 1.000
6 12 2.89b 0.40 12 3.31b 0.51 0.909
8 12 3.29b 0.34 12 2.91b 0.29 0.681
NFκκκκB 0 12 2.07 0.11 12 2.17 0.12 0.543
2 12 5.18a 0.35 12 5.19a 0.21 1.000
4 12 6.55a 0.34 12 6.26a 0.47 0.946
6 12 1.72b 0.09 12 1.68b 0.13 0.982
8 12 1.87b 0.16 12 1.71b 0.12 0.821 � Samples with the lowest number of gene copies for each gene of interest had a value of 1 with
all other sample values relative to that. Values at weeks zero indicate the average baseline values. Weeks within one gene and diet with a common letter in superscript (mean column) do not significantly differ (p>0.05). qPCR, quantitative polymerase chain reaction; Se, selenium; n, number
of dogs; SE, standard error; GPx1, glutathione peroxidase 1; SelH, selenoprotein H; SepW1, selenoprotein W; TrxRd1, thioredoxin reductase 1; TrxRd2, thioredoxin reductase 2; DIO1, iodothyronine deiodinase 1; SelK, selenoprotein K; SelT, selenoprotein T; Sep15, 15 kDa selenoprotein; TNF-α, tumor necrosis factor alpha; NFκB1, nuclear factor kappa-light-chain-
enhancer of activated B cells; B2M, beta-2-microglobulin; GAPDH, glyceraldehyde 3-phosphate dehydrogenase; HPRT1, hypoxanthine phosphoribosyltransferase 1.
included in the study. The number of dogs in this study (n=24) was selected to ensure 80%
power to detect differences between the diets in the primary measures: urinary Se:CT and
whole blood GPx. This is considered a realistic number to be repeated at other dog
facilities, as larger numbers of dogs are rarely found in research facilities. This study did not
evaluate the effects of Se on dog health, but does give an indication on which parameters
may be used to assess Se associated long-term health effects.
Urinary Se:CT ratio dramatically decreased within one week after changing to the low Se
diet. Urine is the main route of excretion of excess Se(42-43). 24-hour urinary Se concentrations
have previously been demonstrated to correlate well with Se intake in humans(43-44), cats(15; 20),
and dogs(15) and this study demonstrated that the more practical single void sample,
corrected for CT concentration, is a valuable indicator of dietary Se concentration in dogs.
Urinary Se:CT ratio has previously been validated as a proxy measure of 24-hour urinary Se
excretion in humans(45) but has never been measured in diseased dogs (e.g. with cancer), so
there is no dog specific estimate of a safe urinary Se:CT concentration. However, in humans
there are indications that urinary Se reflects Se requirements, as excretion decreases in
healthy children, pregnant women and in people with cancer, where it is likely that Se
requirements are higher compared to healthy individuals(43). This makes urinary Se:CT ratio
142 Chapter 5
Biomarkers of seleniumBiomarkers of seleniumBiomarkers of seleniumBiomarkers of selenium statusstatusstatusstatus
an important biomarker to measure changes in dietary Se intake, but the safe minimum level
of urinary Se:CT ratio that is associated with the prevention of long-term health effects
warrants further research.
Serum Se concentrations also decreased within one week after switching the dogs to the
low Se diet. The average serum Se concentrations of the dogs in this study was 257 µg/L
(range 213-310 µg/L) in the adequate and 238 µg/L (range 172-298 µg/L) in the low Se
group, and fell within the range reported by Forrer et al.(46) (150-340 µg/L) for healthy dogs.
However, dogs in the study of Forrer et al. were healthy at the time of sampling, but were
not monitored during a longer period, so disease may have developed at a later stage.
Pilarczyk et al.(47) found a significantly lower (p<0.01) serum Se concentration in dogs with
malignant neoplasm (range 103-265 µg/L) compared to healthy dogs (range 208-346 µg/L).
This association reinforces the need to verify whether this relationship is causal.
GPx measurements were taken as an indicator of Se bioactivity. Se requirements are often
based on GPx concentrations reaching a plateau(29; 48). However, we do not know if optimal
selenoprotein concentrations are desirable for optimal health. In humans, a blood Se
concentration of 79-95 µg/L is considered sufficient to maximize GPx activity(48). This seems to
be higher in dogs, as the average serum Se concentration of dogs in the low Se group in
the last week of the study was 224 µg/L, where both serum and whole blood GPx
concentrations were significantly lower than in the adequate Se group, and thus not
maximised.
In this study, inorganic Se (sodium selenite) was used as the primary source of Se. This can
be converted to selenocysteine and incorporated into selenoproteins(49). Selenomethionine
cannot be synthesized from inorganic selenium, but may be non-specifically incorporated
into body proteins(50), so using inorganic Se prevents selenomethionine mixing with the
methionine pool and incorporation of selenomethionine into body proteins where it has no
Se specific role(49). The use of selenomethionine (organically-bound Se) would have likely
resulted in a higher retention of Se in the body (i.e. lower excretion) without being
bioactive, and a higher dietary Se requirement may thus apply for organic compared to
inorganic Se species in order to maximize selenoprotein activity.
The body stores of Se may also have had an impact on all biomarkers measured in this
study. In the first part of the study, Se may still have been present in body proteins and
during protein turn-over may have been released to become available for selenoprotein
incorporation (in this study measured as GPx), while in the last few weeks body stores of Se
may have become depleted. It is likely that the amount of stored Se is animal species
specific, as Todd et al.(15) found that cats retain less Se than dogs. This may be linked to the

Chapter 5
Biomarkers of seleniumBiomarkers of seleniumBiomarkers of seleniumBiomarkers of selenium statusstatusstatusstatus
143
evolutionary "feast and famine" feeding approach of dogs, as described by Bosch et al.(51), in
which dogs gorge feed, and during the famine stage, stored Se may be used for
physiological processes.
Serum GPx, in this study, significantly reacted two weeks earlier to a change in dietary Se
compared to whole blood GPx. Similar findings were reported in cats by Todd et al.(20).
Changes in plasma GPx were observed after feeding a diet containing 2, 1.43 and 0.98 mg
sodium selenite/kg DM after 16, 32 and 24 days, respectively, compared to a basal diet
containing 0.45 mg Se/kg DM. No changes in whole blood GPx were observed within the
32-day lasting study of Todd et al.(20). This difference may simply be caused by the higher
level and variation of GPx activity in whole blood compared to serum. GPx activity of dogs
in whole blood is approximately five times higher than in serum. Another possible reasoning
is that the surplus of tissue GPx is effluxed into the plasma, as indicated by the high
correlation between tissue and plasma GPx concentrations(52). The difference in reaction time
between serum and whole blood GPx activity may also be explained by different isoforms
of GPx. Plasma is known to contain mainly the plasma GPx (GPx3) enzyme(53), while whole
blood may additionally contain other forms of GPx. However, the GPx activity measurement
does not discriminate between various forms of GPx and it may be that the activity of serum
GPx is more quickly affected by a reduction in dietary Se than other forms of GPx. In rats, it
has been determined that plasma GPx3 activity is more highly regulated by dietary Se
concentration than, for example, muscle GPx4(54). The same authors(54) have shown that
although GPx1 mRNA expression was highly regulated by dietary Se concentration in rats,
dietary Se requirements based on tissue (plasma, red blood cell, liver, kidney, and muscle)
GPx activity were higher than when based on mRNA expression (i.e. mRNA expression
plateaus at lower dietary Se concentrations). This is in accordance with the findings of the
present study. The fact that GPx is affected, but the selenoprotein mRNA levels are not,
indicates that the bioactive Se fraction of the low Se diet (total Se concentration: 6.5 µg/MJ
or 0.11 mg/kg DM) is sufficient to maintain mRNA expression of the measured
selenoproteins. Although mRNA expression is the basis of protein formation, the actual
formation of the active selenoproteins were not maximized by the low Se diet. This may be
due to effects on translation, like the structure of specific stem-loops which bind proteins(55).
Also, post-translational modifications (which affect the actual activity of the selenoproteins,
e.g. protein folding, phosphorylation status, etc.) may have played a role in the difference in
reaction of GPx1 mRNA expression and GPx activity to a change in dietary Se
concentration. Therefore, GPx activity may be a more reliable biomarker for Se status than
the mRNA expression of selenoproteins. However, it may be that maximal selenoprotein

144 Chapter 5
Biomarkers of seleniumBiomarkers of seleniumBiomarkers of seleniumBiomarkers of selenium statusstatusstatusstatus
activity is not necessary for the prevention of disease on the long-term. Selenius et al.(56), for
example, found that TrxRd1 mRNA expression was increased with increasing addition of
sodium selenite concentrations (range 2.5–10 µM) to lung cancer cells, while TrxRd activity
decreased at high selenite concentrations, which indicates the impairment of selenoprotein
formation. Therefore, it is hypothesized that selenoprotein mRNA expression may be a useful
biomarker in the detection of high dietary Se concentrations, but that GPx activity is more
useful in the estimation of minimum Se requirements.
The fact that the SelK, SelT, and Sep15 mRNA markers were increased and SelH, TrxRd1,
TrxRd2, TNF-α, and NFκB were decreased in the second half compared to the first half of
the study, point towards an event of inflammation during the first part of the study, as TNF-α,
and NFκB are inflammation markers. The study did not include induction of inflammation
and there are no indications of such events during or before the study, all circumstances
stayed the same. This reinforces the idea that other factors than dietary Se have more
impact on the selenoprotein mRNA expression than dietary Se concentration.
The dietary Se concentration did not result in a significant difference in hair growth
between the diets. Previous studies which have used hair growth as a marker of Se status(27)
used beagles, so there may be a breed variation in hair growth. Although no literature on
speed of hair growth between different breeds could be found, there is evidence for
genetic differences in coat formation between breeds(57). However, the most likely
explanation for the lack of difference in hair growth is that the current study has used
sodium selenite as Se source and in the study of Yu et al.(27), selenomethionine was
supplemented. Methionine is often a limiting amino acid and selenomethionine can be non-
specifically incorporated into body proteins such as hair (50). Therefore, it may be that the
decrease in hair growth in the study of Yu et al. is not due to a reduction in Se, but in
methionine.
As there is no clear adequate range of dietary Se for adult dogs, the low Se diet may have
contained sufficient Se (6.5 µg/MJ or 0.11 mg/kg DM) to maintain health. In this 8 week
study it did not have a negative effect on thyroid hormone metabolism (T3:T4). The
conversion of T4 into the active form T3 has been reported to increase with increasing
dietary Se concentrations in puppies within a range of 0-0.52 mg/kg(29). Also Cu is indicated
to be involved in thyroid hormone metabolism, as a lower GPx activity and liver
selenodeiodinase activity was found in Cu deficient rats compared to a control group(58).
These results indicate that the low Se diet is not deficient for thyroid hormone metabolism of
adult dogs. Although the serum Cu:Cu intake ratio was significantly different between the
groups at baseline, this is unlikely to have affected the results as including the baseline

Chapter 5
Biomarkers of seleniumBiomarkers of seleniumBiomarkers of seleniumBiomarkers of selenium statusstatusstatusstatus
145
intake as a covariate in the analysis will normalize any differences between groups. Further
studies are required to determine the long-term health effects associated with a change in
urinary Se:CT ratio, serum Se and serum GPx concentrations. This can be done by a
retrospective study to determine adequate ranges of these biomarkers and to establish
which set of biomarkers from our study is needed to provide a sufficient prediction of the
risk of Se-induced disease. Consecutively, these ranges can be used in a study to
determine the minimal Se requirement of dogs.
5.6 Conclusion
There were variations in the reaction time of Se biomarkers to a reduction in dietary Se
concentration in dogs. This study has demonstrated that urinary Se:CT ratio, serum Se, and
serum GPx activity react most quickly. These may be useful biomarkers in future long-term
studies to evaluate the minimum requirements for optimal health in dogs.
5.7 Acknowledgements
The hair growth measurements were done by Robyn Bednall and Tim O'Brine of the
WALTHAM® Centre for Pet Nutrition, which was very much appreciated. The authors also
express their thanks to Joachim Neri of the Department of Applied Analytical and Physical
Chemistry at the Faculty of Bioscience Engineering of Ghent University for the Se analyses.
Donna Vanhauteghem of the Laboratory of Animal Nutrition at Ghent University is thanked
for the Cu, CK, T3 and T4 analyses and Iain Peters of the Innovation Centre (Exeter, UK) is
gratefully acknowledged for his expertise and analysis of the mRNA samples.
5.8 References 1. National Research Council (2006) Nutrient requirements of dogs and cats. [Rev. ed, Animal
nutrition series. Washington D.C.: National Academies Press. 2. European Food and Safety Authority (2009) Scientific Opinion on the substantiation of
health claims related to selenium and protection of DNA , proteins and lipids from oxidative damage, function of the immune system, thyroid function, function of the heart and blood vessels, prostate function, cognitive function and spermatogenesis pursuant to article 13 of Regulation (EC) No 1924/2006. EFSA Journal 7777, 1-24.
3. Duntas LH (2010) Selenium and the thyroid: a close-knit connection. Journal of Clinical
Endocrinology and Metabolism 95959595, 5180-5188. 4. McKenzie RC, Arthur JR, Miller SM et al. (2002) Selenium and the Immune System. In
Nutrition and Immune Function, pp. 229-250 [PC Calder, CJ Field and HS Gill, editors]. Wallingford: CABI Publishing.
5. Kumar MS, Selvam R (2003) Supplementation of vitamin E and selenium prevents hyperoxaluria in experimental urolithic rats. Journal of Nutritional Biochemistry 14141414, 306-313.

146 Chapter 5
Biomarkers of seleniumBiomarkers of seleniumBiomarkers of seleniumBiomarkers of selenium statusstatusstatusstatus
6. Liu Y, Xu H, Zhong W et al. (2015) Organic Selenium Alleviated the Formation of Ethylene Glycol-Induced Calcium Oxalate Renal Calculi by Improving Osteopontin Expression and Antioxidant Capability in Dogs. Biological Trace Element Research, 1-9.
7. Fico ME, Poirier KA, Watrach AM et al. (1986) Differential Effects of Selenium on Normal and Neoplastic Canine Mammary Cells. Cancer Research 46464646, 3384-3388.
8. Waters DJ, Shen S, Glickman LT et al. (2005) Prostate cancer risk and DNA damage: translational significance of selenium supplementation in a canine model. Carcinogenesis 26262626, 1256-1262.
9. Aldrich G (2006) Rendered products in pet food. In Essential rendering All about the
animal by-product industry, pp. 159-177 [DL Meekers, editor]. Virginia: National Renderers Association.
10. Zentek J (2007) A changing landscape: the pet food market in Europe. http://en.engormix.com/MA-feed-machinery/formulation/articles/changing-landscape-pet-food-t423/p0.htm (accessed 13 July 2015).
11. Thiry C, Ruttens A, de Temmerman L et al. (2012) Current knowledge in species-related bioavailability of selenium in food. Food Chemistry 130130130130, 767-784.
12. Gibson RS (1989) Assessment of trace element status in humans. Progress in Food and
Nutrition Science 13131313, 67-111. 13. Alfthan G, Aro a, Arvilommi H et al. (1991) Selenium metabolism and platelet glutathione
peroxidase activity in healthy Finnish men: effects of selenium yeast, selenite, and selenate. American Journal of Clinical Nutrition 53535353, 120-125.
14. Wedekind KJ, Cowell C, Combs GF, Jr. (1997) Bioavailability of selenium in petfood ingredients. FASEB Journal 11111111, A360.
15. Todd SE, Thomas DG, Bosch G et al. (2012) Selenium status in adult cats and dogs fed high levels of dietary inorganic and organic selenium. Journal of Animal Science 90909090, 2549-2555.
16. Roman M, Jitaru P, Barbante C (2014) Selenium biochemistry and its role for human health. Metallomics 6666, 25-54.
17. Wedekind KJ, Bever RS, Combs GF, Jr. (1998) Is Selenium addition necessary in pet foods? FASEB Journal 12121212, A823.
18. FEDIAF (2014) Nutritional Guidelines for Complete and Complementary Pet Food for Cats
and Dogs. Brussels: European Pet Food Industry Federation. 19. Levander OA, Sutherland B, Morris VC et al. (1981) Selenium balance in young men during
selenium depletion and repletion. American Journal of Clinical Nutrition 34343434, 2662-2669. 20. Todd SE, Thomas DG, Hendriks WH (2011) Selenium balance in the adult cat in relation to
intake of dietary sodium selenite and organically bound selenium. Journal of Animal
Physiology and Animal Nutrition 96969696, 148-158. 21. Sunde RA, Raines AM, Barnes KM et al. (2009) Selenium status highly-regulates
selenoprotein mRNA levels for only a subset of the selenoproteins in the selenoproteome. Bioscience Reports 29292929, 329-338.
22. Sunde RA (2010) Molecular biomarker panels for assessment of selenium status in rats. Experimental Biology and Medicine 235235235235, 1046-1052.
23. Read R, Bellew T, Yang JG et al. (1990) Selenium and amino acid composition of selenoprotein P, the major selenoprotein in rat serum. Journal of Biological Chemistry 265265265265, 17899-17905.
24. Hill KE, Zhou J, McMahan WJ et al. (2003) Deletion of Selenoprotein P Alters Distribution of Selenium in the Mouse. Journal of Biological Chemistry 278278278278, 13640-13646.
Chapter 5
Biomarkers of seleniumBiomarkers of seleniumBiomarkers of seleniumBiomarkers of selenium statusstatusstatusstatus
147
25. Sunde RA (2012) Selenoproteins: Hierarchy, Requirements, and Biomarkers. In Selenium
It's molecular biology and role in human health, 3 ed., pp. 137-152 [DL Hatfield, MJ Berry and VN Gladyshev, editors]. Dordrecht: Springer Science and Business Media.
26. Evenson JK, Wheeler AD, Blake SM et al. (2004) Selenoprotein mRNA Is Expressed in Blood at Levels Comparable to Major Tissues in Rats. Journal of Nutrition 134134134134, 2640-2645.
27. Yu S, Wedekind KJ, Kirk CA et al. (2006) Primary hair growth in dogs depends on dietary selenium concentrations. Journal of Animal Physiology and Animal Nutrition 90909090, 146-151.
28. Kralik A, Eder K, Kirchgessner M (1996) Influence of zinc and selenium deficiency on parameters relating to thyroid hormone metabolism. Hormone and Metabolic Research 28282828, 223-226.
29. Wedekind KJ, Yu S, Combs GF, Jr. (2004) The selenium requirement of the puppy. Journal
of Animal Physiology and Animal Nutrition 88888888, 340-347. 30. Yu S, Howard KA, Wedekind KJ et al. (2002) A low-selenium diet increases thyroxine and
decreases 3,5,3'triiodothyronine in the plasma of kittens. Journal of Animal Physiology and
Animal Nutrition 86868686, 36-41. 31. Fontaine M, Valli VE, Young LG et al. (1977) Studies on vitamin E and selenium deficiency
in young pigs. I. Hematological and biochemical changes. Canadian Journal of Comparative
Medicine 41414141, 41-51. 32. German AJ, Holden SL, Moxham GL et al. (2006) A simple, reliable tool for owners to
assess the body condition of their dog or cat. Journal of Nutrition 136136136136, 2031S-2033S. 33. Abràmoff MD, Magalhaes PJ, Ram SJ (2004) Image Processing with ImageJ. Biophotonics
International 11111111, 36-42. 34. van Zelst M, Hesta M, Alexander LG et al. (2015) In vitro selenium accessibility in dog
foods is affected by diet composition and type. British Journal of Nutrition 113113113113, 1888-1894.
35. Lavu RVS, Willekens K, Vandecasteele B et al. (2012) Fertilizing soil with Selenium fertilizers: impact on concentration, speciation and bioaccessibility of Selenium in leek (Allium ampeloprasum). Journal of Agricultural and Food Chemistry 60606060, 10930-10935.
36. Rozen S, Skaletsky H (2000) Primer3 on the WWW for general users and for biologist programmers. Methods in Molecular Biology 132132132132, 365-386.
37. GenBank (2015) Genetic Sequence Data Bank. http://www.ncbi.nlm.nih.gov/nuccore/ (accessed 6 July 2015).
38. Peters I, Helps CR, Hall EJ et al. (2004) Realt-time RT-PCR: considerations for efficient and sensitive assay design. Journal of Immunological Methods 286286286286, 203-217.
39. Peters I, Peeters D, Helps CR et al. (2007) Development and application of multiple internal reference (housekeeper) gene assays for accurate normalisation of canine gene expression studies. Veterinary Immunology and Immunopathology 117117117117, 55-66.
40. Van de Velde H, Janssens GPJ, de Rooster H et al. (2013) The cat as a model for human obesity: insights into depot-specific inflammation associated with feline obesity. British
Journal of Nutrition 110110110110, 1326-1335. 41. Vandesompele J, De Preter K, Pattyn F et al. (2002) Accurate normalization of real-time
quantitative RT-PCR data by geometric averaging of multiple internal control genes. Genome Biology 3333, research 0034.
42. Francesconi KA, Pannier F (2004) Selenium Metabolites in Urine: A Critical Overview of Past Work and Current Status. Clinical Chemistry 50505050, 2240-2253.
43. Sanz Alaejos M, Díaz Romero C (1993) Urinary selenium concentrations. Clinical Chemistry 39393939, 2040-2052.

148 Chapter 5
Biomarkers of seleniumBiomarkers of seleniumBiomarkers of seleniumBiomarkers of selenium statusstatusstatusstatus
44. Hawkes W, Richter BD, Alkan Z et al. (2008) Response of Selenium Status Indicators to Supplementation of Healthy North American Men with High-Selenium Yeast. Biological
Trace Element Research 122122122122, 107-121. 45. Hojo Y (1981) Evaluation of the expression of urinary selenium level as ng Se/mg
creatinine and the use of single-void urine as a sample for urinary selenium determination. Bull Environm Contam Toxicol 27272727, 213-220.
46. Forrer R, Gautschi K, Lutz H (1991) Comparative determination of selenium in the serum of various animal species and humans by means of electrothermal atomic absorption spectrometry. Journal of Trace Elements and Electrolytes in Health and Disease 5555, 101-113.
47. Pilarczyk B, Tomza-Marciniak A, Pilarczyk R et al. (2013) Relationship between serum Se concentration in dogs and incidence of some disease conditions. Central European Journal
of Biology 8888, 527-533. 48. Thomson CD (2004) Assessment of requirements for selenium and adequacy of selenium
status: a review. European Journal of Clinical Nutrition 58585858, 391-402. 49. Suzuki KT (2005) Metabolomics of Selenium: Se Metabolites Based on Speciation Studies.
Journal of Health Science 51515151, 107-114. 50. Schrauzer GN (2000) Selenomethionine : A Review of Its Nutritional Significance ,
Metabolism and Toxicity. Journal of Nutrition 130130130130, 1653-1656. 51. Bosch G, Hagen-Plantinga EA, Hendriks WH (2015) Dietary nutrient profiles of wild wolves:
insights for optimal dog nutrition? British Journal of Nutrition 113113113113, S40-S54. 52. Combs Jr GF, Combs SB (1986) Biochemical functions of selenium. In The Role of Selenium
in Nutrition, pp. 205-263. New York: Academic Press. 53. Avissar N, Ornt DB, Yagil Y et al. (1994) Human kidney proximal tubules are the main
source of plasma glutathione peroxidase. American Journal of Physiology 266266266266, C367-C375. 54. Barnes KM, Evenson JK, Raines AM et al. (2009) Transcript analysis of the selenoproteome
indicates that dietary selenium requirements of rats based on selenium-regulated selenoprotein mRNA levels are uniformly less than those based on glutathione peroxidase activity. Journal of Nutrition 139139139139, 199-206.
55. Hesketh JE, Vasconcelos MH, Bermano G (1998) Regulatory signals in messenger RNA: determinants of nutrient–gene interaction and metabolic compartmentation. British
Journal of Nutrition 80808080, 307-321. 56. Selenius M, Fernandes AP, Brodin O et al. (2008) Treatment of lung cancer cells with
cytotoxic levels of sodium selenite: Effects on the thioredoxin system. Biochemical
Pharmacology 75757575, 2092-2099. 57. Cadieu E, Neff MW, Quignon P et al. (2009) Coat Variation in the Domestic Dog Is
Governed by Variants in Three Genes. Science 326326326326, 150-153. 58. Olin KL, Walter RM, Keen CL (1994) Copper deficiency affects selenoglutathione
peroxidase and selenodeiodinase activities and antioxidant defense in weanling rats. American Journal of Clinical Nutrition 59595959, 654-658.

_____________________________________________________________________________________________________________
General discussion_____________________________________________________________________________________________________________
Chapter 6
General discussion_____________________________________________________________________________________________________________

Main findings of the studies reported within this thesis
1. Diet type and crude protein digestibility have a significant impact on Se accessibility
in vitro, where canned diets showed a negative association with crude protein
digestibility and kibble diets a postitive association (Chapter 3a).
2. The Se accessibility from dry pet foods can be estimated by predictive equations
(Chapter 3b).
3. Canned diets contain on average more Se than kibble diets (Chapter 3a & 4).
4. The bioavailability of Se is higher from kibble than from canned diets (Chapter 4).
5. Of the biomarkers measured, urinary Se to creatinine ratio, serum Se and serum
glutathione peroxidase reacted most quickly to a decrease in dietary Se
concentration in dogs (Chapter 5).
Definitions used:
Accessibility: the amount of dietary selenium that is potentially available for absorption after in
vitro digestion.
Bioavailability: the fraction of the dietary selenium that reaches the systemic circulation.
Availability: when accessibility and bioavailability are discussed together.
Bioactivity: selenium that is incorporated into selenoproteins.

Chapter 6
General discussionGeneral discussionGeneral discussionGeneral discussion
151
6.1 Methods to measure selenium availability
When considering how to measure Se availability, either in vitro or in vivo digestibility
measurements can be performed. In vitro studies give an estimation of the accessibility; the
amount that is available for absorption. However, in vitro studies do not inform us of the
actual luminal absorption, and therefore will likely overestimate the apparent in vivo
digestibility. To the author's knowledge, there are no in vitro data available that measures
Se accessibility of pet foods. Therefore, it is not possible to compare our results with
literature. Using the diets of Chapter 3a and 4, the average apparent Se bioavailability
coefficients and the average apparent DM and CP digestibility coefficients were calculated
(Figure 6.1). According to these data, in vitro digestibility overestimates the apparent DM
and CP digestibility and apparent Se bioavailability with 15, 14 and 13%, respectively (all
p<0.001). No significant interaction for diet type (canned vs. kibble) x study type (in vitro vs.
in vivo) was found for apparent DM digestibility and Se bioavailability (p=0.449 and 0.481,
respectively), indicating that there was no difference in the overestimation of in vivo data
with in vitro data between canned and kibble diets. The extent to which apparent in vivo
Se bioavailability was overestimated was also independent of dietary Se concentration
(p=0.545). There was a diet type x study type interaction for CP digestibility, with a higher
overestimation of in vivo data in canned compared to kibble diets (p=0.008).
Not only were the in vitro and in vivo study performed with a different set and number of
diets, but overestimation of apparent in vivo CP digestibility by an in vitro digestibility
method also increases with increasing CP digestibility, as reported in kibble diets by
Hervera et al.(1). One of the limitations of an in vivo study is that apparent digestibility is
measured. This includes endogenous losses, such as enzymatic and biliary Se, that were
actually bioavailable, leading to an underestimation of true bioavailability. The extent of
underestimation is not known exactly and is likely to differ between diets. To overcome this
limitation, dogs should be ileally cannulated, a practice that causes ethical debate. In vitro
studies, on the other hand, do not cause ethical discussion and the Se originating from the
enzyme solutions can be measured separately (in a blank sample) to correct the in vitro Se
accessibility with. Therefore, in vitro studies may give a better estimation of the actual
amount of available Se. In addition, in vitro studies allow to test a larger number of samples
in a shorter amount of time than in vivo studies.

152 Chapter 6
General discussioGeneral discussioGeneral discussioGeneral discussionnnn
Figure 6.1 In vitro and in vivo selenium availability and
apparent dry matter and crude protein digestibility
coefficients
Open bars with black and grey line represent the in vitro results
of canned (n=16) and kibble (n=19) diets, respectively. Black and
grey filled bars stand for the in vivo results of canned (n=4) and
kibble (n=4) diets, respectively. Error bars represent the standard
error. Diets from the in vitro study (Chapter 3a) and in vivo
bioavailability study (Chapter 4) were used in this figure.
6.2 Factors affecting selenium availability
Many factors affect the availability of Se, as described in paragraph 1.7. In this paragraph,
we will only discuss those factors that affected Se availability in the studies reported in this
PhD thesis.
6.2.1 Dietary selenium concentration
In the in vitro Se accessibility (Chapter 3a) and in vivo Se bioavailability (Chapter 4) studies,
the dietary Se concentration was higher in canned than kibble diets. We know from the in
vitro study that the Se concentration per se does not affect the percentage of availability,
but the dietary Se concentration can influence the absolute amount of available Se.
Figure 6.2 shows the association between dietary Se and Se availability. The FEDIAF
minimum recommendation of dietary Se concentration is depicted by the black line. The
dietary Se concentration, together with the amount of dietary intake determines the Se
0
10
20
30
40
50
60
70
80
90
100
selenium availability
dry matter digestibility
crude protein digestibility
Av
ail
ab
ilit
y/D
ige
stib
ilit
y (
%)

Chapter 6
General discussionGeneral discussionGeneral discussionGeneral discussion
153
intake, and thus affects the potential absolute amount of available Se. Dietary intake may
be decreased as a therapy for obesity. Worldwide, 22 to 40% of the pet dogs suffer from
obesity(2). Together with the reduction in caloric intake, Se intake may also be reduced.
Linder et al.(3) found that diets specifically produced for weight loss often do not comply
with the current minimum recommendations for Se. In our studies, one canned and one
kibble weight loss diet were included, which both contained more Se than minimally
recommended by FEDIAF (canned 1.58 and kibble 0.56 mg/kg DM). In addition, weight loss
diets commonly contain high fibre concentrations(4), which may reduce the bioavailability of
Se from the diet and thus may increase the requirement (per MJ) of dietary Se. Nevertheless,
the in vitro study did not identify fibre as an important contribution to the variation in Se
accessibility. Considering the fact that clinical cases of Se deficiency are not reported, it can
be concluded that it is unlikely to develop Se deficiency when commercially available diets
are fed. In addition, it can be seen from Figure 6.2 that although the dietary Se
concentration may be below the FEDIAF minimum recommendation or well above the legal
upper limit for Se supplemented diets (assumed to be a "safe upper intake level"), the
majority of the diets are still in the "safe range" of Se availability.
The lower cut-off for the "safe-range" of available Se (green field in Figure 6.2) is based on
a study by Wedekind et al.(5). This limit can be questioned, as selenomethionine was used
as the Se source in this study. Unlike inorganic Se species, selenomethionine may be non-
specifically incorporated into body proteins, by which it is unavailable for incorporation into
selenoproteins. As the breakpoint reported in this study was based on GPx activity, the Se
requirements may have been overestimated.
The upper cut-off is based on the legal upper limit for Se supplemented diets. However, no
information is available on the basis of this legislation. It is known from studies by
Wedekind et al.(5) and Yu et al.(6) that 5 mg SeMet/kg diet may result in adverse effects in
adult dogs. Although, in these studies, Se was supplemented after processing and was thus
likely to have a higher availability than when Se would have been processed as part of the
diet. This suggests that the dietary Se concentrations reported in this thesis are unlikely to
induce adverse effects, but that Se availability cannot be ignored as an important factor
determining Se provision to dogs. In order to allow a fair estimation of the available Se in
dog foods, the Se accessibility models reported in Chapter 3b may be useful for the
formulation of diets.

154 Chapter 6
General discussioGeneral discussioGeneral discussioGeneral discussionnnn
Figure 6.2 Dietary selenium and apparent
availability coefficients of canned and kibble pet foods
† In vitro selenium accessibility coefficients were corrected for a 13% overestimation of
selenium bioavailability, as presented in Figure 6
digested kibble diets (n=19) and blue filled triangles the
open squares signify in vitro
digested canned diets (n=4). The black line is the minimum requirement for adult dogs (FEDIAF)
and the grey line is the legal upper limit for Se supplemented diets. The lower cut
green field is based on a study of Wedekin
legal upper limit for supplementation.
6.2.2 Selenium speciation
Some diets, in particular those that contain an insufficient amount of Se from their
ingredients, are supplemented to reach the FEDIAF minimum recommendation. Most
commonly, inorganic Se supplements (sodium selenate and sodium selenite) are used
When collecting pet foods for the
European regulation No 767/2009
on the label. Pet food producers where allowed to market pet foods without stating the
additives on the packaging until the
to remain on the market until stocks were exhausted (454/2010 art.2)
Dietary selenium and apparent in vivo and corrected† in vitro
availability coefficients of canned and kibble pet foods
selenium accessibility coefficients were corrected for a 13% overestimation of
bility, as presented in Figure 6.1. Blue open triangles represent
digested kibble diets (n=19) and blue filled triangles the in vivo digested kibble diets (n=4). Red
in vitro digested canned diets (n=16) and red filled squares the
digested canned diets (n=4). The black line is the minimum requirement for adult dogs (FEDIAF)
and the grey line is the legal upper limit for Se supplemented diets. The lower cut
on a study of Wedekind et al.(5) and the upper cut-off is based on the
legal upper limit for supplementation.
Some diets, in particular those that contain an insufficient amount of Se from their
ents, are supplemented to reach the FEDIAF minimum recommendation. Most
commonly, inorganic Se supplements (sodium selenate and sodium selenite) are used
When collecting pet foods for the in vitro study (chapter 3a), many did not yet comply with
No 767/2009(7), which states that any Se additives should be declared
on the label. Pet food producers where allowed to market pet foods without stating the
ves on the packaging until the 31st of August 2011 and these products were permitted
to remain on the market until stocks were exhausted (454/2010 art.2)(8).
in vitro selenium
selenium accessibility coefficients were corrected for a 13% overestimation of in vivo
.1. Blue open triangles represent in vitro
digested kibble diets (n=4). Red
led squares the in vivo
digested canned diets (n=4). The black line is the minimum requirement for adult dogs (FEDIAF)
and the grey line is the legal upper limit for Se supplemented diets. The lower cut-off of the
off is based on the
Some diets, in particular those that contain an insufficient amount of Se from their
ents, are supplemented to reach the FEDIAF minimum recommendation. Most
commonly, inorganic Se supplements (sodium selenate and sodium selenite) are used(4).
), many did not yet comply with
, which states that any Se additives should be declared
on the label. Pet food producers where allowed to market pet foods without stating the
of August 2011 and these products were permitted

Chapter 6
General discussionGeneral discussionGeneral discussionGeneral discussion
155
When retrievable, Se addition of the diets used in the in vitro study (chapter 3a), together
with the in vivo bioavailability study diets (chapter 4), were used to calculate the amount of
Se derived from the ingredients. Se supplementation was not specified in any of the canned
diets (12 out of 20 retrieved). In kibble diets, 15 of the 18 retrieved diets (out of 23)
contained supplemented inorganic Se. The amount specified on the package is the amount
of the sodium selenite salt (in mg/kg diet) and not the actual addition of the Se mineral.
Therefore, a standard Se concentration of 45.6% in sodium selenite supplements(4) is used to
calculate the absolute amount of supplemented Se. The amount of supplementation ranged
from 0.01 to 0.15 mg Se/kg DM, which is 3 to 28% of the total dietary Se concentration
(Figure 6.3). The amount of Se from the ingredients in kibble diets therefore ranged between
0.19 and 1.15 mg Se/kg DM. In canned diets this was 0.17 to 2.12 mg Se/kg DM (assuming
that no declaration means no supplementation). Two of the kibble diets were supplemented
above the legal maximum for Se supplemented diets. The pet food producers may have
used estimated values for the formulation of the diets and may not have been aware of the
high Se concentrations (or variability per batch) in the ingredients. This reflects the difficulty
for pet food manufacturers to produce pet foods within the minimum recommended and
legal maximum range. The analysis of dietary Se for every batch of pet food is not a
standard procedure, due to the costs involved. To avoid unnecessary supplementation, it
would however be advisable to analyse the Se concentration of the diets on regular basis.
The legislation on additive specification on pet food labels was made for clarification of pet
food ingredients to customers, but may be misleading, as the amount of sodium selenite
supplement is mentioned and not the absolute amount of Se added, nor the total dietary Se
concentration. The additional amount of Se generally seems to be a small percentage of the
total dietary Se concentration and may give customers a wrong indication of the dietary Se
concentration. Additionally, the specified amount on the package may actually be 40%
lower or even 300% higher, as long as it does not exceed the legal maximum(9), which may
question the relevance of this regulation even more.
The addition of selenite in kibble diets tended to increase the apparent Se availability
coefficients of the diets reported in this thesis (p=0.086, Figure 6.4). The limited amount of Se
supplementation of the total dietary Se concentration may be the explanation for the lack of
a significant effect. However, the diets used in these studies should be considered a random
market sample, so apparently the fraction of supplemented Se represents only a small
percentage of the total analysed dietary Se. Therefore, the differences in Se accessibility
and bioavailability between canned and kibble diets cannot be merely attributed to the
dietary Se species.

156 Chapter 6
General discussioGeneral discussioGeneral discussioGeneral discussionnnn
Figure 6.3 Supplemented selenite and selenium from ingredients
in kibble diets (n=18)
Filled bars represent the selenium from the ingredients and open bars
are the amount of supplemented selenite. The black line indicates the
recommended minimum Se concentration and the grey line the legal
maximum when Se is supplemented. Diets from the in vitro study (Chapter
3a) and in vivo bioavailability study (Chapter 4) were used in this figure.
Figure 6.4 Effect of selenite supplementation on apparent in vivo
and corrected† in vitro selenium availability coefficients in kibble
diets (n=18)
† In vitro selenium accessibility coefficients were corrected for a 13%
overestimation of in vivo selenium bioavailability, as presented in Figure
6.1. R2, coefficient of determination. P-value was calculated with linear
regression.
0.0
0.2
0.4
0.6
0.8
1.0
1.2
1.4
1 2 3 4 5 6 7 8 9 10 11 12 13 14 15 16 17 18
Se
len
ium
(m
g/k
g D
M)
Diet
R² = 0.173
0
10
20
30
40
50
60
70
80
90
100
0 5 10 15 20 25 30
Se
len
ium
av
ail
ab
ilit
y (
%)
Added selenite per total dietary selenium (%)
p = 0.086

Chapter 6
General discussionGeneral discussionGeneral discussionGeneral discussion
157
6.2.3 Processing conditions
The difference in processing conditions may be another factor that can explain the higher
Se availability from kibble compared to canned diets. The negative impact of retorting on
the in vitro Se accessibility from canned diets was demonstrated in Chapter 3a. Todd et
al.(10) found similar results in a canned cat food, of which the apparent Se absorption
(bioavailability) of the diet was only 37% in dogs, but when sodium selenite or selenium
yeast was supplemented after processing the Se absorption increased more than two-fold
(83 and 79%, respectively), indicating that the negative effect of retorting can be overcome
by supplementing Se after processing. Interestingly, we have also demonstrated that the in
vitro Se accessibility from kibble diets was not affected by extrusion, which emphasizes the
difference between diet types. This means that there are Maillard products or other
complexes formed by the retortion process that renders the Se unavailable.
A large part of the Se in pet foods is protein-bound, therefore, the CP digestibility may have
an influence on the availability of Se. The in vitro study (Chapter 3a) showed that there was
a positive association between Se accessibility and CP digestibility in kibble diets but a
negative association in canned diets. This paradoxical finding can be explained by the net
effect of two factors; protein digestibility as such, and a potential higher susceptibility of
highly digestible protein for cross-linking during retorting. Formation of cross-linkages
require free amino groups(11-12), which are more abundant from highly digestible protein
sources, such as hydrolysed protein, than from protein sources with a low digestibility. The
cross-linkages may bind a large proportion of protein-bound Se. In kibble diets, protein
digestibility appeared to be a more important factor to affect Se accessibility.
When expressed as amount of digestible CP (g/kg DM; Figure 6.5), the effects of CP
digestibility are unclear because dietary CP concentration – as factor in the equation for
digestible CP – causes variability. As such, dietary CP concentration is the main determinant
for the dietary digestible CP concentration, because of the relatively limited range in CP
digestibility within commercially available pet foods versus the large range in dietary CP
concentration (demonstrated in Chapter 4). Yet, the data show that the digestibility rather
than the amount of digestible CP determines Se accessibility: if a particular amount of Se is
bound to protein, it can be logically explained that protein digestibility determines the
proportion of Se that becomes accessible. In this case, the level of protein in the diet does
not contribute to Se accessibility.
The in vivo study revealed no effect of digestible CP on apparent Se bioavailability. In
theory, this might be the result of neglecting shifts in endogenous Se losses. This is however
unlikely, because the data from the in vivo trial fit nicely in the data cloud of the in vitro

158 Chapter 6
General discussioGeneral discussioGeneral discussioGeneral discussionnnn
trial, as shown in Figure 6.5. A more feasible explanation is that the test range in digestible
CP in the in vivo trial was much narrower than in the in vitro trial, so that the residual
variation became relatively larger. This likely hindered the demonstration of a significant
relationship between digestible CP and apparent Se bioavailability within the test range.
This emphasises that the impact of diet type is more important for Se availability than
digestible CP.
Figure 6.5 Effect of digestible crude protein on in vitro selenium
accessibility and apparent in vivo selenium bioavailability
Blue open triangles represent in vitro digested kibble diets (n=19) and
blue filled triangles the in vivo digested kibble diets (n=4). Red open
squares signify in vitro digested canned diets (n=16) and red filled
squares the in vivo digested canned diets (n=4). Diets from the in vitro
study (Chapter 3a) and in vivo bioavailability study (Chapter 4) were used
in this figure.
6.3 Bioavailability versus bioactivity
Bioavailability was used as an indication of the ability of Se to incorporate into
selenoproteins (=bioactivity). However, the in vivo bioavailability study (Chapter 4) showed
that there were large differences in urinary Se excretion between diets and that the urinary
excretion reacts quickly to a change in dietary Se. This indicates that the retention, and
thus the amount available for bioactivity is different between diet types. Therefore, it is
recommended to measure urinary Se excretion in combination with the bioavailability, as
0
20
40
60
80
100
120
0 200 400 600 800 1000
sele
niu
m a
va
ila
bil
ity
(%
)
digestible crude protein (g/kg DM)

Chapter 6
General discussionGeneral discussionGeneral discussionGeneral discussion
159
this will give a better picture of the amount available for Se bioactivity. Bioactivity is what
makes Se essential for the dog, so that should be the main determinant for the amount of
dietary Se. In addition, the Se excreted in the urine may be considered potentially harmful
to the dog. Therefore, not only bioactivity, but also bioavailability and urinary Se excretion
(as a measure for retention) should be studied, since this might determine the amount of Se
circulating in the body without "safe" incorporation into selenoproteins.
It is clear that determination of the Se speciation would provide mechanistic insights in the
above mentioned issues. For instance, to determine the association between urinary Se
metabolites and Se toxicity and/or deficiency, it is convenient to know which metabolites
are excreted in the urine by dogs. It is known from a pilot study for the studies in this thesis,
that dog urine can contain selenosugars. In 3 out of 10 urine samples of dogs fed a
commercially available dry diet containing 0.32 mg Se/kg diet, selenosugar 2 could be
detected with liquid chromatography high-resolution mass spectrometry (LC-HR-MS)
(unpublished data). TMSe was not identified in any of the samples. The selenosugar
concentration accounted for approximately 1 to 11% of the total urinary Se in samples in
which it could be detected. However, the high detection limit (50 ng/ml) and complex
urinary matrix, made it difficult to quantify other Se species in dog urine. For more insight
into Se metabolism of dogs, future studies may focus on urinary Se speciation between
canned and kibble diets and at different dietary Se concentrations.
6.4 Factors affecting measurement of glutathione peroxidase activity
In Table 6.1, the dietary Se intake and a set of biomarkers are compared between the diets
used in the bioavailability study (Chapter 4) and the adequate diet of the biomarker study
(Chapter 5). It should be noted that these data came from different studies including
different diets and different dogs. Se intake was significantly higher in the biomarker study
compared to both the canned (primarily organic Se) and kibble (partly inorganic Se) diets,
which was due to the high Se concentration of the semi-purified diet (completely inorganic
Se). Interestingly, the difference between the semi-purified diet and the commercial diets did
not result in an increased whole blood GPx activity, suggesting that GPx activity may have
reached a plateau, or was less effectively increased by the sodium selenite used in the
semi-purified diets compared to the Se in the commercially available diets. If the latter is
true, and the difference in canned and kibble diets (Chapter 4) is caused by the Se species
in the diets, kibble diets may need to be supplemented with organic Se instead of sodium
selenite. However, that does not necessarily mean that bioactivity is increased when organic
Se is non-specifically incorporated into body proteins.

160 Chapter 6
General discussioGeneral discussioGeneral discussioGeneral discussionnnn
6.4.1 Expressing glutathione peroxidase activity
GPx expressed per gram of haemoglobin (Hb, to correct for dilution) did show a significantly
higher level in canned compared to semi-purified diets, but not in kibble compared to the
semi-purified diets. This was attributed to a lower Hb concentration in the blood of dogs fed
canned diets compared to dogs fed the semi-purified diet (p<0.001). One of the factors
causing this, are preservatives that may be used in canned dog foods, such as propylene
glycol(4). Propylene glycol is reported to induce oxidative damage and decrease the
erythrocyte half-life(13), for which it is prohibited from use in cat foods.
When erythrocytes and their Hb are broken down, bilirubin is formed and excreted via the
bile, which causes the typical green to brown colour. In addition to bilirubin, bile consists of
water, bile acids, fats, and minerals(14). The average lifespan of canine erythrocytes is 110
days(15). After that, the Hb from the cytoplasm of erythrocytes is broken down into globin
and heme(14). The globin moiety may contain SeMet(16) and its amino acids are reused for
protein synthesis(14). The heme moiety is divided into iron and porphyrin, which is in turn
excreted in the bile as conjugated bilirubin(14).
It is likely that bile contains higher concentrations of Se when canned diets are fed to dogs.
Canned diets contain on average more fat, which triggers the cholecystokinin secretion by
mucosal epithelial cells, which in turn increases biliary secretion(17). In addition, a dose
dependent biliary Se excretion has been determined for selenite(18-19). If all Se species are
dose dependently excreted in the bile, the higher average Se concentrations of canned
diets will cause a higher biliary Se excretion. Next to the overall higher Se concentration,
canned diets contain on average more organically bound Se, which may be converted to
Selenotaurine(20). More than 99% of bile acids are taurine conjugates(4). Therefore, it is
plausible that the amount of Se excreted via bile is higher from canned than kibble diets.
This results in the conclusion that there is a potential bias in the interpretation of in vivo
apparent Se bioavailability between diet types. Future research could analyse Se-
containing bile acids in the faeces of dogs fed canned and kibble diets to gain a better
insight into the amount of biliary Se excretion and the effect of diet type.
Table 6.1 also shows that a higher amount of the Se from the semi-purified diet compared
the to canned and kibble diets was excreted in the urine. Serum Se and the thyroid
hormones were also increased by the semi-purified diet. The thyroid hormones may have
been increased by a higher iodine and copper intake. Although both were lower in the
semi-purified compared to the canned and kibble diets (I 0.08 and average 0.22 mg/MJ; Cu
0.48 and average 0.81 mg/MJ, respectively), the availability of the minerals may have been
higher in the semi-purified diet. The serum Se concentration is still within the range of 150-

Chapter 6
General discussionGeneral discussionGeneral discussionGeneral discussion
161
340 µg/L by Forrer et al.(21). It is not clear what the biological relevance of the increase in
serum Se may be. Serum Se should possibly be seen as a short term Se storage. The Se may
be available for GPx activity when necessary (apparently not in this case), or gradually
excreted in the urine.
The apparent higher GPx activity (U/g Hb) in canned compared to kibble diets (Chapter 4)
may be due to the Hb concentration after canned diets were fed to the dogs, similarly to
the difference in GPx activity (U/g Hb) between canned and semi-purified diets. For
example, Todd et al.(10) did not find a difference in GPx activity (U/L) in dogs fed a
commercially available canned diet supplemented with Se yeast or selenite. However, the
lack of a difference in the latter study may also have been caused by a plateau in GPx
activity, as supplements were added to a commercially available, non-Se deficient (0.6
mg/kg DM), canned diet. The studies that did report a higher bioactivity of selenite
compared to SeMet either used growing rats(22) or an amount of dietary Met (2.4 g/kg DM)
in rats(23) considered deficient for adult dogs (FEDIAF minimum recommendation 4 g/kg DM),
suggesting that the SeMet is used as protein building block rather than for the
incorporation in GPx.
6.4.2 Serum versus whole blood glutathione peroxidase activity
In the biomarker study (Chapter 5), GPx activity in dogs was found to be 5 times higher in
whole blood than serum. In humans erythrocyte GPx activity is reported to be 25 to 100
times higher than plasma(24). This difference is likely not due to the difference between
plasma and serum, as plasma only contains clotting proteins (e.g. fibrinogen) extra compared
to serum. No reports have been found that clotting proteins contain GPx, but if they did, that
would only increase the difference between dog and human. GPx concentrations (and thus
activity) can be affected by erythrocyte leakage due to hemolysis(24). However, no sign of
hemolysis was found in the serum samples. The most likely explanation for the larger
difference in erythrocyte and plasma GPx activity in humans compared to whole blood and
serum GPx activity in dogs, is the dilution factor from erythrocyte to whole blood, as whole
blood also contains serum, with a lower GPx concentration than erythrocytes. GPx may also
be used to store Se(25), which suggests that maximal GPx levels are not necessary for optimal
health.
If serum GPx activity would have been measured in the bioactivity study instead of whole
blood GPx, it may have resulted in an even larger difference, due to the lower variability of
serum GPx activity compared to whole blood. Striking is that GPx activity was only
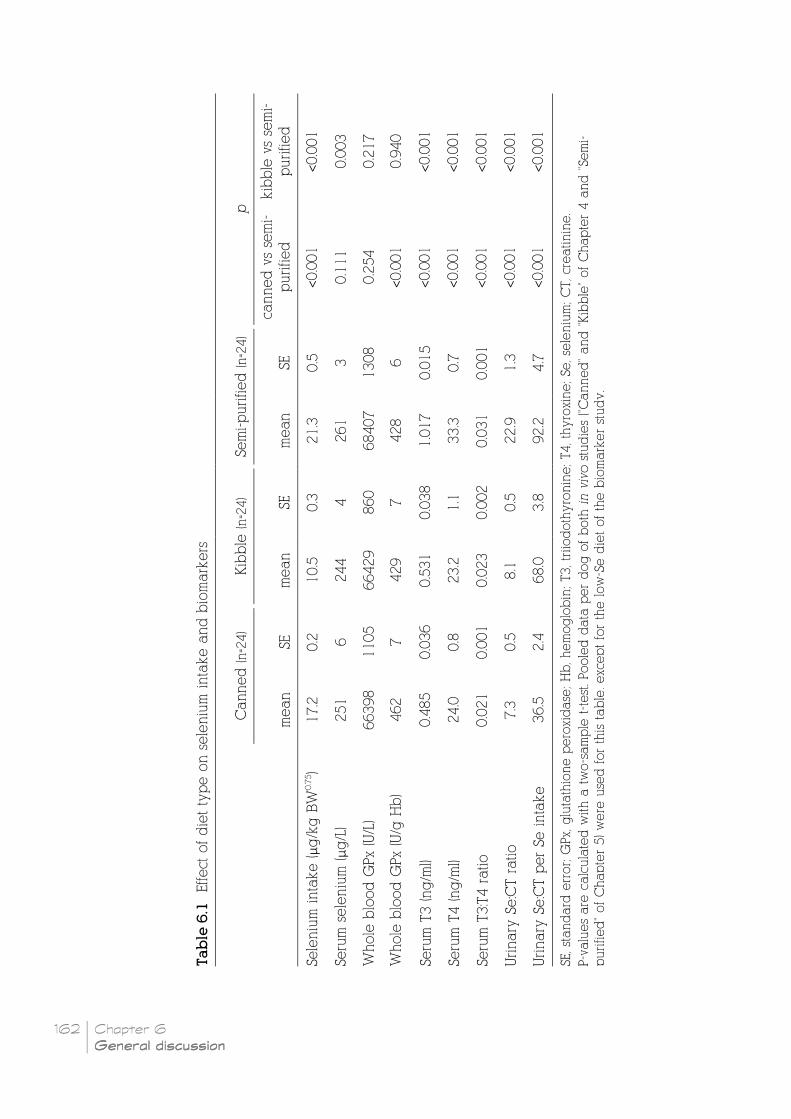
162 Chapter 6
General discussioGeneral discussioGeneral discussioGeneral discussionnnn
Ta
ble
6.1
Effect
of die
t ty
pe o
n s
ele
niu
m inta
ke a
nd b
iom
ark
ers
p k
ibble
vs
sem
i-
purified
<0.001
0.0
03
0.2
17
0.9
40
<0.001
<0.001
<0.001
<0.001
<0.001
SE, standard
error; G
Px, g
luta
thio
ne p
ero
xidase
; Hb, hem
oglo
bin
; T3, triiodoth
yro
nin
e; T4, th
yro
xine; Se, se
leniu
m; CT, cre
atinin
e.
P-v
alu
es
are
calc
ula
ted w
ith a
tw
o-sam
ple
t-test. Poole
d d
ata
per dog o
f both
in v
ivo s
tudie
s ("Canned" and "Kib
ble
" of Chapte
r 4 a
nd "Sem
i-
purified" of C
hapte
r 5) w
ere
use
d for th
is table
, exc
ept fo
r th
e low
-Se d
iet of th
e b
iom
ark
er study.
canned v
s se
mi-
purified
<0.001
0.1
11
0.2
54
<0.001
<0.001
<0.001
<0.001
<0.001
<0.001
Sem
i-purified (n=2
4)
SE
0.5
3
1308
6
0.0
15
0.7
0.0
01
1.3
4.7
mean
21.3
261
68407
428
1.0
17
33.3
0.0
31
22.9
92.2
Kib
ble
(n=2
4)
SE
0.3
4
860
7
0.0
38
1.1
0.0
02
0.5
3.8
mean
10.5
244
66429
429
0.5
31
23.2
0.0
23
8.1
68.0
Canned (n=2
4)
SE
0.2
6
1105
7
0.0
36
0.8
0.0
01
0.5
2.4
mean
17.2
251
66398
462
0.4
85
24.0
0.0
21
7.3
36.5
Sele
niu
m inta
ke (
µg/k
g B
W0.7
5)
Seru
m s
ele
niu
m (
µg/L
)
Whole
blo
od G
Px
(U/L
)
Whole
blo
od G
Px
(U/g
Hb)
Seru
m T
3 (ng/m
l)
Seru
m T
4 (ng/m
l)
Seru
m T
3:T4 ratio
Urinary
Se:C
T ratio
Urinary
Se:C
T p
er Se
inta
ke

Chapter 6
General discussionGeneral discussionGeneral discussionGeneral discussion
163
significantly different between the low and adequate semi-purified diets (Chapter 5) after 6
and 8 weeks in serum and whole blood, respectively; the whole blood GPx activity between
the canned and kibble diets (Chapter 4) was significantly different after 29 (or 43) days. This
reinforces the suggestion that diet type (ingredients, processing conditions) is a major factor
in the bioactivity of Se, considering the fact that the difference in dietary Se concentration
in the semi-purified diets (86%) was much larger than between the canned and kibble diets
(average 55%).
6.5 Other factors to consider when assessing selenium requirements of dogs
The current FEDIAF minimum recommendations are based on a study in kittens, but it has
been shown that dogs have a higher Se retention than cats(10). This may be linked to the
evolutionary feast and famine feeding approach of dogs, in which dogs gorge feed(26).
During the famine stage, stored Se can be used for physiological processes. However, it is
believed that inorganic Se cannot be stored in the body, which makes this theory untrue for
inorganic Se. The higher urinary Se:CT excretion per Se intake in the semi-purified (close to
100% inorganic Se) diets compared to the kibble (approximately 20-25% inorganic Se) and
canned diets (Table 6.1) and in the kibble diets compared to the canned diets (Chapter 4)
confirms this. Therefore, the supplementation of pet foods with inorganic Se may be
interesting for research purposes, but pet food manufacturers should be aware that the
susceptibility to a suboptimal Se status in dogs increases with increasing percentage of
inorganic Se per total dietary Se. Therefore, organic Se may be a better option for
supplementing pet foods.
6.5.1 Gender
Sexual dimorphisms of Se metabolism has been reported in many human and rodent
studies(27), but has not yet been verified in dogs. Brown and Burk(28) have demonstrated that
female rats had higher blood and liver Se concentrations after a selenite injection than
males. A study by Paβlack et al.(29) did not show significant gender differences in Se
concentrations of liver, renal cortex and renal medulla in dogs. However, numerically bitches
had higher average Se concentrations of these tissues (liver: dog 258, bitch 634; renal
cortex: dog 531, bitch 933; renal medulla: dog 163, bitch 334 µg/kg).
In this thesis, serum Se was higher in bitches than in dogs (all spayed/neutered, except one
bitch, p=0.033, Table 6.2). GPx and thyroid hormones were not affected by gender. Daily Se
intake and bioavailability were similar between sexes, and the urinary selenium excretion
did also not differ between dogs and bitches (Table 6.2). However, when the urinary Se:CT
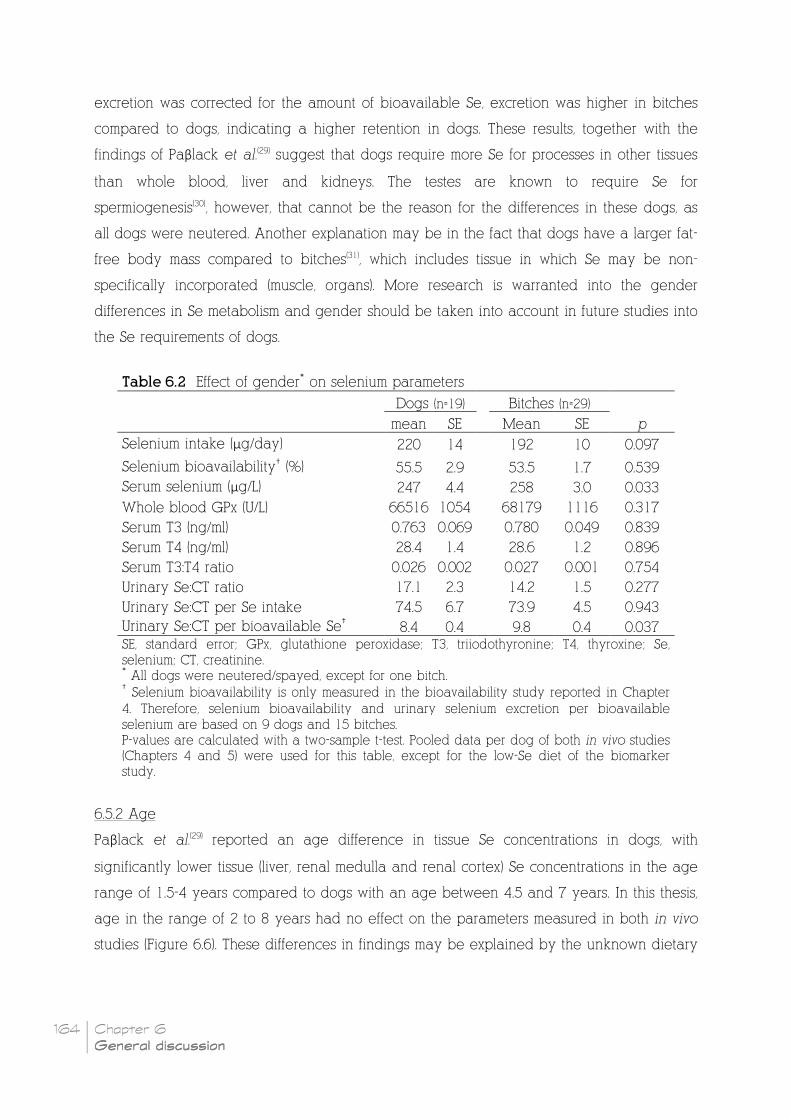
164 Chapter 6
General discussioGeneral discussioGeneral discussioGeneral discussionnnn
excretion was corrected for the amount of bioavailable Se, excretion was higher in bitches
compared to dogs, indicating a higher retention in dogs. These results, together with the
findings of Paβlack et al.(29) suggest that dogs require more Se for processes in other tissues
than whole blood, liver and kidneys. The testes are known to require Se for
spermiogenesis(30), however, that cannot be the reason for the differences in these dogs, as
all dogs were neutered. Another explanation may be in the fact that dogs have a larger fat-
free body mass compared to bitches(31), which includes tissue in which Se may be non-
specifically incorporated (muscle, organs). More research is warranted into the gender
differences in Se metabolism and gender should be taken into account in future studies into
the Se requirements of dogs.
Table 6.2 Effect of gender* on selenium parameters
Dogs (n=19) Bitches (n=29)
mean SE Mean SE p
Selenium intake (µg/day) 220 14 192 10 0.097
Selenium bioavailability† (%) 55.5 2.9 53.5 1.7 0.539 Serum selenium (µg/L) 247 4.4 258 3.0 0.033
Whole blood GPx (U/L) 66516 1054 68179 1116 0.317
Serum T3 (ng/ml) 0.763 0.069 0.780 0.049 0.839
Serum T4 (ng/ml) 28.4 1.4 28.6 1.2 0.896
Serum T3:T4 ratio 0.026 0.002 0.027 0.001 0.754
Urinary Se:CT ratio 17.1 2.3 14.2 1.5 0.277
Urinary Se:CT per Se intake 74.5 6.7 73.9 4.5 0.943 Urinary Se:CT per bioavailable Se† 8.4 0.4 9.8 0.4 0.037 SE, standard error; GPx, glutathione peroxidase; T3, triiodothyronine; T4, thyroxine; Se, selenium; CT, creatinine. * All dogs were neutered/spayed, except for one bitch.
† Selenium bioavailability is only measured in the bioavailability study reported in Chapter
4. Therefore, selenium bioavailability and urinary selenium excretion per bioavailable selenium are based on 9 dogs and 15 bitches. P-values are calculated with a two-sample t-test. Pooled data per dog of both in vivo studies (Chapters 4 and 5) were used for this table, except for the low-Se diet of the biomarker study.
6.5.2 Age
Paβlack et al.(29) reported an age difference in tissue Se concentrations in dogs, with
significantly lower tissue (liver, renal medulla and renal cortex) Se concentrations in the age
range of 1.5-4 years compared to dogs with an age between 4.5 and 7 years. In this thesis,
age in the range of 2 to 8 years had no effect on the parameters measured in both in vivo
studies (Figure 6.6). These differences in findings may be explained by the unknown dietary

Chapter 6
General discussionGeneral discussionGeneral discussionGeneral discussion
165
Se concentrations in the study of Paβlack et al.(29), which may be different between the 1.5-4
years and 4.5-7 years group.
Figure 6.6 Effect of dog age on serum selenium (A), whole blood GPx (B), serum T3:T4
ratio (C) and urinary selenium:CT ratio (D)
R2, coefficient of determination; GPx, glutathione peroxidase; U, unit; T3, triiodothyronine; T4,
thyroxine; CT, creatinine. Pooled data per dog (n=48) of both in vivo studies (Chapters 4 and 5)
were used for these figures, except for the low-Se diet of the biomarker study. P-values were
calculated with linear regression.
6.5.3 Breed
Dog breed could also have had an effect on the results reported in this thesis. All in vivo
studies were performed with Labrador retrievers. There are no studies reported that
investigated dog breed differences in Se metabolism. However, it has been reported by
Weber et al.(32) that larger dog breeds have a higher nutrient digestibility. Energy
requirements of Great Danes have been reported to be approximately 60% higher than
other breeds and that of New Foundland dogs 20% lower(33). Large breeds are known to
age faster(4), by which the need for anti-oxidants, and thus Se, may increase. Also highly
R² = 0.004
175
195
215
235
255
275
295
1 2 3 4 5 6 7 8 9
Se
rum
se
len
ium
(µ
g/L
)
R² = 0.025
0
20000
40000
60000
80000
100000
1 2 3 4 5 6 7 8 9
Wh
ole
blo
od
GPx (
U/L
) B
R² = 0.006
0.000
0.005
0.010
0.015
0.020
0.025
0.030
0.035
0.040
1 2 3 4 5 6 7 8 9
Se
rum
T3
:T4
ra
tio
Age (years)
C
R² = 0.001
0
5
10
15
20
25
30
35
40
1 2 3 4 5 6 7 8 9
Uri
na
ry s
ele
niu
m:C
T r
ati
o
Age (years)
D
0
A
p = 0.686 p = 0.293
p = 0.603 p = 0.883

166 Chapter 6
General discussioGeneral discussioGeneral discussioGeneral discussionnnn
active dog breeds, such as Border Collies, sled dogs (e.g. Husky's), or racing dogs (e.g.
greyhounds) are likely to have increased oxidative stress and thus a higher anti-oxidant
requirement. The Labrador retreiver is a medium sized dog and is the most commonly kept
dog breed in the UK(34). These potential breed effects are worth being further investigated,
but given the general kind of the studies in this thesis, it is dared to
assume that the general ideas from these results are widely applicable
across dog breeds.
6.5.4 Metabolic changes associated with selenium status
When determining Se minimum requirements or a legal upper limit in dogs, it is necessary
to account for changes in Se metabolism. Significant metabolic changes due to Se
deficiency have been shown in a metabolomics study in mice(35). The Se deficient mice had
a serum Se concentration of 81 µg/L compared to a serum Se concentration of 430 µg/L in
mice fed an adequate Se diet (dietary Se concentration not stated). Se deficiency resulted
in an increase in serum serine, threonine, phenylalanine, methionine, creatine, fructose,
sorbose, sucrose, proline, glycine, isoleucine and pyruvate(35). This indicates an increased
protein turnover in Se deficiency, which may be caused by increased protein degradation
due to oxidative stress. The increase in methionine may also reflect a dysregulation of the
methionine-homocysteine cycle, which is also involved in the transamination of SeMet to
SeCys for incorporation into selenoproteins. It is, however, not known whether the change in
metabolism remains when Se status is restored to adequate levels.
There are indications that animals can adapt to high Se intakes, which also suggests a
metabolic change to high concentrations of Se. Hintze et al.(36) reported that kidney Se
concentrations of steers from seleniferous areas were lower on a high Se diet (11.9 mg/kg)
than in steers from non-seleniferous areas. In rats, males have been reported to adapt better
to high Se intakes than female rats, due to an increase in volatile Se metabolites that are
excreted via the respiratory tract(37). Therefore, it is important to determine the baseline Se
status of the animal when assessing Se requirements.

Chapter 6
General discussionGeneral discussionGeneral discussionGeneral discussion
167
6.6 Future perspectives
Although many studies have been performed on Se during the last decades, the
recommendation of Se for maintenance in healthy adult dogs is still not determined
accurately. This thesis showed evidence for the need to separate the minimum requirements
for canned and kibble diets and the potential sex differences in Se requirements. The
accuracy of the Se biomarkers, urinary Se:CT, serum Se and serum GPx, as biomarkers for
prevention of Se related diseases can actually only be verified when Se deficiency is
triggered. The actual Se requirements of dogs to prevent long-term Se related diseases can
possibly only be determined by following up groups of dogs in a longitudinal study (during
early adulthood into the geriatric life stage) that are fed a range in dietary Se (from below
0.1 to above 0.56 mg/kg DM) and look at the onset of Se related diseases. However, there
are still other factors that may influence the requirements, such as genetic predisposition,
oxidant triggering (for example, due to an increased exercise level(38) or obesity(39)), etc.
Therefore, the assumption should be made that the reported biomarkers are really related
to the onset of Se related diseases. An estimation of an adequate range in urinary Se:CT,
serum Se and serum GPx can be determined using epidemiological studies in healthy and
diseased (cancer, diabetes, etc) dogs.
These ranges can be used as an endpoint (to prevent disease development in the study
dogs) in studies into the minimum Se requirements. Minimum requirement studies can be
performed by feeding dogs a pre-feed containing merely inorganic Se, to deplete Se body
stores, as organically-bound Se can be non-specifically stored in body proteins, from which
it can be gradually freed to potentially become bioactive.. A study using stable isotopes
should be done to determine the time necessary to deplete Se body stores in dogs, but the
maximum of 10 months as found in humans(40) could be used as a guidance. After the pre-
feeding period, dogs should be devided into groups with equal numbers of dogs and
bitches. Each group should be fed one experimental diet, that is either a canned or kibble
diet with a Se concentration of the diets ranging between 0 and 0.3 mg/kg DM. It is known
from the study of Van Vleet(41) that clinical Se deficiency signs appeared after 6 to 8 weeks
with a diet containing 0.01 mg Se/kg and no vitamin E. The biomarker study also showed
differences in urinary Se:CT, serum Se and serum GPx within 8 weeks. Therefore, 8 weeks
should be a sufficient study length to determine the minimum Se requirements of dogs. The
Se concentration that does not cause biomarker concentrations to drop below the lower
limit of the range determined in the epidemiological study, can be considered the minimum
requirement of healthy adult dogs.

168 Chapter 6
General discussioGeneral discussioGeneral discussioGeneral discussionnnn
Se requirements of dogs in other life stages (e.g. lactating, geriatric), from different breeds, or
with another physical status (e.g. obesity) may be different, for example, due to a higher
level of oxidative stress. Minimum requirements of these dogs can be determined in the
same way.
In addition, more research is required to get a better understanding of the Se metabolism of
dogs. This can be done by the use of inorganic and organically-bound stable isotopes, for
example, to determinethe turn over time of Se body stores or the difference in the amount
of biliairy Se excretion between the Se species. Analysis of urinary Se species between
canned and kibble diets at low, adequate and high Se concentrations, and the
measurement of Se containing bile acids in the faeces are other ways to get a better insight
into the Se metabolism of dogs.
The effect of specific dietary components on the effect of Se bioavailability and -activity
also require more research. Fibre was not identified as an important factor for Se
accessibility of kibble diets in the in vitro study, but it did significantly decrease in vitro Se
accessibility of canned diets. It would be interesting to investigate whether different fibre
types (e.g. guar gum, sugar beet fibre, cellulose) have a different effect on the Se
bioavailability of canned diets. Also, the interaction of Se with other anti-oxidants, such as
vitamin E and C, should be investigated in more detail, to verify for which dietary range in
these anti-oxidants, the dietary Se recommendation accounts.
6.7 Conclusions
The studies reported in this thesis have demonstrated that diet type and everything that is
associated with it (ingredients, heat processing, Se source) has a major impact on the
availability of Se. Therefore, the minimum requirements for Se inclusion levels in dog foods
are more variable than the current recommendation of FEDIAF allows for. The studies in this
thesis and the determined biomarkers, urinary Se:CT ratio, serum Se and serum GPx, are a
first step towards the actual minimum requirements of healthy adult dogs to prevent long-
term Se related diseases. Based on these requirements, more specific recommendations on
Se inclusion levels in dog foods could be defined.

Chapter 6
General discussionGeneral discussionGeneral discussionGeneral discussion
169
6.8 References
1. Hervera M, Baucells MD, González G et al. (2009) Prediction of digestible protein content of dry extruded dog foods: comparison of methods. Journal of Animal Physiology and
Animal Nutrition 93939393, 366-372. 2. German AJ (2006) The Growing Problem of Obesity in Dogs and Cats. The Journal of
Nutrition 136136136136, 1940S-1946S. 3. Linder DE, Freeman LM, Morris P et al. (2012) Theoretical evaluation of risk for nutritional
deficiency with caloric restriction in dogs. Veterinary Quarterly 32323232, 123-129. 4. National Research Council (2006) Nutrient requirements of dogs and cats. [Rev. ed, Animal
nutrition series. Washington D.C.: National Academies Press. 5. Wedekind KJ, Kirk CA, Yu S et al. (2002) Defining the safe lower and upper limit for
selenium (Se) in adult dogs. FASEB Journal 15151515, A992-A993. 6. Yu S, Wedekind KJ, Kirk CA et al. (2006) Primary hair growth in dogs depends on dietary
selenium concentrations. Journal of Animal Physiology and Animal Nutrition 90909090, 146-151. 7. European Commission (2009) Regulation (EC) No 767/2009 of the European parliament
and of the council of 13 July 2009 on the placing on the market and use of feed, amending European Parliament and Council Regulation (EC) No 1831/2003 and repealing Council Directive 79/373/EEC, Commission Directive 80/511/EEC, Council Directives 82/471/EEC, 83/228/EEC, 93/74/EEC, 93/113/EC and 96/25/EC and Commission Decision 2004/217/EC. Official Journal of the European Union L 229L 229L 229L 229, 1-28.
8. European Commission (2010) Commission regulation (EU) No 454/2010 of 26 May 2010 on transitional measures under Regulation (EC) No 767/2009 of the European Parliament and of the Council as regards the labelling provisions for feed. Official Journal of the
European Union L 128L 128L 128L 128, 1-2. 9. FEDIAF (2011) Code of Good Labelling Practice for Pet Food. Brussels: European Pet Food
Industry Federation. 10. Todd SE, Thomas DG, Bosch G et al. (2012) Selenium status in adult cats and dogs fed high
levels of dietary inorganic and organic selenium. Journal of Animal Science 90909090, 2549-2555. 11. Singh H (1991) Modification of food proteins by covalent crosslinking. Trends in Food
Science & Technology 2222, 196-200. 12. Zhang Q, Ames JM, Smith RD et al. (2009) A Perspective on the Maillard Reaction and the
Analysis of Protein Glycation by Mass Spectrometry: Probing the Pathogenesis of Chronic Disease. Journal of Proteome Research 8888, 754-769.
13. Bauer MC, Weiss DJ, Perman V (1992) Hematologic alterations in adult cats fed 6 or 12% propylene glycol. American Journal of Veterinary Research 53535353, 69-72.
14. Guyton AC, Hall JE (2011) Textbook of medical physiology. 11th ed. Philadelphia: Elsevier Inc.
15. Christian J, Rebar A, Boon G et al. (1993) Senescence of canine biotinylated erythrocytes: increased autologous immunoglobulin binding occurs on erythrocytes aged in vivo for 104 to 110 days. Blood 82828282, 3469-3473.
16. Combs Jr GF, Combs SB (1986) Biochemical functions of selenium. In The Role of Selenium
in Nutrition, pp. 205-263. New York: Academic Press. 17. Cummings JH, Wiggins HS, Jenkins DJ et al. (1978) Influence of diets high and low in
animal fat on bowel habit, gastrointestinal transit time, fecal microflora, bile acid, and fat excretion. Journal of Clinical Investigation 61616161, 953-963.
18. Symonds HW, Mather DL, Vagg MJ (1981) The excretion of selenium in bile and urine of steers: the influence of form and amount of Se salt. British Journal of Nutrition 46464646, 487-493.
170 Chapter 6
General discussioGeneral discussioGeneral discussioGeneral discussionnnn
19. Gyurasics Á, Perjési P, Gregus Z (1998) Role of glutathione and methylation in the biliary excretion of selenium. the paradoxical effect of sulfobromophthalein. Biochemical
Pharmacology 56565656, 1381-1389. 20. National Research Council (1983) Selenium in Nutrition. Washington D.C.: National
Academies Press. 21. Forrer R, Gautschi K, Lutz H (1991) Comparative determination of selenium in the serum
of various animal species and humans by means of electrothermal atomic absorption spectrometry. Journal of Trace Elements and Electrolytes in Health and Disease 5555, 101-113.
22. Lane HW, Strength R, Johnson J et al. (1991) Effect of Chemical Form of Selenium on Tissue Glutathione Peroxidase Activity in Developing Rats. Journal of Nutrition 121121121121, 80-86.
23. Sunde RA, Gutzke GE, Hoekstra WG (1981) Effect of dietary methionine on the biopotency of selenite and selenomethionine in the rat. Journal of Nutrition 111111111111, 76-88.
24. Rucker RB, Fascetti AJ, Keen CL (2008) Trace Minerals. In Clinical Biochemistry of Domestic
Animals (Sixth Edition), pp. 663-693 [JJKWHL Bruss, editor]. San Diego: Academic Press. 25. Foster LH, Sumar S (1997) Selenium in health and disease: A review. Critical Reviews in
Food Science and Nutrition 37373737, 211-228. 26. Bosch G, Hagen-Plantinga EA, Hendriks WH (2015) Dietary nutrient profiles of wild wolves:
insights for optimal dog nutrition? British Journal of Nutrition 113113113113, S40-S54. 27. Schomburg L (2012) Variations in Selenium Metabolism in Males and Females. In Selenium
It's molecular biology and role in human health, pp. 419-432 [DL Hatfield, MJ Berry and VN Gladyshev, editors]. New York: Springer New York.
28. Brown DG, Burk RF (1973) Selenium Retention in Tissues and Sperm of Rats Fed α Torula Yeast Diet. Journal of Nutrition 103103103103, 102-108.
29. Paßlack N, Mainzer B, Lahrssen-Wiederholt M et al. (2015) Concentrations of strontium, barium, cadmium, copper, zinc, manganese, chromium, antimony, selenium, and lead in the liver and kidneys of dogs according to age, gender, and the occurrence of chronic kidney disease. Journal of Veterinary Science 16161616, 57-66.
30. Flohé L (2007) Selenium in mammalian spermiogenesis. In Biological Chemistry, vol. 388, pp. 987-995.
31. Laflamme DP (1997) Development and validation of a body condition score system for dogs. Canine Practice 22222222, 10-15.
32. Weber M, Martin L, Biourge V et al. (2003) Influence of age and body size on the digestibility of a dry expanded diet in dogs. Journal of Animal Physiology and Animal
Nutrition 87878787, 21-31. 33. Kienzle E, Rainbird A (1991) Maintenance Energy Requirement of Dogs: What is the
Correct Value for the Calculation of Metabolic Body Weight in Dogs? The Journal of
Nutrition 121121121121, S39-S40. 34. The Kennel Club (2007) Registration statistics for all recognised dog breeds - 2005 and
2006. http://web.archive.org/web/20090904034036/http://www.thekennelclub.org.uk/cgi-bin/item.cgi?id=926&d=pg_dtl_art_news&h=238&f=0 (accessed 30-11 2015).
35. Mickiewicz B, Villemaire M, Sandercock L et al. (2014) Metabolic changes associated with selenium deficiency in mice. Biometals 27272727, 1137-1147.
36. Hintze KJ, Lardy GP, Marchello MJ et al. (2002) Selenium Accumulation in Beef: Effect of Dietary Selenium and Geographical Area of Animal Origin. Journal of Agricultural and Food
Chemistry 50505050, 3938-3942.

Chapter 6
General discussionGeneral discussionGeneral discussionGeneral discussion
171
37. Combs Jr GF, Combs SB (1986) Effects of selenium excesses. In The Role of Selenium in
Nutrition, pp. 463-525. New York: Academic Press. 38. Kanter M (1998) Free radicals, exercise and antioxidant supplementation. Proceedings of
the Nutrition Society 57575757, 9-13. 39. Furukawa S, Fujita T, Shimabukuro M et al. (2004) Increased oxidative stress in obesity
and its impact on metabolic syndrome. Journal of Clinical Investigation 114114114114, 1752-1761. 40. Patterson BH, Levander OA, Helzlsouer K et al. (1989) Human selenite metabolism: a
kinetic model. American Journal of Physiology 257257257257, R556-R567. 41. van Vleet JF (1975) Experimentally induced vitamin E-selenium deficiency in the growing
dog. Journal of the American Veterinary Medical Association 166166166166, 769-774.


glutathione peroxidase activity analysis __________________________________________________________
Supplement
Storage of whole blood forglutathione peroxidase activity analysis
_____________________________________________________________________________________________________________
Supplement
Storage of whole blood for glutathione peroxidase activity analysis
___________________________________________________

"Storage of heparinised canine whole blood for measurement of glutathione peroxidase activity"
Mariëlle van Zelst1, Myriam Hesta1, Kerry Gray2, Geert P.J. Janssens1
1 Department of Animal Nutrition, Genetics and Ethology, Faculty of Veterinary Medicine, Ghent
University, Merelbeke, Belgium
2 WALTHAM® Centre for Pet Nutrition, Waltham-on-the-Wolds, Leicestershire, United Kingdom
Submitted as short communication to Biological Trace Element Research

Supplement
Glutathione peroxidase storageGlutathione peroxidase storageGlutathione peroxidase storageGlutathione peroxidase storage
175
S.1 Abstract
Glutathione peroxidase activity is used as a biomarker of selenium status in dogs. Freshly
collected blood samples are usually measured, due to the lack of knowledge on the effect
of storing the samples. This study investigated if analysis of glutathione peroxidase activity
in whole blood collected from dogs was affected by storage time, between 5 and 164 days.
Results indicated that glutathione peroxidase activity was more variable in the freshly
analysed samples compared to the stored samples. Although the mean differences between
fresh and stored samples were not always encompass zero, this is thought to be caused by
the variability of reagent preparation rather than by storage, as no consistent increase or
decrease in glutathione peroxidase activity was found. Therefore, it can be concluded that
heparinised dog blood samples can be successfully stored up to 164 days before analysis
of glutathione peroxidase activity.
S.2 Introduction
Glutathione peroxidase (GPx) is an intra-cytoplasmic selenium-dependent antioxidant that
protects the body against free radicals and other oxidative damage. As such, it is an
important and frequently used biomarker of selenium status in mammals(1-3). Eighty percent of
the enzymatic activity of GPx is confined to the cell membrane of erythrocytes and only
some activity can be found in plasma(4). GPx activity is often analysed immediately after
sampling, because the effects of storage of canine whole blood on GPx activity is not well
documented. However, the limited shelf life of analysis kits and stability of reagents(5) makes
it inefficient to use for long-term trials with frequent sampling points. No data are available
on the suitability of long-term storage of canine whole blood for this analysis. Therefore, the
aim of this study was to investigate the effect of storage duration on the activity of
glutathione peroxidase measured in heparinised whole blood from dogs after storage at -
80°C for varying periods of time.
S.3 Experimental methods
These data were collected as part of a study examining selenium bioavailability by van
Zelst et al. (unpublished, Chapter 4). This study (HO0647) was approved by the WALTHAM
Centre for Pet Nutrition Animal Welfare and Ethical Review Body and was conducted under
Home Office Project License authorisation. Twenty-three adult Labrador retrievers were
divided into four groups. Dogs were fed four of eight commercially available diets (2
canned and 2 kibble) in a randomized order, for 29-42 days. Before the start of the study
and at the end of every diet change, 0.5 ml of fasted whole blood was taken for GPx
176 Supplement
Glutathione peroxidase storageGlutathione peroxidase storageGlutathione peroxidase storageGlutathione peroxidase storage
activity analysis by jugular venipuncture (resulting in 23 dogs x 5 sampling occasions = 115
samples). Blood was transferred into a lithium heparin tube and stored on ice until
analysis/storage. GPx activity was measured using 25 µl of whole blood within 20 minutes of
sampling. The remaining sample was immediately stored in its lithium heparin tube at -80°C.
Storage duration was 5 to 164 days, and all samples were assayed as one batch at the end
of the trial (therefore blood samples were always their own control). GPx activity
measurements were performed in duplicate on each individual sample using the Ransel kit
(Randox Laboratories Ltd., UK), based on a method of Paglia & Valentine(6), and the Olympus
AU400 spectrophotometer (Olympus Inc., USA). This method is based on GPx catalysing the
oxidation of glutathione by cumene hydroperoxide. In the presence of glutathione
reductase and NADPH, the oxidised glutathione is immediately converted to the reduced
form with a concomitant oxidation of NADPH to NADP+. The decrease in absorbance is
measured photometrically at 340 nm. A 4-point calibration curve of the Ransel quality
control was used as control. Mean values of the duplicates were calculated and used for
statistical analysis. The mean coefficient of variation (CV, %) over the fresh and stored
measurements was calculated for each sample individually. A standard error of the mean
(SEM) was calculated over all samples for the fresh and stored samples separately. Mean
differences (fresh minus stored) and confidence intervals were obtained from the descriptive
statistics in SPSS 21.
S.4 Results and discussion
Twenty-seven samples did not contain enough blood for analysis on both fresh and stored
samples of GPx activity and were omitted from the study, resulting in a total of 88 analysed
samples of 23 dogs. The average CV of the GPx activity analysis within samples (duplicates)
was 1.4% in the fresh samples and 2.1% in the stored samples. The 4-point calibration curve
of the quality control dilutions 1:11, 1:21, 1:41 and 1:61, showed an average recovery of 83.4
± 1.2 (mean ± standard error), 93.5 ± 1.2, 98.5 ± 1.5, and 94.6 ± 2.7%, respectively in the fresh
samples. The average recovery was 81.8 ± 0.5, 93.9 ± 1.1, 98.2 ± 0.3, and 102.7 ± 1.7%,
respectively in the stored samples. Average results of the GPx activity measurements in fresh
and stored samples are shown in Table S.1 and mean differences between the fresh and
stored samples are plotted in Figure S.1. The confidence intervals of the mean differences
between fresh and stored samples did not encompass zero after 12, 40, 88, 95, and 130 and
all further days of storage. However, the mean CV of the fresh and stored samples always
remained below 10%, which is usually considered as the cut-off value for acceptance of
biological data. In this study the highest mean CV between fresh and stored samples was

Supplement
Glutathione peroxidase storageGlutathione peroxidase storageGlutathione peroxidase storageGlutathione peroxidase storage
177
Table S.1 Mean glutathione peroxidase activity and coefficient
of variation of fresh and stored (-80°C) canine blood
Fresh (U/L) Storage
(days)
Stored (U/L) Mean CV†
(%) n Mean SE Mean SE
5 66317 2481 5 65944 2409 0.53
6 62426 1206 12 64275 1337 2.05
5 64929 2388 19 65280 2526 0.46
5 60835 1707 26 59792 1387 1.79
5 73954 918 40 67826 788 6.11
6 68544 1765 47 67669 1908 2.78
5 63875 2971 54 63746 2490 1.73
5 61330 2042 61 61861 2079 2.79
5 65845 1030 74 67276 951 1.76
6 68171 2285 81 66970 2405 1.71
4 60173 2228 88 65268 1963 5.79
3 58243 1574 95 61201 1242 3.52
5 63676 2147 123 65112 1640 2.07
6 63289 1159 130 66795 1582 3.77
6 62655 1397 137 68067 1671 5.84
6 68055 1874 157 64234 2000 4.32
5 62247 1840 164 59313 1584 3.39
°C, degrees Celsius; n, number of dogs; U, units; SE, standard error; CV,
coefficient of variation.
†coefficient of variation is calculated over the fresh and stored samples
per dog.
6.1%, which could be considered as interassay variation, where in other studies using the
same analytical kit, the interassay variation of merely fresh or stored samples was 7.5%(7)
and 9.9%(8), respectively, indicating that storage in this study did not increase interassay
variability. The biological assay is still of value for the measurement of GPx activity, but
depending on the power of the study, differences in GPx activity between groups could
overrule the interassay variation. The SEM of the fresh samples was 407 and of the stored
samples 296, indicating that variability was much larger in the fresh compared to the stored
samples. The variability in SEM may be due to variation in reagents caused by freshly

178 Supplement
Glutathione peroxidase storageGlutathione peroxidase storageGlutathione peroxidase storageGlutathione peroxidase storage
Figure S.1 Mean difference in glutathione peroxidase activity (U/L)
between fresh and stored canine heparinised whole blood.
Error bars represent the 95% confidence interval.
preparing the reagents every sampling occasion. Therefore, it may be argued that the
significant differences found in the samples after 12 and 40 days of storage may also be
due to this variation. There was also not an obvious increase or decrease of GPx activity
after storage, indicating that storage did not specifically reduce the enzyme activity of GPx.
This strengthens the suggestion that analysis of GPx activity on different days using
different kits (and thus having to prepare the reagents multiple times) has more impact on
the accuracy of the measurements than storage of the blood. This leads to the conclusion
that heparinised dog blood samples can be successfully stored up to 164 days before
analysis of GPx activity, rather than preparing the reagents multiple times, in the
performance of long-term studies with multiple sampling points. In addition, it would be
valuable to increase the reproducibility and accuracy of the method by identifying the
0
10
20
30
40
50
60
70
80
90
100
110
120
130
140
150
160
170
180
-7500 -5000 -2500 0 2500 5000 7500
da
ys
of
sto
rag
e
Difference in glutathione peroxidase activity between fresh and stored samples (U/L)

Supplement
Glutathione peroxidase storageGlutathione peroxidase storageGlutathione peroxidase storageGlutathione peroxidase storage
179
factors (e.g. reagens) responsible for the variability between GPx activity in fresh samples
and after storage.
S.5 References
1. Thomson CD, Robinson MF, Campbell DR et al. (1982) Effect of prolonged supplementation with daily supplements of selenomethionine and sodium selenite on glutathione peroxidase activity in blood of New Zealand residents. American Journal of
Clinical Nutrition 36363636, 24-31. 2. Wedekind KJ, Yu S, Combs GF, Jr. (2004) The selenium requirement of the puppy. Journal
of Animal Physiology and Animal Nutrition 88888888, 340-347. 3. Todd SE, Thomas DG, Hendriks WH (2011) Selenium balance in the adult cat in relation to
intake of dietary sodium selenite and organically bound selenium. Journal of Animal
Physiology and Animal Nutrition 96969696, 148-158. 4. Nève J (1988) Biological functions of selenium. Proceedings of the Second International
Congress on Trace Elements in Medicine and Biology, 97-111. 5. Randox Laboratories (2005) Ransel Glutathione Peroxidase Manual. 6. Paglia DE, Valentine WN (1967) Studies on the quantitative and qualitative
characterization of erythrocyte glutathione peroxidase. Journal of Laboratory and Clinical
Medicine 70707070, 158-169. 7. Guemouri L, Artur Y, Herbeth B et al. (1991) Biological variability of superoxide dismutase,
glutathione peroxidase, and catalase in blood. Clinical Chemistry 37373737, 1932-1937. 8. Blankenberg S, Rupprecht HJ, Bickel C et al. (2003) Glutathione Peroxidase 1 Activity and
Cardiovascular Events in Patients with Coronary Artery Disease. New England Journal of
Medicine 349349349349, 1605-1613.


_____________________________________________________________________________________________________________
Summary_____________________________________________________________________________________________________________
Summary _____________________________________________________________________________________________________________

SummarySummarySummarySummary
183
Selenium is an essential trace mineral involved in many biological processes, such as anti-
oxidant, thyroid and immune function. Current recommendations for selenium inclusion in
dog foods lack knowledge on the requirements of adult dogs and the effect of various
factors on its bioavailability (i.e. the fraction of the dietary selenium that reaches the
systemic circulation) and bioactivity (i.e. the selenium that is incorporated into
selenoproteins). Therefore, the objective of this PhD project (Chapter 2) was to identify
factors that contribute to the biological utilisation of dietary selenium, as a first step towards
correct selenium inclusion levels in dog foods to prevent long-term selenium related
diseases.
First, an in vitro study was performed (Chapter 3a) to assess the effect of a large range of
factors, such as diet type; and dietary protein, methionine, cysteine, lysine and selenium
concentration, on in vitro selenium accessibility (i.e. the amount of dietary selenium that is
potentially available for absorption after in vitro digestion). Sixty-two pet foods (dog, n=52;
cat, n=10) were enzymatically digested: 54 were commercially available (kibble, n=20; pellet,
n=8; canned, n=17; raw meat, n=6; steamed meat, n=3) and eight were unprocessed (kibble,
n=4; canned, n=4) from the same batch as the corresponding processed diets. The canning
process (n=4) decreased in vitro selenium accessibility, whereas extrusion (n=4) did not.
Canned and steamed meat diets had a lower in vitro selenium accessibility than pelleted
and raw meat diets. A positive correlation between in vitro selenium accessibility and crude
protein digestibility was found for extruded diets (kibbles, n=19; r= 0.540) and a negative
correlation for canned diets (n=16; r= -0.611). Data from this in vitro study were also used for
analyses with stepwise linear regression. Predictive equations were successfully formulated
for dry pet foods (Chapter 3b), in order to predict selenium accessibility from diets.
The main factors identified in the in vitro selenium accessibility study (diet type and crude
protein) were evaluated in an in vivo study (Chapter 4) using four canned and four kibble
diets with crude protein concentrations ranging from 10.1 to 27.5 g/MJ. These diets were fed
to four groups of six Labrador retrievers in an incomplete cross over design. Selenium
bioavailability was higher from kibble than canned diets and was not affected by crude
protein intake from both diet types. However, the bioactivity of selenium, as measured by
whole blood glutathione peroxidase activity (U/g Hb), was higher in dogs fed the canned
diets than in dogs fed the kibble diets and decreased with increasing crude protein intake.
These results suggest that there were indeed differences in the bioavailability and -activity
of selenium from canned and kibble diets, which can be caused either by the difference in
ingredients used, by the selenium species or by the processing conditions.

184 SummarySummarySummarySummary
Glutathione peroxidase activity was used as a marker for the bioactivity of selenium. This is
a marker frequently measured in anti-oxidant studies. However, there is a lack of
knowledge on the effect of storing whole blood for this analysis, which is convenient when
performing longitudinal studies with frequent sampling points. Based on the study in
Chapter 4, a study has been performed (Supplement) in which the effect of storing canine
whole blood on the activity of glutathione peroxidase was assessed. Glutathione peroxidase
activity was measured in fresh samples and samples stored for 5 up to 164 days. There
were some significant differences in glutathione peroxidase activity between fresh and
stored samples, but no consistent increase or decrease was found. Results also indicated
that glutathione peroxidase activity was more variable in the freshly analysed samples
compared to the stored samples, which is thought to be caused by the variability from
reagent preparation rather than by storage. Therefore, it can be concluded that canine
blood samples can be successfully stored up to 164 days before analysis of glutathione
peroxidase activity.
Although glutathione peroxidase activity is one of many markers frequently used to
measure selenium status, no studies have been performed to assess whether this marker or
other biomarkers react most quickly to a change in dietary selenium intake. The study
described in Chapter 5 assessed selected biomarkers (urinary selenium:creatinine ratio;
whole blood glutathione peroxidase activity and mRNA expression of selenoproteins; serum
selenium, glutathione peroxidase activity, copper, creatine kinase, and
triiodothyronine:thyroxine ratio; and hair growth) on their suitability to detect a decrease in
selenium provision to adult dogs within eight weeks. Twenty-four dogs received a semi-
purified diet with adequate selenium (46.1 µg/MJ) for eight weeks, after which 12 of the
dogs remained on this diet for another eight weeks and the other 12 dogs received a semi-
purified diet with a low selenium concentration (6.5 µg/MJ; 31% of the FEDIAF minimum). The
urinary selenium:creatinine ratio and serum selenium concentration decreased within one
week after switching to the low selenium diet (84 and 7%, respectively). Serum and whole
blood glutathione peroxidase activity were also significantly lower in dogs consuming the
low selenium diet (6 and 7%, respectively) from weeks 6 and 8 respectively. None of the
other biomarker concentrations changed significantly in response to the low selenium diet
over the 8 week period. Therefore, urinary selenium:creatinine ratio, serum selenium and
serum glutathione peroxidase activity should be used in epidemiological trials, to determine
their association with the occurrence of long-term selenium related diseases and for their
eventual use in trials to determine the minimum selenium requirements in adult dogs.

SummarySummarySummarySummary
185
In conclusion, the studies included in this PhD thesis showed that diet type and dietary
crude protein concentration were associated with selenium bioavailability and bioactivity.
Selenium is generally more bioavailable from kibble diets, but selenium from canned diets
result in an absolute higher bioactivity. Future studies should use the urinary
selenium:creatinine ratio, serum selenium and serum glutathione peroxidase activity to
assess the selenium requirements of adult dogs.


_____________________________________________________________________________________________________________
Samenvatting_____________________________________________________________________________________________________________
Samenvatting _____________________________________________________________________________________________________________


SamenvattingSamenvattingSamenvattingSamenvatting
189
Selenium is een essentieel sporenelement betrokken bij vele biologische processen, zoals
anti-oxidantfunctie, schildklierfunctie en het immuunsysteem. Bij de huidige aanbevelingen
voor het seleniumgehalte in hondenvoeding ontbreekt kennis over de behoefte van
volwassen honden en het effect van verschillende factoren op de biologische
beschikbaarheid (d.i. de fractie van selenium in de voeding dat de systemische circulatie
bereikt) en biologische activiteit (d.i. selenium dat gebruikt wordt voor de vorming van
selenoproteïnen). Daarom was het doel van dit werk (Hoofdstuk 2) om factoren te
identificeren die bijdragen tot het biologische gebruik van selenium uit de voeding, als een
eerste stap op weg naar correcte seleniumconcentraties in hondenvoeding om selenium-
gerelateerde lange termijn ziekten te voorkomen.
Als eerste werd een in vitro onderzoek uitgevoerd (Hoofdstuk 3a) waarin een groot aantal
factoren; zoals dieet type; en de concentraties aan eiwit, methionine, cysteïne, lysine en
selenium gescreend werden op hun effect op potentiële in vitro selenium beschikbaarheid
(de hoeveelheid selenium uit de voeding dat potentieel beschikbaar is voor absorptie na in
vitro vertering). Tweeënzestig honden- en kattenvoeders (hond, n = 52; cat, n = 10) werden
in vitro enzymatisch verteerd: 54 waren commercieel verkrijgbaar (geëxtrudeerde diëten, n
= 20, geperste diëten, n = 8, blikvoer, n = 17; rauw vlees, n = 6, gestoomd vlees, n = 3) en acht
waren niet hitte-behandeld (geëxtrudeerde diëten, n = 4, blikvoer, n = 4) uit dezelfde partij
als de overeenkomstige commerciele voeding. Door de hitte behandeling van blikvoeders (n
= 4) daalde de potentiële in vitro selenium beschikbaarheid, terwijl extruderen (n = 4) geen
verschil opleverde. Blikvoeders en gestoomde vlees diëten hadden een lagere potentiële in
vitro selenium beschikbaarheid dan geperste- en rauw vleesdiëten. Een positieve correlatie
tussen potentiële in vitro selenium beschikbaarheid en eiwitverteerbaarheid was gevonden
voor geëxtrudeerde diëten (n = 19; r = 0,540) en een negatieve correlatie voor blikvoeders (n
= 16; r = -0,611). Gegevens uit deze in vitro studie werden ook gebruikt voor analyse met
lineaire regressie. Voorspellingsmodellen werden succesvol ontwikkeld voor de
geëxtrudeerde en geperste diëten (Hoofdstuk 3b), om daarmee de selenium
toegankelijkheid van voeders in te schatten.
De factoren die in de in vitro studie als meest belangrijk werden aangeduid (dieettype en
eiwit) werden in een in vivo studie (Hoofdstuk 4) getest. Vier blikvoeders en vier
geëxtrudeerde diëten werden geselecteerd met eiwitconcentraties tussen 10,1 en 27,5 g/MJ.
Deze diëten werden in een onvolledige cross-over opstelling gevoerd aan vier groepen
van zes Labrador retrievers. De biologische beschikbaarheid van selenium was hoger in
geëxtrudeerde diëten dan blikvoeders en werd bij beide dieettypen niet beïnvloed door
eiwitinname. De biologische activiteit van selenium, gemeten door glutathionperoxidase

190 SamenvattingSamenvattingSamenvattingSamenvatting
activiteit in bloed (U/g Hb), was hoger bij honden die het blikvoer aten dan bij honden die
de geëxtrudeerde diëten kregen en daalde met toenemende eiwitinname. Deze resultaten
suggereren dat er inderdaad verschillen zijn in de biologische beschikbaarheid en activiteit
van selenium tussen blikvoeders en geëxtrudeerde diëten. Dit kan worden veroorzaakt door
het verschil in gebruikte ingrediënten, de seleniumspecies of het type hitte-behandeling.
Glutathionperoxidase activiteit werd gebruikt als een merker voor de biologische activiteit
van selenium. Dit is een vaak gebruikte merker in studies naar anti-oxidanten. Het invriezen
van bloed voor deze analyse is handig bij het uitvoeren van longitudinale studies met
frequente staalnames, maar kennis over de impact van bewaring op de
glutathionperoxidase activiteit ontbreekt. Er is een studie uitgevoerd (Supplement),
gebaseerd op de studie beschreven in Hoofdstuk 4, waarbij het effect van het invriezen
van hondenbloed op de activiteit van glutathionperoxidase werd bepaald.
Glutathionperoxidase activiteit werd gemeten in verse stalen en stalen ingevroren bij -80°C
gedurende 5 tot 164 dagen. Glutathionperoxidase activiteit verschilde op een aantal
momenten tussen verse en ingevroren stalen, maar er werd geen consistente toename of
afname gevonden. De resultaten gaven ook aan dat glutathionperoxidase activiteit
variabeler is in de vers geanalyseerde stalen in vergelijking met de ingevroren stalen.
Vermoedelijk veroorzaakt het telkens opnieuw bereiden van de reagentia een grotere
variabiliteit dan het invriezen van de stalen. Hondenbloedstalen kunnen dus tot minstens
164 dagen worden ingevroren zonder nadelige invloed op de analyse van
glutathionperoxidase activiteit.
Hoewel glutathionperoxidase activiteit vaak gebruikt wordt als merker voor seleniumstatus,
zijn nog geen studies uitgevoerd om te beoordelen welke biologische merkers het meest
geschikt zijn om verandering in seleniuminname te meten. De in Hoofdstuk 5 beschreven
studie onderzocht geselecteerde biologische merkers (urinaire selenium:creatinine
verhouding; glutathionperoxidase activiteit en mRNA expressie van selenoproteïnen in
bloed; serum selenium, glutathionperoxidase activiteit, koper, creatinekinase, en
triiodothyronine:thyroxine verhouding; en haargroei) op hun geschiktheid om binnen acht
weken een daling in seleniuminname te detecteren bij volwassen honden. Vierentwintig
honden kregen een semi-synthetisch dieet met een adequate hoeveelheid selenium (46,1
µg/MJ) gedurende acht weken, waarna 12 honden dit dieet voor nog eens acht weken
kregen en de overige 12 honden werden overgeschakeld op een semi-synthetisch dieet
met een lage seleniumconcentratie (6,5 µg/MJ, 31% van de FEDIAF minimum aanbeveling).
De urinaire selenium:creatinine verhouding en serum selenium concentratie daalde binnen
één week na het overschakelen naar het lage selenium dieet (84 en 7% respectievelijk).

SamenvattingSamenvattingSamenvattingSamenvatting
191
Serum en bloed glutathionperoxidase activiteit waren ook significant lager bij honden op
het lage selenium dieet (6 en 7% respectievelijk) vanaf week 6 en 8 respectievelijk. Geen
van de andere biologische merkers reageerde binnen acht weken op de overschakeling
naar het dieet met de lage selenium concentratie. De urinaire selenium:creatinine
verhouding, serum selenium en serum glutathionperoxidase activiteit zouden gebruikt
moeten worden in een epidemiologische studie om te bepalen wat de associatie van deze
merkers is met het optreden van selenium-gerelateerde ziekten op de lange termijn.
Uiteindelijk kunnen ze dan gebruikt worden bij het bepalen van de minimale
seleniumbehoefte van volwassen honden.
Kortom, de studies in dit proefschrift toonden aan dat dieettype en eiwitconcentraties
invloed hebben op de biologische beschikbaarheid en activiteit van selenium. De
biologische beschikbaarheid van selenium is over het algemeen hoger bij geëxtrudeerde
diëten, maar selenium uit blikvoeders resulteert in een hogere biologische activiteit.
Toekomstige studies kunnen de urinaire selenium:creatinine verhouding, serum selenium en
serum glutathionperoxidase activiteit gebruiken om de seleniumbehoefte van volwassen
honden te achterhalen.


_________________________________________________________________
Curriculum _____________________________________________________________________________________________________________
Curriculum vitae ____________________________________________


Curriculum vitaeCurriculum vitaeCurriculum vitaeCurriculum vitae
195
Mariëlle van Zelst was born on the 19th of October 1984 in Utrecht, the Netherlands. In
2005, she started a BSc study in Animal Husbandry and Animal Health Care at HAS Den
Bosch, the Netherlands. During her research internships she investigated whale and dolphin
interactions (Atlantic Whale foundation, Tenerife) and alternative protein sources for
hypoallergenic pelleted dog foods (Wielink diervoeders, IJsselmuiden). Mariëlle was a
coordinator of many volunteers at the Atlantic Whale foundation and was a member of the
public relations team of HAS Den Bosch. For her graduation project she developed a
protocol for food preference tests in mink. In 2008, she obtained her bachelor's degree with
distinction (according to UGent standards with "great distinction").
Consecutively, she started a master's programme in Animal Sciences at Wageningen
University and became a member of the student association "De Veetelers" and a board
member and treasurer of the application course committee. Her master theses were about
the behavioural and glucocorticoid responses of assistance dogs during training and about
the effects of diet type on behaviour of dogs. She obtained the MSc degree in 2010
(according to UGent standards with "great distinction") with specialisation in animal nutrition
and ethology.
Fascinated by scientific research and animal nutrition, she started her PhD research in
October 2011 at the department of Nutrition, Genetics and Ethology of the Faculty of
Veterinary Medicine at Ghent University, in collaboration with the renowned pet food
research centre, WALTHAM® Centre for Pet Nutrition, UK. During her thesis, Mariëlle was
first author of several scientific papers in international peer-reviewed journals. She has also
participated actively in various international conferences and was awarded the
Waltham/ESVCN student award for best presentation at the 2015 ESVCN congress, for her
presentation titled "Selenium absorption and bioactivity in dogs are affected by dietary
format", In addition, she has supervised multiple master students during their theses and
successfully fulfilled the UGent doctoral training programme in life sciences and medicine.
196 Curriculum Curriculum Curriculum Curriculum vitaevitaevitaevitae
Mariëlle van Zelst werd geboren op 19 oktober 1984 te Utrecht, Nederland. In 2005 is zij
de Bachelor studie Dier- en Veehouderij gestart aan HAS Den Bosch, Nederland. Tijdens
deze studie heeft zij onderzoeksstages gedaan naar de interactie tussen walvissen en
dolfijnen (Atlantic Whale foundation, Tenerife) en naar alternatieve eiwitbronnen voor
hypoallergene gepelleteerde hondenvoeders (Wielink diervoeders, IJsselmuiden). Mariëlle
was coordinator van een groot aantal vrijwilligers van de Atlantic Whale foundation en
actief lid van het public relations team van HAS Den Bosch. Voor haar afstudeerproject
heeft Mariëlle een protocol voor voedingsacceptatietesten voor edelpelsdieren ontwikkeld.
Zij behaalde in 2008 het bachelor diploma met "genoegen" (volgens UGent richtlijnen "grote
onderscheiding").
Daarna startte zij de mastersopleiding Dierwetenschappen aan Wageningen Universiteit en
werd lid van de studentenvereniging "De Veetelers" en bestuurslid en penningmeester voor
de sollicitatie commissie. Met haar master theses heeft ze gekeken naar het gedrag en
glucocorticoïden reacties van hulphonden tijdens hun training en naar de effecten van
dieet type op het gedrag van honden. Ze behaalde het master diploma (volgens UGent
richtlijnen met grote onderscheiding) in 2010 met de specialisaties diervoeding en
ethologie.
Geboeid door het wetenschappelijk onderzoek en de diervoeding, startte zij in oktober
2011 een doctoraatsstudie bij de vakgroep Voeding, Genetica en Ethologie aan de
Faculteit Diergeneeskunde van Universiteit Gent. Deze studie werd uitgevoerd in
samenwerking met het gerenomeerde onderzoekscentrum WALTHAM® Centre for Pet
Nutrition, UK. Tijdens haar doctoraat was Mariëlle eerste auteur van meerdere artikels in
wetenschappelijke internationale tijdschriften, heeft zij actief deelgenomen aan
internationale congressen en was vereerd met het verkrijgen van de Waltham/ESVCN
student award voor beste presentatie tijdens het ESVCN congres in 2015 voor haar
presentatie getiteld "Selenium absorption and bioactivity in dogs are affected by dietary
format". Daarnaast heeft zij verschillende masterstudenten begeleid met hun masterproeven
en voldaan aan de eisen voor het behalen van het UGent doctoraatsdiploma in life
sciences and medicine.

___________________________________________________________
Bibliography_____________________________________________________________________________________________________________
Bibliography __________________________________________________


BibliographyBibliographyBibliographyBibliography
199
Publications in international peer-reviewed journals
van Zelst M, Hesta M, Alexander LG, Gray K, Bosch G, Hendriks WH, Du Laing G, De
Meulenaer B, Goethals K, Janssens GPJ. (2015) In vitro selenium accessibility in dog
foods is affected by diet composition and type. British Journal of Nutrition 113, 1888-
1894.
van Zelst M, Hesta M, Gray K, Beech K, Cools A, Alexander LG, Du Laing G, Janssens GPJ.
(2015) Selenium digestibility and bioactivity of dog foods: what the can can, the kibble
can't. Submitted to PLOS ONE, revisions.
van Zelst M, Hesta M, Gray K, Staunton, R, Du Laing, G., Janssens, GPJ. (2015) Biomarkers of
selenium status in dogs. Submitted to BMC Veterinary Research, revisions.
van Zelst M, Hesta M, Gray K, Goethals K, Janssens GPJ. Predictive equations of selenium
accessibility of dry pet foods. Submitted to Journal of Animal Physiology and Animal
Nutrition.
van Zelst M, Hesta M, Gray K, Janssens, GPJ. Storage of heparinised canine whole blood for
measurement of glutathione peroxidase activity. Submitted to Biological Trace
Element Research, revisions.
Abstracts presented at international conferences
van Zelst M, Hesta M, Alexander LG, Bosch G, Hendriks WH, Du Laing G, De Meulenaer B,
Janssens GPJ. (2013) Association between diet composition and in vitro selenium
bioaccessibility in pet foods. In: Proceedings of the 38th Animal Nutrition Research
(ANR) Forum, p.48. May 21st 2013, Roeselare, Belgium.
van Zelst M, Hesta M, Alexander LG, Bosch G, Hendriks WH, Du Laing G, De Meulenaer B,
Goethals K, Janssens GPJ. (2013) Prediction models for in vitro selenium bioaccessibility
in dry pet foods. In: Proceedings of the 17th European Society of Veterinary and
Comparative Nutrition (ESVCN) congress, p.71. September 19th-21st 2013, Ghent,
Belgium.

200 BibliographyBibliographyBibliographyBibliography
van Zelst M, Hesta M, Alexander LG, Bosch G, Hendriks WH, Du Laing G, De Meulenaer B,
Janssens GPJ. (2013) Association between diet composition and in vitro selenium
bioaccessibility in pet foods. In: Proceedings of the WALTHAM® International
Nutritional Sciences Symposium (WINSS), p.144. October 1st-4th 2013, Portland,
Oregon, USA.
van Zelst M, Hesta M, Alexander LG, Bosch G, Hendriks WH, Du Laing G, De Meulenaer B,
Janssens GPJ. (2014) In vitro selenium bioaccessibility in pet foods. In: Proceedings of
the 15th International Symposium on Trace Elements in Man and Animals (TEMA
15), p.119. June 22nd-26th 2014, Orlando, Florida, USA.
van Zelst M, Hesta M, Gray K, Alexander LG, Beech K, Cools A, Du Laing G, Janssens GPJ.
(2015) Dietary format affects selenium absorption and bioactivity in dogs. In:
Proceedings of the 40th Animal Nutrition Research (ANR) Forum, p.45. May 22nd
2015, Merelbeke, Belgium.
van Zelst M, Hesta M, Gray K, Alexander LG, Beech K, Cools A, Du Laing G, Janssens GPJ.
(2015) Selenium absorption and bioactivity in dogs are affected by dietary format. In:
Proceedings of the 19th European Society of Veterinary and Comparative Nutrition
(ESVCN) congress, p.65. September 17th-19th 2015, Toulouse, France.
Awarded the Waltham/ESVCN student award for best presentation.
van Zelst M, Hesta M, Gray K, Staunton R, Du Laing G, Janssens GPJ. (2015) Preliminary data
on biomarkers for selenium status in dogs. In: Proceedings of the 19th European
Society of Veterinary and Comparative Nutrition (ESVCN) congress, p.129.
September 17th-19th 2015, Toulouse, France.

Doctoral Training Program__________________________________________________________________________________________
Doctoral Training Program__________________________________________________________________________________________
Doctoral Training Programme _____________________________________________________________________________________________________________


DoctoralDoctoralDoctoralDoctoral Training ProgramTraining ProgramTraining ProgramTraining ProgramTraining ProgramTraining ProgramTraining ProgramTraining Programmemememe
203


_____________________________________________________________________________________________________________
Acknowledgements_____________________________________________________________________________________________________________
Acknowledgements _____________________________________________________________________________________________________________


AcknowledgementsAcknowledgementsAcknowledgementsAcknowledgements
207
Dat was het dan! Wat zijn de afgelopen vier jaar snel voorbij gegaan. Gedurende die vier jaar
heb ik met ontzettend veel plezier aan de studies in dit doctoraat gewerkt. Uiteraard was het
eindresultaat niet hetzelfde zonder de hulp van heel veel mensen die ik in deze
acknowledgements wil bedanken.
Allereerst wil ik graag mijn promotoren bedanken voor hun begeleiding. Geert en Myriam,
ontzettend bedankt voor de goede adviezen die u mij heeft gegeven op geschreven werk en
tijdens de vele meetings die we hebben gehad. Geert, ook bedankt voor het vertrouwen dat u
in mij had vanaf het eerste begin en het oppeppen van mijn zelfvertrouwen wanneer ik dat
nodig had.
I would also like to express my gratitude to the Waltham Centre for Pet Nutrition for giving me
the opportunity to conduct the studies reported in this thesis! I genuinely enjoyed executing
them, and it was a great honour to have been able to perform the in vivo studies at your
facilities in England. In particular, I would like to thank Kerry Gray and Lucy Alexander for their
support and enthusiastic guidance and for thoroughly reading through all my writings during
my PhD. Thank you very much!
Also, very valuable comments to improve the quality of this thesis were given by the jury
members. Therefore, I would like to thank Gijs Du Laing, Wouter Hendriks, Stefaan De Smet,
Evelyne Meyer, Jacques Debraekeleer, Marianne Diez, Kerry Gray and, the chair of the jury,
Ann van Soom.
Wouter Hendriks wil ik nog specifiek bedanken voor het mogen uitvoeren van de in vitro
studie in zijn laboratoria in Wageningen. Guido Bosch heeft mij tijdens de uitvoering van deze
studie heel erg geholpen. Guido, ik heb al kennis mogen maken met jouw intensieve
begeleiding tijdens mijn master thesis in Wageningen, waar ik erg veel van geleerd heb, en nu
mocht ik opnieuw een beroep doen op jouw kennis voor de in vitro studie. Jouw adviezen en
commentaar op het manuscript waren van onschatbare waarde en de hulp met het filtreren heel
erg gewaardeerd! Zoals ze in Vlaanderen zouden zeggen: een hele dikke merci! Ook ben ik
Saskia van Laar-van Schuppen en Jane-Martine Muylaert dankbaar voor hun hulp en adviezen
tijdens de chemische analyses van de in vitro studie.
Verder ben ik mijn collega's erg erkentelijk voor het mij wegwijs maken in België en op het labo
diervoeding. Ontzettend bedankt! Met name wil ik mijn bureaugenoten Daisy en Jia bedanken
voor de gezellige jaren waarin wij een bureau hebben mogen delen. Sarah, bedankt voor je
hulp bij de test van de in vitro studie. Herman en Donna hartelijk dank voor het uitvoeren van
een aantal van de chemische analyses. An, jou wil ik bedanken voor je expertise en hulp op
het gebied van de statistische analyses. Ruben en Jenny, hartelijk dank voor het afhandelen
van alle administratie die komt kijken bij het uitvoeren van een doctoraat. Marta, jou wil ik heel

208 AcknAcknAcknAcknowledgementsowledgementsowledgementsowledgements
erg bedanken voor het wegnemen van een hoop stress door tot in de late uurtjes nog samen te
zitten om de general discussion op orde te krijgen.
Verder wil ik Sofie Coelus bedanken voor haar uitleg van de aminozuur analyse en Joachim
Neri en Daniel Vermeulen voor het uitvoeren van Se en schildklierhormoon analyses. Iain Peters,
thank you very much for your explanation of mRNA expression and for the analysis of the
mRNA samples.
I would also like to thank all the people at Waltham that were involved in one or both in vivo
studies. The unit owners, unit specialists and care takers of the dog units Betsy (Dog 6), Endal
(Dog 8) and Apollo (Dog 9). A special thanks to Colleen Irvine who was involved in both in vivo
studies and did a very good job in making sure that everything was organised well. I would
like to thank Ruth Staunton and Karen Beech for their knowledge and help with the statistical
analysis of both in vivo studies. During the chemical analysis of the first in vivo study and the
optimisation of the GPx analysis, Wendy Tomlinson had an answer to all my questions and
helped me with every problem I encountered, many thanks! Jay and Emma were my support in
the lab during the biomarker study, thank you very much! Robyn Bednall has helped me
tremendously during the biomarker study. She kept the study going during my absence in
England and, together with Tim O'Brine, she performed the hair growth measurements, for which
I am very grateful. Robyn and Tim, thanks a lot! Of course, a special thanks to the stars of the
studies, the dogs: Arnold, Branston, Cinderella, Davina, Dermot, Eclipse, Ella, Elliot, Erin, Esme, Fern,
Flick, Ickle, Indigo, Jackson, Jinx, Keira, Krista, Larry, Leila, Lexie, Lois, Merlin, Morph, Mowgli,
Oasis, Olivia, Orchid, Pebbles, Pedro, Pepe, Pippa, Pixie, Quaver, Rita, Romany, Ronnie, Rosco,
Rupert, Tigger, Twiggy, and Zara.
Ik wil in deze acknowledgements ook graag de kans aangrijpen om de mensen te bedanken
die mijn interesse in de diervoeding hebben geïnitieerd; Hans Kruft en Marco Halff. Hans,
ontzettend bedankt voor de vele mogelijkheden en de grote hoeveelheid aan informatie die je
mij hebt gegeven in de tijd dat ik bij je in de dierenwinkel werkte (2002-2005) en voor de
vriendschap die er nog steeds is. Marco, jou wil ik bedanken voor de ontzettend interessante
dagen waarop ik met jou bij InterPet Products en Vobra Special Pet Foods mee heb mogen
lopen. Door jouw enthousiasme is mijn interesse in de diervoeding gegroeid en wist ik vanaf
toen zeker dat ik in dit vakgebied verder wilde.
Daarnaast wil ik mijn familie en schoonfamilie bedanken. Pap en mam, ontzettend bedankt voor
het altijd steunen van mijn studiekeuzes en voor het altijd klaar staan voor mij. Paul, bedankt
voor alle keren dat je Engelse teksten voor me hebt nagelezen als ik er weer eens onzeker over
was. Ik ben trots op je en op alles wat je op eigen kracht bereikt hebt. Pap en Paul, jullie ben ik
ook nog een bedankje verschuldigd voor het helpen verhuizen naar Merelbeke in 2011, op de

AcknowledgementsAcknowledgementsAcknowledgementsAcknowledgements
209
warmste dag in september. Jos, Mieke, Christian, Judith, Lucien en Daniëlle, bedankt voor de
hartelijke opname in de familie Koks! Ik kwam er als laatste schoondochter bij, maar ik heb me
vanaf het eerste moment bijzonder welkom gevoeld. Mijn vriendenclubje Nicoline, Albert, Lynn,
Wilbert, Lottie en Nelly wil ik bedanken voor alle gezellige uitjes en samenkomsten waardoor
mijn gedachten even weg waren bij selenium en hondenvoeding, wat ook wel eens goed is
(zeggen ze). Hoewel we elkaar door de afstanden niet heel vaak zien, hecht ik toch erg veel
waarde aan jullie vriendschap. Suus en Jorrit, ik heb het bijzonder gewaardeerd dat jullie me
kwamen opzoeken in Engeland. Super bedankt voor jullie vriendschap! Mathieu, jou wil ik
bedanken voor je mentale steun en motivatie gedurende het hele PhD traject. Je hebt er niet
voor gekozen dat ik 4 jaar lang het grootste deel van de tijd in het buitenland zou zijn, maar je
hebt me desondanks altijd enorm gesteund... waar waren wij geweest zonder Skype en
telefoon.. ;-) In Engeland kwam je me zoveel mogelijk opzoeken en de tijd dat ik in België zat,
was het elk weekend weer fijn thuiskomen bij jou in Weesp. Jij bent de beste echtgenoot die ik
me wensen kan!
During my stay in England I have also had a great time outside work, thanks to the Wade
family and their "gang". Sarah, I would like to thank you for always making me laugh, and for
introducing me to an amazing family. During my time in England I had the pleasure of staying
with the Wade family; Lynda, Trevor, Laura and Ryan. I have lived with them for almost a year
during the in vivo studies. I am extremely grateful for having the chance to know them. Ryan, I
wish you all the best with finishing your university and with your roller and ice hockey
tournaments! Laura, thanks a lot for lending me your room and best of luck with building your
career! Trevor, thank you for being such a genuine and friendly person! I really enjoyed our
trips to London, Leicester and the Lidl ;-) I wish you lots of happiness, peace and good times in
the future! Lynda became like a second mum to me, she was always there with advice when I
needed it. She was a lovely, intelligent, funny and truly remarkable person. Due to a terrible car
accident, Lynda passed away on Christmas day 2014, five days after we'd said "see you soon!".
Lynda, I'm very grateful for having known you and for the wonderful moments we've shared.
You will always be on my mind!
Mariëlle
Merelbeke, December 2015


dies diem docet

