selective publicity and stock prices
TRANSCRIPT

THE JOURNAL OF FINANCE • VOL. LXVII, NO. 2 • APRIL 2012
Selective Publicity and Stock Prices
DAVID H. SOLOMON∗
ABSTRACT
I examine how media coverage of good and bad corporate news affects stock prices,by studying the effect of investor relations (IR) firms. I find that IR firms “spin”their clients’ news, generating more media coverage of positive press releases thannegative press releases. This spin increases announcement returns. Around earningsannouncements, however, IR firms cannot spin the news and their clients’ returns aresignificantly lower. This pattern is consistent with positive media coverage increasinginvestor expectations, creating disappointment around hard information. Using re-porter connections and geographical links, I argue that IR firms causally affect bothmedia coverage and returns.
DOES A COMPANY’S MARKETING OF its news matter? Few people would be surprisedto find out that the marketing of shoes or yoghurt affects how these productsare perceived by consumers. In financial markets, however, simple modelsof market efficiency assume that investors can costlessly receive and processall relevant news signals. In such a setting there is no obvious reason forcompanies to spend resources to promote or spin a particular news story onceit has been disclosed. Indeed, these assumptions also provide no clear role forthe media in general. Yet the existence of a large and active business pressseems to imply that investors face costs or difficulties in either acquiring orprocessing information about companies. This raises the question of whetherthe promotion of news stories affects media coverage, investor expectations,and stock returns.
A number of recent papers study the relationship between the media andstock returns. Some papers treat media coverage as an indication of company-level news (Chan (2003)) or as a measure of press attention (Fang and
∗Solomon is with the University of Southern California, Marshall School of Business. I wouldlike to thank my committee chair, Lubos Pastor, as well as committee members Toby Moskowitz,Richard Thaler, and Luigi Zingales for their extensive assistance. I am also particularly grateful toEugene Soltes for generously providing the news data, and for numerous discussions about it. Thispaper has benefited from helpful comments and suggestions from Cam Harvey (the Editor), theAssociate Editor, and an anonymous referee, as well as Daniel Carvalho, Arjun Chakravarti, JohnCochrane, Stefano DellaVigna, Wayne Ferson, Andrea Frazzini, Sam Hartzmark, Chris Hrdlicka,Chris Jones, Roni Kisin, Christian Leuz, Asaf Manela, Atif Mian, Alan Moreira, Adair Morse,Shastri Sandy, Paola Sapienza, John Scalf, Greg Solomon, Andreas Stathopoulos, and seminarparticipants at Chicago Booth, Emory University, the University of British Columbia, the Univer-sity of New South Wales, The University of Rochester, and the University of Southern California.All remaining errors are my own. Research support from the Katherine Dusak Miller Ph.D.Fellowship in Finance is gratefully acknowledged; any opinions expressed herein are the author’s.
599

600 The Journal of Finance R©
Peress (2009)). Other papers study the linguistic content of media cover-age to capture company-specific information (Tetlock, Saar-Tsechansky, andMacskassy (2008)) or overall market sentiment (Tetlock (2007)). With some no-table exceptions (Soltes (2008), Tetlock (2007), Engelberg and Parsons (2011),Gurun and Butler (2010)), however, it is often unclear whether media coveragerepresents cause, effect, or both. The central difficulty in understanding theeffects of media coverage on stock prices is the endogeneity between company-level news and media reporting: it is usually hard to determine if a change inmedia coverage represents a change in press interest or a change in companyconditions.
In this paper I examine the impact of media publicity on asset prices. Moti-vated by the endogeneity problem, I look at companies’ use of investor relations(IR) firms. IR is a subset of the public relations industry that deals specificallywith a company’s communications with investors, shareholders, and the me-dia. Importantly, IR firms are likely to directly influence media coverage, butunlikely to directly influence economic events at the company. This allows oneto examine the role of media coverage separate from underlying news.
I focus on whether IR firms spin their clients’ news by creating more pos-itive media coverage. The specific method of spinning news that I examineis increasing coverage of a company’s good news relative to its bad news, ascaptured by the linguistic tone of the press release. Building on Bushee andMiller (2007), who find that IR firms increase overall media coverage, the spinhypothesis focuses on the role of the press in identifying a story’s importanceor accuracy. Media coverage of a story is likely to increase its credibility orperceived importance with investors, which companies may wish to take ad-vantage of by selectively promoting their good news. The most likely benefitfor companies is to temporarily increase share prices by affecting investor ex-pectations. If investors use media reports when forming expectations of thecompany’s prospects, then more positive media coverage may cause investorsto bid up the price. However, higher expectations cannot be sustained indefi-nitely without real effects at the level of company operations. As a consequence,media spin is likely to result in eventual disappointment.
The evidence in this paper indicates that IR firms spin their clients’ newsstories, and that such activities impact stock prices. My main findings aretwofold. First, I find significant evidence that IR firms generate greater mediacoverage of their clients’ positive press releases relative to their negative pressreleases, consistent with the spin hypothesis. Second, I find that this positivemedia coverage increases returns around news announcements. However, itleads to subsequent lower returns around earnings announcements, where IRfirms show no ability to generate disproportionately positive media coverage.I argue that the lower earnings announcement returns represent investor dis-appointment due to the effects of past spin.
I find that, over the 2002 to 2006 period, the use of an IR firm is associatedwith an increase in media coverage on announcement days of 25.5% overall.Consistent with the spin hypothesis, the increase associated with IR firm use is27.7% for press releases without any negative words, with this effect shrinking
Selective Publicity and Stock Prices 601
as the press release becomes more negative: each standard deviation of negativetone reduces the IR firm effect by 3.9%. This positive tone/negative tone dispar-ity in the IR firm effect exists only in non-earnings announcements, however, asit is not evident in earnings news. This result is consistent with non-earningsannouncements being easier to spin. Relative to earnings, non-earnings newsis less anticipated (so fewer journalists will be aware of it without IR influ-ence) and likely to contain more soft information (allowing IR firms to push aparticular interpretation of ambiguous news events).
I also find evidence that IR firms affect investor expectations and stock re-turns. On non-earnings press release days (when IR firms can spin the news),IR firm clients’ characteristic-adjusted returns are 11.2 basis points higher,significant at a 1% level, after controlling for a large number of other factors.The increase in returns is also larger for positive press releases, similar tomedia coverage: the IR firm increase in returns for press releases with no neg-ative words is 16.5 basis points, with each standard deviation of negative tonereducing the IR firm effect by 15.5 basis points.
By contrast, on earnings announcement days (when IR firms cannot spinthe news), IR firm clients’ characteristic-adjusted returns are 33.6 basis pointslower. This effect is concentrated in releases of negative earnings news, asthe reaction to a given level of negative earnings surprise is 55% larger forcompanies using an IR firm. Earnings returns are significantly more negativefollowing higher returns since the previous earnings announcement, and aftergreater media coverage of positive press releases. Thus, the lower earningsannouncement returns appear to be a direct consequence of investor disap-pointment due to past spin.
A central question of the paper is whether the results above are causal, orinstead are driven by unobserved characteristics of companies that hire an IRfirm. I address this question in several ways. For returns, I examine connectionsbetween IR firms and newspaper reporters who wrote about multiple clients ofthe IR firm. Turnover among connected reporters should reduce the effective-ness of IR firms in spinning the news. However, because reporter turnover isexpected to be largely unrelated to the companies they write about, it should beexogenous to company characteristics. I show that connected reporter turnoverweakens both of the main IR firm effects on returns, as it predicts lower returnsaround non-earnings announcements and higher returns around earnings an-nouncements. By contrast, turnover by reporters who wrote about the companybut were not connected to the IR firm has no effect on returns.
Additionally, IR firms that lack any connections to reporters show very littleability to influence returns in the first place. The IR firm effect on earningsannouncement returns is roughly four times as large for IR firms with somepast journalist connections (18 basis points for clients of unconnected IR firmsvs. 70 basis points for connected IR firms). For non-earnings announcements,the effect of unconnected IR firms is a one basis point decrease in returns,compared with a 23 basis point increase for connected IR firms. Taken together,these results strongly suggest that the patterns in returns are causal, anddriven by the ability of IR firms to generate media coverage.

602 The Journal of Finance R©
The effects on media coverage also appear to be causal. The effect of IR firmson positive news coverage is almost three times greater in newspapers in thesame state as the IR firm, where we would expect them to have more influence.This is consistent with IR firms generating spin through their connections tonewspapers, and suggests that IR firm use does not merely capture companiesthat happen to have more good news overall. Moreover, this result does notappear to be driven by IR firms locating near newspapers that are alreadypredisposed to favorably covering the company. If IR firm geography merelyreflected existing positive local coverage, then the apparent effect of IR firmgeography should disappear once the tendency of newspapers towards positivecoverage is taken into account. However, when I add two measures that maypredict positive local coverage—whether the company is in the same state asthe paper, and the percentage of company shares held by local mutual funds—Ifind that they do not change the IR firm geography effect much. In my last teston causality, I present evidence that the main effects are not driven by an IRfirm’s clients selectively issuing press releases only for good news, nor are theyproxying for the internal IR operations of the company.
Consistent with spin being a motivation for hiring an IR firm, I present evi-dence that IR firm use is also associated with greater management of reportedearnings. Like earnings management, spin involves increasing short-term per-ceptions at the cost of eventual disappointment. Consistent with this idea, IRfirm clients are around 3% more likely to restate their earnings in a givenyear, and are also more likely to cut R&D expenses (a form of real earningsmanagement). They also exhibit weaker shareholder protection, as measuredby the Gompers, Ishii, and Metrick (2003) “G” measure. Together these resultssuggest that IR firm clients are more interested in pushing up prices in theshort term, consistent with spin being a motivation for hiring an IR firm.
The predictable differences in announcement returns also create the poten-tial for profitable trading strategies. I consider a strategy that, around earningsannouncements, buys companies that do not use IR firms and shorts com-panies that use IR firms. Holding stocks for two days produces an alpha of19.8 basis points per day, or around 50% per year, while holding stocks for21 days lowers the alpha to 2.8 basis points per day, or around 7% per year.The fact that very high turnover is required to capture the large differences inreturns suggests that transaction costs may partly explain why the mispricingis not eliminated. Over a two-day window, IR firm clients experience a negativeearnings announcement premium of around –13.3 basis points. This providesevidence that investors are actually disappointed after the spin.1
The rest of the paper is structured as follows: Section I describes the set-ting; Section II presents the paper’s hypotheses; Section III discusses the data;Section IV presents the main results on IR firm use, media coverage, and
1 The overall price pattern in earnings returns for IR firm clients is not obviously more efficient,but this is complicated by the fact that the baseline alternative is an earnings announcementpremium that is itself a challenge to efficiency (Frazzini and Lamont (2006)). Indeed, the short-window positive alpha for companies that do not use IR firms is roughly of the same size as thenegative alpha of companies that do use IR firms.

Selective Publicity and Stock Prices 603
announcement returns; Section V presents results related to identification;Section VI presents additional evidence on returns and earnings managementof IR firm clients; and Section VII concludes.
I. The Setting
The current study relates to three branches of literature in finance, namely,IR, the role of the media, and limited attention. In terms of the effect of special-ized IR firms, Bushee and Miller (2007) examine IR firms’ role in affecting com-pany visibility.2 They find that hiring an IR firm is associated with increases indisclosure, media coverage, analyst coverage, institutional ownership, and val-uation. This paper builds on Bushee and Miller (2007) by examining whether IRfirms engage in spin and selective promotion of good news, thereby augmentingtheir results about visibility.
A second branch of literature looks at the role of the media in financialmarkets. Chan (2003) examines the relationship between news coverage andmomentum, while Fang and Peress (2009) find that greater media coverage isassociated with lower stock returns, which they attribute to investor attentionlowering the cost of capital (Merton (1987)). Soltes (2008) uses an instrumentalvariables approach based on aggregate news volume to show that media cov-erage is associated with higher trading volume, while Engelberg and Parsons(2011) use a geographic instrument to show how the media causes trading.Other papers focus on the linguistic content of news announcements, examin-ing the effect of positive and negative words (“tone”) on returns (Tetlock (2007),Engelberg (2008)), subsequent earnings (Tetlock et al. (2008)), and firm value(Gurun and Butler (2010)). Dyck and Zingales (2003) separate out informationprovided by the firm versus the media, and find that stock prices react moreto earnings emphasized by the press. Solomon, Soltes, and Sosyura (2011)examine how media coverage of stocks affects investors’ allocation of flows tomutual funds.
The current paper contributes to this literature in several ways. First, Ifocus on how the media’s choice of which stories to cover affects prices andinvestor expectations. I focus on the impact of the overall balance of positiveand negative stories in the press. This focus complements the idea of linguistictone (the language content of a particular announcement) in Tetlock (2007) andTetlock et al. (2008), and the concept of media spin (which parts of a particularstory to emphasize) in Dyck and Zingales (2003). Second, I distinguish betweenmedia coverage itself and company-level news. This distinction is importantfor drawing inferences about causality, but is not always made in the literature(Chan (2003), Fang and Peress (2009)). IR firms do not obviously affect com-pany operations, but may affect media coverage directly, making them a veryuseful way to examine the effects of the media itself. I show that companies can
2 Investor relations have also been examined more broadly in terms of managing and increasingcorporate disclosures to investors (Brennan and Tamarowski (2000), Hong and Huang (2005),Chang, Murphy, and Wee (2006)).

604 The Journal of Finance R©
influence the reporting they receive and the incentives of the media to reportobjectively.
The current paper is also related to the literature on limited investor atten-tion and firm disclosure. Hirshleifer and Teoh (2003) model how limited atten-tion among investors can result in different price responses depending on howinformation is disclosed by the firm. Empirically, weaker and delayed responsesto news have been linked to various measures of investor inattention: large ag-gregate news flows (Hirshleifer, Lim, and Teoh (2009)), Friday announcements(DellaVigna and Pollet (2009)), and negative news, where managers have fewerincentives to publicize the story (Hong, Lim, and Stein (2000)). The current pa-per shows that investors rely on media coverage to process information aboutfirms, but do not distinguish between truly important coverage and coverageresulting from IR firm influence.
II. IR Firms and Investor Perceptions
The basic question of this paper is whether IR firms are able to increase thepositive media coverage that their clients receive. While there are various waysthat IR firms could achieve this end, I focus on one particular mechanism—increasing the media coverage of their clients’ positive news relative to negativenews, which I refer to as spin. Assuming that IR firms are able to generate moremedia articles when the news is good, they increase the amount of attentionpaid to positive stories.3 The central prediction of spin is that IR firm use isassociated with disproportionately greater coverage of a company’s positivenews than negative news.
If investors are fully aware of the information content of the underlying story,then spin should not affect stock prices. On the other hand, if investors facecosts or difficulties in processing news stories, there is good reason to predictthat spin may increase prices around news announcements. The rationale isas follows. Media coverage may be interpreted as a signal that the story ismore important or more likely to be true, in which case investors are likely toweight the story more highly when forming expectations of the company’s fu-ture prospects. If media reporting disproportionately covers positive news, thenthis would be interpreted as signifying better future prospects for the company,and hence investors would bid up the price. IR firm use would therefore be as-sociated with larger price increases, especially around announcements that theIR firm can spin.
3 Of course, this is not the only way an IR firm could generate positive coverage. For instance, itcould instead write more positive press releases for a given news event, or persuade each journalistto write more positive articles conditional on what was in the press release. One advantage of thecurrent construct is that it is relatively easy to measure (whereas unduly optimistic press releasesare hard to measure directly, as the true news content is not observable). Further, it does not relyon an explicit payment between the IR firm and reporter (the IR firm could simply notify a busyreporter about a story and thus lower the time cost of writing about it, calling reporters selectivelyonly when the story was positive).
Selective Publicity and Stock Prices 605
A further prediction of spin is that it should not affect overall returns. If pos-itive spin increases expectations while real economic events at the firm are un-changed, eventually investors must be disappointed relative to companies with-out similarly raised expectations. Positive media coverage cannot conceal thetruth of a company’s economic situation forever. Such reversals could occur withthe revelation of hard news that the company cannot spin (earnings announce-ments, bankruptcy, debt covenant violations, etc.), or in a gradual revelationover time in the absence of further news. In either case, if positive media cov-erage affects only investor expectations, it should not change overall returns.
III. Data and Summary Statistics
A. Data Sources
The IR firm data come from O’Dwyer’s Directory of Public Relations Firms,from 2002 to 2007. Published since 1971, this directory contains information onfirms in the public relations industry including fees (audited by a Certified Prac-ticing Accountant), locations, specializations, number of employees, and clientlists. O’Dwyer’s covers public relations firms in general, as well as IR firms morespecifically.4 Using firm specialties and fees, I exclude public relations firmsthat do not appear to do IR work. I then hand match IR firm clients to CRSPcompany names using internet searches to clarify ambiguous names. Furtherdetails on IR firm classification and matching are provided in Appendix A.
The news data come from Factiva, from January 2002 to December 2006.Compustat GVKEY values are manually matched with company codes fromFactiva’s Intelligent Indexing (used by Factiva to classify which articles re-late to each company). The data come from Soltes (2008). The data includeheadline, lead paragraph, news source, publication date and time, and byline.Each article match is based on the first trading day after publication that theinformation could have been traded on. Searches are performed for U.S.-basedcompanies with common shares, other than financials, utilities, and the top100 companies by total news volume.5 This last limitation is necessary as mid-way through the download of the news sample, Factiva changed its licenseagreement to prevent algorithmic downloads, greatly increasing the time re-quired to download news data and making it prohibitively costly to obtain dataon the largest news firms. Robustness checks indicate that excluding thesefirms does not appear to drive the results.6
Data on company returns, market capitalization, and turnover come fromCRSP. Data on earnings per share are from the quarterly CRSP/Compustat
4 The former category includes other services not related to the dissemination of a firm’s infor-mation to shareholders, such as advertising, brand management, direct mail, marketing, crisismanagement, etc.
5 CRSP share code equal to 10 or 11, excluding ADRs and firms headquartered overseas.6 One advantage of the current sample is that the vast majority of firms have meaningful
variation between news and non-news days. Many of the largest news companies have pressreleases virtually every day, meaning that the concept of a “news day” is difficult to determine.

606 The Journal of Finance R©
merged database, and data on book value of equity are from the CRSP/Compustat annual file. Data on number of analysts come from the I/B/E/Sdetailed file. Institutional ownership data are from the Thomson Reuters s12Mutual Fund Holdings database. Data on CEO compensation come from Exe-cucomp.7 Definitions of the control variables used in this paper are provided inAppendix B.
B. Summary Statistics
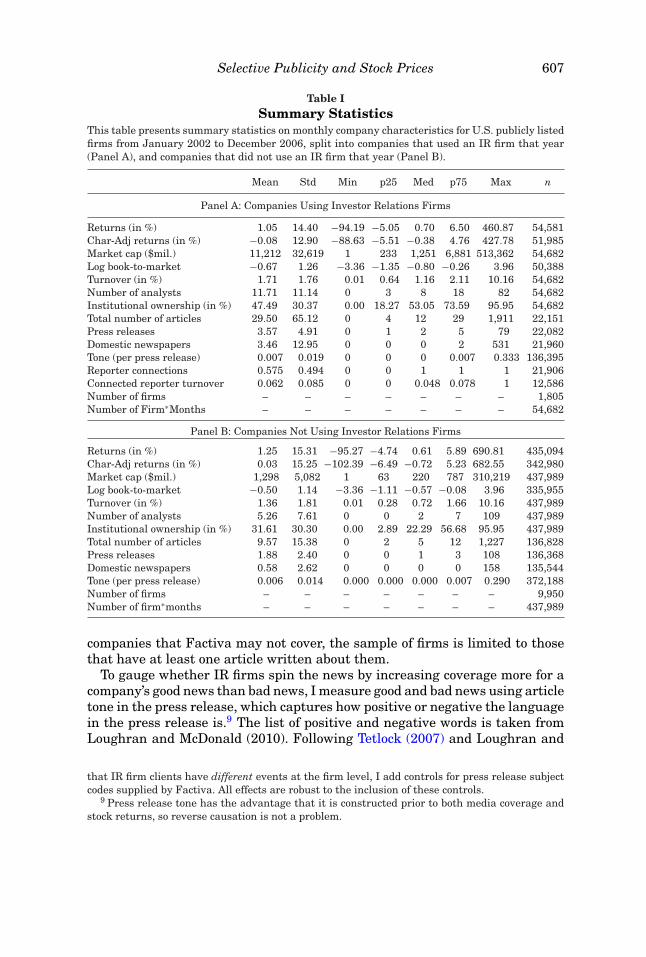
Table I presents summary statistics for company attributes according to IRfirm use. In particular, Panel A reports results for companies that used anIR firm, while Panel B reports results for companies that did not use an IRfirm. As can be seen from the table, a total of 1,805 companies (or 15.4% ofthe sample companies) use an IR firm at some point during the sample period.IR firm clients are on average larger and more visible than other companies,with a larger market capitalization ($11.2b vs. $1.3b), more analysts (11.71 vs.5.26), more institutional ownership (47.49% vs. 31.61%), and higher turnover(1.71% vs. 1.36%). Further, they have a lower log book-to-market ratio (–0.67vs. –0.50) and lower returns (1.05% vs. 1.25%), but insignificantly differentcharacteristic-adjusted returns (–0.08% vs. 0.03%). IR firm clients also havegreater media coverage across every category of news media, with a total of29.50 articles per month, compared to 9.57 articles per month for companieswithout an IR firm.
IV. Results
A. IR Firm Use, Press Release Coverage, and Press Release Tone
The spin hypothesis predicts that IR firm use affects media coverage. Morespecifically, the spin hypothesis predicts that IR firm use will increase coverageof good news more than coverage of bad news. To test this hypothesis, I investi-gate the influence of IR firms on the total number of news articles surroundinga company’s press release (on Business Wire or PR Newswire, the two mainpress release wires). I include articles on the trading days associated with boththe announcement day and the following day, to allow for newspapers that maynot publish about a story until the day after an announcement. Observationsare included for every trading day that a firm issues at least one press release,and for every earnings announcement day according to Compustat (regardlessof whether there is a press release).8 In order to not attribute low coverage to
7 Unless otherwise specified, tables that use annual firm observations match characteristicsbased on values in the previous December, while tables that use monthly or daily data matchcharacteristics to the previous month.
8 Examining only news release days controls for the possibility that IR firm clients may simplyhave more news coverage because they have more events going on at the firm level. Companiesthat have more events over a given period will not mechanically be taken to have more coverageunless each press release day is also considered more newsworthy. To control for the possibility
Selective Publicity and Stock Prices 607
Table ISummary Statistics
This table presents summary statistics on monthly company characteristics for U.S. publicly listedfirms from January 2002 to December 2006, split into companies that used an IR firm that year(Panel A), and companies that did not use an IR firm that year (Panel B).
Mean Std Min p25 Med p75 Max n
Panel A: Companies Using Investor Relations Firms
Returns (in %) 1.05 14.40 −94.19 −5.05 0.70 6.50 460.87 54,581Char-Adj returns (in %) −0.08 12.90 −88.63 −5.51 −0.38 4.76 427.78 51,985Market cap ($mil.) 11,212 32,619 1 233 1,251 6,881 513,362 54,682Log book-to-market −0.67 1.26 −3.36 −1.35 −0.80 −0.26 3.96 50,388Turnover (in %) 1.71 1.76 0.01 0.64 1.16 2.11 10.16 54,682Number of analysts 11.71 11.14 0 3 8 18 82 54,682Institutional ownership (in %) 47.49 30.37 0.00 18.27 53.05 73.59 95.95 54,682Total number of articles 29.50 65.12 0 4 12 29 1,911 22,151Press releases 3.57 4.91 0 1 2 5 79 22,082Domestic newspapers 3.46 12.95 0 0 0 2 531 21,960Tone (per press release) 0.007 0.019 0 0 0 0.007 0.333 136,395Reporter connections 0.575 0.494 0 0 1 1 1 21,906Connected reporter turnover 0.062 0.085 0 0 0.048 0.078 1 12,586Number of firms – – – – – – – 1,805Number of Firm∗Months – – – – – – – 54,682
Panel B: Companies Not Using Investor Relations Firms
Returns (in %) 1.25 15.31 −95.27 −4.74 0.61 5.89 690.81 435,094Char-Adj returns (in %) 0.03 15.25 −102.39 −6.49 −0.72 5.23 682.55 342,980Market cap ($mil.) 1,298 5,082 1 63 220 787 310,219 437,989Log book-to-market −0.50 1.14 −3.36 −1.11 −0.57 −0.08 3.96 335,955Turnover (in %) 1.36 1.81 0.01 0.28 0.72 1.66 10.16 437,989Number of analysts 5.26 7.61 0 0 2 7 109 437,989Institutional ownership (in %) 31.61 30.30 0.00 2.89 22.29 56.68 95.95 437,989Total number of articles 9.57 15.38 0 2 5 12 1,227 136,828Press releases 1.88 2.40 0 0 1 3 108 136,368Domestic newspapers 0.58 2.62 0 0 0 0 158 135,544Tone (per press release) 0.006 0.014 0.000 0.000 0.000 0.007 0.290 372,188Number of firms – – – – – – – 9,950Number of firm∗months – – – – – – – 437,989
companies that Factiva may not cover, the sample of firms is limited to thosethat have at least one article written about them.
To gauge whether IR firms spin the news by increasing coverage more for acompany’s good news than bad news, I measure good and bad news using articletone in the press release, which captures how positive or negative the languagein the press release is.9 The list of positive and negative words is taken fromLoughran and McDonald (2010). Following Tetlock (2007) and Loughran and
that IR firm clients have different events at the firm level, I add controls for press release subjectcodes supplied by Factiva. All effects are robust to the inclusion of these controls.
9 Press release tone has the advantage that it is constructed prior to both media coverage andstock returns, so reverse causation is not a problem.
608 The Journal of Finance R©
McDonald (2010), I measure tone as the fraction of negative words in the articleheadline and lead paragraph. The main measure of tone is thus given by:
Tone = # Negative Words/Total # Words. (1)
By construction, the base effect of IR firms corresponds to neutral and posi-tive announcements, and increases in Tone indicate how this effect changes asnews becomes more negative. Notice that Tone is defined in terms of negativewords, as Tetlock (2007) finds that negative words convey more informationthan positive words. The main results are similar, however, if Tone is insteaddefined using both positive and negative words (with Tone = (# Positive Words –# Negative Words)/Total#Words).
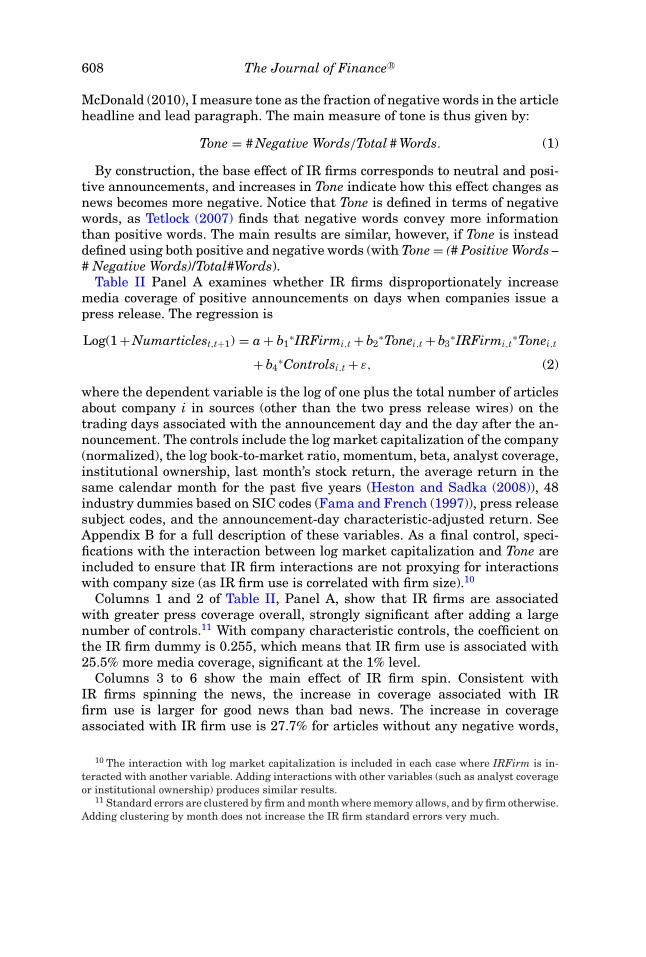
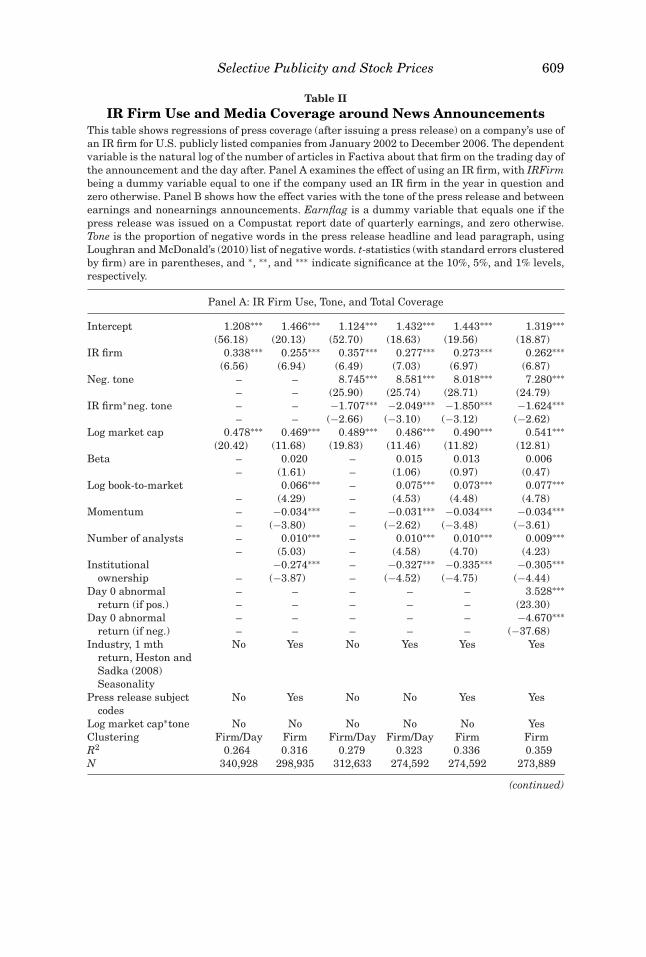
Table II Panel A examines whether IR firms disproportionately increasemedia coverage of positive announcements on days when companies issue apress release. The regression is
Log(1 + Numarticlest,t+1) = a + b1∗IRFirmi,t + b2
∗Tonei,t + b3∗IRFirmi,t
∗Tonei,t
+ b4∗Controlsi,t + ε, (2)
where the dependent variable is the log of one plus the total number of articlesabout company i in sources (other than the two press release wires) on thetrading days associated with the announcement day and the day after the an-nouncement. The controls include the log market capitalization of the company(normalized), the log book-to-market ratio, momentum, beta, analyst coverage,institutional ownership, last month’s stock return, the average return in thesame calendar month for the past five years (Heston and Sadka (2008)), 48industry dummies based on SIC codes (Fama and French (1997)), press releasesubject codes, and the announcement-day characteristic-adjusted return. SeeAppendix B for a full description of these variables. As a final control, speci-fications with the interaction between log market capitalization and Tone areincluded to ensure that IR firm interactions are not proxying for interactionswith company size (as IR firm use is correlated with firm size).10
Columns 1 and 2 of Table II, Panel A, show that IR firms are associatedwith greater press coverage overall, strongly significant after adding a largenumber of controls.11 With company characteristic controls, the coefficient onthe IR firm dummy is 0.255, which means that IR firm use is associated with25.5% more media coverage, significant at the 1% level.
Columns 3 to 6 show the main effect of IR firm spin. Consistent withIR firms spinning the news, the increase in coverage associated with IRfirm use is larger for good news than bad news. The increase in coverageassociated with IR firm use is 27.7% for articles without any negative words,
10 The interaction with log market capitalization is included in each case where IRFirm is in-teracted with another variable. Adding interactions with other variables (such as analyst coverageor institutional ownership) produces similar results.
11 Standard errors are clustered by firm and month where memory allows, and by firm otherwise.Adding clustering by month does not increase the IR firm standard errors very much.
Selective Publicity and Stock Prices 609
Table IIIR Firm Use and Media Coverage around News Announcements
This table shows regressions of press coverage (after issuing a press release) on a company’s use ofan IR firm for U.S. publicly listed companies from January 2002 to December 2006. The dependentvariable is the natural log of the number of articles in Factiva about that firm on the trading day ofthe announcement and the day after. Panel A examines the effect of using an IR firm, with IRFirmbeing a dummy variable equal to one if the company used an IR firm in the year in question andzero otherwise. Panel B shows how the effect varies with the tone of the press release and betweenearnings and nonearnings announcements. Earnflag is a dummy variable that equals one if thepress release was issued on a Compustat report date of quarterly earnings, and zero otherwise.Tone is the proportion of negative words in the press release headline and lead paragraph, usingLoughran and McDonald’s (2010) list of negative words. t-statistics (with standard errors clusteredby firm) are in parentheses, and ∗, ∗∗, and ∗∗∗ indicate significance at the 10%, 5%, and 1% levels,respectively.
Panel A: IR Firm Use, Tone, and Total Coverage
Intercept 1.208∗∗∗ 1.466∗∗∗ 1.124∗∗∗ 1.432∗∗∗ 1.443∗∗∗ 1.319∗∗∗(56.18) (20.13) (52.70) (18.63) (19.56) (18.87)
IR firm 0.338∗∗∗ 0.255∗∗∗ 0.357∗∗∗ 0.277∗∗∗ 0.273∗∗∗ 0.262∗∗∗(6.56) (6.94) (6.49) (7.03) (6.97) (6.87)
Neg. tone – – 8.745∗∗∗ 8.581∗∗∗ 8.018∗∗∗ 7.280∗∗∗– – (25.90) (25.74) (28.71) (24.79)
IR firm∗neg. tone – – −1.707∗∗∗ −2.049∗∗∗ −1.850∗∗∗ −1.624∗∗∗– – (−2.66) (−3.10) (−3.12) (−2.62)
Log market cap 0.478∗∗∗ 0.469∗∗∗ 0.489∗∗∗ 0.486∗∗∗ 0.490∗∗∗ 0.541∗∗∗(20.42) (11.68) (19.83) (11.46) (11.82) (12.81)
Beta – 0.020 – 0.015 0.013 0.006– (1.61) – (1.06) (0.97) (0.47)
Log book-to-market 0.066∗∗∗ – 0.075∗∗∗ 0.073∗∗∗ 0.077∗∗∗– (4.29) – (4.53) (4.48) (4.78)
Momentum – −0.034∗∗∗ – −0.031∗∗∗ −0.034∗∗∗ −0.034∗∗∗– (−3.80) – (−2.62) (−3.48) (−3.61)
Number of analysts – 0.010∗∗∗ – 0.010∗∗∗ 0.010∗∗∗ 0.009∗∗∗– (5.03) – (4.58) (4.70) (4.23)
Institutional −0.274∗∗∗ – −0.327∗∗∗ −0.335∗∗∗ −0.305∗∗∗ownership – (−3.87) – (−4.52) (−4.75) (−4.44)
Day 0 abnormal – – – – – 3.528∗∗∗return (if pos.) – – – – – (23.30)
Day 0 abnormal – – – – – −4.670∗∗∗return (if neg.) – – – – – (−37.68)
Industry, 1 mthreturn, Heston andSadka (2008)Seasonality
No Yes No Yes Yes Yes
Press release subjectcodes
No Yes No No Yes Yes
Log market cap∗tone No No No No No YesClustering Firm/Day Firm Firm/Day Firm/Day Firm FirmR2 0.264 0.316 0.279 0.323 0.336 0.359N 340,928 298,935 312,633 274,592 274,592 273,889
(continued)
610 The Journal of Finance R©
Table II—Continued
Panel B: IR Firm Use and Earnings Announcements
Intercept 1.283∗∗∗ 1.308∗∗∗ 1.237∗∗∗(16.69) (17.22) (17.24)
IR firm 0.271∗∗∗ 0.266∗∗∗ 0.276∗∗∗(6.39) (6.41) (6.79)
Neg. tone 9.213∗∗∗ 8.537∗∗∗ 7.894∗∗∗(31.62) (29.37) (25.18)
IR firm∗neg. tone −2.449∗∗∗ −2.190∗∗∗ −1.594∗∗(−3.75) (−3.71) (−2.46)
Earnings ann.∗IR firm∗ 2.757∗ 3.013∗∗ 2.474∗∗Neg. tone (1.89) (2.28) (1.99)Earnings ann. 0.771∗∗∗ 0.878∗∗∗ 0.759∗∗∗
(47.58) (51.93) (44.81)Earnings ann.∗IR firm 0.155∗∗∗ 0.133∗∗∗ −0.079∗∗
(3.49) (3.10) (−2.09)Earnings ann.∗neg. tone −11.846∗∗∗ −10.212∗∗∗ −7.646∗∗∗
(−18.21) (−16.39) (−13.04)Company characteristics Yes Yes YesPress rel. subject codes No Yes YesAdjusted return No No YesLog market cap∗tone, log market
cap∗ earnings ann.No No Yes
R2 0.355 0.374 0.391N 274,416 274,416 273,713
decreasing as the tone becomes more negative. The coefficient on IRFirm∗Tonewhen all company controls are included is –2.049, significant at the 1% level.The standard deviation of Tone for IR firm clients is 0.019, so a one stan-dard deviation increase in negative tone causes the IR firm effect to de-crease by 3.9%. This effect is quite stable as additional controls are added,including press release subject codes and announcement-day returns (the lat-ter are endogenous with media coverage, but are included to show the ro-bustness of the result). Consistent with Tetlock (2007) and Loughran andMcDonald (2010), greater negative tone appears to be associated with higheroverall newsworthiness.
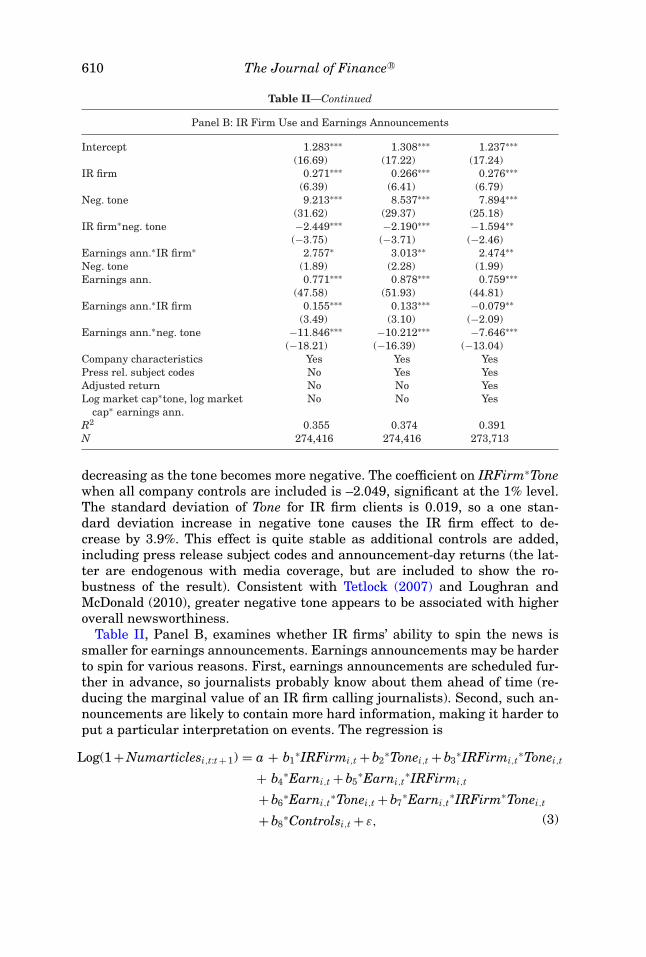
Table II, Panel B, examines whether IR firms’ ability to spin the news issmaller for earnings announcements. Earnings announcements may be harderto spin for various reasons. First, earnings announcements are scheduled fur-ther in advance, so journalists probably know about them ahead of time (re-ducing the marginal value of an IR firm calling journalists). Second, such an-nouncements are likely to contain more hard information, making it harder toput a particular interpretation on events. The regression is
Log(1 + Numarticlesi,t:t + 1) = a + b1∗IRFirmi,t + b2
∗Tonei,t + b3∗IRFirmi,t
∗Tonei,t
+ b4∗Earni,t + b5
∗Earni,t∗IRFirmi,t
+ b6∗Earni,t
∗Tonei,t + b7∗Earni,t
∗IRFirm∗Tonei,t
+ b8∗Controlsi,t + ε, (3)
Selective Publicity and Stock Prices 611
where Earn is a dummy variable that equals one if the press release occurredon a Compustat earnings date, and zero otherwise. All clustering in Panel B isby firm and month.
Table II Panel B shows that IR firms’ ability to spin the news is significantlylower for earnings announcements. The coefficient on Earn∗IRFirm∗Tone,which shows whether the interactions between IR firm use and Tone are sig-nificantly different for earnings announcements, has a coefficient of 3.013 withcompany characteristics and press release controls, significant at the 5% level.In terms of magnitude, the coefficient on Earn∗IRFirm∗Tone is of similar size,or slightly larger than, the IRFirm∗Tone effect. This means that the ability of IRfirms to spin the news is completely eliminated for earnings announcements.
B. IR Firm Use and Returns around Non-Earnings Announcements
If spin influences investor perceptions, and IR firms can obtain disproportion-ately positive coverage around non-earnings announcements, as shown earlier,then IR firm influence should increase non-earnings announcement returns.Furthermore, this increase in returns should be concentrated among the an-nouncements that the IR firm is able to spin—in this case, positive and neutralnews stories. To test this conjecture, I estimate a regression in which the maindependent variable is Retadj, the three-day characteristic-adjusted return fromone day before the announcement to one day after:
Retadji,t =1∏
j=−1
(1 + r(i,t+ j)) −1∏
j=−1
(1 + rp,t+ j), (4)
where ri,t + j is firm i’s return on day t + j, and rp,t + j is the characteristic-matchedportfolio return, that is, the daily equal-weighted return on a portfolio formedof stocks in the same size/book-to-market/momentum quintile similar to Danielet al. (1997). The sample of announcements is every day with a press release,excluding those within five days of an earnings announcement day.12 The re-gression is thus
Retadji,t = a+ b1∗IRFirmi,t + b2
∗Tonei,t + b3∗IRFirmi,t
∗Tonei,t + b∗4Controlsi,t + ε,
(5)
for company i an announcement day t, where Controls includes Lmktcap-norm, Beta, Lbm, Momentum, Retl1, Hessad, Institpctown, Numanalysts,Industry2–48, and Subject2–150.
Table III shows that companies that use IR firms have higher characteristic-adjusted returns around non-earnings announcements. The coefficient on IR-Firm is 0.112 or 11.2 basis points with the full set of controls (Column 3),significant at the 1% level. Columns 1 and 2 report results clustered by firmand announcement day, and Column 3 presents results clustered by firm only.13
12 This exclusion is to avoid contaminating effects of the earnings announcement, although theresults are very similar if only the earnings day itself is excluded.
13 This is due to memory limitations and the addition of the large number of Subject variables.

612 The Journal of Finance R©
Table IIINon-Earnings Press Release Returns and IR Firm Use
This table examines regressions of characteristic-adjusted returns around days with non-earningspress releases on a company’s use of an IR firm for U.S. publicly listed firms from January 2002 toDecember 2006. The dependent variable is RetAdj, the cumulative daily return (in %) in excess ofthe average returns for companies in the same size/book-to-market/momentum quintile, from oneday before to one day after the announcements. Observations include all days when the companyhas a press release on either PR Newswire or BusinessWire, excluding earnings announcements.The main independent variable is IRFirm, a dummy variable equal to one if the company usedan IR firm in the year in question and zero otherwise. Tone is the proportion of negative words inthe press release headline and lead paragraph, using Loughran and McDonald’s (2010) list ofnegative words. Company characteristics include industry dummy variables, the past month’sreturn, the Heston and Sadka variable, accruals, and cuts to R&D. See Appendix B for definitionsof these variables, as well as definitions of log book-to-market, momentum, and press releasesubject codes. t-statistics (with standard errors clustered by firm and announcement day) are inparentheses, and ∗, ∗∗, and ∗∗∗ indicate significance at the 10%, 5%, and 1% levels, respectively.
Intercept 0.489∗∗∗ 1.527∗∗∗ 1.541∗∗∗ 1.709∗∗∗ 1.712∗∗∗(10.64) (4.22) (3.98) (4.56) (4.30)
IR firm 0.161∗∗∗ 0.109∗∗∗ 0.112∗∗∗ 0.165∗∗∗ 0.164∗∗∗(3.45) (2.58) (2.94) (3.74) (4.20)
Neg. tone – – – −23.637∗∗∗ −23.246∗∗∗– – – (−8.70) (−9.31)
IR firm∗neg. tone – – – −8.612∗∗∗ −8.157∗∗∗– – – (−3.67) (−2.68)
Log market Cap −0.391∗∗∗ −0.277∗∗∗ −0.290∗∗∗ −0.364∗∗∗ −0.374∗∗∗(−10.82) (−4.78) (−6.01) (−6.53) (−8.21)
Beta – −0.024 −0.022 −0.03 −0.03– (−0.64) (−0.80) (−0.91) (−1.13)
Log book-to-market – 0.018 0.026 0.02 0.03– (0.57) (0.92) (0.67) (1.00)
Momentum – −0.047 −0.047 −0.052∗ −0.052∗– (−1.56) (−1.62) (−1.74) (−1.79)
Number of analysts – 0.009∗∗ 0.009∗∗∗ 0.010∗∗ 0.010∗∗∗– (1.99) (2.61) (2.23) (2.88)
Institutional ownership – −0.821∗∗∗ −0.819∗∗∗ −0.812∗∗∗ −0.806∗∗∗– (−8.30) (−10.21) (−8.14) (−9.96)
Company characteristics No Yes Yes Yes YesPress rel. subject codes No No Yes No YesLog market cap∗tone No No No Yes Yesclustering Firm/Month Firm/Month Firm Firm/Month FirmR2 0.003 0.004 0.008 0.006 0.009N 275,756 245,252 245,252 245,252 245,252
Columns 4 and 5 also show that the increase in returns is concentrated amongthe same positive announcements that the IR firm is promoting, and is lesspronounced as news becomes more negative. Adding the tone controls increasesthe IR firm effect to 0.165 for press releases with no negative language, and thecoefficient on IRFirm∗Tone is equal to –8.612 (significant at the 1% level withpress release subject codes). A one standard deviation increase in negative tonereduces the IR firm associated increase by 15.5 basis points. In other words,

Selective Publicity and Stock Prices 613
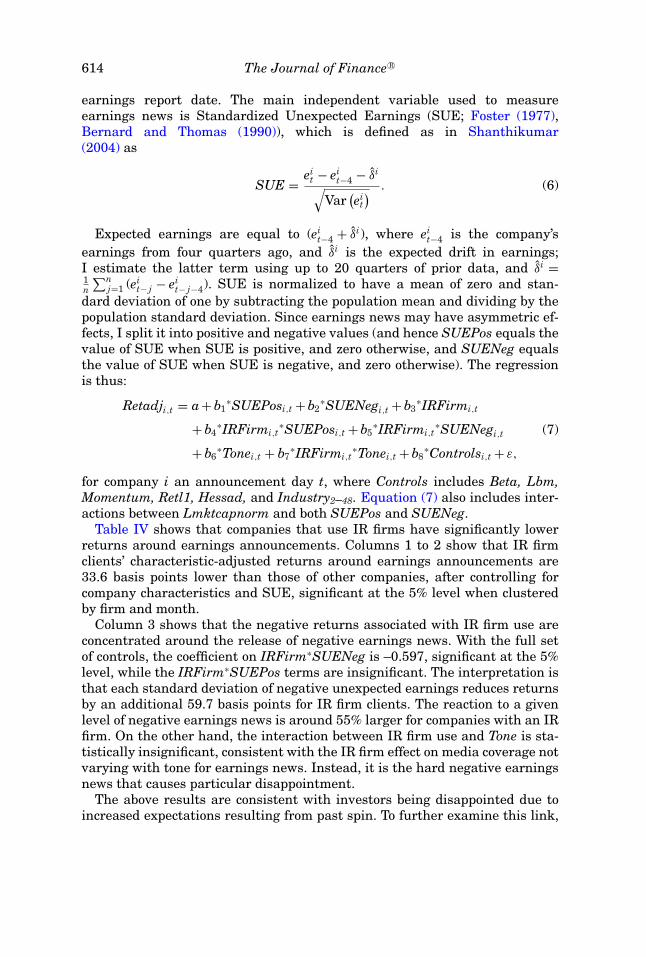
Table IVEarnings Announcement Returns and IR Firm Use
This table examines regressions of earnings announcement characteristic-adjusted returns on acompany’s use of an IR firm for U.S. publicly listed firms from January 2002 to December 2006.The dependent variable is RetAdj, the size/book-to-market/ momentum adjusted cumulative dailyreturns (in %) from one day before to one day after the announcements. The main independentvariable is IRFirm, a dummy variable equal to one if the company used an IR firm that year andzero otherwise. SUE is the firm’s standardized unexpected earnings, split into two positive andnegative values: “(if pos.)” is either positive or zero, and “(if neg.)” is either negative or zero. Tone isthe proportion of negative words in the press release headline and lead paragraph, using Loughranand McDonald’s (2010) list of negative words. See Appendix B for further details. Adjusted Returns,t−50:t−5 is the cumulative-adjusted stock return from 50 days before to 5 days before the earningsannouncement. Log (1 + Coverage of Positive Press Releases) is one plus the natural log of the totalnumber of articles written about the company on days when a positively toned press release isissued, as defined in Appendix B. Stock characteristic controls include beta, log book-to-market,momentum, number of analysts, institutional ownership, industry controls, last month’s stockreturn, the Heston and Sadka variable, accruals, and cuts to R&D, as defined in Appendix B.t-statistics (with standard errors clustered by firm and month) are in parentheses, and ∗, ∗∗, and∗∗∗ indicate significance at the 10%, 5%, and 1% levels, respectively.
IR firm −0.343∗∗ −0.336∗∗ −0.199 −0.364∗ −0.152 −0.348∗∗ −0.284∗∗
(−2.46) (−2.35) (−1.44) (−1.85) (−0.79) (−2.43) (−1.97)SUE (if pos.) 1.667∗∗∗ 1.626∗∗∗ 1.702∗∗∗ 1.603∗∗∗ 1.865∗∗∗ 1.636∗∗∗ 1.613∗∗∗
(12.62) (12.77) (14.72) (10.09) (11.18) (12.45) (12.74)SUE (if neg.) −1.173∗∗∗ −1.207∗∗∗ −1.093∗∗∗ −1.173∗∗∗ −1.127∗∗∗ −1.226∗∗∗ −1.203∗∗∗
(−11.89) (−12.08) (−12.04) (−8.54) (−8.62) (−11.91) (−12.00)IR firm∗SUE (if pos.) – – 0.193 – 0.099 – –
– – (0.82) – (0.29) – –IR firm∗SUE (if neg.) – – −0.597∗∗ – −0.804∗∗ – –
– – (−2.07) – (−2.00) – –Neg. tone – – – −30.02∗∗∗ −31.00∗∗∗ – –
– – – (−5.36) (−5.59) – –IR firm∗neg. tone – – – 9.274 13.207 – –
– – – (0.71) (0.97) – –Adjusted returns, t−50:t−5 – – – – – −1.084∗∗∗ –
– – – – – (−3.49) –Log (1 + coverage of pos. – – – – – – −0.117∗∗∗
press releases, t−50:t−5) – – – – – – (−3.63)Log market cap Yes Yes Yes Yes Yes Yes YesCompany characteristics No Yes Yes Yes Yes Yes YesLog market cap∗SUE No No Yes No Yes No NoLog market cap∗tone No No No Yes Yes No NoR2 0.019 0.022 0.029 0.029 0.037 0.023 0.022N 57,006 50,629 50,629 26,463 26,463 50,560 50,362
similar to press coverage, IR firms increase returns more for positive pressreleases than for negative press releases.
C. IR Firm Use and Returns around Earnings Announcements
Table IV examines whether companies using IR firms have higher orlower returns around earnings announcements. The regressions are simi-lar to those of Table III, but include every day with a Compustat quarterly
614 The Journal of Finance R©
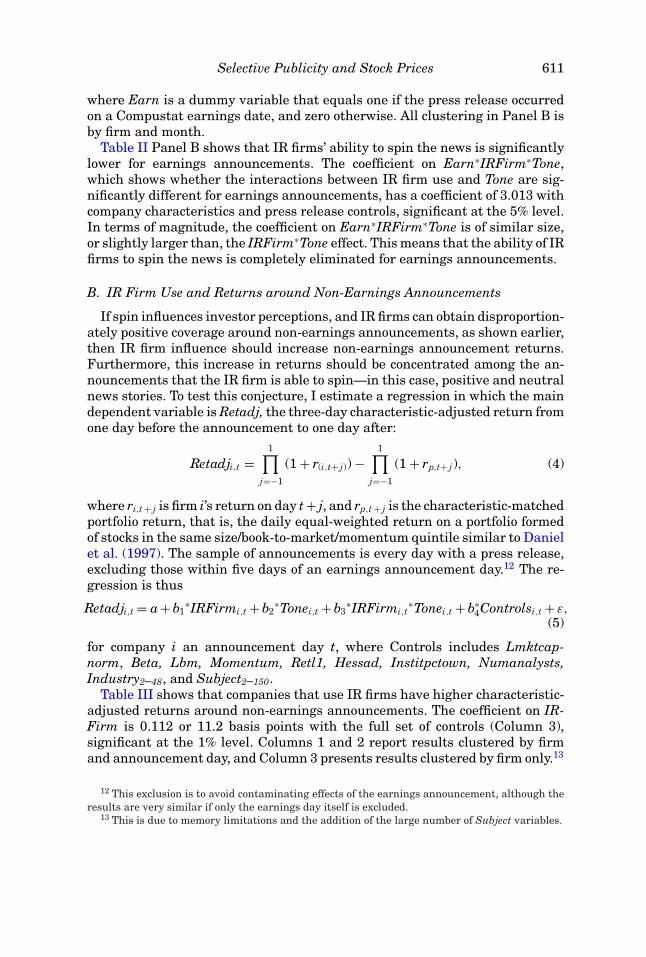
earnings report date. The main independent variable used to measureearnings news is Standardized Unexpected Earnings (SUE; Foster (1977),Bernard and Thomas (1990)), which is defined as in Shanthikumar(2004) as
SUE = eit − ei
t−4 − δi
√Var
(ei
t) . (6)
Expected earnings are equal to (eit−4 + δi), where ei
t−4 is the company’searnings from four quarters ago, and δi is the expected drift in earnings;I estimate the latter term using up to 20 quarters of prior data, and δi =1n
∑nj=1 (ei
t− j − eit− j−4). SUE is normalized to have a mean of zero and stan-
dard deviation of one by subtracting the population mean and dividing by thepopulation standard deviation. Since earnings news may have asymmetric ef-fects, I split it into positive and negative values (and hence SUEPos equals thevalue of SUE when SUE is positive, and zero otherwise, and SUENeg equalsthe value of SUE when SUE is negative, and zero otherwise). The regressionis thus:
Retadji,t = a+ b1∗SUEPosi,t + b2
∗SUENegi,t + b3∗IRFirmi,t
+ b4∗IRFirmi,t
∗SUEPosi,t + b5∗IRFirmi,t
∗SUENegi,t
+ b6∗Tonei,t + b7
∗IRFirmi,t∗Tonei,t + b8
∗Controlsi,t + ε,
(7)
for company i an announcement day t, where Controls includes Beta, Lbm,Momentum, Retl1, Hessad, and Industry2–48. Equation (7) also includes inter-actions between Lmktcapnorm and both SUEPos and SUENeg.
Table IV shows that companies that use IR firms have significantly lowerreturns around earnings announcements. Columns 1 to 2 show that IR firmclients’ characteristic-adjusted returns around earnings announcements are33.6 basis points lower than those of other companies, after controlling forcompany characteristics and SUE, significant at the 5% level when clusteredby firm and month.
Column 3 shows that the negative returns associated with IR firm use areconcentrated around the release of negative earnings news. With the full setof controls, the coefficient on IRFirm∗SUENeg is –0.597, significant at the 5%level, while the IRFirm∗SUEPos terms are insignificant. The interpretation isthat each standard deviation of negative unexpected earnings reduces returnsby an additional 59.7 basis points for IR firm clients. The reaction to a givenlevel of negative earnings news is around 55% larger for companies with an IRfirm. On the other hand, the interaction between IR firm use and Tone is sta-tistically insignificant, consistent with the IR firm effect on media coverage notvarying with tone for earnings news. Instead, it is the hard negative earningsnews that causes particular disappointment.
The above results are consistent with investors being disappointed due toincreased expectations resulting from past spin. To further examine this link,
Selective Publicity and Stock Prices 615
Columns 6 and 7 relate negative earnings returns to the higher returns andgreater positive media coverage generated around non-earnings days. The vari-ables of interest are the cumulative characteristic-adjusted return from t – 50to t – 5 days (relative to the earnings announcement day), and the log of oneplus the number of articles written about the company on positive press releasedays or the day after. Press releases are classified as positive if they containmore positive words than negative words. The results indicate that higher pastreturns and greater coverage of positive press releases significantly predictlower earnings announcement returns. The coefficient on the past returns ef-fect is –1.084 with the full set of controls (Column 6, significant at the 1%level), which implies that about 1% of the total cumulative adjusted returns isreversed on the earnings day. In terms of the effects of past news coverage ofpositive events, the coefficient with the full set of controls is –0.117, significantat the 1% level. A one standard deviation increase in log coverage of positivepress releases is 1.415, which implies lower earnings announcement returns of16.6 basis points.
V. Identification Results
A. Identification Strategy
The results in Section IV suggest that IR firms directly influence mediacoverage and returns. They also preclude several obvious alternatives. Forinstance, IR firm clients are unlikely to simply be more newsworthy, as thiswould ostensibly predict greater media attention for the company’s good andbad news, whereas here the effect pertains only to good news (and only fornon-earnings announcements). For returns, numerous company character-istics might predict higher or lower returns overall, but fewer would pre-dict higher returns for non-earnings news and lower returns for earningsnews.
Nonetheless, it remains possible that the apparent impact of IR firm useon media coverage and returns is driven by selection effects. In particular, theprevious results may be caused by some omitted variable common to companiesthat hire IR firms, rather than the IR firms themselves. The results may alsobe driven by reverse causality, where IR firm use is the result of positive mediacoverage, not the cause. A company may hire an IR firm to simplify its dealingswith the press, or when it has a lot of positive news coming up (although IRfirm relationships tend to be quite stable over time, making the last case lesslikely). Below I consider whether these alternatives appear to be driving themain results.
A.1. Geographic Links and Media Coverage
If IR firms are causing the increases in positive media coverage (as opposed toselection effects or reverse causality), then positive coverage should be greaterin publications where IR firms are expected to have more influence. Consistent
616 The Journal of Finance R©
with this hypothesis, an IR firm is better able to spin the news in newspapers inthe same state as the IR firm (even after controlling for whether the companyitself is in the same state as the newspaper). Under a causality explanation,connections between IR firms and newspapers are likely to be stronger forgeographically nearby newspapers. This could be the case because IR firmpartners meet journalists in the same city, or because IR firms choose to locatenear newspapers they are connected to.
By contrast, if positive media coverage were due to an omitted companycharacteristic (such as being generally interesting to the media), this wouldnot obviously predict a role for IR firm geography. It may play a role undera reverse causality explanation, whereby IR firm location simply reflects un-derlying positive local coverage. In such a case, however, adding controls thatpredict positive local coverage should reduce or eliminate the apparent effectof IR firm geography. Accordingly, in results presented in Section V.B, I controlfor two possible predictors of positive coverage—the location of the companyitself, and the concentration of shareholder ownership in that state (measuredby mutual fund holdings). I find that adding these controls has only a smallimpact on the IR firm geography effect. This suggests that reverse causality isnot driving the results on media coverage.
Another factor suggesting that reverse causality is not driving the resultsis that over half of IR firms are located in New York, Illinois, or California(38% are in New York alone). It seems unlikely that this concentration of IRfirms is driven by positive media coverage given to companies by these states’newspapers. Notwithstanding this, in Section V.B I test this possibility byadding state fixed effects, and find they have virtually no impact on the IR firmeffect. These results support the view that the IR firm effect on media coverageis causal.
A.2. Turnover among Connected Reporters and Returns
To examine whether the IR firms are causally affecting returns (as opposedto selection effects or reverse causality), I examine turnover among reportersconnected to the IR firms. Under causality, IR firms’ ability to influence mediacoverage is likely to operate through connections to particular journalists, towhom they can suggest stories to write. If a connected reporter leaves a news-paper, this will reduce the influence of IR firms who relied on them, creating ashock to the ability of IR firms to spin the news.
Turnover among connected reporters has the advantage that it should beexogenous to company returns for several reasons. First, reporters leavingthe sample is likely due to events exogenous to the companies they writeabout (e.g., life events for the reporter, changes at the newspaper). Second,because turnover is measured at the IR firm level (not the company level),any remaining selection effects will be diversified over all of the IR firm’sclients. In addition, turnover among connected reporters can be compared withturnover among reporters who wrote about the company but were not con-nected to the IR firm, to make sure that the effects are not driven by company
Selective Publicity and Stock Prices 617
characteristics. I measure connections via reporters who wrote about multipleclients of the IR firm in the past year.
Consistent with the IR firm effect being causal, in tests reported inSection V.B I find that the patterns in returns are stronger for IR firms thathave connections to reporters: non-earnings announcement returns are higherand earnings announcement returns are lower. Moreover, these patterns inreturns are less pronounced when connected reporters drop out of the sample,showing that a weakening of connections reduces the returns patterns. Finally,turnover among unconnected reporters shows no effects. These findings, partic-ularly those for reporter turnover, are strongly supportive of IR firms causallyinfluencing announcement returns.
A.3. Internal IR Spending
One alternative to causation involves internal IR operations. Using an ex-ternal IR firm may be a proxy for the company’s level of internal IR operations.Even if this were true, however, IR spending would still have an effect on themedia and investor perceptions, although the mechanism would be different.In Appendix C, I construct several proxies for internal IR operations using thecontact information in each press release. I examine proxies for the numberof people listed, the number of contact categories (media, investors, analysts,etc.), and the number of methods of contact given (email, phone numbers). Intests reported in Appendix C, I find that including measures of internal IRoperations has little effect on the relationship between external IR firms andannouncement returns, suggesting that external IR firm use is not simply aproxy for levels of internal IR spending.
A.4. Selective Issuance of Press Releases
A final alternative that may predict similar patterns is that IR firms arechanging disclosure policies (rather than media coverage directly) by encour-aging their clients to issue press releases more for good news. For bad news,they could either not issue a press release at all, or meet disclosure require-ments in a less public manner (e.g., by filing an 8-K form with the SEC). Inthis case, IR firm clients’ press releases would have on average more positivenews, more positive media coverage, and higher returns, but not due to IR firmsinfluencing the media. In the Internet Appendix, I test whether IR firm clientsare more likely to selectively issue press releases for positive news, by sampleof examining earnings announcements and SEC filings of 10-K, 10-Q, and 8-Kforms.14 Relative to other companies, IR firm clients are somewhat less likely
14 As well as examining whether IR firms selectively issue press releases for good news, theInternet Appendix includes additional results on the effect of IR firm use on book-to-market ratios,bid–ask spread, and trading volume. It also examines whether IR firm use is related to CEOequity-based compensation and sales, and considers additional tests related to selection effects ofjournalist inclusion. An Internet Appendix for this article is available online in the “Supplementsand Datasets” section at http://www.afajof.org/supplements.asp.
618 The Journal of Finance R©
to selectively issue press releases for positive news, suggesting that selectivepress releases for good news are not driving the results.
B. Geographical Links and IR Firm Influence on Media Coverage
Table V explores the impact of geographical links on IR firms’ ability to spin,and shows that IR firms generate disproportionately more positive coverageamong newspapers in their own state. The unit of observation is a company-newspaper-year combination, from 2002 to 2006 (for all news sources with atleast 1,000 articles that year). In Panel A, the regression is
PctPosArti,p,t = a+ b1∗IRFirmi,t + b2
∗CompanyPaperMatchi,p,t
+ b3∗IRFirmPaperMatchi,p,t + b4
∗CompanyStatedum1−50,i,t
+ b5∗OwnershipIRStatei,t + b6
∗OwnershipPaperStatei,p,t
+ b7∗LogTotalArticlesi,t + b8
∗Controlsi,t + ε, (8)
for company i and newspaper p in year t. The dependent variable is PctPosArt,the number of stories that year in the news source about the company, writtenwithin one day of the company issuing a positive-toned press release, expressedas a percentage of all of articles in the news source.15 As in Table IV, press re-leases are classified as positive overall if they contain more positive words thannegative words. In Panel B, the regression is similar but the dependent vari-able is PctCompPosArt, coverage on positive press release days as a percentageof articles about that company in the news source. Thus, Panel A measurespositive coverage overall in the paper, while Panel B measures positive newsrelative to other news about that company.
The main independent variable in both panels of Table V is IRFirmPaper-Match, a dummy variable equal to one if the news source and the IR firm arelocated in the same state and zero otherwise. The variable CompanyPaper-Match is a dummy variable equal to one if the news source and the companyare located in the same state and zero otherwise, and LogTotalArticles is equalto the log of the total number of articles in the news source that year (to ac-count for possible mechanical effects in the range of allowable percentagesacross newspaper size). CompanyStatedum are dummy variables for the statethat the company is located in (to control for the possibility that firms fromparticular states are more newsworthy overall).
The variables OwnershipIRState and OwnershipPaperState measure thefraction of the company’s shares held by mutual funds located in the stateof the IR firm and the newspaper, respectively. Ownership information comesfrom mutual fund s12 filings in the Thomson Financial database, and geo-graphic information from the CRSP Mutual Fund database. These variables
15 Percentages are used so that coverage may be comparable across news sources, despite thefact that different news sources will have very different space restrictions. The press release mustbe either on the same day as the article or the day immediately before (to account for a one-daypublication delay in daily newspapers).

Selective Publicity and Stock Prices 619
Table VMedia Coverage and IR Firm Geographical Links to Newspapers
This table shows regressions of annual positive press coverage on IR firm use and geographicallinks between newspapers, companies, and IR firms for U.S. publicly listed companies from January2002 to December 2006. In Panel A, the dependent variable measures (by news source), the numberof articles about each company on days when the company had a positively toned press release,divided by the number of articles in the paper that year. In Panel B, the same positive coverageis divided by the number of articles about that company in the paper that year. IRFirm is adummy variable equal to one if the company used an IR firm in the year. CompanyPaperMatch isa dummy variable that equals one if the company is headquartered in the same state as the newspublication, and zero otherwise. IRFirmPaperMatch is a dummy variable that equals one if the IRfirm is headquartered in the same state as the newspaper. State Controls are 50 dummy variablesfor the state of the company headquarters. Stock characteristic controls include beta, log book-to-market, momentum, and industry controls, as defined in Appendix B. t-statistics (with standarderrors clustered by firm and year) are in parentheses, and ∗, ∗∗, and ∗∗∗ indicate significance at the10%, 5%, and 1% levels, respectively.
Panel A: Positive Coverage as a Proportion of All Articles in the News Source
Dependant Variable Is Coverage of Positive Press Releases as % of All Articles in the News Source
Intercept 0.059∗∗ 0.059∗∗ 0.058∗∗ 0.054∗∗ 0.054∗∗(4.19) (4.19) (4.14) (3.89) (3.89)
IR firm 0.027∗∗ 0.026∗∗ 0.026∗∗ 0.026∗∗ 0.027∗∗(4.29) (4.25) (4.27) (4.29) (4.07)
IRFirmPaperMatch – 0.066∗∗ 0.058∗∗ 0.057∗∗ 0.060∗∗– (3.43) (3.04) (3.06) (3.08)
CompanyPaperMatch – – 0.044∗∗∗ 0.044∗∗∗ 0.046∗∗∗– – (8.04) (8.47) (8.37)
Mutual fund ownership – – – – −0.125∗∗in state of paper – – – – (−4.25)
Mutual fund ownership – – – – −0.313∗in state of IR firm – – – – (−2.20)
Company characteristics Yes Yes Yes Yes YesState controls No No No Yes YesR2 0.035 0.035 0.036 0.040 0.040N 1,534,965 1,534,965 1,534,965 1,534,965 1,534,965
Panel B: Positive Coverage as a Proportion of Articles about That Company
Dependant Variable Is Coverage of Positive Press Releases as % of Articles about Company inNews Source
Intercept 24.496∗∗∗ 24.498∗∗∗ 24.627∗∗∗ 26.636∗∗∗ 26.662∗∗∗(7.41) (7.41) (7.45) (7.64) (7.65)
IR firm 4.837∗∗∗ 4.806∗∗∗ 4.789∗∗∗ 4.640∗∗∗ 4.739∗∗∗(5.93) (5.89) (5.86) (5.81) (5.45)
IRFirmPaperMatch – 0.994 1.776∗∗ 1.961∗∗ 2.472∗∗– (1.62) (2.86) (3.16) (3.64)
CompanyPaperMatch – – −4.174∗∗∗ −4.219∗∗∗ −3.753∗∗∗– – (−5.17) (−5.84) (−5.10)
Mutual fund ownership – – – – −31.613∗in state of paper – – – – (−2.39)
(continued)
620 The Journal of Finance R©
Table V—Continued
Panel B: Positive Coverage as a Proportion of Articles about That Company
Dependant Variable Is Coverage of Positive Press Releases as % of Articles about Company inNews Source
Mutual fund ownership – – – – −28.252in state of IR firm – – – – (−1.69)
Company characteristics Yes Yes Yes Yes YesState controls No No No Yes YesR2 0.056 0.056 0.056 0.060 0.060N 318,215 318,215 318,215 318,215 318,215
control for the possibility that IR firm location and newspaper coverage arejointly responding to the number of investors in the company located in a givenstate. In equation (8), Controls includes Lmktcapnorm, Beta, Lbm, Numana-lysts, Institpctown, and Industry2–48, as described in Table I, Panel B.16
Table V shows that IR firm influence is significantly greater for news sourcesin the same state, even after controlling for the company’s location. In PanelA, IR firms’ geographical links increase positive coverage as a proportion ofall articles in the newspaper. With the full set of controls (Column 5), thecoefficient on IRFirmPaperMatch is 0.060, significant at the 5% level whenclustered by firm and year.17 This indicates that the same-state increase in IRfirm–related coverage is an additional 0.060% of the total number of articlesin that newspaper. The IRFirmPaperMatch effect is robust and fairly stablewhen additional controls are added. By comparison, the base coefficient onthe IRFirm variable is 0.027 (for out-of-state papers), and the coefficient onCompanyPaperMatch is 0.046 (for local companies).
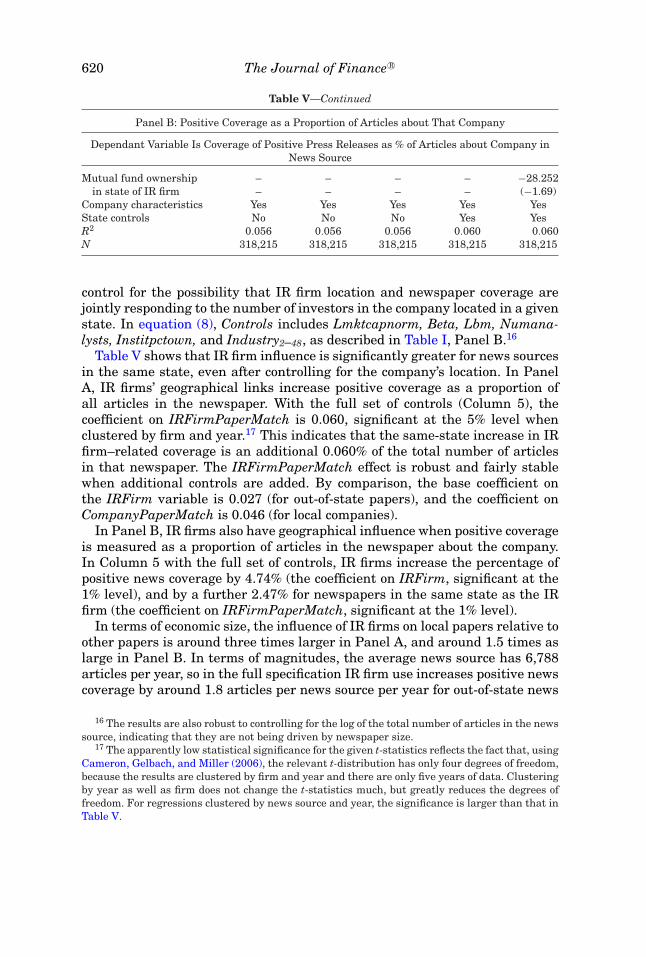
In Panel B, IR firms also have geographical influence when positive coverageis measured as a proportion of articles in the newspaper about the company.In Column 5 with the full set of controls, IR firms increase the percentage ofpositive news coverage by 4.74% (the coefficient on IRFirm, significant at the1% level), and by a further 2.47% for newspapers in the same state as the IRfirm (the coefficient on IRFirmPaperMatch, significant at the 1% level).
In terms of economic size, the influence of IR firms on local papers relative toother papers is around three times larger in Panel A, and around 1.5 times aslarge in Panel B. In terms of magnitudes, the average news source has 6,788articles per year, so in the full specification IR firm use increases positive newscoverage by around 1.8 articles per news source per year for out-of-state news
16 The results are also robust to controlling for the log of the total number of articles in the newssource, indicating that they are not being driven by newspaper size.
17 The apparently low statistical significance for the given t-statistics reflects the fact that, usingCameron, Gelbach, and Miller (2006), the relevant t-distribution has only four degrees of freedom,because the results are clustered by firm and year and there are only five years of data. Clusteringby year as well as firm does not change the t-statistics much, but greatly reduces the degrees offreedom. For regressions clustered by news source and year, the significance is larger than that inTable V.

Selective Publicity and Stock Prices 621
sources, and by 5.9 articles per year for news sources in the same state. Includ-ing controls for shareholder geography strengthens the IRFirmPaperMatchcoefficients somewhat, rather than eliminate them.
C. Returns around Announcements and Turnover among Connected Reporters
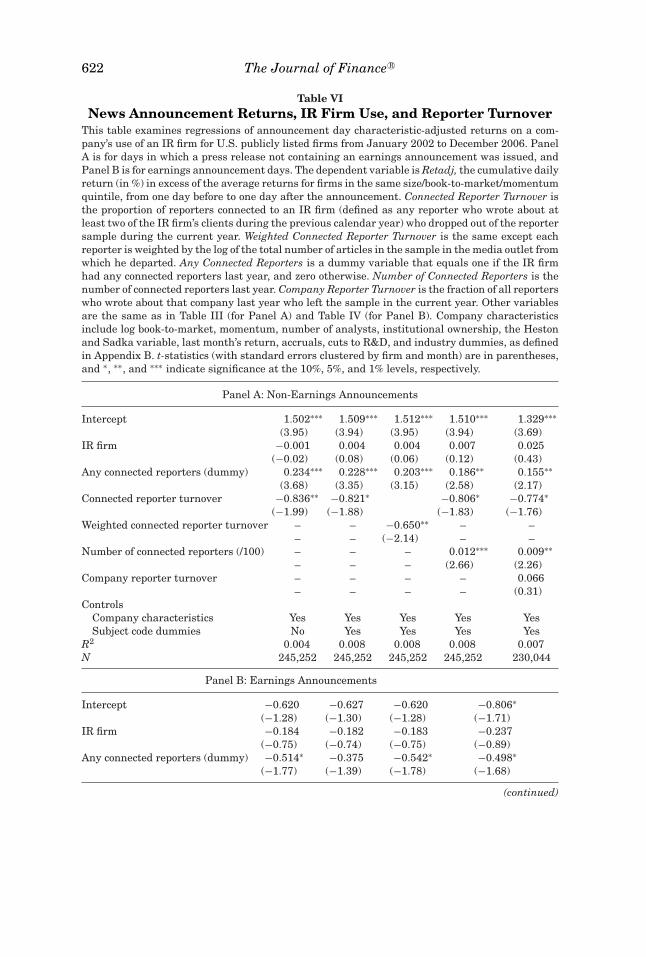
Table VI considers the role of connections between reporters and IR firmson the announcement returns of IR firm clients. If the effect of IR firms onreturns is causal, then the presence of connected reporters should increase thereturns patterns in Sections IV.B and IV.C. Further, turnover among connectedreporters (which is an exogenous shock to IR firm influence) should weakenthose patterns. Both of these predictions find support in the data.
Reporter information is taken from the byline of each article, which hasnon-missing entries for roughly 25.6% of non-press release articles.18 Reporternames are cleaned by removing information on paper affiliations and titles. Re-porters must have written at least 50 single-author articles during the sampleto be included. A reporter is considered to have left the sample in year t if yeart – 1 is the last year that the reporter’s name appears on a byline. A reporter isconsidered to be connected to an IR firm in year t – 1 if he wrote articles aboutat least two of the IR firm’s clients in year t – 1. The main independent variableis RepTurnover, defined for each IR firm i and applied to all clients of the IRfirm that year:
RepTurnoveri,t
= Number of Connected Reporters in year [t − 1] who left sample in year tNumber of Connected Reports in year [t − 1]
.(9)
If the IR firm has no connections to reporters in the previous year (or thecompany does not use an IR firm) the value of RepTurnover is zero, and compa-nies with multiple IR firms are assigned the average over all IR firms used. Asecond variable, WtRepTurnover, weights connected reporters by the log of thenumber of articles in their news source, to test whether the results are drivenby newspaper circulation. The variable AnyConnect equals one if the companyuses an IR firm with any connected reporters in year t – 1, and zero otherwise,to distinguish IR firms with no turnover from IR firms with no connected re-porters. The variable NumConnect is the number of connected reporters inyear t – 1, to test whether the RepTurnover effect is driven by the denominator.Finally, CompanyRepTurnover is the proportion of all reporters (connected andunconnected) who wrote about the company in year t – 1 and dropped out of thesample in year t. This variable can be positive for all companies, not just IRfirm clients, to control for the possibility that connected reporter turnover ismeasuring a change in the company itself, such as the company becoming less
18 In the Internet Appendix, I show that IR firm use is not associated with a change in theprobability of an article having a journalist name included, which might generate contaminatingeffects.
622 The Journal of Finance R©
Table VINews Announcement Returns, IR Firm Use, and Reporter Turnover
This table examines regressions of announcement day characteristic-adjusted returns on a com-pany’s use of an IR firm for U.S. publicly listed firms from January 2002 to December 2006. PanelA is for days in which a press release not containing an earnings announcement was issued, andPanel B is for earnings announcement days. The dependent variable is Retadj, the cumulative dailyreturn (in %) in excess of the average returns for firms in the same size/book-to-market/momentumquintile, from one day before to one day after the announcement. Connected Reporter Turnover isthe proportion of reporters connected to an IR firm (defined as any reporter who wrote about atleast two of the IR firm’s clients during the previous calendar year) who dropped out of the reportersample during the current year. Weighted Connected Reporter Turnover is the same except eachreporter is weighted by the log of the total number of articles in the sample in the media outlet fromwhich he departed. Any Connected Reporters is a dummy variable that equals one if the IR firmhad any connected reporters last year, and zero otherwise. Number of Connected Reporters is thenumber of connected reporters last year. Company Reporter Turnover is the fraction of all reporterswho wrote about that company last year who left the sample in the current year. Other variablesare the same as in Table III (for Panel A) and Table IV (for Panel B). Company characteristicsinclude log book-to-market, momentum, number of analysts, institutional ownership, the Hestonand Sadka variable, last month’s return, accruals, cuts to R&D, and industry dummies, as definedin Appendix B. t-statistics (with standard errors clustered by firm and month) are in parentheses,and ∗, ∗∗, and ∗∗∗ indicate significance at the 10%, 5%, and 1% levels, respectively.
Panel A: Non-Earnings Announcements
Intercept 1.502∗∗∗ 1.509∗∗∗ 1.512∗∗∗ 1.510∗∗∗ 1.329∗∗∗(3.95) (3.94) (3.95) (3.94) (3.69)
IR firm −0.001 0.004 0.004 0.007 0.025(−0.02) (0.08) (0.06) (0.12) (0.43)
Any connected reporters (dummy) 0.234∗∗∗ 0.228∗∗∗ 0.203∗∗∗ 0.186∗∗ 0.155∗∗(3.68) (3.35) (3.15) (2.58) (2.17)
Connected reporter turnover −0.836∗∗ −0.821∗ −0.806∗ −0.774∗(−1.99) (−1.88) (−1.83) (−1.76)
Weighted connected reporter turnover – – −0.650∗∗ – –– – (−2.14) – –
Number of connected reporters (/100) – – – 0.012∗∗∗ 0.009∗∗– – – (2.66) (2.26)
Company reporter turnover – – – – 0.066– – – – (0.31)
ControlsCompany characteristics Yes Yes Yes Yes YesSubject code dummies No Yes Yes Yes Yes
R2 0.004 0.008 0.008 0.008 0.007N 245,252 245,252 245,252 245,252 230,044
Panel B: Earnings Announcements
Intercept −0.620 −0.627 −0.620 −0.806∗(−1.28) (−1.30) (−1.28) (−1.71)
IR firm −0.184 −0.182 −0.183 −0.237(−0.75) (−0.74) (−0.75) (−0.89)
Any connected reporters (dummy) −0.514∗ −0.375 −0.542∗ −0.498∗(−1.77) (−1.39) (−1.78) (−1.68)
(continued)

Selective Publicity and Stock Prices 623
Table VI—Continued
Panel B: Earnings Announcements
Connected reporter turnover 3.913∗∗∗ 3.923∗∗∗ 3.214∗∗(2.60) (2.60) (2.04)
Weighted connected reporter turnover – 2.487∗ – –– (1.71) – –
Number of connected reporters – – 0.012 –– – (0.55) –
Company reporter turnover – – – 0.209– – – (0.56)
ControlsCompany characteristics Yes Yes Yes Yes
R2 0.022 0.022 0.022 0.020N 50,629 50,629 50,629 41,455
newsworthy or journalists covering the company being fired. Table VI showsthe effects of reporter turnover on announcement returns. Panel A examinesnon-earnings announcements and Panel B examines earnings announcements.The regressions are the same as in Sections IV.B and IV.C, respectively, withthe addition of RepTurnover, AnyConnect, WtRepTurnover, NumConnect, andCompanyRepTurnover.
The first result from Table VI is that having at least one connected reportergreatly strengthens the effect of IR firms on announcement returns, consistentwith the mechanism of IR firm influence being connections to specific reporters.In Panel A, with stock and press release subject controls, the base effect ofIRFirm is –0.1 basis points and insignificant, whereas the AnyConnect effectis 23.4 basis points and significant at the 1% level when clustered by company.In other words, virtually the entire effect of IR firms on non-earnings returnscomes from connected IR firms, with unconnected IR firms having no significanteffects. In Panel B, the coefficient on AnyConnect is –0.514 (i.e., –52 basispoints in addition to the base IRFirm effect) and significant at the 10% levelwith company characteristic controls (Column 1), while IRFirm is –0.177 andinsignificant. The effect is fairly stable with the inclusion of controls for thenumber of connected reporters (Column 3) and company-level reporter turnover(Column 4). In the data, 57% of IR firm clients had an IR firm with connectionsto at least one reporter.
The second result from Table VI is that connected reporter turnover weakensthe effect of IR firms on announcement returns, resulting in lower non-earningsannouncement returns (Panel A) and higher earnings announcement returns(Panel B), the opposite of the baseline IR firm effects. In Panel A for non-earnings announcements, the coefficient on RepTurnover is between –0.774and –0.836 depending on the controls, significant at the 10% or 5% level whenclustered by firm. In Panel B for earnings announcements, connected reporterturnover increases returns. The coefficient on RepTurnover is between 3.923and 3.214 depending on the controls, and significant at the 1% or 5% level
624 The Journal of Finance R©
when clustered by firm and announcement month. In terms of the magnitudeof the RepTurnover effect, a one standard deviation increase in connected re-porter turnover (among those with some connection, equal to 0.147) raisesearnings announcement returns by 57.5 basis points, and reduces non-earningsannouncement returns by 12.1 basis points.
A third result from Table VI is that turnover among unconnected reportersdoes not drive the return effects. For both earnings and non-earnings announce-ments, company-level reporter turnover is statistically insignificant, and hasvery little impact on the connected reporter turnover effect. This indicates thatthe effects of reporter turnover are limited to those reporters who are connectedto the company’s IR firm. Finally, the connected reporter turnover results aresimilar if reporter turnover is weighted by newspaper circulation. The signifi-cance of reporter turnover is higher for non-earnings announcements in PanelA, but lower for earnings announcements in Panel B.
VI. Results on IR Firm Client Characteristics and Returns
A. IR Firm Use and Management of Reported Earnings
As discussed earlier, the most plausible motivation for spin seems to be totemporarily increase the share price, even though such price increases willultimately be reversed without better company performance to justify them.In such a case, spinning the news represents behavior designed to affect in-vestor perceptions rather than to improve underlying company performance.Spin is, of course, not the only possible reason to hire an IR firm—a companymay hire an IR firm simply to outsource a non-core component of its busi-ness, as part of a strategy to increase greater disclosure, or for various otherreasons.
Spin has similarities with other types of shareholder manipulation such asthe management of reported earnings (Graham, Harvey, and Rajgopal (2005)).Both increase short-term perceptions, even though this can result in largereventual disappointment. Shifting earnings from the future to the present,such as by earnings smoothing, requires that they be “paid back” at somepoint. If the manipulation involves cutting positive NPV projects (such asroutine maintenance or R&D), then the eventual cost to the company willbe greater than the benefit today. Nonetheless, there is significant evidencethat some managers engage in these activities (Graham et al. (2005)). Us-ing an IR firm to affect expectations is relatively cheap (the average cost is$474,000 per year in the sample), and selectively promoting good news sto-ries to the media is legal and publicly defensible (absent bribery or breachingdisclosure requirements).
The literature offers various reasons as to why managers might engage inearnings smoothing. Some explanations are based on game-theoretic consid-erations when managers have private benefits of control (Guttman, Kadan,and Kandel (2006)). Other explanations center on behavioral argumentsusing investors’ utility (e.g., Burgstahler and Dichev (1997)), information

Selective Publicity and Stock Prices 625
processing heuristics (Degeorge, Patel, and Zeckhauser (1999)), or investoroptimism (Teoh, Welch, and Wong (1998)).
If companies hire IR firms in order to spin the news, then IR firm use may beassociated with other types of shareholder manipulation, such as managing re-ported earnings. I consider this possibility in Table VII, where I examine threemeasures of managing reported earnings—earnings restatements, accruals,and cuts to R&D expenditure—as well as a measure of shareholder protection.The independent variables are IRFirm, Lmktcapann, Lbm, Retlann, Turnover,Institpctown, Numanalysts, Industry (as defined in Appendix B), and year fixedeffects, and t-statistics are clustered by firm and year.
In Panel A, I consider whether IR firm clients are likely to have weakershareholder protection, as measured by the G measure of governance fromGompers et al. (2003), where higher values of G represent weaker shareholderprotection. I also examine whether IR firm clients are more likely to restatetheir earnings (a sign of poor governance and past attempts to boost investorexpectations). Similar to Richardson, Tuna, and Wu (2002), I identify earningsrestatements as cases where a company has a news article or press releasethat contains words that are derivations of “restate” and “earnings” in eitherthe headline or lead paragraph.19 The dependent variable is a dummy variablethat equals one if the firm has any restatement that year, and zero otherwise.
In Panel B, I examine measures of earnings management and cash flowmanagement (Graham et al. (2005)). For earnings management, I consideraccruals (Sloan (1996), Barton and Simko (2002)), measured as earnings beforeextraordinary items and discontinued operations less operating cash flows,scaled by total assets in the previous year (Barton and Simko (2002)). Accrualscapture the amount of earnings that have not produced current cash flows, andthis variable has been associated with earnings management in prior research(Dechow, Sloan, and Sweeney (1995)). For cash flow management, I look at cutsto R&D, which often involve cutting potentially profitable long-term projectsin order to reduce current expenses (D’Souza and Wang (2006)). Cuts to R&Dare measured as a dummy variable that equals one if the firm reduced R&Dexpenditure that year.
The results in Table VII show that IR firm use is associated with earningsmanagement. In Panel A, with the full set of controls IR firm clients have a2.6% higher chance of restating earnings, significant at the 1% level (Column 6),and a governance index that is 0.211 points higher, significant at the 5% level(Column 3, relative to a mean governance level of 9.01 and a standard deviationof 2.59). In Panel B, IR firm clients have a 1.1% higher chance of cutting R&Dspending (significant at the 5% level with the full set of controls, and at the 1%level in other specifications). In terms of accruals, the evidence is weaker: IRfirm clients have higher accruals at a univariate level, but this effect disappearswhen additional controls are included.
19 The document must contain both “restat∗” and “earn∗.” This is similar to the mechanism usedby the General Accounting Office, and used in Collins et al. (2008).
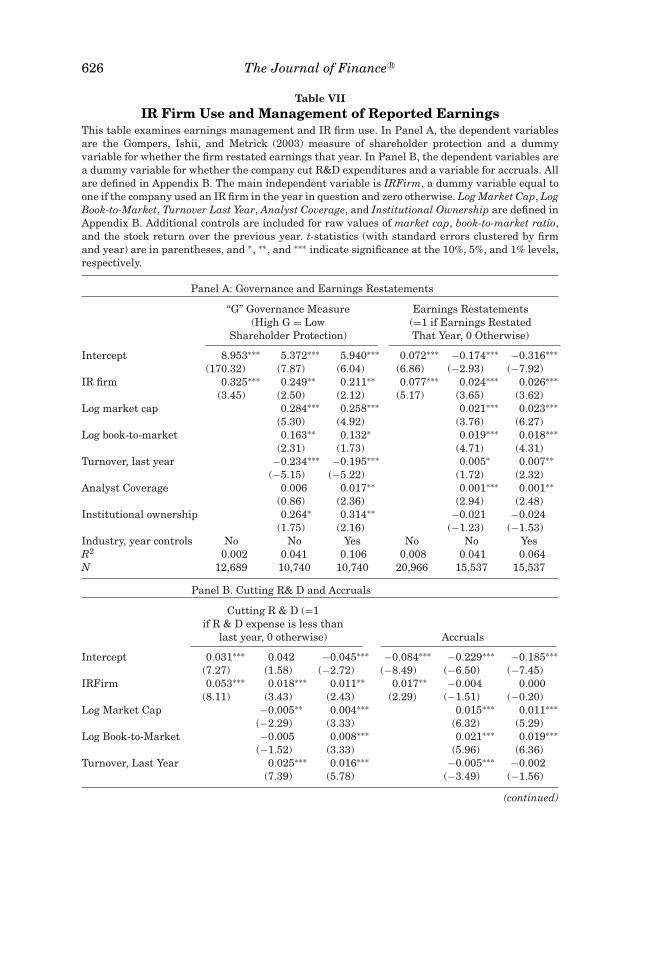
626 The Journal of Finance R©
Table VIIIR Firm Use and Management of Reported Earnings
This table examines earnings management and IR firm use. In Panel A, the dependent variablesare the Gompers, Ishii, and Metrick (2003) measure of shareholder protection and a dummyvariable for whether the firm restated earnings that year. In Panel B, the dependent variables area dummy variable for whether the company cut R&D expenditures and a variable for accruals. Allare defined in Appendix B. The main independent variable is IRFirm, a dummy variable equal toone if the company used an IR firm in the year in question and zero otherwise. Log Market Cap, LogBook-to-Market, Turnover Last Year, Analyst Coverage, and Institutional Ownership are defined inAppendix B. Additional controls are included for raw values of market cap, book-to-market ratio,and the stock return over the previous year. t-statistics (with standard errors clustered by firmand year) are in parentheses, and ∗, ∗∗, and ∗∗∗ indicate significance at the 10%, 5%, and 1% levels,respectively.
Panel A: Governance and Earnings Restatements
“G” Governance Measure Earnings Restatements(High G = Low (=1 if Earnings Restated
Shareholder Protection) That Year, 0 Otherwise)
Intercept 8.953∗∗∗ 5.372∗∗∗ 5.940∗∗∗ 0.072∗∗∗ −0.174∗∗∗ −0.316∗∗∗(170.32) (7.87) (6.04) (6.86) (−2.93) (−7.92)
IR firm 0.325∗∗∗ 0.249∗∗ 0.211∗∗ 0.077∗∗∗ 0.024∗∗∗ 0.026∗∗∗(3.45) (2.50) (2.12) (5.17) (3.65) (3.62)
Log market cap 0.284∗∗∗ 0.258∗∗∗ 0.021∗∗∗ 0.023∗∗∗(5.30) (4.92) (3.76) (6.27)
Log book-to-market 0.163∗∗ 0.132∗ 0.019∗∗∗ 0.018∗∗∗(2.31) (1.73) (4.71) (4.31)
Turnover, last year −0.234∗∗∗ −0.195∗∗∗ 0.005∗ 0.007∗∗(−5.15) (−5.22) (1.72) (2.32)
Analyst Coverage 0.006 0.017∗∗ 0.001∗∗∗ 0.001∗∗(0.86) (2.36) (2.94) (2.48)
Institutional ownership 0.264∗ 0.314∗∗ −0.021 −0.024(1.75) (2.16) (−1.23) (−1.53)
Industry, year controls No No Yes No No YesR2 0.002 0.041 0.106 0.008 0.041 0.064N 12,689 10,740 10,740 20,966 15,537 15,537
Panel B. Cutting R& D and Accruals
Cutting R & D (=1if R & D expense is less than
last year, 0 otherwise) Accruals
Intercept 0.031∗∗∗ 0.042 −0.045∗∗∗ −0.084∗∗∗ −0.229∗∗∗ −0.185∗∗∗(7.27) (1.58) (−2.72) (−8.49) (−6.50) (−7.45)
IRFirm 0.053∗∗∗ 0.018∗∗∗ 0.011∗∗ 0.017∗∗ −0.004 0.000(8.11) (3.43) (2.43) (2.29) (−1.51) (−0.20)
Log Market Cap −0.005∗∗ 0.004∗∗∗ 0.015∗∗∗ 0.011∗∗∗(−2.29) (3.33) (6.32) (5.29)
Log Book-to-Market −0.005 0.008∗∗∗ 0.021∗∗∗ 0.019∗∗∗(−1.52) (3.33) (5.96) (6.36)
Turnover, Last Year 0.025∗∗∗ 0.016∗∗∗ −0.005∗∗∗ −0.002(7.39) (5.78) (−3.49) (−1.56)
(continued)
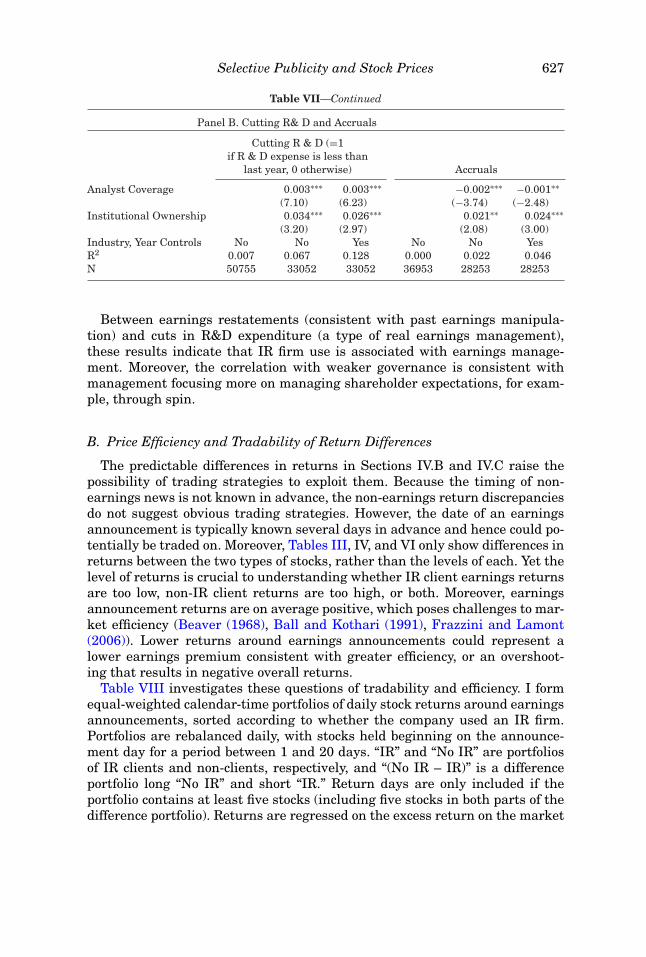
Selective Publicity and Stock Prices 627
Table VII—Continued
Panel B. Cutting R& D and Accruals
Cutting R & D (=1if R & D expense is less than
last year, 0 otherwise) Accruals
Analyst Coverage 0.003∗∗∗ 0.003∗∗∗ −0.002∗∗∗ −0.001∗∗(7.10) (6.23) (−3.74) (−2.48)
Institutional Ownership 0.034∗∗∗ 0.026∗∗∗ 0.021∗∗ 0.024∗∗∗(3.20) (2.97) (2.08) (3.00)
Industry, Year Controls No No Yes No No YesR2 0.007 0.067 0.128 0.000 0.022 0.046N 50755 33052 33052 36953 28253 28253
Between earnings restatements (consistent with past earnings manipula-tion) and cuts in R&D expenditure (a type of real earnings management),these results indicate that IR firm use is associated with earnings manage-ment. Moreover, the correlation with weaker governance is consistent withmanagement focusing more on managing shareholder expectations, for exam-ple, through spin.
B. Price Efficiency and Tradability of Return Differences
The predictable differences in returns in Sections IV.B and IV.C raise thepossibility of trading strategies to exploit them. Because the timing of non-earnings news is not known in advance, the non-earnings return discrepanciesdo not suggest obvious trading strategies. However, the date of an earningsannouncement is typically known several days in advance and hence could po-tentially be traded on. Moreover, Tables III, IV, and VI only show differences inreturns between the two types of stocks, rather than the levels of each. Yet thelevel of returns is crucial to understanding whether IR client earnings returnsare too low, non-IR client returns are too high, or both. Moreover, earningsannouncement returns are on average positive, which poses challenges to mar-ket efficiency (Beaver (1968), Ball and Kothari (1991), Frazzini and Lamont(2006)). Lower returns around earnings announcements could represent alower earnings premium consistent with greater efficiency, or an overshoot-ing that results in negative overall returns.
Table VIII investigates these questions of tradability and efficiency. I formequal-weighted calendar-time portfolios of daily stock returns around earningsannouncements, sorted according to whether the company used an IR firm.Portfolios are rebalanced daily, with stocks held beginning on the announce-ment day for a period between 1 and 20 days. “IR” and “No IR” are portfoliosof IR clients and non-clients, respectively, and “(No IR – IR)” is a differenceportfolio long “No IR” and short “IR.” Return days are only included if theportfolio contains at least five stocks (including five stocks in both parts of thedifference portfolio). Returns are regressed on the excess return on the market
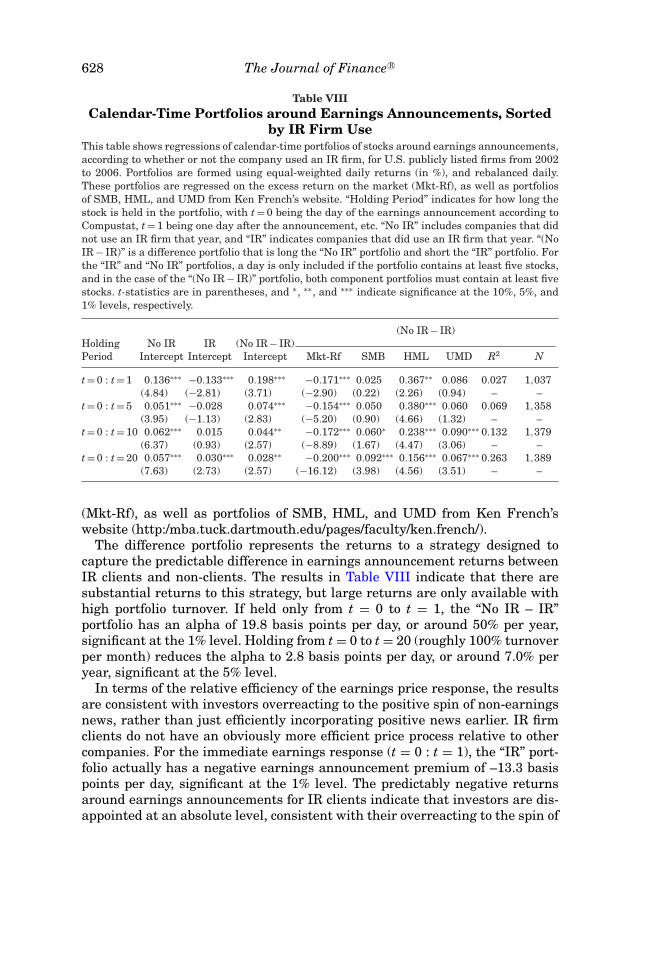
628 The Journal of Finance R©
Table VIIICalendar-Time Portfolios around Earnings Announcements, Sorted
by IR Firm UseThis table shows regressions of calendar-time portfolios of stocks around earnings announcements,according to whether or not the company used an IR firm, for U.S. publicly listed firms from 2002to 2006. Portfolios are formed using equal-weighted daily returns (in %), and rebalanced daily.These portfolios are regressed on the excess return on the market (Mkt-Rf), as well as portfoliosof SMB, HML, and UMD from Ken French’s website. “Holding Period” indicates for how long thestock is held in the portfolio, with t = 0 being the day of the earnings announcement according toCompustat, t = 1 being one day after the announcement, etc. “No IR” includes companies that didnot use an IR firm that year, and “IR” indicates companies that did use an IR firm that year. “(NoIR − IR)” is a difference portfolio that is long the “No IR” portfolio and short the “IR” portfolio. Forthe “IR” and “No IR” portfolios, a day is only included if the portfolio contains at least five stocks,and in the case of the “(No IR − IR)” portfolio, both component portfolios must contain at least fivestocks. t-statistics are in parentheses, and ∗, ∗∗, and ∗∗∗ indicate significance at the 10%, 5%, and1% levels, respectively.
(No IR − IR)Holding No IR IR (No IR − IR)Period Intercept Intercept Intercept Mkt-Rf SMB HML UMD R2 N
t = 0 : t = 1 0.136∗∗∗ −0.133∗∗∗ 0.198∗∗∗ −0.171∗∗∗ 0.025 0.367∗∗ 0.086 0.027 1,037(4.84) (−2.81) (3.71) (−2.90) (0.22) (2.26) (0.94) – –
t = 0 : t = 5 0.051∗∗∗ −0.028 0.074∗∗∗ −0.154∗∗∗ 0.050 0.380∗∗∗ 0.060 0.069 1,358(3.95) (−1.13) (2.83) (−5.20) (0.90) (4.66) (1.32) – –
t = 0 : t = 10 0.062∗∗∗ 0.015 0.044∗∗ −0.172∗∗∗ 0.060∗ 0.238∗∗∗ 0.090∗∗∗ 0.132 1,379(6.37) (0.93) (2.57) (−8.89) (1.67) (4.47) (3.06) – –
t = 0 : t = 20 0.057∗∗∗ 0.030∗∗∗ 0.028∗∗ −0.200∗∗∗ 0.092∗∗∗ 0.156∗∗∗ 0.067∗∗∗ 0.263 1,389(7.63) (2.73) (2.57) (−16.12) (3.98) (4.56) (3.51) – –
(Mkt-Rf), as well as portfolios of SMB, HML, and UMD from Ken French’swebsite (http:/mba.tuck.dartmouth.edu/pages/faculty/ken.french/).
The difference portfolio represents the returns to a strategy designed tocapture the predictable difference in earnings announcement returns betweenIR clients and non-clients. The results in Table VIII indicate that there aresubstantial returns to this strategy, but large returns are only available withhigh portfolio turnover. If held only from t = 0 to t = 1, the “No IR – IR”portfolio has an alpha of 19.8 basis points per day, or around 50% per year,significant at the 1% level. Holding from t = 0 to t = 20 (roughly 100% turnoverper month) reduces the alpha to 2.8 basis points per day, or around 7.0% peryear, significant at the 5% level.
In terms of the relative efficiency of the earnings price response, the resultsare consistent with investors overreacting to the positive spin of non-earningsnews, rather than just efficiently incorporating positive news earlier. IR firmclients do not have an obviously more efficient price process relative to othercompanies. For the immediate earnings response (t = 0 : t = 1), the “IR” port-folio actually has a negative earnings announcement premium of –13.3 basispoints per day, significant at the 1% level. The predictably negative returnsaround earnings announcements for IR clients indicate that investors are dis-appointed at an absolute level, consistent with their overreacting to the spin of

Selective Publicity and Stock Prices 629
non-earnings news. By comparison, the positive alpha for the “No IR” port-folio of 13.6 basis points is roughly the same magnitude.20 In other words, IRclients’ returns appear too low by roughly the same amount that non-IR clients’returns appear too high. These results do not support the notion that IR firmsare increasing price efficiency by simply speeding up the realization of positivenews.
C. Monthly Calendar-Time Portfolios and Average Characteristic-AdjustedReturns
I next examine whether using an IR firm affects returns overall (rather thanjust price reactions to news). Under the spin hypothesis, IR firm use should notaffect overall returns. On the other hand, overall returns may be affected byan alternative role that IR firms may be playing, namely, increasing attention(Fang and Peress (2009), Merton (1987)). When more investors are aware of acompany (e.g., as a result of increased media coverage), this can increase thepool of funds available to the company and thus lower the cost of capital andexpected returns.
In the current context, the above argument implies that, when an IR firmis first added, the company’s stock price should increase to reflect the lowerdiscount rate, in a simple present value framework. Thereafter, expected re-turns should be lower. The increase in price is important; without it, nomanager would ever voluntarily sign up for a service that simply loweredstock returns today and in the future. This question is related to the re-sults in Fang and Peress (2009), who use a calendar-time portfolio frame-work to show that high news stocks have lower returns. Table II shows thatadding an IR firm does in fact increase media coverage, and thus presentsa test of the Merton (1987) hypothesis of greater news lowering the cost ofcapital.
Table IX examines this question by looking at monthly abnormal returns ofstocks sorted by last month’s news coverage and IR firm use. The table presentsalpha coefficients from four-factor regressions (using Mkt-Rf, SMB, HML, andUMD, taken from Ken French’s website). As in Fang and Peress (2009), me-dia coverage is split into high, low, and no coverage, based on the number ofarticles last month in U.S. daily newspapers, with high versus low coveragerelative to the median level of stocks that had at least one article that month.21
Panel A sorts companies according to whether they use an IR firm, Panel Bsorts companies according to whether they added an IR firm for the first timethat year, and Panel C sorts companies according to IR firm use excluding thosethat added an IR firm for the first time.
20 For value-weighted portfolios, IR firm clients have directionally negative but insignificant two-day earnings announcement returns of –1.1 basis points. The value-weighted two-day differencebetween IR and non-IR companies is 14.1 basis points, significant at the 5% level.
21 The choice of U.S. newspapers is designed to resemble the Fang and Peress (2009) tests,although the results are similar using other news sources.

630 The Journal of Finance R©
Table IXFour-Factor Alphas by News Level and IR Firm Use
This table shows four-factor alphas for companies split according to U.S. newspaper coverage andIR firm usage for U.S. publicly listed firms from January 2002 to December 2006. The coefficient isthe intercept from the regression of monthly excess stock returns on the Fama French three factorsplus momentum: excess market return, SMB, HML, and UMD. Panel A examines companies thatuse an IR firm. For the rows, “No IR Firm” refers to companies that did not use an IR firm thatyear, “IR Firm” to companies that used an IR firm that year, and “No IR − IR” to the difference.Panel B sorts on whether the company added an IR firm for the first time that year. Panel Csorts on whether companies used an IR firm, but excluding companies that added an IR firm forthe first time from the “IR Firm” category. The columns divide companies according to levels ofnews coverage—“No” refers to companies without any articles last month, “Low” and “High” tocompanies with at least one article last month, and are, respectively, below or above the medianof all companies with some coverage in newspapers last month, and “No-High” to the difference ofthe two categories. t-statistics are in parentheses, and ∗, ∗∗, and ∗∗∗ indicate statistical significanceat a 10%, 5%, and 1% levels, respectively.
News Level
All No Low High No-High
Panel A: All IR Firm Clients
No IR firm 0.528∗∗ 0.633∗∗ 0.176 −0.124 0.757∗∗∗(2.14) (2.34) (0.86) (−0.59) (2.62)
IR firm 0.175 0.173 0.137 0.132 0.041(1.20) (0.82) (0.68) (0.73) (0.17)
No IR − IR 0.203 0.301 −0.140 −0.217 –(1.32) (1.43) (−0.64) (−1.21) –
Panel B: Companies That Added an IR Firm for the First Time
No IR firm 0.518∗∗ 0.618∗∗ 0.216 −0.045 0.663∗∗(2.15) (2.33) (1.10) (−0.23) (0.40)
IR firm −0.617∗∗ −0.789∗∗ −0.529 −0.094 −0.695(−2.08) (−2.21) (−1.04) (−0.18) (−1.21)
No IR − IR 0.885∗∗∗ 1.150∗∗∗ 0.405 0.076 –(3.03) (3.35) (0.83) (0.15) –
Panel C: IR Firm Clients Other than Those Who Added an IR Firm for the First Time
No IR firm 0.510∗∗ 0.618∗∗ 0.161 −0.146 0.764∗∗∗(2.08) (2.29) (0.79) (−0.68) (2.64)
IR firm 0.272∗ 0.311 0.224 0.171 0.139(1.75) (1.36) (1.01) (0.93) (0.56)
No IR − IR 0.085 0.145 −0.245 −0.278 –(0.50) (0.61) (−0.99) (−1.41) –
Table IX offers very little support for the hypothesis that IR firm use low-ers expected returns.22 In Panel A, IR firm clients do not have significantly
22 If portfolios are value weighted, the differences in alphas by IR firm use are generally smallerand insignificant in all three panels. The results are also very similar if monthly characteristic-adjusted returns are used instead.
Selective Publicity and Stock Prices 631
different returns overall from other companies. This is consistent with the spinhypothesis, whereby positive spin is eventually reversed. In Panel B, compa-nies that add an IR firm for the first time have significantly lower alphas thanother companies, whereas the Merton (1987) hypothesis predicts higher re-turns in the short run. In Panel C, in years after first adding the IR firm, IRfirm clients show no significant differences in alphas, rather than significantlylower returns as under Merton (1987).
VII. Conclusion
In this paper, I provide evidence that media coverage affects the price re-sponse to news announcements. Greater coverage of positive news stories raisesinvestor expectations of future profitability, leading to price increases in theshort term and lower returns in the future around earnings announcements.My findings suggest that investors rely on the media to help them processinformation and decide which stories are economically important. With theproliferation of free online news services, the problem becomes deciding whichpress releases and articles to read in the limited time available. Media cover-age can help here by carrying an imprimatur of importance for a story. Greatercoverage of good news relative to bad news is thus interpreted as indicatingthat the good news is more economically significant.
The evidence in this paper also indicates that reporters and newspapersare not unbiased in their decisions about which stories to cover. Instead, theyare susceptible to influence by IR firms, who are able to increase the chancesof particular stories being covered. Moreover, this influence appears to oper-ate through the channel of personal connections between reporters and IRfirms. How exactly such incentives operate is an area that invites furtherresearch.
News coverage is also an avenue by which some managers attempt to influ-ence investor opinion. As a form of investor manipulation, it is quite attrac-tive. It is fairly low cost—the average client of an IR firm spends only around$474,000 per year on IR firm services.23 It is difficult to prove that a particularnewspaper report was due to IR firm influence, and the practice does not involvemanagers making any false or misleading statements. The association betweenIR firm use and management of reported earnings, such as earnings restate-ments and cuts to R&D expenditure as well as weak shareholder protection,suggests that manager myopia might partly explain IR firm use. Nonetheless,it is possible that firms obtain other benefits from the publicity that are notmeasured in stock returns (such as greater product recognition as part of amarketing effort). Given the low cost of IR firms, it is not possible to reject thehypothesis that IR firms pay for themselves or even add value, but not enoughto be visible in overall stock returns.
23 This assumes that the total fees due to IR are spread among all publicly listed clients of theIR firm–fees are only known at the aggregate IR firm-year level. This also counts companies thatuse multiple IR firms—the average company spends roughly $375,000 on each IR firm it uses.
632 The Journal of Finance R©
Finally, the predictable nature of the patterns in returns indicates that in-vestors are not incorporating publicly available information on IR firm us-age into prices. To the extent that returns around earnings announcementsare predictably lower for IR firm clients, investors ought to respond to thisearlier. The results in this paper suggest investors do not distinguish be-tween media coverage arising from IR influence and media coverage fromgeneral newsworthiness, and are surprised when hard information turnsout to be worse than expected. Investors, it appears, can be fooled, but notforever.
Appendix A: IR Firm Matching
For each year, I take IR firm and client information from the client lists inO’Dwyer’s Directory of Public Relations Firms. Since these lists do not includeclient identifiers and often give a general name for the company rather thanthe precise CRSP name (and client lists include many private companies),I hand match them with CRSP names of publicly listed firms. I use a textstring comparison to match each O’Dwyer’s name with the 50 closest CRSPnames, and for those without an exact match, any likely matches among the50 closest names are identified. Where possible, common abbreviations arehand matched separately (e.g., GE for General Electric, AAR for AmericanAirlines, etc.). Ambiguous names are resolved by internet search, and matchesare performed on a conservative basis, excluding cases in which a Google searchreveals multiple possible matches. I exclude client names that map to multiplepotential CRSP firms, as well as clients identified as regional branches orsubsidiaries of CRSP firms.
To distinguish between IR firms and non-IR public relations (PR) firms, Ionly exclude PR firms that show no evidence of doing IR work. PR firms areclassified as IR firms if in any sample year of the PR firm’s existence they listIR as one of their specialty areas (PR firms can nominate multiple areas ofspecialization) or the firm appears in the rankings of the top fees due to IRwork (the latter list includes total annual fees from IR work as low as $75,000per year, although not all PR companies disclose their fees).
Appendix B: Variable Definitions
Variable Description Definition
IRFirm IR firm dummy Dummy variable that equals one if the firm uses anIR firm that year
Lmktcapann Log market cap Log market capitalization, from December ofprevious year
Lmktcapnorm Log market cap,normalized
Log market capitalization, from previous month,normalized to mean of zero and standarddeviation of one
(continued)

Selective Publicity and Stock Prices 633
Appendix B—Continued
Variable Description Definition
Beta CAPM beta Coefficient from regression of excess stock returnson excess return on CRSP value-weighted index,using up to five years of monthly data
Lbm Log book-to-market ratio Log of (book value of equity/market value of equity)Mom Momentum Cumulative returns from 12 months ago to
two months ago (inclusive)Numanalysts Number of analysts Number of analysts who made an earnings per
share forecast in the previous yearTurnover Share turnover Monthly share volume divided by the number of
shares outstanding, averaged over the previouscalendar year
Institpctown Institutional ownership Fraction of the company’s shares held byinstitutions
Industry Industry dummies 48 dummy variables for industry, based on SICcodes and classifications in Fama and French(1997)
Hessad Heston and Sadka factor Heston and Sadka (2008) factor for returnperiodicity—the average return of the stock inthe same calendar month over the past five years
Retl1 Return last month Stock return in the previous monthAccruals Accounting accruals Earnings before extraordinary items and
discontinued operations less operating cash flows,scaled by total assets in the previous year (as inBarton and Simko (2002))
Randdcut Dummy for cuts to R&D A dummy variable that equals one if the companyhas lower R&D expenditure in the current yearthan in the previous year, and zero otherwise
SUE SUE, normalized SUE = eij−ei
t−4−δi√
V ar(eit )
where e is quarterly earnings and
δ is the expected drift in earnings, normalized bysubtracting the mean and dividing by thestandard deviation (see Section IV.C)
SUEPos SUE (when positive) Equal to SUE (normalized) when this is positive,and zero otherwise
SUENeg SUE (when negative) Equal to the absolute value of SUE (normalized)when SUE is negative, and zero otherwise
Subject Subject code dummies 150 dummy variables for press release subjectmatter, based on the most common Factivasubject codes
RetAdj Characteristic-adjustedreturn
Three-day stock return, minus return on a portfoliomatched on quintiles of market capitalization,book-to-market, and momentum
Appendix C: Effect of Internal IR Spending
One alternative to causation involves the role of internal IR spending. Hir-ing an external IR firm involves a make versus buy decision at the company,compared with spending more on in-house IR. It is possible that IR firm use is

634 The Journal of Finance R©
actually measuring variation in internal IR spending, and that this is drivingthe main results. To test this possibility, I construct several proxies for the com-pany’s level of internal IR operations, using the regularly structured contactinformation contained at the bottom of press releases. Typical examples looklike the following:
“/CONTACT: J. Roger Faherty, Chairman and Chief Executive Officer ofDirectrix, Inc., +1–212-XXX-XXXX, [email]@directrix.com/ 09:23 EDT”
“/CONTACT: Bob Schneider, Media Relations, +1–816-XXX-XXXX, or MarkBarnett, Investor Relations, +1–816-XXX-XXXX, both of H&R Block Inc./15:54EST”
Based on such entries, I construct three proxies for the level of internal IRoperations at the company:
1. A proxy for the number of contact persons, measured as the number oftimes the word “of ” and “both of ” appears in the document (to designatewhich group each person represents, since the word does not appear fre-quently in other contexts within the contact information);
2. A proxy for the number of categories of contacts offered, taken as themaximum of:
• The number of times the word “enquiries” appears (e.g., “Press En-quiries”);
• The number of times the word “relations” appears (e.g., “Investor Rela-tions”);
• The total number of times the words “media,” “investor,” and “analyst”appear (the most common categories listed);
3. A proxy for the number of contact details given, taken as the maximum of
• The number of email addresses, measured from the “@” character;• The number of phone numbers, measured from the “-” character (phone
numbers are usually listed as xxx-xxx-xxxx, after stripping out the “1-”that precedes some).
The three measures of internal IR operations are all fairly highly correlatedwith each other (between 0.51 and 0.72), but only weakly positively correlatedwith external IR firm use (between 0.03 and 0.08).
In Table C.I, I test whether the IR firm effects are sensitive to these measuresof internal IR operations. For both the earnings and non-earnings announce-ment returns, controlling for internal IR operations has very little effect on themain results, in either magnitude or significance. In non-earnings returns, theIR firm coefficient with the full set of internal IR controls is 0.117 (t-statisticof 3.08), versus 0.114 (t-statistic of 3.00) with no internal IR controls. Forearnings returns the IR firm coefficient with the full set of internal IR con-trols is –0.313 (t-statistic of –2.56), versus –0.336 (t-statistic of –2.74) with nocontrols. Measures of internal IR spending also do not show the same patternin returns as using an external IR firm. Internal IR is associated with lower
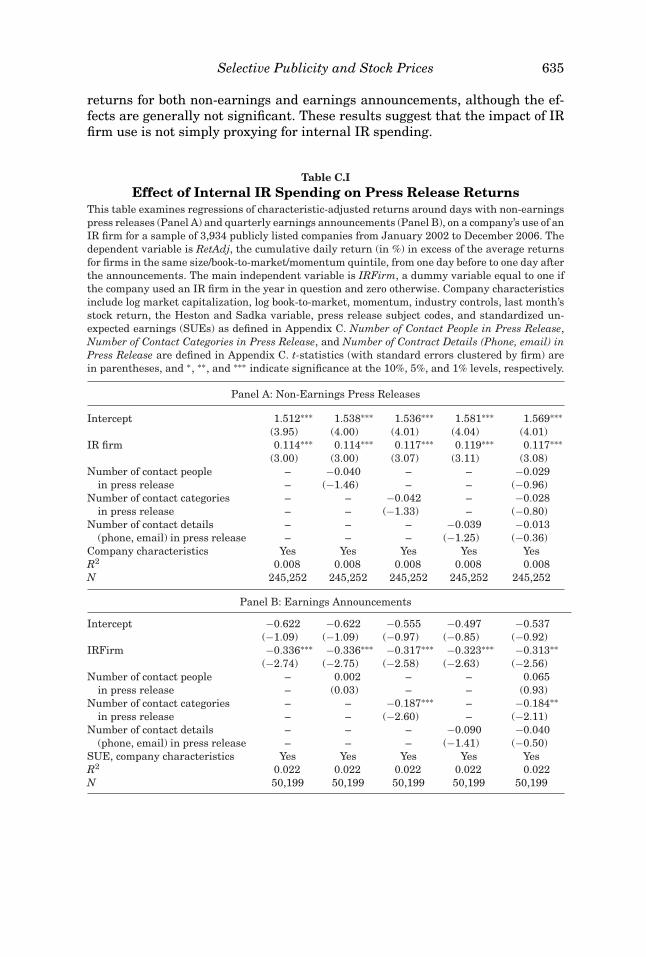
Selective Publicity and Stock Prices 635
returns for both non-earnings and earnings announcements, although the ef-fects are generally not significant. These results suggest that the impact of IRfirm use is not simply proxying for internal IR spending.
Table C.IEffect of Internal IR Spending on Press Release Returns
This table examines regressions of characteristic-adjusted returns around days with non-earningspress releases (Panel A) and quarterly earnings announcements (Panel B), on a company’s use of anIR firm for a sample of 3,934 publicly listed companies from January 2002 to December 2006. Thedependent variable is RetAdj, the cumulative daily return (in %) in excess of the average returnsfor firms in the same size/book-to-market/momentum quintile, from one day before to one day afterthe announcements. The main independent variable is IRFirm, a dummy variable equal to one ifthe company used an IR firm in the year in question and zero otherwise. Company characteristicsinclude log market capitalization, log book-to-market, momentum, industry controls, last month’sstock return, the Heston and Sadka variable, press release subject codes, and standardized un-expected earnings (SUEs) as defined in Appendix C. Number of Contact People in Press Release,Number of Contact Categories in Press Release, and Number of Contract Details (Phone, email) inPress Release are defined in Appendix C. t-statistics (with standard errors clustered by firm) arein parentheses, and ∗, ∗∗, and ∗∗∗ indicate significance at the 10%, 5%, and 1% levels, respectively.
Panel A: Non-Earnings Press Releases
Intercept 1.512∗∗∗ 1.538∗∗∗ 1.536∗∗∗ 1.581∗∗∗ 1.569∗∗∗(3.95) (4.00) (4.01) (4.04) (4.01)
IR firm 0.114∗∗∗ 0.114∗∗∗ 0.117∗∗∗ 0.119∗∗∗ 0.117∗∗∗(3.00) (3.00) (3.07) (3.11) (3.08)
Number of contact people – −0.040 – – −0.029in press release – (−1.46) – – (−0.96)
Number of contact categories – – −0.042 – −0.028in press release – – (−1.33) – (−0.80)
Number of contact details – – – −0.039 −0.013(phone, email) in press release – – – (−1.25) (−0.36)
Company characteristics Yes Yes Yes Yes YesR2 0.008 0.008 0.008 0.008 0.008N 245,252 245,252 245,252 245,252 245,252
Panel B: Earnings Announcements
Intercept −0.622 −0.622 −0.555 −0.497 −0.537(−1.09) (−1.09) (−0.97) (−0.85) (−0.92)
IRFirm −0.336∗∗∗ −0.336∗∗∗ −0.317∗∗∗ −0.323∗∗∗ −0.313∗∗(−2.74) (−2.75) (−2.58) (−2.63) (−2.56)
Number of contact people – 0.002 – – 0.065in press release – (0.03) – – (0.93)
Number of contact categories – – −0.187∗∗∗ – −0.184∗∗in press release – – (−2.60) – (−2.11)
Number of contact details – – – −0.090 −0.040(phone, email) in press release – – – (−1.41) (−0.50)
SUE, company characteristics Yes Yes Yes Yes YesR2 0.022 0.022 0.022 0.022 0.022N 50,199 50,199 50,199 50,199 50,199

636 The Journal of Finance R©
REFERENCESBall, Ray, and S. P. Kothari, 1991, Security returns around earnings announcements, The Account-
ing Review 66, 718–738.Barton, Jan, and Paul J. Simko, 2002, The balance sheet as an earnings management constraint,
The Accounting Review 77, 1–27.Beaver, William H., 1968, The information content of annual earnings announcements, Journal of
Accounting Research 6, 67–92.Bernard, Victor L., and Jacob K. Thomas, 1990, Evidence that stock prices do not fully reflect the
implications of current earnings for future earnings, Journal of Accounting and Economics 13,305–340.
Brennan, Michael J., and Claudia Tamarowski, 2000, Investor relations, liquidity, and stock prices,Journal of Applied Corporate Finance 12, 26–37.
Burgstahler, David, and Ilia D. Dichev, 1997, Earnings management to avoid earnings decreasesand losses, Journal of Accounting and Economics 24, 99–126.
Bushee, Brian J., and Gregory S. Miller, 2007, Investor relations, firm visibility, and investorfollowing, Working paper, The Wharton School, University of Pennsylvania.
Cameron, A. Colin, Jonah B. Gelbach, and Douglas L. Miller, 2006, Robust inference with multi-way clustering, NBER Technical Working paper No. 327.
Chan, Wesley S., 2003, Stock price reaction to news and no-news: Drift and reversal after headlines,Journal of Financial Economics 70, 223–260.
Chang, Millicent, Patrick Murphy, and Marvin Wee, 2006, An investigation into the impact ofinvestor relations on the profitability of director share trading, Working paper, The Universityof Western Australia.
Collins, Denton, Adi Masli, Austin L. Reitenga, and Juan M. Sanchez, 2008, Earnings restatements,SOX and the disciplining of CFOs, Working paper, University of Arkansas.
D’Souza, Julia, and Sean Wang, 2006, Earnings management: The effect of accounting flexibilityon R&D investment choices, Working paper, Johnson School, Cornell University.
Daniel, Kent, Mark Grinblatt, Sheridan Titman, and Russ Wermers, 1997, Measuring mutual fundperformance with characteristic-based benchmarks, Journal of Finance 52, 1035–1058.
Dechow, Patricia M., Richard G. Sloan, and Amy Sweeney, 1995, Detecting earnings management,The Accounting Review 70, 193–226.
Degeorge, Francois, Jayendu Patel, and Richard Zeckhauser, 1999, Earnings management to ex-ceed thresholds, Journal of Business 72, 1–33.
DellaVigna, Stefano, and Joshua Pollet, 2009, Investor inattention and Friday earnings announce-ments, Journal of Finance 64, 709–749.
Dyck, Alexander, and Luigi Zingales, 2003, The media and asset prices, Working paper, Universityof Chicago Booth School of Business.
Engelberg, Joseph, 2008, Costly information processing: Evidence from earnings announcements,Working Paper, University of California San Diego.
Engelberg, Joseph, and Christopher A. Parsons, 2011, The causal impact of media in financialmarkets, Journal of Finance 66, 67–97.
Fama, Eugene F., and Kenneth R. French, 1997, Industry costs of equity, Journal of FinancialEconomics 43, 153–193.
Fang, Lily H., and Joel Peress, 2009, Media coverage and the cross-section of stock returns, Journalof Finance 64, 2023–2052.
Foster, George, 1977, Quarterly accounting data: Time series properties and predictive-abilityresults, The Accounting Review 52, 1–21.
Frazzini, Andrea, and Owen Lamont, 2006, The earnings announcement premium and tradingvolume, NBER Working Paper Series no. 13090.
Gompers, Paul A., Joy L. Ishii, and Andrew Metrick, 2003, Corporate governance and equity prices,The Quarterly Journal of Economics 118, 107–155.
Graham, John R., Campbell R. Harvey, and Shiva Rajgopal, 2005, The economic implications ofcorporate financial reporting, Journal of Accounting and Economics 40, 3–73.

Selective Publicity and Stock Prices 637
Gurun, Umit G., and Alexander W. Butler, 2012, Don’t believe the hype: Local media slant, localadvertising and firm value, Journal of Finance 67, 561–597.
Guttman, Ilan, Ohad Kadan, and Eugene Kandel, 2006, A rational expectations theory of the kinkin earnings reports, The Accounting Review 81, 811–848.
Heston, Steve L., and Ronnie Sadka, 2008, Seasonality in the cross-section of stock returns, Journalof Financial Economics 87, 418–445.
Hirshleifer, David, Sonya Seongyeon Lim, and Siew Hong Teoh, 2009, Driven to distraction: Ex-traneous events and underreaction to earnings news, Journal of Finance 64, 2289–2325.
Hirshleifer, David, and Siew Hong Teoh, 2003, Limited attention, information disclosure, andfinancial reporting, Journal of Accounting and Economics 36, 337–386.
Hong, Harrison, and Ming Huang, 2005, Talking up liquidity: Insider trading and investor rela-tions, Journal of Financial Intermediation 14, 1–31.
Hong, Harrison, Terrence Lim, and Jeremy C. Stein, 2000, Bad news travels slowly: Size, analystcoverage, and the profitability of momentum strategies, Journal of Finance 55, 265–295.
Loughran, Tim, and Bill McDonald, 2010, When is a liability not a liability? Textual analysis,dictionaries, and 10.ks, Journal of Finance 66, 35–65.
Merton, Robert C., 1987, A simple model of capital market equilibrium with incomplete informa-tion, Journal of Finance 42, 483–510.
Richardson, Scott, Irem Tuna, and Min Wu, 2002, Predicting earnings management: The case ofearnings restatements, Working paper, London Business School.
Shanthikumar, Devin, 2004, Small and large trades around earnings announcements: Does trad-ing behavior explain post-earnings-announcement drift? Working paper, The University ofCalifornia, Irvine.
Sloan, Richard G., 1996, Do stock prices fully reflect information in accruals and cash flows aboutfuture earnings? The Accounting Review 71, 289–315.
Solomon, David H., Eugene F. Soltes, and Denis Sosyura, 2011, Winners in the spotlight: Mediacoverage as a driver of return chasing, Working paper, University of Southern California.
Soltes, Eugene F., 2008, News dissemination and the impact of the business press, Working paper,Harvard Business School.
Teoh, Siew Hong, Ivo Welch, and T.J. Wong, 1998, Earnings management and the long-run marketperformance of initial public offerings, Journal of Finance 53, 1935–1974.
Tetlock, Paul C., 2007, Giving content to investor sentiment: The role of media in the stock market,Journal of Finance 62, 1139–1168.
Tetlock, Paul C., Maytal Saar-Tsechansky, and Sofus Macskassy, 2008, More than words: Quanti-fying language to measure firms’ fundamentals, Journal of Finance 63, 1437–1467.