selection in finite populations. 11. the selection limit and rate of
TRANSCRIPT

SELECTION IN FINITE POPULATIONS. 11. THE SELECTION LIMIT AND RATE OF RESPONSE FOR A MONTE CARLO
SIMULATION MODEL1
PHILIP W. HEDRICKZ
Department of Biology, University of Chicago
Received September 10, 1969
K I M U R A (1957) developed a general theory to give the probability of fixation of a favorable allele in a finite population based on a single locus, two allele
model. By assuming no linkage or epistatic interactions between loci, ROBERTSON (1960) extended the single-locus theory to predict the limits to directional selec- tion. At the present time there is no general solution for multilocus systems in which there is linkage or epistasis. In order to investigate the effects of linkage and epistasis on the selection limit, a number of workers have employed com- puter simulation (GILL 1965; YOUNG 1967; QURESHI and KEMPTHORNE 1968).
In a series of papers, LATTER examined a two locus system where the genes had an additive effect on the selected trait. The two loci were in initial linkage equi- librium and several intensities of linkage were studied. LATTER (1965b) found that with no linkage (c=.5) between the two loci that the selection limit was generally close to the probability of fixation as given by u(q) (KIMURA 1957).
- (1) e-2Nss(zh-1) (l-+)-zNsr dz I:
= 1: e - 2 ~ 8 ~ ( 2 h - 1 ) (1-s)-2Ns2 dx where go is the initial gene frequency of the favorable allele A, N is the effective population size, and the relative fitnesses of the genotypes AA, Aa, and aa are 1 +s, 1 +hs, and 1, respectively. But when the population size was small and s was large, LATTER found that his simulated selection limit was lower than the pre- diction given by U (4).
With tight linkage (cl .05) between two loci of the same initial gene frequency and of equal gene effect, LATTER observed that linkage reduced the selection limit most when
HILL and ROBERTSON (1966) also examined a two locus system where the genes had additive action. The loci were assumed to be in initial linkage equilibrium. They observed the greatest reduction in gene frequency response with tight linkage when the loci had a low initial gene frequency and large, equal effects.
1 Adapted from a thesis presented in partial fulfillment of the Ph.D. degree at the University of Minnesota. The investigation was supported by P.H.S. Grants GM-3090-12 and GM-01156-06.
Present address. Department of Systematics and Ecology, University of Kansas, Lawrence, Kansas.
Genetics 65: 175-186 May 1970.
Dow
nloaded from https://academ
ic.oup.com/genetics/article/65/1/175/5989858 by guest on 29 D
ecember 2021

176 P H I L I P W. HEDRICK
Both LATTER and HILL and ROBERTSON observed that linkage reduced the time to half of the gene frequency response (half-life). With tight linkage and low initial gene frequency, LATTER found that the time to 95 % of the gene frequency response was dramatically increased. HILL and ROBERTSON also stated that response continued for two intermediate recombination levels (c = .I25 and .03125) after response had ceased for the complete linkage and no-linkage cases.
The first objective of this investigation was to examine the accuracy with which u(q) predicts the selection limit for genes of additive, dominant and recessive gene action in a genetic system of thirty chromosomes, each with two loci. Selection limit results obtained using a transition matrix approach and the estimated effective population size were used to interpret these findings. The second aspect of the investigation compared the simulated rate of gene frequency response in terms of half-life time to the expected rate computed from matrix iteration. The effect of complete linkage between the pairs of loci on the selection limit and the rate of gene frequency response was also studied.
MODEL A N D METHODS
The genetic system simulated in this study is that of directional selection for a quantitative trait. Sixty loci contributed to the quantitative character such that the phenotypic value for any individual was
P = Y i + e
with the values of yi being 2u, ufau, or zero depending on whether the genotype at the i-th locus was AA, Aa, or aa. The environmental effect, e, was random relative to the genotypic value and was normally distributed. The genotypic variance changed as the gene frequency changed by selection but the phenotypic variance was kept constant throughout an experiment by making the required adjustments in the environmental variance. There was no interaction between the different loci, i.e., no epistasis.
The loci were arranged into thirty chromosomes, each with two loci and there were two alleles per locus. All the loci had the same genotypic values and expected initial gene frequency in a given experiment. The linkage between the two loci on a chromosome was either complete (c=O) or absent (c=.5). The experiments included all combinations of six initial gene fre- quencies, three degrees of dominance, three levels of gene effects and the two linkage intensities. Each experiment was replicated ten times when all sixty loci contributed to the genotypic value and fifteen times in a few cases where only forty loci were used.
In all the experiments sixty individuals were randomly drawn from a conceptually infinite base population to form the zero generation. This generation was assumed to be in linkage equilibrium. Then the twenty individuals with the highest phenotypic values were selected to be the parents of the first generation. The parents were randomly ordered and adjacent individuals in the array were pair mated. Sixty progeny were generated so that every parental pair had an equal probability of being the parents for any individual. The twenty progeny with the highest phenotypic value were selected as parents for the next generation, and so on.
Since it was impractical to continue selection until all sixty loci were f ied , the experiments were terminated ten generations after the expected time needed for three-quarters of the gene frequency response. At t h i s point in all the cases with no linkage and the runs with complete linkage and recessive gene action, the loci still segregating were assigned to one of the two fixed- gene classes. The proportions of the loci added to the favorable and unfavorable classes were calculated from u(q) using the gene frequency in the terminal generation. After the segregating loci were assigned to terminal classes, the proportion of loci in the favorable fixed class was defined as the selection limit, qr.
60
i=1
Dow
nloaded from https://academ
ic.oup.com/genetics/article/65/1/175/5989858 by guest on 29 D
ecember 2021

SELECTION I N FINITE POPULATIONS. 11. 177
A different approach was used to estimate the selection limit in the runs with complete linkage when the genes were either dominant or additive. The logic of this approach was based on two observations. First of all, the number of loci segregating at the termination of the e x P S - ments was less when there was complete linkage than when there was no linkage. Secondly, the gene frequencies of the segregating loci for the complete linkage runs were consistently less than for the no-linkage runs. Based on these observations and realizing that u(q) increases as q increases, the expected difference in the selection limit between the complete and no-linkage cases would be greater than the difference in gene frequency observed in the final generation of the experiment. Therefore, for dominance and additivity, the difference in the gene frequency for the two linkage intensities in the last generation of the experiment was used as the measure of the linkage effect. For recessive genes, the effect of linkage was measured by the difference in the selection limits for the complete and no-linkage runs.
Using qf - qo as the gene frequency response for all the no-linkage cases and complete linkage with recessive gene action runs, the times to one-half and three-quarters of the average gene frequency response were found. For linkage with dominance or additivity, in order to compute the half and three-quarters lives, the selection limit was defined as the selection limit with no linkage minus the difference in gene frequency at the end of the experiment between the two intensities of linkage. Since this is a maximum estimate of the selection limit for the no-linkage runs the gene frequency at half or three-quarters life and the time to half or three quarters life are also maximum values.
The simulation parameters were set up so that the simulated results could be compared to thexetical values of the selection limit and the rate of response. To do this the expected selective value was calculated using the expression, s = &iu/op (HALDANE 1931) where i is the intensity of selection (standardized selection differential), U is half the difference in genoyptic value between the two homozygotes, and up is the phenotypic standard deviation. The expected POW- lation size was computed as the number of parents plus one-half (WRIGHT 1931). WRIGHT’S approximation excludes the possibility of self-fertilization and assumes there is no selection. Equivalent levels of dominance for the simulated model and the theoretical model are a = 0 and h = 1/2 for additivity, a = 1 and h = 1 for dominance, and a = - 1 and h = 0 for recessivity.
RESULTS
(i) Selection limit: What is the validity of using u ( q ) to predict the average selection limit of unlinked loci in a multilocus system? As an attempt to answer this question a comparison between the simulated selection limit and ~ ( q ) was made in Table 1 for the percent difference in response
u(s ) -9r 100 U(9) -qo
and the absolute difference u ( q ) -qf. Generally U ( 4 ) was within one standard error of the simulated selection limit
with Nsz2.05 (the SE of qf between replications ranged from .012 to .026 and the binomial SE from .007 to .020). For dominance there were several instances when the probability of fixation was more than one standard error greater than the selection limit. With the larger Ns values, the agreement of qf and ~ ( q ) was not as good. In general for these runs the percent difference (reduction) in re- sponse was greatest for low gene frequencies and for recessive gene action. In nine cases this reduction in response exceeded twenty percent.
In an effort to find the reason for this reduction in response, the selection limit obtained from transition matrix iteration and an estimate of the effective population size were used. The transition matrix selection limits were taken
Dow
nloaded from https://academ
ic.oup.com/genetics/article/65/1/175/5989858 by guest on 29 D
ecember 2021

178 PHILIP W. HEDRICK
TABLE 1
The percent and actual (in parentheses) diflerence between the probability of fixation, u(q), and the selection limit, qf, for c = .5
Additive Dominant Recessive Qa
.0625 ,125 .25 .375 .5 .75
.0625
.I25
.25
.375
.5
.75
.0625 ,125 .25 .375 .5 .75
-3.5 (.006) .o (.OOo)
1.5 (.006) -5.4 (.ow) -2.1 (.008) -4.1 (.009)
19.8 (.067) 12.2 (.063) 8.4 (.052) 3.6 (.021) 4.6 (.022) .8 (.002)
27.8 (.l61)1 23.7 (.177)
7.5 (.055)2 5.8 (.036) 1.0 (.005) .o (.OOO)
Ns = 2.05 .4 (.OM)
8.4 (.035) 8.4 (.043) 4.9 (.024)
.5 (.002)
.o (.OW)
Ns = 4.1 17.2 (.092) 15.2 (.107) 7.0 (.050)3 3.1 (.019) .4 (.002) .4 (.001)
Ns = 8.2 21.6 (.171)4
8.6 (.073) 2.1 (.016)+
.o (.OW)+
.o (.OOO)+
.o (.OOO)
11.2 (.OW) -3.2 (.005)
3.6 (.010) 8.1 (.028) 9.4 (.033)
-3.2 (.007)
13.7 (.019) 24.8 (.065)5
16.9 (.084) 12.7 (.058)
22.1 (.097)
.o (.WO)
20.7 (.046)6 41.4 (.166) 44.6 (.267) 7
21.2 (.126)+ 17.3 (.086)+
.o (000)t
t 40 loci affecting character Effective population size calculated for the seven experiments indicated by superscripts
I . . .7 (Table2)
from a model in which the expected gene frequency after one generation was
(3) as in method B of HEDRICK (1970). The initial vector of gene frequency distribu- tion, Yo, though was given by
(4) where Pi is the probability of i favorable genes when the initial gene frequency is qo. The limit given by this approach should be closer to the simulated selection limit than ~ ( q ) since it uses a better approximation of gene frequency change and takes into account sampling variation in the initial number of favorable alleles at a locus.
The probability of fixation is directly dependent on population size, so that a reduction in the population size would decrease U (9). Assuming that the effective population size was twenty and one-half would cause an overestimate in u ( q ) if the population size was actually less. To find out what the effective population size actually was for several runs, it was calculated from the average inbreeding coefficient. The relationship used in this computation was
q ' = q + s q ( l - q ) [ h + (1 - 2 h ) q ] / [l + s q 2 + 2 h s q ( l - q ) ]
Pc = (2;) (qo) i (1 - q o ) 2 N - i
1 -Fx= (1 - (1/2N))" ( 1 - F o ) ( 5 )
Dow
nloaded from https://academ
ic.oup.com/genetics/article/65/1/175/5989858 by guest on 29 D
ecember 2021

SELECTION I N FINITE POPULATIONS. 11.
TABLE 2
The efective population size, N, and the expected reduction from u(q) where the population size was assumed to be 20.5 due to N and from matrix
iteration. The ratio of observed response to the expected response is given in the right-hand column
179
Reduction from u(q) Model
(see Table 1) N N Matnx Expected Ratio
I 17.7 .057 .093 .150 9 7 2 16.9 .017 .025 .042 .99 3 18.1 ,022 .039 .061 1.01 4 18.3 .037 .144 .181 1.02 5 17.5 ,030 ,013 .043 .88 6 14.0 ,099 .012 ,061 1.10 7 8.2 .214 .036 .250 .89
where F, is the inbreeding coefficient in the x-th generation, F, is the inbreeding coefficient in the zero generation (assumed to be zero), and N is the effective population size (FALCONER 1960). The inbreeding coefficient for each generation was computed from the pedigree of each individual in that generation. The ex- pression ln(1 - F E ) = bx was fitted from t , the second generation, to T which was approximately the number of generations to half the gene frequency re- sponse. Then by setting b = ln(1 - (1/2N)) and solving for N , an estimate of the effective population size was found.
The effective population size was calculated for the seven experiments indi- cated by superscripts in Table 1. The effective size and the reduction in the probability of fixation expected because of the reduction in the population size are given in Table 2. The largest reduction in population size was seen for recessive genes with large effect (Experiments 6 and 7). For the other experi- ments, the reduction in population size was no greater than four. On the other hand, the differences accounted for by the matrix iteration were generally great- est in the dominant and additive cases (Experiments 1-4). An expected amount of reduction from u ( q ) was computed by summing the effects of the reduced population size and those accounted for by the matrix iteration. The ratio of the observed response over the expected response,
O ( q t ) - 4 0 E(qf) -go ’
is given in the last column of Table 2. For all the models the ratio is close to unity and particularly for the additive and dominant cases, models 1-4.
All fifty-four combinations of dominance, initial gene frequency and gene effect were also run with complete linkage between the two loci on each chromo- some. For all these runs the same initial arrays of gametes as in the corresponding no-linkage case were used. As a measure of the effect of linkage on the selection limit for additive or dominant genes, the absolute difference in gene frequency response in the last generation for the two intensities of linkage is given in Table 3. For recessive genes the difference in the selection limit and the percent
Dow
nloaded from https://academ
ic.oup.com/genetics/article/65/1/175/5989858 by guest on 29 D
ecember 2021

180 P H I L I P W. HEDRICK
TABLE 3
The percent and actual (in parentheses) difference between the selection limits with c = .5 and the selection limit with c = 0
4 n Additive Dominant Recessive
,0625 .I25 .25 .375 .5 .75
,0625 ,125 .25 ,375 .5 .75
,0625 .I25 .25 .375 .5 .75
29.9 (.029)
19.4 (.058) 9.4 (.036)
10.7 (.033) 7.4 (.014)
19.9 (.W)
7.2 (.018) 7.0 (.027)
6.6 (.027)
3.1 (.007)
18.0 (.089)
.9 (.003)
13.7 (.055) 17.3 (.097) 18.8 (.123) 6.1 (.035) 5.5 (.027)
.0 (.Ooo)
Ns = 2.05 18.9 (.039) 11.8 (.037) 11.7 (.04+) 6.8 (.025)
14.5 (.050) 1.6 (.003)
Ns = 4.1 19.2 (.068) 8.9 (.040)
21.1 (.115) 8.5 (.043)
2.8 (.006) 9.9 (.041)
Ns = 8.2 22.3 (.125) 22.3 (.168) 18.6 (.119)
2.3 (.010) 7.5 (.@MI)
0.0 (.WO)
3.4 (.006) 5.9 (.016)
17.2 (.046)
-5.3 (.018) 1.3 (.003)
-1.8 (.006)
.8 (.001) -3.5 (.007)
18.1 (.062) 7.5 (.031) 9.2 (.046) .0 (.000)
13.3 (.023) -3.6 (.COS)
7.8 (.026) 11.6 (.054)
-3.2 (.013) .0 (.000)
difference in total gene frequency response for the two linkage intensities are given.
With additivity or dominance, the percent reduction was generally greatest at low initial gene frequencies. In several instances the reduction was twenty percent or greater. For recessive genes the reduction due to linkage was generally less than for additive or dominant genes. The largest reduction for recessive genes was generally also at a low initial gene frequency.
(ii) Rate of gene frequency response: In Figures 1,2, and 3 the times for half the gene frequency response observed in the simulation runs are compared to the half-life times computed from matrix iteration (as above). The solid lines repre- sent the time to half of the gene frequency response, 1/2(qf - qo), for matrix iteration corresponding to a population size of twenty. The circles indicate the time to half of the simulated gene frequency response when there is no linkage. With linkage and dominance or additivity, the maximum (as defined in METH-
ODS) half-life is represented as triangles. For recessive genes and linkage, the triangles indicate the time to half the observed gene frequency response.
The time to half-life with independent assortment in the simulated system was longer in every case than that calculated using matrix iteration. The average increase in time to half-life for all three levels of dominance was approximately three generations. With complete linkage and dominance or additivity, the maxi-
Dow
nloaded from https://academ
ic.oup.com/genetics/article/65/1/175/5989858 by guest on 29 D
ecember 2021

SELECTION I N FINITE POPULATIONS. 11. 181
2N
1.5 N
UI Y
'i" ;;i Y
I:
.5N
.I 1 I I I I I I I 1 I
.4 .6 .8 1 .o .2
FIGURE 1.-The time in generations to the half-life of gene frequency response for additive gene action for Ns equal to 2, 4, and 8; solid lines, transition matrix; circles, simulation with c =.5; triangles, simulation with c = 0.
mum half-life was almost always less than for independent assortment. This difference increased as Ns became larger, particularly at low initial gene fre- quencies. For recessive genes and linkage, the decrease in half-life time from independent assortment was also largest at low initial gene frequencies and high Ns values. The times for three-quarters of the response for both linkage and no linkage showed much the same trends.
Dow
nloaded from https://academ
ic.oup.com/genetics/article/65/1/175/5989858 by guest on 29 D
ecember 2021

182 P H I L I P W. HEDRICK
N
1.5N
Ly y. - 7 N
a U 4
I
.5N
I I I I I I I I I 1 .2 .4 .6 .8 1.0
OO FIGURE 2.-A Figure 1 but for dominant gene action.
DISCUSSION
There was apparent agreement between the selection limit for no linkage and the probability of fixation when N s was small. The values at the actual limit may not actually be as close to ~ ( q ) as those indicated since Q? was partially deter- mined using U (Q) . Since the simulation model differed from the model used for ~ ( q ) in several ways that lower the selection limit, using u(q) to find qf would increase the selection limit above its actual value. On the other hand, it should be noted that the formula
Dow
nloaded from https://academ
ic.oup.com/genetics/article/65/1/175/5989858 by guest on 29 D
ecember 2021

SELECTION I N FINITE POPULATIONS. 11. 183
N
1.5 N
Ly Y I
7 N Y II
U I
.5 N
-
i
I I I I I I I I I I .2 .4 .6 .8 1.0
FIGURE 3.-As Figure 1 but for recessive gene action.
s = 2iu/ap is not exact and that the error resulting from it increases as the gene effect,
increases (LATTER 1965a). For the largest gene effect ( .30) used in this study, though, the error is between two and three percent.
2 U / %
Dow
nloaded from https://academ
ic.oup.com/genetics/article/65/1/175/5989858 by guest on 29 D
ecember 2021
184 PHILIP W. HEDRICK
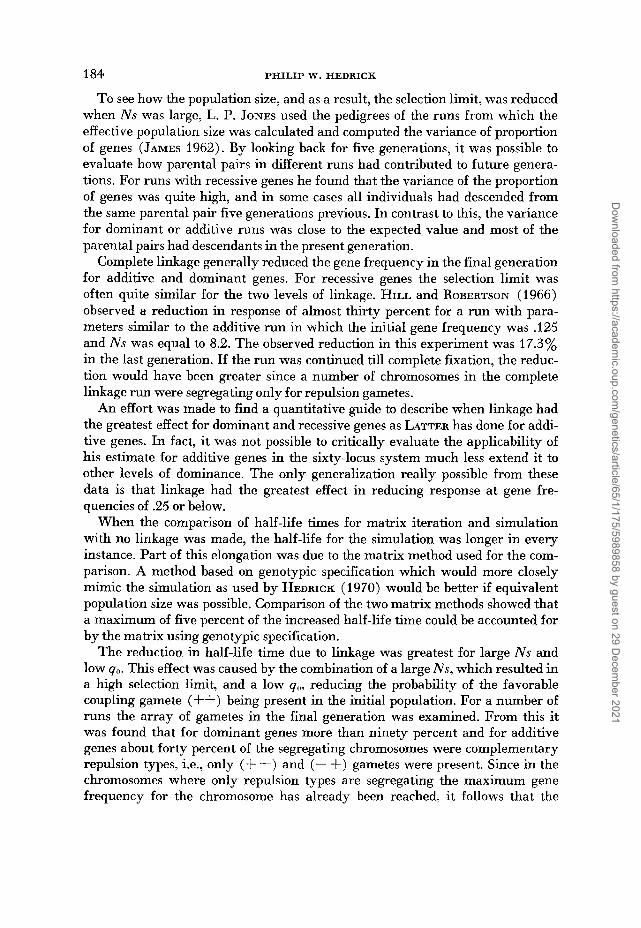
To see how the population size, and as a result, the selection limit, was reduced when Ns was large, L. P. JONES used the pedigrees of the runs from which the effective population size was calculated and computed the variance of proportion of genes (JAMES 1962). By looking back for five generations, it was possible to evaluate how parental pairs in different runs had contributed to future genera- tions. For runs with recessive genes he found that the variance of the proportion of genes was quite high, and in some cases all individuals had descended from the same parental pair five generations previous. In contrast to this, the variance for dominant or additive runs was close to the expected value and most of the parental pairs had descendants in the present generation.
Complete linkage generally reduced the gene frequency in the final generation for additive and dominant genes. For recessive genes the selection limit was often quite similar for the two levels of linkage. HILL and ROBERTSON (1966) observed a reduction in response of almost thirty percent for a run with para- meters similar to the additive run in which the initial gene frequency was .125 and Ns was equal to 8.2. The observed reduction in this experiment was 17.3% in the last generation. If the run was continued till complete fixation, the reduc- tion would have been greater since a number of chromosomes in the complete linkage run were segregating only for repulsion gametes.
An effort was made to find a quantitative guide to describe when linkage had the greatest effect for dominant and recessive genes as LATTER has done for addi- tive genes. In fact, it was not possible to critically evaluate the applicability of his estimate for additive genes in the sixty-locus system much less extend it to other levels of dominance. The only generalization really possible from these data is that linkage had the greatest effect in reducing response at gene fre- quencies of .25 or below.
When the comparison of half-life times for matrix iteration and simulation with no linkage was made, the half-life for the simulation was longer in every instance. Part of this elongation was due to the matrix method used for the com- parison. A method based on genotypic specification which would more closely mimic the simulation as used by HEDRICK (1970) would be better if equivalent population size was possible. Comparison of the two matrix methods showed that a maximum of five percent of the increased half-life time could be accounted for by the matrix using genotypic specification.
The reduction in half-life time due to linkage was greatest for large N s and low go. This effect was caused by the combination of a large Ns, which resulted in a high selection limit, and a low go, reducing the probability of the favorable coupling gamete (+-I-) being present in the initial population. For a number of runs the array of gametes in the final generation was examined. From this it was found that for dominant genes more than ninety percent and for additive genes about forty percent of the segregating chromosomes were complementary repulsion types, i.e., only (+ -) and (- +) gametes were present. Since in the chromosomes where only repulsion types are segregating the maximum gene frequency for the chromosome has already been reached, it follows that the
Dow
nloaded from https://academ
ic.oup.com/genetics/article/65/1/175/5989858 by guest on 29 D
ecember 2021

SELECTION I N FINITE POPULATIONS. 11. 185
reduction in half-life due to linkage was actually greater than given in Figure 2 for dominant genes and somewhat larger than given in Figure 1 for additive genes.
LATTER (1966) found that tight linkage between two additive loci of equal effects with a low qo had an extended period of response. This effect was attributed to a period of segregation of the two repulsion types, (- +) and (4- -), until an effective crossover produced a (4- +) gamete and a period of late response. The high proportion of repulsion segregants observed in both the additive and dominant runs here indicates a potential for prolonged response if the recom- bination fraction was very small. HILL and ROBERTSON (1966) have suggested that LATTER’S observations may be applicable only to the special case where the gene effects at the two loci are quite similar. When there is dominance and the segregation of only the two repulsion types, a situation of pseudo-overdominance exists. The two loci could be quite different in effect and their segregation still maintained by the force of selection. With a large population size, segregation for an indefinite period of time could occur while waiting for the effective cross- over event.
I wish to thank L. P. JONES and R. E. COMSTOCK for their assistance and encouragement dur- ing the investigation and Dr. COMSTOCX for his thorough reading of the manuscript. The com- ments of W. G. HILL and B. D. H. LATTER on the manuscript were very helpful.
SUMMARY
The probability of fixation of a favorable allele as given by u(q) (KIMURA 1957) was close to results simulated for a system of thirty chromosomes, each with two loci when there was a selective value of . I for all loci and no linkage. With a selective value of .2 or .4, the simulated selection limit was lower than the u(q ) value. This difference was accounted for by computing an estimate of the effective population size and by the reduction expected from a transition matrix approach (HEDRICK 1970). The effect of complete linkage on the response was most pronounced at low initial gene frequencies. Linkage did not reduce the response as much for recessive genes as for dominant or additive genes.-The time to half of the gene frequency response was somewhat higher for the simu- lated results than for the matrix iteration. Part of this difference can be attributed to the matrix method used. The time to half-life was reduced greatly with com- plete linkage when there was a low initial gene frequency and a high Ns value. It is suggested that a low recombination level may lengthen the response time, particularly for dominant genes.
LITERATURE CITED
FALCONER, D. S., 1960 GILL, J. L., 1965
18: 1171-1187. HALDANE, J. B. S., 1931
Introduction to Quantitative Genetics. Ronald Press, New York. Selection and linkage in simulated genetic populations. Australian J. Biol. Sci.
A mathematical theory of natural and artificial selection. VII. Selection intensity as a function of mortality rate. Proc. Cambridge Phil. Soc. 27: 131-136.
Dow
nloaded from https://academ
ic.oup.com/genetics/article/65/1/175/5989858 by guest on 29 D
ecember 2021
186 PHILIP W. HEDRICK
HEDRICK, P. W., 1970 Selection in finite populations. I. The probability of fixation and rate of
HILL, W. G. and A. ROBERTSON, 1966 The effect of linkage on limits to artificial selection.
KIMURA, M., 1957 Some problems of stochastic processes in genetics. Ann. Math. Statist. 28: 882-901.
JAMES, J. W., 1962 The spread of genes in random mating control populations. Genet. Res. 3: 1-10.
LATTER, B. D. H., 1965a The response to artificial selection due to autosomal genes of large effect. I. Changes in gene frequency at an additive locus. Australian J. Biol. Sci. :18 585-598. -, The response to artificial selection due to autosomal genes of large effect. 11. The effects of linkage on limits to selection in finite populations. Australian J. Biol Sci. 18: 1009-1023. -, 1966 The response to artificial selection due to autosomal genes of large effect. 111. The effects of linkage on the rate of advance and approach to fixation in finite populations. Australian J. Biol. Sci. 19: 131-146.
On the fixation of genes of large effects due to con- tinued transaction selection in small populations of polygenic systems with linkage. Theoret. Appl. Genetics 38: 24.9-255.
ROBERTSON, A., 1960 A theory of limits in artificial selection. Proc. Royal Soc. London B 153: 236249.
WRIGHT. S., 1931 YOUNG, S. S. Y., 1967 Computer simulation of directional selection in large populations. 11. The
response using transition matrix iteration. Genetics 65 : 157-173.
Genet. Res. 8: 269-294.
1965b
QURESHI, A. W. and 0. KEMPTHORNE, 1968
Evolution in Mendelian populations. Genetics 16: 97-159.
additive x additive and mixed models. Genetics 56: 73-87.
Dow
nloaded from https://academ
ic.oup.com/genetics/article/65/1/175/5989858 by guest on 29 D
ecember 2021