selection by simulation : a work sample approach to the ... · selection by simulation a work...
TRANSCRIPT

Selection by simulation : a work sample approach to theselection of process operatorsRidderbos, A.
DOI:10.6100/IR384913
Published: 01/01/1992
Document VersionPublisher’s PDF, also known as Version of Record (includes final page, issue and volume numbers)
Please check the document version of this publication:
• A submitted manuscript is the author's version of the article upon submission and before peer-review. There can be important differencesbetween the submitted version and the official published version of record. People interested in the research are advised to contact theauthor for the final version of the publication, or visit the DOI to the publisher's website.• The final author version and the galley proof are versions of the publication after peer review.• The final published version features the final layout of the paper including the volume, issue and page numbers.
Link to publication
Citation for published version (APA):Ridderbos, A. (1992). Selection by simulation : a work sample approach to the selection of process operatorsEindhoven: Technische Universiteit Eindhoven DOI: 10.6100/IR384913
General rightsCopyright and moral rights for the publications made accessible in the public portal are retained by the authors and/or other copyright ownersand it is a condition of accessing publications that users recognise and abide by the legal requirements associated with these rights.
• Users may download and print one copy of any publication from the public portal for the purpose of private study or research. • You may not further distribute the material or use it for any profit-making activity or commercial gain • You may freely distribute the URL identifying the publication in the public portal ?
Take down policyIf you believe that this document breaches copyright please contact us providing details, and we will remove access to the work immediatelyand investigate your claim.
Download date: 09. Jun. 2018

SELECTION BY SIMULATION
I
• c
a work sample approach to the selection of process operators
ASTRIO RIDDERBOS

Selection by simulation
a work sample approach to the selection of process operators
Proefschrift
ter verkrijging van de graad van doctor aan de Technische Universiteit te Eindhoven, op gezag van de Rector Magnificus, prof.dr. J.H. van Lint, voor een commissie aangewezen door het College van Dekanen in het openbaar te verdedigen op
dinsdag 10 november 1992 om 16.00 uur door
Astrid Ridderbos
geboren te Amsterdam

Dit proefschrift is goed~ekeurd door
de promotoren: prof. dr. J.A. Algera prof. dr. R.A. Roe
de copromotor: dr.ir. H. Kragt
CJP-gegevens Koninklijke Bibliotheek Den Haag
Ridderbos, Astrid
Selection by simulation: a work sample approach to the selection of process operators I Astrid Ridderbos. [S.l. : s.n. ]. - ill. Proefschrift Eindhoven. - Met lit. opg. - Met samenvatting in het Nederlands. ISBN: 90-9005483-9 Trefw. :personeelsselectie; procestechnici
Vormgeving: Marleen van Baaien Omslagontwerp en produktie:·Aiderse Baas & Budwilowitz, Amsterdam
© 1992, A. Ridderbos, Culemborg
Alle rechten voorbehouden. Uit deze uitgave mag niet worilen gereproduceerd door middel van boekdruk, fotocopie, microfl.lm of welk ander medium dan ook, zonder schriftelijke toestemming van de auteur. All rights reserved. No part of this publication may be J."eproduced, stored in a retrieval system, or transmitted in any form by any means, mechanical, photocopying, recording or otherwise, without the written permission of the author.

Acknowledgements
Although the actual writing of this thesis was a solitary activity, the research reported here was conducted in close cooperation with many fellow researchers and graduate students from different disciplines. The development of a selection instrument for process operatorsbasedon simulation techniques- a work sample-, was a subject par excellence that called fora multi-disciplinary approach to the design problem. Therefore, in developing the instrument experts from the behavioural, engineering and computer sciences each contributed their specific expertise to the different parts of the work sample. Special thanks go to Ties Leermakers, M.E., and Kees Kuijpers, B.E., for the development of the process simulation and their supervision activities with regard to the graduate students from Teehoical Physics, Electrical Engineering and Computer Science, who contributed to either the modeHing of the simulated process or the programming of the simulation models. The students whose graduate workis gratefully acknowledged in this regard are John Geurts, Robert Cullen, Thom van der Staay, Amo Kluytmans and Rein de Vries. The graduate work of Ad van Ginneken, who majored in Industrial Engineering and Management Science and who contributed to the development of a Behaviour Observation Scale for process operators is also gratefully acknowledged. Dennis Buis did and excellent job in writing the software for the pc version of the work sample.
Thanks are due to Prof. Jen Algera and Dr. Harmen Kragt who supervised the research reported bere. I would like to thank them for the stimulating discussions and their support throughout the course of the research. Thanks are also due to Dr. Gen Regterschot, not only for his statistica! advice but also for his thorough screening of the manuscript. The interactions with Prof. Rob Roe, Prof. Jan Moraal and Prof. PeterSander contributed greatly to the final version of the thesis. Thanks also go to Marleen van Baaien who took care of the finallay-out and who prepared all figures and tables.
The following companies from chemical and petrochemical industry financially supported the research: Arco Chemica! Holland, Netherlands Refining Company, DSM, Exxon Chemica! Holland, Hoechst Holland, Kema, Shell Chemica! Holland and Stamicarbon. Some of these companies also provided ample opportunity to conduct the validity experiments, both in providing great numbers of (trainee) operators as subjects for the experiments and in providing a location close to the central control room to conduct these experiments. Special thanks go toL. Bollen, P. Zwaans, Chr. Hoogstraate and M. Osephius, who contributed much to the progress of the research. Appreciation is further extended to Peter Elings and Joho Stals who served as experimenters durlog the validity experiments.
Last but oot least I am very much indebted to a number of persons who provided their support on a more personal level. I realise how precious friends are. I thank them all. Furthermore, I would like to thank the two most important men in my life, my best friend Erik whose unfaltering trust in my abilities is the best remedy to any doubts that do creep in once in a while, and my little man Rik whose smiling face and sunny humour always give me lotsof joy.

To Jan and Tini, for education comes from the heart.
Contents Page
Chapter 1. Introduetion 1
1.1. The operator's job in modern process industry 2 1.2. The major tasks of the process operator 4 1.3. Trends in selection and training of process operators 6
1. 3 .1. Selection of process operators 6 1.3.2. Training of process operators 7
1.4. Start of the project: 'Process simulation for selection of process operators' 10 1.5. Overview 11
Chapter 2. Selection in perspeelive 13
2.1. Signs versus samples 14 2.2. Work samples in selection 17
2.2.1. Several work sample approaches 17 2.2.2. Trainability testing 19 2.2.3. Evaluation 19
2.3. The work sample for process operators 20 2.4. Reliability, validity and utility 20
Chapter 3. Metbod 23
3.1. The design cycle 24 3.2. Outline of four validity studies 79 ·
Chapter 4. Development of the work sample 33
4.1. Definition of the work sample for process operators 34 4.2. Identification of key elementsof the process operator's control task 37 4.3. Process simulation 49

4.4. Performance measures 4.5. 'Tuning' the work sample
Chapter 5. Reliability of the work sample
5.1. Reliability measures 5.1.1. Test-retest reliability 5.1.2. Split-half reliability
5.2. Discussion and conclusions
Cbapter 6. Development of the criterion measure
Page
51 00
65
66 66 72 74
77
6.1. Criterion development 78 6.2. Ratings ro 6.3. Construction of a Behaviour Observation Scale (BOS) for process operators 83
6.3.1. Developing behavioural criteria for the BOS 84 6.3.2. Adjustment of the BOS 86 6.3.3. Appraisal session with the BOS 88
6;4. Reliability of the BOS 94 6.4.1. Intemal consistency 96 6.4.2. Inter-rater reliability 96 6.4.3. Test-retest reliability CJ7 6.4.4. Various measures 98
6.5. Discussion and conclusions 102
Chapter 7. Validity of the work sample 105
7.1. Face validity 106 7.2. Content validity 107 7.3. Criterion related validity 112
7 .3.1. Concurrent validity 112 7 .3.2. Predictive validity 119
7;4. External variables 121 1.5. Discussion and conclusions 123

Chapter 8. Evaluation and decision
8.1. Evaluation of the work sample 8.2 Future use of the work sample
Epilogue
Sunnnary
Samenvatting
References
Appendix A Reliability, validity and utility
Appendix B The T&W process simulator
Appendix C The simulated process: the mixing process
AppendixD The exercises in the final work sample
Appendix E Measures used in calculating the raw score per exercise in the work sample and procedure for converting raw scores into
standard scores
Appendix F Behaviour Observation Scale for process operators
Curriculum Vitae
Page
127
128 133
135
139
141
145
153
163
165
167
173
177
183

Chapter 1.
Introduetion
This chapter describes the subject and field of study of the present work. The eperator's job in the chemicaland petrochemical process industry is described, outlining the effects of technological innovations on the tasks of the operator. Implications for selection and training are discussed. Finally, the aim of this study is described: the design of a selection tooi for process operators.

2 Selection by simu/ation
1.1. The operator's job in modern process industry
Over the last decades technological developments have had great impact on jobs and tasks in several industries. Especially the increasing level of automation has had great effects on job content and the way people perform their jobs. In the chemical and petrochemical process industry, the work situation of the operator started to change significantly during the fifties and sixties. First of all, with the development of pneumatic control instruments, there was a transition from local manual control to local automatic controL With the introduetion of pneumatic and electrical signal transformers, the central control room came into being, which during the sixties housed the fust digital computers, at that time only used for data Jogging. During the seventies and eighties in most companies a transition has taken place from panel instrumentation to distributed instrumentation and computerised operating systems ('DCS': distributed control systems) (Kragt, 1983).
These developments have resulted in different requirements being placed upon the human operator. In his original publications Crossman (1960, 1974) was one of the frrst to recognise the fact that the spread of automation not only greatly affected productivity and methods of organisation, but also affected the demands on individual workers. Over the years many authors have mentioned two more or less parallel trends: a trend from direct manual control towards supervisory control as wellas a trend from traditional manual skills to higher level cognitive skills necessary to perform the job (Edwards & Lees, 1973; Kragt
& Landeweerd, 1974; Spencer, 1974; Bainbridge, 1982; Norros, Ranta & Wahlstrom, 1982; Kragt, 1983; Wickens, 1984; Adler, 1986; Algera, 1988; Olsson, 1988).
Automation and skill
Algera (1988) distinguishes three levels of automation, which indicate how much control of the system is left to the operator and how much is left to the machine: 1. manual control ( the operator is an integrated component of a closed control circuit); 2. semi-automatic control (certain control acts are performed by the operator, but other
interventions are carried out by the machine); 3. supervisory control (bere the teehoical system is entirely controlled by the machine and
the operator monitors it).
These three levels of automation are depicted in figure 1.1 Althrough clearly there has been a trend from manual control to supervisory control
in the process industry, this does not imply that the machine bas taken over completely. In modern process industry we find that many components of process control have been automated, but at the same time there is still much control carried out manually (Wickens, 1984). This is depicted by level 2 in figure 1.1. Some processes are just too 'complex'which means that the process reactions are not fully understood yet! - to be controlled by

1. Introduetion 3
mathematical algorithms in computer programs, while others require a shift from automatic to manual control only under special circumstances (e.g. in case of major upset:s). In the few instances that control is completely automated (level 3 in figure 1.1), it is still the human operator who must be able to take over when automated control fails. With regards
to the allocation of tasks to either the computer or the human process operator, Christis (1987) has introducedan alternative conception of automation in which aspects relating to the quality of work are more central. In this conception the attempt to attain a maximum level of automation should be abandoned. Instead, an optimum level of automation should be pursued, in which the tasks of the computer and the human operator are better adjusted to
each other. This conception is slowly winning ground in modern process industry (Bollen & Meerbach, 1986). This way the operator is acting as a system component and has a crucial role in the overall system. So we find elements of all three automation levels in
process control, although nowadays the emphasis is on the second level.
Leveli - Manual control
Level 2 - Semi-automatic control
Level3 Supervisory control
Figure l.I. Three levels of automation ( From Ekkers, Brouwers, Pasmooij & de Vlaming, 1980).
Frequently, the skills for. effective operation of new systems have been underestimated. Adler (1986) calls this the 'myth of a de-skilling trend'. It is mistakenly believed
that transferring tasks from worker to machine permits reductions in skill requirements. However, there is much more evidence to support the notion that automation changes the

4 Selection by simu/ation
types of skill required and, in fact, leads to an increase in skill requirements. According to
Bainbridge (1982) this is one of the 'ironies of automation': in automating one is not necessarily removing the difficulties. Because automation had led, among other things, to
integration of processes and an increasing complexity of most processes, cognitive abilities
such as information processing and decision making have become increasingly important.
1.2. The major tasks of the process operator
It is the operator's job to control and supervise the processes with the help of a
process control system. The operator's job consists of several tasks. According to Norros, Ranta & Wahlstrom ( 1982) the tasks of the operator are the following:
- monitor the process and the automation system;
- operate during non-automated state transitions; - diagnose and operate in situations where the process or the automation system deadlocks
in a situation not foreseen; - serve as a back-up for the situations where the automation system does not function
properly;
repair and maîntain the automation system;
- communicate with the environment; - evaluate and optimise used operational practices and procedures.
Rijnsdorp (1991) mentions the following tasks as typical for operators workingin a central control room:
- interacting with the process automation system;
- manual regulatory control;
- manual sequence control; - state assessment; - off-normal diagnosis;
- optimisation of process operation; - dealing with upsets and emergencies;
- cooperation with other central operators;
- coordination of field operator tasks; - training of junior operators;
- first line maintenance of the DCS;
- system improvement.
It is possible to construct a host of other lists - and many authors have done so - which all
describe in much more detail the operator's numerous tasks. However, Brinkman, Kragt & Piso (1985) mention some remarks made by process operators who had to rate lists of quite detailed task descriptions which all in thernselves made perfect sense (e.g. inspect, localise, read, calculate, plan, inform etc.). These operators said that the way they had to describe
1. Introduetion 5
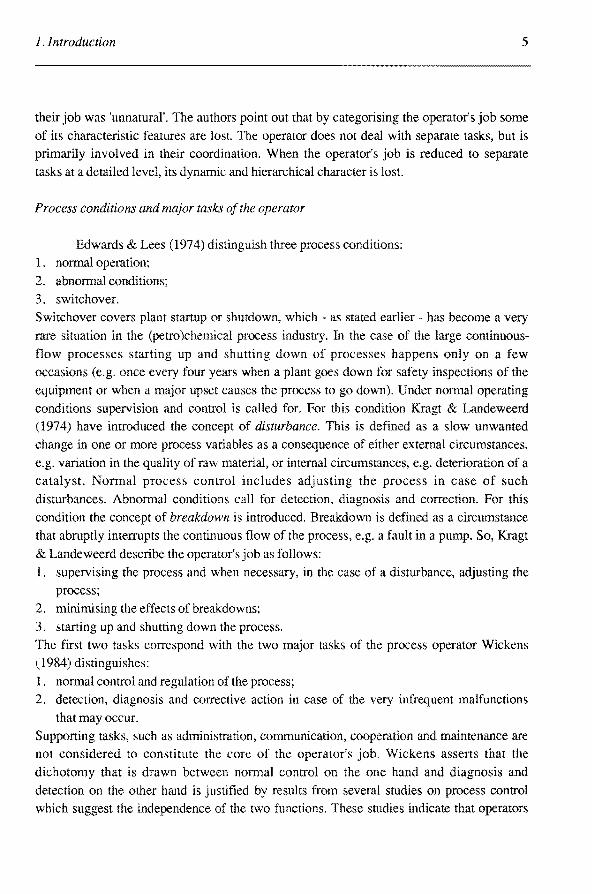
their job was 'unnatural'. The authors point out that by categorising the operator's jobsome of its characteristic features are lost. The operator does not deal with separate tasks, but is primarily involved in their coordination. When the operator's job is reduced to separate tasks at a detailed level, its dynamic and hierarchical character is lost.
Process conditions and major tasks of the operator
Edwards & Lees (1974) distinguish three process conditions: 1. normal operation;
2. abnormal conditions; 3. switchover. Switchover covers plant startup or shutdown, which- as stated earlier- has become a very
rare situation in the (petro)chemical process industry. In the case of the large continuous
flow processes starting up and shutting down of processes happens only on a few occasions (e.g. once every four years when a plantgoesdown for safety inspections of the equipment or when a major upset causes the process to go down). Under normal operating conditions supervision and control is called for. For this condition Kragt & Landeweerd (1974) have introduced the concept of disturbance. This is defined as a slow unwanted change in one or more process variables as a consequence of either external circumstances, e.g. variation in the quality of raw material, or internal circumstances, e.g. deterioration of a catalyst. Normal process control includes adjusting the process in case of such disturbances. Abnormal conditions call for detection, diagnosis and correction. For this condition the concept of breakdown is introduced. Breakdown is defined as a circumstance that abruptly interrupts the continuous flow of the process, e.g. a fault in a pump. So, Kragt
& Landeweerd describe the operator's job as follows: 1. supervising the process and when necessary, in the case of a disturbance, adjusting the
process;
2. minimising the effects of breakdowns; 3. staning up and shutting down the process. The first two tasks correspond with the two major tasks of the process operator Wickens (1984) distinguishes:
1. normal control and regulation of the process; 2. detection, diagnosis and corrective action in case of the very infrequent malfunctions
that may occur. Supponing tasks, such as administration, communication, cooperation and maintenance are not considered to constitute the core of the operator's job. Wiekeos asserts that the dichotomy that is drawn between normal control on the one hand and diagnosis and
detection on the other hand is justified by results from several studies on process control which suggest the independenee of the two functions. These studies indicate that operators

6 Selection by simu/ation
who are good controllers may not necessarily be effective at diagnosis and vice versa. In normal process control attention must be focused upon the forward flow of events: what causes what. Under abnormal conditions diagnosis calls fora reversion of this pattern: what was caused by what. Effective control strategies might not contribute to effective fault diagnosis, while strategies to detect faults - which are the more cautious strategies - do not yield high production and therefore are not the most effective control strategies. However, although control and diagnosis may be two different tasks which refer to different operator abilities, they both are integral parts of the operator's process control job.
1.3. Trends in selection and training of process operators
Because the technological developments as described in the previous sections have had great impact on the process operator's job, selection and training procedures should have been adapted to fit the new job requirements, such as higher level cognitive skilis for operation of more complex processes. In this section the trends in selection and training of process operators are examined against the trends from rnanual control towards supervisory control and from traditional manual skills to higher level cognitive skills.
1.3.1. Selection of process operators
The process operator in the central control room in any process industry is part of a man/machine system. Kragt & Daniets (1984) distinguish two approaches in the design of man/machine systems: 1. the ergonomie approach: based on the operator,. fitting the 'machine' (interface, work
situation) to the capabilities and limitations of human beings; 2. the selection and training approach: based on the 'machine', finding the most suitable
person (selection) and increasing the level of suitability (training). It almost goes without saying that in an ideal situation attention is paid to both approaches.
There is a vast amount of literature on the ergonomie approach and on almost every other subject involving the 'machine' side of process control. Although originally literature on training of process operators was scarce, we find a growing amount of literature on this subject since process simulators came into use. This is described in the next section. However, over the years little attention has been given to the selection of process operators. Edwards & Lees (1973) have pointed out that selection practices have been influenced by the fact that, originally, the operator's job was mainly manual work. During the frrst half of this century it was considered a job everyone could leam to do, given the right on-the-job
training. The first - and for a very long period of time the only - artiele to be found specifically on selection of process operators is that of Hiscock (1938). He describes a set of selection tests for chemica! process operators in apaint factory.

l.lntroduction 7
With the rise of automation during the sixties and seventies, the interest in training of process operators grew, but the subject of selection still did not get much attention. There is some evidence in the Netherlands that the technological developments caused a shift in
reeruitment practices. Kragt & Daniëls (1984) found that candidates were generally reeruired from: 1. pupils with intermediate general continued education and pupils from elementary teehuical schools; 2. candidates with a professional experience as ship-mechanics. Pupils with only primary school background were no longer recruited. Nowadays we find a shift in reeruitment of pupils from elementary technica! schools to pupils from secondary teehuical schools. Selection practices mostly consist of the use of biographical data and an
interview with a candidate. A review of UK and international knowledge and practice in the selection of process control operators yielded very few examples of good practice in applying selection methodologies (Astley, Shepherd & Whitfield, 1990). These authors found that the most widely used instruments in the selection process were: 1. the application
form; 2. psychological tests; 3. the interview; and 4. exposure to the job (in the form of videos and plant tours). Furthermore, it is important to note that these instruments are not necessarily used in combination. The authors conclude that selection practices in the process industries are not particularly valid and they recommend a systematic approach to selection. They especially recommend practical support to process control companies in the form of
methods and advice for carrying out the stages in the selection process, such as suggesting effective ways for measuring job competence. This is what Kragt & Daniëls (1984) referred to when they remarked that the lack of well defined performance criteria could be a reasou that so few researchers dare to explore the area of recruitment, selection, training and performance appraisal of process operators.
1.3.2. Training of process operators
The last decade has shown a remarkable increase in lirerature on the subject of training of operators. As was argued above, the increase in automation bas had great impact on the process operator's job. Because job content has undergone significant changes, the demands being made on process operators nowadays are very different from those just 20 years ago. Most companies in the chemical and petrochemical industry run their plants with
-for the greater part- the samecrew of operators for 40 years or so. Whereas the complexity of the job increased more and more, the need for (re)training of the existing crew became evident. Furthermore, the need arose for systematic training of new operators, since opportunities for leaming on the job have dirninished greatly. A reason for this is not only the increasing complexity of most processes in terms of cognitive requirements needed to fulfil the job, but also the direct effect of automation: less opportunities to interact directly
with the process and leam from this interaction. This is one of the 'ironies of automation' (Bainbridge, 1982).

8 Selection by simu/ation
With regard to operator training, three types of training can be identified in the
process industry: L basic training, which involves the learning of basic process k:nowledge and general
operator skills; 2. specialised training, in which skilis are learnt which are necessary to control a specific
process; 3. refreshment training, a course for experienced operators to prevent loss of knowledge
and skills. These three types of training are arranged according to a level of increasing specificity. They are also arranged according to time. First of all, operators are given a basic training in which they learn general principles of the operator's job. Nowadays this basic training takes place in secondary teehuical schools, company schools or on ·the job in cooperation with the Institute for professional education of process operators (VAPRO in the Netherlands). Both theory and practice are involved. Basic k:nowledge of process control is necessary before operators can leam how to control a specific process. This takes place during specialised training. Specialised training always takes place on the job. The operator learns to control the specific plants he is working on. Once an operator is experienced, it is found that in practice a number of situations only occur sporadically (e.g. during startup, or as aresult of automation). Then refreshment training is needed in order to have all the necessary
knowledge and skills at hand and to be able to apply these skîlls in a direct and meaningful way.
Training simulators
The chemica! and petrochemical process industry has a long history of training on the job. Trainee operators have traditionally leamed the job from experienced operators. The classica! approach to operator training has been to read from the operating manuals and try
to explain the operating procedures to the trainee operators. However, over the last decade we have found an increasing use of simulators for training of operators in the process industry (de Jong & de Wijn, 1983; Mellaard, Kop & Miedema, 1985; Shepherd & Kontogiannis, 1987; Lojek, Leins & Eul, 1988; Shepherd, 1990). Plenty of reasous for using simulators for training can be found in the literature. The most widely cited are:
the operator gets hands-on experience without endangering production or environment; the operator is allowed to deliberately make mistakes and experience the consequences of these mistakes;
emergency type situations can be trained which cannot be trained on the real system for obvious safety reasons;
it is possible to repeat certain procedures as often as necessary. However, the use of a simulator per se is not a panacea. Many very costly training simulators ushered in by overenthusiastic plant managers to solve their training problems can be

I. Introduetion 9
found nowadays in dusty cellars and depots. The use of a training simulator requires among other things - a systematic specifically simulator adapted training programme. Furthermore, if we want to use a simulator for training, it soon becomes clear that the type and purpose of training determine which type of simulator is most suitable. Bruens,
Oxenaar & Steinbuch ( 1987) identify roughly four types of simulators: 1. basic simulators: simple simulators which simulate the basicprinciplesof a process; 2. generic simulators: general simulators which simulate a type of process with a reason
able degree of detail; 3. replica simulators: simulators which simulate a specific process, in which both the ope
ration and the behaviour do not differ from the real installation;
4. function simulators: part task simulators which simulate an isolated part of an installation.
Replica or function simulators seem to be the most suitable both for specialised and refreshment training. A one-to-one simulation with re gard to (a part of) a specific process is needed then. On the other hand, a basic or generic simulator is more suitable for basic training. However, the differences between simulators are in no way absolute. The various simulatorscan be placed on a scale showing how close they are to reality. Here we come to address the questions of validity and fidelity with re gard to simulators.
Too frequently still the validity of a simulator is equalled to the fidelity of a simulator: the degree of sirnilarity with the simulated process or system. However, when developing training simulators, the objective of high fidelity - in terms of a high degree of physical similarity with the simulated process - is not always compatible with training
objectives (Stammers, 1981). Moraal (1983) also argues that the validity of a simulator depends on the purpose of its use. Literature shows that many training simulators provide such facilities as re-run of past events, freeze situations to enable inspeetion and discussion of key features, feedback of results and acceleration of reai-time processes. These facilities do not contribute to the physical similarity with the actual process and thus do not contribute to the fidelity, but they do enhance training results.
Besides the growing amount of literature on process simulators for training purposes, we can find a good deal of literature on the development of training programmes for learning process control skilis and fault diagnosis (Duncan, 1974; Shepherd, Marshall,
Turuer & Duncan, 1977; Marshall, Scanlon, Shepherd & Duncan, 1981; Shepherd, 1985 & 1986; Jelsma & Bijlstra, 1988; Bainbridge, 1989; Jelsma, 1989). These studies have in common that they try to develop techniques and methods in designing training programmes for process operators. For it is realised that the technological developments have outdated traditional training programmes in which the emphasis was on increasing the automated skilis in behaviour. Nowadays the emphasis is on the development of cognitive processes and the mastery of complex decision-making tasks. Although a start bas been made, much remains to be done before we know what it takes to develop an effective training pro-

10 Selection by simulation
gramme which facilitates maximum transfer of training. We refer to the epilogue forsome
thoughts on this subject.
1.4. Start of the project: 'Process simulation for selection of process operators'
In recent years more and more signs from industry have indicated that in addition to the ergonomie approach the selection and training of process operators requires more attention (see survey in Kragt, 1983). In 1986 a workshop was organised in the Netherlands
under the motto: "The skills of the process operator, an unknown area in the field of process automation". Among those taking part were eleven prominentchemicaland petrochemical companies (Bollen & Meerbach, 1986). One of the most important conclusions of this
· workshop was that both selection and training of process operators should be adapted to the changing tasks. According to the various companies taking part, the selection criteria used until now, mainly educationallevel and impressions of the candidate's 'technica! feeling', no longer gave sufficient guarantee of a correct choice. Attention was also drawn to the lack of an objective selection metbod and the poor coordination between extemal and intemal training. These were considered as the primary problems with regard to selection, education and training of process operators.
So, this workshop highlighted the common needs of the participating companies and led directly to the start of the research project which in turn led to the study reported bere. This research project has been partially financed by eighe different companies from the (petro)chemical industry. It started under the title: 'Process simulation for selection and training of process operators'. It was hypothesised that process simulation could be a powerfut tooi not only in developing training programmes - as is referred to in the previous section -, but also indeveloping a selection instrument for process operators. The results reported in this thesis cover the first phase of the project: the development of such a
selection instrument. Selection practices nowadays mainly involve interviews and subjective impressions.
Furthermore the few companies that have been using conventional psychological selection tests in the past did not have the impression that these tests predicted operator performance particularly well. Kragt & Daniëls (1984) already mentioned the possibility of using process simulation in creating a work sample for selection purposes. During simulation research it
appeared that individual differences in performance occurred, which these authors attributed to differences in personality traits: thoughtfulness, patience or proneness to panicking. While leaving the presumed personality traits for what they are, we realised that the use of a process simulator in creating a work sample for selection purposes offered tremendous
This research project has been financed by Arco Chemical Holland, Netherlands Refining Company, DSM, Exxon Chemical Holland, Hoechst Holland, Kema, Shell Chemical Holland, Stamicarbon and Eindhoven University ofTechnology.
1. Introduetion 11
possibilities for measuring operator performance objectively. Furthermore, the predictive value of selection instruments resembling the work situation seems better than that of the more convention al selection tests. In chapter 2 we will go into this matter more extensively.
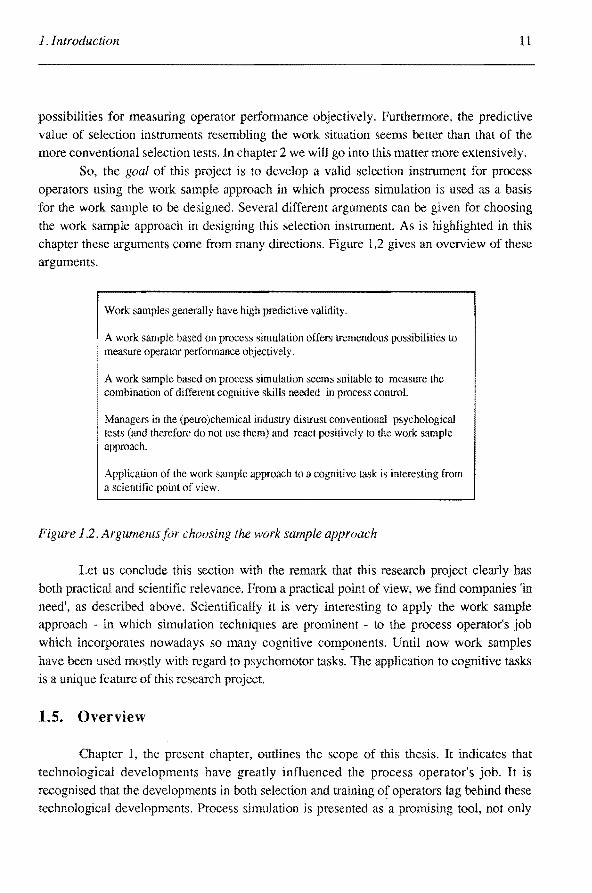
So, the goal of this project is to develop a valid selection instrument for process operators using the work sample approach in which process simulation is used as a basis for the work sample to be designed. Several different arguments can be given for choosing the work sample approach in designing this selection instrument. As is highlighted in this chapter these arguments come fTOm many directions. Figure 1.2 gives an overview of these arguments.
Work samples generally have high predielive validity.
A work samplebasedon process simulation offers tremendons possibilities to measure operator performance objectively.
A work sample based on process simulation seems suitable to measure the combination of different cognitive skilis needed in process control.
Managers in the (petro )chemica! industry distrust conventional psychological tests (and therefore do not use them) and react positively to the work sample approach.
Application of the work sample approach toa cognitive task is interesting from a scientific point of view.
Figure 1.2. Arguments for choosing the work sample approach
Let us conclude this section with the remark that this research project clearly has both practical and scientific relevance. From a practical point of view, we find companies 'in need', as described above. Scientifically it is very interesting to apply the work sample approach - in which simulation techniques are prominent to the process operator's job which incorporates nowadays so many cognitive components. Until now work samples
have been used mostly with re gard to psychomator tasks. The application to cognitive tasks is a unique feature of this research project.
1.5. Overview
Chapter 1, the present chapter, outlines the scope of this thesis. It indicates that technological developments have greatly influenced the process operator's job. It is recognised that the developments in both selection and training of operators lag behind these technological developments. Process simulation is presented as a promising tool, not only

12 Selection by simu/ation
in the design of training programmes but also as a device in creating a work sample for selection purposes. The next chapters are devoted to the aim of the present work: the application of the work sample approach in developing a selection instrument for process operators. In chapter 2, the two approaches to the development of a selection instrument, sign versus sample, are examined and underlying assumptions of either approach are discussed. Furthermore, the literature on the work sample approach is reviewed and important concepts such as reliability, validity and utility with regard to selection tests are discussed. In chapter 3, the design cycle from the engineering sciences is introduced as a frarnework for the development of the work sample for process operators. Emphasis is on the iterative and cyclic character of the design process. Also, the design of four validity
studies on the work sample is outlined. In chapter 4, key elements of the control task are identified, construction of several provisional versions of the work sample is described and results of a pilot experiment for 'tuning' the work sample are presented.
Results of the validity studies are described in chapters 5, 6 and 7. In chapter 5, results hearing on the reliability of the work sample are presented. In chapter 6, the focus is on the development of the criterion measure: a Behaviour Observation Scale for process operators. Results referring to the reliability of the criterion are also presented in this chapter. In chapter 7, results referring to different types of validity, i.e. face validity, content validity, and criterion related validity, are presented. In chapter 8, an evaluation of the most important results is provided and the usefulness of the work sample approach for selection of process operators is discussed. Furthermore, guidelines are given concerning future use of the work sample for process operators. Finally, possible directionsof future research in the process industry are suggested in the epilogue.

Chapter 2.
Selection • ID perspective
In this chapter, two approaches to the development of a selection instrument, i.e. the sign approach and the sample approach, are examined and underlying assumptions of either approach are discussed. Furthermore, the literature on the work sample approach is reviewed and important concepts such as reliability, validity and utility with regard to
selection tests are discussed.
14 Selection by simulation
2.1. Signs versus samples
Because selection of personnet always involves expectations about future behaviour on the job, prediction is one of the most crudal functions in any selection procedure. Other
important functions of selection procedures are information gathering, decision making and reporting and communication activities (Greuter, 1989). Although nowadays Roe (1989a)
argues that selection procedures should be regarded as integral structures of activities that do
not merely cover the administration of a test but encompass every activity that is involved in
selecring applicants, predierion remains at the heart of every selection procedure. Predierion means transforming past or present characteristics of applicants into expectarions of future
behaviour on the job. Variables that descrit>e actual characteristics of applicants or their
behaviour are called 'predictors', while variables that describe job behaviour or the results of job behaviour are called 'criteria' (Roe, 1983).
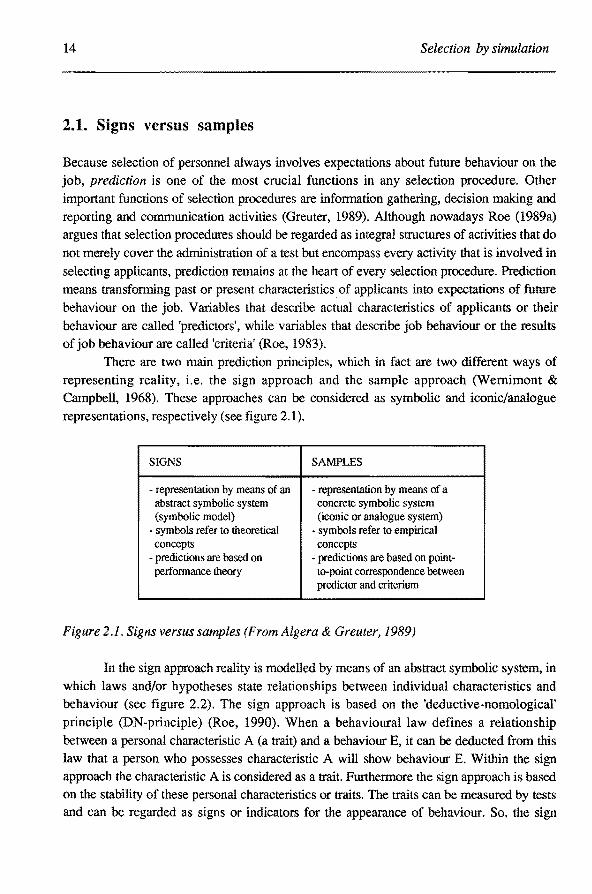
There are two main predierion principles, which in fact are two different ways of representing reality, i.e. the sign approach and the sample approach (Wernimont & Campbell, 1968). These approaches can be considered as symbolic and iconic/analogue
representations, respecrively (see figure 2.1).
SIGNS SAMPLES
- representation by means of an representation by means of a abstract symbolic system concrete symbolic system (symbolic model) (iconic or analogue system)
- symbols refer to theoretica! - symbols refer to empirica! concepts concepts
- predictions are based on - predictions arebasedon point-performance theory to-point correspondence between
predietor and criterium
Figure 2.1. Signs versus samples (From Algera & Greuter, 1989)
In the sign approach reality is modelled by means of an abstract symbolic system, in
which laws and/or hypotheses state relarionships between individual characteristics and behaviour (see figure 2.2). The sign approach is based on the 'deductive-nomological'
principle (DN-principle) (Roe, 1990). When a behavioural law defines a relationship
between a personal characterisric A (a trait) and a behaviour E, it can be deducted from this
law that a person who possesses characteristic A will show behaviour E. Within the sign approach the characteristic A is considered as a trait. Furthermore the sign approach is based on the stability of these personal characterisrics or traits. The traits can be measured by tests and can be regarded as signs or indicators for the appearance of behaviour. So, the sign
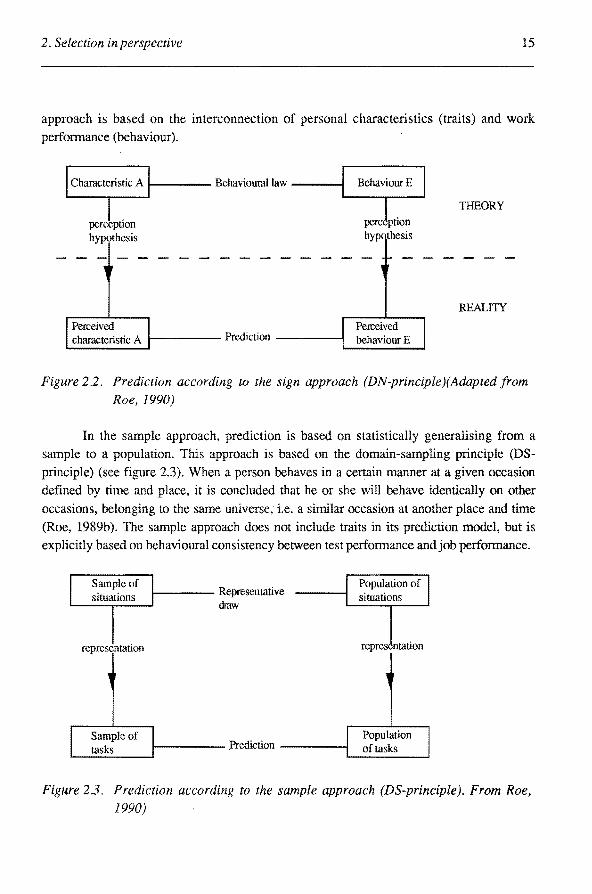
2. Selection inperspective 15
approach is based on the interconnection of personal characteristics (traits) and work performance (behaviour).
perception hypothesis
Perceived
1---- Behaviourallaw ----1
characteristic A 1------ Prediction -----l Perceived behaviourE
TIIEORY
REALITY
Figure 2.2. Prediction according to the sign approach (DN-principle)(Adapted from Roe, 1990)
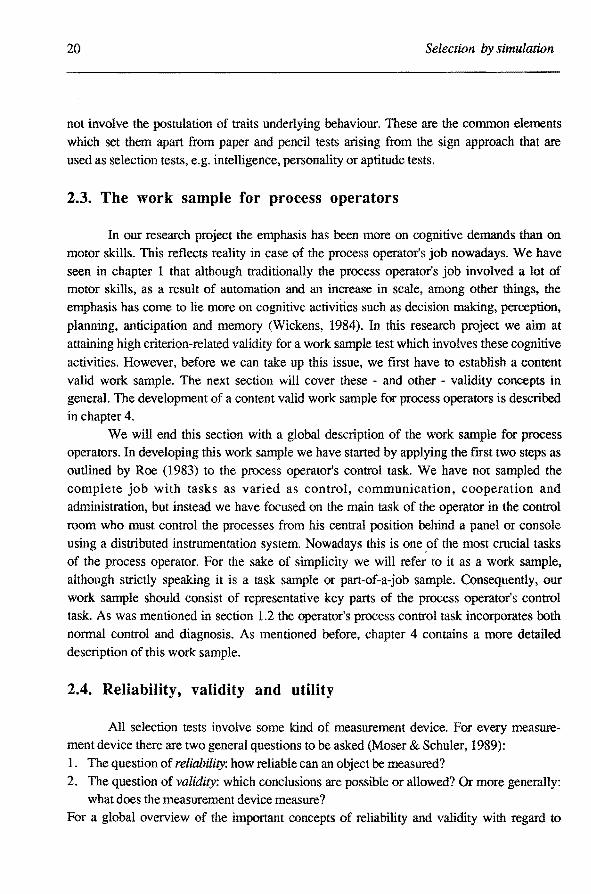
In the sample approach, prediction is based on statistically generalising from a sample to a population. This approach is based on the domaio-sampling principle (DSprinciple) (see figure 2.3). When a person behaves in a certain manner at a given occasion defined by time and place, it is concluded that he or she will behave identically on other occasions, betonging to the same universe, i.e. a similar occasion at another place and time (Roe, 1989b). The sample approach does not include traits in its preilietion model, but is explicitly basedon behavioural consistency between test performance and job performance.
representation
Sample of tasks
t---- Representative draw
1------ :Prediction -----l
Population of situations
repres ntation
Population oftasks
Figure 2.3. Prediction according to the sample approach (DS-principle). From Roe, 1990)

16 Selection by simu/ation
In designing a prediction model for a selection instrument there seem to be four possibilities (Greuter, 1989; Roe & Greuter, 1989; Roe, 1990). The choice is between the sign (deductive-nomological) approach and the sample (domain sampling) approach on the one hand. On the other hand the choice is between a clinical metbod and a formalised method. Combination of these possibilities lead to four different forms of preilietion (see figure 2.4). When the sign approach is combined with a formalised method, the model contains a formalised specification of the relationship between one or more predietor variables, operational measures or traits, and one or more criterion measures. When this approach is combined with a clinical method, scores of applicants on predietor variables are compared in order to find those with the best overall profile; it is assumed that this person's performance on the job will be best. When the sample approach is combined with a formalised method, content oriented devices are used to measure past or present performance: scores are generalised statistically to future performance estimates. When this approach is combined with a clinical method, work performance of applicants in similar situations is analysed in order to draw analogies: thus an idea of future performance is derived from past performance.
Formalised methods
Clinical methods
Deductive-nomological (sign)
measuring capacities and traits; combining scores according to a formalised model
measuring capacities and traits ('impressions'); combining scores (impressions) subjectively
Domain sampling (sample)
measuring sk:ills, behaviour or performance styles; combining scores according to a formalised model
measuring skills, behaviour or performance styles; combining scores (impressions) subjectivel y
Figure 2.4. Basic design choices for selection-oriented predierion models (From Greuter, 1989)
As has been argued in Chapter 1 we have chosen the work sample approach for the design of a selection instrument for process operators. Arguments for this choice have been summarised in figure 1.2. Furthermore, we have chosen to apply the formalised method. In our opinion, development of new selection instruments should always involve scientific methods, which - not quite incidentally are highly formalised. Because selection instrurnents are used to take far reaching decisions about peoples' future, they should be developed and adrninistered with the utmost care and attention to potential shortcomings.

2. Selection in perspective 17
2.2. Work samples in selection
In the selection of personnel the (work) sample approach emphasises the develop
ment of a test instrument, consisring of one or more tasks which represent the fundamental
demands with regard toa certain job. Although it is generally agreed upon that consistency between test behaviour and work behaviour is the heart of the work sample approach, we
still find many different definitions of the term 'work sample'. In fact there is not one work
sample approach, but there are several approaches hearing resemblance to each other. In this
section we give a short overview of the approaches and the different definitions of tbe term 'work sample' that are being used. We also point out in what ways our approach differs
from the other approaches and we shall end this section with a global definition of our work
sample. According to Roe (1983), the following steps must betaken indeveloping a work
sample:
1. initially a start is made with an inventory of the tasks of a given job; 2. a representative sample is taken from this inventory;
3. candidates carry out the tasks in this sample; 4. and finally performance in the sample is used to predict performance in the future job.
Roe stresses the fact that a work sample should consist of a representative sample of tasks
of a given job. Th is relates to the content validity of a work sample. This and related validity
concepts will be briefly discussed insection 2.3.
2.2.1. Several work sample approaches
Asher & Sciarrino (1974) identify two broad categones of work samples: motorand
verbaL The motor work sample corresponds to what Robertson & Kandola (1982) call the
psychomator work sample. This is the work sample in the traditional sense of the word. It
involves tasks such as typing, sewing, using a tooi, etc. So, these traditional work sample
tests, consisting of high-fidelity simulations (veridical representation of the work situation
on the job), have been developed for motor tasks, and not so much for activities which are very varied and where the workis carried out more with people than with things (Cook,
1988). This traditional work sample test is in fact mainly a manual skills test. However, in
actdition to the psychomator work sample, Robertson & Kandola also identify three other types of work sample: i.e. individual, situational decision making (e.g. in-basket tests), job
related information (e.g. usually paper and pencil knowledge tests which examine the
amount of information a person holds about a particular job) and group discussions/decision making (e.g. two or more people being put together to discuss a particular topic and their
performance in the discussion is evaluated). These types of work samples make up Asher & Sciarrino's broad category of verbal work samples, which are usually language oriented or

18 Selection by simulation
people oriented. According to Roe's description of a work sample, in-basket tests can be considered as work samples for jobs which do not involve (psycho )motor skills and which are more in the management domain. In-basket tests aim at evoking relevant work behaviour by simulating the (essential characteristics of) the target job(s). It is a so-called situational test consisting of 'stimuli' (problems to be solved) which a candidate manager finds on bis or her desk in the 'in-basket' (Bom, Algera & Hoolwerf, 1988). However, the other two types of work sample tests, i.e. paper and pencil knowledge tests and group discussions do not seem to classify as work sample tests, because usually they do not involve a representative sample of tasks of a given job.
Another example of the work sample approach is the 'behavioural consistency' approach of Schmitt & Ostroff (1986). It is explicitly based on consistency between the relevant dimensions of the real task behaviour and the samples which are used in the selection to simulate the task. Prediedons are based on a one-to-one correspondence: consistency between test and work behaviour.
According to Motowidlo, Dunnette & Carter (1990) both work sample tests and assessment eentres are instances of high-fidelity simulations that mimic actual job situations and elicit responses that are interpreted as direct indicators of how applicants would handle the task situation if it were actually to occur on the job. According to Feitham (1989) though, a work sample test or simulation is just one of the many techniques that make up an assessment centre. An assessment centre can be described then as a process by which an individual, or group of individuals, is assessed by a team of judges using a comprehensive and integrated series of techniques, such as interviews, standardised paper-and pencil tests of mental abilities, and simulation exercises which more or less directly represent important elements of real job tasks. However, the point Motowidlo et al. try to make is clear. Simulation exercises vary in the extent of fidelity with which they present a task stimulus and elicit a response. High-fidelity simulations use very realistic matenals and equipment to represent a task situation. Simulations that present only a written or spoken description of the task stimulus and elicit only a written or spoken description of the response that would be taken are referred to as low-fidelity simulations. Fidelity decreases as stimulus materials and responses become less and less exact approximations of actual job stimuli and responses. It is not clear, though, just how much fidelity is necessary before a simulation can become usefully predictive. Motowidlo et aL mention several studies in which the predictive value of low-fidelity simulations, such as the situational interview, is quite high. They also conclude from their own study that high-fidelity simulations that present a veridical task situation and ask applicants to show (and not tell) what they would do, may be more realistic than low-fidelity simulations in many respects, but that such a level of realism may not always be necessary for empirica! validity.

2. Selection in perspective 19
2.2.2. Trainability testing
A great deal of the study on work samples has been carried out with those people who already have the skilis needed for specific activities, such as typing. The work sample test thus acts as a selection instrument that has to identify the most suitable candidate. Differentiation takes place on the basis of simulated work behaviour. However, îf someone does not have the skîlls required to carry out the activities, the trainability testing approach
can be used. Trainability tests are in fact a subtype of a work sample which indicate how well/quickly a candidate can leam the new skilis (Cook, 1988). Robertsou & Downs (1979) also consider trainability testing a special form of work sample testing. It involves a structured and controlled leaming period with a work sample in which the 'how' and 'why' of what is done is systematically observed. Trainability tests can be used as pass/fail selection instruments for acceptance on training programmes. In the development of
trainabîlity tests we also see that emphasis is placed on psychomator skills, as is the case with the more traditional work sample tests. In their review of trainability tests Robertsou & Downs name, for example, activities such as carpentry, welding, sewing, bricklaying, forklift truck and dental activities, but put forward the possibility of using trainability tests in a wider professional area, with less emphasis on typical manual skills.
In the United States we find the 'miniature job training and evaluation approach' (Siegel & Bergman, 1975; Siegel, 1978 & 1983) which bears some similarity to both the trainability testing approach and the traditional work sample approach. The rniniature job training and evaluation approach is based on the notion that if someone shows that he can learn and do well in a job sample, this is also true for the job as a whole, provided that he is given the correct on-the-job training. This approach introduces a combination of training aspects and measurement aspects into the testing situation. Specifically, the applicant is
trained to perform a sample of tasks involved in the job and, immediately following the training, his ability to perform these tasks is measured. Other research (Reilly & Israelski, 1988; Van der Maesen de Sombreff & Westen, 1991) also shows that tests which combine a minicourse and a work sample test predict successfully how people perfarm during training and on the job.
2.2.3. Evaluation
Although surely there are differences between 'different' kind of work sample tests, such as traditional work sample tests, in-basket tests, simulation exercises in assessment centres, the behavioural consistency approach, trainability testing, minicourses and the miniature job training and evaluation approach, they have in common that they are all explicitly based on consistency between test behaviour and behaviour in 'real life' on the job. From a more theoretica! point of view it has been pointed out (section 2.1) that they do
20 Selection by simulation
not involve the postulation of traits underlying behaviour. These are the common elements which set them apart from paper and pencil tests arising from the sign approach that are used as selection tests, e.g. intelligence, personality or aptitude tests.
2.3. The work sample for process operators
In our research project the emphasis has been more on cognitive demands than on motor skills. This reflects reality in case of the process operator's job nowadays. We have seen in chapter 1 that although traditionally the process operator's job involved a lot of motor skills, as a result of automation and an increase in scale, among other things, the emphasis bas come to lie more on cognitive activities such as decision making, perception, planning, anticipation and memory (Wickens, 1984). In this research project we aim at attaining high criterion-related validity fora work sample test which involves these cognitive
activities. However, before we can take up this issue, we first have to establish a content valid work sample. The next section will cover these - and other - validity concepts in general. The development of a content valîd work sample for process operators is described in chapter 4.
We will end this section with a global description of the work sample for process operators. In developing this work sample we have started by applying the frrst two steps as outlined by Roe (1983) to the process operator's control task. We have not sampled the complete job with tasks as varied as control, communication, cooperation and administration, but instead we have focused on the main task of the operator in the control
room who must control the processes from his central position bebind a panel or console
using a distributed instrumentation system. Nowadays this is one .of the most crucial tasks of the process operator. Por the sake of simplicity we will refer to it as a work sample, although strictly speaking it is a task sample or part-of-a-job sample. Consequently, our work sample should consist of representative key parts of the process operator's control task. As was mentioned in section 1.2 the operator's process control task incorporates both normal control and diagnosis. As mentioned before, chapter 4 contains a more detailed description of this work sample.
2.4. Reliability, validity and utility
All selection tests involve some kind of measurement device. For every measurement device there are two general questions to be asked (Moser & Schuier, 1989): 1. The question of reliability: how reliable can an object be measured? 2. The question of validity: which conclusions are possible or allowed? Or more generally:
what does the measurement device measure? Por a global overview of the important concepts of reliability and validity with regard to

2. Selection in perspective 21
selection tests in general we refer to Appendix A. In this appendix the different types and coefficients of reliability and validity will be discussed. Especially those coefficients are highlighted which are directly related to the research reported in this thesis. Chapters 5, 6 and 7 contain results referring to the reliability and validity of the work sample to be
design ed. For a more comprehensive account of reliability and validity we refer to the many psychometrie textbooks which cover these subjects. Appendix A also contains a description of the concept of utility with regard to selection tests or programmes. Utility analysis
involves a cost-benefits evaluation, in other words: the economie benefits of a selection test or programme are estimated. In this section we shall only briefly cover some validity issues directly pertaining to the work sample approach.
Validity ofwork samples
In the United States it recently has become very important that a selection method can be defended in a court of law. The 'Equal Employment Opportunity' legislation prefers
tests which are as similar as possible to the activities in question. As in actdition to high face validity work samples generally also have high content validity, many legal problems can be prevented (Cook, 1988). Research by Schmidt, Greenthal, Hunter, Berner & Seaton (1977)
and Cascio & Philips (1979) supports the notion that work samples are in fact 'more fair' than the conventional paper and pencil (aptitude) tests. Relatively speaking, the same number of coloured people, Latin American and white people achieved good performances in the work samples these researchers used. In addition, both minority and majority members saw the work sample tests as significantly fairer, clearer, and more appropriate in level of difficulty.
In actdition to the high face validity and content validity work sample tests also have
high predictive validity. In fact, the literature (Campion, 1972; Asher & Sciarrino, 1974; Robertson & Kandola, 1982; Robertson & Smith, 1989) shows that work samples as
selection tools are better predietors than the more conventional tests, such as intelligence, personality or aptitude tests. Furthermore, results of meta-analytic reviews show impressive support for the validity of work sample tests (Hunter & Hunter, 1984; Schmitt, Gooding,
Noe & Kirsch, 1984). However, a more carefully balanced appraisal of the high predictive validity of work sample tests should take into account that this primarily holds for the more traditional work sample tests. These tests have been originally developed for (psycho)motor tasks and until now relatively little attention has been paid to cognitive aspects. For
managerial jobs in-basket tests and assessment eentres have been developed, which do include cognitive aspects, but work samples have been traditionally developed for industrial jobs where the emphasis is on manual skills. This is one of the aspects in which the work
sample for process operators differs from the traditional work samples.
Chapter 3.
Metbod
In this chapter, the design cycle from the engineering sciences is introduced as a framework for the development of the work sample for process operators. Emphasis is on the iterative and cyclic character of the design process. Furthermore, the design of four validity studies on the work sample is outlined.
24 Selection by simularion
3.1. The design cycle
The design cycle concept is the most fundamental model of the design process. Although design methodology originated from the engineering sciences, it should be recognised that the design cycle concept can be applied to any type of product, e.g. a radio, a tea pot, a wardrobe or a user-interface of a word processor. In fact, Bastiaans (1989) applied the design cycle concept to the design of user-interfaces in generaL Roe (1989)
introduced the design cycle concept into the psychological literature and applied it to the persounel selection procedure. He specifically mentioned that when talking about personnet selection the product to be designed might be a psycllological test, a job analysis instrument
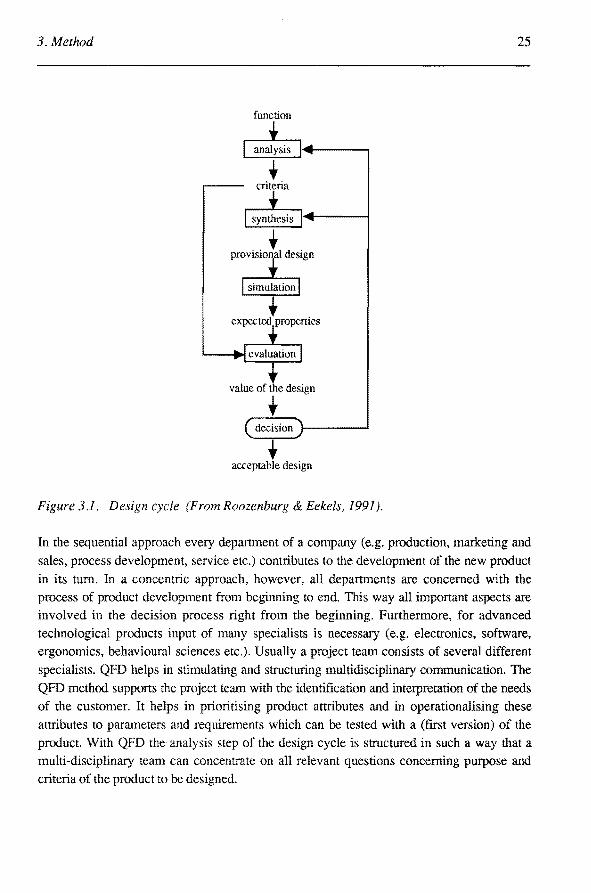
or an integral selection procedure. An example of the application of the design cycle to predictive performance models can be found in Greuter (1989). In the present work we will focus on the application of the design cycle to the development of a work sample for process operators. However, we will frrst present an overview of the design cycle in which the iterative structure of the design process is highlighted. This description bas been derived from Roozenburg & Eekels (1991). The model ofthe design cycle is shown in figure 3.1.
Analysis
Starting point in designing always includes the purpose and functions of the new product. There should at least be a global description of the functions of the new product, otherwise the designer or design team does not know what to design. In the analysis step
one or more product ideas are generated and the design team will get an idea of the problems accompanying these ideas. Criteria are formulated which should be fulfilled by any solution to these problems, frrst at a global level, but in later iterations at a more specific level. To decide which of the possible solutions to a design problem is the best solution requirements
and desi:res should be formulated concretely, in the form of a list of specific criteria. This list is called the 'list of requirements'. However, not only requirements should be specified in this list, but also constraints, e.g. restrictions regarding time and use of resources. These requirements and constraints should be delineated in close cooperation with the future users of the product and other people involved.
So, in the analysis step of the design cycle a problem is defined and criteria are formulated in the form of a 'list of requirements' - which should be fulfilled by a solution to this problem. Quality Function Deployment (QFD) is a recently developed metbod to support this process from problem definition to list of requirements. QFD is especially suited for the organisational context in which the process of product specification (the development of a list of requirements) takes place. Nowadays the sequentia! approach to
product development is ousted more and more by a concentric, more integral approach.
3.Method 25
function
I anrutsis ~~~------~ • criteria
• acceptable design
Figure 3.1. Design cycle (From Roozenburg & Eekels, 1991 ).
In the sequentia! approach every department of a company (e.g. production, marketing and
sales, process development, service etc.) contributes to the development of the new product in its turn. ln a concentric approach, however, all departments are concemed with the processof product development from beginning to end. This way all important aspects are involved in the decision process right from the beginning. Furthermore, for advanced technological products input of many specialists is necessary (e.g. electronics, software, ergonomics, behavioural sciences etc.). Usually a project team consistsof several different specialists. QFD helps in stimulating and structuring multidisciplinary communication. The
QFD metbod supports the project team with the identification and interpretation of the needs of the customer. It helps in prioritising product attributes and in operationalising these attributes to parameters and requirements which can be tested with a (first version) of the product. With QFD the analysis step of the design cycle is structured in such a way that a multi-disciplinary team can concentrate on all relevant questions conceming purpose and criteria of the product to be designed.

26 Selection by simulation
Synthesis
The second step in thè design cycle is the generation of a provisional design proposal. The term 'synthesis' literally means: the creation of a new whole from (partly) known parts. This is a very difficult and crucial step in the design cycle, because it is essentially a creative activity. Methods for finding solutions to problems are called creativity methods or creativity techniques. Three groups of methods are distinguished: 1. associative methods (e.g. brainstorming); 2. creative confrontation methods (e.g. searching for analogies); 3. analytica! systematic methods (e.g. function analysis). Whatever metbod or combination of methods is chosen in the synthesis step of the design cycle, the aim is to create. Although this is the most crucial step in the design cycle, the other steps are very important also and can not be missed. The design cycle can be considered as a unity, in which the synthesis step only tells to full advantage when it is supported by and implemenled in the other steps of the cycle. Therefore, the result of this step is called a provisional design proposal: it is simply one of many possibilities, of which the value bas to be established in the next steps. The form in which the design proposals are expressed (e.g. verbal, drawing, mock up, mathematica! model etc.) depends on the phase of the design process (how many iterations have been gone through yet?).
Simulation
In the design process simulation is a deductive subprocess. By reasoning or modeHing one should arrive at conclusions about behaviour and characteristics of the provisional design before it will actually be produced and used. Theories, formula, tables and experimental methods can be used in this simulation step, but many simulations are only basedon experimental knowledge. Every representation of an original can be regarded as a model of that original. Consequently, drawings and descriptions of the design of a product are already a model of a new product. Usually, however, simulation of the behaviour of the original can not ~. executed with just a drawing or a description of the design. Products are designed to have a certain effect when they are used in a certain way. Furthermore, a product is influenced by coincidental environmental factors. To simulate these two influences on the functioning of a product a behavioural model is needed. There is great varianee in simulation models, from theoretica! mathematica! models to true-to-nature material replica ofthe original and its environment (high fidelity simulations).
Modelscan be classified by type ofsystem, function or operative principle. When models are classified by type of system we can distinguish between material models (e.g. mock-up, drawing, sample of subjects) and conceptual models, which are systems of concepts or symbols (diagrams, mathematica! models, networks). When models are

3. Method 27
classified by function we can distinguish functions such as description, visualising and experimenting. Furthennore, models contribute to valuable insights in design factors and environmental variables that influence the simulated behaviour. This usually leads to
improvements of the provisional design in order to get a better simulation result. When models are classified by operative principle we can distinguish four main types of models: 1. structure models (e.g. flow diagram, block diagram); 2. iconic models (e.g. prototype, mock-up, dummy, photograph); 3. analogue models (in which an attribute of the original is symbolised by another attribute
of the model); 4. mathematica! models (e.g. algebrak model).
In any case, whatever model is used the simulation step in the design cycle should lead to expectations about the (real) properties of the product, in tenns of conditional predictions.
Evalaation
In the evaluation step the value and quality of the provisional design are detennined. This is done by comparing the expected characteristics with the desired characteristics as defined in the list of requirements. There will always exist some differences, so one.should judge whether these differences are acceptable or not. This is a difficult judgment, because usually a great number of characteristics is involved and typically a provisional design fulfils some of the desired characteristics more than others. Designing always involves compromising between (partly) conflicting requirements!
Decision
Finally, a decision is called for: either 'proceed' which means working out the provisional design proposal (or, when the design is definitive: tak:ing it into production)- or
'try again' to generatea better design proposal. Usually one has to return to the synthesis step, to make improvements in a second, third or even tenth(!) cycle. However, it is also possible to return to the analysis step and redefine the list of requirements. Exploring the
possible solutions usually provides valuable insights into the real nature of the design problem. So, both design and list of requirements are being developed in consecutive cycles and in strong interaction with each other until an acceptable fit is accomplished.
Transitionfromfunction tofarm
The most difficult part of any design process is the transition from function to fonn. In fact, this is a creative process which requires both analysis and synthesis. In designing, many means can fulfil a function and usually it is not directiy clear what means are the most

28 Selection by simulation
useful (valuable, effective or practical). So, designing is essentially a Succession of educated guesses consisring of a number of empirica! cycles in which knowledge about the problem and the design accumulates.
The iterative structure ofthe design process
The development of both design and list of requirements can be described as an iterative process. This processis shown in figure 3.2.
'r· list of
--- requirements 1
design I • comparison
list of requirements 2
characteristics
design 2
+ comparison
list of requirements 3
characteristics
design 3 comparison __..... acceptable design
Figure 3.2. The iterative structure of the design process (From Roozenburg & Eekels, 1991).
3. Method 29
The design process consists of the succession of several steps as described earlier. During
this process comparisons are made between actual characteristics and desired characteristics.
The result of these comparisons influences both the design and the list of requirements.
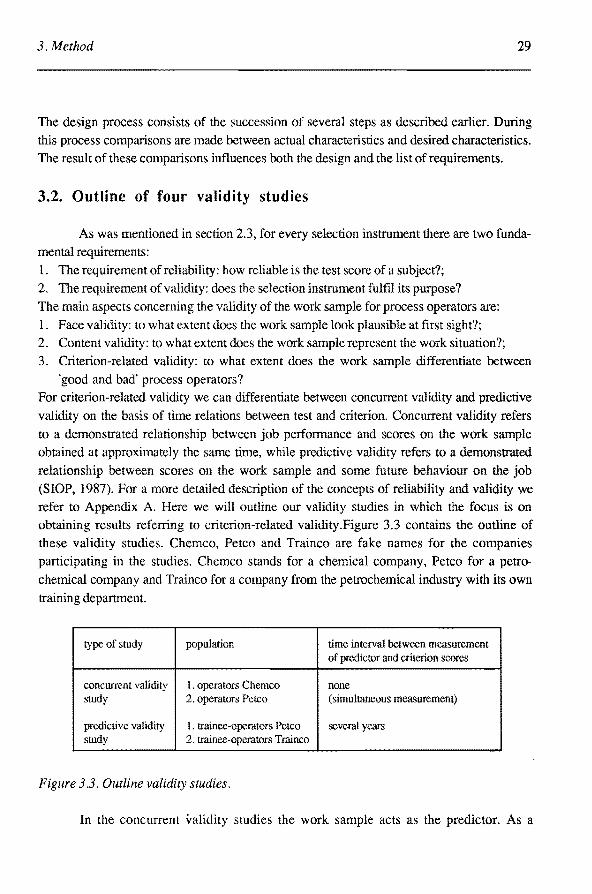
3.2. Outline of four validity studies
As was mentioned in section 2.3, for every selection instrument there are two funda
mental requirements:
1. The requirement of reliability: how reliable is the test score of a subject?;
2. The requirement of validity: does the selection instrument fulfil its purpose?
The main aspects concerning the validity of the work sample for process operators are:
1. Face validity: to what ex tent does the work sample look plausible at first sight?;
2. Content validity: to what ex tent does the work sample represent the work situation?;
3. Criterion-related validity: to what extent does the work sample differentiate between
'good and bad' process operators?
For criterion-related validity we can differentiate between concurrent validity and predictive
validity on the basis of time relations between test and criterion. Concurrent validity refers
to a demonstrated relationship between job performance and scores on the work sample
obtained at approximately the same time, while predictive validity refers to a demonstrated
relationship between scores on the work sample and some future behaviour on the job
(SlOP, 1987). Fora more detailed description of the conceptsof reliability and validity we
refer to Appendix A. Here we will outline our validity studies in which the focus is on
obtaining results referring to criterion-related validity.Figure 3.3 contains the outline of
these validity studies. Chemco, Petco and Trainco are fake narnes for the companies
participating in the studies. Chemco stands for a chemica! company, Petco for a petro
chemical company and Trainco fora company from the petrochemical industry with its own
training department
type of study population time interval between measurement of predietor and criterion scores
concurrent valîdity I. operators Chemco none study 2. operators Petco (simultaneous measurement)
predictive validity I. trainee-operators Petco several years study 2. trainee-operators Trainco
Figure 3.3. Outline validity studies.
In the concurrent validity studies the work sample acts as the predictor. As a

30 Selection by simulation
criterion measure a Behaviour Observation Scale is used which contains several aspects of the process operator's job. Development of this criterion measure is described in chapter 6. At both Chemco and Petco most operators of a specific plant cooperated in the research. Besides data referring to the concurrent validity of the work sample (chapter 7), data referring to the reliability of both the work sample ( chapter 5) and the criterion measure ( chapter 6) were gathered in these studies.
The predicrive validity studies were started to - eventually - obtain data referring to the predicrive validity of the work sample. Trainee-operators of two different companies parricipated in these studies. Because none of these trainee-operators is working yet as a process operator with full process,control responsibiliries, it was not possible to collect data on the criterion measure we used in the concurrent validity studies, i.e. work behaviour. However, data were gathered on several measures which might be considered as provisional criterion measures, such as school grades and judgments of teachers on. appropriateness for the process operator's job. Furthermore, some 'classica!' aptitude tests were administered to the trainee-operators in order to examine the relationship of these tests with the work sample. Finally, data referring to the reliability of the work sample were also gathered in these studies and are presented in chapter 4.
Figure 3.4 shows where the chapters of the present work can be located in the steps of the design cycle. In chapters 1 and 2, the function and purpose of the product to be dt<signed is described. The process operator's work situation is described and the most imp0rtant theoretica! concepts are dealt with. The present chapter on the method, chapter 3, can not. be found in one of the steps of tigure 3.4, but serves as the framework for the figure. Parts of chapter 4, the development of the work sample, can be located in analysis, synthesis and simulation. Sections 4.1 and 4.2 serve to specify criteria for the design, sections 4.3 and 4.4 describe the process in which a provisional design is developed and in section 4.5 the first simulation with this provisional design takes place. Likewise, parts of chapter 6, development of the criterion measure, can be located in analysis, synthesis and simulation. Sections 6.1 and 6.2 serve to specify criteria for this design, section 6.3 describes the process in which a provisional design is developed and in secrion 6.4 the simulation with this provisional design takes place. Section 6.5 however, can be located in the evaluation step of the design cycle: the value of the design of the BOS is discussed. Chapters 5 and 7 can be located in the simulation step for the work sample. In these chapters, the important requirements of reliability and validity with regard to the work sample are tested, respectively. IQ chapter 8, an evaluation. of the most important results is provided. The value of the design of the work sample is discussed and a decision is made concerning the acceptability of the design. If the design is not acceptable, new adjustments will have to be made. If it is, we shall enter a new phase in our research project: making our product 'user-ready'.

3. Method 31
Chapter 1
function (purpose)
Chapter2
ana/ysis
Chapter4
4.1 4.2
crileria
' synthesis Chapter4 Chapter6
4.3 I 4.4 6.3
' provisiona/ design
~ simu/ation
Chapter4 l~sl Chapter6 I CMp~7 I 4.5 6.4
' expected properties • evaluation
Chapter6 I Ch-8 I
6.5
• va/ue of the design
acceptable design
Figure 3.4. The chapters ofthis thesis located in the steps ofthe design cycle.

Chapter 4.
Developn1ent of the work sample
In this chapter, the design cycle as described in chapter 3 is applied to the development of a work sample for process operators. Attention is paid to the specifïc definition of the work sample under consideration. Key elements of the process operator' s control task are identified
using several techniques, such as participant observation, interviews and a questionnaire survey. Performance measures are described, drawing attention to the advantages of using a process simulator as a basis for the work sample. The hardware and software of both the process simulator and the specific simulated process is globally described. Finally, the construction of several provisional versions of the work sample is outlined and results of pilot experiments for 'tuning' the instrument are presented.
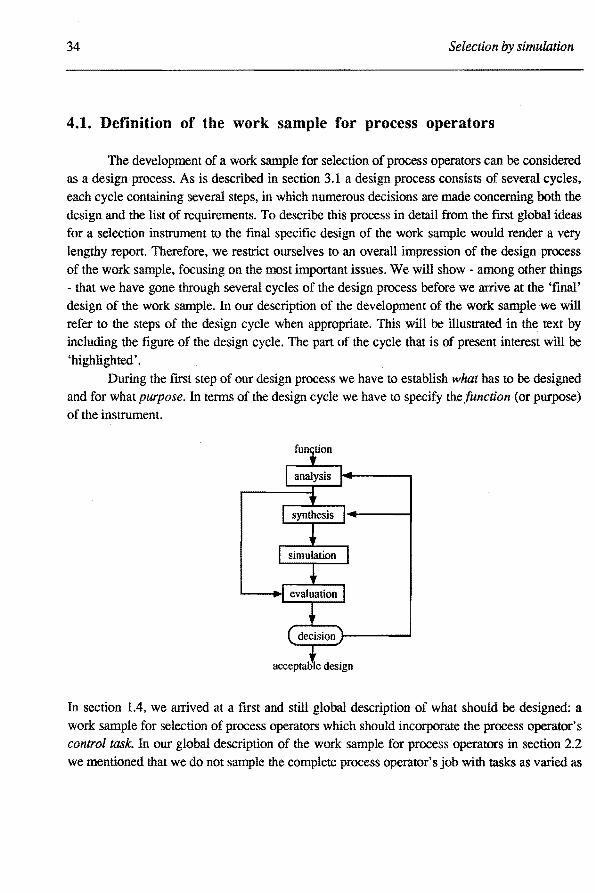
34 Selection by simulation
4.1. Definition of the work sample for process operators
The development of a work sample for selection of process operators can be considered as a design process. As is described in section 3.1 a design process consists of several cycles, each cycle containing several steps, in which numerous decisions are made conceming both the design and the list of requirements. To describe this process in detail from the first global ideas for a selection instrument to the final specific design of the work sample would render a very lengthy report. Therefore, we restriet ourselves to an overall impression of the design process of the work sample, focusing on the most important issues. We will show- among other things - that we have gone through several cycles of the design process before we arrive at the 'final' design of the work sample. In our description of the development of the work sample we will refer to the steps of the design cycle when appropriate. This will be illustrated in the text by including the tigure of the design cycle. The part of the cycle that is of present interest will be 'highlighted'.
During the first step of our design process we have to establish what has to be designed and for what purpose. In termsof the design cycle we have to specify thefunction (or purpose) of the instrument.
In section 1.4, we arrived at a first and still global description of what should be designed: a work sample forselection ofprocess operators which should incorporate the process operator's control task. In our global description of the work sample for process operators in section 2.2 we mentioned that we do not sample the complete process operator' s job with tasks as varled as

4. Development of the work sample 35
control, communication, cooperation and administration. Instead we focus on the main task of
the operator in the control room who has to control the processes from his central position
behind a panel or console using a distributed instrumentation system. Nowadays this is one of
the most crudal tasks of the process operator. Furthermore, as was mentioned in section 2.3,
for every selection instrument there are two fundamental requirements; that of reliability and that
of validity. Of course these requirements also apply to the work sample for process operators.
So, what has to be designed and for what purpose can be summarised as follows:
a reliable and valid selection instrument for the process operator' s control taskin the (petro)
chemica/ industry in the form of a work sample. The next phase in the design cycle is the analysis step. In this step one or more product
ideas are generated and criteria are formulated: the 'list of requirements'.
As the (petro)chemical process industry has toa large extent switched over from panel instru
mentation to distributed instrumentation or intends to do so in the near future, we should be developing the work sample on a process simulator to which several VDU's can be linked. A
process simulator is needed to supply the 'material' the process operator works on in reality: the
process itself. In a process simulator differentpartsof chemica! processes can be simulated real
time. The subject interacts with the simulated process on line. So, the state of the process changes (for better or for worse) depending on the interventions and control actions of the
subject. This dynamic interaction with the simulated process will be a unique feature of the
work sample to be designed. It distinguishes itself from both the more traditional motor work
samples with their static material to be worked upon and the in-basket tests for managerial jobs,

36 Selection by simu/ation
as described insection 2.2. We like to point out here that a simulated process should be used as
a basis for the work sample and should not be equated with the work sample itself. The work sample then, should contain (parts of) a simulated process, but it should also contain control
targets and simulated disturbances of the process leading to control actions of the subject. In this way the work sample will call on the operator's primary responsibilities during: a. normal process control of monitoring system instrurnents and periodically adjusting control
settings in order to maintain production quantities and qualities within certain bounds (Wickens, 1984);
b abnormal conditions where a breakdown abruptly interrupts the continuons flow of the
process and detection, diagnosis and corrective actions are called for (Kragt & Landeweerd,
1974). In terros of the design cycle we have specified some first and still global criteria during
the analysis step. So, our frrst list of requirements consists of the following items:
- a simulated process should be used as a basis for the work sample; - the process simulator shouldconsist ofVDU instrumentation;
- direct - on line - interaction with the simulated process should be possible;
the work sample should contain control targets and simulated disturbances of the process.
These items all arise from the process operator's control task which has to be represented in the work sample. From interviews with future users of the instrument and other parties involved in
the project (e.g. the university) additional requirements were formulated: - the work sample should be suitable for both inexperienced and experienced operators;
the process simulation in the work sample should be modular, soit can be used as a flexible
basis for both a selection and a training instrument. Although the purpose of this research project is to develop a work sample for selection of pro
cess operators (both experienced and inexperienced), it should be possible to easily transform
the simulated process that is used as a basis for this work sample and use it as a basis for a training instrument for process operators. For further discussion on this subject we refer to
section 4.2. Furthermore, during the interviews with future users not only requirements were
formulated, but also some constraints: development and validation of the work sample should be completed in four years;
- time to perform the work sample should not exceed four hours.
Since the work sample should be fitted in a one day selection procedure, the time a candidate needs to perform the work sample should not exceed more than half a day.
After having specified these first and still rather global requirements and constraints, the
next phase in the analysis step was to specify the content of the work sample. Before we could
make a provisional design proposal we frrst had to find out what should be incorporated in a
4. Devetopment of the work sample 37
work sample of the process operator's control task. In other words: what are the key elements
that constitute this task?
4.2. ldentification of key elements of the process operator's control task
In order to answer the question which ended the previous section we conducted an
analysis of the process operator's control task, using a content-oriented strategy (SlOP, 1987). Since detailed task information is necessary for simulation in a work sample approach, we used
different techniques to gather this information, such as observation, interviews and
questionnaires. The observations were carried out in the form of participant observations,
mostly in the central control room during operator shifts. Approximately 30 semi-structured
interviews were held with operators, instructors and production managers during four weeks at
six different companies from the (petro)chemical process industry. First, by using the Critica! Incidents Technique (CIT), frrst described by Flanagan (1954), an attempt was made to specify
as many situations as possible where behaviour of operators could be considered critica! for
process con trol. The CIT is very useful because of reference to observed behaviour. We have also applied this technique in the construction of the criterion measure. We refer to section 6.3.1 for a further description of this technique. Here it suffices to say that in applying this technique the incidents to be described need to be examples of either effective or ineffective on-the-job
behaviour and they should have occurred during the last 6 to 12 months. The CIT is effective in
illuminating the critica! aspects or key elements of a task which are essential for good
performance on the task. So, from the descriptions of the incidents that have been critica! for process control, the critica! components and factors were derived. These were named 'control
problems'. Finally a questionnaire was developed, which covered these control problems,
divided into three categories: a. process-related control problems;
b. external control problems;
c. task-related control problems. These categones contain different types of control problems, which can not easily be compared
toeach other in terms of, for example, difficulty. However, within a category camparisans can
be made. The aim of the questionnaire was to find out which combination of control problems
would render a content valid work sample of the operator's control task. Especially for the
category of process-related control problems we needed information which problems should be
incorporated in a work sample. Because these control problems are directly related to the process - in our case: the simulated process - it was of great importance to find out at an early stage

38 Selection by simu/ation
which control problems should be incorporated. For the choice of the simulated process parts and the programming of these simulations directly effect which control problems are included or excluded. The other two categoties of control problerns, that of the extemal control probieros and task-related control problems, can be incorporated in the work sample by means ofvarying the task instructions and introducing disturbances in the process. Therefore, the most important decision, the choice of what specitic process to simulate, depended for the greatest part on the results concerning the category of process-related control problerns. In the questionnaire each control problem was accompanied by a definition and an example. A lisring and description of the control problems covered by the questionnaire can be found in table 4.1.
Subjects in the questionnaire survey
Respondents to the questionnaire were experienced operators and control engineers from six different companies from the (petro)chemical process industry. In each company the questionnaire was completed by three experienced operators (total: 18 operators) and -depending on availability - between one to three experienced control engineers (total: 14 engineers). Respondents were asked for each control problem if it occurred in 'their own' process, whether it could be considered critica! for process control and difficult for inexperienced operators and whether it should be included in a work sample. It was pointed out that this work sample should involve a simulated process which in turn should be a meaningful representation of the processes found in reality.
We decided to include control engineers as respondentsin this questionnaire survey in order to have a frame of reference conceming the occurrence of the process-related control problems in the processes. The engineers are experts on this subject because it is one of their tasks to design control loops that should neutralise as much as possible any harmful effects of these process-related control problems. However, many of these effects still exist and are experienced by the process operators in their daily work situation. Although the control engineers do know about the effects of the process-related control problems, these and - even more so- the effects of the other two categoties of control problems (extemal and task-related) are not experienced directly by the engineers in the daily work situation of process controL Therefore, the decision which control problems should be incorporated in a work sample will be based only on the results of the process operators. For the work sample is meant to be a representation of the process operator' s control task and not of the control engineer' s task.

4. Development of the work sample
Table 4.1. Control problems covered by the questionnaire.
A. Process-related control problems
Problems in volving directly the dynamics of the physical process
Series conneetion In series conneetion several process parts are connected serially. A control ~ ... JS2l ... ~problem can arise when e.g. a disturbance spreads instantly through several ---w-~w ..- process parts, S 1, S2 and S3, which are operated closely aftereach other.
Parallel conneetion
Timedelay
mtl_c t _..time
Time constant
1~~ t_..time
~;-/ ~me
Recycling
~·Ftry r= ·r: ~
action e.ffect
Hysteresis
In parallel conneetion several process parts are connected in parallel order. A control problem can arise when e.g. a disturbance spreads through several process parts, PI, P2 and P3, which are operated at the same time.
The period of time a signa! (e.g. disturbance, control action) needs befare a reaction takes place.
The period of time a signa! (e.g. disturbance, control action) needs before a result (statie value K) is reached (reaction is direct, but usually very slow).
The reaction of a process part to a signal is for a short period of time contradictory, befare aresult (statîc value K) is reached.
(ParL~ of) the product flow are fed back into the process.
Asymmetry exists when an increase of an input signa! has a smal! effect on an output signa!, while a decrease (with the samemagnitude as the inerease) of an input signa! has a large effect on an output signal (or vice versa).
A controller does not react to an input signal when thc proeess value is within eertaio limitsin a specifïc area.
39

40
T able 4.1. ( continued)
B. External control problems
Change in specification of raw materials
Change in specification of product
Atmospheric influences
C. Task-related control problems
Choice of setpoint
Inaccurate information
Conflicting information
Abundance of alarms
Diagnosis of disturbances
Measures
Selection by simu/ation
Problems originating outside the physical process, but influencing course and control of the process
Both quality and quantity of raw material may fluctuate. These differences in the input variabie (raw material) of a process cause control actions on the part of the operator if specifications of the output variabie (product) are tobe met.
When different requirements are placed {both qualitative and quantitative) on an output variabie (product), the operator has to take eertaio actions to meet these requirements.
Changes in weather conditions may influence the process (e.g. changes in temperature, wind, rain etc.) and may cause control actions on the part of the operator if specifications of the process variables are to be met
Problems ha ving to do with decisions the operator bas to make before he can perform eertaio control actions
The operator is not sure of the optimum setting of a setpoint (desired value)
The operator obtains insufficient or inaccurate information on the state of the process through the instrumentation system.
The information on the state of the process which the operator obtains fromthe instrumentation system is notcompatible with the information the operator obtains from procedures, written instructions etc.
When several alarms are coming in at the same time or shortly after each other, the operator should be able to quickly give priority to the most important alarms.
Mter detection of a disturbance the operator should look for the possible cause of the disturbance and take corrective action.
The occurrence of the control problems as assessed by the respondents is expressed in a
percentage for each control problem. The judgments about necessity of ioclusion of a control
problem in a work sample are summarised using Lawshe's (1975) Content Validity Ratio:

4. Development of the work sample
ne -N/2 CVR= N/2
41
where N equals the number of respondents indicating the occurrence of the control problem in 'their own' process and ne is the number of respondents indicating the necessity of inclusion of
the control problem in a work sample. We refer to section 2.4 and Appendix A for a more extensive description of the use and interpretation ofLawshe's CVR. Here it suffices tomention that a value of 1.00 indicates unanimous agreement on the part of the respondents that a control problem should be included in a work sample; -1.00 indicates unanimous agreement that this is not necessary. A value of .50 is usually considered as the minimum level that should be obtained. Furthermore, Lawshe's CVR is usually employed to estab1ish the content validity of an already existing instrument. We have used it here in a somewhat different manner. We have used it in the development phase of an instrument to find out how the instrument should be constructed in order to obtain the highest possible content validity.
To find a ranking for the eight process-related control problems on the dimensions frequency and difficulty the technique of paired comparisons has been used. With this metbod the subject is presented with all possible pairs of control problems, and for every pair he has to indicate which of the two control problems is either more difficult or occurs more frequently. From the subjeet's choices a 'preference' order is deduced.
To find the degree of agreement among the set of ranks within each group of respondents, Kendall's coefficient of concordance, W, which ranges in value from 0.00 to 1.00 is calculated. If the ranks assigned by each respondent to the eight process-related control problems are the same as those assigned by every other respondent, then W=l.OO. If there is maximum disagreement among the respondents, then W=O.OO. We also tested this coefficient of coneerdance for significance.
Furthermore, the reliability coefficient, rtt, (Edwards, 1967) is computed; rtt gives an
impression of the reliability of the rank order we find and ranges from 0.00 to 1.00. This reliability coefficient reflects the correlation between our group of respondents and another comparable group of respondents, who would also rank the eight process-linked control problems.
Results ofthe questionnaire survey
The results on the question whether the control problems occurred in 'their own' process are summarised in table 4.2. For instance, when we look at the process-related control problem 'time delay', we find that 100% of the operators and 92% of the engineers indicated

42 Selection by simulation
that it occu:rred in 'their own' process. It appears that only the control problems 'asymmetry' and 'inverse response' are indicated by less than 75% of the operators as present in 'their own' process. For the control engineers this is the case only for 'inverse response'.
Table 4.2. Overview of control problems, their assessed occurrence by operators and control engineers in various processes and the Content Validity Ratio.
Occurrence (%) Content Validity Ratio
Operators Engineers Operators Engineers
l Process-related control problems
series conneetion 100 100 0.89 0.69 recycling 100 100 0.56 0.69 timedelay 100 92 0.78 0.67 parallel conneetion 100 85 0.78 0.45 time constant 94 100 0.76 0.23 hysteresis 94 77 0.41 -0.20 asymmetry 61 85 0.64 0.45 inverse response 56 31 0.20 -0.50
U External control problems
change in specification ofraw material 100 85 0.67 0.09 atmospheric influences 94 77 Ö.29 0.20 change in specification of product 78 85 0.43 0.09
ID Task-related control problems
abundance of alanns 100 100 0.67 0.54 fault diagnosis 100 100 0.89 0.54 choice of setpoint 100 92 0.67 0.17 inaccurate information 100 85 0.56 0.09 conflictinginformation 89 77 0.13 0.20
The judgments about the necessity of inclusion of a control problem in a simulation instrument, the Content Validity Ratio (CVR), are also contained in table 4.2. This table shows that the
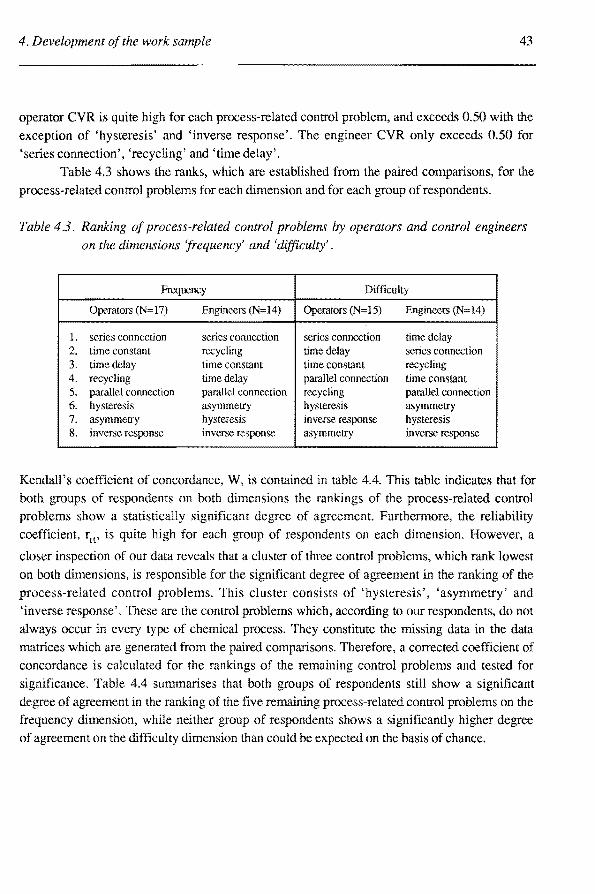
4. Development of the work sample 43
operator CVR is quite high for each process-related control problern, and exceeds 0.50 with the exception of 'hysteresis' and 'inverse response'. The engineer CVR only exceeds 0.50 for 'series connection', 'recycling' and 'time delay'.
Table 4.3 shows the ranks, which are established frorn the paired cornparisons, for the
process-related control problerns for each dirneusion and for each group of respondents.
Table 4.3. Ranking of process-related control problems by operators and control engineers on the dimensions 'frequency' and 'difficulty'.
Frequency Difficulty
Operators (N=17) Engineers (N=14) (N::::l5) Engineers
1. series conneetion series conneetion series conneetion timedelay 2. time constant recycling time delay series conneetion 3. time delay time constant time constant recycling 4. recycling time delay parallel conneetion time constant 5. parallel conneetion parallel conneetion recycling parallel conneetion 6. hysteresis asymmetry hysteresis asymmetry 7. asymmetry hysteresis inverse response hysteresis 8. inverse response inverse response asymmetry inverse response
Kendall's coefficient of concordance, W, is contained in table 4.4. This table indicates that for both groups of respondents on both dirnensions the rankings of the process-related control problerns show a statistically significant degree of agreement. Furtherrnore, the reliability
coefficient, rtt' is quite high for each group of respondents on each dirnension. However, a
closer inspeetion of our data reveals that a cluster of three control problerns, which rank lowest
on both dimensions, is responsible for the significant degree of agreement in the ranking of the
process-related control problems. This cluster consists of 'hysteresis', 'asyrnmetry' and 'inverse response'. These are the control problems which, according to our respondents, do not always occur in every type of chemica! process. They constitute the missing data in the data rnatrices which are generated from the paired comparisons. Therefore, a corrected coefficient of concordance is calculated for the rankings of the rernaining control problerns and tested for significance. Table 4.4 surnrnarises that both groups of respondents still show a significant degree of agreement in the ranking of the five rernaining process-related control problerns on the frequency dimension, while neither group of respondents shows a significantly higher degree of agreement on the difficulty dimeosion than could be expected on the basis of chance.
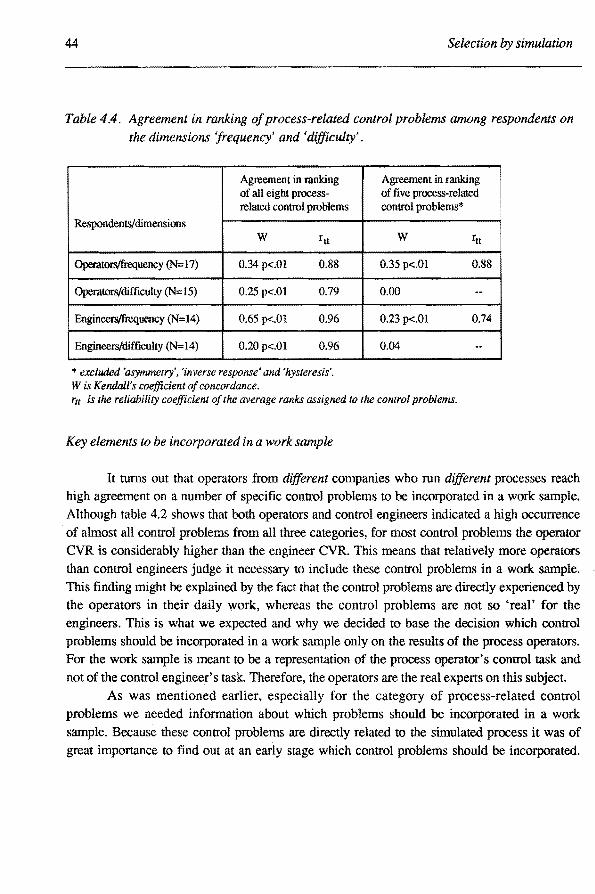
44 Selection by simu/ation
T able 4.4. Agreement in ranking of process-related control problems among respondents on the dimensions 'frequency' and 'difficulty'.
Agreement in ranking of all eight process-related control problems
Respondents/dimensions w rtt
Operators/frequency (N= 17) 0.34 p<.Ol 0.88
Operators/difficulty (N= 15) 0.25 p<.Ol 0.79
Engineers/frequency (N=14) 0.65 p<.Ol 0.96
Engineers/difficulty (N=l4) 0.20 p<.Ol 0.96
* excluded 'asymmetry', 'inverse response' and 'hysteresis'. Wis Kendall's coefficient of concordance.
Agreement in ranking of five process-related control problems*
w rtt
0.35 p<.Ol 0.88
0.00 ..
0.23 p<.Ol 0.74
0.04 --
rtt is the reliability coefficient of the average ranks assigned to the control problems.
Key elements to be incorporated in a work sample
It turns out that operators from different companies who run different processes reach high agreement on a number of specific control problems to be incorporated in a work sample.
Although table 4.2 shows that both operators and control engineers indicated a high occurrence
of almost all control problems from all three categories, for most control problems the operator CVR is considerably higher than the engineer CVR. This means that relatively more operators
than control engineers judge it necessary to include these control problems in a work sample.
This finding might be explained by the fact that the control problems are directly experienced by the operators in their daily work, whereas the control problems are not so 'real' for the
engineers. This is what we expected and why we decided to base the decision which control problems should be incorporated in a work sample only on the results of the process operators. For the work sample is meant to be a representation of the process operator's control task and
not of the control engineer' s task. Therefore, the operators are the real experts on this subject.
As was mentioned earlier, especially for the category of process-related control problems we needed information about which problems should be incorporated in a work
sample. Because these control problems are directly related to the simulated process it was of great importance to find out at an early stage which control problems should be incorporated.

4. Development of the work sample 45
For the choice of the simulated process parts and the programming of these simulations directly
effect which process-related control problems are included or excluded. This is the reason why we have tried to find a ranking for the eight process-related control problems on the dimensions
frequency and difficulty using the technique of paired comparisons. We would like to base the decision which control problems to include in the work sample on information conceming the frequency of occurrence, the difficulty and the judgments about the necessity of inclusion (operator CVR).
Table 4.4 summarises that both groups of respondents still show a significant degree of agreement in the ranking of the process-related control problems on the frequency dimension (when 'asymmetry', 'hysteresis' and 'inverse response' are excluded), while neither group of
respondents shows a significantly higher degree of agreement on the difficulty dimension than could be expected on the basis of chance. There may be a number of reasans why the
respondents do not agree in their ranking on the 'difficulty' dimension. It may be because the 'difficulty' of any control problem can be subjectively different for the respondents, depending on the process context or the qualifications of the respondent. Or it may be because the control problems do not differ sufficiently in degree of difficulty. lf the differences in difficulty among the control problems are so small that they can not be reliably discriminated, then we can not expect respondents to agree intheir ranking of the control problems on this dimension.
In view of the results presented above, the simulated process which is used to construct a work sample of the operator's control task should contain the following five process-related control problems: 1. series connection; 2. time delay; 3. time constant;
4. recycling; 5. parallel connection. However, interviews with the operators after they had completed the questionnaire made it clear that 'time delay' and 'time constant' were considered as identical control problems by the
operators. Although from a technica! point of view they do differ from each other (in 'time delay' there is a delayed reaction and in 'time constant' there is an immediate but very slow
reaction which is very hard to detect at the onset), the effect of these two control problems is almast the same for the operators cantrolling the process. The main difficulty for both these control problems lies in the fact that it takes a long time befare control actions or disturbances in the process affect the process. Therefore, in the next sections 'time delay' and 'time constant' will be treated as one process-related control problem.
The categones of extemal control problems and task-related control problems will have

46 Selection by simulation
to be included in a work sample either by imptementing disturbances in the simulated process itself or by varying the instructions in an experimental task situation. However, this can only be done when the construction of the simulated process is finished and the process-related control problems are incorporated in the process. Then, in creating control tasks (exercises) for the candidates with the simulated process in the work sample, the external control problems and task-related control problems come into play.
In surn, it turns out that experts from different companies who run different processes reach high agreement on a number of specific control probierus to be incorporated in a work sample. So, in spite of the many differences between processes and process control systems, it seems that some control problems are more or less 'universa!', at least within the boundary of
the (petro)chemical process industry. Therefore, a work sample containing these control problems is likely to have a high degree of content validity. Results on the content validity of the work sample are presented in secdon 7 .2.
Modular construction of the simulated process
As was specified in our list of requirements (section 4.1) the simulated processin the work sample should be modular, so it can be used as a flexible base for both a selection and a training instrument. In figure 4.1 is shown that the key elementsof the operator's process control task can be considered as building blocks for both a work sample for selection purposes and a work sample for training purposes. The left part of this figure shows the make-up of the work sample for selection purposes. Because of the requirements that a work sample for selec
tion purposes should be suitable for both inexperienced and experienced operators and that time to perform the work sample should not exceed four hours (otherwise it can not be fittedintoa one day selection procedure), it seems appropriate to use separate modules with just partsof a process. So, the instrument should consist of singular modules each containing a separate simulated process part. These modules are illustrated by the small squares in figure 4.1. Each module will introduce a different process-related control problem then, in other words: each of the process parts incorporates a single process-related control problem. This is illustrated by the symbols in the small squares in the figure. These symbols can be also found in table 4.1 where they served to illustrate the control problems. Several exercises will have to be performed with these separate modules in which extemal and task-related control probierus will be introduced through instructions and simulated disturbances. In a training programme these modules cou1d be linked together. This is illustrated by the right part of figure 4.1.

4. Development of the work sample
1. Selection 2. Training
[8 ~ 1~-[01 control probl ms
work sample selection training programme
Figure 4 .1. Outline of the construction of a work sample for either selection purposes or
training purposes.
47

48 Selection by simu/ation
This way the training programme will consist of several training steps, each step introducing a new module containing a new process part and new probierus to be controlled. As a result, complexity is increased during the training process which is allowed to take up a greater period
of time than the selection process. Eventually, all modulescan be connected in order to create a
'total' process to be controlled, consisting of several process parts each containing a different process-related control problem. However, the subject of this thesis is the design of the work
sample forselection purposes .. As was mentioned in section 1.4, the goal of this project is to
develop a valid selection instrumènt for process operators using the work sample approach. Process simulation is used as a basis for the work sample to be designed. We refer to the
epilogue for further discussion on the design of a training instrument based on the same 'building- blocks'.
So far we have gone through the analysis step of the design cycle: we have described
purpose and functions of the 'product' and we have formulated requirements and constraints
(section 4.1). We have also gone through the first pan of the synthesis step: the generation of a provisional design proposal. In this section we have specified some constituents of the
'product': the key elementsof the operator's process control task. We also sketched the global form of the work sample for selection purposes, as shown in the left part of figure 4.1. Now is the moment to give these ideas a physical foundation in the form of a simulated process. This is
the next pan in the synthesis step.

4. Development of the work sample 49
4.3. Process simulation
During the seventies several experiments have been conducted with a process simulator
in the laboratory of the department Technology and Workof the Graduate School of Industrial
Engineering and Management Science at the Eindhoven University of Technology. Until 1983
research with this process simulator was focused on the effects of education, training, alarm presentation and information presentation on operator performance (Kragt, 1983). In most of these experiments a dynamic model of a distillation column was used and the subject interacted
with the simulated process through conventional panel instrumentation. With the start of several new research projects, such as 'Information presentation on VDU's' and 'Process simulation
for selection and training of process operators', a new process simulator had to be built,
because the existing process simulator had too many limitations forthese new research projects. To name just a few (Kuijpers & Leermakers, 1987):
- the process simulator was built on the basis of a fixed (distillation column) model, which was very complex and inflexible;
- compared with modem distributed control systems, too little information on the state of the
process could be presented to the operator;
only a small range of disturbances of the process could be introduced; the process model was notfit for 'abnormal' operations, such as startup or shutdown;
the software was not flexible which seriously restricted extensions to the simulation model;
working memory and disk capacity were insufficient because of increasing input/output and growing data storage.
The process simulator
A detailed description of design philosophy, software and hardware of the newly built
T&W process simulator (simulator of the department Technology and Work) can be found in Kuijpers & Leermakers ( 1987). A global description of this T & W process simulator is included
in Appendix B. Here it suffices to say that this new process simulator meets the following
hardware requirements: real-time simulation and fast response to changing of grapbics and updating of information;
- experimenter intervention in the process from a separate temrinal;
presentation of process data to the operator by VDU's, recorders, printers and facia (both analogue and digitally );
operator interaction with the process by conventional controllers, keyboard or touchscreen.
The software of the T & W process simulator takes care of the following:

50 Selection by simu/ation
experimenter interaction with the process (e.g. start, stop, freeze, restart); operator interaction with the process; data manipulation;
- model calculations. The software is modular, flexible and independent of the hardware. This T&W process simulator then contains the environment in which several different simulated processes can be 'run'.
The simulated process
Before a start was made with designing and programming the simulated process which we would use as a basis for the work sample of the process operator's control task, we specified several requirements: - it had to be possible to model the process; qualitative relations between variables should be
specified: which input variables influence which output variables?;
- it had to be possible to quantify the process; quantitative relations between variables should be specified: what is the magnitude of the effect of an input variabie on an output variable?;
- the process should be modular; the process should consist of simpte operational units from the (petro)chemical process industry;
- the process should contain the process-related control probieros as described in section 4.2. The design of the simulated process can be considered as part of the design process of
the work sample. In the work sample the simulated process serves as the 'material' the process operator works on in reality. The requirements for the simulated process all arise from the process operator's task situation with the exception of the requirement of modular construction of the process, which arises from the need for a flexible basis for the work sample {see section 4.2 and figure 4.1). We also found that for this part of the project- designing the simulated process - the design cycle had to be gone through several times before an end product was reached which possessed most of the desired characteristics. For an extensive description of the design of the simulated process we refer to Geurts (1988) and Cullen (1989). Descriptions of the construction and actual programming of the simulated process can be found in Van der Staay
(1988) and Kluytmans (1989). Here it suffices to say that this simulated process consists of several process parts, such as a heat exchanger, a long pipeline, several tanks, a mixing tank, and a reactor, containing the process-related control problems mentioned insection 4.2: 'series connection', 'time delay/time constant', 'recycling' and 'parallel connection'. Furthermore it was possible to generate both extemal and task-related control probieros by introducing

4. Development of the work sample 51
disturbances into these process parts and varying task instructions. However, through 'trial and
error' we found out that the process part containing the control problem 'recycling' was not
suitable for ioclusion in a work sample for selection purposes for the reason that this process
part was too complex. It would take hours to train and instruct inexperienced operators before they could perform any exercises with this process part. This would vialate two of the requirements we have specified insection 4.1, namely that
the work sample should be suitable for both inexperienced and experienced operators;
- time to perform the work sample should not exceed four hours.
However, the process part containing the control problem 'recycling' can be used in
constructing a training simulator for basic process control skills. We refer to the epilogue for
further discussion on this subject.
Finally, after numerous pilot runs of the several process parts and accompanying
exercises, pilot experiments with students, discussions with 'experts' (operators, instructors)
and pilot experiments with both experienced operators and trainee operators (which are described in section 4.5) we decided which process parts and which exercises were suitable for the work sample for selection purposes. Tagether these process parts form a mixing process.
This mixing process consistsof five modules containing the following process parts: heat exchanger;
heat exchanger with long pipeline;
tank A;
tank A + tank B;
mixing tank.
These simulated process parts which are used as the basis for the work sample are described in Appendix C. For a detailed description of the process technica! backgrounds of the modules that
are used in the work sample we refer to De Vries (1992).
4.4. Performance measures
The next phase in the synthesis step consisted of the development of performance
measures. Performance information in work settings is gathered for many purposes. In our work sample we need performance information for selection purposes. The lirerature on perfor
mance measurement and performance-appraisal systems is vast. Many measurement methods
and appraisal systems have been developed and it seems that there are many different ways to
measure performance. At the most basic level all these different performance data can be placed
into two broad categories. Meister (1985) distinguishes: 1. subjective measurement methods, e.g. observation, sealing techniques and rating methods;

52 Selection by simu/ation
2. objective measurement methods, e.g. time, error and frequency measures. Using a different terminology, Landy & Farr (1983) differentiate judgmental measures of performance, e.g. ratings, from nonjudgmental measures of performance, e.g. production output
or time to complete a task.
Performance measures on a process simulator
Nat only does a process simulator provide the opportunity to create part of the work setting of process operators, it also provides the opportunity to systematically and objectively record performance data. Performance data gathered by means of a process · simulator fall into the category of objective measurement methods or nonjudgmental measures of performance. In terros of the recording of performance data, there can be automatic registration of information requested by the operator and operator actions in relation to the process, such as: opening and closing of valves and starting or stopping of pumps. In addition, data on plant status can be recorded in terros of selected process parameters, alarms activated and so on (Baker & Marshall, 1989). Other performance data that can be recorded by a simulator are time to startup and time to complete a specitïc task, which in turn can be used in the calculation of quantitative standards, such as: cast of startup and cast of production. In addition, subjective data can be gathered by means of interviews and questionnaire responses and by observing the operator while he is performing the simulated tasks.
Although the above shows that in general there is ample opportunity to abserve operator performance in many aspects, it is not so simple to assess and evaluate this performance. We need answers to questions such as: "When is performance effective?"; "What are successful operator actions?"; or "Who is the best operator?". In answering these questions, we need to consider the specifïc task and its constituent elements. However, in any assessment of perfor
mance it is reasanabie to consider bath the accuracy of the performance and the time taken to perform an action (Baker & Marshall, 1989).
Standards of performance in rhe mixing process
As was mentioned in section 4.3 we used a simulation of a mixing process as a basis for the work sample of the process operator's control task. In setting performance standards we need to consicter the specifïc task(s). The exercises with the mixing process can be basically divided in two different kinds:
a. type A exercises in which the operator actively needs to manipulate eertaio process variables in order to reach the required state of the process;

4. Development of the work sample 53
b. type B exercises in which the operator only needs to manipulate certain process variables
when the steady state of the processis disturbed or is threatened to become disturbed. For every process part type A exercises are presenred first. These exercises are meant to give the candidate a 'feeling' for the dynamics of the particular processpart he is working on. An
example of a type A exercise is: "Increase temperature T21 from 57.l'C to 59.2'C". Figure 4.2 illustrates a possible course of a variabie in this exercise (type A variable). The taskis tobring
the variabie as fast as possible toa given value.
+ temperature
Figure 4.2. Example of a control curve of type A variables.
These first kinds of exercises are then foliowed by the type B exercises in which the particular process part is running at a steady state. When all goes well the operator does not need to adjust any variables. Only when disturbances occur, the process will need adjusting in
order to keep the most important process variables within given limits. Usually two alarm limits
are given and the candidate's task is to keep the process running smoothly with the important process variables as close to the specified setpoint as possible, even though disturbances may (and will) occur. These are the exercises that reflect best the process operator's task situation in
the central control room. Figure 4.3 illustrates a possible course of a variabie in this kind of exercise (type B variable).
In both kinds of exercises speed and accuracy are stressed as important factors in successfully accomplishing the exercises. So both speed and accuracy are the standards against which the candidate's performance needs to be judged.
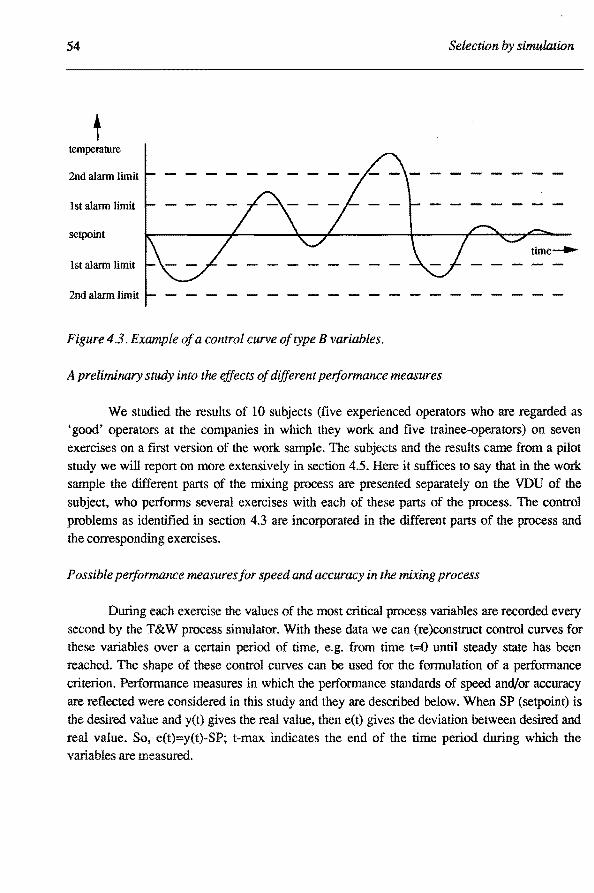
54 Selection by simu/ation
temperature
2nd alarm limit
I st alarm limit
SetpOint
1 st alarm limit
2nd alarm limit
Figure 4.3. Example of a control curve of type B variables.
A preliminary study into the effects of different performance measures
We studied the results of 10 subjects (five experienced operators whoare regardedas 'good' operators at the companies in which they work and five trainee-operators) on seven exercises on a first version of the work sample. The subjects and the results came from a pilot study we will report on more extensively insection 4.5. Here it suffices to say that in the work sample the different parts of the mixing process are presented separately on the VDU of the subject, who performs several exercises with each of these parts of the process. The control problems as identified in section 4.3 are incorporated in the different parts of the process and the corresponding exercises.
Possible performance measuresfor speed and accuracy in the mixing process
During each exercise the values of the most critical process variables are recorded every second by the T&W process simulator. With these data we can (re)construct control curves for these variables over a certain period of time, e.g. from time t=O until steady state has been reached. The sbape of these control curves can be used for the formulation of a performance criterion. Performance measures in which the performance standards of speed and/or accuracy are reflected were considered intbis study and they are described below. When SP (setpoint) is the desired value and y(t) gives the real value, then e(t) gives the deviation between desired and real value. So, e(t)=y(t)-SP; t-max indicates the end of the time period during which the variables are measured.
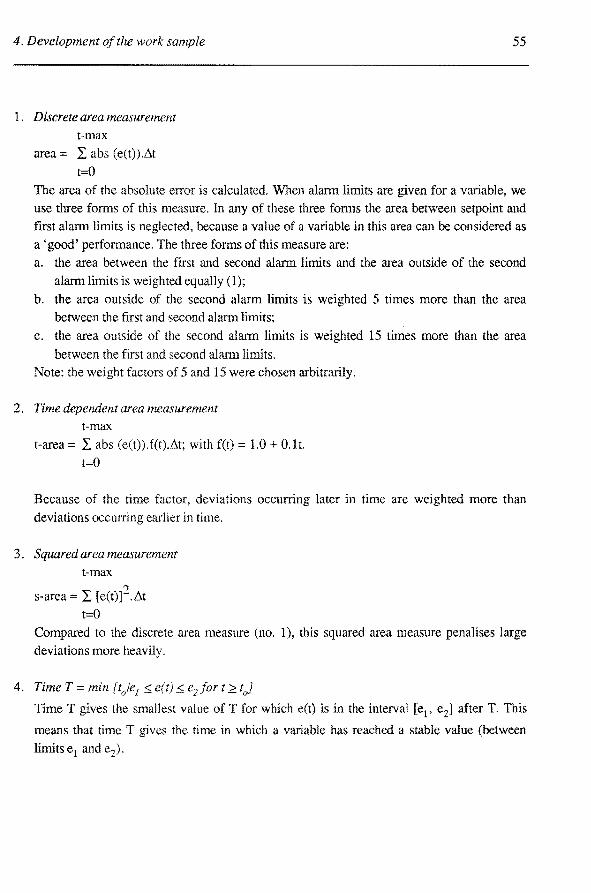
4. Development of the work sample
1. Discrete area measurement t-max
area= I abs (e(t)).l<.t
t=O
55
The area of the absolute error is calculated. When alarm limits are given for a variable, we use three forms of this measure. In any of these three forms the area between setpoint and first alarm limits is neglected, because a value of a variabie in this area can be considered as
a 'good' performance. The three forms of this measure are: a. the area between the first and second alarm limits and the area outside of the second
alarmlimitsis weighted equally (1);
b. the area outside of the second alarm limits is weighted 5 times more than the area between the fust and second alarm limits;
c. the area outside of the second alarm limits is weighted 15 times more than the area
between the first and second alarm limits. Note: the weight factors of 5 and 15 were chosen arbitrarily.
2. Time dependent area me as urement t-max
t-area= I abs (e(t)).f(t).l<.t; with f(t) = 1.0 + O.lt.
t=O
Because of the time factor, deviations occurring later in time are weighted more than
deviations occurring earlier in time.
3. Squared area measurement t-max
s-area = I [e(t)]2.t-..t
t=O Compared to the discrete area measure (no. 1), this squared area measure penalises large
deviations more heavily.
4. TimeT= min {t0/e1 ~ e(t) ~ e2 fort L tJ
Time T gives the smallest value of T for which e(t) is in the interval [e1, e2] after T. This
means that time T
limits e1 and e2).
the time in which a variabie has reached a stabie value (between

56 Selection by simu/ation
5. Num.her of times ofundershoot and overshoot (#ulo) This is a measure of the number of times there is an undershoot and/or oversboot of a variabie relative to its setpoint.
We wanted to study the qualities of these measures and compare them with each other in order to answer questions like: "Is it possible that a candidate obtains a better or worse score compared toanother candidate when we use a different performance measure?"; and "Which measure or combination of measures reflects operator performance best?". In fact, this last question is a matter of construct validity.
Results of comparing different performance measures
As mentioned earlier, we have two different types of variables. Type A variables have to be brought as fast as possible to a required value and have to be kept stabie at that value. The value of type B variables bas to be kept between specified alarm limits for a certain amount of time. This calls for different performance measures. For type A variables we compared discrete area measurement without weighing (no. la), time dependent measurement (no. 2), timeT (no. 4) and number of times of undershoot and oversboot (no. 5). For type B variables we compared discrete area measurement withand without weighing (no. la, no. lb, no. lc) and squared area measurement (no. 3).
Before we were able to compare the scores of the different performance measures, we had to conven the raw scores to standard scores. This was done in the following way. In each exercise and for each performance measure the candidate obtains a raw score on the process variabie that has to be controlled. The smaller this raw score the better the performance (this applies to all performance measures; all types of area measurement, timeTand #u/o). In each exercise the mean raw score of the five experienced operators on the specific variabie is used as a reference score. Then, the raw scores of the candidates are divided by this mean raw score. The higher the result of this division, the worse the performance. For instance, when the result of this division is 3.00 for a certain candidate, it means that the raw score of this candidate is three times higher than the mean raw score of the experienced operators. For the sake of simplicity and the ease of interpretation of the scores, the result of this division is then scaled on a scale from 0 to 10. Figure 4.4 illustrates the sealing of these results.

4. Development of the work sample
8.5 I
10 9 8 7 6 5 4 3 2 0 I I I I I I I I I I
0.0 0.50 1.00 1.50 2.00 2.50 3.00 3.50 4.00 4.50 5.00 .......
Figure 4.4. Sealing on a scale from 0 to JO of the results of the division of candidates'
raw scores by the experienced operators' mean raw scores.
57
Aresult between 0.00 and 0.50 is scaled as a 10 (highest score), aresult between 0.50 and
1.00 is scaled as a 9, etc. Finally, aresult of 5.00 or higher is scaled as a 0 (lowest score). It can be seen in this figure that the mean raw score of the experienced operators is equated with
8.5. Therefore, scores of 8 or 9 are indicative of the performance of experienced operators who
are regardedas 'good' operators at the companies in which they work.
Table 4.5. Results ofthe correlational analysis of type A variables.
t-area area (a) T #u/o
t-area area (a) .93
T .75 .58
#ulo -.14 -.24 .13
Table 4.5 shows the results of the correlational analysis of the standard scores of the four performance measures we used for type A variables. It shows strong correlation between t
area, area (a) and T, while we find low correlation between #ulo and the other three measures. It
seems that the number of times there is an undershoot or oversboot is a totally different
performance aspect.
Table 4.6. Results ofthe correlational analysis of type B variables.
s-area area (a) area (b) area (c)
s-area area(a) .95
area (b) .97 .98
area (c) .97 .97 .99
Table 4.6 shows the results of the correlational analysis of the standard scores of the

58 Selection by simu/ation
four performance measures we used for type B variables. We find strong correlations between all measures. This means that there are hardly any differences in scoring ratios between candidates, regardless of which performance measure is used.
Inspeetion of the standard scores of the subjects reveals that there is hardly more than a I-point difference between the measures. However, there are a few exceptions. Figure 4.5 shows the standard scores of the five trainee-operators on one variabie from the same type B exercise as calculated by the four different performance measures. It not only shows that candidate no. 2 has the lowest score for every measure, but it also reveals a 5-point difference between different measures for this candidate. When discrete area measurement (a) is used, this candidate obtains a score of 5, while with discrete area measurement (c) or squared area measurement he obtains a score of 0.
s-area area(a) area (b) area(c)
-m- candidate 5 -+- candidate 4
candidate 1 + candidate 3
candidate2
Figure 45. Standardscores of jive trainee-operators on one· variabie as calculated by different measures
Choosing 'best' performance measures
First of all, it is important to note that we have to be careful with drawing definite conclusions from the above. More research is needed, especially with more data, before we can explicitly answer the questions raised earlier in this section. Nonetheless, this preliminary study into the effects of different performance measures bas provided us with some worthwhile insights. When we inspeet tables 4.5 and 4.6 the first thing that comes to rnind is that is does not really matter what measure is used (with the exception of #u/o). The end result will be more or less the same. The rank order between the candidates remains the same, regardless of what measure is used. This is an indication of the robustness of these measures.

4. Development ofthe work sample 59
However, in a work sample approach the choice concerning what performance measures
to use should also depend on considerations with regard to the utility of performance. For instance, we should take into consideration what potential damage is related to what control behaviour. Discussions with experts on process control have brought about the notion that it all
depends on the specific process that has to be controlled and the task situation. In our case: it depends on the instructions and the specific exercises in the work sample. However, very large
deviations from setpoint are usually very darnaging for almost all processes. Therefore, this should be expressed by the performance measure chosen. In the work sample the task in type B exercises is to keep the value of the (type B) variables between specified alarm limits for a certain amount of time. We have chosen area measurement, because it takes into account the
deviations from setpoint. The higher the score, the worse the performance. However, squared area measurement and area measures with differential weighing for the area outside the alarm
limits penalise large deviations even more. Indeed, for some candidates we found a clear
difference in standard scores on the measures for type B variables. We found large variations in scores, as calculated by the different measures, for candidates who performed the worst. Usually, we found the lowest scores for the squared area measure. As mentioned earlier, it is clear that large deviations from the setpoint are penalised more by this measure than by discrete area measurement. Because the error is squared, the larger the deviation the higher the score.
On the other hand, deviations less than one measurement unit (e.g. < 1 'C) are penalised less by squared area measurement, regardless of any alarm limits. When a first alarm limit is set for deviations of more than 0.2'C from the setpoint and a second alarm limit for deviations of more than 0.5'C from the setpoint, it would be logical to incorporate this in the measure used.
Because several exercises in the work sample involve alarm limits set below one measurement unit, the squared area measure is not the best choice in this case. Deviations outside the second
alarm limits are most penalised when discrete area measurement is used with a weight factor for the area outside these alarm limits. However, when we compare the scores of the area measures with different weight factors attached to the area outside the second alarm limits, we hardly find any differences. The few differences that do occur, occur with very large deviations from the setpoint. Then, the lowest score is the one calculated with the discrete area measure with weight factor 15 (see tigure 4.5). Further research is needed to find out which weight factor gives the 'best' results. 'Best' result should be defined in termsof 'most realistic' score. One approach could be to campare experts' judgments of control curves with scores calculated by different measures. However, this would require more time (one of the restraints in our list of requirements) than we actually have in designing the work sample! So, our approach is to choose for
discrete area measurement of type B variables in this phase of the project and to postpone the choice concerning the weight factor that should be attached to this measure. In conducting the

60 Selection by simu/ation
concurrent validity studies with the work sample, different weight factors will be employed in
calculating the results. So, the effect of this differential weighing will be examined again with more subjects and more data (see chapter 6). Then, a definite choice will be made concerning the performance measure for type B variables.
For type A variables (in type A exercises) the choice seems to be between two types of area measurement and simple time measurement. Analysis of the control curves of the subjects shows that number of times of undershoot or oversboot is not indicative for either good or bad performance. A re-examination of the purpose of the type A exercises in the work sample (see also section 4.3) shows that these exercises are meant to give the candidate a 'feeling' for the dynamics of the particular process pan he is working on. For every process part type A
exercises are presented first. The task in these exercises is to bring a certain process variabie as fast as possible to a given value. The exercise is finished when this value bas been reached precisely. When we take the specific taskof these types of exercises into consideration, timeT seems to be the performance measure that is most appropriate. Therefore, we have chosen to apply time Tas the performance measure in the type A exercises.
4.5. 'Tuning' the work sample
In this phase of the design process we have completed the synthesis step: after numerous pilot runs of the several process parts, try-outs of several exercises, pilot experiments with students and discussions with 'experts' (operators, instructors) we have developed a :frrst version of the work sample. We will proceed now with the simulation step of the design cycle.

4. Development of the work sample 61
Afirst version
For a first version of the work sample the simulated process parts as described in Appendix C were used as a basis. This first version consisted of five modules: a. heat exchanger; b. heat exchanger with long pipeline; c. tank A; d. tank A + tank B; and e. mixing tank. It contained a total of 20 exercises: 14 exercises in which the operator actively needed to manipulate certain process variables in order to reach the requested state of the process (type A exercises) and six exercises in which the operator only needed to manipulate eertaio process variables when the steady state of the process was disturbed or was threatened to become disturbed (type B exercises). Type A exercises are meant to give the candidate a 'feeling' for the
dynamics of the particular process part he is working on. They can be considered as 'practice' exercises. They are foliowed by the type B exercises. The results on these exercises were used to calculate the scores in a pilot experiment, because these are the exercises that reflect best the process operator's task situation in the central control room (see secdon 4.4). The pilot experiment was conducted with five experienced operators and seven trainee-operators of four different companies from the (petro)chemical industry in order to find out whether the first version of the work sample fulfilled somebasic requirements which are described below. If not, this first version could be adjusted before validity studies would be conducted. We named this the 'tuning' of the work sample. For a detailed description of this pilot experiment we refer to
Ridderbos (1990). Here it suffices to describe the main purpose and the most important results. In termsof the design cycle this pilot experiment marks the beginning of the simulation step.
Purpose ofthe pilot experiment
The main purpose of the pilot experiment was to exarnine the discriminating power of
the first version of the work sample. When the right skilis are being measured, experienced operators, whoare regardedas 'good' operators at the companies in which they work, should perform better than trainee-operators. Furthermore, it can be expected that the varianee in scores of experienced operators will be smaller that the varianee in scores of the trainee-operators. This is caused by the 'restriction of range' effect. The group of experienced operators will be more
homogeneaus with respect to process control skilis than trainee-operators, because of the 'natural selection' that has been taking place over the years in the companies. Also, in this pilotexperiment the face validity of the first version was examined and instructions, exercises, keyboard and information presentation on the VDU was evaluated. Both experienced operators
and trainee-operators completed a questionnaire on these subjects. In terms of the design cycle: hypotheses about some real characteristics of the provi-

62 Selection by simu/ation
sional design proposal were tested in this pilot experiment during the simulation step of the
design process. The hypotheses were: a. experienced operators (eo) will petform better than trainee-operators (to):
lleo > llto;
b. varianee in scores of experienced operators will be smaller than that of trainee-operators:
cr2 eo <dl to·
Furthermore, we expected to find a favourable evaluation of the face validity of the work sample, since a great deal of effort had been spent on identifying the key elements of the
process operator's control job in order to create a representative work sample (see the previous
s~ctions).
Results of the pilot experiment
The scores presented here are standard scores. Raw scores per exercise are based on the control curve of thè specific process variabie the operator had to keep close to the setpoint. The
raw score per operator per exercise consists of the area of the control curve outside the first alarm limits (discrete area measure (a); see section 4.4). Raw scores are converted to standard
scores by using the mean raw score of the five experienced operators in each exercise as a
reference score. The raw scores of the candidates are divided by this rnean raw score. The result
of this divisionisthen scaled on a scale from 0 to 10 (see tigure 4.4 of section 4.4).
mean 9
score 8
7
6 -o- trainee-operators
5 "*' experienced operators
4
3
2
2 3 4 5 6 '~o.'t exercise
Figure 4.6. Mean standard scores per exercise per group of operqtors
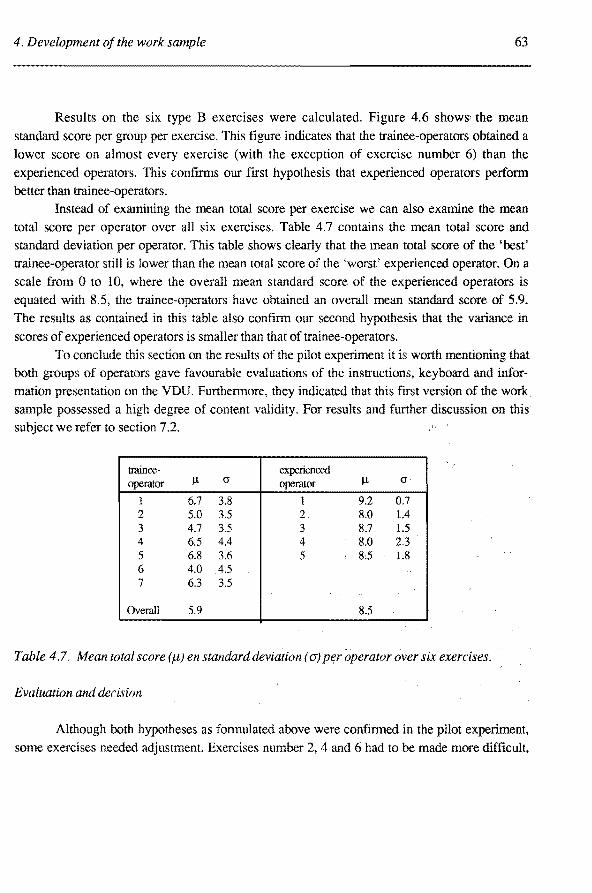
4. Development ofthe work sample 63
Results on the six type B exercises were calculated. Figure 4.6 shows' the mean
standard score per group per exercise. This tigure indicates that the trainee-operators obtained a lower score on almost every exercise (with the exception of exercise number 6) than the
experienced operators. This confmns our first hypothesis that experienced operators perfarm better than trainee-operators.
Instead of examining the mean total score per exercise we can also examine the mean total score per operator over all six exercises. Table 4.7 contains the mean total score and standard deviation per operator. This table shows clearly that the mean total score of the 'best' trainee-operator still is lower than the mean total score of the 'worst' experienced operator. On a scale from 0 to 10, where the overall mean standard score of the experienced operators is equated with 8.5, the trainee-operators have obtained an overall mean standard score of 5.9. The results as contained in this table also confirm our second hypothesis that the varianee in scores of experienced operators is smaller than that of trainee-operators.
To conclude this section on the results of the pilot experiment it is worth mentioning that both groups of operators gave favourable evaluations of the instructions, keyboard and information presentation on the VDU. Furthermore, they indicated that this ftrSt version of the work sample possessed a high degree of content validity. For results and further discussion on this subject we refer to section 7 .2.
ttainee- experienced operator Jl (J operator Jl (J
l 6.7 3.8 1 9.2 0.7 2 5.0 3.5 2 8.0 1.4 3 4.7 3.5 3 8.7 1.5 4 6.5 4.4 4 8.0 2.3 5 6.8 3.6 5 8.5 1.8 6 4.0 4.5 7 6.3 3.5
Overall 5.9 8.5
Table 4 .7. Mean total score (Jl) en standard deviation ( CJ) per operator over six exercises.
Evaluation and decision
Although both hypotheses as formulated above were confirmed in the pilot experiment, some exercises needed adjustment. Exercises number 2, 4 and 6 had to be made more difficult,

64 Selection by simulation
e.g. by introducing either an extra disturbance into the exercises or more fluctuation in already
employed disturbances. This should increase the discriminaring power between experienced
operators and trainee-operators. However, at the same time we should be carefut that this
should not decrease varianee in scores between trainee-operators. A decrease in the varianee in
scores between trainee-operators would diminish the discrirninating power of the work sample.
This, of course, should be avoided.
Furthermore, it was decided to include two more type B exercises into the work sample,
so that the four modules- 'heat exchanger', 'heat exchanger with long pipeline', 'tank A+ tank
B' and 'mixing tank'- each contain two type B exercises. In order to stay within time lirnits the
type A exercises had to be limited then to two per module. In this way, a more balanced mixture
of type A and type B exercises in the work sample was obtained. So, in the next provisional
version of the work sample each module will start with two type A exercises. As we have
mentioned earlier, these exercises are meant to give the candidate a 'feeling' for the dynamics of
the partienlar process part he is working on. Then, for each module, except the module with 'tank A', two type B exercises will be presented.These are the exercises in which the particular
process part is running at a steady state. When all goes well the operator does not need to adjust
any variables. Only when disturbances occur, the process will need adjusting in order to keep
the most important process variables within given lirnits. Two alarm lirnits are given and the
task of the candidate is to keep the process running smoothly with the important process
variables as close to the specified setpoint as possible, even though disturbances may (and will)
occur. Because the module 'tank A' is neededas an introduetion for the module 'tank A+ tank
B' and two type A exercises accompany the module 'tank A' we have a total of 10 type A
exercises and 8 type B exercises in the next provisional version of the work sample for process operators. This version is described in Appendix D. This appendix also indicates how the
control probieros are incorporated into the exercises.
Finally, this version of the work sample, which is still a provisional design proposal, is
tested in several validity studies. The design of these validity studies has been described in
section 3.2. These validity studies can be considered as part of the simulation step of the design
cycle (see figure 3.4). In these validity studies, the requirements of reliability and validity are
tested. The results on these subjects are presented in chapter 5 and 7, respectively. In chapter 6,
the design and development of the criterion measure is described. Of course, this design
process also involves all steps of the design cycle. However, in the designprocessof the work
sample we will continue now with the simuiadon step of the design cycle.

Chapter 5.
Reliability of the work sample
In this chapter, results of the four validity studies are presented as far as they refer to
the reliability of the work sample. For a general description of the concept of reliability and
the different types of reliability we refer to Technica! Appendix A. The results are discussed
in a concluding section and they indicate that the reliability of the work sample is sufficient.

66 Selection by simu/ation
5.1. Reliability measures
During the four validity studies data have been gathered which can be used to
calculate several reliability coefficients (see for the design of these validity studies section 3.2). During the two predictive validity studies we have adrninistered the work sample twice to the trainee-operators with a six month time period in between. So, for these studies it is possible todetermine test-retest relio.bility. Care should be taken in interprering these testretest reliability coefficients though, because the extent to which the work sample is affected by repetition is not known yet. Additionally, the data gathered in both the concurrent and predictive validity studies can be used to determine split-half relio.bility. Because the work sample has been adrninistered twice in the two predictive validity studies it is possible to calculate four split-half reliability coefficients: in each study one for the fust administration of the work sample and one for the second administration of the work sample. For each of the two concurrent validity studies, in which the work sample has been adrninistered just once, one split-half reliability coefficient can be calculated.
The other types of reliability as described in Appendix A can not be determined for the work sample. Inter-rater reliability is not appropriate because the measurements do not take the form of judgments. Furthermore, inter-item consistency is impossible to determine because of the nature of the scores on the work sample. For a detailed description of the measures used in calculating the raw score per exercise and the procedure for converting these raw scores to standard z-scores we refer to Appendix E. Here it suffices to say that the raw scores on the different exercises have to be converted to standard scores before it is possible to campare them. We have chosen to use standard z-scores. Because the varianee of the separate 'items' (exercises) equals 1.0 in the standard z-scores, it does not make sense to use Cronbach's coefficient alpha in calculating inter-item consistency. To use the variances of the raw scores in this computation is no salution to the problem either, because when raw scores are used it is impossible to calculate a total score for the work sample. Consequently, the varianee of a total score, needed in computing Cronbach's coefficient alpha, is unknown. Therefore, inter-item consistency can not be determined. Finally, because of practical (time) and economical constraints we have not constructed a parallel form of the work sample. Hence, parallel form reliability is not determined.
5.1.1. Test-retest reliability
Two predictive validity studies were conducted with trainee-operators of two different companies from the (petro)chernical industry. We will refer tothese companies as Petco and Trainco. In both studies the work sample was administered twice to the traineeoperators with a six month time period in between.

5. Reliability of the work sample 67
Suhjects and procedure
The trainee-operators from Petco were new employees of this company who all started working at this company in the time period between june 1990 and february 1991. These trainee-operators (a total number of 16) were recruited mostly from technica! schools (intermediate level; in Dutch: MTS). At the company they receive individual on-the-job training. The work sample was administered twice to 15 trainee-operators (one trainee
operator left the company within half a year of recruitment). The fust administration of the work sample took place within two months of employment, the second administration six months thereafter. An overview of mean age and educationallevel of these trainee-operators is contained in table 5.1.
The trainee-operators from Trainco were students at the company school of this company. The education at this school takes two years during which the students are instructed in both theory and practice of process con trol. During these two years they obtain
Vapro A, Band C certificates.
Table 5.1. Mean age (in years) and educational level of trainee-operators (number of suhjects whocompiered this type of school) in the two participating companies
Meanage Educationallevel
MAVO HAVO vwo MTS MAVO*
Pctco 21.7 1 11 3*
Trainca 19.3 22 7 2
* these trainee-operators had compieled MAVO compiemeneed with Vapro A +B certificates
The students at this company school are usually recruited from general secondary schools (intermediate level; in Dutch: MAVO, HAVO). Incidentally, students who have completed higher level general secondary schools (in Dutch: VWO) start their education in process
control at the company school. Two classes of studems were studied. Class 1 started school in 1989 with 15 students and class 2 started school in 1990 with 20 students. The work sample was administered twice to 13 students of class 1 and to 18 students of class 2. In both classes two students left school after four months. For both classes the work sample was administered four months after school started and six months later. The students from both classes have been taught exactly the same courses from the same school curriculum.
The work sample was administered in identical fashion and all other things surrounding the study have been the same for both classes. Furthermore, we have tested if the two classes performed in the same way on the first administration of the work sample. We have

68 Selection by simu/ation
perfonned the Wilcoxon 2-sample test (nonna! approximation; with continuity correction of .5) for the two classes on the ranks of the three types of total scores: total score over type A exercises (Total-A), total score over type B exercises (Total-B) and total score over all
exercises (TOT AL) (see section 4.5 fora description of the type A and type B exercises).
Table 5.2. Results ofthe Wilcoxon2-sample test on the three types oftotal scores: Total-A, Total-Band TOT AL.
Wilcoxon scores (rank sums) for variabie Total-A classified by variabie Class
Class N Sumof Expected Std Dev Mean scores underH 0 underH 0 score
1 13 212.0 208.0 24.98 16.31 2 18 284.0 288.0 24.98 15.78
S=212.00 Z=O.l4 Prob > IZI = 0.89 ---- --- - - ---
Wilcoxon scores (rank sums) for variabie Total-B classified by variabie Class
Class N Sumof Expected StdDev Mean scores underH 0 underH 0 score
1 13 186.0 208.0 24.98 14.31 2 18 310.0 288.0 24.98 16.78
S=l86.00 Z=-.86 Prob > IZI = 0.39 ---- --- - ----
Wilcoxon scores (rank sums) for variabie TOT AL classified by variabie Class
Class N Sumof Expected StdDev Mean scores uncterH0 underH0 score
1 13 194.0 208.0 24.98 14.92 2 18 302.0 288.0 24.98 16.78
5=194.00 Z=-.54 Prob > IZI = 0.59
Table 5.2 contains the results of the Wilcoxon 2-sample tests on these total scores. None of these tests revealed a significant effect for the variabie 'class'. So, we decided to calculate and present the results of these two classes together in order to have a larger group (31 students) in our statistica! analyses. For this group of trainee-operators from Tminco the overview of mean age and educationallevel is also contained in table 5.1. This table shows that the main difference between the trainee-operators from Petco and Trainco is their

5. Reliability of the work sample 69
educational level. All - but one - trainee-operators from Petco have completed either a technica! school (intermediate level) or a general secondary school supplemented with Vapro
A and B certificates. The trainee-operators from Trainco all have completed general secondary schools (mostly at intermediate level) and are now studying for Vapro certificates at the company school. Furthermore, there is a mean age difference of two years between
these groups. Each trainee-operator has visited the laboratory at the University twice for an
individual session with the work sample. Each session took three to four hours. In the laboratory a central control room of a chemical plant was simulated, containing a console, an overview of the simulated process, a PC, a VDU on which the process was displayed and a keyboard for controlling the process. Next to this simulated central control room was the experimenter's room with VDU's and keyboard for controlling the experiment. Figure
5.1 shows the simulated central control room in the laboratory of the department Technology and Work, Graduate School of Management Science and Industrial Engineering at Eindhoven University of Technologyin which the trainee-operators performed the exercises
in the work sample.
Figure 5.1. Simulated central control room in the Labaratory
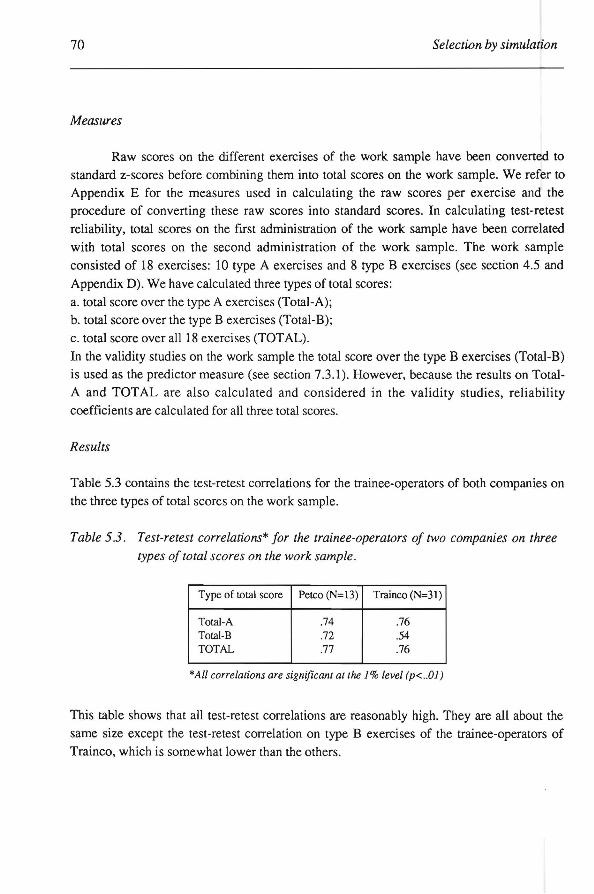
70 Selection by simu/ation
Measures
Raw scores on the different exercises of the work sample have been converted to
standard z-scores before combining them into total scores on the work sample. We refer to Appendix E for the measures used in calculating the raw scores per exercise and the procedure of converting these raw scores into standard scores. In calculating test-retest
reliability, total scores on the frrst adrninistration of the work sample have been correlated
with total scores on the second administration of the work sample. The work sample
consisted of 18 exercises: 10 type A exercises and 8 type B exercises (see section 4.5 and Appendix D). We have calculated three types of total scores:
a. total score over the type A exercises (Total-A); b. total score over the type B exercises (Total-B);
c. total score over all 18 exercises (TOT AL).
In the validity studies on the work sample the total score over the type B exercises (Total-B) is used as the predietor measure (see section 7.3.1). However, because the results on TotalA and TOT AL are also calculated and considered in the validity studies, reliability coefficients are calculated for all three total scores.
Results
Table 5.3 contains the test-retest correlations for the trainee-operators of both companies on
the three types of total scores on the work sample.
Table 5.3. Test-retest correlations* for the trainee-operators of two companies on three
types oftotal scores on the work sample.
Type of total score Petco (N=l3) Trainca (N=31)
Total-A .74 .76 Total-B .72 .54 TOT AL .77 .76
*All correlations are significant at the 1% level (p< .. OJ)
This table shows that all test-retest correlations are reasonably high. They are all about the
same size except the test-retest correlation on type B exercises of the trainee-operators of
Trainco, which is somewhat lower than the others.

5.Reliability ofthe work sample 71
Gain in scoresfromfirst to second administration ofthe work sample
Befare interpreting the test-retest reliability coefficients, we would like to know the
extent to which the work sample is affected by repetition. It holds for almast every test that scores imprave on a second adrninistration. People learn from the test itself. The question is then: how much do they learn? How much dotheir scores improve? To answer this question for the work sample we have compared the scores on the first administration with the scores on the second administration of the work sample. To obtain the gain in scores, expressed in
terros of a, we need to transfarm the scores of the two adrninistrations in such a way that they can be compared to each other. Right now scores have been standardised per exercise per administration. We have chosen the scores of the second administration as a reference
set. Standard z'-scores have been computed for the first administration using ~ en a of the second administration. For the standard z-scores per exercise of the second adrninistration
holds per definition: ~=0 en cr=l. We expect an increase in performance from the first to the second administration. So, we expect to find higher scores (=worse performance in the work sample) on the first administration. Consequently, we expect for most exercises a ~>0 for the standard z'-score.Table 5.4 contains the means per exercise of the standard z'-scores
for the first administration of the work sample for both groups of trainee-operators. This table indicates indeed a better performance on all - but one - exercises at the second adrninistration of the work sample. All means - except that of exercise number 14 - are larger than zero.
For the trainee-operators of Petco we find a gain in scores from the first to the second adrninistration of the work sample of more than one standard deviation above the
mean for exercise number 7. A gain of more than two standard deviations is found for exercise number 10. However, foreleven exercises we find a gain in scores of less than half a standard deviation. For the trainee-operators of Train co we find a gain in scores of more
than 1 standard deviation above the mean for exercises number 1, 4 and 5. For this group of operators we find forten exercises a gain in scores of less than half a standard deviation.
Overall (average over the 18 exercises) we find a gain in score of .59a for the
trainee-operators of Petco and a gain in score of .54cr for the trainee-operators of Trainco. So, for the mean total score on the work sample we find for both groups of traineeoperators a gain in score of a bout half a standard deviation.

72 Selection lJy simulation
Table 5.4. Means per exercise of the standard z'-scores of the first administration of the work sample for both groups of trainee-operators.
Excercise Mean standard z'-score
Petco (N=13) Trainco (N=31)
1 .60 1.60 2 .32 .51 3 .84 .85 4 .85 1.21
s .45 1.23 6 .30 .08 7 1.22 .21 8 .29 .23
9 .97 .83 10 2.40 .59
11 .43 .78 12 .07 .16 13 .68 .39 14 -.OS -.08
15 .19 .34 16 .33 .19 17 .47 .24 18 .17 .39
Overall .59 .54
5.1.2. Split-half reliability
Because the work sample was administered twice during the two predictive validity studies with trainee-operators, four split-half reliability coefficients have been calculated: in each study one for the first administration of the work sample and one for the second administration of the work sample. For each of the two concurrent validity studies with experienced operators, in which the work sample was administered just once, one split-half reliability coefficient has been calculated.
Subjects and procedure
Subjects and procedure of the two predictive validity studies with trainee-operators from Petco and Trainco are the same as described in section 5.1.1.
Subjects of the two concurrent validity studies to whom the work sample was
5. Reliability of the work sample 73
administered were 41 experienced operators from a chemica! plant at Chemco and 53 experienced operators from a petrochemical plant at Petco. In both studies the work sample was administered in a special cabin on the premises of the company at a location close to the central control room. The computer with the simulated process, VDU's and keyboards (for both operator and experimenter) were installed in this cabin for two months. During this period the work sample was administered to each operator individually, either during morning or aftemoon shifts. Each operator got four to five hours off from work to perform the exercises on the work sample and fill out two questionnaires (results on these questionnaires concern the validity of the work sample and are presenred in chapter 7).
Measures
In calculating split-half reliability, the work sample was divided into two halves. These halves were correlated with each other. Care was taken to di vide the work sample into two comparable halves. Because the work sample consists of five modules containing different process parts (see Appendix D) and two different types of exercises, both types of exercises belonging to different modules are equally divided over both halves. The variabie 'Half 1' comains exercises 1, 3, 6, 8, 9, 11, 1 3, 16 and 18 and the variabie 'Half 2' contains exercises 2, 4, 5, 7, 10, 12, 14, 15 and 17. Because the work sample contains two different types of exercises: type A to get familiar with the specific process part and type B to keep the process running smoothly, we also computed split-halfreliability coefficients for these two types of exercises separately. The reason for this is to find out whether any differences occur on these exercises between trainee-operators on the one hand and experienced operators on the other hand. The variabie 'Type-Al' contains exercises 1, 6, 9, 11 and 16 and the variabie 'Type-A2' contains exercises 2, 5, 10, 12 and 15, while the variabie 'Type-B 1' comains exercises 3, 8, 14 and 17 and the variabie 'Type-B2' comains exercises 4, 7, 13 and 18.
Because the split-half reliability is a coefficient for one half of the test, the Spearman-Brown formula has been used in correcting reliability computed by the split-half metbod (Anastasi, 1976).
Results
Table 5.5 comains the split-half reliability coefficients over all exercises and over type A exercises and type B exercises separately for the two administrations of the work sample to the trainee-operators of Petco and Trainco. This table shows that all split-half reliability coefficients are considerably high.

74 Selection by simu/ation
Table 55. Split-half reliability coefficients for the two administrations of the work sample to the trainee-operators of Pet co (N-13) and Trainco (N=31 ).
Type of 1 st administration 2nd administration exercise worksample worksample
Petco Trainco Petco Trainco
Type-A .91 .77 .76 .79 Type-B .73 .77 .71 .65 All .94 .84 .91 .86
Table 5.6 contains the split-half reliability coefficients over all exercises and over type A exercises and type B exercises separately for the administration of the work sample to the chemical plant operators of Chemco and the petrochemical plant operators of Petco. This table shows considerably high split-half reliability coefficients for the administration of the work sample at Petco, while the coefficients for Chemco are somewhat lower. In the next section these results will be discussed.
Table 5.6. Split-half reliability coefficients for the administration of the work sample to the operators of C hemco and Petco.
Type of exercise Chemco (N=41) Petco (N=53)
Type-A .44 .81 Type-B .72 .87 All .58 .90
5.2. Discussion and conclusions
All test-retest correlations for the trainee-operators of both companies are moderately high. They are allabout the same size (around .75) except the test-retest correlation on the type B exercises of the trainee-operators of Trainco, which is somewhat lower than the others (.54). However, the overall impression of the test-retest reliability of the work sample is quite favourable. We find a meaningful relationship between the scores of the flfSt and second adtninistration of the work sample. We have found a good half standard deviation gain in score for the mean total score of both groups of trainee-operators. This means that they do learn from the first administration of the work sample. Because these subjects are trainee-operators they could have really leamed in the time period between test and retest (although they have not been trained specifically on practical process control skills). However, the increase of half a standard deviation is not so exceptional. Algera
5. Reliability ofthe work sample 75
(1977) also found a gain in scores of half a standard deviation on retest sessions with the General Aptitude Test Battery (GA TB). This is one of the most widely used 'paper-andpencil' aptitude tests. Results on gain in scores in retesting on work samples are not known to the author. For some exercises we have found a gain in scores of more than one standard
deviation. A closer inspeetion of our data reveals that these considerable gains are caused by the test performance of a few individuals, who for some reason 'flunked' these exercises.
Because of the small samples in our study, the results are influenced heavily by the performance of these few individuals.
Split-half reliability is quite high for the trainee-operators of both companies and the experienced operators of Trainco (around .90 over all exercises). Split-half reliability for the experienced operators of Petco is somewhat lower (.58). Closer inspeetion of our data has not brought about a possible explanation for this deviating result. Dividing the exercises
differently over the two halves of the work sample (but still taking care that comparable halves are obtained), gave about the same coefficients. This result emphasises even more the homogencity of the work sample. So, based on the results of these studies it is reasanabie to conclude that there exists a meaningful relationship between the scores on the two
halvesof the work sample. When both test-retest correlations and split-half reliability coefficients are con
sidered, the condusion is justified that the reliability of the work sample is sufficient.
Chapter 6.
Development of the measure
criterion
This chapter starts with some general remarks about criterion development and ratings as criterion measures. To determine the relationship between the perlormance of pro
cess operators on the work sample and the perlormance of operators on process control in
reality, a perlormance appraisal system is needed to compare the results on the work sample with the results in real life situations. In this chapter, the design process of such a
perlormance appraisal system, a Behaviour Observation Scale (BOS) for process operators,
is described. This BOS will be used as the criterion measure in the validity studies on the
work sample. The chapter ends with the presentation of the results of these validity studies
as far as they refer to the reliability of this Behaviour Observation Scale. The results indicate
that the reliability of the BOS is sufficient.

78 Selection by simu/ation
6.1. Criterion development
It is impossible to apply tests in a meaningful way by simply interprering test scores without reference to some extemal criteria to which they relate (Greuter & Algera, 1989).
Therefore, these authors fmd it very surprising to see how little attention has been given to
constructing and operationalising (multiple) criteria. We also like to stress the importance of using reliable criterion measures. Far too often, low validity for selection tests has been found due to the lack of reliability of the criterion measures used In these instances, correlations between tests and criterion measures are heavily 'attenuated' because of the unreliability of the criterion measures. Before specifying requirements for operationalising criterion measures, let us first define the concèpt of criterion measure. Many authors have defined the concept of criterion measure differently, but we agree with Greuter & Algera according to whom all these different definitions converge to one central meaning:
a criterion is a me as ure of success fora given activity. These authors also mention the fact that job performance usually is a complex and multidimensional activity. It reflects various independent aspects. Therefore, they argue for
developing and using multiple criteria, especially when prediering future work behaviour. However, a single overall criterion will still suffice when a final decision about applicants is called for (e.g. acceptance or rejection).
Greuter and Algera have put forward three requirements for operationalising a criterion: 1. relevance: the extent to which an index of success as applied is related to the true order of
success in a given activity;
2. reliability: the amount of agreement between different performance evaluations at different periods of time and/or with different although apparently similar measures;
3. practicality: the extent to which a given criterion can be made available in an economie way and has enough transparency and acceptability to those who want to use it for making decisions.
Cascio (1989), in putting forward requirements of effective appraisal systems, separates acceptability from practicality. Acceptability is considered the most important requirement of all. For if appraisal systems do nothave the support of those who will use them, they will be used wrongly or not used at all. In our opinion this also applies to criterion measures as far as they contain some forrn of performance appraisal. Practicality then refers to the ease of onderstanding and using appraisal instruments. Furthermore, Cascio also adds sensitivity to the list of requirements. Sensitivity refers to the discriminating power of
appraisal systems. It is important that appraisal systems - and again, the same applies to criterion measures - distinguish between effective and ineffective performers. Therefore, we like to add 4. acceptability;

6. Development of the criterion measure 79
5. sensitivity
to the list of requirements for operationalising a criterion.
Classijïcation of criterion measures
Various authors have tried to classify criterion measures. Greuter & Algera (1989) mention a classification scheme of Srnith (1976) in which three dimensions seem to cover
most criteria: 1. time-span covered: criterion measures can be obtained either very soon after actual on
the-job behaviour has occurred or many years afterwards; 2. desired specificity: some criteria refer to specific instances of behaviour, while others
give rise to a global estimate;
3. degree of closeness to organisational goals to be approached: criteria range from the
description of actual behaviour, through the evaluation of immediate results, to estimates of the pay-off for the organisation.
Although these dimensions indeed seem to cover most criteria, it nonetheless will simplify our discussion on rating scales in the next section to mention here the criterion categones Landy & Rastegary (1989) found in their extensive review of the literature from 1980 through 1986 in the area of criterion measurement. These authors distinguish the following distinct classes of criterion measures: 1. ratings: e.g. supervisory ratings, self ratings, peer ratings;
2. objective measures of productivity: e.g. number of units produced, amount of time necessary to produce a unit, number of errors that occur in producing each unit;
3. ancillary measures of performance: e.g. absenteeism, turnover, accidents;
4. knowledge tests: e.g. paper and pencil task mastery tests;
5. hands-on measures: e.g. work samples. Supervisory ratings continue to be the most widely used - and abused! - type of criterion
measure. In the next section we will discuss ratings in more detail. We willend this section with some remarks about the other classes of criterion measures. According to Landy & Rastegary, objective measures have been unattractive for several reasons. First, there are relatively few jobs where employee performance can be characterised using objective measures of performance that are not trivia!. Second, most jobs require some interaction among workers. As a result, workers are not individually responsible for the 'production'.
So, there is really no unique criterion variabie to match with the predietor score. Problems with the ancillary measures of performance have to do with the infrequent occurrence of these measures and questions about their specitïc meaning. Although knowledge tests are widely used as criteria for training studies and also frequently used as predietors of future
work performance, they are seldom used as criteria in selection studies. The problem with knowledge tests as criteria is that they describe the necessary but not sufficient condition for

80 Selection by simu/ation
effective performance: they represent what the worker might or could do, but not what he or
she will door has done. Finally, Landy & Rastegary consider the work sample as the most promising 'hands-on' criterion measure. The attractive characteristics of a work sample as
predietor also apply when it is used as criterion measure:
l. it is a carefully developed and clearly delirnited piece of the entire job; 2. it is selected and developed to represent a centralor important part of the job;
3. it is adrninistered in carefully controlled conditions that permit accurate observation of
behaviour and standardisation of equipment and environment. To determine the relationship between performance of process operators on the work
sample and performance of operators on process control in reality, a performance appraisal
system is needed to compare the results on the work sample with the results in real life situations. In choosing a performance appraisal system to be used as a criterion measure in
our concurrent validity studies, we have discarded the categories of objective measures,
ancillary measures and knowledge tests for all of the above mentioned reasons. Furthermore, because our predietor is a work sample invalving a basic simulator, it would only be
appropriate to use a second work sample as a criterion measure when this second work sample involves a replica simulator. As is described in chapter 1, basic simulators are simple
simulators which simulate the basic principles of a process, while replica simulators
simulate a specific process in which both the operation and the behaviour do not differ from
the real installation. In constructing our predictor, the work sample invalving a basic simulator, we have been reducing reality, while at the same time making sure that the key
elements of the control task are represented in this work sample. If we construct a second
work sample in the same fashion and use it as the criterion measure in our validity studies, the interpretation of the correlation between the predietor work sample and the criterion work sample would be very ambiguous. What would a very high correlation mean? It could
mean that performance on the one work sample prediets performance on the other work sample, but not necessarily job performance. It all would depend on the relationship of the
work samples with the real job. The 'ideal' criterion measure for our work sample would be a work sample invalving a replica simulator. However, one-to-one or high-fidelity
simulations with regard to specific processes are needed then. Because only very few
companies have such extremely expensive high-fidelity simulators at their disposal, it has
not been possible to use a second work sample as the criterion measure in our validity studies. Therefore, we have chosen to use ratings as our criterion measure.
6.2. Ratings
Although supervisory ratings are the most widely used type of criterion measure, they have been heavily criticised over the Jast decades. For instance, Williams (1989) bas formulated four answers to the question: 'What is wrong with the immediate supervisor as

6. Development of the criterion measure 81
the souree of ratings?' First of all, the immediate supervisor can not observe all of the
employee's work performance. Second, the supervisor may be more interested in certain
aspects of the work behaviour than in others. Third, some supervisors 'manage by
exception', which means that the employee has relatively little contact with the supervisor
except when things go wrong. Fourth, it is not always clear who the immediate supervisor is. In the case of two or more bosses: whodoes the appraisal? As alternative sourees for
appraisal Williams mentions self ratings, peer appraisal, subordinate appraisal and multiple appraisal. However, other authors, for instanee Cascio (1989), have argued in favour of the
immediate supervisor to evaluate performance. First, the immediate supervisor is most
familiar with the individual performance. Second, the immediate supervisor has the best
opportunity to observe actual performance. So, we find the same arguments both against
and in favour of supervisory ratings1 In our opinion, supervisory ratings can be effective
criterion measures as long as they are well developed and carefully administered. They do
have the capacity to show substantial relationships to selection tests in the form of significant validity coefficients (Landy & Rastegary, 1989). So, when they are constructed in such a way that they are relevant, sensitive, reliable, practicaland acceptable (!) (see section
6.1), we see noharm in using them as criterion measures. In our opinion, it depends mostly on the purpose of the appraisal and on the specifïc
work situation which kind of ratings is most appropriate. In choosing the souree for
appraisal in our validity studies, we have found supervisory ratings to be the most acceptable in both companies. Especially in one company, management strongly opposed either
self ratings or peer ratings. Supervisory ratings were acceptable to management, shift
supervisors and process operators. Probably because this appraisal format was identical to
the format of the company's appraisal system. So, having taken the very important 'hurdle'
of acceptability, our next task was to construct a rating scale which fulfilled the other
requirements mentioned above: relevance, sensitivity, reliability and practicality.
U se of behavioural criteria in performance appraisal
Literature on ratings, rating scales, raters and methods is vast and is usually found
in textbooks on performance appraisal or measurement of work performance (Handyside,
1989; Henderson, 1984; Landy & Farr, 1983; Latham & Wexley, 1982; Meister, 1985; Williams, 1989). The following discussion on appraisal systems is largely based on the
workof Latham & Wexley (1982).
Performance appraisal of employees can be an important tooi in increasing the productivity of an organisation. Although the importance of having a reliable performance
appraisal system is generally agreed upon, most systems are still basedon traits or costrelated outcomes. Appraisal on the basis of traits is based on characteristics such as initiative, creativity, commitment, etc. Employees are appraised in terrus of characteristics

82 Selection by simu/ation
like these. Disadvantages of systems basedon traits are: 1. they are not defined in terms of observable work behaviour: when an employee is not
creative enough, it is not directly clear what he or she should do to improve; 2. they refer to potential predietors of a performance insteadof to the performance itself; 3. they are too genera!: a system should apply to one job or 'family' of jobs to be effective. Cost-related outcomes usually are good indicators of the productivity of an organisation, but in general less well suited for measuring and evaluating performance of individual employees. Disadvantages of performance appraisal systems based on cost-related outcomes are: 1 they are not complete: often important factors for which employees should be held
accountable are omitted; 2. forsome jobs cost-related outcomes just do not apply;
3. often they incorporate factors for which employeescan not be held accountable; 4. they may create a 'results-at-all-cost mentality', which can be harmful to the
organisation; 5. they do not inform the employees about actlvities which will increase productivity.
In contrast with traits and cost-related outcomes, behavioural criteria are directly based on observable work behaviour. They can be directly related to the employee's specific activities during his or her performance on the job. The main advantage is that they not only measure employee performance on factors which can be directly influenced by the employee, but they also indicate what activities the employee should perform to obtain specific results. Some examples of behavioural criteria for evaluating work performance of mechanics can be found in tigure 6.1.
Keeps machines oiled and greased Almost never 1 2 3 4 5 Almost always
Knows what tools are neeried to make a repair,for example doesn't have to continually run back for more tools Almost never l 2 3 4 5 Almost always
Cleans air conditioning system once a week,for example, vacuums filters Almost never l 2 3 4 5 Almost always
Figure 6.1. Examples of behavioural criteria for evaluating work performance· of mechanics (FromLatham & Wexley, 1982).
In developing a performance appraisal system based on behavioural criteria the aim is that - taken all behavioural criteria tagether - these criteria provide an accurate idea of what

6. Development of the criterion measure 83
is expected of the employee on the job. If, for example, someone's performance should suddenly decrease, the performance appraisal system can be used to identify the weak spots, while at the same time the system indicates what activities should be employed in
order to increase performance. This is the main advantage of appraisal systems based on behavioural criteria.
6.3. Construction of a Behaviour Observation Scale (BOS) for process operators
As described above, a performance appraisal system basedon behavioural criteria is preferred above systems based on traits or cost-related outcomes. Furthermore, a system basedon behavioural criteria is best suited for use as a criterion measure in the concurrent
validity studies with the work sample. For both a system based on behavioural criteria and
the sample approach are behaviour oriented approaches. The work sample is constructed in such a manner as to represent (part of) the process operator's work behaviour. Therefore, we have chosen to construct a Behaviour Observation Scale (BOS) for process operators, since this is an appraisal system based on behavioural criteria. In this section the construction of the BOS is described, basedon a study initially reported by Van Ginneken (1990). The study on the construction ofthe BOS has been divided in three stages:
1. Development of a BOS at Petco using the Critica! lncidents Technique (CIT) to develop behavioural criteria.
2. Adjustment of the BOS by means of interviews with experts from different companies from the (petro)chemical industry.
3. Execution of an appraisal session at Petco with the BOS to test its psychometrie properties.
In section 6.4, results from the two validity studies are described as far as they refer to the reliability of the BOS.
Of course, the design process of the BOS also involves all steps of the design cycle. We started with specifying the function or purpose of the Behaviour Observation Scale. Th is BOS should serve as the criterion measure in validaring the work sample of the process operator's control task. In sections 6.1 and 6.2 it is described why we have chosen to develop the BOS (a rating scale) as the criterion measure. In the analysis step of the design cycle requirements have been specified which should be fulfilled by the BOS: acceptability,
relevance, sensitivity, reliability and practicality. Furthermore, although the work sample represents a part of the operator job: the process operator's control task in the central control room (see section 2.3), we want the Behaviour Observation Scale to cover all task dimensions of the process operator's job. In this way, the relationship of the work sample withother task dimensions can be examined. The correlation of the work sample with the task dimeosion of process control in the central control room in the BOS is expected to be
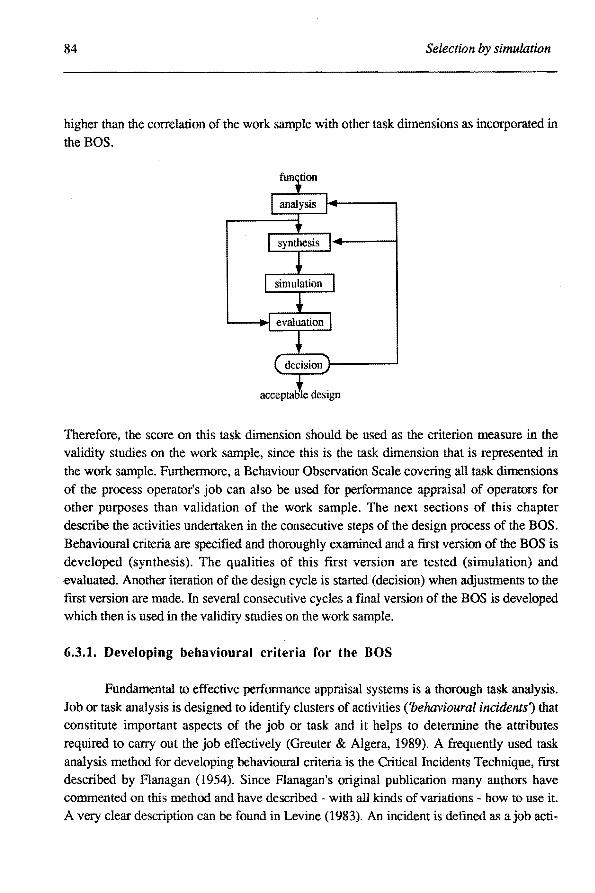
84 Selection by simu/ation
higher than the correlation of the work sample with other task dimensions as incorporated in the BOS.
Therefore, the score on this task dimeosion should be used as the criterion measure in the validity studies on the work sample, since this is the task dimeosion that is represented in the work sample. Furthermore, a Behaviour Observation Scale covering all task dimensions of the process operator's job can also be used for performance appraisal of operators for other purposes than validation of the work sample. The next sections of this chapter describe the activities undertaken in the consecutive steps of the designprocessof the BOS. Behavioural criteria are specified and thoroughly examined and a frrst version of the BOS is developed (synthesis). The qualities of this first version are tested (simulation) and
· evaluated. Another iteration of the design cycle is started (decision) when adjustments to the first version are made. In several consecutive cycles a final version of the BOS is developed which then is used in the validity studies on the work sample.
6.3.1. Developing behavioural criteria for the BOS
Fundamental to effective performance appraisal systems is a thorough task analysis. Job or task analysis is designed to identify clusters of activities ('behavioural incidems') that constitute important aspects of the job or task and it helps to determine the attributes required to carry out the job effectively (Greuter & Algera, 1989). A frequently used task analysis method for developing behavioural criteria is the Critica! Incidents Technique, frrst described by Flanagan (1954). Since Flanagan's original pubHeation many authors have commented on this method and have described with all kinds of variations - how to use it. A very clear description can be found in Levine (1983). An incident is defined as a job acti-

6. Development of the criterion measure 85
vity complete enough to allow an observer to make interences about an employee's capabilities. The incidents to be described need to be examples of either effective or ineffective onthe-job behaviour and should have occurred during the last 6 to 12 months. Every incident should describe:
1. what led to the occurrence of the incident and what was the settingit occurred in; 2. exactly what did the employee do that was so effective or ineffective; 3. what were the consequences of the employee's actions. The CIT is very effective in defining behavioural criteria, because it illuminates the critica! aspects or key elementsof a task which are essential for good performance on the task.
In this study, 186 incidents were collected: 106 incidents from interviews with
operators and 80 incidents from so called 'Product Loss Incident' (PLI) reports used at every department at Petco. Interviews were conducted with 22 operators; 15 operators from four different operator shifts in plant 1; six operators from two different operator shifts in plant 2 and one off-sites operator. It was decided to conduct only one interview with an offsites-operator since most incidents reported in the PLI reports came from off-sites.
First, in developing Behaviour Observation Scales critica! incidents which are iden
tical or resembie each other are categorised into one behavioural item. Second, behavioural items resembling each other are categorised into one performance dimension. In this study performance dimensions have been identified and defined at the outset in order to 'guide' the interviews with the operators. The operators were asked to describe incidents for each dimension. The performance dimensions have been identified from job descriptions at Petco, observations during operator shifts and lirerature (letten, 1987). The dimensions are: 1. Process control in the central control room; 2. Process control outside; 3. Communication and cooperation;
4. Safety. It was decided that in case of incidents which could not be categorised into one of these
dimensions, a new dirneusion would be added The collected 186 incidents were ordered and categorised into 53 behavioural items:
23 items for 'Process control in the central control room', 14 items for 'Process control outside', 10 items for 'Communication and cooperation' and 6 items for 'Safety'. Most behavioural items were 'made up' of several incidents. No behavioural items referred to other performance dimensions than the ones defined at the outset Some incidents were related to behavioural items of different performance dimensions. For instance, an incident related to 'Safety' also contained aspects of 'Communication and cooperation'. So, two different behavioural items were based on a description of one and the same incident. For more detailed information on this construction process and the specific behavioural items we refer to Van Ginneken (1990). Figure 6.2 contains four examples of behavioural items, one from each performance dimension, of a first version of the BOS.

86 Selection by simu/ation
Performance dimension 'Process control in the central control room':
The board operator regular/y checks the values of temperature, pressure, level and valves on the VDU Almost never 1 2 3 4 5 Almost always
Performance dimension 'Process control outside':
The unit operator Jorgets to operate a certain apparatus when ordered from the central control room Almost always 1 2 3 4 5 Almost never
Performance dimension 'Communication and cooperation':
The unit operator reports to the central control room which activities he wilt perfarm Almost never 1 2 3 4 5 Almost always
Performance dimension 'Safety':
The operator cantacts a colleague in unsafe situations Almost never 1 2 3 4 5 Almost always
Figure 62.Four examples of behavioural items, one from each performance dimension,from the first version of the BOS.
The first version of the BOS with four performance dimensions and a total of 53 behavioural items concluded the secoud stage of the construction of the BOS. In this version most items were phrased in a positive way. This may promate a tendency to give stereotype positive answers (response set), although reality might be somewhat less positive. To prevent the occurrence of a response set, about the same number of items should be phrased positively and negatively. This was accomplished in the third stage of the construction of the BOS, making adjustments to the first version, which is described in the next section.
6.3.2. Adjustment of the BOS
The first version of the BOS was extensively reviewed in two sessions of four to six hours with experts on process control at Petco. All critica! incidents were reviewed to see if they were 'translated' into the proper behavioural item and categorised into the proper performance dimension. Furthennore, the behavioural items were scrutinised to make sure that they represented all important task aspects of the process operator's job. Finally, the resulting behavioural items were reviewed with a shift supervisor at Petco. Because the

6. Development of the criterion measure 87
BOS should be appropriate to appraise operators' performance in other companies from the process îndustry, interviews to examine the BOS were conducted in two other companies. At Chemco - where the BOS would be used in a concurrent validity study on the work sample - the BOS was extensively reviewed with one expert on process controL In another company from the process industry, the BOS was evaluated in interviews with five shift supervisors.
In all interviews, all behavioural items were evaluated. For each item was asked: whether the item was clear; whether the item was relevant; whether the item allowed for discrimination between operators.
Furthermore, in all interviews was asked: whether the BOS was a correct representation of the process operator's job;
- whether it was possible to appraise operator performance with the BOS. As a result of these interviews several adjustrnents to the frrst version of the BOS
were made. For the specific adjustments we refer to Van Ginneken (1990). Here it suffices to say that some behavioural items were left out, while also new behavioural items were added. Some behavioural items were rephrased, others were joined together. Also, terminology accompanying the 5-point Likert scales was changed. Usually the ends of the scales are defined in terms of 'almost always' and 'almost never' (see also figure 6.2). In this study we have chosen to describe each point on the scale with a specific term which indicates frequency of occurrence of the behavioural item. These terms can be regarded as 'anchors' for the rater (the shift-supervisor). The advantage is that the supervisor bas a more clear idea about the meaning of each point on the scales. This will benefit the appraisal. Furthermore, to prevent response set items were phrased both positively and negatively. So, in the second version of the BOS we find a more balanced dîstribution of items with regard to posîtive and negative phrasing. The terms accompanying scale points of positively phrased items are: 1. sometimes; 2. regularly; 3. often; 4. almost always; 5. always. The terms accompanying scale points of negatively phrased items are: 1. often; 2. regularly; 3. sometimes; 4. almost never; 5. never. Figure 6.3 contains four examples of behavioural items with 'new' terminology accompanying the scales; two items are phrased positively and two items are phrased negatively. The terms accompanying negatively phrased items are not inversely proportionate to the terms accompanying positively phrased items. It was expected that most appraisals would fall into the categones of 'often' to 'always' for positively phrased items and into the categones of 'sometimes' to 'never' for negatively phrased items. Therefore the scales are not proportional. If they would be proportional, they would range from 'never' to 'always' for positively phrased items and from 'always' to 'never' for negatively phrased items. It was expected that if such proportional scales would be used most operators would get the

88 Selection by simulation
same appraisal and differences between good and very good operators would not be
detected that way. The adjustments have led to the following make up of the BOS:
26 items for 'Process control in the central control room' (of which 15 are phrased positively and 11 negatively); 12 items for 'Process control outside' (of which six are phrased positively and six negatively); 13 items for 'Communication and cooperation' (of which seven are phrased positively
and six negatively); 10 items for 'Safety' (of which six are phrased positively and four negatively).
The control room operator reacts immediately on an incoming alarm and perfarms the right action
sometimes 2
regularly 3
of ten 4 5
almost always always
The control room operator has problems with cantrolling the process manually
1 often
2 3 4 regularly sometimes almost never
5 never
The unit operator acquaints himself insufficiently with the state of the unitand the process
1 often
2 3 4 regularly somelimes almost never
5 never
The operator takes into account the possible effects of his actions on the environment
somelimes 2
regularly 3
of ten 4 5
almost always always
Figure 6.3. F our examples of behavioural items from the second version of the BOS.
6.3.3. Appraisal session with the BOS
An appraisal session was carried out at Petco with the adjusted version of the BOS to test its psychometrie properties. In this company two large plants are controlled from one central control room by (in total) 10 operator-shifts (5 operator-shifts for each plant). All 10 shift-supervisors have appraised 3 to 4 operators from their own shift. In total 37 operators were appraised with the BOS, 16 from plant 1 and 21 from plant 2. The operators all had
several years of experience with cantrolling the processes from the central control room. On average these were the better and more experienced operators. Recently employed operators who did not have enough practice yet in cantrolling the processes from the central control

6. Development ofthe criterion measure 89
room and other operators who were considered unable to perfarm this task (as judged by
the management of Petco) were not selected for appraisal with the BOS. So, the group of 37
operators being appraised is not representative of the total population of operators at Petco,
but all items of all four performance dimensions (including 'Process control in the central
control room') do apply for these operators. Before the actual appraisal shift-supervisors were informed by means of a memorandum a bout the status of the BOS in the 'work sample
project' and about the purpose of the appraisal session. It was made very clear that the
results of the appraisal would be strictly confidential and that they would only be used to test certain properties of the BOS itself. The appraisal would have no consequences for the
operators being appraised. Management would not be informed on results of individual
operators. All 10 shift-supervisors appraised 'their' operators during a night shift, while a
research er was present to answer any questions that might occur.
Measures
For each item the mean score and standard deviation were calculated and minimum
and maximum scores were determined. These measures indicate per item whether most appraisals cover all (1 through 5) scale points (relatively large varianee and relatively large
difference between minimum and maximum) or most appraisals cover a small portion of the
scale (relatively small varianee and relatively small difference between minimum and maximum).
Item-total correlations per performance dimension were calculated. The item-toid
correlation coefficient (ri1) is an indication of the relationship between the item and the total
score per dimension. In other words: to what extent does this single item measure the same as the dimension as a whole? A correlation coefficient of at least .40 is necessary to keep the
item in the performance dimension under consideration (Dousma & Horsten, 1980).
Furthermore, as an indication of the reliability of the BOS Cronbach's coefficient
alpha was determined. See Appendix A for a general discussion on reliability and the different types of reliability coefficients. Cronbach's alpha is a measure of the homogeneity
of a test. When a test is aimed on measuring the performance of an operator with regard to process control in the central control room (the first performance dimension of the BOS), all
items should correlate highly with each other. The higher the coefficient alpha, the more
homogeneaus the dimension. In our situation, a coefficient of .80 or higher indicates high
internal consistency and consequently a homogeneaus composition of the dimension under
consideration (Anastasi, 1976).
Finally, a correlation coefficient between performance dimensions was calculated.
High correlations indicate high cohesion between dimensions while low correlations
indicate independenee from each other.

90 Selection by simu/ation
Results
Mean scores per item range from 2.16 to 4.41, while the mean score of 90% of all items ranges from 3.00 to 4.00. Standard deviations range from .57 to 1.22. For most items varlation in scores is fairly large. The standard deviation of 68% of all items is higher than .75. Table 6.1 indicates the percentages of items corresponding to the scale points used as minimum and maximum scores. This table shows that for each item the maximum score of 5 has been used in the appraisal. Furthermore, it indicates that for the greater majority of
items (87%) the scores range between 1 and 5 or 2 and 5.
Table 6.1. Percentage of items ranging between minimum and maximum scores on the 5-point scale.
Range in scores %of items
minimum 1 and maximum 5 42 minimum 2 and maximum 5 45 minimum 3 and maximum 5 13
Figure 6.4 gives an overview per dimension of the mean number of times a scalepoint has been used in the appraisal (the total number of times a scale-point has been used in the appraisal of the 37 operators divided by the total number of items per dimension). This
figure shows that for each dimeosion scale-point 4 has been used the most. Item-total correlation coefficients are higher than .70 for 78% of all items. For only
two items we have found an item-total correlation coefficient of less than .40. These items are: - 'The operator functions well in a team' from performance dirneusion 'Communication
and cooperation', rit=.39;
- 'The operator wears some kind of personal proteetion when woricing in a dangerous
situation or with dangerous products' from performance dimension 'Safety', rit=.32.
Since we decided that a correlation coefficient of at least .40 is necessary to keep the items in the performance dimension under consideration (Dousma & Horsten, 1980), these items were deleted from the BOS.

6. Development of the criterion measure
Dimeosion 1 20,--------------------------. 18
16
14
12 10 8 6 4
2 0 ~~~L-~~~~~~~~~~
2 3 4 5
Dimeosion 3 20,--------------------------, 18 16 14 12
10
8
6
4
2
'
r
' '
ll'--: I I ' I : I
: ' ' ! ' ' '
i
: i ' ' I I I I
: I
' ' I
' I I I
o~~~~~~~~~~~~~~~ !_ ' ____ ... " ..! " 2 3 4 5
20 Dimeosion 2
18 16 14 12
10 8 6 4 2 0
2 3 4 5
Dimension4 20 18 16 14 12 10 8 6 4
2 0
2 3 4 5
Figure 6.4. Overview per performance dimension of the mean number of times a
scale-point was used in the appraisal.
91
Table 6.2 contains Cronbach1S coefficient alpha per dimension. This table shows
that all coefficients are considerably high, which means that each dimension is very homogen eaus.
Table 6.2. Cronbach's coefficient alp ha per performance dimension.
Performance dimeosion alpha
Process control in the central control room .97 Process control outside .92 Communication and cooperation .92 Safety .87
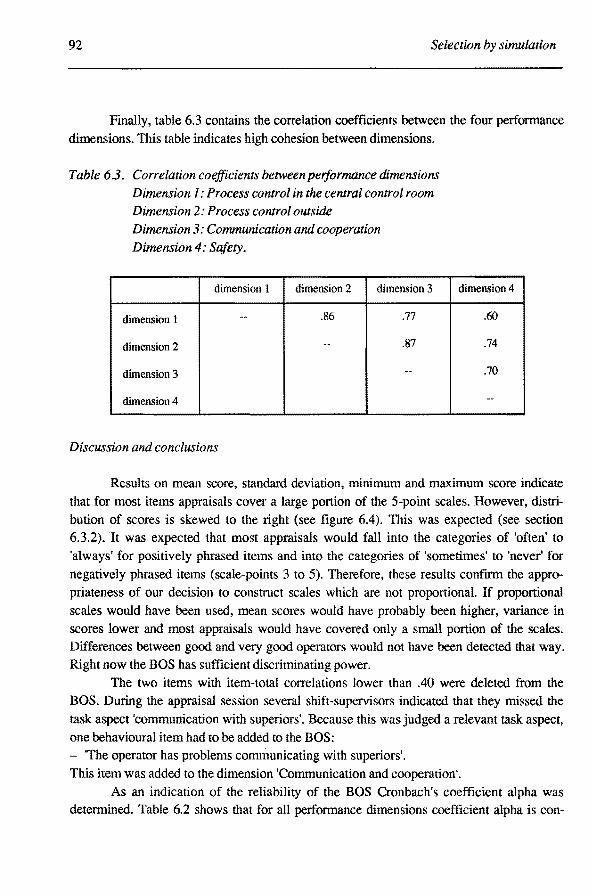
92 Selection by simu/ation
Finally, table 6.3 contains the correlation coefficients between the four performance dimensions. This table indicates high co hesion between dimensions.
Table 6 3. Correlation coejjicients between performance dimensions Dimension 1: Process control in the central control room Dimension 2: Process control outside Dimension 3: Communication and cooperation Dimension 4: Safety.
dimensioo I dimeosion 2 dimensioo 3
dimeosion 1 .86 .77
dimeosion 2 -- .87
dimension 3
dimension4
Discussion and conclusions
dimension4
.60
.74
.70
--
Results on mean score, standard deviation, minimum and maximum score indicate that for most items appraisals cover a large portion of the 5-point scales. However, distribution of scores is skewed to the right (see tigure 6.4). This was expected (see section 6.3.2). It was expected that most appraisals would fall into the categoties of 'aften' to
'always' for positively phrased items and into the categones of 'sometimes' to 'never' for
negatively phrased items (scale-points 3 to 5). Therefore, these results confirrn the appropriateness of our decision to construct scales which are not proportional. If proportional scales would have been used, mean scores would have probably been higher, varianee in scores lower and most appraisals would have covered only a small portion of the scales. Differences between good and very good operators would nothave been detected that way. Right now the BOS has sufficient discriminating power.
The two items with item-total correlations lower than .40 were deleted from the BOS. During the appraisal session several shift-supervisors indicated that they missed the task aspect 'communication with superiors'. Because this was judged a relevant task aspect, one behavioural item had to be added to the BOS: - 'The operator has problems communicating with superiors'.
This item was added to the dimension 'Communication and cooperation·. As an indication of the reliability of the BOS Cronbach's coefficient alpha was
deterrnined. Table 6.2 shows that for all performance dimensions coefficient alpha is con-

6. Development ofthe criterion measure 93
siderably high. This means that all dimensions are very homogeneous. Another indication of the reliability of the BOS would be given by a test-retest reliability coefficient. This coefficient has been calculated for part of this group of 37 operators when the BOS was applied in the concurrent validity study of the work sample at Petco (which took place six months laterand is described insection 6.4).
The relatively high correlations between performance dimensions indicate high cohesion between dimensions. It seems that the dimensions are not independent of each other. The ranking of an operator is a bout the same on all four dimensions. This means that when an operator has been rated high on the first dirneusion (compared toother operators), he will be rated high on the other dimensions. One possible explanation for these high correlations is the so called 'halo effect'. This means that performance on one aspect of the job is generalised to performance on the whole job (Latham & Wexley, 1982). Many authors have commented on this halo effect and possible causes. Commonly it is believed that criterion measures are heavily contaminated by raters' tendency to generalise from their initia! impression of the people they rate. However, according to Handyside (1989) this is not true, because: 1. profiles for the different aspects for each person are usually fairly varied; 2. the halo-effect is not substantially reduced by
a. either a careful explanation on the rating form; b. appropriate training of raters.
Handyside has put forward a different explanation of the cause of the effect: the 'severity
leniency' bias. In a study on the analysis of ratings given in an assessment center, Handyside (1988) could segregate two groups of raters: 'high' raters and 'low' raters. It was found that the average for the high raters was .91 standard deviations higher that the
average for the low raters, even though they correlated .72. In order to explore what effect this 'severity-leniency' was having on the intercorrelations of ratings, the situation was simulated on a computer, and large numbers of simulated ratings were produced in such a way that the 'severity-leniency' bias could be manipulated for various values from zero to about 2 1/2 times as much as had been found to be the value for the raters who had participated in the assessment center. Over half a million ratings were used in the analysis. The results showed that the severity-leniency of the raters had a very clear-cut effect on the way the underlying (i.e. zero severity-leniency) correlation became distoned. This distonion was both different in kind and greater in magnitude than the ordinary and well-known 'attenuation' effect. Attenuation occurs when a measure with less than perfect reliability is correlated against an exernal criterion. The effect is that the correlations are reduced in absolute magnitude but the sign remains the same. When two ratings by the same raters are correlated, Handyside has found a shifting of the correlations towards being more positive and larger than the underlying values before the severity-leniency bias was introduced. Therefore, Handyside concluded that the cause of 'halo' is not that the individual raters fail

94 Selection by simu/ation
to distinguish adequately between the 'aspects' that they are asked to rate. Instead, an important cause of the effect is that the raters have slightly different absolute standards of judgment, and that when the ratings by large numbers of raters are 'pooled' these small differences in standards combine in such a way as to produce higher correlations than would other
wise appear, particularly when the characteristics are really largely independent of each other.
Taking this alternative explanation for the 'halo' effect into consideration and the fact
that the performance dimensions of the BOS are all very homogeneous, we have chosen to keep them as separate performance dimensions. Furthermore, it is important to have 'Process control in the central control room' as a separate dimension, because this is the task dimension which is represented in the work sample. In establishing the validity of the work: sample the correlation between scores on the work sample and scores on the dimension 'Process control in the central control room' of the BOS need to be calculated. This correlation can be compared then with the correlations between scores on the work sample and scores on the other dimensions. Results on the validity of the work sample are
presented in chapter 7. The adjustments resulting from the appraisal session have led to the following make
up of the final version of the BOS: - 26 items for 'Process control in the central control room'; - 12 items for 'Process control outside'; - 12 items for 'Communication and cooperation'; - 9 items for 'Safety'.
So, the final version of the BOS consists of 59 behavioural items. This final version of the BOS is contained in Appendix F (in Dutch). This is the version that was used as the criterion measure in the concurrent validity studies on the work sample.
6.4. Reliability of the BOS
During the two concurrent validity studies at Chemco and Petco the BOS bas been used as a criterion measure to valklate the work sample. Results from these validity studies directly relating to the validity of the work sample are presented in chapter 7. However, the data that were gathered on the BOS in these studies can also be used to calculate different types of reliability coefficients for this criterion measure. In this section, results referring to the reliability of the BOS are presented.
Sub je cts mul procedure
At Chemco the job performance of 51 operators was appraised with the BOS. The performance of almost all operators was rated by two raters: the shift-supervisor and head-

6. Development of the criterion me as ure 95
technician of the partienlar shift the operator works in. Because the operators work in five shifts, we have five pairs of raters (one for each operator-shift). The head-technicians did not appraise their own performance, so the performance of the head-technicians was appraised by just one rater: their shift-supervisor. Therefore, a total of 46 operators is rated by two raters. These are all rated on dimensions 2 (Process control outside), 3 (Communication and cooperation) and 4 (Safety). A total of 13 operators could not be rated on dimeosion 1 (Process control in the central control room): eight trainee-operators were only recently employed by the company and consequently did not have experience yet with independently controlling the processes from the central control room, while five operators were considered unable to perform this task (as judged by the management of Chemco) for the last couple of years. Therefore, a total of 33 operators is rated on dirneusion 1. For most measures results of the ratings by the shift-supervisors and the head-technicians are presented separately.
At Petco the job performance of 55 operators was appraised with the BOS. The performance of each operator was rated by only one rater: the shift-supervisor of the shift the operator works in. Management strongly disapproved of appraisal of operator performance by others than the shift-supervisors. A total of 46 operators is rated on dimensions 2, 3 and 4. A total of nine operators could not be rated on dirneusion 1, because for the last couple of years they had never independently controlled the processes from the central control room. These operators were considered unable to perform this task (as judged by the management of Petco). Fora subgroup of 10 operators it was the second time that their performance was appraised (by the same shift-supervisor) by means of the BOS. During the appraisal session in the study on the construction of the BOS (as described insection 6.3.3) they were appraised with an earlier version of the BOS which closely resembied the last version.
Measures
In both validity studies Cronbach's coefficient alpha was determined. At Chemco each operator was rated by two raters, so for this study it was possible todetermine interrater reliability. At Petco a test-retest reliability coefficient was calculated for the subgroup of 10 operators who participated in the appraisal session during the study in which the BOS was developed. Furthermore, for both studies results on the following measures are presented: a. mean, standard deviation, minimum and maximum per item; b. mean and standard deviation per performance dimension; c. item-total correlations per performance dimension; d. correlations between performance dimensions. The results are presented per type of measure.

96 Selection by simu/ation
6.4.1. Internat consistency
In both studies Cronbach's coefficient alpha was determined per performance dimeosion of the BOS. At Chemco this coefficient was calculated for both groups of raters: shift-supervisors and head-technicians. Table 6.4 contains the coefficients.
Table 6.4. Cronbach's coejficient alphaper performance dimension. ass= Cronbach's coefficient alp ha with shift-supervisors as raters.
am= Cronbach's coejficient alp ha with head-technicians as raters.
Performance dimension Chemco Petco <Xss <Xm <Xss
Process control in the central.control room .98 .98 .99 Process control outside .94 .98 .96 Communication and cooperation .92 .79 .93 Safety .92 .89 .96
It was already mentioned that a coefficient of .80 or higher indicates high intemal consistency and consequently a homogeneous composition of the dimeosion under consideration (Anastasi, 1976). This table shows that almost all coefficients are higher than .80, which means that each performance dimeosion of the BOS is very homogeneous. Furthermore, these coefficients are of the same magnitude as found in the study on the construction of the BOS (see table 6.2). In this study, we only find a somewhat lower
coefficient for dimeosion 3 (Communication and cooperation) when the head-technicians are the raters at Chemco. This finding will be discussed - and explained - in section 6.4.4 when the item-total correlations are presented.
6.4.2. Inter-rater reliability
At Chemco the performance of 46 operators was rated by two raters: the shiftsupervisor ~d head-technician of the partienlar shift the operator works in (see also the secdon on 'subjects and procedure'). These operators are all rated on dimensions 2 (Process control outside), 3 ( Communiearlon and cooperation) and 4 (Safety). A total of 33 operators has been rated on dimeosion 1 (Process control in the central control room). Table 6.5 contains the correlation coefficients between the two groups of raters. This table shows that inter-rater reliability is highest for dimeosion 1 (.80), but also considerably high for the other three dimensions. This means there is a great ex tent of agreement between raters. The level of correlations found in this study corresponds to the level that is usually found

6. Development of the criterion measure 97
between ratings of different raters reporting on the performance of the same employees. This tends to be in the order of .55 to .75 (Handyside, 1989). According to Handyside, this means that, in the interest of faimess, there is a lot to be said for getting ratings - if possible - by more than one rater for each employee. As a result of the appraisal the average of these ratings should be taken. This is exactly what has been done at Chemco. In validaring the work sample, the ratings on the BOS (the criterion measure) were averaged before they
were correlated with the results on the work sample. This is described more extensively in chapter 7 which covers the results on the validity of the work sample.
Table 65. Inter-rater reliability at Chemco.
Perfonnance dimeosion Correlation*
Process control in the central control room .80 Process control outside .65 Communication and cooperation .56 Safety .66
*All corre/ations are significanl at the J% level (p<.Ol)
6.4.3. Test-retest reliability
A test-retest reliability coefficient was calculated for a subgroup of 10 operators at Petco. These operators were among the 37 operators who were appraised six months earlier with an earlier version of the BOS during the study on the construction of the BOS (see section 6.3.3).
Table 6.6. Test-retest reliability at Petco.
Perfonnance dimeosion Correlation*
Process control in the central control room .91 Process control oul~ide .81 Communication and cooperation .75 Safety .80
*All correlations are significant at the 1% level (p<.Ol)
This earlier version of the BOS closely resembied the last version. Dimensions 1 and 2 are exactly the same for both versions. Compared with the earlier version there have been two
itemsleftout of dimension 3 while one new item has been added. Finally, in dimension 4 one item has been left out. Test-retest reliability coefficients have been calculated over the
98 Selection by simu/ation
totals per dimension, with exactly the sameitems contributing to the totals of bath versions. Table 6.6 contains these reliability coefficients. This table shows considerably high correlations between böth appraisal sessions for all performance dimensions of the BOS. Highest correlation is found for dirneusion 1 (.91), while lowest correlation is found for dirneusion 3 (.75).
When we consider Cronbach's coefficient alpha in bath studies, inter-rater reliability at Chemco and test-retest reliability at Petco we conclude that job performance of process operatorscan be reliably appraised with the BOS.
6.4.4. Various measures
Mean, standard deviation, minimum and maximum per item
For the shift-supervisors at Chemco mean scores per item range from 2.80 to 4.16, while the mean score of 83% of all items ranges from 3.00 to 4.00. Standard deviations range from .53 to 1.30. For most items varlation in scores is reasonably large. The standard deviation of 63% of all items is higher than .75. For the head-technicians at Chemco mean scores per item range from 2.98 to 4.35 and the mean score of 53% of all items ranges from 3.00 to 4.00. It seems that the head-technicians are more lenient in their appraisal. For the head-technicians the mean score of 46% of all items is higher than 4.00, while for the shiftsupervisors the mean score of only 15% of all items is higher than 4.00. Furthermore, standard deviation of most items is smaller for the head-technicians than for the shiftsupervisors. Standard deviations range from .47 to 1.14 for the head-technicians. Standard deviation of only 32% of all items is higher than .75. However, we have found good interrater reliability (see section 6.4.2). We find that the shift-supervisors on the one hand and the head-technicians on the other hand have slightly different absolute standards of judgment. For bath groups of raters the means and standard deviations per dirneusion can be found in figure 6.5. This figure nicely illustrates the differences between the shiftsupervisors and the head-technicians at Chemco.
For the shift-supervisors at Petco mean scores per item range from 2.95 to 4.15, while the mean score of 76% of all items ranges from 3.00 to 4.00. Standard deviations range from .60 to 1.41. Again, for most items varlation in scores is reasonably large. The standard deviation of 86% of all items is higher than .75. Table 6.7 indicates for the three groups of raters in the two companies the percentage of items corresponding to the scale points used as minimum and maximum scores. This table shows that for all groups for each item the maximum score of 5 bas been used in the appraisal. Furthermore, it indicates that for the greater majority of items the scores range between 1 and 5 or 2 and 5.

6. Development of the criterion measure 99
Table 6.7. Percentage of items ranging between minimum and maximum scores on the 5-point scale. SS=shift-supervisors HT=head-technicians.
Range in scores %of items Chemco Petco ss HT ss
minimum 1 and maximum 5 27 14 75 minimum 2 and maximum 5 59 44 22 minimum 3 and maximum 5 14 41 3
Furthennore, this table also illustrates the difference between the shift-supervisors and head-technicians at Chemco. For 41% of the items the head-technicians have used only three points on the scale, 3 to 5. This table also shows that the shift-supervisors of Petco have used the scale-points from 1 to 5 for 75% of the items.
Mean and standard deviation per performance dimension
Figure 6.5 gives an overview of the means and standard deviations per dimeosion for all groups of raters. This figure shows that on average the head-technicians of Chemco give somewhat higher appraisals than the shift-supervisors of Chemco. Furthennore, justas table 6.7 this figure indicates that varianee in scores is largest for the ratings of the shiftsupervisors of Petco.
ltem-total correlations per performance dimension
Item-tatal correlations for all three groups of raters are considerably high. For the shift-supervisors of Chemco we have found 83% of all items to exceed item-tatal correlation of .70. For the shift-supervisors of Petco 80% of all item-tatal correlations exceeded .70. As was mentioned in section 6.3.3, when constructing tests a correlation coefficient of at least .40 is necessary to keep an item in the test (Dousma & Horsten, 1980). In both groups of shift-supervisors no item-total correlations lower than .40 have been found It was only for the group of head-technicians of Chemco that we have found one item-tatal correlation coefficient of less than .40: - Item 47 - The operator calls attention to the need for training, instructions, additional
resources, etc.' from performance dimension 'Communication and cooperation', 10.
It seems that this single item does not measure the same as the dimension as a whole when
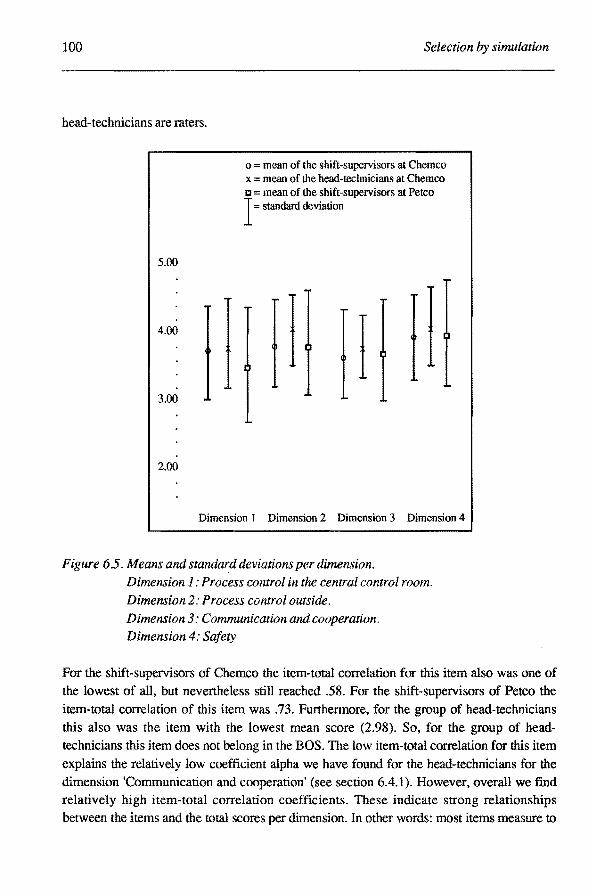
100 Selection l7y simu/ation
head-technicians are raters.
5.00
4.00
3.00
2.00
o = roean of the shift-supervisors at Cheroco x = roean of the head-technicians at Cheroco 1:1 = roean of the shift-supervisors at Petco I= standard deviation
1 I I
Diroension I Diroension 2 Diroension 3 Diroension 4
Figure 65. Means and standard deviations per dimension. Dimension 1: Process control in the central control room. Dimension2: Process control outside. Dimension 3: Communication and cooperation. Dimension 4: Safety
For the shift-supervisors of Chemco the item-total correlation for this item also was one of the lowest of all, but nevertheless still reached .58. For the shift-supervisors of Petco the item-total correlation of this item was .73. Furthermore, for the group of head-technicians this also was the item with the lowest mean score (2.98). So, for the group of headtechnicians this item does not belong in the BOS. The low item-total correlation for this item explains the relatively low coefficient alpha we have found for the head-technicians for the dimension 'Communication and cooperation' (see section 6.4.1). However, overall we find relatively high item-total correlation coefficients. These indicate strong relationships between the items and the total scores per dimension. In other words: most items measure to

6. Development ofthe criterion measure 101
a great extent the same as the dimension as a whole.
Correlations between performance dimensions
Table 6.8. contains the correlation coefficients between the four performance dimensions for all three groups of raters. The relatively high correlations between performance dimensions indicate high cohesion between dimensions. These findings replicate the results of the appraisal session in the study on the construction of the BOS (see section 6.3.3).
Table 6.8. Correlation coefficients between performance dimensions.
Dimension 1: Process control in the central control room.
Dimension 2: Process control outside.
Dimension 3: Communication and cooperation.
Dimension 4: Safety.
Shift-supervisors Chemco
dimension 1 dimension 2 di mension 3 dimension 4
dimension 1 dimension 2 dimension 3 dimension4
Head-technicians Chemco
dimension 1
dimension 1 dimension 2 dimension 3 di mension 4
Shift-supervisors Petco
dimension 1
dimension 1 dimension 2 dimension 3 dimension4
.86 .86 .75 .84 .87
.81
dimension 2 dimension 3 dimension 4
.91 .84 .76 .82 .85
.79
dimension 2 dimension 3 dimension 4
.79 .77 .68 .91 .86
.88
It seems that the performance dimensions of the BOS are not independent of each other. The ranking of an operator is about the same on all four dimensions.This means that when an
102 Selection by simu/ation
operator has been rated high on the first dimension (compared toother operators), he will be rated high on the other dimensions. However, for the same reasons we have put forward in section 6.3.3 - the high intemal consistency of the dimensions and the fact that in establishing the validity of the work sample the correlation between scores on the work sample and scores on the dimension 'Process control in the central control room' of the BOS need to be calculated - we have chosen to keep the performance dimensions as separate dimensions.
6.5. Discussion and conclusions
The BOS as has been developed covers the 'whole' process operator's job. It includes four main performance dimensions: 1. Process control in the central control room; 2. Process control outside; 3. Communication and cooperation; 4. Safety. Therefore, the BOS can be used for performance appraisal of process operators by companies from the process industry.
However, we have developed the BOS for criterion measurement in our validity studies on the work sample. The work sample represents the process operator's control task (see chapter 3). Consequently, we will use the score on the dimension 'Process control in the central control room' as our criterion measure. We will not use the total score on the BOS as criterion measure, because different task aspects are incorporated in this total score which are not represented in the work sample. So, in establishing the validity of the work sample correlation between scores on the work sample and scores on the dimension 'Pro
cess control in the central control room' of the BOS have to be calculated. This correlation can be compared then with the correlations between scores on the work sample and scores on the other dimensions. The correlation of the work sample with the first dimension of the BOS is expected to be higher than the correlations of the work sample with the other dimensions of the BOS, because the first dimension covers the part of the operator's job that is represented in the work sample. However, the high correlations between performance dimensions (sections 6.3.3 and 6.4.4) indicated high cohesion between dimensions. These correlations indicate that the performance dimensions are not independent of each other. In our discussion in section 6.3.3 we have argued in favour of keeping the performance dimensions as separate dimensions. In establishing the validity of the work sample the correlation between scores on the work sample and scores on the dimension 'Process control in the central control room' of the BOS needs to be calculated. This correlation can be compared then with the correlations between scores on the work sample and scores on the other dimensions. Results on the validity of the work sample are presented in chapter 7.

6. Development of the criterion measure 103
In section 6.1, we have mentioned five requirements for appraisal systems which should also apply to our criterion measure. The requirements were: acceptability, relevance, sensitivity, reliability and practicality. In terms of the design eycle we have now reached the steps of evaluation and decision for the Behaviour Observation Scale. It is our apinion that we have succeeded in constructing a criterion measure which fulfils all of these requirements. First, as described in section 6.2 we have found the BOS when used in the form of supervisory ratings - aceeptable to management of both companies participating in the validity studies. Furthermore, the BOS was also acceptable to both raters and ratees. Second, relevanee as defined as the extent to which a criterion measure as applied is related to the true order of success in a given activity is not exactly known. However, a rank correlation of .76 between the total score on the BOS and the ranking as aresult of a company ranking system at Chemco indicates considerable relevance. Furthermore, the utmost care has been taken in constructing the BOS to identify and incorporate all important aspects of the process operator's job (see sections 6.3.1 and 6.3.2). Third, sensitivity of the BOS has been accomplished. Sensitivity (discriminating power) requires a certain level of varlation in scores. Data on means, standard deviations and minimum and maximum scores per item and per performance dirneusion indicate enough variability in scores. Also, the above mentioned rank correlation between the total score of the operators at Chemco on the BOS and the ranking of the company indicates that the BOS distinguishes between effective and ineffective performers. Fourth, reliability of the BOS has been accomplished. The several measures we have used as indicators of the reliability of the BOS all show substantially high reliability coefficients for all groups of raters in both validity studies. Intemal consistency of all performance dimensions of the BOS is very high, inter-rater reliability - although for a small sample of raters - is high and test-retest reliability coefficients are considerably high for all four dimensions. Taken tagether these results justify the condusion that job performance of process operators can be reliably appraised with the BOS. Fifth, practicality has also been accomplished. The BOS has been made available in an economie way and in the validity studies it bas been shown that the BOS had enough transparency to the people who had to u se it.
We like to conclude this chapter by pointing out that we have developed a criterion measure which fulfils all requirements and therefore can be used in the validity studies on the work sample.

Chapter 7.
Validity of the work sample
In this chapter, results bearing on the validity of the work sample are presented. Results referring to the different types of validity that play an important role in the sample approach, i.e. face validity, content validity and criterion related validity, are presented. These results are discussed in a concluding section. The results indicate that face validity and content validity of the work sample is good. Data on one type of criterion related validity, namely predictive validity, are still inconclusive. However, results on the other type of criterion related validity, namely concurrent validity, are good.
106 Selection by simu/ation
7.1. Face validity
The question of face validity is in essence the questiorr of how plausible the test looks. For a description of the concept of validity and the different types that are distinguished we refer to Appendix A. As is mentioned in this appendix, face validity is never suffïcient in itself. It only makes the test more acceptable to the people involved, usually employer and employee (Cook, 1988). However, it is quite possible that a test measuring some specific personal characteristic (e.g. dominance) contains items which- at first glance - do not involve this characteristic. It is also possible that this test successfully discriminates between people differing in dominant behaviour, while at the same time face validity is nihil. This example illustrates the fact that face validity is not always a necessary requirement for successful tests. However, face validity can be considered as a minimum requirement for work sample tests. As was described in chapter 2, the sample approach to the design of a selection instrument emphasises the fact that the instrument should consist of one or more tasks which represent the fundamental demands with regard to a certain job. A work sample should consist of a representative sample of tasks of a given (part of a) job. This implies that work samples do require face validity. They should at least 'look plausible'. This means that at first glance they should show some resemblance to the (part of the) job they represent, in other words: they should be face valid. So, face validity can be seen as a
necessary - although not sufficient - requirement of work samples. As was described in chapter 3, we have used the design cycle from the engineering
sciences as a framework in designing the work sample for process operators. The frrst steps of the design cycle, analysis and synthesis, have led to a frrst version of the work sample, a provisional design. This first provisional design contained two simulated process parts and some exercises. Two former process operators, now teaching process control at a teehoical school, have seen and worked with this design. Their comments and suggestions for improvements were incorporated in the next provisional design. This - once again -illustrates the iterative nature of the d~sign process. In each design process usually several iterations need to be realised before an acceptable design is reached. So, in one of the first iterations of our design process these two instructors commented on the plausibility of the provisional design of the work sample. Their judgement in this regard was very positive, which gave us an indication that we were on the right track. Furthermore, representatives from eight companies from the (petro)chemical industry - all having considerable knowledge of the process operator's job - were given demonstrations with the first provisional design of the work sample. Their first impressions of the plausibility of the design were unanimous in favour of the design. So, face validity of the work sample was generally agreed upon.

7. Validity of the work sample 107
7 .2. Content validity
Content validity refers to the concept of representativeness. Test performance should be a representative sample of job performance. Especially in the sample approach, content validity is essenriaL The work sample test should represent reality by having sampled representative features (or key elements) of the job.
ldentification of key elements ofthe process operator's control task
In the analysis and synthesis steps of the design process of the work sample we have conducted an analysis of the process operator's control taskin order to identify the key
elements of this task. The identification of key elements and the results of a questionnaire survey on these key elements - which we named control problems - have been extensively
described in section 4.2. Here we only like to point out the judgrnents about the necessity of inclusion of such a control problem into a work sample. These judgments were expressed in a Content Validity Ratio (CVR) (Lawshe, 1975) and have been presented in table 4.2. As was mentioned in that chapter, Lawshe's CVR is usually employed to establish the content validity of an already existing instrument. However, we have used Lawshe's CVR in the development phase of an instrument to find out how the instrument should be constructed in
order to obtain the highest possible content validity. As was mentioned in sectien 4.2, especially for the category of process-related control problems we needed information which problems should be incorporated in a work sample. Because these control problems
are directly related to the process - in our case: the simulated process - it was of great importance to find out at an early stage which control problems should be incorporated. Por the choice of the simulated process parts and the prograrnrning of these simulations directly
effect which process-related control problems are included or excluded. The categones of extemal control problems and task-related control problems will have to be included in a work sample either by implemenring disturbances in the simulated process itself or by varying the instructions in an experimental task situation. In view of the results presenred in sectien 4.2, the following four process-related control problems were originally chosen to be used in the construction of a work sample of the operator's control task: 'series
connection', 'time delay/time constant', 'recycling' and 'parallel connection'. However, as was described in section 4.3, through 'trial and error' we found out that the processpart containing the control problem 'recycling' was not suitable for inclusion in a work sample for selection purposes for the reason that this process part was too complex. Therefore, the 'final' version of the work sample does not contain this control problem (see also Appendix E).
So, the analysis of the process operator's control task - by means of Jiterature search, observations, interviews and the questionnaire survey - has led to the identification
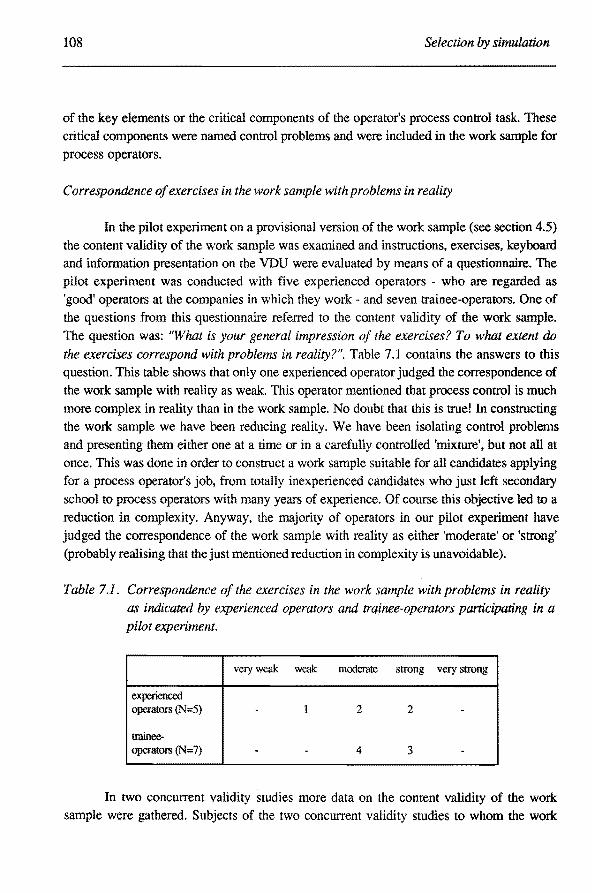
108 Selection by simu/ation
of the key elements or the critica! components of the operator's process control task. These critica! components were named control problems and were included in the work sample for process operators.
Correspondence of exercises in the work sample with problems in reality
In the pilot experiment on a provisional version of the work sample ( see section 4.5)
the content validity of the work sample was examined and instructions, exercises, keyboard and information presentation on the VDU were evaluated by means of a questionnaire. The pilot experiment was conducted with five experienced operators - who are regarded as 'good' operators at the companies in which they work - and seven trainee-operators. One of the questions from this questionnaire referred to the content validity of the work sample.
The question was: "What is your general impression of the exercises? To what extent do the exercises correspond with problems in realityr. Table 7.1 contains the answers to this question. This table shows that only one experienced operator judged the correspondence of the work sample with reality as weak. This operator mentioned that process control is much more complex in reality than in the work sample. No doubt that this is true! In constructing the work sample we have been reducing reality. We have been isolating control problems and presenting them either one at a time or in a carefully controlled 'mixture', butnotall at once. This was done in order to construct a work sample suitable for all candidates applying for a process operator's job, from totally inexperienced candidates who just left secondary school to process operators with many years of experience. Of course this objective led to a rednetion in complexity. Anyway, the majority of operators in our pilot experiment have judged the correspondence of the work sample with reality as either 'moderate' or 'strong' (probably realising that the just mentioned rednetion in complexity is unavoidable ).
Table 7.1. Correspondence of the exercises in the work sample with problems in reality as indicated by experienced operators and trainee-operators participating in a pilot experiment.
very weak weak moderate strong very strong
experienced operators (N=5) 1 2 2
lnlinee-operators (N= 7) . . 4 3 -
In two concurrent validity studies more data on the content validity of the work sample were gathered. Subjects of the two concurrent validity studies to whom the work
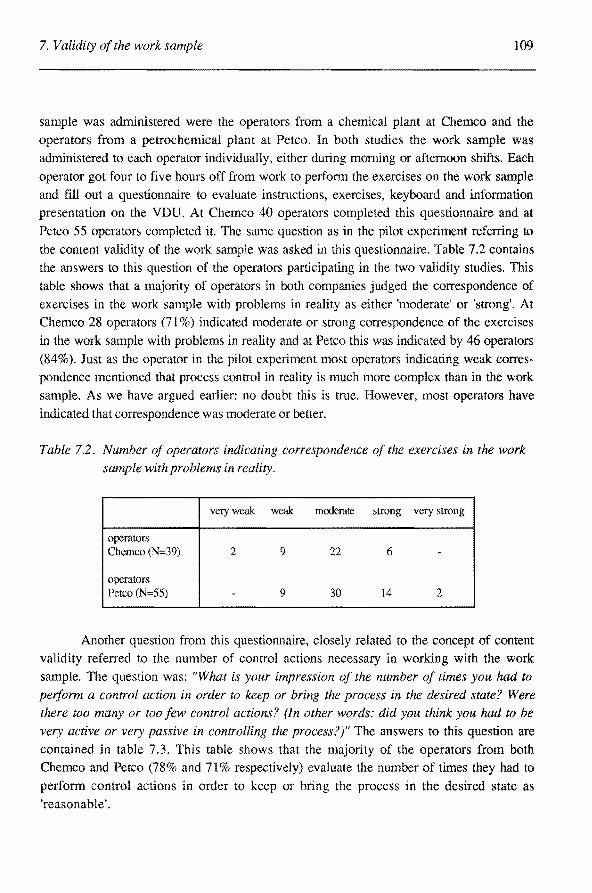
7. V alidity of the work sample 109
sample was administered were the operators from a chemica] plant at Chemco and the
operators from a petrochemical plant at Petco. In both studies the work sample was
administered toeach operator individually, either during morning or afternoon shifts. Each
operator got four to five hours off from work to perform the exercises on the work sample
and fill out a questionnaire to evaluate instructions, exercises, keyboard and information
presentation on the VDU. At Chemco 40 operators completed this questionnaire and at
Petco 55 operators completed it. The same question as in the pilot experiment referring to
the content validity of the work sample was asked in this questionnaire. Table 7.2 contains
the answers to this question of the operators participating in the two validity studies. This
table shows that a majority of operators in both companies judged the correspondence of
exercises in the work sample with problems in reality as either 'moderate' or 'strong'. At
Chemco 28 operators (71%) indicated moderate or strong correspondence of the exercises
in the work sample with problems in reality and at Petco this was indicated by 46 operators
(84%). Justas the operator in the pilot experiment most operators indicating weak corres
pondence mentioned that process control in reality is much more complex than in the work
sample. As we have argued earlier: no doubt this is true. However, most operators have
indicated that correspondence was moderate or better.
Table 7.2. Number of operators indicating correspondence of the exercises in the work sample with problems in reality.
veryweak weak moderate strong very strong
operators Chemco (N=39) 2 9 22 6
operators Petco (N=55) - 9 30 14 2
Another question from this questionnaire, closely related to the concept of content
validity referred to the number of control actions necessary in working with the work
sample. The question was: "What is your impression of the number of times you had to perfarm a control action in order to keep or bring the process in the desired state? Were there too many or too few control actions? (In other words: did you think you had to be very active or very passive in controlZing the process?)" The answers to this question are
contained in table 7.3. This table shows that the majority of the operators from both
Chemco and Petco (78% and 71% respectively) evaluate the number of times they had to
perform control actions in order to keep or bring the process in the desired state as
'reasonable'.

110 Selection lJy simulation
Table 7.3. Number of operators evaluating the number of times they had to perform a control action in order to keeporbring the processin the desired state.
fartoo few too few reasonable too many far too many
operators Chemco (N=40) - 5 31 4 -operators Petco (N=55) - 4 39 11 1
Recognition of control problems in the work sample
In the two concurrent validity studies at Chernco and Petco operators have tilled out yet another questionnaire after they had finished working on the work sample. In this questionnaire the 'retranslation' technique was ernployed in order to get more information on the content validity of the work sample. This technique was introduced in psychological literature by Smith & Kendali (1963) to construct content valid rating scales. However, the basic procedure is also applicable to other areas of research. The procedure sterns from a
procedure employed to ensure that translations from one language into another adhere to the connotations as well as to the denotations of the original. First, a text is translated into a foreign language. Second, this text is retranslated into the original by another translator. Where differences occur, translations are reexamined and if necessary corrected.
Similarly, we have asked the operators from Chemco and Petco to indicate the essendal characteristic of a partienlar module (process part) of the work sample which makes the exercises difficult to handle for inexperienced operators. In a way, we have asked them to 'retransl<J,te' (identify) the essential characteristics from the work sample. These characteristics were identified earlier in the real working situation by other operators and consequently were incorporated into the work sample. In asking to identify these characteristics, we have referred to 'inexperienced operators' insteadof plain 'operators' or 'experienced operators' to avoid answers such as: 'no difficulties given enough experieqce' or 'this module is very easy to control'. lt is our experience that most experienced operators find it difficult to admit that they have problems controlling the process in the work sample. Therefore, referring to inexperienced operators is 'an. easy way out' for them. In the questionnaire, the exercises betonging to the different modules are described to facilitate reeall of the exercises. Both the task settingof the exercises (task-related control problems) and the simulated disturbances in the exercises (external control problems) are described. The objective was to find out whether operators were able to 'recognise' the essential characteristics (process-linked control problems) that were incorporated into the modules of the work sample:

7. Validity ofthe work sample 111
1. time delay/time constant; 2. series connection; 3. parallel connection.
For a detailed description of the work sample, modules, exercises and control problems we refer to Appendix D. Here it suffices to mention that the work sample consists of four modules: an introductory module and three modules each incorporating one of the above mentioned 'essential characteristics' (process-linked control problems). In relranslating these essential characteristics from the exercises, the operators have described them in their own words. The researcher has scored a point for recognition of 'time delay /time constant' if the answer contained some mentioning of the relative long period of time between action and reaction. Usually this was expressed by one of the following worcts in the statements: 'time delay', 'time constant', 'long time period', 'response time' or 'delay'. We have scored a point for recognition of 'series connection' if the answer contained some mentioning of the direct conneetion of the two tanks which prompts almost simultaneous operation of these tanks. Operators have mentioned for instanee 'tank A influencing tank B', 'disturbances in the beginning of process become disturbances at the end of the process' and 'several valves to operate closely aftereach other'. We have scored a point for recognition of 'parallel connection' if the answer contained some mentioning of the interconneetion of different process variables. Operators have mentioned for instanee 'fluctuations in both leveland temperature' and 'disturbance affects both temperature and flows'.
Table 7.4. Number of operators recognising the process-linked control problems in the work sample.
delay/ series conneetion parallel conneetion
operators Chemco (N=39) 19 9 9
operators Petco (N=54) 27 10 19
Table 7.4 contains the results of the 'retranslation process' by the operators. This table shows that half of the operators of both companies recognised 'time delay/time constant' as an essential characteristic , while 'series connection' and 'parallel connection' were recognised by roughly one quart of the operators. These figures, however, are still quite impressive consictering the fact that in order to recognise these characteristics the operators had to abstract from the specific exercises with the specified task settings and simulated disturbances to characteristics of the module (process part) that complicated the
112 Selection by simu/ation
exercises. A lot of operators have mentioned the specific disturbances in the exercises as the essenrial characteristics that made the exercises difficult to handle for inexperienced operators. For instance, operators have mentioned the hamperlog of the valves, the changes in weather conditions and the changes in product flows. However, these are the extemal con
trol problems which have been incorporated into the exercises. Of course, these control problems complicate the exercises, but the fact that the process contains the specific process-linked control problem is at the heart of the problem. Introduetion of extemal or task
related control problems 'only' serves to deteriorate the problem situation.
7.3. Criterion related validity
Determining validity in a criterion-related strategy rests on demonstraring a statistica! relationship between scores on a predietor and scores on a criterion measure. In order to
validate the work sample we have constructed a Behaviour Observation Scale (BOS) for process operators (see chapter 6) to use as the criterion measure. The scores on the BOS against which the scores on the work sample are validated may be obtained at roughly the
same time as the scores on the work sample or after a certain period of time. On the basis of these time relations between predietor and criterion we can differentiate between concurrent validity and predictive validity, respectively (Anastasi, 1976).
7.3.1. Concurrent validity
In our study, concurrent validity refers to a demonstrated relationship between job performance with regard to the process control task as measured by the BOS and scores on the work sample obtained at approximately the same time.
Subjects and procedure
Subjects of the two concurrent validity studies to whom the work sample was administered were 41 experienced operators from a chemical plant at Chemco and 53 experienced operators from a petrochemical plant at Petco. Two operators from Petco had to be deleted from the study, because of missing data due to computer failure (failure of data registration) during the administration of the work sampletothese two operators.
In both studies the work sample was administered in a special cabin on the premises of the company at a location close to the central control room. The computer with the simulated process, VDU's and keyboards (for both operator and experimenter) was installed in this cabin for two months. During this period the work sample was administered to each
operator individually, either during moming or afternoon shifts. Each operator got four to five hours off from work to perform the exercises on the work sample and flll out two
7. Validity ofthe work sample 113
questionnaires (results on these questionnaires conceming the content validity of the work sample have been presented insection 7.2).
At Chemco job performance of 36 operators was rated by two raters: the shiftsupervisor and head-technician of the particular shift the operator works in. Job perform
ance of the head-technicians was appraised by just one rater: their shift-supervisor. The operators were all rated on dimensions 2 (Process control outside), 3 (Communication and
cooperation) and 4 (Safety). A total of five operators could not be rated on dimeosion 1 (Process control in the central control room), because for the last couple of years they had never independently controlled the processes from the central control room. These operators
were considered unable to perform this task (as judged by the management of Chemco ). At Petco the performance of each operator was rated by only one rater: the shift
supervisor of the particular shift the operator works in. Management strongly disapproved of appraisal of operator performance by others than the shift-supervisors. A total of 53 operators was rated on dimensions 2, 3 and 4. A total of eight operators could not be rated on dimeosion 1, because forthelast couple of years these operators had never independently controlled the processes from the central control room. They were considered unable to perform this task (as judged by the management of Petco ).
Measures
Raw scores on the various exercises of the work sample were converted into standard z-scores before combining them into total scores on the work sample. We refer to Appendix E for the measures used in calculating the raw scores per exercise and the procedure for converring these raw scores into standard scores. The work sample consisted of 18 exercises: 10 type A exercises and 8 type B exercises (see section 4.4 and Appendix
D). Three types of total scores on the work sample were calculated: 1. total score over the type A exercises (Total-A);
2. total score over the type B exercises (Total-E);
3. total score over a1118 exercises (TOT AL).
As was mentioned in chapter 4, the exercises can be basically divided in two different kinds: type A exercises in which the operator actively needs to manipulate certain process variables
in order to reach the requested state of the process and type B exercises in which the operator only needs to manipulate certain process variables when the steady state of the process is disturbed or is threatened to become disturbed. For each process part type A exercises are presented first. These exercises are meant to give the candidate a 'feeling' for the dynamics of the particular process part he is working on. They can be considered as 'practice' exercises. For each module type A exercises are then foliowed by type B exercises in which the particular processpart is running at a steady state. When all goes well the operator does not need to adjust any variables. Only when disturbances occur, the process

114 Selection lJy simulation
will need adjusting in order to keep the most important process variables within given limits. These are the exercises that reflect. best the process operator's task situation in the central control room. Therefore, the total score over the type B exercises (Total-B) is used as the predietor measure.
The BOS was developed in order to use it as a criterion measure in our validity studies on the work sample (see chapter 6). The BOS consists of four performance dimensions: 1. Process control in the central control room; 2. Process control outside; 3. Communiearlon andcooperation; 4. Safety. The work sample represents the process operator's control task in the central control room
(see chapter 3). Consequently, we have used the score on the dimension 'Process control in the central control room' as our criterion measure. We have not used the total score on the BOS as criterion measure, because different task aspects are incorporated in this total score which are not represented in the work sample.
In establishing the validity of the work sample the correlation between Total-B on the work sample and scores on the dimeosion 'Process control in the central control room' of the BOS has been calculated. This correlation was compared then with the correlations between Total-B on the work sample and scores on the other dimensions. Correlation of Total-B on the work sample with the first dimension of the BOS is expected to be higher than with the other dimensions of the BOS (see also section 6.4.5), because the fust dimeosion covers the part of the operator's job that is represented in the work sample. However, because correlations between performance dimensions have shown high cohesion between dimensions (see sections 6.3.3 and 6.4.4), we expect moderate correlations of Total-B on the work sample with the other dimensions of the BOS. Furtherrnore, we expect lower correlations with the criterion measure forTotal-A than for Total-B because type A exercises are 'practice' exercises to get acquainted with the particular process. Both 'good' and 'bad' operatorsneed to get acquainted with the dynamics of the particular process. We exp~ct that only on type B exercises the difference in process control skilis is revealed.
In section 6.4.2, the correlation coefficients between the two groups of raters at Chemco have been presented. Table 6.5 shows that inter-rater reliability resembles the level of correlations usually found (.55 to .75) when different raters report on the performance of the same employees (Handyside, 1989). According to Handyside, this means that, in the interest offaimess, there is a lotto be said for getting ratings- if possible- by more than one rater for each employee. As a result of the appraisal the average of these ratings should be taken. This is exactly what was done at Chemco. In validating the work sample, the ratings of the 36 operators who were rated by two raters were averaged before they were correlated with the results on the work sample.

7 .. Validity of the work sample 115
As was mentioned in section 4.4, the task in type B exercises is to keep the value of
the variables between specified alarm limits for a certain amount of time. When choosing
'best' performance measures, we have chosen area measurement, because it takes into
account the deviations from setpoint. The higher the score, the worse the performance. As
was argued in section 4.4 squared area measurement is not the best choice in our case, because several exercises in the work sample involve alarm limits set below one measure
ment unit. Deviations outside the second alarm limits are penalised extra when discrete area
measurement is used with a weight factor for the area outside these alarm limits. However, when we compared the scores of the area measures with different weight factors attached to
the area outside the second alarm limits, we hardly found any differences. The few
differences that did occur, occurred with very large deviations from the setpoint. In that case
the lowest score was the one calculated with the discrete area measure with weight factor 15
(see figure 4.5). In chapter 4, our approach was to choose for discrete area measurement in
that phase of the project for type B variables and to postpone the choice concerning the
weight factor that should be attached to this measure. We mentioned that in conducting the concurrent validity studies with the work sample, different weight factors would be
employed in calculating the results. This way the effect of this differential weighing would be examined again with more subjects and more data. Then, a definite choice should be
made concerning the performance measure for type B variables. Therefore, in the first
concurrent validity study we conducted with the work sample -·at Chemco - we have calculated the results for all type B exercises with three different weight factors for the area
outside the second alarm limits. Because the weight factors of 5 and 15 employed in the
pilot study did hardly have any effects on the end results, we have increased the weight
factors in this study to 25 and 150, respectively. So, we calculated the results on type B
exercises at Chemco in three different ways. Results will be presented on three different
scores: 1. Total-l total score overthe type B exercises without weighing;
2. Total-25 total score over the type B exercises with a weight factor of 25 for the area outside the second alarm limits;
3. Total-150 = total score over the type B exercises with a weight factor of 150 for the area
outside the second alarm limits.
The correlation between these scores will be determined. Also, for each score the correlation with the criterion (total score on the first dimension of the BOS) is determined. Depending
on these results we will choose which type of measurement will be used for the type B
exercises in the work sample.
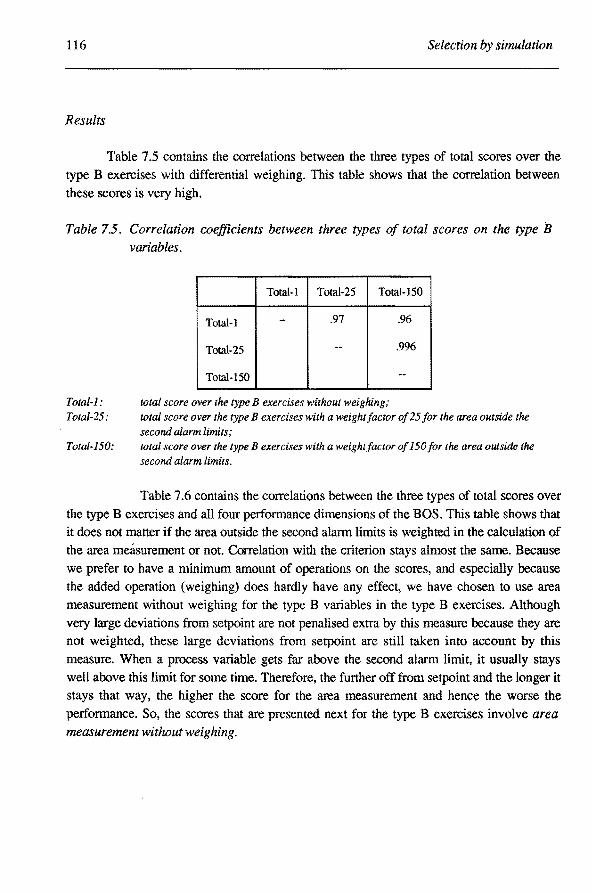
116 Selection l:Jy simu/ation
Results
Table 7.5 contains the correlations between the three types of total scores over the type B exercises with differential weighing. This table shows that the correlation between these scores is very high.
Table 7 5. Correlation coejficients between three types of total scores on the type B variables.
Total-l: Total-25:
Total-150:
Total-l Total-25 Total-150
Total-l - .97 .96
Total-25 .. .996
Total-150 ..
total score over the type B exercises without weighing; total score over the type B exercises wlth a welght factor of25 for the area outside the second alarm limits; total score over the type B exercises with a weight factor of 150 for the area outside the second alarm limits.
Table 7.6 contains the correlations between the three types of total scores over the type B exercises and all four performance dimensions of the BOS. This table shows that it does not matter if the area outside the second alarm lirnits is weighted in the calculation of the area meásurement or not. Correlation with the criterion stays almost the same. Because
we prefer to have a minimum amount of operations on the scores, and especially because the added operation (weighing) does hardly have any effect, we have chosen to use area measurement without weighing for the type B variables in the type B exercises. Although
very large deviations from setpoint are not penalised extra by this measure because they are not weighted, these large deviations from setpoint are still taken into account by this
measure. When a process variabie gets far above the second alarm limit, it usually stays well above this limit for some time. Therefore, the further off from setpoint and the longer it stays that way, the higher the score for the area measurement and hence the worse the performance. So, the scores that are presented next for the type B exercises involve area measurement without weighing.
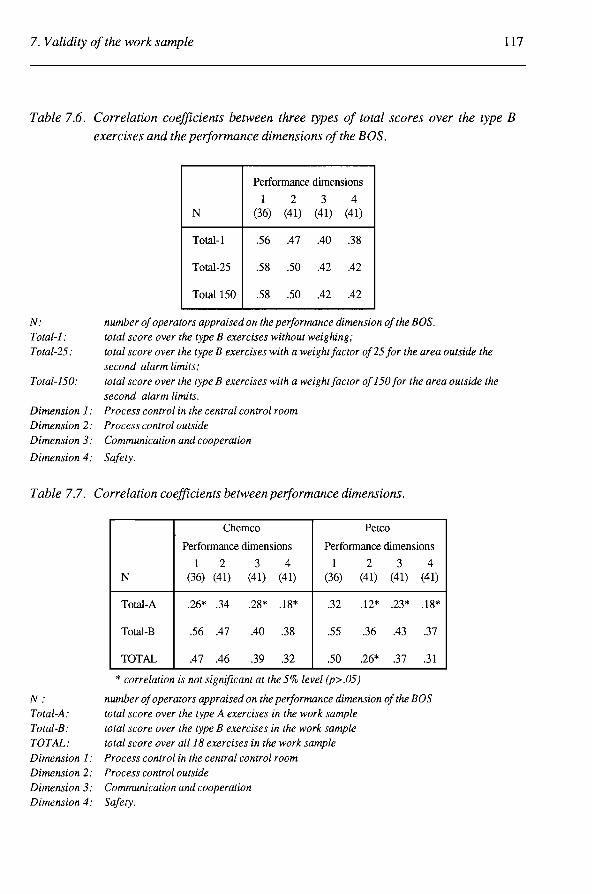
7. Validity ofthe work sample 117
Table 7.6. Correlation coefficients between three types of total scores over the type B
exercises and the performance dimensions ofthe BOS.
N: Total-l: Total-25:
Total-150:
Performance dimensions
1 2 3 4 N (36) (41) (41) (41)
Total-l .56 .47 .40 .38
Total-25 .58 .50 .42 .42
Totall50 .58 .50 .42 .42
number of operators appraised on the performance dimension ofthe BOS. total score over the type B exercises without weighing; total score over the type B exercises with a weight factor of25 for the area outside the second alarm limits;
tot al score over the type B exercises with a weightfactor of 150 for the area outside the second alarm limits.
Dimension 1: Process control in the central control room Dimension 2: Process control outside
Dimension 3: Communication and cooperation
Dimension 4: Safety.
Table 7.7. Correlation coefficients between performance dimensions.
Chemco Petco
Performance dimensions Performance dimensions
N: Total-A: Total-B:
TOT AL:
Dimension 1: Dimension 2: Dimension 3: Dimension 4:
1 2 3 4 1 2 3 4 N (36) (41) (41) (41) (36) (41) (41) (41)
Total-A .26* .34 .28* .18* .32 .12* .23* .18*
Total-B .56 .47 .40 .38 .55 .36 .43 .37
TOT AL .47 .46 .39 .32 .50 .26* .37 .31
* correlation is notsignificant at the 5% level (p>.05)
number of operators appraised on the performance dimension of the BOS total score over the type A exercises in the work sample total score over the type B exercises in the work sample total score over al/18 exercises in the work sample
Process control in the central control room Process control outside
Communication and cooperation Safety.

118 Selection by simu/ation
Table 7.7 contains the correlations between the three types of total scores on the work sample (Total-A, Total-B and TOT AL) and the total scores on the four performance dimensions of the BOS in both concurrent validity studies. This table shows that the highest correlations occur between Total-B on the work sample and dimeosion 1 of the BOS. Correlation is .56 at Chemco and .55 at Petco. For all three types of total scores on the work sample correlations with the other three performance dimensions of the BOS are lower than with the frrst dimension. Correlations between Total-A on the work sample and the performance dimensions of the BOS are all considerably lower than the correlations between Total-B and the performance dimensions. These results will be discussed more extensively insection 7.4.
The relationship between the total score on the type B exercises (Total-B) and the total scores on the first dimension of the BOS is graphically depicted in figure 7.1 for the operators from Chemco and in figure 7.2 for the operators from Petco. These figures illustrate the correlations of .56 and .55, respectively.
5 El El
El El 1!1 rJl 'IJ 1'1.1 El El 4
El I liiEI El l!lil ml!lm
111 111 111 El
3 111 ID 111
El El ID
2
I • • • -10 -9 -8 -7 -6 -5 -4 -3 -2 -I 0 I 2 3 4 5 6 7 8 9 IO
Worksampie
Figure 7.1. Total scores on the type B exercises in the work sample (x-axis) depicted against the total scores on the dimension 'Process control in the central control room' ofthe BOS (y-axis)for the operatorstrom Chemco.

7. Validity of the work sample 119
5 ";-1!1 a
lil mdP El m El m
lil El 4 a Eb El lil El
El El a a'ill El El
lil El Vl 3 lil e a 0 ,:1:) El a
a a a a
El lll El
2
1;-,_,a~·,_,-,-,-,-,-,-,-~~~~~~~~~~
-10-9 -8 -7 -6 -5 -4 -3 -2 -1 0 1 2 3 4 5 6 7 8 9 10 11
Worksample
Figure 7.2. Total scores on the type B exercises in the work sample (x-axis) depicted
against the total scores on the dimension 'Process control in the central control room' of the BOS (y-axis) for the operators from Petco.
7 .3.2. Predictive validity
In our study, predictive validity refers to a demonstraled relationship between scores on the work sample, which have been collected, and job performance with regard to the process control taskas measured by the BOS aftera certain period of time. In tigure 3.3 the design of the validity studies was shown. Two predictive validity studies have been started: one with trainee-operators from Petco and one with trainee-operators from Trainco. To all trainee-operators the work sample was administered twice with a six month time period in between. Chapter 5 contains a description of the subjects and procedure used in these studies. Results re lating to the reliability of the work sample are also presented in chapter 5. However, since none of the trainee-operators is qualified yet to work independently as a process operator - let alone control the processes from the central control room - we lack a criterion against which the results on the work sample can be compared. The traineeoperators from bath Petco and Trainco are still in training for the job. Therefore, they can not be rated on the BOS yet.
However, for one group of trainee-operators from Trainco we have collected a ranking relating to the possibility of becoming a 'good' process operator. This ranking was given by the joint training staff at the company school. At Trainco, two classes of students have participated in the validity study. Class 1 started school in 1989 with 15 students and class 2 started school in 1990 with 20 students. 14 students from class 1 graduated from school in 1991 and it is for these students that we have collected the ranking. The time period between the administration of the work sample and the ranking by the training staff was 18 months. We realise that in this ranking other dimensions than process control skilis

120 Selection by simu/ation
alone are expressed. In ranking the students the training staff has taken into consideration grade points - both in courses on theory and practice -, attitude, behaviour at school and during intemsbips at the company, motivation, etc. The work sample was administered to 13 students of class 1. One student was ill at the time of administration and was left out of the study. Table 7.8 contains the correlations between the rankings from the trainingstaffat Trainco's company school and the rankings on the first administration of the work sample to the students of this class. This table shows considerably high correlations between the rankings of both Total-A and TOT AL scores on the work sample and the ranking at Trainco.
Table 7.8. Correlation between rankingsfrom Trainco and rankings on the work sample
for the students of class 1.
Type of total score Ranking Trainco
Total-A .63 (p<.Ol) Total-B .28
TOT AL .58 (p<.Ol)
Total-A: total score over the type A exercises in the work sample Total-B: total score over the type B exercises in the work sample
TOT AL: total score over all18 exercises in the work sample.
We should be very careful in iriterpreting these results. Not only is the sample size quite small (N=13), it is also very clear that the ranking made by the trainingstaffat Trainco is not only based on process control skills. It is just this skill that the work sample intends to predict and not any other skilis and personal characteristics which did play a role in establishing the ranking at Trainco. This may 'cloud' the correlation coefficients. However, we have found a substantial difference between the correlations for Total-A, the total score over the type A exercises in the work sample, and Total-B, the total score over the type B exercises in the work sample. As was mentioned in section 7.3.1 type A exercises are exercises in which the operator actively needs to manipulate certain process variables in order to reach the requested state of the process. The modules of the work sample all start with type A exercises. These exercises are meant to give the operator a 'feeling' for the dynamics of the particular process part he is working on. They are 'practice' exercises to get acquainted with the particular process. The results as contained in table 7.8 indicate that the total score on type A exercises prediets quite well the ranking of the trainee-operators 18 months later. The total score on type B exercises only mildly correlates with this ranking. This difference is quite remarkable and will be discussed more extensively in the next section.
We will end this section with the remark that at the moment we still have only

7. Validity of the work sample 121
inconclusive data on the predictive validity of the work sample. lt will take at least two more
years befare we can make a start with collecting data on the criterion: process control in the central control room.
7.4. External variables
Table 7.9. Correlation coefficients between the total scores on the work sample and performance dimensions on the BOS on the one hand and age and work experience on the other hand.
Chemco (N=41) 1
Petco (N=53) 2
A ge Work Age Work exoerience exoerience
Performance dimensions on the BOS: 1. Process control in the central control room -.30 -.28 .08 .00 2. Process control outside -.24 -.14 .18 .11 3. Communication and cooperation -.31* -.25 .16 .04 4. Safety -.19 -.09 .08 -.02
Total scores on the work sample: 1. Total-A .17 .20 .02 .13 2. Total-B .13 .13 -.10 .04 3. TOTAL .17 .19 -.04 .10
1 for all correlatwns the number of operators involved is 41 exceptfor the correlations ofthefirst performance dimension of the BOS: there N =36
2 for all correlations the nttmber of operators involvedis 53 except for the correlations of the first performance dimension ofthe BOS: there N=45
* correlation is significant at the 5% level (p<.05) Total-A: total score over the type A exercises in the work sample Total-E: total score over the type B exercises in the work sample TOT AL: total score over a/118 exercises in the work sample
In conducting the validity studies on the work sample we have collected results on
other external variables than the criterion measure (the BOS). In the concurrent validity
studies with the operators from Chemco and Petco we have collected data on age and
number of years of work experience as process operator at the company. This was done to
explore the relationship between these variables and pelformanee on both the work sample and the criterion measure. Table 7.9 contains the correlations between these variables. This
table shows that at both · Chemco and Petco age as well as work experience show low to
moderate (either positive or negative) correlations with both the pelformanee dimensions on the BOS and the total scores on the work sample. Therefore, neither age nor number of
years of work experience can be used as alternative indicators of pelformanee on the job.

122 Selection l:Jy simu/ation
In the predictive validity studies with the trainee-operators from Petco and Trainco we have adrninistered the General Aptitude Test Battery (GATB) and the Test for Non Verbal Abstraction (TNV A) in order to explore the relationship between the cognitive abilities as measured by these tests and the results on the work sample. We hypothesised that correlations would be low to moderate. In chapter 1, we argued that because automation has led, among other things, to integration of processes and an increasing complexity of most processes, cognitive abilities such as information processing and decision making have beoome increasingly important in carrying out the process operator's control task. Because the work sample is a representation of the operator's control task we expect scores on the GA TB and TNV A (which measure general cognitive abilities) to correlate moderately with scores on the work sample.
Table 7.10. Correlation coejficients between the subtests of the GATB and TNV A on the one hand and the total scores on the work sample on the other hand.
Petco (N=15) Total-A Total-B
GATB name comparison .07 -.09 computation .15 .47 three-dimensional space .28 .01 vocabulary .41 .55* tooi matching .22 .29 arithrnatic reason .13 .55* fonn matching -.02 .18 markmaking .01 .31
'INVA number of correct items .64*"' .58* number of false items -.24 -.26
* correlatû:m is significant at the 5% level (p<.05) ** correlation is significant at the 1% level (p<.01)
TOT AL
.00
.32
.18
.52*
.28
.34
.07
.18
.68** -.28
Total-A: total score over the type A exercises in the work sample Total-B: total score over the type B exercises in the work sample TOT AL: total score over al/18 exercises in the work sample
Trainco (N=31) Total-A Total-B TOT AL
.47"'* .32 .45*"'
.42* .34 .43*
.55** .43* .56**
.44"' .33 .44*
.30 .24 .31
.22 .39* .33
.23 .10 .20
.14 -.03 .08
.44** .26 .41* -.30 -.33 -.35
Because the work sample does not measure 'pure' coguitive abilities, but a combinapon of cognitive abilities and the more practical skilis of process control, we expect low to moderate correlations with these tests. Correlations between subtests of the GA TB and the TNV A on the one hand and the total scores on the work sample on the. other hand are presented in table 7.10. This table shows that for the greater part the correlations are low to moderate indeed. However, we fmd relatively high correlations for the number of correct
7. Validity of the work sample 123
items on the TNV A for both the operators at Petco and at Trainco. It seems that the work samplefora large part involves abstract reasoning. The results as contained in table 7.10 show somewhat higher correlations for the trainee-operators from Trainca than for the trainee-operators from Petco. However, with a few correlations that are somewhat higher than expected (> .50), our hypothesis is confirmed: most correlations between the subtests of the GA TB and the total scores on the work sample are low to moderate. These results seem to support the notion that the work sample does not measure 'pure' cognitive abilities, but a combination of cognitive abilities and the more practical skilis of process controL
7 .5. Discussion and conclusions
Face validity and content validity
We concluded section 7.1 with the remark that face validity of the work sample was generally agreed upon. First impressions of the plausibility of the design of the work sample were very favourable. Furthermore, the results presented insection 7.2 alllead up to the condusion that we have succeeded in constructing a work sample with sufficient content validity. First, we have taken considerable care to identify the key elementsof the process operator's control task. Second, experts on process control (the operators themselves) have indicated in several studies moderate or better correspondence of the exercises in the work sample with problems in reality. Third, in a difficult retranslation task the essential characteristics of the modules of the work sample were recognised by a considerable number of operators.
Concurrent validity
With regard to the concurrent validity our expectations have been confirmed. First of all, correlation of Total-B with the first dimension of the BOS is higher than the correlations of Total-B with the other dimensions of the BOS. This was found at bath Chemco and Petco. Because we have found considerably high correlations between the performance dimensions of the BOS (see table 6.8 in the previous chapter), we expected moderate (instead of low) correlations of Total-B with the other three dimensions of the BOS. This is exactly what we have found (see table 7.7). Furthermore, we have found the highest correlation with the criterion for Total-B. The correlation of Total-A with the criterion is indeed lower. Because of the low correlation for Total-A, correlation for TOTAL is also
lower than for Total-B. These findings can be explained when we look at the exercises in somewhat more
detail. As was mentioned earlier, the work sample consistsof type A exercises and type B exercises. Each module in the work sample starts with two type A exercises. These type of
124 Selection by simu/ation
exercises are meant to give the operator a 'feeling' for the dynamics of the particular process
part he is woricing on. An example of this kind of exercise is: "lncrease temperature T21
from 57.1 <c to 59.2 CC". The task is to bring the variabie as fast as possible to a given
value. These first kinds of exercises are then foliowed by the type B exercises in which the
partienlar processpart is running at a steady state. When all goes well the operator does not
need to adjnst any variables. Only when disturbances occnr, the process will need adjusting
in order to keep the most important process variables within given limits. Usnally two alarm
limits are given and the operator's task is to keep the process running smoothly with the
important process variables as close to the specified setpoint as possible, even thongh
disturbances may (and will) occur. When we take this difference between the two kinds of
exercises into consideration, it is clear why we have fonnd lower correlations between
Total-A and the frrst dimension of the BOS than between Total-Band this dimension. The
low correlations of type A exercises indicate that these exercises hardly discriminate
between operators. This is what was expected, becanse these are the 'practice' exercises to
get acqnainted with the particular process. Both 'good' and 'bad' operators need to get
acquainted with the dynamics of the partienlar process. Then, on the type B exercises the
difference in process control skilis is revealed. The relatively high correlations of type B
exercises indicate that these exercises discriminate well between operators. However, when
is validity considered 'good'? How high should a validity coefficient be? We will now try to
answer this qnestion.
For the interpretation of the magnitude of criterion related validity coefficients
Bethel-Fox (1989) gives some indications. He mentions as a rule of thnmb, that for
personnet selection a test score that weakly prediets job performance has a correlation with
job performance of about 0.2 whereas a good predietor bas a correlation of about 0.4. A
correlation of 0.6 corresponds to a strong level of predierion and correlation coefficients for
a test predicting job performance rarely, if ever, exceed 0.7. Furthermore, the (un)reliability
of both the test and the criterion limit the validity of the test. The more inaccurate the
measurements are, the lower the predielive valne of the test will be. We refer to Appendix A
for the formnlae to calculate the ceiling placed by (un)reliability on the predictive value of a
test score. In our validity studies on the work sample we have found sufficient reliability for
both the predietor and the criterion. We can conclude that the validity is not severely limited
because of unreliability of either the work sample or the BOS. When we campare the
validity coefficients of .56 and .55 that we have found in the concurrent validity studies at
Chemco and Petco, respectively, with Bethel-Fox's rule of thumb, we can conclude that this
level of correlation corresponds to a strong level of prediction. So, the fact that we have
found these relatively high correlation coefficients in both studies indicates good concurrent
validity for the work sample.
To end this discussion on the magnitude of validity coefficients we like to point out that in fact there is no general answer to the question asked earlier. The interpretation of a
7. Validity ofthe work sample 125
validity coefficient should take into account a number of concomitant circumstances
(Anastasi, 1976). The obtained correlation, of course, should he high enough to be
statistically significant at some acceptable level. However, having established a significant
correlation between test and criterion weneed to evaluate the size of the correlation in light
of the uses to be made of the test. Anastasi gives an account of the standard error of estimate in which terms a validity coefficient may be interpreted. It appears that even with a validity
of .80, which is unusually high, the error of predicted scores is considerable. So, if the primary function of psychological tests were to predict each individuars exact score on a criterion, the outlook would be very discouraging. In our situation, however, as in most
testing situations it is not necessary to predict the specific criterion performance of indi
viduals, but rather to deterrnine which individuals will exceed a certain minimum standard
of performance, or cutoff point, in the criterion. A test may appreciably imprave predictive
efficiency if it shows moderate correlation with the criterion.
Predictive validity
We ended the sectionon the predictive validity with the remark that at the moment we still have only inconclusive data on the predictive validity of the work sample. It will
take at least two more years before we can make a start with colleering data on the criterion:
process control in the central control room. However, for one group of trainee-operators
from Trainca we have collected a ranking relating to the possibility of becoming a 'good'
process operator. This ranking was given by the joint trainingstaffat the company school.
Table 7.8 showed considerably high correlations between the rankingsof both Total-A and TOT AL scores on the work sample and the ranking at Trainco. Correlation between Total-B
and the ranking at Trainco was considerably lower. These results indicate that the total score
over type A exercises prediets quite well the ranking of the trainee-operators 18 months later. The total score over type B exercises only mildly correlates with this ranking. This
difference is quite remarkable, since the total score over type B exercises is used as the
predictor. In the two concurrent validity studies at Chemco and Petco correlations between Total-B and the criterion were considerably higher than correlations between either Total-A
or TOT AL and the criterion. This divergent result for the trainee-operators of Trainco can be
explained when we consider the criterion against which the results on the work sample are
correlated. The ranking of the students has not taken place based on results on the BOS,
which was used as the criterion in the concurrent validity studies. In ranking the students
the training staff has taken into consideration grade points - both in courses on theory and
practice -, attitude, behaviour at school and during intemsbips at the company, motivation,
etc. Because the training staff is involved with the students at school - a situation where
leaming takes place - it seems reasanabie to assume that this ranking is based mostly on an evaluation of the learning ability of the students. Since type A exercises are meant to give

128 Selection by simu/ation
8.1. Evaluation of the work sample
At this point in the design process of the work sample, we have reached the steps of evaluation and decision. In this phase of the design process the value of the work sample is discussed and a decision is made concerning the acceptability of the design. If the design should prove not acceptable, new adjustments will have to be made and we will enter yet another iteration of the design cycle. We should 'try again' togeneratea better design proposal. If we judge the design acceptable, which means an acceptable fit between requirements and characteristics is accomplished, we will enter a new phase in the research project: making the work sample 'user-ready'. As bas been described in section 3.1, when the decision is 'proceed' it means working out the provisional design proposal (or, when the
design is definitive: taking it into production). First, we evaluate the two fundamental requirements for each selection instrument (section 2.3): the reliability and the validity of the work sample. Then we evaluate the other requirements for the work sample as have been specified in chapter 4.
Reliability and validity ofthe work sample
We started the design process with entering the design cycle and specifying what had to be designed and for what purpose: - a reliable and valid selection instrument for the process operator's control task in the
(petro) chemica/industry in the form of a work sample.
The results on two different measures of reliability as presented in chapter 5 indicated sufficient reliability of the work sample. The overall impression of both test-retest
reliability and split-half reliability of the work sample is quite favourable. In the validity

8. Evaluation and decisions 129
studies with the trainee-operators of Petco and Trainca we found a meaningful relationship
between the scores on the first and second administration of the work sample. Furthermore,
split-half reliability was quite high in three of the four studies reported. Therefore, basedon
the results of these studies it is reasanabie to conclude that the requirement of reliability has
been fulfilled.
Now reliable measurement is established, we need to know that what we measure is
what we intend to measure. Here we come to address the issue of the validity of the work
sample. The results on the different types of validity are presented in chapter 7. First of all, these results indicate that we have succeeded in constructing a work sample with bath
sufficient face validity and content validity. Not only have we taken considerable care to
identify the key elements of the process operator's control task, experts on process control
(the operators themselves) have indicated in several studies moderate to good resemblance
of the exercises in the work sample with problems in reality. Furthermore, in a difficult
retranslation task the essential characteristics of the modules of the work sample have been recognised by a considerable number of operators. To establish criterion related validity we
first constructed a measurement device for measuring the criterion. In chapter 6 the con
struction of this device, a Behaviour Observation Scale for process operators, is descri bed.
In that chapter, results are presented which indicate that job performance can be reliably
measured with the BOS. So, having established sufficient reliability for both predietor and
criterion, we can praeeed with examining the criterion related validity of the work sample. This validity coefficient is the correlation between the total score on the type B exercises in
the work sample and the total score on the first performance dimension of the BOS. In the
two concurrent validity studies at Chemco and Petco we have found validity coefficients of .56 and .55, respectively. When we campare these validity coefficients with Bethel-Fox's
(1989) rule of thumb (see chapter 7 and Appendix A), we can conclude that this level of
correlation corresponds to a strong level of prediction. Furthermore, these validity
coefficients campare to the mean validity coefficient of .50 for work samples that is reported
by Van der Maesen de Sombreff (1990). As is mentioned in chapter 7, at the moment we
still have only inconclusive data on the predictive validity of the work sample. It will take at least two more years befare we can make a start with collecting data on the criterion 'Process control in the central control room' for the trainee-operators from Petco and
Trainca on whom we have collected results on the work sample. Only when these operators
are qualified to independently workas a process operator and control the processes from the
central control room, we can start collecting results on the BOS.
However, since measures of face validity, content validity and concurrent validity are all quite high, it is reasonable to conclude that the requirement of validity has been fulfilled (at
least as much as possible at this moment in time).
Befare we continue with a discussion of the other requirements to be fulfilled, we like to camment on the two different types of exercises in the work sample, type A exercises

130 Selection by simulation
and type B exercises, with regard to reliability and validity of the work sample. These two different types of exercises were fust introduced in section 4.4. For every process part type A exercises are presented frrst. These exercises are meant to give the candidate a 'feeling'
for the dynamics of the particular process part he is working on. In these type of exercises the operator actively needs to manipulate certain process variables in order to reach the required state of the process. This first kind of exercises is then foliowed by the type B exercises in which the particular process part is running at a steady state. When all goes well
the operator does not need to adjust any variables. Only when disturbances occur, the process will need adjusting in order to keep the most important process variables within given limits. In calculating test-retest reliability and criterion related validity, we have
calculated three types of total scores: a. total score over the type A exercises (Total-A); b. total score over the type B exercises (Total-B); c. total score over all18 exercises (TOT AL). In section 5.2, we concluded that the overall impression of both test-retest reliability and split-half reliability was quite favourable. We did not fmd remarkable differences between the different types of total scores in this regard. With re gard to the criterion related validity, however, we did obtain different results on the type A and type B exercises. In the
concurrent validity studies our expectations were confirmed. First of all, correlation of Total-B with the frrst dimension of the BOS was higher than the correlations of Total-B with the other dimensions of the BOS. This was found both at Chemco and at Petco. Furthermore, we found the highest correlation with the criterion for Total-B. The correlation of Total-A with the criterion was indeed lower. Because of the low correlation for Total-A,
correlation forTOTAL was also lower than for Total-B. In chapter 7 these results were explained taking the difference between the two kinds of exercises into consideration. The low correlations of type A exercises indicate that these exercises hardly discriminate between operators. This is what was expected, because these are 'practice' exercises to get acquainted with the partienlar process. Both 'good' and 'bad' operators need to get
acquainted with the dynamics of the particular process. Then, on the type B exercises the difference in process control skills is revealed. The relatively high correlations of type B exercises indicate that these exercises discriminate well between operators.
In the predictive validity study we found considerably high correlations between the rankingsof both Total-A and TOTAL scores on the work sample and the ranking of a subgroup of trainee-operators from Trainco. The trainee-operators were ranked by the
joined training staff of the company school of Trainco according to the criterion 'who would be the best process operator' (see section 7.3.2). Correlation between Total-B and the ranking at Trainco was considerably lower. These results indicated that the total score over type A exercises prediets quite well the ranking of the trainee-operators 18 months later. The total score over type B exercises only mildly correlates with this ranking. This difference is

8. EvalUll.tion and decisions 131
quite remarkable, since the total score over type B exercises is used as the predietor score.
In chapter 7, we have explained this result by referring to the criterion against which the
results on the work sample were correlated in the predictive validity study at Trainco. It
seemed reasonable to assume that this ranking was based mostly on an evaluation of the
learning ability of the students. Since type A exercises can be considered as 'practice'
exercises, performance on these exercises reflect mainly how fast candidates learn. Therefore, it is very plausible that the total score over these exercises correlates highly with
a criterion in which learning ability is 'over-represented'.
Other requirements to be fulfilled
In terms of the design cycle we have specified some first, global criteria in chapter 4
in the form of a list of requirements. The achievement of these requirements can be
summarised as follows: a simulated process is used as a basis for the work sample;
the process simulator consists of VDU instrumentation;
direct - on line interaction with the simulated processis possible; the work sample contains control targets and simulated disturbances of the process.
These items all arose from the process operator's control task which had to be represented in a work sample. Befare a start was made with designing and programming the simulated
process which we would use as a basis for the work sample of the process operator's
control task, we also specified several requirements for this simulated process. The
achievement of these requirements can be summarised as follows:
the process bas been modelled; qualitative relations between variables are specified: it is
known which input variables influence which output variables;
- the process has been quantified; quantitative relations between variables are specified: the magnitude of the effect of an input variabie on an output variabie is known;
- the process consists of simple operational units from the (petro)chemical process industry;
the process contains the process-related control problems as described in section 4.2;
the process is modular, so it can be used as a flexible basis for both a selection and a training instrument.
The design of the simulated process was part of the design process of the work
sample. For in the work sample the simulated process serves as the 'material' the process
operator works on in reality. Therefore, we are very pleased to conclude that all requirements we have specified in chapter 4 with regard to the process simulation have been ful
filled by our design. We refer toKnijpers & Leermakers (1987) fora detailed description of
the modular software contiguration of the T&W process simulator. Fora global description of this process simulator we refer to Appendix B. Fora detailed description of the simulated
132 Selection by simu/ation
process and its implementation we refer to De Vries (1992). A global description of the simulated process can be found in Appendix C. The exercises of the final work sample are described in Appendix D (in Dutch).
The achlevement of the additional requirement that was formulated in chapter 4
can be summarised as follows: - the work sample is suitable for both inexperienced and experienced operators. Results of both the concurrent and predictive validity studies have shown that measurement with the work sample is reliable for both inexperienced and experienced operators. Furthermore, discriminative power of the work sample has been attained for both populations. This is illustrated by the results of the pilot experiment (see section 4.3) and the results on the criterion related validity (see chapter 7).
Furthermore, not only requirements have been formulated in chapter 4 which should be fulfilled by the work sample, but also some constraints. Pulfilment of these constraints can be summarised as follows: - time to perform the work sample does not exceed four hours; - development and validation of the work sample was completed in four years. Since the work sample should be fitted in a one day selection procedure, time to perform the work sample should not exceed more than half a day. The validity studies showed that the time the operators needed to perform the work sample varled from three to four hours. Because of the time that is spent on the introductory part of the work sample and the fixed time periods for the type B exercises, minimum duration of the work sample is three hours. Operators performing very well on the type A exercises, which are finished when a desired process value is reached, take about three hours to perform the work sample. The longer it takes to complete the type A exercises, the longer the total duration of the work sample will be. However, because for all type A exercises there is a maximum time limit, maximum
duration of the work sample does not exceed four hours. Finally, since this research project started in the fall of 1987 and development and validation of the work sample was completed inthefall of 1991, we have also fulfilled the other constraint.
In sum, we conclude that the design of the work sample is acceptable. We have achieved an acceptable fit between the requirements that have been specified in chapter 4 and the characteristics of our last provisional design. So, in this phase of the project the decision is 'proceed'. This means working out the provisional design proposal. Since the design is not definitive yet (for instance, the process simulation runs on a mainframe computer), we will enter a new phase in the research project: making the work sample 'user-ready'. In order to make the work sample user-ready, another design cycle should be started. New requirements should be specified (for instance, the work sample should be portable) and a new design process should be started. This is globally described in the next section.
8. Evaluation and decisions 133
8.2. Future use of the work sample
As was mentioned above, since the result of the evaluation of the design of the work
sample was positive, a new design process was started: making the work sample user
ready. We wil! not describe at full length this design process, which again involves all the
steps of the design cycle, but instead give a short impression of how the final user-ready work sample looks and how it can be included in a selection procedure (see also Ridderbos,
1992). A multi-disciplinary design team consisting of experts from the behavioural,
engineering and computer sciences has worked to create the final work sample for selection
of process operators on a personal computer (pc) - which fulfils the requirement that the
work sample should be portable and easy to use - and to create a work sample analysis programme on pc in which results on the work sample are calculated with regard to a
reference group and which can be used to present results on several candidates graphically.
The work sample consistsof the same exercises that are described in Appendix D. In fact, the work sample on pc is exactly identical to the experimental version of the work sample on
the mainframe computer (PDP · with which the validity studies reported in this thesis were
performed) with regard to the process simulation, the exercises and the measures used in calculating the scores on the work sample. The main difference is that in the pc version there
is a totally automated instruction, while in the experimental version the experimenter had to
give instructions between the exercises and also had to start and stop the exercises manually
on the experimenter keyboard. Furthermore, when the experimental version of the work
sample was administered candidates read all text betonging to the work sample -
introduetion to the simulated process, tasks to be performed in the exercises - from a written instruction manuaL All this is also incorporated in the pc version of the work sample. For
the candidate this means that when the work sample programme is started up at a pc he is
automatically guided through the instructions, introductory text of the simulated process and
the 18 exerdses. The candidate interacts with the pc by means of a carefully constructed dialogue system. The pc 'tells' the candidate what to do, when to do it and (sometimes, but
of course not during the exercises!) how to do it. Furthermore, through 'commands' from
the pc the candidate starts the exercises himself. The pc 'detects' when the exercises are
finished and continues with the instructions for the next exercise. In this fashion the
candidate performs the 18 exercises of the work sample. The scores of the candidate are savedon a floppy, which uniquely belongs to this candidate.
When the work sample has been administered to one or more candidates, results on
the performance of the candidates can be obtained by 'feeding' the floppies belonging to the
candidates into a pc on which the work sample analysis programme is installed. This should
be done by the coordinator of the selection procedure. With this programme it is possible to
quickly obtain the results on the candidates. Results are presented a..<; percentiles, indicating

134 Selection by simu/ation
the position of the candidate with regard to the reference group chosen. The work sample
analysis programme contains two reference groups: trainee-operators and experienced operators. The data used in calculating the percentile scores come from the validity studies
reported in this thesis. For a detailed description of a session with the work sample on pc -
from administration of the work sample to a candidate to calculating the results in the work sample analysis programme - we refer to the instruction manual of the work sample
(Ridderbos, Kragt, Leermakers, Knijpers & Buis, 1992).
Since the work sample represents part of the process operator's job, namely the task of process control in the central control room, the result of a candidate on the work sample
should not be used as the 'one-and-only' indicator of how suitable the candidate is for the operator job. The work sample should be considereq as one of the tools in the total selection
procedure, providing information on the ability of the candidate with regard to bis process
control skills. This is one of the most important achievements of this research project, because this was the part of the operator job for which a lack of well defined perfonnance criteria was observed (Kragt & Daniëls, 1984). Furthermore, the work sample approach to
the design of a selection instrument has not only led to the development of a work sample on process control skills, but also to the development of a measurement instrument for the operator job as a whole, the Behaviour Observation Scale (BOS - see chapter 6). This BOS
has been used as the criterion measure in the validity studies on the work sample, but cao
also be used in a wider context, for instanee for performance appraisal. We refer to the
epilogue for further discussion on this subject. In a selection procedure the work sample is an excellent tooi to obtain information on the process control skilis of the candidate.
Information on other skilis and abilities which are judged necessary to perform the operator job - such as administration, communication, cooperation and maintenance - should come
from other sourees in the selection procedure, for instanee the application form, interviews
and/or exposure to the job in the form of plant tours and conversations with future colleagues. Adding the work sample to the selection procedure will provide important
information on the candidate with regard to the operator job. Consequently, this willlead to
better founded decisions a bout a candidate's suitability for the operator job.

Epilogue
In this epilogue possible directions of future research in the process industry are
suggested. Recommendations and suggestions will be restricted to the subjects of training
and performance appraisal of process operators. These subjects are related to the selection
of process operators. With regard to the subject of training two important aspects are dealt with in this epilogue: a. training simulators; b. the development of effective training
programmes.
Training
As described in section 1.4, the workshop organised in the Netherlands under the motto: "The skills of the process operator, an unknown area in the field of process automation" (Bollen & Meerbach, 1986) highlighted the common needs of the participating
companies with regard to selection, education and training of process operators. This workshop directly resulted in the start of the research project reported in this thesis. The research project started under the title: 'Process simulation for selection and training of process
operators'. It was hypothesised that process simulation could be a powerful tooi in developing both a selection instrument and a training programme for process operators.
However, we decided to first complete the development of a valid selection instrument
before we would take up the issue of training. Therefore, the results reported in this thesis cover the design and development of this selection instrument: a work sample of the process
operator's control task. Process simulation is used as a basis for this work sample. In chapter 4 (figure 4.1) is described how the key elementsof the eperator's process control task are used as building blocks for the work sample. In our opinion, however, these
building blocks can not only be used in a work sample for selection purposes but also in a
work sample for training purposes. In section 1.3.2 three types of training were identified
in the process industry: L basic training; 2. specialised training; 3. refreshment training. When we mention a training instrument based on the same building blocks we used in the
selection instrument we refer to an instrument for basic training, which involves the learning of basic process knowledge and general operator skills. During the course of the research
project we learned that there was poor coordination between the formal education in the
school system and the training on the job of process operators. What is leamed in schools
that prepare pupils for the operator job (e.g. MTS process technique) lags behind what is
needed in practice. It seems that schools can not keep up with the speed of technological
innovations. Basic simulator training in schools would be one way to bridge the gap
between school and the real work situation. Since this basic simulator training can be
executed on a pc, it is a tooi within reach for many schools which can not afford expensive
simulators. Because the simulated process in the work sample is modular, it can be used as a flexible base for both a selection and a training instrument. This was illustrated in figure
4.1. The work sample forselection purposes consistsof separate modules each containing a
separate simulated process part. In a training programme these modules could be linked

136 Selection by simu/ation
together. This way the training programme would consist of several training steps, each step
introducing a new module containing a new process part and new problems to be controlled. As a result complexity is increased during the training process. Furthermore,
modules not included in the selection instrument, e.g. the process part containing the control problem 'recycling' (see section 4.3), can also be used in the construction of a training simulator programme for basic process control skills. Eventually all modules can be
connected in order to create a 'total' process to be controlled, consisting of several process
parts each containing a different process-related control problem. Research is needed on how to combine the modules in order to create an effective training programme.
During the course of the research project we also learned that process simulators are
used more and more in industry for specialised and refreshment training of the existing crew of operators. However, in section 1.3.2 we mentioned that many very costly training
simulators ushered in by overenthusiastic plant managers to solve their training problems
can be found nowadays in dusty cellars and depots. One of the reasous is that in most companies no systematic training programme is introduced. Without such a programme the
simulator becomes nothing more then a 'toy' (although a very expensive one), often used
when it is still new and exciting but neglected when the first glitter has worn off. Furthermore, an instructor is needed to coordinate the simulator training and the operators
should be given time off work to participate in the training. When these conditions are not
fulfilled simulator training is doomed to fail. Generally it is thought that one-to-one (high fidelity) simulation with regard to (a
part) of a specific process is needed for specialised or refreshment training. However, perfect one-to-one simularion is very expensive and hard to rnaintaio (when something is
changed in the real system, it should be changed in the simulator also). Furthermore, it is not known how much fidelity in terms of a high degree of physical sirnilarity with the
simulated process - is needed for effecrive training. There is a lot of speenlation going on. Research in this area is badly needed.
Performance appraisal
To determine the relationship between performance on the work sample for process
operators and performance of operators on process control in reality, a performance appraisal system was needed to compare the results on the work sample with the results in
reallife situations. In chapter 6, the design process of such a performance appraisal system,
a Behaviour Observation Scale (BOS) for process operators, is described. This BOS was used as the criterion measure in the validity studies on the work sample. The BOS covers the 'whole' process operator's job. It includes four main performance dimensions: 1. Process control in the central control room; 2. Process control outside;

Epilogue 137
3. Communication and cooperation;
4. Safety. Although we have developed the BOS for criterion measurement in our validity studies on
the work sample and only used the score on the dimension 'Process control in the central
control room' as our criterion measure, the total score on the BOS can be used for (annual) performance appraisal of process operators by companies from the process industry. The BOS is a performance appraisal system based on behavioural criteria and - taken all
behavioural criteria together - these criteria provide an accurate idea of what is expected of the operator on the job. If, for example, someone's performance should decrease, the BOS can be used to identify the weak spots, while at the same time the BOS indicates what activities should be employed in order to increase performance. This is the main advantage of appraisal systems based on behavioural criteria. It is our opinion that the BOS is suitable
for appraisal of individual operators. As was already mentioned in chapter 6, we found a rank correlation of .76 between the total score on the BOS and the ranking as aresult of a company ranking system of Chemco. This indicates considerable relevance. Although the
utmost care has been taken in constructing the BOS to identify and incorporate all important aspects of the process operator's job, appraisal of operators with the BOS has been taken place in just two companies from the chemica! and petrochemical process industry. Further
research is needed to find out if the work performance of operators from other companies can be reliably appraised with the BOS.
Some last remarks
Finally, we like to conclude with some last remarks concerning the usefulness of
process simulation with regard to selection and training of process operators. We have
found process simulation to be a valuable tooi in the development of a work sample for selection purposes. The results as presented in this thesis indicate that both reliability and (concurrent) validity of this work sample are good. However, it also became very clear that developing simulations is a time consuming activity. In the case of the work sample for selection purposes we had a simulation (process simulation) in a simulation (work sample). Therefore, in developing the instrument the use of the design cycle as a frame of reference was very important. The formulation of a list of requirements and constraints is essential in sketching the outline of the instrument to be developed. As is described in Appendix A, the
utility of a selection instrument refers to the practical usefulness of the instrument that allows the user to make. better hiring decisions, save money, improve efficiency etc. (SlOP, 1987). In this appendix a formula is given to estimate the economie benefits of a selection instrument. This formula incorporates a sealing factor (SDy) to translate standardised criterion levels into dollars (or guilders). However, measuring .SDy, the variability of job performance in dollars (or guilders) per year, has proven controversial. Therefore, it is not

138 Selection by simu/ation
possible to estimate precisely the economie benefits of the work sample for process operators. However, it is possible to give another evaluation of the practical usefulness of the work sample. This can be done by using the Taylor-Russell tables (see Roe, 1983) to establish the relationship of a validity coefficient to the practical effectiveness of a test in selection. According to these tables (Boudreau, 1989), when other parameters are held constant: 1. higher validities result in more improved success ratios (where the success ratio represents the percentage of selected individuals who are successful on the job); 2. lower
selection ratios (which represent the number of individuals selected divided by the number of individuals that applied for a job) result in more improved success ratios (because the lower the selection ratio, the more 'choosy' the selection decision); 3. base rates closer to 0.50 result in more improved success ratios because valid selection has less value as you approach a base rate of zero (where none of the applicants can be successful) or as you approach a base rate of 1.0 (where all applicants can succeed even without selection). So,
when we consider the validity coefficient we have found for the work sample for process operators (.55, see chapter 7), we find that given a base rate of .50 (where one out of two applicants can be successful) and a selection ratio of .20 (where one out of five applicants is hired) the success ratio improves from .50 (without a selection instrument) to .82 when the work sample is used as the selection instrument. This means that - given this base rate and
selection ratio - without applying the work sample chances are 50% that the most suitable applicant is chosen, while chances improve up to 80% when the work sample is applied in selection.
So, we have found simulation techniques to be very useful in the development of a selection instrument. In our opinion this could also be the case in the development of a training instrument as long as a list of requirements and constraints - an indispensable part
of the design cycle - is formulated beforehand. For any design process the use of the design cycle as a frame of reference facilitates the fit between the expected characteristics of the product and actual characteristics of the product. In this way, the fin al product can really live up to its expectations.
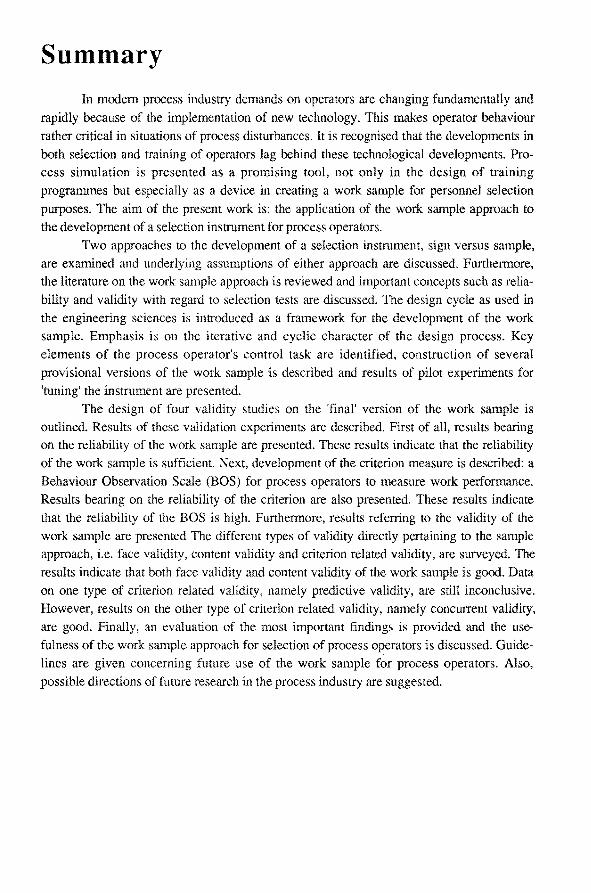
Summary
In modem process industry demands on operators are changing fundamentally and rapidly because of the implementation of new technology. This makes operator behaviour
rather critica! in situations of process disturbances. It is recognised that the developments in bath selection and training of operators lag bebind these technological developments. Process simulation is presented as a promising tooi, not only in the design of training programmes but especially as a device in creating a work sample for persounel selection
purposes. The aim of the present work is: the application of the work sample approach to the development of a selection instrument for process operators.
Two approaches to the development of a selection instrument, sign versus sample, are examined and underlying assumptions of either approach are discussed. Furthermore, the literature on the work sample approach is reviewed and important concepts such as relia
bility and validity with regard to selection tests are discussed. The design cycle as used in the engineering sciences is introduced as a framewerk for the development of the work sample. Emphasis is on the iterative and cyclic character of the design process. Key elements of the process operator's control task are identified, construction of several provisional versions of the work sample is described and results of pilot experiments for 'tuning' the instrument are presented.
The design of four validity studies on the 'final' version of the work sample is outlined. Results of these validation experiments are described. First of all, results hearing on the reliability of the work sample are presented. These results indicate that the reliability of the work sample is sufficient. Next, development of the criterion measure is described: a Behaviour Observation Scale (BOS) for process operators to measure work performance. Results bearing on the reliability of the criterion are also presented. These results indicate that the reliability of the BOS is high. Furthermore, results referring to the validity of the work sample are presented The different types of validity directly pertaining to the sample approach, i.e. face validity, content validity and criterion related validity, are surveyed. The results indicate that both face validity and content validity of the work sample is good. Data on one type of criterion related validity, namely predictive validity, are still inconclusive. However, results on the other type of criterion related validity, namely concurrent validity, are good. Finally, an evaluation of the most important findings is provided and the usefulness of the work sample approach for selection of process operators is discussed. Guidelines are given concerning future use of the work sample for process operators. Also, possible directions of future research in the process industry are suggested.

Samenvatting (surnrnary in Dutch)
Hieronder is als Nederlandse samenvatting een enigszins gewijzigde versie van het artikel 'Arbeidsproef voor procesoperators; processimulator test regelprestaties van sollicitanten' uit de Gids voor Personeelsmanagement opgenomen (Ridderbos, 1992).
In de procesindustrie heeft de werksituatie van operators de laatste jaren grote veranderingen ondergaan. Door de automatisering, schaalvergroting en toenemende complexiteit van de meeste processen moet een operator tegenwoordig over behoorlijk wat cognitieve
vaardigheden beschikken, zoals beslissen, redeneren, anticiperen, fouten diagnose en probleem oplossen. Terwijl in het operator-vak van oudsher motorische vaardigheden een grote rol speelden, zijn de werkzaamheden in de centrale meet- en regelkamers momenteel nauwelijks nog als zodanig te kenschetsen. Dit veranderde takenpakket vereist o.a. aanpassing van de selectiemethode van procesoperators. Aan de TU Eindhoven is hiertoe een onderzoeksproject gestart waarbij een arbeidsproef voor procesoperators is ontwikkeld op een proces-simulator.
De ontwikkeling van deze arbeidsproef heeft zich beperkt tot de regeltaak van de operator. De proef is een afspiegeling van een deel van het werkgedrag dat noodzakelijk is voor een goede beheersing van een proces. Functie-aspecten als communicatie, samenwerking, administratie en geschiktheid om 's nachts te werken zijn bewust buiten beschouwing
gelaten. De proef richt zich op de voornaamste taak van de operator in de centrale meet- en regelkamer: het regelen van de processen vanuit deze centrale positie met behulp van beeldscherm-instrumentatie. Tegenwoordig is dit immer één van de meest cruciale taken van de procesoperator. De andere functie-aspecten kunnen op een andere manier tijdens de selectieprocedure aan de orde komen, bijvoorbeeld tijdens het selectie-interview of de medische keuring. De arbeidsproef is dus een onderdeel van de selectieprocedure. Prestaties op de
proef geven dan een indicatie van de regelvaardigheid van de kandidaat. Bij de ontwikkeling van de arbeidsproef is de basiscyclus van het ontwerpen uit de
technische wetenschappen gehanteerd. Met behulp van deze ontwerpcyclus kan een complex ontwerpproces systematisch worden aangepakt De nadruk ligt hierbij op het iteratieve
karakter van het ontwerpproces. De ontwikkeling van de arbeidsproef is in dit proefschrift dan ook beschreven aan de hand van de stappen waaruit de ontwerpcyclus is opgebouwd, nl. analyse, synthese, simulatie, evaluatie en beslissing.
Aan de ontwikkeling van de arbeidsproef ligt een inventarisatie van de regeltaak van de procesoperator in de Nederlandse procesindustrie ten grondslag. Het accent is hierbij gelegd op een analyse van de meest kritische en frequent voorkomende componenten van de regeltaak. Verschillende technieken zijn gebruikt om de gedetailleerde taakinformatie te achterhalen, die noodzakelijk is voor de simulatie. Zo is gebruik gemaakt van observaties,
interviews en vragenlijsten. De observaties zijn uitgevoerd als 'participerende' observaties, voornamelijk tijdens operator shifts in de centrale meet- en regelkamers van diverse

142 Selection by simulation
fabrieken. Gedurende vier weken zijn in zes verschillende bedrijven uit de (petro)chemische industrie ongeveer dertig semi-gestructureerde interviews gehouden met operators, trainers en produktie-managers. Met behulp van de kritieke incidentenmethode zijn zoveel mogelijk specifieke situaties achterhaald waarin operators moeite hadden met de uitvoering van hun regeltaak. Vervolgens is uit al deze processpecifieke regelproblemen een aantal algemene gedefinieerd. Deze algemene regelproblemen zijn tenslotte opgenomen in een vragenlijst.
Operators en meet- en regeltechnici uit verschillende bedrijven hebben deze vragenlijst ingevuld. Op basis van hun antwoorden zijn die componenten uit de regeltaak achterhaald, die zowel het meest kritisch waren als ook het meest frequent voorkwamen. Vervolgens zijn als testontwerpen enkele basismodules ontwikkeld met behulp van een gesimuleerd proces, waarin deze algemene regelproblemen zijn opgenomen. Een basismodule bestaat uit een deelproces met diverse opdrachten voor de kandidaat-operator. De kandidaat ziet dit deelproces schematisch op een beeldscherm. Daaraan is een toetsenbord gekoppeld dat hij kan gebruiken om commando's te geven, zoals een klep in het deelproces vijf procent open sturen. Een voorbeeld van zo'n basismodule is het deelproces 'warmtewisselaar met transportleiding'. Een regelprobleem dat hierin is verwerkt is 'looptijd'. Zo duurt het bij deze module vrij lang voordat het effect van een ingreep of storing zichtbaar is. De basismodules zijn bij studenten, leerling-operators, ervaren operators en trainers uitgeprobeerd. Op deze manier werden niet alleen onvolkomenheden in de programmatuur van de proces-simulaties en de geschreven instructies ontdekt, maar ook werden praktische zaken als tijdsduur, bedieningsgemak van het toetsenbord en overzichtelijkheid van de plaatjes op het beeldscherm uitgetest. Tevens zijn de moeilijkheidsgraad van de modules en het daarmee samenhangende onderscheidingsvermogen van de opgaven onderzocht. Uiteindelijk is uit de basismodules een arbeidsproef samengesteld waarmee uitgebreide validatie-studies zijn uitgevoerd.
Onderzoek naar de betrouwbaarheid van arbeidsproeven is noodzakelijk om na te gaan hoe consistent de testresultaten zijn. Als indicatie voor de betrouwbaarheid kan een test-hertest correlatie worden berekend. Is er bij een tweede afname van de proef sprake van
dezelfde resultaten of zijn ze bepaald door toeval? Voor de arbeidsproef voor procesoperators zijn bij twee experimenten met leerling-operators test-hertest correlaties gevonden van .76 en .77. Verder is nog een zogenaamd splitchalf betrouwbaarheidscoëfficiënt berekend. Hiertoe wordt de proef in twee vergelijkbare delen verdeeld. Vervolgens worden deze twee delen gecorreleerd. Bij enkele experimenten bleek ook uit deze test dat de arbeidspeoef voldoende betrouwbaar is.
De validiteit van de arbeidsproef (gelijktijdige validiteit) is onderzocht in twee experimenten met ervaren operators in twee verschillende bedrijven. Vrijwel alle operators van
de twee fabrieken hebben aan de proef deelgenomen. Tevens zijn via een door de directe chef ingevulde beoordelingslijst gegevens verzameld over de prestaties van de operators in de praktijk. Wat de .arbeidsproef immers beoogt te voorspellen is de regelvaardigheid in de

Samenvatting 143
praktijk. Het grote manco van veel validiteitsstudies is, dat men aan de kant van de predietor wel betrouwbare gegevens heeft verzameld, maar helaas niet aan de kant van het criterium. Wanneer dan een lage validiteit wordt gevonden, is dit vaak te wijten aan de onbetrouwbaar
heid van het criterium. Daarom is grote aandacht besteed aan het ontwikkelen van een betrouwbaar instrument om de regelvaardigheid in de praktijk (het criterium) te meten. Er is een beoordelingsschaal ontwikkeld die op betrouwbare wijze de prestaties van de operator aangeeft op verschillende taakdimensies. Deze beoordelingslijst is een zogenaamde Behaviour Observation Scale (BOS-schaal). Het gaat hierbij om een beoordeling van direct observeerbaar gedrag en niet om een beoordeling van eigenschappen van operators. De beoordelingslijst is opgebouwd uit de volgende taakdimensies: 1. bedienen meet- en
regelapparatuur; 2. buiten lopen; 3. communicatie en samenwerking; en 4. veiligheid. De score op de eerste dimensie is de criteriumscore. De correlatie van de arbeidsproef met deze
criteriumscore was in de twee experimenten .56 en .55. Dit is een vrij hoge validiteit. Hoe kan de arbeidsproet voor procesoperators nu in de praktijk worden toegepast?
Tot nu toe bestaat de selectiepraktijk voor operators in de chemie voornamelijk uit het raadplegen van biografische gegevens en het houden van een of meer interviews met kandidaten. Her en der wordt ook wel eens van psychologische tests gebruik gemaakt. Maar het merendeel van de bedrijven heeft daar weinig vertrouwen in. Over het algemeen kunnen we
stellen dat de selectiepraktijk in de procesindustrie niet erg valide is. Een bijkomende moeilijkheid is dat men door de nieuwe technologische ontwikkelingen geen goed inzicht meer heeft in wat nu de kritische operator-vaardigheden zijn. Daarom zijn in de arbeidsproef nu juist opgaven opgenomen die een beroep doen op deze kritische vaardigheden. Prestaties op de arbeidsproef zijn een indicatie voor het toekomstig functioneren van de procesoperator met betrekking tot zijn belangrijkste taak: de regeltaak. Andere functie-aspecten, zoals
vermogen tot samenwerken en geschiktheid voor continu-dienst, moeten op een andere manier in de selectieprocedure aan de orde komen. De proef dient dus te worden ingepast in de totale procedure. V oor de personeelsfunctionaris of degene die de selectie-activiteiten
coördineert verloopt de proef als volgt De kandidaat wordt achter een pc gezet, waarop de
proef 'draait'. Vervolgens wordt de kandidaat geheel automatisch door het programma en de opgaven geleid. Na deze sessie, die in totaal drie tot vier uur duurt, worden alle gegevens van de kandidaat verwerkt in een analyse programma. Dit programma kan de personeels
functionaris eenvoudig zelf bedienen en binnen enkele minuten weet hij de score van de kandidaat. Bovendien wordt aangegeven hoe hij deze score moet interpreteren, omdat het programma diverse normtabellen bevat. Daarmee kan de personeelsfunctionaris de relatieve positie van een kandidaat bepalen ten opzichte van een gekozen referentiegroep, zoals leerling-operator versus ervaren operator.
Het toevoegen van de arbeidsproef aan de bestaande selectieprocedure zorgt ervoor
dat een meer weloverwogen en beter gefundeerd besluit kan worden genomen over de geschiktheid van een kandidaat voor het operator-vak.

References
Adler, P. (1986). New technologies, new skills. California Management Review. Volume XXIX, number 1, The Regents of the University of Califomia.
Algera, J.A. (1977). Period of validity of testscores; stability of scores and gain in scores
upon retesting. Dutch Joumal of Psychology, 32, 423-430 (in Dutch). Algera, J.A. (1988). Task analysis and new technologies. In: V. de Keyser, T. Qvale &
S.A. Ruiz Quintanilla (Eds.), The meaning of work and technological options.
Chichester: John Wiley & Sons. Algera, J.A. & Greuter, M.A.M. (1989). Job analysis for personnel selection. In: M. Smith
& I. Robertson (Eds.), Advances in personaf selection and assessment. Chichester:
John Wiley & Sons. American Educational Research Association, American Psychological Association &
National Council on Measurement in Education (1985). Standards for educational and psychological testing. Washington DC: American Psychological Association.
Anastasi, A. (1976). Psychological testing. New York: MacMillan Publishing Co.
Asher, J.J. & Sciarrino, J.A. (1974). Realistic work sample tests: a review. Personnet Psychology, 27, 519-533.
Astley, J., Shepherd, A. & Whitfield, D. (1990). A review of UK and international
knowledge and practice in the selection of process control operators. In: E.J. Lovesey
(Ed.), Contemporary Ergonomics. Proceedings of the Ergonornies Society's 1990 Annual Conference, Leeds, England.
Bainbridge, L. (1982). Ironiesof automation. In: G. Johannsen & J.E. Rijnsdorp (Eds.),
Analysis, ·design and evaluation of man-machine systems. Proceedings
IFAC/IFIP/IFORS/ IEA Conference, Baden-Baden, Germany.
Bainbridge, L. (1989). Cognitive processes and training methods: a summary. In: L.
Bainbridge & S.A. Ruiz Quintanilla (Eds.), Developing skilts with information technology. Chichester: John Wiley & Sons.
Baker, S. & Marshall, E. (1989). Simulators for training and the evaluation of operator
performance. In: L. Bainbridge, S.A. Ruiz Quintanilla (Eds.), Developing skilis with information technology. Chichester: John Wiley & Sons.
Bastiaans, R.H.R.H. (1989). Design methodology and development of user-interfaces. In:
F.R.H. Zijlstra & A.G. Arnold (Red.). Man-computer interaction in the Netherlands. Amsterdam: Stichting Informatica Congressen.
Bethel-Fox, Ch. E. (1989). Psychological testing. In: P. Herriot (Ed.), Assessment and
selection in organizations: methods and practice for reeruitment and appraisal. Chichester: John Wiley & Sons.

146 Selection by simulation
Bollen, L.A.A. & Meerbach, H.C.C.M. (Eds.) (1986}. Process & automation. Proceedings of the workshop organised by Essochem Holland B.V., September 17th, Rozenburg, The Netherlands. (In Dutch).
Bom, M.Ph., Algera, J.A. & Hooiwerf (1988). Dilemmas in the measurement of management qualities; construction problems in the development of an In-Basket test to determine management potential. Behaviour and Organisation, 1, p. 30 (In Dutch).
Boudreau, J.W. (1989). Selection utility analysis: a review and agenda for future research. In: M. Smith & I. Robertson (Eds.), Advances in selection and assessment. Chichester: John Wiley & Sons.
Brinkman, J.A., Kragt, H. & Piso, E. (1985). An operator-oriented analysis of the process operator's job. Proceedings of the 2nd IFAC/IFIP/IFORS/IEA Conference on analysis, design and evaluation of man-machine systems, Varese, Italy.
Campion, J.E. (1972). Work sampling for personnet selection. Journal of Applied Psychology, 56, 1, 40-44.
Cascio, W.F. (1989). Managing human resources; productivity, quality of work life,
profits. New York: McGraw-Hill. Cascio, W.F. & Phillips, N.F. (1979). Performance testing: a rose among thorns?
PersonnelPsychology, 32,751-766. Christis, J. (1987). Automation in the process industry. In: H.O. Steensma & V.Chr.
Vrooland (Eds.), Automation does notpraeeed automatically. Amsterdam: Stichting CCOZ (In Dutch).
Cook, M. (1988). Personnet selectionandproductivity. Chichester: John Wiley & Sons. Crossman, E.R.F.W. (1960). Automation and skill. In: E. Edwards & F.P. Lees (1974)
(Eds.). The human operator in process control. London: Taylor & Francis. Cullen, R. (1989). Process simulation for selection and training of operators in the
petrochemical industry. Graduation report, Eindhoven University of Technology, Graduate Schools of Electrical Engineering and Industrial Engineering and Management Science, Department Technology and Work, Ergonornies no. 40 (In Dutch).
Dousma, T. & Horsten, A. (1980). Constructing and administering exams. Utrecht: Spectrum (In Dutch).
Duncan, K.D. (1974}. Analytica! techniques in training design. In: E. Edwards & F.P. Lees (Eds.). The human operator in process control. London: Taylor & Francis.
Edwards, A.L. (1967). Statistica/ methods {2nd Ed.). New York: Holt, Rinehart & Winston.
Edwards, E. & Lees, F.P. (1973). Man & computer in process control. Huddersfield: H. Charlesworth & Co.
Edwards, E. & Lees, F.P. (Eds.) (1974). The human operator in process control. London: Taylor & Francis.

References 147
Ekkers, C.L., Brouwers, A.A.F., Pasmooij, C.K. & Vlaming, P.M. de (1980). Human regulatory and control tasks. Leiden: NlPG(fNO (In Dutch).
Feltham, R.T. (1989). Assessment centres. In: P. Herriot (Ed.),Assessment and selection in organizations: methods and practice for reeruitment and appraisal. Chichester: John Wiley & Sons.
Flanagan, J.C. (1954). The critical incident technique, Psychological Bulletin, 51, 327-
358. Geurts, J.P. (1988). Modular process simulationfor selection and training of operators
from the process industry. Graduation report, Eindhoven University of Technology, Graduate Schools of Teehoical Physics and Industrial Engineering and Management Science, Department Technology and Work, Ergonornies no. 35 I NR 1573 (In Dutch).
Ginneken, A. van (1990). Developing performance dimensions for appraisal of process operators. Graduation report, Eindhoven U niversity of Technology, Graduate School of Industrial Engineering and Management Science, Department Technology and Work (in Dutch).
Greuter, M.A. (1989). Performance modelling for personnel selection. In: P. Herriot (Ed.), Assessment and selection in organizations: methods and practice for reeruitment and appraisal. Chichester: John Wiley & Sons.
Greuter, M.A. & Algera, J.A. (1989). Criterion development and job analysis. In: P.
Herriot (Ed.), Assessment and selection in organizations: methods and practice for reeruitment and appraisal. Chichester: John Wiley & Sons.
Handyside, J.D. (1988). Severity-leniency and the 'halo-effect' in ratings. Guldance and Assessment Review, December.
Handyside, J.D. (1989). On ratings and rating scales. In: P. Herriot (Ed.), Assessment and selection in organizations: Methods and practice for reeruitment and appraisal. Chichester: John Wiley & Sons.
Henderson, R. (1984 ). Performance appraisal. Reston, Virginia: Reston Publishing Company.
Hiscock, W.G. (1938). Selection tests for chemica! process workers. Occupational Psychology, 12, 178-186.
Hunter, J.E. & Hunter, R.F. (1984). Validity and utility of alternative predietors of performance. Psychological Bulletin, 96, 72-98.
Jelsma, 0. (1989). Instructional control of transfer. Enschede: Bijlstra & Van Merriënboer. Jelsma, 0. & Bijlstra, J.P. (1988). Training for transfer in learning to detect, diagnose,
and compensate system failures. Proceedings of the seventh european annual conference on human decision making and manual control, Paris, France.

148 Selection by simulation
Jetten, G.E.M. (1987), Selection, education and training of operators. Graduation report, Eindhoven University of Technology, Graduate School of Industrial Engineering and Management Science, Department Technology and Work, Ergonornies no. 14 (in Dutch).
Jong, P.J. de & Wijn, W.J. de (1983). Training of process operators; modeHing and simulation. PT/Process Technique, 38, no.lO, 31-33 (In Dutch).
Kluytmans, A.W.G. (1989). Implementation of the 'sum-process' for developing a work sample. Graduation Report, Eindhoven University of Technology, Graduate School of Industrial Engineering and Management Science, Department Technology and Work, Ergonornies no. 46 (In Dutch).
Kragt, H. (1983). Operator tasks and annunciator systems; studies in the process industry. Eindhoven: De Witte B.V.
Kragt, H. & Daniëls, M.J.M. (1984). Some remarks on the process operator and his job: the human operator in the control room of tomorrow. In: EFCE PubHeation Series, no. 38, 191-200.
Kragt, H. & Landeweerd, J.A. (1974). Mental skills in process controL In: E. Edwards & F.P. Lees (Eds.), The human operator in process control. London: Taylor & Francis.
Knijpers, K. & Leermakers, T. (1987). The Bdk/T&W process simulator manual. Intemal report, Eindhoven University ofTechnology, Graduate School of Industrial Engineering and Management Science, Department Technology and Work, Ergonornies no. 2 (In Dutch).
Landy, F.J. & Farr, J.L. (1983). The measurement of work performance, theory and applications. New Y ork: Academie Press.
Landy, F.J. & Rastegary, H. (1989). Criteria for selection. In: Smith, M. & Robertson, I. (Eds.), Advances in selection and assessment. Chichester: John Wiley & Sons.
Latham, G.P. & Wexley, K.N. (1982). lncreasing productivity through performance appraisal. Amsterdam: Addison-Wesley Publishing Company.
Lawshe, C.H. (1975). A quantitative approach to content validity, Personnet Psychology, 28, 563-575.
Levine, E.L. (1983). Everything you always wanted to know about job analysis, and
more! ... a job analysis primer. Tampa: Mariner Publishing Company. Lojek, R.J., Leins, R.O. & Eul, H.J. (1988). Dynamic simulation- Olefins plant operator
training system. Reports on Science and Technology, 44, 60-65. Maesen de Sombreff, P. van der & Westen, G. (1991). Test for data processing at the tax
collector's office; practical exercise as combination of minicourse and work sample. Personnet Management, 27, 10, 593-596 (In Dutch).
Marshall, E.C., Scanlon, K.E., Shepherd, A. & Duncan, K.D. (1981). Panel diagnosis training for major-hazard continuous-process installations. The chemica! engineer, no .2, 66-69.

References 149
Meister, D. (1985). Behaviaral analysis and measurement methods. New York: John Wiley
& Sons.
Mellaard, M., Kop, A.A.M. & Miedema, J.A. (1985). Training of process operators;
Method for choosing a simulator. PT/Process Technique, 40, no. 9, 28-32 (In Dutch).
Meerling (1980). Methods en techniques in psychological research, part 1, Model observation and decision. Amsterdam: Boom Meppel (in Dutch).
Moraal, J. (1983). The validity of simulators. Dutch Journat of Psychology, 38, 125-139
(lnDutch).
Moser, K. & Schuier, H. (1989). The nature of psychological measurement. In: P. Herriot
(Ed.), Assessment and selection in organizations: methods and practice for reeruitment
andappraisal. Chichester: John Wiley & Sons.
Motowidlo, S.J., Dunnette, M.D. & Carter, G.W. (1990). An alternative selection
procedure: the low-fidelity simulation. Journalof Applied Psychology, 75, 6, 640-647.
Norros, L. Ranta, J. & Wahlstrom, B. (1982). On the rnadelling of the human process
operator. In: G. Johannsen & J.E. Rijnsdorp (Eds.), Analysis, design and evaluation
of man-machine systems. Proceedings IFAC/IFIP/IFORS/IEA Conference, Baden
Baden, Germany.
Olsson, G. (1988). Job design in complex man-machine systems. In: J. Ranta (Ed.),
Analysis, design and evaluation of man-machine systems. Selected papers from the
third IF AC/IFIP/IEA/IFORS Conference, Oulu, Finland.
Reilly, R. & Israelski, E. (1988). Development and validation of minicourses in the tele
communication industry.Journal of Applied Psychology, 73, 4, 721-726. Ridderbos, A (1990). Work samples forselection and training; process control performance
of trainee operators and experienced operators on a process simulator. PT/Process
Technique, 3, nr. 45, 30-33 (In Dutch).
Ridderbos, A. (1992). Work sample for process operators; process simulator tests process
control performance of candidates. Guide for Personnel Management, A, 47-49 (In
Dutch).
Ridderbos, A., Kragt, H., Leerrnakers, T., Kuijpers, K. & Buis, D. (1992). Handhook and instruction manual of the work sample for process operators. Eindhoven U niversity
of Technology, Graduate School for Industrial Engineering and Management Science,
Department Technology and Work (in Dutch).
Rijnsdorp, J.E. (1991). lntegrated processcontroland automation. Process measurement
and control, Vo/2. Amsterdam: Elsevier.
Robertson, I. & Downs, S. (1979). Learning and the prediction of performance:
development of trainability testing in the United Kingdom. Journal of Applied Psychology, Vol. 64, No. I, 42-50.
Robertson, LT. & Kandola, R.S. (1982). Work sample tests: validity, adverse impact and
applicant reaction. Journalof Occupational Psychology, 55, 171-183.

150 Selection by simu/ation
Robertson, LT. & Smith, M. (1989). Personnet selection methods. In: Smith, M. & Robertson, I. (Eds.), Advances in selection and assessnient. Chichester: John Wiley & Sons.
Roe, R.A. (1983). Foundations ofpersonnel selection. Assen: Van Gorcum (In Dutch). Roe, R.A. (1989a). Introduetion to section 2: The selection process. In: P. Herriot (Ed.),
Assessment and selection in organizations: methods and practice for reeruitment and appraisal. Chichester: John Wiley & Sons.
Roe, R.A. (1989b). Designing selection procedures. In: P. Herriot (Ed.),Assessment and selection in organizations: methods and practice for reeruitment and appraisal. Chichester: John Wiley & Sons.
Roe, R.A. (1990). Personnel selection: models and instruments. In: P.J.D. Drenth, Hk. Thierry & Ch.J. de Wolff (Red.), New handhook for the Psychology of Work and
Organisation. Deventer: Van Loghum Slaterus (In Dutch). Roe, R.A. & Daniëls, M.J.M. (1984). Personnel appraisal; background and application.
Assen: Van Gorcum (In Dutch). Roe, R.A. & Greuter, M.J.M. (1989). Developments in personnel selection methodology.
In: R.K. Hambieton & J. Zaal (Eds.), Advances in Testing. Deventer: Kluwer. Roozenburg, N.F.M. & Eekels, J. (1991). Product design, structure and methods. Utrecht:
Lemma (In Dutch).
Sacket, P.R. (1989). Comment on selection utility analysis. In: M. Smith & I. Robertson (Eds.), Advances inselection and assessment. Chichester: John Wiley & Sons.
Schmidt, F.L., Greenthal, A.L., Hunter, J.E., Berner, J.G. & Seaton, F.W. (1977). Job sample vs. paper-and pencil trades and technica! tests: adverse impact and examinee attitudes. Personnet Psychology, 30, 187-197.
Schmitt, N., Gooding, R.F., Noe, R.A. & Kirsch, M. (1984). Meta-analyses of validity studies publisbed between 1964 and 1982 and the investigation of study differences. PersonnelPsychology, 37,407-422.
Schmitt, N. & Ostroff, C. (1986). Operationalizing the "behavioral consistency" approach: selection test development basedon a content-oriented strategy. Personnel Psychology, 39, 91-108.
Shepherd, A. (1985). Hierarchical task analysis and training decisions. Programmed Learning & EducationalTechnology,22, 2, 162-176.
Shepherd, A. (1986). Issues in the training of process operators. International Journalof Industrial Ergonomics, 1, 49-64.
Shepherd, A. (1990). The use of low cost personal computers for the training of process operators. Proceedings IDC Conference, Manchester, England. ·

References 151
Shepherd, A. & Kontogiannis, T. (1981).Development of a specificationfor an automated
instruction system for training process control skills. Proceedings from the First European meeting on cognitive science approaches to process control, Marcoussis,
France. Shepherd, A., Marshall E.C., Turner, A. & Duncan, K.D. (1977). Diagnosis of plant
failures from a control panel: a comparison of three training methods. Ergonomics, 20, no. 4, 347-361.
Spencer, J. (1974). An investigation of process control skill. In: E. Edwards & F.P. Lees (Eds.), The human operator in process control. London: Taylor & Francis.
Siegel, A.I. (1978). Miniature job training and evaluation as a selection/classification device. Human Factors, 20 (2), 189-200.
Siegel, A.I. (1983). The rniniature job training and evaluation approach: additional findings. Personnet Psychology, 36, 41-56.
Siegel, A.I. & Bergman, B.A. (1975). A job learning approach to performance prediction. Personnet Psychology, 28, 325-339.
Smith, P.C. (1976). Behavior, results, and organizational effectiveness: the problem of
criteria. In: M.D. Dunnette (Ed.), Handbaak of industrial and organisational psychology. Chicago: Rand McNally.
Smith, P.C. & Kendall, L.M. (1963). Retranslation of expectations: an approach to the construction of unambiguous anchors for rating scales. Journat of Applied Psychology, Vol. 47, no. 2, 149-155.
Society for lndustrial and Organizational Psychology, Inc. (1987). Principles for the validation and use of personnel selection procedures (Third Edition). College Park, MD: Author.
Spencer, J. (1974). An investigation of process control skill. In: E. Edwards & F.P. Lees (Eds.), The human operator in process contra!. London: Taylor & Francis.
Staay, Th. van der (1988). The implementation ofthe 'instruction-model'; afirst attempt to
the implementation of a work sample. Graduation report. Eindhoven University of Technology, Graduate School of Industrial Engineering and Management Science, Department Technology and Work, Ergonornies no. 28 (In Dutch).
Stammers, R.B. (1981). Theory and practice in the design of training simulators.
Programmed Learning & Educational Technology, 18, no. 2, 67-71. Vries, R.H. de ( 1992). Process technica! background of the work sample for process
operators. Internal report, Eindhoven University of Technology, Graduate School of Industrial Engineering and Management Science, Department Technology and Work (In Dutch).
Wernimont, P.F. & Campbell, J.P. (1968). Signs, samples and criteria. Journat of Applied
Psychology, 52, 372-376.

152 Selection by simu/ation
Wickens, C.D. (1984). Engineering psychology and human performance. London: Charles
E. Merrill Publishing Company. Williams, R.S. (1989). Alternative raters and methods. In: P. Herriot (Ed.), Assessment
and selection in organizations: Methods and practice for reeruitment and appraisal. Chichester: John Wiley & Sons.

Appendices
Six appendices are included in which several topics are elaborated. The literature referred to
in these appendices can be found in the References (p. 145).
Appendix A
Reliability, validity and utility
This appendix comains a global overview of the important concepts of reliability, validity and utility with re gard to selection tests in generaL
1. Reliability
The concept of reliability refers to concepts such as consistency, dependability and
repeatability. Reliability refers to the consistency of scores obtained by the same persons when reexamined with the same test on different occasions, or with different sets of
equivalent items, or under other variabie examining conditions. Test reliability indicates the
extent to which individual dirterences in test scores are attributable to 'true' differences in the characteristics under consideration and the extent to which they are attributable to chance
errors (Anastasi, 1976). No matter what a test claims to measure, it should measure this
reliable. The less accurate a measurement is, the less predictive value it will contain. Hence, the reliability of a test limits its validîty (Bethell-Fox, 1989). The forma! definition of
reliability will be briefly introduced below (Moser & Schuler, 1989), but most attention will
be given to a description of the different types of reliability and how to apply and interpret them.
Reliability can be defined as the proportion of true varianee to observed variance. Because of errors of measurement we cannot directly observe the 'true score' of a person.
The true score of a person is defined as:
with
Xt ::: true score of person X
X0
::: observed score of person X
Xe = error term
(1)
In classica! test theory the reliability of a measurement device is given by the following formula:
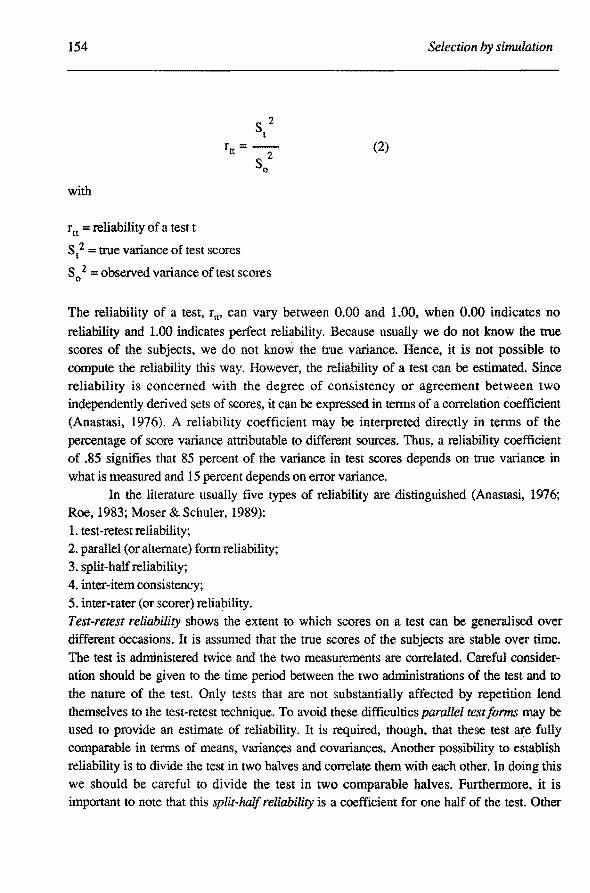
154
with
r1t = reliability of a test t
s 2 t
r =--tt 2 so
s? = true varianee of test scores
S 0
2 = observed varianee of test scores
Selection by simulation
(2)
The reliability of a test, ru, can vary between 0.00 and 1.00, when 0.00 indicates no
reliability and 1.00 indicates perfect reliability. Because usually we do not know the true scores of the subjects, we do not know the true variance. Hence, it is not possible to compute the reliability this way. However, the reliability of a test can be estimated. Since reliability is concerned with the degree of consistency or agreement between two independently derived sets of scores, it can be expressed in terms of a correlation coefficient (Anastasi, 1976). A reliability coefficient may be interprered directly in termsof the percentage of score varianee attributable to different sources. Thus, a reliability coefficient of .85 signifies that 85 percent of the varianee in test scores depends on true varianee in what is measured and 15 percent depends on error variance.
In the literature usually five types of reliability are distinguished (Anastasi, 1976; Roe, 1983; Moser & Schuier, 1989): 1. test-retest reliability; 2. parallel (or alternate) form reliability; 3. split-halfreliability; 4. inter-item consistency; 5. inter-rater (or scorer) reliability. Test-retest reliability shows the extent to which scores on a test can be generalised over different occasions. It is assumed that the true scores of the subjects are stabie over time.
The test is administered twice and the two measurements are correlated. Careful consideration should be given to the time period between the two administrations of the test and to
the nature of the test. Only tests that are not substantially affected by repetition lend themselves to the test-retest technique. To avoid these difficulties parallel testforms may be used to provide an estimate of reliability. It is required, though, that these test are fully comparable in terms of means, variances and covariances. Another possibility to establish reliability is to divide the test in two halves and correlate them with each other. In doing this we should be careful to divide the test in two comparable halves. Furthermore, it is important to note that this split-half reliability is a coefficient for one half of the test. Other

Appendix A 155
things being equal, the longer a test, the more reliable it will be. The Speannan-Brown fonnula is widely used in correcting reliability computed by the split-half method. Interitem consistency is a generalisation of split-half reliability. This type of reliability is based
on the consistency of responses to all items in the test. The mean correlation between all items of a test is computed. This is often called a measure of homogencity and it is most commonly computed by the Kuder-Richardson fonnula or Cronbach's coefficient alpha.
Finally, the fifth type of reliability: inter-rater reliability is only appropriate when measurements take the fonn of judgments. This type of reliability is commonly computed when subjectively scored instruments are employed in research. In a way it is comparable to parallel-test reliability, because parallel raters or judges are involved in assessing the perfor
mance of candidates. The different types of reliability discussed above are summarised in figure 1. In this figure the different types of reliability are classified according to number of
test fonns and number of testing sessions required. A test can possess different types of reliability differing in magnitude - depending on the kind of reliability measure computed. What type of reliability coefficient is computed should depend mostly on the nature of the test, although practical or economical constraints usually play an important role in this
decision. Tests that are affected by repetition do not lend themselves to test-retest reliability. A parallel-form estimate is preferred then. However, if it is impossible to construct a comparable parallel form of the test for practical (e.g. time) or econornical reasons, split-half or inter-item measures can be computed. If possible at all, more than one type of reliability coefficient should be computed. This permits analysis of total score varianee into different components and will give a more accurate estimate of the true varianee and total error varianee (Anastasi, 1976).
Testing Test fonns required sessions
required one two
one split-half parallel-fonn inter-item (immediate) inter-rater
two test-retest parallel-fonn (delayed)
Figure 1. Techniques for measuring reliability in relation totest form and testing session (FromAnastasi, 1976)

156 Selection by simu/ation
2. Validity
V alidity can be described as the degree to which inferences from scores are justified
or supported by evidence. The 'Standards' of the American Educational Research Asso
ciation discuss validity in the following terms:
"V alidity is the most important consideration in test evaluation. The concept refers to the
appropriateness, meaningfulness, and usefulness of the specific inferences made from
test scores. Test validation is the process of accuroulating evidence to support such
inferences. A variety of inferences may be made from scores produced by a given test,
and there are many ways of accumulating evidence to support any partienlar inference.
Validity, however, is a unitary concept. Although evidence may be accumulated in many
ways, validity always refers to the degree to which that evidence supports the inter
ferences that are made from the scores. The inferences regarding specific uses of a test
are validated, not the test itself" (AERA et al., 1985, p. 9).
There are many procedures to determine validity, but they are all concemed with the
relationships on the test and other independently observable facts about the behaviour
characteristics under consideration (Anastasi, 1976). Such a relationship can be expressed
in a single number, the correlation coefficient The type of correlation coefficient typically
used in developing psychological tests is the Pearson Product-Moment Coefficient of
Correlation (Bethell-Fox, 1989). The magnitude and conditions affecting validity coeffi
cients will be discussed later on. First we will discuss the different types of validity that are usually distinguished (Anastasi, 1976; Meerling, 1980; Roe, 1983; Cook, 1988; Moser & Schuier, 1989):
1. content validity;
2. construct validity;
3. criterion-related validity, which can be divided in:
- predictive validity;
~concurrent validity.
These types of validity are generally considered as the main types. However, some authors
also distinguishface validity: 'the test looks plausible'. However, this type of validity is
never sufficient in itself. It only makes the test more acceptable to the people involved,
usually employer and employee (Cook, 1988).
Content validity
Content validity refers to the concept of representativeness. To determine validity in a content-oriented strategy it should be verified that test performance is a representative
sample of job performance or job-required knowledge (SlOP, 1987). Especially when tests
are constructed according to the sample approach, content validity is essential. The work

Appendix A 157
sample test should represent reality by having sampled representative features of the job.
Hence, content validity depends on a thorough job analysis. In general, the most common approach to determine the content validity of a test is
to have experts rate whether the items are essential to, representative of, or relevant to the
target under issue (Moser & Schuier, 1989). If the test is a work sample, it should be rated
whether it represents the job. Lawshe (1975) has outlined a formal procedure for
establishing content validity. According to Lawshe content validity is the extent to which
communality or overlap exists between 1. performance on the test under investigation;
2. ability to function in the defined job performance domain.
In other words, content validity is operationally defined as the extent to which members of a 'Content Evaluation Panel', composed of workers and supervisors, rate test items as either
essential, useful, or necessary. There ratings are used to calculate a Content Validity Ratio
for each test item:
with
ne- N/2 CVR=--
N/2
ne = number of panellists indicating 'essential'
N = total number of panellists
(3)
When fewer than half of the panellists say 'essential', the CVR is negative. When half say
'essential' and half do not, the CVR is zero. When all say "essential", the CVR is 1.00 and
when the number saying 'essential' is more than half, but less than all, the CVR is some
where between zero and 1.00. The CVR is an item statistic that is useful in the rejection or retention of specific items. After items have been identified for inclusion in the final fonn,
the Content Validity Index (CVI) can be computed for the whole test. The CVI is simply the mean of the CVR values of the retained items.
Construct validity
Constructs refer to traits of individuals inferred from empirica! evidence or theory. A
construct-oriented strategy can be described as an attempt to demonstrate a relationship between underlying traits or hypothetical constructs and job related behaviour (SlOP,
1987). In other words, construct validation refers to the exploration of the relation between
a test and the constructs <X variables to be measured. A construct-oriented strategy in

158 Selection by simu/ation
validation 'belongs' to the sign approach and not to the sample approach. An important class of methods used in construct validation is that of correlational studies (Meerling, 1980). When a relationship (significant correlation) is found between two different indicators of the same construct, it is usually labelled as an instanee of convergent validity. Divergent validity refers to the finding that indicators of different constrocts bear no (significant) relationship to each other. For instance, let us assume we constructed a new test for measuring a certain mental quality. If this test measures a mental quality which is also measured to some extent by other tests, then reasonably strong correlations between the tests should appear (i.e. the measurements converge). To the extent that the new test is designed to measure a mental quality not captured by other tests, scores on the new test should show low correlations with scores on these other tests (i.e. the measurements diverge). So, if a test shows the anticipated pattem of correlations with other tests (higher correlations with some, lower correlations with others), then we have reason to believe that the new test does indeed measure the construct (Bethell-Fox, 1989). This illustrates that construct validity has to do with knowing exactly what is measured by a measuring instrument. However, Moser and Schuier (1989) mention research which shows that assessment eentres have low construct validity, but that nevertheless the predictive validity of assessment eentres is quite high. They conclude from this that a measurement instrument can be useful although it is not exactly known what it measures. In our opinion construct validity of assessment eentres is low because of the heterogenons nature of assessment centres. The same applies to work samples in which several different tasks are incorporated reflecting the total work situation. Therefore, construct validity does not apply to the work sample approach in testing.
Criterion-related validity
Criterion-related validity indicates the effectiveness of a test in predicting an individuars behaviour in specified situations. For this purpose, performance on the test is checked against a criterion, i.e. a direct and independent measure of that which the test is designed to predict (Anastasi, 1976). Determining validity in a criterion-related strategy rests on demonstrating a statistica} relationship between scores on a predietor and scores on a criterion measure. This criterion measure is a measure of job performance or job behaviour, such as productivity, accident rate, absenteeism, tenure, reject rate, training score and supervisory or co-worker ratings (SlOP, 1987).
The criterion measure against which test scores are validated may be obtained roughly at the same time as test scores or after a certain period of time. Based on these time relátions between test and criterion we can differentiate between concurrent validity and predictive validity, respectively. The term 'prediction' can be used in the broader sense, to refer to prediction from the test to any criterion situation, but in the concept of predielive

Appendix A 159
validity it is used in the more limited sense of prediction over a certain time interval (Anastasi, 1976). In other words, concurrent validity refers to a demonstrated relationship between job performance and scores on selection instruments obtained at approxirnately the same time, while predictive validity refers to a demonstraled relationship between test scores of applicants and some future behaviour on the job (SlOP, 1987).
In the case of selection tests, predictive validity is usually held superior to concurrent validity. Of course, the information provided by predielive validity is very relevant
to tests used in selection and classification ofpersonnel. Cook (1988) refers to it as the most convincing demonstration of a test's validity, because it parallels real-life selection: select today, find out later if you made the correct choice. However, this same time-lag makes predictive validation slow and expensive. lt takes longitudinal studies of many years to show that a test has predictive validity. Concurrent validity can be demonstrared much
quicker in cross-sectional studies. Employees can be tested, while more or less at the same time criterion measures can be collected.
One of the most often mentioned disadvantages of concurrent validadon research is the phenomenon of 'restrietion of range'. When present employees are studied, people who were rejected, who left or who were dismissed are not available for study. Nor are the people who proved so good that they have been promoted. So, both endsof the dis tribution of productivity are missing, hence the mnge is restricted. However, it's only in an ideal predielive validity study that there is no restrietion of range. Quite possib1y an employer uses some kind of selection test, which most likely correlates with the one being validated, which creates indirect restrietion of range. Sametimes an employer uses test data to select, so there is a cut-off point in the distriburl on of test scores, which creates direct restrietion of range (Cook, 1988). Furthermore, Cook mentions that several recent reviews of research all
conclude that the two methods of measuring criterion-related validity give much the same results. He concludes that, contrary to what is usually thought, predictive validity studies are not so superior to concurrent validity studies.
Magnitude of a validity coefficient
How high should a validity coefficient be? For criterion-related validity coefficients Betheli-Fox (1989) gives some indications. He mentions as a rule of thumb, that for persounel selection a test score that weakly prediets job performance has a correlation with job performance of about 0.2 whereas a good predietor bas a correlation of about 0.4. A
correlation of 0.6 corresponds to a strong level of prediction and correlation coefficients for a test predicting job performance rarely, if ever, exceed 0.7. Furthermore, as mentioned earlier, the (un)reliability of a test limits it validity. The more inaccurate a measurement is,
the lower it's predictive value will be. Bethell-Fox gives several formulae to calculate the ceiling placed by (un)reliability on the predictive value of a test score. First of all, the ceiling

160 Selection by simu/ation
placed by the reliability of a test on the test's predictive validity is given by the following
formula:
with
Vat, •• =maximum possible validity of the test
(r ••. ) = reliability of the test
(4)
So, for example, a test with a reiiability of 0.5 limits validity to a possible maximum of 0.7
as opposed to a theoretically possible maximum of 1.0 for a perfectly reliable test. How
ever, this ignores the reliability of the criterion against which the test is validated. The more inaccurate a criterion's measurement is, the lower the predictive validity will be. If the
reliability of both. test and criterion is considered then the maximum possible value of the
predictive validity coefficient is given by the following formula:
with
Vat,.. = maximum passible validity of the test
(r ••. ) = reliability of the test .
(r'fy') = reliability of the critprion
(5)
So, for example, when both test and criterion have a reliability of 0.5 validity is limited to a possible maximum of 0.5. Of course, it is possible to correct an obtained validity coefficient
for the (un)reliability of both the test and criterion. However, this would give us information on a very artificial situation. We would know then what the predictive validity coefficient
would be if both test and criterion were perfectly reliable. Since this is never the case in real
life testing. we leave this subject for what it is and refer the interested reader to one of the
many statistics textbooks.
3. ·Utility
The. utility of a selection instrument or selection programme refers to the practical usefulness of that instrument or programme that allows the user to make better hiring
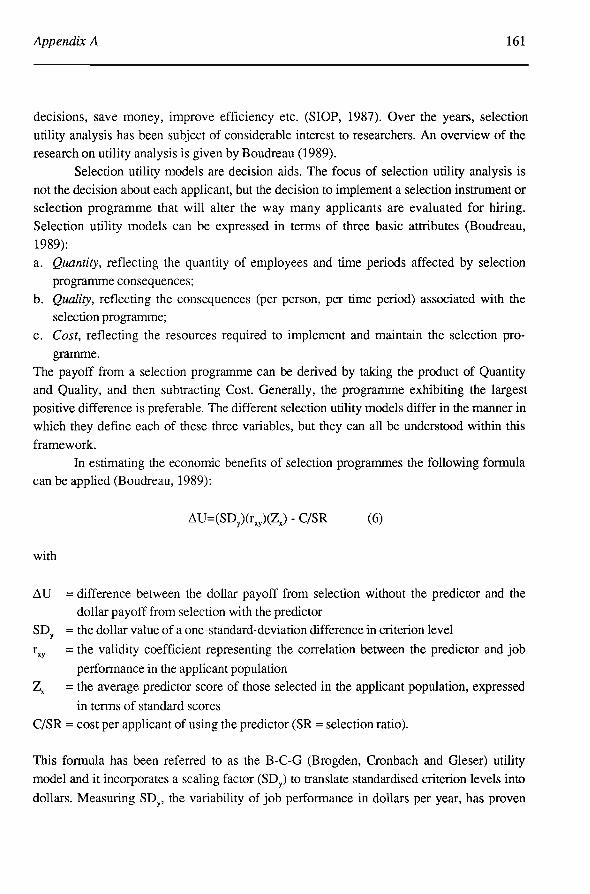
Appendix A 161
decisions, save money, improve efficiency etc. (SlOP, 1987). Over the years, selection
utility analysis has been subject of considerable interest to researchers. An overview of the research on utility analysis is given by Boudreau (1989).
Selection utility models are decision aids. The focus of selection utility analysis is
not the decision about each applicant, but the decision to implement a selection instrument or selection programme that will alter the way many applicants are evaluated for hiring.
Selection utility models can be expressed in terms of three basic attributes (Boudreau, 1989):
a. Quantity, reflecting the quantity of employees and time periods affected by selection
programme consequences;
b. Quality, reflecting the consequences (per person, per time period) associated with the selection pro gramme;
c. Cost, reflecting the resources required to implement and maintain the selection pro-
gramme. The payoff from a selection programme can be derived by taking the product of Quantity and Quality, and then subtracting Cost. Generally, the programme exhibiting the largest
positive difference is preferable. The different selection utility models differ in the manner in
which they define each of these three variables, but they can all be understood within this
framework. In estimating the economie benefits of selection programmes the following formula
can be applied (Boudreau, 1989):
11U=(SD)(r.)(Z.)- C/SR (6)
with
.-1 U = difference between the dollar payoff from selection without the predietor and the
dollar payoff from selection with the predietor
SDY = the dollar value of a one-standard-deviation difference in criterion level
rxy = the validity coefficient representing the correlation between the predietor and job
performance in the applicant population Zx = the average predietor score of those selected in the applicant population, expressed
in terms of standard scores
C/SR = cost per applicant of using the predietor (SR= selection ratio).
This formula has been referred to as the B-C-G (Brogden, Cronbach and Gleser) utility
model and it incorporates a sealing factor (SD) totranslate standardised criterion levels into
dollars. Measuring SDY, the variability of job performance in dollars per year, has proven

162 Selection by simu/ation
controversial. SDY is the critica! component of the B-C-G utility model (Cascio, 1989). If
the variability in expected productivity among job applicants is very small, then it really does not matter who is selected. On the other hand, when the variability in expected productivity among applicants is large, that is precisely the situation in which valid predietors can make an important difference. Estimates of SDY vary from 40% (Cascio,
1989) to 70% (Cook, 1988) of annual salary. Notwithstanding the vast amount of research on utility analysis, it is not clear
whether and how utility analysis is being implemented in practice (Sackett, 1989). Although interest in utility analysis is substantial, continued work on both the measurement of model parameters and on the effective communication of utility analysis results to organisational decision makers is needed.

Appendix B
The T & W process simulator
The simulator of the department Technology and Work, Graduate School for Industrial Engineering and Management Science at Eindhoven University of Technology, is developed and implemenred on a PDP-Iln3 micro-computer under the reai-time operating system RT-ll{fSX-plus. The software is written in Fortran IV. For an extensive description of this process simulator we refer to Kuijpers & Leermakers (1987). In this appendix we restriet ourselves to a description of the most important hardware and software characteristics.
The hardware configuration for the subject/operator consists of a VDU, on which parts of the process are displayed, and a keyboard to control the process. The experimenter also has a VDU and keyboard at his proposal to start, stop or reset the simulation. Furthermore, a graphic monitor shows the experimenter exactly what is shownon the VDU of the subject/operator. Th is hardware configuration is shown in figure 2.
Subject/operator Ex perimenter
Figure 2. The hardware configuration of the T & W process simulator.
In developing the T&W simulator, a modular software configuration was chosen (see figure 3). The simulator consist of seven modules, each having its specifïc task. The central module of the simulator is the DATABS module. DATABS is the database management system of the simulator. Figure 3 shows that all communication between the modules proceeds through DAT ABS. Th is module manages all messages between the different modules. All messages go through the 'interprocess message communication system'. Other tasks of DATABS are the management of the process variables and accompanying

164 Selection by simulation
status for use by the other modules and saving the history of a simulation run in the file REPLA Y.DAT. The module MODEL takes care of the computation of the values of the proces varia bles. In the module ANAL YZ control data such as reaction time and area integral are calculated and saved in the file ANAL YZ.DA T. The DISPL Y module takes care of the grapbics that are presented on the VDU and the updating of the values of the process variables. The EXPER module takes care of starting, stopping or freezing the simulation. The ALARM module checks whether the process variables exceed the given alarm limits of a process variable. Finally, the KEYBRD module permits controlling the simulated process by pushing the buttons on the keyboard. Four of the modules- DAT ABS, DISPLY, EXPER and ALARM - are totally independent of the specific process model used on the simulator. The other modules - MODEL, ANALYZ and KEYBRD - are partly dependent on the model used. (Several different simulated processes can be used on the T&W simulator).
INPUT DATA
FILES
REPLAY.DAT
interprocess message communicalion system
Figure 3. The modul ar software configuration of the T & W process simulator.

Appendix C
The simulated process: the mixing process
The simulated process that is used in the work sample is shown in tigure 4. This
process consists of the following process parts:
a. heat exchanger;
b. long pipeline;
c. tankA;
d. tankB;
e. mixing tank.
Together these process parts form the mixing process.
Product flow Fll (500 1/h) is heated in the heat exchanger from temperature T11
(15.o·q to temperature T21 (57.1 ·c), because the product flow absorbs heat in the heat
exchanger from the warm flow F12 (550 l!h) with temperature T12 (9o.o·c). Then, the
product flow is transported through a long pipeline totank A. Temperature T31 (40.6.C) at
the end of the long pipeline is lower than temperature T21 (57.l"C) at the beginning of the
long pipeline because of heat loss to the environment. Furthermore, a change in the
environmental temperature T22 can influence the heat loss over the pipeline. So, the product
flow Fll flows into tank A with temperature T31 (40.6.C). Tank A is a stabilising tank.
When the process is running at a steady state the level L31 (2.50 m) of this tank will be
constant. However, when input or output flow changes, the level may fluctuate strongly.
The product flow, now called F42 (500 1/h), flows directly from tank A into tank B with
temperature T41 (40.6.C). Tank B has the same size and volume as tank A. Therefore, level
L41 of tank B is also 2.50 m when the process is running at a steady state. And again,
when input or output flow changes, the level may fluctuate strongly. The product flow, now
called F51 (500 l/h), flows directly from tank B into the mixing tank with temperature T51
(40.6.C). This flow is mixed with a product flow from another plant. This product flow
F52 (1000 l!h) flowsin the mixing tank with a temperature T52 (62.4.C). Both flows are
mixed in the mixing tank and the end product F61 (1500 1/h) flowsoutof the mixing tank
with a temperature T61 (55.1 ·c).

Vll
50% Til = 15.0>C Fll = 500 1/h
F: Flow T:Temperature L: Level V: Valve
Til =40.(fC
122=20.<fe
L41 =2.50
V51
L51 = 2.50 m
T4l =40.é'C F41 = 500 1/h
50%
50%
V61
T52 62.4<t: V52
F52 = 1000 1/h.:r... t 50%
50% T61 = 55.1°C F61 = 1500 1/h

Appendix D
The exercises in the final work sample
First, this appendix contains a description of which process parts and process
related control problems make up the modules in the work sample. Second, it describes
how the extemal control problems and the task-related control problems have been included
in the exercises in the work sample. For a detailed description of the specific disturbances
that are introduced in the type B exercises we refer to De Vries (1992). Third, the instructien
manual for the candidate is included (in Dutch) as far as the description of the 18 exercises in the work sample is concemed.
The modules in the work sample consist of one or two of the process parts
described in Appendix C. The process-related control problems are directly related to the process parts which are used in the modules. The first module consists of the heat
exchanger. This is an introductory module for the second module which consists of the heat
exchanger plus long pipeline. The process-related control problem 'time delay/time constant' is incorporated in this module. The third module consists of tank A. This is an introductory module for the fourth module which consists of tank A plus tank B. The
process-related control problem 'series connection' is exemplified in this module. Finally,
the process-related control problem 'parallel connection' is exemplified in the fifth module
which consists of the mixing tank. The external control problems and the task-related control problems are related to
either the disturbances that are introduced in the exercises or the specific task the candidate
is asked to perform in the exercises. The first two exercises of each module, the type A
exercises, all involve the external control problem 'change in specificatien of product'.
Because different requirements are placed on the output variable, the operator has to take
certain actions to meet these requirements. The last two exercises of each module, the type B exercises, all involve the external control problem 'change in specificatien of raw
materials'. Disturbances cause fluctuation of quality and/or quantity of raw materiaL These
differences in the input variabie of the process parts cause control actions on the part of the
operator if specification of the output variabie are to be met. The external control problem 'atmospheric influences' is introduced in exercise number 7, where a change in the
environmental temperature causes control actions on the part of the operator if specifications
of the process variables are to be met. The task-related control problem 'diagnosis of disturbance' comes into play in the type B exercises, where after detection of a disturbance
the operator should look for the possible cause of the disturbance and take corrective
actions. The task-related control problem 'abondance of alarms' arises in the type B
exercises of the last two modules, 'tank A plus tank B' and 'mixing tank'. In these
exercises several alarms are coming in at the sametime or shortly aftereach other and the
operator should be able to quickly give priority to the most important alarms. The taskrelated control problem, 'choice of setpoint', arises in the last two exercises in the work

168 Selection by simu/ation
sample, the type B exercises with the mixing tank, where the operator is not sure of the
optimum setting of a setpoint of one of the two process variables to be controlled (the level of the mixing tank). Finally, the other two task-related control problems,'inaccurate
information' and 'conflicting information', are not incorporated in the exercises because this
would complicate the exercises too much.
The tiescription of the exercises from the instruction manual for the candidate (in Dutch)
Algemene toelichting bij de opgaven
U gaat nu beginnen aan de opgaven bij de diverse deelprocessen. U mag kladpapier en pen gebruiken voor het geval u aantekeningen wilt maken.
Bij alle opgaven wordt gestart met een deelproces dat zich in de stabiele toestand bevindt.
Het is bij alle opgaven de bedoeling dat u ze zowel snel als nauwkeurig uitvoert. Snelheid en nauwkeurigheid zijn bij de uitvoering van de opgaven dus allebei even belangrijk (tenzij anders vermeld staat).
Voor alle opgaven geldt bovendien het volgende: De proefleider meldt aan u het nummer van de opgave, die u vervolgens eerst aandachtig doorleest. U wacht dan verder af, tot de proefleider u het sein geeft dat u aan de opgave kunt beginnen.
Een opgave is voltooid, indien u het deelproces in de aangegeven toestand heeft gebracht De ene keer zult u sneller klaar zijn dan de andere keer. U heeft echter voor elke opdracht ruim de tijd. Wanneer u klaar bent, wacht u dan verder rustig af tot de proefleider u het sein geeft dat u de volgende opgave kunt doorlezen. Vervolgens wacht u weer op het teken dat u aan de opgave kunt beginnen.
Indien u over deze procedure nog vragen heeft, kunt u die nu aan de proefleider stellen. Is alles u duidelijk, meldt u dit dan ook even.
I. Opgaven bij de warmtewisselaar
Voer de opgaven zo snel mogelijk, maar tegelijkertijd ook zo nauwkeurig mogelijk uit. Wat de nauwkeurigheid betreft, dient U precies op de gevraagde waarde uit te komen.
Opgave 1: VerlaagTil naar54.2 ·c bij gelijke productstroom Fll. Houdt Fll dus op 500 1/h.
Toelichting bij opgave 2 Bij opgave 2 zijn er alarmgrenzen ingevoerd voor T21. Bij een afwijking van meer dan l,O'C t.o.v. de gewenste waarde van Tll (51,7'C) zal de temperatuuraanduiding rood kleuren (le alarmfase). Indien Tll meer dan 2,o·c verschilt van de gewenste waarde zal de temperatuuraanduiding rood gaan knipperen (2e alarmfase). Het is de bedoeling dat u voorkomt dat Til in alarmfase komt. Hoe groter de afwijking van Tll is buiten het toegestane gebied, des te slechter is dat voor de rest van het proces.

AppendixD 169
Opgave 2: Verhoog Fl1 naar 650 llh, maar zorg ervoor dat T21 niet lager wordt dan 56,1 'C en niet hoger dan 58,1 'C. Terwijl u Fll dus met 150 1/h verhoogt, mag T21 niet buiten het volgende gebied komen: 56,1 .s T21 .s 58,1.
Nu volgen twee opgaven, die van een iets andere aard zijn dan de voorafgaande twee opgaven. Leest u eerst aandachtig onderstaande toelichting.
Toelichting bij opgave 3 en 4: In dit deelproces kunnen natuurlijk allerlei storingen voorkomen: 'kleine, grote, langdurende, kortdurende, ernstige, minder ernstige, etc. etc .. De storingen kunnen betrekking hebben op de variabelen in het proces, zoals de flows en de temperaturen, maar er kunnen ook instrumentatiefouten optreden. Denk bv. aan het blijven steken van kleppen in een bepaalde stand. Bij de volgende opgaven treden er één of meer storingen op. Het is de bedoeling dat U, ondanks deze storing( en) de opgaven zo goed mogelijk probeert te voltooien.
Opgave 3: Het proces verkeert in stabiele toestand, T21 = 57,l'C. Indien er geen storingen optreden hoeft U niets te doen. Het proces blijft dan immers rustig doordraaien. De opdracht is om T21 gedurende 7 minuten constant te houden. De temperatuur mag wel iets vari1\ren, maar moet binnen het volgende gebied blijven: 57,0.::;; T21 .s 57,2. Let u goed op. Dit gebied is zeer smal (0,1 graad aan weerszijden). Zodra T21 buiten dit gebied komt zal de temperatuuraanduiding rood kleuren (Ie alarmfase). Wanneer T21 meer dan l,O'C afwijkt van de gewenste waarde zal de temperatuuraanduiding rood gaan knipperen (2e alarmfase). Het is de bedoeling dat u voorkomt dat T21 in alarmfase komt. Hoe groter de afwijking van T21 is buiten het toegestane gebied, des te slechter is dat voor de rest van het proces. Het is tevens de bedoeling dat u het proces, indien mogelijk, laat draaien met een productstroom F11 van 500 llh.
Opgave 4: De instructie luidt hetzelfde als bij opgave 3.
JI. Opgaven bij de warmtewisselaar + transportleiding
Voer de onderstaande opgaven zo snel mogelijk, maar tegelijkertijd ook zo nauwkeurig mogelijk uit. Wat nauwkeurigheid betreft, dient U op de gevraagde waarde uit te komen.
Opgave S: Verhoog T31 naar 42,TC bij gelijke productstroom Fll. Houdt Fll dus op 500 1/h.
Toelichting bij opgave 6: Bij opgave 6 zijn er alarmgrenzen ingevoerd voor T31. Bij een afwijking van meer dan l,O'C t.o.v. de gewenste waarde van T31 (40,6'C) zal de temperatuuraanduiding rood kleuren (le alarmfase). Indien T31 meer dan 2,0'C verschilt van de gewenste waarde zal de temperatuuraanduiding rood gaan knipperen (2e alarmfase). Het is de bedoeling dat u voorkomt dat T31 in alarmfase komt. Ook hier geldt weer dat hoe groter de afwijking van T31 is buiten het toegestane gebied, des te slechter is dat voor de rest van het proces.
Opgave 6: Verlaag Fll naar 430 l!h, maar zorg ervoor dat T31 niet lager wordt dan 39,6'C en niet hoger dan 41,6'C.

170 Selection by simulation
Terwijl u Fll dus met 70 1/h verlaagt, mag T31 niet buiten het volgende gebied komen: 39,6 s. T31 s. 41 ,6.
Nu volgen weer twee opgaven, die van een iets andere aard zijn dan de voorafgaande twee opgaven bij dit deelproces. Leest u eerst aandachtig onderstaande toelichting.
Toelichting bij opgaven 7 en 8: In dit deelproces kunnen natuurlijk ook weer allerlei storingen voorkomen: kleine, grote, langdurende, kortdurende, ernstige, minder ernstige, etc. etc .. De storingen kunnen betrekking hebben op de variabelen in het proces, zoals de flowsen de temperaturen, maar er kunnen ook instrumentatiefouten optreden. Denk bv. aan het blijven steken van kleppen in een bepaalde stand. Bij de volgende opgaven treden er één of meer storingen op. Het is de bedoeling dat U, ondanks deze storing( en) de opgaven zo goed mogelijk probeert te voltooien.
Opgave 7: Het proces verkeert in stabiele toestand, Til = 40,6'C. Indien er geen storingen optreden hoeft u niets te doen. Het proces blijft dan immers rustig doordraaien. Uw opdracht is om T31 gedurende JO minuten constant te houden. De temperatuur mag wel iets variëren, maar moet binnen het volgende gebied blijven: 40,5 s. T31 s. 40,7. Let u goed op. dit gebied is zeer smal (0,1 graad aan weerszijden). Zodra Til bniten dit gebied komt zal de temperatuuraanduiding rood kienren (le alarmfase). Wanneer Til meer dan l,O'C afwijkt van de gewenste waarde zal de temperatuuraanduiding rood gaan knipperen (2e alarmfase). Het is de bedoeling dat u voorkomt dat Til in alarmfase komt. Hoe groter de afwijking van Til is buiten het toegestane gebied, des te slechter is dat voor de rest van het proces. Het is tevens de bedoeling dat u het proces, indien mogelijk, laat draaien met een productstroom Fll van 500 l!h.
Opgave 8: De instructie luidt hetzelfde als bij opgave 7.
lil. Opgaven bij vat A
Bij onderstaande opgaven gaat het weer zowel om de snelheid als de nauwkeurigheid waarmee u de opgave uitvoert. Wat de nauwkeurigheid betreft dient u precies op het gevraagde niveau te komen.
Opgave 9: Verhoog het niveau L31 in vat A zo snel mogelijk naar 3,00 m, terwijl u maximaal een productstroom aanvoert van 550 1/h.
Opgave 10: Verlaag het niveau L31 in vat A zo snel mogelijk naar 1,50 m terwijl u minimaal een productstroom aanvoert van 400 1/h.
IV. Opgaven bij de vaten A en B
Bij onderstaande opgaven gaat het weer zowel om de snelheid als de nauwkeurigheid waarmee u de aan u gestelde opdracht voltooit. Wat de nauwkeurigheid betreft dient u precies op het gevraagde niveau uit te komen.

AppendixD 171
Opgave 11: Verlaag de niveaus in beide vaten zo snel mogelijk met een halve meter. Breng dus zowel niveau L31 als
niveau IA I op 2,00 m.
Opgave 12: Verhoog niveau IA 1 in vat B zo snel mogelijk naar 2,80 m. Doet u dit echter op een zodanige manier dat er
geen veranderingen optreden in niveau L31 van vat A.
Nu volgen twee opgaven, die weer van een iets andere aard zijn dan de voorafgaande twee opgaven bij dit deelproces. Leest U eerst aandachtig onderstaande toelichting.
Toelichting bij opgaven 13 en 14:
In dit deelproces kunnen natuurlijk ook weer allerlei storingen voorkomen, kleine, grote, langdurende, kortdurende, ernstige, minder ernstige, etc. etc .. De storingen kunnen betrekking hebben op de variabelen in
het proces, zoals de flowsen de niveaus, maar er kunnen ook instrumentatiefouten optreden. Denk bv. aan het blijven steken van kleppen in een bepaalde stand. Bij de volgende opgaven treden er één of meer storingen op. Het is de bedoeling dat u, ondanks deze
storing( en) de opgaven zo goed mogelijk probeert te voltooien.
Opgave 13: Het proces verkeert in stabiele toestand. De niveau L31 en IAI staan in beide vaten op 2,50 m. Indien er
geen storingen optreden hoeft U niets te doen. Het proces blijft dan immers rustig doordraaien. Uw opdracht is om zowel niveau L31 als niveau L41 gedurende 10 minuten constant te houden. De niveaus mogen wel iets vari~ren, maar moeten binnen het volgende gebied blijven: 2 ,25 ::;;. L31/ L4 I ::;, 2 ,75. Dit geldt dus voor
beide vaten. Let u goed op. Dit gebied is vrij smal (0,25 m. aan weerszijden). Zodra het niveau buiten dit gebied komt zal de niveau-aanduiding rood kleuren (Ie alarmfase). Wanneer het niveau aan weerszijden meer
dan 0,50 m. afwijkt van de gewenste waarde zal de niveau-aanduiding rood gaan knipperen (2e alarmfase). Het is de bedoeling dat u voorkomt dat de niveaus in alarmfase komen. Hoe groter de fluctuatie van de niveaus is buiten het toegestane gebied, des te slechter is dat voor de apparatuur.
Opgave 14: Deze opgave luidt hetzelfde als opgave 13.
V. Opgaven bij het mengvat
Bij onderstaande opgaven gaat het weer vooral om zowel de snelheid als de nauwkeurigheid waarmee u de aan u gestelde opdracht voltooit.
Wat de nauwkeurigheid betreft dient u precies op de gevraagde temperatuur uit te komen én u dient de alarmgrenzen van niveau L51 niet te overschrijden. Overschrijdt u deze grenzen toch, dan 7.al de niveau
aanduiding rood kleuren. Overschrijding van deze grenzen is slecht voor de apparatuur.
Opgave 15:
Verhoog de temperatuur T61 zo snel mogelijk naar 55,6 ·c, maar doet u dit zodanig dat het niveau L51 niet hoger wordt dan dat het nu staat (5,00 m.) en niet lager dan 4,85 m. Terwijl u dus T61 met 0,5'C verhoogt, mag L51 niet buiten het volgende gebied komen:
4,85 s L51 s 5,00.

172 Selection by simu/ation
Opgave 16: Verlaag de temperatuur T61 nu zo snel mogelijk naar 54,7 "C, maar doet u dit weer zodanig dat het niveau L5l niet hoger wordt dan het nu staat (5,00 m.) en niet lager dan 4,85 m. Terwijl u dus T61 met 0,4'C verlaagt, mag L51 niet buiten bet volgende gebied komen:4.85 5.. L51 5.. 5,00.
Nu volgen twee opgaven, die weer van een iets andere aard zijn dan de voorafgaande twee opgaven bij dit deelproces. Leest u eerst aandachtig onderstaande toelichting.
Toelichting bij opgaven 17 en 18: In dit deelproces kunnen natuurlijk ook weer allerlei storingen voorkomen: kleine, grote, langdurende, kortdurende, ernstige, minder ernstige, etc. etc .. De storingen kunnen betrekking hebben op de variabelen in het proces, zoals de flows, de temperaturen en het niveau, maar er kunnen ook instrumentatiefouten optreden. Denk bv. aan het blijven steken van kleppen in een bepaalde stand. Bij de volgende opgaven treden er één of meer storingen op. Het is de bedoeling dat u, ondanks deze storing( en) de opgaven zo goed mogelijk probeert te voltooien.
' Opgave 17: Het proces verkeert in stabiele toestand. Het niveau L51 in het mengvat staat op 5,00 m. en de temperatuur T61 onder het mengvat is 55,l'C. Indien er geen storingen optreden hoeft u niets te doen. Het proces blijft dan immers rustig doordraaien. Uw opdracht is om zowel niveau L51 als temperatuur T61 gedurende 10 minuten constant te houden. Het niveau mag wel iets varii!ren, maar moet binnen het volgende gebied blijven: 4,85 5.. L51 .:s; 5,15. Ook T61 mag wel iets varii!ren, maar moet binnen het volgende gebied blijven: 54,7 5.. T61 5.. 55,6. Let u goed op. Deze gebieden zijn beiden erg smal (0,15 m. aan weerszijden voor het niveau en 0,5'C aan weerszijden voor de temperatuur). Zodra de waardes van deze variabelen hun alarmgrenzen overschrijden zullen zij rood kleuren (Ie alarmfase). De 2e alarmfase (rood knipperen) wordt bereikt wanneer L51 aan weerszijden meer dan 0,65 m. afwijkt van de gewenste waarde en T61 aan weerszijden meer dan 1,5'C afwijkt van de gewenste waarde. Het is de bedoeling dat u zowel L51 als T61 binnen de aangegeven alarmgrenzen houdt. Hoe groter de fluctuatie is van beide variabelen buiten het voor hen aangegeven gebied, des te slechter is dat voor de apparatuur en de rest van het proces.
Opgave 18: Deze opgave luidt hetzelfde als opgave 17.

Appendix E
Measures used in calculating the raw score per exercise in the work sample and procedure for converting raw scores into standard scores
Two types of performance measures were used in calcuiating the raw score per exercise: 1. TimeT= min {t0 I e1 s e(t) s e2 for t ~ toJ
2. Discrete area measurement t-max
area= Labs (e(t)).t1t
t=O Time T is used for type A variables and gives the time in which a variabie has reached a required, stabie value (between limits e1 and e2). Time T is measured in seconds. For type B
variables the area of the absolute error is calculated (discrete area measurement). The area between setpoint and first alarm limits is neglected, because a value of a variabie in this area can be considered a 'good' performance. Furthermore, it was decided to give equal weight factors (1) to the area between the first and second alarm limits and the area outside of the second alarm limits. So, the area outside the first alarm limits was calculated.
In each exercise either one or both types of measures were calculated for the crucial process variables: the process variables to be controlled by the candidate. Figure 5 gives an overview of these crucial process variables per exercise and the performance measures used in calculating the raw scores for these variables. This tigure shows that all eight type B exercises (number 3, 4, 7, 8, 13, 14, 17 and 18) involve area measurement for the crucial
variable(s) to be controlled. These type of exercises reflect best the process operator's task in the central control room. The crucial process variable(s) should be kept as close to the setpoint as possible. Type A exercises (the 'practice' exercises) involve either time· measurement (number 1, 5, 9, 10, 11 and 12) or both time measurement and area
measurement (number 2, 6, 15 and 16). When ju st time measurement is involved in the type A exercises, the process variable(s) should be brought toa given value as fast as possible. When both time and area measurement is involved in these exercises, a process variabie
should be brought to a given value as fast as possible (time measurement) while at the same time another process variabie should be kept as close to the setpoint as possible (area
measurement). Furthermore, all exercises involve either one or two crucial variables to be controlled. So, the exercises number 1, 3, 4, 5, 7, 8, 9, 10 and 12 render one raw score (either timeTor area) and the exercises number 2, 6, 11, 13, 14, 15, 16, 17 and 18 render two raw scores (time T and area; two time T scores; two area scores). Because the raw scores involve different measurements on different scales, they frrst have to be standardised

174 Selection by simu/ation
before they can be combined into either one score per exercise (when both timeTand area
should be combined in one exercise) or a total score on the work sample.
Exercise number ( variabie 1, measure 1) ( variabie 2, measure 2)
Module 1 - Heat exchanger
1. (Temperature T21, timeT) 2. (Flow F11, timeT) (Temperature T21, area) 3. (Temperature T21, area) 4. (Temperature T21, area)
Module 2 - Heat exchanger plus long pipeline
5. (Temperature T31, timeT) 6. (Flow F11, timeT) (Temperature T31, area) 7. (Temperature T31, area) 8. (Temperature T31, area)
Module 3 - Tank A
9. (Level L31, time T) 10. (Level L31, timeT)
Module 4 - Tank A+ Tank B
11. (Level L31, time T) (Level L41, time T) 12. (Level L41, timeT) 13. (Level L31, area) (Level L41, area) 14. (Level L31, area) (Level L41, area)
Module 5 - Mixing tank
15. (Temperature T61, timeT) (Level L51, area) 16. (Temperature T61, timeT) (Level L51, area) 17. (Temperature T61, area) (Level L51, area) 18. (Temperature T61, area) (Level L51, area)
Figure 5. The crucial process variables and performance measures in the exercises in
the work sample
Before converting the raw scores into z-scores, a logarithmic transformation had to
be performed on the area scores (the naturallogarithm of the raw scores was taken) in order
to obtain a distribution: of scores approximating the normal distribution. (The distribution of

Appendix E 175
the time scores already approximated the normal distribution.) Then, the scores were converted into z-scores. Two z-scores per exercise (arising from two raw scores per exercise) were first combined into one z-score per exercise ((zl +z2)/2). Finally, the z-scores were combined into several total scores by actdition of the z-scores of the exercises contributing to the specific total score: Total-A (total score over type A exercises; number 1+2+5+6+9+10+ 11+12+15+16), Total-B (total score over type B exercises; number 3+4+7+8+13+ 14+17+18) and TOTAL (total score over all eighteen exercises). In each of the validity studies conversion into z-scores took place per group of operators.

Appendix F
Behaviour Observation Scale for process operators
This appendix comains the Behaviour Observation Scale for process operators (in
Dutch) that was used as the criterion measure in the concurrent validity studies at Chemco
andPetco.
Beoordelingslijst voor het validatie onderzoek van de TUE
Onderstaande beoordelingslijst is ervoor om te toetsen hoe groot de overeenkomst is tussen iemands resultaten op de simulator en zijn prestaties in de praktijk. Deze lijst is dus geen vervanging van het bestaande beoordelingssysteem. Deze beoordelingslijst is opgebouwd uit vier taakdimensies, die elk een aantal items bevatten. Deze items zijn gebaseerd op concreet waarneembare gedragingen die de operator tijdens het uitoefenen van zijn functie vertoont. Het gaat hier dus steeds om een beoordeling van observeerbaar gedrag en niet om een beoordeling van eigenschappen van operators. De volgende vier taakdimensies worden onderscheiden: -Bedienen meet- en regelapparatuur: 26 items -Buiten lopen: 12 items -Communicatie en samenwerking: 12 items
Veiligheid: 9 items De beoordelingslijst bestaat dus in totaal uit 59 items. Het invullen neemt ongeveer een half uur per operator in beslag. Voor leerling-operators kan de Ie dimensie: Bedienen meet- en regelapparatuur overgeslagen worden. V oor alle overige operators de lijst graaggeheel invullen.
Taakdimensie: Bedienen meet· en regelapparatuur in de controlekamer
1) De meetkamerman stelt zich op de hoogte van veranderingen, zowel hardware als software, die zich op de unit voordoen.
1 2 3 4 5 soms regelmatig vaak bijna altijd altijd
2) De meetkamerman voert (indien nodig) meerdere werkzaamheden tegelijkertijd op de juiste wijze uit. 1 2 3 4 5
soms regelmatig vaak bijna altijd altijd
3) De meetkamerman voert correcties met betrekking tot de procesvariabelen op de juiste wijze door. 1 2 3 4 5
soms regelmatig vaak
4) De meetkamerman grijpt op het verkeerde moment in het proces in. 1 2 3
vaak regelmatig soms
bijna altijd
4 bijna nooit
altijd
5 nooit
5) De meetkamerman houdt zich goed op de hoogte van de toestand en het verloop van het proees (d.m.v. het uitvoeren van controles).
1 2 3 4 5 soms regelmatig vaak bijna altijd altijd

178 Selection by simu/ation
6) De meetkamerman heeft problemen met het op de hand regelen van het proces. 1 2 3 4
vaak regelmatig soms bijna nooit
7) De meetkamerman reageert meteen op een binnenkomend alarm en onderneemt de juiste aktie. 1 2 3 4
soms regelmatig vaak bijna altijd
5 nooit
5 altijd
8) De meetkamerman blijft niet alleen binnen de tolerantiegrenzen, maar regelt zo dicht mogelijk op de targets, ook al betekent dit extra werk.
1 2 soms regelmatig
3 vaak
4 bijna altijd
9) De meetkamerman heeft problemen met het werken met de geavanceerde regelkringen. 1 2 3 4
vaak regelmatig soms bijna nooit
5 altijd
5 nooit
10) De meetkamerman identificeert conflicterende informatie, combineert gegevens en stelt de juiste diagnose.
1 2 3 4 5 soms regelmatig vaak bijna altijd altijd
11) De meetkamerman heeft problemen met het stellen van de juiste prioriteiten als er meerdere alarmen tegelij'kertijd binnenkomen.
1 2 3 4 5 vaak regelmatig soms bijna nooit nooit
12) De meetkamerman voert een start-up of een shut-down volgens de voorgeschreven procedures uit 1 2 3 4 5
soms regelmatig vaak bijna altijd
13) De meetkamerman corrigeert te vroeg of te laat in verband met de responsietijd van het proces. 1 2 3 4
vaak regelmatig soms bijna nooit
14) De meetkamerman signaleert trends en is zo in staat te corrigeren alvorens er een alarm optreedt. 1 2 3 4
soms regelmatig vaak bijna altijd
15) De meetkamerman maakt bedieningsfouten bij het bedienen van de toetsenborden. 1 2 3 4
vaak regelmatig soms bijna nooit
16) De meetkamerman identificeert meteen de oonaak in probleemsituaties. 1 2 3 4
soms regelmatig vaak bijna altijd
altijd
5 nooit
5 altijd
5 nooit
5 altijd

Appendix F 179
17) De meetkamerman heeft problemen met het op de voorgeschreven wijze in- en uit bedrijfnemen vàn
apparatuur. 1 2 3 4 5
vaak regelmatig soms bijna nooit
18) De meetkamerman wacht passief af totdat er iets gebeurt en grijpt dan pas in. 1 2 3 4
vaak regelmatig soms bijna nooit
nooit
5 nooit
19) De meetkamerman kent zijn unit en is in staat om alle apparatuur te bedienen, ook in noodsituaties.
1 2 3 4 5 soms regelmatig vaak bijna altijd altijd
20) De meetkamerman heeft problemen met het leggen van de relaties tussen de verschillende procesdelen. 1 2 3 4 5
vaak regelmatig soms bijna nooit
21) De meetkamerman heeft problemen om het overzicht te behouden in alarm situaties. 1 2 3 4
vaak regelmatig soms bijna nooit 22) De meetkamerman blijft waakzaam gedurende het uitoefenen van zijn functie.
1 2 3 4 soms regelmatig vaak bijna altijd
23) De meetkamerman heeft problemen met het maken van onderscheid tussen hoofd- en bijzaken.
nooit
5 nooit
5 altijd
1 2 3 4 5 vaak regelmatig soms bijna nooit
24) De meetkamerman is goed op de hoogte van de mogelijke gevolgen van zijn akties. 1 2 3 4
soms regelmatig vaak bijna al tijd
25) De meetkamerman onderneemt meteen aktie als hij dat nodig acht en wacht niet af. 1 2 3 4
soms regelmatig vaak bijna altijd
nooit
5 altijd
5 altijd
26) De meetkamerman legt de juiste relaties tussen de waarden van de procesvariabelen, ook tijdens alarmsituaties.
1 2 3 4 5 soms regelmatig vaak bijna altijd altijd
Taakdimensie: Buiten lopen
1) De unitoperator controleert alles goed tijdens het lopen van zijn ronde en grijpt meteen in als dat nodig is.
soms 2
regelmatig 3
vaak 4
bijna altijd 5
altijd
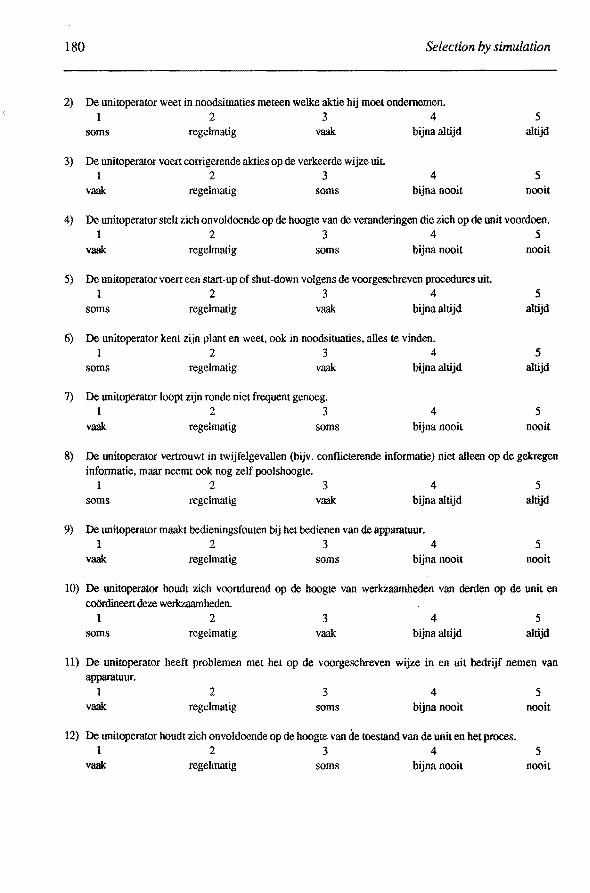
180 Selection by simu/ation
2) De unitoperator weet in noodsituaties meteen welke aktie hij moet ondernemen. 1 2 3 4
soms regelmatig vaak bijna altijd
3) De unitoperator voert corrigerende aleties op de verkeerde wijze uit 1 2 3 4
vaak regelmatig soms bijna nooit
5 altijd
5 nooit
4) De unitoperator stelt zich onvoldoende op de hoogte van de veranderingen die zich op de unit voordoen. 1 2 3 4 5
vaak regelmatig soms bijna nooit nooit
5) De unitoperator voert een start-up of shut-down volgens de voorgeschreven procedures uit. 1 2 3 4 5
soms regelmatig vaak bijna altijd
6) De unitoperator kent zijn plant en weet, ook in noodsituaties, alles te vinden. 1 2 3 4
soms regelmatig vaak bijna altijd
7) De unitoperator loopt zijn ronde niet frequent genoeg. 1 2 3 4
vaak regelmatig soms bijna nooit
altijd
5 altijd
5 nooit
8) De unitoperator vertrouwt in twijfelgevallen (bijv. conflicterende informatie) niet alleen op de gekregen informatie, maar neemt ook nog zelf poolshoogte.
1 2 3 4 soms regelmatig vaak bijna altijd
9) De unitoperator maakt bedieningsfouten bij het bedienen van de apparatuur. 1 2 3 4
vaak regelmatig soms bijna nooit
5 altijd
5 nooit
10) De unitoperator houdt zich voortdurend op de hoogte van werkzaamheden van derden op de unit en COÖrdineertdeze werkzaamheden.
1 2 3 soms regelmatig vaak
4 bijna altijd
5 altijd
11) De unitoperator heeft problemen met het op de voorgeschreven wijze in en uit bedrijf nemen van apparatuur.
1 2 3 4 5 vaak regelmatig soms bijna nooit nooit
12) De unitoperator houdt zich onvoldoende op de hoogte van de toestand van de unit en het proces. l 2 3 4 5
vaak regelmatig soms bijna nooit nooit
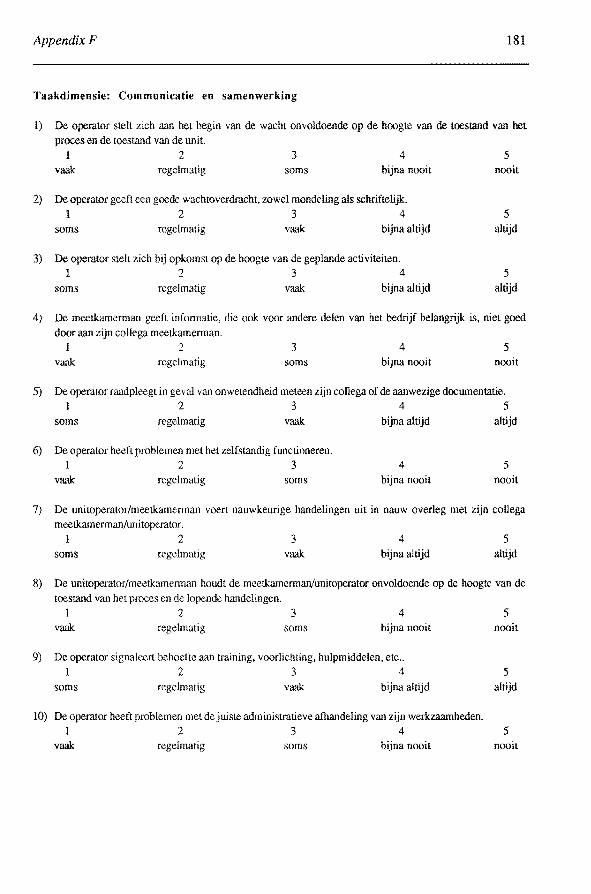
Appendix F 181
Taakdimensie: Communicatie en samenwerking
1) De operator stelt zich aan het begin van de wacht onvoldoende op de hoogte van de toestand van het proces en de toestand van de unit.
1 2 3 4 5 vaak regelmatig soms bijna nooit
2) De operator geeft een goede wachtoverdracht, zowel mondeling als schriftelijk. 1 2 3 4
soms regelmatig vaak bijna altijd
3) De operator stelt zich bij opkomst op de hoogte van de geplande activiteiten. 1 2 3 4
soms regelmatig vaak bijna altijd
nooit
5 altijd
5 altijd
4) De meetkamerman geeft informatie, die ook voor andere delen van het bedrijf belangrijk is, niet goed door aan zijn collega meetkamerman.
1 2 3 4 5 vaak regelmatig soms bijna nooit nooit
5) De operator raadpleegt in geval van onwetendheid meteen zijn collega of de aanwezige documentatie. 1 2 3 4 5
soms regelmatig vaak
6) De operator heeft problemen met het zelfstandig functioneren. 1 2 3
vaak regelmatig soms
bijna altijd
4 bijna nooit
altijd
5 nooit
7) De unitoperator/meetkamerman voert nauwkeurige handelingen uit in nauw overleg met zijn collega meetkamerman/unitoperator.
1 2 3 4 5 soms regelmatig vaak bijna altijd altijd
8) De unitoperator/meetkamerman houdt de meetkamerman/unitoperator onvoldoende op de hoogte van de toestand van het proces en de lopende handelingen.
1 2 3 4 5 vaak regelmatig soms bijna nooit
9) De operator signaleert behoefte aan training, voorlichting, hulpmiddelen, ete .. 1 2 3 4
soms regelmatig vaak bijna altijd
10) De operator heeft problemen met de juiste administratieve afhandeling van zijn werkzaamheden.
nooit
5 altijd
1 2 3 4 5 vaak regelmatig soms bijna nooit nooit

182 Selection by simulation
11) De operator geeft ideeën met betrekking tot de verbetering van het proces, de apparatuur, etc .. 1 2 3 4 5
soms regelmatig vaak bijna altijd altijd 12) De operator heeft problemen met het communiceren met leidinggevenden.
1 2 3 4 5 vaak regelmatig soms bijna nooit nooit
Taakdimensie: Veiligheid
1) De operator neemt onvoldoende voorzorgsmaatregelen bij het werken met gevaarlijke stoffen of in een gevaarlijke omgeving.
l 2 3 4 5 vaak regelmatig soms bijna nooit nooit
2) De operator houdt bij het in en uit bedrijf nemen van apparatuur duidelijk rekening met de veiligheidsprocedure en -aspecten.
l 2 3 4 5 soms regelmatig vaak
3) De operator houdt zijn werkplek niet goed schoon. l 2 3
vaak regelmatig soms
bijna altijd
4 bijna nooit
altijd
5 nooit
4) De operator neemt bij een onveilige situatie meteen de eerste benodigde veiligheidsmaatregelen en wacht niet af.
I 2 soms regelmatig
3 vaak
4 bijna altijd
5 altijd
5) De operator is alert op het identificeren en melden van onveilige situaties en behoefte aan onderhoud. l 2 3 4 5
soms regelmatig vaak bijna altijd altijd
6) De operator houdt zich onvoldoende op de hoogte van de benodigde veiligheidsvoorschriften. 1 2 3 4 5
vaak regelmatig soms bijna nooit
7) De operator draagt wrg voor een goede naleving van de permitprocedure op de unit 1 2 3 4
soms regelmatig vaak bijna altijd
8) De operator houdt bij zijn werkzaamheden rekening met de mogelijke gevolgen voor het milieu. 1 2 3 4
soms regelmatig vaak bijna altijd
nooit
5 altijd
5 altijd
9) De operator houdt bij het verrichten van operationele werkzaamheden onvoldoende rekening met de veiligheidsvoorschriften.
1 2 3 4 5 vaak regelmatig soms bijna nooit nooit

Curriculum Vitae
Astrid Ridderbos werd op 26 april 1961 geboren in Amsterdam. In 1979 behaalde zij het Gymnasiurn-E diploma aan de Van der Waalsscholengemeenschap te Amsterdam,
waarna zij 1 jaar heeft gewoond en gestudeerd in de Verenigde Staten aan de University of
Idaho in Moscow, Idaho. Bij terugkeer in Nederland startte zij met de studie Psychologie
aan de Universiteit van Amsterdam. Na het behalen van haar kandidaatsexamen in 1984
(cum laude), heeft zij gekozen voor de hoofdrichting Functieleer, met als differentiatierich
ting Cognitieve functiestoornissen, en heeft zij haar studie voltooid aan de Rijksuniversiteit Utrecht, waar zij in 1987 cum laude afstudeerde op een neuropsychologisch taalonderzoek bij Korsakov patiënten. Vervolgens trad zij in december 1987 in dienst als onderzoeker bij
de faculteit Technische Bedrijfskunde van de Technische Universiteit Eindhoven. Als lid van
de vakgroep Technologie en Arbeid verrichtte zij gedurende vier jaar onderzoek op het
gebied van selectie en training van procesoperators. Het ontwikkelen van een selectieinstrument voor procesoperators, gebaseerd op simulatietechnieken, vormde het doel van dit
onderzoek. In dit proefschrift is de ontwikkeling van dit selectie-instrument, de arbeidsproef
voor procesoperators, met de daarbij behorende validatie-experimenten beschreven. Sinds
juni 1992 is zij werkzaam als organisatie-adviseur op het gebied van de verzuimpreventie bij de BVG (Bedrijfsvereniging van werkgevers en werknemers uit de gezondheidszorg en
maatschappelijke dienstverlening) te Zeist.
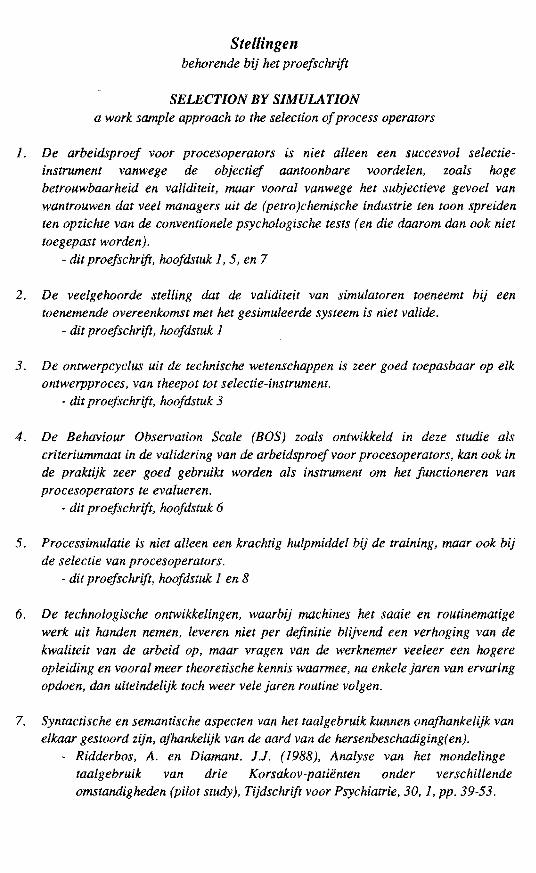
Stellingen behorende bij het proefschrift
SELECTJON BY SIMULATION a work sample approach to the selection of process operators
1. De arbeidsproet voor procesoperators is niet alleen een succesvol selectieinstrument vanwege de objectief aantoonbare voordelen, zoals hoge betrouwbaarheid en validiteit, maar vooral vanwege het subjectieve gevoel van wantrouwen dat veel managers uit de (petro)chemische industrie ten toon spreiden ten opzichte van de conventionele psychologische tests (en die daarom dan ook niet toegepast worden).
-dit proefschrift, hoofdstuk 1, 5, en 7
2. De veelgehoorde stelling dat de validiteit van simuiatoren toeneemt bij een toenemende overeenkomst met het gesimuleerde systeem is niet valide.
- dit proefschrift, hoofdstuk 1
3. De ontwerpcyclus uit de technische wetenschappen is zeer goed toepasbaar op elk ontwerpproces, van theepot tot selectie-instrument.
- dit proefschrift, hoofdstuk 3
4. De Behaviour Observation Scale (BOS) zoals ontwikkeld in deze studie als criteriummaat in de validering van de arbeidsproetvoor procesoperators, kan ook in de praktijk zeer goed gebruikt worden als instrument om het functioneren van procesoperators te evalueren.
- dit proefschrift, hoofdstuk 6
5. Processimulatie is niet alleen een krachtig hulpmiddel bij de training, maar ook bij de selectie van procesoperators.
- dit proefschrift, hoofdstuk 1 en 8
6. De technologische ontwikkelingen, waarbij machines het saaie en routinematige werk uit handen nemen, leveren niet per definitie blijvend een verhoging van de kwaliteit van de arbeid op, maar vragen van de werknemer veeleer een hogere opleiding en vooral meer theoretische kennis waarmee, na enkele jaren van ervaring opdoen, dan uiteindelijk toch weer vele jaren routine volgen.
7. Syntactische en semantische aspecten van het taalgebruik kunnen onafhankelijk van elkaar gestoord zijn, afhankelijk van de aard van de hersenbeschadiging( en).
- Ridderbos, A. en Diamant. J.J. (1988), Analyse van het mondelinge taalgebruik van drie Korsakov-patiënten onder verschillende omstandigheden (pilotstudy), Tijdschrift voor Psychiatrie, 30, 1, pp. 39-53.

8. Bij alle maatregelen die de overheid neemt om het ziekteverzuim in Nederland terug te dringen, zou zij zich ervan bewust moeten zijn dat dit tot een stijging van andere vormen van arbeidsverzuim kan leiden, zoals bijvoorbeeld een verhoging van het intern arbeidsverzuim (een mooie term voor uitgebreid de krant lezen en koffieleuten op het werk) en meer arbeidsonrust (zoals stakingen).
9. Hetfeit dat wél altijd aanfull-time werkende moeders en meestal niet aanfull-time werkende vaders wordt gevraagd 'hoe ze dat nu met de kinderen doen', geeft aan dat de verzorgende taken nog steeds voornamelijk aan de vrouw worden toebedeeld.
10. Zeilen is één van de meest actieve vormen van ogenschijnlijk niets doen.
11. Wanneer het grote publiek kennis zou nemen van de levensbeschrijving van een moderne Amerikaanse koe, zou de grootste hamburgergigant ter wereld direct zijn vestigingen kunnen sluiten wegens gebrek aan klandizie.
12. De psychologie is een zodanig veelzijdige wetenschap dat iedereen er verstand van denkt te hebben.
13. Het schrijven van een proefschrift is een eenvoudige zaak vergeleken met het bij elkaar krijgen van de voltallige kerncommissie op dezelfde tijd en dezelfde plaats.
14. Het feit dat Einstein een notoire langslaper was die veel van zijn ideeën over relativiteit in bed opdeed, kan een stimulans zijn voor veellangslapers om ondanks mogelijke tegenwerking in deze gewoonte te volharden.
Astrid Ridderbos, augustus 1992