selected demographic...
TRANSCRIPT

Compiled by Knoxville/Knox County Metropolitan Planning Commission, July 31, 2014
U.S. Census Bureau, 2007-2011 American Community Survey 5-Year Estimates
Total population 428,777
Male 208,411
Female 220,366
Under 5 years 25,907
5 to 9 years 26,524
10 to 14 years 25,539
15 to 19 years 29,723
20 to 24 years 37,297
25 to 34 years 57,914
35 to 44 years 57,910
45 to 54 years 61,555
55 to 59 years 26,161
60 to 64 years 24,552
65 to 74 years 30,026
75 to 84 years 19,057
85 years and over 6,612
Median age (years) 37.1
18 years and over 335,199
21 years and over 313,069
62 years and over 69,596
65 years and over 55,695
One race 421,713
White 371,099
Black or African American 38,846
American Indian and Alaska Native 782
Asian 8,043
Native Hawaiian and Pacific Islander 96
Some other race 2,847
Two or more races 7,064
Hispanic or Latino (of any race) 14,084
Not Hispanic or Latino 414,693
Characteristic Estimate Characteristic Estimate
Knox County, Tennessee
SELECTED DEMOGRAPHIC CHARACTERISTICS
SEX AND AGE RACE
HISPANIC OR LATINO
Err +/-
121
121
950
928
187
192
165
111
90
865
845
148
418
416
0.2
884
779
147
728
810
557
214
277
105
640
728
Err +/-
Data are based on a sample and are subject to sampling variability. The degree of uncertainty is represented through the use of a margin of error (Err +/-). The value shown here is the 90 percent margin of error. Blank estimate and error row(s): data not applicable, not available, or undisclosed.

Compiled by Knoxville/Knox County Metropolitan Planning Commission, July 31, 2014
U.S. Census Bureau, 2007-2011 American Community Survey 5-Year Estimates
Characteristic Estimate Characteristic Estimate
Knox County, Tennessee
SELECTED SOCIAL CHARACTERISTICS
HOUSEHOLDS BY TYPE
MARITAL STATUS
GRANDPARENTS
SCHOOL ENROLLMENT
EDUCATIONAL ATTAINMENT
DISABILITY STATUS
PLACE OF BIRTH
Total households 179,705
Family households (families) 108,513
With own children under 18 years 45,671
Married couple family 84,181
With own children under 18 years 31,245
Male householder, no wife present 6,280
With own children under 18 years 3,651
Female householder, no husband present 18,052
With own children under 18 years 10,775
Nonfamily households 71,192
Householder living alone 60,603
65 years and over 17,067
Households with one/more people <18 yrs 50,650
Households with one/more people 65 yrs+ 39,897
Average household size 2.32
Average family size 2.97
Males 15 years and over 168,399
Never married 56,253
Now married, except separated 87,062
Separated 2,590
Widowed 4,699
Divorced 17,795
Females 15 years and over 182,408
Never married 49,511
Now married, except separated 89,496
Separated 3,074
Widowed 17,090
Divorced 23,237
Grandparents living w/ grandchildren <18 yrs 7,481
Responsible for grandchildren 4,058
Population 3 yrs and over enrolled in school 112,164
Nursery school, preschool 5,874
Kindergarten 5,100
Elementary school (grades 1-8) 41,415
High school (grades 9-12) 20,120
College or graduate school 39,655
Population 25 years and over 283,787
Less than 9th grade 10,744
9th to 12th grade, no diploma 20,562
High school graduate (includes equivalency) 75,745
Some college, no degree 58,321
Associate's degree 21,884
Bachelor's degree 61,064
Graduate or professional degree 35,467
Total civilian noninstitutionalized population
With a disability
Under 18 years
With a disability
18 to 64 years
With a disability
65 years and over
With a disability
Total population 428,777
Native 410,433
Born in U.S. 407,638
State of residence 263,843
Different state 143,795
Born in Puerto Rico, U.S. Island area, abroad 2,795
Foreign born 18,344
Err +/-Err +/-
Population 5 years and over 402,870
English only 380,125
Language other than English 22,745
Speak English less than "very well" 9,769
Spanish 10,100
Speak English less than "very well" 5,024
Other Indo-European languages 6,567
Speak English less than "very well" 1,815
Asian and Pacific Islander languages 4,668
Speak English less than "very well" 2,376
Other languages 1,410
Speak English less than "very well" 554
LANGUAGE SPOKEN AT HOME
1,213
1,572
1,205
1,542
1,036
604
462
850
598
1,571
1,627
732
1,338
527
0.01
0.03
115
1,131
1,604
372
416
1,018
118
1,044
1,608
421
757
1,027
759
601
1,466
482
493
663
641
1,348
118
887
889
1,873
1,600
1,034
1,792
1,334
1,126
1,175
2,555
2,690
411
1,126
1,123
1,123
817
648
564
774
424
502
404
387
229
Data are based on a sample and are subject to sampling variability. The degree of uncertainty is represented through the use of a margin of error (Err +/-). The value shown here is the 90 percent margin of error. Blank estimate and error row(s): data not applicable, not available, or undisclosed.

Compiled by Knoxville/Knox County Metropolitan Planning Commission, July 31, 2014
U.S. Census Bureau, 2007-2011 American Community Survey 5-Year Estimates
Characteristic Characteristic Estimate
Knox County, Tennessee
SELECTED ECONOMIC CHARACTERISTICS
EMPLOYMENT STATUS INCOME AND BENEFITS
HEALTH INSURANCE COVERAGE
COMMUTING TO WORK
OCCUPATION
INDUSTRY
CLASS OF WORKER
Population 16 years and over 345,490
In labor force 224,905
Civilian labor force 224,464
Employed 211,055
Unemployed 13,409
Armed Forces 441
Not in labor force 120,585
Workers 16 years and over 206,894
Car, truck, van - drove alone 175,983
Car, truck, van - carpooled 16,646
Public transportation 1,328
Walked 3,084
Other means 2,238
Worked at home 7,615
Mean travel time to work (minutes) 21.0
Civilian employed population 16 yr and over 211,055
Management, business, science, arts 83,189
Service 32,788
Sales and office 59,394
Natural resources, construction, maintenance 16,622
Production, transportation, material moving 19,062
Civilian employed population 16 yr and over 211,055
Agriculture, forestry, fishing, hunting, mining 803
Construction 13,571
Manufacturing 16,156
Wholesale trade 7,880
Retail trade 28,857
Transportation, warehousing, utilities 9,234
Information 5,301
Finance, insurance, real estate, rental, leasing 14,470
Professional, scientific, mgmt, admin services 26,666
Educational services, health care, social asst 49,835
Arts, entertainment, rec, accom, food 20,094
Other services, except public administration 10,975
Public administration 7,213
Civilian employed population 16 yr and over 211,055
Private wage and salary workers 170,758
Government workers 27,799
Self-employed 12,332
Unpaid family workers 166
Total households 179,705
Less than $10,000 15,490
$10,000 to $14,999 9,548
$15,000 to $24,999 21,156
$25,000 to $34,999 21,840
$35,000 to $49,999 26,130
$50,000 to $74,999 32,670
$75,000 to $99,999 20,549
$100,000 to $149,000 18,795
$150,000 to $199,000 6,751
$200,000 or more 6,776
Median household income (dollars) 47,277
Mean household income (dollars) 66,065
Families 108,513
Less than $10,000 5,027
$10,000 to $14,999 2,680
$15,000 to $24,999 8,924
$25,000 to $34,999 9,247
$35,000 to $49,999 15,422
$50,000 to $74,999 22,633
$75,000 to $99,999 16,127
$100,000 to $149,999 16,069
$150,000 to $199,999 6,132
$200,000 or more 6,252
Median family income (dollars) 63,191
Mean family income (dollars) 83,785
Per capita income (dollars) 28,042
Civilian noninstitutionalized population
With health insurance coverage
With private health insurance
With public coverage
No health insurance coverage
Err +/-Estimate
417
1,984
1,971
2,044
926
158
2,080
2,044
1,818
1,476
1,697
865
887
2,044
194
967
927
685
1,352
686
595
913
1,062
1,385
1,362
806
564
2,044
2,198
1,228
758
89
2,140
2,167
1,334
302
478
337
614
0.3
1,213
773
600
986
1,131
1,087
1,321
901
943
555
466
920
1,037
1,572
489
355
738
732
774
1,003
810
973
553
470
1,141
1,700
437
Err +/-
1,409
Mean earnings (dollars) 67,891 1,216
With Social Security income 46,925 776
Mean Social Security income (dollars) 16,202 229
With retirement income 32,054 918
Mean retirement income (dollars) 20,235 699
With Supplemental Security Income 6,063 424
Mean Supp Security Income (dollars) 8,168 410
With cash public assistance income 6,716 543
Mean cash public asst income (dollars) 3,014 266
With Food Stamp/SNAP benefits 17,668 895
With earnings 141,571
Data are based on a sample and are subject to sampling variability. The degree of uncertainty is represented through the use of a margin of error (Err +/-). The value shown here is the 90 percent margin of error. Blank estimate and error row(s): data not applicable, not available, or undisclosed.

Compiled by Knoxville/Knox County Metropolitan Planning Commission, July 31, 2014
U.S. Census Bureau, 2007-2011 American Community Survey 5-Year Estimates
Characteristic Estimate Characteristic Estimate
Knox County, Tennessee
SELECTED HOUSING CHARACTERISTICS
HOUSING OCCUPANCY
UNITS IN STRUCTURE
VEHICLES AVAILABLE
GROSS RENT
YEAR STRUCTURE BUILT
HOUSING TENURE
VALUE
Total housing units 193,926
Occupied housing units 179,705
Vacant housing units 14,221
Homeowner vacancy rate 1.9
Rental vacancy rate 5.1
Total housing units 193,926
1-unit, detached 128,639
1-unit, attached 11,118
2 units 4,084
3 or 4 units 6,233
5 to 9 units 9,005
10 to 19 units 12,096
20 or more units 13,730
Mobile home 9,013
Boat, RV, van, etc 8
Total housing units 193,926
Built 2005 or later 12,173
Built 2000 to 2004 17,545
Built 1990 to 1999 35,576
Built 1980 to 1989 30,543
Built 1970 to 1979 37,294
Built 1960 to 1969 24,049
Built 1950 to 1959 17,227
Built 1940 to 1949 8,861
Built 1939 or earlier 10,658
Occupied housing units 179,705
Owner-occupied 119,683
Renter-occupied 60,022
Avg household size of owner-occupied unit 2.46
Avg household size of renter-occupied unit 2.02
Occupied housing units 179,705
No vehicles available 10,227
1 vehicle available 68,625
2 vehicles available 67,173
3 or more vehicles available 33,680
Owner-occupied units 119,683
Less than $50,000 6,812
$50,000 to $99,999 23,723
$100,000 to $149,999 26,606
$150,000 to $199,999 23,650
$200,000 to $299,999 20,366
$300,000 to $499,999 13,301
$500,000 to $999,999 4,475
$1,000,000 or more 750
Median value (dollars) 154,900
Occupied units paying rent 56,157
Less than $200 2,753
$200 to $299 1,563
$300 to $499 6,196
$500 to $749 20,231
$750 to $999 15,946
$1,000 to $1,499 7,969
$1,500 or more 1,499
Median rent (dollars) 722
No rent paid 3,865
Total housing units 193,926
No bedrooms 2,167
1 bedroom 20,488
2 bedrooms 55,122
3 bedrooms 78,930
4 bedrooms 30,269
5 or more bedrooms 6,950
BEDROOMS
Err +/-Err +/-
Occupied housing units 179,705 1,213
Lacking complete plumbing facilities 1,771 416
Lacking complete kitchen facilities 2,138 426
No telephone service available 6,409 590
SELECTED CHARACTERISTICS
Owner-occupied units 119,683 1,387
Housing units with a mortgage 80,289 1,208
Housing units without a mortgage 39,394 929
Median monthly owner costs (dollars) 1,235 14
Median monthly owner costs (dollars) 354 7
SELECTED MONTHLY OWNER COSTS
676
1,213
1,034
0.3
0.8
676
1,379
555
516
520
704
789
915
773
12
676
726
857
1,349
1,283
1,336
983
921
579
742
676
354
912
1,416
1,649
999
578
1,213
1,387
1,308
0.02
0.04
1,213
665
1,513
1,382
1,095
1,387
552
994
1,051
1,049
902
576
393
156
1,724
1,179
345
249
547
891
969
729
279
8
528
Data are based on a sample and are subject to sampling variability. The degree of uncertainty is represented through the use of a margin of error (Err +/-). The value shown here is the 90 percent margin of error. Blank estimate and error row(s): data not applicable, not available, or undisclosed.

Compiled by Knoxville/Knox County Metropolitan Planning Commission, July 31, 2014
U.S. Census Bureau, 2007-2011 American Community Survey 5-Year Estimates
Total population 20,448
Male 9,885
Female 10,563
Under 5 years 928
5 to 9 years 1,459
10 to 14 years 1,737
15 to 19 years 1,534
20 to 24 years 626
25 to 34 years 1,163
35 to 44 years 2,728
45 to 54 years 3,863
55 to 59 years 1,711
60 to 64 years 1,610
65 to 74 years 1,771
75 to 84 years 845
85 years and over 473
Median age (years) 45.1
18 years and over 15,286
21 years and over 14,705
62 years and over 4,031
65 years and over 3,089
One race 20,321
White 18,482
Black or African American 693
American Indian and Alaska Native 0
Asian 1,080
Native Hawaiian and Pacific Islander 0
Some other race 66
Two or more races 127
Hispanic or Latino (of any race) 513
Not Hispanic or Latino 19,935
Characteristic Estimate Characteristic Estimate
Farragut town, Tennessee
SELECTED DEMOGRAPHIC CHARACTERISTICS
SEX AND AGE RACE
HISPANIC OR LATINO
Err +/-
33
313
314
187
217
303
331
200
264
268
323
258
281
223
182
129
1.2
302
335
332
258
120
508
393
95
329
95
90
114
290
292
Err +/-
Data are based on a sample and are subject to sampling variability. The degree of uncertainty is represented through the use of a margin of error (Err +/-). The value shown here is the 90 percent margin of error. Blank estimate and error row(s): data not applicable, not available, or undisclosed.

Compiled by Knoxville/Knox County Metropolitan Planning Commission, July 31, 2014
U.S. Census Bureau, 2007-2011 American Community Survey 5-Year Estimates
Characteristic Estimate Characteristic Estimate
Farragut town, Tennessee
SELECTED SOCIAL CHARACTERISTICS
HOUSEHOLDS BY TYPE
MARITAL STATUS
GRANDPARENTS
SCHOOL ENROLLMENT
EDUCATIONAL ATTAINMENT
DISABILITY STATUS
PLACE OF BIRTH
Total households 7,494
Family households (families) 6,059
With own children under 18 years 2,529
Married couple family 5,416
With own children under 18 years 2,138
Male householder, no wife present 92
With own children under 18 years 83
Female householder, no husband present 551
With own children under 18 years 308
Nonfamily households 1,435
Householder living alone 1,302
65 years and over 564
Households with one/more people <18 yrs 2,651
Households with one/more people 65 yrs+ 2,000
Average household size 2.70
Average family size 3.06
Males 15 years and over 7,683
Never married 1,488
Now married, except separated 5,520
Separated 72
Widowed 96
Divorced 507
Females 15 years and over 8,641
Never married 1,466
Now married, except separated 5,623
Separated 50
Widowed 826
Divorced 676
Grandparents living w/ grandchildren <18 yrs 274
Responsible for grandchildren 95
Population 3 yrs and over enrolled in school 5,616
Nursery school, preschool 377
Kindergarten 223
Elementary school (grades 1-8) 2,623
High school (grades 9-12) 1,441
College or graduate school 952
Population 25 years and over 14,164
Less than 9th grade 90
9th to 12th grade, no diploma 249
High school graduate (includes equivalency) 1,951
Some college, no degree 2,793
Associate's degree 788
Bachelor's degree 5,206
Graduate or professional degree 3,087
Total civilian noninstitutionalized population
With a disability
Under 18 years
With a disability
18 to 64 years
With a disability
65 years and over
With a disability
Total population 20,448
Native 19,118
Born in U.S. 18,913
State of residence 8,592
Different state 10,321
Born in Puerto Rico, U.S. Island area, abroad 205
Foreign born 1,330
Err +/-Err +/-
Population 5 years and over 19,520
English only 17,923
Language other than English 1,597
Speak English less than "very well" 561
Spanish 428
Speak English less than "very well" 100
Other Indo-European languages 461
Speak English less than "very well" 98
Asian and Pacific Islander languages 708
Speak English less than "very well" 363
Other languages 0
Speak English less than "very well" 0
LANGUAGE SPOKEN AT HOME
236
194
239
236
200
68
65
187
140
273
258
144
224
185
0.08
0.08
275
275
232
51
59
171
254
257
206
45
179
166
133
88
410
140
97
359
294
220
315
53
112
316
333
187
399
331
33
312
324
816
777
111
310
192
447
412
202
257
96
180
79
270
169
95
95
Data are based on a sample and are subject to sampling variability. The degree of uncertainty is represented through the use of a margin of error (Err +/-). The value shown here is the 90 percent margin of error. Blank estimate and error row(s): data not applicable, not available, or undisclosed.

Compiled by Knoxville/Knox County Metropolitan Planning Commission, July 31, 2014
U.S. Census Bureau, 2007-2011 American Community Survey 5-Year Estimates
Characteristic Characteristic Estimate
Farragut town, Tennessee
SELECTED ECONOMIC CHARACTERISTICS
EMPLOYMENT STATUS INCOME AND BENEFITS
HEALTH INSURANCE COVERAGE
COMMUTING TO WORK
OCCUPATION
INDUSTRY
CLASS OF WORKER
Population 16 years and over 15,965
In labor force 9,881
Civilian labor force 9,881
Employed 9,455
Unemployed 426
Armed Forces 0
Not in labor force 6,084
Workers 16 years and over 9,202
Car, truck, van - drove alone 7,707
Car, truck, van - carpooled 556
Public transportation 14
Walked 16
Other means 120
Worked at home 789
Mean travel time to work (minutes) 24.4
Civilian employed population 16 yr and over 9,455
Management, business, science, arts 5,265
Service 814
Sales and office 2,813
Natural resources, construction, maintenance 232
Production, transportation, material moving 331
Civilian employed population 16 yr and over 9,455
Agriculture, forestry, fishing, hunting, mining 44
Construction 414
Manufacturing 796
Wholesale trade 459
Retail trade 1,099
Transportation, warehousing, utilities 319
Information 294
Finance, insurance, real estate, rental, leasing 784
Professional, scientific, mgmt, admin services 2,022
Educational services, health care, social asst 2,000
Arts, entertainment, rec, accom, food 503
Other services, except public administration 455
Public administration 266
Civilian employed population 16 yr and over 9,455
Private wage and salary workers 7,449
Government workers 1,274
Self-employed 712
Unpaid family workers 20
Total households 7,494
Less than $10,000 121
$10,000 to $14,999 221
$15,000 to $24,999 224
$25,000 to $34,999 516
$35,000 to $49,999 633
$50,000 to $74,999 1,029
$75,000 to $99,999 1,146
$100,000 to $149,000 1,714
$150,000 to $199,000 1,035
$200,000 or more 855
Median household income (dollars) 96,220
Mean household income (dollars) 120,678
Families 6,059
Less than $10,000 67
$10,000 to $14,999 84
$15,000 to $24,999 113
$25,000 to $34,999 235
$35,000 to $49,999 377
$50,000 to $74,999 783
$75,000 to $99,999 1,049
$100,000 to $149,999 1,502
$150,000 to $199,999 994
$200,000 or more 855
Median family income (dollars) 111,410
Mean family income (dollars) 136,283
Per capita income (dollars) 44,087
Civilian noninstitutionalized population
With health insurance coverage
With private health insurance
With public coverage
No health insurance coverage
Err +/-Estimate
307
482
482
500
154
95
416
500
383
201
352
111
115
500
51
140
183
146
243
114
123
200
286
288
211
152
117
500
528
225
178
22
465
489
207
21
27
101
201
2.0
236
103
101
113
179
152
193
223
279
222
192
7,695
12,395
194
92
53
94
134
120
158
226
236
222
192
8,383
15,586
4,065
Err +/-
260
Mean earnings (dollars) 121,515 13,964
With Social Security income 2,269 210
Mean Social Security income (dollars) 20,166 1,351
With retirement income 1,899 227
Mean retirement income (dollars) 31,899 3,141
With Supplemental Security Income 118 67
Mean Supp Security Income (dollars) 7,122 2,065
With cash public assistance income 46 41
Mean cash public asst income (dollars) 970 590
With Food Stamp/SNAP benefits 142 75
With earnings 5,989
Data are based on a sample and are subject to sampling variability. The degree of uncertainty is represented through the use of a margin of error (Err +/-). The value shown here is the 90 percent margin of error. Blank estimate and error row(s): data not applicable, not available, or undisclosed.

Compiled by Knoxville/Knox County Metropolitan Planning Commission, July 31, 2014
U.S. Census Bureau, 2007-2011 American Community Survey 5-Year Estimates
Characteristic Estimate Characteristic Estimate
Farragut town, Tennessee
SELECTED HOUSING CHARACTERISTICS
HOUSING OCCUPANCY
UNITS IN STRUCTURE
VEHICLES AVAILABLE
GROSS RENT
YEAR STRUCTURE BUILT
HOUSING TENURE
VALUE
Total housing units 7,805
Occupied housing units 7,494
Vacant housing units 311
Homeowner vacancy rate 1.5
Rental vacancy rate 0.0
Total housing units 7,805
1-unit, detached 6,913
1-unit, attached 362
2 units 38
3 or 4 units 76
5 to 9 units 59
10 to 19 units 175
20 or more units 135
Mobile home 47
Boat, RV, van, etc 0
Total housing units 7,805
Built 2005 or later 427
Built 2000 to 2004 923
Built 1990 to 1999 2,258
Built 1980 to 1989 1,861
Built 1970 to 1979 1,443
Built 1960 to 1969 630
Built 1950 to 1959 110
Built 1940 to 1949 67
Built 1939 or earlier 86
Occupied housing units 7,494
Owner-occupied 6,764
Renter-occupied 730
Avg household size of owner-occupied unit 2.79
Avg household size of renter-occupied unit 1.84
Occupied housing units 7,494
No vehicles available 185
1 vehicle available 1,451
2 vehicles available 3,633
3 or more vehicles available 2,225
Owner-occupied units 6,764
Less than $50,000 70
$50,000 to $99,999 100
$100,000 to $149,999 379
$150,000 to $199,999 1,035
$200,000 to $299,999 1,531
$300,000 to $499,999 2,980
$500,000 to $999,999 657
$1,000,000 or more 12
Median value (dollars) 312,200
Occupied units paying rent 718
Less than $200 0
$200 to $299 0
$300 to $499 0
$500 to $749 25
$750 to $999 256
$1,000 to $1,499 356
$1,500 or more 81
Median rent (dollars) 1,080
No rent paid 12
Total housing units 7,805
No bedrooms 94
1 bedroom 88
2 bedrooms 497
3 bedrooms 2,412
4 bedrooms 3,663
5 or more bedrooms 1,051
BEDROOMS
Err +/-Err +/-
Occupied housing units 7,494 236
Lacking complete plumbing facilities 129 113
Lacking complete kitchen facilities 223 129
No telephone service available 138 97
SELECTED CHARACTERISTICS
Owner-occupied units 6,764 243
Housing units with a mortgage 4,948 281
Housing units without a mortgage 1,816 231
Median monthly owner costs (dollars) 1,892 82
Median monthly owner costs (dollars) 440 26
SELECTED MONTHLY OWNER COSTS
231
236
158
1.4
5.0
231
247
109
31
65
50
103
58
41
95
231
110
195
285
255
242
155
59
64
87
231
66
60
152
295
334
178
236
243
163
0.09
0.37
236
92
265
279
240
243
50
77
126
198
211
264
160
21
10,100
161
95
95
95
28
88
156
73
93
18
Data are based on a sample and are subject to sampling variability. The degree of uncertainty is represented through the use of a margin of error (Err +/-). The value shown here is the 90 percent margin of error. Blank estimate and error row(s): data not applicable, not available, or undisclosed.

Compiled by Knoxville/Knox County Metropolitan Planning Commission, July 31, 2014
U.S. Census Bureau, 2007-2011 American Community Survey 5-Year Estimates
Total population 179,085
Male 86,212
Female 92,873
Under 5 years 10,816
5 to 9 years 8,891
10 to 14 years 8,488
15 to 19 years 13,476
20 to 24 years 24,031
25 to 34 years 26,515
35 to 44 years 22,053
45 to 54 years 21,938
55 to 59 years 9,554
60 to 64 years 8,669
65 to 74 years 12,005
75 to 84 years 9,237
85 years and over 3,412
Median age (years) 33.6
18 years and over 145,464
21 years and over 131,820
62 years and over 29,885
65 years and over 24,654
One race 175,491
White 140,287
Black or African American 29,961
American Indian and Alaska Native 309
Asian 3,020
Native Hawaiian and Pacific Islander 6
Some other race 1,908
Two or more races 3,594
Hispanic or Latino (of any race) 6,939
Not Hispanic or Latino 172,146
Characteristic Estimate Characteristic Estimate
Knoxville city, Tennessee
SELECTED DEMOGRAPHIC CHARACTERISTICS
SEX AND AGE RACE
HISPANIC OR LATINO
Err +/-
52
928
923
481
623
684
803
931
885
753
725
636
611
570
473
335
0.6
952
1,405
936
747
669
1,385
1,132
172
414
9
600
673
941
929
Err +/-
Data are based on a sample and are subject to sampling variability. The degree of uncertainty is represented through the use of a margin of error (Err +/-). The value shown here is the 90 percent margin of error. Blank estimate and error row(s): data not applicable, not available, or undisclosed.

Compiled by Knoxville/Knox County Metropolitan Planning Commission, July 31, 2014
U.S. Census Bureau, 2007-2011 American Community Survey 5-Year Estimates
Characteristic Estimate Characteristic Estimate
Knoxville city, Tennessee
SELECTED SOCIAL CHARACTERISTICS
HOUSEHOLDS BY TYPE
MARITAL STATUS
GRANDPARENTS
SCHOOL ENROLLMENT
EDUCATIONAL ATTAINMENT
DISABILITY STATUS
PLACE OF BIRTH
Total households 82,829
Family households (families) 38,402
With own children under 18 years 16,208
Married couple family 25,649
With own children under 18 years 8,280
Male householder, no wife present 2,935
With own children under 18 years 1,776
Female householder, no husband present 9,818
With own children under 18 years 6,152
Nonfamily households 44,427
Householder living alone 37,744
65 years and over 9,543
Households with one/more people <18 yrs 18,348
Households with one/more people 65 yrs+ 18,108
Average household size 2.04
Average family size 2.89
Males 15 years and over 71,954
Never married 31,791
Now married, except separated 27,133
Separated 1,200
Widowed 2,675
Divorced 9,155
Females 15 years and over 78,936
Never married 29,828
Now married, except separated 27,925
Separated 1,524
Widowed 8,556
Divorced 11,103
Grandparents living w/ grandchildren <18 yrs 2,761
Responsible for grandchildren 1,518
Population 3 yrs and over enrolled in school 49,952
Nursery school, preschool 2,053
Kindergarten 1,767
Elementary school (grades 1-8) 13,733
High school (grades 9-12) 6,672
College or graduate school 25,727
Population 25 years and over 113,383
Less than 9th grade 5,738
9th to 12th grade, no diploma 10,976
High school graduate (includes equivalency) 31,531
Some college, no degree 23,423
Associate's degree 8,058
Bachelor's degree 21,254
Graduate or professional degree 12,403
Total civilian noninstitutionalized population
With a disability
Under 18 years
With a disability
18 to 64 years
With a disability
65 years and over
With a disability
Total population 179,085
Native 170,883
Born in U.S. 169,849
State of residence 114,907
Different state 54,942
Born in Puerto Rico, U.S. Island area, abroad 1,034
Foreign born 8,202
Err +/-Err +/-
Population 5 years and over 168,269
English only 157,903
Language other than English 10,366
Speak English less than "very well" 5,086
Spanish 4,969
Speak English less than "very well" 2,768
Other Indo-European languages 2,544
Speak English less than "very well" 726
Asian and Pacific Islander languages 1,903
Speak English less than "very well" 1,193
Other languages 950
Speak English less than "very well" 399
LANGUAGE SPOKEN AT HOME
1,165
898
702
785
455
397
290
662
481
1,242
1,312
546
789
564
0.02
0.05
962
1,038
823
234
330
700
944
1,013
900
276
476
790
427
334
1,578
287
344
753
491
1,477
1,271
519
709
1,237
1,149
691
1,080
794
52
903
971
1,831
1,838
272
907
479
1,258
1,072
824
805
640
519
285
344
271
330
210
Data are based on a sample and are subject to sampling variability. The degree of uncertainty is represented through the use of a margin of error (Err +/-). The value shown here is the 90 percent margin of error. Blank estimate and error row(s): data not applicable, not available, or undisclosed.

Compiled by Knoxville/Knox County Metropolitan Planning Commission, July 31, 2014
U.S. Census Bureau, 2007-2011 American Community Survey 5-Year Estimates
Characteristic Characteristic Estimate
Knoxville city, Tennessee
SELECTED ECONOMIC CHARACTERISTICS
EMPLOYMENT STATUS INCOME AND BENEFITS
HEALTH INSURANCE COVERAGE
COMMUTING TO WORK
OCCUPATION
INDUSTRY
CLASS OF WORKER
Population 16 years and over 149,127
In labor force 91,629
Civilian labor force 91,514
Employed 84,947
Unemployed 6,567
Armed Forces 115
Not in labor force 57,498
Workers 16 years and over 83,051
Car, truck, van - drove alone 68,645
Car, truck, van - carpooled 7,342
Public transportation 1,249
Walked 2,187
Other means 1,130
Worked at home 2,498
Mean travel time to work (minutes) 19.0
Civilian employed population 16 yr and over 84,947
Management, business, science, arts 29,778
Service 16,879
Sales and office 23,840
Natural resources, construction, maintenance 6,760
Production, transportation, material moving 7,690
Civilian employed population 16 yr and over 84,947
Agriculture, forestry, fishing, hunting, mining 188
Construction 5,534
Manufacturing 4,925
Wholesale trade 2,761
Retail trade 11,819
Transportation, warehousing, utilities 3,117
Information 2,052
Finance, insurance, real estate, rental, leasing 5,546
Professional, scientific, mgmt, admin services 9,837
Educational services, health care, social asst 21,555
Arts, entertainment, rec, accom, food 10,835
Other services, except public administration 4,356
Public administration 2,422
Civilian employed population 16 yr and over 84,947
Private wage and salary workers 69,527
Government workers 10,938
Self-employed 4,425
Unpaid family workers 57
Total households 82,829
Less than $10,000 12,215
$10,000 to $14,999 6,191
$15,000 to $24,999 12,487
$25,000 to $34,999 12,097
$35,000 to $49,999 12,925
$50,000 to $74,999 13,293
$75,000 to $99,999 6,723
$100,000 to $149,000 3,896
$150,000 to $199,000 1,408
$200,000 or more 1,594
Median household income (dollars) 33,467
Mean household income (dollars) 47,834
Families 38,402
Less than $10,000 3,532
$10,000 to $14,999 1,598
$15,000 to $24,999 4,422
$25,000 to $34,999 4,121
$35,000 to $49,999 6,705
$50,000 to $74,999 7,998
$75,000 to $99,999 4,384
$100,000 to $149,999 3,045
$150,000 to $199,999 1,174
$200,000 or more 1,423
Median family income (dollars) 47,340
Mean family income (dollars) 64,958
Per capita income (dollars) 22,655
Civilian noninstitutionalized population
With health insurance coverage
With private health insurance
With public coverage
No health insurance coverage
Err +/-Estimate
898
1,405
1,408
1,544
668
83
1,464
1,544
1,086
1,022
1,107
564
618
1,544
93
607
532
350
898
403
347
606
723
972
984
518
320
1,544
1,570
808
480
41
1,530
1,589
851
299
397
263
390
0.4
1,165
693
465
763
796
777
825
574
392
252
261
856
1,313
898
419
245
504
390
507
597
446
362
243
252
1,423
2,960
649
Err +/-
1,221
Mean earnings (dollars) 50,608 1,568
With Social Security income 21,703 692
Mean Social Security income (dollars) 14,788 329
With retirement income 13,578 688
Mean retirement income (dollars) 17,063 1,000
With Supplemental Security Income 3,733 356
Mean Supp Security Income (dollars) 7,326 416
With cash public assistance income 5,050 505
Mean cash public asst income (dollars) 2,828 324
With Food Stamp/SNAP benefits 12,237 744
With earnings 61,319
Data are based on a sample and are subject to sampling variability. The degree of uncertainty is represented through the use of a margin of error (Err +/-). The value shown here is the 90 percent margin of error. Blank estimate and error row(s): data not applicable, not available, or undisclosed.
Compiled by Knoxville/Knox County Metropolitan Planning Commission, July 31, 2014
U.S. Census Bureau, 2007-2011 American Community Survey 5-Year Estimates
Characteristic Estimate Characteristic Estimate
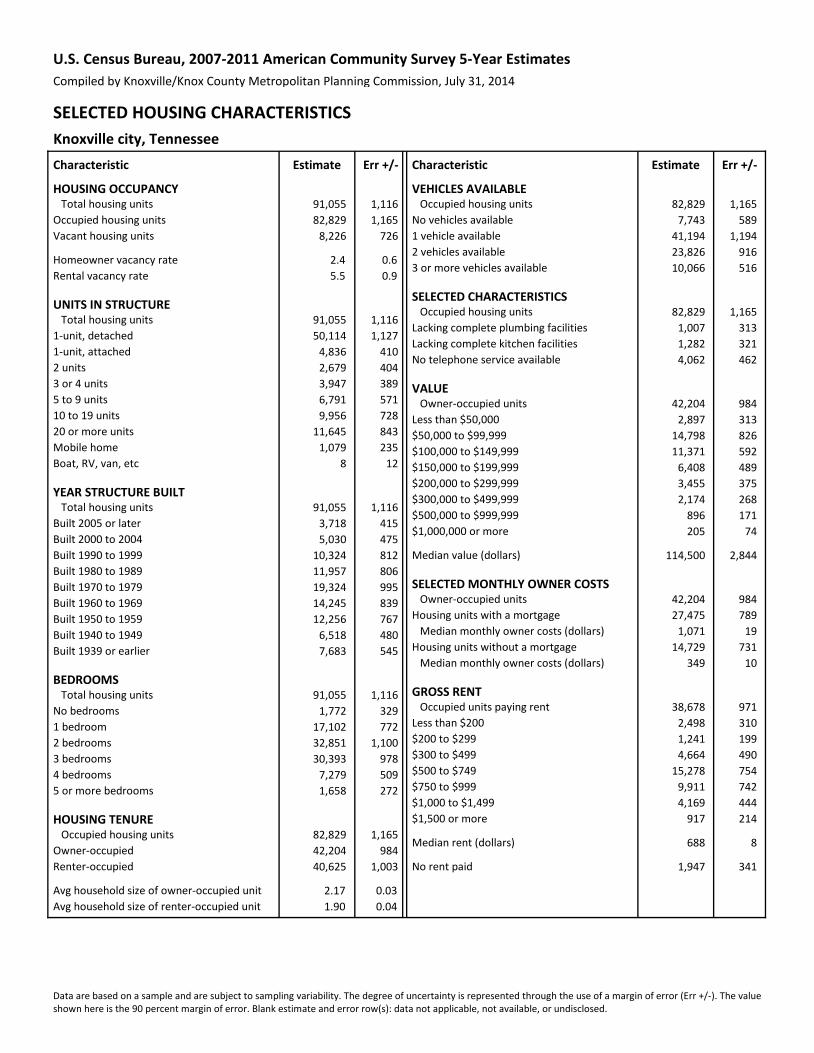
Knoxville city, Tennessee
SELECTED HOUSING CHARACTERISTICS
HOUSING OCCUPANCY
UNITS IN STRUCTURE
VEHICLES AVAILABLE
GROSS RENT
YEAR STRUCTURE BUILT
HOUSING TENURE
VALUE
Total housing units 91,055
Occupied housing units 82,829
Vacant housing units 8,226
Homeowner vacancy rate 2.4
Rental vacancy rate 5.5
Total housing units 91,055
1-unit, detached 50,114
1-unit, attached 4,836
2 units 2,679
3 or 4 units 3,947
5 to 9 units 6,791
10 to 19 units 9,956
20 or more units 11,645
Mobile home 1,079
Boat, RV, van, etc 8
Total housing units 91,055
Built 2005 or later 3,718
Built 2000 to 2004 5,030
Built 1990 to 1999 10,324
Built 1980 to 1989 11,957
Built 1970 to 1979 19,324
Built 1960 to 1969 14,245
Built 1950 to 1959 12,256
Built 1940 to 1949 6,518
Built 1939 or earlier 7,683
Occupied housing units 82,829
Owner-occupied 42,204
Renter-occupied 40,625
Avg household size of owner-occupied unit 2.17
Avg household size of renter-occupied unit 1.90
Occupied housing units 82,829
No vehicles available 7,743
1 vehicle available 41,194
2 vehicles available 23,826
3 or more vehicles available 10,066
Owner-occupied units 42,204
Less than $50,000 2,897
$50,000 to $99,999 14,798
$100,000 to $149,999 11,371
$150,000 to $199,999 6,408
$200,000 to $299,999 3,455
$300,000 to $499,999 2,174
$500,000 to $999,999 896
$1,000,000 or more 205
Median value (dollars) 114,500
Occupied units paying rent 38,678
Less than $200 2,498
$200 to $299 1,241
$300 to $499 4,664
$500 to $749 15,278
$750 to $999 9,911
$1,000 to $1,499 4,169
$1,500 or more 917
Median rent (dollars) 688
No rent paid 1,947
Total housing units 91,055
No bedrooms 1,772
1 bedroom 17,102
2 bedrooms 32,851
3 bedrooms 30,393
4 bedrooms 7,279
5 or more bedrooms 1,658
BEDROOMS
Err +/-Err +/-
Occupied housing units 82,829 1,165
Lacking complete plumbing facilities 1,007 313
Lacking complete kitchen facilities 1,282 321
No telephone service available 4,062 462
SELECTED CHARACTERISTICS
Owner-occupied units 42,204 984
Housing units with a mortgage 27,475 789
Housing units without a mortgage 14,729 731
Median monthly owner costs (dollars) 1,071 19
Median monthly owner costs (dollars) 349 10
SELECTED MONTHLY OWNER COSTS
1,116
1,165
726
0.6
0.9
1,116
1,127
410
404
389
571
728
843
235
12
1,116
415
475
812
806
995
839
767
480
545
1,116
329
772
1,100
978
509
272
1,165
984
1,003
0.03
0.04
1,165
589
1,194
916
516
984
313
826
592
489
375
268
171
74
2,844
971
310
199
490
754
742
444
214
8
341
Data are based on a sample and are subject to sampling variability. The degree of uncertainty is represented through the use of a margin of error (Err +/-). The value shown here is the 90 percent margin of error. Blank estimate and error row(s): data not applicable, not available, or undisclosed.