select the best effect of coagulate for removal nitrite
TRANSCRIPT

Republic of Iraq Ministry of Higher Education University of Technology Building and Construction Dept.
Select the Best Effect of Coagulate for Removal Nitrite and Nitrate in Row Water
A project Submitted as a partial Fulfillment of the
Requirements for The Degree of (B.S.C) in civil Engineering
By:
Ahmed Nasser
SUPERVISED BY:
Leacture. Ghydaa Yassen
2011

الاهداء
الى مثلي الاعلى...الوالد العزيز
الى القلب الذي حمل عني الهموم .....احب الناس الام
الحنون
الى ثاني اثنين لايشبعان :طالب مال وطالب علم
نهدي بحثنا المتواضع هذا
الطالب احمد ناصر

بسم الله الرحمن الرحيم
شكر و تقدير
نتقدم بالشكر الجزيل الى رئاسهة قسم البناء و
الانشاءات ......و الى الست (م. غيداء ) للجهود التتي
بذلها لأنجاز هذا المشروع و نشكر اساتذه القسم كافه
لمساهمتهم في ايصالنا الى هذا المستوى العلمي ... و
الى جميع العاملين في مختبر الهندسه الصحيه للجهود
التي بذلوها في انجاز هذا البحث ..
احمد ناصر

جمهوريه العراق وزاره التعليم العالي الجامعه التكنولوجيه
قسم البناء و الانشاءات فرع الهندسه الصحيه و البيئيه
اختيار تأثير افضل مخثر في ازاله النترات و النتريت من
ماء النهر
مشروع مقدم اللى قسم هندسه البناء و الانشاءات كجزء من
نيل درجه البكلوريوس في هندسه البناء و الانشاءات
(فرع الهندسه الصحيه و البيئيه)

بسـم اللـه الرحـمن الرحـيم
الذ◌ي خلق فسوى سبح إسم ربك الأعلى
والذ◌ي قدر فهدى
صدق اللـه العظـيم
3- 1 سورة الاعلى
◌
1
2
3

Table of Contents IV
Table of Contents
Subject Page
Dedication Ι
Acknowledgement ΙΙ
Abstract ΙΙΙ
Table of Contents IV
Chapter One: Introduction
1.1 Introduction 1
1.2 water pollution 2
1.2.1 Types of water pollution 2
1.2.2 Sources of water pollution 2
1.3 object of this study 3
Chapter Two: Literature Review
2.1 Introduction 4
2.2 Coagulation and flocculation 5
2.3 coagulant 6
Table of Contents V
Chapter Three:
3.1-Introduction
10
3.2-Coagulation 10
3.3-Alum and ferric sulphate comparison
11
3.4-Alum and ferric chloride comparison
21B11
3.5-Flocculent
22B11
3.6-Particle Charge Prevents Coagulation
23B12
3.7-Microscopic Electrical Force the Double Layer 24B12
3.8-Double Layer Thickness
25B13
26B3.9-Zeta Potential
27B13
3.10-Zeta Potential vs. Surface Potential
28B14
3.11- Balancing Opposing Forces
29B14
3.12-Repulsion 30B14
3.13-Attraction
31B14

Table of Contents VI
3.14- The Energy Barrier 15
3.15-Lowering the Energy Barrier
15
3.16-Compress the Double Layer
15
3.17-Lower the Surface Charge 16
3.18-Coagulate, and then Flocculate
16
3.19-Four Ways to Flocculate 16
3.19.1-Double Layer Compression
17
3.19.2-Charge Neutralization
17
3.19.3-Bridging
17
3.19.4-Colloid Entrapment
18
3.20-Time Tested Coagulants
18
3.21-Tools for Dosage Control Jar Test an Undervalued Tool
18

Table of Contents VII
3.22- Jar Test Apparatus 19
Chapter Four:
4.1- Introduction 20
4.2- sampling 20
4.2.1-Raw Water samples 20
4.3- Turbidity 21
4.4- Jar Tester 21
Chapter Five: Account and discussion 5.1- Introduction. Account and discussion 25
Chapter Six: Conclusion
6.1-Conclusions 31

Table of Contents VIII
List of table
Chapter four
Table Title
Page
4-1 Apparatus and Equipments
21
Chapter five Table Title
Page
5-1 Results of the turbidity Removal by jar test after add (Alum, FeCl3 and FeSO4)
22
5-2 Results of the (Alum, FeCl3 and FeSO4) Obtained of Conventional Jar Test through Table (1)
22
5-3
Results of the turbidity Removal by jar test after add (Alum, FeCl3 and FeSO4)
23
5-4 Results of the (Alum, FeCl3 and FeSO4) Obtained of Conventional Jar Test through Table (3)
23
5-5 Results of the turbidity Removal by jar test after add (Alum, FeCl3 and FeSO4)
24
5-6 Results of the (Alum, FeCl3 and FeSO4) Obtained of Conventional Jar Test through Table (5)
24
5-7 Results of the turbidity Removal by jar test after add (Alum, FeCl3 and FeSO4)
25
5-8 Results of the (Alum, FeCl3 and FeSO4) Obtained of Conventional Jar Test through Table (7)
25
5-9 Results of the turbidity Removal by jar test after add (Alum, FeCl3 and FeSO4)
26
5-10 Results of the (Alum, FeCl3 and FeSO4) Obtained of Conventional Jar Test through Table (9)
26

Table of Contents IX
Subject Page
References
32
Abstract
33
Dedication 34

الخلاصة
U الخلاصة الماء نعمة الله على الخلق حيث وفر لنا نهري دجلة والفرات التي تروي اراضيه والمعروف عن هذه
الانهار انها تنقي نفسها بنفسها ولكن تدخل الانسان من خلال نشاطاته الصناعية والزراعية والتي خلفت كثير من المخلفات التي رميت دون درايه الى هذه الانهر احد مسببات التلوث , ولذلك اعتبرت
محطات معالجة ماء الشرب ضرورة من ضروريات الحياة فلابد من الاهتمام بهذا الجانب .
ان احواض الترسيب والتخثير باستعمال المخثرات المختلفة احد طرق معالجة مياه الانهار ,وتعتبر كبريتات الالمنيوم المائية (الشب) , كبريتات الحديدوز , كلوريد الحديديك اكثرها شيوعا من هنا جاءت
فكرة البحث هذا بايجاد افضل مخثر من هذه المخثرات السابقة والتي تعطي اعلى نسبة ازالة وكذلك قادرة على ازالة ايوني النترات والنتريت من ماء النهر .
والعكارة والنترات والنتريت قبل pHتناول الجانب العملي جمع عينات من نهر دجلة واجراء فحص المعالجة وبعد المعالجة بهذه المخثرات ( كبريتات الالمنيوم المائية (الشب) , كبريتات الحديدوز ,
) . jar testكلوريد الحديديك) ومن خلال اجراء فحص (
توصلنا من خلال هذه الدراسة بان كبريتات الحديدوز افضل مادة مخثرة يليها الشب فكلوريد الحديديك في ازالة العكارة من ماء النهر , ورغم ان كلوريد الحديديك اقل مادة بتخثيرالعكارة ولكنه افضل مخثر
مع مرور pHلازالة النترات والنتريت يليه الشب فكبريتات الحديدوز , كما لوحظ انخفاض بقيمة الزمن مما وفر اجواء للتفاعل وكذلك زيادة في ازالة ايون النتريت نتيجة ارتفاع لدرجات الحرارة كما
. وقلت العكارة مع الزمن نتيجة لسرعة جريان النهر ربيعا

Abstract
UAbstrac Ut Water the grace of God over creation as provided us with the Tigris and the Euphrates, which tells its territory and is known for these rivers they purify themselves, but human intervention through the activities of industrial, agricultural, and that left many of the waste thrown Without knowledge into this river one of the causes of pollution, and therefore considered treatment plants drinking water need of the necessities of life must be attention to this aspect. The basins of sedimentation and coagulation using different coagulant one ways of addressing the rivers, and is aluminum sulfate (alum), ferrous sulfate, ferric chloride most commonly from here came the idea of this search to find a better rennet from this coagulant the former, which gives a higher percentage of removal, as well as able to remove Ionic nitrate and nitrite from the water of river. Address the practical side of collecting samples from the Tigris River and an examination of pH and turbidity, nitrate and nitrite before treatment and
after treatment in this coagulant aluminum sulfate (alum), ferrous sulfate, ferric chloride) and through an examination of (jar test). Reached
through this study that the ferrous sulfate best material coagulant followed by alum and ferric chloride in the removal of turbidity of water river, although the ferric chloride is less material coagulate the turbidity but the best coagulant for the removal of nitrate and nitrite, followed by alum ferrous sulfate, as noted a decrease of pH with the passage of time, providing suitable condition for interaction, as well as an increase in the removal of nitrite ion as a result of high temperature and turbidity, and I said with time
due to the rapid flow of the river year-old.

1
Chapter one: Introduction
Chapter one Introduction
U1.1 Introduction U
The removal of suspended matter from water is one of the
major goals of water treatment. Only disinfection is used more often or considered more important. In fact, effective clarification is really necessary for completely reliable disinfection because microorganisms are shielded by particles in the water. Clarification usually involves: • Coagulation • Flocculation • settling • Filtration This guide focuses on coagulation and flocculation: the two key steps which often determine finished water quality. Coagulation control techniques have advanced slowly. Many plant operators remember when dosage control was based upon a visual evaluation of the flocculation basin and the clarifier. If the operator’s eyeball evaluation found deterioration in quality, then his common sense response was to increase the coagulant dose. This remedy was based upon the assumption that if a little did some good, then more ought to do better, but it often did worse. The competency of a plant operator depended on his years of experience with that specific water supply. By trial, error and oral tradition, he would eventually encounter every type of problem and learn to deal with it. Reliable instruments now help us understand and control the clarification process. Our ability to measure turbidity, particle count, zeta potential and streaming current makes coagulation and flocculation more of a science, although art and experience still have their place. We make zeta meters and happen to be a little biased in favor of zeta potential. In this guide, however, we have attempted to give you a fair picture of all of the tools at your disposal, and how you can put them to work.

2
Chapter one: Introduction
U1.2 water pollution Water pollution is one of the major environmental of our time : it is came about due to the industrial and urban growth over few decades the water body is polluted when containing an excessive amount of specific pollution which affects the quality of water body : than are dissolved or lie suspended in water whereby the quality of the water deteriorates , affecting aquatic ecosystems , and they cannot survive if their water load is loaded with toxic chemicals or harmful microorganisms (Hammer 1992) The pollutants generally fall into two categories: nature and man-made. The first one (nature pollutants) includes water contaminants such as minerals (salts) and heavy metals and the second (man-made pollutants) is introduced into water sources by manufacturing plants, poor waste and disposal management, air pollution . Most often these pollutants are nutrients, sediment, pathogens, toxic metals, carcinogens, oxygen demanding materials. U1.2.1 Types of water pollution The major water pollutants are physical, chemical, biological and physiological materials that degrade water quality due to improper human actives produced because of the discharge of industrial and domestics’ wastewater into stream, so the pollution could concern public health (Klein 1957). These types are as follow:
1. Physical pollution, which causes change in the watercolor, turbidity, temperature, suspended solids, foam and radioactivity. 2. Chemical pollution caused by organic and inorganic chemicals and resulting in the change of pH value that increases toxicity by heavy metals and other toxic materials. 3. Physiological pollution is caused by several substances, particularly hydrogen sulfide and results in the change of taste and odor. 4. Biological pollution, caused by viruses, bacteria, protozoa, algae and helminthes.
U 1.2.2 Sources of water pollution Water pollution in water body (rivers, lakes, and reservoirs) may come from non-point or point sources (Velz 1970 and Mitsch 1993)

3
Chapter one: Introduction
U1.3-object of this study In this study collect two sample from Tiger river every two month (mid February, March, mid March, April, mid April) in clean bottle, NOR3,R NOR2.R. Is tested in laboratory, in another hand used three coagulate (Alum, Ferric Sulfate, and Ferrous chloride) to study the best coagulate and the best dose can reduce effluence of this element from raw water through jar test.
4 Chapter two: Literature Review
Chapter tow
Literature Review
U2.1- Introduction
One of the most important aspects related to sitting, planning,
design, operation and long-term management of Municipal Solid Waste (MSW) landfill is the management of leachate. Leachate from MSW landfill sites are often characterized as heavily polluted wastewater. Leachate is a complex organic liquid formed primarily by the percolation of precipitation water through open landfill or through the cap of the completed site (Senior, 1995). Leachate may contain large amount of organic contaminants which can be measured as chemical oxygen demand (COD) and biological oxygen demand (BOD), ammonia, halogenated hydrocarbons, suspended solid, significant concentration of heavy metals and inorganic salts (Trebouet et al., 2000; Bagchi, 1990). If it was not treated and safely disposed, landfill leachate could be a potential source of surface and groundwater contamination, as it may percolate through soils and sub soils, causing pollution to receiving waters (Tatsi et al., 2003).
The specific composition of leachate influences its relative treatability and depends to a large extent on the contamination to be removed (Kreith, 1994). In general, the treatment of landfill leachate often involves a combination of various techniques. Several processes derived from water and wastewater treatment have been applied for the treatment of leachate. These include aerobic and anaerobic biological treatments, photo-oxidation and membrane processes, chemical oxidation and precipitation, activated carbon and adsorption and coagulation-flocculation (Trebouet et al., 2001; Marttinen et al., 2002; Wang et al., 2002; Enzminger et al., 1987; Lisk, 1991). Biological processes are quite effective for younger leachates (containing mainly volatile fatty acids), but less efficient for the treatment of stabilized leachate (Amokrane et al., 1997; Wang et al., 2002). However, leachate with low organic content is best treated with physical/chemical process (Baghi, 1990). Chemical precipitation using lime indicated that between 70 and 90% removal of color, turbidity,

5 Chapter two: Literature Review
suspended matter and dispersed oil could be achieved (Amokrane et al., 1997). Therefore, a combination of physical-chemical and biological methods is often required for the efficient treatment of leachate (Rautenbach & Millis, 1994). Now this waste water removal in the rivers and anther sours water.
U2.2-Coagulation and flocculation
Coagulation and flocculation is widely used in water and wastewater treatment and these techniques form an important step in the treatment process (Muhammad et al., 1998; Amokrane et al., 1997; AWWA, 1971). Coagulation process is effective for removing high concentration organic pollutants (Wang et al., 2002), heavy metals and some anions (Kreith, 1994). Aluminum and iron coagulants have been widely used as coagulants for the removal of humic substances from water (Lu et al., 1999; Wang et al., 2002; Amokrane et al., 1997; Koether et al., 1997; Ching et al., 1994). Chemical coagulants can destabilize colloidal particles by four distinct mechanisms: double layer compression; charge neutralization; enmeshment in a precipitate and inter-particle bridging (Al-Malack et al., 1999). Different coagulants provide different degrees of destabilization. The higher the valence of the counter-ion, the more will the destabilizing effect and the less amount of dose required for coagulation. Studies on the coagulation-flocculation processes for the treatment of landfill leachate have been reported by a few researchers (Sletten et al., 1995; Ehrig, 1984; Amokrane et al., 1997; Diamadopoulos, 1994). Alum, ferrous sulphate, ferric chloro-sulphate and ferric chloride were commonly used (Ehrig, 1984; Amokrane et al., 1997). Amokrane et al. (1997) reported that iron salts seem to be more efficient than aluminum. They reported that the addition of flocculants together with coagulants may enhance the flocs-settling rate. Additionally they reported that nonionic, cationic or anionic polyelectrolyte could be used as coagulant aids to increase flocs settling rate, without really improving the turbidity removal efficiency. However, limited information exists on the efficiency of the coagulation-flocculation process, when applied for the removal of suspended solids, colour and COD from semi-aerobic landfill leachate. A semi-aerobic landfill is a system where semi-aerobic condition is maintained in the waste body through a convection process. It involves the

6 Chapter two: Literature Review
decomposition of organic matter inside the landfill and causes an increase in temperature. The difference in temperature between the inside and outside of the landfill generates a heat convection current in the landfill through the leachate pipe (Aziz et al., 2004). It was found that the leachate from semi-aerobic system has slightly lower organic contaminants compared with an anaerobic landfill in terms of BOD, COD, and other constituents (Basri et al., 2000; Aziz et al., 2004). This study focuses on the leachate generated from Pulau Burung Landfill Site (PBLS); which is situated within Byram Forest Reserve at 5° 24’ N, 100° 24’ E in Penang, Malaysia. The total area of the landfill is 23.7 ha and equipped with a leachate collection pond but without other treatments.
This site is contained by a natural marine clay liner. PBLS has a semi-aerobic system and it is one of the only three sites of its kind found in Malaysia. PBLS has been developed as a sanitary landfill Level II by establishing a controlled tipping technique in 1991. It was further upgraded to a sanitary landfill level III by employing controlled tipping with leachate recirculation in 2001. This site receives 1,500 tons of solid waste daily (Aziz et al., 2004).
U2.3- coagulant
Ferric chloride is not new to the drinking water treatment industry and has been commercially available in the United States since the1930’s. However, it has only been in the past 15 years that a trend towards increased acceptance of ferric chloride for drinking water treatment has evolved. This is due in large part to significant improvements in product economics, quality and availability. Since 1986 there has been a ground swell in interest in ferric chloride not only for the treatment of turbidity but additionally for the removal of color, natural organic materials and arsenic from raw waters. California Water Technologies has been instrumental in helping Water Treatment Plants understand the extensive capabilities of this coagulant. Ferric chloride is an interesting compound. It is produced as a solution from the oxidation of ferrous chloride with chlorine and it has the unusual distinction of being one of the purest and most concentrated forms of iron commercially available for water treatment. However, what is truly unusual is its chemistry is that ferric chloride not only functions as a reactant to
7 Chapter two: Literature Review
remove water impurities but it also functions as both a coagulant and a flocculant. Its versatility is enormous. The reactions of ferric chloride in water include an ability to form precipitates with hydrogen sulfide (H2S), phosphate (PO4), arsenic as arsenate (AsO4) and hydroxide alkalinity (OH). In drinking water treatment, however, understanding ferric chloride’s reaction with hydroxide alkalinity is the primary key to understanding its effectiveness as a coagulant/flocculent. Ferric chloride reacts in water with hydroxide alkalinity to form various hydrolysis products that incorporate Fe (OH)R3R. These compounds possess high cationic charge which allows them to neutralize the electrostatic charges found on colloidal compounds and also to bind to negatively charged particles, including the ferric hydroxide itself. This ability to bind to itself is the mechanism for the formation of floc aggregates and the basis for ferric chloride’s flocculation abilities. The hydrolysis products from ferric chloride, nominally ferric hydroxide, are different from those of sulfate based ferric sulfate and aluminum sulfate (alum). The aggregates or floc particles of ferric hydroxide are physically more discrete and dense and have a higher cationic charge density. In contrast, the floc aggregates of ferric sulfate and aluminum sulfate tend to be less discrete and “fluffy” or cloud like, this apparently due to differences in the types of bonding of the hydrolysis products. These differences translate into characteristics and abilities for ferric chloride that set it far apart from the sulfate based coagulants. In typical plant situations one can expect to use about 30% less ferric chloride than aluminum sulfate (on a dry weight basis) to achieve similar results. Ferric Chloride forms a more discrete and dense floc that promotes faster sedimentation in general and specifically, better sedimentation in cold water. This dense floc has more available cationic charge that allows higher reactivity with colloidal solids. The high ratio of cationic charge to total mass also makes the ferric chloride hydrolysis products more reactive and adsorptive with emulsified and semi-emulsified organic matter; such as oils, fats, and other natural and synthetic organic matter. This would explain the ability of ferric chloride to remove TOC and other disinfection by product precursors (DBP’s). The high density of the ferric hydroxide floc leads to another important benefit for the treatment plant. The settled sludge volume of the ferric (chloride) hydroxide ranges typically from 1/3 to 2/3 that of sulfate based coagulants. Additionally, the sludge developed through the use of ferric chloride is generally much more

8 Chapter two: Literature Review
dewater able. So, although the ferric hydroxide molecule itself is heavier than the aluminum hydroxide molecule, this does not translate into more sludge to be disposed of. Instead, because sludge is disposed of on a wet basis rather than on a dry basis, the use of ferric chloride produces fewer wet tons of sludge and yields significant solids handling and disposal savings. One of the other characteristics of ferric chloride is its ability to form floc over a very wide pH range as is demonstrated in the accompanying charts. The charts also show the very low solubility of ferric hydroxide compared to aluminum hydroxide. The combination of these properties allow ferric chloride to function over a very wide pH range with little fear of carry over into downstream processes due to post precipitation. This ends up being very important for operations looking to flocculate at higher pH and alkalinity’s while controlling corrosively factors in the water. Additionally, the low end of the pH range becomes especially important to enhanced coagulation processes. Although there is little formal data regarding the use of ferric chloride as a filtration aid there is much operational data that speaks to its ability to greatly enhance turbidity removal with both slow and rapid sand filter filtration. Additionally there are more recent reports that speak to the use of iron coated sand in the removal of manganese. 1. Potable Water Treatment Applications 2. Turbidity removal 3. Enhanced Coagulation 4. NOM, DBP precursor removal 5. Color removal 6. Arsenic reduction 7. Softening Solids Sedimentation Aid 8. Filtration Aid Four coagulation chemicals and one coagulant aid are commonly used in water treatment plants. Selection of the right chemical depends on which coagulation method is used the coagulant is usually a metal salt, which reacts with alkalinity in the water to produce an insoluble metal hydroxide floc, which incorporates the colloidal particles. This fine precipitate is then flocculated to produce settable solids. Coagulants are usually added as a concentrated solution, which can be dosed accurately using a positive
9 Chapter two: Literature Review
displacement-metering pump. (Tebbutt, 1998) Aluminum sulfate AlR2R(SOR4R).14HR2RO , ferric chloride FeClR3 R, ferric sulfate FeR2R(SOR4R)R3R and polyaluminum chloride are the primary chemicals used to treat drinking water. Powdered activated carbon (PAC), a coagulant aid, can be used in coagulation cells to enhance the removal of taste and odors compounds,
and remove some organic carbon.

10 Chapter three: Theory
Chapter three
Theory
U3.1-Introduction
Coagulation is the formation process of clot by means of a
coagulant reaction in contact with water. Coagulation objective is to transform impurities such as fine colloidal suspension, suspended solids and microorganisms, in bigger particles called flocks, which can be removed by sedimentation, flotation and/or filtration adsorption. The parameters that determine an efficient coagulation are pH, kind of coagulant, rapid mix of coagulant, water temperature, zeta Coagulation is the formation process of clot by means of a coagulant reaction in contact with water. Coagulation objective is to transform impurities such as fine colloidal suspension, suspended solids and microorganisms, in bigger particles called flocks, which can be removed by sedimentation, flotation and/or filtrationadsorption. The parameters that determine an efficient coagulation are pH, kind of coagulant, rapid mix of coagulant, water temperature, zeta
U3.2-Coagulation Coagulation is the electrochemical process of aggregating small particles into larger particles or "floes” that settle more rapidly that individual particles due to their increased weight. It is also the most common first step in water treatment prior to treatment where by the removal of impure particulates can be achieved. In the process, coagulants are added to turbid water in order to destabilize particles and reduce antiparticle repulsion force. Destabilization increases the tendency of particles to coalesce on contact, resulting in heavier agglomerated particles and then settle out of solution (Degremont 1991).
Coagulation is accomplished by the addition of ions having the opposite change to that of the colloidal particles. Since the colloidal particles are charged negatively usually, the added ions should be cations or positively charged. The coagulating power of an ion is dependent on its valency or magnitude of charge (Amirtharajah and O milia 1990)

11 Chapter three: Theory
U3.3-Alum and ferric sulphate comparison Many laboratory studies of cultured anabaena floc aquae in jar tests that were conducted with alum and ferric Sulphate at PH 6.0, William et al (1986), Briley, and Knappe (1998) found that alum and ferric Sulphate produced similar levels f turbidity.howver, on a molar basis, ferric Sulphate required a higher dose to achieve a given streaming current value then alum, indicating that charge neutralization was more effectively accnplished with alum hydrolysis products. U3.4-Alum and ferric chloride comparisonU Cheal and Field (1980) evaluated in a bench scale, jar test experiments four coagulants, AlR2R(SOR4R).14HR2RO, ferric chloride FeCl3R R, ferric sulfate FeR2R(SOR4R)R3R , and two cationic inorganic coagulant were ineffective at destabilizing the sediment suspension and initiating floc formation in the relatively short rapid mixing period . As a result, conversely ferric chloride FeCl3 performed well, exhibiting rapid floc formation and good solids settling characteristics and the optimum dosage for ferric chloride FeCl3, based on sediment and metals removal, was 15 mg/L as Fe while kim (2000) performed on locally available alum from Nepal, alum and ferric chloride from the united states؛ Hadi (1990) and Feryad (2003) (alum and ferric chloride). They found through comparison to all coagulants studied that Fe Cl3 requires the least amount of dosage to achieve the greatest amount of turbidity removal as well as comparable amounts of dosage show greater PH drops in FeCl3 treated waters that in alum treated waters. U3.5-Flocculent Degremont (1991), defind flocculation as the agglomeration of destabilized particles into microfloc, and later into bulky floccules, which can be settled, called floc. Tchobanoglous and Schroeder (1985), stated that particles would gradually aggregate through per kinetic flocculation brought about by Brownian motion, but the process is very slow. The rate can be greatly enhanced by providing velocity gradients that bring about orthogenetic
flocculation. Kiely (1997), suggested detention times of 20 to 60 min are now

12 Chapter three: Theory
required to encourage the microfloc (pin floc) to agglomerate and produce larger flocs, therefore; the flocculation basin is about 50 times larger than the rapid mixing unit. Gentle agitation is required in this unit to promote thorough mixing. However, mixing should not be so strong as to cause breakup of the weak influent microfloc. In practice, Schemidtke (1983), illustrated variables such as the characteristics of particular water, the coagulant used, pH, and temperature as important factors that affect on the
flocculation.
U3.6-Particle Charge Prevents Coagulation The key to effective coagulation and flocculation is an understanding of how individual colloids interact with each other. Turbidity particles range from about .01 to 100 microns in size. The larger fraction is relatively easy to settle or filter. The smaller, colloidal fraction, (from .01 to 5 microns), presents the real challenge. Their settling times are intolerably slow and they easily escape filtration. The behavior of colloids in water is strongly influenced by their electro kinetic charge. Each colloidal particle carries a like charge, which in nature is usually negative. This like charge causes adjacent particles to repel each other and prevents effective agglomeration and flocculation. As a result, charged colloids tend to remain discrete, dispersed, and in suspension. On the other hand, if the charge is significantly reduced or eliminated, then the colloids will gather together. First forming small groups, then larger aggregates and finally into visible floc particles which settle rapidly and filter easily. U3.7-Microscopic Electrical Force the Double Layer
The double layer model is used and explains how electrical to visualizethe ionic environment in the vicinity of a charged colloid repulsive forces occur. It is easier to understand this model as a sequence of steps that would take place around a single negative colloid if the ions surrounding it were suddenly stripped away. We first look at the effect of the colloid on the positive ions, which are often called counter-ions. Initially, attraction from the negative colloid causes some of the positive ions to form a firmly attached layer around the surface of the colloid. This layer of counter-ions is known as the Stern layer. Additional positive ions are still attracted by the negative colloid but now they are repelled by the positive Stern layer as well as by other nearby positive ions that are also trying to approach the colloid. A dynamic equilibrium results, forming a diffuse layer of counter-ions. The diffuse positive ion layer has a high
13 Chapter three: Theory
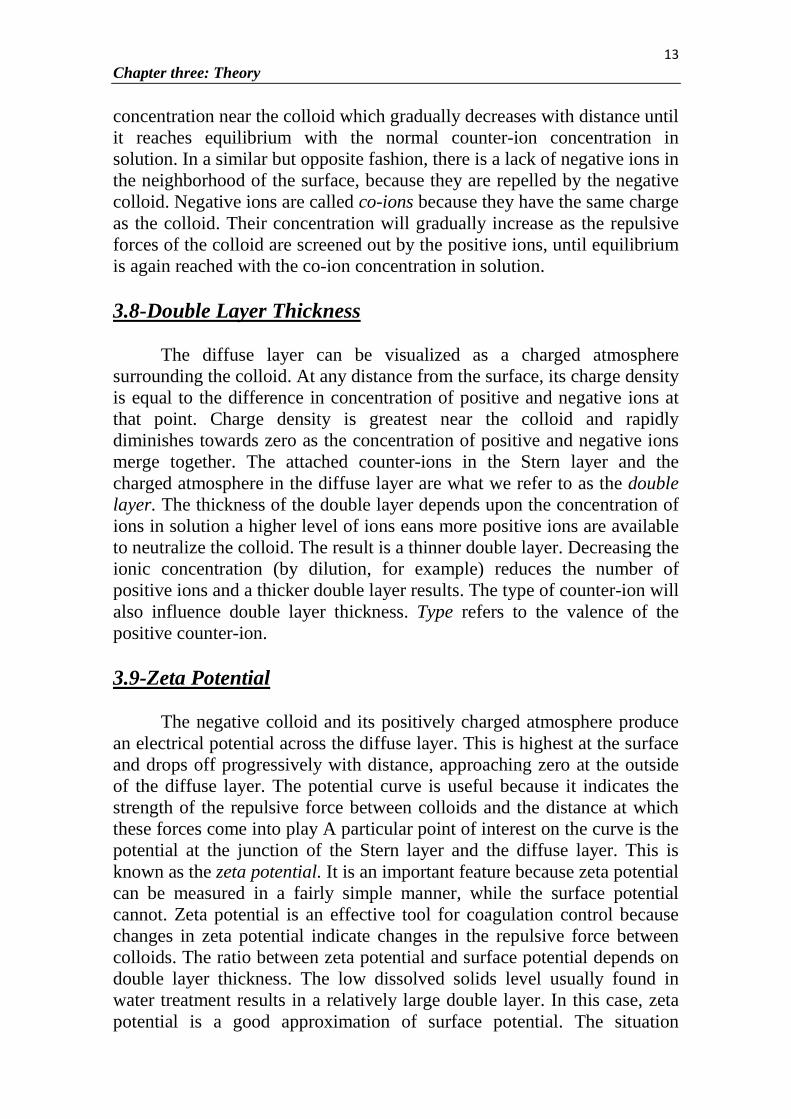
concentration near the colloid which gradually decreases with distance until it reaches equilibrium with the normal counter-ion concentration in solution. In a similar but opposite fashion, there is a lack of negative ions in the neighborhood of the surface, because they are repelled by the negative colloid. Negative ions are called co-ions because they have the same charge as the colloid. Their concentration will gradually increase as the repulsive forces of the colloid are screened out by the positive ions, until equilibrium is again reached with the co-ion concentration in solution. U3.8-Double Layer Thickness
The diffuse layer can be visualized as a charged atmosphere surrounding the colloid. At any distance from the surface, its charge density is equal to the difference in concentration of positive and negative ions at that point. Charge density is greatest near the colloid and rapidly diminishes towards zero as the concentration of positive and negative ions merge together. The attached counter-ions in the Stern layer and the charged atmosphere in the diffuse layer are what we refer to as the double layer. The thickness of the double layer depends upon the concentration of ions in solution a higher level of ions eans more positive ions are available to neutralize the colloid. The result is a thinner double layer. Decreasing the ionic concentration (by dilution, for example) reduces the number of positive ions and a thicker double layer results. The type of counter-ion will also influence double layer thickness. Type refers to the valence of the positive counter-ion. U3.9-Zeta Potential
The negative colloid and its positively charged atmosphere produce an electrical potential across the diffuse layer. This is highest at the surface and drops off progressively with distance, approaching zero at the outside of the diffuse layer. The potential curve is useful because it indicates the strength of the repulsive force between colloids and the distance at which these forces come into play A particular point of interest on the curve is the potential at the junction of the Stern layer and the diffuse layer. This is known as the zeta potential. It is an important feature because zeta potential can be measured in a fairly simple manner, while the surface potential cannot. Zeta potential is an effective tool for coagulation control because changes in zeta potential indicate changes in the repulsive force between colloids. The ratio between zeta potential and surface potential depends on double layer thickness. The low dissolved solids level usually found in water treatment results in a relatively large double layer. In this case, zeta potential is a good approximation of surface potential. The situation

14 Chapter three: Theory
changes with brackish or saline waters; the high level of ions compresses the double layer and the potential curve. Now the zeta potential is only a fraction of the surface potential. U3.10-Zeta Potential vs. Surface Potential
The relationship between Zeta Potential and Surface Potential depends on the level of ions in solution. In fresh water, the large double layer makes the zeta potential a good approximation of the surface potential. This does not hold true for saline waters due to double layer compression. U3.11- Balancing Opposing Forces
The DLVO Theory (named after Derjaguin, Landau, Verwery and Overbook) is the classic explanation of how particles interact .It looks at the balance between two opposing forces - electrostatic repulsion and Vander Waals attraction - to explain why some colloids agglomerate and flocculate while others will not. U3.12-Repulsion
Electrostatic repulsion becomes significant when two particles approach each other and their electrical double layers begin to overlap. Energy is required to overcome this repulsion and force the particles together. The level of energy required increases dramatically as the particles are driven closer and closer together. An electrostatic repulsion curve is used to indicate the energy that must be overcome if the particles are to be forced together. The maximum height of the curve is related to the surface potential. U3.13-Attraction
Vander Waals attraction between two colloids is actually the result of forces between individual molecules in each colloid. The effect is additive; that is, one molecule of the first colloid has a Vander Waals attraction to each molecule in the second colloid. This is repeated for each molecule in the first colloid and the total force is the sum of all of these. An attractive energy curve is used to indicate the variation in attractive force with distance between particles.

15 Chapter three: Theory
U3.14- The Energy Barrier
The DLVO theory combines the van der Waals attraction curve and the electrostatic repulsion curve to explain the tendency of colloids to either remain discrete or to flocculate. The combined curve is called the net interaction energy. At each distance the smaller energy is subtracted from the larger to get the net interaction energy. The net value is then plotted - above if repulsive, below if attractive – and the curve is formed. The net interaction curve can shift from attraction to repulsion and back to attraction with increasing distance between particles. If there is a repulsive section, then this region is called the energy barrier and its maximum height indicates how resistant the system is to effective coagulation. In order to agglomerate, two particles on a collision course must have sufficient kinetic energy (due to their speed and mass) to jump over this barrier. Once the energy barrier is cleared, the net interaction energy is all attractive. No further repulsive areas are encountered and as a result the particles agglomerate. This attractive region is often referred to as an energy trap since the colloids can be considered to be trapped together by the van der Waals forces. U3.15-Lowering the Energy Barrier
For really effective coagulation, the energy barrier should be lowered or completely removed so that the net interaction is always attractive. This can be accomplished by either compressing the double layer or reducing the surface charge. U3.16-Compress the Double Layer
Double layer compression involves adding salts to the system. As the ionic concentration increases, the double layer and the repulsion energy curves are compressed until there is no longer an energy barrier. Particle agglomeration occurs rapidly under these conditions because the colloids can just about fall into the van der Waals “trap” without having to surmount an energy barrier. Flocculation by double layer compression is also called salting out the colloid. Adding massive amounts of salt is an impractical technique for water treatment, but the underlying concept should be understood, and has application toward wastewater flocculation in brackish waters.

16 Chapter three: Theory
U3.17-Lower the Surface Charge
In water treatment, we lower the energy barrier by adding coagulants
to reduce the surface charge and, consequently, the zeta potential. Two points are important here.First, for all practical purposes, zeta potential is a direct measure of the surface charge and we can use zeta potential measurements to control charge neutralization. Second, it is not necessary to reduce the charge to zero. Our goal is to lower the energy barrier to the point where the particle velocity from mixing allows the colloids to overwhelm it. The energy barrier concept helps explain why larger particles will sometimes flocculate while smaller ones in the same suspension escape. At identical velocities the larger particles have a greater mass and therefore more energy to get them over the barrier. U3.18-Coagulate, and then Flocculate
In water clarification, the terms coagulation and flocculation are sometimes used interchangeably and ambiguously, but it is better to separate the two in terms of function. Coagulation takes place when the DLVO energy barrier is effectively eliminated; this lowering of the energy barrier is also referred to as destabilization.
Flocculation refers to the successful collisions that occur when the destabilized particles are driven toward each other by the hydraulic shear forces in the rapid mix and flocculation basins. Agglomerates of a few colloids then quickly bridge together to form micro flocs which in turn gather into visible floc masses.
Reality is somewhere in between the line between coagulation and flocculation is often a somewhat blurry one. Most coagulants can perform both functions at once. Their primary job is charge neutralization but they often adsorb onto more than one colloid, forming a bridge between them and helping them to flocculate. Coagulation and flocculation can be caused by any of the following: • Double layer compression • charge neutralization • bridging • Colloid entrapment U3.19-Four Ways to Flocculate
In the pages that follow, each of these four tools is discussed separately, but the solution to any specific coagulation-flocculation
17 Chapter three: Theory
problem will almost always involve the simultaneous use of more than one of these. Use these as a check list when planning a testing program to select an efficient and economical coagulant system. U3.19.1-Double Layer Compression
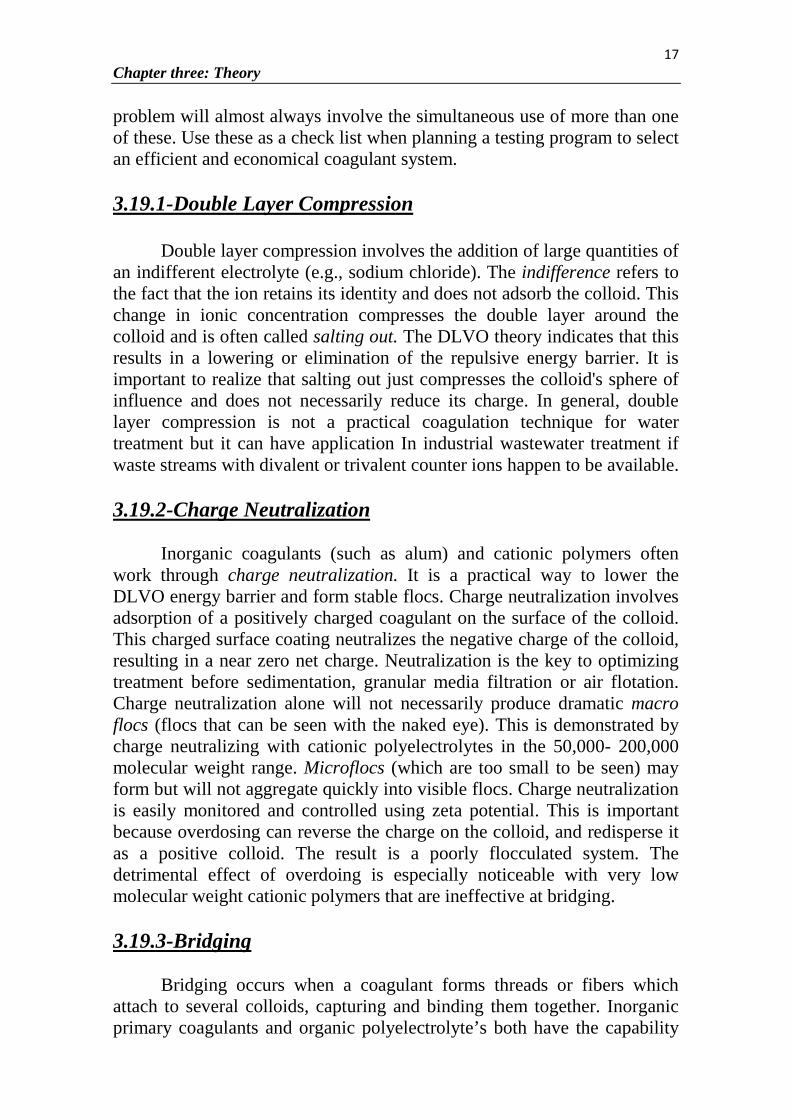
Double layer compression involves the addition of large quantities of an indifferent electrolyte (e.g., sodium chloride). The indifference refers to the fact that the ion retains its identity and does not adsorb the colloid. This change in ionic concentration compresses the double layer around the colloid and is often called salting out. The DLVO theory indicates that this results in a lowering or elimination of the repulsive energy barrier. It is important to realize that salting out just compresses the colloid's sphere of influence and does not necessarily reduce its charge. In general, double layer compression is not a practical coagulation technique for water treatment but it can have application In industrial wastewater treatment if waste streams with divalent or trivalent counter ions happen to be available. U3.19.2-Charge Neutralization
Inorganic coagulants (such as alum) and cationic polymers often work through charge neutralization. It is a practical way to lower the DLVO energy barrier and form stable flocs. Charge neutralization involves adsorption of a positively charged coagulant on the surface of the colloid. This charged surface coating neutralizes the negative charge of the colloid, resulting in a near zero net charge. Neutralization is the key to optimizing treatment before sedimentation, granular media filtration or air flotation. Charge neutralization alone will not necessarily produce dramatic macro flocs (flocs that can be seen with the naked eye). This is demonstrated by charge neutralizing with cationic polyelectrolytes in the 50,000- 200,000 molecular weight range. Microflocs (which are too small to be seen) may form but will not aggregate quickly into visible flocs. Charge neutralization is easily monitored and controlled using zeta potential. This is important because overdosing can reverse the charge on the colloid, and redisperse it as a positive colloid. The result is a poorly flocculated system. The detrimental effect of overdoing is especially noticeable with very low molecular weight cationic polymers that are ineffective at bridging. U3.19.3-Bridging
Bridging occurs when a coagulant forms threads or fibers which attach to several colloids, capturing and binding them together. Inorganic primary coagulants and organic polyelectrolyte’s both have the capability

18 Chapter three: Theory
of bridging. Higher molecular weights mean longer molecules and more effective bridging. Bridging is often used in conjunction with charge neutralization to grow fast settling and/or shear resistant flocs. For instance, alum or a low molecular weight cationic polymer is first added under rapid mixing conditions to lower the charge and allow microflocs to form. Then a slight amount of high molecular weight polymer, often an anionic, can be added to bridge between the microflocs. The fact that the bridging polymer is negatively charged is not significant because the small colloids have already been captured as microflocs. U3.19.4-Colloid Entrapment
Colloid entrapment involves adding relatively large doses of coagulants, usually aluminum or iron salts which precipitate as hydrous metal oxides. The amount of coagulant used is far in excess of the amount needed to neutralize the charge on the colloid. Some charge neutralization may occur but most of the colloids are literally swept from the bulk of the water by becoming enmeshed in the settling hydrous oxide floc. This mechanism is often called sweep floc. U3.20-Time Tested Coagulants
Aluminum and ferric compounds are the traditional coagulants for water and wastewater treatment. Both are from family called metal coagulants, and both are still widely used today. In fact, many plants use one of these exclusively, and have no provision for polyelectrolyte addition. Metal coagulants offer the advantage of low cost per pound. In addition, selection of the optimum coagulant is simple, since only a few choices are available. A distinct disadvantage is the large sludge volume produced, since sludge dewatering and disposal can be difficult and expensive. Aluminum and ferric coagulants are soluble salts. They are added in solution form and react with alkalinity in the water to form insoluble hydrous oxides that coagulate by sweep floc and charge neutralization. Metal coagulants always equine attention to pH conditions and consideration of the alkalinity level in the raw and treated water. Reasonable dosage levels will frequently result in near optimum pH conditions. At other times, chemicals such as lime, soda ash or sodium bicarbonate must be added to supplement natural alkalinity. U3.21-Tools for Dosage Control Jar Test an Undervalued Tool
We usually associate the jar test with a tedious dosage control tool that seems to take an agonizingly long time to set up, run and then clean up

19 Chapter three: Theory
after. As a result the true versatility of the humble jar test is often overlooked. The following applications for jar testing may be more important than its use in routine dosage control. It is studies such as these where the jar test has its major value, since the results are worth the time and effort to do the test properly: • Selection of primary coagulant • Comparison of coagulant aids • optimizing feed point for pH adjusting chemicals • mixing energy and mixing time studies (rapid mix and flocculation) • optimizing feed point for coagulant aids • evaluating dilution requirements for coagulants • estimating settling velocities for sedimentation basin sizing • studying effect of rapid changes in mixing energy • evaluating effect of sludge recycling U3.22- Jar Test Apparatus
Many commercial laboratory jar test units are in use today. The Phipps & Bird six place gang stirrer is very traditional. It has1" x 3" flat blade paddles and is usually used with 1.5 liter glass beakers. A disadvantage is the large vortex that forms at high stirring speeds. Some provision is usually made for drawing off a settled sample from below the water surface. Siphon type draw-offs are frequently used for glass beakers. Camp improved the Phipps & Bird design by using 2-liter glass beakers outfitted with vortex breaking stators. These were especially suitable for mixing studies because Camp developed curves for mixing intensity (G) versus stirrer speed using this design. Gator or Wagner jars are a relatively recent improvement and are square Plexiglas jars with a liquid volume of 2 liters. These are now commercially available, and have several advantages over traditional glass beakers. First, they are less fragile and allow for easy insertion of a sample tap, thus avoiding the need for a siphon type draw-off. Their square shape helps dampen rotational velocity without the need for stators while their Plexiglas walls offer much greater thermal insulation than glass, thus minimizing temperature change during testing

20 Chapter four: field work
Chapter four Field work
U4.1- Introduction U:
Included In this chapter, all fields work sampling, testing and all
table containing the result of this testing. U4.2- sampling Grab water samples were taken during (15-2-2011 to 15-4-2011) form point selected for each test as follow fig (4.1) show sampling water:
fig (4.1) show sampling water
U4.2.1-Raw Water samples
Tigris raw water samples were taken from AL- Qadisiya WTP intakes at Baghdad city. The grab water samples were brought to the laboratory in plastic containers, within a short time not exceeding one hour and kept in cold pace (4Cº ) for testing , pH the first test show in fig (4.2) , for jar test investigation and this tests bellow.
Fig (4.2): pH meter

21 Chapter four: field work
4.3- Turbidity Turbidity was determined in the laboratory with (portable Hanna
Instruments HI93703) Microprocessor turbidity meter, manufactured in type which can by calibrated with standard solution (10, 100, 1000)
4.4- Jar Tester
A Jar testes "Hjc Floc Tester _ Holzle and chelives Co. " Table,(4.1) was used to simulate coagulation and precipitation processes for raw water by using circular phastic jar show in fig (4-3). the jar tester is electrically operated , 220 volts , power supply , single phase , it has six positions of paddles , each paddle has single blade , having dimensions of 5.2 cm long and 1.6 cm depth , under each paddle is a bay allowing beaker
of one liter through the sample , admitting clear vision .
Table (4.1) Apparatus and Equipments
Type and Manufacture Apparatus Item Hanna Instruments HI93703
Microprocessor turbidity meter Manufactured in Singapore
Turbidity meter 1
PH and Temperature meter 2 Hjc Floc Tester _ Holzle and chelives Co Jar tester 3
Fig (4.3): jar test instrument

22 Chapter five: account and discussion
Chapter five Account and discussion
U5.1- introduction
In this chapter, interest with account of the result of the experimental
work and the result of all this tests show in tables bellow: Table (5-1), Results of the turbidity Removal by jar test after add
(Alum, FeCl3 and FeSO4)(15 February)
FeCl3 FeSO4 Alum D(Mg/l) 69.93 75.36 73.40 4 71.68 79.75 75.38 8 72.33 81.20 83.62 12 72.72 82.32 88.17 16 71.90 83.63 85.65 20 70.32 80.95 84.90 24
Table (5-2), Results of the (Alum, FeCl3 and FeSO4) Obtained of Conventional Jar Test through Table (1) (15 February)
NO3 NO2 pH Turbidity Sample Date 1190 6.8 8.1 110 R.W Before and
after add alum
867 4.6
7.8 13.9 F.R.W
1190 6.8
8.1 110 R.W Before and after add FeSO4 820 5.0
7.6 18 F.R.W
1190 6.8
8.1 110 R.W Before and after add
FeCl3 748 4.2
7.8 30 F.R.W
F.R.W: R.W after coagulation

23 Chapter five: account and discussion
Table (5-3), Results of the turbidity Removal by jar test after add (Alum, FeCl3 and FeSO4)(1-March)
FeCl3 FeSO4 Alum D(Mg/l) 64.31 79.65 55.69 4 72.60 80.88 65.85 8 74.32 82.40 71.08 12 78.46 85.90 74.90 16 73.77 87.84 75.38 20 64.41 86.70 74.30 24
Table (5-4), Results of the (Alum, FeCl3 and FeSO4) Obtained of Conventional Jar Test through Table (3) (1-March)
NO3
NO2 PH Turbidity Sample Date
875
9.9 8.1 95 R.W Before and after add
alum 697
8.2 7.8 23.39 F.R.W
875
9.9 8.1 95 R.W Before and after add FeSO4 673.4
8.2 7.7 11.55 F.R.W
875
9.9 8.1 95 R.W Before and after add
FeCl3 446
6.7 7.9 20.46 F.R.W
F.R.W : R.W after coagulation Table (5-5), Results of the turbidity Removal by jar test after add
(Alum, FeCl3 and FeSO4) (15-March) FeCl3 FeSO4 Alum D(Mg/l)
80.94 79.87 70.33 4
85.68 81.63 71.90 8 86.43 83.67 74.90 12
88.70 85.55 75.40 16
87.90 88.82 77.64 20
86.32 86.77 76.56 24

24 Chapter five: account and discussion
Table(5-6), Results of the (Alum , FeCl3 and FeSO4) Obtained of Conventional Jar Test through Table(5) (15-March)
NO3 NO2 pH turbidity Sample
Date
837 7.4 7.9 85 R.W
Before and after add
alum 500 6.2 7.8 19 F.R.W
837 7.4 7.9 85 R.W
Before and after add FeSO4 473.8 5.6 7.6 9.5 F.R.W
837 7.4 7.9 85 R.W
Before and after add
FeCl3 464 5.26 7.8 9.6 F.R.W
F.R.W: R.W after coagulation Table(5-7), Results of the turbidity Removal by jar test after add
(Alum ,FeCl3 and FeSO4)(1-April) FeCl3 FeSO4 Alum D(Mg/l) 71.42 64.66 75.39 4 76.46 69.30 78.63 8 78.62 70.48 80.67 12 78.62 74.21 81.22 16 80.00 76.66 84.44 20 75.34 75.10 81.34 24
Table(5-8), Results of the (Alum , FeCl3 and FeSO4) Obtained of Conventional Jar Test through Table(7) (1-April)
NO3
NO2 PH Turbidity Sample Date
885 8.3 8.1 57 R.W
Before and after add
alum 490 5.4 7.5 8.869 F.R.W
885 8.3 8.1 57 R.W
Before and after add FeSO4 734 7.2 7.7 13.30 F.R.W
885 8.3 8.1 57 R.W
Before and after add
FeCl3 624 6.35 7.8 11.4 F.R.W
F.R.W: R.W after coagulation

25 Chapter five: account and discussion
Table (5-9), Results of the turbidity Removal by jar test after add (Alum, FeCl3 and FeSO4) (15-April)
FeCl3 FeSO4 Alum D(Mg/l) 75.49 65.19 67.45 4 77.60 67.13 69.91 8 78.10 67.96 71.05 12 79.75 68.20 73.33 16 75.69 70.00 76.19 20 73.52 69.29 75.47 24
Table (5-10), Results of the (Alum, FeCl3 and FeSO4) Obtained of Conventional Jar Test through Table (9) (15-April)
NO3
NO2 PH Turbidity Sample Date
110 9.5 8.1 60 R.W
Before and after add
alum 84.3 8.37 7.9 14.28 F.R.W
110 9.5 8.1 60 R.W
Before and after add FeSO4 63.1 7.43 7.7 18
F.R.W
110 9.5 8.1 60 R.W
Before and after add
FeCl3 86 7.65 7.8
12.15 F.R.W
F.R.W: R.W after coagulation
U5.2- Discussion of this result U Accounts were discussed by the following graphs: In Figure (5-1), which shows the relationship between the proportion of removal rate and different models of mid-February found that the optimal dose at the removal rate of 88 is 16 mg / L when using alum as coagulant and rises to 20 mg / L ,of ferrous sulfate at the rate of removal of 84 and less than removal for up to 74% at a dose of 17 mg / L, and note from the table (5-2) that the pH value decreased when the use of all coagulants from 8.1 to reach the limits (6.7 to 8.7) and generated an suitable condition for chemical effective for coagulants interaction with suspended solids, causing low concentrations of nitrite The effect of nitrate and ferric chloride in removing these ions was great

26 Chapter five: account and discussion
Figure.(5-1), percentage of removal rate with different doses at samples one in1 (15/2)
We note that the results varied for the models (1/3) is viewed as ferrous sulfate best coagulant and the percentage removal of 87% at a dose of 22 mg / L, followed by ferric chloride and Alum. And through the table (5-4) found that ferric chloride the best coagulant in the removal of these ions followed
by alum.
Figure. (5-2), percentage of removal rate with different doses at samples two in (1/3)
50556065707580859095
0 10 20 30
Rem
oval
rate
%
Dose coagulant(mg/L)
FeCl3
FeSO4
Alum
50
55
60
65
70
75
80
85
90
95
0 10 20 30
Rem
oval
rate
%
Dose coagulant (mg/L)
FeCl3
FeSO4
Alum

27 Chapter five: account and discussion
In shape (5-3) the effect of ferric chloride and ferrous sulfate equal in the degree of removal in terms of doses 20 mg / liter ferrous sulfate 16 mg / l for ferric chloride
Figure. (5-3), percentage of removal rate with different doses at sample three in (15/3)
In the form (5-4) note the best dose of ferrous sulfate 20 mg / L is also for all coagulants that the removal rate for 81% ferric chloride and alum.
Figure. (5-4), percentage of removal rate with different doses at sample four in (1/4)
50
55
60
65
70
75
80
85
90
95
0 10 20 30
Rem
oval
rate
%
Dose coagulant (mg/L)
FeCl3
FeSO4
Alum
0
10
20
30
40
50
60
70
80
90
0102030
Rem
val r
ate%
Dose coagulant (mg/L)
Alum
FeSO4
FeCl3

28 Chapter five: account and discussion
By (5-6) (5-8) (5-10) we found that the ferric chloride best coagulant removal for ionic nitrate and nitrite, followed by alum and ferrous sulfate. Although most of the ferrous sulfate in the previous data was the best material and coagulant dose of 20 mg / L, followed by alum ferric chloride, and due to the low value pH to the lower limit for all months of the other cases coagulant
shown in Figure (5-6)
Figure. (5-5), percentage of removal rate with different doses at sample five in (15/4)
Figure (6) pH with different type and dose of coagulant at different time
Through Figure (7-5), which shows the relationship between turbidity and time note down the turbidity with the continuation of time caused by low suspended solids in raw water due
0
20
40
60
80
100
051015202530 Rem
oval
rate
%
Dose coagulant
Alum
FeSO4
FeCl3
7.4
7.5
7.6
7.7
7.8
7.9
8
8.1
8.2
06-Feb 26-Feb 18-Mar 07-Apr 27-Apr
pH
Time
R.W
alum
FeSO4
FeCl3
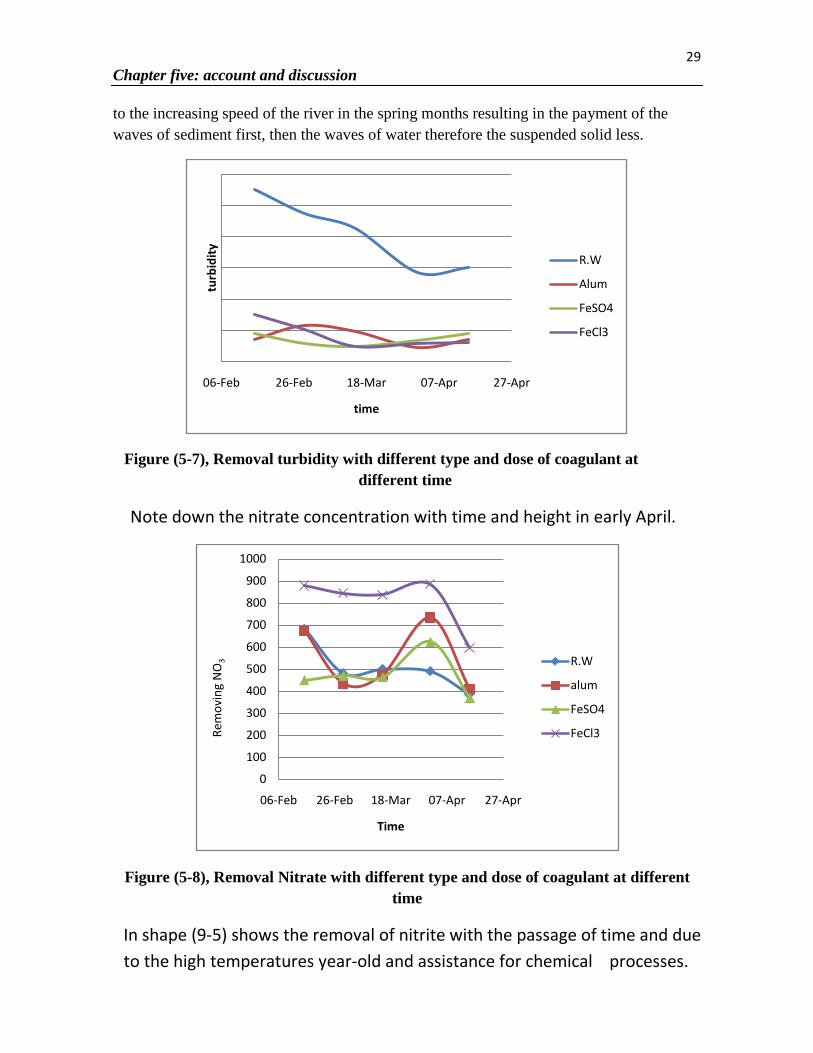
29 Chapter five: account and discussion to the increasing speed of the river in the spring months resulting in the payment of the waves of sediment first, then the waves of water therefore the suspended solid less.
Figure (5-7), Removal turbidity with different type and dose of coagulant at different time
Note down the nitrate concentration with time and height in early April.
Figure (5-8), Removal Nitrate with different type and dose of coagulant at different time
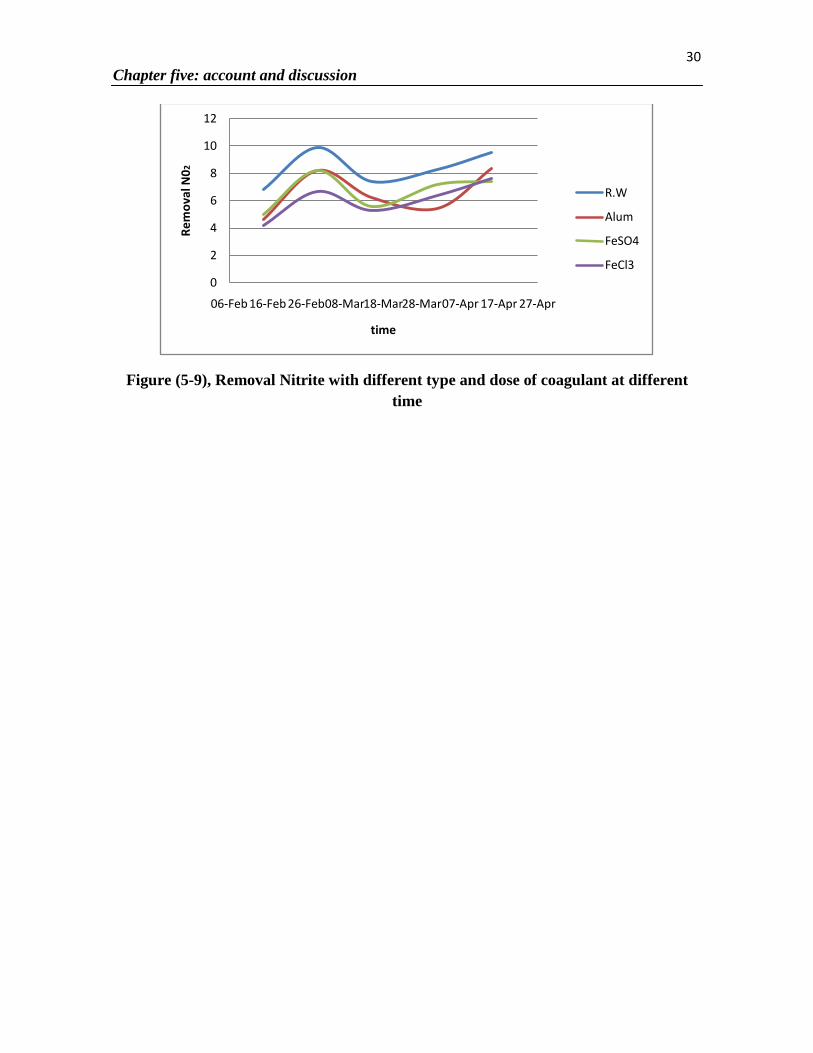
In shape (9-5) shows the removal of nitrite with the passage of time and due to the high temperatures year-old and assistance for chemical processes.
06-Feb 26-Feb 18-Mar 07-Apr 27-Apr
turb
idity
time
R.W
Alum
FeSO4
FeCl3
0
100
200
300
400
500
600
700
800
900
1000
06-Feb 26-Feb 18-Mar 07-Apr 27-Apr
Rem
ovin
g N
O3
Time
R.W
alum
FeSO4
FeCl3
30 Chapter five: account and discussion
Figure (5-9), Removal Nitrite with different type and dose of coagulant at different time
0
2
4
6
8
10
12
06-Feb 16-Feb 26-Feb08-Mar18-Mar28-Mar07-Apr 17-Apr 27-Apr
Rem
oval
N02
time
R.W
Alum
FeSO4
FeCl3

31
Conclusions
Chapter six Conclusion
6.1-Conclusions Here are some of the conclusions from this study: 1 - ferrous sulfate is the best coagulant in the removal of turbidity, followed by alum and ferric chloride. 2 - ferric chloride is the best coagulant to remove the ionic nitrate and nitrite 3 - lower the value of pH constantly study which shows that there is scope for interaction and a broad 4 - Increase in the removal of nitrite ion with time due to higher spring temperatures, which generates the suitable condition to a chemical reaction 5 - lower the value of the turbidity with time due to increased speed of runoff-year-old
32 Reference
32
UReferences 1. Amokrane A, Comel C. Landfill leachates pretreatment by coagulation flocculation. Water Res. 1997;31: 2775-82 2. AWWA. (1971) Water quality and treatment: A Handbook of PublicWater Supplies, 3 P
rdP Edition., McGraw-Hill, New York.
3. Rautenbach, R. & Mellis, R. (1994) Wastewater treatment by acombination of bioreactor and nanofiltration. Desalination, 95,
171-188.
4. Kreith F. (1994) Handbook of Solid Waste Management, McGraw-Hill, Inc.
5. Wang, Z.P., Zhang, Z., Lin, Y.J., Deng. N.S., Tao, T. & Zhuo, K. (2002) Landfill leachate treatment by a coagulation-photooxidation process. J. Hazardous Mater, 95 (1/2), 153-159. Lu X., Chen Z. & Yang X. (1999) Spectroscopic Study of Aluminum Speciation in Removing Humic Substances by Al Coagulation. Wat.Res., 33 (15), 3271-3280.
6. Marttinen, S.K., Kettunen, R.H., Sormunen, K.M., Soimasuo, R.M. & Rintala, J.A. (2002) Screening of physical-chemical methods for removal of organic material, nitrogen and toxicity from low strength landfill leachates. Chemosphere, 46, 851-858.
7. Trebouet, D., Schlumpf, J.P., Jaouen, P. & Quemeneur, F. (2001) Stabilized landfill leachate treatment by combined physico-chemical-nanofiltration processes. Wat. Res., 35, 2935-2942.
8. Al-Malack, M.H., Abuzaid N.S. & El-Mubarak, A.H. (1999)Coagulation of Polymeric Wastewater Discharged by A Chemical Factory. Wat. Res., 33 (2), 521-529.

33 Reference
33
9. Aziz, H.A., Yusoff, M.S., Adlan, M.N., Adnan, N.H. & Alias, S.(2004) Physico-chemical removal f iron from semi-aerobic landfill leachate by limestone filter. Waste Manage Res., 22:371-375.
10. Senior E. (1995) Microbiology of Landfill Sites. Lewis Publishers
11. Sletten, R.S., Benjamin, M.M., Horng, J.J. & Ferguson, J.F. (1995) Physical-chemical treatment of landfill leachate for metals removal. Wat. Res., 29 (10), 2376-2386.
12. Basri, D.R.H., Mohamed, A.A.K., Aziz, H.A. & Asaari, F.A.H. (2000) The Effectiveness of Cockle Shells in Treating Leachate Organic Pollutants’ in ISWA International Symposium and Exhibition On Waste Management in Asian Cities, 23-25 October 2000, Hong Kong Convention and Exhibition Centre. 13. Trebouet, D., Schlumpf, J.P., Jaouen, P. & Quemeneur, F. (2001) Stabilized landfill leachate treatment by combined physico-chemical-nanofiltration processes. Wat. Res., 35, 2935-2942.
14. Enzminger, J.D., Robertson, D., Ahlert, R.C. & Kosson, D.S. (1987) Treatment of landfill leachates. J. Hazardous Materials, 14, 83-101.
15. Blanc, F.C. & Navia, R. (1991) Treatment of diary wastewater by chemical coagulation, Proc. Ind. Waste Conf. West Lafayette (Indiana), 45P
thP., 681-689.
16. Tatsi, A.A., Zouboulis, A.I., Matis, K.A. & Samaras, P. (2003) Coagulation-flocculation pretreatment of sanitary landfill leachates. Chemosphere, 53, 737-744.
17. Kreith F. (1994) Handbook of Solid Waste Management, McGraw-Hill, Inc.
18. Lisk, D.J. (1991) Environmental effects of landfill. Sci. Total Environ., 100, 415-468.
19. Ching H.W., Elimelech M. & Hering J.G. (1994) Dynamics of Coagulation of Clay Particles With Aluminum Sulphate. Journal of Environmental Engineering, 120 (1), 169-189, 1994.

34 Reference
34
20. Diamadopoulos, E. (1994) Characterization and treatment of recirculation-stabilized leachate. Wat. Res., 28 (12), 2439-2445.
21. Ehrig, H.J. (1984) Treatment of sanitary landfill leachate: Biological treatment. Waste Manage. Res., 2, 131-152.