seismological grand challenges … · grand challenge 2. how does the near-surface environment...
TRANSCRIPT

SeiSmological grand challengeS
in UnderStanding earth’S dynamic
SyStemS
Pre-Publication version • December 2008
long-range science Plan for seismology WorkshoP
sePtember 18–19, 2008, Denver, co
PrePared by the SeiSmological grand challengeS Writing grouP
this report is drawn from the many presentations and discussions at
the September 18–19, 2008, workshop on a long range Science Plan
for Seismology (lrSPS), held in denver, colorado, and attended by ~ 120
members of the seismological and geophysical research community.
Financial support for the lrSPS Workshop was provided by the national
Science Foundation (nSF). logistical support for the lrSPS Workshop and
for preparation and dissemination of this report were provided by the
iriS consortium. initial drafts of this report were openly available and
commented on by the seismological community. this final report is being
submitted to the nSF and other federal agencies.
thorne lay, editor
richard c. aster, workshop tri-chair
donald W. Forsyth, workshop tri-chair
barbara romanowicz, workshop tri-chair
richard m. allen
Vernon F. cormier
Joan gomberg
John a. hole
guy masters
derek Schutt
anne Sheehan
Jeroen tromp
michael e. Wysession
seismological granD challenges
in unDerstanDing earth’s Dynamic
systems
Pre-Publication version • December 2008
long-range Science Plan For SeiSmology WorkShoP
SePtember 18–19, 2008, denVer, co

contentS
executive Summary .......................................................................................................................................................1
introduction: the Seismological discipline ...................................................................................................................4
grand challenges for Seismology ................................................................................................................................10
grand challenge 1. how do Faults Slip? .................................................................................................................11
grand challenge 2. how does the near-Surface environment affect natural hazards and resources? ..................17
grand challenge 3. What is the relationship between Stress and Strain in the lithosphere? .................................24
grand challenge 4. how do Processes in the ocean and atmosphere interact With the Solid earth?.....................28
grand challenge 5. Where are Water and hydrocarbons hidden beneath the Surface? .........................................32
grand challenge 6. how do magmas ascend and erupt? ........................................................................................36
grand challenge 7. What is the lithosphere-asthenosphere boundary? ................................................................40
grand challenge 8. how do Plate boundary Systems evolve? ................................................................................45
grand challenge 9. how do temperature and composition Variations control mantle and core convection? ......50
grand challenge 10. how are earth’s internal boundaries affected by dynamics?.................................................55
Sustaining a healthy Future for Seismology ................................................................................................................59
Summary ....................................................................................................................................................................67
appendix: key Seismological Practices .......................................................................................................................68
monitoring dynamic Processes in earth’s environment ..........................................................................................68
multiscale 3d and 4d imaging and modeling of complex earth Systems ...............................................................70
recommended reading ..............................................................................................................................................73
acronyms and titles ....................................................................................................................................................74

1
eismology is the study of Earth’s elastic vibrations, the sources that generate them, and the structures through which they propagate. It is a geophysical discipline that has a remarkable diversity of applications to critical issues facing society and
plays a leading role in addressing key scientific frontiers involving Earth’s dynamic systems. Seismology enjoys quantitative foundations rooted in continuum mechanics, elasticity, and applied mathematics. Modern seismological systems utilize state-of-the-art digital ground motion recording sensors and real-time communications systems, and anyone can openly access many seismological data archives.
Seismologists “keep their ear” on Earth’s internal systems, listening for signals aris-ing from both natural and human-made energy sources distributed around the globe. These seismic signals contain a wealth of information that enables seismologists to quantify active wave sources and determine structures and processes at all depths in the planetary interior. This is done at higher resolution than is possible by any other approach, revealing structures associated with dynamic processes that are active now or have been ongoing over multibillion years. Recent breakthroughs in theory and data processing now allow every byte of continuous seismological data acquired to be used for imaging sources and structures throughout these dynamic systems, even extract-ing coherent signals from what had previously been dismissed as background noise. Ground-motion recordings are intrinsically multi-use; seismic data collected to moni-tor any specific Earth phenomenon, for example, underground nuclear tests, can also advance studies of earthquake sources or deep Earth structure. This multi-use attribute of seismic data places great value in the prevailing philosophies of open data access and real-time data collection embraced by the U.S. seismological research community and many of its international partners.
S
executiVeSummary
executiVe Summary
2
A rich panoply of societal applications of seismology has emerged directly from basic research programs focused on understanding Earth’s active wave sources and structure. Seismology plays central roles in hydrocarbon and resource exploration, earthquake detection and quantification, earthquake hazard assessment and strong ground motion prediction for the built infrastructure, including lifelines and critical facilities, volca-nic-eruption and tsunami-warning systems, nuclear test monitoring and treaty verifi-cation, and aquifer characterization. Seismology provides unique information about glacier systems, landslide mass movements, the ocean wave environment, containment of underground wastes, carbon sequestration, and other topics relevant to climate and environmental change.
A 2008 workshop on seismological research frontiers, funded by the National Science Foundation (NSF), considered promising research directions for the next decades and identified the following 10 Seismological Grand Challenge research questions:
• How do faults slip?• How does the near-surface environment affect natural hazards and resources? • What is the relationship between stress and strain in the lithosphere?• How do processes in the ocean and atmosphere interact with the solid Earth?• Where are water and hydrocarbons hidden beneath the surface?• How do magmas ascend and erupt?• What is the lithosphere-asthenosphere boundary?• How do plate boundary systems evolve?• How do temperature and composition variations control mantle
and core convection? • How are Earth’s internal boundaries affected by dynamics?
Further seismological research on these questions will address both fundamental prob-lems in understanding how Earth systems work and augment applications to societal concerns about natural hazards, energy resources, environmental change, and national security. Seismological contributions, research frontiers, and required infrastructure for progress on these 10 Seismological Grand Challenges are described in this report. Selected examples of recent research advances are used to highlight rapid progress, out-standing challenges, and diverse applications of seismology for studying Earth’s dynamic systems. The essence of associated seismological practices and approaches are further defined in an appendix by discussion of two key disciplinary practices: (1) monitoring the full diversity of dynamical processes in Earth’s environment, including human-induced sources and processes, and (2) multiscale, three-dimensional (3D) and time-varying (4D) imaging and modeling of Earth’s complex systems.
executiVe Summary
3
Maintaining a healthy national research capability in seismology to pursue the many societally important applications of the discipline and to address the 10 Grand Challenge research questions requires sustained and expanded support of seismic data acquisition, archival, and distribution facilities. Global and regional seismological networks with a commitment to long-term operation, and pools of portable instruments for shorter-term land- and sea-based deployments, provide key observations essential to tackling the Grand Challenges. The Advanced National Seismic System (ANSS), the primary earthquake monitoring system in the United States, must be completed. The currently sparse instrumental coverage of the vast areas of unexplored ocean floor needs to be expanded. Source facilities for controlled-source seismic data acquisition are essential to support crustal reflection and refraction imaging, including marine airguns, explo-sions in boreholes, and vibrating trucks. Cooperation among academic, government, and industry efforts in controlled-source seismology must be enhanced to support the Grand Challenge efforts. Completion of the planned deployment of the EarthScope Transportable Array across the conterminous United States and Alaska is important for achieving the manifold science goals of that major NSF program. International par-ticipation in open seismic data exchange for diverse seismic networks around the world must be diplomatically pursued and expanded. Interdisciplinary workshops addressing critical problems of the near-surface environment and deep Earth should be promoted, with active seismological participation.
Many of the government and private sector users of seismology are now confronted with serious workforce shortages. Expanded efforts are required to attract quantita-tively oriented, diverse students to the discipline. These efforts should be abetted by building on current education and outreach endeavors of the seismological community, and by developing stronger partnerships among academic, industry, and government laboratories, which are all impacted by workforce-shortage issues. At the same time, some trends toward reducing seismological staff and resources in government labs need to be reversed to sustain contributions of the discipline.
Seismology holds great promise for achieving major breakthroughs on the Seismological Grand Challenge questions and associated societal benefits over the next few decades, as long as federal agencies and industry continue to invest in basic research programs and infrastructure for this burgeoning geophysical discipline. With the well-established practices of open data sharing, expanding efforts to share software and to develop community models, and the multi-use aspect of all seismic data, bountiful return on investments in seismological infrastructure and training is assured. As progress on the Seismological Grand Challenges is made, the fundamental understanding of Earth’s dynamic systems that is gained will advance the sustainability and security of human civilization, along with satisfying our deep curiosity about how planet Earth works.
executiVe Summary
4
he ground beneath our feet usually seems solid and unmoving, but in reality it is in a con-stant state of vibration; only intermittently are
the motions strong enough for human perception. Sensible motions may involve small vibrations from a large truck passing nearby or possibly shaking from a distant earthquake. On occasion, the ground moves violently, causing catastrophic loss of life as buildings collapse and Earth’s surface is disrupted. These ground motions originate in Earth’s rocky interior by various processes that suddenly release stress, such as rapid sliding motions across a fault. The stress change pro-duces propagating disturbances that expand outward from the energy source through the surrounding rocks in the form of elastic P-waves and S-waves that reach and shake the surface.
About 140 years ago, scientists first invented instru-ments to record seismic vibrations of the ground as a function of time, and geophysicists drew upon solid mechanics and elasticity to develop fundamental understanding of elastic waves. This was the begin-ning of the discipline of seismology, which involves the study of seismic waves, their sources, and the medium through which they propagate. Because it is a discipline that infers source and structural informa-tion from remotely observed data, the field has driven many mathematical methods for inversion and infer-ence. Seismology provides quantitative models for structures and sources that guide many multidisci-plinary Earth science research and monitoring efforts. During the twentieth century, the discipline grew into
t
introductionthe SeiSmological diSciPline
a major international endeavor, developing a panoply of applications of Earth’s vibrations. These applica-tions study both the dynamic sources of the seismic waves and the characteristics of the materials through which they travel along with myriad industrial, soci-etal, and scientific applications.
Placing ground motion sensors, or seismometers, on Earth’s surface is akin to putting stethoscopes on the Earth system and listening for the rumblings and gur-glings of the planet’s internal processes. Over the past century, seismologists have learned to unravel the rich information contained within seismograms, apply-ing quantitative elastic (and nonlinear) wave theory to accumulating databases and distilling meaningful information from the cacophony of seismic motions. Classic seismological applications include the system-atic location and quantification of earthquakes and construction of models for Earth’s elastic wave proper-ties as functions of depth from the surface to the cen-ter of the planet. This dual effort to study both earth-quake sources and Earth structure is now advanced but still frames the discipline.
Controlled human-created energy releases, such as buried explosions, underwater airguns, and large vibrating trucks, provide seismic wave sources at Earth’s surface that illuminate the shallow crust with elastic waves. These active-source techniques are anal-ogous to ultrasound methods used in medical imag-ing, and provide very high resolution of subsurface conditions and the detection of energy and mineral
introduction
5
resources. Seismology intrinsically provides unpar-alleled resolution of physical properties in the inac-cessible interior from the crust to the core. Seismic imaging of fossil-fuel-bearing geologic structures is essential to discovering, exploiting, and managing critical energy resources that power global civiliza-tion. When nuclear testing moved underground dur-ing the Cold War, seismology assumed a key role in treaty verification and in remote monitoring of weap-ons development programs.
With these new roles in hydrocarbon exploration and national security monitoring efforts complementing earthquake studies and Earth structure research, seis-mology rapidly grew into a major high-tech research discipline. Today, global seismometer networks trans-mit ground motion recordings from around the world in real time via satellite, microwave, or Internet telem-etry to data analysis centers. Automated computer
processing of the accumulated seismic signals is per-formed by many government agencies and research programs to produce rapid bulletins of global seis-micity and prompt information for disaster mitiga-tion. These activities are essential for the continu-ous monitoring of the Earth system, and there is still much room for improvement of methodologies used in many efforts. Large-scale deployments of land- and sea-based instruments utilize both active human-made sources and passive natural sources of seismic waves, revealing multiscale structures of the crust and deep Earth. Massive online data repositories freely provide the data to scientists, enabling research and monitoring applications across academic, government, and com-mercial sectors. The complexity of seismic wave pro-cessing and modeling efforts combined with very large seismic data sets has placed seismology as a primary driver of high-performance computing at universities, national laboratories, and industry for many decades.
11/2008
JapanGSN U.S.Australia Germany ItalyFrance OtherCanada
International Federation ofDigital Seismograph Networks
introduction
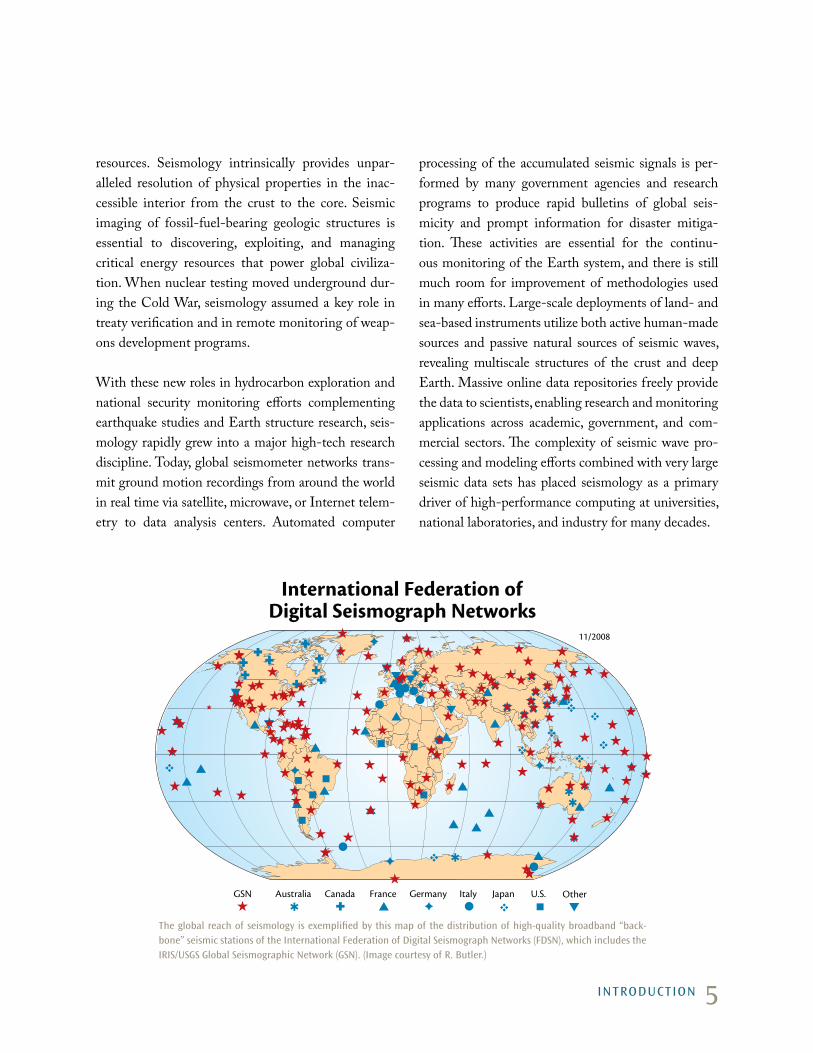
the global reach of seismology is exemplified by this map of the distribution of high-quality broadband “back-bone” seismic stations of the international Federation of digital Seismograph networks (FdSn), which includes the iriS/uSgS global Seismographic network (gSn). (image courtesy of r. butler.)
6
volcanic eruptions, explosions, mine collapses, rock bursts, landslides) that have very long-term nega-tive impacts on human life, property, and infrastruc-ture, near-real-time access to seismic data is also of great importance. Whenever it is possible to transmit ground motion data to open archives in real time, mul-tiple societal applications of the signals are enabled.
By its very nature, seismology is sensitive to many active, dynamic processes happening today in Earth’s dynamic systems, and the discipline has expanded its scope to include detecting and characterizing numer-ous aspects of environmental change and near-sur-face processes, including ground-water distribution, glacial motions, storm migration, the ocean wave environment, and ocean circulation. Much of mod-ern Earth science research addresses complex phys-ical systems that involve interfaces among multiple disciplines, and seismology offers powerful tools for remote sensing of structures and sources that com-plement other approaches. This central importance of seismology is noted in many major scientific planning documents (e.g., BROES, 2001; IUGG, 2007), and a suite of research community organizations (CIDER, COMPRES, CSEDI, FDSN, IASPEI, IAVCEI, IRIS, MARGINS, RIDGE, SCEC, UNAVCO—all
A defining attribute of seismograms is that they are simply records of ground motion as a function of time. Thus, seismic data recorded by a network of seis-mometers for any particular purpose (e.g., monitor-ing nuclear testing or earthquake hazard analysis), intrinsically provide signals that are valuable for mul-tiple unrelated uses. One can equally well study Earth structure, earthquakes, explosions, volcanic eruptions, and other processes with the same seismograms. Study of the diverse Earth systems requires glob-ally distributed sensors and international collabora-tions on data acquisition and exchange. The multi-use attribute of seismic signals places a great premium on continuously recording ground motions over as wide of a frequency band as possible, archiving all record-ings in accessible formats, and openly sharing the data between nations and institutions, no matter what the original motivation was for deploying the seis-mic instrumentation. The U.S. seismological commu-nity, and its international partners in the Federation of Digital Seismograph Networks (FDSN), have strongly fostered this framework of open access to seismic data, establishing data centers that are acces-sible to all researchers. Because the data play criti-cal roles in rapid evaluation of short-term changes in Earth’s dynamic systems (e.g., earthquakes, tsunamis,
introduction
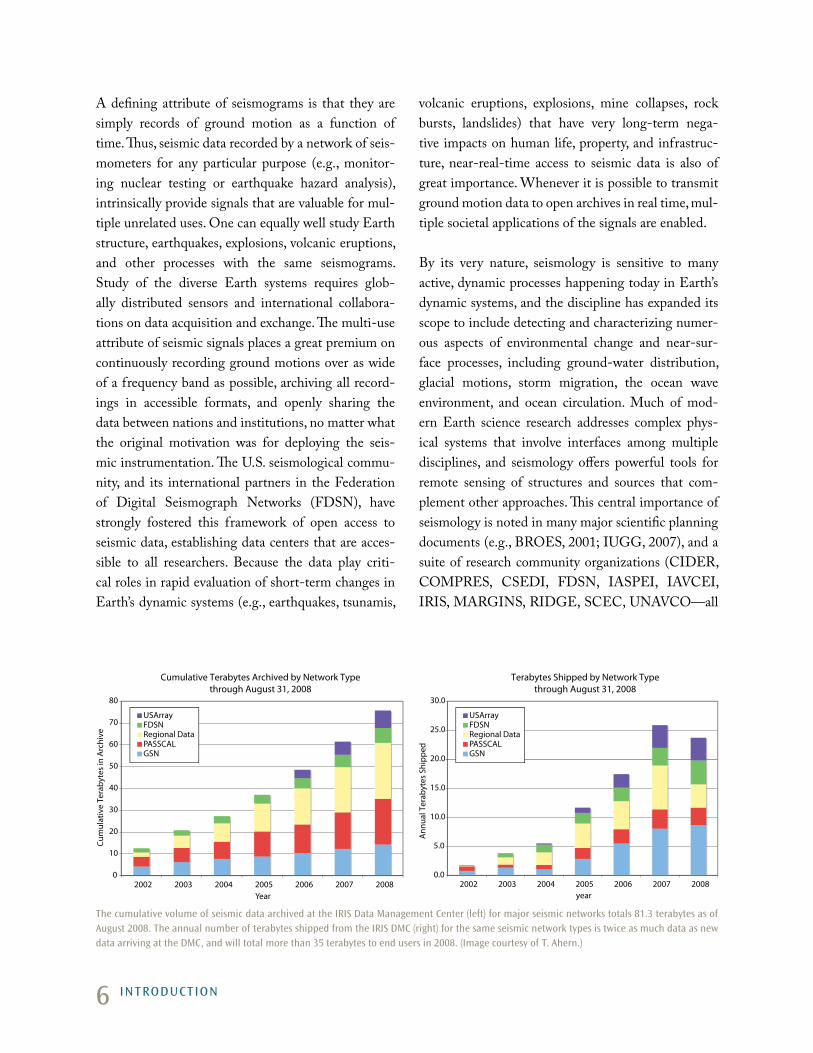
Cumulative Terabytes Archived by Network Typethrough August 31, 2008
0
10
20
30
40
50
60
70
80
2002 2003 2004 2005 2006 2007 2008Year
Cum
ulat
ive
Tera
byte
s in
Arc
hive
Terabytes Shipped by Network Typethrough August 31, 2008
0.0
5.0
10.0
15.0
20.0
25.0
30.0
2002 2003 2004 2005 2006 2007 2008year
Ann
ual T
erab
ytes
Shi
pped
USArrayFDSNRegional DataPASSCALGSN
USArrayFDSNRegional DataPASSCALGSN
the cumulative volume of seismic data archived at the iriS data management center (left) for major seismic networks totals 81.3 terabytes as of august 2008. the annual number of terabytes shipped from the iriS dmc (right) for the same seismic network types is twice as much data as new data arriving at the dmc, and will total more than 35 terabytes to end users in 2008. (image courtesy of t. ahern.)
7
acronyms are defined at the end of the report) engage seismologists with synergistic disciplines in min-eral physics, geodynamics, volcanology, geology, and increasingly, oceanography, hydrology, glaciology, cli-mate, and atmospheric sciences.
This centrality of seismology in Earth science and global monitoring engages multiple U.S. federal agencies in supporting the discipline, including the National Science Foundation (NSF), the United States Geological Survey (USGS), the National Oceanic and Atmospheric Administration (NOAA), the Department of Energy (DOE), the Department of Defense (DoD), the Federal Emergency Management Agency (FEMA), and the National Aeronautics and Space Administration (NASA). This diversity of supporting agencies has benefited the discipline immensely, and reflects the multi-use nature of seis-mological data. U.S. seismology is deeply engaged in international activities such as the International Monitoring System (IMS) of the Comprehensive Nuclear Test Ban Treaty Organization (CTBTO), and the Global Earth Observations System of Systems (GEOSS), placing the discipline in high-level, scien-tifically and politically influential roles.
One sign of a healthy scientific enterprise is that it is producing major advances and paradigm shifts. As manifest in this report, seismology is a dynamic and energized field, with a continually expanding portfolio of important contributions. Examples of recent transformative developments in the discipline include the following:
• Creation of the open-access online seismic data repository of the Incorporated Research Institutions for Seismology (IRIS) Data Management System (DMS) has enabled proliferating discoveries and new societal applications by many researchers. This facility, which houses terabytes of seismic data, freely delivers these data to the entire world, an approach being emulated internationally.
• The availability and centralized maintenance of large pools of state-of-the-art portable seismographs, such as IRIS PASSCAL, has driven a new era of discov-ery in seismic source and structural studies across the discipline.
• The discovery of coherent information contained in recorded seismic “noise” allows virtually every data byte to be used for scientific application; entirely new approaches to structural studies and investigations of changes in the oceanic and atmospheric environ-ment have emerged. Earth’s background vibrations contain information about sources and structures that was not recognized until recently.
introduction
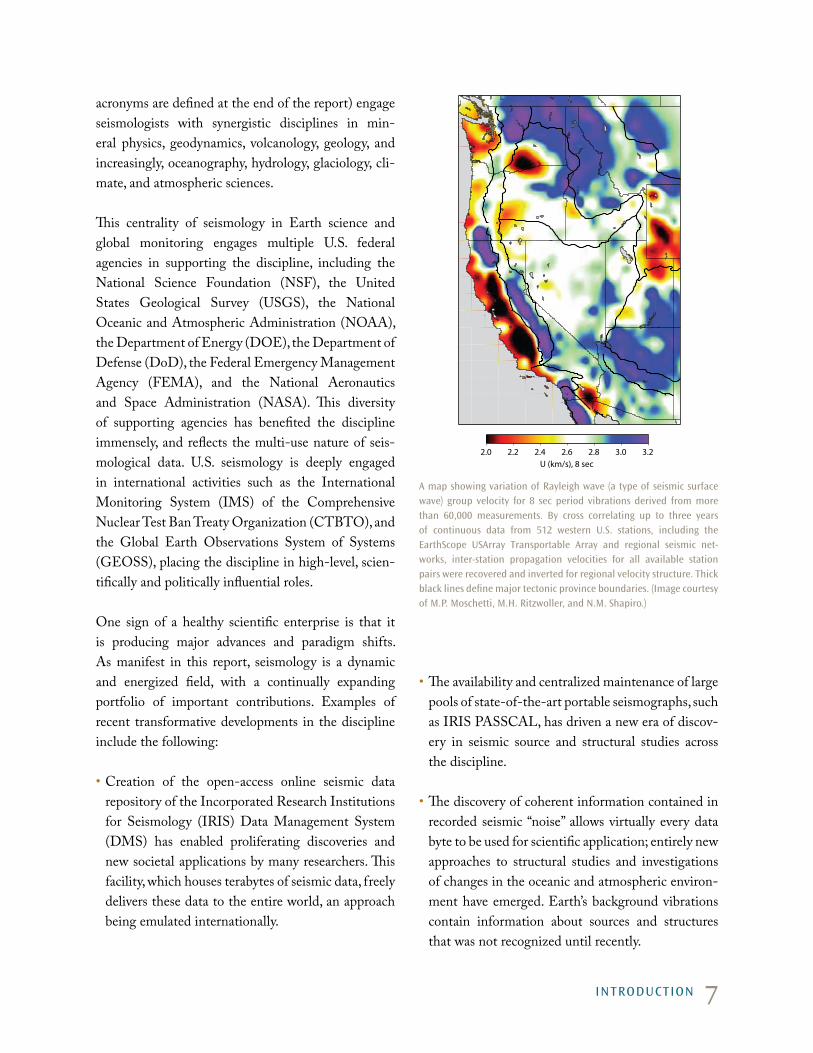
a map showing variation of rayleigh wave (a type of seismic surface wave) group velocity for 8 sec period vibrations derived from more than 60,000 measurements. by cross correlating up to three years of continuous data from 512 western u.S. stations, including the earthScope uSarray transportable array and regional seismic net-works, inter-station propagation velocities for all available station pairs were recovered and inverted for regional velocity structure. thick black lines define major tectonic province boundaries. (image courtesy of m.P. moschetti, m.h. ritzwoller, and n.m. Shapiro.)
2.0 2.2 2.4 2.6 2.8 3.0 3.2U (km/s), 8 sec
8
• The recent discovery of a continuous spectrum of faulting behavior, ranging from conventional earth-quakes that rupture at great speeds (including super-shear velocities) to “slow earthquakes” that involve anomalously slow ruptures—some so slow that the sliding motion does not radiate detectable seismic waves or is manifested in seismic tremor—has uni-fied seismic and geodetic monitoring of fault zones and may have fundamental importance for frictional sliding processes and earthquake hazard.
• The discovery of the predominance of large-scale structures with anomalous elastic properties in the deep mantle by imaging methods (e.g., seismic tomography) has brought a paradigm shift to our understanding of mantle convection and thermal evolution of Earth’s deep interior, with new empha-sis on thermo-chemical dynamics.
• Project EarthScope, a major research effort funded primarily by NSF, is providing unprecedented spa-tial coverage of seismic and geodetic observations
introduction
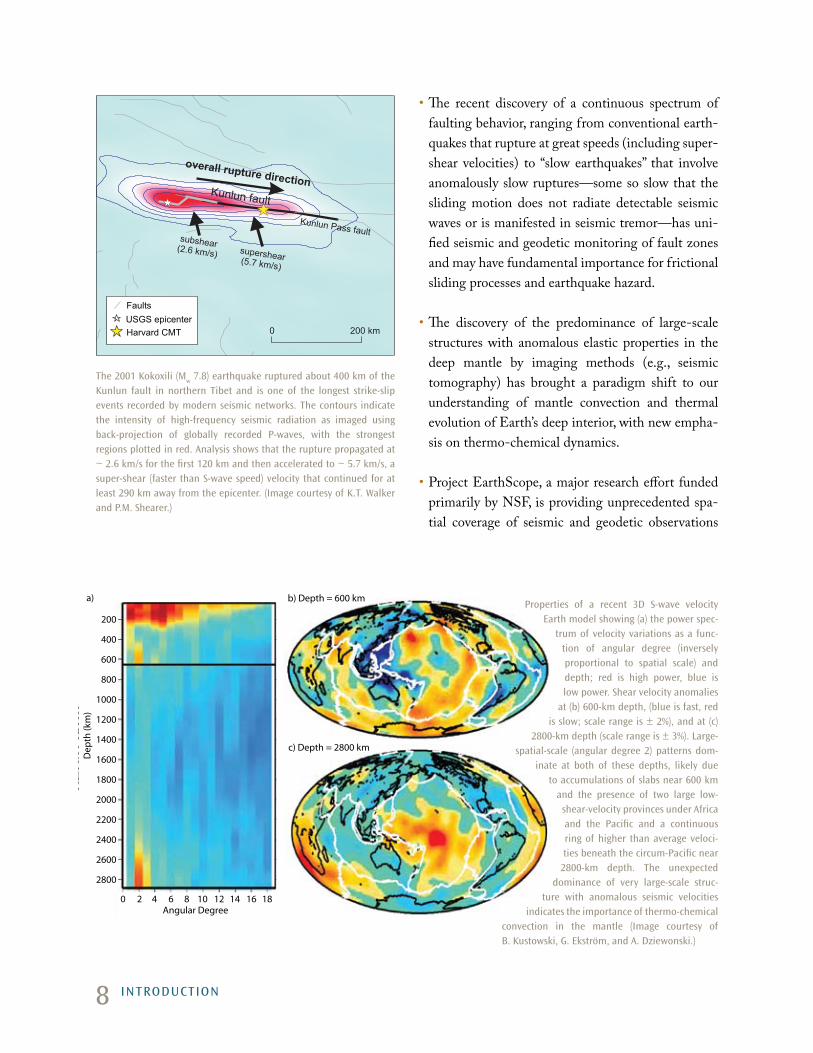
the 2001 kokoxili (mw 7.8) earthquake ruptured about 400 km of the
kunlun fault in northern tibet and is one of the longest strike-slip events recorded by modern seismic networks. the contours indicate the intensity of high-frequency seismic radiation as imaged using back-projection of globally recorded P-waves, with the strongest regions plotted in red. analysis shows that the rupture propagated at ~ 2.6 km/s for the first 120 km and then accelerated to ~ 5.7 km/s, a super-shear (faster than S-wave speed) velocity that continued for at least 290 km away from the epicenter. (image courtesy of k.t. Walker and P.m. Shearer.)
0 200 km
subshear(2.6 km/s) supershear(5.7 km/s)
Kunlun Pass fault
Kunlun fault
overall rupture direction
USGS epicenterFaults
Harvard CMT
b) Depth = 600 km
c) Depth = 2800 km
200
400
600
800
1000
1200
1400
1600
1800
2000
2200
2400
2600
2800
Dep
th (k
m)
Angular Degree0 2 4 6 8 10 12 14 16 18
a)Properties of a recent 3d S-wave velocity
earth model showing (a) the power spec-trum of velocity variations as a func-
tion of angular degree (inversely proportional to spatial scale) and depth; red is high power, blue is low power. Shear velocity anomalies
at (b) 600-km depth, (blue is fast, red is slow; scale range is ± 2%), and at (c)
2800-km depth (scale range is ± 3%). large-spatial-scale (angular degree 2) patterns dom-
inate at both of these depths, likely due to accumulations of slabs near 600 km
and the presence of two large low-shear-velocity provinces under africa and the Pacific and a continuous ring of higher than average veloci-ties beneath the circum-Pacific near
2800-km depth. the unexpected dominance of very large-scale struc-
ture with anomalous seismic velocities indicates the importance of thermo-chemical
convection in the mantle (image courtesy of b. kustowski, g. ekström, and a. dziewonski.)

9
across North America, revealing fine-scale crustal and mantle structures that are divulging secrets of continental evolution.
• The emergence of quantitative physics-based pre-dictions of surface ground motions using realistic dynamic fault rupture models and 3D geological structures has begun to transform earthquake haz-ard analysis, complementing the emergence of per-formance-based earthquake engineering.
• The discovery of remote triggering of earthquakes and enhanced understanding of earthquake inter-actions has provided new insights into the stress changes that lead to earthquake initiation.
• The tsunami generated by the great 2004 Sumatra earthquake reaffirmed the catastrophic potential of natural events and the need for early-warning systems. Automated data collection and process-ing are enabling near-real-time responses to earth-quake occurrence, including seismic shaking and tsunami-warning systems that have potential to save many lives.
The continued health and vigor of seismology requires federal and industry attention to critical founda-tions of the discipline and expansion of the base upon which future advances can be built. Core needs include sustaining and expanding data collection and dissemination infrastructure, providing access to high-performance computational resources, attracting and supporting diverse, quantitatively oriented stu-dents to the discipline, and fostering interdisciplin-ary collaborations to study complex Earth systems. To clarify the critical functions and potential contri-butions that seismology can make and the infrastruc-ture needed to achieve the full span of possibilities, the seismology community has identified 10 Grand Challenge research questions for the next few decades and the associated infrastructure needs essential for making progress on these topics.
introduction
rupture zones of the 26 december 2004 (seismic moment magnitude m
w = 9.2) and 28 march 2005 (m
w = 8.7) great Sumatra earthquakes.
the 2004 event generated a tsunami that claimed over 225,000 lives around the indian ocean. international teams of seismologists and geodesists have studied how the rupture spread over the fault, how slip varied along the subduction zone, and how aseismic after-slip occurred for several months after the events. efforts to establish new tsunami-warning systems for the indian ocean and caribbean are now underway. (image courtesy of c.J. ammon.)
2004
2005
14
12
10
8
6
4
2
0
-2
90 92 94 96 98 100 102
10
he history of seismological advances has validated the approach of sustaining diverse basic science research in seismology as the most effective way of devel-oping and enhancing the societally critical applications of the discipline. This
strategy ensures workforce education in university programs, incorporation of novel technologies and innovations into seismological practices and operations, and culti-vation of fertile ground for serendipitous discoveries that can create whole new areas of application. Here, the seismological research community has defined ten major Grand Challenge questions at the forefront of research on Earth systems to which seismology contributes significantly. These Grand Challenges are framed by funda-mental research issues, but encompass hazard mitigation, environmental monitoring, and resource-extraction efforts of central importance to society and supported by many federal and state agencies.
grand challengeSFor SeiSmology
t
grand challengeS For SeiSmology
11
grand challenge 1.hoW do FaultS SliP?
The general public associates seismology mainly with earthquakes, making it one of the most widely recog-nized of Earth science disciplines. Understanding the nature of earthquake faulting continues to be a top priority seismological undertaking that holds many implications for society. The steady relative motions of Earth’s tectonic plates concentrate stresses that are relieved mainly as slippage along faults on plate boundaries and within their plate interiors. Multiscale fault zone systems, ranging from the microscopic to the scale of plate boundaries, are involved in earth-quake initiation, rupture, and termination. Seeking a detailed physical understanding of the nonlinear pro-cesses by which faults slip in these complex systems is a demanding Grand Challenge for seismology.
The sliding motion of faults exhibits a huge range of complex behavior. The most spectacular releases of stress occur in conventional earthquakes. Elastic potential energy stored up in the rock over hundreds to thousands of years as a result of adjacent relative
plate motions, is rapidly released when fault fric-tional resistance is overcome; local shearing motions occur within seconds, generating seismic waves that radiate outward. Recent observations reveal a rich spectrum of additional fault slip behavior, from faults that offset steadily without apparent resis-tance, to faults that slide sporadically, chattering as they slip in sequences of numerous overlapping events, to others that slide at super-shear velocities (faster than the speed of S-waves in the rocks), emit-ting seismic shock waves that can cause large, excep-tionally damaging ground motions.
Seismology provides many of the highest-resolution tools for peering into fault zones. Seismic recordings can be used to image the geometry and time-depen-dent properties of the fault zones in diverse environ-ments, although current models make many simpli-fying assumptions such as “faults are planar” or “slip is unidirectional,” which are likely not always correct. Variations of fluid concentrations and pressures along
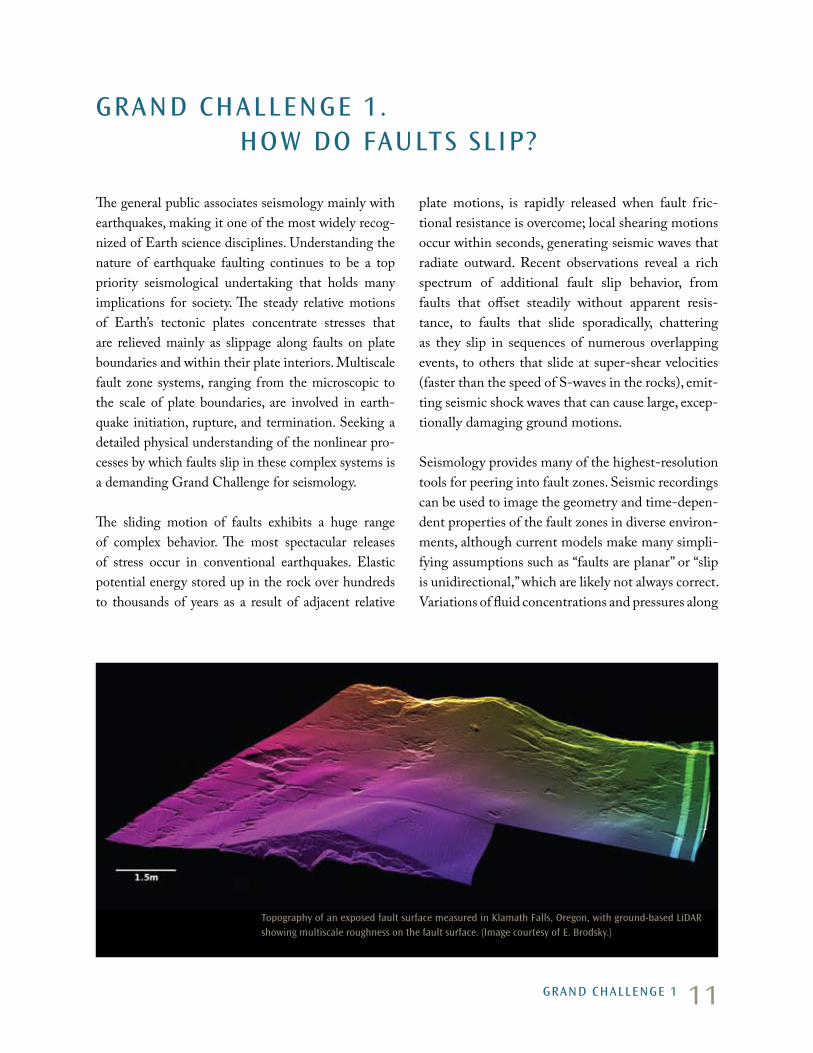
topography of an exposed fault surface measured in klamath Falls, oregon, with ground-based lidar showing multiscale roughness on the fault surface. (image courtesy of e. brodsky.)
grand challenge 1
12
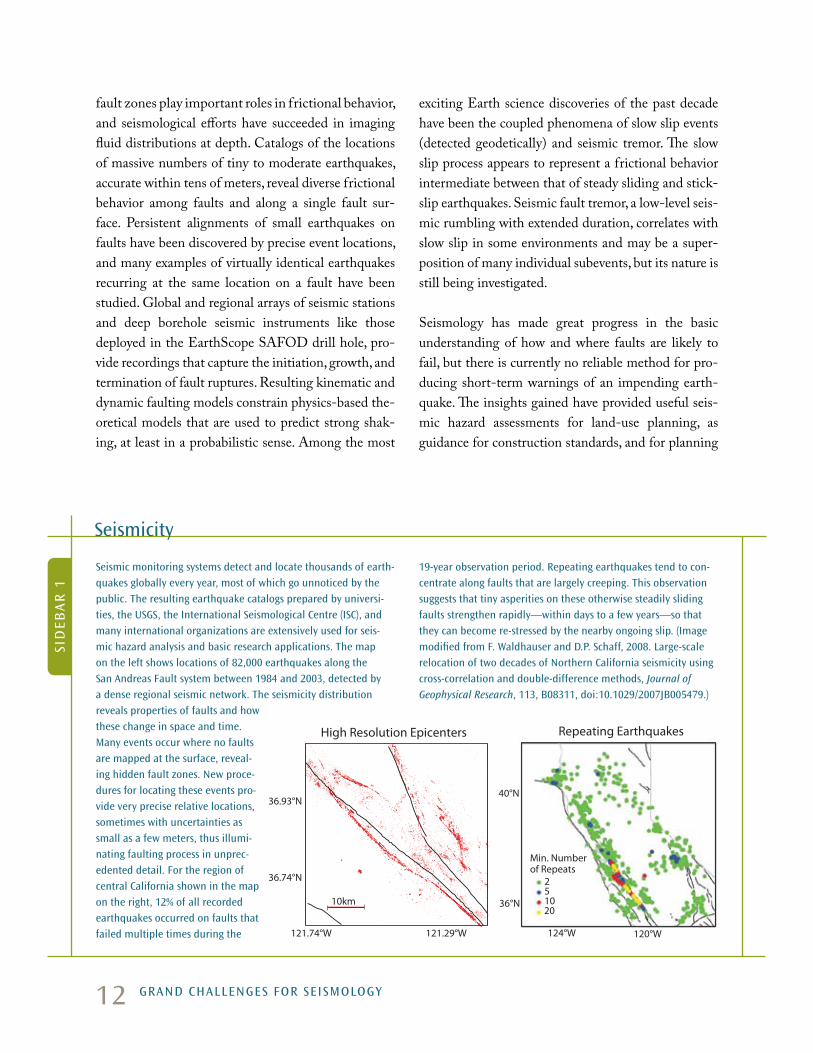
Seismic monitoring systems detect and locate thousands of earth-quakes globally every year, most of which go unnoticed by the public. the resulting earthquake catalogs prepared by universi-ties, the uSgS, the international Seismological centre (iSc), and many international organizations are extensively used for seis-mic hazard analysis and basic research applications. the map on the left shows locations of 82,000 earthquakes along the San andreas Fault system between 1984 and 2003, detected by a dense regional seismic network. the seismicity distribution reveals properties of faults and how these change in space and time. many events occur where no faults are mapped at the surface, reveal-ing hidden fault zones. new proce-dures for locating these events pro-vide very precise relative locations, sometimes with uncertainties as small as a few meters, thus illumi-nating faulting process in unprec-edented detail. For the region of central california shown in the map on the right, 12% of all recorded earthquakes occurred on faults that failed multiple times during the
19-year observation period. repeating earthquakes tend to con-centrate along faults that are largely creeping. this observation suggests that tiny asperities on these otherwise steadily sliding faults strengthen rapidly—within days to a few years—so that they can become re-stressed by the nearby ongoing slip. (image modified from F. Waldhauser and d.P. Schaff, 2008. large-scale relocation of two decades of northern california seismicity using cross-correlation and double-difference methods, Journal of
Geophysical Research, 113, b08311, doi:10.1029/2007Jb005479.)
Seismicity
Sid
eba
r 1
fault zones play important roles in frictional behavior, and seismological efforts have succeeded in imaging fluid distributions at depth. Catalogs of the locations of massive numbers of tiny to moderate earthquakes, accurate within tens of meters, reveal diverse frictional behavior among faults and along a single fault sur-face. Persistent alignments of small earthquakes on faults have been discovered by precise event locations, and many examples of virtually identical earthquakes recurring at the same location on a fault have been studied. Global and regional arrays of seismic stations and deep borehole seismic instruments like those deployed in the EarthScope SAFOD drill hole, pro-vide recordings that capture the initiation, growth, and termination of fault ruptures. Resulting kinematic and dynamic faulting models constrain physics-based the-oretical models that are used to predict strong shak-ing, at least in a probabilistic sense. Among the most
exciting Earth science discoveries of the past decade have been the coupled phenomena of slow slip events (detected geodetically) and seismic tremor. The slow slip process appears to represent a frictional behavior intermediate between that of steady sliding and stick-slip earthquakes. Seismic fault tremor, a low-level seis-mic rumbling with extended duration, correlates with slow slip in some environments and may be a super-position of many individual subevents, but its nature is still being investigated.
Seismology has made great progress in the basic understanding of how and where faults are likely to fail, but there is currently no reliable method for pro-ducing short-term warnings of an impending earth-quake. The insights gained have provided useful seis-mic hazard assessments for land-use planning, as guidance for construction standards, and for planning
grand challengeS For SeiSmology
2 51020
10km
121.74°W 121.29°W
36.74°N
36.93°N
36°N
124°W 120°W
40°N
Min. Number of Repeats
Repeating EarthquakesHigh Resolution Epicenters
13
for emergency response. Far more can be achieved by enhancing our fundamental level of observations and understanding of the physics of earthquake ruptures,
ranging from better prediction of ground shaking variations, to expansion of early warning systems for earthquake and tsunami hazards.
Sideb
ar
2
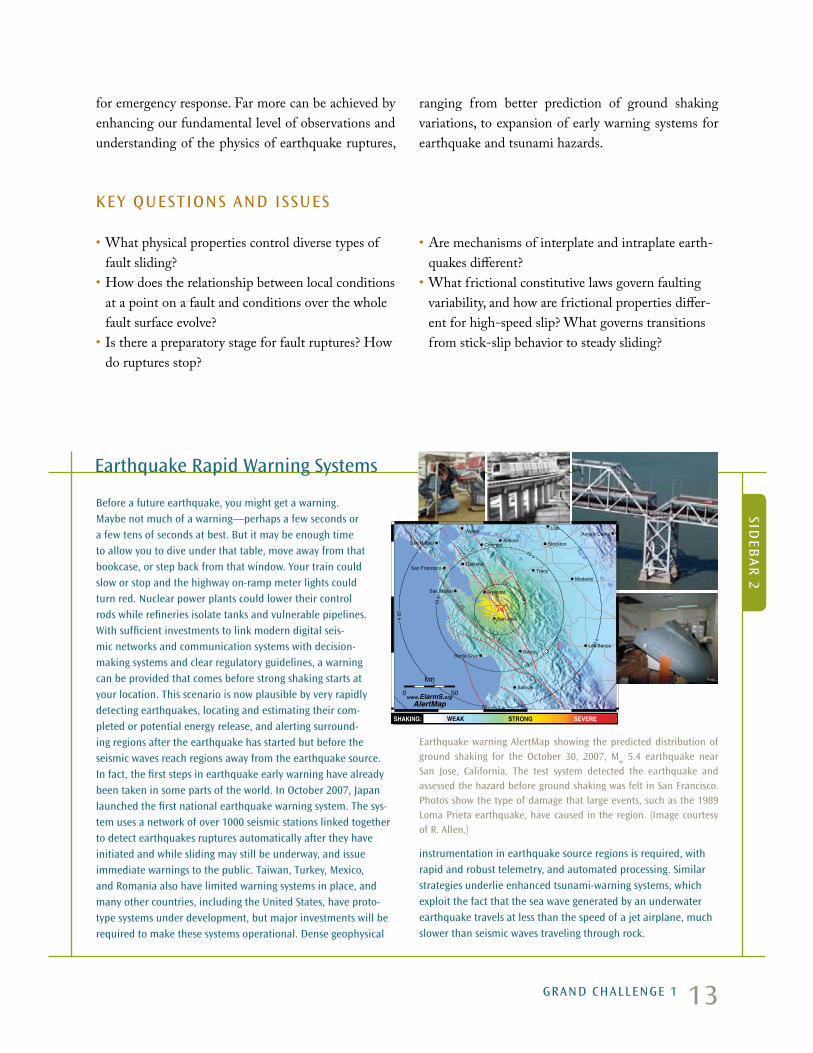
before a future earthquake, you might get a warning. maybe not much of a warning—perhaps a few seconds or a few tens of seconds at best. but it may be enough time to allow you to dive under that table, move away from that bookcase, or step back from that window. your train could slow or stop and the highway on-ramp meter lights could turn red. nuclear power plants could lower their control rods while refineries isolate tanks and vulnerable pipelines. With sufficient investments to link modern digital seis-mic networks and communication systems with decision-making systems and clear regulatory guidelines, a warning can be provided that comes before strong shaking starts at your location. this scenario is now plausible by very rapidly detecting earthquakes, locating and estimating their com-pleted or potential energy release, and alerting surround-ing regions after the earthquake has started but before the seismic waves reach regions away from the earthquake source. in fact, the first steps in earthquake early warning have already been taken in some parts of the world. in october 2007, Japan launched the first national earthquake warning system. the sys-tem uses a network of over 1000 seismic stations linked together to detect earthquakes ruptures automatically after they have initiated and while sliding may still be underway, and issue immediate warnings to the public. taiwan, turkey, mexico, and romania also have limited warning systems in place, and many other countries, including the united States, have proto-type systems under development, but major investments will be required to make these systems operational. dense geophysical
instrumentation in earthquake source regions is required, with rapid and robust telemetry, and automated processing. Similar strategies underlie enhanced tsunami-warning systems, which exploit the fact that the sea wave generated by an underwater earthquake travels at less than the speed of a jet airplane, much slower than seismic waves traveling through rock.
earthquake warning alertmap showing the predicted distribution of ground shaking for the october 30, 2007, m
w 5.4 earthquake near
San Jose, california. the test system detected the earthquake and assessed the hazard before ground shaking was felt in San Francisco. Photos show the type of damage that large events, such as the 1989 loma Prieta earthquake, have caused in the region. (image courtesy of r. allen.)
earthquake rapid Warning Systems
grand challenge 1
San Jose
San FranciscoOakland
Stockton
Fremont
Modesto
Salinas
Concord
Vallejo
San Mateo
Tracy
San Rafael
Santa CruzGilroy
Los Banos
Antioch
LodiAngels Camp
0s
10 s
10 s
10s
20s
20 s
20s
AlertMap0 50
km
SHAKING: WEAK STRONG SEVERE
www.ElarmS.org
key QueStionS and iSSueS
• What physical properties control diverse types of fault sliding?
• How does the relationship between local conditions at a point on a fault and conditions over the whole fault surface evolve?
• Is there a preparatory stage for fault ruptures? How do ruptures stop?
• Are mechanisms of interplate and intraplate earth-quakes different?
• What frictional constitutive laws govern faulting variability, and how are frictional properties differ-ent for high-speed slip? What governs transitions from stick-slip behavior to steady sliding?
14
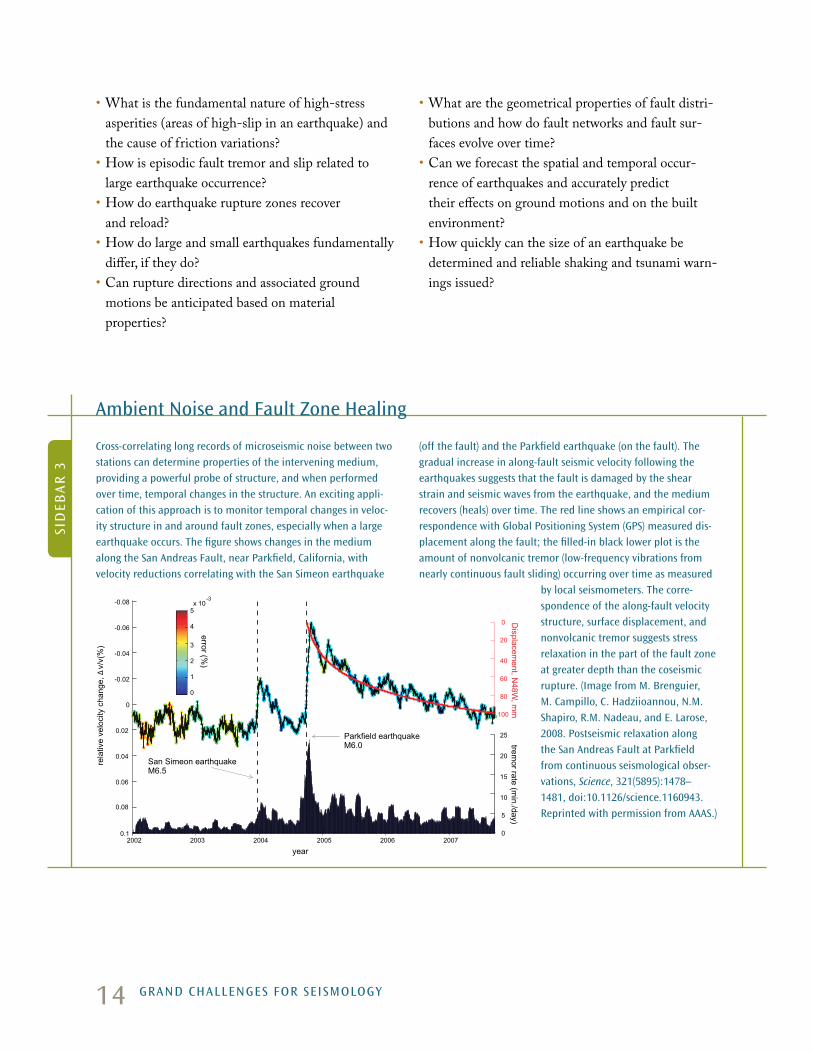
cross-correlating long records of microseismic noise between two stations can determine properties of the intervening medium, providing a powerful probe of structure, and when performed over time, temporal changes in the structure. an exciting appli-cation of this approach is to monitor temporal changes in veloc-ity structure in and around fault zones, especially when a large earthquake occurs. the figure shows changes in the medium along the San andreas Fault, near Parkfield, california, with velocity reductions correlating with the San Simeon earthquake
(off the fault) and the Parkfield earthquake (on the fault). the gradual increase in along-fault seismic velocity following the earthquakes suggests that the fault is damaged by the shear strain and seismic waves from the earthquake, and the medium recovers (heals) over time. the red line shows an empirical cor-respondence with global Positioning System (gPS) measured dis-placement along the fault; the filled-in black lower plot is the amount of nonvolcanic tremor (low-frequency vibrations from nearly continuous fault sliding) occurring over time as measured
by local seismometers. the corre-spondence of the along-fault velocity structure, surface displacement, and nonvolcanic tremor suggests stress relaxation in the part of the fault zone at greater depth than the coseismic rupture. (image from m. brenguier, m. campillo, c. hadziioannou, n.m. Shapiro, r.m. nadeau, and e. larose, 2008. Postseismic relaxation along the San andreas Fault at Parkfield from continuous seismological obser-vations, Science, 321(5895):1478–1481, doi:10.1126/science.1160943. reprinted with permission from aaaS.)
• What is the fundamental nature of high-stress asperities (areas of high-slip in an earthquake) and the cause of friction variations?
• How is episodic fault tremor and slip related to large earthquake occurrence?
• How do earthquake rupture zones recover and reload?
• How do large and small earthquakes fundamentally differ, if they do?
• Can rupture directions and associated ground motions be anticipated based on material properties?
ambient noise and Fault Zone healing
• What are the geometrical properties of fault distri-butions and how do fault networks and fault sur-faces evolve over time?
• Can we forecast the spatial and temporal occur-rence of earthquakes and accurately predict their effects on ground motions and on the built environment?
• How quickly can the size of an earthquake be determined and reliable shaking and tsunami warn-ings issued?
Sid
eba
r 3
grand challengeS For SeiSmology
rela
tive
velo
city
cha
nge,
v/
v(%
)∆
San Simeon earthquakeM6.5
Parkfield earthquakeM6.0
Displacem
ent,N48W
, mm
0.1
0.06
0.04
0.02
0
-0.02
-0.04
-0.06
-0.08 -3
error (%)
0
1
2
3
4
5x 10
year2002 2003 2004 2005 2006 2007
0
5
10
15
20
25
tremor rate (m
in./day)
0
100
80
60
40
20
0.08
15grand challenge 1
SeiSmological aPProacheS and reQuirementS to make ProgreSS
• Deploy more sensitive and low-noise seismographic arrays in shallow boreholes near faults.
• Maintain large pools of portable instruments for rapid deployment after earthquakes.
• Collect strong ground motion recordings for more large earthquakes.
• Sustain long-term operation of global and regional networks.
• Perform real-time analysis of earthquake source properties for rapid earthquake and tsunami warn-ing systems.
• Increase communications and collaborations with other disciplines studying aspects earthquake sci-ence, such as drilling efforts, geological studies, and laboratory studies.
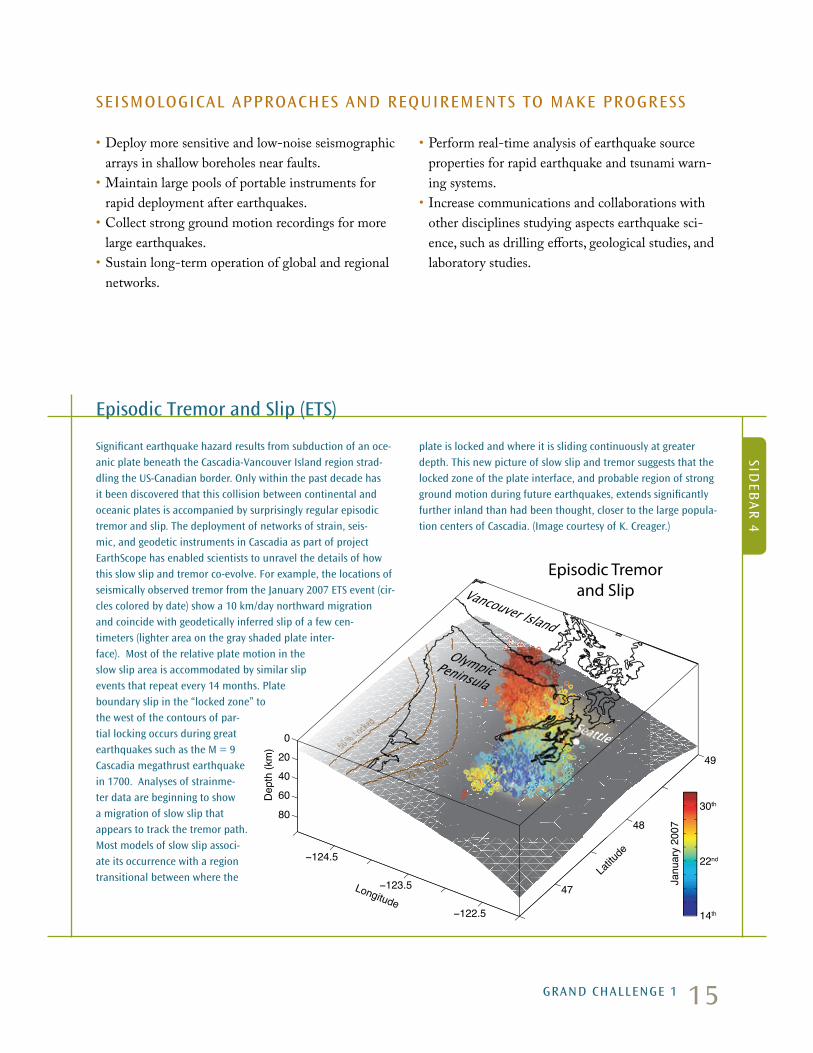
Significant earthquake hazard results from subduction of an oce-anic plate beneath the cascadia-Vancouver island region strad-dling the uS-canadian border. only within the past decade has it been discovered that this collision between continental and oceanic plates is accompanied by surprisingly regular episodic tremor and slip. the deployment of networks of strain, seis-mic, and geodetic instruments in cascadia as part of project earthScope has enabled scientists to unravel the details of how this slow slip and tremor co-evolve. For example, the locations of seismically observed tremor from the January 2007 etS event (cir-cles colored by date) show a 10 km/day northward migration and coincide with geodetically inferred slip of a few cen-timeters (lighter area on the gray shaded plate inter-face). most of the relative plate motion in the slow slip area is accommodated by similar slip events that repeat every 14 months. Plate boundary slip in the “locked zone” to the west of the contours of par-tial locking occurs during great earthquakes such as the m = 9 cascadia megathrust earthquake in 1700. analyses of strainme-ter data are beginning to show a migration of slow slip that appears to track the tremor path. most models of slow slip associ-ate its occurrence with a region transitional between where the
plate is locked and where it is sliding continuously at greater depth. this new picture of slow slip and tremor suggests that the locked zone of the plate interface, and probable region of strong ground motion during future earthquakes, extends significantly further inland than had been thought, closer to the large popula-tion centers of cascadia. (image courtesy of k. creager.)
episodic tremor and Slip (etS)
0
−124.5
−123.5
−122.5
47
48
49
80
60
40
20
Latitu
de
Longitude
Dep
th (k
m)
dddddddeeekkkkkkkkkkcccccoooLLLLL%%%%000000222
ddddddddddddddeeeeeeeekkkkkkkkkkkkkkkkkkccccccccoooooooooooLLLLLLLLLL%%%%%%%%%%%%%%%%%%%00000000000000000006666666666
Seattle
Vancouver Island
OlympicPeninsula
Episodic Tremorand Slip
14th
22nd
30th
Janu
ary
2007
Sideb
ar
4
16
“When will the big one be?” is the primary question asked of seismologists by the public. most people asking this question are seeking accurate predictions of earthquake magnitude, location, and time with a high probability of occurrence, such as “there will be a magnitude 7.0 earthquake beneath San Francisco on Wednesday at noon.” confronting the enigma of earthquake pre-diction has been a challenge to seismology since the emergence of the discipline. there are two approaches to this problem. the first is the “silver bullet” approach that seeks an unambiguous earthquake precursory signal. the ideal signal would be detectable before all earthquakes. unfortunately, no such universal precursory signal has yet been identified. there may instead be precursory signals that precede only some earthquakes, and only in specific envi-ronments. candidates include increased seismicity and crustal strain, changes in seismic velocities near a fault, variations in electrical resistivity and potential, radio frequency emission, and changes in ground-water levels and chemistry. these observa-tions are worthy of further research efforts once it has been dem-onstrated that a specific observation made before an earthquake is unique to the time window before the earthquake. it should be noted that many reported precursory signals have not passed even this basic requirement.
the second approach is to develop an understanding of the complete physical system responsible for earthquakes. earthquakes involve processes occurring at multiple spatial and temporal scales for which direct observations are severely limited. much progress has been made understanding crustal deforma-tion, stress accumulation, fault interaction, and rupture dynam-ics, but the challenge remains to link these processes to the underlying physics of fault rupture. it is also valuable to improve our understanding of patterns of seismicity using high-precision earthquake catalogs that are now being produced by advanced methodologies. Working toward a deterministic understanding of precise earthquake catalogs may reveal many currently hid-den aspects of the earthquake system. Studying the basic physical processes of earthquakes and catalogs over longer time periods will reveal whether aspects of the complex earthquake system are intrinsically predictable or not, and what observations may yield the best prospects of providing some predictive capabilities. the complexity of the earthquake process, and intrinsic observational limitations, may make earthquake rupture a fun-damentally unpredictable phenomenon. even if earthquakes could be predicted with a high degree of probability and accu-racy, this would solve only part of society’s earthquake prob-lem. the fate of new orleans after hurricane katrina illustrates that even when imminent disaster is predicted several days in
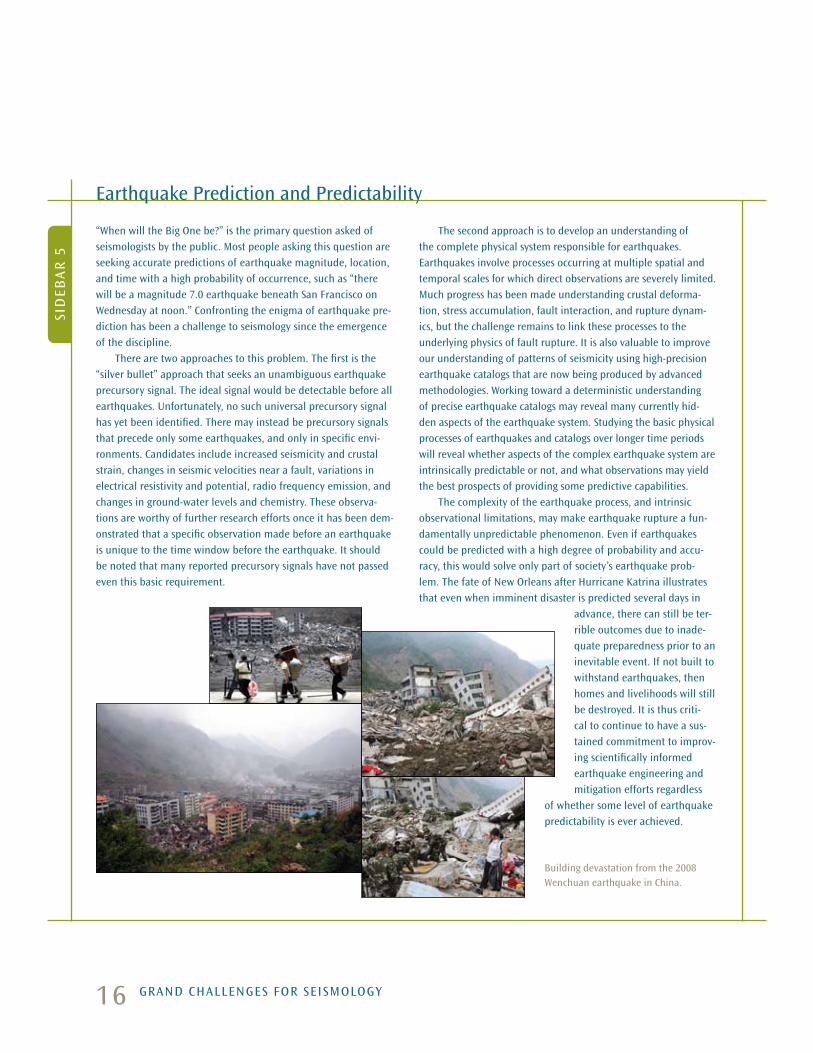
advance, there can still be ter-rible outcomes due to inade-quate preparedness prior to an inevitable event. if not built to withstand earthquakes, then homes and livelihoods will still be destroyed. it is thus criti-cal to continue to have a sus-tained commitment to improv-ing scientifically informed earthquake engineering and mitigation efforts regardless
of whether some level of earthquake predictability is ever achieved.
building devastation from the 2008 Wenchuan earthquake in china.
earthquake Prediction and Predictability
grand challengeS For SeiSmology
Sid
eba
r 5

17grand challenge 2
grand challenge 2. hoW doeS thenear-SurFace enVironment aFFect
natural haZardS and reSourceS?
A Grand Challenge for seismology is to quantify structures and processes in Earth’s near surface envi-ronment that affect civilization. Critical problems addressed by seismology involve understanding how seismic waves interact with the near surface to pro-duce strong ground-shaking hazards, evaluating how shallow Earth structure controls the distribution of valuable resources, and determining how the near sur-face records Earth’s history of climate change. These tasks are extremely challenging due to the acute het-erogeneity of near-surface Earth structure and associ-ated high seismic attenuation.
The location and severity of most natural hazards is strongly influenced by near-surface materials, whether the ultimate cause of the hazard arises from the Earth, atmosphere-ocean systems, or human activity. Seismic wave sources in the near-surface environment, such as underground explosions, rock bursts, mine bumps, and earthquake faulting, involve significant hazards as well as industrial and political interests. Sediment deposits at or near Earth’s surface are the youngest solid Earth structures and therefore record the most recent envi-ronmental changes or events (e.g., variability in cli-mate or weather, floods, landslides, and earthquakes).
0
30
200
Dep
th (m
)
0 60Distance South of San Gabriel Canyon (km)
San Gabriel River Shallow Vs Transect, 100x Vertical Exaggeration
Shear Velocity, m/s
NEHRP Classi�cation
760 15203601800
E D C B
San GabrielCanyon
SealBeach
30
Azusa WhittierNarrows
PicoRivera
Los Alamitos AlamitosBay
San Gabriel Valley
a 60-km long cross section of the upper 200 m of the los angeles and San gabriel basins, at 100x vertical exaggera-tion, showing measured shear-wave speed. red-orange regions indicate soils that would strongly amplify ground shaking during an earthquake. the section was derived using seismic surface waves from urban background noise sources. (image from W.a. thelen, m. clark, c.t. lopez, c. loughner, h. Park, J.b. Scott, S.b. Smith, b. greschke, and J.n. louie, 2006. a transect of 200 shallow shear-velocity profiles across the los angeles basin, Bulletin of the Seismological Society of America, 96(3):1055–1067, ©Seismological Society of america.)
18 grand challengeS For SeiSmology
understanding and mitigating earthquake risk depends critically on predicting the intensity of strong ground motion, a daunting scientific challenge. the faulting that generates seismic waves is complex and incompletely understood. moreover, seismic waves are strongly distorted as they propagate through earth’s hetero-geneous crust, which is incompletely mapped. in practice, strong ground motion is characterized using intensity measures, such as peak ground acceleration, or peak ground velocity, in an attempt to capture damage potential. earthquake engineering relies on parametric relationships that predict the strength of shaking dur-ing future earthquakes, based on how the ground motion during past earthquakes varied with factors such as magnitude, distance to fault rupture, and surficial geology. this empirical approach is adequate for moderate earth-quakes; however, there are very few on-scale recordings near large earthquakes, where the hazard is highest. Physics-based
strong ground motion simulations have the potential to fill this gap, but only if they accurately reflect the full range of earth behaviors in the presence of strong seismic waves. Physics-based ground motion simulation is thus an area of intense research and rapid recent progress. an important element of such simu-lations is dynamic rupture modeling, which considers the joint stress-slip evolution during earthquake shear failure as being driven by the redistribution of stored strain energy and can serve as the foundation for predicting fault behavior and strong ground motion. dynamic rupture modeling requires the use of today’s most powerful supercomputers because representa-tions of faults have to span spatial scales covering many orders of magnitude, and because physical quantities must be calcu-lated at all causally connected points to properly account for stress and slip evolution.
Physics-based Prediction of ground motions using realistic Fault rupture models and 3d geological Structures
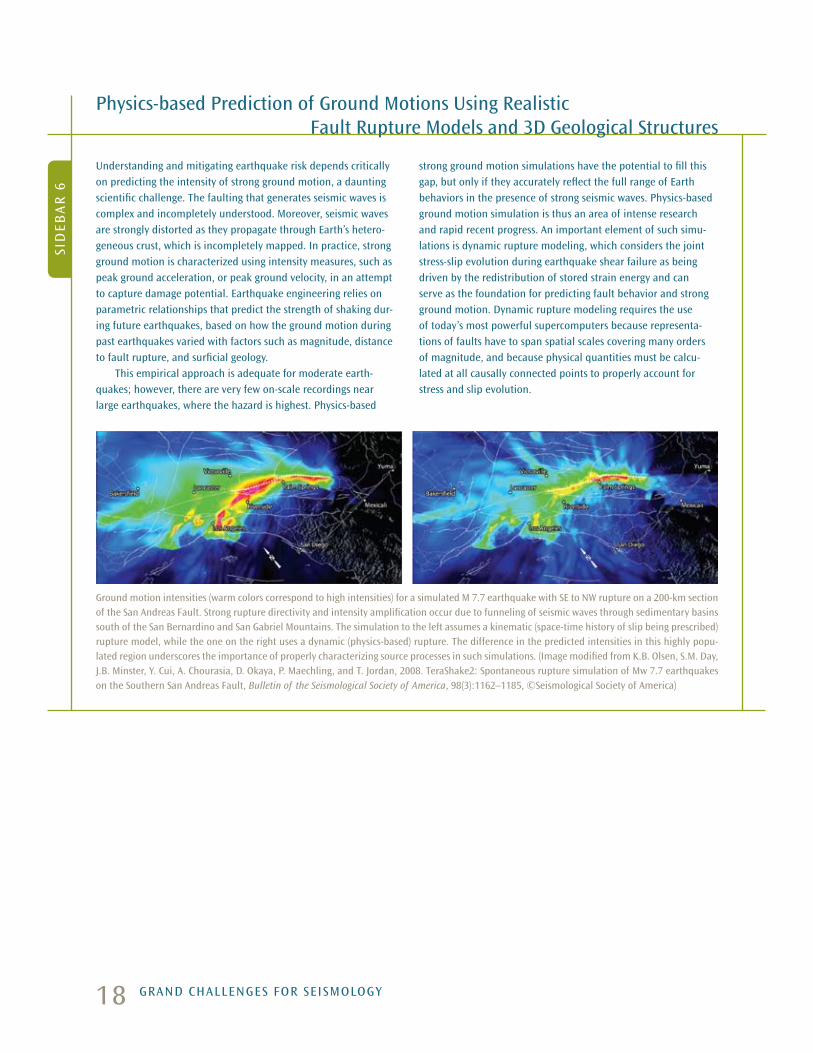
ground motion intensities (warm colors correspond to high intensities) for a simulated m 7.7 earthquake with Se to nW rupture on a 200-km section of the San andreas Fault. Strong rupture directivity and intensity amplification occur due to funneling of seismic waves through sedimentary basins south of the San bernardino and San gabriel mountains. the simulation to the left assumes a kinematic (space-time history of slip being prescribed) rupture model, while the one on the right uses a dynamic (physics-based) rupture. the difference in the predicted intensities in this highly popu-lated region underscores the importance of properly characterizing source processes in such simulations. (image modified from k.b. olsen, S.m. day, J.b. minster, y. cui, a. chourasia, d. okaya, P. maechling, and t. Jordan, 2008. teraShake2: Spontaneous rupture simulation of mw 7.7 earthquakes on the Southern San andreas Fault, Bulletin of the Seismological Society of America, 98(3):1162–1185, ©Seismological Society of america)
Sid
eba
r 6
19
Near-surface processes affect water, energy, and min-eral resources at depths of meters to a few kilometers. Detailed knowledge of Earth’s near surface is there-fore a crucial part of managing a sustainable environ-ment for civilization.
Near-surface geophysics is undergoing explosive growth because of societal interests in assessing the impact of human activities on our environment. Although the near surface is accessible to drilling and excavation, those activities cannot provide the needed temporal and spatial resolution and must be comple-mented by near-surface geophysics to “connect the dots.” Seismology provides a number of cost-effec-tive and noninvasive near-surface imaging methods, including the use of refracted, reflected, and converted body waves, and surface waves to produce 3D and 4D (time-varying) subsurface maps that have applica-tions for hydrology, civil engineering, earthquake haz-ard assessment, archeology, nuclear blast detection, and many other critical issues.
Shallow seismic methods play a key role in determin-ing a vast range of geotechnical properties that are critical to the built environment. Depth to bedrock, the load-bearing strength of shallow materials, and the expansive potential of soils can all be estimated from the properties of seismic waves. Seismic stud-ies in conjunction with coring can be used to map lateral changes in specific soil horizons beneath con-struction sites. The shear modulus of soils is a critical engineering strength parameter for assessing the sta-bility of embankments, buildings, and the foundations of other structures, and it can be quantified by non-invasive seismic shear-wave studies using controlled seismic sources and/or background seismic noise. The extent, thickness, and volume of unstable slopes and past landslides, and mapping weak horizons at their bases, can be used to assess hazards and direct mit-igation strategies. Microearthquakes along the sides and bottoms of landslides can potentially be used as a proxy to monitor creep using seismic methods.
0
2
4
6
8
10
12
14
0 5 10 15 20
140 340 540 740 940 1140 1340 1540 1700
Velocity (m/s)
NorthSouth
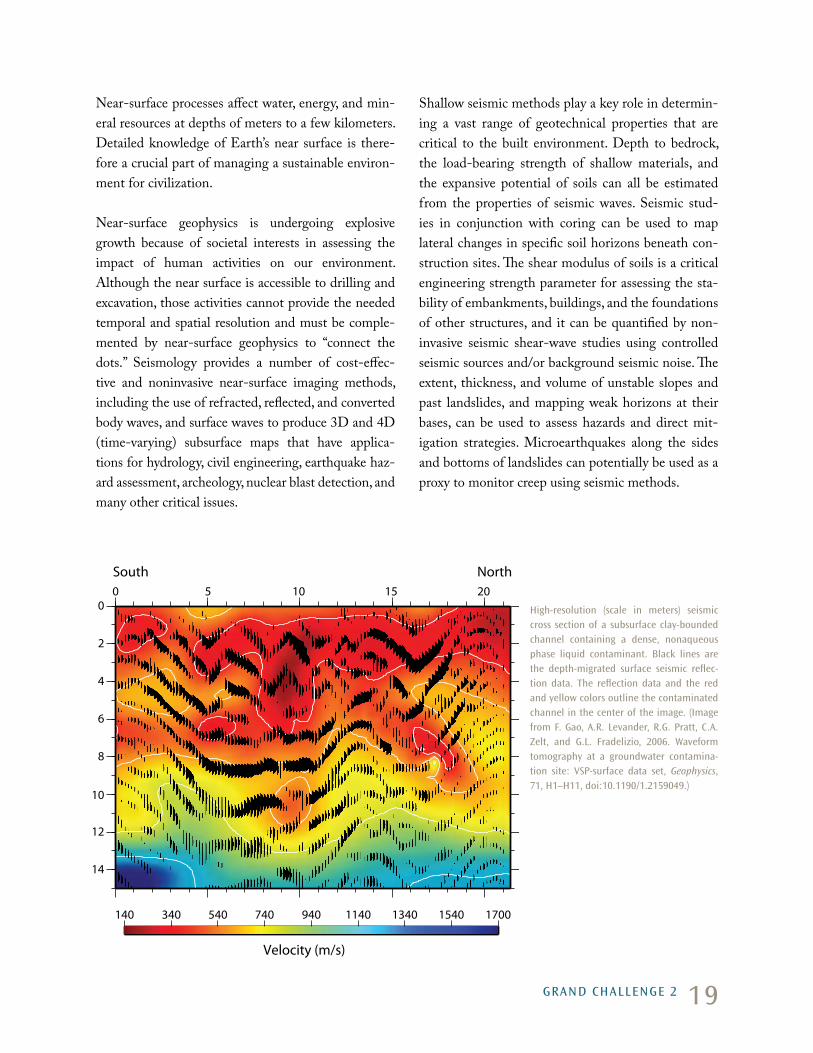
high-resolution (scale in meters) seismic cross section of a subsurface clay-bounded channel containing a dense, nonaqueous phase liquid contaminant. black lines are the depth-migrated surface seismic reflec-tion data. the reflection data and the red and yellow colors outline the contaminated channel in the center of the image. (image from F. gao, a.r. levander, r.g. Pratt, c.a. Zelt, and g.l. Fradelizio, 2006. Waveform tomography at a groundwater contamina-tion site: VSP-surface data set, Geophysics, 71, h1–h11, doi:10.1190/1.2159049.)
grand challenge 2
20
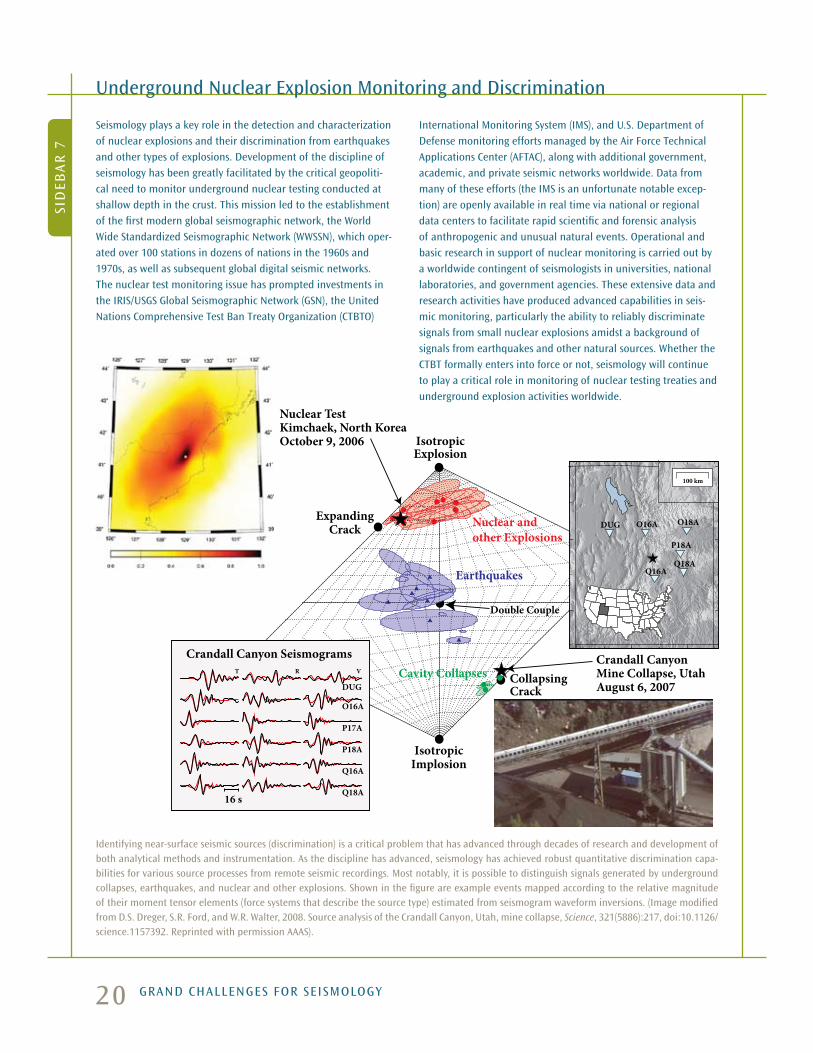
underground nuclear explosion monitoring and discrimination
Sid
eba
r 7
identifying near-surface seismic sources (discrimination) is a critical problem that has advanced through decades of research and development of both analytical methods and instrumentation. as the discipline has advanced, seismology has achieved robust quantitative discrimination capa-bilities for various source processes from remote seismic recordings. most notably, it is possible to distinguish signals generated by underground collapses, earthquakes, and nuclear and other explosions. Shown in the figure are example events mapped according to the relative magnitude of their moment tensor elements (force systems that describe the source type) estimated from seismogram waveform inversions. (image modified from d.S. dreger, S.r. Ford, and W.r. Walter, 2008. Source analysis of the crandall canyon, utah, mine collapse, Science, 321(5886):217, doi:10.1126/science.1157392. reprinted with permission aaaS).
Double Couple
IsotropicImplosion
ExpandingCrack
CollapsingCrack
IsotropicExplosion
Nuclear andother Explosions
Earthquakes
Crandall CanyonMine Collapse, UtahAugust 6, 2007
Cavity Collapses
Nuclear TestKimchaek, North KoreaOctober 9, 2006
DUG
O16A
P17A
P18A
Q16A
Q18A16 s
T R V
Crandall Canyon Seismograms
DUG O16A O18A
P18A
Q16AQ18A
100 km
grand challengeS For SeiSmology
Seismology plays a key role in the detection and characterization of nuclear explosions and their discrimination from earthquakes and other types of explosions. development of the discipline of seismology has been greatly facilitated by the critical geopoliti-cal need to monitor underground nuclear testing conducted at shallow depth in the crust. this mission led to the establishment of the first modern global seismographic network, the World Wide Standardized Seismographic network (WWSSn), which oper-ated over 100 stations in dozens of nations in the 1960s and 1970s, as well as subsequent global digital seismic networks. the nuclear test monitoring issue has prompted investments in the iriS/uSgS global Seismographic network (gSn), the united nations comprehensive test ban treaty organization (ctbto)
international monitoring System (imS), and u.S. department of defense monitoring efforts managed by the air Force technical applications center (aFtac), along with additional government, academic, and private seismic networks worldwide. data from many of these efforts (the imS is an unfortunate notable excep-tion) are openly available in real time via national or regional data centers to facilitate rapid scientific and forensic analysis of anthropogenic and unusual natural events. operational and basic research in support of nuclear monitoring is carried out by a worldwide contingent of seismologists in universities, national laboratories, and government agencies. these extensive data and research activities have produced advanced capabilities in seis-mic monitoring, particularly the ability to reliably discriminate signals from small nuclear explosions amidst a background of signals from earthquakes and other natural sources. Whether the ctbt formally enters into force or not, seismology will continue to play a critical role in monitoring of nuclear testing treaties and underground explosion activities worldwide.
21
One of the most important challenges for seismology is to understand how strong ground motions are pro-duced by earthquakes, and to translate this understand-ing into improved National Seismic Hazard Maps that can be directly utilized by the earthquake engineer-ing community. The intensity of earthquake shaking is profoundly influenced, and commonly amplified, by soils and other shallow geologic structures such as basins, resulting in rapidly varying strong ground motions. There can be strong coupling of time-depen-dent earthquake rupture and seismic wave generation with basin responses, which can be quantified by com-prehensive 3D modeling for scenario earthquakes. Characterizing the seismic properties of shallow sedi-mentary deposits and crustal basins is thus crucial to assessing potential damage during earthquakes.
The potential for soil to liquefy in strong shaking may also be discernible from seismic properties such as shear-wave speed and attenuation, coupled with other geotechnical measurements. Ground rupture and seis-mic hazard can be predicted by mapping faults at the surface and in the subsurface using seismically imaged offsets in shallow layers. Nonlinear responses of the shallow surface materials to strong shaking can be characterized, along with evaluating the behavior of urban infrastructure embedded in the shallow mate-rials. Improving the models of earthquake occurrence and the complexity of strong ground motions for realistic earthquake ruptures into improved National Seismic Hazard Maps is a critical undertaking that straddles the interface between seismology and earthquake engineering.
Seismic refraction and reflection methods are well-suited to mapping the geometry and bulk mineralogy of shallow rock units, but also can be used to infer porosity and pore-fluid saturation, which are essen-tial for hydrological characterization. In addition to delineating aquifers in sedimentary basins, seismol-ogy can be used to map aquifers in fractured rock in regions with more limited groundwater supply.
Compartmentalization or connectivity of reservoirs, dictated by the presence of faults and other struc-tures, is important to predicting how much water may be pumped from a well, and is crucial to maintain-ing water quality and mapping the flow of natural or human groundwater contamination.
Determining Earth’s record of natural climate change relies in part on seismic imaging of shallow sedi-mentary deposits that record and respond to climate variations. In lake and near shore settings, subtle cli-mate changes alter water levels, biologic activity, and stream sediment, leaving records in the type and thickness of water-bottom deposits. Depositional patterns over large areas are best mapped by seismic reflection, which images boundaries of velocity con-trasts. Complementary drilling programs in lake and ocean sediments are generally best designed utilizing stratigraphic patterns mapped in 2D or 3D by seismic reflections. Seismic stratigraphy at the basin scale and on continental margins has long been used to identify sea level changes through time. Such efforts examine, at very high resolution, the shallowest and youngest sediments to constrain climate, typically during the past few hundred thousand years.
Near-surface problems are usually addressed through a combination of shallow geophysical methods and subsurface sampling. Seismic measurements give part of the picture, but incorporation of gravity, electri-cal, magnetic, radar, and electromagnetic induction data offers improved characterization of the shallow subsurface. An important challenge is joint inversion and interpretation of diverse data for a single consis-tent subsurface model, including direct identification of sediment, rock, and fluid properties (e.g., porosity and permeability). Such joint inversions are an area of exceptional research promise and presently require careful site-dependent calibration.
grand challenge 2
22
SeiSmological aPProacheS and reQuirementS to make ProgreSS
• Develop and broadly disseminate improved 3D wave propagation capabilities for extremely hetero-geneous media.
• Develop combined active and passive imaging methodologies using ambient noise.
• Provide dense instrumentation for 4D characteriza-tions of near-source environments.
• Explore cross-disciplinary approaches for quanti-fication of material properties and their nonlinear relationships.
• Increase the number of inexpensive sensors and recording systems to enable multiscale imaging of near-surface environments over large areal extents.
• Add source facilities for high-resolution shallow subsurface mapping in diverse environments.
key QueStionS and iSSueS
• How can the acute heterogeneity in the near sur-face best be imaged and its material properties con-strained in diverse applications?
• How do soils respond to strong ground shaking, and how are nonlinear properties of near-surface materials best calibrated?
• To what extent can seismology resolve permeability and temporal changes in permeability at depth?
• Can physics-based predictions of strong ground motion couple with performance-based engineer-ing to improve seismic hazard mitigation?
• How can the National Seismic Hazard Maps be improved using advanced physics-based under-standing of earthquake ruptures and strong ground motions?
• How can time-dependent properties of shallow aquifers best be characterized to monitor water and contaminant transport?
• Can potential ground failures from landslides and karst be robustly assessed and monitored?
• Can nuclear testing be monitored with confi-dence levels necessary for the Comprehensive Test Ban Treaty?
• What is the resolution of seismological techniques to identify and locate unexploded ordinance, tun-nels, buried landfills, and other human-made sub-surface hazards?
grand challengeS For SeiSmology
23
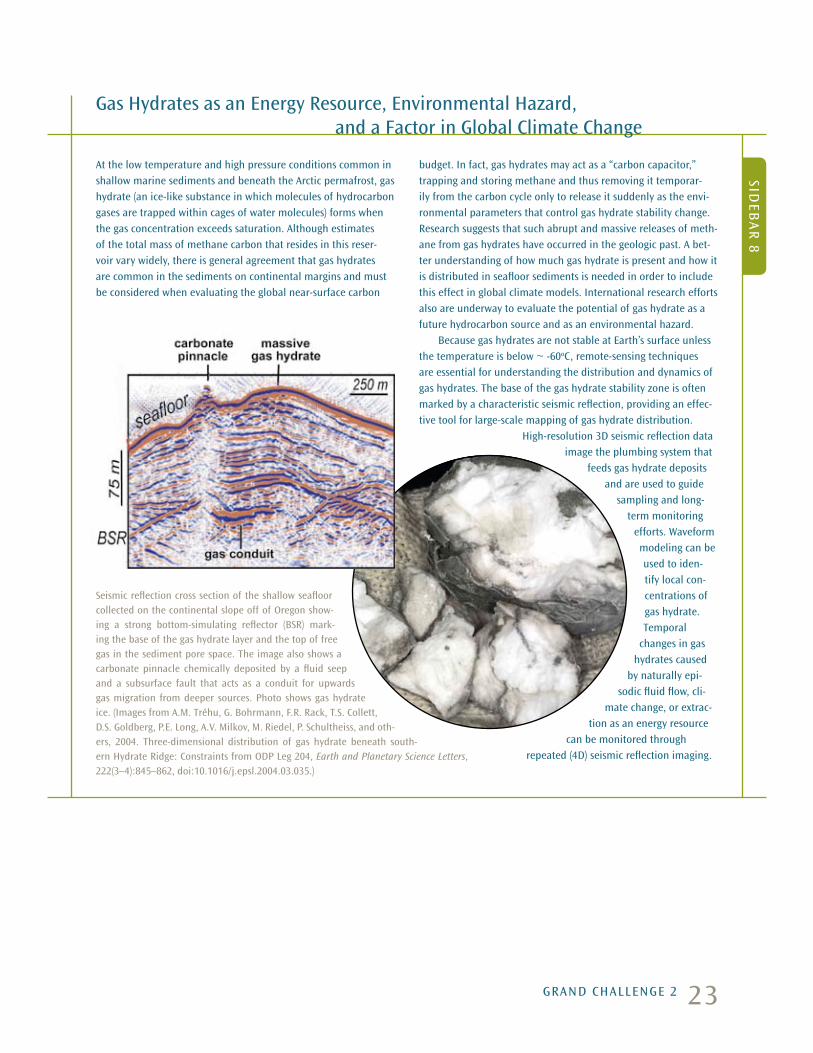
at the low temperature and high pressure conditions common in shallow marine sediments and beneath the arctic permafrost, gas hydrate (an ice-like substance in which molecules of hydrocarbon gases are trapped within cages of water molecules) forms when the gas concentration exceeds saturation. although estimates of the total mass of methane carbon that resides in this reser-voir vary widely, there is general agreement that gas hydrates are common in the sediments on continental margins and must be considered when evaluating the global near-surface carbon
budget. in fact, gas hydrates may act as a “carbon capacitor,” trapping and storing methane and thus removing it temporar-ily from the carbon cycle only to release it suddenly as the envi-ronmental parameters that control gas hydrate stability change. research suggests that such abrupt and massive releases of meth-ane from gas hydrates have occurred in the geologic past. a bet-ter understanding of how much gas hydrate is present and how it is distributed in seafloor sediments is needed in order to include this effect in global climate models. international research efforts also are underway to evaluate the potential of gas hydrate as a future hydrocarbon source and as an environmental hazard. because gas hydrates are not stable at earth’s surface unless the temperature is below ~ -60oc, remote-sensing techniques are essential for understanding the distribution and dynamics of gas hydrates. the base of the gas hydrate stability zone is often marked by a characteristic seismic reflection, providing an effec-tive tool for large-scale mapping of gas hydrate distribution.
high-resolution 3d seismic reflection data image the plumbing system that
feeds gas hydrate deposits and are used to guide
sampling and long-term monitoring
efforts. Waveform modeling can be used to iden-tify local con-centrations of gas hydrate. temporal
changes in gas hydrates caused
by naturally epi-sodic fluid flow, cli-
mate change, or extrac-tion as an energy resource
can be monitored through repeated (4d) seismic reflection imaging.
gas hydrates as an energy resource, environmental hazard, and a Factor in global climate change
Seismic reflection cross section of the shallow seafloor collected on the continental slope off of oregon show-ing a strong bottom-simulating reflector (bSr) mark-ing the base of the gas hydrate layer and the top of free gas in the sediment pore space. the image also shows a carbonate pinnacle chemically deposited by a fluid seep and a subsurface fault that acts as a conduit for upwards gas migration from deeper sources. Photo shows gas hydrate ice. (images from a.m. tréhu, g. bohrmann, F.r. rack, t.S. collett, d.S. goldberg, P.e. long, a.V. milkov, m. riedel, P. Schultheiss, and oth-ers, 2004. three-dimensional distribution of gas hydrate beneath south-ern hydrate ridge: constraints from odP leg 204, Earth and Planetary Science Letters, 222(3–4):845–862, doi:10.1016/j.epsl.2004.03.035.)
Sideb
ar
8
grand challenge 2
24 grand challengeS For SeiSmology
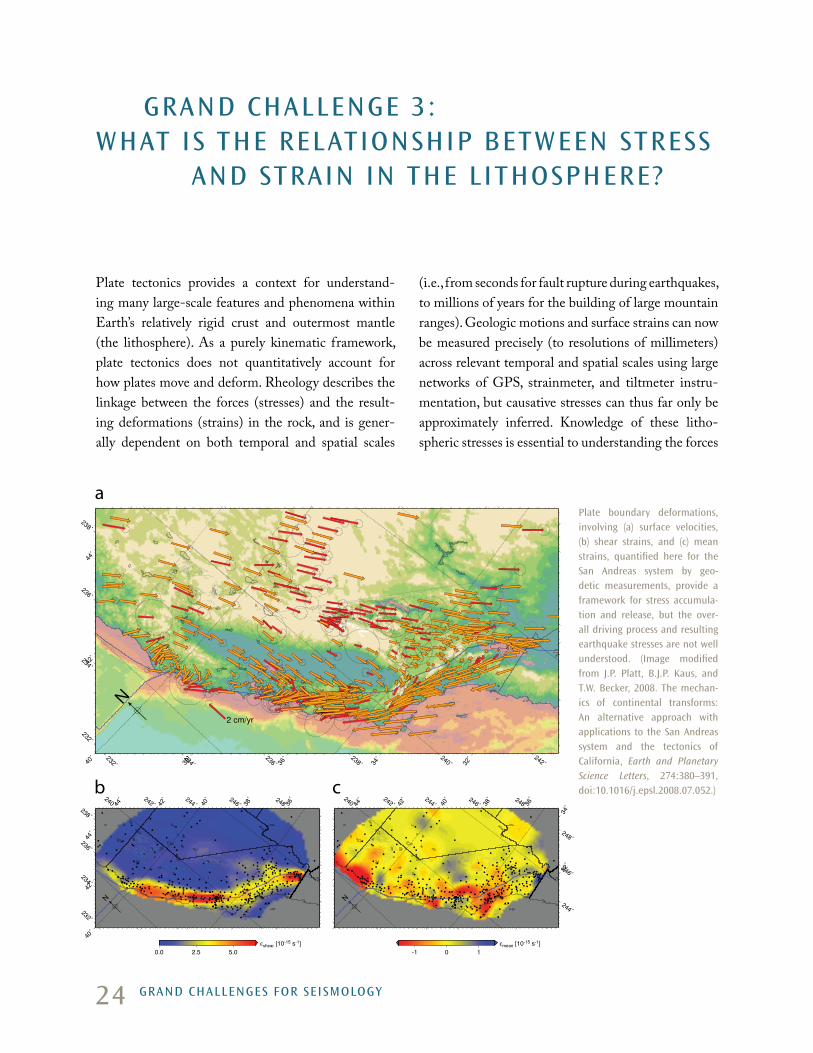
Plate tectonics provides a context for understand-ing many large-scale features and phenomena within Earth’s relatively rigid crust and outermost mantle (the lithosphere). As a purely kinematic framework, plate tectonics does not quantitatively account for how plates move and deform. Rheology describes the linkage between the forces (stresses) and the result-ing deformations (strains) in the rock, and is gener-ally dependent on both temporal and spatial scales
(i.e., from seconds for fault rupture during earthquakes, to millions of years for the building of large mountain ranges). Geologic motions and surface strains can now be measured precisely (to resolutions of millimeters) across relevant temporal and spatial scales using large networks of GPS, strainmeter, and tiltmeter instru-mentation, but causative stresses can thus far only be approximately inferred. Knowledge of these litho-spheric stresses is essential to understanding the forces
grand challenge 3: What iS the relationShiP betWeen StreSS and Strain in the lithoSPhere?
Plate boundary deformations, involving (a) surface velocities, (b) shear strains, and (c) mean strains, quantified here for the San andreas system by geo-detic measurements, provide a framework for stress accumula-tion and release, but the over-all driving process and resulting earthquake stresses are not well understood. (image modified from J.P. Platt, b.J.P. kaus, and t.W. becker, 2008. the mechan-ics of continental transforms: an alternative approach with applications to the San andreas system and the tectonics of california, Earth and Planetary Science Letters, 274:380–391, doi:10.1016/j.epsl.2008.07.052.)
232˚
234˚
236˚
238˚
240˚242˚
244˚246˚
248˚ 36˚
38˚
40˚
40˚
42˚
42˚
44˚
44˚
0.0 2.5 5.0εshear [10-15 s-1]
N
240˚242˚
244˚
244˚
246˚
246˚
248˚
248˚
32˚
34˚36
˚
38˚
40˚
42˚
44˚
-1 0 1εmean [10-15 s-1]
N
a
b c
25grand challenge 3
driving deformation at plate boundaries and within plates, and localized redistribution of stress accom-panying the earthquake cycle. Seismology, along with geodesy and other geoscience disciplines, plays a fun-damental role in the Grand Challenge of quantifying the stress distribution, rheology, and thermodynamic properties of materials in the lithosphere.
Aftershocks provide the most general example of interacting earthquakes; changes in Earth’s static stress field surrounding the source region of a major earthquake can be related to aftershock occurrence. In addition, since the 1992 Landers earthquake, it has been clear that seismic waves from one event can trig-ger other earthquakes at much greater distances (up to tens of thousands of kilometers) than is possible with static stress changes. These local and remote trigger-ing phenomena reveal important attributes of stress in the Earth and their relationship to earthquake occur-rence, given that changes in stress caused by seismic
waves and faulting can be quantified. Relationships between aftershocks and slow deformations associated with post-earthquake re-equilibration from GPS and strainmeter observations can be used to resolve rheol-ogy and stress transfer mechanisms.
Many of the limitations on what can be learned from our seismic and geodetic data, imposed by the slow pace of geologic processes and the relatively short time of observation, may be partially overcome using com-puter simulations of the behavior of complex, inter-acting fault networks embedded in ever-more realis-tic Earth models. Earthquake sequence simulations spanning many thousands of earthquake cycles incor-porate the latest in “petascale” computing, to address how stress redistributes as fault systems evolve.
Seismic approaches can constrain diverse proper-ties of lithospheric structure, such as the depth and topography of the Moho (the discontinuity between
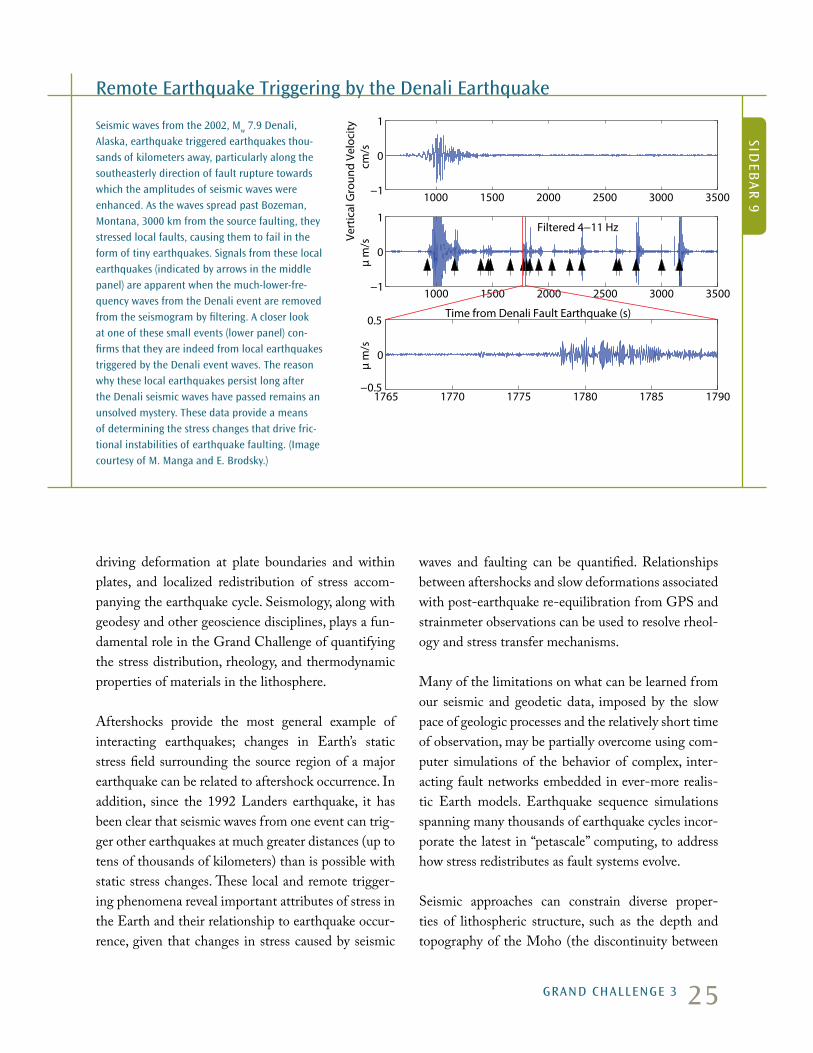
Seismic waves from the 2002, mw 7.9 denali,
alaska, earthquake triggered earthquakes thou-sands of kilometers away, particularly along the southeasterly direction of fault rupture towards which the amplitudes of seismic waves were enhanced. as the waves spread past bozeman, montana, 3000 km from the source faulting, they stressed local faults, causing them to fail in the form of tiny earthquakes. Signals from these local earthquakes (indicated by arrows in the middle panel) are apparent when the much-lower-fre-quency waves from the denali event are removed from the seismogram by filtering. a closer look at one of these small events (lower panel) con-firms that they are indeed from local earthquakes triggered by the denali event waves. the reason why these local earthquakes persist long after the denali seismic waves have passed remains an unsolved mystery. these data provide a means of determining the stress changes that drive fric-tional instabilities of earthquake faulting. (image courtesy of m. manga and e. brodsky.)
remote earthquake triggering by the denali earthquake
Sideb
ar
9
1000 1500 2000 2500 3000 3500−1
0
1
µ m
/s
Filtered 4−11 Hz
Time from Denali Fault Earthquake (s)
1765 1770 1775 1780 1785 1790−0.5
0
0.5
µ m
/sVe
rtic
al G
roun
d Ve
loci
ty
1000 1500 2000 2500 3000 3500−1
0
1
cm/s
26
the crust and mantle), 3D rigidity of the lithosphere, and identification of the brittle/ductile transition sep-arating regions of stick-slip faulting from fault creep. These models, combined with topographic and grav-ity data, can be used to estimate lithospheric stress and to assess the relative contributions between internal forces and plate boundary forces.
Anisotropy is an imprinted directionality in the structural and/or mineral fabric that causes seis-mic shear waves with different shaking directions to travel with different speeds. The analysis of modern three-component digital seismograms can separate
these different parts of the seismic wavefield to provide measures of anisotropy and constraints on the long-term history of strain in the lithosphere. Anisotropy measurements permit estimation of the magnitude and orientation of shear strain in the ductile sublitho-spheric mantle (the asthenosphere) and consequent inferences about the orientation of the shear stress at the base of the lithosphere. In many cases, seismically measured mantle anisotropy is used as a proxy for flow or deformation. These studies offer unique constraints on how flow affects plate motion and the transfer of stress to and within the lithosphere.
key QueStionS and iSSueS
• What is the state of stress on active faults and how does it vary in space and time?
• What are the stress-strain laws of faults and the surrounding crust that give rise to slow and fast slip?
• How do pore fluids influence the stress environ-ment in fault zones?
• What is the relative importance of static (elas-tic) versus dynamic (vibrational) stress changes for earthquake triggering?
• What is the time-dependent rheology (material response to forces) and its variability throughout the crust and mantle?
• How are new faults initiated and reactivated throughout Earth history?
• Are observed statistical characteristics of earth-quakes caused by material or geometric heterogene-ity or by nonlinear dynamics?
• Can we develop general models of strain accumula-tion and release consistent with geodesy, paleoseis-mology, landform evolution, and laboratory con-straints on rheology?
SeiSmological aPProacheS and reQuirementS to make ProgreSS
• Perform rapid post-event drilling into fault zones guided by 3D seismic imaging to quantify frictional heating and conduct time-dependent hydro-frac-ture measurements to quantify in situ stresses.
• Deploy new offshore ocean bottom seismom-eters (OBS), pressure sensors, and seafloor geo-detic instruments to understand submarine earthquake cycles.
• Increase coordination between different disciplines making stress and differential stress measurements.
• Determine changes in fault slip directions over time and model relative to absolute stresses.
• Develop robust anisotropic models for the lithosphere.
grand challengeS For SeiSmology
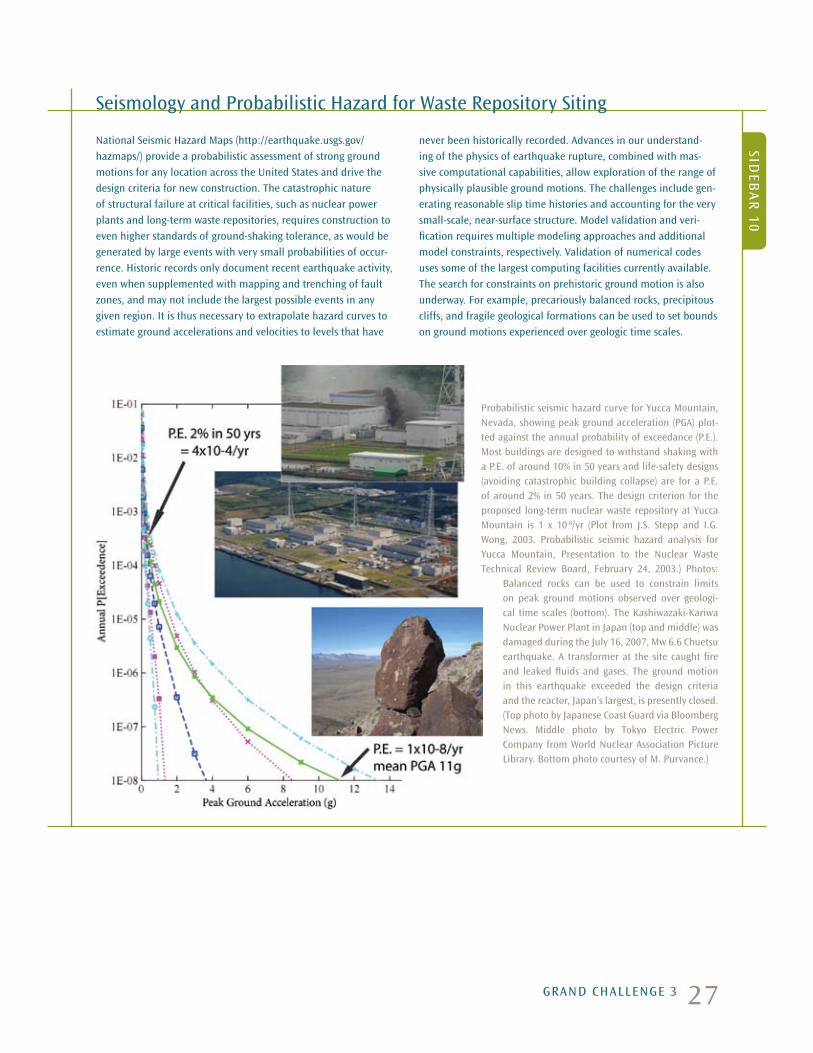
27
national Seismic hazard maps (http://earthquake.usgs.gov/hazmaps/) provide a probabilistic assessment of strong ground motions for any location across the united States and drive the design criteria for new construction. the catastrophic nature of structural failure at critical facilities, such as nuclear power plants and long-term waste repositories, requires construction to even higher standards of ground-shaking tolerance, as would be generated by large events with very small probabilities of occur-rence. historic records only document recent earthquake activity, even when supplemented with mapping and trenching of fault zones, and may not include the largest possible events in any given region. it is thus necessary to extrapolate hazard curves to estimate ground accelerations and velocities to levels that have
never been historically recorded. advances in our understand-ing of the physics of earthquake rupture, combined with mas-sive computational capabilities, allow exploration of the range of physically plausible ground motions. the challenges include gen-erating reasonable slip time histories and accounting for the very small-scale, near-surface structure. model validation and veri-fication requires multiple modeling approaches and additional model constraints, respectively. Validation of numerical codes uses some of the largest computing facilities currently available. the search for constraints on prehistoric ground motion is also underway. For example, precariously balanced rocks, precipitous cliffs, and fragile geological formations can be used to set bounds on ground motions experienced over geologic time scales.
Seismology and Probabilistic hazard for Waste repository Siting
Sideb
ar
10
Probabilistic seismic hazard curve for yucca mountain, nevada, showing peak ground acceleration (Pga) plot-ted against the annual probability of exceedance (P.e.). most buildings are designed to withstand shaking with a P.e. of around 10% in 50 years and life-safety designs (avoiding catastrophic building collapse) are for a P.e. of around 2% in 50 years. the design criterion for the proposed long-term nuclear waste repository at yucca mountain is 1 x 10⁻⁸/yr (Plot from J.S. Stepp and i.g. Wong, 2003. Probabilistic seismic hazard analysis for yucca mountain, Presentation to the nuclear Waste technical review board, February 24, 2003.) Photos:
balanced rocks can be used to constrain limits on peak ground motions observed over geologi-cal time scales (bottom). the kashiwazaki-kariwa nuclear Power Plant in Japan (top and middle) was damaged during the July 16, 2007, mw 6.6 chuetsu earthquake. a transformer at the site caught fire and leaked fluids and gases. the ground motion in this earthquake exceeded the design criteria and the reactor, Japan’s largest, is presently closed. (top photo by Japanese coast guard via bloomberg news. middle photo by tokyo electric Power company from World nuclear association Picture library. bottom photo courtesy of m. Purvance.)
grand challenge 3
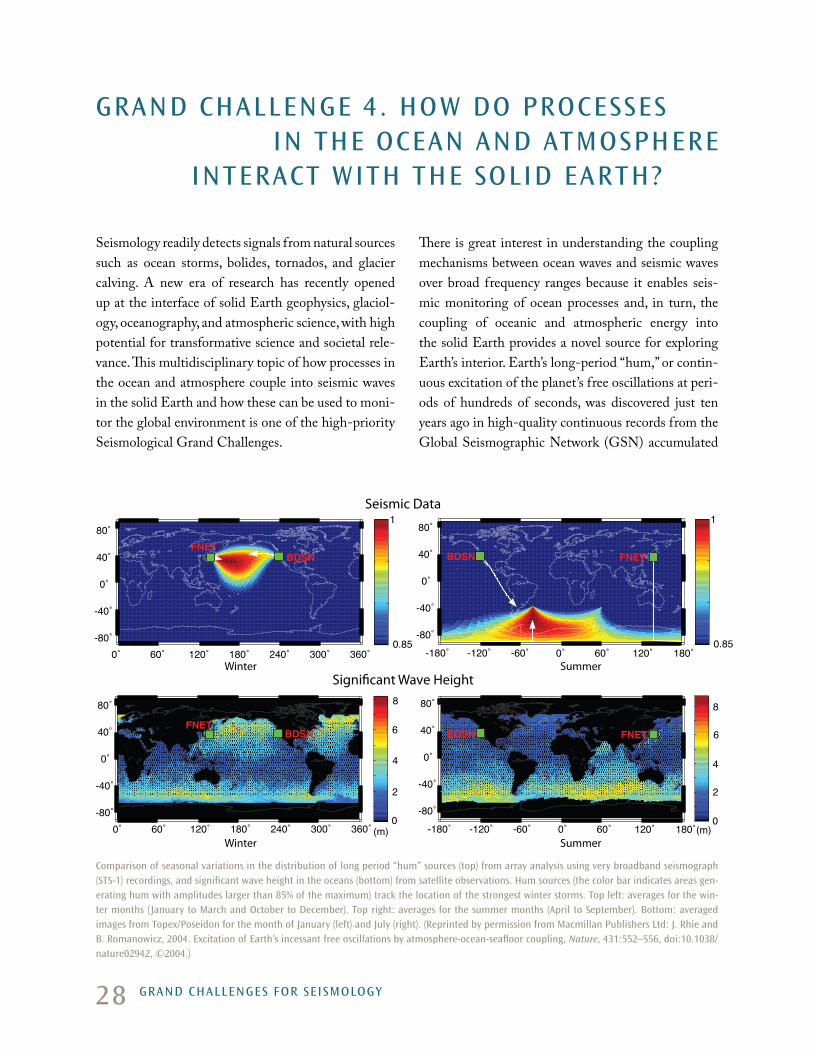
28
Seismology readily detects signals from natural sources such as ocean storms, bolides, tornados, and glacier calving. A new era of research has recently opened up at the interface of solid Earth geophysics, glaciol-ogy, oceanography, and atmospheric science, with high potential for transformative science and societal rele-vance. This multidisciplinary topic of how processes in the ocean and atmosphere couple into seismic waves in the solid Earth and how these can be used to moni-tor the global environment is one of the high-priority Seismological Grand Challenges.
There is great interest in understanding the coupling mechanisms between ocean waves and seismic waves over broad frequency ranges because it enables seis-mic monitoring of ocean processes and, in turn, the coupling of oceanic and atmospheric energy into the solid Earth provides a novel source for exploring Earth’s interior. Earth’s long-period “hum,” or contin-uous excitation of the planet’s free oscillations at peri-ods of hundreds of seconds, was discovered just ten years ago in high-quality continuous records from the Global Seismographic Network (GSN) accumulated
grand challenge 4. hoW do ProceSSeS in the ocean and atmoSPhere
interact With the Solid earth?
comparison of seasonal variations in the distribution of long period “hum” sources (top) from array analysis using very broadband seismograph (StS-1) recordings, and significant wave height in the oceans (bottom) from satellite observations. hum sources (the color bar indicates areas gen-erating hum with amplitudes larger than 85% of the maximum) track the location of the strongest winter storms. top left: averages for the win-ter months (January to march and october to december). top right: averages for the summer months (april to September). bottom: averaged images from topex/Poseidon for the month of January (left) and July (right). (reprinted by permission from macmillan Publishers ltd: J. rhie and b. romanowicz, 2004. excitation of earth’s incessant free oscillations by atmosphere-ocean-seafloor coupling, Nature, 431:552–556, doi:10.1038/nature02942, ©2004.)
0.85
1
0˚ 60˚ 120˚ 180˚ 240˚ 300˚ 360˚-80˚
-40˚
0˚
40˚
80˚FNET
BDSN
0.85
1
-180˚ -120˚ -60˚ 0˚ 60˚ 120˚ 180˚
-80˚
-40˚
0˚
40˚
80˚
FNETBDSN
0˚ 60˚ 120˚ 180˚ 240˚ 300˚ 360˚-80˚
-40˚
0˚
40˚
80˚
0
2
4
6
8
BDSNFNET
(m) -180˚ -120˚ -60˚ 0˚ 60˚ 120˚ 180˚
-80˚
-40˚
0˚
40˚
80˚
0
2
4
6
8
BDSN FNET
(m)
Seismic Data
Winter Summer
Winter Summer
Significant Wave Height
grand challengeS For SeiSmology
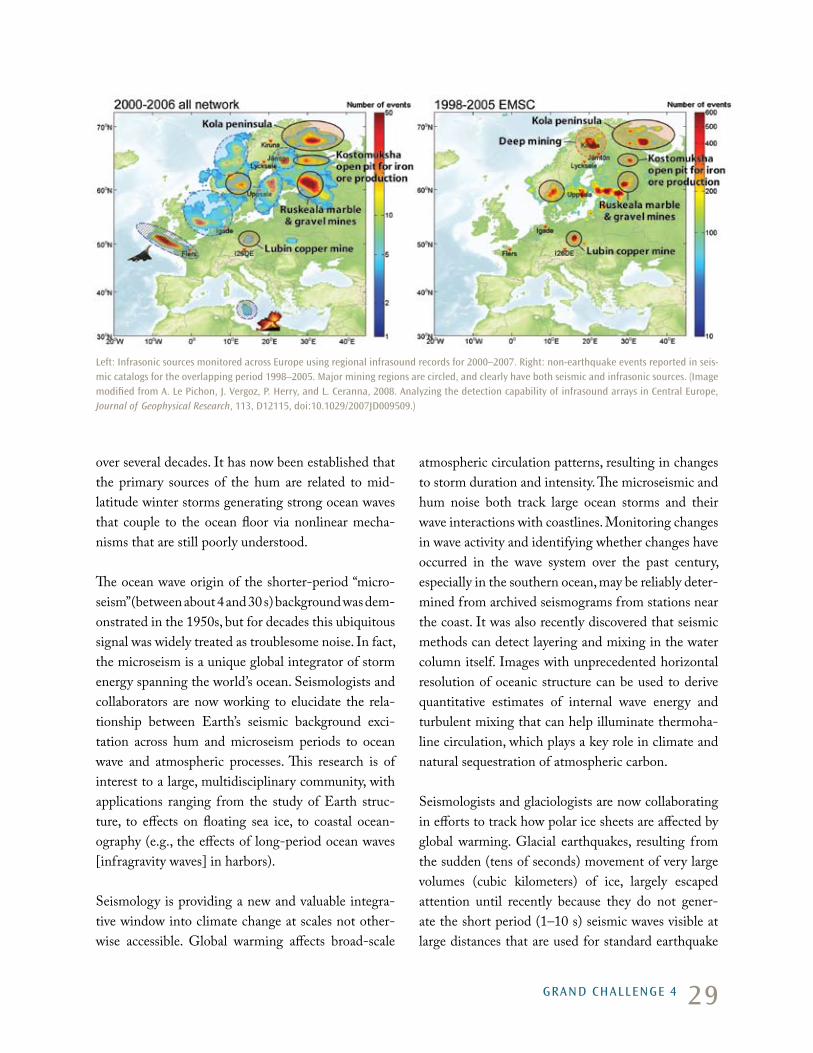
29
over several decades. It has now been established that the primary sources of the hum are related to mid-latitude winter storms generating strong ocean waves that couple to the ocean floor via nonlinear mecha-nisms that are still poorly understood.
The ocean wave origin of the shorter-period “micro-seism” (between about 4 and 30 s) background was dem-onstrated in the 1950s, but for decades this ubiquitous signal was widely treated as troublesome noise. In fact, the microseism is a unique global integrator of storm energy spanning the world’s ocean. Seismologists and collaborators are now working to elucidate the rela-tionship between Earth’s seismic background exci-tation across hum and microseism periods to ocean wave and atmospheric processes. This research is of interest to a large, multidisciplinary community, with applications ranging from the study of Earth struc-ture, to effects on floating sea ice, to coastal ocean-ography (e.g., the effects of long-period ocean waves [infragravity waves] in harbors).
Seismology is providing a new and valuable integra-tive window into climate change at scales not other-wise accessible. Global warming affects broad-scale
atmospheric circulation patterns, resulting in changes to storm duration and intensity. The microseismic and hum noise both track large ocean storms and their wave interactions with coastlines. Monitoring changes in wave activity and identifying whether changes have occurred in the wave system over the past century, especially in the southern ocean, may be reliably deter-mined from archived seismograms from stations near the coast. It was also recently discovered that seismic methods can detect layering and mixing in the water column itself. Images with unprecedented horizontal resolution of oceanic structure can be used to derive quantitative estimates of internal wave energy and turbulent mixing that can help illuminate thermoha-line circulation, which plays a key role in climate and natural sequestration of atmospheric carbon.
Seismologists and glaciologists are now collaborating in efforts to track how polar ice sheets are affected by global warming. Glacial earthquakes, resulting from the sudden (tens of seconds) movement of very large volumes (cubic kilometers) of ice, largely escaped attention until recently because they do not gener-ate the short period (1–10 s) seismic waves visible at large distances that are used for standard earthquake
left: infrasonic sources monitored across europe using regional infrasound records for 2000–2007. right: non-earthquake events reported in seis-mic catalogs for the overlapping period 1998–2005. major mining regions are circled, and clearly have both seismic and infrasonic sources. (image modified from a. le Pichon, J. Vergoz, P. herry, and l. ceranna, 2008. analyzing the detection capability of infrasound arrays in central europe, Journal of Geophysical Research, 113, d12115, doi:10.1029/2007Jd009509.)
grand challenge 4
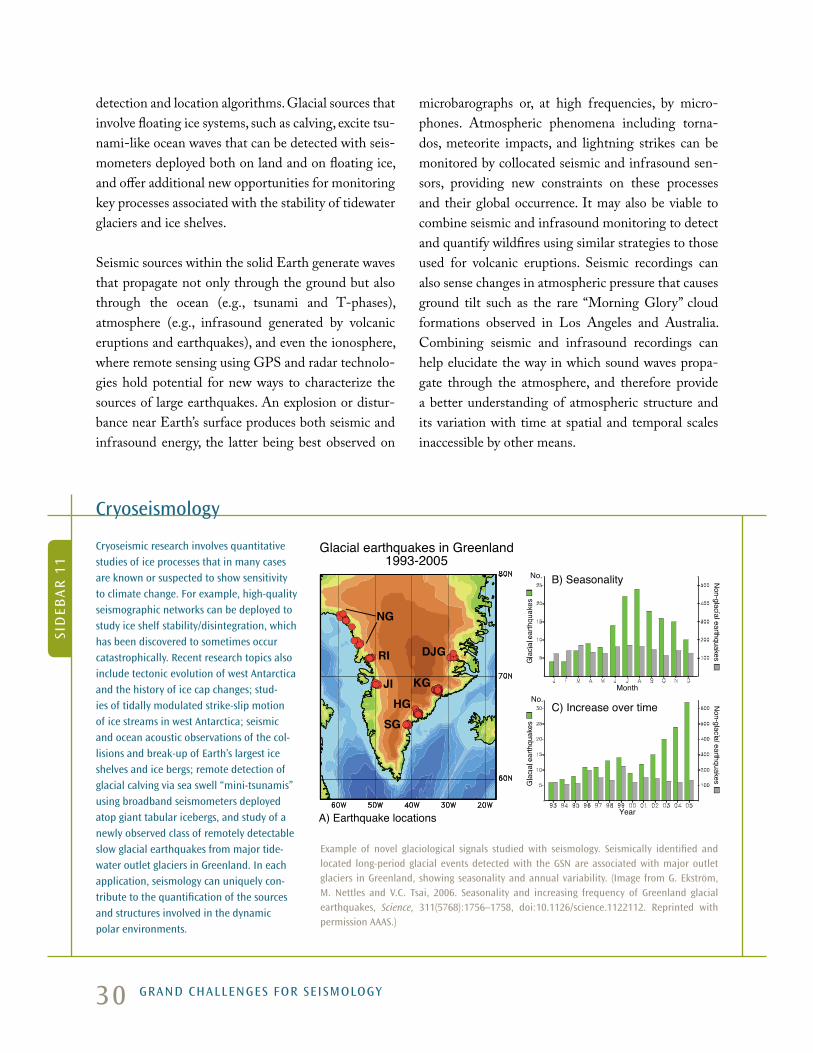
30
detection and location algorithms. Glacial sources that involve floating ice systems, such as calving, excite tsu-nami-like ocean waves that can be detected with seis-mometers deployed both on land and on floating ice, and offer additional new opportunities for monitoring key processes associated with the stability of tidewater glaciers and ice shelves.
Seismic sources within the solid Earth generate waves that propagate not only through the ground but also through the ocean (e.g., tsunami and T-phases), atmosphere (e.g., infrasound generated by volcanic eruptions and earthquakes), and even the ionosphere, where remote sensing using GPS and radar technolo-gies hold potential for new ways to characterize the sources of large earthquakes. An explosion or distur-bance near Earth’s surface produces both seismic and infrasound energy, the latter being best observed on
microbarographs or, at high frequencies, by micro-phones. Atmospheric phenomena including torna-dos, meteorite impacts, and lightning strikes can be monitored by collocated seismic and infrasound sen-sors, providing new constraints on these processes and their global occurrence. It may also be viable to combine seismic and infrasound monitoring to detect and quantify wildfires using similar strategies to those used for volcanic eruptions. Seismic recordings can also sense changes in atmospheric pressure that causes ground tilt such as the rare “Morning Glory” cloud formations observed in Los Angeles and Australia. Combining seismic and infrasound recordings can help elucidate the way in which sound waves propa-gate through the atmosphere, and therefore provide a better understanding of atmospheric structure and its variation with time at spatial and temporal scales inaccessible by other means.
cryoseismic research involves quantitative studies of ice processes that in many cases are known or suspected to show sensitivity to climate change. For example, high-quality seismographic networks can be deployed to study ice shelf stability/disintegration, which has been discovered to sometimes occur catastrophically. recent research topics also include tectonic evolution of west antarctica and the history of ice cap changes; stud-ies of tidally modulated strike-slip motion of ice streams in west antarctica; seismic and ocean acoustic observations of the col-lisions and break-up of earth’s largest ice shelves and ice bergs; remote detection of glacial calving via sea swell “mini-tsunamis” using broadband seismometers deployed atop giant tabular icebergs, and study of a newly observed class of remotely detectable slow glacial earthquakes from major tide-water outlet glaciers in greenland. in each application, seismology can uniquely con-tribute to the quantification of the sources and structures involved in the dynamic polar environments.
cryoseismology
Sid
eba
r 1
1
DJG
KG
HG
SG
JI
RI
NG
No.
No.Month
Year
Glacial earthquakes in Greenland1993-2005
B) Seasonality
C) Increase over time
A) Earthquake locations
example of novel glaciological signals studied with seismology. Seismically identified and located long-period glacial events detected with the gSn are associated with major outlet glaciers in greenland, showing seasonality and annual variability. (image from g. ekström, m. nettles and V.c. tsai, 2006. Seasonality and increasing frequency of greenland glacial earthquakes, Science, 311(5768):1756–1758, doi:10.1126/science.1122112. reprinted with permission aaaS.)
grand challengeS For SeiSmology
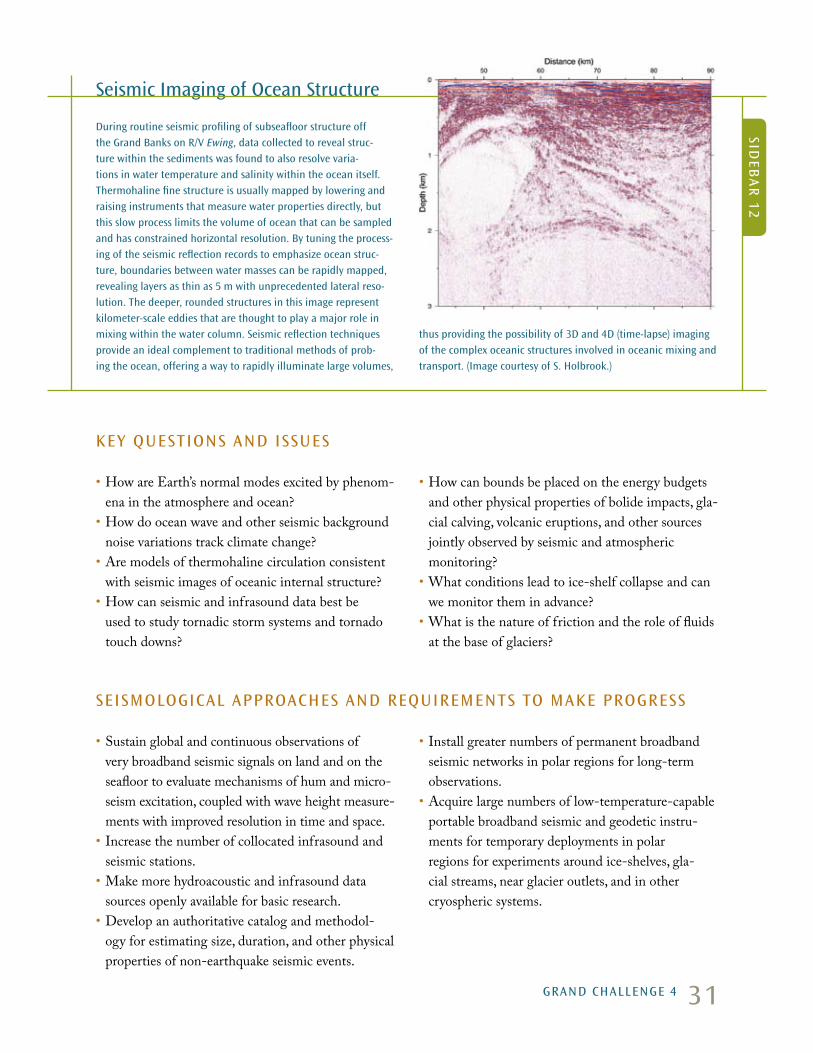
31
during routine seismic profiling of subseafloor structure off the grand banks on r/V Ewing, data collected to reveal struc-ture within the sediments was found to also resolve varia-tions in water temperature and salinity within the ocean itself. thermohaline fine structure is usually mapped by lowering and raising instruments that measure water properties directly, but this slow process limits the volume of ocean that can be sampled and has constrained horizontal resolution. by tuning the process-ing of the seismic reflection records to emphasize ocean struc-ture, boundaries between water masses can be rapidly mapped, revealing layers as thin as 5 m with unprecedented lateral reso-lution. the deeper, rounded structures in this image represent kilometer-scale eddies that are thought to play a major role in mixing within the water column. Seismic reflection techniques provide an ideal complement to traditional methods of prob-ing the ocean, offering a way to rapidly illuminate large volumes,
thus providing the possibility of 3d and 4d (time-lapse) imaging of the complex oceanic structures involved in oceanic mixing and transport. (image courtesy of S. holbrook.)
Sideb
ar
12
Seismic imaging of ocean Structure
key QueStionS and iSSueS
• How are Earth’s normal modes excited by phenom-ena in the atmosphere and ocean?
• How do ocean wave and other seismic background noise variations track climate change?
• Are models of thermohaline circulation consistent with seismic images of oceanic internal structure?
• How can seismic and infrasound data best be used to study tornadic storm systems and tornado touch downs?
• How can bounds be placed on the energy budgets and other physical properties of bolide impacts, gla-cial calving, volcanic eruptions, and other sources jointly observed by seismic and atmospheric monitoring?
• What conditions lead to ice-shelf collapse and can we monitor them in advance?
• What is the nature of friction and the role of fluids at the base of glaciers?
SeiSmological aPProacheS and reQuirementS to make ProgreSS
• Sustain global and continuous observations of very broadband seismic signals on land and on the seafloor to evaluate mechanisms of hum and micro-seism excitation, coupled with wave height measure-ments with improved resolution in time and space.
• Increase the number of collocated infrasound and seismic stations.
• Make more hydroacoustic and infrasound data sources openly available for basic research.
• Develop an authoritative catalog and methodol-ogy for estimating size, duration, and other physical properties of non-earthquake seismic events.
• Install greater numbers of permanent broadband seismic networks in polar regions for long-term observations.
• Acquire large numbers of low-temperature-capable portable broadband seismic and geodetic instru-ments for temporary deployments in polar regions for experiments around ice-shelves, gla-cial streams, near glacier outlets, and in other cryospheric systems.
grand challenge 4

32
Fluids in Earth’s interior can be detected by seismic waves because there are large contrasts in wave prop-erties between fluids and solids. Spatial and temporal variations in the distribution of water and hydrocar-bons are primary targets for high-resolution seismic imaging of the shallow Earth. Water and other volatiles also play major roles in controlling material rheology and magma production within the deeper Earth. Thus, mapping and monitoring changes in the distribution and circulation of fluids and volatiles in Earth’s interior is one of the key Seismological Grand Challenges.
Water is of fundamental importance to the evolution of the Earth, the only “water planet” in our solar sys-tem. Water affects the evolution of the continental and oceanic lithosphere by transferring geothermal heat during hydrothermal circulation. Water in pores and cracks weakens faults by reducing the effective pres-sure on the fault surface, it reacts with rocks to form minerals such as talc that further lubricate fault slip, and dissolved water in the mantle lowers viscosity of the asthenosphere, facilitating convection; indeed, it is widely accepted that these effects are necessary for plate tectonics. Carbon dioxide and water are fundamental drivers of explosive volcanic eruptions and these dis-solved gases lower the melting temperature needed for magma production. Water-filled cracks contribute sig-nificantly to the attenuation of seismic energy in the Earth, as can be clearly seen by comparison with the persistence of scattered energy on seismograms from the dry lunar crust. Fully developing and exploiting geothermal energy requires high-resolution knowl-edge of crustal structure and fluid distributions.
Water is carried back into the mantle by subduction. Although the amount at depth, particularly greater than about 400 km, is still unknown, it is likely that the mantle accommodates the water equivalent of several global oceans. It has recently been proposed that man-tle upwelling and mantle mineralogical phase transi-tions produce large regions of concentrated hydra-tion and partial melt near the global discontinuity at a depth of 410 km in the mantle. Understanding effects of water on ongoing mantle processes and Earth evolution has spawned scientifically rich multidisci-plinary observational and theoretical efforts employ-ing seismology, mineralogy, geodynamics, petrology, and rock mechanics.
Civilization is utterly dependent on access to fresh water from surface sources and from near-surface aquifers. Ninety-five percent of this accessible liquid fresh water is stored as groundwater (the vast majority of near-surface water is either ocean salt water or gla-cial ice). The recharge, flow, and storage of groundwa-ter are heavily influenced by geologic stratigraphy and fault distribution. The principal imaging of these criti-cally important subsurface structures is through seis-mology, which also offers the ability to estimate the volume of water stored within cracks and pores.
The formation, migration, and storage of Earth’s liquid and gas hydrocarbons, as well as geothermal energy reserves, are similarly constrained by geological struc-tures. Because of its unique ability to resolve subsur-face detail, seismology is thus not only key to survey-ing and assessing the large basins that hold most of the world’s usable groundwater, but is also the cornerstone of the global hydrocarbon exploration, production,
grand challenge 5. Where are Water and hydrocarbonS
hidden beneath the SurFace?
grand challengeS For SeiSmology

33
and reservoir management industry. Seismological techniques, including 4D (time-lapse) mapping, are increasingly used to monitor the extraction and move-ment of hydrocarbons and water in producing fields in real time. Seismic exploration and production on land and at sea is a multibillion dollar industry with major workforce needs now and in the future.
Resources are currently being extensively applied worldwide to investigate geological reservoirs for their carbon dioxide sequestration potential. Methodologies
for managing such sequestration efforts will rely crit-ically on seismology, both to monitor spatial and temporal changes in seismic velocities correspond-ing to the fluid content, and to detect brittle-failure-induced microearthquakes generated by the injec-tion process. Such methodologies are already in place in numerous producing hydrocarbon fields to mon-itor production and are readily adaptable to carbon sequestration applications.
Seismic reflection methods are the medical ultrasound of “mother” earth. they produce the highest-resolution images of the subsurface, and have been adopted globally by industry as an essential and cost-effective method of finding, develop-ing, extracting, and managing energy, mineral, and groundwater resources. industry enthusiastically adopted 3d seismic reflection imaging more than 20 years ago to image structural and reser-voir complexity, and more recently has developed 4d, or time-lapse repeat surveys, to monitor reservoir mechanical and fluid changes during resource extraction. this is increasingly accom-panied by monitoring of production-induced microearthquake activity. three-dimensional seismic reflection has enjoyed mod-erate usage in the coal industry, especially to delineate coal-bed
methane deposits, and is likely to grow as easily accessible depos-its are exhausted. Seismology is less commonly used in mineral exploration and development, but has great potential for growth; pioneering work outside of the united States has proven valu-able in mapping mineral deposits. challenges exist in adapting the petroleum industry tools to nonlayered and steeply dipping targets in crystalline rocks. Seismic imaging has also been used to track mining-induced stress changes in the rocks that lead to “mine bumps,” induced earthquakes, and cavern collapses, and plays a key role in mining safety measures. Similar coupled imag-ing and microearthquake monitoring holds great potential for geothermal energy exploration and production.
exploration Seismology and resources: energy and mining
the petroleum industry relies on high-resolution seismic surveying to map oil and gas reservoirs at depths of up to 7 km. though costly, 3d seismics yield the detail necessary to image the faults and complex sedimentary features that can trap energy reserves. this 3d “sonogram” traces the origin and properties of rock layers and reveals the most likely targets for drilling and extraction. using 3d seismic imaging, industry has cut the number of nonproducing “dry” holes by more than half since 1990. (Ship image from b. dragoset, 2005. The Leading Edge, 24:S46–S71, and Western geophysical. “F3” seismic data and analysis from F. aminzadeh, and P. de groot, 2006, Neural Networks and Other Soft Computing Techniques with Applications in the Oil Industry, eage book Series, iSbn 90-73781-50-7. Visualization by J. louie.)
key QueStionS and iSSueS
• How can we improve the detection, characteriza-tion, and production of hydrocarbon resources, including detecting deep deposits beneath salt,
finding small-scale pockets in incompletely extracted reservoirs, and monitoring porosity, per-meability, and fluid flow at high resolution?
grand challenge 5
Sideb
ar
13

34
the national need for well-trained geoscientists, including geo-physicists and seismologists is well documented by the u.S. department of labor, the u.S. department of education, and the american geological institute. the current geoscience workforce is aging, with the majority being within 15 years of retirement age. the current percentage of geoscientists between 31–35 years old is less than half that of geoscientists between 51–55 years old and there are not enough students being produced to fill the positions that will be vacated by retirements. by 2020, the cur-rent u.S. workforce, plus new u.S. entries, is estimated to fall short of the projected geoscientist demand from the petroleum industry alone by 20,000 jobs. the bureau of labor Statistics esti-mates an employment growth of 22% for geoscientists between 2006 and 2016, much faster than the average for all occupations. the need for energy, environmental protection, and respon-sible land and water management is expected to further spur employment demand. geoscience Phds are particularly needed for teaching and training the next generation of students, and for performing basic research. the “digest of educational Statistics” documents
the low number of geological sciences Phds (505 in ay 2005–2006). digest statistics show a high percentage of Phds being awarded to nonresident aliens in physical Sciences (44% in 2005–2006, an increasing percentage of which are returning to their home countries), and low participation rates by women (30% of the 2005–2006 Phds), and underrepresented minorities (4%). addressing the geoscience workforce issue requires atten-tion at the k–12 level, where u.S. students are lagging in science and mathematics training relative to international peers. efforts are needed to alert entering university student to the excitement and career potential for geoscience majors. a number of summer internship programs for undergraduates have been successful in promoting advanced study and careers in seismology. the nSF research experiences for undergraduates (reu) program has pro-moted internships associated with nSF-funded projects. Summer internships include those sponsored by iriS, Scec, and the ucar/unaVco SoarS/reSeSS program. Summer camps such as Sage provide technical training in applied geophysics in the field. these internships provide experiences that contribute to many students’ decisions to pursue graduate work in seismology and geophysics.
these efforts need to be sustained and expanded, and con-certed efforts need to address the pipelines that bring stu-dents into seismology and other geoscience disciplines.
Seismology Workforce issues
Sid
eba
r 1
4
iriS summer intern Justin brown servicing a seismograph station in the Valley of ten thousand Smokes of katmai national Park, alaska, in 2004. (image courtesy of iriS; photo by J. cundiff.)
iriS summer interns work with university faculty and graduate stu-dents to collect reflection data during the iriS intern program orienta-tion week at new mexico tech. (image courtesy of J. taber.)
grand challengeS For SeiSmology
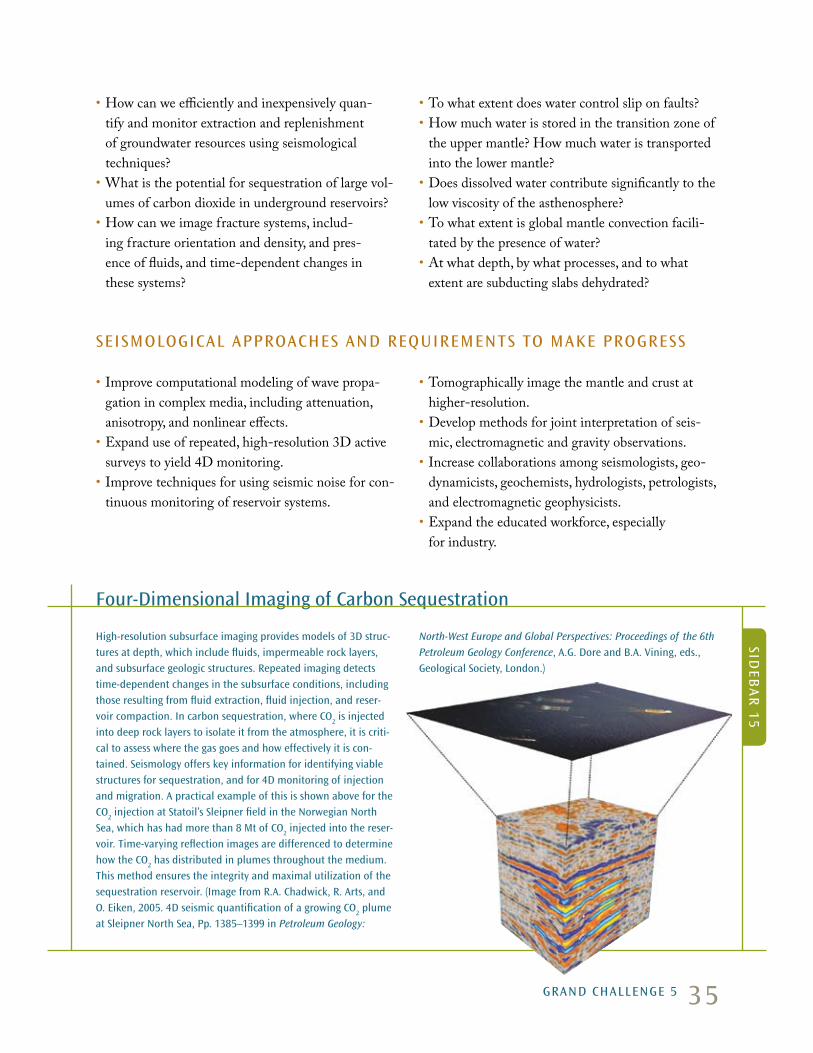
35
high-resolution subsurface imaging provides models of 3d struc-tures at depth, which include fluids, impermeable rock layers, and subsurface geologic structures. repeated imaging detects time-dependent changes in the subsurface conditions, including those resulting from fluid extraction, fluid injection, and reser-voir compaction. in carbon sequestration, where co
2 is injected
into deep rock layers to isolate it from the atmosphere, it is criti-cal to assess where the gas goes and how effectively it is con-tained. Seismology offers key information for identifying viable structures for sequestration, and for 4d monitoring of injection and migration. a practical example of this is shown above for the co
2 injection at Statoil’s Sleipner field in the norwegian north
Sea, which has had more than 8 mt of co2 injected into the reser-
voir. time-varying reflection images are differenced to determine how the co
2 has distributed in plumes throughout the medium.
this method ensures the integrity and maximal utilization of the sequestration reservoir. (image from r.a. chadwick, r. arts, and o. eiken, 2005. 4d seismic quantification of a growing co
2 plume
at Sleipner north Sea, Pp. 1385–1399 in Petroleum Geology:
North-West Europe and Global Perspectives: Proceedings of the 6th
Petroleum Geology Conference, a.g. dore and b.a. Vining, eds., geological Society, london.)
Sideb
ar
15
Four-dimensional imaging of carbon Sequestration
• How can we efficiently and inexpensively quan-tify and monitor extraction and replenishment of groundwater resources using seismological techniques?
• What is the potential for sequestration of large vol-umes of carbon dioxide in underground reservoirs?
• How can we image fracture systems, includ-ing fracture orientation and density, and pres-ence of fluids, and time-dependent changes in these systems?
• To what extent does water control slip on faults?• How much water is stored in the transition zone of
the upper mantle? How much water is transported into the lower mantle?
• Does dissolved water contribute significantly to the low viscosity of the asthenosphere?
• To what extent is global mantle convection facili-tated by the presence of water?
• At what depth, by what processes, and to what extent are subducting slabs dehydrated?
SeiSmological aPProacheS and reQuirementS to make ProgreSS
• Improve computational modeling of wave propa-gation in complex media, including attenuation, anisotropy, and nonlinear effects.
• Expand use of repeated, high-resolution 3D active surveys to yield 4D monitoring.
• Improve techniques for using seismic noise for con-tinuous monitoring of reservoir systems.
• Tomographically image the mantle and crust at higher-resolution.
• Develop methods for joint interpretation of seis-mic, electromagnetic and gravity observations.
• Increase collaborations among seismologists, geo-dynamicists, geochemists, hydrologists, petrologists, and electromagnetic geophysicists.
• Expand the educated workforce, especially for industry.
grand challenge 5
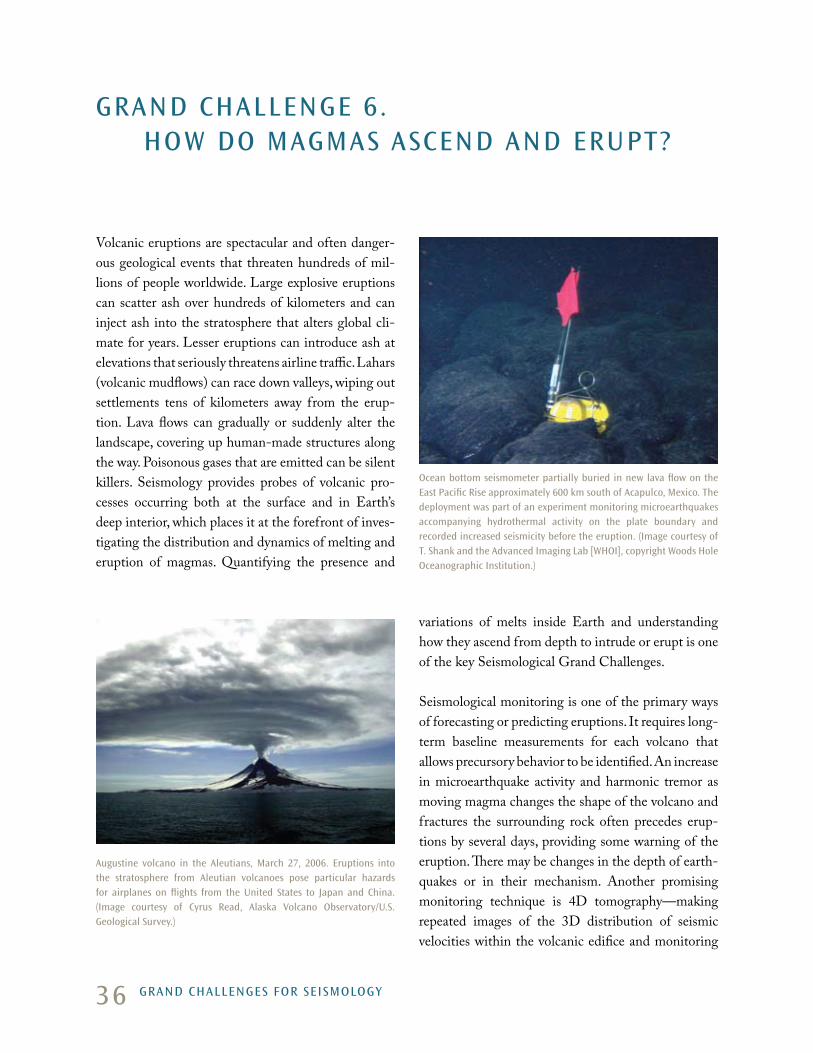
36
Volcanic eruptions are spectacular and often danger-ous geological events that threaten hundreds of mil-lions of people worldwide. Large explosive eruptions can scatter ash over hundreds of kilometers and can inject ash into the stratosphere that alters global cli-mate for years. Lesser eruptions can introduce ash at elevations that seriously threatens airline traffic. Lahars (volcanic mudflows) can race down valleys, wiping out settlements tens of kilometers away from the erup-tion. Lava flows can gradually or suddenly alter the landscape, covering up human-made structures along the way. Poisonous gases that are emitted can be silent killers. Seismology provides probes of volcanic pro-cesses occurring both at the surface and in Earth’s deep interior, which places it at the forefront of inves-tigating the distribution and dynamics of melting and eruption of magmas. Quantifying the presence and
variations of melts inside Earth and understanding how they ascend from depth to intrude or erupt is one of the key Seismological Grand Challenges.
Seismological monitoring is one of the primary ways of forecasting or predicting eruptions. It requires long-term baseline measurements for each volcano that allows precursory behavior to be identified. An increase in microearthquake activity and harmonic tremor as moving magma changes the shape of the volcano and fractures the surrounding rock often precedes erup-tions by several days, providing some warning of the eruption. There may be changes in the depth of earth-quakes or in their mechanism. Another promising monitoring technique is 4D tomography—making repeated images of the 3D distribution of seismic velocities within the volcanic edifice and monitoring
grand challenge 6. hoW do magmaS aScend and eruPt?
augustine volcano in the aleutians, march 27, 2006. eruptions into the stratosphere from aleutian volcanoes pose particular hazards for airplanes on flights from the united States to Japan and china. (image courtesy of cyrus read, alaska Volcano observatory/u.S. geological Survey.)
ocean bottom seismometer partially buried in new lava flow on the east Pacific rise approximately 600 km south of acapulco, mexico. the deployment was part of an experiment monitoring microearthquakes accompanying hydrothermal activity on the plate boundary and recorded increased seismicity before the eruption. (image courtesy of t. Shank and the advanced imaging lab [Whoi], copyright Woods hole oceanographic institution.)
grand challengeS For SeiSmology

37
changes in the medium’s velocity with time as cracks open or fluids migrate through them. Seismo-acoustic monitoring of infrasound signals from eruptions may be able to directly detect and recognize stratospheric ash injection and other key features of eruptions at great distances, providing rapid notification to warn aircraft of hazardous conditions.
Current eruption prediction methods are primar-ily empirically based, because we do not have enough information for a complete understanding of the underlying physical processes. The geometry of mag-matic plumbing systems of volcanoes is poorly known. To improve scientific understanding and eruption prediction capabilities, it is essential to both improve volcano instrumentation networks and to develop advanced methodologies that can better determine the physical changes that accompany eruptions, including improvements in capabilities to image the interior of volcanic systems and to quantitatively characterize magma migration and eruption processes.
In addition to the hazards posed by volcanoes, volcanic processes are of fundamental interest because they play a major role in shaping the sur-face of the planet. Eruptions and intrusions of magma are the pri-mary of forming new oceanic crust. For example, two-thirds of the Earth is covered by basaltic oceanic crust averaging 7-km thick, all formed by magma rising from the mantle at mid-ocean ridge spreading centers at diverging plate boundaries during the last 180 million years.
Hot mantle rocks partially melt and generate magma as they rise toward the surface at the mid-ocean ridge because the rapid drop in pressure in the upwelling material causes the hot rocks to exceed the melting
temperature. In contrast, melt production beneath volcanic arcs, such as the “ring of fire” surrounding the Pacific, is largely created by permeating the warm mantle wedge with aqueous fluids released from sub-ducted oceanic plates. This addition of water lowers the melting temperature of the mantle wedge, causing partial melting and magma ascent. Although magma composition, as studied by geochemists and petrolo-gists, can reveal the approximate conditions under which melting occurred, including pressure, temper-ature, and water content, the depth extent of melting and the migration pathways for magma from the deep melt production zone up to the surface can only be imaged with seismology.
Beneath mid-ocean ridges, mantle flow models and low-resolution seismic tomography suggest that par-tial melting occurs in a zone more than 100-km across at depths as great as 100 km, yet nearly all of it emerges at a plate boundary zone that is less than 1-km wide at the surface. It is not known whether this focusing
0
40
80
120
160
200100 km 200 300 400
−.08 −.04 0 .04 .08
∆ Vp/Vs
volcanoseismographearthquakes
trench
tomographic image of the ratio between P velocity and S velocity in a subduc-tion zone beneath nicaragua. the highest ratio (darkest red area) indicates the presence of melts rising from near the subducted oceanic plate. the sinking plate is indicated by earthquakes extending to depths of 175 km. Fluids released from the sinking plate lower the melting temperature of material in the mantle wedge, resulting in partial melting and ascent of magmas to the volcanic arc. (image from e.m. Syracuse, g.a. abers, k.m. Fischer, l.g. mackenzie, c.a. rychert, J.m. Protti, V. gonzalez, and W. Strauch, 2008. Seismic tomography and earthquake loca-tions in the nicaraguan and costa rican upper mantle, Geochemistry, Geophysics, Geosystems, 9, Q07S08, doi:10.1029/2008gc001963.)
grand challenge 6
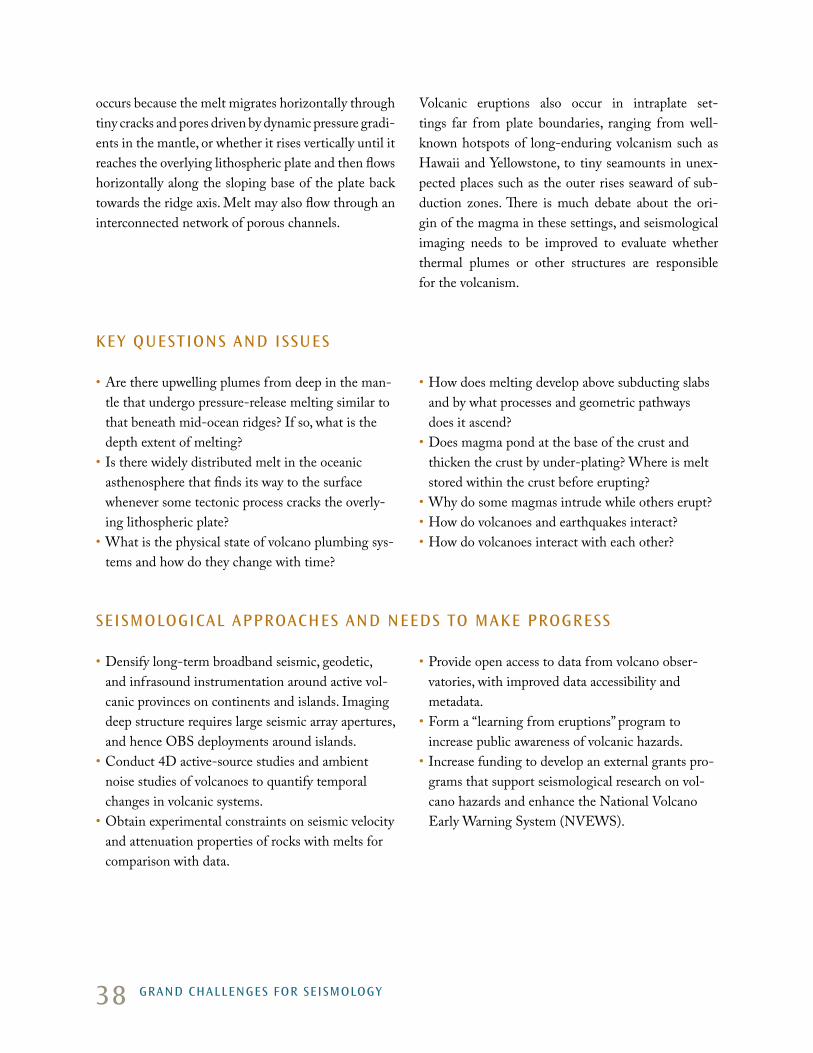
38
occurs because the melt migrates horizontally through tiny cracks and pores driven by dynamic pressure gradi-ents in the mantle, or whether it rises vertically until it reaches the overlying lithospheric plate and then flows horizontally along the sloping base of the plate back towards the ridge axis. Melt may also flow through an interconnected network of porous channels.
Volcanic eruptions also occur in intraplate set-tings far from plate boundaries, ranging from well-known hotspots of long-enduring volcanism such as Hawaii and Yellowstone, to tiny seamounts in unex-pected places such as the outer rises seaward of sub-duction zones. There is much debate about the ori-gin of the magma in these settings, and seismological imaging needs to be improved to evaluate whether thermal plumes or other structures are responsible for the volcanism.
key QueStionS and iSSueS
• Are there upwelling plumes from deep in the man-tle that undergo pressure-release melting similar to that beneath mid-ocean ridges? If so, what is the depth extent of melting?
• Is there widely distributed melt in the oceanic asthenosphere that finds its way to the surface whenever some tectonic process cracks the overly-ing lithospheric plate?
• What is the physical state of volcano plumbing sys-tems and how do they change with time?
• How does melting develop above subducting slabs and by what processes and geometric pathways does it ascend?
• Does magma pond at the base of the crust and thicken the crust by under-plating? Where is melt stored within the crust before erupting?
• Why do some magmas intrude while others erupt?• How do volcanoes and earthquakes interact?• How do volcanoes interact with each other?
SeiSmological aPProacheS and needS to make ProgreSS
• Densify long-term broadband seismic, geodetic, and infrasound instrumentation around active vol-canic provinces on continents and islands. Imaging deep structure requires large seismic array apertures, and hence OBS deployments around islands.
• Conduct 4D active-source studies and ambient noise studies of volcanoes to quantify temporal changes in volcanic systems.
• Obtain experimental constraints on seismic velocity and attenuation properties of rocks with melts for comparison with data.
• Provide open access to data from volcano obser-vatories, with improved data accessibility and metadata.
• Form a “learning from eruptions” program to increase public awareness of volcanic hazards.
• Increase funding to develop an external grants pro-grams that support seismological research on vol-cano hazards and enhance the National Volcano Early Warning System (NVEWS).
grand challengeS For SeiSmology
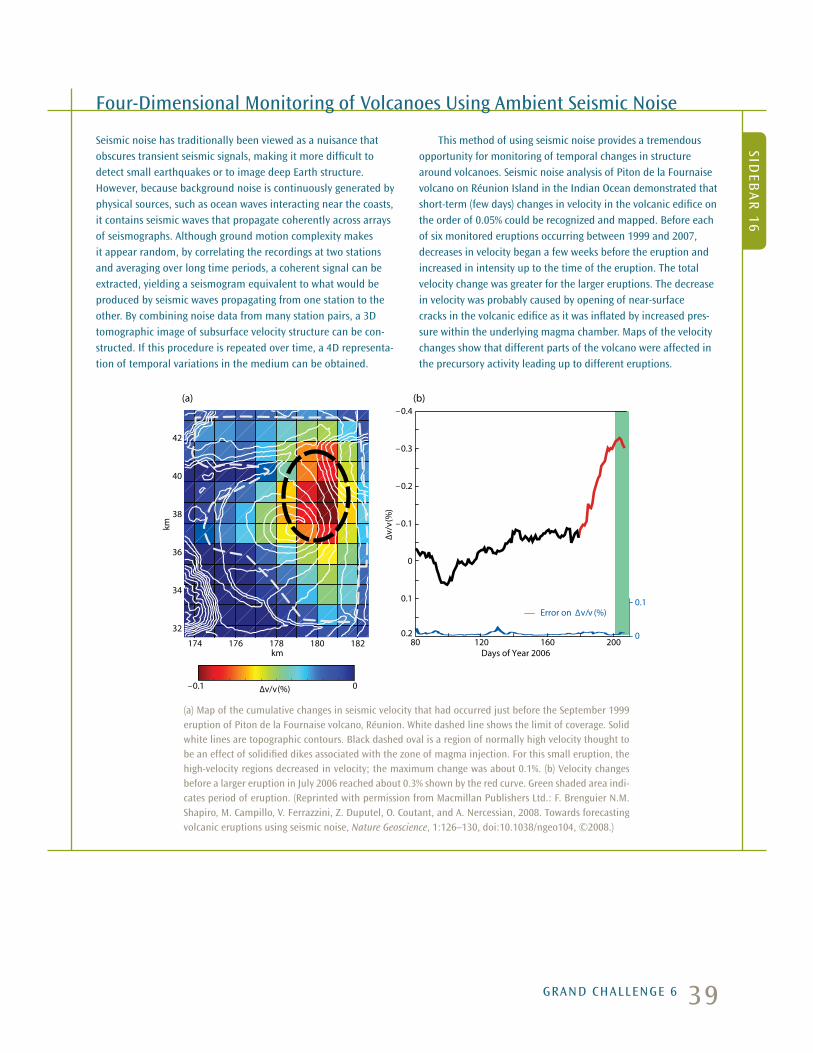
39
Seismic noise has traditionally been viewed as a nuisance that obscures transient seismic signals, making it more difficult to detect small earthquakes or to image deep earth structure. however, because background noise is continuously generated by physical sources, such as ocean waves interacting near the coasts, it contains seismic waves that propagate coherently across arrays of seismographs. although ground motion complexity makes it appear random, by correlating the recordings at two stations and averaging over long time periods, a coherent signal can be extracted, yielding a seismogram equivalent to what would be produced by seismic waves propagating from one station to the other. by combining noise data from many station pairs, a 3d tomographic image of subsurface velocity structure can be con-structed. if this procedure is repeated over time, a 4d representa-tion of temporal variations in the medium can be obtained.
this method of using seismic noise provides a tremendous opportunity for monitoring of temporal changes in structure around volcanoes. Seismic noise analysis of Piton de la Fournaise volcano on réunion island in the indian ocean demonstrated that short-term (few days) changes in velocity in the volcanic edifice on the order of 0.05% could be recognized and mapped. before each of six monitored eruptions occurring between 1999 and 2007, decreases in velocity began a few weeks before the eruption and increased in intensity up to the time of the eruption. the total velocity change was greater for the larger eruptions. the decrease in velocity was probably caused by opening of near-surface cracks in the volcanic edifice as it was inflated by increased pres-sure within the underlying magma chamber. maps of the velocity changes show that different parts of the volcano were affected in the precursory activity leading up to different eruptions.
Four-dimensional monitoring of Volcanoes using ambient Seismic noise
Sideb
ar
16
(a) map of the cumulative changes in seismic velocity that had occurred just before the September 1999 eruption of Piton de la Fournaise volcano, réunion. White dashed line shows the limit of coverage. Solid white lines are topographic contours. black dashed oval is a region of normally high velocity thought to be an effect of solidified dikes associated with the zone of magma injection. For this small eruption, the high-velocity regions decreased in velocity; the maximum change was about 0.1%. (b) Velocity changes before a larger eruption in July 2006 reached about 0.3% shown by the red curve. green shaded area indi-cates period of eruption. (reprinted with permission from macmillan Publishers ltd.: F. brenguier n.m. Shapiro, m. campillo, V. Ferrazzini, Z. duputel, o. coutant, and a. nercessian, 2008. towards forecasting volcanic eruptions using seismic noise, Nature Geoscience, 1:126–130, doi:10.1038/ngeo104, ©2008.)
km
Error on ∆v/v (%)
174 176 178 180 182
32
34
36
38
40
42
–0.1 0∆v/v(%)
0
0.1
80 120 160 2000.2
0.1
0
–0.1
–0.2
–0.3
–0.4(b)(a)
∆v/v
(%)
km Days of Year 2006
grand challenge 6

40
Understanding the evolution and coupling of litho-sphere and asthenosphere throughout Earth history is crucial to elucidating the dynamics of plate tec-tonics and continental evolution, and constitutes a Seismological Grand Challenge. Lithosphere, the mechanically strong outer shell of the Earth com-posed of crust and uppermost mantle, forms the tec-tonic plates. Lithosphere varies in thickness from 0 km at mid-ocean ridges to perhaps 250 km or more under cratons—the ancient and relatively stable hearts of continents. The asthenosphere is the mantle below the lithosphere, which flows and deforms to accom-modate and perhaps drive plate motions. Both can
be viewed as rheological manifestations of a thermal boundary layer for the overall mantle convection sys-tem, but there is also a seismological expression of the boundary between the lithosphere and asthenosphere that is not understood, and possibly even the termi-nology is now outmoded.
The thermo-chemical evolution of continental litho-sphere is linked to the processes by which continen-tal crust forms. Continental crust began forming more than 3.8 Ga. By 2.7 Ga, continental cratons seem to have stabilized as regions of compositionally buoy-ant and stiff mantle lithosphere isolated from mantle
grand challenge 7. What iS the lithoSPhere- aSthenoSPhere boundary?
Seismic velocity discontinuities beneath the Sierra nevada, imaged by earthScope instruments, reveal regions of detaching lower crust beneath the mountain range, demonstrating the complexity of continental lithosphere evolution. (image updated from original published in h. gilbert, c. Jones, t. owens, and g. Zandt, 2007. imaging Sierra nevada lithospheric sinking, Eos Transactions, American Geophysical Union, 88(21):225, 229.)
grand challengeS For SeiSmology
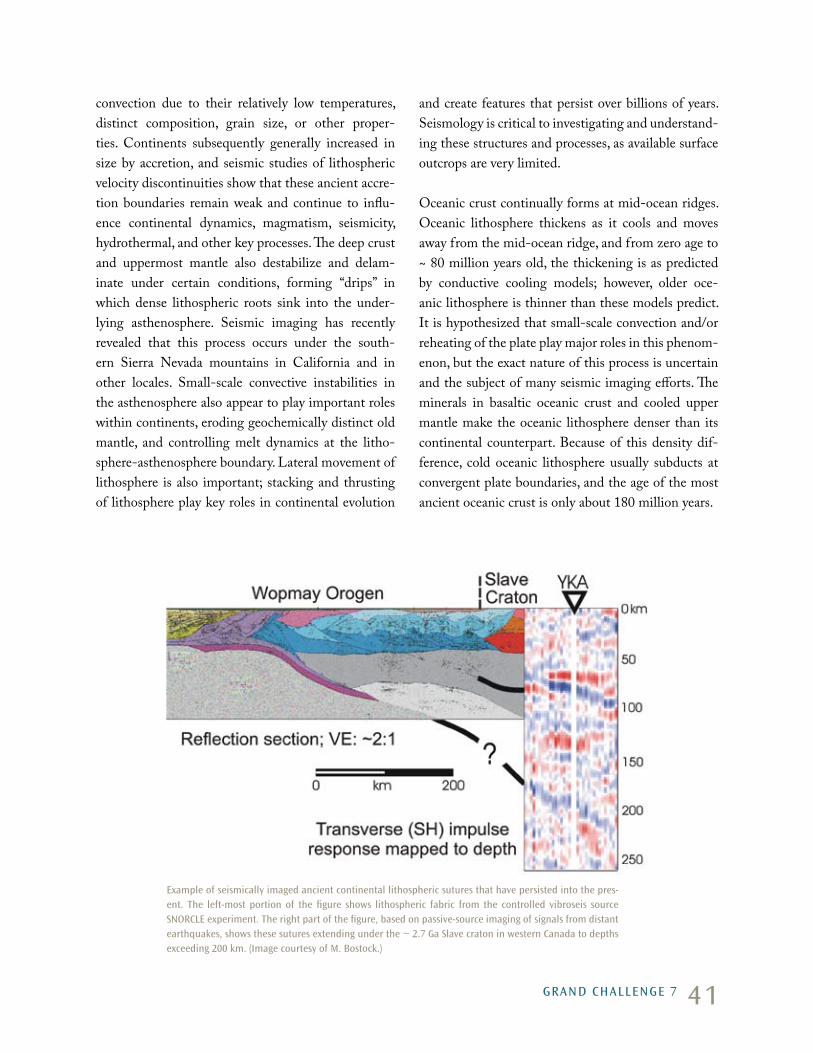
41
convection due to their relatively low temperatures, distinct composition, grain size, or other proper-ties. Continents subsequently generally increased in size by accretion, and seismic studies of lithospheric velocity discontinuities show that these ancient accre-tion boundaries remain weak and continue to influ-ence continental dynamics, magmatism, seismicity, hydrothermal, and other key processes. The deep crust and uppermost mantle also destabilize and delam-inate under certain conditions, forming “drips” in which dense lithospheric roots sink into the under-lying asthenosphere. Seismic imaging has recently revealed that this process occurs under the south-ern Sierra Nevada mountains in California and in other locales. Small-scale convective instabilities in the asthenosphere also appear to play important roles within continents, eroding geochemically distinct old mantle, and controlling melt dynamics at the litho-sphere-asthenosphere boundary. Lateral movement of lithosphere is also important; stacking and thrusting of lithosphere play key roles in continental evolution
and create features that persist over billions of years. Seismology is critical to investigating and understand-ing these structures and processes, as available surface outcrops are very limited.
Oceanic crust continually forms at mid-ocean ridges. Oceanic lithosphere thickens as it cools and moves away from the mid-ocean ridge, and from zero age to ~ 80 million years old, the thickening is as predicted by conductive cooling models; however, older oce-anic lithosphere is thinner than these models predict. It is hypothesized that small-scale convection and/or reheating of the plate play major roles in this phenom-enon, but the exact nature of this process is uncertain and the subject of many seismic imaging efforts. The minerals in basaltic oceanic crust and cooled upper mantle make the oceanic lithosphere denser than its continental counterpart. Because of this density dif-ference, cold oceanic lithosphere usually subducts at convergent plate boundaries, and the age of the most ancient oceanic crust is only about 180 million years.
example of seismically imaged ancient continental lithospheric sutures that have persisted into the pres-ent. the left-most portion of the figure shows lithospheric fabric from the controlled vibroseis source Snorcle experiment. the right part of the figure, based on passive-source imaging of signals from distant earthquakes, shows these sutures extending under the ~ 2.7 ga Slave craton in western canada to depths exceeding 200 km. (image courtesy of m. bostock.)
grand challenge 7
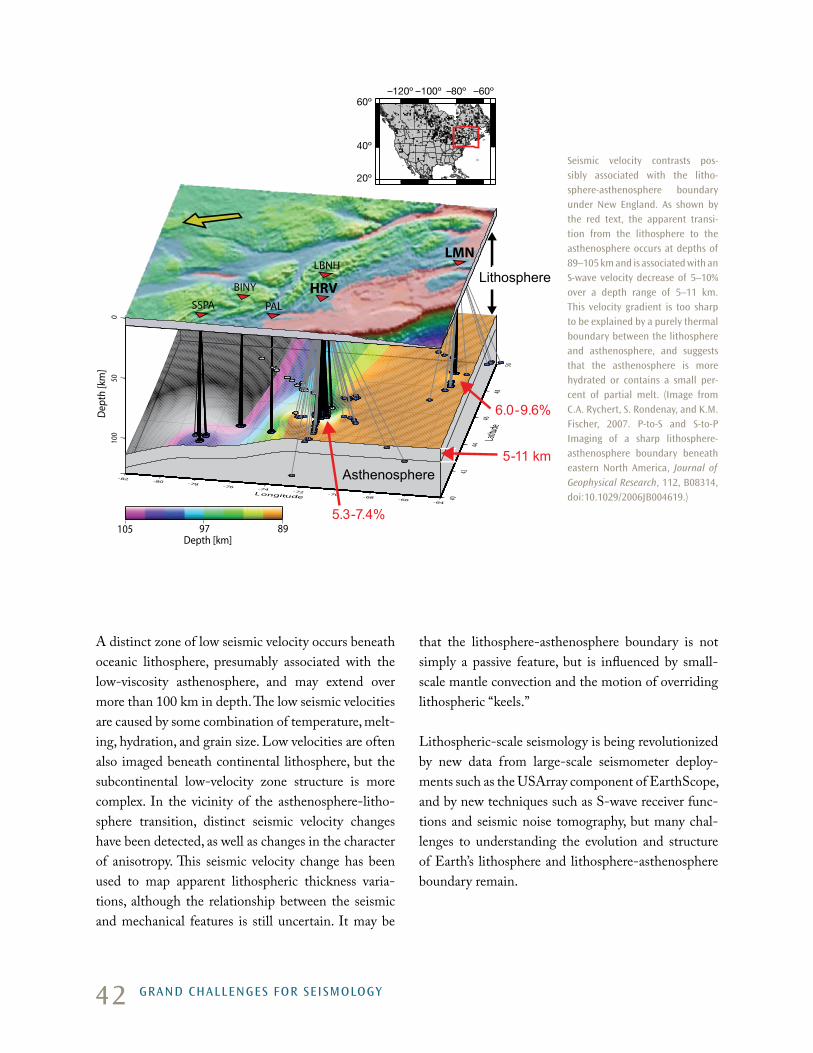
42
A distinct zone of low seismic velocity occurs beneath oceanic lithosphere, presumably associated with the low-viscosity asthenosphere, and may extend over more than 100 km in depth. The low seismic velocities are caused by some combination of temperature, melt-ing, hydration, and grain size. Low velocities are often also imaged beneath continental lithosphere, but the subcontinental low-velocity zone structure is more complex. In the vicinity of the asthenosphere-litho-sphere transition, distinct seismic velocity changes have been detected, as well as changes in the character of anisotropy. This seismic velocity change has been used to map apparent lithospheric thickness varia-tions, although the relationship between the seismic and mechanical features is still uncertain. It may be
that the lithosphere-asthenosphere boundary is not simply a passive feature, but is influenced by small-scale mantle convection and the motion of overriding lithospheric “keels.”
Lithospheric-scale seismology is being revolutionized by new data from large-scale seismometer deploy-ments such as the USArray component of EarthScope, and by new techniques such as S-wave receiver func-tions and seismic noise tomography, but many chal-lenges to understanding the evolution and structure of Earth’s lithosphere and lithosphere-asthenosphere boundary remain.
-82-80
-78-76
-74-72
-70-68
-66-64
4042
4446
4850
100
500
HRV
LMN
PAL
BINY
SSPA
LBNH
LongitudeLat
itude
Dep
th[k
m]
97105 89Depth [km]
6.0-9.6%
5.3-7.4%
5-11 kmAsthenosphere
Lithosphere
Seismic velocity contrasts pos-sibly associated with the litho-sphere-asthenosphere boundary under new england. as shown by the red text, the apparent transi-tion from the lithosphere to the asthenosphere occurs at depths of 89–105 km and is associated with an S-wave velocity decrease of 5–10% over a depth range of 5–11 km. this velocity gradient is too sharp to be explained by a purely thermal boundary between the lithosphere and asthenosphere, and suggests that the asthenosphere is more hydrated or contains a small per-cent of partial melt. (image from c.a. rychert, S. rondenay, and k.m. Fischer, 2007. P-to-S and S-to-P imaging of a sharp lithosphere-asthenosphere boundary beneath eastern north america, Journal of Geophysical Research, 112, b08314, doi:10.1029/2006Jb004619.)
grand challengeS For SeiSmology
43
key QueStionS and iSSueS
• How did the cratonic interiors of continents form, what is their composition, why did they stabilize, and how stable are they over Earth history?
• In what ways, and by what mechanisms, do pre-existing structures such as ancient faults or sutures affect modern-day deformation, magmatism, seis-micity, and other processes?
• What aspects of melting, grain-scale, and rock-scale processes cause velocity anisotropy, and how can we use knowledge of these causes to deduce the flow and strain state of the lithosphere and asthenosphere?
• What exactly is the asthenosphere? Why is it weak, and why does it have low seismic veloc-ity and high attenuation? What controls the properties and configuration of the lithosphere- asthenosphere boundary?
• Where and when do small-scale convection and lithospheric delamination (detachment and sinking of deep crustal layers) occur?
• Where does convection occur in the ocean astheno-sphere and does it relate to surface features?
• Why do intraplate earthquakes occur far from active plate boundaries?
• What is the role of melt, water, other volatiles, and composition in modulating the stability and insta-bility of the lithosphere?
• How are continental crust and lithosphere assem-bled? How deep do boundaries associated with accreted terrains (chunks of crustal material added to continental margins) extend?
SeiSmological aPProacheS and reQuirementS to make ProgreSS
• Enhance and continue deployment of dense por-table and permanent seismic arrays on continents and on the ocean floor to provide critical observa-tions of discontinuities, anisotropy, attenuation, and small-scale heterogeneity of the lithosphere and asthenosphere.
• Provide access to high-performance computing to enable development of new computational methods for demanding full waveform analysis and inversion.
• Acquire inexpensive, abundant seismometers for large-scale active- and passive-source deployments to image 3D lithospheric structures.
• Encourage close collaboration among geoscientists across a range of disciplines to better understand the complex roles of fluids and variable rheology, and to reveal the geologic history of the lithosphere.
grand challenge 7

44
the theory of plate tectonics predicts that most earthquakes result from repeated accumulation and release of strain at the contacts between differentially moving plates. however, plate tectonic motions do not readily account for earthquakes located within the interiors of oceanic and continental plates. these “intraplate” earthquakes present fundamental challenges to understanding how strain accumulates and what the associated seismic potential and hazard are for intraplate regions. For exam-ple, large areas of australia, north america, asia, and europe experience intraplate earthquakes, some of which are catastrophi-cally large. three large earthquakes in north america occurred in 1811–1812 in the mississippi river valley of the central united States and a large event in 1886 severely damaged charleston, South carolina. Some other intraplate earthquakes, such as those in hawaii, are associated with volcanic processes. interactions between lithospheric and asthenospheric systems may be the cause of these events, but the mechanisms are not known.
Plate interiors do not appear to experience significant strain over long periods of geological time, nor have gPS measure-ments detected significant strain rates in areas of past large intra-plate earthquakes. however, paleoseismologists, who study his-toric faulting events, have found geological evidence of repeated large earthquakes over thousands of years in intraplate environ-ments like the new madrid seismic zone of the central united States. there are many ideas and speculations on why intraplate events occur, but no consensus has emerged on how they are generated or how they continue to occur over many earthquake cycles. intraplate earthquakes also present significant seismic hazards, especially because they can affect densely populated regions with little preparation for seismic shaking. the exis-tence of intraplate earthquakes remains a deep scientific mys-tery with strong societal implications that needs to be solved by innovative approaches.
intraplate earthquakes
Sid
eba
r 1
7
intraplate seismicity of the new madrid seismic zone in the central uSa superimposed on a topog-raphy map with warmer colors indicating higher elevations. the red circles are earthquake loca-tions from local seismic network analyses. the magenta line shows the boundary of the mississippi embayment structure that, geologically, is an incursion of the gulf of mexico coastal plain. thick black lines show the approximate boundary of the reelfoot rift zone, an ancient (approximately 500 million year old) rift that has been subsequently covered by recent mississippi embayment sediments. ancient faults of the reelfoot rift have presumably been reactivated to form the com-plex fault structures seen in the distribution of earthquakes. this region has experienced at least four series of large earthquakes over the past 2500 years, including three with magnitudes of 7.0, 7.2, and 7.5 in 1811–1812. (image courtesy of m.b.magnani.)
grand challengeS For SeiSmology
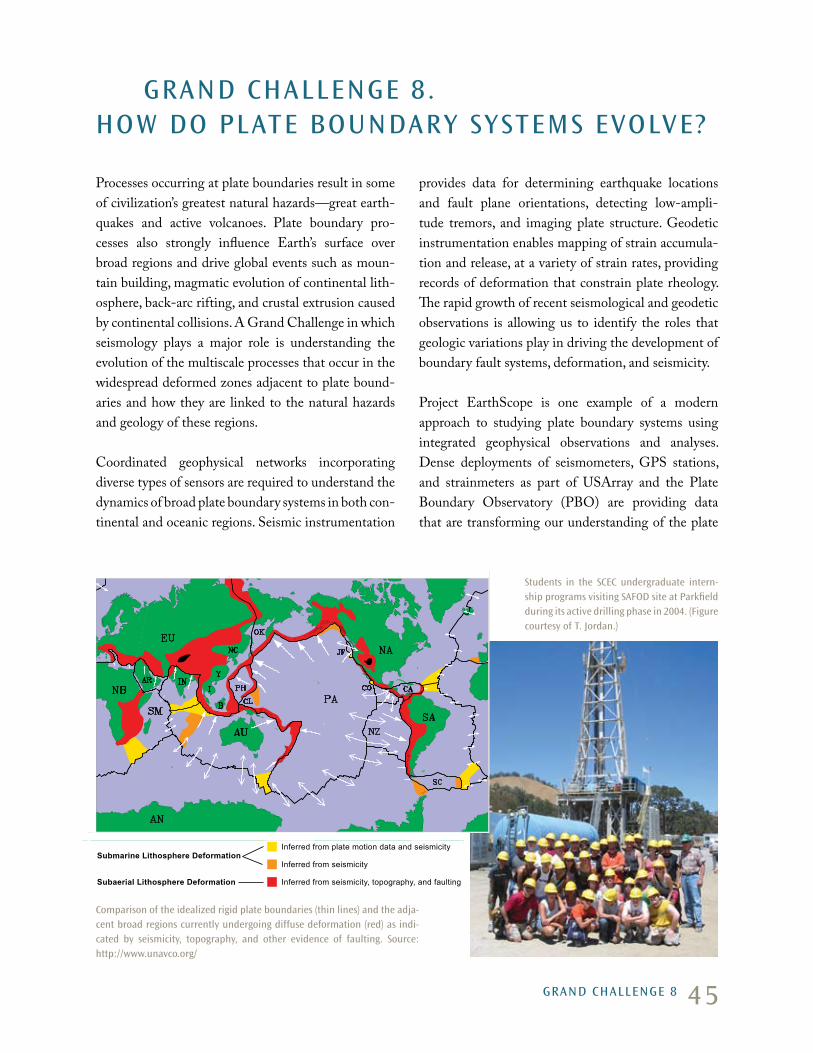
45
Processes occurring at plate boundaries result in some of civilization’s greatest natural hazards—great earth-quakes and active volcanoes. Plate boundary pro-cesses also strongly influence Earth’s surface over broad regions and drive global events such as moun-tain building, magmatic evolution of continental lith-osphere, back-arc rifting, and crustal extrusion caused by continental collisions. A Grand Challenge in which seismology plays a major role is understanding the evolution of the multiscale processes that occur in the widespread deformed zones adjacent to plate bound-aries and how they are linked to the natural hazards and geology of these regions.
Coordinated geophysical networks incorporating diverse types of sensors are required to understand the dynamics of broad plate boundary systems in both con-tinental and oceanic regions. Seismic instrumentation
provides data for determining earthquake locations and fault plane orientations, detecting low-ampli-tude tremors, and imaging plate structure. Geodetic instrumentation enables mapping of strain accumula-tion and release, at a variety of strain rates, providing records of deformation that constrain plate rheology. The rapid growth of recent seismological and geodetic observations is allowing us to identify the roles that geologic variations play in driving the development of boundary fault systems, deformation, and seismicity.
Project EarthScope is one example of a modern approach to studying plate boundary systems using integrated geophysical observations and analyses. Dense deployments of seismometers, GPS stations, and strainmeters as part of USArray and the Plate Boundary Observatory (PBO) are providing data that are transforming our understanding of the plate
grand challenge 8. hoW do Plate boundary SyStemS eVolVe?
comparison of the idealized rigid plate boundaries (thin lines) and the adja-cent broad regions currently undergoing diffuse deformation (red) as indi-cated by seismicity, topography, and other evidence of faulting. Source: http://www.unavco.org/
Students in the Scec undergraduate intern-ship programs visiting SaFod site at Parkfield during its active drilling phase in 2004. (Figure courtesy of t. Jordan.)
grand challenge 8

46
boundary. For example, focused research in the Pacific Northwest using the EarthScope observations is beginning to unveil the history of subduction of the Juan de Fuca Plate and its connection to geologi-cally active tectonic processes throughout the west-ern United States, including the Yellowstone hotspot, the Great Basin, and the Rio Grande Rift. The San Andreas Fault system is one of the most-studied plate boundaries on Earth, with extensive seismological, strain, drilling (e.g., SAFOD), geomorphology, and geodetic data collection efforts. Through EarthScope, seismologists are now mapping the deeper structure of the plate boundary in great detail, revealing how the pattern of crustal deformation is related to the struc-ture, composition, and physical properties of the litho-sphere and asthenosphere.
Oceanic plate boundaries are just as complex and dif-fuse as continental plate boundaries, but we have rel-atively little data at present to constrain their deep structures and processes. Melting at mid-ocean ridges is a passive process responding to distant plate forces. The newly generated crust has a uniform thickness of
7 km. Partial melting of the upwelling mantle initiates at around 100 km depth. The oceanic crustal formation process therefore cycles large volumes of the mantle through the melting zone, generating a compositional heterogeneity between the crust and underlying resid-ual mantle that cools to become oceanic lithosphere. Melt pathways generated by this process remain enig-matic, largely due to limited data and instrumenta-tion presently available for study of seafloor processes. Larger instrument deployments are required to bet-ter constrain and improve understanding of both the small- and large-scale structures involved in this seafloor-spreading process.
In plate boundaries regions with dense geophysical instrumentation, seismologists are now quantifying the distribution of deformation and imaging the pri-mary structural and geologic units. By coupling the forces acting at plate boundaries with their structure and rheology, we can begin to build dynamic mod-els of these systems to better understand fundamental processes of Earth’s plate tectonic system.
(b)surface
1000 kmdepth
plum
e
downwelling slab
(a)NW SEsurface
1000 kmdepth
plume tear
SW
NW NE
-3% 3%0
DNA08-SS
N
SW
S
NW SE
tomographic velocity models of the upper 1000 km of the earth beneath the western united States. orange regions represent low seismic velocities interpreted as warm upwelling regions that may be associated with surface volcanism. blue regions represent high seismic velocities interpreted as cool downwellings that take the form of more planar curtains sinking into the mantle. the subducting Juan de Fuca slab has been disrupted by an upwelling plume, which appears to have torn the slab from north to south. (image courtesy of r. allen.)
grand challengeS For SeiSmology

47
interpreted cross section from the mantle electromagnetic and tomography (melt) experiment across the east Pacific rise. the seismic imaging and anisotropic structure is interpreted to show an asymmetrical melting region extending to 100 km depth. upper mantle material is being cycled through the melt zone, which is reflected in the composition of oceanic crust. (image from melt Seismic team, 1998. imaging the deep seismic structure beneath a mid-ocean ridge: the melt experiment, Science, 280(5367):1215–1218, doi:10.1126/science.280.5367.1215. reprinted with permission from aaaS.)
key QueStionS and iSSueS
• Is surface deformation controlled by crustal proper-ties and stresses or by forces transmitted to the sur-face through the lithosphere?
• How do accretionary prisms at subduction zones evolve, what are the seismogenic hazards of splay faults that cut into the prisms, and what is their influence on trench migration?
• Are mantle wedges strongly coupled or decoupled from subducting slabs?
• How does continental lithosphere develop in back-arc basins behind subduction zones?
• How do sinking slabs interact with localized and large-scale upwellings?
• What causes deep earthquakes and what are the stress and thermal conditions in deep slabs?
• What controls the localization and segmentation of extension in rift zones and at mid-ocean ridge spreading centers?
• How and why do ocean spreading center ridge jumps occur, and what is their relation to deeper structure?
• How much lateral transport of melt is there along ridge segments and between ridges and hot spots?
• How is continental deformation in plate boundary zones accommodated at depth? What role is played by small-scale convection in driving broad defor-mation zones around plate boundaries?
grand challenge 8
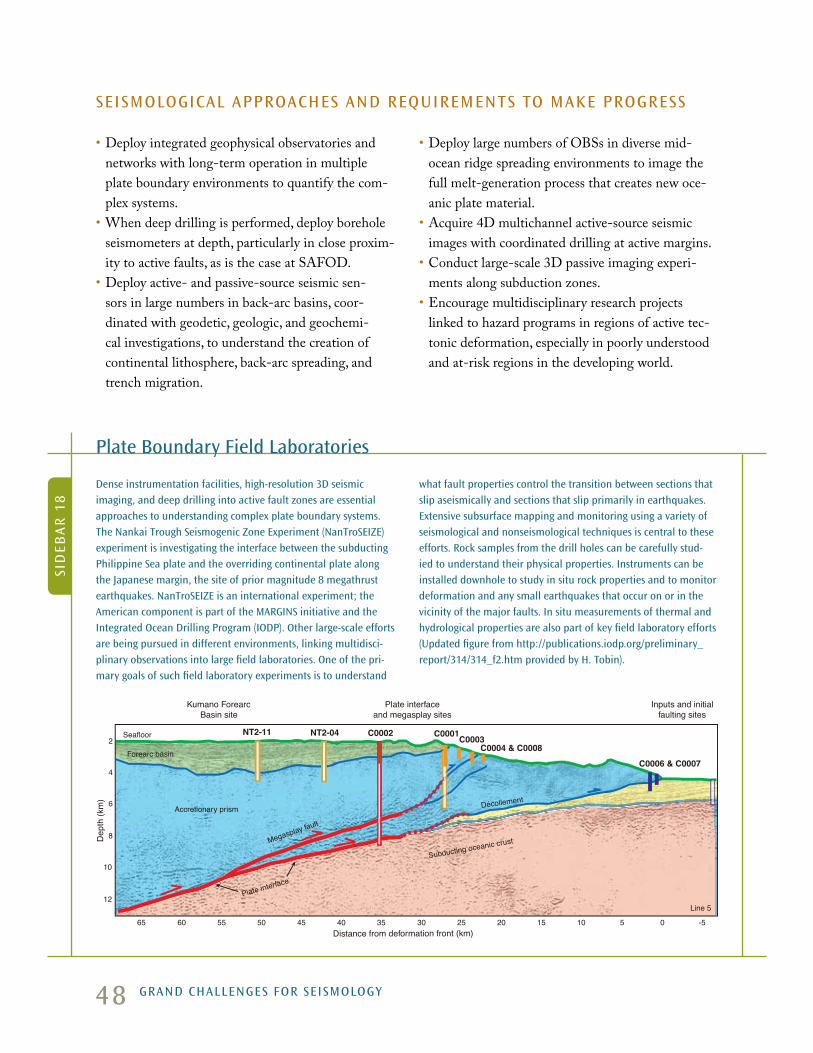
48
SeiSmological aPProacheS and reQuirementS to make ProgreSS
• Deploy integrated geophysical observatories and networks with long-term operation in multiple plate boundary environments to quantify the com-plex systems.
• When deep drilling is performed, deploy borehole seismometers at depth, particularly in close proxim-ity to active faults, as is the case at SAFOD.
• Deploy active- and passive-source seismic sen-sors in large numbers in back-arc basins, coor-dinated with geodetic, geologic, and geochemi-cal investigations, to understand the creation of continental lithosphere, back-arc spreading, and trench migration.
• Deploy large numbers of OBSs in diverse mid-ocean ridge spreading environments to image the full melt-generation process that creates new oce-anic plate material.
• Acquire 4D multichannel active-source seismic images with coordinated drilling at active margins.
• Conduct large-scale 3D passive imaging experi-ments along subduction zones.
• Encourage multidisciplinary research projects linked to hazard programs in regions of active tec-tonic deformation, especially in poorly understood and at-risk regions in the developing world.
dense instrumentation facilities, high-resolution 3d seismic imaging, and deep drilling into active fault zones are essential approaches to understanding complex plate boundary systems. the nankai trough Seismogenic Zone experiment (nantroSeiZe) experiment is investigating the interface between the subducting Philippine Sea plate and the overriding continental plate along the Japanese margin, the site of prior magnitude 8 megathrust earthquakes. nantroSeiZe is an international experiment; the american component is part of the marginS initiative and the integrated ocean drilling Program (iodP). other large-scale efforts are being pursued in different environments, linking multidisci-plinary observations into large field laboratories. one of the pri-mary goals of such field laboratory experiments is to understand
what fault properties control the transition between sections that slip aseismically and sections that slip primarily in earthquakes. extensive subsurface mapping and monitoring using a variety of seismological and nonseismological techniques is central to these efforts. rock samples from the drill holes can be carefully stud-ied to understand their physical properties. instruments can be installed downhole to study in situ rock properties and to monitor deformation and any small earthquakes that occur on or in the vicinity of the major faults. in situ measurements of thermal and hydrological properties are also part of key field laboratory efforts (updated figure from http://publications.iodp.org/preliminary_report/314/314_f2.htm provided by h. tobin).
Plate boundary Field laboratories
C0006 & C0007
C0003C0001C0002NT2-04NT2-11
Dep
th (k
m)
Distance from deformation front (km)-565 60 55 50 45 40 35 30 25 20 15 10 5 0
Accretionary prism
Forearc basin
Seafloor
Subducting oceanic crust
Décollement
Megasplay fault
Line 5
Plate interface
C0004 & C00082
4
6
8
10
12
Kumano ForearcBasin site
Plate interfaceand megasplay sites
Inputs and initialfaulting sites
Sid
eba
r 1
8
grand challengeS For SeiSmology
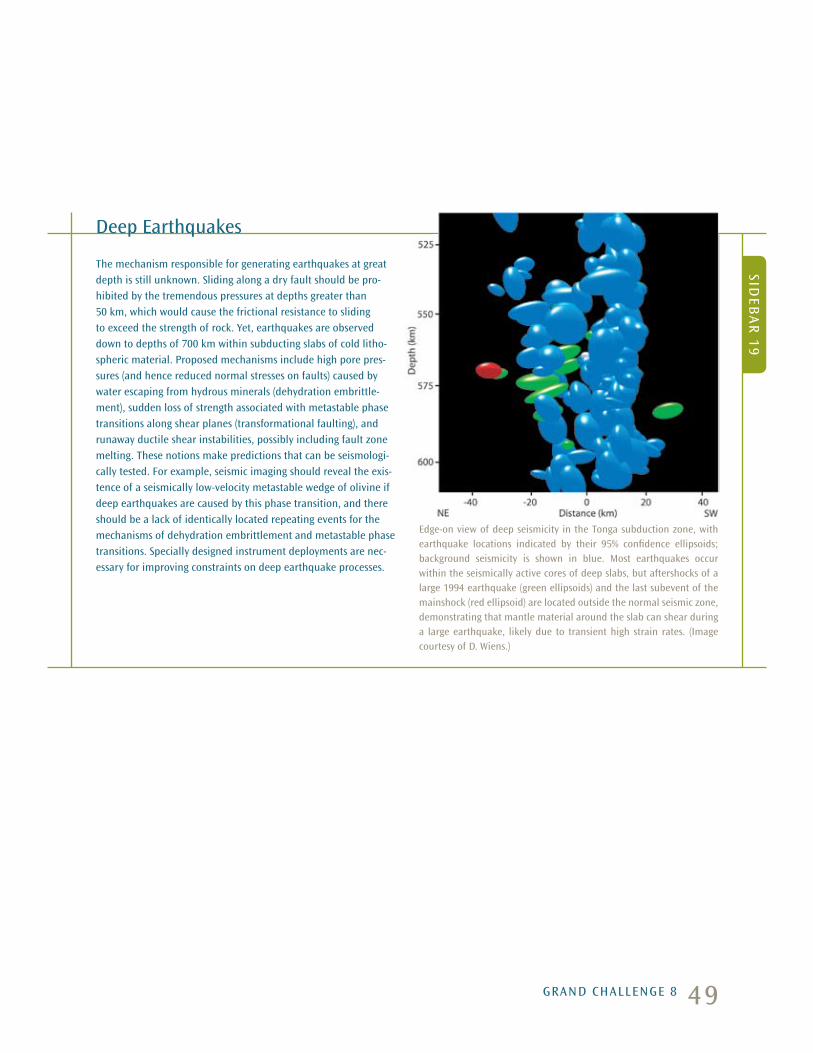
49
the mechanism responsible for generating earthquakes at great depth is still unknown. Sliding along a dry fault should be pro-hibited by the tremendous pressures at depths greater than 50 km, which would cause the frictional resistance to sliding to exceed the strength of rock. yet, earthquakes are observed down to depths of 700 km within subducting slabs of cold litho-spheric material. Proposed mechanisms include high pore pres-sures (and hence reduced normal stresses on faults) caused by water escaping from hydrous minerals (dehydration embrittle-ment), sudden loss of strength associated with metastable phase transitions along shear planes (transformational faulting), and runaway ductile shear instabilities, possibly including fault zone melting. these notions make predictions that can be seismologi-cally tested. For example, seismic imaging should reveal the exis-tence of a seismically low-velocity metastable wedge of olivine if deep earthquakes are caused by this phase transition, and there should be a lack of identically located repeating events for the mechanisms of dehydration embrittlement and metastable phase transitions. Specially designed instrument deployments are nec-essary for improving constraints on deep earthquake processes.
deep earthquakes
Sideb
ar
19
edge-on view of deep seismicity in the tonga subduction zone, with earthquake locations indicated by their 95% confidence ellipsoids; background seismicity is shown in blue. most earthquakes occur within the seismically active cores of deep slabs, but aftershocks of a large 1994 earthquake (green ellipsoids) and the last subevent of the mainshock (red ellipsoid) are located outside the normal seismic zone, demonstrating that mantle material around the slab can shear during a large earthquake, likely due to transient high strain rates. (image courtesy of d. Wiens.)
grand challenge 8

50
Understanding the large-scale patterns of mantle and core flow both today and in Earth’s past is one of the Grand Challenges confronting seismology and other Earth science disciplines. Issues ranging from the thermal history of the planet to the driving forces of present-day tectonics to how the geodynamo gener-ates the magnetic field and why it undergoes spon-taneous reversals are intimately linked to this topic. Seismology has contributed greatly over the past three decades to constraining present-day deep mantle and
core structures, and improved resolution is steadily being achieved as data accumulate and new analysis methods are developed. A profound result of recent advances is the recognition that large-scale chemical heterogeneity is present in the deep mantle and man-tle convection is now being considered in the frame-work of thermo-chemical dynamics, as has long been the case for core convection.
The very large-scale 3D elastic wave velocity structure of the deep mantle is now fairly well known and is characterized by two massive low-velocity provinces (one under Africa and the other under the central Pacific) surrounded by faster material. The faster mate-rial appears to be geographically related to present and past subduction zones in the upper mantle, although continuity of seismically imaged fast tabular structures throughout the lower mantle is, at best, intermittent. This observation lends support to the idea of complex mass transfer between the upper and lower mantle. The large low-velocity structures are slow features for both P-waves and S-waves, but the S-wave velocity reduc-tions are larger than would be expected if the material were just relatively warm. There are very strong lateral gradients in velocity structure at the edges of these low-velocity provinces, and analysis of normal modes indicates anomalously high-density material in these regions. These observations constitute strong evidence for distinct composition for these large masses in the deep mantle, and deep mantle convection must involve both thermal and chemical variations.
grand challenge 9. hoW do temPerature and comPoSition VariationS control mantle and core conVection?
global 3d configuration (extending from the mapped surface to the core-mantle boundary) of seismic velocity heterogeneities in the man-tle as imaged by seismic tomography. red regions have relatively low S-wave velocities, while blue regions have relatively fast S-wave veloci-ties. the image is dominated by two enormous low-velocity regions, beneath africa and the central Pacific plates, and by a ring of high velocities underlying subduction zones around the rim of the Pacific. (image courtesy of a. dziewonski).
grand challengeS For SeiSmology
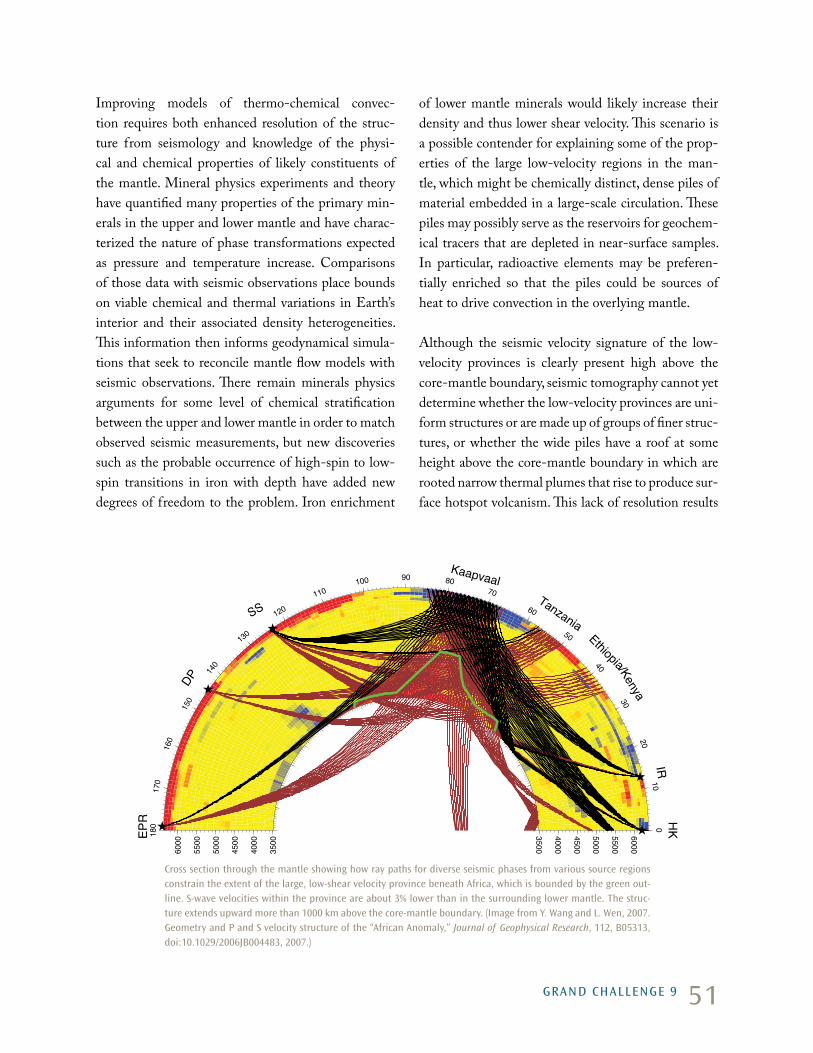
51
Improving models of thermo-chemical convec-tion requires both enhanced resolution of the struc-ture from seismology and knowledge of the physi-cal and chemical properties of likely constituents of the mantle. Mineral physics experiments and theory have quantified many properties of the primary min-erals in the upper and lower mantle and have charac-terized the nature of phase transformations expected as pressure and temperature increase. Comparisons of those data with seismic observations place bounds on viable chemical and thermal variations in Earth’s interior and their associated density heterogeneities. This information then informs geodynamical simula-tions that seek to reconcile mantle flow models with seismic observations. There remain minerals physics arguments for some level of chemical stratification between the upper and lower mantle in order to match observed seismic measurements, but new discoveries such as the probable occurrence of high-spin to low-spin transitions in iron with depth have added new degrees of freedom to the problem. Iron enrichment
of lower mantle minerals would likely increase their density and thus lower shear velocity. This scenario is a possible contender for explaining some of the prop-erties of the large low-velocity regions in the man-tle, which might be chemically distinct, dense piles of material embedded in a large-scale circulation. These piles may possibly serve as the reservoirs for geochem-ical tracers that are depleted in near-surface samples. In particular, radioactive elements may be preferen-tially enriched so that the piles could be sources of heat to drive convection in the overlying mantle. Although the seismic velocity signature of the low-velocity provinces is clearly present high above the core-mantle boundary, seismic tomography cannot yet determine whether the low-velocity provinces are uni-form structures or are made up of groups of finer struc-tures, or whether the wide piles have a roof at some height above the core-mantle boundary in which are rooted narrow thermal plumes that rise to produce sur-face hotspot volcanism. This lack of resolution results
cross section through the mantle showing how ray paths for diverse seismic phases from various source regions constrain the extent of the large, low-shear velocity province beneath africa, which is bounded by the green out-line. S-wave velocities within the province are about 3% lower than in the surrounding lower mantle. the struc-ture extends upward more than 1000 km above the core-mantle boundary. (image from y. Wang and l. Wen, 2007. geometry and P and S velocity structure of the “african anomaly,” Journal of Geophysical Research, 112, b05313, doi:10.1029/2006Jb004483, 2007.)
3500
4000
4500
5000
5500
60003500
4000
4500
5000
5500
6000
010
20
30
40
50
60
708090100
110
120
130
140
150
160
170
180
HKEP
RIR
SS
DP
KaapvaalTanzania
Ethiopia/Kenya
grand challenge 9
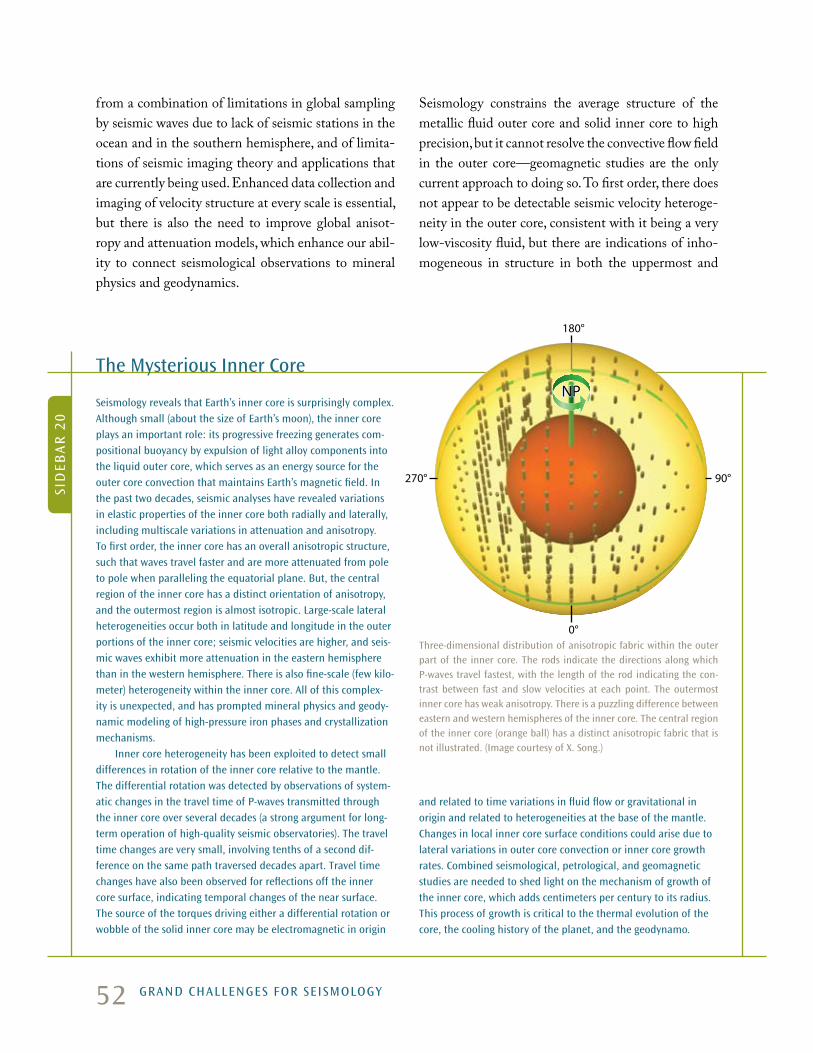
52
from a combination of limitations in global sampling by seismic waves due to lack of seismic stations in the ocean and in the southern hemisphere, and of limita-tions of seismic imaging theory and applications that are currently being used. Enhanced data collection and imaging of velocity structure at every scale is essential, but there is also the need to improve global anisot-ropy and attenuation models, which enhance our abil-ity to connect seismological observations to mineral physics and geodynamics.
Seismology constrains the average structure of the metallic fluid outer core and solid inner core to high precision, but it cannot resolve the convective flow field in the outer core—geomagnetic studies are the only current approach to doing so. To first order, there does not appear to be detectable seismic velocity heteroge-neity in the outer core, consistent with it being a very low-viscosity fluid, but there are indications of inho-mogeneous in structure in both the uppermost and
Seismology reveals that earth’s inner core is surprisingly complex. although small (about the size of earth’s moon), the inner core plays an important role: its progressive freezing generates com-positional buoyancy by expulsion of light alloy components into the liquid outer core, which serves as an energy source for the outer core convection that maintains earth’s magnetic field. in the past two decades, seismic analyses have revealed variations in elastic properties of the inner core both radially and laterally, including multiscale variations in attenuation and anisotropy. to first order, the inner core has an overall anisotropic structure, such that waves travel faster and are more attenuated from pole to pole when paralleling the equatorial plane. but, the central region of the inner core has a distinct orientation of anisotropy, and the outermost region is almost isotropic. large-scale lateral heterogeneities occur both in latitude and longitude in the outer portions of the inner core; seismic velocities are higher, and seis-mic waves exhibit more attenuation in the eastern hemisphere than in the western hemisphere. there is also fine-scale (few kilo-meter) heterogeneity within the inner core. all of this complex-ity is unexpected, and has prompted mineral physics and geody-namic modeling of high-pressure iron phases and crystallization mechanisms. inner core heterogeneity has been exploited to detect small differences in rotation of the inner core relative to the mantle. the differential rotation was detected by observations of system-atic changes in the travel time of P-waves transmitted through the inner core over several decades (a strong argument for long-term operation of high-quality seismic observatories). the travel time changes are very small, involving tenths of a second dif-ference on the same path traversed decades apart. travel time changes have also been observed for reflections off the inner core surface, indicating temporal changes of the near surface. the source of the torques driving either a differential rotation or wobble of the solid inner core may be electromagnetic in origin
and related to time variations in fluid flow or gravitational in origin and related to heterogeneities at the base of the mantle. changes in local inner core surface conditions could arise due to lateral variations in outer core convection or inner core growth rates. combined seismological, petrological, and geomagnetic studies are needed to shed light on the mechanism of growth of the inner core, which adds centimeters per century to its radius. this process of growth is critical to the thermal evolution of the core, the cooling history of the planet, and the geodynamo.
the mysterious inner core
Sid
eba
r 2
0
three-dimensional distribution of anisotropic fabric within the outer part of the inner core. the rods indicate the directions along which P-waves travel fastest, with the length of the rod indicating the con-trast between fast and slow velocities at each point. the outermost inner core has weak anisotropy. there is a puzzling difference between eastern and western hemispheres of the inner core. the central region of the inner core (orange ball) has a distinct anisotropic fabric that is not illustrated. (image courtesy of x. Song.)
180°
0°
270° 90°
NPNP
grand challengeS For SeiSmology

53
key QueStionS and iSSueS
• What are the scales of heterogeneity in the global mantle convection system, and what are the chemi-cal, thermal, and mineralogical causes of the multi-scale heterogeneity?
• What is the flux of material between the upper and lower mantle, and on what time scales does it occur?
• What are the relative contributions of thermal, chemical, and mineralogical variations to seismi-cally detected heterogeneity?
• Are there large thermal plumes in the mantle, and are they related to surface hotspots?
• What is the longevity of chemical heterogeneities in the deep mantle and what is their effect on the overall convection pattern?
• What are the nature and cause of deep mantle anisotropy?
• When did the inner core form and what are its influences on the geodynamo and Earth’s mag-netic field?
• How is heterogeneity of the inner core related to its growth processes over Earth’s history and what are the geodynamic and geomagnetic consequences of this heterogeneity?
• How do the interiors of other rocky bodies in the solar system differ from that of the Earth?
SeiSmological aPProacheS and reQuirementS to make ProgreSS
• Expand global coverage with permanent broad-band seismic stations, including the ocean basins, to improve resolution of global structure and sustain long deployments to capture time-varying processes.
• Deploy large portable arrays of three-component broadband sensors in various tectonic environments to resolve deep anisotropy and assess the fine-scale components of heterogeneity in the deep mantle and core.
• Develop and distribute large data sets to be applied in imaging methods that use finite-frequency the-ory and wavefield backprojection to improve reso-lution of deep structure.
• Encourage enhanced interdisciplinary communica-tion among seismologists, mineral physicists, and geodynamicists through workshops, programs, and community organizations.
• Include seismic data acquisition capabilities in planetary exploration efforts.
the lowermost 100 km of the outer core. These regions plausibly have distinct chemistry associated with thermo-chemical dynamics of the core that drives the core flow regime and thereby generates the magnetic field by geodynamo action. Resolving the structure of these domains is a high priority for understand-ing the deep interior. The inner core is solid, but has been recently found to be surprisingly heterogeneous on many scales. It exhibits radially varying anisotropic
structure, hemispherical heterogeneity, and heteroge-neous attenuation properties. Seismic evidence indi-cates that the inner core is currently rotating slightly faster than the mantle. Close interaction among seis-mologists, mineral physicists, and geodynamicists is essential for evaluating the nature and consequences of these complexities.
grand challenge 9
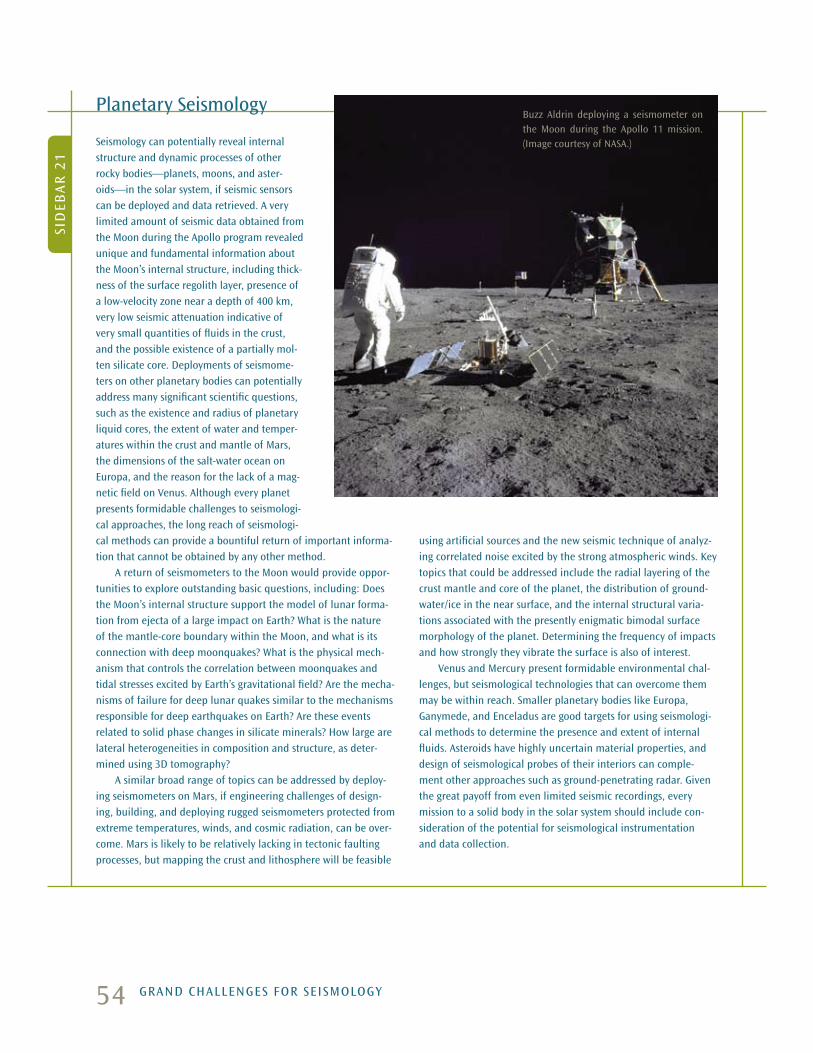
54
Seismology can potentially reveal internal structure and dynamic processes of other rocky bodies—planets, moons, and aster-oids—in the solar system, if seismic sensors can be deployed and data retrieved. a very limited amount of seismic data obtained from the moon during the apollo program revealed unique and fundamental information about the moon’s internal structure, including thick-ness of the surface regolith layer, presence of a low-velocity zone near a depth of 400 km, very low seismic attenuation indicative of very small quantities of fluids in the crust, and the possible existence of a partially mol-ten silicate core. deployments of seismome-ters on other planetary bodies can potentially address many significant scientific questions, such as the existence and radius of planetary liquid cores, the extent of water and temper-atures within the crust and mantle of mars, the dimensions of the salt-water ocean on europa, and the reason for the lack of a mag-netic field on Venus. although every planet presents formidable challenges to seismologi-cal approaches, the long reach of seismologi-cal methods can provide a bountiful return of important informa-tion that cannot be obtained by any other method. a return of seismometers to the moon would provide oppor-tunities to explore outstanding basic questions, including: does the moon’s internal structure support the model of lunar forma-tion from ejecta of a large impact on earth? What is the nature of the mantle-core boundary within the moon, and what is its connection with deep moonquakes? What is the physical mech-anism that controls the correlation between moonquakes and tidal stresses excited by earth’s gravitational field? are the mecha-nisms of failure for deep lunar quakes similar to the mechanisms responsible for deep earthquakes on earth? are these events related to solid phase changes in silicate minerals? how large are lateral heterogeneities in composition and structure, as deter-mined using 3d tomography? a similar broad range of topics can be addressed by deploy-ing seismometers on mars, if engineering challenges of design-ing, building, and deploying rugged seismometers protected from extreme temperatures, winds, and cosmic radiation, can be over-come. mars is likely to be relatively lacking in tectonic faulting processes, but mapping the crust and lithosphere will be feasible
using artificial sources and the new seismic technique of analyz-ing correlated noise excited by the strong atmospheric winds. key topics that could be addressed include the radial layering of the crust mantle and core of the planet, the distribution of ground-water/ice in the near surface, and the internal structural varia-tions associated with the presently enigmatic bimodal surface morphology of the planet. determining the frequency of impacts and how strongly they vibrate the surface is also of interest. Venus and mercury present formidable environmental chal-lenges, but seismological technologies that can overcome them may be within reach. Smaller planetary bodies like europa, ganymede, and enceladus are good targets for using seismologi-cal methods to determine the presence and extent of internal fluids. asteroids have highly uncertain material properties, and design of seismological probes of their interiors can comple-ment other approaches such as ground-penetrating radar. given the great payoff from even limited seismic recordings, every mission to a solid body in the solar system should include con-sideration of the potential for seismological instrumentation and data collection.
Planetary Seismology
Sid
eba
r 2
1
buzz aldrin deploying a seismometer on the moon during the apollo 11 mission. (image courtesy of naSa.)
grand challengeS For SeiSmology

55
Internal boundaries in the Earth are associated with the primary compositional layering that resulted from chemical differentiation of the planet (the crust, man-tle, and core) and with mineralogical phase changes controlled by pressure and temperature variations (the transition zone and deep mantle velocity discontinui-ties and the inner core boundary). These variations can
produce significant accompanying changes in compo-sition and rheology. These boundaries can thus exert a strong influence on mantle and core convection, par-ticularly if they serve as thermal boundary layers, and their seismically determined properties can constrain internal composition and temperature when calibra-tions from mineral physics are available. Seismology
can characterize the depth (pres-sure) and elasticity contrasts across internal boundaries with high precision. The frontier of research now lies in mapping the 3D topography and sharp-ness of Earth’s internal boundar-ies, which are key to quantifying their mineralogical and compo-sitional nature. The seismological methods that are needed involve waveform modeling and wave-field migrations, complementing travel-time tomography, which is better for resolving volumetric heterogeneities. Detailed imaging and interpretation of the ther-mal, compositional, and dynam-ical processes near Earth’s inter-nal boundaries are the principal components of one of the Grand Challenges for Seismology.
Radial models of the mantle include globally extensive seis-mic velocity jumps near depths of 410, 520, and 660 km, which are generally attributed to phase
grand challenge 10. hoW are earth’S internal boundarieS aFFected by dynamicS?
Surface topography and bathymetry around South america (top) overlays vari-able topography on earth’s upper mantle phase transition discontinuities near 410 km (middle) and 660 km (bottom) depth. topography on the discontinuities is used to characterize compositional and thermal heterogeneity within the earth. in this region, the large depressions are related to subduction processes, whereby cold Pacific plate lithosphere descends into the mantle beneath South america. (image courtesy of n. Schmerr.)
grand challenge 10
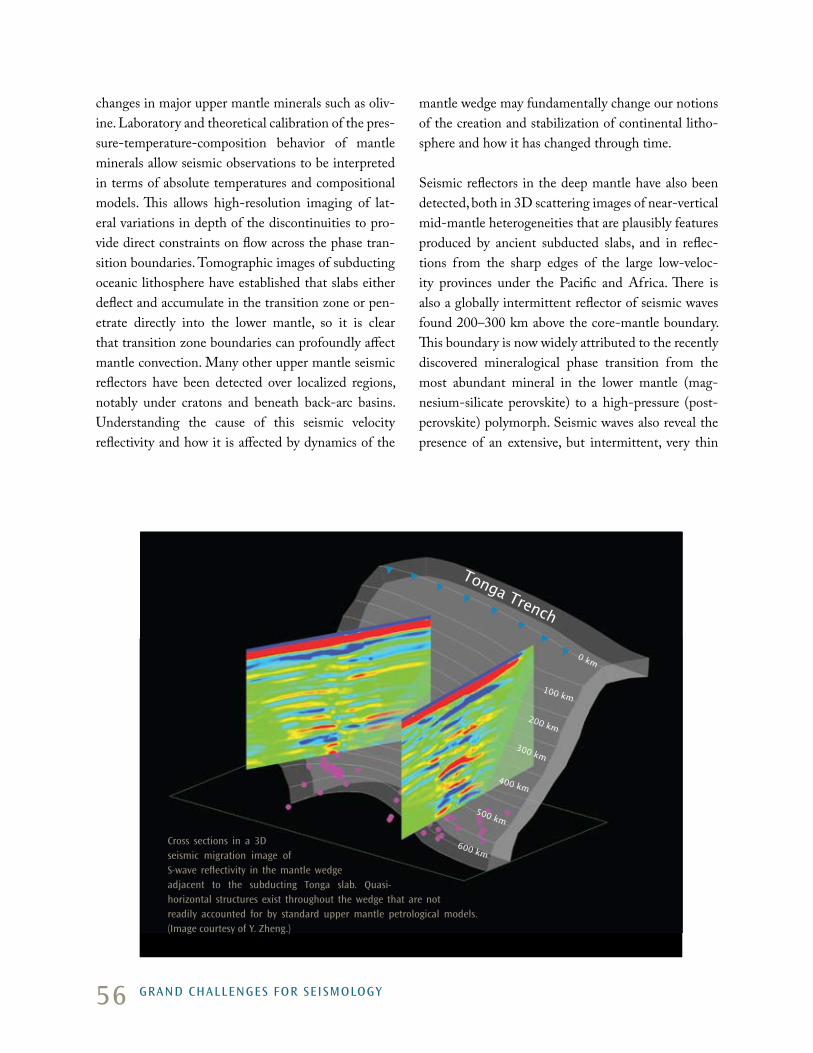
56
changes in major upper mantle minerals such as oliv-ine. Laboratory and theoretical calibration of the pres-sure-temperature-composition behavior of mantle minerals allow seismic observations to be interpreted in terms of absolute temperatures and compositional models. This allows high-resolution imaging of lat-eral variations in depth of the discontinuities to pro-vide direct constraints on flow across the phase tran-sition boundaries. Tomographic images of subducting oceanic lithosphere have established that slabs either deflect and accumulate in the transition zone or pen-etrate directly into the lower mantle, so it is clear that transition zone boundaries can profoundly affect mantle convection. Many other upper mantle seismic reflectors have been detected over localized regions, notably under cratons and beneath back-arc basins. Understanding the cause of this seismic velocity reflectivity and how it is affected by dynamics of the
mantle wedge may fundamentally change our notions of the creation and stabilization of continental litho-sphere and how it has changed through time.
Seismic reflectors in the deep mantle have also been detected, both in 3D scattering images of near-vertical mid-mantle heterogeneities that are plausibly features produced by ancient subducted slabs, and in reflec-tions from the sharp edges of the large low-veloc-ity provinces under the Pacific and Africa. There is also a globally intermittent reflector of seismic waves found 200–300 km above the core-mantle boundary. This boundary is now widely attributed to the recently discovered mineralogical phase transition from the most abundant mineral in the lower mantle (mag-nesium-silicate perovskite) to a high-pressure (post-perovskite) polymorph. Seismic waves also reveal the presence of an extensive, but intermittent, very thin
100 km
200 km
300 km
400 km
500 km
600 km
0 km
Tonga Trench
cross sections in a 3d seismic migration image of S-wave reflectivity in the mantle wedge adjacent to the subducting tonga slab. Quasi-horizontal structures exist throughout the wedge that are not readily accounted for by standard upper mantle petrological models. (image courtesy of y. Zheng.)
grand challengeS For SeiSmology

57
(< 30 km) ultra-low velocity zone located just above the core-mantle boundary. This low-velocity zone is commonly attributed to partial melt being present in the hottest part of the thermal boundary layer, although strong chemical contrasts may also be involved. All of these seismological structures have impli-cations for deep mantle dynamics.
Analysis of boundary layer pro-cesses provides internal tempera-ture probes along with constraints on rheology and composition. Improved seismological constraints play a unique role in discovering and understanding these boundaries.
400 km
CMB−100 km
X2
X1L2
L2
L1
L1L1
310km0
phase transition height above CMB [21]
migrated S-wave reflector images of the core-mantle boundary (2) and a deep mantle reflec-tor about 250 km above the core-mantle boundary (1). (image from r.d. van der hilst, m.V. de hoop, P. Wang, S.-h. Shim, P. ma, and l. tenorio, 2007. Seismostratigraphy and thermal structure of earth’s core-mantle boundary region, Science, 315:1813–1817, doi:10.1126/sci-ence.1137867. reprinted with permission from aaaS.)
key QueStionS and iSSueS
• How sharp are internal mantle and core boundaries?
• What is the multiscale topographic structure and lateral extent of mantle boundaries, including the core-mantle boundary?
• What are the effects of the transition zone bound-aries on mass flux between the upper and lower mantle?
• Are there thermal boundary layers that serve as sources of mantle plumes at any of the internal boundaries?
• Is post-perovskite present in the mantle and does it exist in lenses or as a layer?
• What is the cause of the ultra-low velocity zone at the base of the mantle, and how has it evolved?
• How can seismological observations constrain heat flux across the boundaries?
• To what degree are variations in water content and chemical heterogeneity responsible for topography on mantle discontinuities?
• Can we detect time-dependent changes in bound-ary properties?
• Are there stable thermo-chemical boundary layers in the outermost outer and lowermost outer core?
• What causes hemispherical variations just below the inner core boundary and what is the source of deeper anisotropy?
grand challenge 10
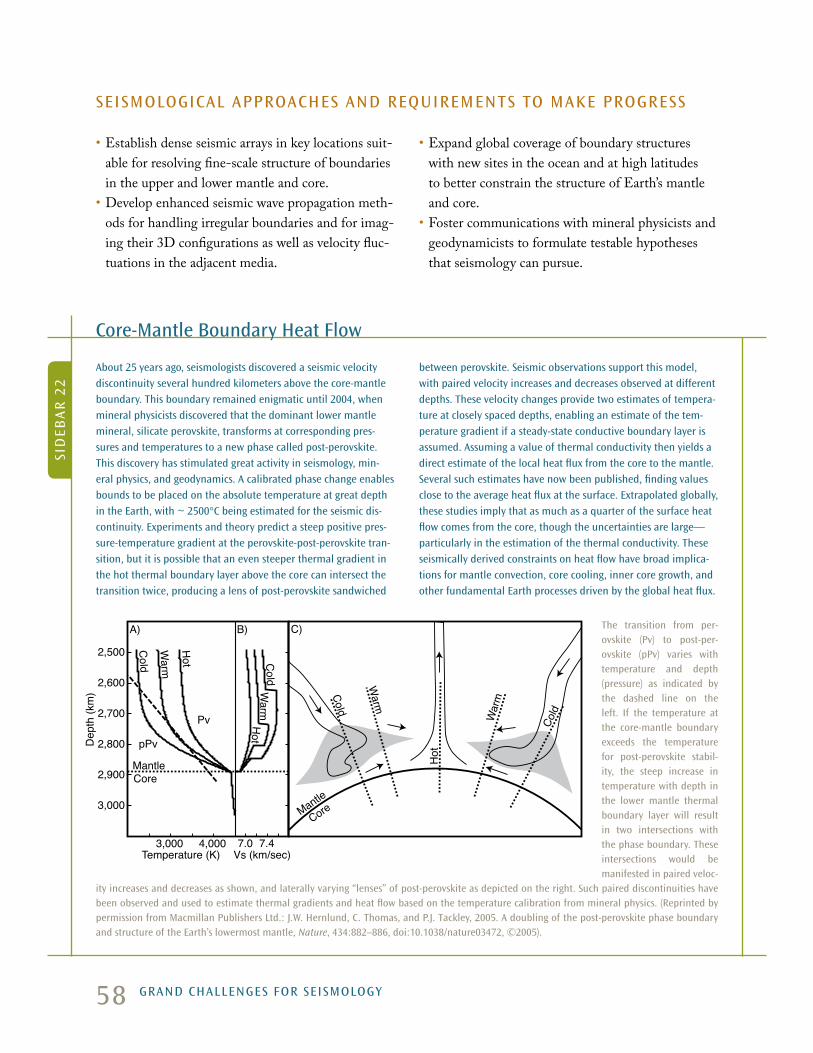
58
SeiSmological aPProacheS and reQuirementS to make ProgreSS
• Establish dense seismic arrays in key locations suit-able for resolving fine-scale structure of boundaries in the upper and lower mantle and core.
• Develop enhanced seismic wave propagation meth-ods for handling irregular boundaries and for imag-ing their 3D configurations as well as velocity fluc-tuations in the adjacent media.
• Expand global coverage of boundary structures with new sites in the ocean and at high latitudes to better constrain the structure of Earth’s mantle and core.
• Foster communications with mineral physicists and geodynamicists to formulate testable hypotheses that seismology can pursue.
about 25 years ago, seismologists discovered a seismic velocity discontinuity several hundred kilometers above the core-mantle boundary. this boundary remained enigmatic until 2004, when mineral physicists discovered that the dominant lower mantle mineral, silicate perovskite, transforms at corresponding pres-sures and temperatures to a new phase called post-perovskite. this discovery has stimulated great activity in seismology, min-eral physics, and geodynamics. a calibrated phase change enables bounds to be placed on the absolute temperature at great depth in the earth, with ~ 2500°c being estimated for the seismic dis-continuity. experiments and theory predict a steep positive pres-sure-temperature gradient at the perovskite-post-perovskite tran-sition, but it is possible that an even steeper thermal gradient in the hot thermal boundary layer above the core can intersect the transition twice, producing a lens of post-perovskite sandwiched
between perovskite. Seismic observations support this model, with paired velocity increases and decreases observed at different depths. these velocity changes provide two estimates of tempera-ture at closely spaced depths, enabling an estimate of the tem-perature gradient if a steady-state conductive boundary layer is assumed. assuming a value of thermal conductivity then yields a direct estimate of the local heat flux from the core to the mantle. Several such estimates have now been published, finding values close to the average heat flux at the surface. extrapolated globally, these studies imply that as much as a quarter of the surface heat flow comes from the core, though the uncertainties are large—particularly in the estimation of the thermal conductivity. these seismically derived constraints on heat flow have broad implica-tions for mantle convection, core cooling, inner core growth, and other fundamental earth processes driven by the global heat flux.
core-mantle boundary heat Flow
Sid
eba
r 2
2
the transition from per-ovskite (Pv) to post-per-ovskite (pPv) varies with temperature and depth (pressure) as indicated by the dashed line on the left. if the temperature at the core-mantle boundary exceeds the temperature for post-perovskite stabil-ity, the steep increase in temperature with depth in the lower mantle thermal boundary layer will result in two intersections with the phase boundary. these intersections would be manifested in paired veloc-
ity increases and decreases as shown, and laterally varying “lenses” of post-perovskite as depicted on the right. Such paired discontinuities have been observed and used to estimate thermal gradients and heat flow based on the temperature calibration from mineral physics. (reprinted by permission from macmillan Publishers ltd.: J.W. hernlund, c. thomas, and P.J. tackley, 2005. a doubling of the post-perovskite phase boundary and structure of the earth’s lowermost mantle, Nature, 434:882–886, doi:10.1038/nature03472, ©2005).
C)
3,000
2,900
2,800
2,700
2,600
2,500
3,000 4,000 7.0 7.4
Dep
th (k
m)
Temperature (K) Vs (km/sec)
Cold
Warm
Hot
pPv
Pv
MantleCore
A) B)
Hot
Warm
Cold
Cold
ColdWar
m
Warm
Hot
Mantle
Core
grand challengeS For SeiSmology
59
he remarkable panoply of seismological research topics and societal applications reviewed here is the direct result of extensive invest-ment by a number of federal agencies, industry, and universities.
Sustaining the upward trajectory of seismology’s diverse contributions to science and society requires continued strategic investment in future human and technical resources. Discussion of the disciplinary needs and recommendations for the future are summarized here.
t
SuStaining ahealthy Future
For SeiSmology
SuStaining a healthy Future For SeiSmology

60
enhancing acceSS to high-PerFormance comPuting caPabilitieS
building and SuStaining the ProFeSSional PiPeline
Increasingly massive seismic data sets, very large inver-sions for 3D and 4D multiscale models of Earth’s inte-rior, and robust forward calculations of broadband seis-mic ground motions for realistic, nonlinear effects of earthquake and explosion sources as well as 3D struc-ture present enormous computational challenges that exceed the capabilities of the most advanced comput-ers presently available. Advancing seismology research at universities and elsewhere will rely on access to resources ranging from moderate-size, in-house com-puter workstations and clusters to large-scale computa-tional capabilities, such as those at national laboratories in tandem with integrated cyberinfrastructure net-works such as TeraGrid. Access to high-performance
Key to all undertakings in seismology is maintaining and supporting a steady pipeline of talented people with solid quantitative skills into university programs that provide undergraduate and graduate training in fundamentals and applications of seismological theory and prepare new seismologists for tomorrow’s chal-lenges. Retention of this talent and expertise in indus-try, national laboratory, academic, regulatory, state, and federal agency careers requires continued collaboration among academia, funding agencies, and employers to establish sustained supporting structures. The seismol-ogy workforce demands of industry are not presently being fully met and new and stronger partnerships between relevant industries (e.g., energy, insurance, engineering) and academic programs should be devel-oped to attract undergraduates and graduate students to the discipline.
Attracting top students to this exciting and important discipline requires improved outreach that highlights its many societal contributions and exciting research
computing, coupled with further improvements in the standardization and dissemination of advanced seis-mic software (such as is currently being pursued by the NSF Computational Infrastructure for Geodynamics [CIG] initiative), is essential to advancing the disci-pline, both in facilitating new methodological break-throughs and in providing access to state-of-the-art capabilities to more institutions.
RECOMMENDATIONS• Make available to the broad research community
carefully vetted seismological software and pro-cessing tools, along with integrative data products. There is also a special need in developing coun-
frontiers. Broadly based efforts to enhance public awareness of the importance of the discipline, as con-ducted by Education and Outreach (E&O) efforts of IRIS, SCEC, and EarthScope as well as many uni-versity programs, are highly beneficial long-term investments that play a critical role in showcasing the importance of seismology and its numerous contribu-tions to society.
RECOMMENDATIONS• Further engage seismology community organiza-
tions with industry to increase awareness of oppor-tunities in seismology among undergraduates and high school students.
• Expand E&O efforts of these organizations to pro-mulgate public awareness of the discipline and its societal contributions, and support undergraduate and graduate training materials and enhanced edu-cational opportunities.
SuStaining a healthy Future For SeiSmology
61
tries with significant earthquake hazards to provide simple, standardized and open software tools for processing and analysis of seismic network data.
• Ensure data storage and online open access to all seismic data sets in perpetuity.
• Establish readily accessible pathways to facilitate the use of massive computer resources through aca-demic, industry, federal (e.g., national laboratory) and other collaborations.
• Sustain instrumentation programs that provide intermediate-size university computer capabilities involving workstations and clusters.
SuStaining global obSerVatorieS
The open availability of high-quality, widely distrib-uted recordings of ground motion lies at the heart of all seismological research and monitoring activi-ties. Strong commitments are therefore needed to sustain continuous, long-term observations at global observatories maintained by the FDSN, the IRIS/USGS GSN, and the CTBTO IMS, as well as com-pletion of the Advanced National Seismic System (ANSS) within the United States. Furthermore, data and co-sited instrumentation partnerships should be enhanced with DOE, DoD (e.g., AFTAC National Data Center), Nuclear Regulatory Commission, state, university, and other partners, whenever there is mutual benefit. Sustained maintenance and operation of high-quality standardized global stations is essen-tial for national security, global monitoring of the environment, earthquake and tsunami hazard warn-ing and response activities, and investigations of the Seismological Grand Challenges elucidated in this report. As instrumental bandwidths broaden, net-works expand, and new types of observations become available in all disciplines, we need to look toward a more holistic view of monitoring that includes not just signals from traditional seismometers and accel-erometers, but also complementary signals tradition-ally monitored and analyzed by geodesists, space sci-entists, meteorologists, oceanographers, glaciologists, hydrologists, and environmental scientists.
RECOMMENDATIONS• Advance coordination with other environmental
monitoring facilities and communities to establish multidisciplinary monitoring stations at global seis-mographic facilities, as well as to augment global seismic instrumentation.
• Share the sustained support of IRIS/USGS GSN long-term operations and equipment upgrades among all federal agencies that rely upon global seismic data as part of their operations.
• Coordinate between the academic commu-nity and international sponsors of hazard assess-ment and mitigation, especially in poorly studied regions in developing nations to create multi-use programs for monitoring, research, training, and capacity-building.
• Set the completion of the ANSS by the USGS as a high priority.
• Continue support for the operations of the ISC, which assembles and reprocesses catalogs from many international networks to the benefit all users of seismological bulletins.
• Deploy global ocean bottom borehole installations, guided by the International Ocean Network (ION) plans for establishing uniform global coverage of the Earth.
SuStaining a healthy Future For SeiSmology

62
adVancing Portable inStrumentation
Large pools of portable instruments are essential for seismological investigations of continental and oceanic environments at higher resolution than that afforded by the current global network of permanent stations. These resources also allow for flexibility in studying targeted regions of special interest and activity (e.g., active volcanoes, aftershock zones, and other natu-ral laboratories for key lithosphere-scale processes on land and in the ocean). IRIS PASSCAL, EarthScope Transportable Array and Flexible Array instruments, Ocean Bottom Seismometer Instrumentation Pool (OBSIP), and Marcus G. Langseth research vessel all presently provide key seismic data for such studies. After being archived in perpetuity in a community data center, such as the IRIS DMC, these data from temporary deployments and expeditions become part of the global seismic data resource and are increas-ingly re-exploited for research topics that range far beyond the original motivations. Although improved seismic instrumentation of the ocean environments will be achieved by the NSF Ocean Observatories Initiative (OOI), its current seismological compo-nent has become very limited, and there is generally a dire need for much more extensive coverage of ocean environments using subsurface borehole seismome-ter deployments and an expanded pool of broadband OBSs. Systematic deployment of broadband OBSs in targeted areas of the oceans holds great promise
for scientific breakthroughs, such as those proposed in the Ocean Mantle Dynamics Science Plan (2000) produced by the NSF-funded community. The con-trolled-source community has expressed a need for increased numbers of three-component instruments to enable dense deployments that are not possible with current instrument pools and to exploit the full seismic wavefield in these studies.
RECOMMENDATIONS• Continue support by federal agencies to sustain
seismic data collection and open data distribution facilities with long-term amortization and invest-ments in new technologies.
• Increase the pool of three-component broadband sensors, which are required for improved resolu-tion in next-generation 3D and 4D imaging efforts of crustal, lithospheric, and deep mantle and core structure.
• Support the EarthScope Transportable Array deployment through completion of its traverse across the United States, including Alaska.
• Expand the pool of portable OBSs for systematic large-scale deployments in portable arrays.
• Significantly increase the number of sensors for active-source experiments, including three-com-ponent systems, which are essential for advances to occur in high-resolution crustal imaging.
controlled SeiSmic Source SuPPort
The highest-resolution imaging of the near-surface crust requires densely distributed controlled seismic sources recorded by dense receiver arrays. The NSF-funded research vessel Marcus G. Langseth, which has a large airgun array and four 6-km streamers of dense hydrophones, has recently greatly enhanced commu-nity research capabilities in marine geologic studies. In contrast, the land-based community has no such
shared-source facility. The cost of controlled sources has become a limiting factor in the funding of research grants from NSF and other sources. This paucity of funding has led to a reduction in the number of proj-ects and a widening gap between academic and indus-try capabilities in this critical and workforce-challenged field. Improved and sustained availability of sources to the research community is thus required to underpin
SuStaining a healthy Future For SeiSmology
63
scientific advances, to broaden the pool of academic groups conducting such work, to advance partnership opportunities with industry, and to enhance core edu-cational opportunities for Earth science students.
The vibrator trucks of the Network for Earthquake Engineering Simulation (NEES) facility could be made more available for seismological research on very shallow structure, which may require increased flexibility in the current operation of this facility. NEES vibrators lack sufficient capabilities for crustal-scale imaging. The controlled-source seismic imag-ing efforts of the USGS have substantially diminished over the past several decades, and there is no longer a dedicated internal program to collaborate with uni-versities in the permitting and handling of buried explosive sources, which requires highly specialized expertise and is facilitated by government participa-tion. Drilling shot holes for explosives and vibrator truck arrays can both be subcontracted commercially, but the substantial cost is a significant impediment to most researchers and current research program bud-gets. Establishing a broad-based community source
facility, including drill rigs, explosive-handling capabil-ity, and a vibrator array, and integrating the needs and resources of IRIS, USGS, and NEES, would sustain the health of active seismic imaging at all scales. This facility could work on a model similar to DOSECC, which provides scientific drilling rigs, combined with expertise for the contract hiring of industry rigs where appropriate and cost effective.
RECOMMENDATIONS• Establish a facility or collection of facilities for
sources used in active-source seismology so that research programs and education in this area can be sustained. This facility could possibly be developed through access to the vibrator trucks of NEES, reinvigorated participation of the USGS in active-source seismology, and in partnership with industry.
• Improve interactions among academic, governmen-tal, and industrial efforts in active-source seismol-ogy to sustain the discipline.
• Expand the ability to conduct 3D active-source imaging at sea.
Producing adVanced SeiSmological data ProductS
The diverse applications of seismology for basic research and environmental monitoring all benefit from the long-standing efforts to produce catalogs of earthquake parameters (location, origin time, mag-nitude) and mathematical representations of Earth structure (1D, 2D, and 3D seismic velocity and den-sity distributions). Seismic source catalogs and mod-els are used widely beyond seismology, extending the disciplinary impact to earthquake engineering, earth-quake insurance, geotechnical, geological, and geo-chemical arenas. Indeed, the principal seismic data for most of these communities are earthquake cata-logs rather than seismograms. It is incumbent upon the discipline to provide the most reliable and com-prehensive compilations of seismological knowledge
to all users. However, the distributed nature of the many efforts that produce earthquake parameter lists and Earth models on various scales leads to an array of products that lack clear authoritative validation and easy access. The widespread use of the 1D Preliminary Reference Earth Model (PREM), produced in 1981, clearly demonstrates the importance of well-defined syntheses of seismological knowledge.
Recent advances in data quality and availability, advanced processing methods, and computational capabilities enable significant improvements in earth-quake catalogs and Earth models, yet there is not a dedicated effort to systematically enhance these funda-mental seismological products. It is realistic to commit
SuStaining a healthy Future For SeiSmology
64
enhancing Free and oPen acceSS to data
Seismology is an intrinsically global and interna-tional undertaking, and it relies upon strong coordi-nation and cooperation among governments, interna-tional organizations, and universities. Seismological contributions are greatly served by global open access to real-time seismic data from all international data-collection activities, building on the examples of the USGS NEIC, IRIS DMC, and FDSN-participant data centers, along with many U.S. university pro-grams. Efforts to provide access to data that are not now freely available, such as the IMS seismic record-ings, thousands of instruments in national regional recording systems, and other currently restricted
seismic data sets, will enhance multi-use of the corre-sponding signals for investigating important topics in the Earth system. Global concerns about earthquake hazards, environmental change, and nuclear testing present many opportunities for international partner-ships and interactions on technology transfer, capac-ity-building, confidence-building, and integrative hazard assessment that are all complemented by basic research. The advanced state-of-the-art of seismology in the developed world can be leveraged to enfran-chise and bolster progress in developing nations that are struggling to deal with challenging hazard issues and limited resources.
to monitoring almost all seismicity on all continents down to magnitude ~ 3 events, and beneath the oceans down to magnitude ~ 4, over the next decade. Event location accuracy can be systematically improved on large and even global scales, with relative locations as accurate as a few hundred meters rather than current levels of a few to tens of kilometers. Integration of cat-alogs from various seismic systems into an authorita-tive, readily accessible global seismic source database would benefit basic research, applied research, and many societal applications that use seismicity distri-butions. It is also realistic to commit to developing a consensus 3D Earth model as a reference structure for diverse applications. This is a very complex under-taking and should be coordinated at the agency level, with an understanding that models evolve and require updating as data and methods improve.
Natural disasters provide both learning and teaching opportunities that can be exploited if infrastructure is in place in advance. Rapid responses to exploit the window of opportunity for making critical transient observations (e.g., fault-zone drilling, hydrological monitoring, aftershock recording, volcanic deforma-tions) must be planned in advance. Rapid dissemina-
tion of seismological information to educators, emer-gency response coordinators and the general public also requires in-place infrastructure.
RECOMMENDATIONS• Integrate regional and global seismic bulletins into
an openly available, definitive international seismic source catalog.
• Commit to improving earthquake location accura-cies on large scales by using advanced processing methods and strive to complete catalogs down to levels of magnitude 3 in continents and 4 in oceanic regions.
• Develop a 3D Earth model as the next generation community model beyond PREM, describing the anelastic, anisotropic, aspherical Earth structure by standardized parameterization that can be used by multiple disciplines.
• Provide ready access to products of seismological research in forms that are useful to fellow Earth sci-entists to facilitate dissemination of seismological knowledge.
• Expand infrastructure for learning from disas-ters and mounting scientific response, along with improved outreach with information for the public.
SuStaining a healthy Future For SeiSmology
65
enhanced interdiSciPlinary coordination
Progress on the Seismological Grand Challenges listed in this long-range plan and the many societal appli-cations of seismology hinges on improved interdisci-plinary interactions and communications. Strong syn-ergisms exist within the Earth science arena between seismology and other disciplines, such as geodesy, geo-dynamics, mineral physics, geology, and geochemistry. These connections are fostered by professional societies such as the American Geophysical Union (AGU), the Society of Exploration Geophysicists (SEG), and the International Association for Seismology and Physics of Earth’s Interior (IASPEI). Research coordination is abetted by NSF-funded community organizations and consortia such as IRIS, the Southern California Earthquake Center (SCEC), the Cooperative Institute for Deep Earth Research (CIDER), the Consortium for Materials Properties Research in Earth Sciences (COMPRES), and the geodetic consortium UNAVCO. NSF programs such as EarthScope, MARGINS, RIDGE, and CSEDI also enhance mul-tidisciplinary communications. Coordination with the National Ecological Observatory Network (NEON) can augment societal applications of seismology. The United States has only limited ties between industry
and academia for workforce training and technology development in active-source seismology. Many of the novel seismological areas of research identified in this document, including some aspects of atmospheric, cli-mate, and ocean research, are at early stages in build-ing constructive coordination among science commu-nities, funding agencies, and industry.
RECOMMENDATIONS• Sustain multidisciplinary integration efforts and
foster improved communications and coordination on seismology activities among NSF divisions of Earth Sciences, Ocean Sciences, and Atmospheric Sciences, and the Office of Polar Programs. Overcome existing institutional barriers to opti-mal cross-divisional seismology activities through coordination at the Geoscience Directorate level of NSF.
• Encourage federal and state agencies, universi-ties, and scientific organizations to support inter-disciplinary workshops on critical interfaces in the shallow Earth system, extreme environments, deep Earth processes, and environmental change with active participation by seismologists.
RECOMMENDATIONS• Continue to have federal programs and seismology
organizations strongly advocate for open access to seismic data on a global basis, with real-time access to the greatest extent possible.
• Communicate and foster seismological capabilities for addressing hazards and environmental moni-toring concerns and data exchange with developing nations through coordinated international efforts.
SuStaining a healthy Future For SeiSmology
adVanceS in inStrumentation
Technological advances permeate the discipline of seismology, which has been a scientific leader in embracing advances in computer storage, digital pro-cessing, telecommunications, Internet dissemination
of information, and other technologies. Specific to the discipline are needs for further advances in seismic sen-sors and high-resolution data acquisition. The current sensors for recording very broadband (VBB) seismic
66 SuStaining a healthy Future For SeiSmology
data at the long-period end of seismic ground motions (Streckeisen STS-1 sensors deployed in many seismic networks) are no longer being produced and will need replacement as they age. Development of a next-gen-eration VBB sensor is a high priority, and is required to ensure on-scale, complete recordings of the very largest earthquakes, such as the 2004 Sumatra tsunami earthquake, and to record with high fidelity Earth’s free oscillations, slow earthquake motions, and very-long-period “noise” arising from oceanic, atmospheric, and other sources. New micro-electro mechanical systems (MEMS) are being designed to sense short-period ground vibrations, and further development of this technology may soon enable vast increases in num-bers of inexpensive sensors that can provide high-den-sity sampling of ground motions in urban and remote areas. Extension of the usable period band for MEMS or other novel low-cost sensors to the range of tens of seconds would usher in a revolution in seismic tomog-raphy of the deep Earth by facilitating 3D and 4D crust and mantle imaging experiments using orders of magnitude more receivers than are fieldable with cur-rent (e.g., IRIS PASSCAL) seismometer technology. New seismic sensors for hostile environments (extreme cold, ocean bottom, deep boreholes, and extraterres-trial environments) are critical for expanding the sci-entific reach of seismology and for addressing the dis-cipline’s Grand Challenges. University participation in seismic instrumentation development has dimin-ished over time, and sustaining specialized expertise in ground-motion measurement technologies is a chal-lenge that confronts the discipline.
RECOMMENDATIONS• Encourage collaborations across federal agencies
that utilize very broadband seismic data for moni-toring purposes to support development of next-generation very broadband seismometers to replace current instruments.
• Explore MEMS technologies to develop low-cost seismic sensors that can be deployed in great numbers and can supplement or replace current seismometers.
• Increase the number of strong motion instruments near faults and in urban areas to improve con-straints on rupture processes and to better under-stand the relationship between ground motion and building damage.
• Continue to develop next-generation telemetered seismic instrumentation in hostile environments (e.g., volcanoes, glaciers, seafloor).
• Develop partnerships among industry, national lab-oratories, academia, and federal agencies to advance and sustain seismic instrumentation innovation and capabilities.
• Sustain existing permanent networks, such as the GSN and ANSS, as long-term observa-tional systems for both research and monitoring, through stable funding from multi-agency part-ners and continued upgrades to improve reliability and efficiency.
67
eismology is an exciting, vigorous, and important discipline, with broad relevance to major challenges confronting society, including environmental change, cop-ing with natural hazards, energy resource development, and national security.
Seismology provides the highest-resolution probes of inaccessible regions of Earth’s interior from shallow crustal sediments to the central core, and thus plays a primary role in efforts to understand the structure and dynamics of Earth’s many internal sys-tems. The discipline has grown to its current prominence by sustained federal support of basic research, which ensures training of new generations of seismologists via uni-versity research programs, along with technical developments that enhance applied research in nuclear monitoring, exploration and resource management seismology, earthquake and volcano hazard monitoring, and environmental change evaluation.
Looking to the next 10 to 20 years, the seismological community has herein defined 10 Grand Challenge basic research questions where seismology offers the opportu-nity for fundamental contributions. These topics all address Earth systems that can be probed and quantified using seismological techniques. This document identifies scien-tific challenges and opportunities for basic research in seismology to be supported by federal, university, state, and industry programs. It is hoped that this document will use-fully inform and inspire program managers and agency directors to help advance and sustain the critical infrastructure, workforce, and scientific capabilities necessary for the field to fully realize its potential contributions to science and to society at large.
S
Summary
Summary
68
eismological approaches to solving the Grand Challenges described in this document include a plethora of analysis techniques and distinct seismic wave analyses. Underlying all of the methods are some intrinsic attributes of the
discipline that warrant discussion. These include the practices of monitoring Earth’s natural and human-made sources, and the practices of imaging Earth’s systems and modeling the ground shaking using the resulting Earth models.
S
aPPendixkey SeiSmological PracticeS
monitoring dynamic ProceSSeS in earth’S enVironment
Earthquakes, volcanoes, ocean storms, glacial flows, and many other natural sources are located, identified, and quantified through fundamental monitoring prac-tices of seismology. These practices require long-term operation of many seismometers in arrays and net-works of various scales with continuous data teleme-try. Monitoring operations include sparse global seis-mographic networks with very broadband recording capabilities, dense regional networks with high-res-olution capabilities, and temporary deployments in remote areas such as Antarctica, the ocean, mountain ranges, and dense jungles. Commitment to long-term operations for monitoring natural hazards is essential, but long-term monitoring is also crucial for investi-gating relatively slow Earth processes, such as changes associated with global warming, inner core super-rotation, and many other seismically observable phe-nomena. Open access to the seismic data collected for
monitoring purposes ensures full exploitation of the signals for multi-use purposes of basic research and diverse monitoring functions.
More than 200,000 earthquakes are located each year. Continuous seismic monitoring provides the where and when of earthquakes and can guide emergency response activities, and the same data provide infor-mation needed to understand the physics of earth-quake ruptures. Continuous monitoring has allowed the discovery of new kinds of seismic phenomena, such as the seismic tremor discussed above, which may help future hazard reduction efforts. Seismic monitor-ing of earthquakes also provides critical information about site responses, which is essential for earthquake engineering. Shallow geological heterogeneity pro-duces profound variations in surface ground shaking, and empirical calibration remains the best approach to
aPPendix
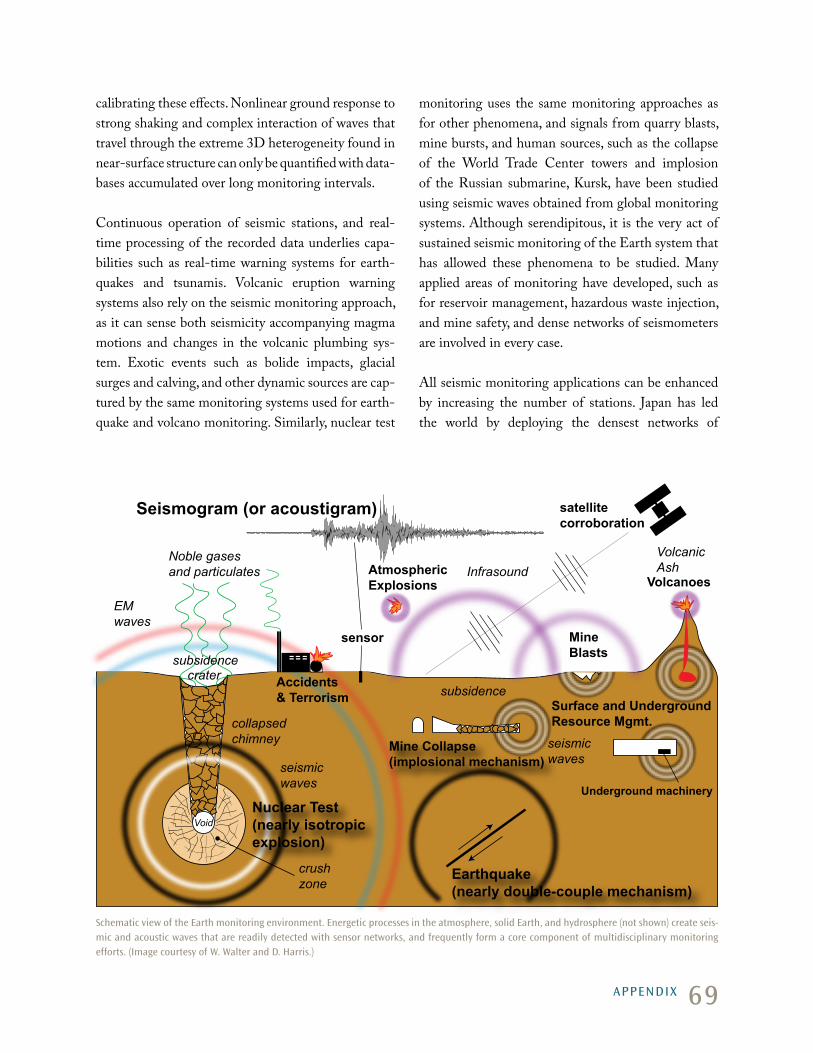
69
calibrating these effects. Nonlinear ground response to strong shaking and complex interaction of waves that travel through the extreme 3D heterogeneity found in near-surface structure can only be quantified with data-bases accumulated over long monitoring intervals.
Continuous operation of seismic stations, and real-time processing of the recorded data underlies capa-bilities such as real-time warning systems for earth-quakes and tsunamis. Volcanic eruption warning systems also rely on the seismic monitoring approach, as it can sense both seismicity accompanying magma motions and changes in the volcanic plumbing sys-tem. Exotic events such as bolide impacts, glacial surges and calving, and other dynamic sources are cap-tured by the same monitoring systems used for earth-quake and volcano monitoring. Similarly, nuclear test
monitoring uses the same monitoring approaches as for other phenomena, and signals from quarry blasts, mine bursts, and human sources, such as the collapse of the World Trade Center towers and implosion of the Russian submarine, Kursk, have been studied using seismic waves obtained from global monitoring systems. Although serendipitous, it is the very act of sustained seismic monitoring of the Earth system that has allowed these phenomena to be studied. Many applied areas of monitoring have developed, such as for reservoir management, hazardous waste injection, and mine safety, and dense networks of seismometers are involved in every case.
All seismic monitoring applications can be enhanced by increasing the number of stations. Japan has led the world by deploying the densest networks of
Surface and Underground Resource Mgmt.
Void
subsidence
collapsedchimney
crushzone
seismicwaves
seismicwaves
Volcanoes
Underground machinery
satellitecorroboration
EMwaves
sensor
Seismogram (or acoustigram)
Earthquake (nearly double-couple mechanism)
Noble gasesand particulates
cratersubsidence
Infrasound
MineBlasts
Accidents& Terrorism
AtmosphericExplosions
Nuclear Test(nearly isotropicexplosion)
VolcanicAsh
Mine Collapse(implosional mechanism)
Schematic view of the earth monitoring environment. energetic processes in the atmosphere, solid earth, and hydrosphere (not shown) create seis-mic and acoustic waves that are readily detected with sensor networks, and frequently form a core component of multidisciplinary monitoring efforts. (image courtesy of W. Walter and d. harris.)
aPPendix
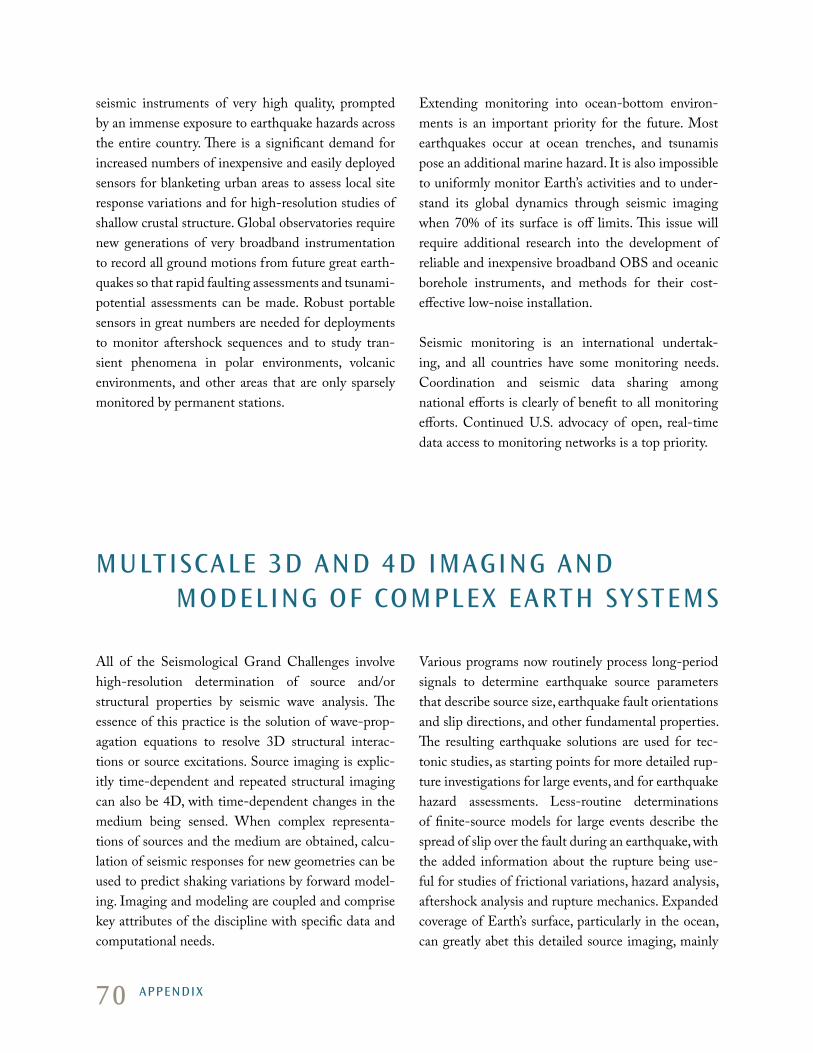
70
seismic instruments of very high quality, prompted by an immense exposure to earthquake hazards across the entire country. There is a significant demand for increased numbers of inexpensive and easily deployed sensors for blanketing urban areas to assess local site response variations and for high-resolution studies of shallow crustal structure. Global observatories require new generations of very broadband instrumentation to record all ground motions from future great earth-quakes so that rapid faulting assessments and tsunami-potential assessments can be made. Robust portable sensors in great numbers are needed for deployments to monitor aftershock sequences and to study tran-sient phenomena in polar environments, volcanic environments, and other areas that are only sparsely monitored by permanent stations.
Extending monitoring into ocean-bottom environ-ments is an important priority for the future. Most earthquakes occur at ocean trenches, and tsunamis pose an additional marine hazard. It is also impossible to uniformly monitor Earth’s activities and to under-stand its global dynamics through seismic imaging when 70% of its surface is off limits. This issue will require additional research into the development of reliable and inexpensive broadband OBS and oceanic borehole instruments, and methods for their cost-effective low-noise installation.
Seismic monitoring is an international undertak-ing, and all countries have some monitoring needs. Coordination and seismic data sharing among national efforts is clearly of benefit to all monitoring efforts. Continued U.S. advocacy of open, real-time data access to monitoring networks is a top priority.
multiScale 3d and 4d imaging and modeling oF comPlex earth SyStemS
All of the Seismological Grand Challenges involve high-resolution determination of source and/or structural properties by seismic wave analysis. The essence of this practice is the solution of wave-prop-agation equations to resolve 3D structural interac-tions or source excitations. Source imaging is explic-itly time-dependent and repeated structural imaging can also be 4D, with time-dependent changes in the medium being sensed. When complex representa-tions of sources and the medium are obtained, calcu-lation of seismic responses for new geometries can be used to predict shaking variations by forward model-ing. Imaging and modeling are coupled and comprise key attributes of the discipline with specific data and computational needs.
Various programs now routinely process long-period signals to determine earthquake source parameters that describe source size, earthquake fault orientations and slip directions, and other fundamental properties. The resulting earthquake solutions are used for tec-tonic studies, as starting points for more detailed rup-ture investigations for large events, and for earthquake hazard assessments. Less-routine determinations of finite-source models for large events describe the spread of slip over the fault during an earthquake, with the added information about the rupture being use-ful for studies of frictional variations, hazard analysis, aftershock analysis and rupture mechanics. Expanded coverage of Earth’s surface, particularly in the ocean, can greatly abet this detailed source imaging, mainly
aPPendix

71
for very large earthquakes; this science was one of the original motivations for deploying more permanent ocean seismic observatories. Resolution of detailed rupture processes is delimited by the accuracy of the structural models, so those must also improve.
Imaging methods also underlie all determinations of Earth structure. With the basic spherically symmetric Earth structure having been determined by the 1980s, seismologists subsequently turned their attention to resolving lateral variations in seismic wave speeds using data from regional and global seismographic networks. This use of data created the still-booming field of seismic tomography, the seismological equiva-lent of medical CAT-scan imaging, by which models for heterogeneous P-wave and S-wave structure of the crust, mantle, and core have been determined. Global images are variable in resolution due to the nonuni-form distributions of sources and receivers, and signifi-cant improvements in models are driven primarily by
new data-collection efforts in previously unsampled areas or with densified station spacing. Imaging oce-anic crust and upper mantle structure continues to be particularly hampered by a lack of oceanic stations, and there continues to be a pressing need for deployment of a global ocean bottom seismographic network.
Seismic tomography is moving toward “finite-fre-quency” imaging, in which the full bandwidth of seis-mic signals is harnessed to probe different aspects of Earth structure. In addition, efforts have commenced to map anelastic attenuation structure and anisotro-pic structure on regional and global scales using com-plete waveform information. These efforts will provide improved constraints on thermal and compositional structure and deformational processes in the interior.
State-of-the-art practices in exploration seismology for 3D and 4D imaging involves acquisition, pro-cessing, and interpretation of huge seismic data sets.
three-dimensional reflection image of the accretionary prism in
the nankai trench off the izu Peninsula, Japan, obtained by a 3d survey. note the great complexity of the
structure and the ability of seismology to image the geological pro-cess with high resolution. (image courtesy of the university of texas Jackson School of geosciences.)
aPPendix
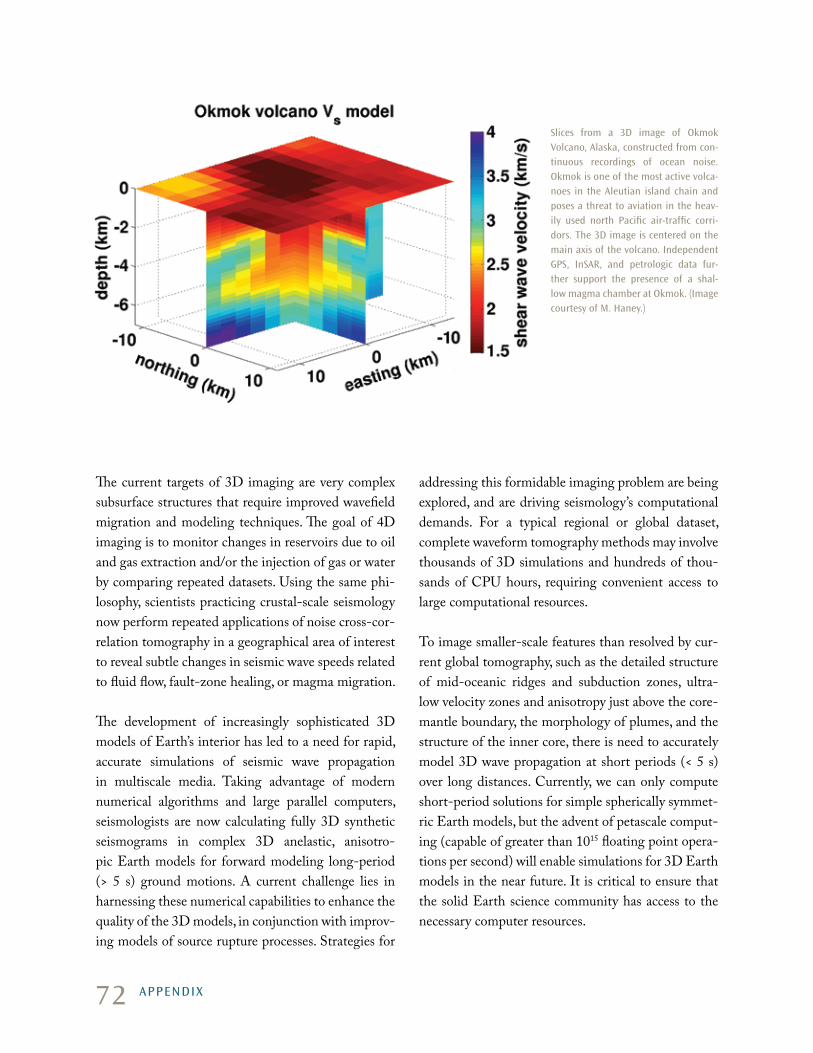
72
The current targets of 3D imaging are very complex subsurface structures that require improved wavefield migration and modeling techniques. The goal of 4D imaging is to monitor changes in reservoirs due to oil and gas extraction and/or the injection of gas or water by comparing repeated datasets. Using the same phi-losophy, scientists practicing crustal-scale seismology now perform repeated applications of noise cross-cor-relation tomography in a geographical area of interest to reveal subtle changes in seismic wave speeds related to fluid flow, fault-zone healing, or magma migration.
The development of increasingly sophisticated 3D models of Earth’s interior has led to a need for rapid, accurate simulations of seismic wave propagation in multiscale media. Taking advantage of modern numerical algorithms and large parallel computers, seismologists are now calculating fully 3D synthetic seismograms in complex 3D anelastic, anisotro-pic Earth models for forward modeling long-period (> 5 s) ground motions. A current challenge lies in harnessing these numerical capabilities to enhance the quality of the 3D models, in conjunction with improv-ing models of source rupture processes. Strategies for
addressing this formidable imaging problem are being explored, and are driving seismology’s computational demands. For a typical regional or global dataset, complete waveform tomography methods may involve thousands of 3D simulations and hundreds of thou-sands of CPU hours, requiring convenient access to large computational resources.
To image smaller-scale features than resolved by cur-rent global tomography, such as the detailed structure of mid-oceanic ridges and subduction zones, ultra-low velocity zones and anisotropy just above the core-mantle boundary, the morphology of plumes, and the structure of the inner core, there is need to accurately model 3D wave propagation at short periods (< 5 s) over long distances. Currently, we can only compute short-period solutions for simple spherically symmet-ric Earth models, but the advent of petascale comput-ing (capable of greater than 1015 floating point opera-tions per second) will enable simulations for 3D Earth models in the near future. It is critical to ensure that the solid Earth science community has access to the necessary computer resources.
Slices from a 3d image of okmok Volcano, alaska, constructed from con-tinuous recordings of ocean noise. okmok is one of the most active volca-noes in the aleutian island chain and poses a threat to aviation in the heav-ily used north Pacific air-traffic corri-dors. the 3d image is centered on the main axis of the volcano. independent gPS, inSar, and petrologic data fur-ther support the presence of a shal-low magma chamber at okmok. (image courtesy of m. haney.)
aPPendix
73
American Geological Institute, Geoscience Workforce Age Distribution, Geoscience Currents, No. 16, http://www.agiweb.org/workforce, 9 October 2008.
Basic Research Opportunities in Earth Sciences, 2001. National Research Council, National Academies Press, Washington, D.C. (http://books.nap.edu/catalog php?record_id=9981)
Cooperative Studies of the Earth’s Deep Interior: Development, Discoveries, Future, 2004. CSEDI, 42 pp. (http://www.csedi.org/)
Critical Needs for the Twenty First Century: The Role of the Geosciences, 2008. The American Geological Institute. (http://www.agiweb.org/gap/trans08.html)
Current and Future Research Directions in High-Pressure Mineral Physics, 2004. COMPRES, ESS Building, Stony Brook, NY 11794. (http://www.compres.stonybrook.edu/Publications/index.html)
Earthquake Risk Reduction: Addressing the Unmet Challenges, 2008. Earthquake Engineering Research Institute, 32 pp. (http://www.eeri.org/cds_publications/catalog/product_info.php?products_id=291)
Geosciences: The Future, 2007. International Union of Geodesy and Geophysics, 106 pp. (http://www.iugg.org/publications/reports/)
Grand Challenges for Disaster Reduction, 2005. National Science and Technology Council Subcomiittee on Disaster Reduction, 21 pp. (http://www.nehrp.gov/pdf/grandchallenges.pdf )
Living on an Active Earth, 2003. National Research Council, National Academies Press, Washington, D.C.
Ocean Mantle Dynamics Science Plan, 2000. National Science Foundation, Washington, DC. 43 pp.
Origin and Evolution of Earth: Research Questions for a Changing Planet, 2008. National Research Council, National Academies Press, Washington, D.C. (http://www.nap.edu/catalog.php?record_id=12161)
Securing Society Against Catastrophic Earthquake Losses, 2003. Earthquake Engineering Research Institute, 62 pp. (http://www.eeri.org/cds_publications/catalog/product_info.php?products_id=230)
recommendedreading
recommended reading
74
AGU – American Geophysical Union
ANSS – Advanced National Seismic System, operated by the USGS
ATM – Atmospheric Sciences Division of the NSF
CIG – Computational Infrastructure for Geodynamics, funded by NSF
CIDER – Cooperative Institute for Deep Earth Research
CISN – California Integrated Seismic Network
COMPRES – Consortium for Materials Properties Research in Earth Sciences
CSEDI – Cooperative Studies of the Earth’s Deep Interior, funded by NSF
CTBTO – Comprehensive (Nuclear) Test Ban Treaty Organization
DMS – IRIS Data Management System
DoD – Department of Defense
DOE – Department of Energy
DOSECC – Drilling, Observation and Sampling of the Earth’s Continental Crust
EAR – Earth Sciences Division of NSF
EarthScope – NSF/USGS/NASA Major equipment facility for studying the North American continent
EERI – Earthquake Engineering Research Institute
FDSN – International Federation of Digital Seismograph Networks
FEMA – Federal Emergency Management Agency
GEO – Geosciences Directorate of NSF
GEOSS – Global Earth Observation System of Systems
GPS – Global Positioning System
GSN – Global Seismographic Network
IASPEI – International Association for Seismology and Physics of Earth’s Interior
IAVCEI – International Association for Volcanology and Chemistry of Earth’s Interior
IMS – International Monitoring System of the CTBTO
IODP – Integrated Ocean Drilling Program
ION – International Ocean Network
acronymS and titleS
acronymS and titleS
75
ISC – International Seismological Centre
InSAR – Interferometric Synthetic Aperture Radar
IRIS – Incorporated Research Institutions for Seismology
IUGG – International Union for Geodesy and Geodynamics
MARGINS – Continental margins program, funded by NSF
MELT – Mantle Electromagnetic and Tomography experiment
NASA – National Aeronautics and Space Administration
NEES – Network for Earthquake Engineering Simulation, funded by NSF
NEIC – National Earthquake Information Center, operated by the USGS
NEON – National Ecological Observatory Network, funded by NSF
NOAA – National Oceanic and Atmospheric Administration
NSF – National Science Foundation
NVEWS – National Volcano Early Warning System of the USGS
OBS – Ocean Bottom Seismometer
OBSIP – Ocean Bottom Seismometer Instrumentation Pool, funded by NSF
OCE – Ocean Sciences Division of the National Science Foundation
OOI – Ocean Observatories Initiative, funded by NSF
OPP – Office of Polar Programs of NSF
PASSCAL – IRIS Program for Array Seismic Studies of the Continental Lithosphere
PBO – Plate Boundary Observatory, a component of EarthScope
PGA – Peak Ground Acceleration
PREM – Preliminary Reference Earth Model
RESESS – Research Experience for Solid Earth Science for Students internship program
RIDGE – Ocean ridge research program, funded by NSF
SAFOD – San Andreas Fault Observatory at Depth, a component of EarthScope
SAGE – Summer of Applied Geophysical Experience
SCEC – Southern California Earthquake Center
acronymS and titleS
76
SEG – Society of Exploration Geophysicists
SOARS – Significant Opportunities in Atmospheric Research and Science UCAR internship program
SSA – Seismological Society of America
TeraGrid – An open scientific computational resource infrastructure funded by NSF and partners
UCAR – University Corporation for Atmospheric Research
UNAVCO – University consortium for measurement of crustal deformation
USArray – Seismographic component of EarthScope
USGS – United States Geological Survey
WWSSN – World-Wide Standardized Seismographic Network
acronymS and titleS

this long range science Plan for seismology is baseD on
a WorkshoP sPonsoreD by the national science founDation
anD funDeD through an aWarD to the iris consortium.
any oPinions, finDings, conclusions, or recommenDations exPresseD
in this Publication Do not necessarily reflect the vieWs of nsf.
an electronic version of this rePort
is available at httP://WWW.iris.eDu/hq/lrsPs/