seismic shear loading at flexural capacity in …4)0278.pdf · seismic shear loading at flexural...
TRANSCRIPT

2 7 8
S E I S M I C S H E A R L O A D I N G A T F L E X U R A L C A P A C I T Y
IN C A N T I L E V E R W A L L S T R U C T U R E S
R VV.G. B lake ley* , R.C. C o o n e y * * , L.M. Megge t * * *
ABSTRACT
An investigation is described into the effect of various combinations of the normal modes of vibration of cantilever shear wall structures on the maximum shears at flexural capacity. It is shown that the base shear can be much higher than would be derived by assuming a normal code lateral load distribution of sufficient magnitude to cause flexural yielding. The results of elastic normal mode response spectrum analyses of a 10-storey building considering several structural variables are presented in terms of envelope values of the ratio of maximum base shear at flexural capacity to that assuming a code lateral load distribution. The same effect is investigated with a series of step-by-step numerical integration dynamic analyses of cantilever wall structures responding inelastically to a range of earthquakes. On the basis of the results suggestions are made for the shear design of cantilever walls.
1. INTRODUCTION
The capacity design philosophy as applied to frame or wall structures has the objective of achieving a desirable sequence in the failure mechanism of the structure under severe earthquake motions. It entails selection and suitable detailing of the mechanisms best capable of ductility and energy dissipation and provision in the remaining mechanisms of sufficient reserve strength to ensure that inelastic behaviour is predominantly confined to the chosen energy dissipating mechanism. In terms of ductile cantilever walls this approach requires provision of sufficient shear strength to confine energy dissipation to ductile flexural yielding.
The New Zealand Standard Code of Practice for General Structural Design and Design Loadings allows that where the lateral force resisting system comprises cantilever shear walls with height to width ratios exceeding 2, width exceeding 1.5m and acceptable openings they may be designed with a structural type factor, S, of 1.2 or 1.0, depending on whether there is one or more walls, provided design and detailing is adequate to ensure that energy is dissipated by ductile flexural yielding. The design lateral forces may be determined either by an equivalent static force analysis or by a spectral modal analysis. The latter is based on a design spectrum comprising the curve for the basic seismic coefficient multiplied by a scaling factor, so chosen that the computed base shear is no less than 0.9 times that derived from an equivalent static force analysis. At
* Design Engineer, Office of the Chief Designing Engineer (Civil), Head Office, M.W.D.
** Senior Engineer, Office of the Chief Structural Engineer, Head Office, M.W.D.
*** Senior Engineer, Office of the Chief Structural Engineer, Head Office, M.W.D.
any other level the shear derived by the spectral modal analysis is to be taken as no less than 80% of the values computed by the equivalent static forces method. The calculated shears are to be used to derive the horizontal forces and overturning moments.
It has been commonly assumed that the design shear for a cantilever wall can be determined by, first, calculating the flexural capacity of the wall at the base making allowance for sources of overstrength in accordance with capacity design principles and, second, deriving the shear at that moment capacity assuming a distribution of horizontal seismic forces as specified by the code , comprising an inverted triangle with the addition of a concentrated load of 0.1 times the base shear applied at the top storey when the height to depth ratio of the wall is equal to or greater than 3. This lateral force diagram represents predominantly first mode inertial forces with the additive effect of second mode accelerations at the top, but designers should be aware that this does not necessarily indicate either the critical shear forces at capacity moment in the wall or the possibility of plastic hinges forming in the wall above the base. There may be many occasions in the response of a cantilever wall structure to a major earthquake where the higher mode forces are predominant over those of the first mode and the combination of forces is still sufficient to cause flexural yielding at the base.
In such circumstances the centre of lateral inertial loading is either lower or higher than that predicted by the code load distribution, depending on the direction of combination of the applied loads due to the various modes. Correspondingly, the shears may be much higher at either the base or the top of the wall than the design values. The investigation reported in this paper studied initially the upper limits of
BULLETIN OF THE NEW ZEALAND NATIONAL SOCIETY FOR EARTHQUAKE ENGINEERING, VOL.8, N0.4. DECEMBER 1975
2 7 9
likely shear at capacity moment in the wall from an elastic normal mode response spectrum approach. The results were then compared with the computed shears for three ductile cantilever shear wall structures using a step-by-step numerical integration computer programme to compute the inelastic response to five major earthquakes.
2. NORMAL MODE RESPONSE SPECTRUM ANALYSES
A normal mode response spectrum analysis was made of a standard 10-storey, 30.5m tower building using the results of Skinner to determine extreme values of base shear relative to shear at capacity moment derived from the code lateral load distribution.
2.1 Assumptions,
a. The masses are concentrated at the floors and have a uniform value of 4.54 x 10 5kgm.
b. The storey bending stiffness ratio falls linearly from 3500 MN/m between the base and floor one to 1750 MN/m between floors nine and ten. (This variation is felt to be consistent with variation of wall thickness and reinforcing steel content up a building).
c. The ratio of storey bending stiffness to shear stiffness is 0.5 for all storeys. (The results were found to be not unduly sensitive to this parameter).
d. The ratios of frequency of the first three modes of vibration is 1:3.7:7.1 in accordance with values given by Skinner £2) f o r a building with the properties given above.
e. Design of the building is in accordance with the seismic design co-efficients of the New Zealand loadings code : basic seismic co-efficient, C, for a building in Zone A founded on rigid or intermediate subsoils, Class III buildings (I = 1.0), lateral load resistance provided by two or more approximately symmetrically arranged ductile cantilever shear walls (S = 1.0), reinforced concrete material (M = 1.0), and no unusual risk (R = 1.0). Design loads are determined from an equivalent static force analysis.
f. Response spectra '^) derived by smoothing curves of a number of earthquakes scaled to have the same spectrum intensity as El Centro 1940 (N-S) are applicable to buildings in Zone A.
g. The foundation capacity exceeds the wall base flexural capacity.
2.2 Variables Considered
a. Six buildings with periods in the range 0.2 seconds to 1.2 seconds inclusive.
b. Three values of equivalent viscous damping, 2%, 5%, 10%. (Generally, a ductile cantilever wall is considered to have an equivalent viscous damping co-efficient of about 5%. However, a value of 2% is feasible before widespread cracking, and damping may be as high as 10% after non-structural damage has occurred or where there is significant foundation compliance).
c. Three values of total moment over-strength at the base, M Q, of 1.2, 1.4 and 1.6 times the design moment, M^. (Factors which influence this over-
strength are: reinforcing steel yield strengths greater than the minimum specified, Bauschinger effects in the reinforcing steel,under cyclic loading, increased contribution of the vertical web steel to the flexural capacity with increased imposed curvatures, concrete compressive strengths greater than the minimum specified, capacity reduction factor used in the design, and actual gravity load on the wall greater than the design gravity load, particularly where the critical design case is a gravity load of 0.9D. Also, over-strength may arise because of minimum vertical steel requirements throughout the wall cross-section or where walls are oversized).
2.3 Procedure Followed
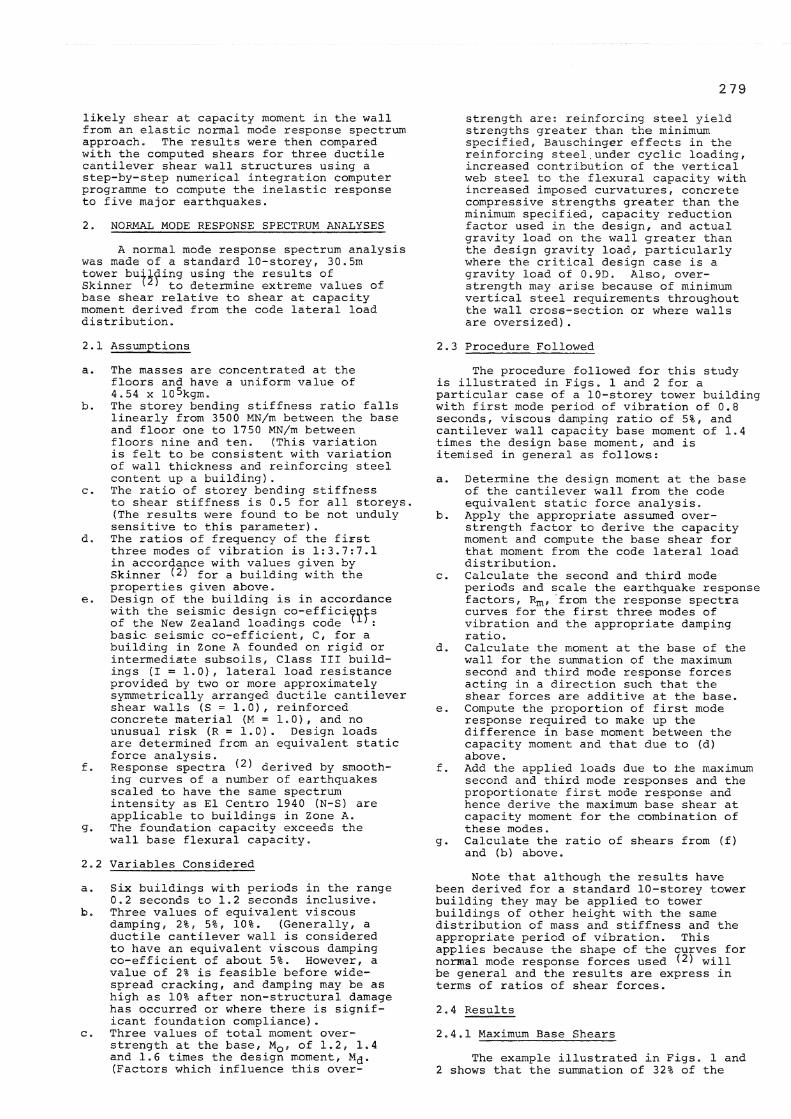
The procedure followed for this study is illustrated in Figs. 1 and 2 for a particular case of a 10-storey tower building with first mode period of vibration of 0.8 seconds, viscous damping ratio of 5%, and cantilever wall capacity base moment of 1.4 times the design base moment, and is itemised in general as follows:
a. Determine the design moment at the base of the cantilever wall from the code equivalent static force analysis.
b. Apply the appropriate assumed over-strength factor to derive the capacity moment and compute the base shear for that moment from the code lateral load distribution.
c. Calculate the second and third mode periods and scale the earthquake response factors, R m, from the response spectra curves for the first three modes of vibration and the appropriate damping ratio.
d. Calculate the moment at the base of the wall for the summation of the maximum second and third mode response forces acting in a direction such that the shear forces are additive at the base.
e. Compute the proportion of first mode response required to make up the difference in base moment between the capacity moment and that due to (d) above.
f. Add the applied loads due to the maximum second and third mode responses and the proportionate first mode response and hence derive the maximum base shear at capacity moment for the combination of these modes.
g. Calculate the ratio of shears from (f) and (b) above.
Note that although the results have been derived for a standard 10-storey tower building they may be applied to tower buildings of other height with the same distribution of mass and stiffness and the appropriate period of vibration. This applies because the shape of the curves for normal mode response forces used (2) will be general and the results are express in terms of ratios of shear forces.
2.4 Results
2.4.1 Maximum Base Shears
The example illustrated in Figs. 1 and 2 shows that the summation of 32% of the
2 8 0
maximum first mode response, 100% second mode and 100% third mode gives an applied load diagram sufficient to reach flexural capacity at the base of the wall but with a centre of applied inertial load at 0.34 of the height of the wall. If the code lateral load distribution had been assumed with sufficient force to reach flexural capacity at the base, the centre of applied inertial would have been 0.73 of the height of the building. The ratio, V r , of maximum base shear at capacity moment, assuming a critical combination of the first three modes of vibration, to that assuming the lateral load distribution specified by the code is then 2.13. This same ratio for all 54 cases studied is listed in Table 1, showing a range from 1.39 to 4.02. It may be seen that generally this ratio increases with: increasing periods of vibration, decreasing overstrength ratios and decreasing damping ratios. All three trends lead to a reduced proportion of first mode maximum response required to allow the summation of the three modal base moments to reach flexural capacity. This proportion varied from 49% to 10% between the minimum and maximum shear ratios in Table 1. As the proportion of first mode forces at flexural capacity reduces, so the influence exerted by the higher modes on the shear forces increases.
Although the shear ratios of Table 1 have been calculated for cantilever walls designed for the seismic co-efficients of Zone A and analysed using response spectra for earthquakes of the size of El Centro 1940 (N-S), the values are also applicable to walls designed for the reduced co-efficients of Zones B and C if the response spectra for the design earthquake are considered to reduce in the same proportion. That is, the values also apply to cantilever walls designed for Zone B and analysed with response spectra comprising acceleration ordinates of 0.833 times those of the El Centro-type curves, or for walls designed for Zone C and analysed with response spectra comprising acceleration ordinates of 0.667 times those of the El Centro-type spectra. If an earthquake stronger than El Centro was considered for Zone A the ratios of Table 1 would increase because the higher modes of vibration could exert a proportionately greater influence on the response.
The values of Table 1 represent an envelope of maximum possible base shears from a normal mode response spectrum approach considering an earthquake of the size of El Centro 1940 N-S, and assuming that the contribution of modes higher than the third is not likely to be significant. From elastic considerations of ranges of contribution of the three modes a distribution of the probability of occurrence of base shear ratios up to the envelope values could readily be determined. However, account must be taken of the limits to applied modal forces imposed by plastic hinging, and it is felt that the variability of base shear forces is best investigated by means of inelastic response computer analyses.
2.4.2. Plastic Hinge Formation at Intermediate Heights
Consideration of modal force combinations can also indicate the possibility of plastic
hinge formation at levels above the base. The moment diagram in Fig. 1 (c) shows that the critical mode combination for shear of 32% mode 1, 100% mode 2 and 100% mode 3, where shears and moments are additive at the base, is not critical for moments above the base. However, if mode 2 acted alone a plastic hinge could theoretically form in the vicinity of the seventh floor for the reverse direction of bending to that considered above. Further, if the moments due to mode 1 were additive to those of mode 2 at higher floor levels, as shown for the example of 40% mode 1 and 100% mode 2 on the right hand side of Fig. 1(c), a plastic hinge could form at any point within several stories above the base. Wherever flexural yielding does occur it will act as a fuse inhibiting further increases in loading.
3. INELASTIC TIME HISTORY SEISMIC ANALYSES
A series of inelastic seismic analyses were made of the time history of response of three cantilever shear wall structures of varying height subjected to five different earthquake acceleration records to determine shear and flexural hinging characteristics.
3.1 Buildings Analysed
3.1.1 6-Storey Structure
An actual building designed in 1973 by the Ministry of Works and Development for construction in Zone A was chosen as an example of a 6-storey tower structure relying on two cantilever walls for lateral load resistance in one of the principal axes of the building. Lateral load resistance is provided in the other direction by two coupled shear walls. The floor area per storey is 869m 2 and the interstorey height is 3.35m.
The cantilever walls are rectangular with a member depth of 9.404m and thickness of 4 57mm between ground and second floor, 356mm between second and fourth floor and 254mm between fourth floor and roof. Reinforcing steel at the base comprises a total of 72-31.8mm diameter bars concentrated towards each end of the wall plus 34-15.9mm diameter bars within the central region, with a total steel percentage of 1.5%. Design was to a base shear co-efficient of 0.20g with a design base moment of 59.5 MNm in each wall. The calculated first mode period of vibration was 0.45 seconds.
3.1.2 15-Storey Structure
The example chosen of a 15-storey tower structure was designed by the MWD in 1971 for construction in Zone A. The floor area is 1032m 2 per storey and the interstorey heights are 4.27m between ground and first floor, 3.97m between first and second floors and 3.36m from second floor to roof. Lateral load resistance is provided by two coupled shear walls in one principal direction and two cantilever shear walls in the other. Each cantilever wall has two flanges of width 7.78m joined by a web at one end with an overall depth of 12.19m. The wall thickness varies from 711mm between ground and first floor, 559mm between second and fifth floor, 457mm between sixth and ninth
2 8 1
floors and 3 56mm between the ninth floor and the roof. Reinforcement at the base is provided by a 254mm by 254mm by 133kgm/m universal column at each end of each flange with 46-25. 4mm diameter bars in the flange, and by 64-25.4mm diameter bars spread uniformly through the web. The total steel percentage at the base is 0.78%. Design was to a base shear co-efficient of 0.16g and the design moment at the base of each wall was 344 MNm. The calculated first mode period of vibration was 0.81 seconds.
3.1.3 20-Storey Structure
A 20-storey cantilever wall structure was designed for the purposes of this study, with seismic co-efficient for Zone A and importance factor for Class II structures for consistency with the previous two structures. The building is considered to have a floor area of 1488m 2 per storey and interstorey heights of 4.58m between ground and first floor and 3.36m for the remaining storeys. Lateral resistance is provided by two ductile cantilever walls comprising flanges of 9.15m length and a 15.25m overall depth web at the end of the flanges. The wall thicknesses are 812mm from ground to third floor, 711mm from third to sixth floor, 559mm from sixth to tenth floor, 4 57mm from tenth to fifteenth floor, and 356mm from fifteenth floor to roof. The reinforcement at the base comprises 88-31.8mm diameter bars in each flange and 132-31.8mm diameter bars spread evenly through the web with a total steel percentage of 0.94%. Design was to a base shear co-efficient of 0.13g and the design moment at the base of each wall was 905MNm. The calculated first mode period of vibration was 1.2 seconds.
3.2 Earthquake Acceleration Records
3.2.1 Taft, 1952, N21E
The Taft, California earthquake record taken in July 1952 during ground motions from the Richter magnitude 7.7 Kern County earthquake. The maximum acceleration is 0.16g and the period of strong shaking is approximately 15 seconds.
3.2.2 El Centro, 1940, N-S
This record was made on alluvium 8 km from the fault line of a Richter magnitude 6.4 earthquake. The maximum acceleration is 0.33g and the period of strong shaking is approximately 12 seconds.
3.2.3 El
This is a simulated earthquake record (3) designed to represent- the strong shaking in a Richter magnitude 7 or greater earthquake . The maximum acceleration is 0.37g and it has the same spectrum intensity as the El Centro, 1940 record. The period of strong shaking is about 20 seconds.
3.2.4 A2 (3)
A simulated earthquake record intended to model the shaking in the vicinity of the fault in a Richter magnitude 8 or greater earthquake, this has a spectrum intensity half again as strong as that for the El Centro, 1940 shock. It has a maximum acceleration of 0.44g with a period of strong
shaking of approximately 40 seconds.
3.2.5 Pacoima Dam # 1971, S16E
The San Fernando earthquake of February 9 1971 was of Richter magnitude 6 . 6 with a focal depth of 13km and slipping on a thrust fault at 45° to the ground surface. The Pacoima Dam record was taken on a rock spine in the epicentral region. It has a maximum acceleration of 1.2g and a duration of 10 seconds.
3.3 Analysis Procedure
The structures were analysed with DRAIN-2D(4), a general purpose computer programme for the dynamic response analysis of planar structures deforming inelastically under earthquake excitation, using the MWD's IBM 370/168 computer. The structure is idealised as a planar assemblage of discrete elements. Analysis is by the Direct Stiffness Method, with the normal displacements as unknowns. Each node possesses up to three displacement degrees of freedom. The structure mass is assumed to be lumped at the nodes and static loads may be applied prior to the dynamic loads. A variety of structural elements is available but for this study beam-column elements were used. These yield through the formation of concentrated plastic hinges at the ends of the element and permit flexural shearing deformations to be considered. A bilinear moment-curvature hysteresis loop was assumed for this study. The dynamic response is determined by step-by-step numerical integration, with a constant acceleration assumption within any step. Results were tested for sensitivity to the computational time step and a time interval of 1/128 second was chosen as being satisfactory. The viscous damping matrix at any time may be based on the mass matrix and the current tangent stiffness matrix or the original elastic stiffness matrix. Where plastic hinges form at the ends of beam-column elements during a time step there may be a moment unbalance on the node, which can be corrected in subsequent time steps. It was found that where the stiffness-dependent part of the damping matrix was based on the original elastic stiffness, rather than on the current tangent stiffness, numerical stability was maintained and there were only very minor differences in moment across the nodes. The cantilever wall structures were assumed to have 5% equivalent viscous damping in the first mode.
The sensitivity of the response results to the modelling of the walls was investigated. Each wall was represented by a single column of elements with an integer number of elements per interstorey height. The configuration finally chosen had 9 elements in the first interstorey height and decreasing numbers of elements in succeeding storeys, with a total of 18 elements in the 6-storey structure, 28 elements in the 15-storey structure and 40 elements in the 20-storey structure. The close spacing of elements at the base of the walls best simulated performance during plastic hinging in view of the analysis procedure of concentrating plastic rotations at the ends of each element.
As a basis for modelling the moment-curvature characteristics of the walls, each

2 8 2
section was analysed using the section design capability of the ICES computer programme system. The probable strengths of the walls were assessed by making the following assumptions: steel yield stress of 1.25 times the minimum specified to account for yield overstrength and Bauschinger effects under cyclic load, gravity load on the wall due to dead load plus 1.3 times the reduced live load on the contributary part of the structure, and a capacity reduction factor of unity. A number of points on the moment-curvature curve were plotted and a bilinear curve fitted to these points. For each wall the curve of best fit was chosen as one with first yield at 1.1 times design moment and a stiffness after yield of 2% of the initial elastic stiffness. The proximity of the design moment to the first yield moment, despite inclusion of probable sources of overstrength in the latter figure, arises because the calculated ultimate strength at design moment for an extreme concrete fibre compression strain of 0.003 includes a major portion of the web steel at yield strength, whereas this steel will be at a lower stress at first yield of the extreme bars in the tension flange. Thus, but for over strength first yield in the wall could occur at a moment up to 25% less than the design moment. In the modelled moment-curvature relationship the strain hardening branch of the curves after yield allows for increasing contribution of the web steel with increasing curvatures. The initial elastic stiffness was chosen to allow for flexural cracking by an assumption of a moment of inertia of 0.5 times that of the gross section at the base, the proportion increasing uniformly with height to unity over approximately the top third of the structure.
The output of dynamic response analysis programmes is, of course, subj ect to the limits of accuracy with which the structural properties and performance can be modelled in computer analysis. In this study the reliability of results is enhanced since the primary interest is in ratios of shears under different modal combinations rather than absolute values.
3.4 Results
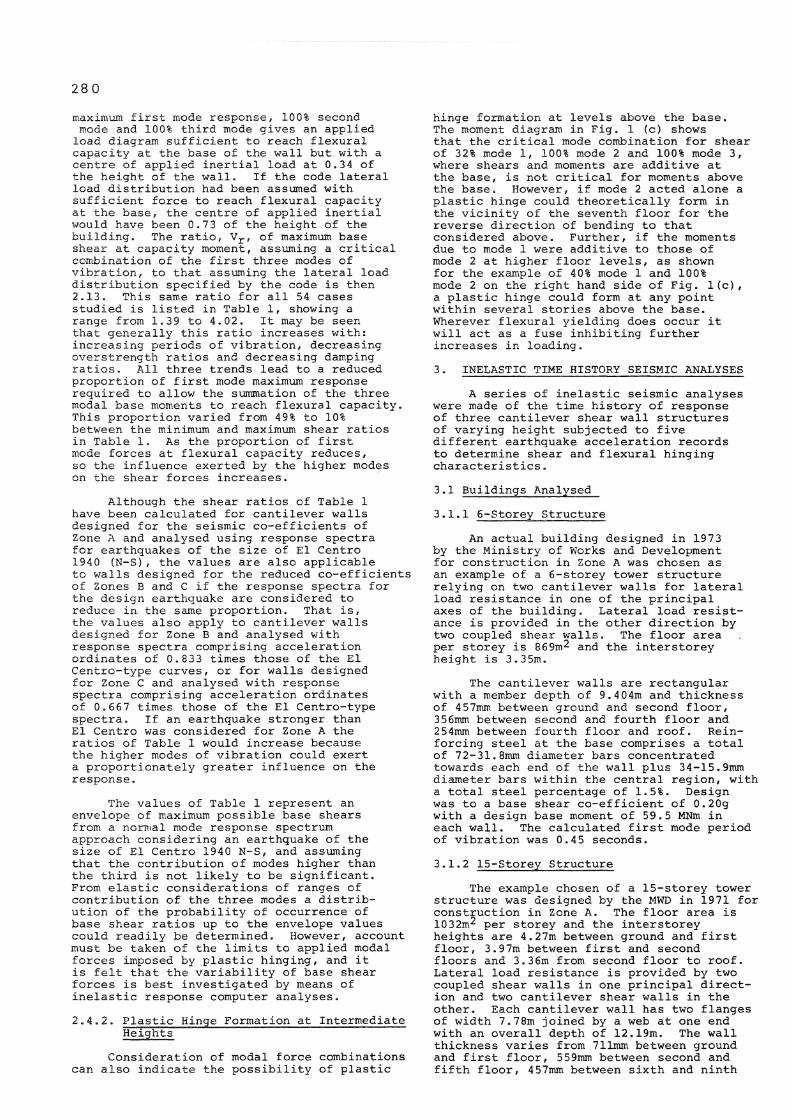
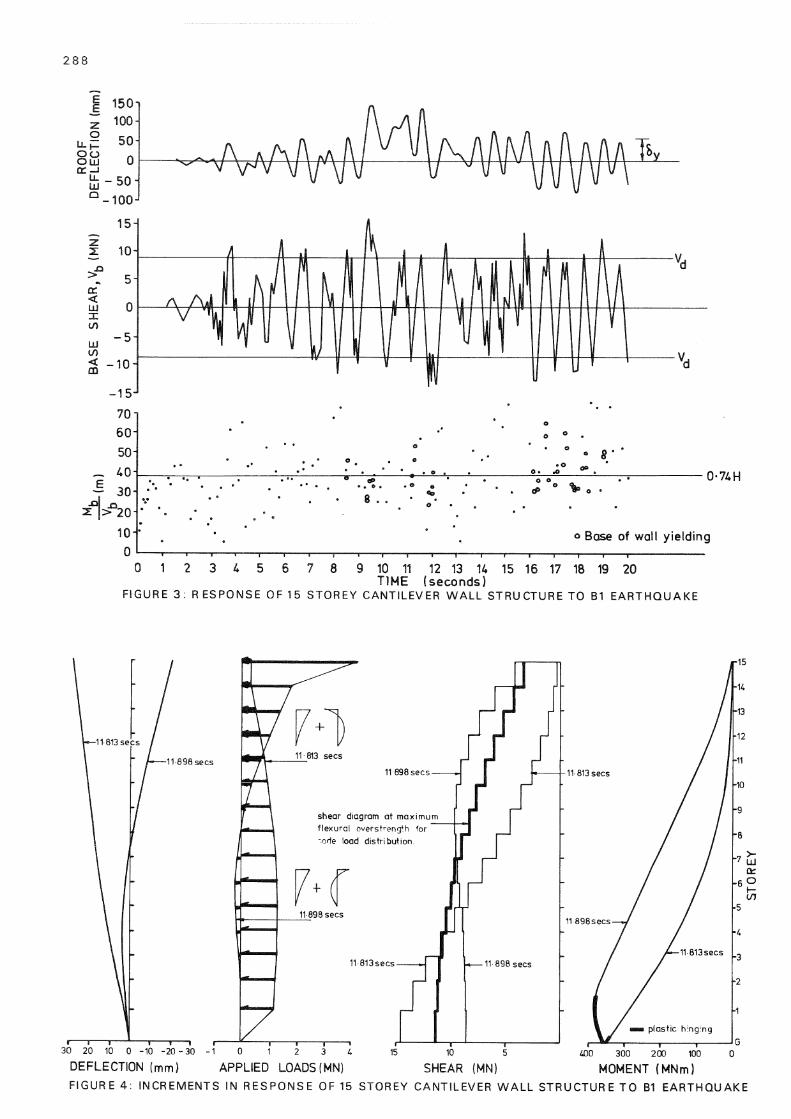
An example is shown in Fig. 3 of the time history of response of the 15-storey structure to 20 seconds of the Bl simulated earthquake. The curves plotted are displacement at the top of the wall against time and base shear against time, and points have been plotted for the ratio of base moment to base shear. The plot of the ratio of base moment to base shear indicates the variability of the modal combinations. These only give rise to significant shear forces at or approaching flexural yield in the structure and values of this parameter which were recorded while part of the wall was yielding are indicated. At small force levels a number of points were outside the range of the plot. This occurred when the modal combination was such that the base shear approached zero or was in the opposite sense to the base moment.
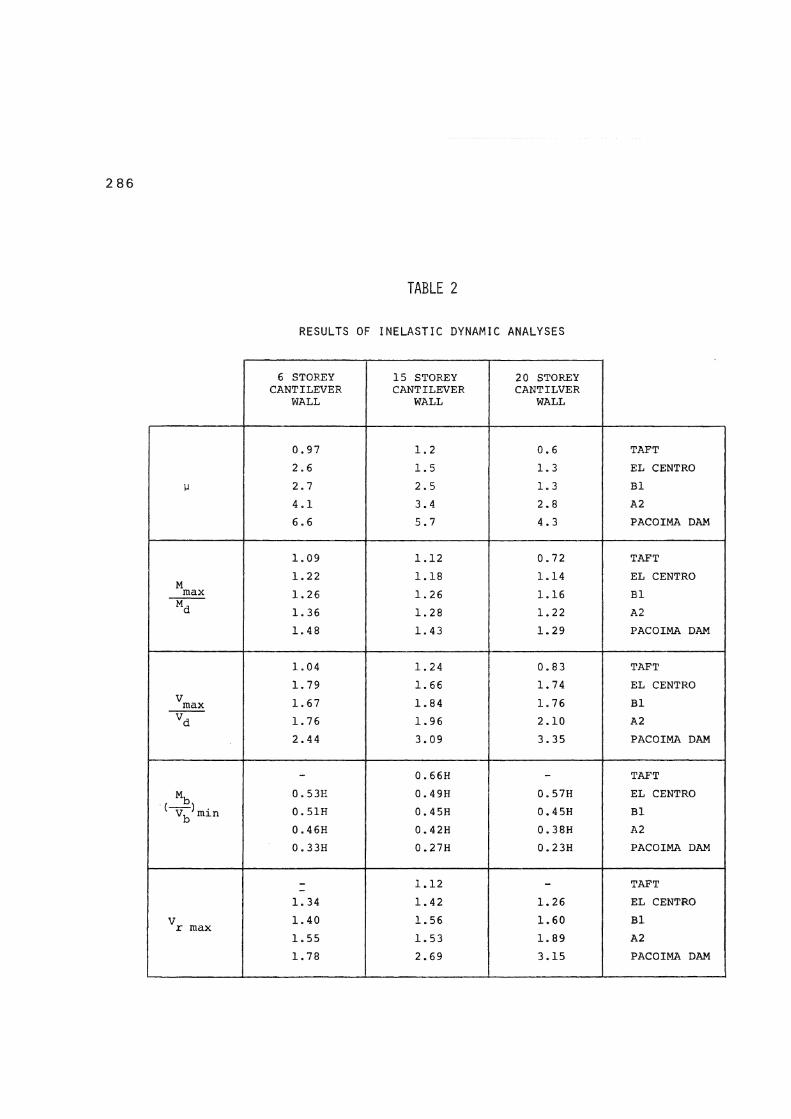
The results for all analyses are summarised in Table 2. They are presented in terms of: the maximum displacement ductility factor at the top of the building.
u; the ratio of maximum base moment to ' code design base moment, M m a x/M c;; the ratio of maximum base shear to code design base shear, V m a x / V a ; the minimum ratio of base moment to base shear while the moment curvature loop for the base element is on the strain hardening branch, (Mj=)/Vj:>)min, expressed as a proportion of the wall height, H; and the maximum ratio of base shear during strain hardening to base shear at that base moment assuming a code lateral load distribution - equivalent to V r of Section 2. The values of V r for the structures responding to the El Centro and Bl earthquakes are in the range 1.3 to 1 . 6 and may be compared with the envelope values for structures of similar period, damping and overstrength given in Table 1. Maximum flexural overstrength for the inelastically analysed buildings are given by the ratio of M m a x / M a , although the over-strength when V r m a x was recorded may be rather less depending on the position on the strain hardening branch of the moment-curvature curve. Allowance should be made for an extra source of strength in all three walls, relative to those of Table 1, since they were designed on co-efficients for public buildings rather than those for Class III structures. As expected the ratio V r increases for the stronger earthquakes , A2 and Pacoima Dam records.
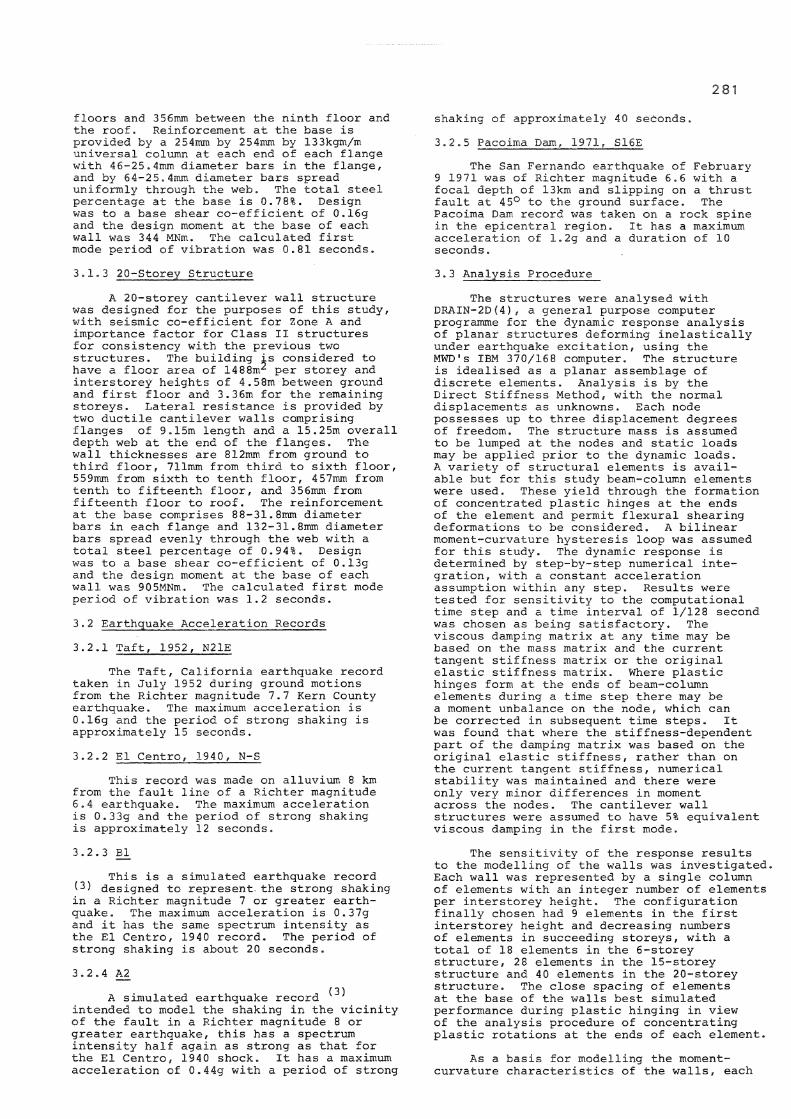
The response characteristics of the 15-storey wall during a portion of the time history of Fig. 3 is shown in Fig. 4. The curves plotted are at increments in the same yield excursion. The applied load diagram illustrates that during the time interval the second mode contribution has reversed from being additive to the first mode near the base and subtractive near the top, to being additive near the top and subtractive near the base. In consequence the first increment gives critical conditions for shear near the base and the second increment gives critical conditions for shear near the top. Clearly, a capacity design shear envelope must allow for modal shear increases at the top as well as at the base of the wall. The base shear in this half cycle was at a value greater than would be assessed from capacity shear design, based on the code load distribution, for a period of approximately 0.1 seconds.
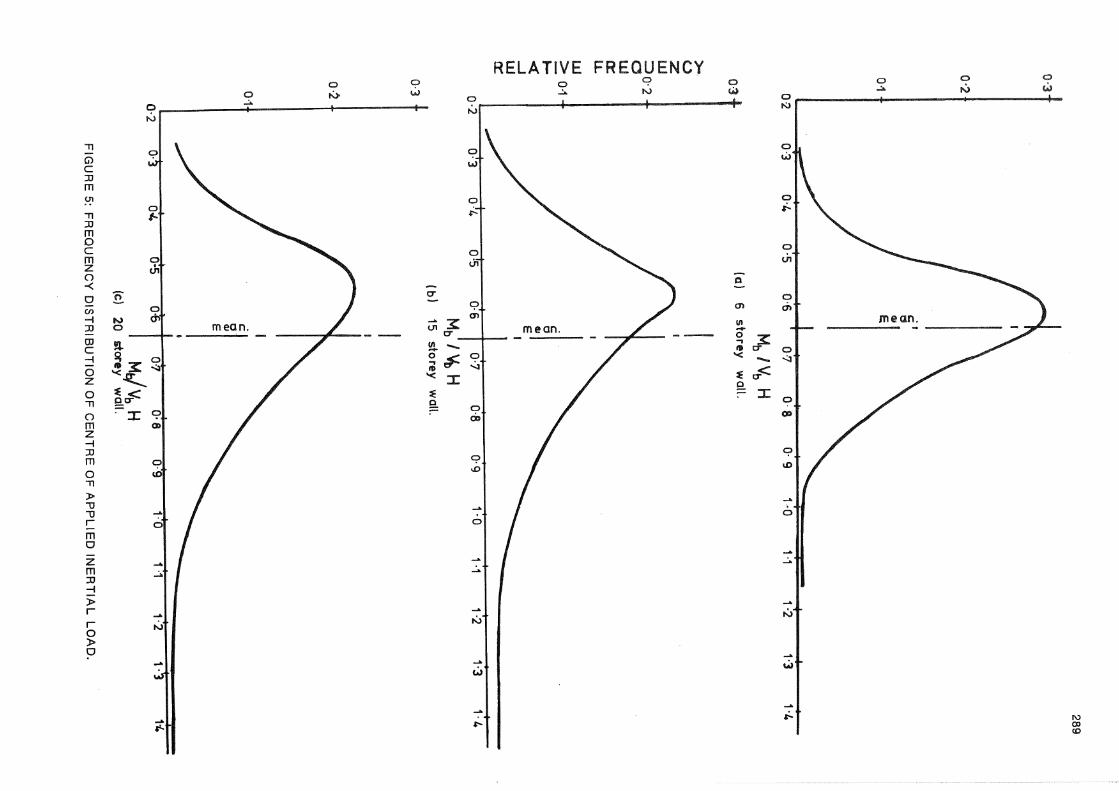
The ratio of base moment to base shear, M^/V^, represents a convenient measure for assessing the variability of the modal combinations at flexural capacity. Frequency curves are plotted in Fig. 5 for each of the structures using all values of M t / V b recorded while the structures were in the strain hardening range for all earthquake analyses. The frequency curves show a skew distribution with the mode less than the mean, that is positive skewness. Wherever the value of M^/V^ is less than that for an assumed code load distribution, approximately 0.72H, the shears near the base will be higher than that assumed from this distribution at that moment. Similarly, where the values of M^/V^ are greater than that applicable to the code load distribution the shears near the top of the wall will be greater.
As predicted in Section 2.4.2, plastic hinges formed in a number of storeys above
2 8 3
the base in the taller structures. For the analyses using the El Centro, Bl and A2 records hinging occurred at some stage in the response in all elements up to maximum heights of 8 storeys (plus a hinge at the eleventh-storey) for the 20-storey structure, 5 storeys for the 15-storey structure and 1 storey for the 6-storey structure. Extent of hinging was to almost twice these heights under the Pacoima Dam record. However, the rotations imposed on the hinges at higher levels were not large. The limiting height of wall below which 90 per cent of the total cumulative plastic rotation was suffered was computed and gave average values as follows: 0.25 times the wall depth for the six-storey structure, 0.5 times the wall depth for the 15-storey structure and 1.0 times the wall depth for the 20-storey structure.
4. DESIGN APPLICATIONS
The analyses of Sections 2 and 3 have demonstrated the possibility of the modes combining in such a way as to give shear forces in cantilever walls considerably greater than would be predicted from a code-specified distribution of applied loads sufficient to cause flexural yielding. It has also been shown that flexural yielding may extend for several storeys above the base. Observations of the structural performance of some cantilever shear wall structures during earthquakes have shown extensive diagonal tension cracking often over several storeys, two recent examples being the Indian Hills Medical Centre during the San Fernando 1971 earthquake (5) and the Hotel Trueba during the Veracruz 1973 eartyquake a Performance of other walls may have been helped by conservative shear design.
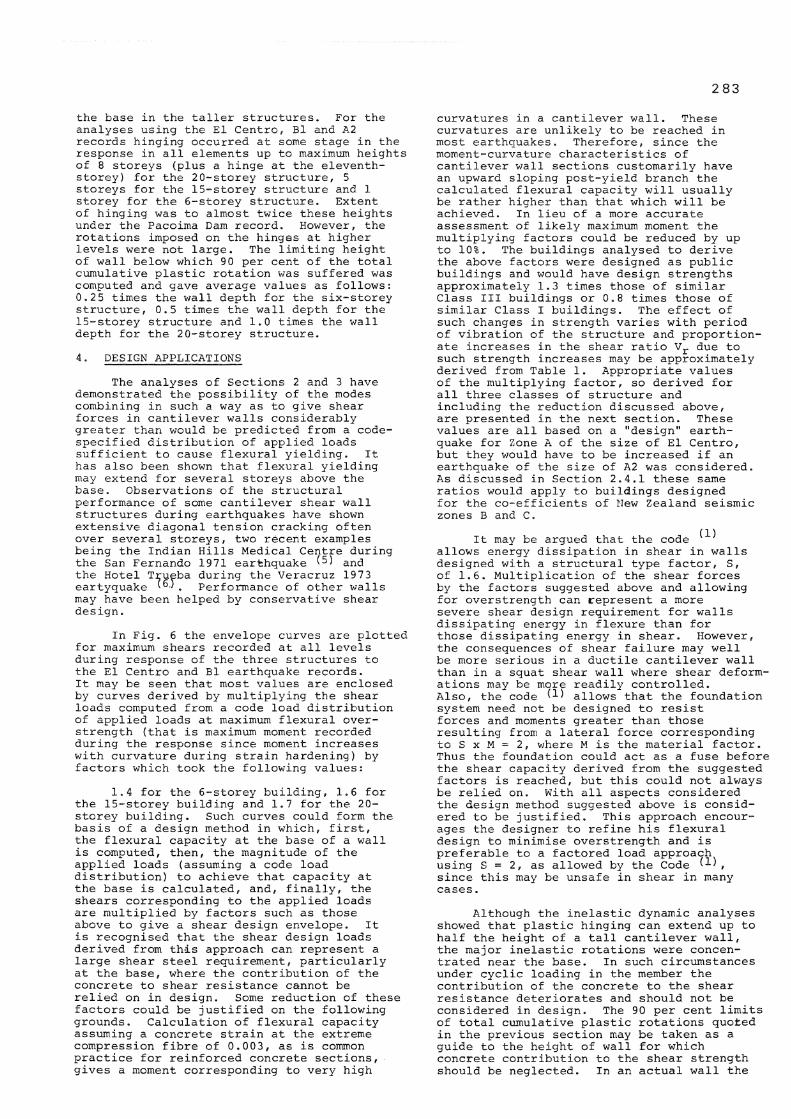
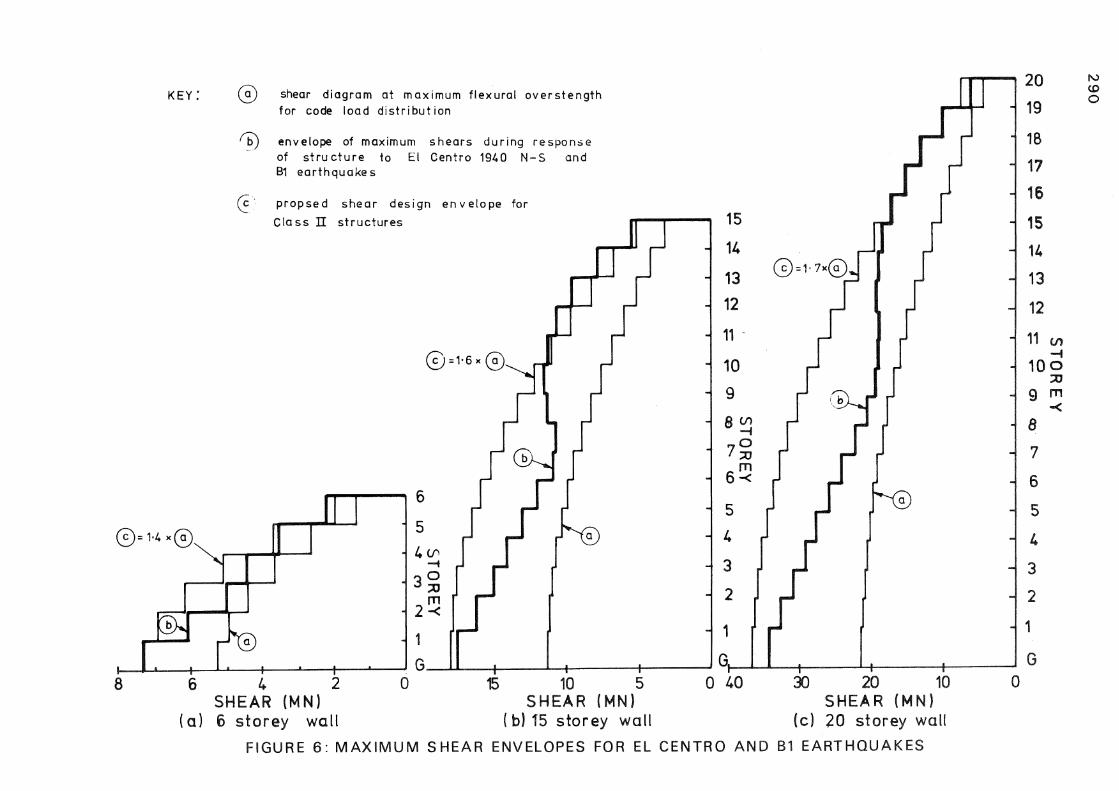
In Fig. 6 the envelope curves are plotted for maximum shears recorded at all levels during response of the three structures to the El Centro and Bl earthquake records. It may be seen that most values are enclosed by curves derived by multiplying the shear loads computed from a code load distribution of applied loads at maximum flexural over-strength (that is maximum moment recorded during the response since moment increases with curvature during strain hardening) by factors which took the following values:
1.4 for the 6-storey building, 1.6 for the 15-storey building and 1.7 for the 20-storey building. Such curves could form the basis of a design method in which, first, the flexural capacity at the base of a wall is computed, then, the magnitude of the applied loads (assuming a code load distribution) to achieve that capacity at the base is calculated, and, finally, the shears corresponding to the applied loads are multiplied by factors such as those above to give a shear design envelope. It is recognised that the shear design loads derived from this approach can represent a large shear steel requirement, particularly at the base, where the contribution of the concrete to shear resistance cannot be relied on in design. Some reduction of these factors could be justified on the following grounds. Calculation of flexural capacity assuming a concrete strain at the extreme compression fibre of 0.003, as is common practice for reinforced concrete sections, gives a moment corresponding to very high
curvatures in a cantilever wall. These curvatures are unlikely to be reached in most earthquakes. Therefore, since the moment-curvature characteristics of cantilever wall sections customarily have an upward sloping post-yield branch the calculated flexural capacity will usually be rather higher than that which will be achieved. In lieu of a more accurate assessment of likely maximum moment the multiplying factors could be reduced by up to 10%. The buildings analysed to derive the above factors were designed as public buildings and would have design strengths approximately 1.3 times those of similar Class III buildings or 0.8 times those of similar Class I buildings. The effect of such changes in strength varies with period of vibration of the structure and proportionate increases in the shear ratio V r due to such strength increases may be approximately derived from Table 1. Appropriate values of the multiplying factor, so derived for all three classes of structure and including the reduction discussed above, are presented in the next section. These values are all based on a "design" earthquake for Zone A of the size of El Centro, but they would have to be increased if an earthquake of the size of A2 was considered. As discussed in Section 2.4.1 these same ratios would apply to buildings designed for the co-efficients of New Zealand seismic zones B and C.
It may be argued that the code ^ allows energy dissipation in shear in walls designed with a structural type factor, S, of 1.6. Multiplication of the shear forces by the factors suggested above and allowing for overstrength can represent a more severe shear design requirement for walls dissipating energy in flexure than for those dissipating energy in shear. However, the consequences of shear failure may well be more serious in a ductile cantilever wall than in a squat shear wall where shear deformations may be more readily controlled. Also, the code allows that the foundation system need not be designed to resist forces and moments greater than those resulting from a lateral force corresponding to S x M = 2, where M is the material factor. Thus the foundation could act as a fuse before the shear capacity derived from the suggested factors is reached, but this could not always be relied on. With all aspects considered the design method suggested above is considered to be justified. This approach encourages the designer to refine his flexural design to minimise overstrength and is preferable to a factored load approach using S = 2, as allowed by the Code , since this may be unsafe in shear in many cases.
Although the inelastic dynamic analyses showed that plastic hinging can extend up to half the height of a tall cantilever wall, the major inelastic rotations were concentrated near the base. In such circumstances under cyclic loading in the member the contribution of the concrete to the shear resistance deteriorates and should not be considered in design. The 90 per cent limits of total cumulative plastic rotations quoted in the previous section may be taken as a guide to the height of wall for which concrete contribution to the shear strength should be neglected. In an actual wall the

284
plasticity may be spread further by inclined flexure-shear cracks. Above this level it appears justifable to include the concrete in shear design, but consideration should be given to provision of extra ties for confinement of the concrete in compression or for prevention of buckling of the longitudinal steel wherever plastic hinges may form.
The future of structural design appears to lie in a probabilistic approach when more is known of the applied loads and the structural performance. For such an approach the analyses reported here could be extended to cover more buildings and earthquake loadings to determine an extreme value distribution of the parameter V r , representing the critical modal combination effects on shear loadings.
5. CONCLUSIONS
An investigation was made of the effects of the higher modes of vibration on the maximum shears in cantilever walls when they are loaded seismically to their flexural capacity. It has been shown that the various modes may combine in such a way as to reach yield moment at the base of the wall but with an applied load diagram such that the centre of inertial load is very much lower than would occur with the normal code load distribution comprising an inverted triangle with possibly a point load at the top of 10% of the base shear. Alternatively, the centre of inertial load may be higher than assumed. Consequently a shear design based on such an assumed load distribution could underestimate the imposed shear loadings, both at the base and higher in the wall, at flexural capacity and lead to a premature failure. An elastic normal mode response spectrum analysis was made of a 10-storey building responding to an El Centro sized earthquake . The effect of the variables damping, overstrength, and building period was found on the ratio of maximum base shear at flexural capacity, assuming a critical combination of the first three modes of vibration, to that assuming the lateral load distribution specified by the code. The value of this ratio was found to vary from 1.4 to 4.0, increasing in turn with increasing period of vibration, decreasing damping ratio and decreasing flexural overstrength.
The elastic normal mode response spectrum approach was augmented by a series of inelastic seismic analyses of the time-history of response of three cantilever shear wall structures of varying height subjected to five different earthquake acceleration records. The maximum value of the ratio of actual base shear at yield to base shear at that moment assuming code lateral load distribution was found to be 1.4 for an El Centro 1940 N-S earthquake and 1.6 for the Bl simulated record. Greater values were computed for stronger earthquakes. It was found that plastic hinging could extend well above the base of a wall, up to half the height of a tall structure. However, plastic rotations were concentrated near the base.
It is recommended that the design of ductile cantilever walls be based on capacity
design principles and the following procedure is suggested:
(i) Compute design base moment from either the equivalent static force method or spectral modal analysis as allowed by the code .
(ii) Design and detail flexural reinforcement. (In the capacity design approach there are clearly advantages if the section design is refined to minimise overstrength.)
(iii) Compute the capacity moment of the section allowing a realistic assessment for at least the following sources of over-strength: actual yield strength of steel greater than minimum, specified, increases in steel strength under reversed cyclic loading beyond yield inherent in the Bauschinger effect, actual concrete strengths greater than the minimum specified, gravity loads on the wall greater than the minimum design case, neglect of the capacity reduction factor incorporated in design, and the full yield stress contribution of all web steel.
(iv) Determine a shear force diagram based on the code-specified distribution of applied loads sufficient to reach capacity moment of the wall at the base, such moment being calculated as in (iii) above.
(v) Multiply the shear force diagram determed as in (iv) above by a factor which has no less than the following values according to class of structure:
No. of Storeys Class I Class II Class I I I
1 to 5 6 to 9
10 to 14 15 to 20
1.0 1.2 1.4 1.4
1.2 1.3 1.5 1.6
1.3 1.5 1.7 1.8
This will give the shear design envelope.
(vi) In design of shear reinforcement neglect the contribution of the concrete to the shear resistance where concentrated plastic rotations are anticipated. The results of this study give some indication of the extent of such rotations. Above this level consideration should be given to the use of extra ties for confinement of the concrete in compression or for prevention of buckling of the longitudinal steel under moderate plastic rotations.
ACKNOWLEDGEMENTS
The permission of the Commissioner of Works, N. C. McLeod, to publish this paper is acknowledged. The opinions expressed are not necessarily those of the Ministry of Works and Development. Grateful acknowledgement is made of the advice and guidance received from O. A. Glogau, Chief Structural Engineer, and B. W. Buchanan, Senior Design Engineer, MWD. K. E. Williamson, Lewis and Williamson, Auckland first brought the authors' attention to the problem assessed in this paper. Special acknowledgement is made for his continued interest and helpful comments.
REFERENCES
1. Standards Association of New Zealand, "Draft New Zealand Standard Code of Practice for General Structural Design

2 8 5
and Design Loadings", DZ 4203, Part 4, Earthquake Provisions, March 1975. 50 pp. Skinner, R. I., "Earthquake - Generated Forces and Movements in Tall Buildings", Bulletin 166, New Zealand Department of Scientific and Industrial Research, 1964. 106pp. Jennings, P. C., Housner, G. W. and Tsai, N. C., "Simulated Earthquake Motions for Design Purposes", Proceedings of the Fourth World Conference on Earthquake Engineering, Vol. 1 Session Al, Santiago, Chile, 1969. pp. 145-160. Kanaan, A. E. and Powell, G. H., "General Purpose Computer Programe for
Inelastic Dynamic Response of Plane Structures", Earthquake Engineering Research Centre, University of California, Berkeley, Report No. EERC 73-6, April 1973. 101 pp.
5. Pinkham, C. W., "A Review of the Repair of Two Concrete Buildings Damaged by the San Fernando Earthquake", Journal of the American Concrete Institute, Proc. Vol. 70, No. 3, March, 1973. pp. 237 - 241.
6. Irvine, H. M., "The Veracruz Earthquake of 28 August, 1973", Bulletin of the New Zealand National Society for Earthquake Engineering, Vol. 7, No. 1, March 1974. pp. 2 to 13.
TABLE 1
RATIO OF MAXIMUM BASE SHEAR TO SHEAR DERIVED FROM CODE
LOAD DISTRIBUTION AT FLEXURAL CAPACITY
PERIOD
T
M =1.2M, o a
M =1„4M. o a M =1.6M. o a
(seconds) X = 2% X=5% X=1G% A = 2% X=5% X=10% X=2% X=5% X=10%
0.2 1.58 1.55 1.53 1.49 1.47 1.45 1.43 1.41 1.39
0.4 1.93 1.71 1.63 1.80 1.60 1.54 1.70 1.53 1.47
0.6 2.36 2.02 1.83 2.17 1.87 1.71 2.02 1.76 1.62
0.8 2.82 2.32 2.05 2.55 2.13 1.89 2.68 1.99 1.78
1.0 3.33 2.68 2.32 3.00 2.44 2.13 2.75 2.26 1.99
1.2 4.02 3.20 2.76 3.59 2.89 2.50 3.27 2.65 2.31
2 8 6
TABLE 2
RESULTS OF INELASTIC DYNAMIC ANALYSES
6 STOREY CANTILEVER
WALL
15 STOREY CANTILEVER
WALL
20 STOREY CANTILVER
WALL
0.97 1.2 0.6 TAFT 2.6 1.5 1.3 EL CENTRO
V 2.7 2.5 1.3 Bl 4.1 3.4 2.8 A2 6.6 5.7 4.3 PACOIMA DAM
1.09 1.12 0.72 TAFT
M max
M a
1.22 1.26 1.36
1.18 1.26 1.28
1.14 1.16 1.22
EL CENTRO Bl A2
1.48 1.43 1.29 PACOIMA DAM
1.04 1.24 0.83 TAFT 1.79 1.66 1.74 EL CENTRO
V max 1.67 1.84 1.76 Bl V d 1.76 1.96 2.10 A2
2.44 3.09 3.35 PACOIMA DAM
0.66H TAFT M,
v V b; m i n
0.53H 0.51H
0.49H 0.45H
0.57H 0.45H
EL CENTRO Bl
0.46H 0.42H 0.38H A2 0.33H 0.27H 0.23H PACOIMA DAM
- 1.12 - TAFT 1.34 1.42 1.26 EL CENTRO
V r max
1.40 1.55
1.56 1.53
1.60 1.89
Bl A2
1.78 2.69 3.15 PACOIMA DAM

287
APPLIED LOAD (MM)
(a)
SHEAR (MN)
(b)
Capacity moment ( M 0 = 1 4 M d )
0 -I 150
3 2 % mode I + 1 0 0 % mode 2 f 1 0 0 % mode 3
100% mode 2
Pdssible capacity envelope if wall overstrong near top
Design moment (spectral modal analysis
Design moment (equivalent static forces)
- 4 0 % model + 1 0 0 % mode 2
Capacity moment M 0 = 1-4 M d )
MOMENT ( M N m )
(c)
F IGURE 1 : DESIGN FORCES FOR 10 STOREY CANTILEVER W A L L (T-j = 0 80 SECONDS)
2 8 8
74H
I 1 , , r
0 1 2 3 4 5 6 7 8 9 10 11 12 13 U 15 16 17 18 19 20 T I N E (seconds)
FIGURE 3: R E S P O N S E OF 15 STOREY CANTILEVER W A L L STRUCTURE TO B1 EARTHQUAKE
11 898secs
shear diagram at max imum f lexural overstrength for -.ode load distr ibut ion.
11 813secs
30 20 10 0 -10 -20 - 3 0 - 1 0 1 2 3 U
DEFLECTION (mm) APPLIED LOADS (MN) 10 5
SHEAR (MN) MOMENT (MNm) F IGURE 4: INCREMENTS IN R E S P O N S E OF 15 STOREY CANTILEVER W A L L STRUCTURE TO B1 EARTHQUAKE
SHEAR (MN) SHEAR (MN) SHEAR (MN) (a) 6 s t o r e y wal l (b) 15 s to rey wal l (c) 20 s to rey wal l
FIGURE 6 : M A X I M U M SHEAR ENVELOPES FOR EL CENTRO A N D B1 E A R T H Q U A K E S