seismic retrofit and fema p-58 risk assessment of mid-rise...
TRANSCRIPT

1
Seismic retrofit and FEMA P-58 risk assessment of mid-rise soft-story concrete towers
Kit Miyamoto, Ph.D., S.E., Amir SJ Gilani, Ph.D., S.E. and Lon Determan, S.E.
Miyamoto International Los Angeles, CA
Abstract The two frame office towers, constructed in the 1970s per the 1967 edition of the UBC, use perimeter reinforced concrete moment frames to resist seismic loading. The buildings are rectangular in plan and have certain characteristics that adversely affect their seismic performance, in particular the presence of a soft-story response at the first floor (approximately 50% taller than typical floors), and limited ductility typical of buildings of that era. Risk analysis showed that for the towers the PML exceeded 20%. Nonlinear response history analysis (NLRHA) of the towers was conducted and showed that in the existing configuration, the story drift ratios (SDRs) at the first floor exceeded 2%, shear hinging of the first floor beams was expected and that the SDRs would need to be reduced to approximately 1.4% for the first floor to limit the extent of nonlinear response. Seismic retrofit included addition of 300-kip viscous dampers in both directions to the first floor of the building. Analysis showed that the retrofitted structure had a first floor SDR of approximately 1.3% and that the soft story response and plastic shear hinging of first floor beams were mitigated. FEMA P-58 analysis of the retrofitted buildings were then conducted using the results—SDR, story acceleration, and residual drifts—from the NLRHA. It was seen that the 90th percentile repair cost (PML) was significantly reduced and was now less than 15%. Introduction Description of the buildings The office towers investigated, located in downtown Sacramento, CA, are of very similar construction. For the purposes of this study, the west tower was specifically modeled and evaluated. The west tower is a 14-story reinforced concrete moment frame building constructed in 1971. The building has a plan dimension of approximately 150 x 81 ft. The building is rectangular in plan. Typical floors measure 11 ft in height, whereas, the first floor is 17 ft tall. Gravity loading is resisted by a system consisting of 8-inch thick post-tensioned 2-way flat slab and reinforced concrete columns bearing on a pile foundation system.
The lateral load is resisted by a system of reinforced concrete perimeter moment frames. Figure 1 presents the plan view of a typical floor and the location of the lateral load resisting system. Columns are 28-in square and support 18x40 in. beams on the second floor and 18x30 in. beams at the floors above. In the longitudinal direction, there are five 29-ft long bays on each side (10 bays total), and in the transverse direction, there are three 26-ft long bays on each side (6 bays total).
Figure 1. Lateral load resisting system
Site seismicity The building site is classified as Class D. For the building site and soil conditions, the USGS provides the following design parameters: short period acceleration of 0.53g, and 1-sec acceleration of 0.31g. These values are used to construct the seismic demand for the building. The seismicity at the site is considered moderate. Recent visits to the building has shown that the structure has not experienced any noticeable damage from past earthquakes, including the recent 2014 South Napa event. Building characteristics Overview Reinforced concrete buildings constructed prior to adoption of new seismic codes are usually classified as having low ductility. In other words, such buildings do not have the means to resist the seismic energy that is imparted to them by earthquakes. The low-ductile reinforced concrete buildings have performed poorly in past earthquakes.

2
Factors enhancing seismic performance The structure under consideration has several key design features that enhance its earthquake resistance, including the following: Structural configuration. The building is regular in plan,
with no re-entrant corners or vertical off-sets. Regular buildings have performed well in past earthquakes.
Close stirrup spacing at the beam-to-column joints. The plans show stirrup spacing of 4-in. on center for beams and tie spacing of 3.25-in. on center at the joints. The reinforcement is shown with 135-degree hooks. Such close spacing of transverse reinforcement would prevent the buckling of reinforcement at the location of highest seismic stress.
Factors decreasing seismic performance The structure under consideration has several key design features that reduce its earthquake resistance, including the following: Soft-story response. The first story of the building is
approximately 50% taller than the stories above. Buildings with such configuration can be vulnerable to earthquake damage because the deformation and damage is concentrated at the first floor, while good design typically results in uniform distribution of lateral deformation among all floors.
Transverse reinforcement. The beams have stirrup spacing of 18-in. and 13-in. on center near midspan at the second level and above, respectively. The mid-height column tie spacing is 12-in. on center. These values exceed the current code limits and can lead to premature failure in some members.
Shear capacity of beams. Beams are constructed of lightweight concrete and use No. 3 or 4 transverse bars spaced 18 in. or 13 in. on center at middle third of the members, thus having limited shear capacity. Modern codes attempt to mitigate shear failure by requiring ductile flexural damage prior to shear failure.
Splices and development length. The tension lap splices for the beams do not meet the current code requirements. The column #18 to #14 longitudinal bar splices use cold-welded couplers. Inadequate splice and development length can lead to bar pullout and prevent reinforcement from reaching its capacity.
Column ties. The code requires that every other longitudinal reinforcement have a tie around it. This
requirement is not met for the Type D columns shown in the plans. This code requirement is intended to prevent buckling of longitudinal reinforcement at locations of high seismic loading.
Joint eccentricity. Eccentricity in the line of action between beams and columns will amplify loading on the members.
Seismic performance of existing building Overview ASCE 41-13 (ASCE 2014) provides comprehensive requirements for seismic evaluation and upgrade of existing buildings and was used for this structure. Computer program ETABS (CSI 2016) was used to prepare a three-dimensional mathematical model of the building; see Figure 2. This model was used to assess the performance of the existing building moment frames. Nominal material properties, spans and member sizes specified in the original construction documents were used in analysis. Dimensions were based on centerline dimensions provided in the drawings. Gravity loading on the building is composed of member self-weights, design live load and additional dead load to account for non-structural elements such as flooring, ceiling, and duct work, which is distributed uniformly on floor slabs. The concrete floor diaphragms are modeled as rigid, meshed shell elements. The seismic loading was based on values obtained from the USGS web site for the design earthquake (475-year event).
Figure 2. Mathematical model of the building
3
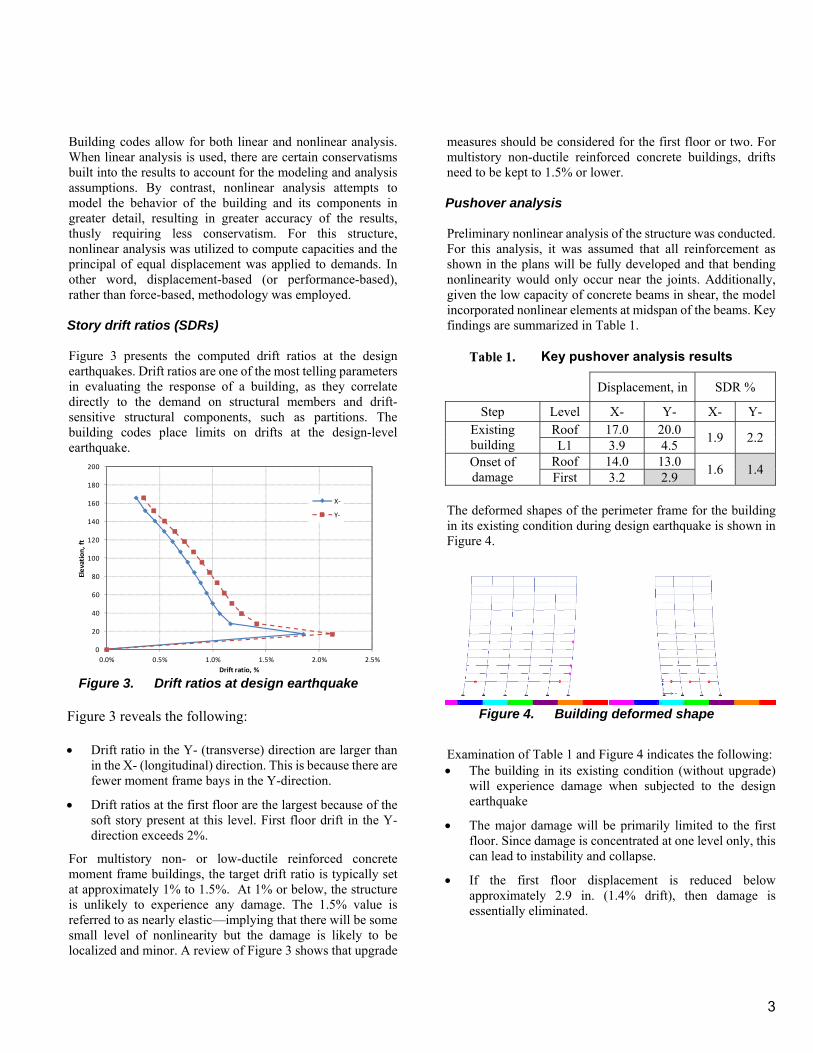
Building codes allow for both linear and nonlinear analysis. When linear analysis is used, there are certain conservatisms built into the results to account for the modeling and analysis assumptions. By contrast, nonlinear analysis attempts to model the behavior of the building and its components in greater detail, resulting in greater accuracy of the results, thusly requiring less conservatism. For this structure, nonlinear analysis was utilized to compute capacities and the principal of equal displacement was applied to demands. In other word, displacement-based (or performance-based), rather than force-based, methodology was employed. Story drift ratios (SDRs) Figure 3 presents the computed drift ratios at the design earthquakes. Drift ratios are one of the most telling parameters in evaluating the response of a building, as they correlate directly to the demand on structural members and drift-sensitive structural components, such as partitions. The building codes place limits on drifts at the design-level earthquake.
Figure 3. Drift ratios at design earthquake
Figure 3 reveals the following: Drift ratio in the Y- (transverse) direction are larger than
in the X- (longitudinal) direction. This is because there are fewer moment frame bays in the Y-direction.
Drift ratios at the first floor are the largest because of the soft story present at this level. First floor drift in the Y-direction exceeds 2%.
For multistory non- or low-ductile reinforced concrete moment frame buildings, the target drift ratio is typically set at approximately 1% to 1.5%. At 1% or below, the structure is unlikely to experience any damage. The 1.5% value is referred to as nearly elastic—implying that there will be some small level of nonlinearity but the damage is likely to be localized and minor. A review of Figure 3 shows that upgrade
measures should be considered for the first floor or two. For multistory non-ductile reinforced concrete buildings, drifts need to be kept to 1.5% or lower. Pushover analysis Preliminary nonlinear analysis of the structure was conducted. For this analysis, it was assumed that all reinforcement as shown in the plans will be fully developed and that bending nonlinearity would only occur near the joints. Additionally, given the low capacity of concrete beams in shear, the model incorporated nonlinear elements at midspan of the beams. Key findings are summarized in Table 1.
Key pushover analysis results
Displacement, in SDR %
Step Level X- Y- X- Y- Existing building
Roof 17.0 20.0 1.9 2.2
L1 3.9 4.5 Onset of damage
Roof 14.0 13.0 1.6 1.4
First 3.2 2.9 The deformed shapes of the perimeter frame for the building in its existing condition during design earthquake is shown in Figure 4.
Figure 4. Building deformed shape
Examination of Table 1 and Figure 4 indicates the following: The building in its existing condition (without upgrade)
will experience damage when subjected to the design earthquake
The major damage will be primarily limited to the first floor. Since damage is concentrated at one level only, this can lead to instability and collapse.
If the first floor displacement is reduced below approximately 2.9 in. (1.4% drift), then damage is essentially eliminated.
0
20
40
60
80
100
120
140
160
180
200
0.0% 0.5% 1.0% 1.5% 2.0% 2.5%
Elevation, ft
Drift ratio, %
X‐
Y‐

4
Seismic upgrade with fluid viscous dampers Fluid viscous dampers, were used as the upgrade solution. Dampers possess the following characteristics: Developed by the defense and aerospace industry, and
present state-of-the-art solution for civil applications.
Are maintenance free and have been widely used in upgrade of reinforced concrete buildings with proven reliability.
Minimize the need for strengthening of existing members and foundations.
Can be aesthetically integrated into the building architectural features.
Have been extensively tested.
Are cost-effective.
Minimize disruption to building occupancy.
For this project, dampers were selected with the following properties: Velocity exponent = 0.5
Damper nominal design force = 350 kips
Seismic upgrade evaluation Overview The analytical model of the building was revised by adding 8 dampers per floor for the bottom story; see Figure 5 and Figure 6. Analysis was conducted to assess the efficacy of the proposed upgrade. Three pairs of recorded accelerations from past California earthquakes were synthesized to correspond closely to the types of motions that can be anticipated at the building site during a design-level earthquake. Maximum values were then selected for assessment of the upgraded building model.
Figure 5. Revised building model with dampers
Figure 6. Damper placement, bottom story
Findings Figure 7 presents the computed story displacements for the upgraded model. The displacement values of Table 1 corresponding to the approximate thresholds for linear response (no or minor damage) at the first floor and roof levels are also shown as arrows in the figure. It is noted that displacements of the upgraded model are within the acceptable limits.
Figure 7. Computed story displacements
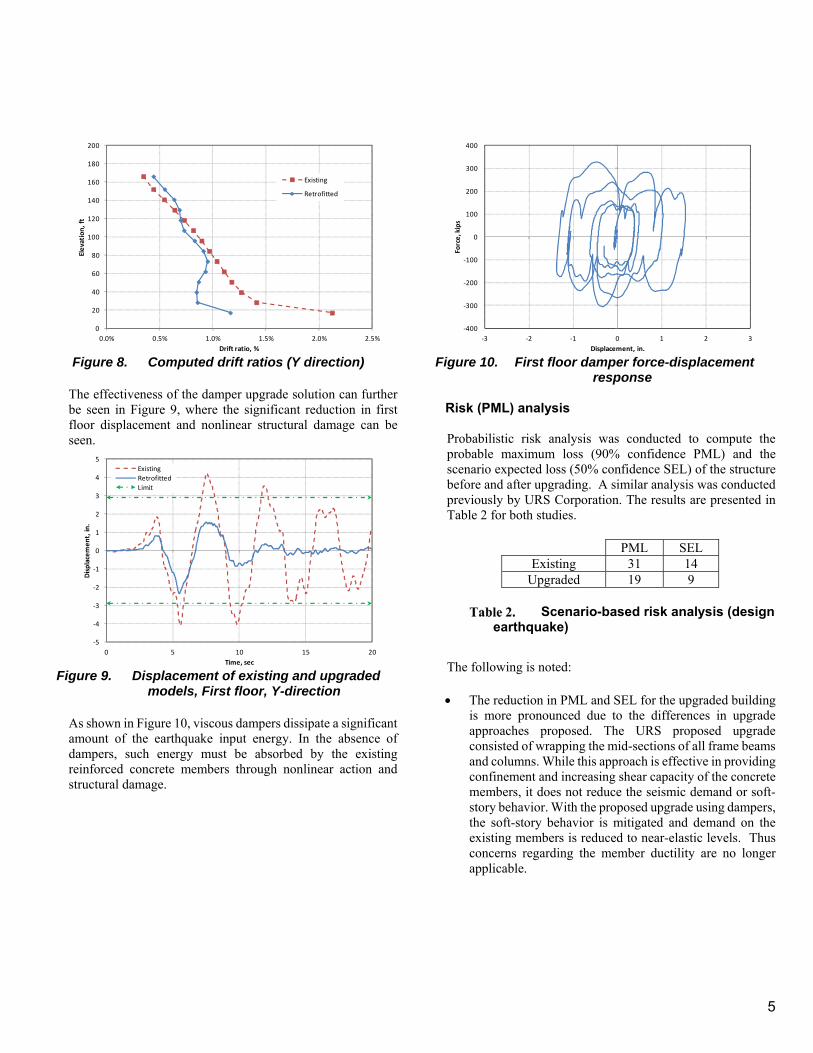
Figure 8 presents the computed drift ratios for the existing and upgraded building. The efficacy of the proposed upgrade can be evaluated by noting the following: The soft-story response at the first floor is significantly
reduced. The drift ratio at the first floor was on the order of twice that of the typical floors above, and this amplification is now reduced by approximately 60%.
Drift ratio at first floor is approximately 1.2%. As such, no or only minor yielding of concrete members is expected.
0
20
40
60
80
100
120
140
160
180
200
0 5 10 15 20
Elevation, ft
Stort displacement, in.
X‐
Y‐
Limits
5
Figure 8. Computed drift ratios (Y direction)
The effectiveness of the damper upgrade solution can further be seen in Figure 9, where the significant reduction in first floor displacement and nonlinear structural damage can be seen.
Figure 9. Displacement of existing and upgraded
models, First floor, Y-direction As shown in Figure 10, viscous dampers dissipate a significant amount of the earthquake input energy. In the absence of dampers, such energy must be absorbed by the existing reinforced concrete members through nonlinear action and structural damage.
Figure 10. First floor damper force-displacement
response Risk (PML) analysis Probabilistic risk analysis was conducted to compute the probable maximum loss (90% confidence PML) and the scenario expected loss (50% confidence SEL) of the structure before and after upgrading. A similar analysis was conducted previously by URS Corporation. The results are presented in Table 2 for both studies.
PML SEL
Existing 31 14 Upgraded 19 9
Scenario-based risk analysis (design earthquake)
The following is noted: The reduction in PML and SEL for the upgraded building
is more pronounced due to the differences in upgrade approaches proposed. The URS proposed upgrade consisted of wrapping the mid-sections of all frame beams and columns. While this approach is effective in providing confinement and increasing shear capacity of the concrete members, it does not reduce the seismic demand or soft-story behavior. With the proposed upgrade using dampers, the soft-story behavior is mitigated and demand on the existing members is reduced to near-elastic levels. Thus concerns regarding the member ductility are no longer applicable.
0
20
40
60
80
100
120
140
160
180
200
0.0% 0.5% 1.0% 1.5% 2.0% 2.5%
Elevation, ft
Drift ratio, %
Existing
Retrofitted
‐5
‐4
‐3
‐2
‐1
0
1
2
3
4
5
0 5 10 15 20
Displacement, in.
Time, sec
Existing
Retrofitted
Limit
‐400
‐300
‐200
‐100
0
100
200
300
400
‐3 ‐2 ‐1 0 1 2 3
Force, kips
Displacement, in.

6
Seismic Risk Analysis Procedure The FEMA P-58 (FEMA 2012 and SP3 2016) methodology is a probabilistic approach that combines the site-specific hazard, building properties, and exposure to estimate key response parameters, including the 90th-percentile repair cost in the event of the design (475-year return period) earthquake. The simulation for this project included 10,000 Monte Carlo analyses. Site Hazard The site hazard was based on USGS data. The de-aggregation data from contributing faults is presented in Figure 11 and the hazard curve for the site is presented in Figure 12.
Figure 11. De-aggregation for the site seismic hazard
Figure 12. Site hazard curve
Building Properties The building was defined as a 14-story reinforced concrete moment frame structure, with lateral frames located at the building perimeter. It is of 1970s vintage, Risk Category II and has office occupancy. The input data for building properties were based on the results from the structural analysis of the building retrofitted with
viscous dampers. The key input parameters include story drift ratio, peak floor acceleration, and residual drift; see Figure 13 through Figure 14.
Figure 13. Story drift ratios
Figure 14. Peak floor accelerations
Building Capacity Building capacity was based on the FEMA 154 checklist. The default values for the collapse fragility were used. Building Content and Fragility Functions The building contents (structural and nonstructural) were based on typical contents for this class of buildings. The P58 default fragility functions were used. Results The median and 90% repair costs for the design earthquake were computed as approximately 6% and 12%, respectively; see Table 3.

7
Median and 90% repair cost
Sa (3.6s) (g)
Mean repair cost
Median repair cost
90th percentile repair cost
8% 12% 6% 12%
Project status The construction for the seismic retrofitting of the towers has been completed. Figure 15and Figure 16 present a portion of construction plans showing the damper elevations and connection to the existing concrete members, respectively. As required by ASCE 41-13, all dampers were subjected to production testing conducted by the manufacturer. Figure 17 shows the force-velocity relation for the 350-kip dampers. Figure 18 presents photographs of retrofitted building
Figure 15. Elevation view of damper placement
Figure 16. Connection details for dampers
Figure 17. Force-velocity relation
Figure 18. Seismic retrofitting using viscous dampers

8
Conclusions The preliminary probable response of the office towers in Sacramento to earthquake loading was investigated using a combination of advanced structural analysis and risk assessment. Analysis and evaluation showed the following: The buildings in their existing configurations had PML
values that exceed 20 and will likely experience moderate to significant damage in the event of a design-level earthquake.
The building structure had a moderate degree of nonductile detailing as well as soft-story behavior at the ground floor which pose significant hazards during earthquakes.
The buildings were effectively upgraded with fluid viscous dampers.
The upgraded solution mitigated the critical building deficiencies and reduce the PML.
References ASCE 41-13 (2014) Seismic Evaluation and Retrofit of Existing Buildings, American Society of Civil Engineers, Reston, VA. ASTM E2557 (2016) Standard Practice for Probable Maximum Loss (PML) Evaluations for Earthquake Due-Diligence Assessments. American Society of Testing and Material, West Conshohocken, PA ETABS (2016), Integrated software package for the structural analysis and design of buildings, Computers and Structures Inc., Walnut Creek, CA FEMA P-58 (2012) Seismic Performance Assessment of Buildings Federal Emergency Management Agency Washington, D.C SP3 (2016) Seimic Performance Predication Program, Hasleton and Baker, https://www.hbrisk.com/

Voluntary Seismic Upgrade & Seismic Risk Assessment of
High-Rise Soft-Story Concrete Towers in Sacramento
K. Miyamoto, A. Gilani, L. Determan
Miyamoto International, Inc.


• Part I– Assessment
– Retrofit
– PML
• Part II– Construction details
– Construction photography
– Cost-benefit analysis
Outline
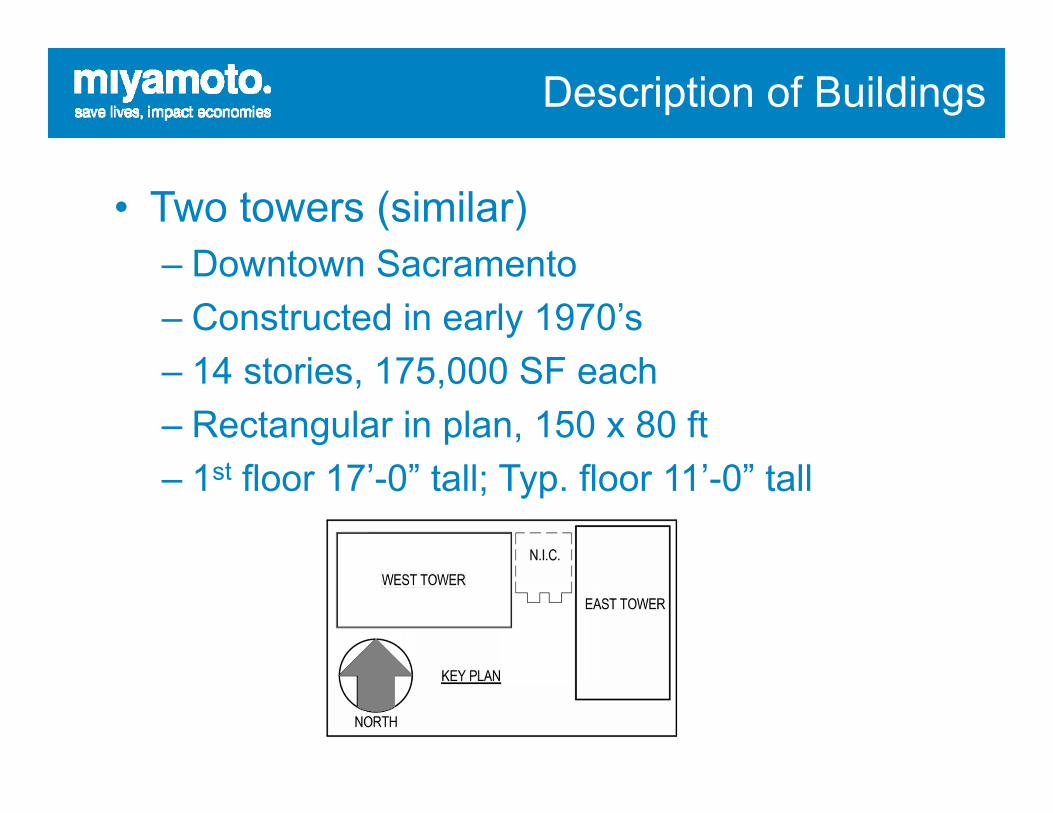
• Two towers (similar)– Downtown Sacramento
– Constructed in early 1970’s
– 14 stories, 175,000 SF each
– Rectangular in plan, 150 x 80 ft
– 1st floor 17’-0” tall; Typ. floor 11’-0” tall
Description of Buildings

• Gravity system– 8-in. PT two way
slab
– Concrete columns and pile foundation
• LFRS– RC perimeter MF
– 28-in columns and 18x beams
Framing Systems
Plan

• Enhancing performance– Configuration: regular and symmetric in plan,
redundant system
– Ductile detailing including 135-deg hooks and 4-in. tie spacing in PH zones
• Deficiencies– Soft story response
– Beams: LWC w/ ties at 13-18” o.c. at mid-span
– 18” beams eccentric to 28” columns
– Captured columns in west tower
Building Characteristics

Eccentric Bm/Col Conn.

Captured Columns

• ASCE 41 BSE-1– Site Class D
– S0.2=0.53 g
– S1.0=0.31 g
• 2014 Napa EQ– Building in escrow
– Architectural damage at seismic gap assemblies
– No noticeable structural damage
Seismicity
0.0
0.1
0.2
0.3
0.4
0.5
0.6
0 1 2 3 4 5 6S
pect
ral a
ccel
erat
ion,
g
Period, sec

• Nominal properties
• Linear and NL analyses
• Seismic weight, 22,000 kips
• Predominantly fundamental mode response
FE Modeling and Analysis
Mode Period, sec UX UY RZ
1 3.8 0% 87% 0%
2 3.4 84% 0% 2%
3 2.6 2% 0% 84%

• RS analysis
• Larger drift in Y-direction, less frames– >2% Y- & ~2% in X-
direction
– For nonductile concrete these values are too high
• Soft-story behavior at the bottom story
Linear Analysis: SDRs
0
2
4
6
8
10
12
14
16
0.0% 0.5% 1.0% 1.5% 2.0% 2.5%
Story
SDR, %
X‐
Y‐

• Flexural hinges near joints
• Shear hinges mid-span of beams (force controlled)
• Target displacement– ASCE 41
NL Analysis

• Shear flexural hinges
• To prevent flexural and shear hinging at BSE 1, – limit SDR to
~1.5% (2.9 in.) first floor
PO Results

• Add FVD to the bottom story– Aesthetically
integrate into existing building
– Maintain occupancy
– Target building vulnerability
– Sensitivity analysis• FVD:1 or 2 stories,
similar results
Seismic Retrofit Solution
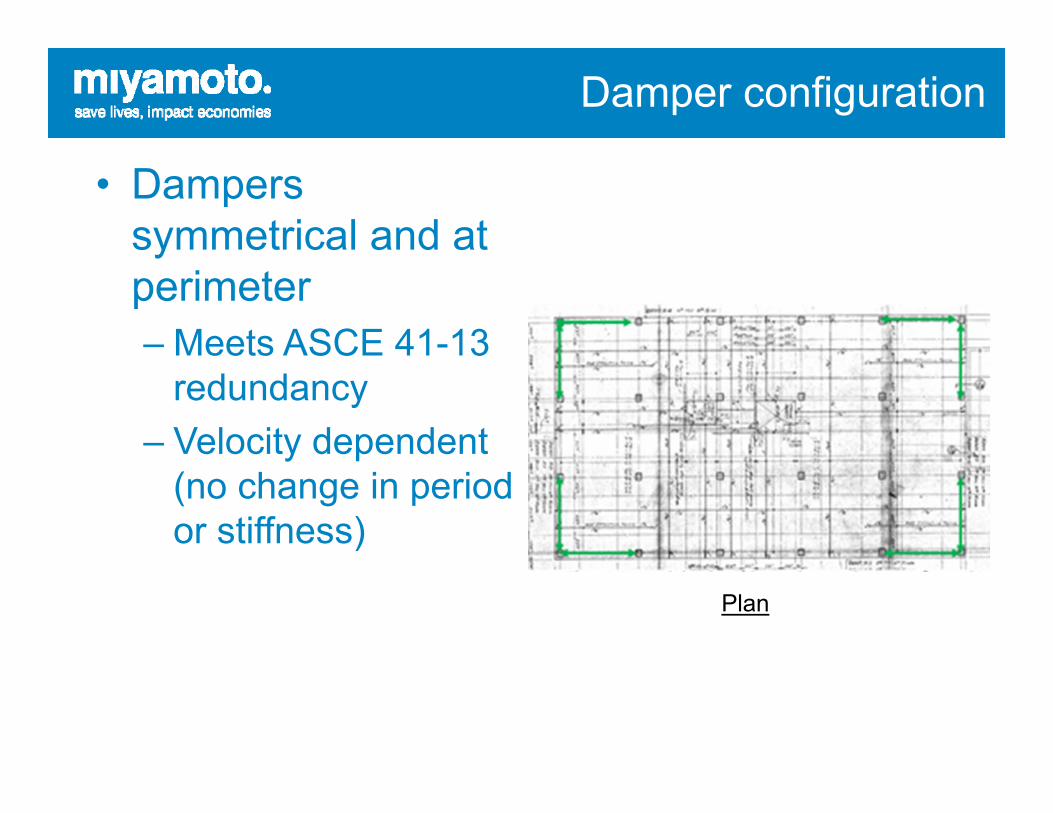
• Dampers symmetrical and at perimeter– Meets ASCE 41-13
redundancy
– Velocity dependent (no change in period or stiffness)
Damper configuration
Plan
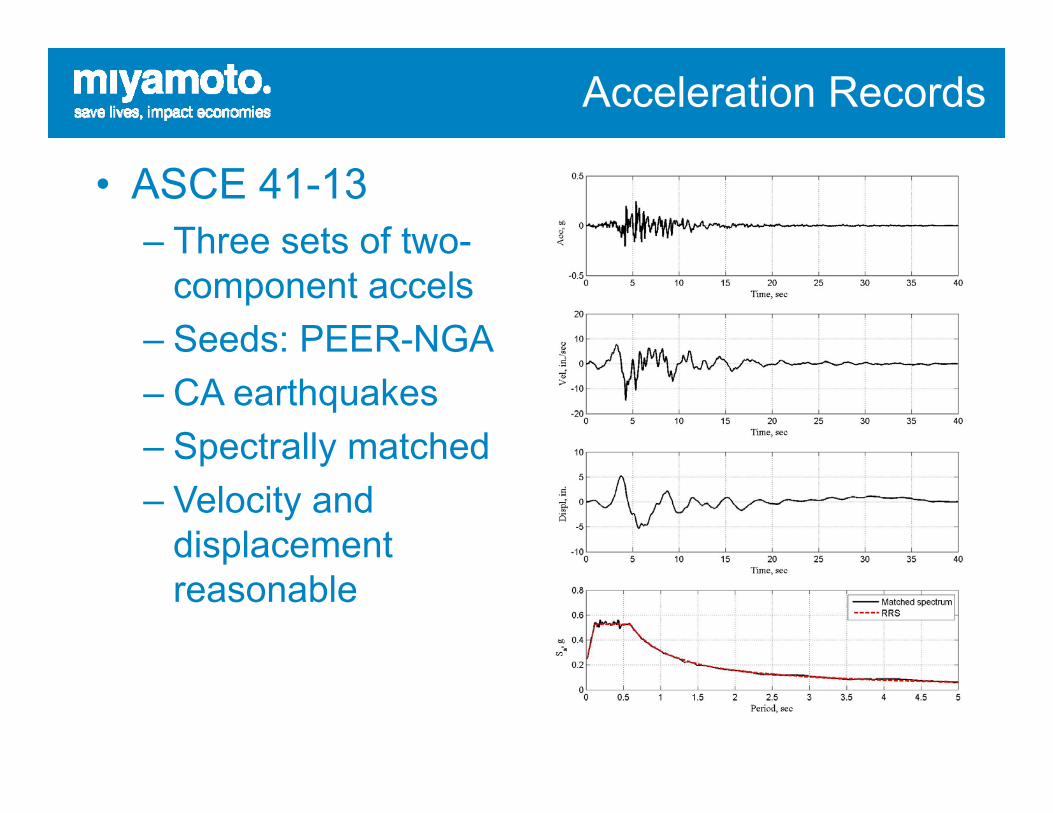
• ASCE 41-13– Three sets of two-
component accels
– Seeds: PEER-NGA
– CA earthquakes
– Spectrally matched
– Velocity and displacement reasonable
Acceleration Records

• Maxima of the responses– NLRHA
• SDR reduced to <1.2%– No plastic hinging
NLRHA SDR
0
2
4
6
8
10
12
14
16
0.0% 0.2% 0.4% 0.6% 0.8% 1.0% 1.2% 1.4%
Story
SDR, %
X‐
Y‐

Comparison of Performance
0
2
4
6
8
10
12
14
16
0.0% 0.5% 1.0% 1.5% 2.0% 2.5%
Story
SDR, %
Existing
Damped
‐2.5%
‐2.0%
‐1.5%
‐1.0%
‐0.5%
0.0%
0.5%
1.0%
1.5%
2.0%
2.5%
0 5 10 15 20
SDR, %
Time, sec
EXistingRetrofitted
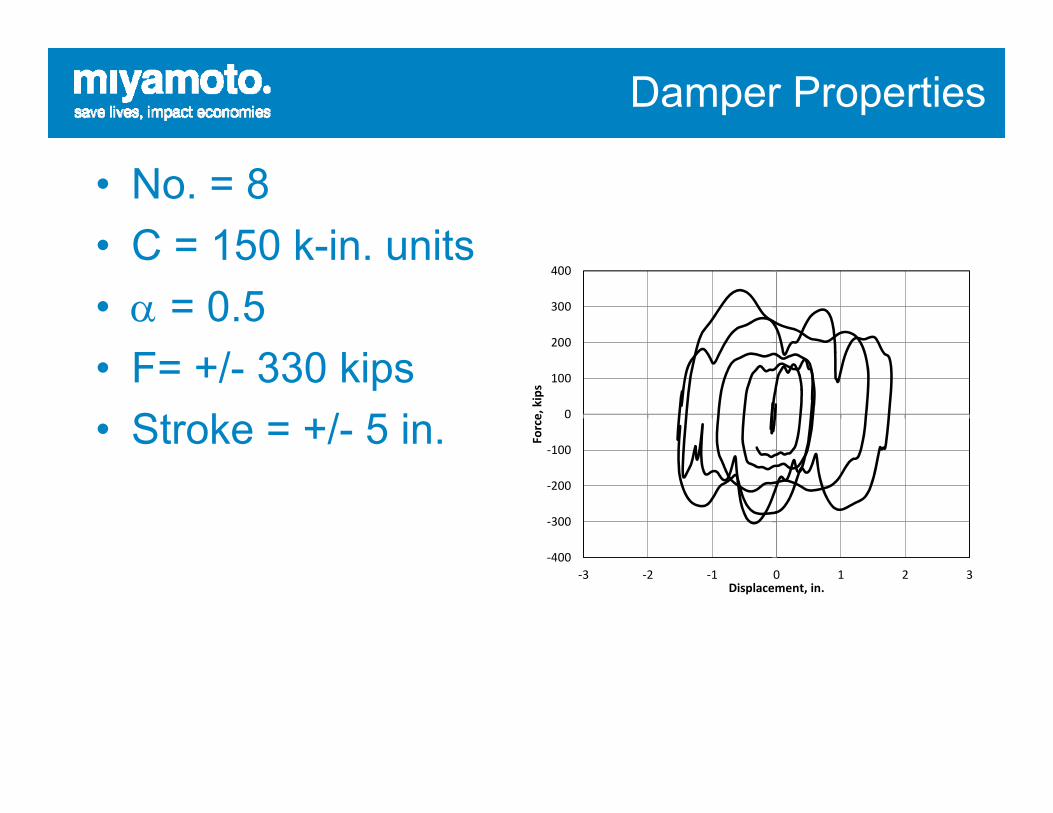
• No. = 8
• C = 150 k-in. units
• = 0.5
• F= +/- 330 kips
• Stroke = +/- 5 in.
Damper Properties
‐400
‐300
‐200
‐100
0
100
200
300
400
‐3 ‐2 ‐1 0 1 2 3
Force, kips
Displacement, in.
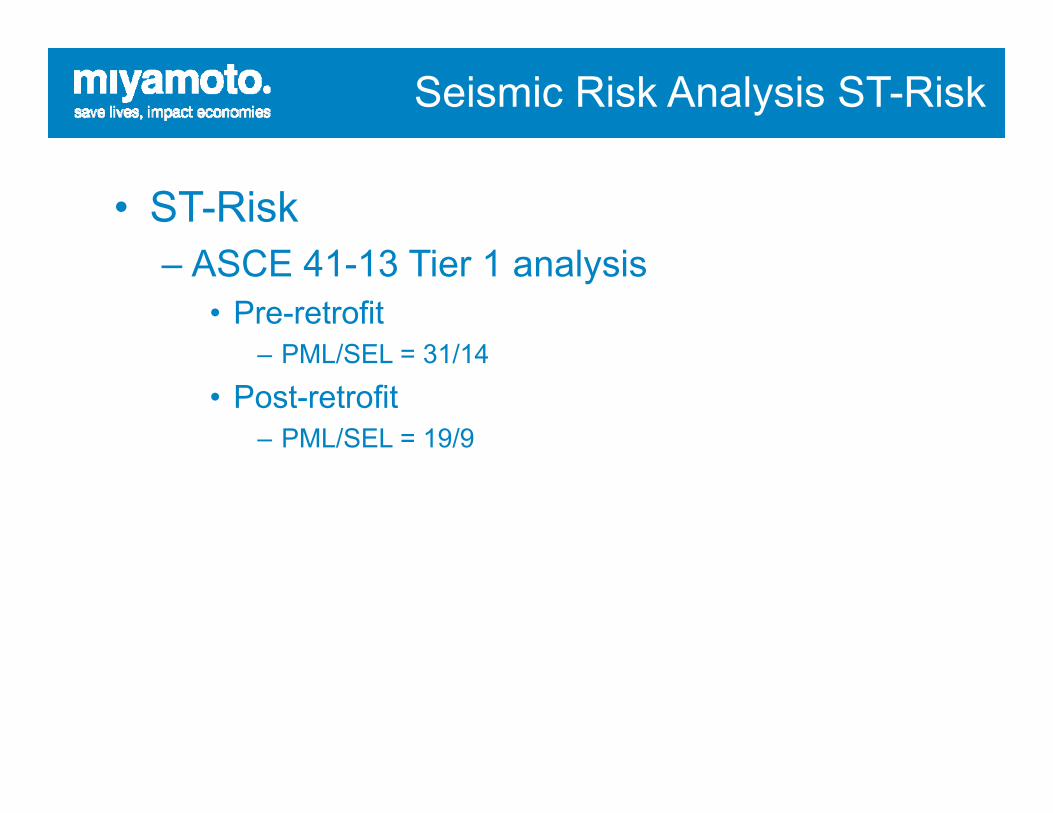
• ST-Risk– ASCE 41-13 Tier 1 analysis
• Pre-retrofit– PML/SEL = 31/14
• Post-retrofit– PML/SEL = 19/9
Seismic Risk Analysis ST-Risk

• SP3 (Haselton-Baker)
• NLRHA option– Extract maximum
SDR, residual displacement (RD), and peak floor accelerations (PFA) from all runs at each floor. Use this as input. (Avg. shown)
FEMA P58 Analysis
0
2
4
6
8
10
12
14
16
0.0% 0.5% 1.0% 1.5% 2.0%
Story
SDR, %
X‐
Y‐
0
2
4
6
8
10
12
14
16
0 0.05 0.1 0.15 0.2 0.25 0.3
Story
PFA, g
X‐
Y‐

– Perform MCS and obtain risk consequences
– USRC rating currently under consideration
FEMA P-58 Cont.
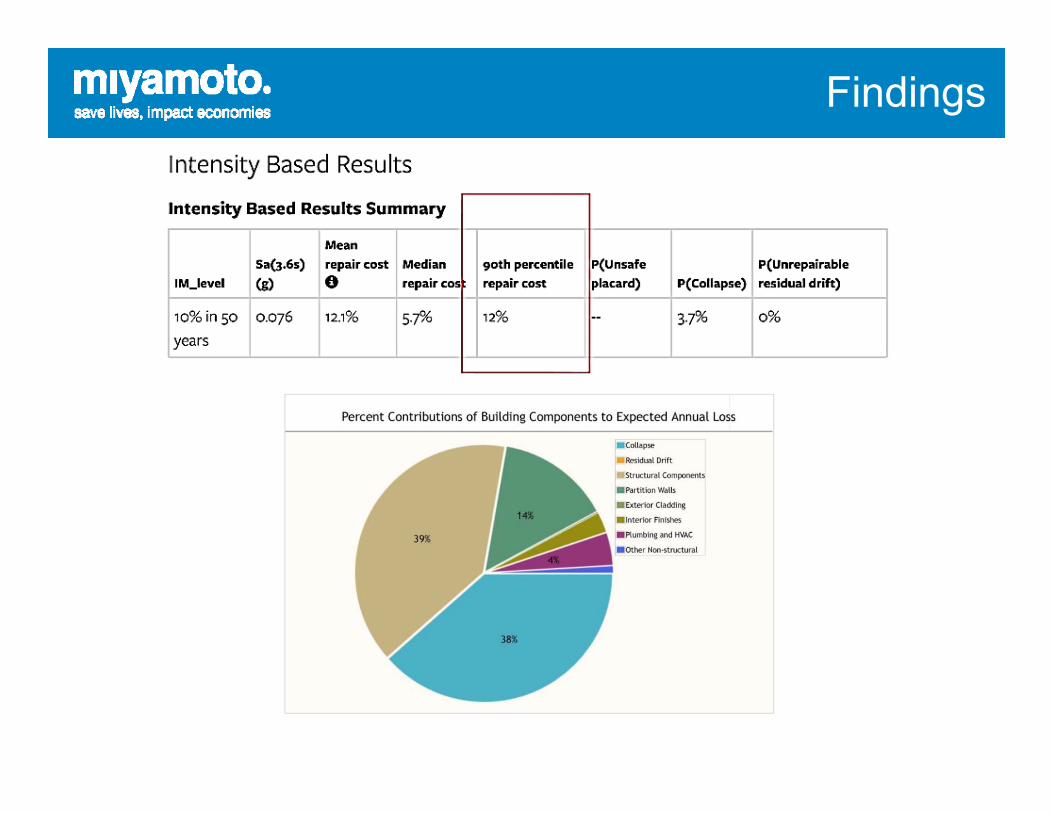
Findings

Retrofit Plan

Upgrade Elevations

Captured Columns

Details

Details

Details
Column Connection Beam Connection

Construction

Construction

Construction

Construction
Construction
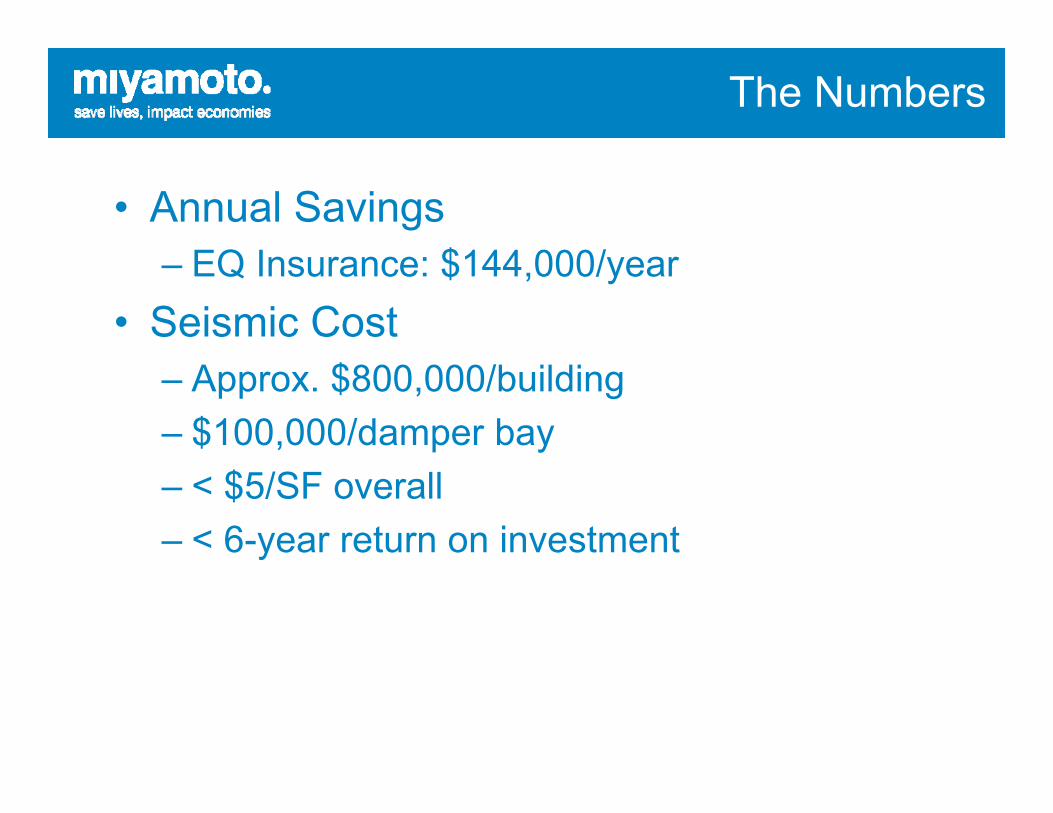
• Annual Savings– EQ Insurance: $144,000/year
• Seismic Cost– Approx. $800,000/building
– $100,000/damper bay
– < $5/SF overall
– < 6-year return on investment
The Numbers

• Building– PML>20
– Soft story response & some suspect detailing
• Limited scope retrofit– Be cost effective and simple to implement
– Address main deficiencies; targeted scope• Damper for soft story
• FRP for shear
• Eliminate some eccentricity at joints
• Eliminate captive column
Discussions

We make the world a better, safer place.