“seismic rehabilitation of wood diaphragms in...
TRANSCRIPT
“Seismic Rehabilitation of Wood Diaphragms in
Unreinforced Masonry Buildings”
by
Amber J. Grubbs, Mary Beth D. Hueste and Joseph M. Bracci
Texas A&M University
Department of Civil Engineering
College Station, Texas 77843-3136
May 2007
This research was conducted at Texas A&M University and was supported by the Mid-America Earthquake Center through the Earthquake Engineering Research Centers Program of the National Science Foundation under NSF award number EEC-9701785 and the Department of Civil Engineering and the Texas Engineering Experiment Station at Texas A&M University. Any opinions, findings and conclusions or recommendations expressed in this material are those of the authors and do not necessarily reflect those of the National Science Foundation and the other sponsors.

ABSTRACT
This research focused on evaluating the seismic performance of existing and
rehabilitated wood floor and roof diaphragms in typical pre-1950’s, unreinforced
masonry (URM) buildings found in the Central and Eastern portions of the United
States. Specifically, there were two major objectives: (1) to assess the adequacy of
current seismic guidelines for evaluating existing wood diaphragms in pre-1950’s URM
buildings and for designing necessary retrofits; and (2) to evaluate the effect of
diaphragm retrofits, as designed by FEMA guidelines, on the overall response of URM
structures.
This study utilized current guidelines and tools available to practicing engineers
to evaluate wood diaphragms in two pre-1950s URM buildings for seismic demands and
to design appropriate rehabilitations for these diaphragms. The linear static procedures
from the FEMA 273 and FEMA 365 guidelines were used to evaluate the existing wood
diaphragms of the case study buildings. This evaluation indicated that the existing
diaphragms were not sufficient for the Life Safety performance level when subject to the
demands of the 10% probability of exceedance in 50 years event in St. Louis, Missouri.
Retrofit options were provided in the FEMA guidelines to upgrade the diaphragms to
Life Safety performance.
A parametric study was also performed to evaluate the complete building
response after the diaphragms of a URM prototype structure were retrofitted. The
selected retrofit included increasing the in-plane strength of the diaphragm and
improving the connection of the diaphragm to the URM walls. Various existing
conditions of masonry were considered. It was found that retrofitting the diaphragms led
to improved behavior for the diaphragms. However, stresses increased in other
structural components, including the walls, due to a reduction in the building period and
increased seismic demands.

v
ACKNOWLEDGMENTS
This research was conducted at Texas A&M University and was supported by the
Mid-America Earthquake Center through the Earthquake Engineering Research Centers
Program of the National Science Foundation under NSF award number EEC-9701785
and the Department of Civil Engineering and the Texas Engineering Experiment Station
at Texas A&M University. Any opinions, findings and conclusions or recommendations
expressed in this material are those of the authors and do not necessarily reflect those of
the National Science Foundation and the other sponsors.

vii
TABLE OF CONTENTS
Page
ABSTRACT ................................................................................................................... iii
ACKNOWLEDGMENTS ............................................................................................. v
TABLE OF CONTENTS ............................................................................................... vii
LIST OF FIGURES ....................................................................................................... xi
LIST OF TABLES ........................................................................................................ xiii
1. INTRODUCTION.................................................................................................... 1
1.1 BACKGROUND AND PROBLEM STATEMENT ......................................... 1
1.2 RESEARCH OBJECTIVES .............................................................................. 3
1.3 SCOPE OF WORK ............................................................................................ 5
2. PREVIOUS RESEARCH ........................................................................................ 7
2.1 GENERAL ......................................................................................................... 7 2.2 MID-AMERICA EARTHQUAKE CENTER RESEARCH.............................. 7
2.2.1 General..................................................................................................... 7 2.2.2 Research Performed at Texas A&M University ...................................... 7 2.2.3 Research Performed at Georgia Tech University .................................... 9 2.2.4 Additional MAE Center Studies in Unreinforced Masonry .................... 10
2.3 RESEARCH PERFORMED BY CERL ............................................................ 11 2.4 OTHER STUDIES PERFORMED ON URM STRUCTURES......................... 12
3. CASE STUDY BUILDINGS................................................................................... 15
3.1 GENERAL ......................................................................................................... 15 3.2 CASE STUDY BUILDING 1 ............................................................................ 15
3.2.1 General Description ................................................................................. 16 3.2.2 Structural Details ..................................................................................... 16
3.3 CASE STUDY BUILDING 2 ............................................................................ 19 3.3.1 General Description ................................................................................. 19 3.3.2 Structural Details ..................................................................................... 20
4. FEMA REHABILITATION GUIDELINES ........................................................... 25
4.1 GENERAL ......................................................................................................... 25 4.2 LINEAR STATIC PROCEDURE ..................................................................... 26 4.3 NONLINEAR STATIC PROCEDURE............................................................. 27
4.3.1 General..................................................................................................... 27
viii
Page
4.3.2 Applicability of NSP Analysis................................................................. 27 4.3.3 Description of NSP Analysis ................................................................... 28 4.3.4 Application of NSP Analysis to Case Study Buildings ........................... 30
4.4 DYNAMIC PROCEDURES............................................................................ 31
5. LINEAR STATIC PROCEDURE ........................................................................... 33
5.1 GENERAL ......................................................................................................... 33 5.2 LINEAR STATIC PROCEDURE USING FEMA 273 .................................... 33
5.2.1 Applicability of Linear Procedures.......................................................... 33 5.2.2 Details of Linear Static Procedure ........................................................... 34 5.2.3 FEMA 273 Linear Static Analysis Acceptance Criteria .......................... 40 5.2.4 Identification of Acceptable Diaphragm Retrofit ................................... 44 5.2.5 Discussion of FEMA 273 LSP Results.................................................... 46
5.3 LINEAR STATIC PROCEDURE USING FEMA 356 ..................................... 47 5.3.1 General..................................................................................................... 47 5.3.2 Applicability of Linear Procedures.......................................................... 47 5.3.3 Details of Linear Static Procedure ........................................................... 47 5.3.4 FEMA 356 Linear Static Analysis Acceptance Criteria .......................... 52 5.3.5 Identification of Acceptable Diaphragm Retrofit .................................... 53 5.3.6 Discussion of FEMA 356 LSP Results.................................................... 55
5.4 SUMMARY OF LSP RESULTS...................................................................... 56
6. PARAMETRIC STUDY.......................................................................................... 59
6.1 GENERAL ......................................................................................................... 59 6.2 DESCRIPTION OF PARAMETRIC BUILDING MODELS ........................... 60
6.2.1 Existing Building Model Description ...................................................... 60 6.2.2 Retrofitted Building Model Description .................................................. 66 6.2.3 Summary of Parametric Models .............................................................. 67
6.3 TIME HISTORY ANALYSIS ........................................................................... 69 6.3.1 General..................................................................................................... 69 6.3.2 Discussion for Method to Report Results ................................................ 74 6.3.3 Discussion of Fundamental Mode Shapes ............................................... 75 6.3.4 Comparison of Major Building Response Parameters............................. 80 6.3.5 Deformation Response of URM Prototype.............................................. 84 6.3.6 Stress Developed in URM Prototype....................................................... 88
6.4 SUMMARY OF PARAMETRIC STUDY RESULTS...................................... 94 6.5 DISCUSSION .................................................................................................... 95
7. CONCLUSIONS...................................................................................................... 97
7.1 SUMMARY ....................................................................................................... 97 7.2 CONCLUSIONS................................................................................................ 99
ix
7.3 RECOMMENDATIONS FOR FUTURE WORK............................................. 102
Page
REFERENCES............................................................................................................... 103
APPENDIX A (LSP Calculations for Existing Case Study Building 1)........................ 107
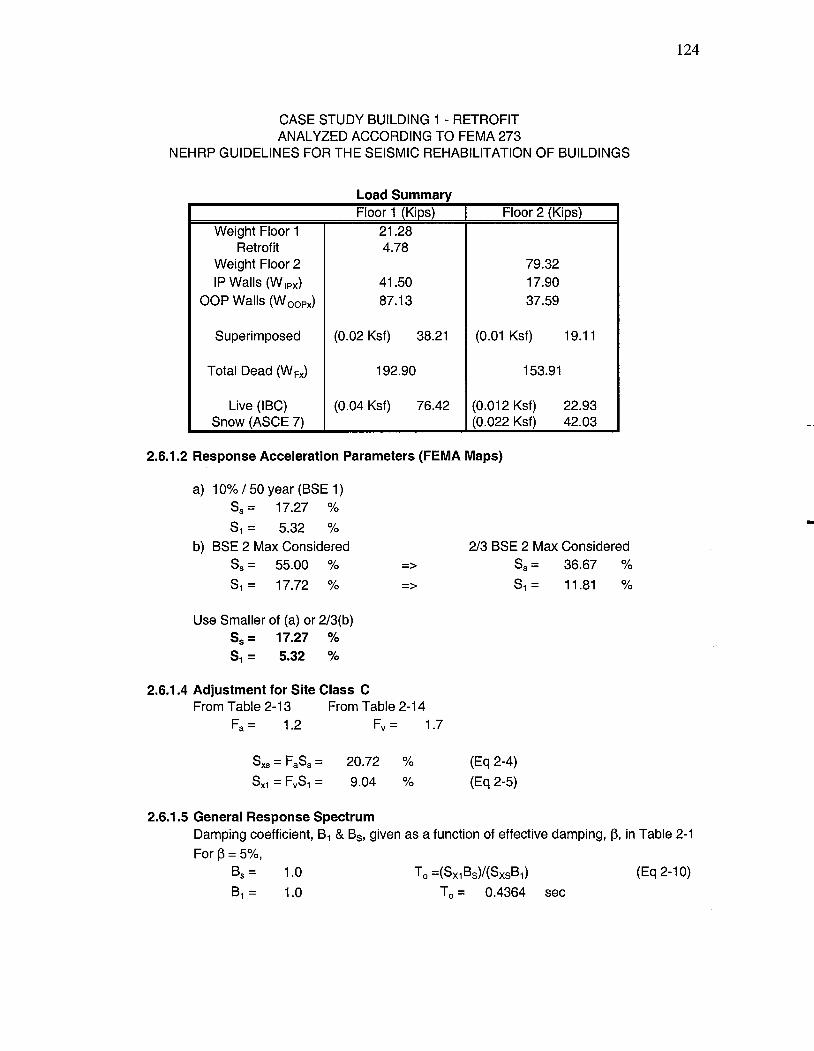
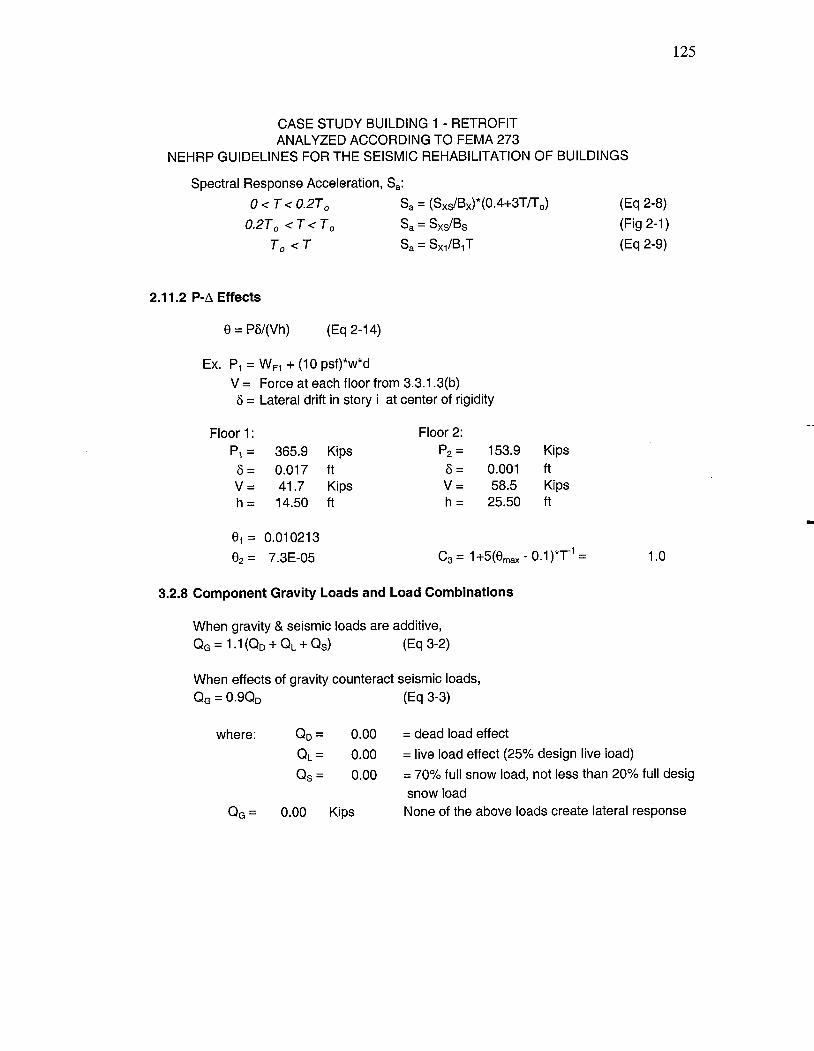
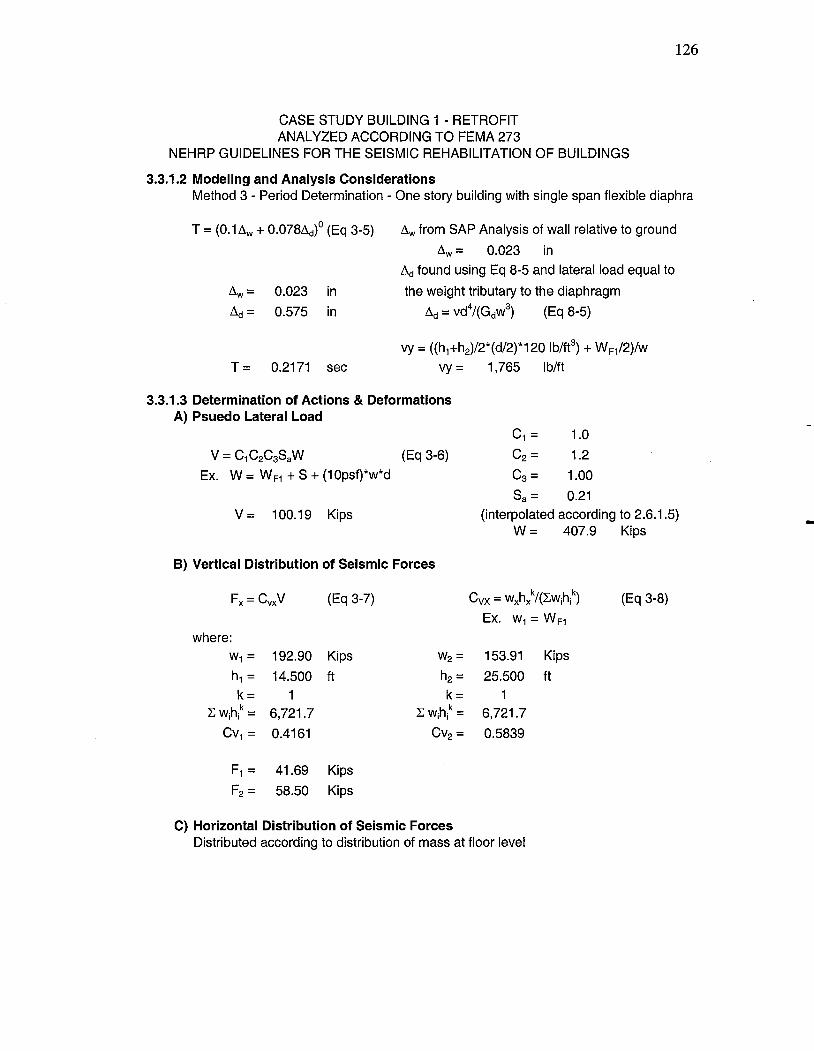
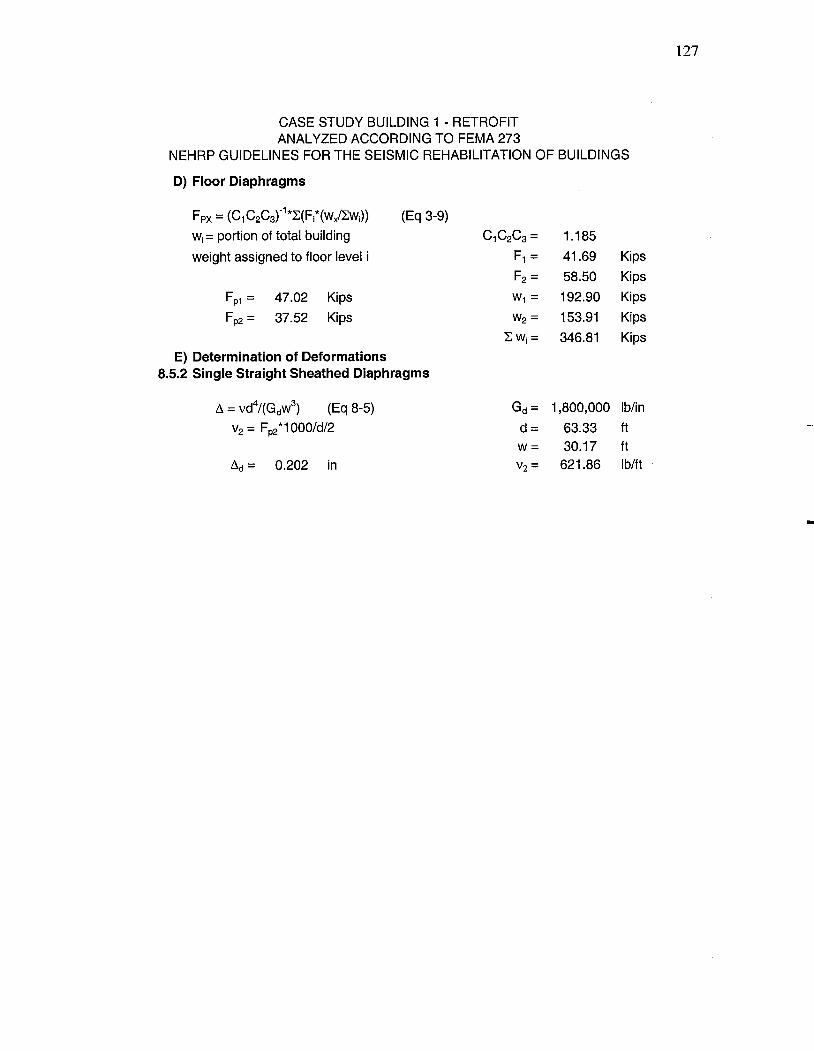
APPENDIX B (Sample LSP Calculation for Retrofitted Case Study Building 1) ........ 123
APPENDIX C (LSP Calculations for Existing Case Study Building 2)........................ 137
APPENDIX D (Sample LSP Calculation for Retrofitted Case Study Building 2) ........ 153
APPENDIX E (Summary of All Retrofit Calculations for Case Study Buildings) ....... 167

xi
LIST OF FIGURES FIGURE Page
2.1 Prototype Star Anchor ........................................................................................ 8
2.2 3-D Lumped Mass Model (Kim and White 2002) ............................................. 10
3.1 Case Study Building 1........................................................................................ 16
3.2 Plan Layout of Case Study Building 1 ............................................................... 17
3.3 Typical Joist-to-Beam Connection Detail .......................................................... 18
3.4 Beam-to-Wall Detail .......................................................................................... 18
3.5 Case Study Building 2........................................................................................ 19
3.6 Plan Layout of Case Study Building 2 ............................................................... 21
3.7 Masonry Wall-to-Beam Connection at Roof Level ........................................... 22
3.8 Joist-to-Wall Detail ............................................................................................ 23
3.9 Typical Beam Bearing Detail for Roof Joists .................................................... 23
4.1 Comparison of Linear and Nonlinear Force versus Displacement
Relationship…………........................................................................................ 26
4.2 Effective and Elastic Stiffness Relationship (Adapted from ATC 1997a)......... 30
5.1 General Response Spectrum for FEMA 273 (Adapted from ATC 1997a) ........ 35
5.2 Component Behavior Relationships (Adapted from ATC 1997a) ..................... 40
5.3 General Response Spectrum for FEMA 356 (Adapted from ASCE 2000)........ 49
5.4 Comparison of FEMA 273 and FEMA 356 Demands....................................... 57
5.5 Comparison of FEMA 273 and FEMA 356 Predictions for Case Study
Building 1........................................................................................................... 57
5.6 Comparison of FEMA 273 and FEMA 356 Predictions for Case Study
Building 2........................................................................................................... 58
6.1 SAP Model of URM Prototype Building .......................................................... 61
6.2 Time History Records Used for Parametric Study............................................. 71
6.3 Demonstration of Reported Locations from Prototype ...................................... 74
6.4 Unretrofitted Prototype Model Fundamental Mode Shape ................................ 76
6.5 Retrofitted Prototype Model Fundamental Mode Shape.................................... 78
xii
FIGURE Page
6.6 Summary of Building Response Parameters ...................................................... 81
6.7 Summary of Maximum Deformation in URM Prototype .................................. 86
6.8 Maximum Diaphragm Displacement for All Time History Records ................. 88
6.9 Summary of Critical In-Plane and Out-of-Plane Wall Stresses ......................... 93
xiii
LIST OF TABLES TABLE Page
5.1 Design Response Acceleration Parameters for Case Study Buildings............... 34
5.2 Summary of LSP Design Parameters for Case Study Buildings........................ 37
5.3 LSP Diaphragm Demands.................................................................................. 39
5.4 FEMA 273 LSP Diaphragm Demand-to-Capacity Ratios ................................. 39
5.5 LSP Diaphragm Acceptance Criteria for Case Study Buildings........................ 42
5.6 Permissible h/t Ratios for URM Out-of-Plane Walls (ATC 1997a) .................. 43
5.7 Comparison of h/t Ratio Limitations.................................................................. 44
5.8 FEMA 273 LSP Diaphragm Retrofits for Case Study Building 1 ..................... 45
5.9 FEMA 273 LSP Diaphragm Retrofits for Case Study Building 2 ..................... 46
5.10 LSP Demands Predicted Using FEMA 356 ....................................................... 51
5.11 FEMA 356 LSP Diaphragm Demand-to-Capacity Ratios ................................. 52
5.12 LSP Diaphragm Acceptance Criteria for Case Study Buildings........................ 53
5.13 FEMA 356 LSP Diaphragm Retrofits for Case Study Building 1 ..................... 54
5.14 FEMA 356 LSP Diaphragm Retrofits for Case Study Building 2 ..................... 55
6.1 Summary of Material Properties for Parametric Study ...................................... 68
6.2 Time History Parameters, 10% in 50-year event for St. Louis, Missouri
(Adapted from Wen and Wu 2000).................................................................... 70
6.3 Description of Reported Locations Shown in Fig. 6.3 ....................................... 75
6.4 Summary of Building Response Parameters (Median Maximum Values)……... 80
6.5 Comparison of Average, Median, and Absolute Maximum Base Shear
Values................................................................................................................. 84
6.6 Maximum Deformations of URM Prototype (Median Values) ......................... 85
6.7 Maximum Stress in the Floor and Roof Diaphragms......................................... 89
6.9 Maximum Stress in In-Plane URM Wall .......................................................... 90
6.10 Maximum Stress in Out-of-Plane URM Wall ................................................... 92
7.1 FEMA Recommended Diaphragm Retrofits...................................................... 98

1
1. INTRODUCTION
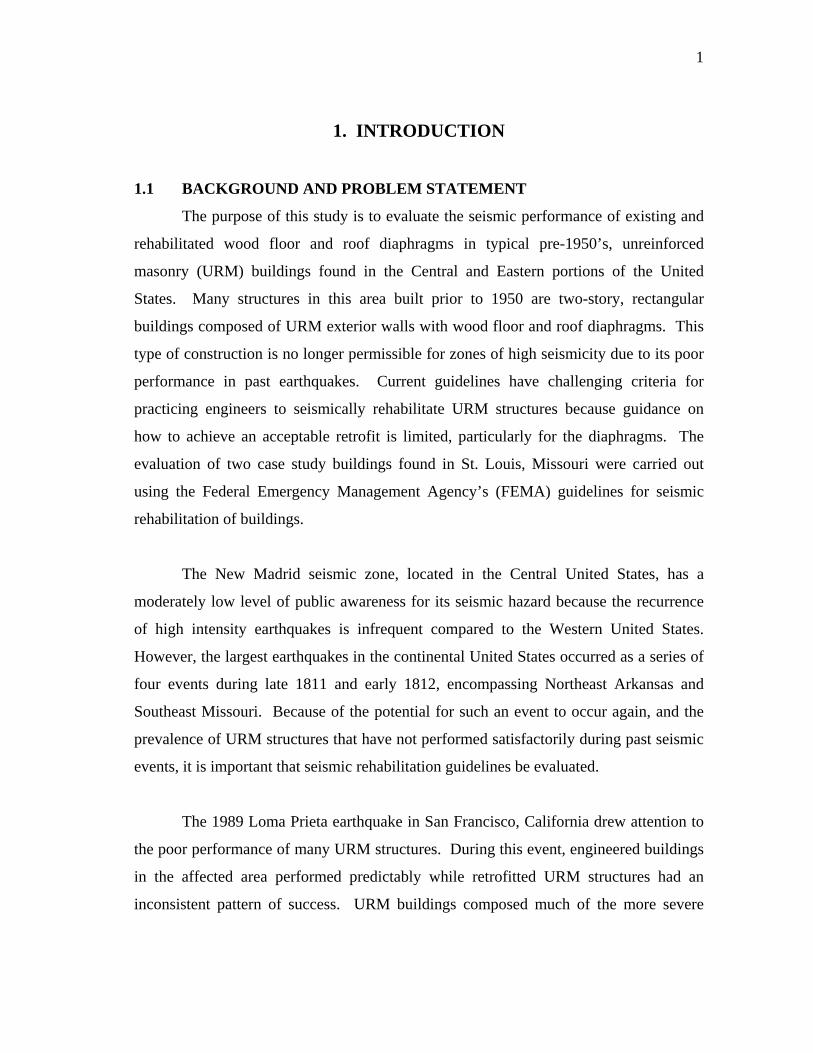
1.1 BACKGROUND AND PROBLEM STATEMENT
The purpose of this study is to evaluate the seismic performance of existing and
rehabilitated wood floor and roof diaphragms in typical pre-1950’s, unreinforced
masonry (URM) buildings found in the Central and Eastern portions of the United
States. Many structures in this area built prior to 1950 are two-story, rectangular
buildings composed of URM exterior walls with wood floor and roof diaphragms. This
type of construction is no longer permissible for zones of high seismicity due to its poor
performance in past earthquakes. Current guidelines have challenging criteria for
practicing engineers to seismically rehabilitate URM structures because guidance on
how to achieve an acceptable retrofit is limited, particularly for the diaphragms. The
evaluation of two case study buildings found in St. Louis, Missouri were carried out
using the Federal Emergency Management Agency’s (FEMA) guidelines for seismic
rehabilitation of buildings.
The New Madrid seismic zone, located in the Central United States, has a
moderately low level of public awareness for its seismic hazard because the recurrence
of high intensity earthquakes is infrequent compared to the Western United States.
However, the largest earthquakes in the continental United States occurred as a series of
four events during late 1811 and early 1812, encompassing Northeast Arkansas and
Southeast Missouri. Because of the potential for such an event to occur again, and the
prevalence of URM structures that have not performed satisfactorily during past seismic
events, it is important that seismic rehabilitation guidelines be evaluated.
The 1989 Loma Prieta earthquake in San Francisco, California drew attention to
the poor performance of many URM structures. During this event, engineered buildings
in the affected area performed predictably while retrofitted URM structures had an
inconsistent pattern of success. URM buildings composed much of the more severe
2
building damage overall. The life-threatening hazard posed by the potential collapse of
URM buildings in an earthquake prompted the City of San Francisco to identify existing
URM buildings and develop a risk reduction plan (EQE 1990).
Because most of these URM buildings were built prior to adoption of seismic
code requirements, they were not adequately designed for earthquake excitation. Of the
damage to URM buildings, much of the failure was the result of poor anchorage of the
URM walls to the wood diaphragms or due to excessive in-plane flexibility of the floor
diaphragms. The anchorage in some cases may be as little as the diaphragms connected
to out-of-plane URM walls by sitting in a pocket in the wall. While this may be
adequate for gravity loads, this connection will not successfully transfer lateral loading
from the walls to the diaphgragm. Excessive flexibility of the floor can allow the out-of-
plane walls to displace beyond their stability limit.
This study is one in a series of related studies directed by the Mid-America
Earthquake (MAE) Center aiming for a long-term goal of mitigating the impact of
earthquakes with a focus on the Central and Eastern United States. The MAE Center
joins the Pacific Engineering Earthquake Research (PEER) Center and the
Multidisciplinary Center for Earthquake Engineering Research (MCEER) as the three
earthquake engineering research centers funded by the National Science Foundation.
This particular study is a part of one MAE Center project, ST-8: Seismic Performance
of Wood Floor and Roof Diaphragms. Peralta et al. (2002, 2003, 2004) documented the
first phase of this project describing the experimental testing of unretrofitted and
retrofitted wood diaphragms.
One group of studies directed by the MAE Center focuses on retrofitting
essential facilities. Much of the existing building stock in the Central and Eastern
portions of the United States is pre-1950s URM buildings, many of which are essential
facilities. These structures need to remain operational after an earthquake event due to
3
the emergency services these buildings must provide. Typical firehouses in St. Louis,
Missouri were selected as case study buildings for this research due to the
MAE Center’s emphasis toward essential facilities.
This particular study focuses on the wood floor and roof diaphragms of pre-
1950s URM buildings. With the observation that existing URM buildings can pose
significant safety hazards during an earthquake, attention has been directed to the need
for some form of seismic rehabilitation. This study considers retrofit of the diaphragms
to limit in-plane deflection, thereby limiting damage to the out-of-plane masonry walls,
and to do so by utilizing a simple retrofit design procedure currently available to
industry. The goals of this research are to assess the adequacy of current seismic
rehabilitation guidelines for URM structures with a focus on the diaphragms and to
evaluate the effect of diaphragm retrofits, as designed by the FEMA guidelines, on the
overall seismic response of URM structures.
There are two recent sets of guidelines for seismic rehabilitation maintained by
the Federal Emergency Management Agency: the NEHRP Guidelines for Seismic
Rehabilitation of Buildings and Commentary (FEMA 273 and 274) (ATC 1997a, b) and
the more recent NEHRP Prestandard and Commentary for Seismic Rehabilitation of
Buildings (FEMA 356) (ASCE 2000). These guidelines were used in this research to
evaluate two case study buildings found in St. Louis, Missouri. Two URM firehouses
were selected as case study buildings because of their typical, but relatively simple,
layout and the obvious need for such essential facilities to survive an earthquake event.
1.2 RESEARCH OBJECTIVES
This research focuses on two major objectives: (1) assessing the adequacy of
current seismic guidelines for evaluating existing wood diaphragms in pre-1950s URM
buildings and for designing necessary retrofits; and (2) evaluating the effect of
4
diaphragm retrofits, satisfying the FEMA guidelines, on the overall seismic response of
URM structures.
The first objective is accomplished by applying the applicable performance-
based evaluation procedures outlined in two sets of current seismic rehabilitation
guidelines, FEMA 273 (ATC 1997a) and FEMA 356 (ASCE 2000), for two case study
structures. The FEMA guidelines were developed for use by practicing engineers to
design an acceptable retrofit for a specific seismic demand and performance level.
These guidelines are easily available and at least some of the procedures are simple to
use.
In both guidelines, FEMA 273 and FEMA 356, there are four analysis methods
detailed: Linear Static Procedure (LSP), Nonlinear Static Procedure (NSP), Linear
Dynamic Procedure (LDP), and Nonlinear Dynamic Procedure (NDP). For the purposes
of this study, only the LSP has been selected. This procedure allows an evaluation of the
performance of a diaphragm as a component. However, the information contained
within each of these two documents pertaining to flexible diaphragms is limited. By
stepping through a seismic evaluation and rehabilitation design for two case study
buildings, these limitations can be demonstrated. The result of this effort is outlined in a
comparison of these two relatively recent guidelines, which helps to define the
differences between them.
The second objective is accomplished using a parametric study based on the
conclusions of the FEMA 273 and FEMA 356 analyses. Because the approach used in
the first part of this study is component based, the parametric study will evaluate how
the rehabilitation of a single component affects the behavior of the system as a whole.
Rehabilitating the diaphragm typically involves increasing the in-plane diaphragm
strength and stiffness, which will change the behavior of the system, and may or may not
have adverse effects on other building components. Various research studies have been
5
conducted in the past on URM structures to observe the changing behavior of the system
as a function of rehabilitating specific components (ABK 1985, Paquette et al. 2001,
Tena-Colunga and Abrams 1996, and Yi et al. 2002). This parametric study is unique in
that it demonstrates the changing behavior of the system utilizing the specific diaphragm
retrofits designed according to the FEMA guidelines.
The analytical results of the parametric study were evaluated to observe how
variations in the diaphragm stiffness and the adequacy of the connection between the
wall and diaphragm affect the behavior of the system, rather than focusing solely on
avoiding out-of-plane URM wall damage by limiting diaphragm in-plane deflections.
Each parametric analysis physically represents a potential existing or retrofitted state of
a prototype URM structure. The prototype structure is analyzed using a set of synthetic
time histories developed to be representative of local soil conditions for St. Louis,
Missouri for a 10% probability of exceedance in 50-year seismic event (Wen and Wu
2000).
1.3 SCOPE OF WORK
This report is organized in the following manner. Chapter 2 provides a summary
of existing relevant literature. Each of the cited references provides background or
influence to this study. Chapter 3 describes the case study buildings. The case study
buildings are used in the subsequent analyses, therefore a thorough description of each
building is necessary to validate the necessary assumptions made throughout the
analysis. Chapter 4 discusses the possible alternatives for analyzing the case study
buildings provided in the FEMA guidelines. A brief description of each alternative is
provided with a corresponding explanation of the reasons for ultimately selecting the
LSP. With the case study buildings described and the methodology for analysis selected,
Chapter 5 presents an explanation of the LSP contained in both FEMA 273 and FEMA
356. This chapter first focuses on the analysis pertaining to Case Study Building 1,
followed by Case Study Building 2. Any pertinent conclusions that can be made at these
6
stages are included at the end of this section according to the respective case study
building and guideline. Chapter 6 is devoted to explaining the parametric study.
Initially, this section describes the parameters of the prototype used in the finite element
modeling. The study varies critical parameters of three main structural components
using values consistent with FEMA guidelines. The parameter variations are outlined in
detail and accompanied by an explanation of each respective physical representation.
Results and conclusions from the parametric study complete Chapter 6. Chapter 7
includes a summary of this research along with conclusions and recommendations for
future research. The attached appendices contain calculations referred to within the
main body of the report.
7
2. PREVIOUS RESEARCH
2.1 GENERAL
This chapter provides a review of relevant literature and research pertaining to
this study.
2.2 MID-AMERICA EARTHQUAKE CENTER RESEARCH
2.2.1 General
The overall goal of the MAE Center is to create innovative solutions to mitigate
impacts of earthquake events through system driven research. To accomplish this
objective, the MAE Center conducts many related research studies that achieve a large
overall common purpose. The studies are then organized and timed accordingly so that
the deliverable from one study may feed into knowledge in another study. This allows
the MAE Center as a whole to be able to achieve a larger goal through these more
interdependent studies. One of these research programs, the Essential Facilities
Program, focused primarily on URM structures and their critical components. The
research described in this report is part of the group of research dedicated to URM
structures and is a follow up investigation of previously conducted research at Texas
A&M University.
2.2.2 Research Performed at Texas A&M University
This study is part of a MAE Center project at Texas A&M University (TAMU)
that includes additional experimental and analytical studies of wood diaphragms. The
related research focused on large-scale experimental testing of typical diaphragms for
pre-1950’s URM buildings in the Central and Eastern portions of the United States.
Because much of the past damage in URM structures has been related to the poor
connections of the diaphragms to the URM walls (EQE 1990) and diaphragm flexibility,
the focus of this experimental work included several types of representative diaphragms
8
and retrofits that strengthened the connections and stiffened and strengthened the
diaphragm (Peralta et al. 2002, 2003, 2004).
Three basic types of diaphragms, typical of pre-1950’s existing diaphragms in
this region, were tested experimentally with plan dimensions of 3.66 m x 7.32 m (12 ft x
24 ft): (1) specimen MAE-1 had 1x4 in. (nominal) tongue and groove sheathing nailed
to 2x10 in (nominal) joists in the long direction representative of a floor diaphragm;
(2) specimen MAE-2 had 1x6 in. (nominal) staggered sheathing nailed to 2x10 in.
(nominal) joists running in the short direction typical of a flat roof diaphragm; and
(3) specimen MAE-3 was similar to MAE-2 but with a corner opening to represent a
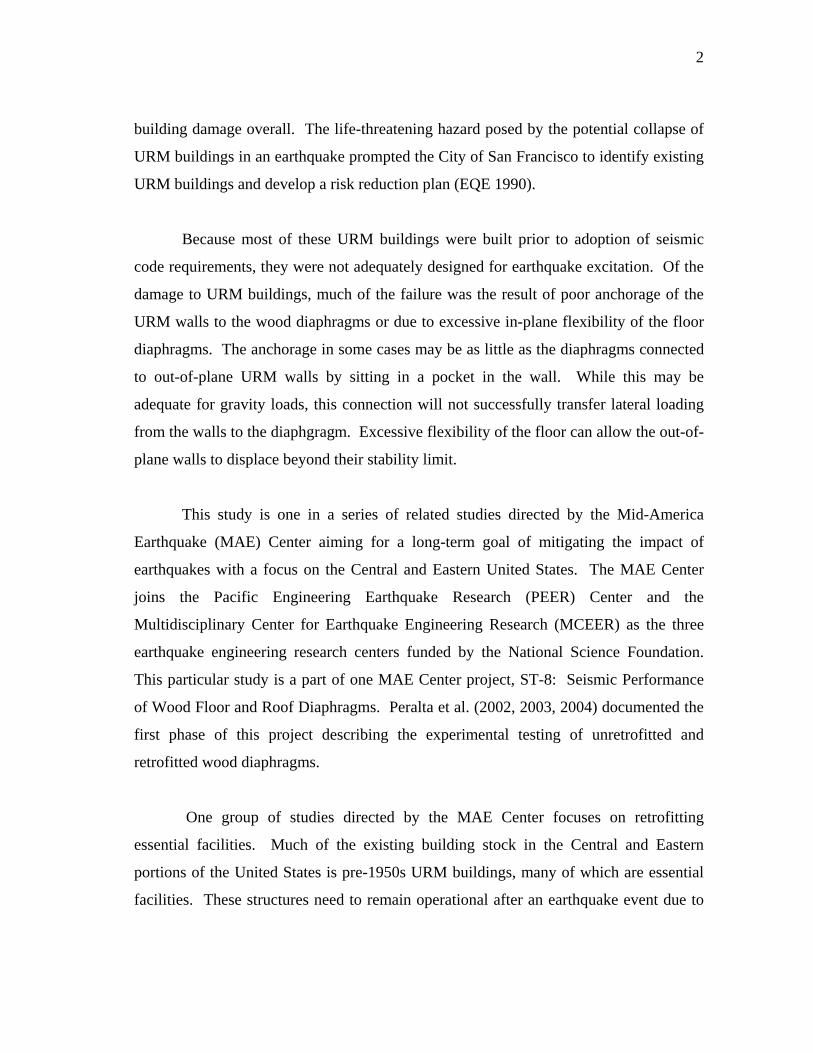
stairwell. MAE-1 utilized a replica star anchor, a wall-to-diaphragm anchor typical of
the time period of concern (see Fig. 2.1), to attach the diaphragm to the rigid steel lateral
support frames, whereas MAE-2 and MAE-3 had bolted connections representing
anchors that connected the joists running parallel to the lateral support frames at 1.22 m
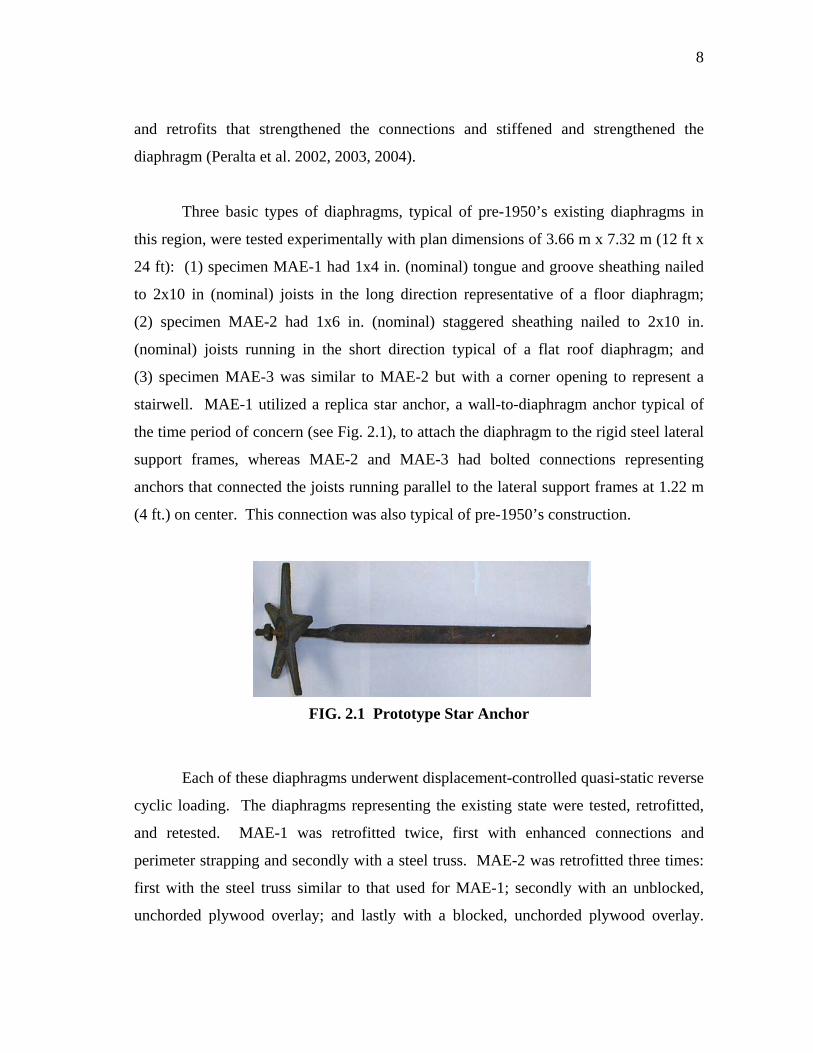
(4 ft.) on center. This connection was also typical of pre-1950’s construction.
FIG. 2.1 Prototype Star Anchor
Each of these diaphragms underwent displacement-controlled quasi-static reverse
cyclic loading. The diaphragms representing the existing state were tested, retrofitted,
and retested. MAE-1 was retrofitted twice, first with enhanced connections and
perimeter strapping and secondly with a steel truss. MAE-2 was retrofitted three times:
first with the steel truss similar to that used for MAE-1; secondly with an unblocked,
unchorded plywood overlay; and lastly with a blocked, unchorded plywood overlay.
9
MAE-3 used the two plywood overlay retrofits, unblocked and blocked, like that used
for MAE-2. Each of the plywood retrofits is a possible retrofit listed in the FEMA 273
and FEMA 356 guidelines.
The yield force, yield displacement, effective stiffness, and post-yield stiffness
were measured for each diaphragm specimen. In addition, the predicted backbone
curves from both FEMA guidelines were calculated for each specimen. The steel truss
retrofit for diaphragms MAE-1 and MAE-2 improved the performance of the diaphragm
the most, in terms of increased strength and stiffness. The blocked and unblocked
plywood overlays did increase the strength and stiffness, although the blocked overlay
gave a more significant increase in the stiffness. The FEMA predictions in all cases had
consistent tendencies, but generally did not give an accurate prediction of the actual
measured in-plane response for the diaphragm specimens. Generally, FEMA 273
overpredicted the stiffness and underpredicted yield displacement and deformation
levels. The opposite was true for FEMA 356 where this method typically
underpredicted stiffness and overpredicted the yield displacement and deformation
levels.
2.2.3 Research Performed at Georgia Tech University
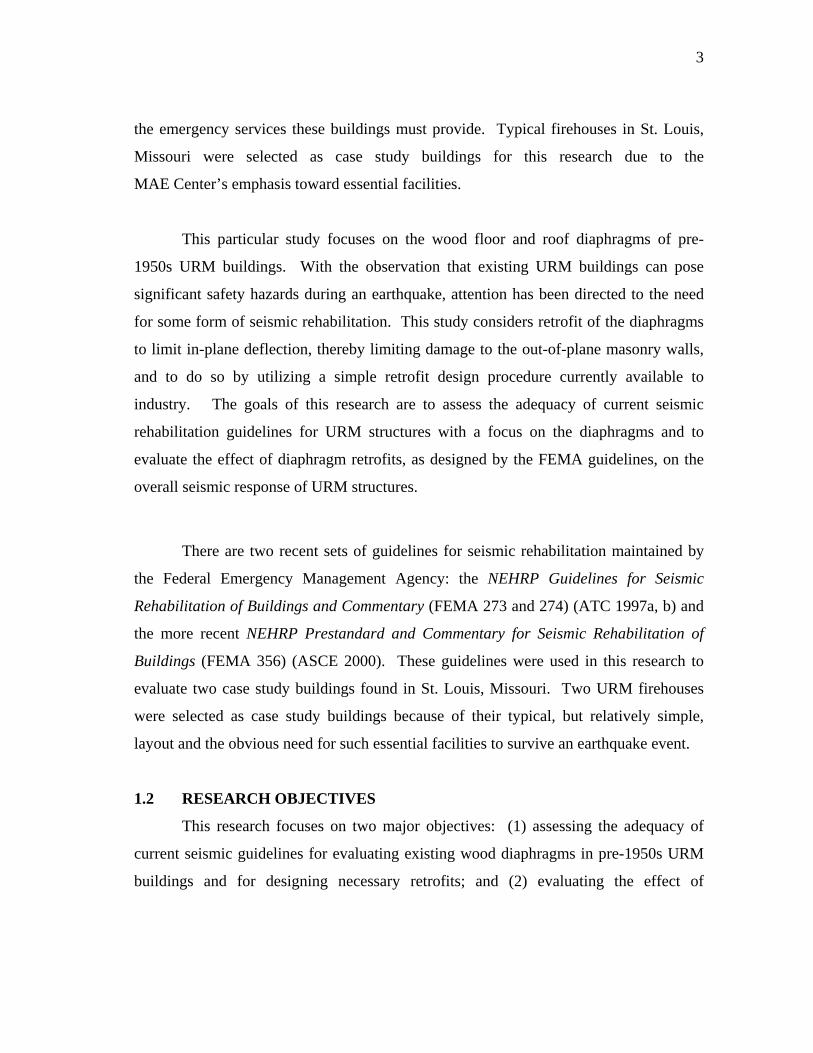
Kim and White (2002) developed a three-dimensional nonlinear model that can
be applied for low-rise, URM structures with flexible diaphragms. The model was
developed to provide a more realistic estimate of the structural response of URM
structures under earthquake loadings, as compared to linear elastic models.
The model captures the diaphragm as a six degree-of-freedom element. The
theory is based on a plate girder analogy with the diaphragm chords acting as the flange.
It allows nails slip to be the major contributor in the diaphragm deformation. The model
allows the user to alter material properties in necessary quadrants to account for
weaknesses or openings in the diaphragm; thus, the material property of the diaphragm
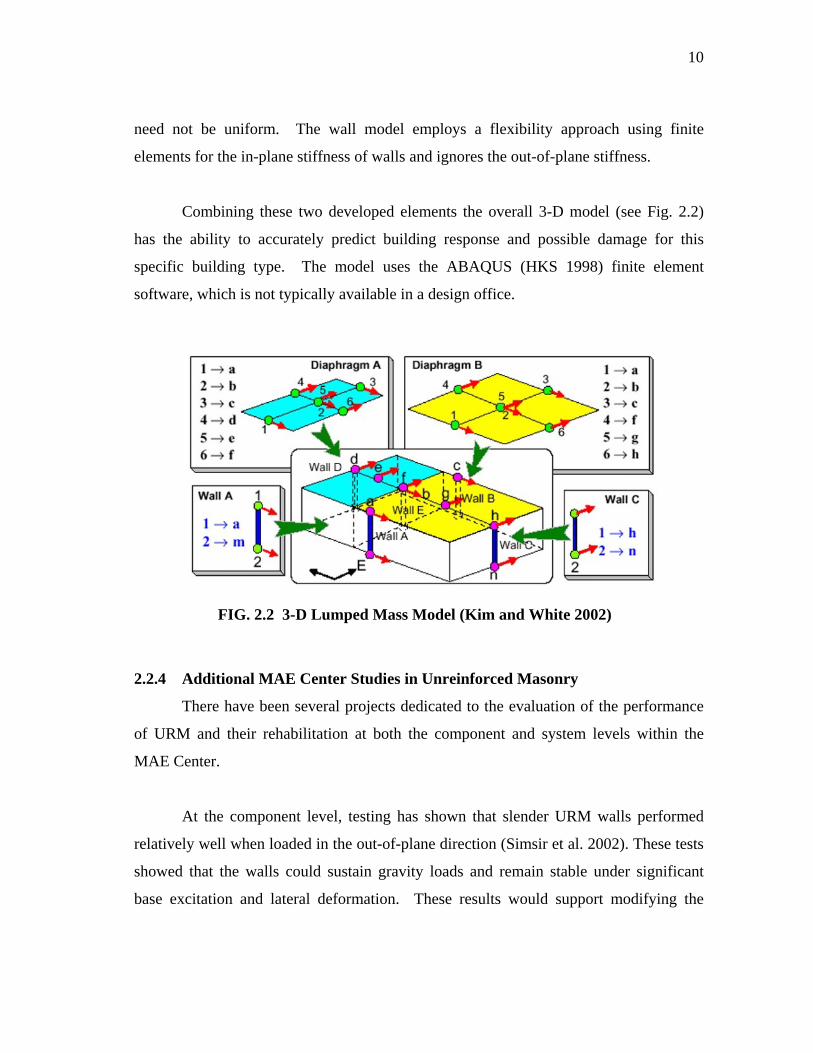
10
need not be uniform. The wall model employs a flexibility approach using finite
elements for the in-plane stiffness of walls and ignores the out-of-plane stiffness.
Combining these two developed elements the overall 3-D model (see Fig. 2.2)
has the ability to accurately predict building response and possible damage for this
specific building type. The model uses the ABAQUS (HKS 1998) finite element
software, which is not typically available in a design office.
FIG. 2.2 3-D Lumped Mass Model (Kim and White 2002)
2.2.4 Additional MAE Center Studies in Unreinforced Masonry
There have been several projects dedicated to the evaluation of the performance
of URM and their rehabilitation at both the component and system levels within the
MAE Center.
At the component level, testing has shown that slender URM walls performed
relatively well when loaded in the out-of-plane direction (Simsir et al. 2002). These tests
showed that the walls could sustain gravity loads and remain stable under significant
base excitation and lateral deformation. These results would support modifying the

11
FEMA recommendations to increase the permissible wall slenderness (height-to-
thickness ratio) limitations. Separate tests took place on wall and pier specimens
developed so that the strength and deformation behavior of the URM wall could be
assessed both before and after rehabilitation (Erbay and Abrams 2001).
At the system level, a full-scale model of a typical URM building with wood
floor and roof diaphragms found in the Eastern and Central portions of the United States
was developed (Yi et al. 2002). The testing of this building will demonstrate the
behavior of the system response according to performance-based design. Many of the
input parameters on this building were derived from the various MAE Center projects
previously mentioned. The results of the testing from this study were not published at
the time this report was compiled.
2.3 RESEARCH PERFORMED BY CERL
The focus of the study funded by the United States Army Construction
Engineering Research Laboratory (CERL) and Development Center was to identify and
detail the wood diaphragm systems within the army’s inventory of buildings and test a
typical prototype for strength, stiffness and failure mechanisms (Cohen et al. 2002). The
inventory study produced two prototypes of masonry buildings with flexible roof
diaphragms that were tested at half-scale with dynamic shake table testing and compared
with analytical predictions. Because the test specimens were half-scale, the ground
motions were geometrically scaled down, accordingly.
There were generally two diaphragms studied: (1) a diagonally sheathed lumber
diaphragm and (2) a corrugated metal deck diaphragm. The wood diaphragm of interest
had 0.953 cm (0.375 in.) thick by 8.26 cm (3.25 in.) wide sheathing. The 1.91 cm x 14.0
cm (0.75 x 5.5 in.) joists were connected to the sheathing by 4d (nominal) nails. These
material dimensions were roughly half scale dimensions of the prototype element.
12
These prototypes were studied analytically using an idealized two-degree-of-
freedom finite element model in SAP2000 (CSI 1999). The material values were chosen
to mimic the parameters that would have been selected in design practice. The testing of
the half-scale specimens showed that the buildings remained elastic up to 0.5g. By
refining the FEM model and keeping the peak ground acceleration below 0.5g during the
analytical modeling, they were able to achieve results analytically that sufficiently
approximated the results of the experiment. The refined FEM model accurately
predicted the natural frequencies, the displacement and acceleration of both the systems
and specimen, and cracking patterns. The model was refined based on critical
parameters, which were selected based on the sensitivity of the model to those
parameters. These modifications included decreasing the thickness of the masonry and
the increasing the overall damping ratio. Acceptable results were produced using a two-
degree-of-freedom system in predicting the diaphragm fundamental frequency,
acceleration, and deflection.
The results from the experimental and analytical results showed that the system
could not be idealized as a single degree of freedom system. The response spectrum
analysis of a two-degree of freedom system did produce an acceptable system response.
2.4 OTHER STUDIES PERFORMED ON URM STRUCTURES
A study conducted after the 1989 Loma Prieta earthquake looked at the influence
of flexible diaphragms on the seismic behavior of URM structures (Tena-Colunga and
Abrams 1996). This study showed that diaphragm and shear wall accelerations have the
potential to increase with increasing diaphragm flexibility. This study utilized three case
study buildings of various typical URM building types and results were compared with
the FEMA 273 guidelines. The Gilroy Firehouse was one of the case study buildings,
and is similar to the structure type of interest for the study described in this report.
13
A recent study of typical URM buildings in North America used three wall
specimens extracted from an existing building to observe the behavior of the existing
and retrofitted walls (Paquette et al. 2001). One of these specimens was tested in an
existing condition fashion with no retrofits while the other two were each retrofitted.
The first retrofit followed what is often done in practice by anchoring the wall at mid-
height. While this action did enhance the overall performance compared to the
unretrofitted wall, it did not mitigate the displacement of the upper portion of the wall.
Thus, this specimen failed sooner than expected. The second retrofit involved bonding
fiberglass backing onto the back of the wall using epoxy with the intention of increasing
out-of-plane wall stiffness. This specimen performed very well with almost no visible
deflection and a significantly lower building period than that of the existing or first
retrofitted specimens. Like the MAE Center testing, these tests demonstrated that each
of the walls could sustain substantial out-of-plane acceleration. Furthermore, the testing
showed that anchoring the walls at mid-height enhanced the performance and the
addition of fiberglass to increase the out-of-plane stiffness of the wall was even more
effective. Perhaps most importantly, the testing of these walls showed that they could be
significantly affected by variation of boundary conditions. The need for anchoring URM
walls at the intermediate floor is very important in older URM structures where wall to
diaphragm anchors are likely to be weak or nonexistent.

15
3. CASE STUDY BUILDINGS
3.1 GENERAL
Two firehouses in St. Louis, Missouri that are typical of pre-1950’s URM
buildings found in the Central and Eastern portions of the United States were chosen as
case study buildings for this research. Firehouses were selected due to the focus of the
MAE Center research program on essential facilities. The required operability of these
structures after an earthquake provides the potential to evaluate seismic performance
with multiple levels of objectives. This study only considers the Life Safety objective,
according to FEMA, but the same process conducted here can be applied to evaluate a
higher level of performance. The office of the chief engineer for the Board of Public
Services in St. Louis provided copies of original drawings for two local firehouses, as
well as the drawings for any improvements made since their original construction. In
addition to obtaining the drawings, a sight inspection and guided tour of each building
was performed. Although firehouses have some characteristics specific to their function,
such as large wall openings for overhead doors in the first story, the details of the
structures have a number of similarities with the many URM structures in the Central
and Eastern United States. Therefore, the case studies provide insight into the seismic
performance and rehabilitation needs for other similar URM buildings.
3.2 CASE STUDY BUILDING 1
3.2.1 General Description
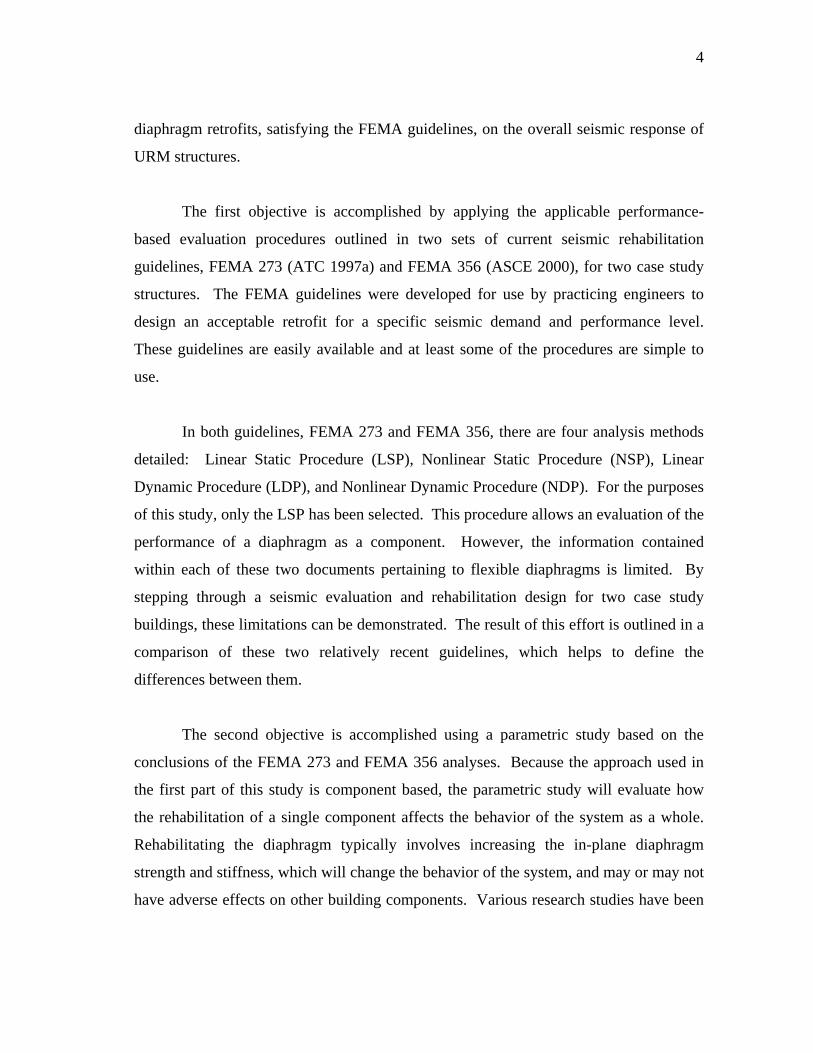
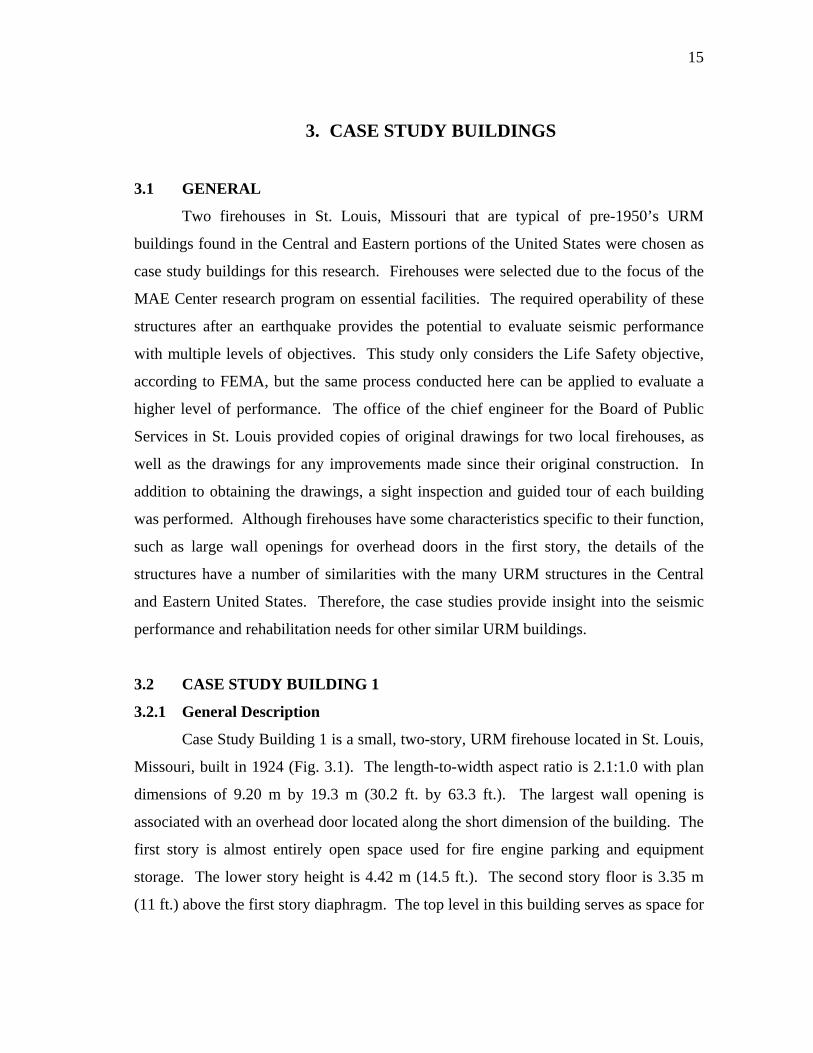
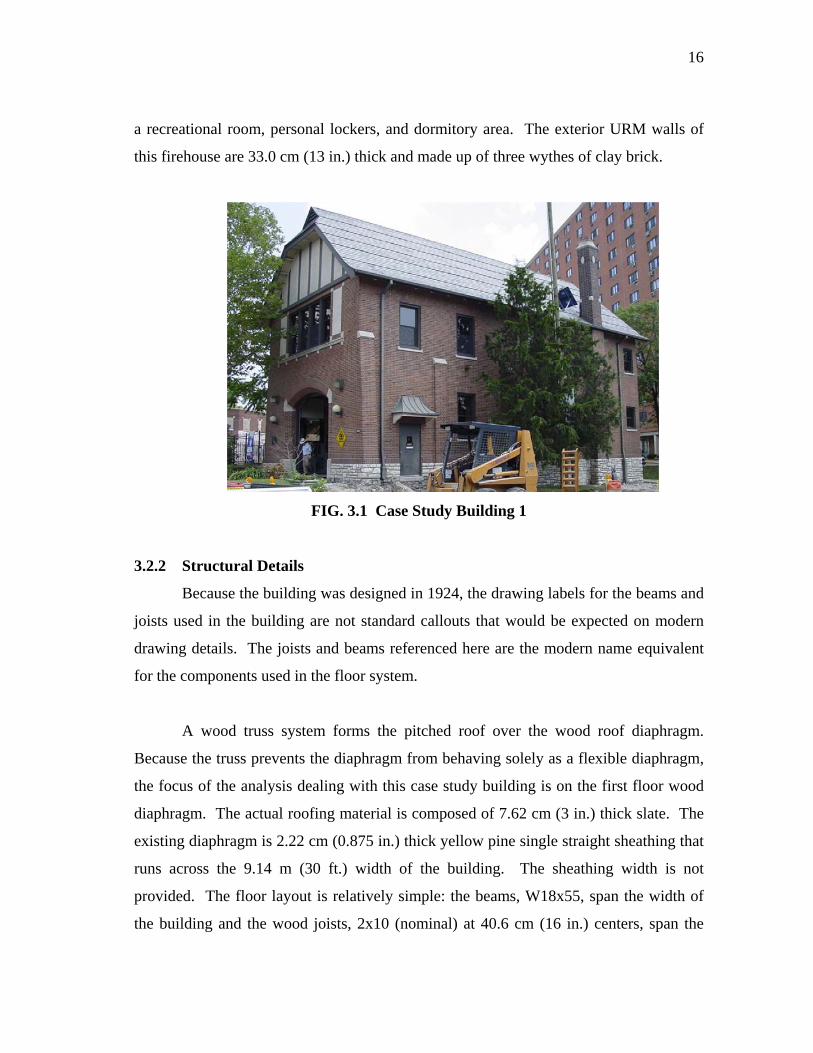
Case Study Building 1 is a small, two-story, URM firehouse located in St. Louis,
Missouri, built in 1924 (Fig. 3.1). The length-to-width aspect ratio is 2.1:1.0 with plan
dimensions of 9.20 m by 19.3 m (30.2 ft. by 63.3 ft.). The largest wall opening is
associated with an overhead door located along the short dimension of the building. The
first story is almost entirely open space used for fire engine parking and equipment
storage. The lower story height is 4.42 m (14.5 ft.). The second story floor is 3.35 m
(11 ft.) above the first story diaphragm. The top level in this building serves as space for
16
a recreational room, personal lockers, and dormitory area. The exterior URM walls of
this firehouse are 33.0 cm (13 in.) thick and made up of three wythes of clay brick.
FIG. 3.1 Case Study Building 1
3.2.2 Structural Details
Because the building was designed in 1924, the drawing labels for the beams and
joists used in the building are not standard callouts that would be expected on modern
drawing details. The joists and beams referenced here are the modern name equivalent
for the components used in the floor system.
A wood truss system forms the pitched roof over the wood roof diaphragm.
Because the truss prevents the diaphragm from behaving solely as a flexible diaphragm,
the focus of the analysis dealing with this case study building is on the first floor wood
diaphragm. The actual roofing material is composed of 7.62 cm (3 in.) thick slate. The
existing diaphragm is 2.22 cm (0.875 in.) thick yellow pine single straight sheathing that
runs across the 9.14 m (30 ft.) width of the building. The sheathing width is not
provided. The floor layout is relatively simple: the beams, W18x55, span the width of
the building and the wood joists, 2x10 (nominal) at 40.6 cm (16 in.) centers, span the
17
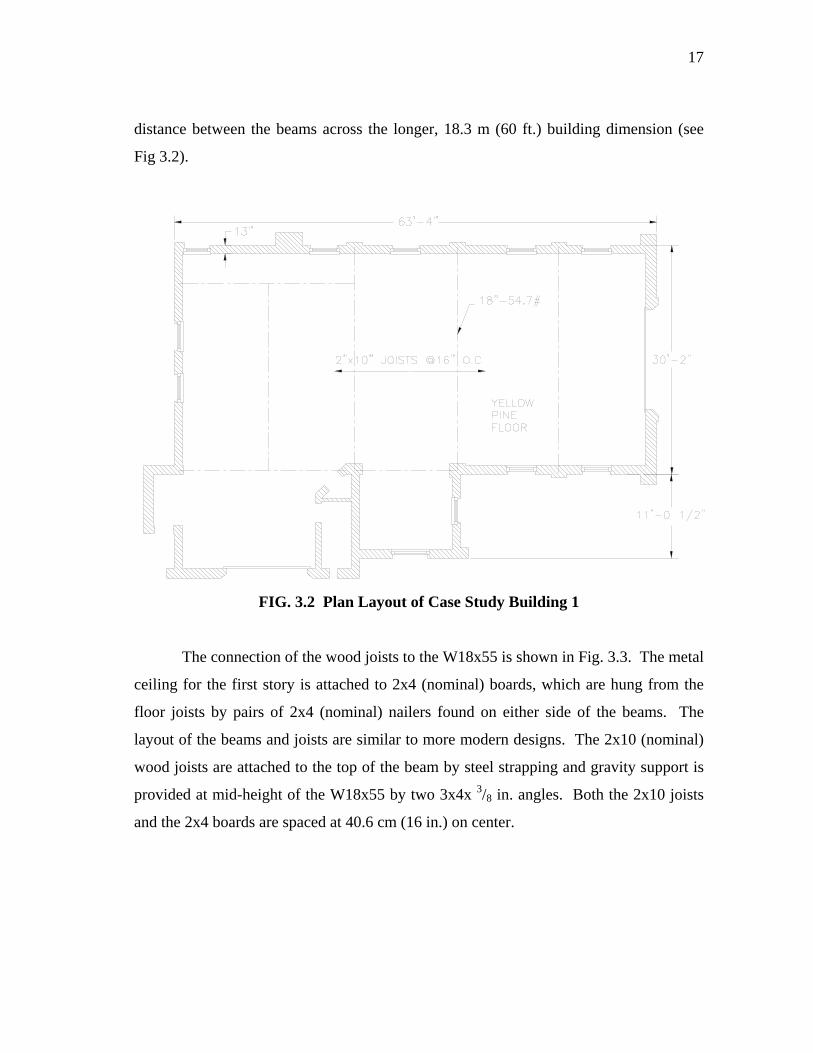
distance between the beams across the longer, 18.3 m (60 ft.) building dimension (see
Fig 3.2).
FIG. 3.2 Plan Layout of Case Study Building 1
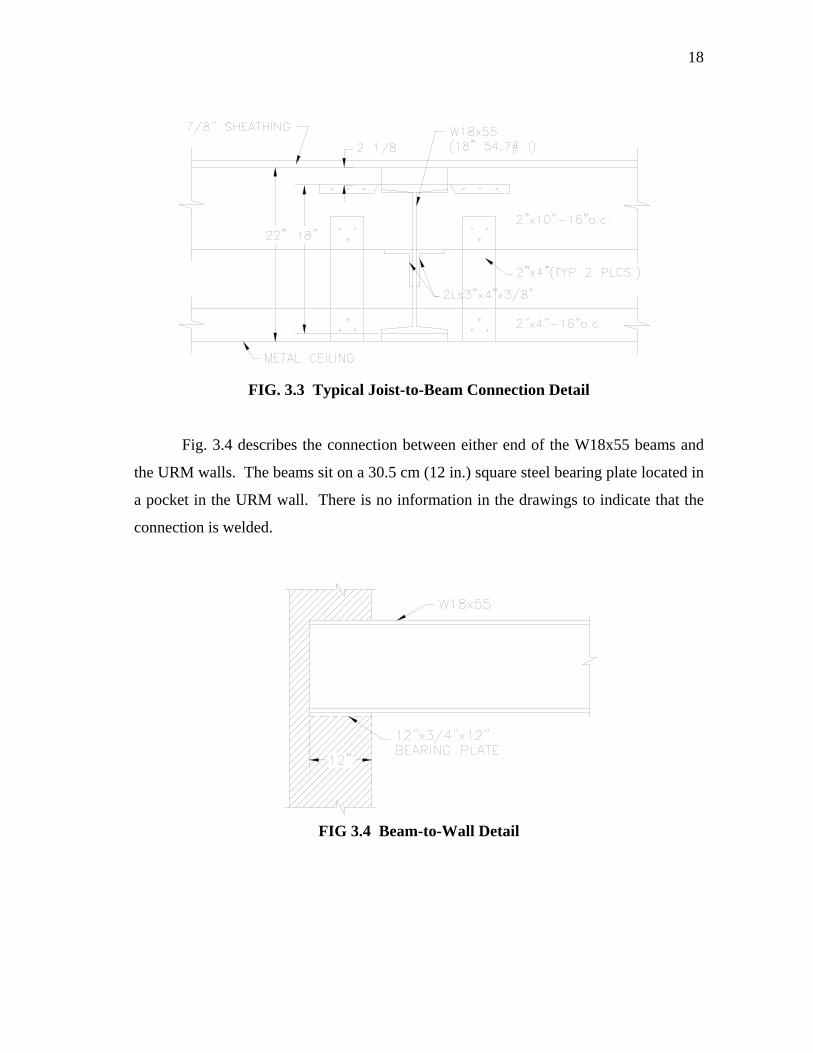
The connection of the wood joists to the W18x55 is shown in Fig. 3.3. The metal
ceiling for the first story is attached to 2x4 (nominal) boards, which are hung from the
floor joists by pairs of 2x4 (nominal) nailers found on either side of the beams. The
layout of the beams and joists are similar to more modern designs. The 2x10 (nominal)
wood joists are attached to the top of the beam by steel strapping and gravity support is
provided at mid-height of the W18x55 by two 3x4x 3/8 in. angles. Both the 2x10 joists
and the 2x4 boards are spaced at 40.6 cm (16 in.) on center.
18
FIG. 3.3 Typical Joist-to-Beam Connection Detail
Fig. 3.4 describes the connection between either end of the W18x55 beams and
the URM walls. The beams sit on a 30.5 cm (12 in.) square steel bearing plate located in
a pocket in the URM wall. There is no information in the drawings to indicate that the
connection is welded.
FIG 3.4 Beam-to-Wall Detail
19
3.3 CASE STUDY BUILDING 2
3.3.1 General Description
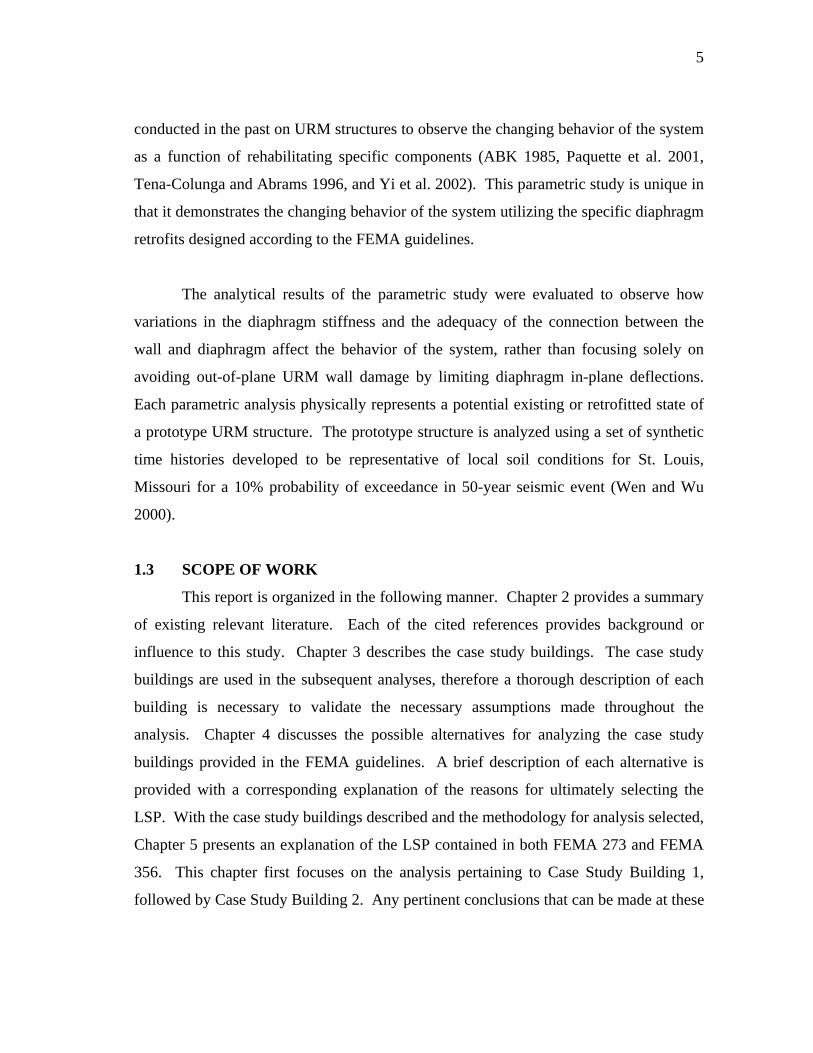
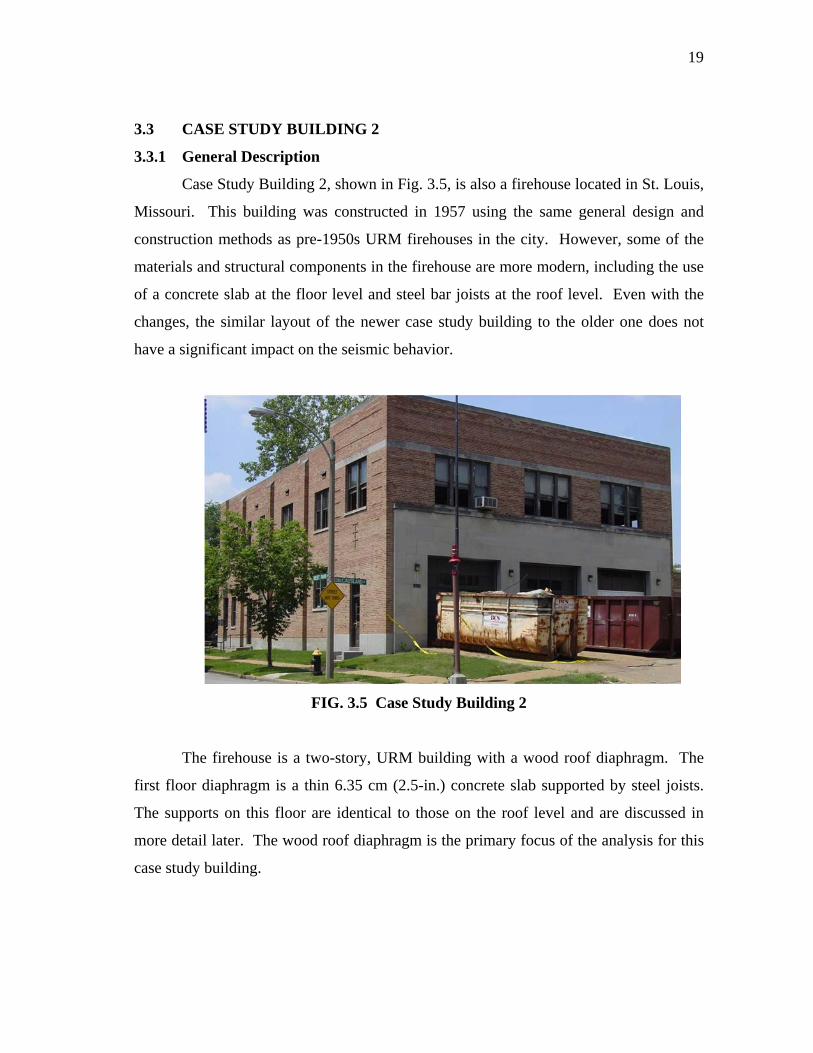
Case Study Building 2, shown in Fig. 3.5, is also a firehouse located in St. Louis,
Missouri. This building was constructed in 1957 using the same general design and
construction methods as pre-1950s URM firehouses in the city. However, some of the
materials and structural components in the firehouse are more modern, including the use
of a concrete slab at the floor level and steel bar joists at the roof level. Even with the
changes, the similar layout of the newer case study building to the older one does not
have a significant impact on the seismic behavior.
FIG. 3.5 Case Study Building 2
The firehouse is a two-story, URM building with a wood roof diaphragm. The
first floor diaphragm is a thin 6.35 cm (2.5-in.) concrete slab supported by steel joists.
The supports on this floor are identical to those on the roof level and are discussed in
more detail later. The wood roof diaphragm is the primary focus of the analysis for this
case study building.
20
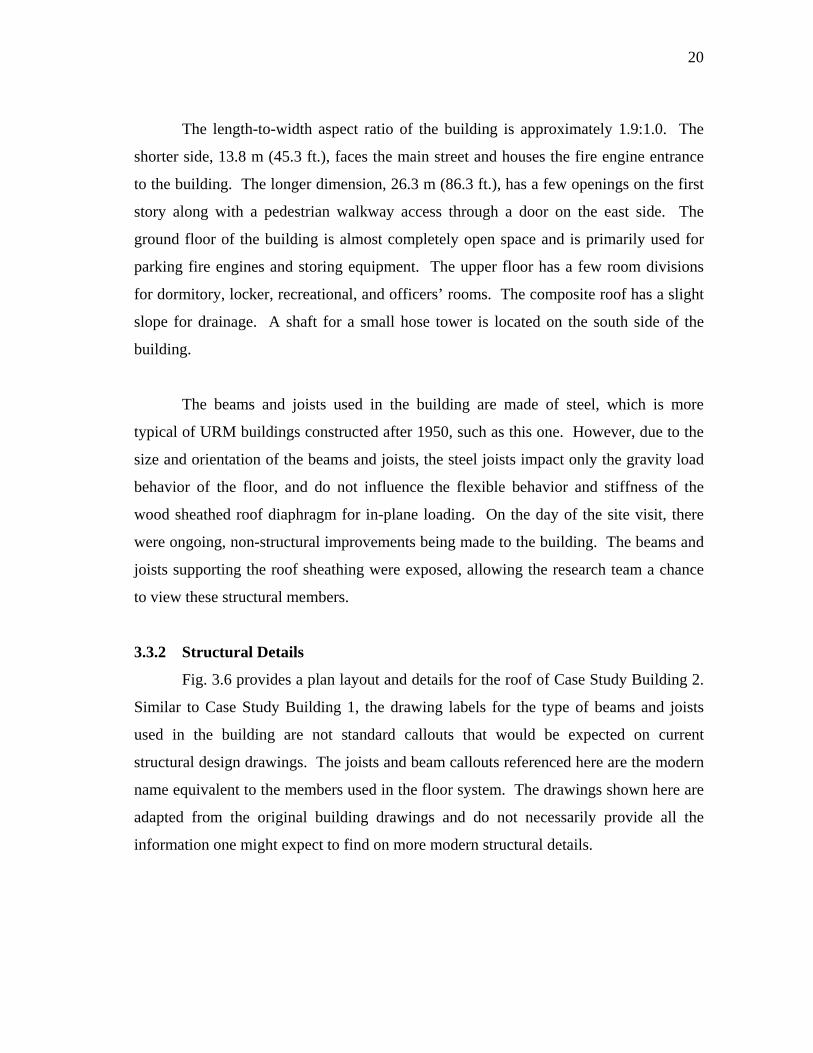
The length-to-width aspect ratio of the building is approximately 1.9:1.0. The
shorter side, 13.8 m (45.3 ft.), faces the main street and houses the fire engine entrance
to the building. The longer dimension, 26.3 m (86.3 ft.), has a few openings on the first
story along with a pedestrian walkway access through a door on the east side. The
ground floor of the building is almost completely open space and is primarily used for
parking fire engines and storing equipment. The upper floor has a few room divisions
for dormitory, locker, recreational, and officers’ rooms. The composite roof has a slight
slope for drainage. A shaft for a small hose tower is located on the south side of the
building.
The beams and joists used in the building are made of steel, which is more
typical of URM buildings constructed after 1950, such as this one. However, due to the
size and orientation of the beams and joists, the steel joists impact only the gravity load
behavior of the floor, and do not influence the flexible behavior and stiffness of the
wood sheathed roof diaphragm for in-plane loading. On the day of the site visit, there
were ongoing, non-structural improvements being made to the building. The beams and
joists supporting the roof sheathing were exposed, allowing the research team a chance
to view these structural members.
3.3.2 Structural Details
Fig. 3.6 provides a plan layout and details for the roof of Case Study Building 2.
Similar to Case Study Building 1, the drawing labels for the type of beams and joists
used in the building are not standard callouts that would be expected on current
structural design drawings. The joists and beam callouts referenced here are the modern
name equivalent to the members used in the floor system. The drawings shown here are
adapted from the original building drawings and do not necessarily provide all the
information one might expect to find on more modern structural details.
21
The URM walls are three wythes of clay brick and approximately 31.8 cm
(l2.5 in.) thick. The story heights are only slightly different from one another: the first
story height is 38.1 m (15.8 ft.) and the second story height is 4.51 m (14.8 ft.).
The main beams span the short dimension of the building. The first floor beams
range in size from W36x150 to W36x182, but the roof beams are all W27x94. Simple
joists, W10x54 (SJ 102), are spaced 51 cm (20 in.) on centers and span the distance
between the beams. Thus, the joists are parallel to the long direction of the building
(see Fig. 3.6).
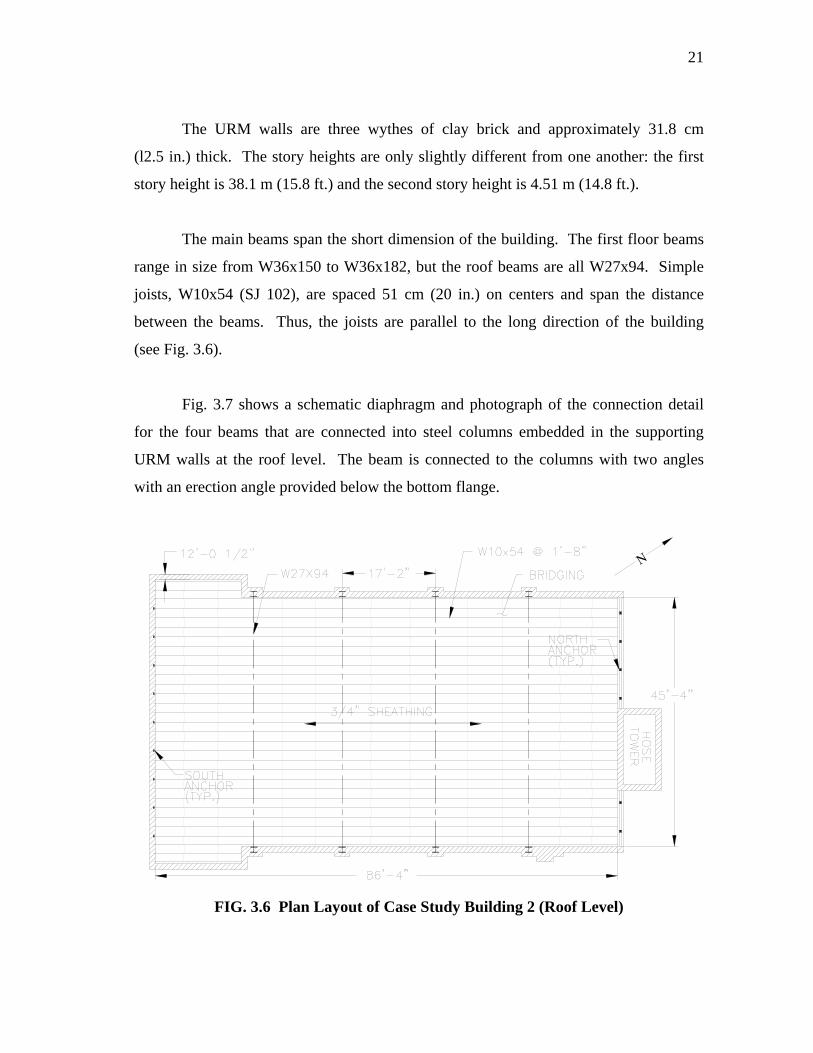
Fig. 3.7 shows a schematic diaphragm and photograph of the connection detail
for the four beams that are connected into steel columns embedded in the supporting
URM walls at the roof level. The beam is connected to the columns with two angles
with an erection angle provided below the bottom flange.
N
FIG. 3.6 Plan Layout of Case Study Building 2 (Roof Level)
22
(a) Schematic Diagram (b) Photograph
FIG. 3.7 Masonry Wall-to-Beam Connection at Roof Level
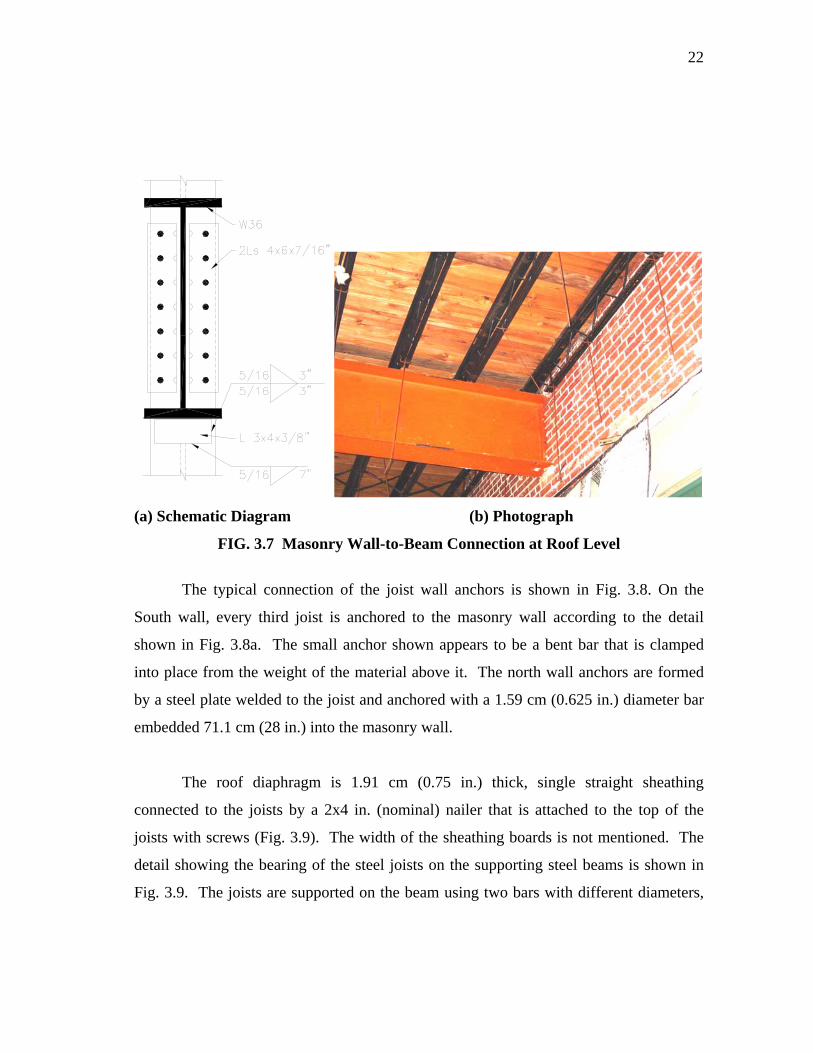
The typical connection of the joist wall anchors is shown in Fig. 3.8. On the
South wall, every third joist is anchored to the masonry wall according to the detail
shown in Fig. 3.8a. The small anchor shown appears to be a bent bar that is clamped
into place from the weight of the material above it. The north wall anchors are formed
by a steel plate welded to the joist and anchored with a 1.59 cm (0.625 in.) diameter bar
embedded 71.1 cm (28 in.) into the masonry wall.
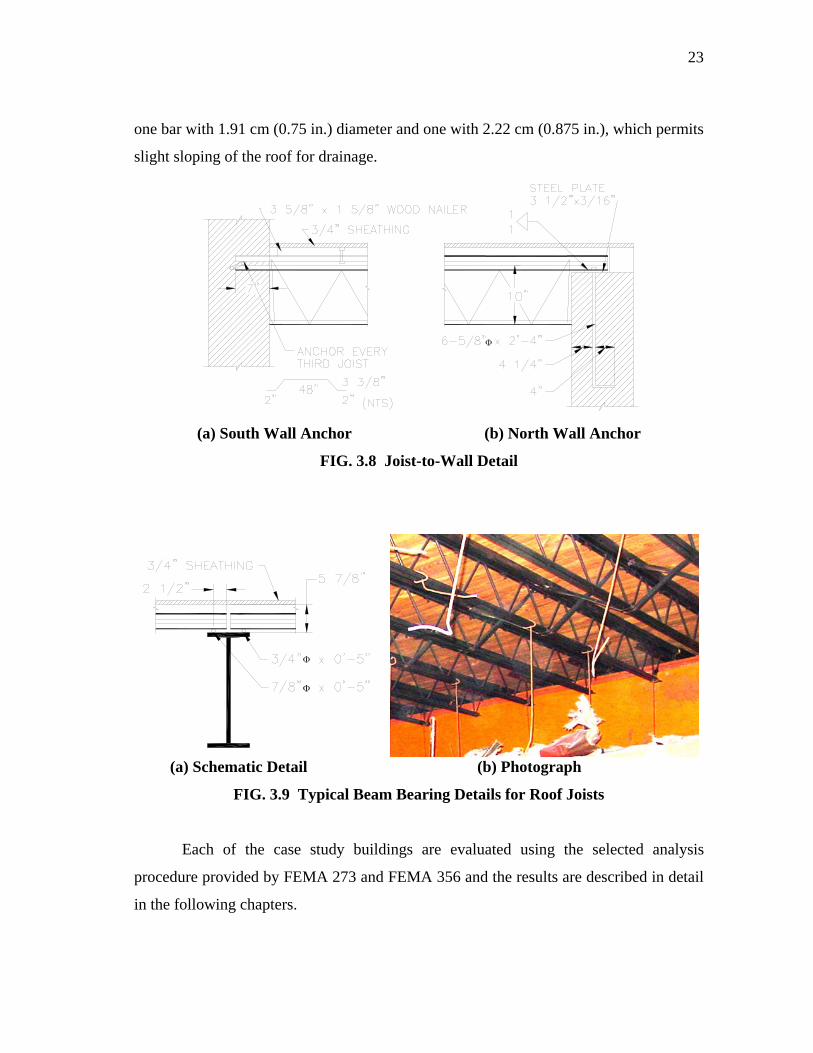
The roof diaphragm is 1.91 cm (0.75 in.) thick, single straight sheathing
connected to the joists by a 2x4 in. (nominal) nailer that is attached to the top of the
joists with screws (Fig. 3.9). The width of the sheathing boards is not mentioned. The
detail showing the bearing of the steel joists on the supporting steel beams is shown in
Fig. 3.9. The joists are supported on the beam using two bars with different diameters,
23
one bar with 1.91 cm (0.75 in.) diameter and one with 2.22 cm (0.875 in.), which permits
slight sloping of the roof for drainage.
(a) South Wall Anchor (b) North Wall Anchor
FIG. 3.8 Joist-to-Wall Detail
(a) Schematic Detail (b) Photograph
FIG. 3.9 Typical Beam Bearing Details for Roof Joists
Each of the case study buildings are evaluated using the selected analysis
procedure provided by FEMA 273 and FEMA 356 and the results are described in detail
in the following chapters.

25
4. FEMA SEISMIC REHABILITATION GUIDELINES
4.1 GENERAL
To assess the adequacy of the wood diaphragms in the case study buildings, two
seismic rehabilitation guidelines were selected: the NEHRP Guidelines for Seismic
Rehabilitation of Buildings (FEMA 273) (ATC 1997a), and the more recent NEHRP
Prestandard and Commentary for Seismic Rehabilitation of Buildings (FEMA 356)
(ASCE 2000). These guidelines provide analytical procedures and guidelines for the
seismic rehabilitation of existing buildings. There are four analysis procedures provided
in both FEMA 273 and FEMA 356: (1) the Linear Static Procedure (LSP); (2) the
Nonlinear Static Procedure (NSP); (3) the Linear Dynamic Procedure (LDP); and (4) the
Nonlinear Dynamic Procedure (NDP).
The scope of the case study building evaluation is limited to applying the
FEMA guidelines to the wood diaphragms. In general, FEMA 356 is a revised and
updated version of FEMA 273. FEMA 273 is accompanied by a companion document
containing the relevant commentary, FEMA 274, whereas FEMA 356 is a combined
standard and commentary. The two sets of guidelines contain few, but potentially
critical, differences for the evaluation of existing buildings. FEMA 356 contains a few
more specific discussions for URM buildings, which will be described later in more
detail.
The following sections briefly discuss the four analysis procedures provided in
FEMA 273 and FEMA 356 in the context of applying these methods to the case study
building diaphragms. However, the LSP is the only procedure that was used in this
study to evaluate the case study buildings. This procedure permits a component
evaluation of the diaphragms without requiring a URM wall model, as discussed in the
following sections.
26
4.2 LINEAR STATIC PROCEDURE (LSP)
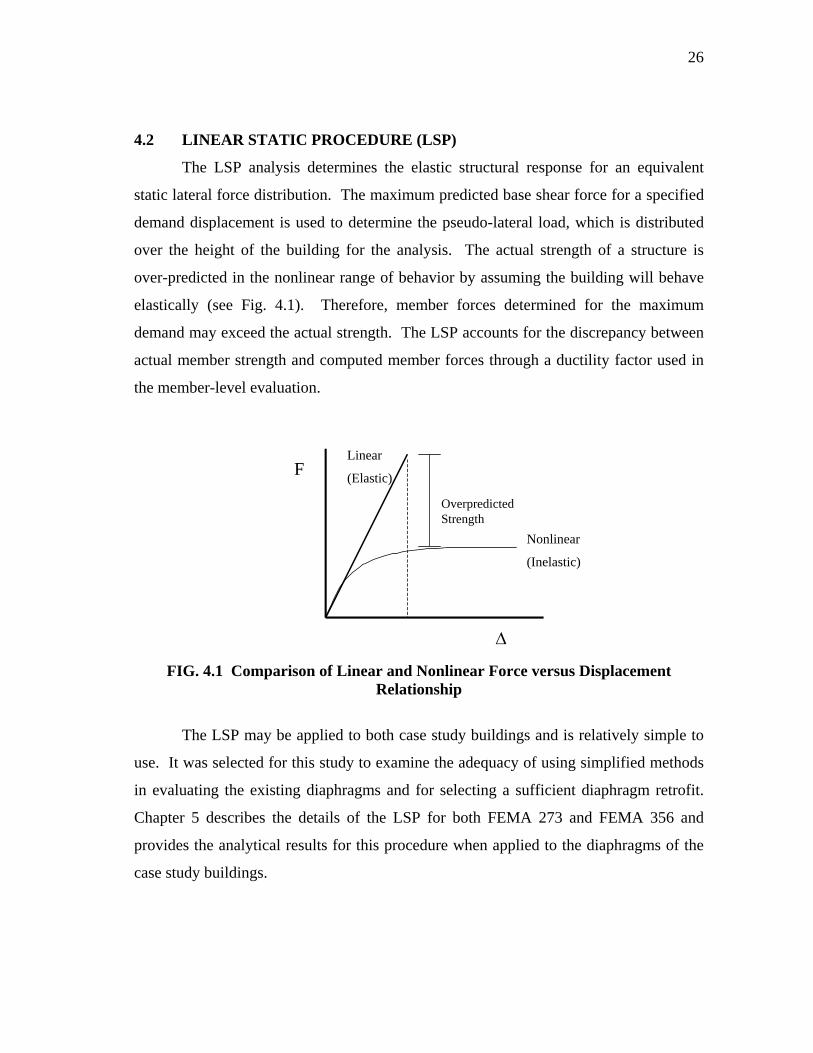
The LSP analysis determines the elastic structural response for an equivalent
static lateral force distribution. The maximum predicted base shear force for a specified
demand displacement is used to determine the pseudo-lateral load, which is distributed
over the height of the building for the analysis. The actual strength of a structure is
over-predicted in the nonlinear range of behavior by assuming the building will behave
elastically (see Fig. 4.1). Therefore, member forces determined for the maximum
demand may exceed the actual strength. The LSP accounts for the discrepancy between
actual member strength and computed member forces through a ductility factor used in
the member-level evaluation.
∆
F
Overpredicted Strength
∆y FIG. 4.1 Comparison of Linear and Nonlinear Force versus Displacement
Relationship
The LSP may be applied to both case study buildings and is relatively simple to
use. It was selected for this study to examine the adequacy of using simplified methods
in evaluating the existing diaphragms and for selecting a sufficient diaphragm retrofit.
Chapter 5 describes the details of the LSP for both FEMA 273 and FEMA 356 and
provides the analytical results for this procedure when applied to the diaphragms of the
case study buildings.
Linear
(Elastic)
Nonlinear
(Inelastic)
27
4.3 NONLINEAR STATIC PROCEDURE
4.3.1 General
The NSP is the second of the two static methods available in the FEMA
guidelines. The NSP involves computing the member forces for a structure at a target
lateral displacement. The target displacement is intended to be equivalent to the
maximum displacement during the design earthquake when considering inelastic
material behavior. The fundamental idea is to monotonically increase loading on a
representative building model, using a nonlinear push-over analysis, until the
predetermined target displacement has been reached. The corresponding internal forces
and deformations are determined. The computed forces are thought to provide
reasonable approximations of the internal forces that would develop during the design
earthquake.
4.3.2 Applicability of NSP Analysis
According to both FEMA guidelines, nonlinear analysis procedures should be
applied when the linear procedures are deemed inapplicable. Additionally, the NSP is
permitted when higher mode effects are not significant. Higher mode effects are
classified as significant when the story shear in any story which is required to obtain
90% mass participation exceeds the story shear in the first mode by more than 130%. If
higher mode effects are significant, the NSP is still applicable if the LDP is used as a
supplement. The higher mode effects in URM structures similar to the case study
buildings were investigated using SAP 2000 (CSI 1999) with the model described in
Chapter 7. The story shears in the analysis do not exceed the limitations for the NSP,
therefore the higher mode effects were deemed insignificant and the NSP is applicable
for the case study buildings.
The NSP is permitted for the following rehabilitation objectives: (1) local
modification of existing components, (2) removal or lessening existing irregularities,
(3) global structural stiffening, (4) mass reduction, or (5) seismic isolation. The selected
28
rehabilitation objective for the case study buildings is to locally modify the existing
diaphragm as a structural component. Thus, the nonlinear static procedure is applicable
for the two case study buildings because the rehabilitation objective is permitted and
higher mode effects are not significant.
4.3.3 Description of NSP Analysis
As stated previously, the NSP is based on deforming the structure to a target
displacement. The target displacement, δt, requires the specification of a control node in
the building of interest. The control node, by definition, is located at the center of mass
at the roof level of the building, excluding penthouses. Additionally, if the building
contains multiple flexible diaphragms, a control node and target displacement should be
determined for each line of vertical seismic framing. Lateral forces are applied
monotonically until this control node exceeds the target displacement. The manner in
which the lateral forces may be applied are also described in the FEMA guidelines.
Determining the target displacement is an iterative procedure. Many of the
factors in the calculation of the target displacement, δt, are derived from the results of the
nonlinear push-over curve developed for a particular building. The sequence shown in
Eqs. 4.1 through 4.3 (ATC 1997a) is the FEMA 273 recommended procedure for
determining δt, which is established by the following relationship. FEMA 356 has slight
differences in some of the equations below but undergoes the same iterative process.
2
0 1 2 3 24e
t aTC C C C S gδπ
= (4.1)
where: Te = Effective fundamental period of the building (s) C0 = Factor relating spectral and roof displacement (1.2 for a two-story
building) C1 = Factor relating expected maximum inelastic displacements to
displacements calculated for linear elastic response, based on the relationship between Te, R and To
29
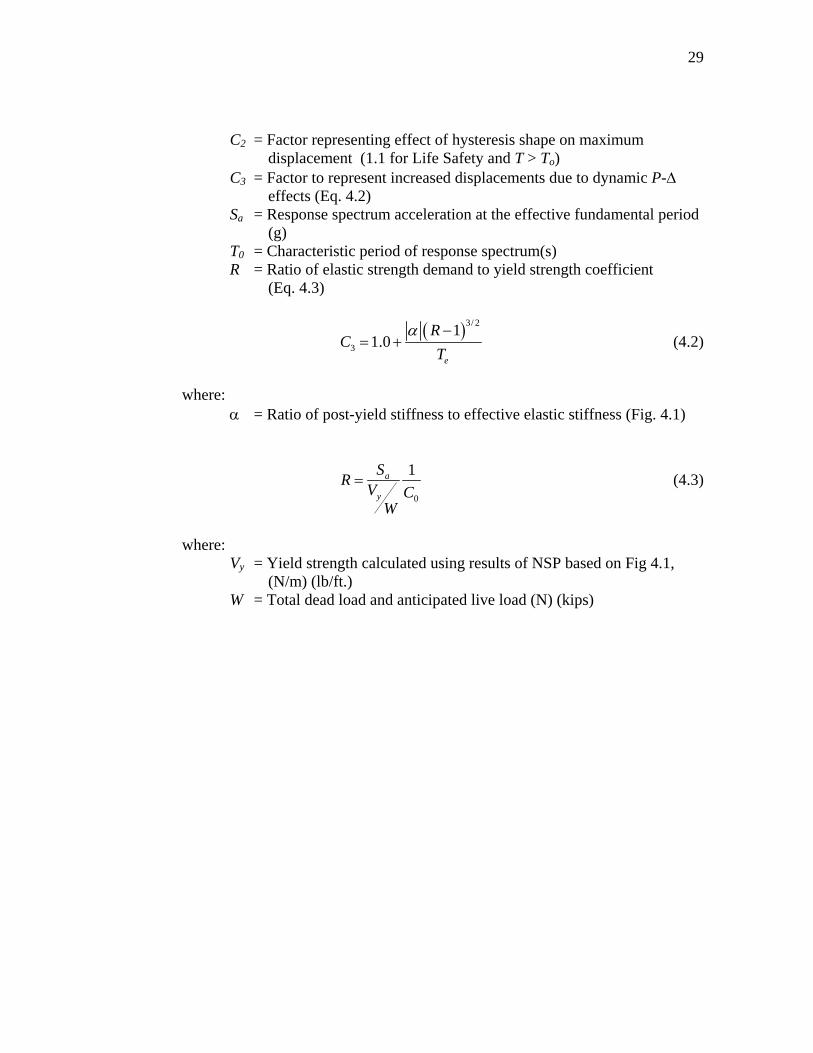
C2 = Factor representing effect of hysteresis shape on maximum displacement (1.1 for Life Safety and T > To)
C3 = Factor to represent increased displacements due to dynamic P-∆ effects (Eq. 4.2)
Sa = Response spectrum acceleration at the effective fundamental period (g)
T0 = Characteristic period of response spectrum(s) R = Ratio of elastic strength demand to yield strength coefficient
(Eq. 4.3)
( )3/ 2
3
11.0
e
RC
Tα −
= + (4.2)
where: α = Ratio of post-yield stiffness to effective elastic stiffness (Fig. 4.1)
0
1a
y
SR V CW
= (4.3)
where: Vy = Yield strength calculated using results of NSP based on Fig 4.1,
(N/m) (lb/ft.) W = Total dead load and anticipated live load (N) (kips)
30
δy δt
VyB
ase
Shea
r
0.6Vy
Roof Displacement
αKe
Ke
Ki
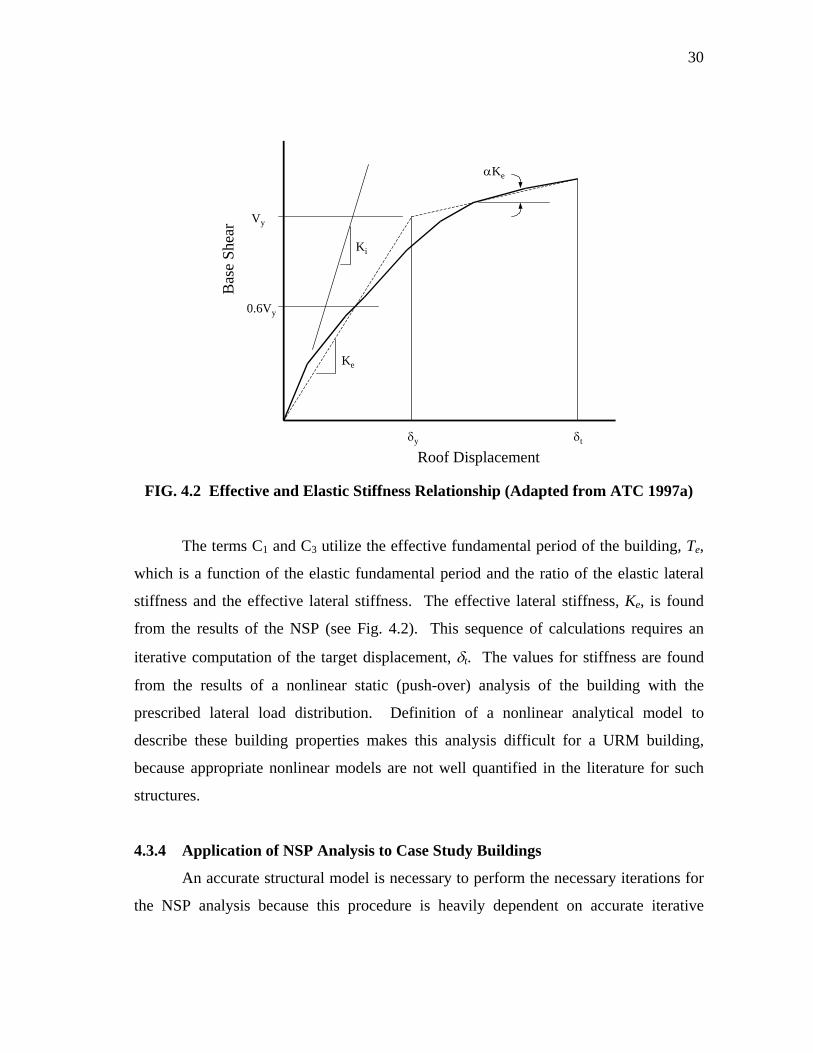
FIG. 4.2 Effective and Elastic Stiffness Relationship (Adapted from ATC 1997a)
The terms C1 and C3 utilize the effective fundamental period of the building, Te,
which is a function of the elastic fundamental period and the ratio of the elastic lateral
stiffness and the effective lateral stiffness. The effective lateral stiffness, Ke, is found
from the results of the NSP (see Fig. 4.2). This sequence of calculations requires an
iterative computation of the target displacement, δt. The values for stiffness are found
from the results of a nonlinear static (push-over) analysis of the building with the
prescribed lateral load distribution. Definition of a nonlinear analytical model to
describe these building properties makes this analysis difficult for a URM building,
because appropriate nonlinear models are not well quantified in the literature for such
structures.
4.3.4 Application of NSP Analysis to Case Study Buildings
An accurate structural model is necessary to perform the necessary iterations for
the NSP analysis because this procedure is heavily dependent on accurate iterative
31
results. Although a reasonably accurate building model can be developed for a
reinforced concrete or steel building, based on current knowledge and analytical tools,
this is not the case for URM structures. A simple model can be simulated similar to that
of the spring model shown previously in Fig. 2.2. However, creating a finite-element
model containing nonlinear properties that accurately predict damage mechanisms in the
URM walls is a complex task and would require simplifying assumptions. Thus, a
model may be produced to approximate the performance that a URM structure may have
under monotonic lateral loading, but the possible inconsistencies that can come from
individuals making modeling assumptions based on limited information makes this
procedure less desirable for evaluating URM structures. Because the focus of this study
was on the diaphragm components, the necessity of modeling the entire structure using a
nonlinear model to determine the target displacement made the NSP less desirable for
this evaluation.
4.4 DYNAMIC PROCEDURES
The LDP is developed based on the same premise for predicting strength and
displacement criteria as the LSP, but instead utilizes a time-history analysis to calculate
the response of the building. As in the LSP, the outcome of this analysis are
representative displacements for the building under the design earthquake, but the
internal forces may be overestimated because nonlinear behavior is not included. Like
the NSP, the LDP requires an accurate analytical representation for a URM building,
although elastic models may be used for the LDP. While an elastic model can be
created, this representation is limited in that the nonlinear structural behavior is not
included.
The NDP is applicable for the same building types as the NSP and utilizes time
history analysis for the response computation like the LDP. Ultimately, the NDP
contains the same limitation as the NSP. It is difficult to develop a model of an URM
building that accurately predicts the dynamic structural response into the nonlinear range
32
of behavior. Therefore, the LSP was chosen for use in evaluating the case study building
wood diaphragms as components of the structural system. This approach uses a
relatively simple modeling and analytical procedure to determine the adequacy of the
diaphragms and to assess the need for rehabilitation.
33
5. LINEAR STATIC PROCEDURE
5.1 GENERAL
The Linear Static Procedure (LSP) uses a pseudo-lateral load applied over the height of
the building to approximate the maximum displacements during a design earthquake
using an elastic analysis. If a building behaves elastically during an earthquake, then the
actual demands that develop may be predicted by an elastic analysis. If the design
earthquake causes the building to behave inelastically, then the elastic analysis over-
predicts the force demands but is assumed to give a reasonable estimate of the lateral
displacements. The LSPs described in both the FEMA 273 and FEMA 356 guidelines
were used to evaluate the wood diaphragms in the case study buildings. Detailed
calculations for both case study buildings, including calculations for retrofit options, are
provided in Appendices A thru E.
5.2 LINEAR STATIC PROCEDURE USING FEMA 273
5.2.1 Applicability of Linear Procedures
The LSP contained in FEMA 273 is applicable for building rehabilitation as long
as the building of interest meets the demand-to-capacity ratio (DCR) requirements.
These requirements state the LSP may be used for any building as long as the demand,
as calculated by the linear procedure, is no more than twice the expected strength of the
component, regardless of regularity. This comparison is made for each component in the
rehabilitated building. If all components meet the criteria, then any of the linear
procedures are applicable. It is important to note that these ratios are only used to
determine the applicability of these procedures and not to determine the acceptability of
a component’s behavior. If the DCR exceeds 2.0, the linear procedures no longer apply
if any of the following irregularities are present: in-plane or out-of-plane discontinuities
in any primary element of the lateral-force-resisting system, severe weak story
irregularity, or torsional strength irregularity.
34
Additional criteria must be met for the LSP to be applicable: (1) the total
building height must be less than or equal to 30.5 m (100 ft.), (2) the ratio of the
horizontal dimension from one story to the next must be less than 1.4, (3) the lateral drift
along any side of the structure may not exceed 150% of the average story drift, and
(4) the building must have an orthogonal lateral force resisting system. However, the
required demand of a component cannot be determined until the LSP analysis is
complete. Therefore, the applicability of the FEMA 273 LSP analysis can only be
determined at the end of the analysis for this procedure.
5.2.2 Details of Linear Static Procedure
FEMA 273 suggests that the building under consideration satisfy the
performance objectives of a specific seismic demand. The event must meet the
following criteria: a BSE-1 earthquake event with a magnitude equal to the smaller of a
10% probability of exceedance in 50-years, or two-thirds of the maximum considered
event, which is defined as 2% probability of exceedance in 50-years, evaluated for a Life
Safety Performance Level. For St. Louis, the earthquake that satisfies these criteria is
the 10% in 50-years earthquake. The St. Louis region most closely fits in Site Class C
for the soil conditions typically found in St. Louis. FEMA defines Class C soils as very
dense soils and soft rock. These designations are used to adjust the mapped spectral
response acceleration parameter. Taking all of this into consideration provides adequate
information to determine the short period, SXS, and one-second, SX1, design response
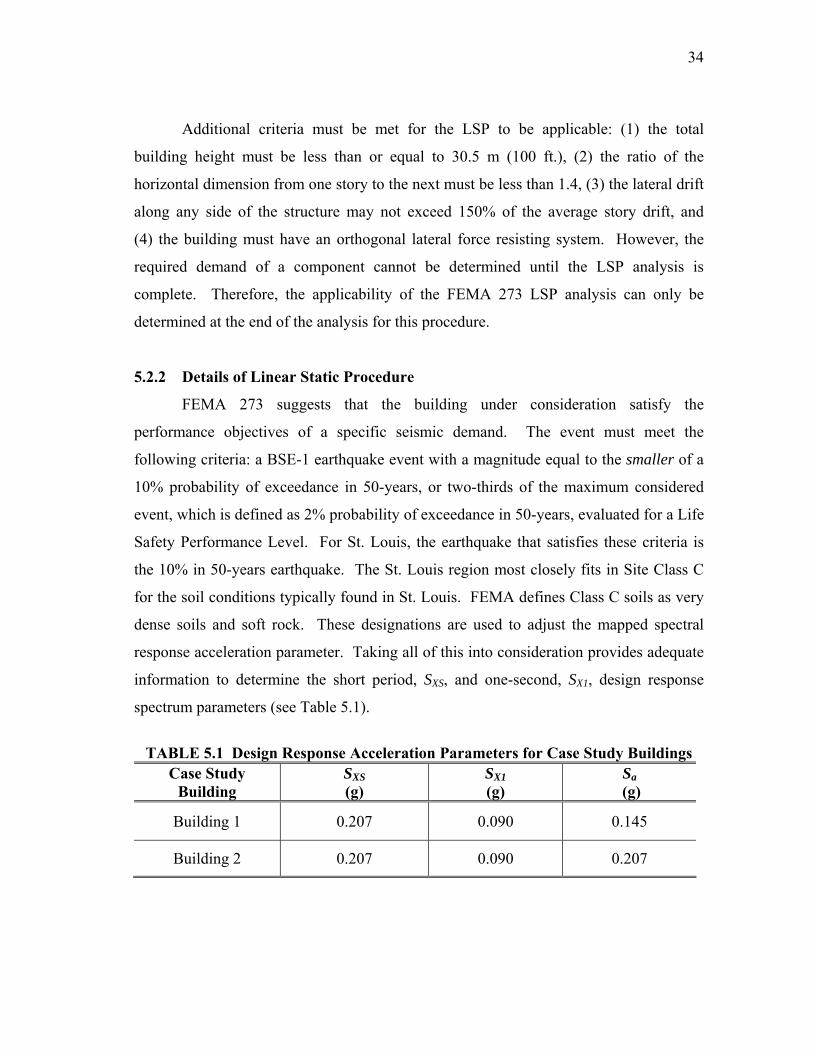
spectrum parameters (see Table 5.1).
TABLE 5.1 Design Response Acceleration Parameters for Case Study Buildings
Case Study Building
SXS (g)
SX1 (g)
Sa (g)
Building 1 0.207 0.090 0.145
Building 2 0.207 0.090 0.207
35
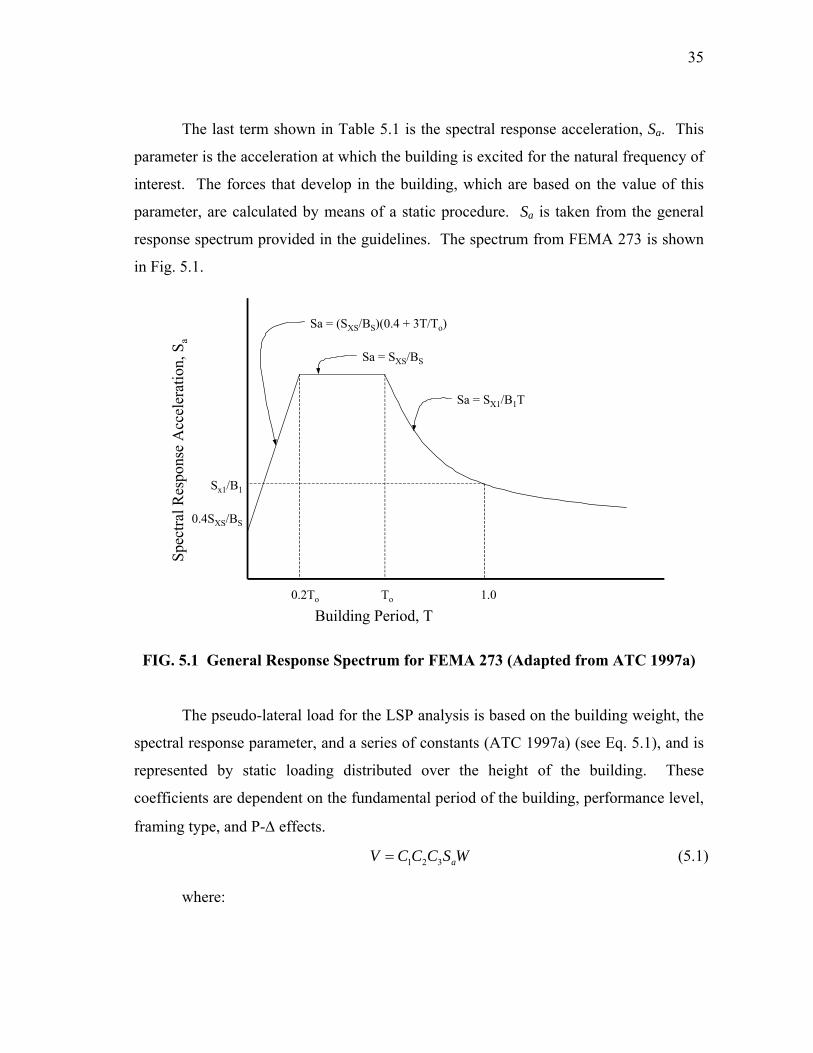
The last term shown in Table 5.1 is the spectral response acceleration, Sa. This
parameter is the acceleration at which the building is excited for the natural frequency of
interest. The forces that develop in the building, which are based on the value of this
parameter, are calculated by means of a static procedure. Sa is taken from the general
response spectrum provided in the guidelines. The spectrum from FEMA 273 is shown
in Fig. 5.1.
0.2To To 1.0
Sx1/B1
Spec
tral R
espo
nse
Acc
eler
atio
n, S
a
0.4SXS/BS
Building Period, T
Sa = (SXS/BS)(0.4 + 3T/To)
Sa = SXS/BS
Sa = SX1/B1T
FIG. 5.1 General Response Spectrum for FEMA 273 (Adapted from ATC 1997a)
The pseudo-lateral load for the LSP analysis is based on the building weight, the
spectral response parameter, and a series of constants (ATC 1997a) (see Eq. 5.1), and is
represented by static loading distributed over the height of the building. These
coefficients are dependent on the fundamental period of the building, performance level,
framing type, and P-∆ effects.
1 2 3 aV C C C S W= (5.1) where:
36
V = Pseudo lateral load equal to the total base shear (N) (kips) Sa = Response spectral acceleration at the fundamental period and
damping ratio of the building in the direction under consideration (m/s2) (ft/s2)
W = Total dead load and anticipated live load (N) (kips) C1 = Modification factor relating maximum inelastic displacements to
those calculated for linear elastic response 1.5 for T < 0.10 s 1.0 for T ≥ To C2 = Modification factor accounting for stiffness and strength
degradation on maximum displacement 1.1 for Framing Type 1, T > To, Life Safety Performance Level C3 = Modification factor representing increased displacements due to
P-∆ effects, 1.0 for θ < 0.1 θ = Indicative of stability of a structure under gravity loads and lateral
deflection induced by earthquakes T = Fundamental period of the building (s) To = Characteristic period of the response spectrum (s)
For simplicity, and to use the two case study buildings to represent generic URM
structures, the wall openings in both buildings were ignored in the determination of the
pseudo-lateral load. For these two case study buildings, P-∆ effects were not significant.
Therefore, the corresponding constant, C3, was set to 1.0 for both cases. Notice that C1
compares the fundamental building response to the characteristic period of the response
spectrum, To. FEMA 273 provides an equation to estimate the fundamental building
period for a one-story building with a single span flexible diaphragm given in Eq. 5.2
(ATC 1997a). The estimated period is dependent on the in-plane wall and diaphragm
displacement created by a lateral load equal to the weight tributary to the diaphragm.
( )0.50.1 W dT = ∆ + ∆ (5.2) where:
T = Fundamental building period (s) ∆w = In-plane wall displacement due to a lateral load equal to the
weight tributary to the diaphragm (cm) (in.) ∆d = Diaphragm midspan displacement due to a lateral load equal to
the weight tributary to the diaphragm (cm) (in.)
37
FEMA 273 also provides an expression to estimate diaphragm displacement,
shown here as Eq. 5.3. (ATC 1997a). The equation is the same for all types of
sheathing, but the guidelines provide different shear stiffness values for the various types
of sheathing. In both case study buildings, the existing diaphragm is composed of single
straight wood sheathing. FEMA 273 assigns a diaphragm shear stiffness of 35,000 N/cm
(200,000 lb/in.) to this type of sheathing.
4
3d
LG bν
∆ = (5.3)
where:
∆ = Calculated diaphragm deflection (cm) (in.) ν = Maximum shear in direction under consideration (kg/m) (lb/ft.) Gd = Diaphragm shear stiffness (kg/cm) (lb/in.) L = Diaphragm span between shear walls (m) (ft.) b = Diaphragm width (m) (ft.)
The shear stiffness, Gd, is actually the in-plane stiffness of the floor diaphragm
equal to the shear modulus times the thickness, t, of the diaphragm (Isoda et al., 2002).
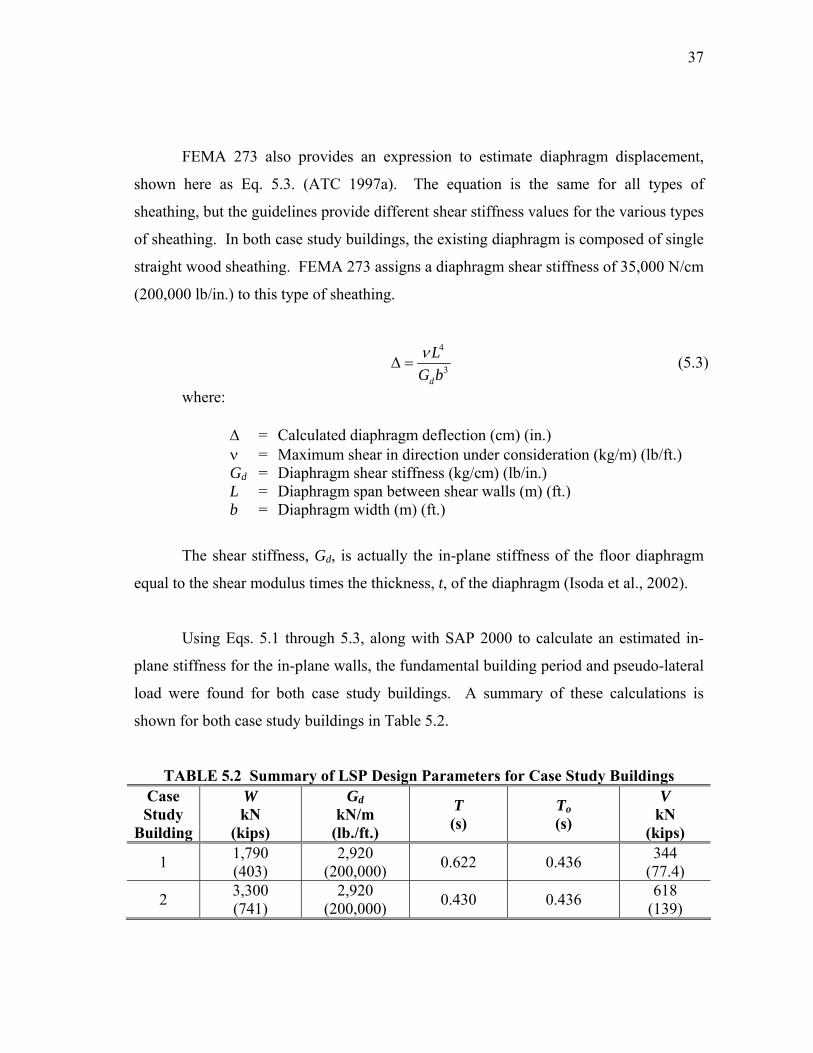
Using Eqs. 5.1 through 5.3, along with SAP 2000 to calculate an estimated in-
plane stiffness for the in-plane walls, the fundamental building period and pseudo-lateral
load were found for both case study buildings. A summary of these calculations is
shown for both case study buildings in Table 5.2.
TABLE 5.2 Summary of LSP Design Parameters for Case Study Buildings Case Study
Building
W kN
(kips)
Gd kN/m
(lb./ft.)
T (s)
To (s)
V kN
(kips)
1 1,790 (403)
2,920 (200,000) 0.622 0.436 344
(77.4)
2 3,300 (741)
2,920 (200,000) 0.430 0.436 618
(139)
38
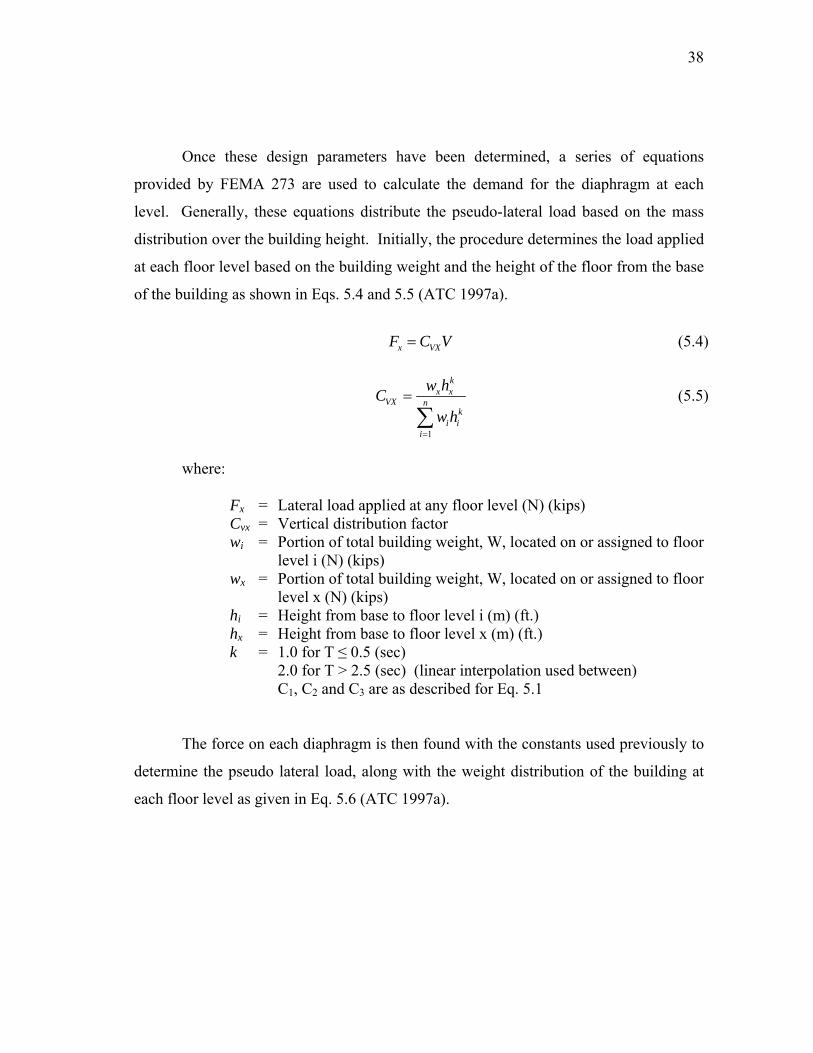
Once these design parameters have been determined, a series of equations
provided by FEMA 273 are used to calculate the demand for the diaphragm at each
level. Generally, these equations distribute the pseudo-lateral load based on the mass
distribution over the building height. Initially, the procedure determines the load applied
at each floor level based on the building weight and the height of the floor from the base
of the building as shown in Eqs. 5.4 and 5.5 (ATC 1997a).
x VXF C V= (5.4)
1
kx x
VX nk
i ii
w hCw h
=
=
∑ (5.5)
where:
Fx = Lateral load applied at any floor level (N) (kips) Cvx = Vertical distribution factor wi = Portion of total building weight, W, located on or assigned to floor
level i (N) (kips) wx = Portion of total building weight, W, located on or assigned to floor
level x (N) (kips) hi = Height from base to floor level i (m) (ft.) hx = Height from base to floor level x (m) (ft.) k = 1.0 for T ≤ 0.5 (sec) 2.0 for T > 2.5 (sec) (linear interpolation used between)
C1, C2 and C3 are as described for Eq. 5.1
The force on each diaphragm is then found with the constants used previously to
determine the pseudo lateral load, along with the weight distribution of the building at
each floor level as given in Eq. 5.6 (ATC 1997a).
39
1 2 3
1 nx
px i ni x
ii x
wF FC C C w=
=
= ∑∑
(5.6)
where:
Fpx = Total diaphragm force at level x (N) (kips)
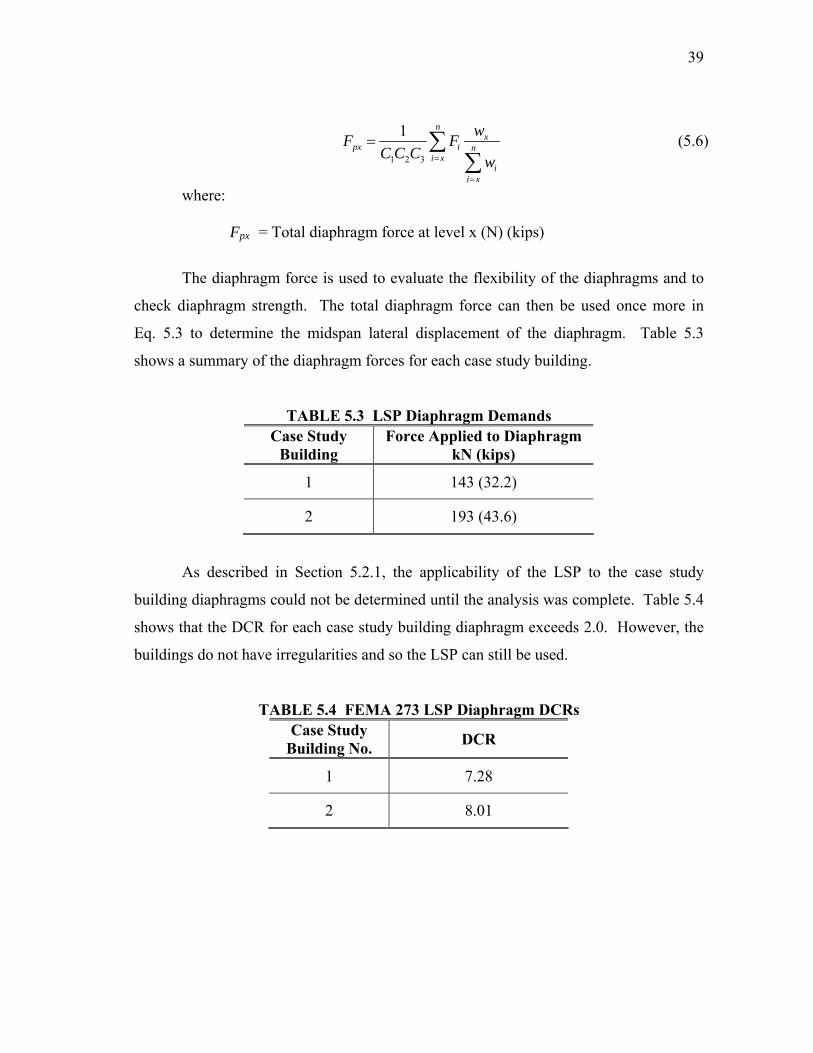
The diaphragm force is used to evaluate the flexibility of the diaphragms and to
check diaphragm strength. The total diaphragm force can then be used once more in
Eq. 5.3 to determine the midspan lateral displacement of the diaphragm. Table 5.3
shows a summary of the diaphragm forces for each case study building.
TABLE 5.3 LSP Diaphragm Demands Case Study
Building Force Applied to Diaphragm
kN (kips)
1 143 (32.2)
2 193 (43.6)
As described in Section 5.2.1, the applicability of the LSP to the case study
building diaphragms could not be determined until the analysis was complete. Table 5.4
shows that the DCR for each case study building diaphragm exceeds 2.0. However, the
buildings do not have irregularities and so the LSP can still be used.
TABLE 5.4 FEMA 273 LSP Diaphragm DCRs Case Study
Building No. DCR
1 7.28
2 8.01
40
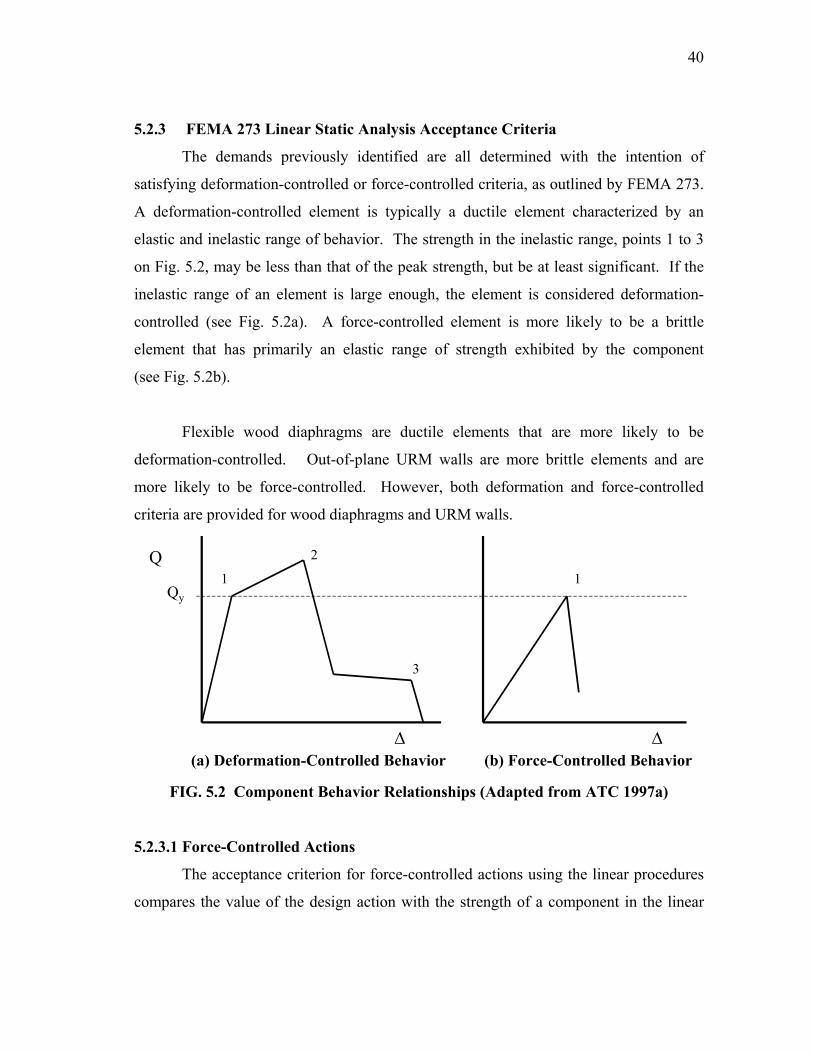
5.2.3 FEMA 273 Linear Static Analysis Acceptance Criteria
The demands previously identified are all determined with the intention of
satisfying deformation-controlled or force-controlled criteria, as outlined by FEMA 273.
A deformation-controlled element is typically a ductile element characterized by an
elastic and inelastic range of behavior. The strength in the inelastic range, points 1 to 3
on Fig. 5.2, may be less than that of the peak strength, but be at least significant. If the
inelastic range of an element is large enough, the element is considered deformation-
controlled (see Fig. 5.2a). A force-controlled element is more likely to be a brittle
element that has primarily an elastic range of strength exhibited by the component
(see Fig. 5.2b).
Flexible wood diaphragms are ductile elements that are more likely to be
deformation-controlled. Out-of-plane URM walls are more brittle elements and are
more likely to be force-controlled. However, both deformation and force-controlled
criteria are provided for wood diaphragms and URM walls.
Qy
∆
1Q 2
3
∆
1
(a) Deformation-Controlled Behavior (b) Force-Controlled Behavior FIG. 5.2 Component Behavior Relationships (Adapted from ATC 1997a)
5.2.3.1 Force-Controlled Actions
The acceptance criterion for force-controlled actions using the linear procedures
compares the value of the design action with the strength of a component in the linear
41
elastic range of behavior. The design action, QUF, is determined based on gravity and
earthquake demands, but the earthquake demand is reduced by the series of constants
used in calculating the pseudo-lateral load (see Eq. 5.7).
1 2 3
EUF G
QQ QC C C
= ± (5.7)
where:
QUF = Design actions due to gravity loads and earthquake loads (N)
(kips) QE = Action due to design earthquake loads calculated using forces in
Eq. 5.6 (N) (kips) QG = Action due to design gravity loads when they counteract or are
additive to seismic loads (N) (kips) C1, C2, C3 as defined in Eq. 5.1
The design action QUF must be less than a knowledge factor times the lower-
bound strength, QCL, of the component of concern, as shown in Eq. 5.8. For this study, a
minimum level of knowledge was assumed in selecting the knowledge factor.
CL UFQ Qκ ≥ (5.8) where:
κ = Knowledge factor (0.75 for minimum level) QCL = Lower-bound strength of a component or element at the
deformation level under consideration (N) (kips)
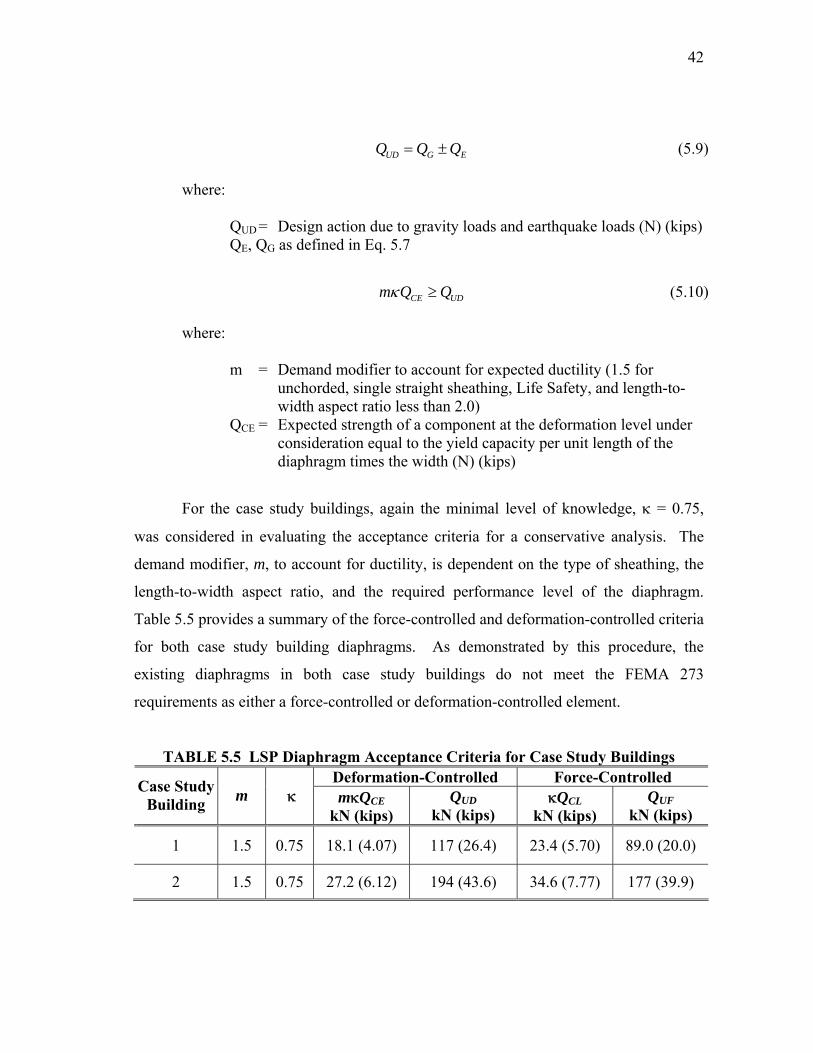
5.2.3.2 Deformation-Controlled Actions
The criteria according to FEMA 273 for deformation-controlled actions using the
linear procedures are as follows: the demands imposed on the diaphragm, QUD calculated
according to Eq. 5.9, must be less than the expected strength of the diaphragms, QCE,
multiplied by two factors to account for knowledge and ductility as shown in Eq. 5.10.
FEMA 273 provides values for both of these factors.
42
UD G EQ Q Q= ± (5.9)
where:
QUD = Design action due to gravity loads and earthquake loads (N) (kips) QE, QG as defined in Eq. 5.7
CE UDm Q Qκ ≥ (5.10)
where:
m = Demand modifier to account for expected ductility (1.5 for unchorded, single straight sheathing, Life Safety, and length-to-width aspect ratio less than 2.0)
QCE = Expected strength of a component at the deformation level under consideration equal to the yield capacity per unit length of the diaphragm times the width (N) (kips)
For the case study buildings, again the minimal level of knowledge, κ = 0.75,
was considered in evaluating the acceptance criteria for a conservative analysis. The
demand modifier, m, to account for ductility, is dependent on the type of sheathing, the
length-to-width aspect ratio, and the required performance level of the diaphragm.
Table 5.5 provides a summary of the force-controlled and deformation-controlled criteria
for both case study building diaphragms. As demonstrated by this procedure, the
existing diaphragms in both case study buildings do not meet the FEMA 273
requirements as either a force-controlled or deformation-controlled element.
TABLE 5.5 LSP Diaphragm Acceptance Criteria for Case Study Buildings Deformation-Controlled Force-Controlled Case Study
Building m κ mκQCE kN (kips)
QUD kN (kips)
κQCL kN (kips)
QUF kN (kips)
1 1.5 0.75 18.1 (4.07) 117 (26.4) 23.4 (5.70) 89.0 (20.0)
2 1.5 0.75 27.2 (6.12) 194 (43.6) 34.6 (7.77) 177 (39.9)
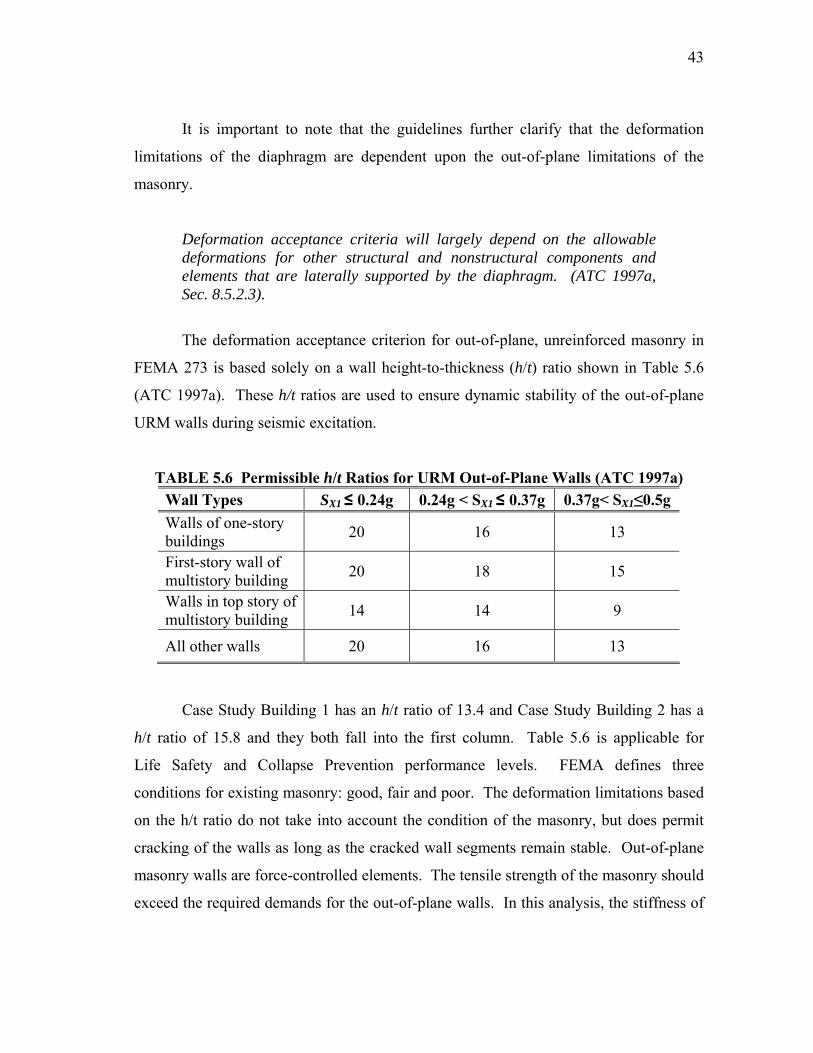
43
It is important to note that the guidelines further clarify that the deformation
limitations of the diaphragm are dependent upon the out-of-plane limitations of the
masonry.
Deformation acceptance criteria will largely depend on the allowable deformations for other structural and nonstructural components and elements that are laterally supported by the diaphragm. (ATC 1997a, Sec. 8.5.2.3).
The deformation acceptance criterion for out-of-plane, unreinforced masonry in
FEMA 273 is based solely on a wall height-to-thickness (h/t) ratio shown in Table 5.6
(ATC 1997a). These h/t ratios are used to ensure dynamic stability of the out-of-plane
URM walls during seismic excitation.
TABLE 5.6 Permissible h/t Ratios for URM Out-of-Plane Walls (ATC 1997a) Wall Types SX1 ≤ 0.24g 0.24g < SX1 ≤ 0.37g 0.37g< SX1≤0.5g Walls of one-story buildings 20 16 13
First-story wall of multistory building 20 18 15
Walls in top story of multistory building 14 14 9
All other walls 20 16 13
Case Study Building 1 has an h/t ratio of 13.4 and Case Study Building 2 has a
h/t ratio of 15.8 and they both fall into the first column. Table 5.6 is applicable for
Life Safety and Collapse Prevention performance levels. FEMA defines three
conditions for existing masonry: good, fair and poor. The deformation limitations based
on the h/t ratio do not take into account the condition of the masonry, but does permit
cracking of the walls as long as the cracked wall segments remain stable. Out-of-plane
masonry walls are force-controlled elements. The tensile strength of the masonry should
exceed the required demands for the out-of-plane walls. In this analysis, the stiffness of
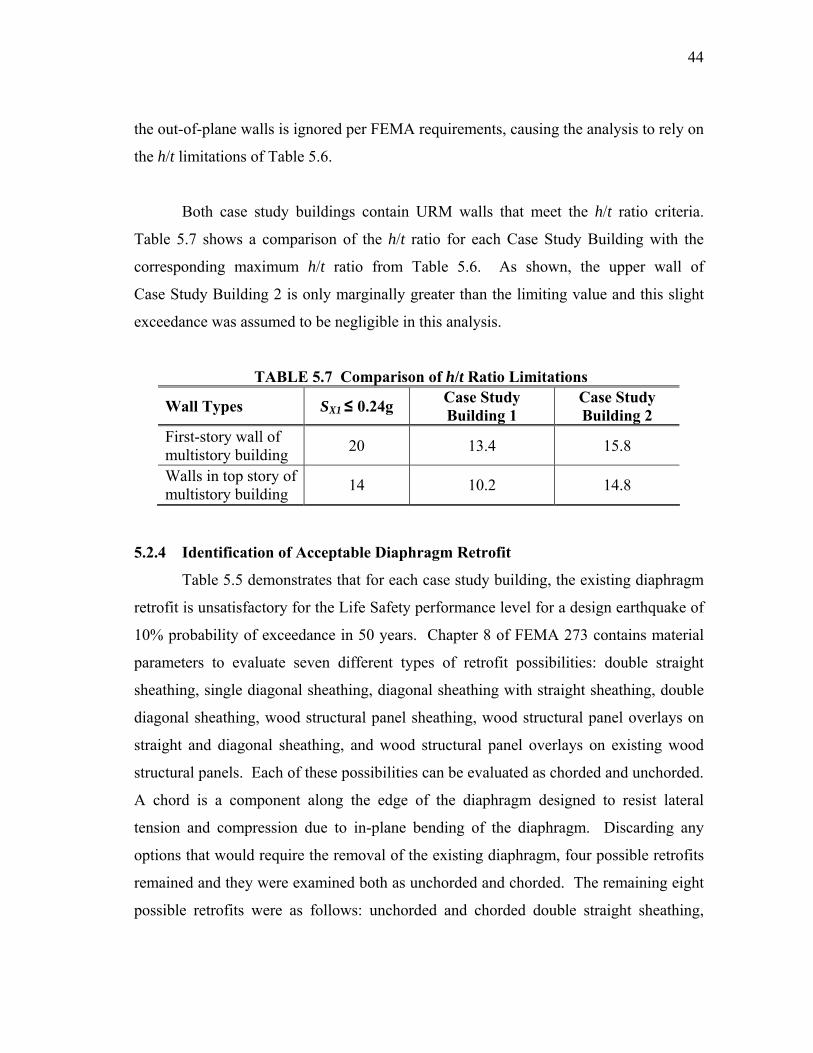
44
the out-of-plane walls is ignored per FEMA requirements, causing the analysis to rely on
the h/t limitations of Table 5.6.
Both case study buildings contain URM walls that meet the h/t ratio criteria.
Table 5.7 shows a comparison of the h/t ratio for each Case Study Building with the
corresponding maximum h/t ratio from Table 5.6. As shown, the upper wall of
Case Study Building 2 is only marginally greater than the limiting value and this slight
exceedance was assumed to be negligible in this analysis.
TABLE 5.7 Comparison of h/t Ratio Limitations
Wall Types SX1 ≤ 0.24g Case Study Building 1
Case Study Building 2
First-story wall of multistory building 20 13.4 15.8
Walls in top story of multistory building 14 10.2 14.8
5.2.4 Identification of Acceptable Diaphragm Retrofit
Table 5.5 demonstrates that for each case study building, the existing diaphragm
retrofit is unsatisfactory for the Life Safety performance level for a design earthquake of
10% probability of exceedance in 50 years. Chapter 8 of FEMA 273 contains material
parameters to evaluate seven different types of retrofit possibilities: double straight
sheathing, single diagonal sheathing, diagonal sheathing with straight sheathing, double
diagonal sheathing, wood structural panel sheathing, wood structural panel overlays on
straight and diagonal sheathing, and wood structural panel overlays on existing wood
structural panels. Each of these possibilities can be evaluated as chorded and unchorded.
A chord is a component along the edge of the diaphragm designed to resist lateral
tension and compression due to in-plane bending of the diaphragm. Discarding any
options that would require the removal of the existing diaphragm, four possible retrofits
remained and they were examined both as unchorded and chorded. The remaining eight
possible retrofits were as follows: unchorded and chorded double straight sheathing,
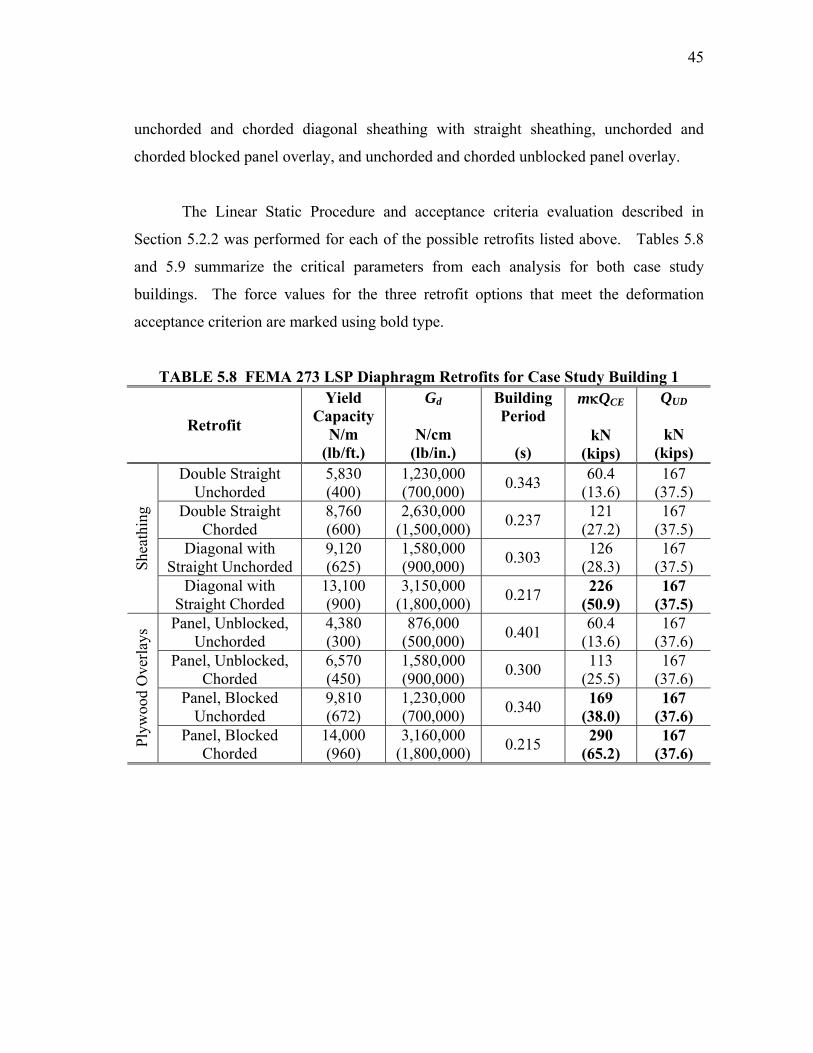
45
unchorded and chorded diagonal sheathing with straight sheathing, unchorded and
chorded blocked panel overlay, and unchorded and chorded unblocked panel overlay.
The Linear Static Procedure and acceptance criteria evaluation described in
Section 5.2.2 was performed for each of the possible retrofits listed above. Tables 5.8
and 5.9 summarize the critical parameters from each analysis for both case study
buildings. The force values for the three retrofit options that meet the deformation
acceptance criterion are marked using bold type.
TABLE 5.8 FEMA 273 LSP Diaphragm Retrofits for Case Study Building 1
Retrofit
Yield Capacity
N/m (lb/ft.)
Gd
N/cm (lb/in.)
Building Period
(s)
mκQCE
kN (kips)
QUD
kN (kips)
Double Straight Unchorded
5,830 (400)
1,230,000 (700,000) 0.343 60.4
(13.6) 167
(37.5) Double Straight
Chorded 8,760 (600)
2,630,000 (1,500,000) 0.237 121
(27.2) 167
(37.5) Diagonal with
Straight Unchorded 9,120 (625)
1,580,000 (900,000) 0.303 126
(28.3) 167
(37.5) Shea
thin
g
Diagonal with Straight Chorded
13,100 (900)
3,150,000 (1,800,000) 0.217 226
(50.9) 167
(37.5) Panel, Unblocked,
Unchorded 4,380 (300)
876,000 (500,000) 0.401 60.4
(13.6) 167
(37.6) Panel, Unblocked,
Chorded 6,570 (450)
1,580,000 (900,000) 0.300 113
(25.5) 167
(37.6) Panel, Blocked
Unchorded 9,810 (672)
1,230,000 (700,000) 0.340 169
(38.0) 167
(37.6)
Plyw
ood
Ove
rlays
Panel, Blocked Chorded
14,000 (960)
3,160,000 (1,800,000) 0.215 290
(65.2) 167
(37.6)
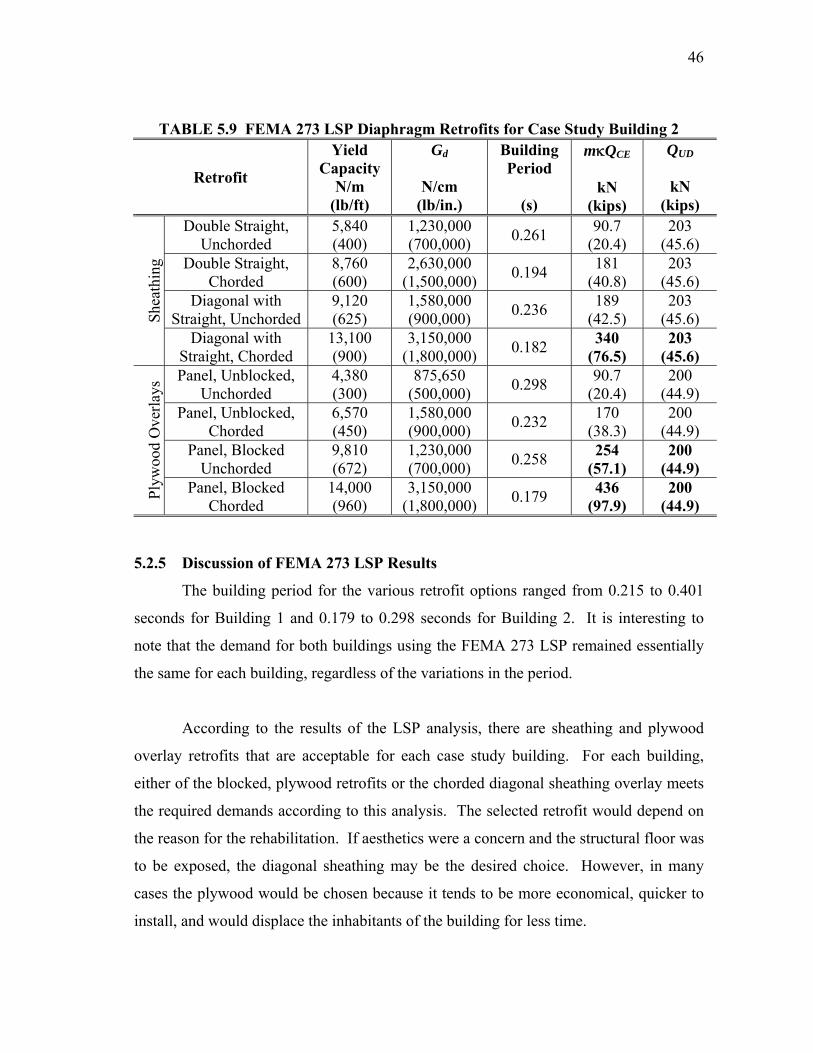
46
TABLE 5.9 FEMA 273 LSP Diaphragm Retrofits for Case Study Building 2
Retrofit
Yield Capacity
N/m (lb/ft)
Gd
N/cm (lb/in.)
Building Period
(s)
mκQCE
kN (kips)
QUD
kN (kips)
Double Straight, Unchorded
5,840 (400)
1,230,000 (700,000) 0.261 90.7
(20.4) 203
(45.6) Double Straight,
Chorded 8,760 (600)
2,630,000 (1,500,000) 0.194 181
(40.8) 203
(45.6) Diagonal with
Straight, Unchorded 9,120 (625)
1,580,000 (900,000) 0.236 189
(42.5) 203
(45.6) Shea
thin
g
Diagonal with Straight, Chorded
13,100 (900)
3,150,000 (1,800,000) 0.182 340
(76.5) 203
(45.6) Panel, Unblocked,
Unchorded 4,380 (300)
875,650 (500,000) 0.298 90.7
(20.4) 200
(44.9) Panel, Unblocked,
Chorded 6,570 (450)
1,580,000 (900,000) 0.232 170
(38.3) 200
(44.9) Panel, Blocked
Unchorded 9,810 (672)
1,230,000 (700,000) 0.258 254
(57.1) 200
(44.9)
Plyw
ood
Ove
rlays
Panel, Blocked Chorded
14,000 (960)
3,150,000 (1,800,000) 0.179 436
(97.9) 200
(44.9)
5.2.5 Discussion of FEMA 273 LSP Results
The building period for the various retrofit options ranged from 0.215 to 0.401
seconds for Building 1 and 0.179 to 0.298 seconds for Building 2. It is interesting to
note that the demand for both buildings using the FEMA 273 LSP remained essentially
the same for each building, regardless of the variations in the period.
According to the results of the LSP analysis, there are sheathing and plywood
overlay retrofits that are acceptable for each case study building. For each building,
either of the blocked, plywood retrofits or the chorded diagonal sheathing overlay meets
the required demands according to this analysis. The selected retrofit would depend on
the reason for the rehabilitation. If aesthetics were a concern and the structural floor was
to be exposed, the diagonal sheathing may be the desired choice. However, in many
cases the plywood would be chosen because it tends to be more economical, quicker to
install, and would displace the inhabitants of the building for less time.
47
5.3 LINEAR STATIC PROCEDURE USING FEMA 356
5.3.1 General
The LSP described in FEMA 356 is similar to that of FEMA 273. FEMA 356 is
actually an update of the FEMA 273 guidelines. The following sections will briefly
outline the LSP contained in FEMA 356 and highlight the major differences between the
two.
5.3.2 Applicability of Linear Procedures
The FEMA 356 requirements for applicability of linear procedures are identical
to those outlined in FEMA 273. The limiting DCR is the same (2.0), and the same
structural irregularities must not be present for buildings with components that surpass
the DCR limit. There are, however, a few differences for determining the applicability
of utilizing the LSP. The four stipulations listed previously in Section 5.2.1 have been
modified in FEMA 356, as follows: (1) the fundamental period must be less than 3.5
times characteristic period of the building, (2) the ratio of the horizontal dimensions
from one story to the next may not exceed 1.4, (3) the building may not contain a
definable severe torsional stiffness irregularity, (4) the drift along any side of the
structure can not exceed 150% of the average story drift, and (5) the building must have
an orthogonal lateral force resisting system. Again, the required demand of a component
cannot be determined until the LSP analysis is complete. Therefore, the applicability of
the FEMA 356 LSP analysis can only be determined after the procedure has been
applied.
5.3.3 Details of the Linear Static Procedure
FEMA 356 develops the methodology for the LSP in the same manner as
FEMA 273. The response acceleration parameters are found from the same maps and
adjusted by the same factors for local soil conditions. Thus, the design acceleration
parameters are the same.
48
There is a slight difference in the value of the spectral response acceleration for
FEMA 356 (see Fig. 5.3) as compared to FEMA 273. For both guidelines, the building
period is greater than Ts, or To in the case of FEMA 273. However, because the
fundamental building period is calculated differently for the two guidelines, the spectral
response acceleration is not the same. Thus, Sa for Building 1 is 0.415g and Sa for
Building 2 is 0.207g. The variation of the building period calculation is discussed in the
following section.
The seismic demand is again equivalent to a pseudo-lateral load based on the
spectral response parameter, building weight, and a series of constants (see Eq. 5.11)
(ASCE 2000). However, FEMA 356 includes an additional factor, Cm, to account for
higher mode mass participation. This additional term does not affect the analysis of the
case study buildings. Again, P-∆ effects represented by C3 are not significant for the
case study buildings.
1 2 3 m aV C C C C S W= (5.11)
where:
C1, C3, Sa, W = Defined for Eq. 5.1 C2 = Modification factor to represent effects of pinched hysteretic
behavior, stiffness degradation and strength deterioration on maximum displacement response = 1.0 for linear procedure
Cm = Effective mass factor = 1.0 for two-story building
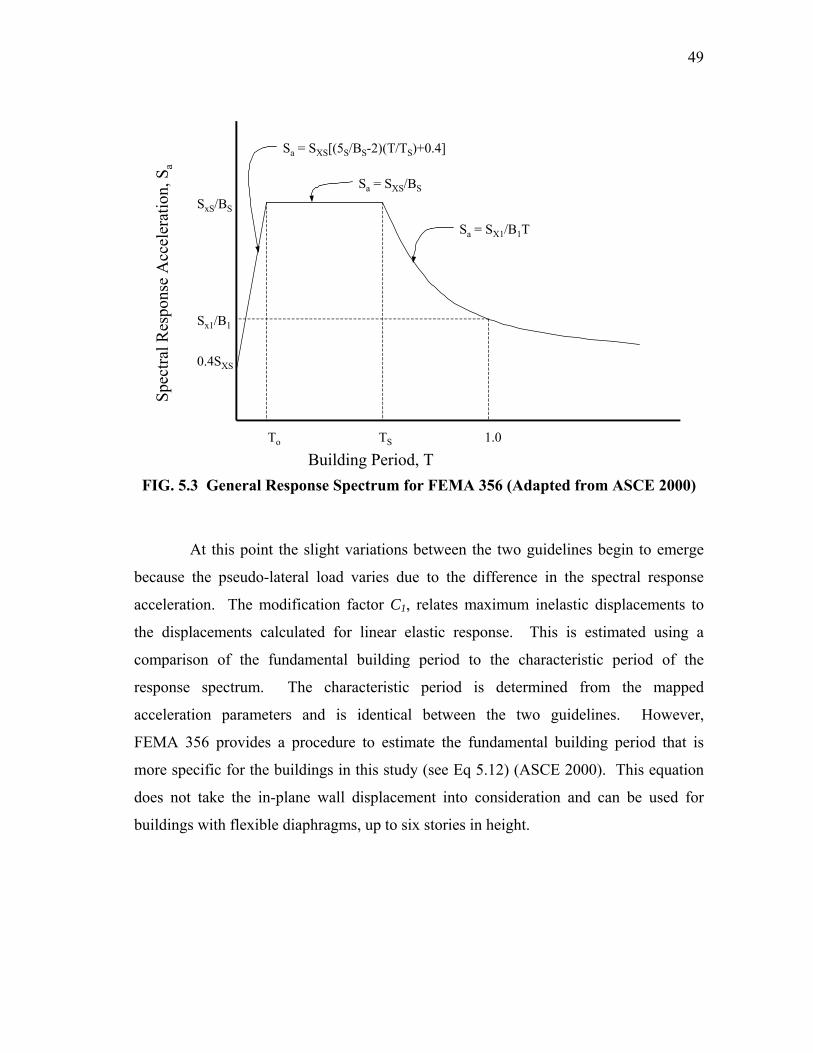
49
To TS 1.0
Sx1/B1
Spec
tral R
espo
nse
Acc
eler
atio
n, S
a
0.4SXS
Building Period, T
Sa = SXS[(5S/BS-2)(T/TS)+0.4]
Sa = SXS/BS
Sa = SX1/B1T
SxS/BS
FIG. 5.3 General Response Spectrum for FEMA 356 (Adapted from ASCE 2000)
At this point the slight variations between the two guidelines begin to emerge
because the pseudo-lateral load varies due to the difference in the spectral response
acceleration. The modification factor C1, relates maximum inelastic displacements to
the displacements calculated for linear elastic response. This is estimated using a
comparison of the fundamental building period to the characteristic period of the
response spectrum. The characteristic period is determined from the mapped
acceleration parameters and is identical between the two guidelines. However,
FEMA 356 provides a procedure to estimate the fundamental building period that is
more specific for the buildings in this study (see Eq 5.12) (ASCE 2000). This equation
does not take the in-plane wall displacement into consideration and can be used for
buildings with flexible diaphragms, up to six stories in height.
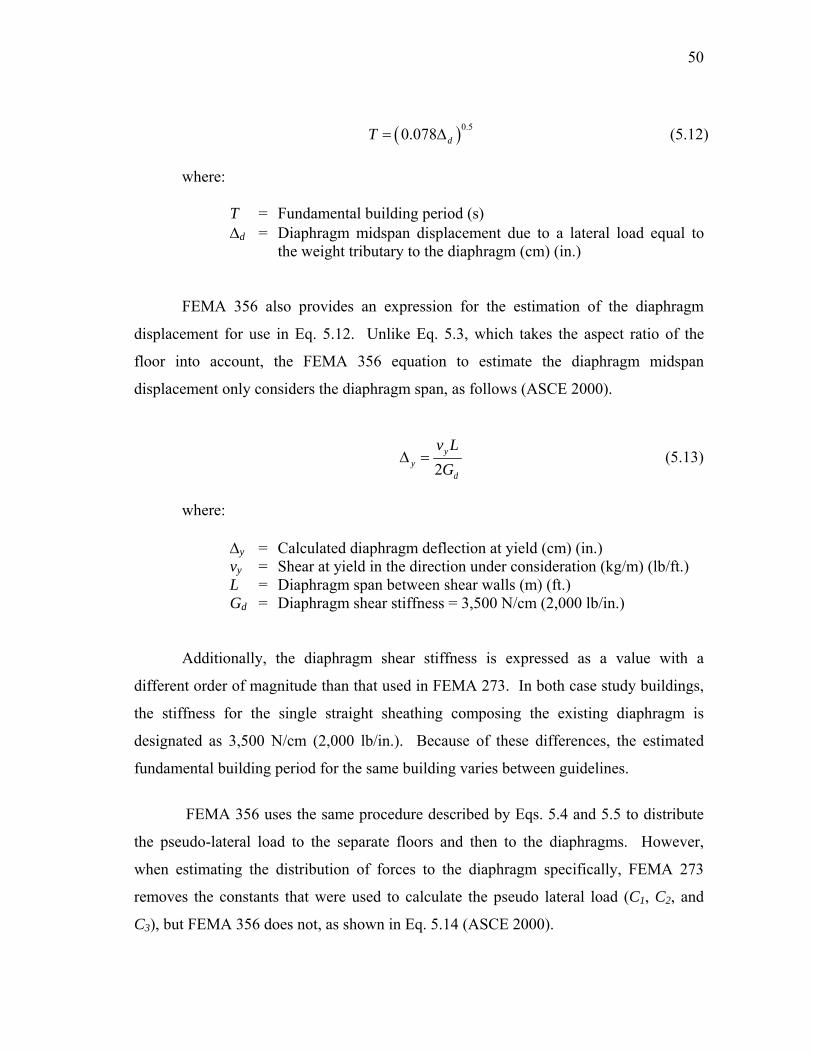
50
( )0.50.078 dT = ∆ (5.12) where:
T = Fundamental building period (s) ∆d = Diaphragm midspan displacement due to a lateral load equal to
the weight tributary to the diaphragm (cm) (in.)
FEMA 356 also provides an expression for the estimation of the diaphragm
displacement for use in Eq. 5.12. Unlike Eq. 5.3, which takes the aspect ratio of the
floor into account, the FEMA 356 equation to estimate the diaphragm midspan
displacement only considers the diaphragm span, as follows (ASCE 2000).
2y
yd
v LG
∆ = (5.13)
where:
∆y = Calculated diaphragm deflection at yield (cm) (in.) vy = Shear at yield in the direction under consideration (kg/m) (lb/ft.) L = Diaphragm span between shear walls (m) (ft.)
Gd = Diaphragm shear stiffness = 3,500 N/cm (2,000 lb/in.)
Additionally, the diaphragm shear stiffness is expressed as a value with a
different order of magnitude than that used in FEMA 273. In both case study buildings,
the stiffness for the single straight sheathing composing the existing diaphragm is
designated as 3,500 N/cm (2,000 lb/in.). Because of these differences, the estimated
fundamental building period for the same building varies between guidelines.
FEMA 356 uses the same procedure described by Eqs. 5.4 and 5.5 to distribute
the pseudo-lateral load to the separate floors and then to the diaphragms. However,
when estimating the distribution of forces to the diaphragm specifically, FEMA 273
removes the constants that were used to calculate the pseudo lateral load (C1, C2, and
C3), but FEMA 356 does not, as shown in Eq. 5.14 (ASCE 2000).
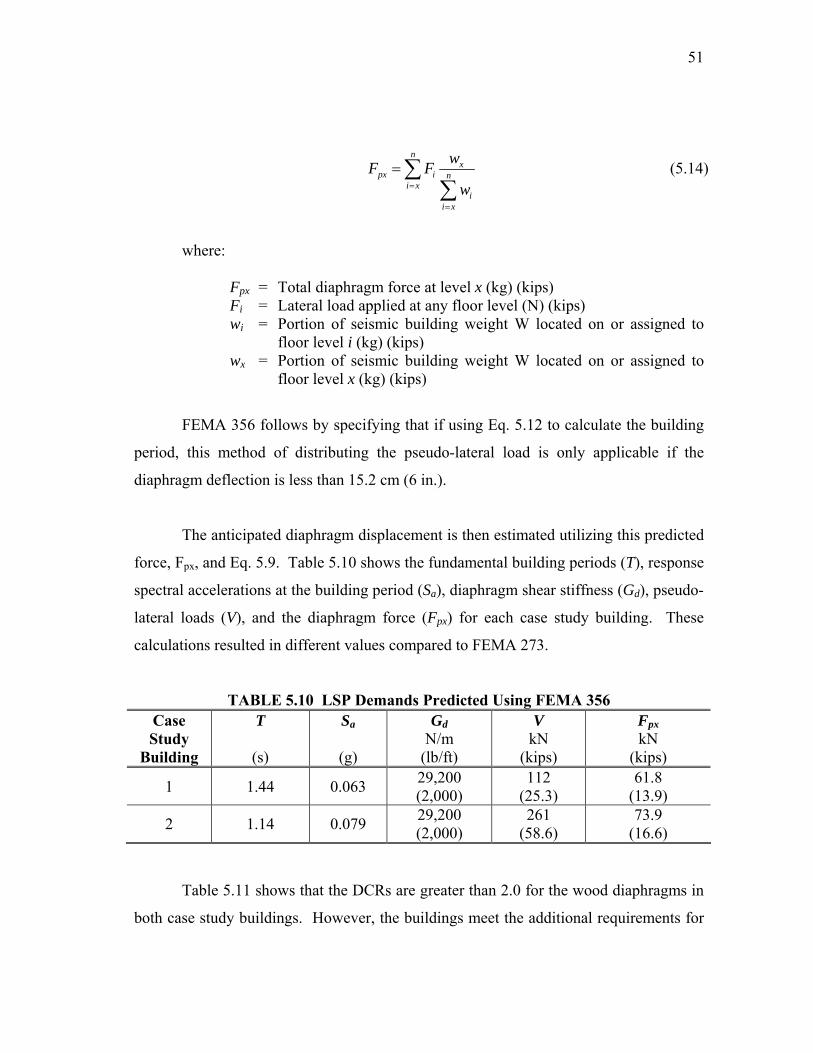
51
n
xpx i n
i xi
i x
wF Fw=
=
= ∑∑
(5.14)
where:
Fpx = Total diaphragm force at level x (kg) (kips) Fi = Lateral load applied at any floor level (N) (kips) wi = Portion of seismic building weight W located on or assigned to
floor level i (kg) (kips) wx = Portion of seismic building weight W located on or assigned to
floor level x (kg) (kips)
FEMA 356 follows by specifying that if using Eq. 5.12 to calculate the building
period, this method of distributing the pseudo-lateral load is only applicable if the
diaphragm deflection is less than 15.2 cm (6 in.).
The anticipated diaphragm displacement is then estimated utilizing this predicted
force, Fpx, and Eq. 5.9. Table 5.10 shows the fundamental building periods (T), response
spectral accelerations at the building period (Sa), diaphragm shear stiffness (Gd), pseudo-
lateral loads (V), and the diaphragm force (Fpx) for each case study building. These
calculations resulted in different values compared to FEMA 273.
TABLE 5.10 LSP Demands Predicted Using FEMA 356 Case Study
Building
T
(s)
Sa
(g)
Gd N/m
(lb/ft)
V kN
(kips)
Fpx kN
(kips)
1 1.44 0.063 29,200 (2,000)
112 (25.3)
61.8 (13.9)
2 1.14 0.079 29,200 (2,000)
261 (58.6)
73.9 (16.6)
Table 5.11 shows that the DCRs are greater than 2.0 for the wood diaphragms in
both case study buildings. However, the buildings meet the additional requirements for
52
regularity when the demand capacity ratio is exceeded, so the FEMA 356 LSP may be
used.
TABLE 5.11 FEMA 356 LSP –Diaphragm Demand-to-Capacity Ratios Case Study
Building DCR
1 3.14
2 3.06
5.3.4 FEMA 356 Linear Static Analysis Acceptance Criteria
FEMA 356 also provides acceptance criteria for both force- and deformation-
controlled actions. These terms have been defined in Section 5.2.3.
5.3.4.1 Force-Controlled Actions
Assessment of force-controlled actions in FEMA 356 is identical to the
FEMA 273 procedure. Again, this criterion does not allow nonlinear behavior of the
material and utilizes the lower-bound strength of the diaphragm, QCL, as a means of
comparison to demand values. However, because of differences in determining the
seismic demand for the diaphragm (see Eq. 5.14), the design action, QUF, is considerably
smaller when using FEMA 356 versus FEMA 273.
5.3.4.2 Deformation-Controlled Actions
The demands calculated by FEMA 356 must also satisfy deformation-controlled
actions based on the strength and ductility of the component. The same factors
accounting for level of knowledge of the existing building and ductility utilized in
FEMA 273 are combined with the expected strength, QCE, and compared with the
predicted demands, QUD. The ductility factors, m, are identical to those listed in
FEMA 273 and are representative of the type of sheathing retrofit. The minimal level of
knowledge was assumed again for these case study buildings for a conservative analysis.
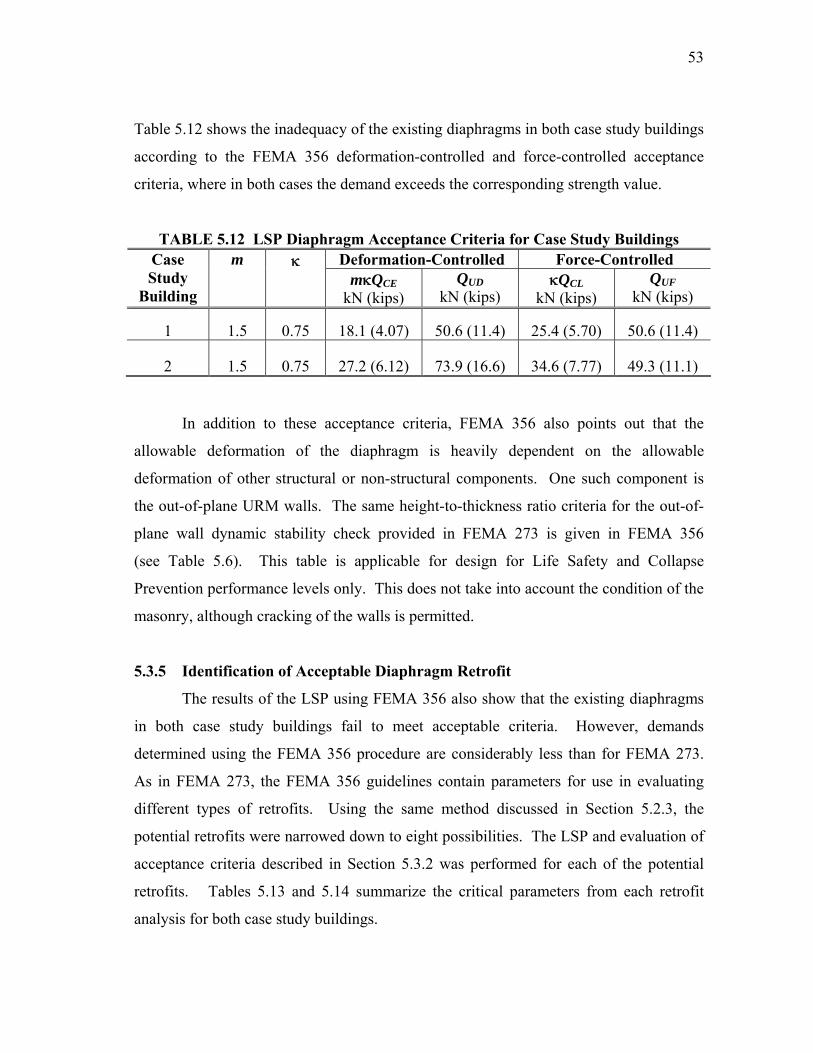
53
Table 5.12 shows the inadequacy of the existing diaphragms in both case study buildings
according to the FEMA 356 deformation-controlled and force-controlled acceptance
criteria, where in both cases the demand exceeds the corresponding strength value.
TABLE 5.12 LSP Diaphragm Acceptance Criteria for Case Study Buildings Deformation-Controlled Force-Controlled Case
Study Building
m κ mκQCE
kN (kips) QUD
kN (kips) κQCL
kN (kips) QUF
kN (kips)
1 1.5 0.75 18.1 (4.07) 50.6 (11.4) 25.4 (5.70) 50.6 (11.4)
2 1.5 0.75 27.2 (6.12) 73.9 (16.6) 34.6 (7.77) 49.3 (11.1)
In addition to these acceptance criteria, FEMA 356 also points out that the
allowable deformation of the diaphragm is heavily dependent on the allowable
deformation of other structural or non-structural components. One such component is
the out-of-plane URM walls. The same height-to-thickness ratio criteria for the out-of-
plane wall dynamic stability check provided in FEMA 273 is given in FEMA 356
(see Table 5.6). This table is applicable for design for Life Safety and Collapse
Prevention performance levels only. This does not take into account the condition of the
masonry, although cracking of the walls is permitted.
5.3.5 Identification of Acceptable Diaphragm Retrofit
The results of the LSP using FEMA 356 also show that the existing diaphragms
in both case study buildings fail to meet acceptable criteria. However, demands
determined using the FEMA 356 procedure are considerably less than for FEMA 273.
As in FEMA 273, the FEMA 356 guidelines contain parameters for use in evaluating
different types of retrofits. Using the same method discussed in Section 5.2.3, the
potential retrofits were narrowed down to eight possibilities. The LSP and evaluation of
acceptance criteria described in Section 5.3.2 was performed for each of the potential
retrofits. Tables 5.13 and 5.14 summarize the critical parameters from each retrofit
analysis for both case study buildings.
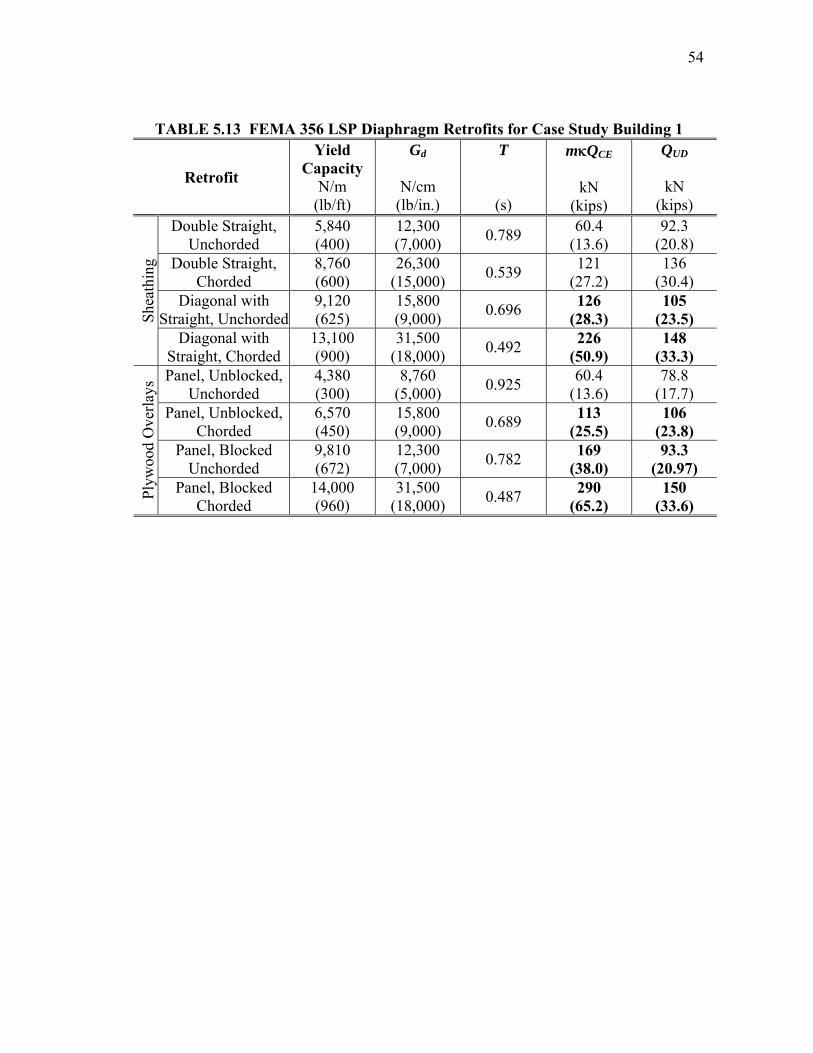
54
TABLE 5.13 FEMA 356 LSP Diaphragm Retrofits for Case Study Building 1
Retrofit
Yield Capacity
N/m (lb/ft)
Gd
N/cm (lb/in.)
T
(s)
mκQCE
kN (kips)
QUD
kN (kips)
Double Straight, Unchorded
5,840 (400)
12,300 (7,000) 0.789 60.4
(13.6) 92.3
(20.8) Double Straight,
Chorded 8,760 (600)
26,300 (15,000) 0.539 121
(27.2) 136
(30.4) Diagonal with
Straight, Unchorded 9,120 (625)
15,800 (9,000) 0.696 126
(28.3) 105
(23.5) Shea
thin
g
Diagonal with Straight, Chorded
13,100 (900)
31,500 (18,000) 0.492 226
(50.9) 148
(33.3) Panel, Unblocked,
Unchorded 4,380 (300)
8,760 (5,000) 0.925 60.4
(13.6) 78.8
(17.7) Panel, Unblocked,
Chorded 6,570 (450)
15,800 (9,000) 0.689 113
(25.5) 106
(23.8) Panel, Blocked
Unchorded 9,810 (672)
12,300 (7,000) 0.782 169
(38.0) 93.3
(20.97)
Plyw
ood
Ove
rlays
Panel, Blocked Chorded
14,000 (960)
31,500 (18,000) 0.487 290
(65.2) 150
(33.6)
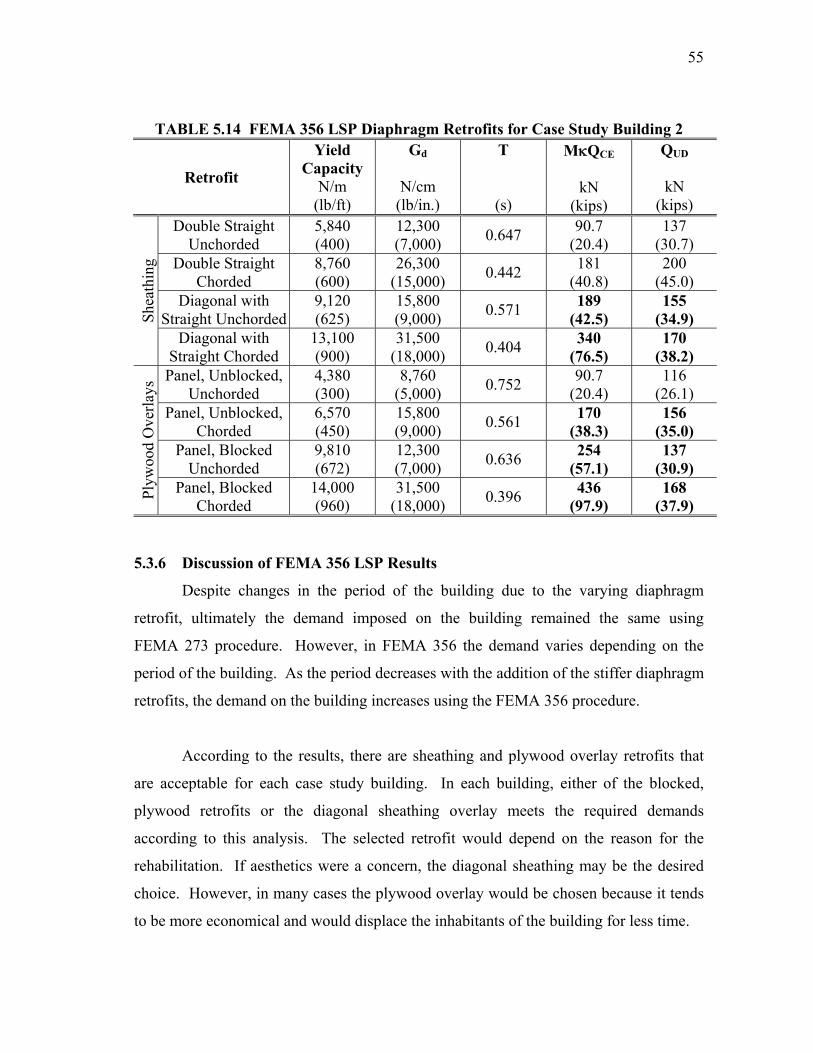
55
TABLE 5.14 FEMA 356 LSP Diaphragm Retrofits for Case Study Building 2
Retrofit
Yield Capacity
N/m (lb/ft)
Gd
N/cm (lb/in.)
T
(s)
MκQCE
kN (kips)
QUD
kN (kips)
Double Straight Unchorded
5,840 (400)
12,300 (7,000) 0.647 90.7
(20.4) 137
(30.7) Double Straight
Chorded 8,760 (600)
26,300 (15,000) 0.442 181
(40.8) 200
(45.0) Diagonal with
Straight Unchorded 9,120 (625)
15,800 (9,000) 0.571 189
(42.5) 155
(34.9) Shea
thin
g
Diagonal with Straight Chorded
13,100 (900)
31,500 (18,000) 0.404 340
(76.5) 170
(38.2) Panel, Unblocked,
Unchorded 4,380 (300)
8,760 (5,000) 0.752 90.7
(20.4) 116
(26.1) Panel, Unblocked,
Chorded 6,570 (450)
15,800 (9,000) 0.561 170
(38.3) 156
(35.0) Panel, Blocked
Unchorded 9,810 (672)
12,300 (7,000) 0.636 254
(57.1) 137
(30.9)
Plyw
ood
Ove
rlays
Panel, Blocked Chorded
14,000 (960)
31,500 (18,000) 0.396 436
(97.9) 168
(37.9)
5.3.6 Discussion of FEMA 356 LSP Results
Despite changes in the period of the building due to the varying diaphragm
retrofit, ultimately the demand imposed on the building remained the same using
FEMA 273 procedure. However, in FEMA 356 the demand varies depending on the
period of the building. As the period decreases with the addition of the stiffer diaphragm
retrofits, the demand on the building increases using the FEMA 356 procedure.
According to the results, there are sheathing and plywood overlay retrofits that
are acceptable for each case study building. In each building, either of the blocked,
plywood retrofits or the diagonal sheathing overlay meets the required demands
according to this analysis. The selected retrofit would depend on the reason for the
rehabilitation. If aesthetics were a concern, the diagonal sheathing may be the desired
choice. However, in many cases the plywood overlay would be chosen because it tends
to be more economical and would displace the inhabitants of the building for less time.
56
5.4 SUMMARY OF LSP RESULTS
As demonstrated by the analyses utilized for the two case study buildings, the
FEMA 273 and FEMA 356 guidelines separately draw similar conclusions for the
selection of retrofits, where the objective is to meet the requirements of the Life Safety
performance level for a 10% in 50 years earthquake demand. The evaluation based on
FEMA 356 led to a larger selection of suitable alternatives than for the FEMA 273
evaluation. The retrofit that will be used for the remaining parametric study will be the
chorded, blocked plywood, because all analyses have this retrofit in common and it will
provide the most significant difference in the variation in performance from the existing
state of the diaphragm. This retrofit is a typical retrofit in such buildings because of its
strength and relative economic feasibility. In reality, if the addition of a diaphragm
chord and blocking were not needed and a different retrofit was acceptable, the most
economical rehabilitation method will be chosen.
It is important to note that both sets of guidelines consistently determine the
strength of the diaphragm component. It is only the calculation of the demand on the
diaphragm that differs. As shown in Fig. 5.4, FEMA 273 more than doubles the demand
prediction of FEMA 356. Similar relationships are true for other building parameters
(see Figs. 5.5 and 5.6). In Case Study Building 1, FEMA 273 gives larger values for the
force applied to the diaphragm and the base shear by factors of 2.3 and 3.1, respectively.
However, the FEMA 356 estimations of both the diaphragm midspan displacement and
the building period exceed that of FEMA 273 by a factor of 2.3. In Case Study Building
2, the same relationships are true, except FEMA 273 gives larger values for the first two
parameters by factors of 2.6 and 2.4, respectively, while the FEMA 356 predictions for
the building period and the diaphragm midspan displacement exceed FEMA 273 by
approximately 2.7.
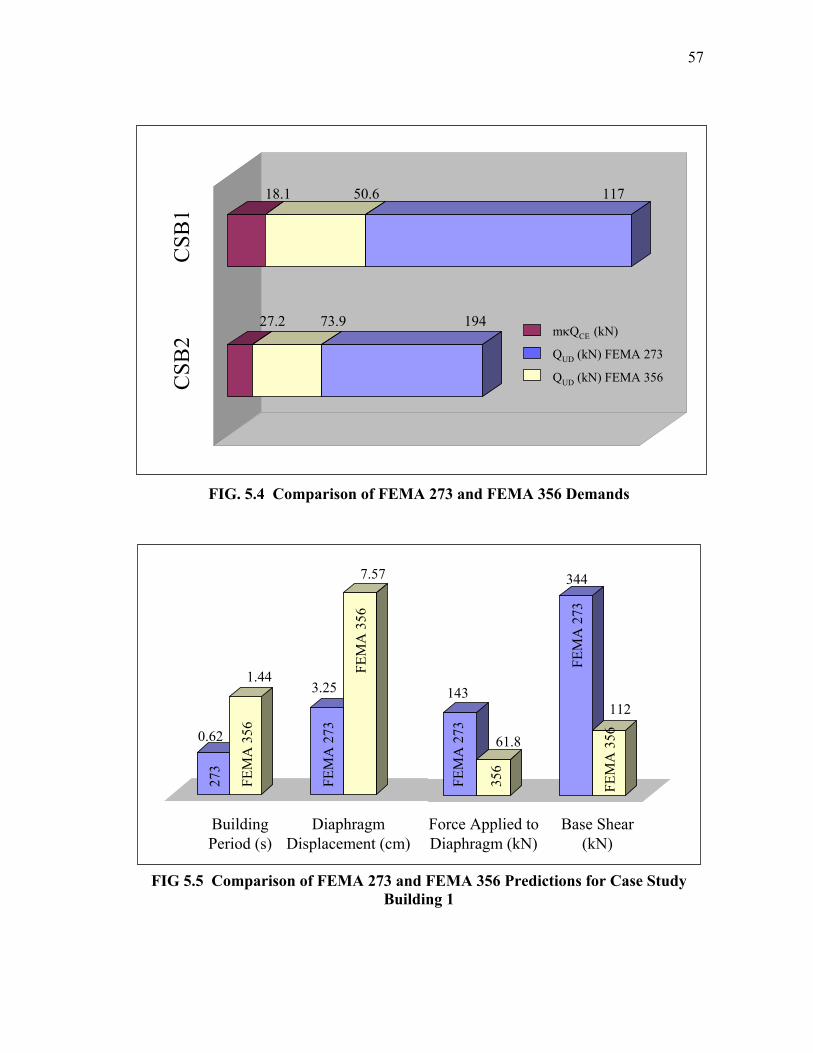
57
mκQCE (kN)
QUD (kN) FEMA 273
QUD (kN) FEMA 356
CSB
1C
SB2
18.1 11750.6
73.9 19427.2
FIG. 5.4 Comparison of FEMA 273 and FEMA 356 Demands
Building Period (s)
Force Applied to Diaphragm (kN)
Base Shear (kN)
Diaphragm Displacement (cm)
FEM
A 3
56
FEM
A 3
56
356
FEM
A 3
56
273
FEM
A 2
73
FEM
A 2
73
FEM
A 2
73
0.62
1.443.25
7.57
143
61.8
344
112
FIG 5.5 Comparison of FEMA 273 and FEMA 356 Predictions for Case Study
Building 1
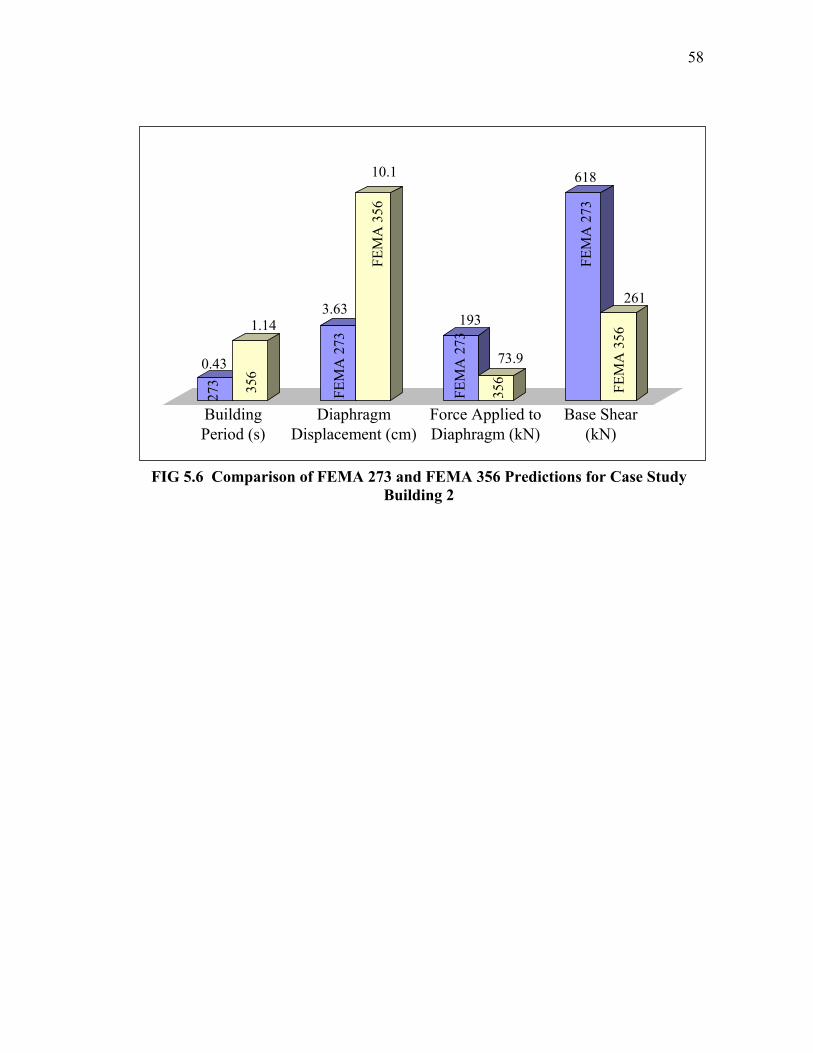
58
Building Period (s)
Force Applied to Diaphragm (kN)
Base Shear (kN)
Diaphragm Displacement (cm)
356
FEM
A 3
56
356 FE
MA
356
273
FEM
A 2
73
FEM
A 2
73
FEM
A 2
73
0.43
1.143.63
10.1
193
73.9
618
261
FIG 5.6 Comparison of FEMA 273 and FEMA 356 Predictions for Case Study
Building 2
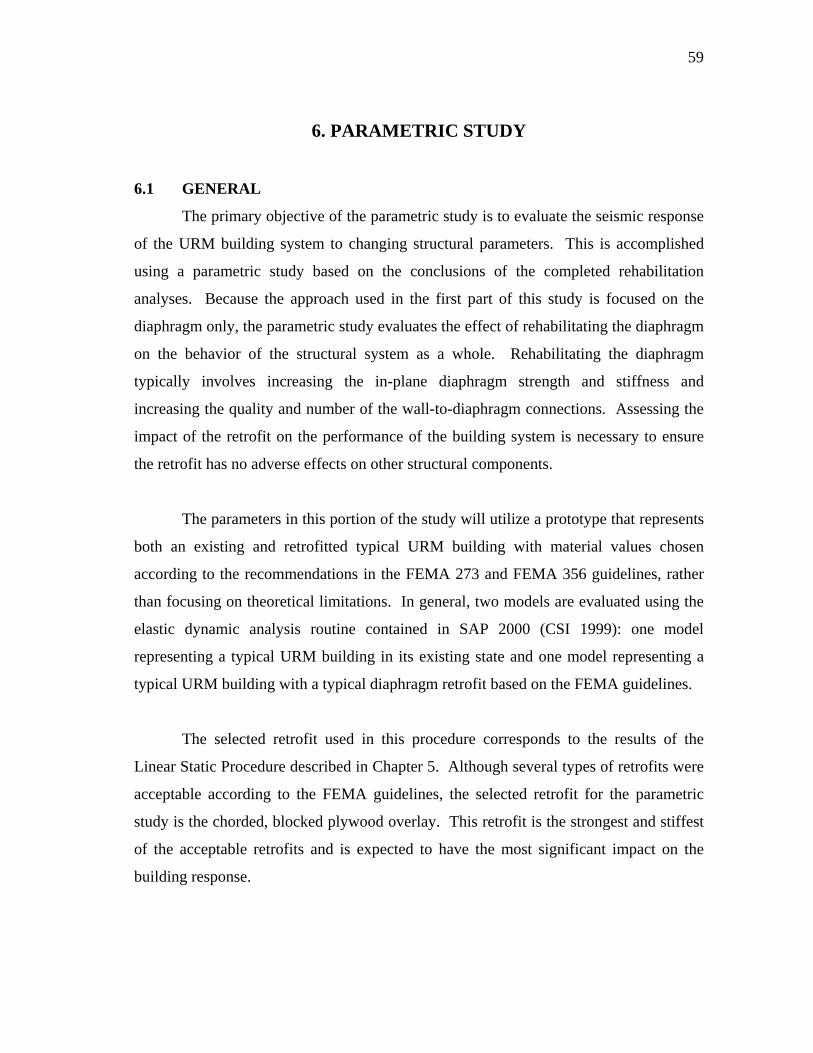
59
6. PARAMETRIC STUDY
6.1 GENERAL
The primary objective of the parametric study is to evaluate the seismic response
of the URM building system to changing structural parameters. This is accomplished
using a parametric study based on the conclusions of the completed rehabilitation
analyses. Because the approach used in the first part of this study is focused on the
diaphragm only, the parametric study evaluates the effect of rehabilitating the diaphragm
on the behavior of the structural system as a whole. Rehabilitating the diaphragm
typically involves increasing the in-plane diaphragm strength and stiffness and
increasing the quality and number of the wall-to-diaphragm connections. Assessing the
impact of the retrofit on the performance of the building system is necessary to ensure
the retrofit has no adverse effects on other structural components.
The parameters in this portion of the study will utilize a prototype that represents
both an existing and retrofitted typical URM building with material values chosen
according to the recommendations in the FEMA 273 and FEMA 356 guidelines, rather
than focusing on theoretical limitations. In general, two models are evaluated using the
elastic dynamic analysis routine contained in SAP 2000 (CSI 1999): one model
representing a typical URM building in its existing state and one model representing a
typical URM building with a typical diaphragm retrofit based on the FEMA guidelines.
The selected retrofit used in this procedure corresponds to the results of the
Linear Static Procedure described in Chapter 5. Although several types of retrofits were
acceptable according to the FEMA guidelines, the selected retrofit for the parametric
study is the chorded, blocked plywood overlay. This retrofit is the strongest and stiffest
of the acceptable retrofits and is expected to have the most significant impact on the
building response.
60
This parametric study permits an assessment of the building system’s behavior,
specifically observing the changing response of the building due to rehabilitating the
diaphragm according to the FEMA 273 and FEMA 356 criteria. The goal of the
parametric study is to observe the changing behavior of the system by increasing the
strengths or stiffnesses of critical components. The behavior of the building will be
observed as it is analytically subjected to the selected set of synthetic ground motion
records developed by Wen and Wu (2000) for St. Louis, Missouri for a 10% probability
of exceedance in 50 years seismic event with representative soil conditions. As
discussed in Section 5.2.2, the FEMA 273 and FEMA 356 guidelines suggest that
achieving the Basic Safety Objective for seismic rehabilitation in this region is based on
the demands imposed by a seismic event having this probability of exceedance evaluated
for a Life Safety Performance Level. Note that an additional requirement is that
Collapse Prevention performance is ensured for the 2% in 50 years event. The scope of
this study did not include an evaluation of this second performance objective.
6.2 DESCRIPTION OF PARAMETRIC BUILDING MODELS
In physical appearance, the existing and retrofitted prototype models are identical
and differ only in the material properties. Both the existing and retrofitted models
consist of a rectangular building with URM walls and wood floor and roof diaphragms,
closely approximating a typical URM building found in the Central and Eastern portion
of the United States. The walls and floors were developed using a three-dimensional
finite element mesh containing 38.1 cm (15 in.) square shell elements with the
representative material properties suggested by the FEMA 273 and FEMA 356
guidelines.
6.2.1 Existing Building Model Description
6.2.1.1 General
The existing building model contains characteristics typical of either case study
building in its current state. This prototype is 26.3 m (86.3 ft.) long by 13.7 m (45 ft.)
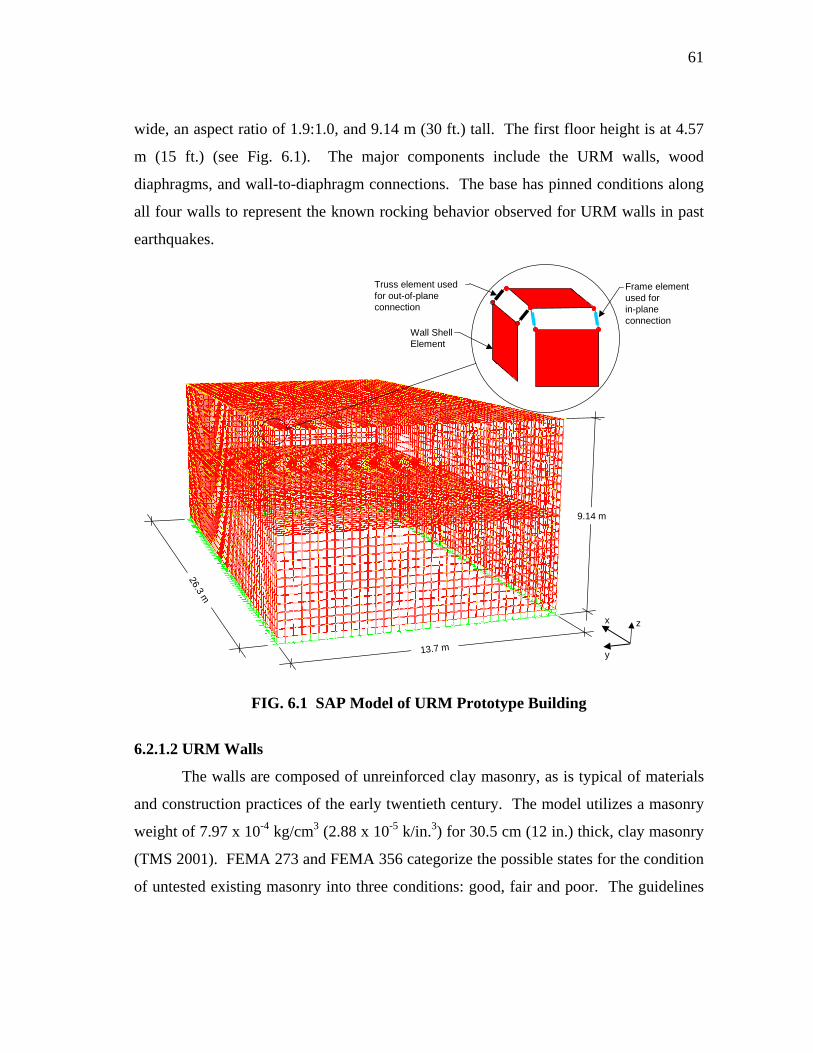
61
wide, an aspect ratio of 1.9:1.0, and 9.14 m (30 ft.) tall. The first floor height is at 4.57
m (15 ft.) (see Fig. 6.1). The major components include the URM walls, wood
diaphragms, and wall-to-diaphragm connections. The base has pinned conditions along
all four walls to represent the known rocking behavior observed for URM walls in past
earthquakes.
26.3 m
13.7 m
x
y
z
9.14 m
Wall Shell Element
Frame element used for in-plane connection
Truss element used for out-of-plane connection
FIG. 6.1 SAP Model of URM Prototype Building
6.2.1.2 URM Walls
The walls are composed of unreinforced clay masonry, as is typical of materials
and construction practices of the early twentieth century. The model utilizes a masonry
weight of 7.97 x 10⁻⁴ kg/cm3 (2.88 x 10⁻⁵ k/in.3) for 30.5 cm (12 in.) thick, clay masonry
(TMS 2001). FEMA 273 and FEMA 356 categorize the possible states for the condition
of untested existing masonry into three conditions: good, fair and poor. The guidelines
62
also list corresponding default values for the compressive strength according to the
applicable existing state.
For the baseline existing building model, the condition of the masonry is
assumed to be in “good” condition. Thus, the default compressive strength is 6,210 kPa
(900 psi) with an elastic modulus of 34.1 x 10⁵ kPa (4.95 x 10⁵ psi) based on the
relationship shown in Eq. 6.1 (ATC 1997a).
E = 550 * f (6.1)
where: E = Elastic modulus = 34.1 x 10⁵ kPa (495 ksi) for “good” masonry f = Compression strength for various masonry conditions
good = 6,210 kPa (900 psi) fair = 4,140 kPa (600 psi) poor = 2,070 kPa (300 psi)
The existing building model was evaluated using all three different masonry
conditions: good, fair, and poor. The effect of decreasing the elastic modulus can also
represent various conditions of cracking. In reality, the wall has large openings that are
not represented on the prototype and this reduction in modulus could be considered to
better represent the actual strength of walls with openings.
6.2.1.3 Diaphragms
FEMA 273 and FEMA 356 provide a single value to represent the modulus of
rigidity for single, straight sheathing, instead of providing a shear modulus. As
discussed in Chapter 5, the modulus of rigidity, Gd, is the in-plane stiffness for
diaphragms equal to the shear modulus of the diaphragm times the diaphragm thickness.
The suggested value for the modulus of rigidity for single straight sheathing is
36,000 kg/cm (200 k/in.). This value, as provided by FEMA 273 and FEMA 356,
63
should more accurately represent the shear stiffness of the wood sheathed flooring
system rather than using a generic material value for wood.
The modulus of rigidity provided by FEMA 273 and FEMA 356 is utilized along
with the thickness of the diaphragm to define the modulus of elasticity for the finite
elements representing the diaphragm in the prototype existing building model. The
diaphragm element is a 38.1 cm (15 in.) square shell that is 1.27 cm (0.5 in.) thick. The
modulus of elasticity is then calculated according to Eq. 6.2 to be, E = 66.2 x 10⁵ kPa
(960 k/in.2), and incorporated in the material parameters of the shell elements used to
model the diaphragms in the existing building model.
( )2 1dGE
tυ+⎛ ⎞
= ⎜ ⎟⎝ ⎠
(6.2)
where: E = Modulus of elasticity of sheathing (kPa) (k/in.2) Gd = Modulus of rigidity of sheathing (kPa) (k/in.2) ν = Poisson’s ratio for wood = 0.2 t = Thickness of finite element = 1.27 cm (0.5 in.)
The weight of the sheathing used in the model is an average value representing
the total weight of the flooring system including the sheathing, joists and beams as
calculated for the LSP. The total weight was applied uniformly over the area of the
floor. The weight of the entire flooring system, composed of sheathing, joists and
beams, was thereby taken into account rather than the weight of only the sheathing.
64
( )* *
fw
d d d
WW
w d t= (6.3)
where: Ww = Unit weight of sheathing as used for prototype (3.73 x 10⁻² N/cm3)
(1.375 x 10⁻⁴ k/in.3) Wf = Total weight of flooring system = 172 kN (38.7 k) wd = Actual width of diaphragm = 13.7 m (540 in.) ld = Actual length of diaphragm = 26.3 m (1035 in.) td = Thickness of diaphragm used for prototype = 1.27 cm (0.5 in.)
6.2.1.4 Diaphragm-to-Wall Connections
The final component of concern is the out-of-plane diaphragm-to-wall
connection. In existing buildings, this connection is provided by what is known as a
“star” or “government” anchor or in some cases, no anchor at all. The star anchor,
shown in Fig. 2.1, was replicated in the previous experimental research performed at
Texas A&M University (Peralta et al. 2002). Again, the star anchor is a flexible
connection, in terms of lateral load transfer, typical of the Central and Eastern portions
of the United States during early twentieth century construction. In the model, this
anchor is represented by a relatively weak axial spring connecting the diaphragm and
out-of-plane wall at four points along the length of the diaphragm (described in
Chapter 3). In both case study buildings, the diaphragm appears to be connected to the
out-of-plane walls at the location of the beams spaced approximately at every 5.18 m
(17 ft.). The star anchor does not represent the connection of the beam to the out-of-
plane wall, only the connection of the diaphragm to the out-of-plane wall. The joists in
the first case study building were supported by a pocket in the out-of-plane wall, which
relies on the friction of the connection for the lateral force resistance.
The star anchor is represented in the model by a small truss element connecting
the diaphragm to the out-of-plane wall at the relevant locations. Like the star anchor, the
truss element transfers only axial load from one adjoining component to the other. The
65
stiffness of the truss element in the model is defined by the modulus of elasticity (MOE).
The MOE of these connections in the early twentieth century is not documented.
However, FEMA 273 and FEMA 356 recommend a structural steel tensile strength of
55 ksi for the years 1909 to 1923 in the United States. While using a reduced MOE of
steel to model the slip of the anchors was considered, no information was available to
accurately represent this behavior. Thus, the typical MOE for steel of 2.00x10⁸ kPa
(2.90 x 10⁴ ksi) was used for the star anchors in the finite element models.
In the prototype model, the finite element mesh that composes the URM walls
and the diaphragm has a line of nodes along the edge of the diaphragm adjacent to the
out-of-plane wall and identical line of nodes along the top of the out-of-plane wall. The
nodes are in identical locations along the x-horizontal direction and are separated by a
very small distance, 1.72 cm (0.5 in.), in the y-horizontal direction. The wall and
diaphragm are connected at the aforementioned star anchor locations by a very short 0.5
in. diameter truss element. The truss element provides axial stiffness to the connection
and has no horizontal rotational stiffness. Hence, the connection does not have the
capability to transfer moment to the out-of plane walls from the diaphragm. The same is
true for the diaphragm-to-wall connections at the first floor level.
The diaphragm-to-wall connections along the in-plane walls are similar to that of
the out-of-plane wall connection. The girders connecting the diaphragm to the in-plane
wall sit in a pocket in the URM wall, giving it the capacity to transfer shear as well as
axial loads. Because of this, the modeled connection of the diaphragm to the in-plane
wall utilizes a 0.5 in. diameter frame element that transferred shear and axial loads, but
without the capacity to transfer moment. The nodes along the edge of the wall and along
the edge of the diaphragm are in identical locations along the y-horizontal direction but
are separated by a small distance, 1.72 cm (0.5 in.) in the x-horizontal direction.
However, the corresponding nodes along the diaphragm and wall are connected along
the full length with a frame element at each node. Like the out-of-plane wall connection,
66
the strength of the connection was unknown. Thus, the normal MOE of steel 2.00 x 10⁸
kPa (2.90 x 10⁴ ksi) was used
6.2.2 Retrofitted Building Model Description
6.2.2.1 General
The retrofit model of the building is generally the same form as the existing
building model, with increased values for the modulus of the diaphragm. The three-
dimensional finite element mesh of the retrofitted building model is identical to that
shown in Fig. 6.1.
6.2.2.2 URM Walls
As in the existing building model, the retrofitted building model was modeled
using all three existing masonry default conditions: good, fair, and poor. Again, the
decreased MOE values for the wall elements can represent a “cracked” condition or the
presence of openings.
6.2.2.3 Diaphragm
In the prototype model containing a wood floor and roof diaphragm, both
diaphragms were modified to represent retrofitted conditions in this portion of the
analysis. The retrofitted diaphragm is no longer simply single, straight sheathing.
According to the results of the linear static procedure, an acceptable retrofit is a blocked,
chorded plywood overlay. The corresponding recommended value for the modulus of
rigidity is 3,150 kN/cm (1,800 k/in.); therefore the corresponding modulus of elasticity is
7,560 kN/cm (4,320 k/in.) from Eq. 6.2. The finite element representing this retrofitted
diaphragm was increased to 2.54 cm (1 in.) thick because the effect of overlaying the
plywood also increases the thickness of the floor system. The weight per unit volume
was modified to account for the new thickness of 2.54 cm (1 in.) and the unit weight was
increased to 2.14 x 10⁻² N/cm3 (7.87 x 10⁻⁵ k/in.3).
67
6.2.2.4 Diaphragm-to-Wall Connections
In current practice, it is common to improve the connection between the floor
and roof diaphragms to the out-of-plane walls. The strength of the connection is
designed so that the retrofitted connection is no longer the weakest component of the
lateral system. After design, the strength of the connection would exceed the flexural
capacity of the out-of-plane wall and the shear strength of the diaphragm. Additionally,
the connection improvements would consist of connecting the diaphragm to the out-of-
plane wall at closer spacings.
Because the connection in the unretrofitted model utilized the typical steel MOE
in current practice, the retrofitted connection was modeled in the same way. The MOE
used to represent the steel of the retrofitted connection is also 2.00 x 10⁸ kPa
(2.90 x 10⁴ ksi). Therefore, in the retrofit prototype, the retrofitted connection is only
different from the unretrofitted connection in the reduced spacing between connections.
The retrofitted connection was modeled as a truss element located at every third
joist along the out-of-plane wall, typically about every 0.91 m (3 ft.) in the model. For
flexible diaphragms, FEMA 273 and FEMA 356 require that the walls should be
anchored to the diaphragms at least every 2.44 m (8 ft.), and continuously connected
with diaphragm crossties. The frequency of connecting every third joist is taken from
common retrofit practices for these types of structures. Both FEMA guidelines consider
these anchors force-controlled elements.
6.2.3 Summary of Parametric Models
Table 6.1 summarizes each case evaluated in the parametric study for both the
existing and retrofitted building.
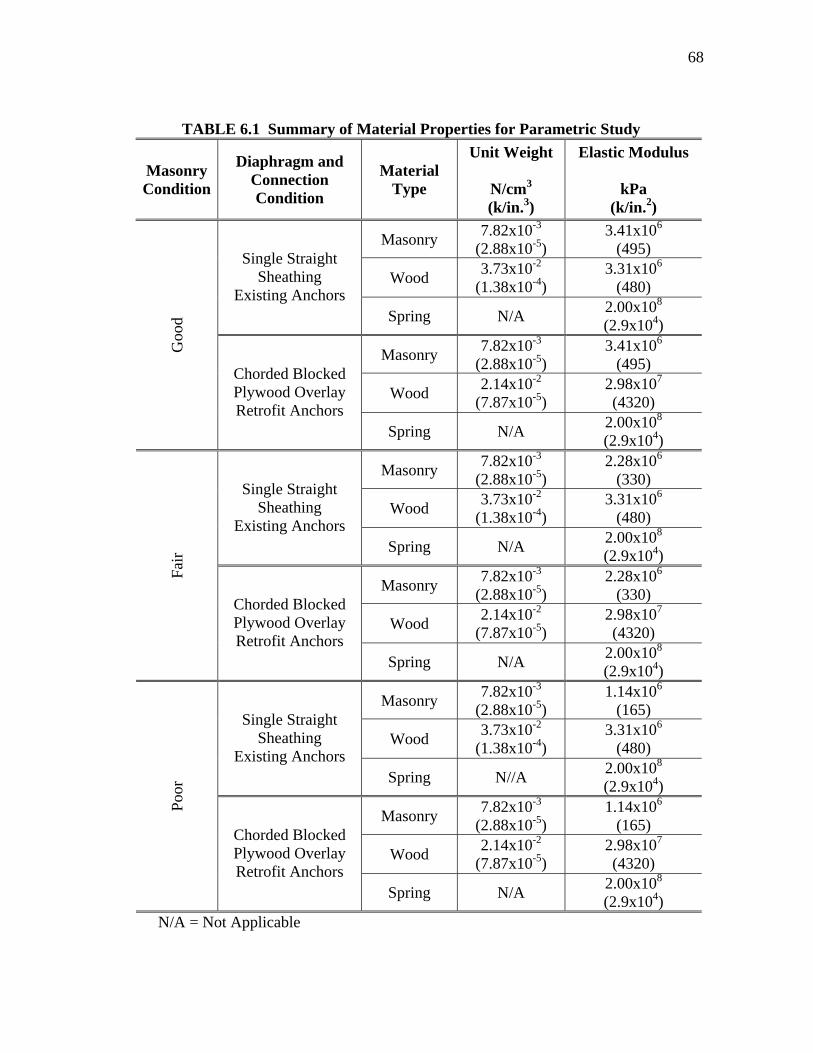
68
TABLE 6.1 Summary of Material Properties for Parametric Study
Masonry Condition
Diaphragm and Connection Condition
Material Type
Unit Weight
N/cm3 (k/in.3)
Elastic Modulus
kPa (k/in.2)
Masonry 7.82x10⁻³ (2.88x10⁻⁵)
3.41x10⁶ (495)
Wood 3.73x10⁻² (1.38x10⁻⁴)
3.31x10⁶ (480)
Single Straight Sheathing
Existing Anchors Spring N/A 2.00x10⁸
(2.9x10⁴)
Masonry 7.82x10⁻³ (2.88x10⁻⁵)
3.41x10⁶ (495)
Wood 2.14x10⁻² (7.87x10⁻⁵)
2.98x10⁷ (4320)
Goo
d
Chorded Blocked Plywood Overlay Retrofit Anchors
Spring N/A 2.00x10⁸
(2.9x10⁴)
Masonry 7.82x10⁻³ (2.88x10⁻⁵)
2.28x10⁶ (330)
Wood 3.73x10⁻² (1.38x10⁻⁴)
3.31x10⁶ (480)
Single Straight Sheathing
Existing Anchors Spring N/A 2.00x10⁸
(2.9x10⁴)
Masonry 7.82x10⁻³ (2.88x10⁻⁵)
2.28x10⁶ (330)
Wood 2.14x10⁻² (7.87x10⁻⁵)
2.98x10⁷ (4320)
Fair
Chorded Blocked Plywood Overlay Retrofit Anchors
Spring N/A 2.00x10⁸
(2.9x10⁴)
Masonry 7.82x10⁻³ (2.88x10⁻⁵)
1.14x10⁶ (165)
Wood 3.73x10⁻² (1.38x10⁻⁴)
3.31x10⁶ (480)
Single Straight Sheathing
Existing Anchors Spring N//A 2.00x10⁸
(2.9x10⁴)
Masonry 7.82x10⁻³ (2.88x10⁻⁵)
1.14x10⁶ (165)
Wood 2.14x10⁻² (7.87x10⁻⁵)
2.98x10⁷ (4320)
Poor
Chorded Blocked Plywood Overlay Retrofit Anchors
Spring N/A 2.00x10⁸
(2.9x10⁴) N/A = Not Applicable
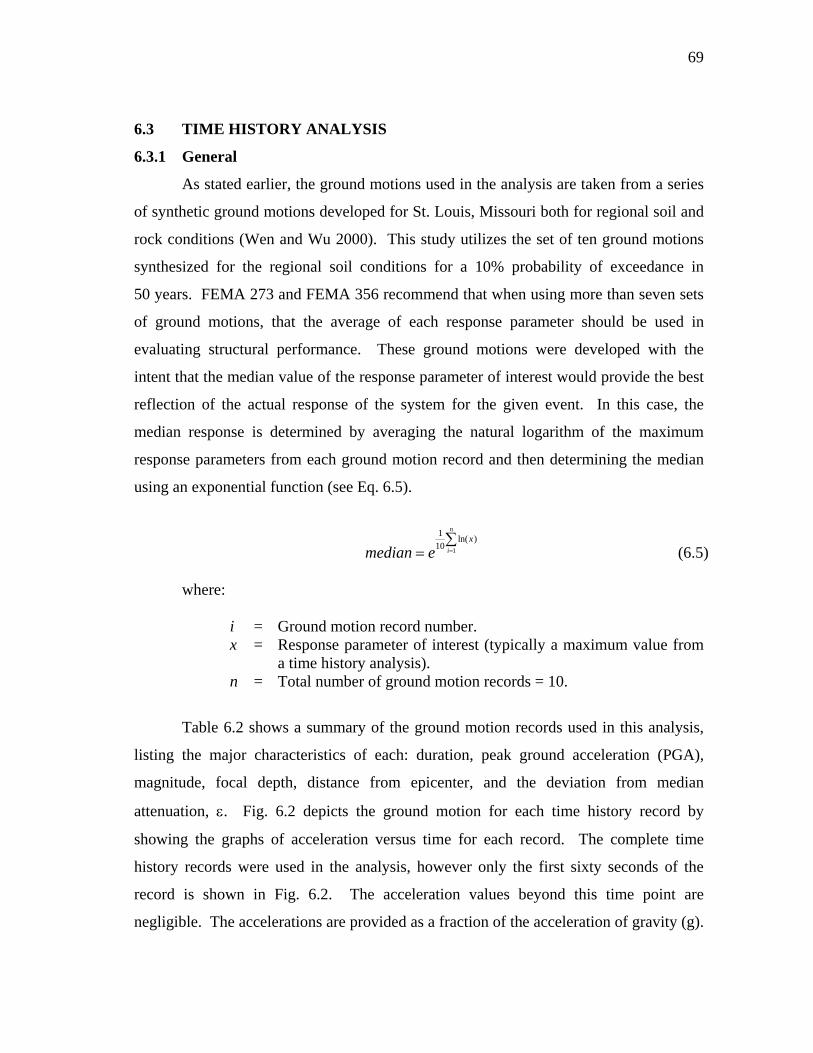
69
6.3 TIME HISTORY ANALYSIS
6.3.1 General
As stated earlier, the ground motions used in the analysis are taken from a series
of synthetic ground motions developed for St. Louis, Missouri both for regional soil and
rock conditions (Wen and Wu 2000). This study utilizes the set of ten ground motions
synthesized for the regional soil conditions for a 10% probability of exceedance in
50 years. FEMA 273 and FEMA 356 recommend that when using more than seven sets
of ground motions, that the average of each response parameter should be used in
evaluating structural performance. These ground motions were developed with the
intent that the median value of the response parameter of interest would provide the best
reflection of the actual response of the system for the given event. In this case, the
median response is determined by averaging the natural logarithm of the maximum
response parameters from each ground motion record and then determining the median
using an exponential function (see Eq. 6.5).
1
1 ln( )10
n
i
x
median e =∑
= (6.5) where: i = Ground motion record number. x = Response parameter of interest (typically a maximum value from
a time history analysis). n = Total number of ground motion records = 10.
Table 6.2 shows a summary of the ground motion records used in this analysis,
listing the major characteristics of each: duration, peak ground acceleration (PGA),
magnitude, focal depth, distance from epicenter, and the deviation from median
attenuation, ε. Fig. 6.2 depicts the ground motion for each time history record by
showing the graphs of acceleration versus time for each record. The complete time
history records were used in the analysis, however only the first sixty seconds of the
record is shown in Fig. 6.2. The acceleration values beyond this time point are
negligible. The accelerations are provided as a fraction of the acceleration of gravity (g).
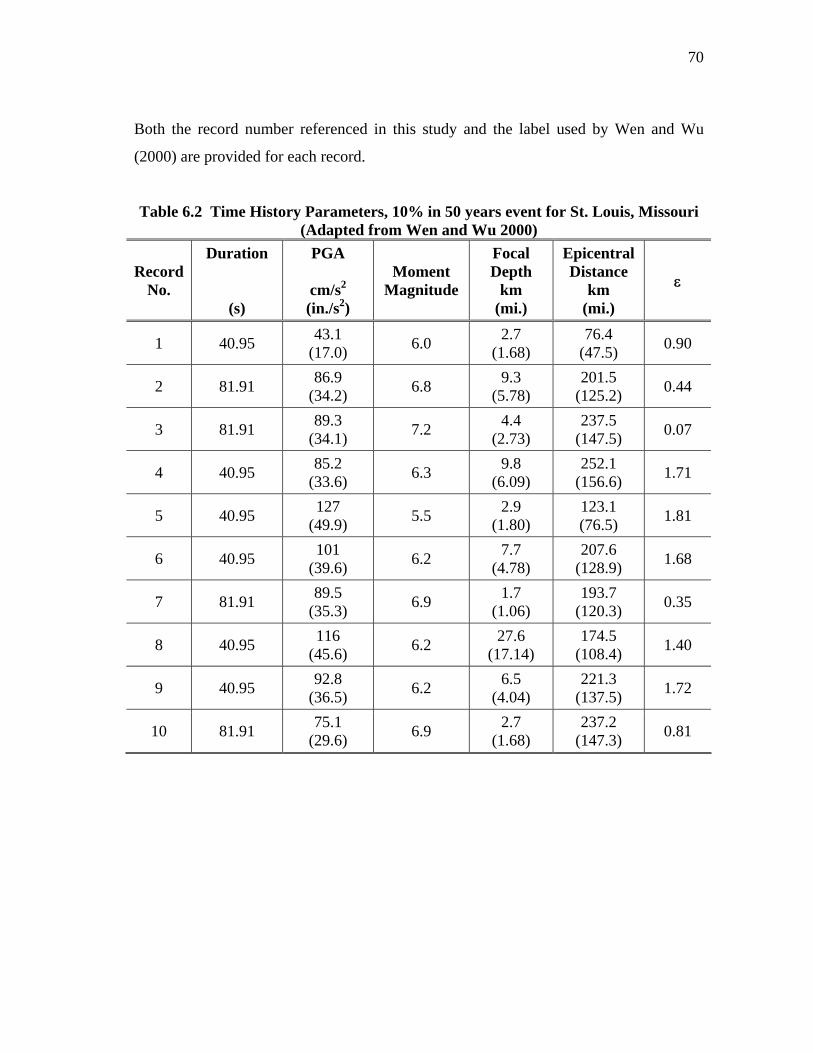
70
Both the record number referenced in this study and the label used by Wen and Wu
(2000) are provided for each record.
Table 6.2 Time History Parameters, 10% in 50 years event for St. Louis, Missouri (Adapted from Wen and Wu 2000)
Record No.
Duration
(s)
PGA
cm/s2 (in./s2)
Moment Magnitude
Focal Depth
km (mi.)
Epicentral Distance
km (mi.)
ε
1 40.95 43.1 (17.0) 6.0 2.7
(1.68) 76.4
(47.5) 0.90
2 81.91 86.9 (34.2) 6.8 9.3
(5.78) 201.5
(125.2) 0.44
3 81.91 89.3 (34.1) 7.2 4.4
(2.73) 237.5
(147.5) 0.07
4 40.95 85.2 (33.6) 6.3 9.8
(6.09) 252.1
(156.6) 1.71
5 40.95 127 (49.9) 5.5 2.9
(1.80) 123.1 (76.5) 1.81
6 40.95 101 (39.6) 6.2 7.7
(4.78) 207.6
(128.9) 1.68
7 81.91 89.5 (35.3) 6.9 1.7
(1.06) 193.7
(120.3) 0.35
8 40.95 116 (45.6) 6.2 27.6
(17.14) 174.5
(108.4) 1.40
9 40.95 92.8 (36.5) 6.2 6.5
(4.04) 221.3
(137.5) 1.72
10 81.91 75.1 (29.6) 6.9 2.7
(1.68) 237.2
(147.3) 0.81
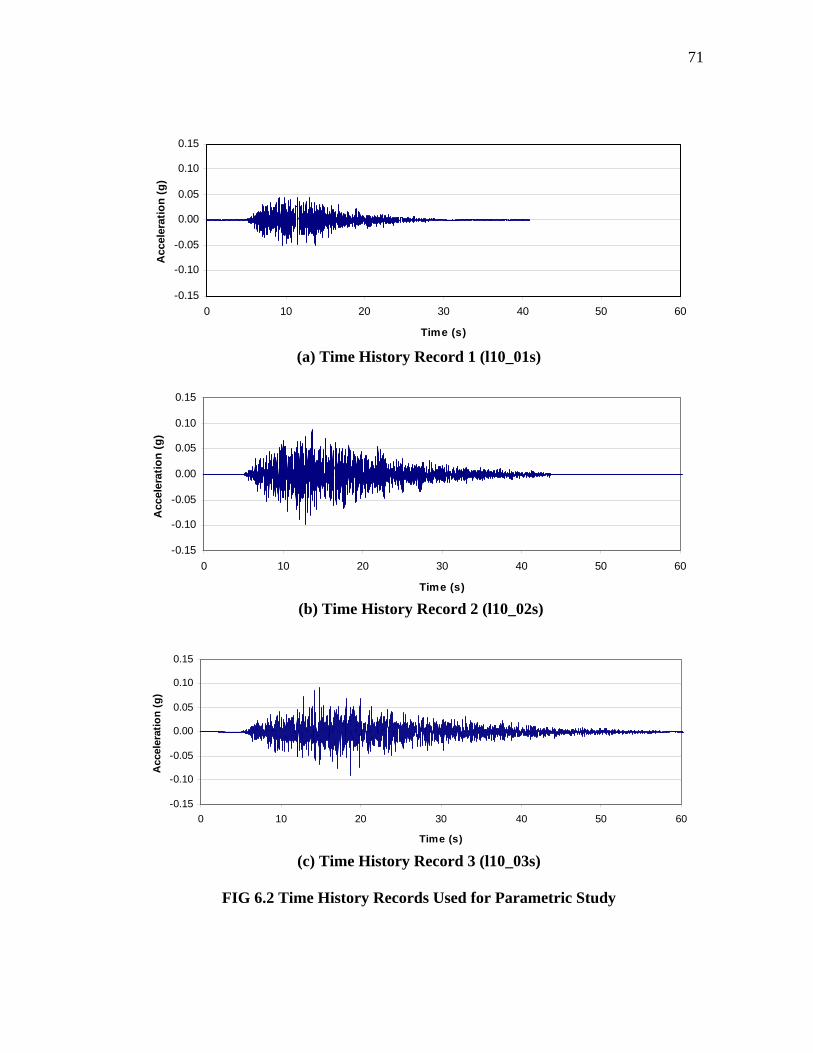
71
-0.15
-0.10
-0.05
0.00
0.05
0.10
0.15
0 10 20 30 40 50 60
Time (s)
Acc
eler
atio
n (g
)
(a) Time History Record 1 (l10_01s)
-0.15
-0.10
-0.05
0.00
0.05
0.10
0.15
0 10 20 30 40 50 60
Time (s)
Acc
eler
atio
n (g
)
(b) Time History Record 2 (l10_02s)
-0.15
-0.10
-0.05
0.00
0.05
0.10
0.15
0 10 20 30 40 50 60
Time (s)
Acc
eler
atio
n (g
)
(c) Time History Record 3 (l10_03s)
FIG 6.2 Time History Records Used for Parametric Study
72
-0.15
-0.10
-0.05
0.00
0.05
0.10
0.15
0 10 20 30 40 50 60
Time (s)
Acc
eler
atio
n (g
)
(d) Time History Record 4 (l10_04s)
-0.15
-0.10
-0.05
0.00
0.05
0.10
0.15
0 10 20 30 40 50 60
Time (s)
Acc
eler
atio
n (g
)
(e) Time History Record 5 (l10_05s)
-0.15
-0.10
-0.05
0.00
0.05
0.10
0.15
0 10 20 30 40 50 60
Time (s)
Acc
eler
atio
n (g
)
(f) Time History Record 6 (l10_06s)
FIG. 6.2 Time History Records Used for Parametric Study (cont.)
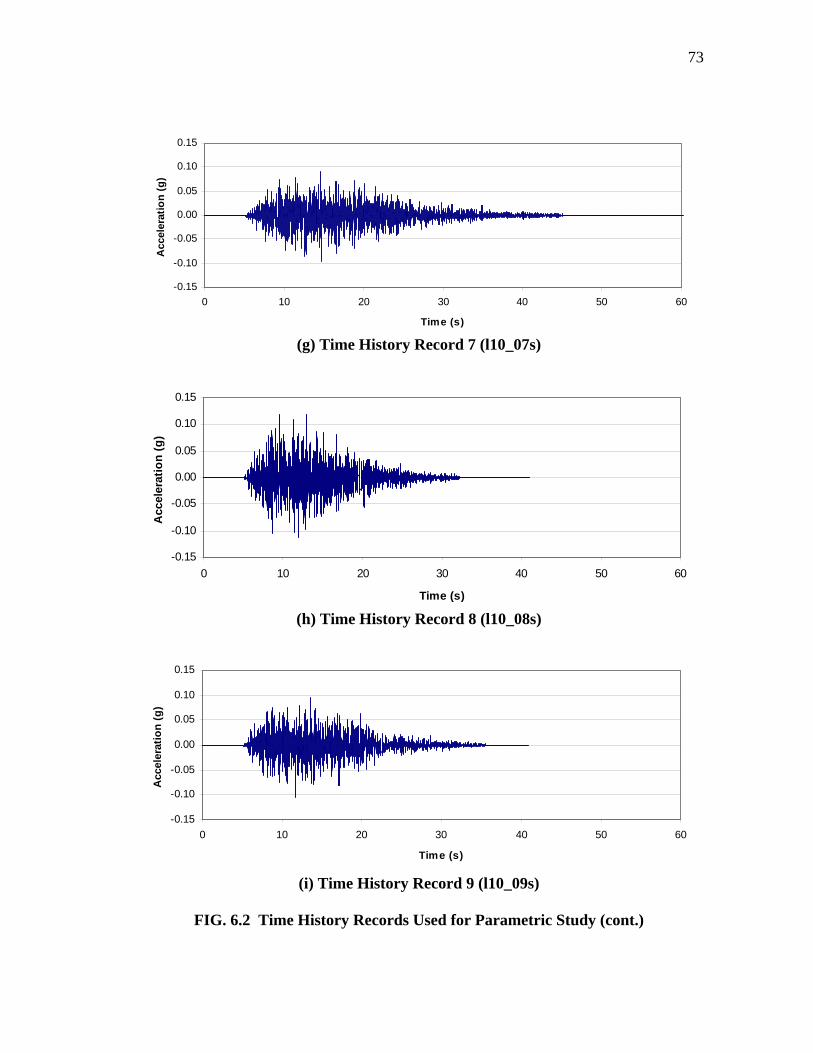
73
-0.15
-0.10
-0.05
0.00
0.05
0.10
0.15
0 10 20 30 40 50 60
Time (s)
Acc
eler
atio
n (g
)
(g) Time History Record 7 (l10_07s)
-0.15
-0.10
-0.05
0.00
0.05
0.10
0.15
0 10 20 30 40 50 60
Time (s)
Acc
eler
atio
n (g
)
(h) Time History Record 8 (l10_08s)
-0.15
-0.10
-0.05
0.00
0.05
0.10
0.15
0 10 20 30 40 50 60
Time (s)
Acc
eler
atio
n (g
)
(i) Time History Record 9 (l10_09s)
FIG. 6.2 Time History Records Used for Parametric Study (cont.)
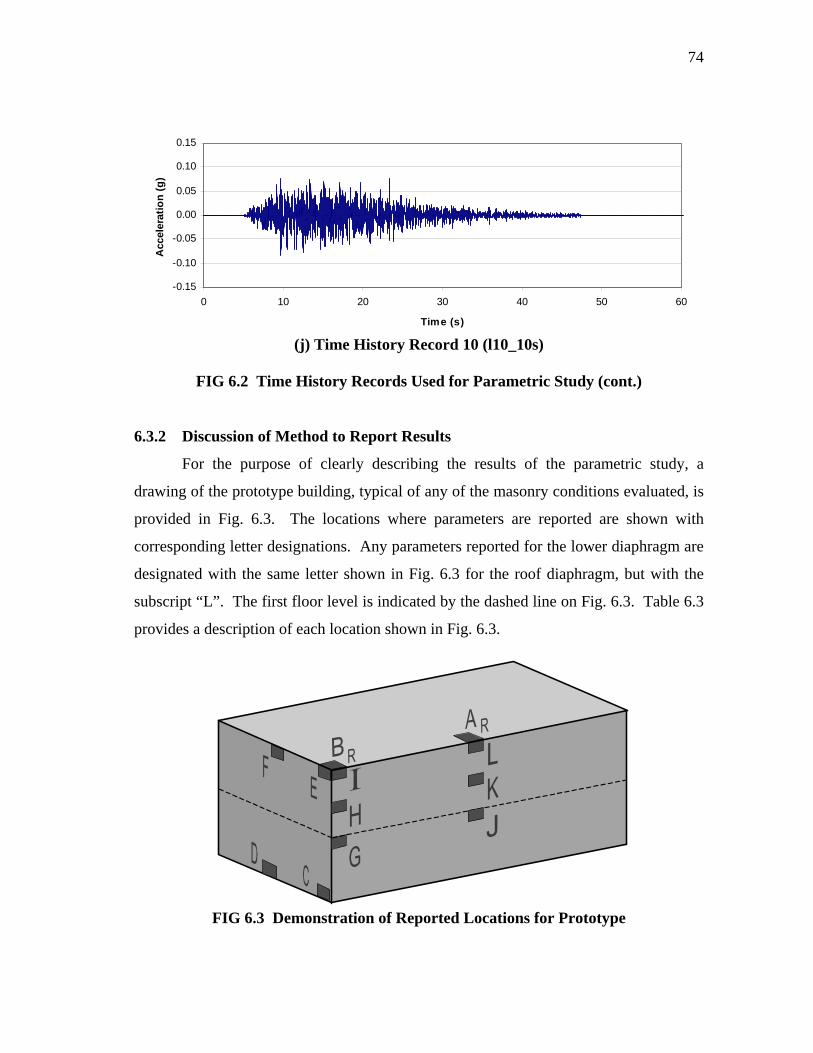
74
-0.15
-0.10
-0.05
0.00
0.05
0.10
0.15
0 10 20 30 40 50 60
Time (s)
Acc
eler
atio
n (g
)
(j) Time History Record 10 (l10_10s)
FIG 6.2 Time History Records Used for Parametric Study (cont.)
6.3.2 Discussion of Method to Report Results
For the purpose of clearly describing the results of the parametric study, a
drawing of the prototype building, typical of any of the masonry conditions evaluated, is
provided in Fig. 6.3. The locations where parameters are reported are shown with
corresponding letter designations. Any parameters reported for the lower diaphragm are
designated with the same letter shown in Fig. 6.3 for the roof diaphragm, but with the
subscript “L”. The first floor level is indicated by the dashed line on Fig. 6.3. Table 6.3
provides a description of each location shown in Fig. 6.3.
FIG 6.3 Demonstration of Reported Locations for Prototype
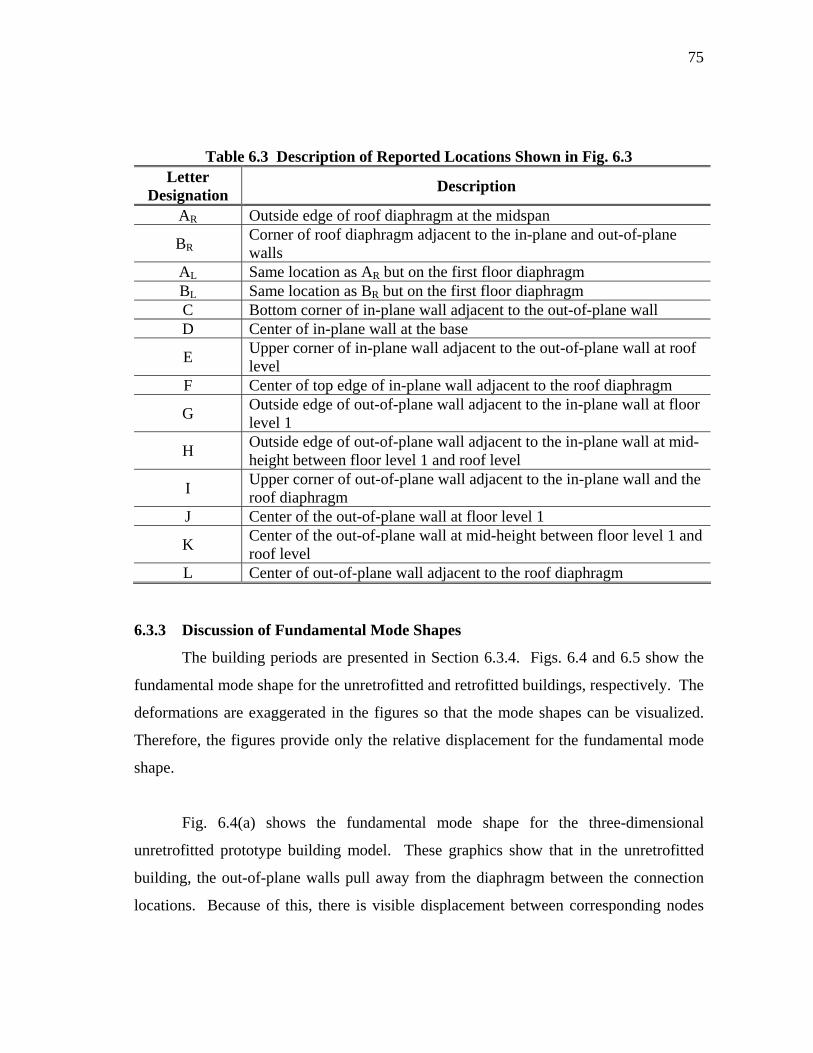
75
Table 6.3 Description of Reported Locations Shown in Fig. 6.3 Letter
Designation Description
AR Outside edge of roof diaphragm at the midspan
BR Corner of roof diaphragm adjacent to the in-plane and out-of-plane walls
AL Same location as AR but on the first floor diaphragm BL Same location as BR but on the first floor diaphragm C Bottom corner of in-plane wall adjacent to the out-of-plane wall D Center of in-plane wall at the base
E Upper corner of in-plane wall adjacent to the out-of-plane wall at roof level
F Center of top edge of in-plane wall adjacent to the roof diaphragm
G Outside edge of out-of-plane wall adjacent to the in-plane wall at floor level 1
H Outside edge of out-of-plane wall adjacent to the in-plane wall at mid-height between floor level 1 and roof level
I Upper corner of out-of-plane wall adjacent to the in-plane wall and the roof diaphragm
J Center of the out-of-plane wall at floor level 1
K Center of the out-of-plane wall at mid-height between floor level 1 and roof level
L Center of out-of-plane wall adjacent to the roof diaphragm
6.3.3 Discussion of Fundamental Mode Shapes
The building periods are presented in Section 6.3.4. Figs. 6.4 and 6.5 show the
fundamental mode shape for the unretrofitted and retrofitted buildings, respectively. The
deformations are exaggerated in the figures so that the mode shapes can be visualized.
Therefore, the figures provide only the relative displacement for the fundamental mode
shape.
Fig. 6.4(a) shows the fundamental mode shape for the three-dimensional
unretrofitted prototype building model. These graphics show that in the unretrofitted
building, the out-of-plane walls pull away from the diaphragm between the connection
locations. Because of this, there is visible displacement between corresponding nodes
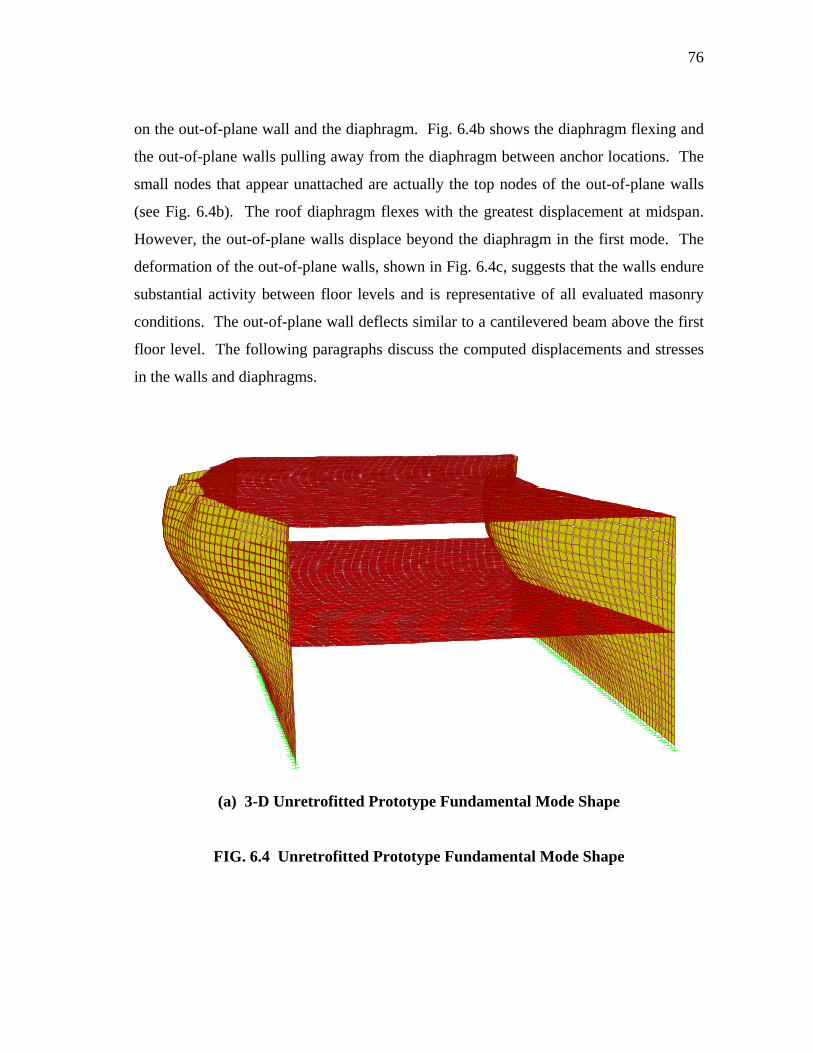
76
on the out-of-plane wall and the diaphragm. Fig. 6.4b shows the diaphragm flexing and
the out-of-plane walls pulling away from the diaphragm between anchor locations. The
small nodes that appear unattached are actually the top nodes of the out-of-plane walls
(see Fig. 6.4b). The roof diaphragm flexes with the greatest displacement at midspan.
However, the out-of-plane walls displace beyond the diaphragm in the first mode. The
deformation of the out-of-plane walls, shown in Fig. 6.4c, suggests that the walls endure
substantial activity between floor levels and is representative of all evaluated masonry
conditions. The out-of-plane wall deflects similar to a cantilevered beam above the first
floor level. The following paragraphs discuss the computed displacements and stresses
in the walls and diaphragms.
(a) 3-D Unretrofitted Prototype Fundamental Mode Shape
FIG. 6.4 Unretrofitted Prototype Fundamental Mode Shape
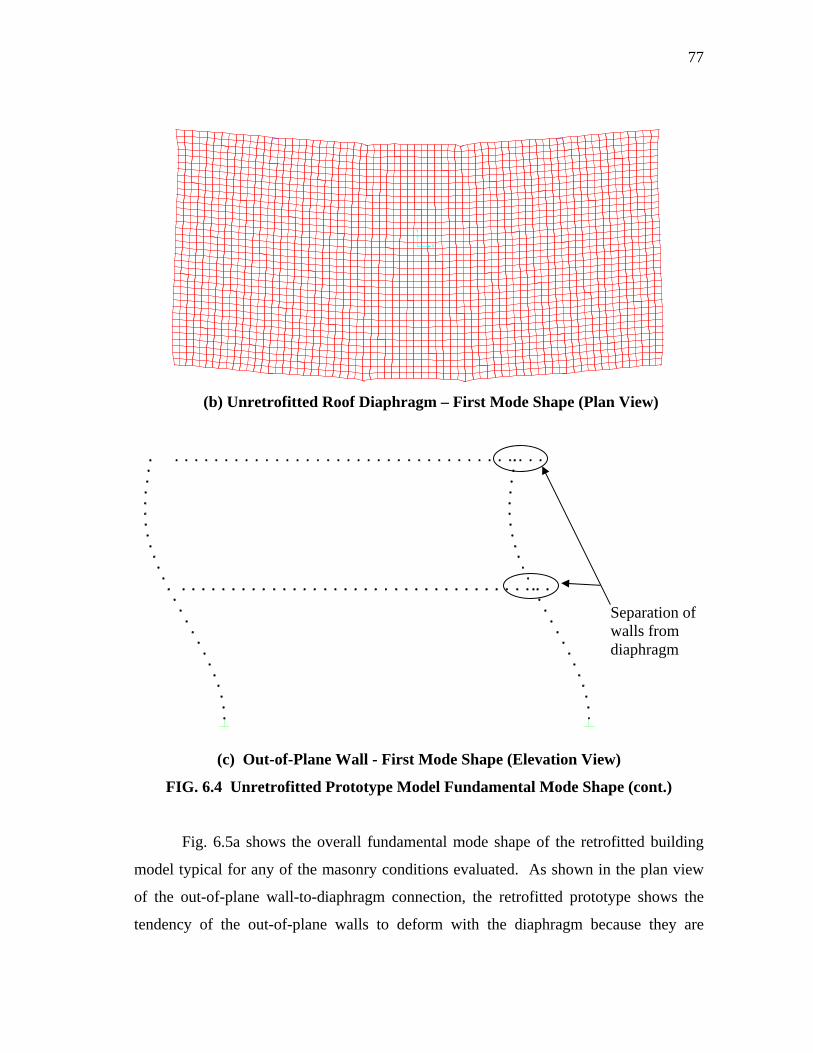
77
(b) Unretrofitted Roof Diaphragm – First Mode Shape (Plan View)
(c) Out-of-Plane Wall - First Mode Shape (Elevation View)
FIG. 6.4 Unretrofitted Prototype Model Fundamental Mode Shape (cont.)
Fig. 6.5a shows the overall fundamental mode shape of the retrofitted building
model typical for any of the masonry conditions evaluated. As shown in the plan view
of the out-of-plane wall-to-diaphragm connection, the retrofitted prototype shows the
tendency of the out-of-plane walls to deform with the diaphragm because they are
Separation of walls from diaphragm
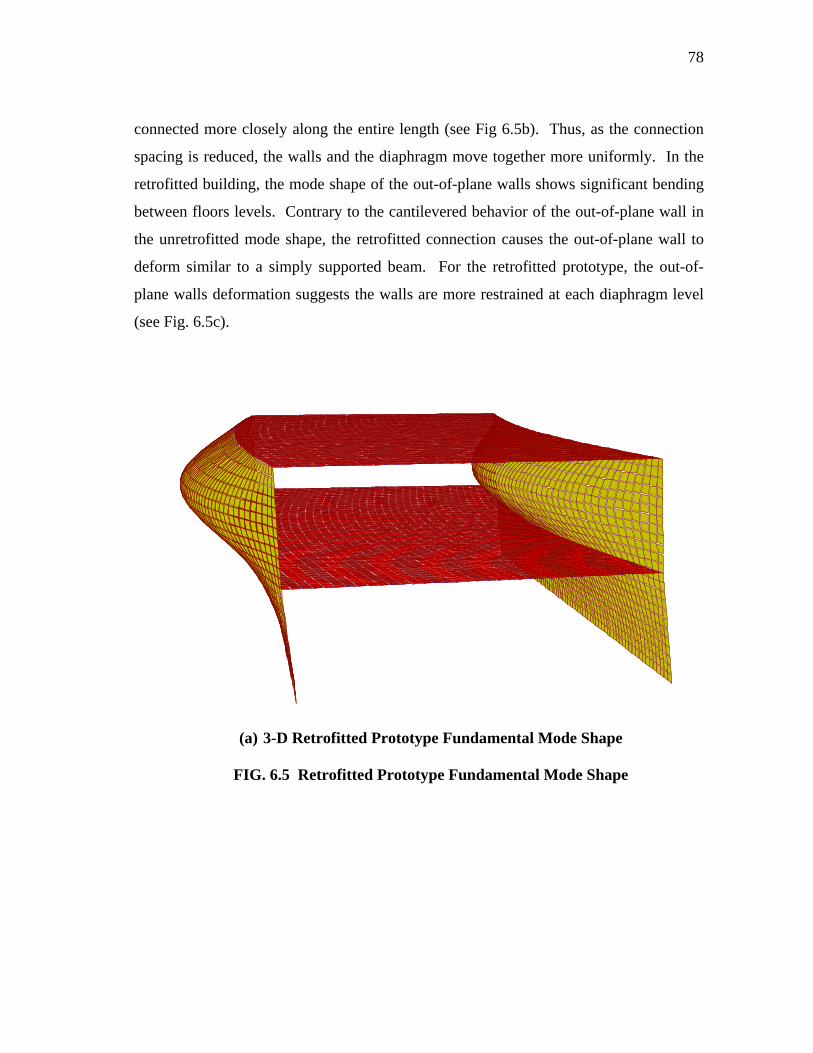
78
connected more closely along the entire length (see Fig 6.5b). Thus, as the connection
spacing is reduced, the walls and the diaphragm move together more uniformly. In the
retrofitted building, the mode shape of the out-of-plane walls shows significant bending
between floors levels. Contrary to the cantilevered behavior of the out-of-plane wall in
the unretrofitted mode shape, the retrofitted connection causes the out-of-plane wall to
deform similar to a simply supported beam. For the retrofitted prototype, the out-of-
plane walls deformation suggests the walls are more restrained at each diaphragm level
(see Fig. 6.5c).
(a) 3-D Retrofitted Prototype Fundamental Mode Shape
FIG. 6.5 Retrofitted Prototype Fundamental Mode Shape
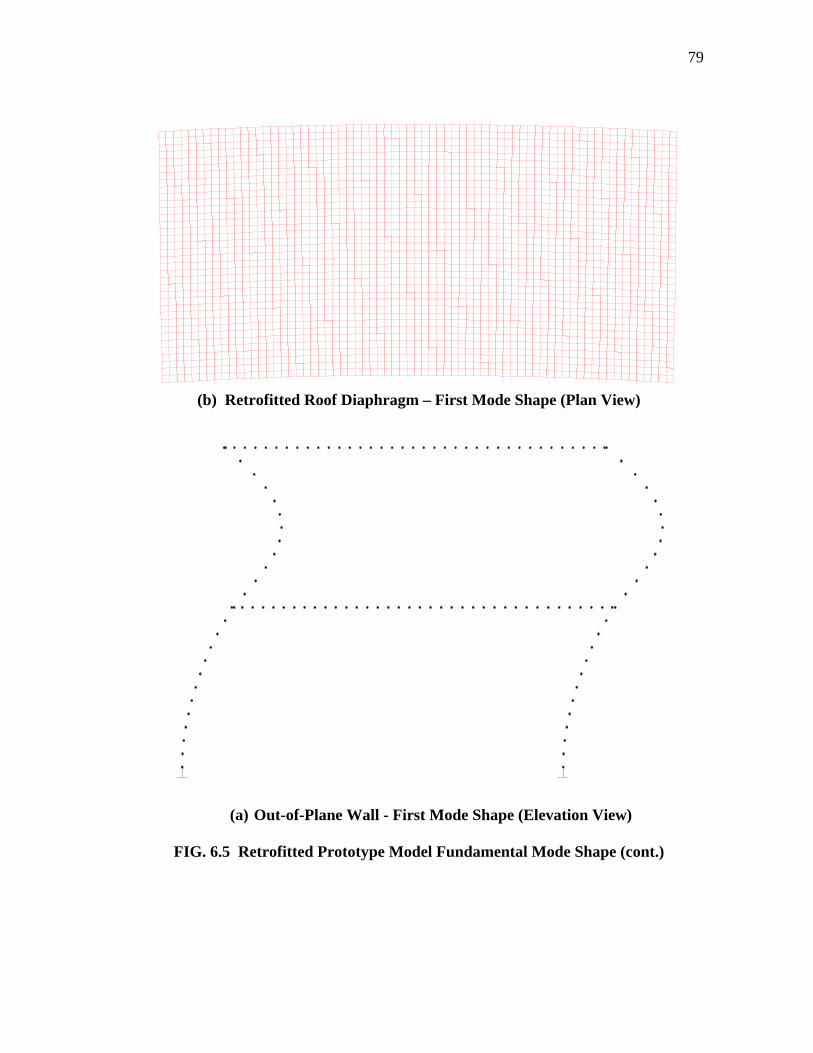
79
(b) Retrofitted Roof Diaphragm – First Mode Shape (Plan View)
(a) Out-of-Plane Wall - First Mode Shape (Elevation View)
FIG. 6.5 Retrofitted Prototype Model Fundamental Mode Shape (cont.)
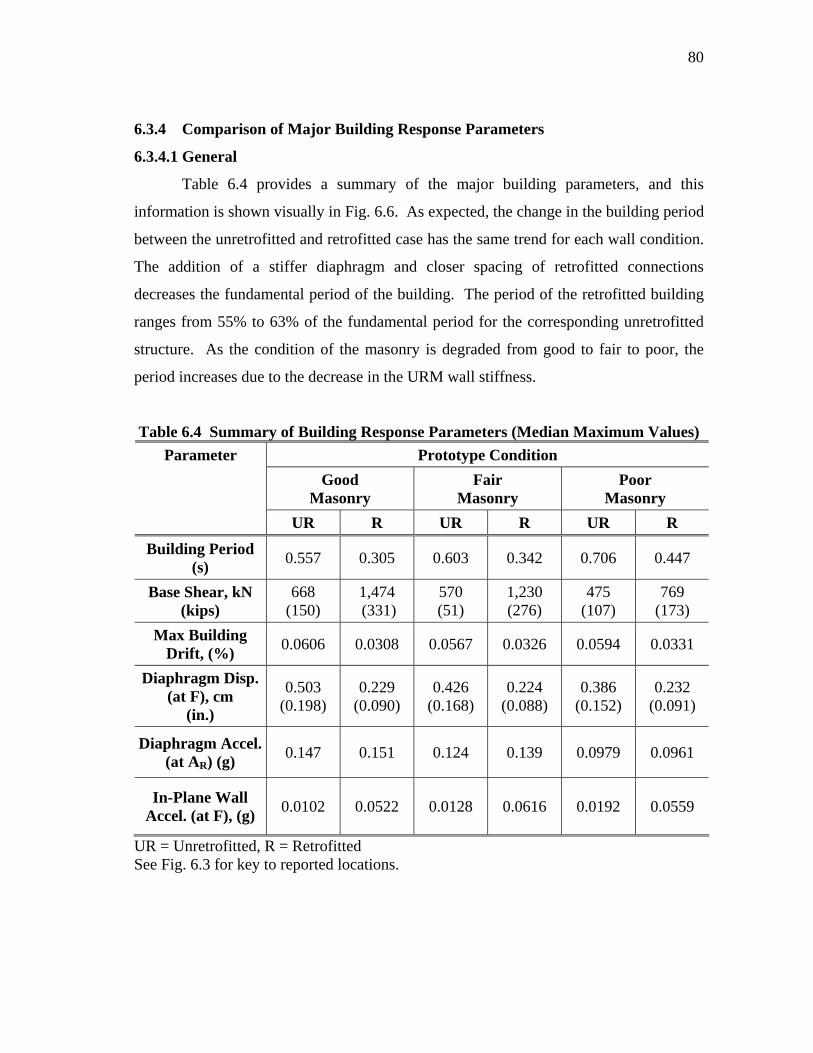
80
6.3.4 Comparison of Major Building Response Parameters
6.3.4.1 General
Table 6.4 provides a summary of the major building parameters, and this
information is shown visually in Fig. 6.6. As expected, the change in the building period
between the unretrofitted and retrofitted case has the same trend for each wall condition.
The addition of a stiffer diaphragm and closer spacing of retrofitted connections
decreases the fundamental period of the building. The period of the retrofitted building
ranges from 55% to 63% of the fundamental period for the corresponding unretrofitted
structure. As the condition of the masonry is degraded from good to fair to poor, the
period increases due to the decrease in the URM wall stiffness.
Table 6.4 Summary of Building Response Parameters (Median Maximum Values) Prototype Condition
Good Masonry
Fair Masonry
Poor Masonry
Parameter
UR R UR R UR R Building Period
(s) 0.557 0.305 0.603 0.342 0.706 0.447
Base Shear, kN (kips)
668 (150)
1,474 (331)
570 (51)
1,230 (276)
475 (107)
769 (173)
Max Building Drift, (%) 0.0606 0.0308 0.0567 0.0326 0.0594 0.0331
Diaphragm Disp. (at F), cm
(in.)
0.503 (0.198)
0.229 (0.090)
0.426 (0.168)
0.224 (0.088)
0.386 (0.152)
0.232 (0.091)
Diaphragm Accel. (at AR) (g) 0.147 0.151 0.124 0.139 0.0979 0.0961
In-Plane Wall Accel. (at F), (g) 0.0102 0.0522 0.0128 0.0616 0.0192 0.0559
UR = Unretrofitted, R = Retrofitted See Fig. 6.3 for key to reported locations.
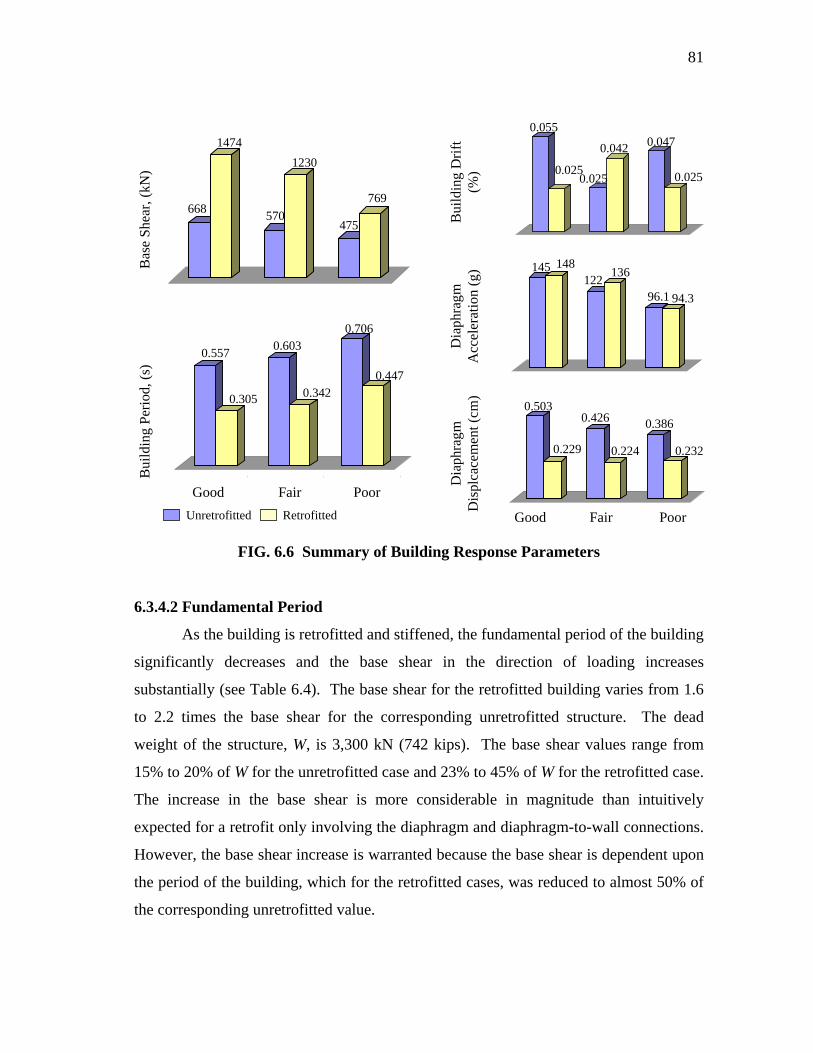
81
0.503
0.229
0.426
0.224
0.386
0.232
668
1474
570
1230
475
769
Bui
ldin
g Pe
riod,
(s)
Good Fair Poor
Bas
e Sh
ear,
(kN
)
Dia
phra
gm
Dis
plca
cem
ent(
cm)
Good Fair Poor
Dia
phra
gm
Acc
eler
atio
n (g
)B
uild
ing
Drif
t (%
)
0.557
0.305
0.603
0.342
0.706
0.447
0.055
0.0250.025
0.042 0.047
0.025
145 148122 136
96.1 94.3
Unretrofitted Retrofitted
FIG. 6.6 Summary of Building Response Parameters
6.3.4.2 Fundamental Period
As the building is retrofitted and stiffened, the fundamental period of the building
significantly decreases and the base shear in the direction of loading increases
substantially (see Table 6.4). The base shear for the retrofitted building varies from 1.6
to 2.2 times the base shear for the corresponding unretrofitted structure. The dead
weight of the structure, W, is 3,300 kN (742 kips). The base shear values range from
15% to 20% of W for the unretrofitted case and 23% to 45% of W for the retrofitted case.
The increase in the base shear is more considerable in magnitude than intuitively
expected for a retrofit only involving the diaphragm and diaphragm-to-wall connections.
However, the base shear increase is warranted because the base shear is dependent upon
the period of the building, which for the retrofitted cases, was reduced to almost 50% of
the corresponding unretrofitted value.
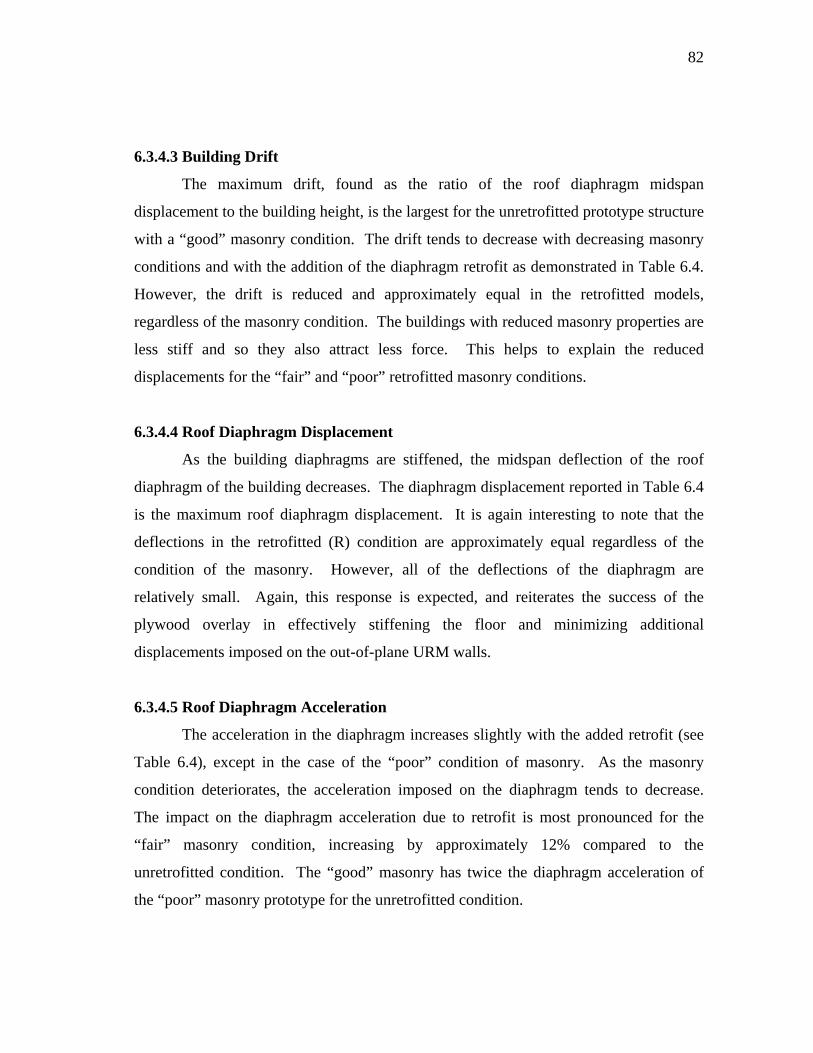
82
6.3.4.3 Building Drift
The maximum drift, found as the ratio of the roof diaphragm midspan
displacement to the building height, is the largest for the unretrofitted prototype structure
with a “good” masonry condition. The drift tends to decrease with decreasing masonry
conditions and with the addition of the diaphragm retrofit as demonstrated in Table 6.4.
However, the drift is reduced and approximately equal in the retrofitted models,
regardless of the masonry condition. The buildings with reduced masonry properties are
less stiff and so they also attract less force. This helps to explain the reduced
displacements for the “fair” and “poor” retrofitted masonry conditions.
6.3.4.4 Roof Diaphragm Displacement
As the building diaphragms are stiffened, the midspan deflection of the roof
diaphragm of the building decreases. The diaphragm displacement reported in Table 6.4
is the maximum roof diaphragm displacement. It is again interesting to note that the
deflections in the retrofitted (R) condition are approximately equal regardless of the
condition of the masonry. However, all of the deflections of the diaphragm are
relatively small. Again, this response is expected, and reiterates the success of the
plywood overlay in effectively stiffening the floor and minimizing additional
displacements imposed on the out-of-plane URM walls.
6.3.4.5 Roof Diaphragm Acceleration
The acceleration in the diaphragm increases slightly with the added retrofit (see
Table 6.4), except in the case of the “poor” condition of masonry. As the masonry
condition deteriorates, the acceleration imposed on the diaphragm tends to decrease.
The impact on the diaphragm acceleration due to retrofit is most pronounced for the
“fair” masonry condition, increasing by approximately 12% compared to the
unretrofitted condition. The “good” masonry has twice the diaphragm acceleration of
the “poor” masonry prototype for the unretrofitted condition.
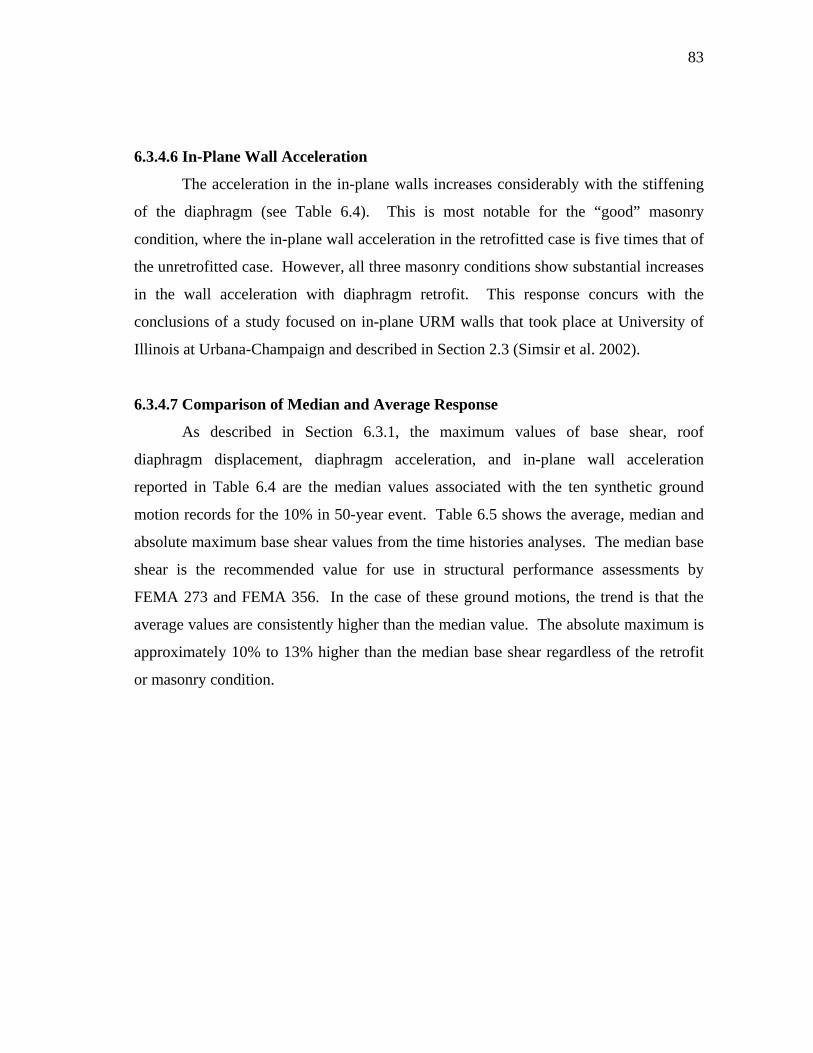
83
6.3.4.6 In-Plane Wall Acceleration
The acceleration in the in-plane walls increases considerably with the stiffening
of the diaphragm (see Table 6.4). This is most notable for the “good” masonry
condition, where the in-plane wall acceleration in the retrofitted case is five times that of
the unretrofitted case. However, all three masonry conditions show substantial increases
in the wall acceleration with diaphragm retrofit. This response concurs with the
conclusions of a study focused on in-plane URM walls that took place at University of
Illinois at Urbana-Champaign and described in Section 2.3 (Simsir et al. 2002).
6.3.4.7 Comparison of Median and Average Response
As described in Section 6.3.1, the maximum values of base shear, roof
diaphragm displacement, diaphragm acceleration, and in-plane wall acceleration
reported in Table 6.4 are the median values associated with the ten synthetic ground
motion records for the 10% in 50-year event. Table 6.5 shows the average, median and
absolute maximum base shear values from the time histories analyses. The median base
shear is the recommended value for use in structural performance assessments by
FEMA 273 and FEMA 356. In the case of these ground motions, the trend is that the
average values are consistently higher than the median value. The absolute maximum is
approximately 10% to 13% higher than the median base shear regardless of the retrofit
or masonry condition.
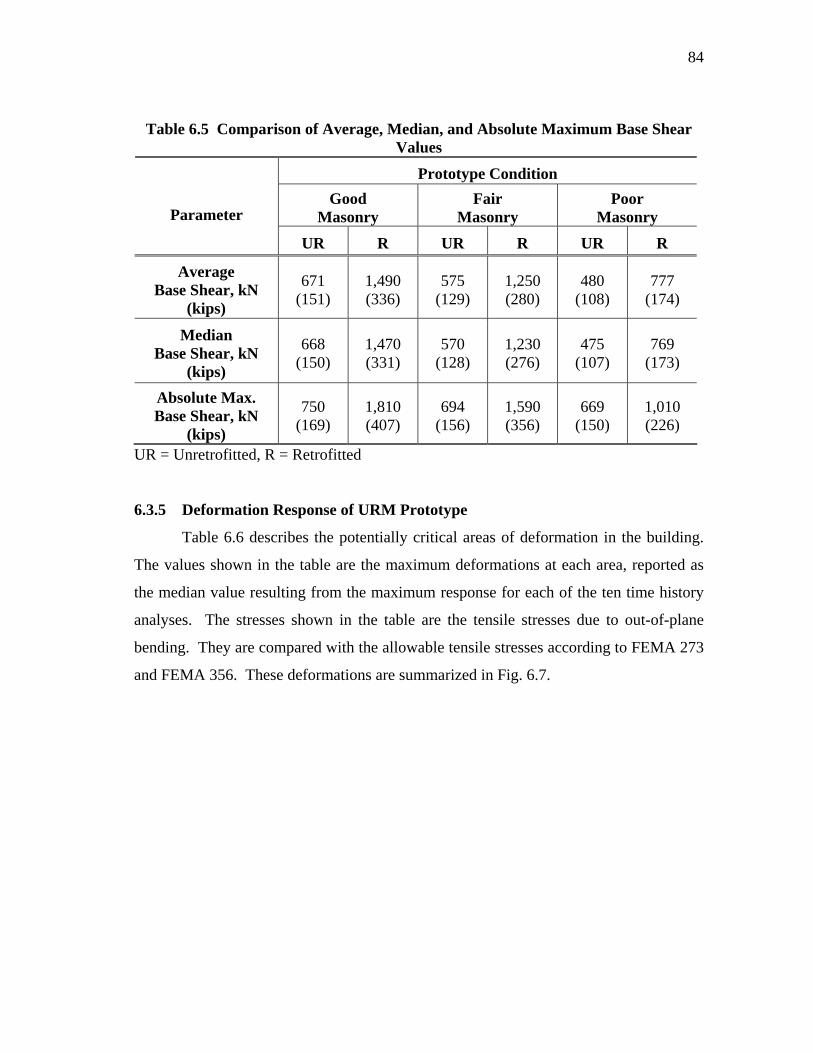
84
Table 6.5 Comparison of Average, Median, and Absolute Maximum Base Shear Values
Prototype Condition Good
Masonry Fair
Masonry Poor
Masonry Parameter
UR R UR R UR R
Average Base Shear, kN
(kips)
671 (151)
1,490 (336)
575 (129)
1,250 (280)
480 (108)
777 (174)
Median Base Shear, kN
(kips)
668 (150)
1,470 (331)
570 (128)
1,230 (276)
475 (107)
769 (173)
Absolute Max. Base Shear, kN
(kips)
750 (169)
1,810 (407)
694 (156)
1,590 (356)
669 (150)
1,010 (226)
UR = Unretrofitted, R = Retrofitted
6.3.5 Deformation Response of URM Prototype
Table 6.6 describes the potentially critical areas of deformation in the building.
The values shown in the table are the maximum deformations at each area, reported as
the median value resulting from the maximum response for each of the ten time history
analyses. The stresses shown in the table are the tensile stresses due to out-of-plane
bending. They are compared with the allowable tensile stresses according to FEMA 273
and FEMA 356. These deformations are summarized in Fig. 6.7.
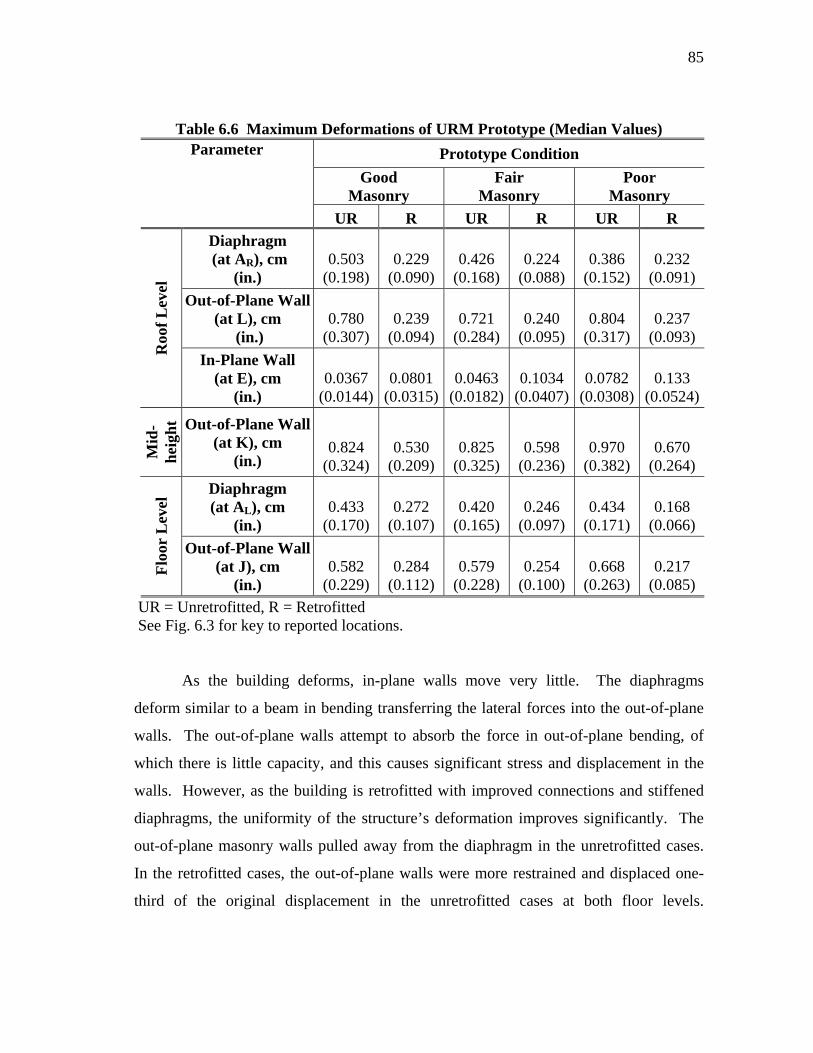
85
Table 6.6 Maximum Deformations of URM Prototype (Median Values) Prototype Condition
Good Masonry
Fair Masonry
Poor Masonry
Parameter
UR R UR R UR R Diaphragm (at AR), cm
(in.) 0.503
(0.198) 0.229
(0.090) 0.426
(0.168) 0.224
(0.088) 0.386
(0.152) 0.232
(0.091) Out-of-Plane Wall
(at L), cm (in.)
0.780 (0.307)
0.239 (0.094)
0.721 (0.284)
0.240 (0.095)
0.804 (0.317)
0.237 (0.093)
Roo
f Lev
el
In-Plane Wall (at E), cm
(in.) 0.0367
(0.0144)0.0801
(0.0315)0.0463
(0.0182)0.1034
(0.0407)0.0782
(0.0308) 0.133
(0.0524)
Mid
-he
ight
Out-of-Plane Wall (at K), cm
(in.) 0.824
(0.324) 0.530
(0.209) 0.825
(0.325) 0.598
(0.236) 0.970
(0.382) 0.670
(0.264) Diaphragm (at AL), cm
(in.) 0.433
(0.170) 0.272
(0.107) 0.420
(0.165) 0.246
(0.097) 0.434
(0.171) 0.168
(0.066)
Floo
r L
evel
Out-of-Plane Wall (at J), cm
(in.) 0.582
(0.229) 0.284
(0.112) 0.579
(0.228) 0.254
(0.100) 0.668
(0.263) 0.217
(0.085) UR = Unretrofitted, R = Retrofitted See Fig. 6.3 for key to reported locations.
As the building deforms, in-plane walls move very little. The diaphragms
deform similar to a beam in bending transferring the lateral forces into the out-of-plane
walls. The out-of-plane walls attempt to absorb the force in out-of-plane bending, of
which there is little capacity, and this causes significant stress and displacement in the
walls. However, as the building is retrofitted with improved connections and stiffened
diaphragms, the uniformity of the structure’s deformation improves significantly. The
out-of-plane masonry walls pulled away from the diaphragm in the unretrofitted cases.
In the retrofitted cases, the out-of-plane walls were more restrained and displaced one-
third of the original displacement in the unretrofitted cases at both floor levels.
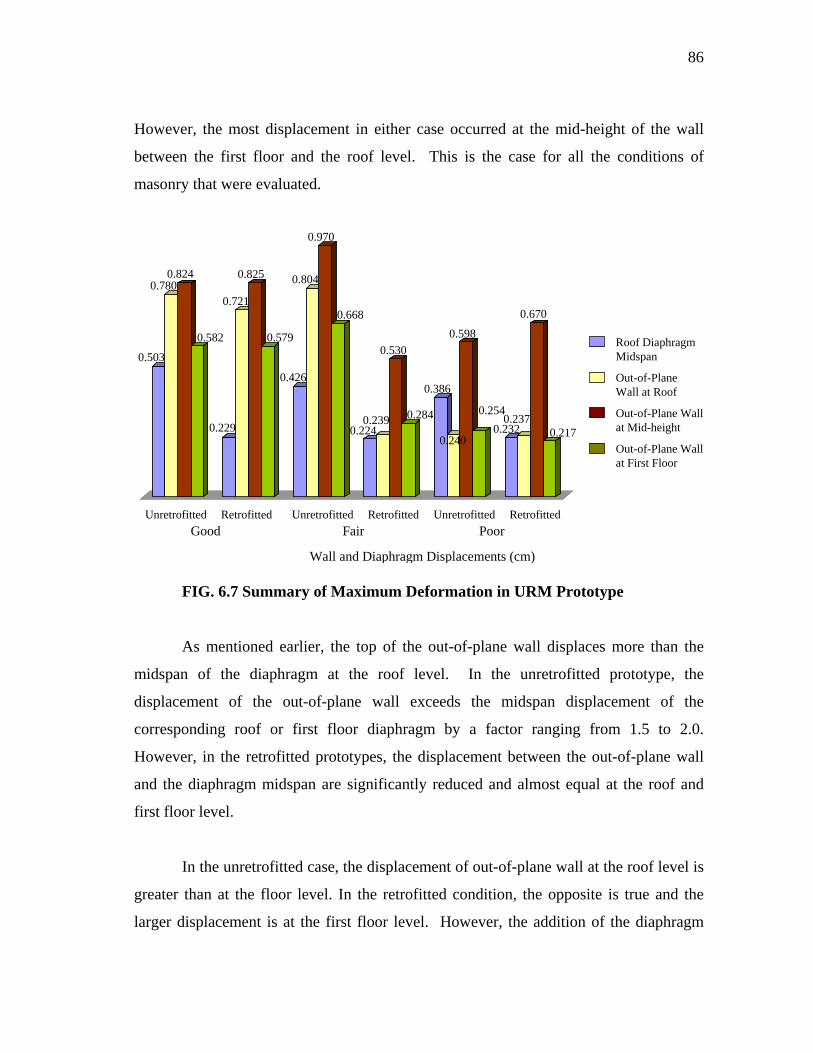
86
However, the most displacement in either case occurred at the mid-height of the wall
between the first floor and the roof level. This is the case for all the conditions of
masonry that were evaluated.
0.503
0.7800.824
0.582
0.229
0.721
0.825
0.579
0.426
0.804
0.970
0.668
0.2240.239
0.530
0.284
0.386
0.240
0.598
0.2540.232
0.237
0.670
0.217
Unretrofitted Retrofitted RetrofittedUnretrofitted UnretrofittedGood Fair Poor
Roof Diaphragm Midspan
Out-of-Plane Wall at Roof
Out-of-Plane Wall at First Floor
Out-of-Plane Wall at Mid-height
Wall and Diaphragm Displacements (cm)
Retrofitted
FIG. 6.7 Summary of Maximum Deformation in URM Prototype
As mentioned earlier, the top of the out-of-plane wall displaces more than the
midspan of the diaphragm at the roof level. In the unretrofitted prototype, the
displacement of the out-of-plane wall exceeds the midspan displacement of the
corresponding roof or first floor diaphragm by a factor ranging from 1.5 to 2.0.
However, in the retrofitted prototypes, the displacement between the out-of-plane wall
and the diaphragm midspan are significantly reduced and almost equal at the roof and
first floor level.
In the unretrofitted case, the displacement of out-of-plane wall at the roof level is
greater than at the floor level. In the retrofitted condition, the opposite is true and the
larger displacement is at the first floor level. However, the addition of the diaphragm
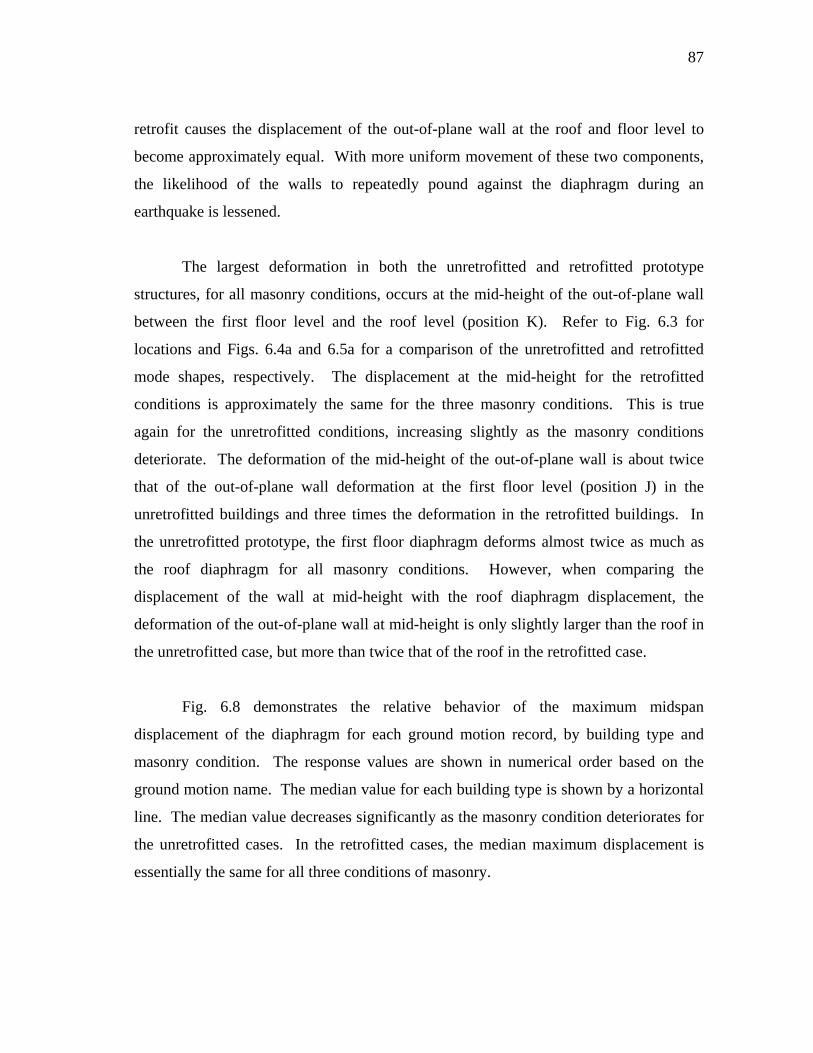
87
retrofit causes the displacement of the out-of-plane wall at the roof and floor level to
become approximately equal. With more uniform movement of these two components,
the likelihood of the walls to repeatedly pound against the diaphragm during an
earthquake is lessened.
The largest deformation in both the unretrofitted and retrofitted prototype
structures, for all masonry conditions, occurs at the mid-height of the out-of-plane wall
between the first floor level and the roof level (position K). Refer to Fig. 6.3 for
locations and Figs. 6.4a and 6.5a for a comparison of the unretrofitted and retrofitted
mode shapes, respectively. The displacement at the mid-height for the retrofitted
conditions is approximately the same for the three masonry conditions. This is true
again for the unretrofitted conditions, increasing slightly as the masonry conditions
deteriorate. The deformation of the mid-height of the out-of-plane wall is about twice
that of the out-of-plane wall deformation at the first floor level (position J) in the
unretrofitted buildings and three times the deformation in the retrofitted buildings. In
the unretrofitted prototype, the first floor diaphragm deforms almost twice as much as
the roof diaphragm for all masonry conditions. However, when comparing the
displacement of the wall at mid-height with the roof diaphragm displacement, the
deformation of the out-of-plane wall at mid-height is only slightly larger than the roof in
the unretrofitted case, but more than twice that of the roof in the retrofitted case.
Fig. 6.8 demonstrates the relative behavior of the maximum midspan
displacement of the diaphragm for each ground motion record, by building type and
masonry condition. The response values are shown in numerical order based on the
ground motion name. The median value for each building type is shown by a horizontal
line. The median value decreases significantly as the masonry condition deteriorates for
the unretrofitted cases. In the retrofitted cases, the median maximum displacement is
essentially the same for all three conditions of masonry.
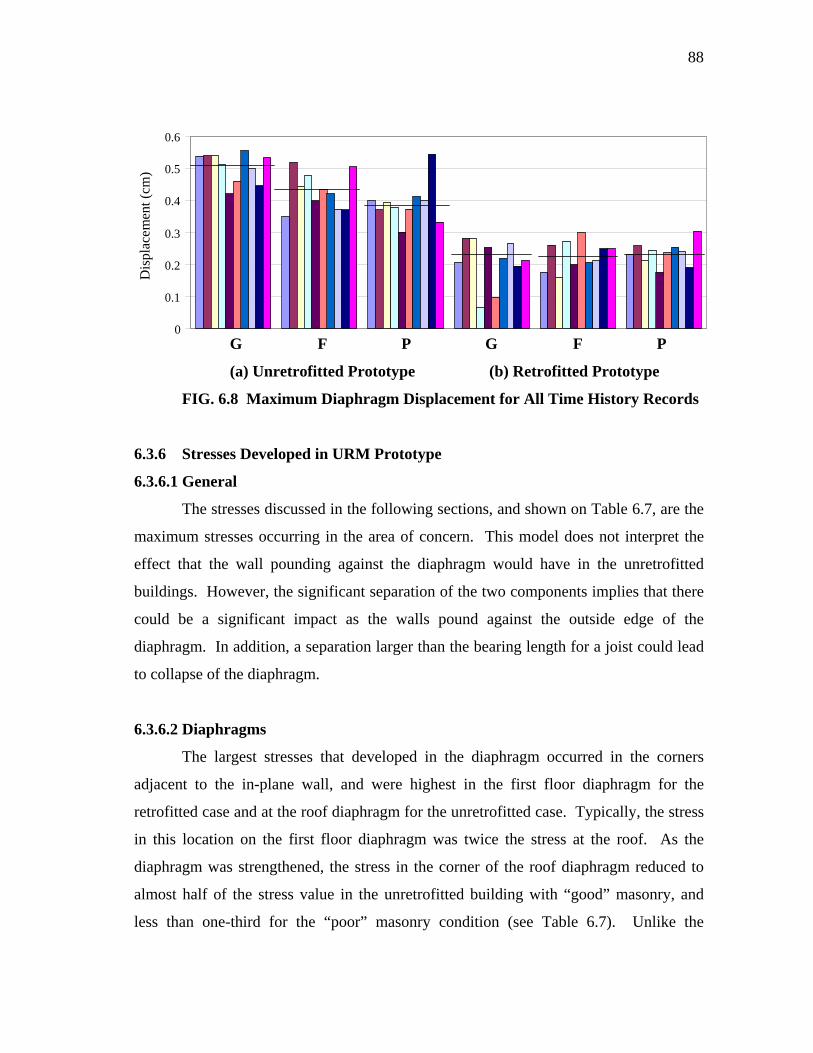
88
0
0.1
0.2
0.3
0.4
0.5
0.6D
ispl
acem
ent (
cm)
G F P G F P
(a) Unretrofitted Prototype (b) Retrofitted Prototype
FIG. 6.8 Maximum Diaphragm Displacement for All Time History Records
6.3.6 Stresses Developed in URM Prototype
6.3.6.1 General
The stresses discussed in the following sections, and shown on Table 6.7, are the
maximum stresses occurring in the area of concern. This model does not interpret the
effect that the wall pounding against the diaphragm would have in the unretrofitted
buildings. However, the significant separation of the two components implies that there
could be a significant impact as the walls pound against the outside edge of the
diaphragm. In addition, a separation larger than the bearing length for a joist could lead
to collapse of the diaphragm.
6.3.6.2 Diaphragms
The largest stresses that developed in the diaphragm occurred in the corners
adjacent to the in-plane wall, and were highest in the first floor diaphragm for the
retrofitted case and at the roof diaphragm for the unretrofitted case. Typically, the stress
in this location on the first floor diaphragm was twice the stress at the roof. As the
diaphragm was strengthened, the stress in the corner of the roof diaphragm reduced to
almost half of the stress value in the unretrofitted building with “good” masonry, and
less than one-third for the “poor” masonry condition (see Table 6.7). Unlike the
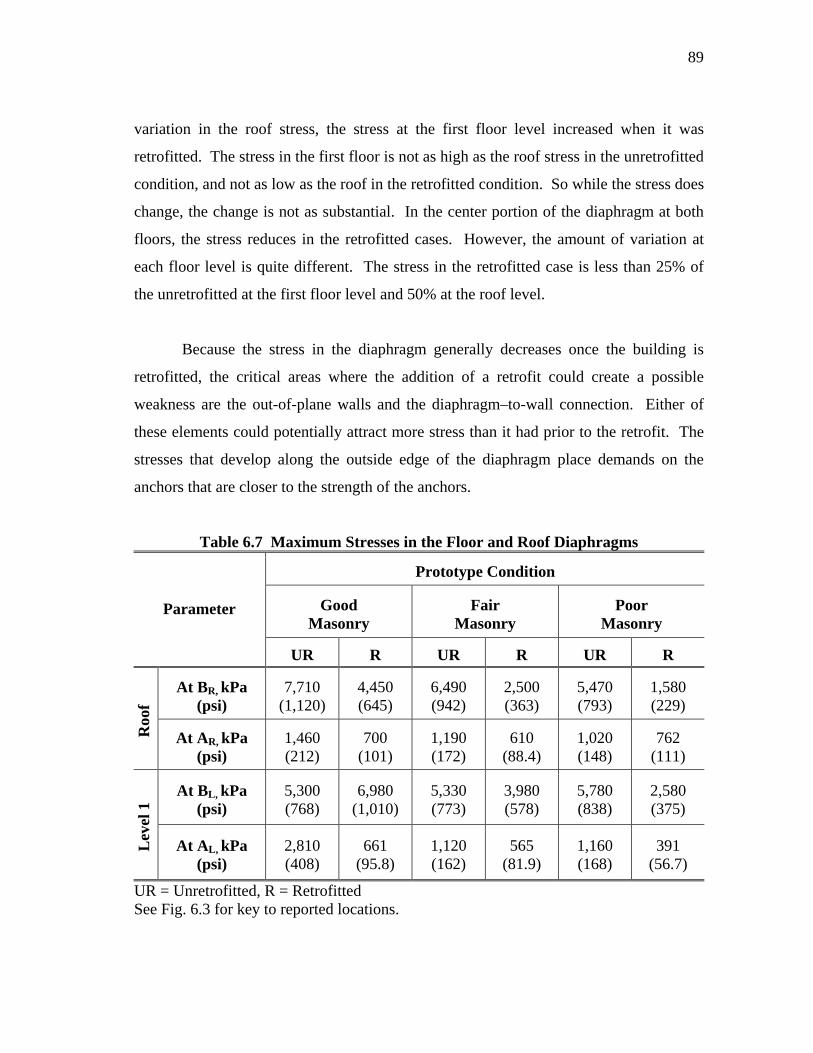
89
variation in the roof stress, the stress at the first floor level increased when it was
retrofitted. The stress in the first floor is not as high as the roof stress in the unretrofitted
condition, and not as low as the roof in the retrofitted condition. So while the stress does
change, the change is not as substantial. In the center portion of the diaphragm at both
floors, the stress reduces in the retrofitted cases. However, the amount of variation at
each floor level is quite different. The stress in the retrofitted case is less than 25% of
the unretrofitted at the first floor level and 50% at the roof level.
Because the stress in the diaphragm generally decreases once the building is
retrofitted, the critical areas where the addition of a retrofit could create a possible
weakness are the out-of-plane walls and the diaphragm–to-wall connection. Either of
these elements could potentially attract more stress than it had prior to the retrofit. The
stresses that develop along the outside edge of the diaphragm place demands on the
anchors that are closer to the strength of the anchors.
Table 6.7 Maximum Stresses in the Floor and Roof Diaphragms
Prototype Condition
Good Masonry
Fair Masonry
Poor Masonry
Parameter
UR R UR R UR R
At BR, kPa (psi)
7,710 (1,120)
4,450 (645)
6,490 (942)
2,500 (363)
5,470 (793)
1,580 (229)
Roo
f
At AR, kPa (psi)
1,460 (212)
700 (101)
1,190 (172)
610 (88.4)
1,020 (148)
762 (111)
At BL, kPa (psi)
5,300 (768)
6,980 (1,010)
5,330 (773)
3,980 (578)
5,780 (838)
2,580 (375)
Lev
el 1
At AL, kPa (psi)
2,810 (408)
661 (95.8)
1,120 (162)
565 (81.9)
1,160 (168)
391 (56.7)
UR = Unretrofitted, R = Retrofitted See Fig. 6.3 for key to reported locations.
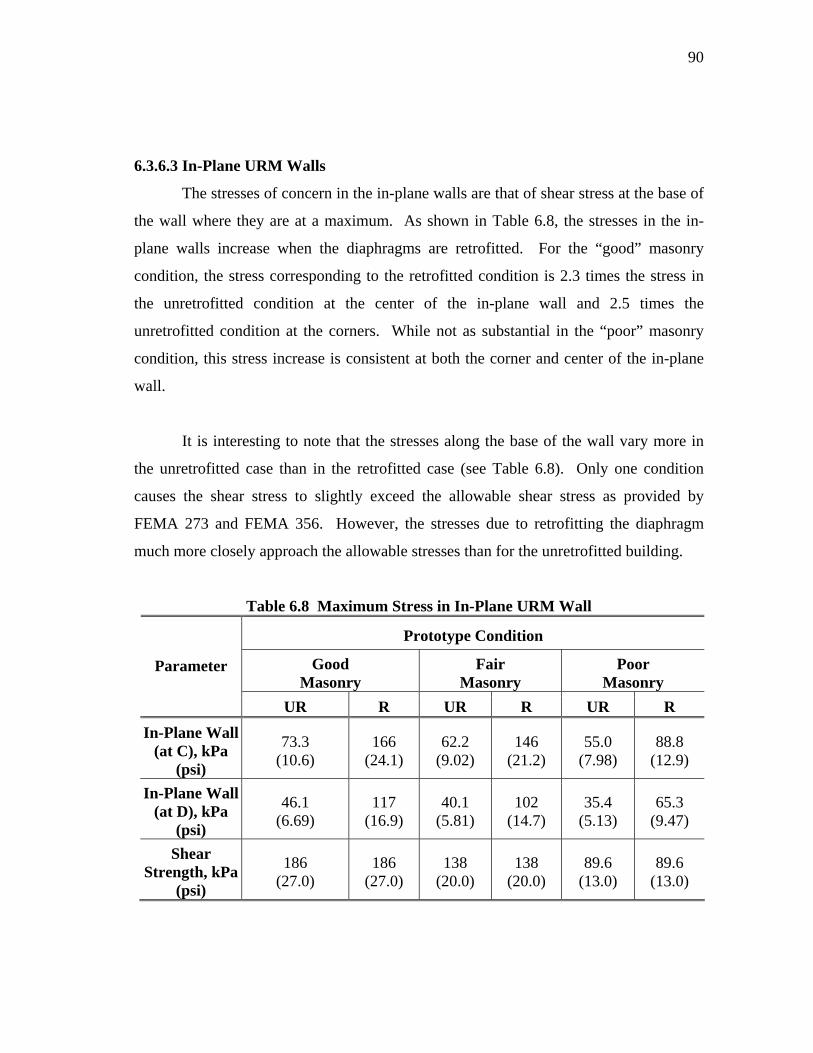
90
6.3.6.3 In-Plane URM Walls
The stresses of concern in the in-plane walls are that of shear stress at the base of
the wall where they are at a maximum. As shown in Table 6.8, the stresses in the in-
plane walls increase when the diaphragms are retrofitted. For the “good” masonry
condition, the stress corresponding to the retrofitted condition is 2.3 times the stress in
the unretrofitted condition at the center of the in-plane wall and 2.5 times the
unretrofitted condition at the corners. While not as substantial in the “poor” masonry
condition, this stress increase is consistent at both the corner and center of the in-plane
wall.
It is interesting to note that the stresses along the base of the wall vary more in
the unretrofitted case than in the retrofitted case (see Table 6.8). Only one condition
causes the shear stress to slightly exceed the allowable shear stress as provided by
FEMA 273 and FEMA 356. However, the stresses due to retrofitting the diaphragm
much more closely approach the allowable stresses than for the unretrofitted building.
Table 6.8 Maximum Stress in In-Plane URM Wall
Prototype Condition
Good Masonry
Fair Masonry
Poor Masonry
Parameter
UR R UR R UR R In-Plane Wall
(at C), kPa (psi)
73.3 (10.6)
166 (24.1)
62.2 (9.02)
146 (21.2)
55.0 (7.98)
88.8 (12.9)
In-Plane Wall (at D), kPa
(psi)
46.1 (6.69)
117 (16.9)
40.1 (5.81)
102 (14.7)
35.4 (5.13)
65.3 (9.47)
Shear Strength, kPa
(psi)
186 (27.0)
186 (27.0)
138 (20.0)
138 (20.0)
89.6 (13.0)
89.6 (13.0)
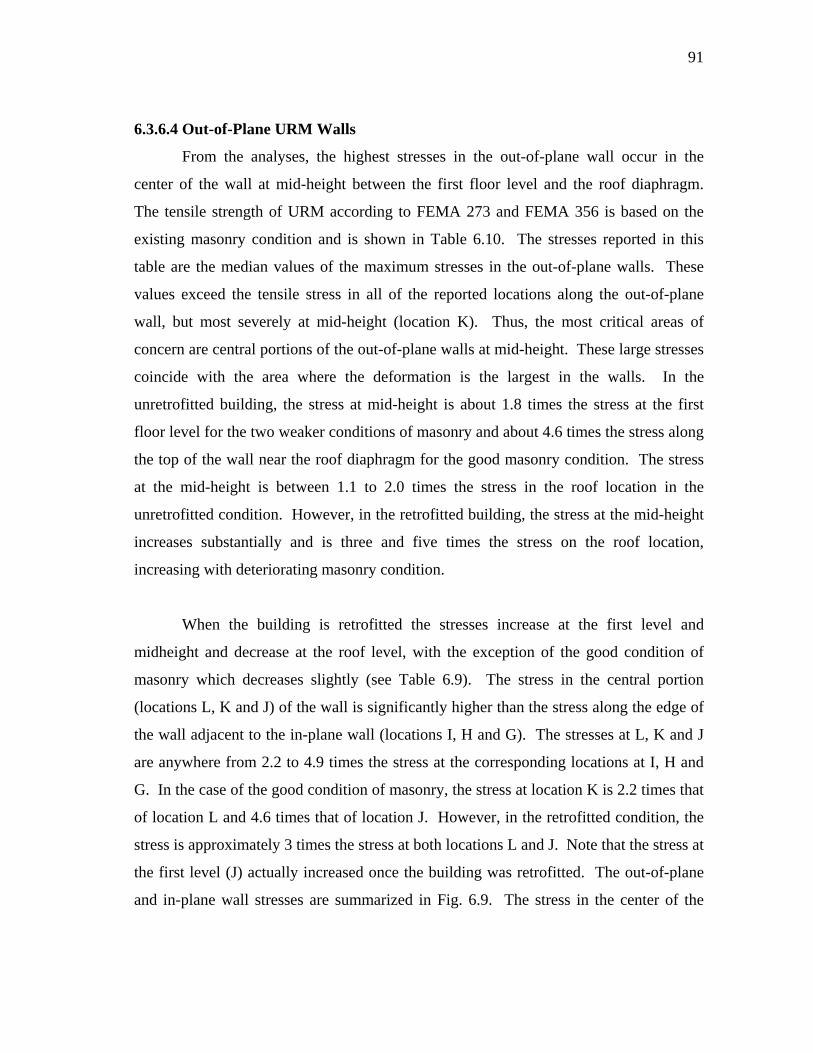
91
6.3.6.4 Out-of-Plane URM Walls
From the analyses, the highest stresses in the out-of-plane wall occur in the
center of the wall at mid-height between the first floor level and the roof diaphragm.
The tensile strength of URM according to FEMA 273 and FEMA 356 is based on the
existing masonry condition and is shown in Table 6.10. The stresses reported in this
table are the median values of the maximum stresses in the out-of-plane walls. These
values exceed the tensile stress in all of the reported locations along the out-of-plane
wall, but most severely at mid-height (location K). Thus, the most critical areas of
concern are central portions of the out-of-plane walls at mid-height. These large stresses
coincide with the area where the deformation is the largest in the walls. In the
unretrofitted building, the stress at mid-height is about 1.8 times the stress at the first
floor level for the two weaker conditions of masonry and about 4.6 times the stress along
the top of the wall near the roof diaphragm for the good masonry condition. The stress
at the mid-height is between 1.1 to 2.0 times the stress in the roof location in the
unretrofitted condition. However, in the retrofitted building, the stress at the mid-height
increases substantially and is three and five times the stress on the roof location,
increasing with deteriorating masonry condition.
When the building is retrofitted the stresses increase at the first level and
midheight and decrease at the roof level, with the exception of the good condition of
masonry which decreases slightly (see Table 6.9). The stress in the central portion
(locations L, K and J) of the wall is significantly higher than the stress along the edge of
the wall adjacent to the in-plane wall (locations I, H and G). The stresses at L, K and J
are anywhere from 2.2 to 4.9 times the stress at the corresponding locations at I, H and
G. In the case of the good condition of masonry, the stress at location K is 2.2 times that
of location L and 4.6 times that of location J. However, in the retrofitted condition, the
stress is approximately 3 times the stress at both locations L and J. Note that the stress at
the first level (J) actually increased once the building was retrofitted. The out-of-plane
and in-plane wall stresses are summarized in Fig. 6.9. The stress in the center of the
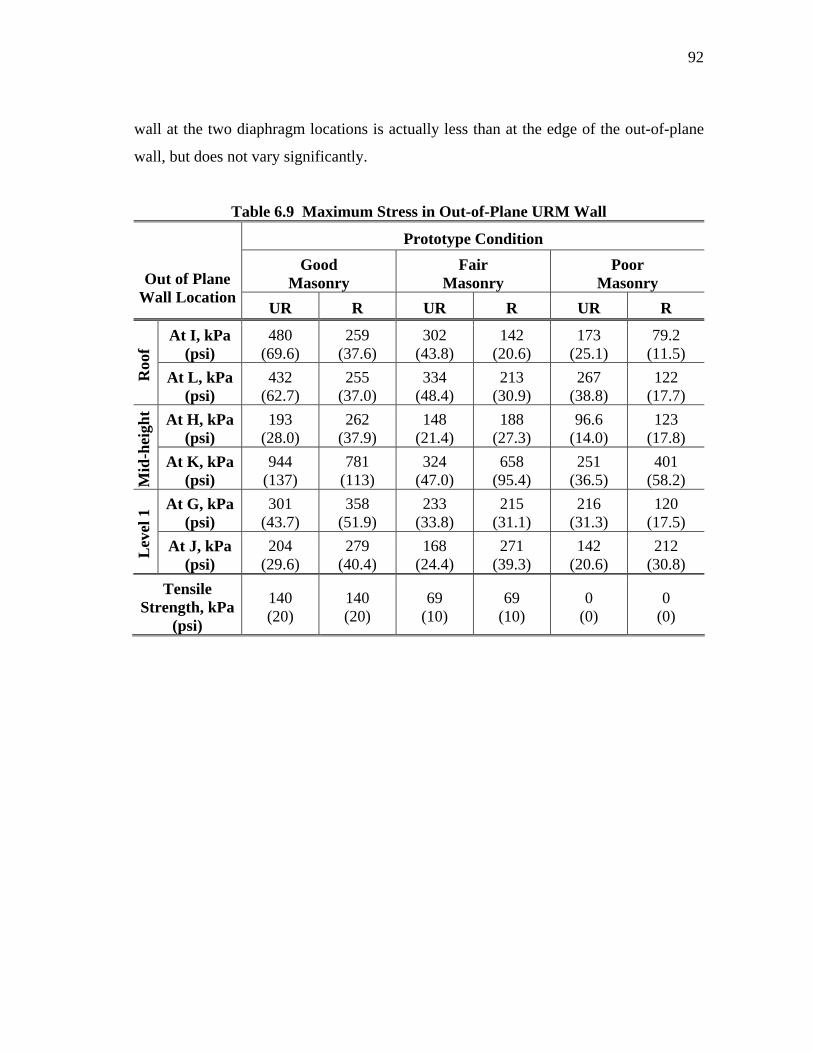
92
wall at the two diaphragm locations is actually less than at the edge of the out-of-plane
wall, but does not vary significantly.
Table 6.9 Maximum Stress in Out-of-Plane URM Wall
Prototype Condition Good
Masonry Fair
Masonry Poor
Masonry Out of Plane Wall Location
UR R UR R UR R
Tensile Strength, kPa
(psi)
140 (20)
140 (20)
69 (10)
69 (10)
0 (0)
0 (0)
At I, kPa (psi)
480 (69.6)
259 (37.6)
302 (43.8)
142 (20.6)
173 (25.1)
79.2 (11.5)
Roo
f
At L, kPa (psi)
432 (62.7)
255 (37.0)
334 (48.4)
213 (30.9)
267 (38.8)
122 (17.7)
At H, kPa (psi)
193 (28.0)
262 (37.9)
148 (21.4)
188 (27.3)
96.6 (14.0)
123 (17.8)
Mid
-hei
ght
At K, kPa (psi)
944 (137)
781 (113)
324 (47.0)
658 (95.4)
251 (36.5)
401 (58.2)
At G, kPa (psi)
301 (43.7)
358 (51.9)
233 (33.8)
215 (31.1)
216 (31.3)
120 (17.5)
Lev
el 1
At J, kPa (psi)
204 (29.6)
279 (40.4)
168 (24.4)
271 (39.3)
142 (20.6)
212 (30.8)
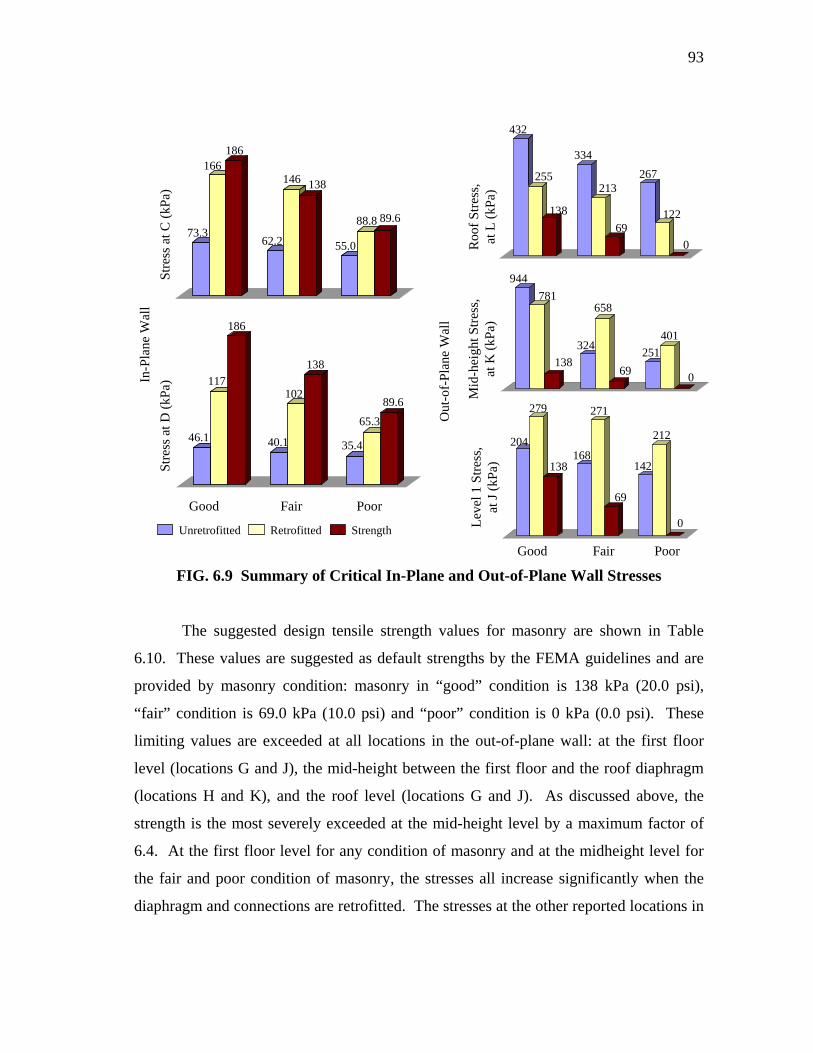
93
73.3
166186
62.2
146 138
55.0
88.8 89.6
46.1
117
186
40.1
102
138
35.4
65.389.6
204
279
138168
271
69
142
212
0
944781
138324
658
69251
401
0
432
255
138
334
213
69
267
122
0
In-P
lane
Wal
l
Good Fair
Unretrofitted Retrofitted Strength
Poor
Leve
l 1 S
tress
,at
J (k
Pa)
Good Fair Poor
Mid
-hei
ght S
tress
,at
K (k
Pa)
Roo
f Stre
ss,
at L
(kPa
)
Stre
ss a
t D (k
Pa)
Stre
ss a
t C (k
Pa)
Out
-of-
Plan
e W
all
FIG. 6.9 Summary of Critical In-Plane and Out-of-Plane Wall Stresses
The suggested design tensile strength values for masonry are shown in Table
6.10. These values are suggested as default strengths by the FEMA guidelines and are
provided by masonry condition: masonry in “good” condition is 138 kPa (20.0 psi),
“fair” condition is 69.0 kPa (10.0 psi) and “poor” condition is 0 kPa (0.0 psi). These
limiting values are exceeded at all locations in the out-of-plane wall: at the first floor
level (locations G and J), the mid-height between the first floor and the roof diaphragm
(locations H and K), and the roof level (locations G and J). As discussed above, the
strength is the most severely exceeded at the mid-height level by a maximum factor of
6.4. At the first floor level for any condition of masonry and at the midheight level for
the fair and poor condition of masonry, the stresses all increase significantly when the
diaphragm and connections are retrofitted. The stresses at the other reported locations in
94
the out-of-plane wall decrease as the diaphragm and connections are retrofitted, but still
far exceed the allowable stress for URM.
The suggested design shear strength of masonry is shown in Table 6.8. These
values are suggested as default strengths by the FEMA guidelines and provided by
masonry condition: masonry in “good” condition is 186 kPa (27.0 psi), “fair” condition
is 138 kPa (20.0 psi) and “poor” condition is 89.6 kPa (13.0 psi). The allowable stress is
not exceeded at either location in the in-plane walls with the exception of the “fair”
condition of masonry at location C. However, in the retrofitted prototype, the in-plane
stress approaches the allowable stress. At location C in the in-plane wall, the demand
comes within 10% of the allowable stress.
6.2.6.5 Connections
As discussed in Section 6.2.1.4, the strength of the retrofitted connection would
be designed such that it is not a weak link that would fail first. Because the modeling
included strong connections that were not necessarily based on the strength of an actual
retrofitted connection, the parametric results for the connections are not specifically
discussed here. However, the above results demonstrate the benefit of adding retrofit
connections at a relatively close spacing.
6.4 SUMMARY OF PARAMETRIC STUDY RESULTS
The parametric study demonstrates that retrofitting the diaphragms changes the
response of the building system. The performance of the diaphragm is improved in that
the deflections are minimized at both the roof and first floor level and the stresses are
decreased at each level, with one exception that does not exceed the diaphragm strength.
Although the stress demands on the in-plane walls did not exceed the allowable stress,
the stresses increased significantly and approach the allowable strength. Had the study
evaluated a more intense earthquake, such as less frequent seismic event, it is likely that
these results would be different.
95
The diaphragm retrofits mitigated the displacement of the out-of-plane walls,
which is expected to improve their stability. However, the out-of-plane wall stresses in
the unretrofitted model exceeded the allowable stress, and the situation was worsened
with a retrofitted diaphragm and connection. The areas that already had high stresses
showed substantially increased stresses for the retrofitted case. The central portion of
the walls, which had the highest stress and the most severe displacement in the
unretrofitted cases, had amplified values for the retrofitted case. In both the unretrofitted
and retrofitted cases, the stresses exceed the allowable tensile strength for out-of-plane
bending. The diaphragm retrofits also led to increased stresses in the in-plane walls,
along with increased base shear forces. Except for one case, the in-plane wall stresses
remained within the allowable shear stress limits. Based on these observations, it is not
recommended to retrofit the diaphragm without a structure-specific study on the
redistribution of lateral forces to the out-of-plane walls, along with an evaluation of the
impact of the retrofit on the in-plane walls and the foundation.
6.5 DISCUSSION
It should be noted that the results of this study are specific to the parameters used
for the analysis. Several of these parameters are discussed below to highlight their
importance to the outcome of the LSP analysis and evaluation.
The accelerations used for the LSP are affected by two primary components: the
soil type and local ground motions. Soil type C, as defined by
FEMA 273 and FEMA 356, requiring no soil amplification factors, was used for this
study to not overestimate the expected damage to the case study structures. While this
soil type is appropriate for much of the St. Louis area, the Mid-America region
commonly has type D soils and in some locations type E soils. The short period spectral
acceleration values change from 1.2 for type C soil to 1.6 and 2.5 for type D and E soil,
respectively; while the one second period spectral acceleration values increase from 1.7
96
for type C to 2.4 and 3.5 for type D and E, respectively. FEMA 273 and FEMA 356
specify that the demands governing the rehabilitation design criteria should be based on
the larger of the following: 1) the smaller of 10% in 50 years earthquake or two-thirds
of a 2% in 50 years earthquake evaluated considering the Life Safety Performance Level
or 2) the 2% in 50 years earthquake considering the Collapse Prevention Performance
Level. The demands for this study were based on ground motion records representing an
earthquake that would have a 10% probability of exceedance in 50 years (10% in 50
years). Depending on local soil conditions and building type, the seismic demand may
be greater than that considered in this study.
Typical large openings present in many URM buildings were not included in the
analytical models for this study. The presence of these openings would greatly affect the
structures ability to redistribute lateral forces when the building is retrofitted. It is noted
that wall openings could have a significant impact on the structural performance.
The parameters appropriate for this study demonstrated that with a solid wall
model and relatively low seismic demands, the out-of-plane wall performance was not
satisfactory. Therefore, it is anticipated that similar structures in other parts of Mid-
America could have even more significant vulnerabilities when evaluated using FEMA
273 and 356.
97
7. CONCLUSIONS
7.1 SUMMARY
This research study focused on evaluating the seismic performance of existing
and rehabilitated wood floor and roof diaphragms in typical pre-1950s, unreinforced
masonry (URM) buildings found in the Central and Eastern portions of the United
States. Specifically there were two major objectives: (1) to assess the adequacy of
current seismic guidelines for evaluating existing wood diaphragms in pre-1950s URM
buildings and for designing necessary retrofits; and (2) to evaluate the effect of
diaphragm retrofits, as designed by FEMA guidelines, on the overall response of URM
structures.
The first objective was accomplished by utilizing two case study buildings
located in St. Louis, Missouri, and evaluating them according to current seismic
rehabilitation guidelines, FEMA 273 and FEMA 356. Each of the four analysis
procedures provided in these guidelines was considered. However, only the Linear
Static Procedure (LSP) was applicable for evaluating diaphragms in typical URM
structures as components. Both FEMA 273 and FEMA 356 were used to allow an
evaluation of the consistency of the results between the two guidelines. The procedures
produced the recommendations shown in Table 7.1 for a satisfactory diaphragm retrofit,
with the bolded retrofits being the most likely selected retrofits in practice because they
are the most economic choices. If other constraints, such as aesthetics, were a concern, a
different retrofit from the selection may be chosen. Intermediate steps in the FEMA 356
LSP gave significantly different values than FEMA 273, but ultimately the two
guidelines gave the same retrofit solutions, with two more retrofit possibilities provided
by FEMA 356.
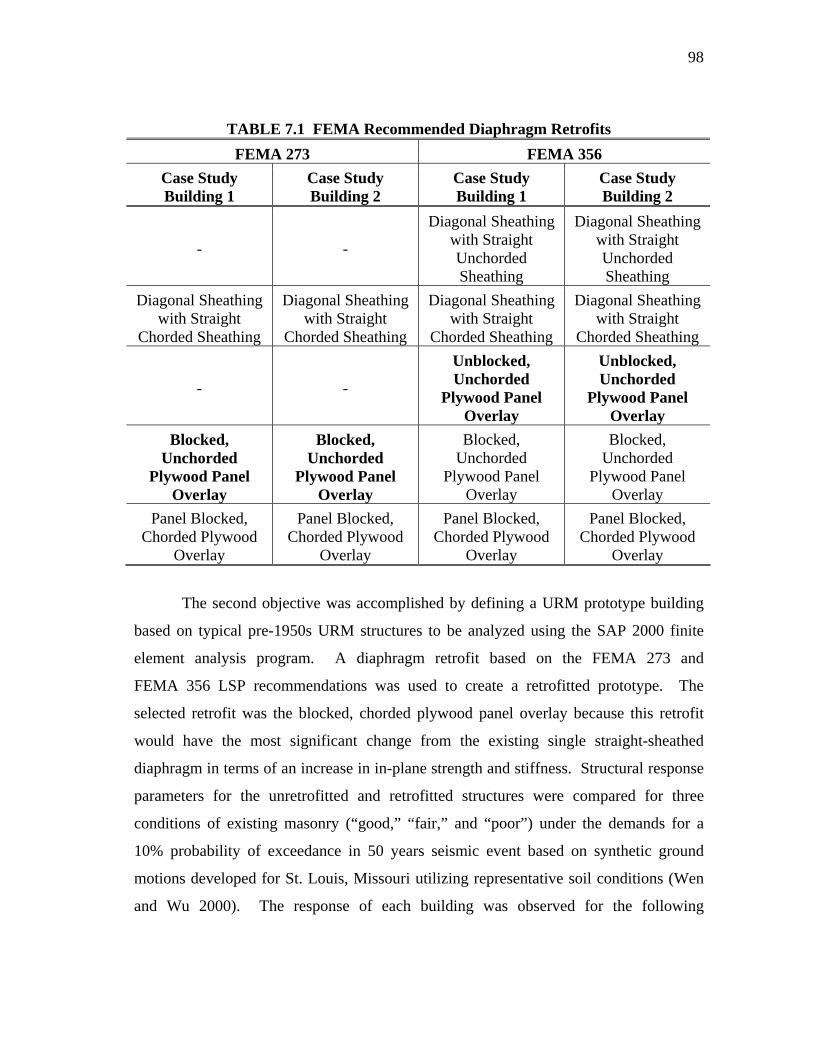
98
TABLE 7.1 FEMA Recommended Diaphragm Retrofits FEMA 273 FEMA 356
Case Study Building 1
Case Study Building 2
Case Study Building 1
Case Study Building 2
- -
Diagonal Sheathing with Straight Unchorded Sheathing
Diagonal Sheathing with Straight Unchorded Sheathing
Diagonal Sheathing with Straight
Chorded Sheathing
Diagonal Sheathing with Straight
Chorded Sheathing
Diagonal Sheathing with Straight
Chorded Sheathing
Diagonal Sheathing with Straight
Chorded Sheathing
- -
Unblocked, Unchorded
Plywood Panel Overlay
Unblocked, Unchorded
Plywood Panel Overlay
Blocked, Unchorded
Plywood Panel Overlay
Blocked, Unchorded
Plywood Panel Overlay
Blocked, Unchorded
Plywood Panel Overlay
Blocked, Unchorded
Plywood Panel Overlay
Panel Blocked, Chorded Plywood
Overlay
Panel Blocked, Chorded Plywood
Overlay
Panel Blocked, Chorded Plywood
Overlay
Panel Blocked, Chorded Plywood
Overlay
The second objective was accomplished by defining a URM prototype building
based on typical pre-1950s URM structures to be analyzed using the SAP 2000 finite
element analysis program. A diaphragm retrofit based on the FEMA 273 and
FEMA 356 LSP recommendations was used to create a retrofitted prototype. The
selected retrofit was the blocked, chorded plywood panel overlay because this retrofit
would have the most significant change from the existing single straight-sheathed
diaphragm in terms of an increase in in-plane strength and stiffness. Structural response
parameters for the unretrofitted and retrofitted structures were compared for three
conditions of existing masonry (“good,” “fair,” and “poor”) under the demands for a
10% probability of exceedance in 50 years seismic event based on synthetic ground
motions developed for St. Louis, Missouri utilizing representative soil conditions (Wen
and Wu 2000). The response of each building was observed for the following
99
components: the wood floor and roof diaphragms, the out-of-plane walls, and the in-
plane walls. Each response was compared to applicable strength and deformation
criteria.
7.2 CONCLUSIONS
The following conclusions were drawn from this study.
1. Three of the four analysis procedures provided in FEMA 273 and FEMA 356
were not desirable for the purposes of evaluating and selecting a rehabilitation
approach for the diaphragm as a component in existing URM structures with the
documentation provided. The Nonlinear Static Procedure, the Linear Dynamic
Procedure, and the Nonlinear Dynamic Procedure all required analytical
modeling of the entire structure as part of these procedures. Creating a finite-
element model containing nonlinear properties that accurately predicts damage
mechanisms in the URM walls is a significant task, because this behavior is not
well understood, and such a model would require simplifying assumptions.
While considering the system behavior is important, the focus of this work was
on the diaphragm components and so this approach was not taken for the first
phase of this study that focused on case study buildings.
2. Both FEMA 273 and FEMA 356 permit the possibility of rehabilitating the
diaphragm without retrofitting the out-of-plane walls. The out-of-plane wall
acceptance criteria consisted of height-to-thickness limits for the walls that
depend on the wall location, building safety objective, and spectral response
parameter. The existing condition of the masonry and the diaphragm stiffness is
not taken into consideration.
3. Using the LSP from either FEMA 273 or FEMA 356, the existing diaphragms
were not acceptable according to the provided acceptance criteria; hence both
100
case study buildings require a retrofit. The LSP from each of the guidelines
permit three of the same diaphragm retrofits for the case study buildings.
However, FEMA 356 had two additional retrofits that met the acceptance criteria
for Life Safety performance. The LSP from FEMA 273 and FEMA 356 predict
the same strength for the diaphragm, but the demand from FEMA 273 is twice
that of the value from FEMA 356. Along these same lines, FEMA 273 gives
larger values for the diaphragm forces and the base shear by factors of 2.3 and
3.1, respectively, as compared to FEMA 356. However, the FEMA 356
estimation of the diaphragm midspan displacement and the building period is
more than double the corresponding FEMA 273 values due to differences in the
equations used to estimate these quantities.
4. The parametric study gave the following observations for the general building
response parameters for each masonry condition. The stiffening of the structure
from the diaphragm retrofit caused the building period to decrease with a
corresponding increase in the base shear. Both the displacement and acceleration
for the roof diaphragm decreased when it was retrofitted. However, the 10% in
50 years seismic event used in the evaluation did not impose demands that were
large enough to give significant displacements for either the unretrofitted or
retrofitted cases. In addition, the building drift also decreased, but was not
substantial even in the unretrofitted case. The acceleration in the in-plane walls
increased substantially when the diaphragm was retrofitted.
5. For the parametric study, the most significant change in the structural response
took place in the central portion of the out-of-plane walls. The results of the
analysis showed the following:
• The tensile stresses caused by out-of-plane bending in the out-of-plane walls
exceed the allowable tensile stress for the unretrofitted case and more than
101
double when the diaphragms are retrofitted. This is generally true for all
reported locations on the out-of-plane wall.
• The deformed first mode shape of the out-of-plane walls changed
significantly from the unretrofitted model to the retrofitted model. In the
unretrofitted model, the out-of-plane wall arched away from the building
between diaphragm levels as though it were cantilevering from the base. In
the retrofitted building, the out-of-plane wall deformed as though it were a
two-span beam, supported laterally at each floor level.
6. The stresses at the reported locations of the in-plane wall did not exceed the
allowable shear strength. However, for the retrofitted condition, the stresses
increased significantly and approached the allowable strength.
7. According to the FEMA 273 and FEMA 356 LSP recommendations, the
diaphragm can be retrofitted as long as it meets certain criteria for deformation-
controlled elements, and acceptable retrofits are given for the rehabilitation. In
evaluating a single component, the LSP allows for the rehabilitation of the wood
diaphragms without the rehabilitation of the walls because these case study
buildings met the acceptable out-of-plane wall height-to-thickness ratios. A
complete evaluation according to the FEMA guidelines would include all
components. The results of the parametric study show that the addition of a
diaphragm retrofit causes more severe stresses in the out-of-plane walls than with
the existing diaphragm, with a potentially hazardous effect. These stresses
cannot be sustained in the out-of-plane walls without some form of rehabilitation.
Therefore, a diaphragm retrofit should be accompanied by an evaluation of the
remaining structural components and those components should also be
retrofitted, if necessary, to ensure adequate seismic performance of the complete
structure.
102
7.3 RECOMMENDATIONS FOR FUTURE WORK
The following recommendations for future research would provide additional
information necessary for the further development of guidelines for the seismic
rehabilitation of wood floor and roof diaphragms in existing URM structures, along with
a better understanding of the behavior of pre-1950s URM buildings. The suggested
analytical work should be complemented by experimental studies.
1. The FEMA 273 and FEMA 356 guidelines provide an important first step in
giving guidance for seismic rehabilitation of buildings, including URM
structures. More information should be provided in the guidelines to provide
guidance for modeling URM structures to reduce error due to oversimplification.
This may include development of an accessible analytical model that more
accurately predicts the behavior of URM walls and wood diaphragms or
additional specific guidance for modeling these components as part of the
structural system.
2. Nonlinear modeling of similar URM structures with wood floor and roof
diaphragms using time history analyses would provide an improved
understanding of the effect the diaphragm retrofit has on the response of the
system into the inelastic range of behavior.
3. An additional parametric study is suggested for a higher intensity earthquake, the
2% in 50 years seismic event, evaluated for the Collapse Prevention Performance
Level, again using representative soil conditions. A complete parametric study
should evaluate the effect of wall and diaphragm openings, plan aspect ratio, and
building height on the structural response of typical URM buildings. For these
conditions, the use of a nonlinear model will be even more critical.
103
REFERENCES
Abrams, D.P. (1992). “Strength and Behavior of Unreinforced Masonry Elements,”
Proc., 10th World Conf. in Earthquake Engineering, Madrid, Spain, June, 3475-
3480.
Applied Technology Council (ATC) (1997a). NEHRP Guidelines for the Seismic
Rehabilitation of Buildings (FEMA Publication 273), Building Seismic Safety
Council, Washington, D.C.
Applied Technology Council (ATC) (1997b). NEHRP Commentary on the Guidelines
for the Seismic Rehabilitation of Buildings (FEMA Publication 274), Building
Seismic Safety Council, Washington, D.C.
American Society of Civil Engineers (ASCE) (2000). NEHRP Prestandard and
Commentary on the Guidelines for the Seismic Rehabilitation of Buildings
(FEMA Publication 356), Building Seismic Safety Council, Washington, D.C.
CSI (1999). SAP2000 Non-Linear V7.10, Computers and Structures, Inc., Berkeley,
California.
Cohen, G.L., Klinger, R.E., Hayes, J.R. Jr., and Sweeney, S.C. (2002). “Seismic
Response of Low-Rise Masonry Buildings with Flexible Roof Diaphragms,”
Proc., 7th U.S. National Conf. on Earthquake Engineering, Boston, July,
available on CD-Rom only.
EQE (1989). The October 17, 1989 Loma Prieta Earthquake [report on the Internet].
c1989 [cited 2002 Aug 22]. “Commercial Structures,” [about 8 screens].
Available from: http://www.eqe.com/publications/lomaprie/lomaprie.htm

104
Erbay, O., and Abrams, D.P. (2001). “Seismic Rehabilitation of Unreinforced Masonry
Shear Walls,” Proc. of 9th Canadian Masonry Symposium, New Brunswick, June.
HKS (1998). “ABAQUS manual”. Hibbit, Karlsson & Sorensen, Inc., Providence, R.I.
Isoda, H., Folz, B., and Filiatrault, A. (2002) “Seismic Modeling of Index Woodframe
Buildings,” Consortium for Universities for Research in Earthquake Engineering,
June 2002.
Kariotis, J.C., Ewing, R.D., and Johnson, A.W. (ABK) (1985). “Predictions of Stability
of Unreinforced Masonry Shaken by Earthquakes,” Proc., 3rd North American
Masonry Conf., Arlington, June, paper 49.
TMS (2001). Masonry Designers’ Guide: Third Edition. The Masonry Society, Boulder,
CO.
Paquette, J., Bruneau, M., Filiatrault, A. (2001). “Out-of-Plane Seismic Evaluation and
Retrofit of Turn-of-the-Century North American Masonry Walls” J. Struct. Eng.
127(5), 561-567.
Peralta, D.F., Hueste, M.B.D., and Bracci, J.M. (2002). “Seismic Performance of
Rehabilitated Floor and Roof Diaphragms in Pre-1950’s Unreinforced Masonry
Buildings,” Proc., 7th U.S. National Conf. on Earthquake Engineering, Boston,
July, available on CD-Rom only.
105
Peralta, D.F., Bracci, J.M. and Hueste, M.D. (2003). “Seismic Performance of
Rehabilitated Wood Diaphragms,” Mid-America Earthquake Center, University
of Illinois at Urbana-Champaign, CD Release 03-01.
Peralta, D.F., Bracci, J.M. and Hueste, M.D. (2004), “Seismic Behavior of Wood
Diaphragms in Pre-1950s Unreinforced Masonry Buildings,” ASCE Journal of
Structural Engineering, V. 130, No. 12, Dec., pp. 2040-2050.
Simsir, C.C., Aschheim, M.A, and Abrams, D.P. (2002). “Response of Unreinforced
Masonry Bearing Walls Situated Normal to the Direction of Seismic Input
Motions,” Proc., 7th U.S. National Conf. on Earthquake Engineering, Boston,
July, available on CD-Rom only.
Tena-Colunga, A., and Abrams, D.P. (1996). “Seismic Behavior of Structures with
Flexible Diaphragms,” J. Struct. Eng., 122(4), 439-445.
Wen, Y.K., and C.L. Wu (2000). “Generation of Ground Motions for Mid-America
Cities,” Mid-America Earthquake Center, 27 Jan. 2000,
http://mae.ce.uiuc.edu/Research/RR-1/Gmotions/Index.html.
Yi, T., Moon, F., Leon, R., and Kahn, L. (2002). “Performance Characteristics of
Unreinforced Masonry Low-Rise Structure Before and After Rehabilitation,”
Proc., 7th U.S. National Conf. on Earthquake Engineering, Boston, July,
available on CD-Rom only.