seismic refraction survey of pleistocene drainage … · seismic refraction survey of pleistocene...
TRANSCRIPT

Seismic Refraction Survey of Pleistocene Drainage Channels in the Lower Great Miami River Valley, OhioGEOLOGICAL SURVEY PROFESSIONAL PAPER 605-B
Prepared in cooperation with the Miami
Conservancy District and the Ohio Department
of Natural Resources^ Division of
Columbus^ Ohio

Seismic Refraction Survey of Pleistocene Drainage Channels in the Lower Great Miami River Valley, OhioBy JOEL S. WATKINS and ANDREW M. SPIEKER
GROUND WATER IN THE LOWER GREAT MIAMI RIVER VALLEY, OHIO
GEOLOGICAL SURVEY PROFESSIONAL PAPER 605-B
Prepared in cooperation with the Miami
Conservancy District and the Ohio Department
of Natural Resources^ Division of
Columbus^ Ohio
UNITED STATES GOVERNMENT PRINTING OFFICE, WASHINGTON : 1971

UNITED STATES DEPARTMENT OF THE INTERIOR
ROGERS C. B. MORTON, Secretary
GEOLOGICAL SURVEY
W. A. Radlinski, Acting Director
Library of Congress catalog-card No. 79-610133
For sale by the Superintendent of Documents, U.S. Government Printing Office Washington, D.C. 20402 - Price $1.25 (paper cover)

CONTENTS
Abstract..-__________________________Introduction- ______-_____---_____---.
Purpose and scope._____-______-_.Previous investigations.___________Acknowledgments__ - _._____._-_.
Field procedures.-____________________Shothole depths and energy source-.Field-data analysis.-______________Field problems.__________________
The bedrock surface_________________Seismic-line designations___________The buried-valley system.____..__.Proposed Cincinnati well-field area. .Accuracy of depth determinations. ..Comparison of 1962 and 1963 results.
Page Bl
1 1 3 3 334444457
The bedrock surface Continued
Velocity reversals in till in the Fernald area._. Seismic velocities. ___-.I___.__--__-_._______._.
Velocity variations in porous media-__________Observed velocities... _ _____________________
Refraction measurements.______________The v0 layer.______________________The v\ layer.______________________Thei>2 layer.______________________Summary of refraction measurements.
Inhole measurements.__________________Interpretation of velocity data_________-_-__.
Summary. _____-___________.---___----_-__-_-_.Selected references. ____________________________
Page B9 10 10 12 12 1212131414141516
ILLUSTRATIONSPage
PLATE 1. Map showing contours on the bedrock surface and location of wells and seismic lines, lower Great Miami Rivervalley, Ohio,_____________-___________________________________--__----_---------------------- In pocket
FIGURE 1. Map showing area of seismic survey in southwestern Ohio. ______________-_------_------------------------ B22. Map showing contours of the bedrock surface at the site of the proposed Cincinnati well field, west of Fairfield__ 63. Diagrams showing comparison of results of delay-time and graphical interpretation techniques ________________ 84. Time-distance plot of first arrivals on line II_ __________________________-_------_------------------------ 95. Graph showing comparison of experimental data with velocity-porosity equations for unsaturated media__------ 116. Graph showing comparison of experimental data with velocity-porosity equations for sturated media ________ 117. Map showing lateral variation in smoothed velocities of the unsaturated zone between Hamilton and the Ohio
River.-________-.----_---___.__--_-_---.----------__-_---_-___-_____------_-_----------------- 13
TABLESPage
TABLE 1. Percentage of error in inferred depth to bedrock as a function of error in measurement of t>_ and v2 . ____________ B72. Bedrock velocities observed where former upland surface is covered by a veneer (less than 25 ft thick) of sand
and gravel--.________________________________________________-_____---__----.--------------------- 143. Drillers' logs of wells shot for velocity._______--_________________-----_-_------------------------------- ^4. Velocities observed in wells and in nearby seismic refraction lines_______-______-___-----_------------------ 15
in


GROUND WATER IN THE LOWER GREAT MIAMI RIVER VALLEY, OHIO
SEISMIC REFRACTION SURVEY OF PLEISTOCENE DRAINAGE CHANNELS IN THE LOWER GREAT MIAMI RIVER VALLEY,
OHIO
By JOEL S. WATKINS and A. M. SPIEKER
ABSTRACT
Largely on the basis of seismic refraction data, the U.S. Geological Survey mapped the bedrock surface of the ancestral Great Miami River valley between Dayton, Ohio, and the Ohio River and determined the thickness of sand and gravel deposits in the buried valley. The data indicate that a major buried valley, 200-300 feet deep and about 2 miles wide, is entrenched in the bedrock. The ancestral valley generally follows the course of the present Great Miami River but is north and west of the river throughout much of its course. A younger buried valley, about 100 feet deep, is cut into bedrock below the present course of the Great Miami River.
Seismic velocities in saturated and unsaturated sands, clays, and gravels within the buried valley vary systematically. In the unsaturated deposits, higher velocities are correlative with high clay content. Higher velocities are thought to be caused by higher water content of the clays. A general northeast-southwest decrease in velocity in the saturated outwash deposits is thought to reflect better sorting in outwash deposits farther from the edge of the receding glacier.
Field and interpretational procedures were varied during the course of the investigation. Use of cables about 10 times as long as the mean depth to bedrock significantly increased produc- tivitjr over use of shorter cables. Delay-time intrepretation techniques, obtained with long cables, yielded results that were more consistent internally and more consistent with geological inferences of valley gradients than were the output data inferred from graphical techniques.
INTRODUCTION
PURPOSE AND SCOPE
In September 1962 the U.S. Geological Survey made a seismic refraction survey of the ancestral Great Miami River valley in southwestern Ohio, between Hamilton and the Ohio River (fig. 1). A second seismic survey was made of the ancestral Great Miami River valley in the area between Hamilton and Dayton, Ohio, in September 1963.
The primary purpose of these surveys was to ol^ain data concerning the thickness and extent of water bearing sand and gravel deposits in southwestern Ohio. These data were used to estimate the coefficients of transmissibility, storage, and other hydrogeo^gic parameters of the ground-water reservoir to aid in the efficient development of ground-water resources in southwestern Ohio. In these surveys over 50 miles of seismic refraction traverse were shot, mainly along roads, in the Great Miami River valley between ^7est Carrollton and the Ohio River (fig. 1). Two adjoining valleys the Mill Creek valley between Hamilton and Cincinnati, and the Dicks Creek valley southeast of Middletown were studied near their intersections with the main valley of the ancestral Miami River.
Two open-file reports (Watkins, 1963; Watkins and Spieker, 1964) summarize the purpose and scope of the investigations and detail the results of interpretations of seismic refraction data. Some additional data col lected near Trenton, Ohio, were provided by R. E. Mattick (written commun., 1964).
The seismic refraction survey was not designed to study seismic operations and techniques nor to do seismic research. Instrumentation was limited to relatively unsophisticated portable equipment during much of both seasons, although a 7000B Houston Technical Laboratories model unit was available for part of the 1963 field season. Emphasis was placed on detecting first arrivals; later arrivals were observed only incidentally. Energy levels between different geopl one channels generally could be quantitatively compered. The equipment did not include magnetic tape recorders.
By the beginning of the 1963 field season it became evident that significantly more efficient seismic opera-
Bl

B2 GROUND WATER IN THE LOWER GREAT MIAMI RIVER VALLEY, OHIO
84°30'
39U30 -
I BUTLER COUNTY kP
V Cincinnati"^ well field {
ew Baltimore
FIGURE 1 Area of seismic surveys in southwestern Ohio.

SEISMIC REFRACTION SURVEY OF PLEISTOCENE DRAINAGE CHANNELS B3
tions were feasible and that more information could probably be obtained from the seismic data than was being obtained at that time. It was equally evident that cherished dogma concerning accuracy of seismic refraction data was, in some areas at least, fallacious, and that further investigation was required.
Despite the instrumental limitations and the necessity to satisfy the basic goals of the survey, the study area had a high density of seismic data by the end of the 1963 field season. The large quantity of data was thought to possibly offset the relatively low quality of some of the data. By agreement with the cooperating agencies, the authors were able to reshoot some problem areas in 1963, to auger several test holes to examine subsurface materials, and to conduct inhole velocity surveys in the fall of 1964.
Geologic logs of varying quality were available for several wells in the study area for comparison with the seismic data. Some excellent well logs were also avail able, notably those from the city of Cincinnati's proposed well field * and those from the U.S. Atomic Energy Commission's facility near Fernald. Two AEC wells and one Cincinnati test well were subsequently included in the inhole velocity surveys.
This report is not intended to represent a complete investigation of problems inherent in seismic investiga tions of glacial aquifers in southwestern Ohio; rather, it is an interim report which summarizes the problems encountered and which proposes some tentative interpretations to account for the observed phenomena.
PREVIOUS INVESTIGATIONS
Warrick and Winslow (1960) conducted seismic surveys in parts of Ohio in search of buried channels which might contain usable ground-water supplies. Their exploration, however, was more of a reconnais sance than the present investigation. Unpublished Geological Survey seismic data from reconnaissance surveys were made available by R. M. Hazlewood (oral commun., 1962). The Ohio Division of Water allowed the authors to examine some unpublished seismic data which the division had commissioned prior to the 1962 field season.
ACKNOWLEDGMENTS
The seismic surveys on which this report is based were made in cooperation with the Ohio Department of Natural Resources, Division of Water, C. V. Young-
i The Cincinnati well field southwest of Fairfield was "proposed" at the time the present report was written and is referred to as such in the other three chapters of the series (Prof. Papers 605-A, 605-C, and 605-D). In the meantime, production wells have been drilled, and the pipelines are under construction. As of February 1970, it is estimated that the well field will be placed in operation sometime in 1972. The termi nology "proposed Cincinnati well field" is retained in this report to maintain con sistency with the other three chapters.
quist, chief, and the Miami Conservancy District, Max L. Mitchell, chief engineer. Informal cooperation was provided by the Cincinnati Water Works Depart ment, Charles M. Bolton, superintendent. In addition to financial cooperation, the cooperating agencies pro vided some of the personnel and equipment necessary to complete the surveys. The Ohio Division of Water made available the power auger for drilling shot holes. This drill rig was operated by Norman C. Falley, formerly with the Division of Water.
The senior author directed the field parties and in terpreted the siesmic data. He was assisted by Zvi Yuval in 1962 and by R. E. Mattick in 1963. The junior author was responsible for the selection of sites to be surveyed and for all geological interpretations.
The authors thank the following governmental units for granting permission to run seismic surveys along public roads and on publicly owned land: The Ohio Department of Highways; the Highway Departments of Butler, Hamilton, and Montgomery Counties; the cities of Fairfield, Hamilton, and Middletown; and the U.S. Atomic Energy Commission (Fernald plant). Armco Steel, Baltimore & Ohio Railroad, and E i.yton Power & Light Co. granted access to their property to conduct surveys. The authors also thank many farmers and individual homeowners who gave permission to enter their property.
The Cincinnati Water Works Department, the Ohio Division of Water, the Southwestern Ohio Water Co., and the U.S. Atomic Energy Commission permitted the authors to measure seismic velocities in wells at their respective facilities.
FIELD PROCEDURES
SHOTHOLE DEPTHS AND ENERGY SOURCE
Nominal shothole depths of 10-14 feet were found to be satisfactory for energy coupling. Shotholer were drilled with a mobile truck-mounted auger, which func tioned adequately in sand and silt but which drilled with difficulty in coarse gravel or boulders. Where holes would not stay open to the desired depth, two shallow holes, each 6 feet deep, were drilled 10 feet apart, and the charge was halved between them. Each half was capped, and they were fired simultaneously. On very rare occasions, where 6-foot holes could not be drilled and there was no danger to property, per sonnel, or livestock, the crew dug shallow holes for the dynamite.
Water tamping of holes was found to be faster and easier and, generally, to provide better energy coupling than dirt tamping. However, water tamping wi>s not often possible because of the potential danger from overhead powerlines.

B4 GROUND WATER IN THE LOWER GREAT MIAMI RIVER VALLEY, OHIO
Charge size ranged from 1.25 to 15 pounds. Nominal charge sizes were as follows:
Charge size (Ib) Spread length (ft) 1.25- 2.5 . -_--.-- 1,100 2.5 - 5.0__---______-_--_-. 2,2005.0 -10.0._ 4,400
15.0______________ 9,020
FIELD-DATA ANALYSIS
Some preliminary picking and plotting of data were performed in the field for guidance in selecting optimum spread locations. A limited amount of interpretation was done in the field, primarily of data from the pro posed city of Cincinnati well-field area. Most of the data were analyzed after field work was completed.
FIELD PROBLEMS
The two most common problems were seismic noise and difficulties in drilling in coarse gravel and boulders. Most noise originated from nearby powerlines and from traffic along roads adjacent to seismic spreads; but other noise sources, such as that from trains or from cattle grazing near the seismic spreads, occasionally delayed operations.
THE BEDROCK SURFACE
SEISMIC-LINE DESIGNATIONS
Definition of the bedrock surface was the primary objective of seismic surveys in the lower Great Miami River valley. Plate 1 is a contour map showing the altitude of the top of bedrock in the area included in these surveys. Locations and designations of the seismic lines are also shown. Lines which were shot in 1962 are designated by letters, and those which were shot in 1963 are designated by numbers. Basic depth-to-bed rock data are available in two open-file reports (Wat- kins, 1963; Watkins and Spieker, 1964).
The bedrock contours on plate 1 were drawn on the basis of the authors' interpretation of the seismic data and logs of wells. In general, basic data (such as the locations of seismic lines and wells) are shown in black, and interpretations (such as the determined depth to bedrock and the bedrock contours) are shown in red. Only those depth determinations actually used in defining the contours are shown on plate 1. Several depth determinations are anomalous, for reasons dis cussed in the sections on geophysical interpretations.
THE BURIED-VALLEY SYSTEM
The Pleistocene aquifer system of the lower Great Miami River valley consists of sand and gravel outwash deposited in bedrock valleys that were carved by melt waters from receding continental ice sheets. The fol lowing discussion is confined to the characteristics and the origin of these bedrock valleys. The hydrogeologic
characteristics of the aquifer system are discussed in the first chapter of the present series (Spieke^, 1968c).
The buried-valley system defined in the present study actually consists of two separate interglacial drainage systems, each formed in a different interglacial age. Both valleys slope from the northeast to the southwest. The more prominent of the two valleys is about 2 miles wide and 200-300 feet deep (below the floor of the present Great Miami River valley). Although this ancient valley follows the general direction of the Great Miami River, it is west or north of the present river over much of its course. A somewhat lesser valley cut into bedrock, about half a mile wide anc1 100 feet deep, follows for the most part the present course of the Great Miami River.
Both valleys are the result of changes imposed on the preexisting drainage system by the Pleistocene glacia- tion. The drainage of southwestern Ohio prior to the glaciation has been the subject of considerable controversy. Evidence in the Cincinnati area and in northern Kentucky (Durrell, 1961) suggests that the preglacial drainage in southwestern Ohio flowed north into the Teays River, the principal preglacial stream in the Midwest (Fenneman, 1916, p. 112-119). Conversely, evidence in the Dayton area (Norris and SpieVer, 1966, p. 18-23) suggests that this preglacial drainage flowed south. Both sides of the controversy are reviewed in the report of Norris and Spieker (1966, p. 18-23). The present seismic survey provided no evidence as to the nature of the preglacial drainage of southwestern Ohio.
Onset of the glaciation forced a rearrangement of drainage into the present system, dominated by the Ohio River. These, changes gradually evolved during the complex sequence of glaciation of the Pleistocene Epoch. The general changes were described by Durrell (1961) for the area south of Middletown and by Norris, Cross, and Goldthwait (1948, p. 29-31) for the area north of Middletown.
The more prominent buried valley is part of the inter glacial drainage system that developed in southwestern Ohio prior to the Illinoian Glaciation. This drainage system is referred to by some as the "Deep Stage" system, a term defined by Stout (in Stout and others, 1948, p. 73-85). In the present series of reports this drainage system is referred to as the valley of the ancestral Great Miami River, or the major buried valley.
The major buried valley can be readily identified on plate 1 as the large, 2-mile-wide trough extending across the report area in a southwesterly direction from West Carrollton. It is separated from the present course of the Great Miami River by bedrock highs in three reaches: between West Carrollton and Carlisle, between Trenton and New Miami, and between Fe^nald and
SEISMIC REFRACTION SURVEY OF PLEISTOCENE DRAINAGE CHANNELS B5
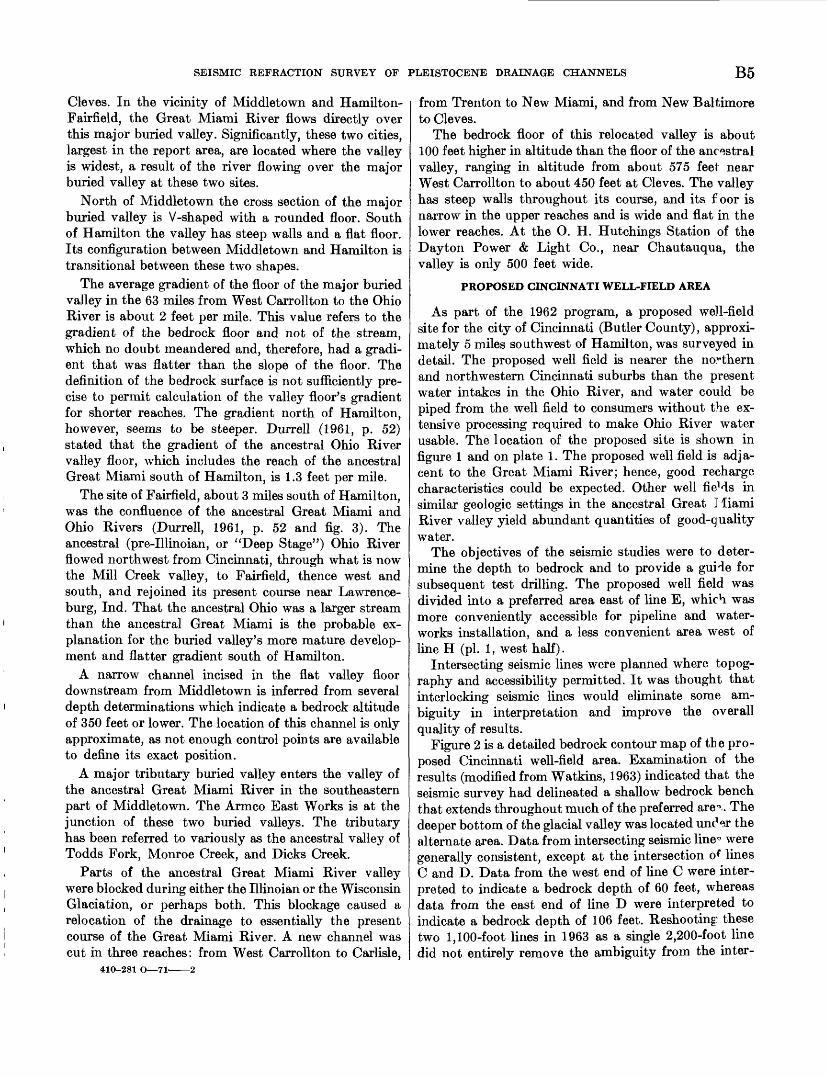
Cleves. In the vicinity of Middletown and Hamilton- Fairfield, the Great Miami River flows directly over this major buried valley. Significantly, these two cities, largest in the report area, are located where the valley is widest, a result of the river flowing over the major buried valley at these two sites.
North of Middletown the cross section of the major buried valley is V-shaped with a rounded floor. South of Hamilton the valley has steep walls and a flat floor. Its configuration between Middletown and Hamilton is transitional between these two shapes.
The average gradient of the floor of the major buried valley in the 63 miles from West Carrollton to the Ohio River is about 2 feet per mile. This value refers to the gradient of the bedrock floor and not of the stream, which no doubt meandered and, therefore, had a gradi ent that was flatter than the slope of the floor. The definition of the bedrock surface is not sufficiently pre cise to permit calculation of the valley floor's gradient for shorter reaches. The gradient north of Hamilton, however, seems to be steeper. Durrell (1961, p. 52) stated that the gradient of the ancestral Ohio River valley floor, which includes the reach of the ancestral Great Miami south of Hamilton, is 1.3 feet per mile.
The site of Fairfield, about 3 miles south of Hamilton, was the confluence of the ancestral Great Miami and Ohio Rivers (Durrell, 1961, p. 52 and fig. 3). The ancestral (pre-Illinoian, or "Deep Stage") Ohio River flowed northwest from Cincinnati, through what is now the Mill Creek valley, to Fan-field, thence west and south, and rejoined its present course near Lawrence- burg, Ind. That the ancestral Ohio was a larger stream than the ancestral Great Miami is the probable ex planation for the buried valley's more mature develop ment and flatter gradient south of Hamilton.
A narrow channel incised in the flat valley floor downstream from Middletown is inferred from several depth determinations which indicate a bedrock altitude of 350 feet or lower. The location of this channel is only approximate, as not enough control points are available to define its exact position.
A major tributary buried valley enters the valley of the ancestral Great Miami River in the southeastern part of Middletown. The Armco East Works is at the junction of these two buried valleys. The tributary has been referred to variously as the ancestral valley of Todds Fork, Monroe Creek, and Dicks Creek.
Parts of the ancestral Great Miami River valley were blocked during either the Illinoian or the Wisconsin Glaciation, or perhaps both. This blockage caused a relocation of the drainage to essentially the present course of the Great Miami River. A new channel was cut in three reaches: from West Carrollton to Carlisle,
41O-281 O 71 2
from Trenton to New Miami, and from New Baltimore to Cleves.
The bedrock floor of this relocated valley is about 100 feet higher in altitude than the floor of the ancestral valley, ranging in altitude from about 575 feet near West Carrollton to about 450 feet at Cleves. The valley has steep walls throughout its course, and its floor is narrow in the upper reaches and is wide and flat in the lower reaches. At the O. H. Hutchings Station of the Dayton Power & Light Co., near Chautauqua, the valley is only 500 feet wide.
PROPOSED CINCINNATI WELL-FIELD AREA
As part of the 1962 program, a proposed well-field site for the city of Cincinnati (Butler County), approxi mately 5 miles southwest of Hamilton, was surveyed in detail. The proposed well field is nearer the northern and northwestern Cincinnati suburbs than the present water intakes in the Ohio River, and water could be piped from the well field to consumers without the ex tensive processing required to make Ohio River water usable. The location of the proposed site is shown in figure 1 and on plate 1. The proposed well field is adja cent to the Great Miami River; hence, good recharge characteristics could be expected. Other well fieMs in similar geologic settings in the ancestral Great I liami River valley yield abundant quantities of good-quality water.
The objectives of the seismic studies were to deter mine the depth to bedrock and to provide a guide for subsequent test drilling. The proposed well field was divided into a preferred area east of line E, which was more conveniently accessible for pipeline and water works installation, and a less convenient area west of line H (pi. 1, west half).
Intersecting seismic lines were planned where topog raphy and accessibility permitted. It was thought that interlocking seismic lines would eliminate some am biguity in interpretation and improve the overall quality of results.
Figure 2 is a detailed bedrock contour map of th e pro posed Cincinnati well-field area. Examination of the results (modified from Watkins, 1963) indicated that the seismic survey had delineated a shallow bedrock bench that extends throughout much of the preferred arex The deeper bottom of the glacial valley was located under the alternate area. Data from intersecting seismic line^ were generally consistent, except at the intersection of lines C and D. Data from the west end of line C were inter preted to indicate a bedrock depth of 60 feet, whereas data from the east end of line D were interpreted to indicate a bedrock depth of 106 feet. Reshooting: these two 1,100-foot lines in 1963 as a single 2,200-foot line did not entirely remove the ambiguity from the inter-

O5
_|3
60
Seis
mic
sho
t po
int
Num
ber
is
alti
tud
e of
be
droc
k su
rfac
e,
in f
eet
abov
e m
ean
sea
level
EX
PLA
NA
TIO
N
4.
(34
0)
Seis
mic
sho
t po
int
Num
ber
is
appr
oxim
ate
alti
tud
e of
be
d
rock
su
rfac
e,
in
feet
ab
ove
mea
n se
a le
vel
TW-1
10
395
Tes
t w
ell
and
iden
tifi
cati
onN
umbe
r is
al
titu
de
of
bedr
ock
surf
ace,
in
fee
t ab
ove
mea
n se
a le
vel
Out
crop
ping
bed
rock
val
ley
wal
l
3
50
Bed
rock
con
tour
Sno
ws
alti
tud
e of
be
droc
k su
rfac
e.
Das
hed
whe
re in
ferr
ed.
Conto
uri
nte
rvai
50
fee
t. D
atum
is
mea
n se
a le
vel
>w*
0
FIG
URE
2. C
onto
urs
of
the
bedr
ock
surf
ace
at t
he s
ite o
f th
e pr
opos
ed C
inci
nnat
i w
ell
field
, w
est
of F
airf
ield
. C
onto
urs
wer
e dr
awn
on t
he b
asis
of
resu
lts
iron
i th
ese
ism
ic r
efra
ctio
n su
rvey
and
tes
t-w
ell
data
.
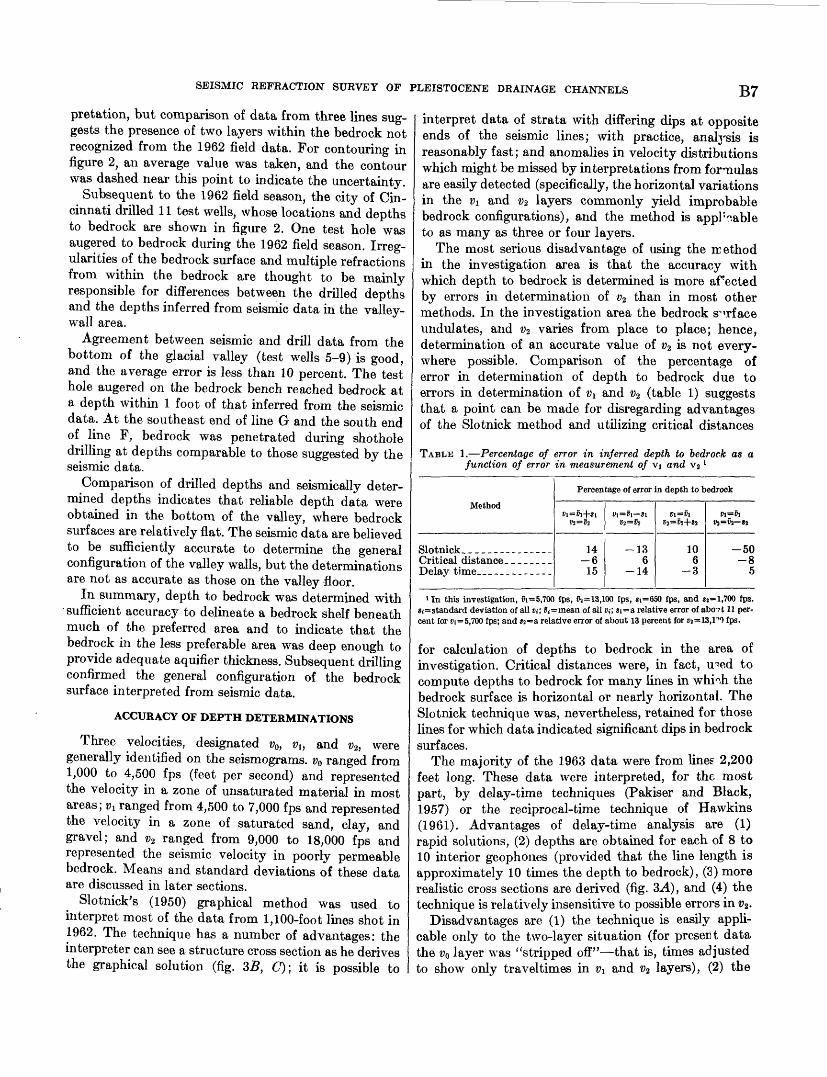
SEISMIC REFRACTION SURVEY OF PLEISTOCENE DRAINAGE CHANNELS B7pretation, but comparison of data from three lines sug gests the presence of two layers within the bedrock not recognized from the 1962 field data. For contouring in figure 2, an average value was taken, and the contour was dashed near this point to indicate the uncertainty.
Subsequent to the 1962 field season, the city of Cin cinnati drilled 11 test wells, whose locations and depths to bedrock are shown in figure 2. One test hole was augered to bedrock during the 1962 field season. Irreg ularities of the bedrock surface and multiple refractions from within the bedrock are thought to be mainly responsible for differences between the drilled depths and the depths inferred from seismic data in the valley- wall area.
Agreement between seismic and drill data from the bottom of the glacial valley (test wells 5-9) is good, and the average error is less than 10 percent. The test hole augered on the bedrock bench reached bedrock at a depth within 1 foot of that inferred from the seismic data. At the southeast end of line G and the south end of line F, bedrock was penetrated during shothole drilling at depths comparable to those suggested by the seismic data.
Comparison of drilled depths and seismically deter mined depths indicates that reliable depth data were obtained in the bottom of the valley, where bedrock surfaces are relatively flat. The seismic data are believed to be sufficiently accurate to determine the general configuration of the valley walls, but the determinations are not as accurate as those on the valley floor.
In summary, depth to bedrock was determined with sufficient accuracy to delineate a bedrock shelf beneath much of the preferred area and to indicate that the bedrock in the less preferable area was deep enough to provide adequate aquifier thickness. Subsequent drilling confirmed the general configuration of the bedrock surface interpreted from seismic data.
ACCURACY OF DEPTH DETERMINATIONS
Three velocities, designated »0, »,, and »2, were generally identified on the seismograms. v0 ranged from 1,000 to 4,500 fps (feet per second) and represented the velocity in a zone of unsaturated material in most areas; vi ranged from 4,500 to 7,000 fps and represented the velocity in a zone of saturated sand, clay, and gravel; and v2 ranged from 9,000 to 18,000 fps and represented the seismic velocity in poorly permeable bedrock. Means and standard deviations of these data are discussed in later sections.
Slotnick's (1950) graphical method was used to interpret most of the data from 1,100-foot lines shot in 1962. The technique has a number of advantages: the interpreter can see a structure cross section as he derives the graphical solution (fig. 3B, 60; it is possible to
interpret data of strata with differing dips at opposite ends of the seismic lines; with practice, analysis is reasonably fast; and anomalies in velocity distributions which might be missed by interpretations from formulas are easily detected (specifically, the horizontal variations in the v\ and v% layers commonly yield improbable bedrock configurations), and the method is appl ; ?-able to as many as three or four layers.
The most serious disadvantage of using the method in the investigation area is that the accuracy with which depth to bedrock is determined is more afected by errors in determination of v2 than in most other methods. In the investigation area the bedrock surface undulates, and v2 varies from place to place; hence, determination of an accurate value of v2 is not every where possible. Comparison of the percentage of error in determination of depth to bedrock due to errors in determination of Vi and v2 (table 1) suggests that a point can be made for disregarding advantages of the Slotnick method and utilizing critical distances
TABLE 1. Percentage of error in inferred depth to bedrock as a function of error in measurement of vi and Vz l
Method
Slotnick_ ___ ______Critical distance- _ __ -_
Percen
fi=»i+«i02 = 52
14-6
15
tage of error
Vi=Vi-Sl V2=Vi
-136
-14
a depth to t
»!=»! 02=08+83
106
-3
edrock
Vl=Vi »J=»3 »J
-50-8
5
»In this investigation, »i*=5,700 fps, »j=13,100 fps, «i=650 fps, and «.»1,700 fps. »i=standard deviation of all»,-; »,-=mean of all t>,-; «i=a relative error of abcnt 11 per cent for »i=5,700 fps; and »2=a relative error of about 13 percent for t>2=13,l'w) fps.
for calculation of depths to bedrock in the area of investigation. Critical distances were, in fact, u?ed to compute depths to bedrock for many lines in whi",h the bedrock surface is horizontal or nearly horizontal. The Slotnick technique was, nevertheless, retained for those lines for which data indicated significant dips in bedrock surfaces.
The majority of the 1963 data were from lines 2,200 feet long. These data were interpreted, for the most part, by delay-time techniques (Pakiser and Black, 1957) or the reciprocal-time technique of Hawkins (1961). Advantages of delay-time analysis are (1) rapid solutions, (2) depths are obtained for each of 8 to 10 interior geophones (provided that the line length is approximately 10 times the depth to bedrock), (3) more realistic cross sections are derived (fig. 3-.1), and (4) the technique is relatively insensitive to possible errors in v2 .
Disadvantages are (1) the technique is easily appli cable only to the two-layer situation (for present data the VQ layer was "stripped off" that is, times adjusted to show only traveltimes in Vi and _> 2 layers), (2) the

B8 GROUND WATER IN THE LOWER GREAT MIAMI RIVER VALLEY, OHIO
, South850 -i
650 -
450
JL
DELAY-TIME INTERPRETATION 2,200-foot spreads
Ground surface
WmfM' Bed ro ck tm^'Mfmmm.
South Nor*h900 -
700' -
500'-
300'-
GRAPHICAL INTERPRETATION1,100-foot spreads
1&s-^_ ^j T»^-^_
*» """x : : S :?::; : : $ S A-f :$:;! 5 1: Bed ro ck : -:: :::: ::::x::: : : ::':;:;:::;:!x: : : :!i: ::|/: ::!::: : : ::::::\^. |
"^slillJliilil
^;ii;;iii;i;l
i^:li:i|:^llll:IS;il::i
GRAPHICAL INTERPRETATION 1,100-foot spreads
600' South North
400 -
200
Clay, till, and alluvium
Bedrock
5000 FEETI______\______I______L
DATUM IS MEAN SEA LEVEL
FIGURE 3. Comparison of results of delay-time and graphical interpretation techniques.
method can be used only with considerable difficulty if first arrivals are from deeper bedrock layers with veloci ties higher than v2, and (3) for 12-channel seismic units it is necessary to sacrifice accuracy in the determina tion of t>i. As indicated in table 1, errors in the deter mination of »i generate slightly larger relative errors in the determination of depth to bedrock. However, the larger errors are compensated to some extent because determination of v2 is much better than in other tech niques, so that relatively little error can be expected from errors in determination of v2 .
In this survey, where extreme accuracy was not a paramount consideration, the primary advantage of 2,200-foot lines was an increase in productivity per unit of time. Approximately 24 miles of traverse were shot in 8 weeks in 1962 as compared with 29 miles in 6 weeks in 1963. The increased productivity was largely attributable to longer line lengths used in 1963.
COMPARISON OF 1962 AND 1963 RESULTS
The lack of sufficient well data in the area of investi gation makes it difficult to evaluate the overall accuracy of the determination of depth to bedrock $vnd impos sible to unequivocally compare results of interpreta tion of 1962 and 1963 data. Cincinnati's proposed well field is an exception because the data from 11 test holes indicated that differences in depth to bedrock may average as much as 50 percent along the valley walls but are less than 10 percent in the bottom of the buried valley.
Several remarks seem appropriate, however, concern ing indirect methods of examining the accuracy of re sults. First, good seismic data appear to be consistent with geologic processes. For example, the slope of the valley floor was originally formed by a stream; hence, upstream locations must generally be higher in altitude than downstream locations. Certain limits can be

SEISMIC REFRACTION SURVEY OF PLEISTOCENE DRAINAGE CHANNELS B9
established for maximum and minimum stream gradient with which seismic data can be compared. Second, internal consistency of data suggests better data that is, adjacent or overlapping spreads should yield con sistent depths.
In both respects the 1963 data appear to be better than the 1962 data. The Crosby Road profile (KK-RR) of the 1962 data indicated some depths to be deeper than those at downstream locations, and depths from adjacent or overlapping lines were quite different in some instances.
The apparent improvement of 1963 data could be attributed to more homogeneous subsurface geologic conditions in the 1963 area of investigation as compared with the 1962 area of investigation, or to better inter pretive techniques. As there is little apparent geologic difference in the 1962 and 1963 areas of investigation, and as calculations in table 1 show that the 1962 interpretive technique (Slotnick) is more susceptible
to certain errors than the 1963 techniques, it is tenta tively concluded that the 1963 results are more con sistently accurate than 1962 results and that the improvement is largely due to use of the longer lines and delay-time interpretation techniques.
VELOCITY REVERSALS IN TILL IN THE FERNALD AREA
Figure 4 shows times of first arriving seismic energy on line II. These data show an apparent discontinuity in 0i arrivals, a phenomenon also observed on lines J (south end), K (north end), HH, OO (south end), and QQ. For purposes of discussion, the Vi arrivals on these lines have been divided into two groups, the i\ and vu, as shown in figure 4.
Frequencies of Vi arrivals were significantly higher than those of #n arrivals. For example, the Vi modal frequency on line HH was about 125 cps (cycles per second) and about 140 cps on line II, whereas the Vu frequencies were roughly 60 cps on both HH and II.
North
200 400 600 DISTANCE, IN FEET
800 1000 1200
41O-2810 Tl-FIGURE 4. Time-distance plot of first arrivals on line II.
BIO GROUND WATER IN THE LOWER GREAT MIAMI RIVER VALLEY, OHIO
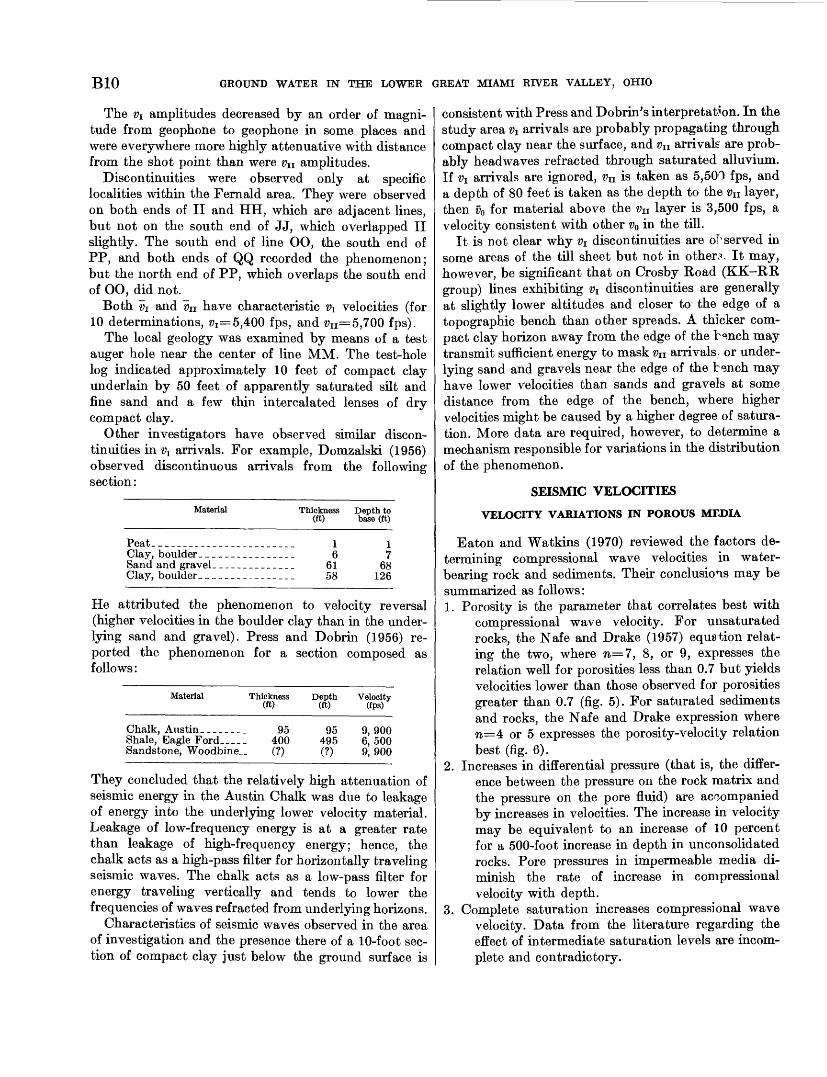
The Vi amplitudes decreased by an order of magni tude from geophone to geophone in some places and were everywhere more highly attenuative with distance from the shot point than were v-a amplitudes.
Discontinuities were observed only at specific localities within the Fernald area. They were observed on both ends of II and HH, which are adjacent lines, but not on the south end of JJ, which overlapped II slightly. The south end of line OO, the south end of PP, and both ends of QQ recorded the phenomenon; but the north end of PP, which overlaps the south end of OO, did not.
Both v-i and vu have characteristic Vi velocities (for 10 determinations, %= 5,400 fps, and #n=5,700 fps).
The local geology was examined by means of a test auger hole near the center of line MM. The test-hole log indicated approximately 10 feet of compact clay underlain by 50 feet of apparently saturated silt and fine sand and a few thin intercalated lenses of dry compact clay.
Other investigators have observed similar discon tinuities in Vi arrivals. For example, Domzalski (1956) observed discontinuous arrivals from the following section:
Material
Peat__ _ __ _________ ..
Thickness ] (ft)
.___ 1
.____ 6
.____ 61
.____ 58
Depth to base (ft)
17
6819fi
He attributed the phenomenon to velocity reversal (higher velocities in the boulder clay than in the under lying sand and gravel). Press and Dobrin (1956) re ported the phenomenon for a section composed as follows:
Material Thickness (ft)
Depth (ft)
Velocity (fps)
Shale, Eagle Ford-Sandstone, Woodbine. .
95400(?)
or;
495(?)
Q QOD6, 5009,900
They concluded that the relatively high attenuation of seismic energy hi the Austin Chalk was due to leakage of energy into the underlying lower velocity material. Leakage of low-frequency energy is at a greater rate than leakage of high-frequency energy; hence, the chalk acts as a high-pass filter for horizontally traveling seismic waves. The chalk acts as a low-pass filter for energy traveling vertically and tends to lower the frequencies of waves refracted from underlying horizons.
Characteristics of seismic waves observed in the area of investigation and the presence there of a 10-foot sec tion of compact clay just below the ground surface is
consistent with Press and Dobrin's interpretation. In the study area Vi arrivals are probably propagating through compact clay near the surface, and Vu arrivals are prob ably headwaves refracted through saturated alluvium. If Vi arrivals are ignored, v-a is taken as 5,500 fps, and a depth of 80 feet is taken as the depth to the vn layer, then v0 for material above the vu layer is 3,500 fps, a velocity consistent with other v0 in the till.
It is not clear why Vi discontinuities are observed in some areas of the till sheet but not in other?. It may, however, be significant that on Crosby Road (KK-RR group) lines exhibiting Vi discontinuities are generally at slightly lower altitudes and closer to the edge of a topographic bench than other spreads. A thicker com pact clay horizon away from the edge of the V^nch may transmit sufficient energy to mask vu arrivals, or under lying sand and gravels near the edge of the bsnch may have lower velocities than sands and gravels at some distance from the edge of the bench, where higher velocities might be caused by a higher degree of satura tion. More data are required, however, to determine a mechanism responsible for variations in the distribution of the phenomenon.
SEISMIC VELOCITIES
VELOCITY VARIATIONS IN POROUS MEDIA
Eaton and Watkins (1970) reviewed the factors de termining compressional wave velocities in water bearing rock and sediments. Their conclusions may be summarized as follows:1. Porosity is the parameter that correlates best with
compressional wave velocity. For unsaturated rocks, the Nafe and Drake (1957) equation relat ing the two, where n=7, 8, or 9, expresses the relation well for porosities less than 0.7 but yields velocities lower than those observed for porosities greater than 0.7 (fig. 5). For saturated sediments and rocks, the Nafe and Drake expression where n=4 or 5 expresses the porosity-velocity relation best (fig. 6).
2. Increases in differential pressure (that is, the differ ence between the pressure on the rock matrix and the pressure on the pore fluid) are accompanied by increases in velocities. The increase in velocity may be equivalent to an increase of 10 percent for a 500-foot increase in depth in unconsolidated rocks. Pore pressures in impermeable media di minish the rate of increase in compressional velocity with depth.
3. Complete saturation increases compressional wave velocity. Data from the literature regarding the effect of intermediate saturation levels are incom plete and contradictory.

SEISMIC REFRACTION SURVEY OF PLEISTOCENE DRAINAGE CHANNELS Bll
1.0
EXPLANATION
J. S. Watkins and L. A. Walters (written commun., 1967)(in place)
O1Meteor crater-badly
fractured rocks 2
Hughes and Kelly (1952) (low pressure)
o Wyllie and others (1956)
Volarovich and others (1965)
King (1966). X 1 . Boise Sandstone (low pressure)
Gardner and others (1964) (low pressure)
0.00.0 5000 10,000
VELOCITY, IN FEET PER SECOND
15,000
FIGURE 5. Comparison of experimental data with velocity-porosity equations for unsaturated media, as proposed by Nafe and Drake (1957), by Wyllie, Gregory, and Gardner (1956, time-average equation and Wood equation), and by J. S. Watkins and L. A. Walters (written commun., 1967). Dashed vertical line, velocity of sound in air.
Velocity of sound in water EXPLANATION
oHughes and Kelly (1952)
o Wyllie and others (1956)
Shumway (1956) (marine sediments)
Button and others (1957) (marine sediments)
Hamilton and others (1956) (marine sediments)
0.05000 10,000
VELOCITY, IN FEET PER SECOND
15,000
FIGURE 6. Comparison of experimental data with velocity-porosity equations for saturated media, as proposed by Nafe and Drake (1957) and by Wyllie, Gregory, and Gardner (1956).

B12 GROUND WATER IN THE LOWER GREAT MIAMI RIVER VALLEY, OHIO
4. Compressional-wave velocities observed in saturated unconsolidated sediments increase with increasing grain diameter up to 0.67 mm (millimeter). No data are available for unsaturated media or cemented rocks.
5. Mineral content affects compressional-wave velocity by varying of the elastic moduli of the grains, varying of the elastic moduli of the cement, or by interaction with the saturant. No quantitative data are available to evaluate the relative im portance of these mechanisms. Where clays are present, interaction with the saturant may substantially diminish the rigidity of the medium.
6. Cementation significantly increases velocities of saturated and unsaturated rock and alluvium, but no quantitative measure of cementation has been established.
OBSERVED VELOCITIES
REFRACTION MEASUREMENTS
Three, and in some places four, subsurface layers with distinctive seismic velocities were recognized during interpretation of the seismic data. The uppermost layer had a velocity that generally ranged from 1,000 to 4,500 fps. This layer was interpreted as representing the unsaturated zone. The velocity of this layer was designated %
Beneath the v0 layer, a second layer, whose velocity was designated vlt was generally present and had velocities that generally ranged from about 4,500 to 7,000 fps. This layer was interpreted as a zone of saturated sand, clay, and gravel above bedrock. Ve locities in the third, or y2 , layer generally ranged from 9,000 to 18,000 fps. This layer, in most places, was interpreted as impermeable bedrock underlying sands and gravels filling the old valley. In data from a few spreads, a deeper bedrock layer was recognized in which the velocities generally ranged from 18,000 to 24,000 fps.
THE V0 LAYER
Shot points in 1962 were normally 25 feet from the nearest geophones. Shotholes were generally 12-14 feet deep and in the unsaturated zone for most lines. The direct arrival through the v 0 layer was generally recorded as a first arrival on the geophone nearest the shot point, although in some areas where the unsaturated zone was thick, direct v0 arrivals were recorded as first arrivals on two or three geophones nearest the shot point. During the 1963 field season, geophone-shot point distances were commonly 50 feet or more; consequently, v0 was rarely determinable from first-arrival data.
Velocities tended to vary as a function cf location. In the following discussion and in the later discussion of Vi data, areas are considered in a north-soutl sequence. As previously mentioned, y0 data were obtained only in the area south of Hamilton that was investigated in 1962.
In the Mill Creek valley southeast of Hamilton (pi. 1), v0=3,150 fps with a standard deviation, s0=950 fps. Data are based on 19 determinations from 14 lines. Southwest of Fair-field in six lines bounded by EE and Z, v0 = 1,500 fps; in 14 lines north of the proposed city of Cincinnati well field, 21 determinations yielded v0= 1,550 fps; in lines 3-4 miles west, between Q and T, v0= 1,850 fps.
Two 130-foot lines with geophones spaced 10 feet apart and shot points 10 feet off ends of lin^s were lo cated in the proposed city of Cincinnati well field 200- 400 feet south-southwest of TW-2. In these, y 0 ranged from 1,500 to 1,900 fps, averaged 1,675 fps, and had a standard deviation of about 150 fps.
Sixty-two determinations of v0 from 33 lines on till in the Fernald area yielded y0= 2,700 fps, and s0=850 fps. Two 275-foot lines were near the west end of spread AX east of Harrison and south of this till sheet. The y 0 determinations ranged from 1,920 fps to 2,360 fps, averaged 2,140 fps, and had a standard deviation of 200 fps. Thirty-three determinations from 20 lines in the valley south of Harrison yielded an average of 1,850 fps for y0 ; s 0=550 fps.Mean differences between «0 recorded at opposite ends
of lines were greater than 550 fps in 29 liner in the till area near Fernald and were about 500 fps in 14 lines south of Harrison. In 19 lines near Ross, the mean dif ference was about 350 fps.
The #0 data recorded between Hamilton and the Ohio River were smoothed by the following procedure: (1) The area was gridded at 0.25-mile intervals; (2) ob served velocities were averaged within a 0.25-mile radius of grid points; (3) the average was multiplied by 0.75; (4) velocities were averaged between 0.25 and 0.50; (5) then the average was multiplied b^ 0.25; and (6) the weighted averages obtained in steps 3 and 5 were summed. The effect of this procedure wg.s to reduce by 75 percent or more the contribution of local varia tions in velocity with wavelengths of up to approxi mately 1 mile, to reduce by 0.25-0.75 the contribution of velocity changes with wavelengths of 1-4 miles, and to pass relatively unaffected velocity chr/nges with wavelengths of greater than 4 miles.
The smoothed data are shown in figure 7.
THE V ! LAYER
The Vi data consist of 119 determinations remaining from the 1962 data after some data had been rejected

SEISMIC REFRACTION SURVEY OF PLEISTOCENE DRAINAGE CHANNELS
To Hamilton, Ohio
B13
SMOOTHED VELOCITIES (u), IN FEET PER SECOND
No data available
FIGURE 7. Lateral variation in smoothed velocities of the unsaturated zone between Hamilton and the Ohio River.
because of irregular arrival times or absence of a Vi layer. Geophone-shot point distances in 1963 data were too large to permit reliable measurement of #1.
Vi varies perceptibly from area to area. For example, in the Mill Creek valley, southeast of Hamilton, 13 determinations yielded Vi= 6,050 fps. In the area ex tending southwest from Hamilton to the till sheet near Fernald, 25 determinations yielded Vi = 5,950 fps. In the proposed Cincinnati well field, 12 determinations yielded vi= 6,000 fps. Two short spreads in the well field had Vi of 6,000 fps, but values ranged from 5,000 to 6,700 fps.
In the till area near Fernald, Vi was 5,500 fps for 29 determinations. Two short lines near AX immediately south of the edge of the till sheet have Vi of 5,950 fps, and a range of 5,200-6,700 fps.
In the area south of the till sheet, 22 determinations yielded vi of 5,450 fps. Overall, 119 determinations of
Vi yielded ?5i 5,700 fps and a standard deviation of about 650 fps. Six determinations on four short lines yielded Vi= 6,000 fps. In the four short lines, tv^o of which were 275 feet long and two of which were 130 feet long, velocities on opposite ends differed by 1,500 and 1,700 fps, respectively. Larger differences were occasionally observed on longer spreads. These are not apparent velocities due to dipping interfaces but are true velocities observed on reversed spreads.
The Vi data were filtered and plotted in the same manner as the v0 data (fig. 7) but could not be con toured with confidence at a meaningful contour interval.
THE Z>2 LAYER
In the 1962 data, v2 = 13,000 fps for 92 determina tions, and s2 = 1,400 fps. For the 1963 data, v2 = 13,200 fps for 64 determinations, and s2 =2,000 fps. The snaall- er standard deviation of the 1962 data probably

B14 GROUND WATER IN THE LOWER GREAT MIAMI RIVER VALLEY, OHIO
reflects, in part, some subjectivity in selecting data, for, in deeper parts of the valley, v2 arrivals were recorded by only one, two, or three geophones on many spreads. In these areas, determination of v2 was commonly difficult. This led to rejection of a significant number of the determinations. (Values from adjacent lines were used for interpretation of depth.)
Areal distribution in v2 was not observed. The pos sibility that differential erosion created ledges in the bedrock surface of the preglacial valley that could be detected by examining velocities as a function of depth in a given area was considered, but cross sections gave no evidence of such a relationship.
In some areas, additional higher velocity bedrock horizons were detected at depth, particularly in the area between Hamilton and Middletown, but lateral correlation of depths of the higher velocity bedrock layers was questionable. Data were not sufficiently comprehensive to suggest reasons for the questionable results.
The only observed lateral variation in v2 was the existence of relatively low seismic velocities, 9,000- 11,500 fps, where bedrock consisted of an old upland surface covered by a veneer of glacial drift. Table 2 summarizes data from some such lines. The relation is not ubiquitous, for in lines 20 and 34 velocities of 14,000 and 15,000 fps were observed, and in line AM 12,800 fps was observed. In each line, bedrock was confirmed during augering for shotholes.
TABLE 2. Bedrock velocities observed where former upland surface is covered by a veneer (less than 85 ft. thick) of sand and gravel
Spread vi (fps) 20_--_--____________ 114,00052____._____.___________ 10,80051___.__________________ 11,40033________._____________ 110,50034______________________ i 11, 000-15, 00035____--.-___________ 111,600G...___-__-___________ 110,100AM.____________________ i 9, 100-12, 800BN-___--_.______-______ 9,700BM. ____________________ 9,900BL_______.___________ 8,800BI______________________ 9,400
1 Bedrock confirmed during augering for shotholes.
SUMMARY OF REFRACTION MEASUREMENTS
All Vt values varied widely: s2/v2 =0.13; Si/£i=0.11; and s0/v0 =Q.23. Areal distributions in velocities were observed in subsets of v0 and vly but variations in v2 consisted only of generally lower values in areas where the old upland surface was covered with a veneer of sand and gravel.
INHOLE MEASUREMENTS
After examination of wells and well logs available within the area of investigation, eight wells (pi. 1) were
selected for inhole seismic-velocity measurements. All but one of the wells are in the south-central part of the area. A wider distribution was desirable, but attempts to locate other wells for logging in both the northern and the southernmost parts of the area were unsuccessful. All the wells selected are at least 100 feet deep and bottom below the water table. Three wells penetrate bedrock, and the bottom of a fourth is thought to be very close to bedrock.
TW-2 is near the intersection of lines C and D, and AEC-A and AEC-2 are near lines BW and BU, respectively (pi. 1, west half). Mt-49 (pi. 1, east half) and BU-8 (pi. 1, west half) are adjacent to lines 3 and BP, respectively. K-l, B-2, and R-7 (pi. 1, west half) are not near seismic lines, but the velocity data from these holes are thought to be similar to data from the general area.
Sand and gravel were the predominant materials below the water level in all wells (table 3). Examination of water-well logs throughout the area of investigation suggests that materials in these wells are typical of the study area as a whole. Only one log, Mt-49, showed that bedrock was penetrated deeply enough to give useful velocity data from bedrock. The logs of B-2 and K-l are cursory, and no log of R-7 is available.
Table 4 shows inhole velocities contrasted with velocities observed in nearby refraction lines.
INTERPRETATION OF VELOCITY DATA
In figure 7 heavy dark lines outline the bedrock walls of the valley of the ancestral Great Miami River. The present river flows southward into the valley from the northeast, flows southwest within the valley for about 8 miles, and then debouches southward into a smaller valley (not shown) cut during later Pleistocene time. The river reenters the ancestral valley in the southwest corner of the area shown in figure 7 and flows southward within the ancestral valley for the rest of the distance to its confluence with the Ohio River, about 3 miles south of the area shown in figure 7.
The Whitewater River flows southeastward into the ancestral valley in the west-central part of the area shown in the figure. It turns south and flows1 within the valley to its confluence with the Great Miami River near the south edge of the area shown in figure 7.
Figure 7 is divided into four generalized areas on the basis of velocities in the unconsolidated alluvium. In area A, surface and near-surface alluvium consist largely of lacustrine clays which have z?0 in excess cf 2,500 fps. The relatively high velocities are typical of clays within the area of investigation and are thought to be caused primarily by high water content due to adsorption by clay particles.

SEISMIC REFRACTION SURVEY OF PLEISTOCENE DRAINAGE CHANNELS B15
Table 3. Drillers' logs of wells shot for velocity
Composition
AEC-2
Soil and fill. ___. Clay (till) ______Sand___. _______Clay and gravel- Gravel- ________Clay and gravel- Gravel- ________Clay, sandy _____Sand and gravel .
Sand and gravel. Water level.
AEC-A
Clay (tiU) .._.__. Sand and gravel.
Water level.
TW-2
Soil, clay, gravel. Sand and gravel. Water level.____
Mt-49
Gravel. ________Clay___.______.Gravel-________Clay__________.Sand and gravel. Shale_--__-____Water level. _ _ _ _
BU-«
Soil and clay._______________Clay and boulders (lake clay?). Sand_ ______________________Hardpan (clay?) _____________Sand and gravel.____________Clay_--_____.__-_________Sand and gravel.____________Bedrock (?)______________Water level.________________
Thick ness (feet)
517
122
2535
641670
545
1196
302
594
11713
2564
19461766
Depth (feet)
522234547525560
124140210
61
550
13814070
1110724
30329195
21222523
2586281
127144210(?)59
Area B consists of the flood plain of the Great Miami River and has the lowest average velocity of the four areas. The low v0 probably indicates high porosities within the relatively well sorted sands and gravels of the flood plain.
Area C consists of a slightly dissected terrace capped in most places with till(?) and clay. Where surface materials consist of till and clay, velocities are generally greater than 2,500 fps. Small streams have transported alluvium over the till sheet and, in places, have cut through into underlying sands and gravels. In the areas underlain by transported alluvium or sands and gravels,
TABLE 4. Velocities observed in wells, and in nearby seismic refraction lines
[ua and »o are inhole and refraction velocities, respectively, in alluvium immediately below the surface; u\ and »i are velocities in saturated alluvium below the standing water level]
HoleInhole velocity Refraction velocity
Vl/Ul '
TW-2_.._._ .... ....Mt-49'.-.. .. TJ TT o
AEC-A--- AEC-2 « E 1
B O
R-7.-.
......... 1,500
......... 1,800__-..-.. 3,700 _ 3,000.-_.__.- 4,700.. .... 1,500... ...,. 1,800..._._.._ 1,300
5,2006,2006,7004,9004,600
«7,500?5,8006,500
1,700... .(*).-.. («)...... .Not present ...Not present ...
5,7005,550
6,100±2005,300
5,400±400
1.10.90.90
1.101.20
1 Average velocity above the water table; transducers did not respond in (Vy part of hole.
2 Rounded to nearest 0.05.3 W2=12,800 fps.4 Estimated to be 1,700 fps. ,.._., > , * A « Closest line is BTJ, 1,800 ft away. Other refraction velocities from line? located
within 400 ft. , .. ,. 6 Only three transducers recorded ui, and one of the values was questionat le.
velocities range from 1,500 to 2,500 fps. Along a small stream immediately north of the debouchment cf the Great Miami River, fluvial sands and gravels have velocities averaging less than 1,500 fps.
The Whitewater River flood plain, area D, has characteristic velocities between 1,500 and 2,500 fps.
The vi decreases from northeast to southwest between Hamilton and the Ohio River, but a relatively abrupt discontinuity occurs between vl in the till near Fernald and Si in the area north of the till. The cause of this abrupt change is not known.
The general pattern of decreasing vi from northeast to southwest is thought to be significant and is interpreted as indicative of better sorting and higher porosity in the outwash as the outwash was transported downstream from the receding glacier.
Inhole velocity data and inhole logs are generally con sistent with surface-refraction data, although in AEC- 2,1..! is lower than the velocity of sound hi water. The low velocities may be due to experimental error result ing from velocity-cable slack in the cased hole. Other inhole HI values are within 10 percent of nearby vl values. This is considered to be exceptionally good agreement, considering the scatter in Vi data ard the possibility of anisotropy.
SUMMARY
The U.S. Geological Survey mapped the bedrock surface of the ancestral Great Miami River valley between Dayton, Ohio, and the Ohio River primarily on the basis of seismic refraction data obtained during 1962 and 1963. Limited well data supplemented the seismic data. A knowledge of the altitude of the bed rock surface and of the thickness of overlying sands and gravels was necessary for the efficient utilization of ground-water resources in southwestern Ohio.
B16 GROUND WATER IN THE LOWER GREAT MIAMI RIVER VALLEY, OHIO
The major buried valley in the report area is 200-300 feet deep and about 2 miles wide. This valley was entrenched in the bedrock surface during interglacial ages prior to the onset of the Illinoian Glaciation. It is followed generally by the course of the present Great Miami River, though it is north and west of the Great Miami over much of its course. Illinoian and Wisconsin glaciers blocked this valley and caused the river to carve a new valley along its present course. The younger buried valley is about 100 feet below the present river level.
Detailed seismic surveys were run in an area west of Fairfield along the south wall of the major buried valley, where the city of Cincinnati proposes to develop a new well field. A shallow bedrock shelf extends under much of the eastern half of this area, but in the western half the bedrock valley floor lies 150-200 feet below the land surface. Subsequent test drilling verified the accuracy of the seismic determinations of the depth to the valley floor. Determinations on sloping surfaces were somewhat less accurate.
Three or four subsurface layers with characteristic velocities were inferred from the seismic data. Velocities in the uppermost layer (t?0) ranged from 1,000 to 4,500 fps; this layer generally consisted of unsaturated material. Velocities in the second layer (v^ ranged from 4,500 to 7,000 fps; the layer, where present, consisted of saturated sand, clay, and gravel. Veloc ities in the third layer (v2) ranged from 9,000 to 18,000 fps; this layer consisted of relatively imperme able bedrock. The fourth layer was a higher velocity layer below the bedrock surface. It is not known if the fourth layer consists of a continuous higher velocity stratum or of isolated pockets of higher velocity material. The fourth layer was indicated by seismic data in only a few locations.
Discontinuous second-layer arrivals occurred in parts of the till sheet near Fernald. The discontinuities are probably the result of a velocity reversal in a section comprising a thin stratum of compact clay or till overlying a thicker section of saturated or almost saturated sand and gravel.
Seismic velocities in the first and second layers vary systematically throughout the area. Average first-layer velocities are significantly higher in areas of surface till and lake clay than in areas of dominantly flood-plain deposits. The higher velocities associated with clays and tills are thought to be due to higher water content of clays. Between Hamilton and the Ohio River, average velocities in the second layer decrease from northeast to southwest. The decrease in velocity is thought to be due to better sorting of outwash deposits as the out- wash was transported away from the receding glacier.
Modifications in field equipment and procedures in 1963, notably modular seismic-cable units which could be connected as 2,200- or 4,400-foot cable" and the utilization of delay-time interpretation techniques, respectively, improved productivity and produced bedrock-depth data which appear superior to 1962 data.
SELECTED REFERENCES
Domzalski, W., 1956, Some problems of shallov refractioninvestigations: Geophys. Prosp., v. 4, no. 2, p. 140-166.
Durrell, R. H., 1961, The Pleistocene geology of tin Cincinnati area: Geol. Soc. America Guidebook Ser., Cincinnati Mtg. (1961), p. 47-57.
Eaton, G. P., and Watkins, J. S., 1970, The use of seismic refrac tion and gravity methods in hydrogeologic investigations, in Morley, L. W., ed. Mining and groundwater geophysics, 1967: Canada Geol. Survey Econ. Geology Kept. 2", p. 544-568.
Fenneman, N. M., 1916, The geology of Cincinnati and vicinity:Ohio Geol. Survey Bull. 19, 207 p., 2 maps.
Gardner, G. H. F., Wyllie, M. R. J., and Droschak, D. M., 1964, Effects of pressure and fluid saturation on the attenuation of elastic waves in sands: Jour. Petroleum Technology, v. 16, p. 189-198.
Hamilton, E. L., Shumway, George, Menard, H. W., and Shupik, C. J., 1956, Acoustic and other physical properties of shallow- water sediments off San Diego: Acoust. Soc. America Jour., v. 28, p. 1-15.
Hawkins, L. V., 1961, The reciprocal method of routine shallow seismic refraction investigations: Geophysics, v. 26, no. 6, p. 806-819.
Hughes, D. S., and Kelly, J. L., 1952, Variation of elastic wave velocity with saturation in sandstone: Geophysics, v. 17, p. 739-752.
King, M. S., 1966, Wave velocities in rocks as r, function of changes in overburden pressure and pore fluid saturants: Geophysics, v. 31, p. 50-73.
Molotova, L. V., and Vassil'ev, Yu. I., 1960, Velocity ratio of longitudinal and transverse waves in rocks, II: Akad. Nauk SSSR Izv. Ser. Geofiz., p. 731-743 (English translation).
Nafe, J. W., and Drake, C. L., 1957, Variation yith depth in shallow and deep water marine sediments of porosity, density, and the velocities of compressional and shear waves: Geophysics, v. 22, p. 523-553.
Norris, S. E., Cross, W. P., and Goldthwait, R. P., 1948, The water resources of Montgomery County, Ohic: Ohio Dept. Nat. Resources, Div. Water Bull. 12, 83 p.
Norris, S. E., and Spieker, A. M., 1966, Ground-water resources of the Dayton area, Ohio: U.S. Geol. Survey Water-Supply Paper 1808, 167 p.
Pakiser, L. C., and Black, R. A., 1957, Exploring for ancient channels with the refraction seismograph: Geophysics, v. 22, no. 1, p. 32-47.
Press, Frank, and Dobrin, Milton, 1956, Seismic wave studies over a high-speed surface layer: Geophysics, v. 21, p. 285- 298.
Shumway, George, 1956, A resonant chamber method for sound velocity and attenuation measurements in sediments: Geo physics, v. 21, p. 305-319.
Slotnick, M. M., 1950, A graphical method for the interpretation of refraction profile data: Geophysics, v. 15, no. 2, p. 163- 180.

SEISMIC REFRACTION SURVEY OF PLEISTOCENE DRAINAGE CHANNELS B17
Spieker, A. M., 1961, A guide to the hydrogeology of the Mill Creek and Miami River valleys, Ohio: Geol. Soc. America Guidebook Ser., Cincinnati Mtg., 1961, p. 217-251.
1968a, Effect of increased pumping of ground water in the Fairfield-New Baltimore area, Ohio A prediction by analog model study: U.S. Geol. Survey Prof. Paper 605-C, 34 p.
1968b, Future development of the ground-water resource in the lower Great Miami River valley, Ohio Problems and alternative solutions: U.S. Geol. Survey Prof. Paper 605-D, 15 p.
1968c, Geology and hydrology of ground water in thelower Great Miami River valley, Ohio: U.S. Geol. SurveyProf. Paper 605-A, 37 p.
Stout, Wilber, Ver Steeg, Karl, and Lamb, G. F., 1943, Geologyof water in Ohio: Ohio Geol. Survey Bull. 44, 694 p.
Sutton, G. H., Berckhemer, Hans, and Nafe, J. E., 1957, Physicalanalysis of deep sea sediments: Geophysics, v. 22, p. 779-812.
Volarovich, M. P., Bayuk, E. I., Salekhli, T. M.,and Pavlogradskii,V. A., 1965, Longitudinal wave velocities in kersoene- andwater-saturated samples of sedimentary rocks under high
pressures: Akad. Nauk. SSSR Izv. Fizika Zemli, no. 3, p.182-189.
Warrick, R. E., and Winslow, J. D., 1960, Application of seismicmethods to a ground-water problem in northeastern Ohio:Geophysics, v. 25, no. 2, p. 505-519.
Watkins, J. S., 1963, Refraction seismic studies in the MiamiRiver, Whitewater River, and Mill Creek valleys, Haniltonand Butler Counties, Ohio: U.S. Geol. Survey open-filereport, 3 p.
Watkins, J. S., and Spieker, A. M., 1964, Seismic refraction sur vey in the Great Miami River valley, Montgomery, Warren,and Butler Counties, Ohio: U.S. Geol. Survey op^n-filereport, 6 p.
Willmore, P. L., and Bancroft, A. M., 1960, The time-termapproach to refraction seismology: Jour. Geophys. Research,v. 3, p. 419-432.
Wyllie, M. R. J., Gregory, A. R., and Gardner, L. W., 1956,Elastic wave velocities in heterogeneous and porous media:Geophysics, v. 21, p. 41-70.
1958, An experimental investigation of factors affectingelastic wave velocities in porous media: Geophysics, v. 23,p. 459-493.
U. S. GOVERNMENT PRINTING OFFICE : 1971 O - 410-281


Ground Water in the
Lower Great Miami
River Valley, Ohio
GEOLOGICAL SURVEY PROFESSIONAL PAPER 605
This volume was published
as separate chapters A D

UNITED STATES DEPARTMENT OF THE INTERIOR
ROGERS C. B. MORTON, Secretary
GEOLOGICAL SURVEY
William T. Pecora, Director

CONTENTS
(Letters designate the separately published chapters]
(A) Ground-water hydrology and geology of the lower Great Miami River valley, Ohio, by Andrew M. Spieker.(B) Seismic refraction survey of Pleistocene drainage channels in the lower Great Miami River valley, Ohio, by Joel S. Watkin« and
Andrew M. Spieker.(C) Effect of increased pumping of ground water in the Fairfield-New Baltimore area, Ohio A prediction by analog-model study,
by Andrew M. Spieker.(D) Future development of the ground-water resource in the lower Great Miami River valley, Ohio Problems and alternative
solutions, by Andrew M. Spieker.


