seismic performance of reinforced concrete buildings …€¦ · · 2015-08-13seismic performance...
TRANSCRIPT
Australian Earthquake Engineering Society 2014 Conference, Nov 21-23, Lorne, Victoria
Seismic Performance of Reinforced Concrete Buildings in
Bhutan
Kinzang Thinley1, Hong Hao2 and Choki Tashi3
1. Corresponding Author. PhD Student, Department of Civil Engineering, Curtin University, Bentley, Perth WA 6102. Email: [email protected]
2. Professor, Department of Civil Engineering, Curtin University, Bentley, Perth WA
6102. Email: [email protected]
3. Former Final Year Student, School of Civil and Resource Engineering, The University of Western Australia, WA 6009
ABSTRACT
Reinforced concrete (RC) frame is one of the most common building structures in Bhutan. While many RC buildings were built in the past and many are still under construction, seismic response of these buildings has not been studied in detail. RC buildings built prior to
1997 were designed only for gravity load and only those built after 1997 were designed for seismic load according to the Indian seismic code IS 1893. Although, Bhutan is located in
one of the most active seismic zones in the world, yet a very limited study has been done on the performance of these buildings. This paper presents the numerical investigations carried out to study the performance of three typical RC buildings in the capital city, Thimphu under
seismic loadings. The predicted ground motions obtained from Probabilistic Seismic Hazard Analysis (PSHA) at generic soil sites in Thimphu, Bhutan are used as input in the structural
response analysis. Non-linear analysis and performance assessment software, Perform 3D is used for the numerical simulations. Soil Structure Interaction (SSI) has been incorporated for different soil sites. The accuracy of the numerical model is calibrated with the test results
reported by other researchers. The results of analyses are presented in terms of the inter-storey drift and displacements. The seismic performance of the buildings is assessed under
different performance levels based on Vision 2000 document. The effect of incorporating SSI in the analysis is also discussed.
Keywords: Reinforced concrete frame, seismicity, performance level, inter-storey drift, SSI.
1. INTRODUCTION
It is well known that earthquake is one of the most destructive natural disasters. It has
claimed many human lives and damaged huge amount of properties. It was reported that
more than 50% of the casualties from natural disasters is attributed to earthquakes (Walling
and Mohanty, 2009).
Australian Earthquake Engineering Society 2014 Conference, Nov 21-23, Lorne, Victoria
Bhutan, a tiny Himalayan country is no exception from the fatalities of earthquakes.
Earthquakes of various sizes have occurred in Bhutan inflicting heavy casualties and damages
for centuries. The first severe earthquake reported in the literature was 1713 earthquake
which was believed to have occurred in the eastern Bhutan near the Indian state of Arunachal
Pradesh (Bilham, 2004, Ambraseys and Jackson, 2003). Although the exact time, size and
location of the earthquake were not very certain, yet it was reported that the earthquake
occurred in the night of spring and inflicted heavy casualties to human lives and their
properties (Ambraseys and Jackson, 2003). The most recent earthquake that rocked Bhutan
was in 2009 which had a magnitude of 6.1 in Richter scale. This earthquake claimed 13 lives
and damaged hundreds of buildings including rural and urban residential houses, schools and
monasteries (Joint Report, 2009). For the last seven and half decades, there were 32
earthquakes of engineering significance occurred in Bhutan, the most notable one being 1941
earthquake which had a magnitude of 6.75 (Dorji, 2009). In addition, there were a lot of
earthquakes occurred around Bhutan such as 1897 Mw=8.7 Shillong Plateau, 1934 Mw=8.3
Bihar-Nepal border, 1947 Mw=7.7 upper Assam and 1950 Mw=8.6 Arunachal Pradesh
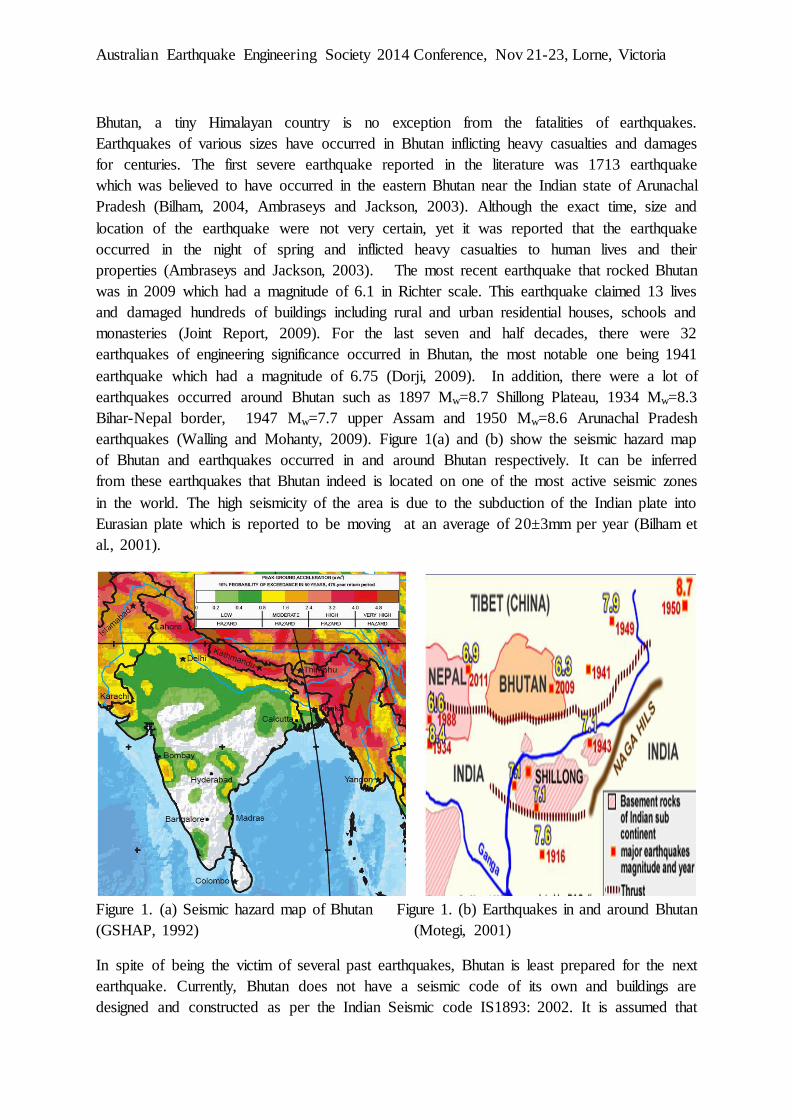
earthquakes (Walling and Mohanty, 2009). Figure 1(a) and (b) show the seismic hazard map
of Bhutan and earthquakes occurred in and around Bhutan respectively. It can be inferred
from these earthquakes that Bhutan indeed is located on one of the most active seismic zones
in the world. The high seismicity of the area is due to the subduction of the Indian plate into
Eurasian plate which is reported to be moving at an average of 20±3mm per year (Bilham et
al., 2001).
Figure 1. (a) Seismic hazard map of Bhutan Figure 1. (b) Earthquakes in and around Bhutan
(GSHAP, 1992) (Motegi, 2001)
In spite of being the victim of several past earthquakes, Bhutan is least prepared for the next
earthquake. Currently, Bhutan does not have a seismic code of its own and buildings are
designed and constructed as per the Indian Seismic code IS1893: 2002. It is assumed that
Australian Earthquake Engineering Society 2014 Conference, Nov 21-23, Lorne, Victoria
seismicity of Bhutan is the same as that of north eastern states of India which is designated
zone V of the Indian seismic code. Hao and Tashi (2010) studied the applicability of using
Indian seismic code to site conditions in Bhutan and expressed some concern for simply
following it in Bhutan. They found that while Indian code predicts very similar PGA in
Thimphu, the shapes of response spectrum are quite different from that predicted for
Thimphu which could result in different structural responses.
Moreover, the use of Indian seismic code has begun only from 1997 in the urban areas. Prior
to 1997, all buildings were either built based on some thumb rules or designed only for
gravity load. Rural houses were built by the local technicians without seismic features. As a
result in the last earthquake in 2009 many rural houses were heavily damaged. Hence, there
are thousands of buildings in both rural and urban areas which are potentially vulnerable to
earthquakes. Although reinforced concrete (RC) buildings built after 1997 were designed
according to the Indian seismic code, yet performance of these buildings has not been
properly assessed. Hence, seismic performance assessment of buildings especially in the
capital city, Thimphu has become the pressing need of the time. Population of the city is
increasing rapidly and so is the risk from earthquakes. It is paramount to know the
performance of the buildings beforehand so that mitigation measures can be addressed and be
prepared for the future events.
This paper presents the seismic performance assessment carried out for three typical RC
buildings in Thimphu using the ground motions predicted at generic soil sites in Thimphu by
Hao and Tashi (2010). Nonlinear dynamic analysis and performance assessment software
called Perform 3D was employed for the study. Soil structure interaction has been
incorporated as per the provision in ASCE 41 (2006) for different soil sites. The
performances of the typical buildings in terms of inter storey drift and displacements are
predicted for the 475 and 2475 years return period earthquakes and compared with the
provision in Vision 2000 document. The effects of soil structure interaction have also been
discussed.
2. NUMERICAL ANALYSIS
2.1 Model Calibration
In order that structural responses of the buildings are correctly predicted, dynamic nonlinear
analysis has been performed for the four-storey reinforced concrete frame building which was
pseudo-dynamically tested at the European Laboratory for Structural Assessment (ELSA).
The building was 10mx10m in plan and was designed according to Eurocodes 2 and 8. The
test was conducted for both low level (0.12g) and high level (0.45g) ground motions which
were artificially generated from the real recorded 1976 Friuli earthquake signal. The test set
up of the building is shown in Figure 2(a). The building and test details can be found in
Negro et al. (1994), Negro et al. (1996) and Negro and Colombo (1997).
Australian Earthquake Engineering Society 2014 Conference, Nov 21-23, Lorne, Victoria
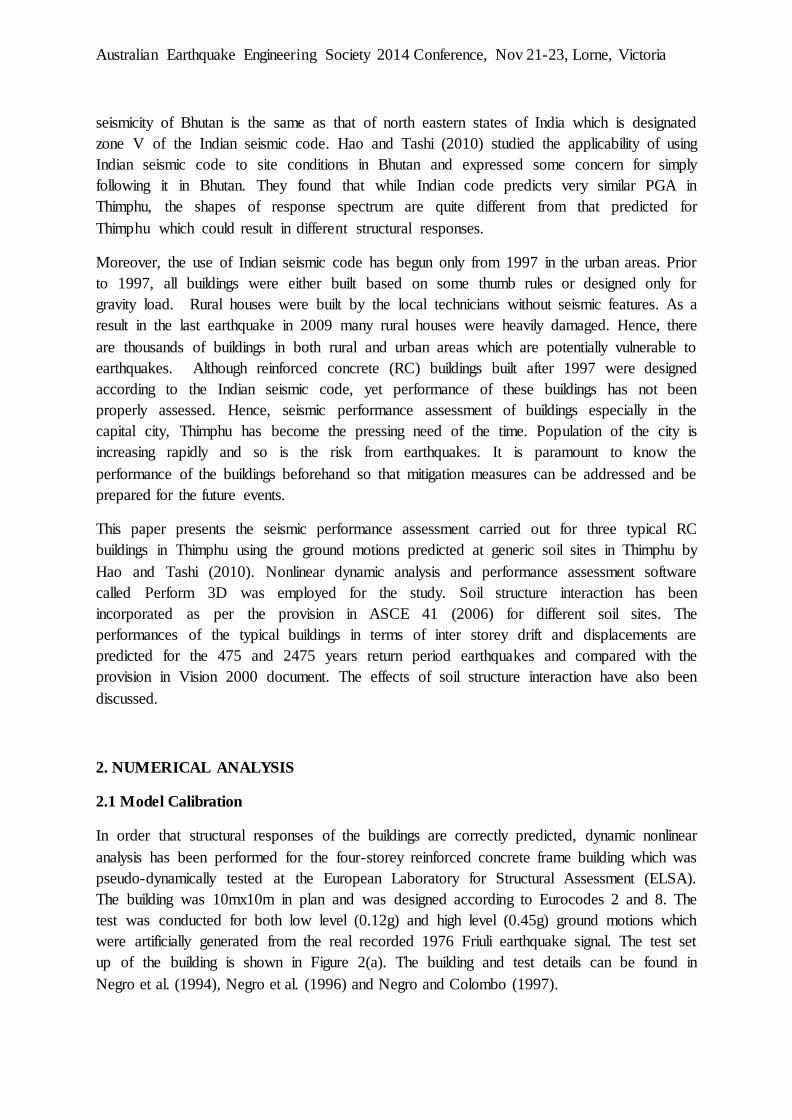
The structural responses predicted numerically are compared with that of test results. Figure 2
(b) shows the comparison of displacements predicted from numerical analysis and that
obtained from the test for high level test. As can be seen from the figure, a very good match
has been obtained indicating that the numerical model gives reliable predictions of structural
responses.
Figure 2(a).Test set of building (Pinto et al. 1994) Figure 2(b). Comparison with test results
2.2 Typical Buildings
The construction of RC buildings had begun as early as 1970s in Bhutan (Dorji, 2009).
Today, RC structures have replaced almost all the traditional structures such as adobe and
stone masonry buildings in the urban areas. Most of the RC buildings in Thimphu are three to
seven storeys tall and are mostly rectangular in plan. Ground floor is mainly used for
commercial purposes while top floors are used as residential units. In this study, three typical
residential RC buildings are considered. They represent the most common RC buildings in
Thimphu. They are labelled as ‘6 storey’, ‘3 storey new’ and ‘3 storey old’. ‘6 storey’ is a
typical six storey RC building which was designed and built after the adoption of Indian
seismic code in 1997. Six storey RC buildings are very common in the central area of
Thimphu where population of the city is concentrated. ‘3 storey new’ is a three storey RC
buildings which was also designed and built after the adoption of Indian seismic code. ‘3
storey old’ is a three storey RC building built prior to 1997 when no seismic provisions had
been incorporated. Both ‘3 storey old’ and ‘3 storey new’ are common in the central area as
well as in the other parts of Thimphu. For comparison, identical building plan with the same
Australian Earthquake Engineering Society 2014 Conference, Nov 21-23, Lorne, Victoria
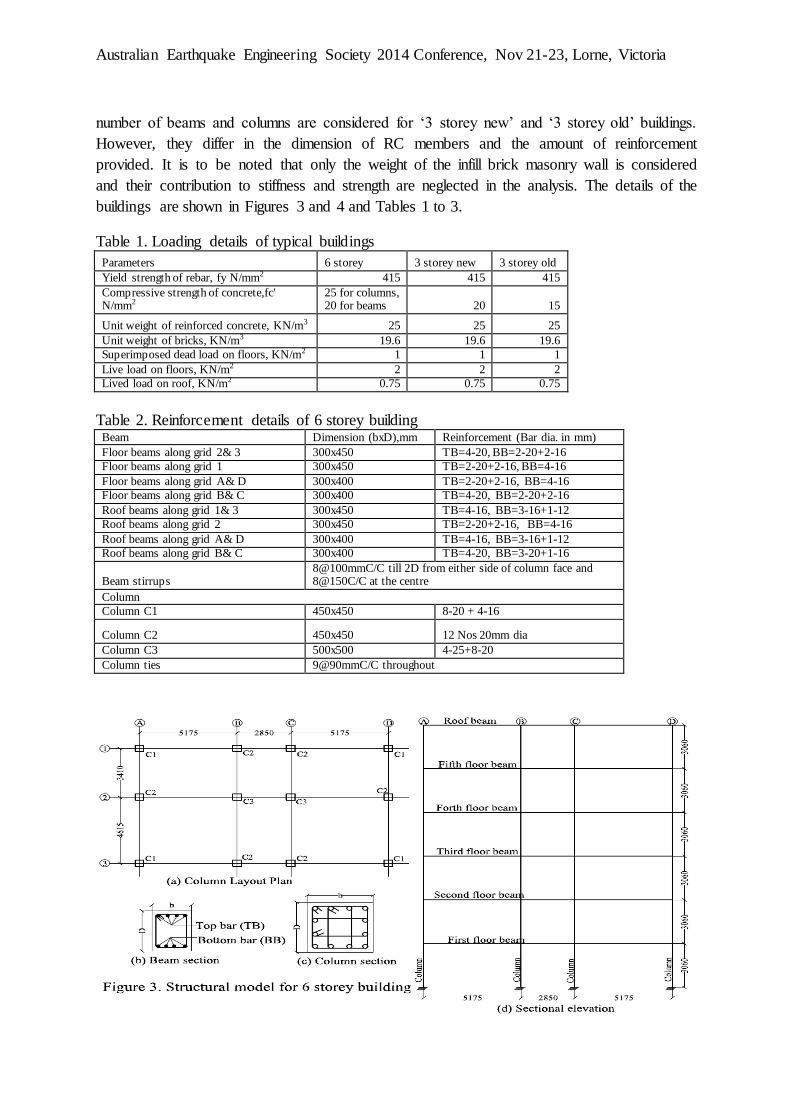
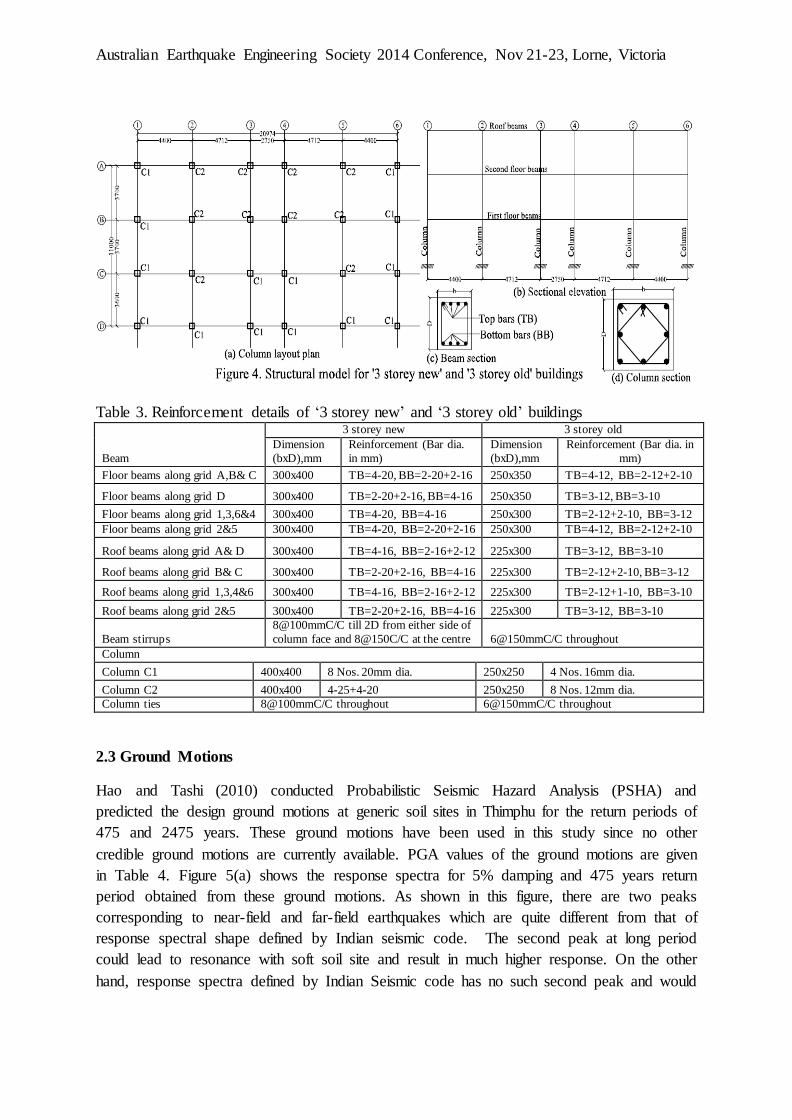
number of beams and columns are considered for ‘3 storey new’ and ‘3 storey old’ buildings.
However, they differ in the dimension of RC members and the amount of reinforcement
provided. It is to be noted that only the weight of the infill brick masonry wall is considered
and their contribution to stiffness and strength are neglected in the analysis. The details of the
buildings are shown in Figures 3 and 4 and Tables 1 to 3.
Table 1. Loading details of typical buildings
Parameters 6 storey 3 storey new 3 storey old
Yield strength of rebar, fy N/mm2 415 415 415
Compressive strength of concrete,fc' N/mm2
25 for columns, 20 for beams 20 15
Unit weight of reinforced concrete, KN/m3 25 25 25
Unit weight of bricks, KN/m3 19.6 19.6 19.6
Superimposed dead load on floors, KN/m2 1 1 1
Live load on floors, KN/m2 2 2 2
Lived load on roof, KN/m2 0.75 0.75 0.75
Table 2. Reinforcement details of 6 storey building Beam Dimension (bxD),mm Reinforcement (Bar dia. in mm)
Floor beams along grid 2& 3 300x450 TB=4-20, BB=2-20+2-16
Floor beams along grid 1 300x450 TB=2-20+2-16, BB=4-16
Floor beams along grid A& D 300x400 TB=2-20+2-16, BB=4-16
Floor beams along grid B& C 300x400 TB=4-20, BB=2-20+2-16
Roof beams along grid 1& 3 300x450 TB=4-16, BB=3-16+1-12
Roof beams along grid 2 300x450 TB=2-20+2-16, BB=4-16
Roof beams along grid A& D 300x400 TB=4-16, BB=3-16+1-12
Roof beams along grid B& C 300x400 TB=4-20, BB=3-20+1-16
Beam stirrups 8@100mmC/C till 2D from either side of column face and 8@150C/C at the centre
Column
Column C1 450x450 8-20 + 4-16
Column C2 450x450 12 Nos 20mm dia
Column C3 500x500 4-25+8-20
Column ties 9@90mmC/C throughout
Australian Earthquake Engineering Society 2014 Conference, Nov 21-23, Lorne, Victoria
Table 3. Reinforcement details of ‘3 storey new’ and ‘3 storey old’ buildings
Beam
3 storey new 3 storey old
Dimension
(bxD),mm
Reinforcement (Bar dia.
in mm)
Dimension
(bxD),mm
Reinforcement (Bar dia. in
mm)
Floor beams along grid A,B& C 300x400 TB=4-20, BB=2-20+2-16 250x350 TB=4-12, BB=2-12+2-10
Floor beams along grid D 300x400 TB=2-20+2-16, BB=4-16 250x350 TB=3-12, BB=3-10
Floor beams along grid 1,3,6&4 300x400 TB=4-20, BB=4-16 250x300 TB=2-12+2-10, BB=3-12
Floor beams along grid 2&5 300x400 TB=4-20, BB=2-20+2-16 250x300 TB=4-12, BB=2-12+2-10
Roof beams along grid A& D 300x400 TB=4-16, BB=2-16+2-12 225x300 TB=3-12, BB=3-10
Roof beams along grid B& C 300x400 TB=2-20+2-16, BB=4-16 225x300 TB=2-12+2-10, BB=3-12
Roof beams along grid 1,3,4&6 300x400 TB=4-16, BB=2-16+2-12 225x300 TB=2-12+1-10, BB=3-10
Roof beams along grid 2&5 300x400 TB=2-20+2-16, BB=4-16 225x300 TB=3-12, BB=3-10
Beam stirrups
8@100mmC/C till 2D from either side of
column face and 8@150C/C at the centre 6@150mmC/C throughout
Column
Column C1 400x400 8 Nos. 20mm dia. 250x250 4 Nos. 16mm dia.
Column C2 400x400 4-25+4-20 250x250 8 Nos. 12mm dia.
Column ties 8@100mmC/C throughout 6@150mmC/C throughout
2.3 Ground Motions
Hao and Tashi (2010) conducted Probabilistic Seismic Hazard Analysis (PSHA) and
predicted the design ground motions at generic soil sites in Thimphu for the return periods of
475 and 2475 years. These ground motions have been used in this study since no other
credible ground motions are currently available. PGA values of the ground motions are given
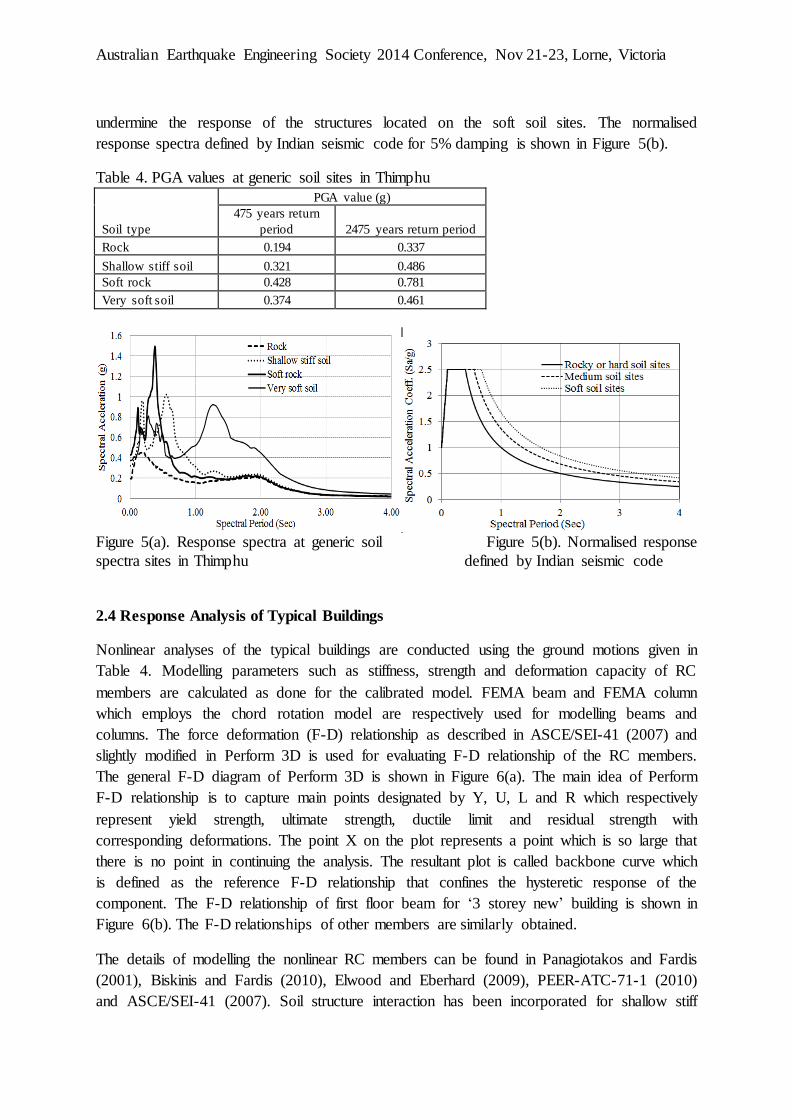
in Table 4. Figure 5(a) shows the response spectra for 5% damping and 475 years return
period obtained from these ground motions. As shown in this figure, there are two peaks
corresponding to near-field and far-field earthquakes which are quite different from that of
response spectral shape defined by Indian seismic code. The second peak at long period
could lead to resonance with soft soil site and result in much higher response. On the other
hand, response spectra defined by Indian Seismic code has no such second peak and would
Australian Earthquake Engineering Society 2014 Conference, Nov 21-23, Lorne, Victoria
undermine the response of the structures located on the soft soil sites. The normalised
response spectra defined by Indian seismic code for 5% damping is shown in Figure 5(b).
Table 4. PGA values at generic soil sites in Thimphu
Soil type
PGA value (g)
475 years return
period 2475 years return period
Rock 0.194 0.337
Shallow stiff soil 0.321 0.486
Soft rock 0.428 0.781
Very soft soil 0.374 0.461
Figure 5(a). Response spectra at generic soil Figure 5(b). Normalised response
spectra sites in Thimphu defined by Indian seismic code
2.4 Response Analysis of Typical Buildings
Nonlinear analyses of the typical buildings are conducted using the ground motions given in
Table 4. Modelling parameters such as stiffness, strength and deformation capacity of RC
members are calculated as done for the calibrated model. FEMA beam and FEMA column
which employs the chord rotation model are respectively used for modelling beams and
columns. The force deformation (F-D) relationship as described in ASCE/SEI-41 (2007) and
slightly modified in Perform 3D is used for evaluating F-D relationship of the RC members.
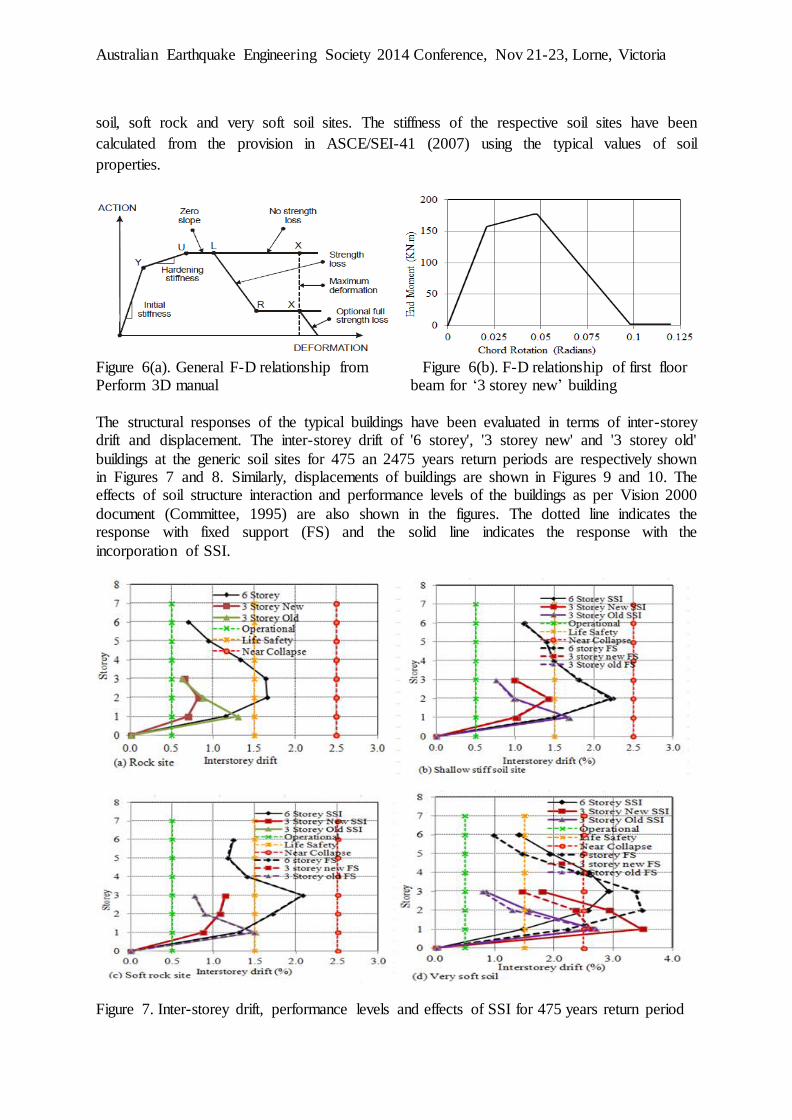
The general F-D diagram of Perform 3D is shown in Figure 6(a). The main idea of Perform
F-D relationship is to capture main points designated by Y, U, L and R which respectively
represent yield strength, ultimate strength, ductile limit and residual strength with
corresponding deformations. The point X on the plot represents a point which is so large that
there is no point in continuing the analysis. The resultant plot is called backbone curve which
is defined as the reference F-D relationship that confines the hysteretic response of the
component. The F-D relationship of first floor beam for ‘3 storey new’ building is shown in
Figure 6(b). The F-D relationships of other members are similarly obtained.
The details of modelling the nonlinear RC members can be found in Panagiotakos and Fardis
(2001), Biskinis and Fardis (2010), Elwood and Eberhard (2009), PEER-ATC-71-1 (2010)
and ASCE/SEI-41 (2007). Soil structure interaction has been incorporated for shallow stiff
Australian Earthquake Engineering Society 2014 Conference, Nov 21-23, Lorne, Victoria
soil, soft rock and very soft soil sites. The stiffness of the respective soil sites have been
calculated from the provision in ASCE/SEI-41 (2007) using the typical values of soil
properties.
Figure 6(a). General F-D relationship from Figure 6(b). F-D relationship of first floor Perform 3D manual beam for ‘3 storey new’ building
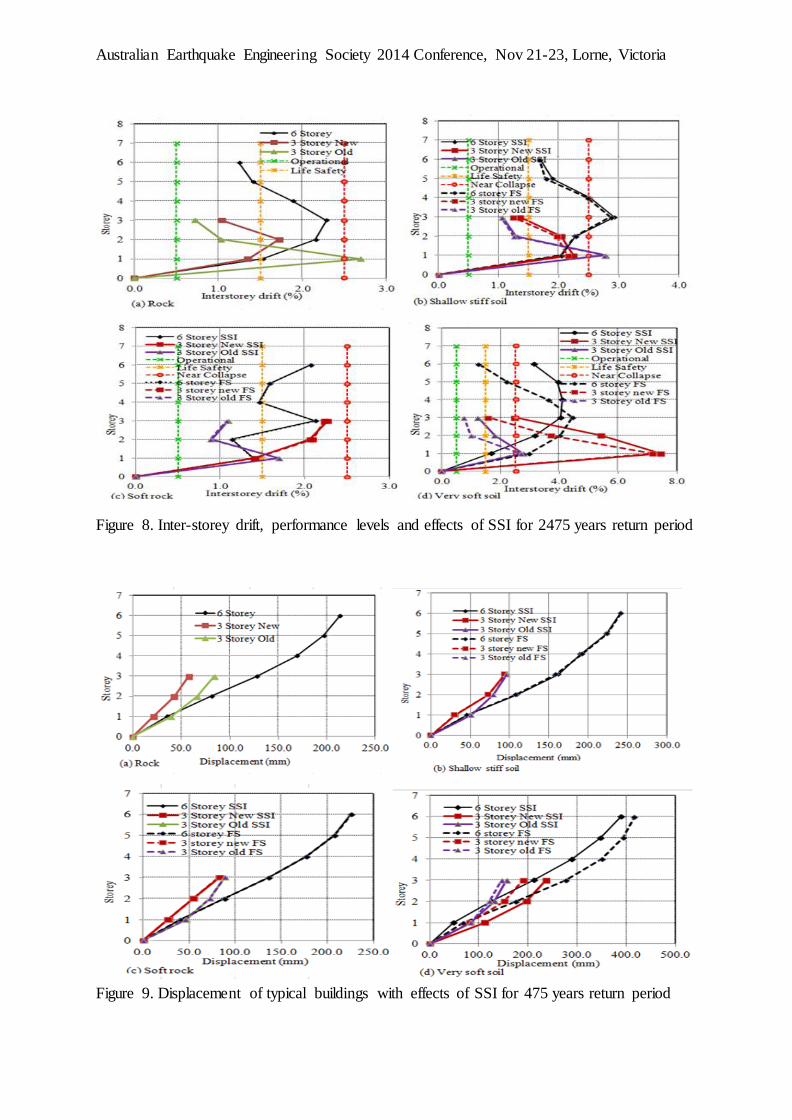
The structural responses of the typical buildings have been evaluated in terms of inter-storey drift and displacement. The inter-storey drift of '6 storey', '3 storey new' and '3 storey old'
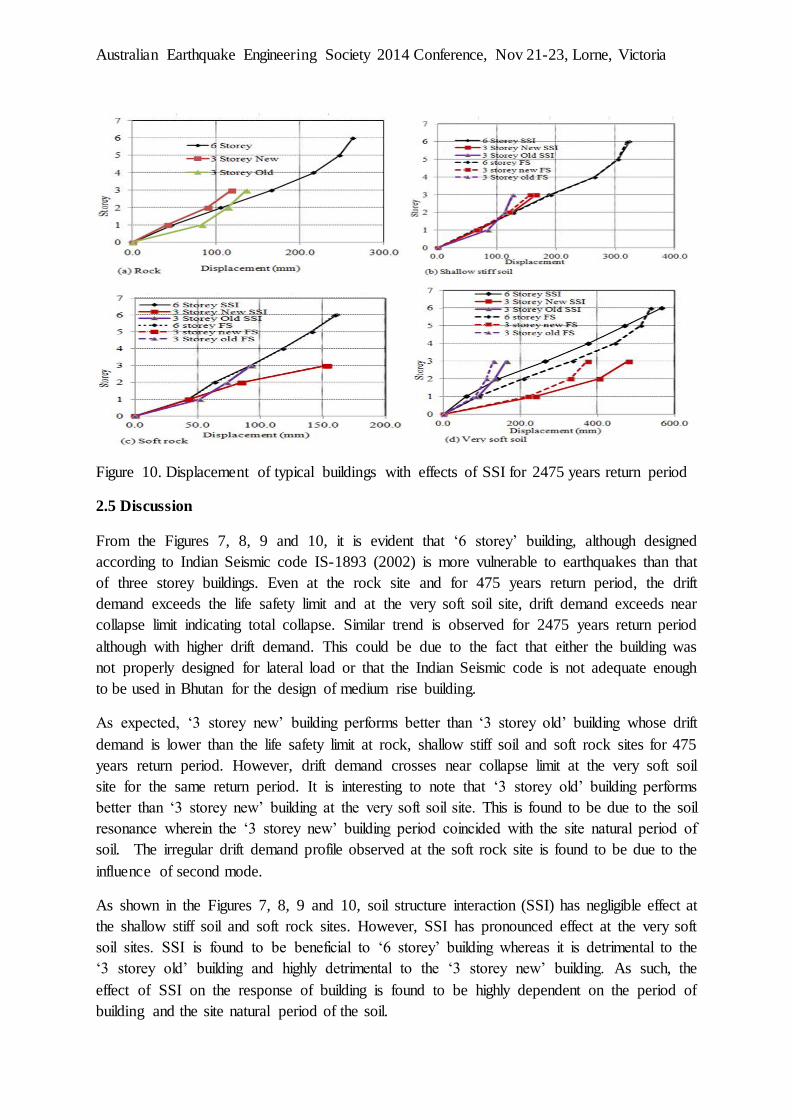
buildings at the generic soil sites for 475 an 2475 years return periods are respectively shown in Figures 7 and 8. Similarly, displacements of buildings are shown in Figures 9 and 10. The effects of soil structure interaction and performance levels of the buildings as per Vision 2000
document (Committee, 1995) are also shown in the figures. The dotted line indicates the response with fixed support (FS) and the solid line indicates the response with the
incorporation of SSI.
Figure 7. Inter-storey drift, performance levels and effects of SSI for 475 years return period
Australian Earthquake Engineering Society 2014 Conference, Nov 21-23, Lorne, Victoria
Figure 8. Inter-storey drift, performance levels and effects of SSI for 2475 years return period
Figure 9. Displacement of typical buildings with effects of SSI for 475 years return period
Australian Earthquake Engineering Society 2014 Conference, Nov 21-23, Lorne, Victoria
Figure 10. Displacement of typical buildings with effects of SSI for 2475 years return period
2.5 Discussion
From the Figures 7, 8, 9 and 10, it is evident that ‘6 storey’ building, although designed
according to Indian Seismic code IS-1893 (2002) is more vulnerable to earthquakes than that
of three storey buildings. Even at the rock site and for 475 years return period, the drift
demand exceeds the life safety limit and at the very soft soil site, drift demand exceeds near
collapse limit indicating total collapse. Similar trend is observed for 2475 years return period
although with higher drift demand. This could be due to the fact that either the building was
not properly designed for lateral load or that the Indian Seismic code is not adequate enough
to be used in Bhutan for the design of medium rise building.
As expected, ‘3 storey new’ building performs better than ‘3 storey old’ building whose drift
demand is lower than the life safety limit at rock, shallow stiff soil and soft rock sites for 475
years return period. However, drift demand crosses near collapse limit at the very soft soil
site for the same return period. It is interesting to note that ‘3 storey old’ building performs
better than ‘3 storey new’ building at the very soft soil site. This is found to be due to the soil
resonance wherein the ‘3 storey new’ building period coincided with the site natural period of
soil. The irregular drift demand profile observed at the soft rock site is found to be due to the
influence of second mode.
As shown in the Figures 7, 8, 9 and 10, soil structure interaction (SSI) has negligible effect at
the shallow stiff soil and soft rock sites. However, SSI has pronounced effect at the very soft
soil sites. SSI is found to be beneficial to ‘6 storey’ building whereas it is detrimental to the
‘3 storey old’ building and highly detrimental to the ‘3 storey new’ building. As such, the
effect of SSI on the response of building is found to be highly dependent on the period of
building and the site natural period of the soil.
Australian Earthquake Engineering Society 2014 Conference, Nov 21-23, Lorne, Victoria
2.6 Limitation
While every effort has been made in this study to be as practical as possible with respect to
the actual buildings at site, stiffness and strength of the masonry walls have been neglected.
Only the weight of the masonry wall is considered in this study. The static stiffness of the soil
is only considered as per ASCE/SEI-41 (2007), while the soil damping ratio which is integral
part of the soil has been neglected. These limitations are part of the author’s future course of
study.
3. CONCLUSION
Bhutan locates on one of the most active seismic zones in the world. A lot of significant
earthquakes have occurred in the past and inflicted heavy casualties to human lives and their
properties. Although the seismic risk is certain, Bhutan has no seismic design code of its own.
Prior to 1997, all buildings were either built by technicians based on some thumb rules or
designed only for gravity load. Post 1997, Indian Seismic code has been followed although its
applicability to the site conditions in Bhutan is still in question. The risk is higher in the
capital city, Thimphu where population is rapidly increasing. Inspite of all these risk factors,
seismic assessment of buildings in Thimphu has not been carried out properly.
This paper presents the seismic performance assessment of three typical RC buildings in
Thimphu. A six storey and a three storey buildings, designed and built in accordance with
Indian Seismic code IS 1893 and a 3 storey building designed only for gravity load are
considered for the study. Performances of these buildings are assessed using predicted ground
motions for Thimphu for the return periods of 475 and 2475 years. Influence of soil structure
interaction has also been included in the analyses.
From this study, it is found that six storey building is more vulnerable to earthquakes than
three storey buildings. The predicted drift demand exceeds the life safety limit even at the
rock site for 475 years return period as per Vision 2000 document. Three storey building
designed according to Indian Seismic code performs better than the three storey building
designed for gravity load alone. Soil structure interaction has limited effect at the shallow
stiff soil and soft rock sites, while larger effect is predicted at the very soft soil site. At a very
soft soil site, SSI is found to be beneficial to six storey building while it is found to be
detrimental to three storey building designed according to Indian Seismic code.
It should be noted that the poor performance of the buildings is at least partially attributed to
the relatively weak concrete strength of 20 and 25 MPa being used in the construction in
Bhutan. Using stronger construction material and proper design to avoid resonance could
greatly improve the performances of the buildings in Bhutan.
Australian Earthquake Engineering Society 2014 Conference, Nov 21-23, Lorne, Victoria
4. ACKNOWLEDGEMENT
The Endeavour Postgraduate Award provided by the Australian Government to the first
author is gratefully acknowledged. The authors also acknowledge Dr. Paolo Negro, Joint
Research Centre of European Commission for sharing the experimental test results and test
details.
5.REFERENCES
AMBRASEYS, N. & JACKSON, D. 2003. A note on early earthquakes in northern India and southern Tibet. Current Science, 84, 570-582.
ASCE/SEI-41 2007. Seismic Rehabilitation of Existing Buildings. American Society of Civil
Engineers.
BILHAM, R. 2004. Earthquakes in India and the Himalaya: tectonics, geodesy and history.
Annals of Geophysics, 47.
BILHAM, R., GAUR, V. K. & MOLNAR, P. 2001. Himalayan seismic hazard. Science(Washington), 293, 1442-1444.
BISKINIS, D. & FARDIS, M. N. 2010. Deformations at flexural yielding of members with continuous or lap-spliced bars. Structural concrete, 11, 127-138.
COMMITTEE, S. V. 1995. Performance-based seismic engineering. Structural Engineers Association of California, Sacramento, CA.
DORJI, J. 2009. Seismic performance of brick infilled RC frame structures in low and
medium rise buildings in Bhutan.
ELWOOD, K. J. & EBERHARD, M. O. 2009. Effective stiffness of reinforced concrete
columns. ACI Structural Journal, 106.
HAO, H. & TASHI, C. 2010. Earthquake Ground Motion Prediction and its Influence on Building Structures in Bhutan.
IS-1893 2002. Criteria for Earthquake Resistant Deisgn of Structures.
NEGRO, P. & COLOMBO, A. 1997. Irregularities induced by nonstructural masonry panels in framed buildings. Engineering Structures, 19, 576-585.
NEGRO, P., PINTO, A., VERZELETTI, G. & MAGONETTE, G. 1996. PsD test on four-story R/C building designed according to Eurocodes. Journal of Structural
Engineering, 122, 1409-1417.
NEGRO, P., VERZELETTI, G., MAGONETTE, G. & PINTO, A. 1994. Test on a four storey full scale RC frame designed according to Eurocode 8 and 2: Preliminary
report. Italy: Joint Research Center.

Australian Earthquake Engineering Society 2014 Conference, Nov 21-23, Lorne, Victoria
PANAGIOTAKOS, T. B. & FARDIS, M. N. 2001. Deformations of reinforced concrete members at yielding and ultimate. ACI Structural Journal, 98.
PEER-ATC-71-1 2010. Modeling and Acceptance Criteria for seismic Design and Analysis of Tall Buildings.
WALLING, M. Y. & MOHANTY, W. K. 2009. An overview on the seismic zonation and
microzonation studies in India. Earth-Science Reviews, 96, 67-91.