seismic performance of a building subjected to...
TRANSCRIPT

299ACI Structural Journal/March 2018
ACI STRUCTURAL JOURNAL TECHNICAL PAPER
A 10-story reinforced concrete building with intermediate moment frames and ordinary structural walls is designed to satisfy the provisions of a set of building codes widely used in the United States and around the world. A two-dimensional (2-D) analyt-ical model representing the nonlinear properties of the structural framing is implemented in computer software. The analytical model is subjected to 104 recorded earthquake ground motions consistent with the “intermediate” seismic environment of the building. The results enable comparison of the expected performance of a code- compliant structure and actual performance as represented by the numerical model. It is concluded that the prescriptive code-based approach can lead to critical underestimation of seismic demands. Of particular concern are the anticipated shear forces, which for some key structural components are beyond the design capacities. Coupled with structural detailing employed in these structures, the results indicate a high potential for relatively brittle failures in some key components during design-level shaking.
Keywords: building code; design provisions; intermediate moment frames; intermediate seismic hazard; ordinary reinforced concrete structural wall.
INTRODUCTIONVast regions of the United States and other parts of the
world can be classified informally as being regions of moderate or intermediate seismic risk. According to modern U.S. design requirements (IBC 2012; ASCE 7 2010; ACI Committee 318 2011), most new concrete structures in these regions must satisfy requirements for intermediate framing, which generally are less stringent than require-ments for regions of higher seismic risk. In ACI 318-11, the seismic force-resisting system of cast-in-place buildings typically is intermediate moment frames, ordinary struc-tural walls, or a combination of these two framing systems. Few studies have examined the safety of such buildings when subjected to design-level earthquake ground shaking (Han and Jee 2005; Jeong et al. 2012). Herein, results of a case study are described to illustrate expected performance of a typical multi-story building and to identify areas for design improvement.
The case-study building is an idealized 10-story building whose seismic force-resisting system comprises interme-diate moment frames and ordinary structural walls. The building is designed to satisfy current U.S. design require-ments for a building assigned to Seismic Design Category C (intermediate risk). Additionally, we adopted the story drift limits of the Colombian code (NSR-10 2010), which are more stringent than in the United States. A two-dimensional (2-D) analytical model representing the nonlinear proper-ties of the structural framing is implemented in computer software and subjected to 104 recorded earthquake ground motions consistent with the “intermediate” seismic environ-
ment of the building site. By examining the results of the seismic analysis, a perspective is developed on the effec-tiveness of the design provisions and on opportunities for building code improvement.
RESEARCH SIGNIFICANCEThis case study examines the expected performance of a
typical reinforced concrete building designed for interme-diate seismic risk. The results illustrate some aspects of the current design approach that are appropriately conservative and others that are less conservative. Some of the calculated results suggest an unacceptably high probability of brittle failure in key structural components. Overall, the study is significant to professional practice and building code development because it provides a perspective on the effec-tiveness of building code design provisions and on opportu-nities for improvement.
BUILDING CONFIGURATION AND ELASTIC PERIODSThe case-study building is an idealized 10-story building
whose seismic force-resisting system includes reinforced concrete intermediate moment frames and an ordinary struc-tural wall (Fig. 1 and 2). The first story is moderately taller than the other typical stories. The vertical elements of the seismic force-resisting system are connected through a rigid diaphragm comprising a two-way beam-supported slab of 6.5 in. (165 mm) thickness. Cross-sectional dimensions of the beams are 15.7 x 15.7 in. (40 x 40 cm). Two typical column cross-sectional dimensions are 19.7 x 19.7 in. (50 x 50 cm) and 19.7 x 27.6 in. (50 x 70 cm). Wall thickness for the first three stories is 7.9 and 5.9 in. (20 and 15 cm) for the fourth story and above.
The “C”-shaped reinforced concrete wall was included in the structural system to limit the maximum design story drift ratio to less than 0.01. In ASCE 7, the story drift ratio limit is 0.02 regardless of whether ordinary, intermediate, or special framing systems are used. A drift ratio limit of 0.01 was selected based on recommendations in NSR-10 and to address the concern that the detailing of interme-diate moment frames and ordinary structural walls would be insufficient for the larger drift ratio.
A linear-elastic model of the building was implemented in the software ETABS (CSI 2008). Member stiffnesses were reduced to account approximately for effects of
Title No. 115-S24
Seismic Performance of a Building Subjected to Intermediate Seismic Shakingby Carlos A. Arteta and Jack P. Moehle
ACI Structural Journal, V. 115, No. 2, March 2018.MS No. S-2015-287.R1, doi: 10.14359/51701095, was received April 13, 2017, and
reviewed under Institute publication policies. Copyright © 2018, American Concrete Institute. All rights reserved, including the making of copies unless permission is obtained from the copyright proprietors. Pertinent discussion including author’s closure, if any, will be published ten months from this journal’s date if the discussion is received within four months of the paper’s print publication.

300 ACI Structural Journal/March 2018
concrete cracking. (Refer to the section titled “Linear Model and Code-Based Design” later in this paper for additional details.) The calculated fundamental vibration period was 2.17 seconds in the NS direction and 1.79 seconds in the EW direction.
SEISMIC RISK CATEGORIZATIONThe manner in which seismic risk levels are expressed in
U.S. building codes has evolved over past decades. Versions
of ACI 318 prior to 1999 expressed seismic risk and corre-sponding design requirements using the terminology low, intermediate (or moderate), and high seismic risk. Later versions of ACI 318 introduced the Seismic Design Category concept, which expresses risk as a function of the expected ground shaking at the site as well as the occupancy and use of the structure. Among its several uses, the Seismic Design Category triggers different levels of detailing requirements. For typical buildings in Risk (Occupancy) Category II of ASCE 7 (for example, residential or office occupancy without large congregation areas), Seismic Design Catego-ries A and B correspond to low seismic risk; C corresponds to intermediate seismic risk; and D, E, and F correspond to high seismic risk.
The case-study building considered herein is categorized as Risk Category II and is located in the Western United States on a dense soil site (Site Class C). Following conven-tional practice using ASCE 7, Maximum Considered Earth-quake (MCE) seismic demands are obtained at short period and at a 1-second period. (Note: ASCE 7-10 introduces the Risk-Targeted Maximum Considered Earthquake Level [MCER). This paper opts to use the former terminology MCE.) These are adjusted for site effects, and then these are further adjusted to the design level by a factor of two-thirds. The resulting design spectral acceleration parameters are SDS = 0.49 and SD1 = 0.19. Because the case study building is categorized as Risk Category II and has (0.33 ≤ SDS < 0.50) and (0.133 ≤ SD1 < 0.20), it is assigned to Seismic Design Category C.
For cast-in-place reinforced concrete buildings assigned to Seismic Design Category C, the typical seismic force- resisting systems are intermediate moment frames and ordi-nary structural walls. For the case-study building, interme-diate moment frames combined with an ordinary structural wall were used. ASCE 7 permits this system to be considered a dual system if the frames are proportioned to resist 25% of the prescribed seismic forces, in which case the seismic design forces can be reduced by response modification coef-ficient R = 5.5. However, for this design, we selected the slightly more conservative value of R = 5.0, which applies to design of intermediate moment frames. This lower R-value was selected because the ratio of wall area to typical floor area was relatively small (approximately 0.0014) and because the difference in the two R-values would result in negligible changes in the framing design. The corresponding deflection amplification factor is Cd = 4.5.
The procedures of ASCE 7 were used to establish a smooth design response spectrum, considering that site-specific response spectra would not be used. The design response spectrum is anchored by the design spectral acceleration parameters SDS and SD1. The smooth continuous curve in Fig. 3(b) shows the design response spectrum before it is reduced by response modification coefficient R, and the smooth dashed curve in Fig. 3(b) shows the design response spectrum reduced by R.
GROUND MOTIONSSelection and scaling of earthquake ground motions is a
subject of ongoing research (Watson-Lamprey and Abraha-
Fig. 1—Plan view of typical floor showing structural elements of floor system, columns, and structural wall.
Fig. 2—Elevation view of building along Grid Line B.

301ACI Structural Journal/March 2018
mson 2006; Baker and Cornell 2006; Huang et al. 2009; Baker 2011). The approach used in this study, conducted in collaboration with a local engineering seismologist, was to select 52 pairs of unscaled earthquake ground motions (Fig. 3(a)) from the PEER NGA-West2 Database (2013). The selected records comply with the following parameters: closest distance to seismic source, ClsD = 6.2 to 18.6 miles
(10 to 30 km); NEHRP soil class C and D having Vs30 = 980 to 2000 ft/s (300 to 600 m/s); and moment magnitude Mw = 6.25 to 6.75. The 5% damped spectral accelerations of the selected ground motions have median values that approx-imate the elastic design response spectrum (Fig. 3(b)) as well as attenuation relationships (Campbell and Bozorgnia 2008) for intermediate seismic hazard scenarios as defined in NSR-10 (for example, 0.1g < PGA ≤ 0.2g). Further-more, the dispersion of the selected acceleration histories agrees with expected ground motion variability as estimated using the aforementioned ground motion attenuation model (Fig. 3(c)). ASCE 7 requires that the mean spectral acceler-ation of the selected motions used for design not fall below the design spectrum for the period range 0.2T to 1.5T. That period range is shown based on the fundamental period T obtained from the nonlinear analysis model. The median of the selected motions falls below the ASCE 7 requirement for longer periods.
LINEAR MODEL AND CODE-BASED DESIGNDesign for combined gravity and seismic actions was
in accordance with ASCE 7. A three-dimensional (3-D) linear structural model of the building was implemented in ETABS. To account for reduced structural stiffness due to concrete cracking and reinforcement slip from connec-tions, the effective moments of inertia of the beams were set to 0.35Ig and those of the columns and walls were set to 0.70Ig. The elastic modulus was 3120 ksi (21,500 MPa) for the beams and 3610 ksi (24,900 MPa) for the columns and walls.
Diaphragms were modeled as rigid in their plane and completely flexible out of plane. Columns were fixed at the grade level. The weight of the elements per unit volume was assumed 150 lb/ft3 (24 kN/m3) and their mass was lumped at floor and roof levels along with that corresponding to the superimposed dead load. The total building weight per unit area, including superimposed dead loads, is 158 lb/ft2 (7.47 kN/m2). Calculated periods based on these assump-tions were 2.17 and 1.79 seconds for the NS and EW direc-tions, respectively. Seismic base-shear coefficient was Cs = 0.028, which includes the reduction by response modifica-tion factor R (=5.0) and the amplification by the importance coefficient I (=1.0).
To account for higher-mode effects during the code-based analysis phase, a modal spectral analysis was done in two orthogonal directions, following ASCE 7 (2010) prescriptions, considering the smooth design spectrum of Fig. 3(b). The resulting base shears, including reduction by R and scaling to equivalent lateral force base shears, were 192 and 194 kip (853 and 864 kN) in the NS and EW direc-tions, respectively. The ratio between the design base shear and the building weight was 2.4%. Maximum roof drift ratio and story drift ratio in the NS direction, considering factor Cd/R, were 0.68% and 0.91%.
Design of beams, columns, and walls was in accordance with ASCE 7 (2010) and ACI 318-11. Concrete was normal-weight, with the following specified properties for the different elements in the structure: floor system concrete had fc′ = 3.0 ksi (20.7 MPa); column and wall concrete had fc′
Fig. 3—Response spectra (β = 5%) comparison: (a) indi-vidual and median spectral values for selected 104 ground motions; (b) code-based elastic design spectrum, reduced spectrum for design, and median spectrum of 104 selected ground motions; and (c) variability comparison between selected 104 ground motions and Campbell and Bozorgnia (2008) ground motion prediction equation.
302 ACI Structural Journal/March 2018
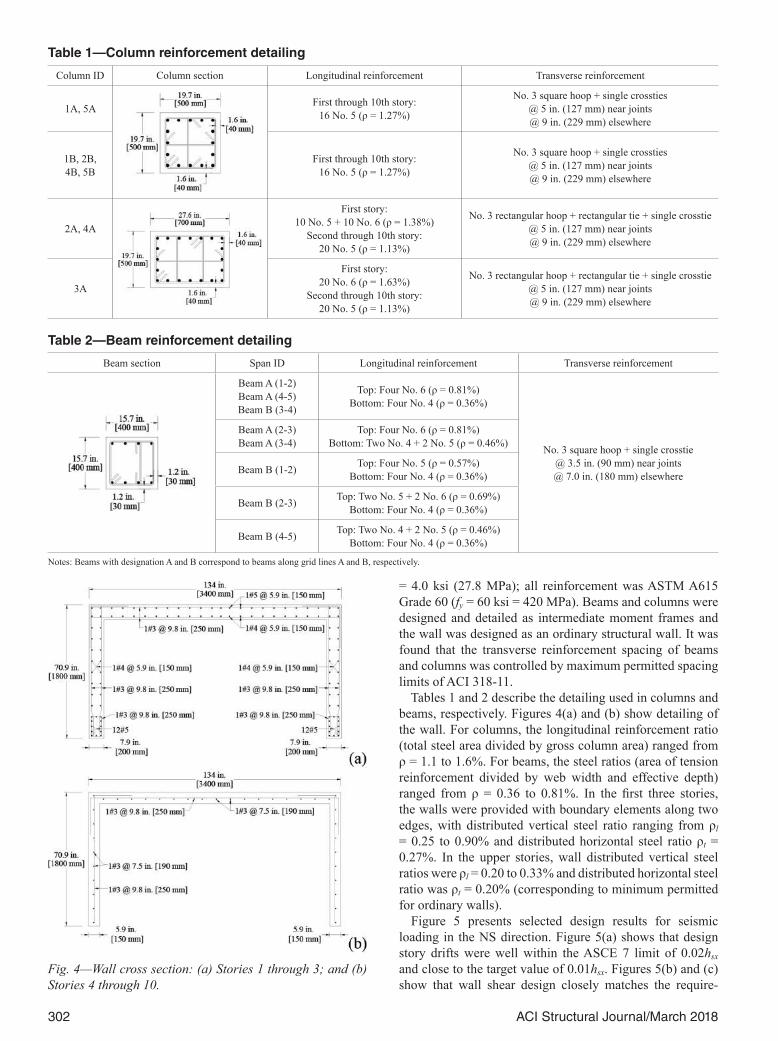
= 4.0 ksi (27.8 MPa); all reinforcement was ASTM A615 Grade 60 (fy = 60 ksi = 420 MPa). Beams and columns were designed and detailed as intermediate moment frames and the wall was designed as an ordinary structural wall. It was found that the transverse reinforcement spacing of beams and columns was controlled by maximum permitted spacing limits of ACI 318-11.
Tables 1 and 2 describe the detailing used in columns and beams, respectively. Figures 4(a) and (b) show detailing of the wall. For columns, the longitudinal reinforcement ratio (total steel area divided by gross column area) ranged from ρ = 1.1 to 1.6%. For beams, the steel ratios (area of tension reinforcement divided by web width and effective depth) ranged from ρ = 0.36 to 0.81%. In the first three stories, the walls were provided with boundary elements along two edges, with distributed vertical steel ratio ranging from ρl = 0.25 to 0.90% and distributed horizontal steel ratio ρt = 0.27%. In the upper stories, wall distributed vertical steel ratios were ρl = 0.20 to 0.33% and distributed horizontal steel ratio was ρt = 0.20% (corresponding to minimum permitted for ordinary walls).
Figure 5 presents selected design results for seismic loading in the NS direction. Figure 5(a) shows that design story drifts were well within the ASCE 7 limit of 0.02hsx and close to the target value of 0.01hsx. Figures 5(b) and (c) show that wall shear design closely matches the require-
Table 1—Column reinforcement detailing
Column ID Column section Longitudinal reinforcement Transverse reinforcement
1A, 5A First through 10th story:16 No. 5 (ρ = 1.27%)
No. 3 square hoop + single crossties@ 5 in. (127 mm) near joints@ 9 in. (229 mm) elsewhere
1B, 2B,4B, 5B
First through 10th story:16 No. 5 (ρ = 1.27%)
No. 3 square hoop + single crossties@ 5 in. (127 mm) near joints@ 9 in. (229 mm) elsewhere
2A, 4A
First story:10 No. 5 + 10 No. 6 (ρ = 1.38%)
Second through 10th story:20 No. 5 (ρ = 1.13%)
No. 3 rectangular hoop + rectangular tie + single crosstie@ 5 in. (127 mm) near joints@ 9 in. (229 mm) elsewhere
3A
First story:20 No. 6 (ρ = 1.63%)
Second through 10th story:20 No. 5 (ρ = 1.13%)
No. 3 rectangular hoop + rectangular tie + single crosstie@ 5 in. (127 mm) near joints@ 9 in. (229 mm) elsewhere
Table 2—Beam reinforcement detailing
Beam section Span ID Longitudinal reinforcement Transverse reinforcement
Beam A (1-2)Beam A (4-5)Beam B (3-4)
Top: Four No. 6 (ρ = 0.81%)Bottom: Four No. 4 (ρ = 0.36%)
No. 3 square hoop + single crosstie@ 3.5 in. (90 mm) near joints@ 7.0 in. (180 mm) elsewhere
Beam A (2-3)Beam A (3-4)
Top: Four No. 6 (ρ = 0.81%)Bottom: Two No. 4 + 2 No. 5 (ρ = 0.46%)
Beam B (1-2) Top: Four No. 5 (ρ = 0.57%)Bottom: Four No. 4 (ρ = 0.36%)
Beam B (2-3) Top: Two No. 5 + 2 No. 6 (ρ = 0.69%)Bottom: Four No. 4 (ρ = 0.36%)
Beam B (4-5) Top: Two No. 4 + 2 No. 5 (ρ = 0.46%)Bottom: Four No. 4 (ρ = 0.36%)
Notes: Beams with designation A and B correspond to beams along grid lines A and B, respectively.
Fig. 4—Wall cross section: (a) Stories 1 through 3; and (b) Stories 4 through 10.

303ACI Structural Journal/March 2018
ments, whereas wall moment strength satisfies the design requirement with considerable margin. In ACI 318-08 (ACI Committee 318 2008), ϕVn of beams and columns resisting earthquake effect E shall not be less than the smaller of: (a) the sum of the shear associated with development of nominal moment strengths of the member at each restrained end of the clear span and the shear calculated for factored gravity loads; and (b) the maximum shear obtained from design load combinations that include E, with E assumed to be twice that prescribed by ASCE 7. In ACI 318-11, part (b) of this requirement is changed for columns by requiring E to be increased by the overstrength factor Ωo, where Ωo = 3 for intermediate moment frames. Beams and columns met these latter requirements by an ample margin.
NONLINEAR MODEL FOR SEISMIC PERFORMANCE ASSESSMENT
Nonlinear analyses were used to assess the expected behavior of the case-study building under representative earthquake ground motions. The software package Open System for Earthquake Engineering Simulation, OpenSees (McKenna et al. 2000) was selected because its nonlinear analysies capabilities have been demonstrated by many researchers and because it facilitated conducting a large number of simulations.
As shown in Fig. 6(a) and 6(b), a 2-D model representative of the structural framing in the NS direction was selected for nonlinear analyses. Symmetry of the floor plan about the NS axis made it possible to select half the structural framing
Fig. 5—Code-based analysis and design results: (a) story drift ratio demand; (b) shear wall design shear demand and capacity; and (c) shear wall design flexural demand and capacity.
Fig. 6—Configuration of frames selected for nonlinear analyses: (a) plan view with selected frames; and (b) elevation of selected 2-D model.

304 ACI Structural Journal/March 2018
in the NS direction. To simulate the large in-plane stiffness of the floors, a rigid diaphragm constraint was imposed on the joints of each level. To represent second-order effects, a P-Delta type of geometric transformation (linear geometric transformation of column stiffness and resisting force from the local coordinate system to the global coordinate system, considering second-order P-Delta effects) was used for the columns while the small target drift ratio (≤1%) enforced in the design allowed for the use of linear geometric transfor-mation in the beams.
Structural elements were modeled to include axial and flex-ural deformations only. Nonlinear elements with distributed plasticity and fiber sections at the integration points (Spacone et al. 1996) were used to model all structural elements. The fiber sections represent cyclic, uniaxial stress-strain relation-ships for the different materials in every section. Concrete was modeled as either confined or unconfined, depending on location within the cross section, using the stress-strain rela-tionship proposed in Kent and Park (1971) as modified by Scott et al. (1982) to include the tensile behavior of concrete. The hysteretic behavior of concrete under stress reversal was modeled in accordance with Mohd Yassin (1994), including gradual degradation of stiffness under unloading and reloading in compression (Spacone et al. 1996). The longi-tudinal reinforcing steel stress-strain behavior was assumed to be bilinear with isotropic strain hardening (Filippou et al. 1983). This implementation allowed approximating the moment-curvature relationships of the structural elements at different levels of axial force. Although physical tests have shown that shear deformations in structural walls may be an important contributor to global displacement, especially for reinforced concrete walls with aspect ratios smaller than 4.0 (Beyer et al. 2011; Massone and Wallace 2004), in this paper, shear deformations and nonlinear shear responses were not modeled because the aspect ratio of the ordinary wall in the direction of interest exceeds 15. For older types of reinforced concrete frames subjected to high-intensity earthquake demand, explicit modeling of beam-column joints can be important because of shear cracking of the joint and bar slippage at its interface with the adjacent elements (Bayhan et al. 2015; Lowes and Altoontash 2003). Given the
low-to-intermediate level of ground shaking demand, and to avoid convergence problems, beam-column joints were assumed rigid, and bond-slip of reinforcement from joints was not modeled explicitly.
For the nonlinear dynamic analyses, mass and stiff-ness-proportional Rayleigh damping was used to simulate the energy dissipation characteristics of the building not represented by nonlinear behavior of the framing elements. The coefficients in the Rayleigh damping were established to achieve damping ratio of β = 5% at periods corresponding to the first and third translational vibration periods for the linear model. Calculated initial periods for the model were 1.76, 0.52, and 0.26 seconds for the first three modes. The initial periods are shorter than those obtained from the linear model because stiffness reduction factors that were applied to the linear model are not applied for the nonlinear model. Instead, nonlinearity is modeled directly by the fiber elements.
OBSERVATIONSResults from nonlinear static analyses
“Pushover” curves of the planar model were developed for loading in the north and south directions (Fig. 7). The negative (south) values of displacement put the flange of the wall in tension and the positive (north) displacements put it in compression. Two reference lateral load patterns were used: 1) rectangular load pattern with equal lateral force at every floor and roof level; and 2) first-mode-shape load pattern with lateral forces at each level proportional to the elastic first-mode shape of the structure. Lateral loading was terminated when the roof drift ratio reached 0.025. Note that the design intended to limit the maximum story drift ratio to 0.01.
As expected for a multi-story frame-wall building controlled by flexural yielding (shear failure was not modeled), the base-shear strength was sensitive to the distri-bution of lateral forces (Eberhard and Sozen 1993). The base shear was larger for the rectangular lateral load pattern because the shorter effective height of the lateral loading pattern results in larger shear force when the flexural mech-anism develops. Loading the wall toward the south engages the flange reinforcement in tension, which might be expected to strengthen the wall compared with loading in the opposite direction. However, the thin wall stems crushed well before all the flange reinforcement could be engaged, resulting in reduced strength for loading toward the south. Comparing overall structure design base-shear demand versus the shear demands from the nonlinear analyses, Fig. 7 suggests an average global overstrength factor of 3.0. This compares with Ωo values of 3.0 and 2.5 for intermediate moment frames and dual systems, respectively (ASCE 7 2010).
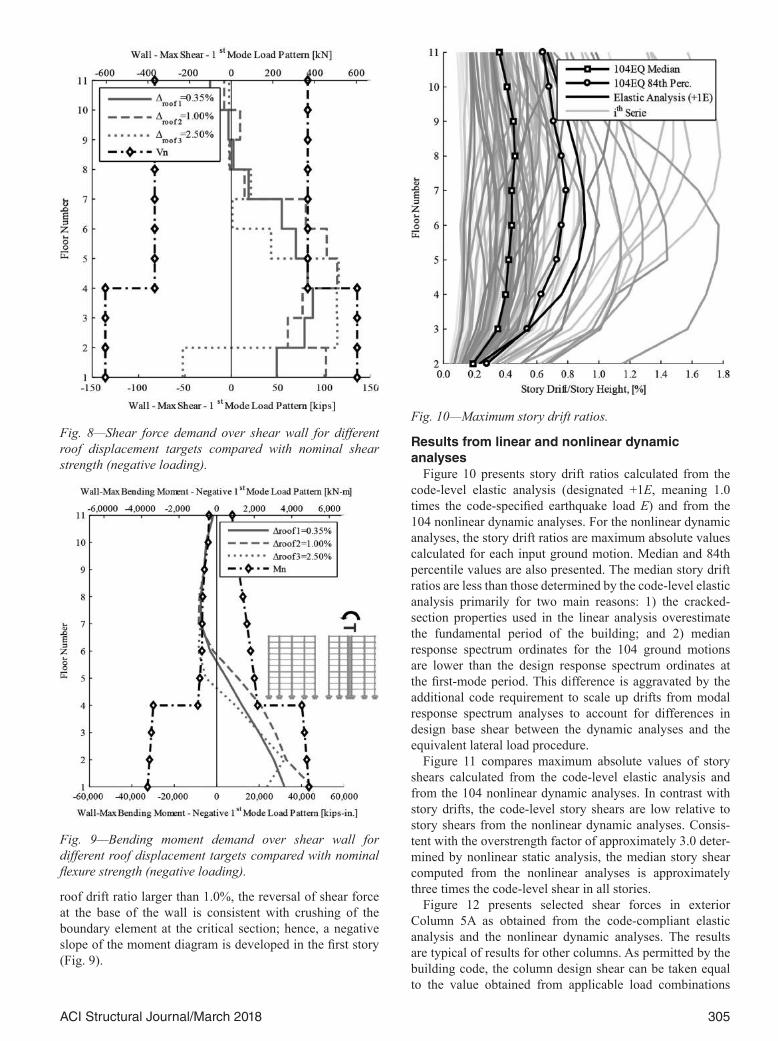
Figures 8 and 9 show the calculated shear and bending moment responses of the wall to the first-mode-shape loading pattern. Frame-wall interaction results in shear force “reversal” in upper stories of the wall. Wall flexural yielding under this loading pattern commences early in upper levels, but eventually includes flexural yielding at the wall base. Wall shears under this loading pattern initially are at or below nominal wall shear strength, but increase to values exceeding the nominal strengths for higher drift levels. At
Fig. 7—Pushover curves (negative direction for flange of shear wall in tension).
305ACI Structural Journal/March 2018
roof drift ratio larger than 1.0%, the reversal of shear force at the base of the wall is consistent with crushing of the boundary element at the critical section; hence, a negative slope of the moment diagram is developed in the first story (Fig. 9).
Results from linear and nonlinear dynamic analyses
Figure 10 presents story drift ratios calculated from the code-level elastic analysis (designated +1E, meaning 1.0 times the code-specified earthquake load E) and from the 104 nonlinear dynamic analyses. For the nonlinear dynamic analyses, the story drift ratios are maximum absolute values calculated for each input ground motion. Median and 84th percentile values are also presented. The median story drift ratios are less than those determined by the code-level elastic analysis primarily for two main reasons: 1) the cracked- section properties used in the linear analysis overestimate the fundamental period of the building; and 2) median response spectrum ordinates for the 104 ground motions are lower than the design response spectrum ordinates at the first-mode period. This difference is aggravated by the additional code requirement to scale up drifts from modal response spectrum analyses to account for differences in design base shear between the dynamic analyses and the equivalent lateral load procedure.
Figure 11 compares maximum absolute values of story shears calculated from the code-level elastic analysis and from the 104 nonlinear dynamic analyses. In contrast with story drifts, the code-level story shears are low relative to story shears from the nonlinear dynamic analyses. Consis-tent with the overstrength factor of approximately 3.0 deter-mined by nonlinear static analysis, the median story shear computed from the nonlinear analyses is approximately three times the code-level shear in all stories.
Figure 12 presents selected shear forces in exterior Column 5A as obtained from the code-compliant elastic analysis and the nonlinear dynamic analyses. The results are typical of results for other columns. As permitted by the building code, the column design shear can be taken equal to the value obtained from applicable load combinations
Fig. 8—Shear force demand over shear wall for different roof displacement targets compared with nominal shear strength (negative loading).
Fig. 9—Bending moment demand over shear wall for different roof displacement targets compared with nominal flexure strength (negative loading).
Fig. 10—Maximum story drift ratios.

306 ACI Structural Journal/March 2018
with seismic forces E amplified to 2E (ACI 318-08) or 3E (ACI 318-11). The nominal shear strength of these structural components is also shown. The design shear based on 2E is unconservative relative to the median shear demands. The design shear based on 3E exceeds median plus one stan-dard deviation demands for all but the first story. The design shears for the first story are significantly underestimated relative to the nonlinear model demands because of differ-ences in the wall stiffness in the two models. In the linear
model, the wall is very stiff such that it absorbs most of the base shear, whereas in the nonlinear model, wall yielding results in greater wall flexibility, which redistributes base shear to the first-story columns. For the case-study building, the column proportions and reinforcement were controlled by design considerations other than shear, such that the provided shear strength exceeds shear demands by a signif-icant margin.
In frame-wall systems undergoing seismic shaking, the distribution of forces along the height of the wall varies with time but it can be approximated as uniform with a load reversal at the roof level. This distribution may differ from that estimated in an elastic modal response analysis, sometimes exacerbating the demand in the upper portions of the wall. Figure 13 compares wall moments, including the design moments from the code-compliant elastic analysis, the moments from the nonlinear analyses, and the provided nominal moment strength. In the nonlinear analyses, nominal moment strength is developed at the base in several of the 104 ground motions, but the primary flexural yielding location occurs at the sharp transition in moment strength at Level 4. Yielding at this elevation is of some concern because the wall has only a single curtain of reinforce-ment without hoops to confine the core concrete, limiting the ductility capacity at this level. The vulnerability of thin, lightly reinforced walls was noted as a contributing factor for the damage or collapse of buildings in the 2010 Maule earthquake (Wallace et al. 2012; Jünemann et al. 2015) and the 2011 Christchurch earthquake (Elwood 2013; Beca 2011). In this case study, however, only 6% of the ground motions resulted in calculated curvature demands exceeding the calculated curvature capacity (Arteta and Moehle 2014).
Fig. 11—Maximum story shears normalized to effective weight W.
Fig. 12—Column shear demands and capacities.
Fig. 13—Wall moment demands and capacities for flange in tension case.

307ACI Structural Journal/March 2018
Figure 14 compares wall shears, including the design shears from the code-compliant elastic analysis, the shears from the nonlinear analyses, and the provided nominal shear strength. The shears from almost all the earthquake ground motions exceed the design-basis shears, with median shears ranging from 1.5 times design shear in the first story to as high as 2.9 times the design shear in the eighth story. To understand the source of the high shear forces, it is important to recall that the design moments and shears are obtained from a design response spectrum that has been reduced by the response modification factor R. In part, the higher shear force occurs because of wall flexural overstrength, which drives up the forces required to yield the wall. Additionally, shears due to apparent higher-mode response are not much reduced by flexural yielding of the wall, but instead hover around the elastic values (Eibl and Kreintzel 1988). Kine-matic interaction with elements framing into the wall also increases the shear demand because of deformation compat-ibility requirements (Panagiotou and Restrepo 2011).
With the exception of the kinematic interaction effect, U.S. codes do not directly address the aforementioned amplifica-tion of wall shear forces. The Structural Engineers Associa-tion of California recommends a shear amplification factor applicable to special structural walls (SEAOC Seismology Committee 2009), which would increase the design shear to 1.4 times the value obtained from the code-based analysis. Eurocode 8 (2004) recommends amplifying the shear force by a factor not less than 1.5 for ductility class “medium” walls (which have details different from ordinary structural walls in the U.S. practice). Rejec et al. (2012) showed that even larger shear forces should be considered. They propose calculating the shear force demand along the height of the walls based on the estimated shear demand from an elastic
response spectrum analysis, accounting only for first-mode contributions, but then amplified by the inclusion of flexural overstrength and higher-mode elastic contributions. Exact application of their methodology produces overly conserva-tive shear demands on the lower portion of the wall of this study because their procedure is calibrated for isolated canti-lever walls that only hinge at the base, and their method for accounting for higher-mode effects does not include framing interaction.
Considering the potentially brittle nature of wall shear failure, a relatively conservative shear design approach should be adopted. The Tall Buildings Initiative Guidelines (TBI 2010) recommend that design for wall shear should be based on
ϕVne ≥ Vu,TBI (1)
where ϕ is the strength reduction factor for shear = 0.75; Vne is the nominal shear strength based on expected material properties, which for a lightly reinforced wall is approxi-mately 1.15Vn; Vn is the nominal shear strength from ACI 318; and Vu,TBI is the mean plus one standard deviation shear from nonlinear dynamic analysis, which can be approxi-mated by the 84th percentile shear. Using this approach, the required nominal shear strength in the first story should be at least 215 kip (954 kN), which is almost twice the provided strength. Although the TBI approach is intended for design of tall buildings located in highly seismic regions, and not for moderately tall buildings in regions of moderate seis-micity, the discrepancy between the demand and capacity suggests the possibility of a serious shortcoming in the current design procedures for walls in buildings assigned to Seismic Design Category C. For the case studied in this paper, the code-based shear demand in the lower portion of wall (first to third story) needs to be amplified by factor 2.3 to comply with the TBI recommendations, while the shear in the upper portion of the wall needs to be amplified by factor 3.6.
A scatter plot of normalized maximum shear demand at the base of the wall versus maximum story drift ratio is presented in Fig. 15. A linear regression line with corre-sponding 95% confidence interval is fitted to the data. On average, the inelastic wall shear demand exceeds the nominal capacity for maximum story drift ratios greater than 0.5%. At the design story drift limit of 1%, the demand on the wall is, on average, 35% greater than the nominal capacity, suggesting that a poor behavior of the wall might be expected under design level shaking, even at relatively low values of displacement demand. It is worth mentioning that expected actual drift ratios may be larger than those expressed previously if one accounts for shear deformations of the wall and the beam-column joints.
CONCLUSIONSA single case study assesses the performance, through
numerical modeling, of a code-compliant structural design under realistic scenarios of seismic shaking. The study focuses on the behavior of a structural system comprising an ordinary reinforced concrete shear wall and intermediate
Fig. 14—Wall shear demands and capacities.

308 ACI Structural Journal/March 2018
frames in an intermediate seismic zone. Although simplifi-cations were made to study a 3-D building with an inelastic 2-D model along its axis of symmetry, the model properly accounts for wall-frame interaction and flexural inelastic response of its members. It is found that the code-level design forces for some elements are less than the median level of demand imposed by ground motion scenarios repre-sentative of the design level. Thus, it seems likely that some components of the studied building would fail to comply with the performance objectives intended by the codes.
The nonlinear analyses suggest that the shear demand on the wall for design-level earthquake shaking may be as much as two or more times the shear force obtained from code-level linear analysis. Furthermore, the analyses indicate that the provided shear strength of the wall may be exceeded even at relatively low story drift ratios. This suggests that a relatively brittle failure might occur for this very stiff struc-tural component.
Nonlinear flexural response of the wall resulted in increased column shear demands relative to those obtained by the code-level analyses. Although the calculated median nonlinear shear demand on columns exceeded the design code-based demand, shear strength of the columns was dictated by minimum shear reinforcement requirements of intermediate frames, providing design strength well beyond the overall maximum demand.
For intermediate moment frames, ACI 318 permits the beam and column design shear demands to be based on load combinations using 2E and ΩοE, respectively, in which E represents the calculated effect of earthquake loads and Ωο = 3 is the amplification factor for system overstrength. Beams and columns met these requirements by an ample margin. For shear walls, it is permitted to use the shear E calculated directly from effect of earthquake loads. Either the factors on E should be increased or more rigorous requirements for shear design of walls should be provided.
The moment strength design requirements for ordinary reinforced concrete walls of buildings in regions of inter-mediate seismicity may also need revision. The case study showed that, at the design shaking level, flexural yielding
of the wall can occur at locations away from the intended critical section at the base. In the case-study building, this is partly attributable to a code-compliant sudden change in wall moment strength occurring at an intermediate height of the building. The introduction of code provisions requiring more uniformity in the moment strength over the building height could reduce the likelihood of yielding at unintended locations.
AUTHOR BIOSACI member Carlos A. Arteta is a Professor of Civil Engineering at Universidad del Norte, Barranquilla, Colombia. He received his BS from Universidad del Norte and his MEng and PhD from the University of Cali-fornia, Berkeley, Berkeley, CA. He is a member of ACI Committee 374, Performance-Based Seismic Design of Concrete Buildings. His research interests include the design and behavior of concrete structures and earth-quake engineering.
Jack P. Moehle, FACI, is the Ed and Diane Wilson Professor of Structural Engineering at the University of California, Berkeley. He is a past member of the ACI Board of Direction and the Technical Activities Committee, and Chair of ACI Committee 318, Structural Concrete Building Code.
ACKNOWLEDGMENTSThe authors would like to thank J. Watson-Lamprey and Y. Bozorgnia
for their support in the selection of the ground motion time series from the Pacific Earthquake Engineering Research Center (PEER) NGA database.
NOTATIONCd = deflection amplification factorClsD = closest distance to surface projection of co-seismic ruptureE = effect of horizontal earthquake-induced forcesfc′ = concrete compressive strengthfy = reinforcing steel yield strengthhsx = story height below Level xIg = moment of inertia of gross cross section about centroidal axisMn = nominal moment strengthMw = moment magnitudeR = response modification coefficientSD1 = design spectral response acceleration parameter at period of 1.0
secondsSDS = design spectral response acceleration parameter at short periodsT = fundamental period of the structureVn = nominal shear strengthVne = nominal shear strength based on expected material propertiesVs30 = average shear-wave velocity in top 30 m (100 ft) of site profileVu,TBI = mean plus one standard deviation shear from nonlinear dynamic
analysisβ = damping ratioΔroof = roof displacement/total heightε = number of standard deviations from medianϕ = strength reduction factorρ = total area of steel divided by gross column area for columns;
= area of tension reinforcement divided by web width and effec-tive depth for beams
ρl = ratio of area of distributed longitudinal reinforcement to gross concrete area perpendicular to that reinforcement for the wall
ρt = ratio of area of distributed transverse reinforcement to gross concrete area perpendicular to that reinforcement for the wall
Ωo = amplification factor due to structural lateral-force-resisting system overstrength
REFERENCESACI Committee 318, 2008, “Building Code Requirements for Structural
Concrete and Commentary (ACI 318-08),” American Concrete Institute, Farmington Hills, MI, 473 pp.
ACI Committee 318, 2011, “Building Code Requirements for Structural Concrete and Commentary (ACI 318-11),” American Concrete Institute, Farmington Hills, MI, 503 pp.
Arteta, C. A., and Moehle, J. P., 2014, “Review of the Behavior of a Code Compliant Structural Design under Realistic Case Scenario of Seismic Hazard Demand,” UCB/SEMM Report No. 2014/05, University of Cali-fornia, Berkeley, Berkeley, CA, 67 pp.
Fig. 15—Wall base-shear demand versus maximum story drift ratio.

309ACI Structural Journal/March 2018
ASCE, 2010, “Minimum Design Loads for Buildings and Other Struc-tures (ASCE/SEI 7-10),” American Society of Civil Engineering/ Structural Engineering Institute, Reston, VA, 636 pp.
Baker, J. W., 2011, “Conditional Mean Spectrum Tool for Ground Motion Selection,” Journal of Structural Engineering, ASCE, V. 137, No. 3, pp. 322-331. doi: 10.1061/(ASCE)ST.1943-541X.0000215
Baker, J. W., and Cornell, C. A., 2006, “Spectral Shape, Epsilon and Record Selection,” Earthquake Engineering and Structural Dynamics, V. 35, No. 9, pp. 1077-1095. doi: 10.1002/eqe.571
Bayhan, B.; Moehle, J. P.; Yavari, S.; Elwood, K. J.; Lin, S. H.; Wu, C. L.; and Hwang, S. J., 2015, “Seismic Response of a Concrete Frame with Weak Beam-Column Joints,” Earthquake Spectra, V. 31, No. 1, pp. 293-315. doi: 10.1193/071811EQS179M
Beca, 2011, “Investigation into the Collapse of the Pyne Gould Corpo-ration Building on 22nd February 2011,” Report to the Department of Building and Housing, Beca Carter Hollings & Ferner Ltd., Auckland, New Zealand.
Beyer, K.; Dazio, A.; and Priestley, M. J. N., 2011, “Shear Deformations of Slender Reinforced Concrete Walls under Seismic Loading,” ACI Struc-tural Journal, V. 108, No. 2, Mar.-Apr., pp. 167-177.
Campbell, K. W., and Bozorgnia, Y., 2008, “NGA Ground Motion Model for the Geometric Mean Horizontal Component of PGA, PGV, PGD and 5% Damped Linear Elastic Response Spectra for Periods Ranging from 0.01 to 10 s,” Earthquake Spectra, V. 24, No. 1, pp. 139-171. doi: 10.1193/1.2857546
CSI, 2008, ETABS – Extended 3D Analysis of Building Systems (v9.5.0), Computers and Structures, Inc., Berkeley, CA.
Eberhard, M. O., and Sozen, M. A., 1993, “Behavior-Based Method to Determine Design Shear in Earthquake-Resistant Walls,” Journal of Structural Engineering, ASCE, V. 119, No. 2, pp. 619-640. doi: 10.1061/(ASCE)0733-9445(1993)119:2(619)
Eibl, J., and Kreintzel, E., 1988, “Seismic Shear Forces in RC Cantilever Shear Walls,” Proceedings, 9th World Conference on Earthquake Engi-neering, Paper 9-1-1, Tokyo-Kyoto, Japan.
Elwood, K., 2013, “Performance of Concrete Buildings in the 22 February 2011 Christchurch Earthquake and Implications for Canadian Codes,” Canadian Journal of Civil Engineering, V. 40, No. 3, pp. 759-776.
Eurocode 8, 2004, “Eurocode 8: Design of Structures for Earthquake Resistance, Part 1, General Rules, Seismic Actions and Rules for Build-ings,” Comité Européen de Normalisation, Brussels, Belgium.
Filippou, F. C.; Popov, E. P.; and Bertero, V. V., 1983, “Effects of Bond Deterioration on Hysteretic Behavior of Reinforced Concrete Joints,” Report UCB/EERC-83/19, Earthquake Engineering Research Center, University of California, Berkeley, Berkeley, CA, 212 pp.
Han, S. W., and Jee, N. Y., 2005, “Seismic Behaviors of Columns in Ordi-nary and Intermediate Moment Resisting Concrete Frames,” Engineering Structures, V. 27, No. 6, pp. 951-962. doi: 10.1016/j.engstruct.2005.01.012
Huang, Y. N.; Whittaker, A. S.; Luco, N.; and Hamburger, R. O., 2009, “Scaling Earthquake Ground Motions for Performance-Based Assessment of Buildings,” Journal of Structural Engineering, ASCE, V. 137, No. 3, pp. 311-321. doi: 10.1061/(ASCE)ST.1943-541X.0000155
IBC, 2012, “International Building Code (IBC-2012),” International Code Council, Inc., Country Club Hills, IL, 690 pp.
Jeong, S. H.; Mwafy, A. M.; and Elnashai, A. S., 2012, “Probabilistic Seismic Performance Assessment of Code-Compliant Multi-Story RC Buildings,” Engineering Structures, V. 34, pp. 527-537. doi: 10.1016/j.engstruct.2011.10.019
Jünemann, R.; de la Llera, J. C.; Hube, M. A.; Cifuentes, L. A.; and Kausel, E., 2015, “A Statistical Analysis of Reinforced Concrete Wall Build-ings Damaged during the 2010, Chile Earthquake,” Engineering Structures, Elsevier Ltd., V. 82, pp. 168-185. doi: 10.1016/j.engstruct.2014.10.014
Kent, D. C., and Park, R., 1971, “Flexural Members with Confined Concrete,” Journal of the Structural Division, ASCE, V. 97, No. 7, pp. 1969-1990.
Lowes, L. N., and Altoontash, A., 2003, “Modeling Reinforced- Concrete Beam-Column Joints Subjected to Cyclic Loading,” Journal of Structural Engineering, ASCE, V. 129, No. 12, pp. 1686-1697. doi: 10.1061/(ASCE)0733-9445(2003)129:12(1686)
Massone, L. M., and Wallace, J. W., 2004, “Load-Deformation Responses of Slender Reinforced Concrete Walls,” ACI Structural Journal, V. 101, No. 1, Jan.-Feb., pp. 103-113.
McKenna, F.; Fenves, G. L.; Scott, M. H.; and Jeremic, B., 2000, Open System for Earthquake Engineering Simulation (OpenSees), Pacific Earth-quake Engineering Research Center, University of California, Berkeley, Berkeley, CA, http://opensees.berkeley.edu.
Mohd Yassin, M. H., 1994, “Nonlinear Analysis of Prestressed Concrete Structures under Monotonic and Cyclic Loads,” PhD dissertation, Depart-ment of Civil Engineering, University of California, Berkeley, Berkeley, CA, 195 pp.
NSR-10, 2010, “Reglamento Colombiano de Construcción Sismo Resis-tente (NSR-10),” Asociación Colombiana de Ingeniería Sísmica (AIS). Bogotá D.C., Colombia, 406 pp.
Panagiotou, M., and Restrepo, J. I., 2011, “Displacement-Based Method of Analysis for Regular Reinforced-Concrete Wall Buildings: Application to a Full-Scale 7-Story Building Slice Tested at UC–San Diego,” Journal of Structural Engineering, ASCE, V. 137, No. 6, pp. 677-690. doi: 10.1061/(ASCE)ST.1943-541X.0000333
PEER NGA-West2 Database, 2013, “A Database of Ground Motions Recorded in Shallow Crustal Earthquakes in Active Tectonic Regions,” Pacific Earthquake Engineering Research Center, University of California, Berkeley, Berkeley, CA, https://ngawest2.berkeley.edu. (last accessed Feb. 6, 2018)
Rejec, K.; Isaković, T.; and Fischinger, M., 2012, “Seismic Shear Force Magnification in RC Cantilever Structural Walls Designed According to Eurocode 8,” Bulletin of Earthquake Engineering, V. 10, No. 2, pp. 567-586. doi: 10.1007/s10518-011-9294-y
Scott, B. D.; Park, R.; and Priestley, M. J., 1982, “Stress-Strain Behavior of Concrete Confined by Overlapping Hoops at Low and High Strain Rates,” ACI Journal Proceedings, V. 79, No. 1, Jan.-Feb., pp. 13-27.
SEAOC Seismology Committee, 2009, “Reinforced Concrete Struc-tures,” 2009 SEAOC Blue Book: Seismic Design Recommendations, Struc-tural Engineers Association of California, Sacramento, CA, pp 9.7-9.9.
Spacone, E.; Filippou, F. C.; and Taucer, F. F., 1996, “Fibre Beam-Column Model for Non-Linear Analysis of R/C Frame: Part I. Formu-lation,” Earthquake Engineering and Structural Dynamics,,” V. 25, pp. 711-725.
TBI, 2010, “Guidelines for Performance-Based Seismic Design of Tall Buildings,” PEER Report No. 2010/05, Pacific Earthquake Engineering Research Center, University of California, Berkeley, Berkeley, CA, 84 pp.
Wallace, J. W.; Massone, L. M.; Bonelli, P.; Dragovich, J.; Lagos, R.; Lüders, C.; and Moehle, J. P., 2012, “Damage and Implications for Seismic Design of RC Structural Wall Buildings,” Earthquake Spectra, V. 28, pp. S281-S299. doi: 10.1193/1.4000047
Watson-Lamprey, J., and Abrahamson, N., 2006, “Selection of Ground Motion Time Series and Limits on Scaling,” Soil Dynamics and Earthquake Engineering, No. 26, pp. 477-482.

JOIN ANACIChapter!
www.concrete.org/chapters
Student ChaptersJoin or form an ACI Student Chapter to maximize your influence, knowledge sharing, and camaraderie! ACI has over 109 student chapters located throughout the world, each providing opportunities for students to:• Connect with their peers and participate in concrete-related activities such as: student
competitions, ACI Conventions, ACI Certification Programs, ACI Educational Seminars, local chapter meetings, social events, and community service projects;
• Network with members of local chapters, many of whom have been in the industry for decades and can help to develop professional relationships and offer career advice;
• Win recognition for their universities through the University Award; and
• Learn about the many scholarships and fellowships offered by the ACI Foundation and by ACI’s local chapters.
Check out the Chapters Special Section from the October 2015 Concrete International:www.concrete.org/publications/concreteinternational/cibackissues.aspx?m=456
The American Concrete Institute has Chapters and Student Chapters located throughout the world. Participation in a local chapter can be extremely rewarding in terms of gaining greater technical knowledge and networking with leaders in the concrete community.Because chapters are distinct and independent legal entities, membership includes both ACI members and non-ACI members and is made up of a diverse blend of architects, engineers, consultants, contractors, educators, material suppliers, equipment suppliers, owners, and students—basically anyone interested in concrete. Many active ACI members initially became involved in ACI through their local chapter. In addition to technical programs and publications, many chapters sponsor ACI Certification programs, ACI educational seminars, project award recognition programs, and social events with the goal of advancing concrete knowledge.
ACI Student Chapters worldwide