seismic microzonation · sni 03‐1726‐2002. some improvements in seismic hazard analysis were...
TRANSCRIPT

Seismic Microzonation | 1
SEISMIC MICROZONATION
CASE STUDY at WEST SUMATERA, INDONESIA
1. General
1.1 Background
The purpose of this study is to propose a revision of the seismic hazard map in Indonesian Seismic Code
SNI 03‐1726‐2002. Some improvements in seismic hazard analysis were implemented in the analysis by
considering the recent seismic activities around Java and Sumatra. Microzonation study is performed in
order to obtain ground motion parameters such as acceleration, amplification factor and response
spectra at the surface of Padang, West Sumatera.
Microzonation has generally been recognized as the most accepted tool in seismic hazard assessment
and risk evaluation and it is defined as the zonation with respect to ground motion characteristics taking
into account source and site conditions. Microzonation does not replace the existing National building
and construction codes.
Figure 1. Process of seismic hazard assessment
Seismic Microzonation | 2
It is used for more detailed zoning, outlining the parameters with a finer spatial resulotion (grain of
information) and providing a description of the hazard parameter with higher accuracy and precision.
Much more detailed basic data on the local geological conditions are necessary to carry out such
studies.
Goals of microzonation are the identification and assessment of specific hazards (ground motion,
ground failure, permanent displacement) with respect to agglomerations, large groups of house,
industrial plants and hospital blocks.
Microzonation requires analysis of a large amount of geological, seismological and geotechnical data.
History of earthquakes, faults regime in the region, attenuation relationships, site characteristics and
ground amplification, liquefaction susceptibility are additional important inputs required.
1.2 Objectives
This project is prepared to do some aims, which are:
1. Provide a comprehensive summary of the main methods and techniques used in seismic
microzoning.
2. Develop recommendations for microzonation procedures in Indonesia.
3. Identify recommended areas for sismic microzoning.
4. Provide a detail map for evacuation zone due to earthquake and tsunami.
5. Identify critical area of landslide due to liquefaction effect or flood.
6. Vulnerability classes and damage grades could be improved by implementing this seismic
microzonation.
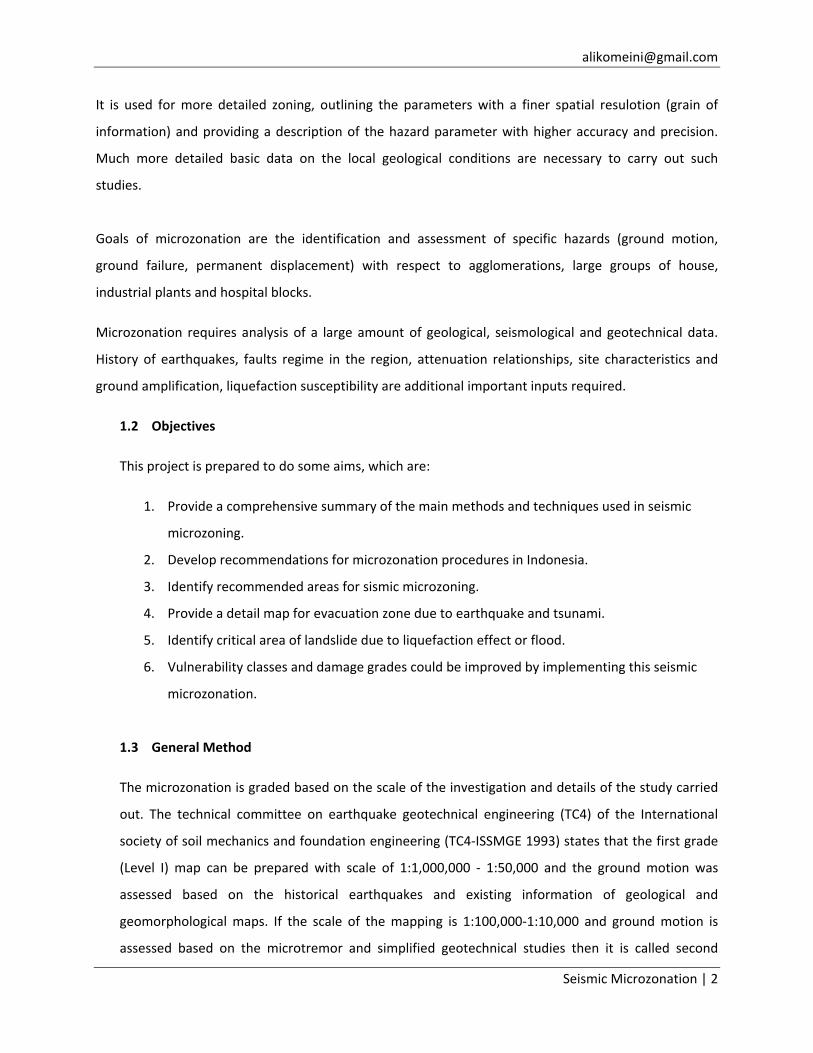
1.3 General Method
The microzonation is graded based on the scale of the investigation and details of the study carried
out. The technical committee on earthquake geotechnical engineering (TC4) of the International
society of soil mechanics and foundation engineering (TC4‐ISSMGE 1993) states that the first grade
(Level I) map can be prepared with scale of 1:1,000,000 ‐ 1:50,000 and the ground motion was
assessed based on the historical earthquakes and existing information of geological and
geomorphological maps. If the scale of the mapping is 1:100,000‐1:10,000 and ground motion is
assessed based on the microtremor and simplified geotechnical studies then it is called second
Seismic Microzonation | 3
grade (Level II) map. In the third grade (Level III) map ground motion has been assessed based on
the complete geotechnical investigations and ground response analysis with a scale of 1:25,000‐
1:5,000. The following phases should be followed when performing a microzonation study:
Figure 2. Microzonation Management Process

Seismic Microzonation | 4
2. Comparison Between Turkey and Switzerland Guideline
Seismic microzonation map requires some important data which are able to be taken from some
online databases. Every country has own specific macro and microzonation since it depends on the
geology map, geotechnical map, topography map and seismotectonic map. Turkey was recognized
as a country which has a lot of earthquake occurrence in Europe. Switzerland also has many seismic
activity due to the location is close to the Alpine’s mountain.
Both countries have several parameters to determine microzonation at each country. These
parameters are:
a. Population density
b. Scale of mapping
c. Grid size
d. Topography and Geology
e. Basic Geotechnical Assessment
f. Dynamic Measurement for shear wave velocity
g. Building stocks
h. Ground shaking intensity
i. Ground Motion Prediction
j. Surface faulting
k. Landslides
l. Liquefactions
m. Tectonic deformation
n. Emergency Management
o. Direct methods
Table 1. Comparison Turkey and Switzerland Guideline
Hazard
Parameters Turkey Switzerland
1 Population’s Number
Min. requirement : Population > 30.000 inhabitants Adapazari City : 391,102 inhabitant Depends on the damage cases and density of people
Basel city : 166,173 inhabitants Depends on the damage cases and density of people
2 Scale of Typical scales is 1:5,000, Local (Communal) is 1:5000
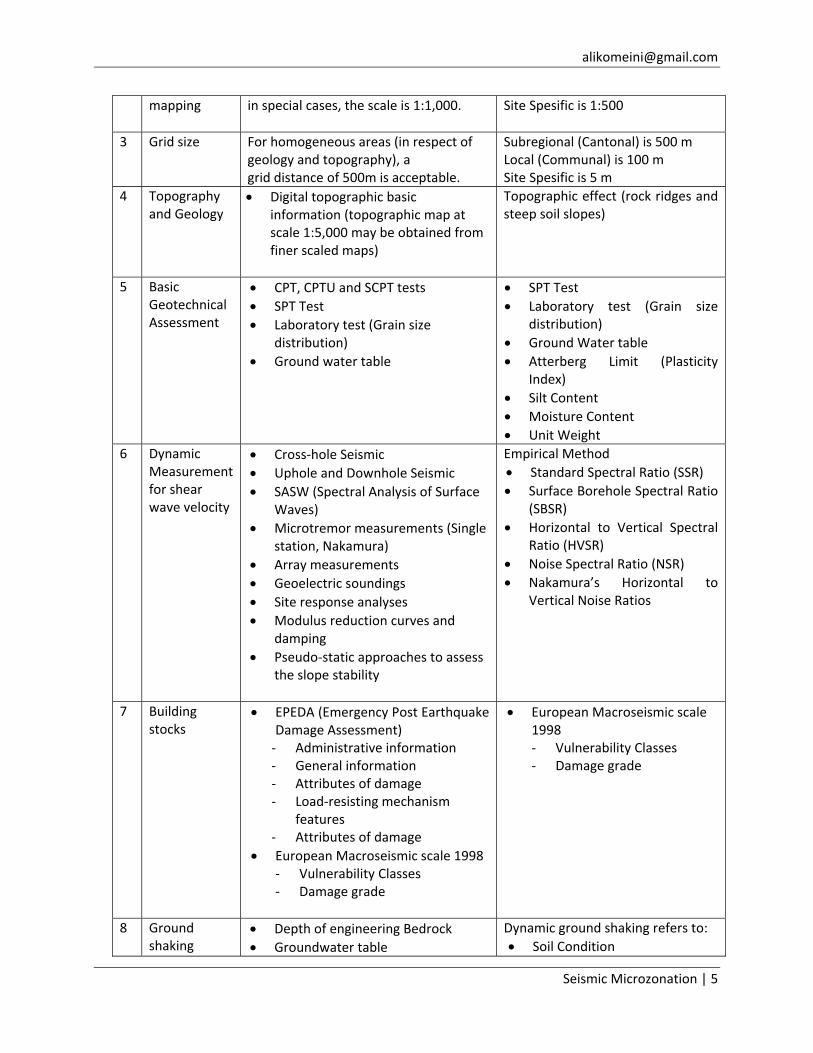
Seismic Microzonation | 5
mapping in special cases, the scale is 1:1,000.
Site Spesific is 1:500
3 Grid size For homogeneous areas (in respect of geology and topography), a grid distance of 500m is acceptable.
Subregional (Cantonal) is 500 m Local (Communal) is 100 m Site Spesific is 5 m
4 Topography and Geology
• Digital topographic basic information (topographic map at scale 1:5,000 may be obtained from finer scaled maps)
Topographic effect (rock ridges and steep soil slopes)
5 Basic Geotechnical Assessment
• CPT, CPTU and SCPT tests • SPT Test • Laboratory test (Grain size
distribution) • Ground water table
• SPT Test • Laboratory test (Grain size
distribution) • Ground Water table • Atterberg Limit (Plasticity
Index) • Silt Content • Moisture Content • Unit Weight
6 Dynamic Measurement for shear wave velocity
• Cross‐hole Seismic • Uphole and Downhole Seismic • SASW (Spectral Analysis of Surface
Waves) • Microtremor measurements (Single
station, Nakamura) • Array measurements • Geoelectric soundings • Site response analyses • Modulus reduction curves and
damping • Pseudo‐static approaches to assess
the slope stability
Empirical Method • Standard Spectral Ratio (SSR) • Surface Borehole Spectral Ratio
(SBSR) • Horizontal to Vertical Spectral
Ratio (HVSR) • Noise Spectral Ratio (NSR) • Nakamura’s Horizontal to
Vertical Noise Ratios
7 Building stocks
• EPEDA (Emergency Post Earthquake Damage Assessment) ‐ Administrative information ‐ General information ‐ Attributes of damage ‐ Load‐resisting mechanism
features ‐ Attributes of damage
• European Macroseismic scale 1998 ‐ Vulnerability Classes ‐ Damage grade
• European Macroseismic scale 1998 ‐ Vulnerability Classes ‐ Damage grade
8 Ground shaking
• Depth of engineering Bedrock • Groundwater table
Dynamic ground shaking refers to: • Soil Condition
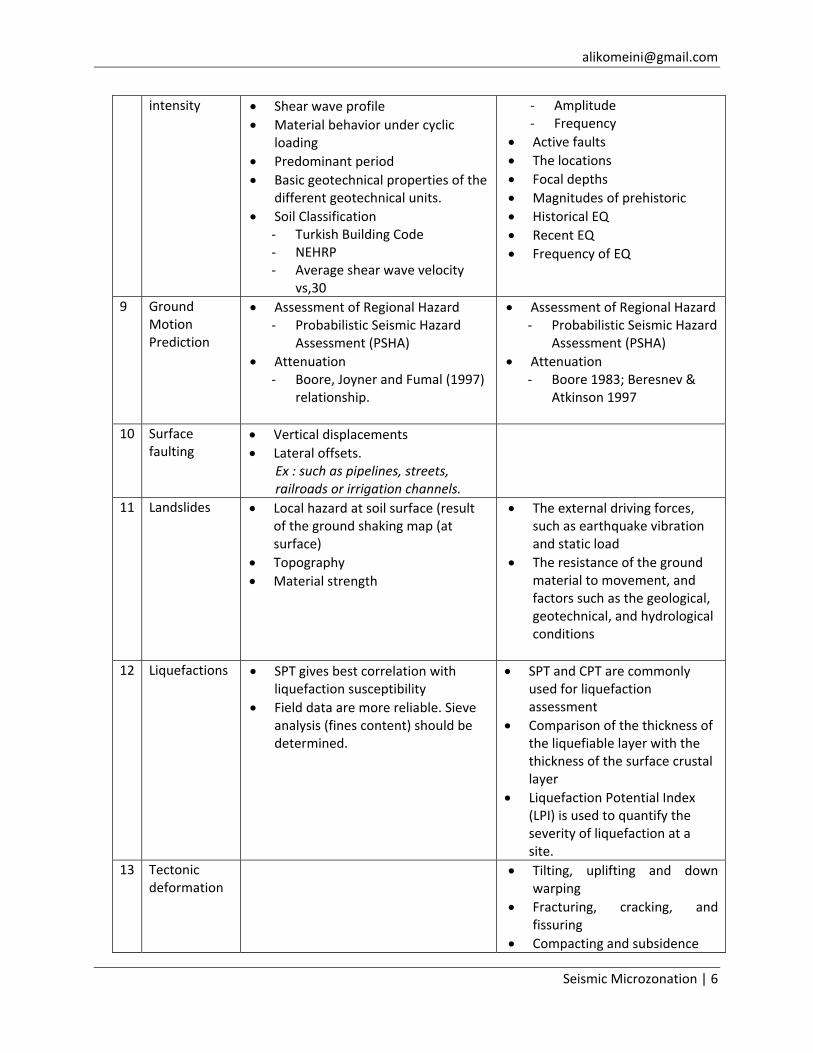
Seismic Microzonation | 6
intensity • Shear wave profile • Material behavior under cyclic
loading • Predominant period • Basic geotechnical properties of the
different geotechnical units. • Soil Classification
‐ Turkish Building Code ‐ NEHRP ‐ Average shear wave velocity
vs,30
‐ Amplitude ‐ Frequency
• Active faults • The locations • Focal depths • Magnitudes of prehistoric • Historical EQ • Recent EQ • Frequency of EQ
9 Ground Motion Prediction
• Assessment of Regional Hazard ‐ Probabilistic Seismic Hazard
Assessment (PSHA) • Attenuation
‐ Boore, Joyner and Fumal (1997) relationship.
• Assessment of Regional Hazard ‐ Probabilistic Seismic Hazard
Assessment (PSHA) • Attenuation
‐ Boore 1983; Beresnev & Atkinson 1997
10 Surface faulting
• Vertical displacements • Lateral offsets.
Ex : such as pipelines, streets, railroads or irrigation channels.
11 Landslides • Local hazard at soil surface (result of the ground shaking map (at surface)
• Topography • Material strength
• The external driving forces, such as earthquake vibration and static load
• The resistance of the ground material to movement, and factors such as the geological, geotechnical, and hydrological conditions
12 Liquefactions • SPT gives best correlation with liquefaction susceptibility
• Field data are more reliable. Sieve analysis (fines content) should be determined.
• SPT and CPT are commonly used for liquefaction assessment
• Comparison of the thickness of the liquefiable layer with the thickness of the surface crustal layer
• Liquefaction Potential Index (LPI) is used to quantify the severity of liquefaction at a site.
13 Tectonic deformation
• Tilting, uplifting and down warping
• Fracturing, cracking, and fissuring
• Compacting and subsidence
Seismic Microzonation | 7
• Creeping in fault zones 14 Emergency
Management This information can be used to
prepare materials and equipment for
emergency response and to develop training
scenarios for emergency personnel
• Assessment of center of damage for specific scenarios.
• In which scenarios own intervention forces are sufficient, where outside help is needed.
• Preparation of conditional decision schemes/checklists.
• Training of the whole system divided in decision‐taking training of the involved staff in case of an event, and training of search and rescue teams in simulated damage places.
• Indentify data and information on local hazards and risks
• Select all options for planning • Assess the feasibility of
implementation • Assess the community context • Assess the costs involved • Assss the overall effectiveness
15 Direct methods
Direct methods rely on
observations collected during or after earthquake within the area
under investigation
• EPEDA (Emergency Post Earthquake Damage Assessment)
• questionnaires of field reports are evaluated according to EMS 1998
• questionnaires of field reports are evaluated according to EMS 1998
3. Seismic Microzonation Map
The final products of the seismic microzonation investigation and mapping process are a set of five
maps for the territory of the municipality:
1. Surface faulting map
2. Ground shaking map
3. Liquefaction potential map
4. Landslide and rock fall (slope instability) map
5. Earthquake‐related flooding susceptibility map
3.1 Microzonation Map for Turkey
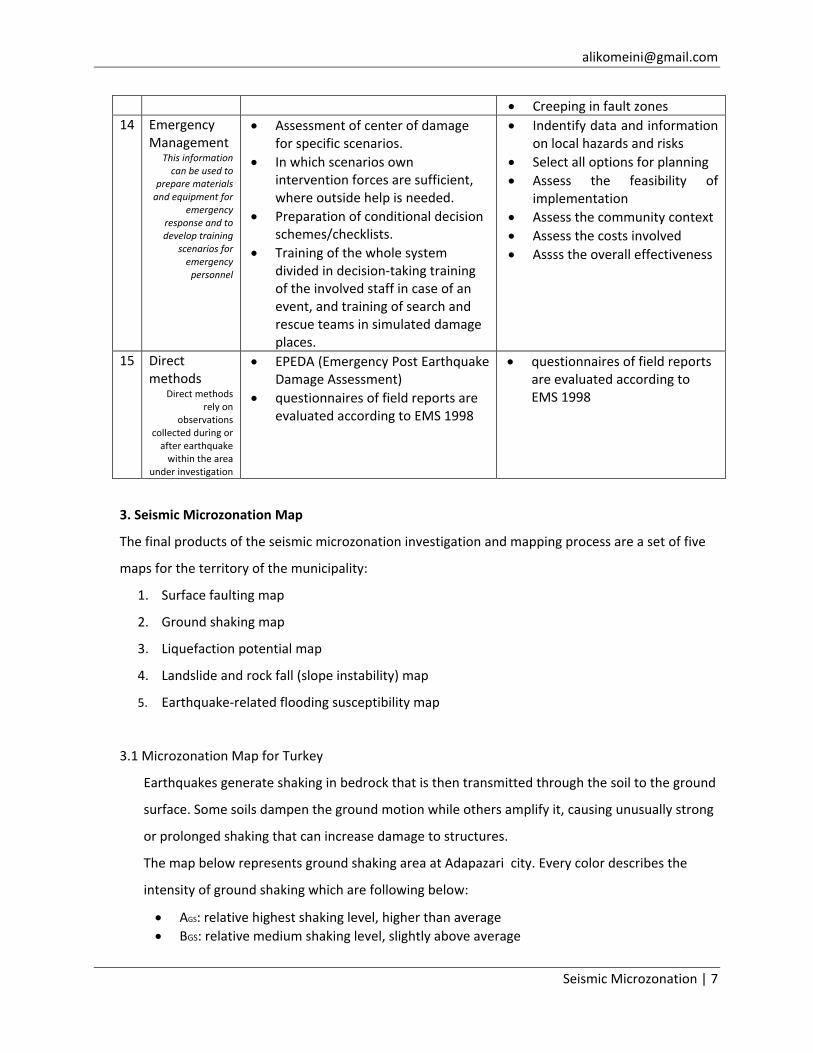
Earthquakes generate shaking in bedrock that is then transmitted through the soil to the ground
surface. Some soils dampen the ground motion while others amplify it, causing unusually strong
or prolonged shaking that can increase damage to structures.
The map below represents ground shaking area at Adapazari city. Every color describes the
intensity of ground shaking which are following below:
• AGS: relative highest shaking level, higher than average • BGS: relative medium shaking level, slightly above average
Seismic Microzonation | 8
• CGS: relative low shaking level, slightly below average
Figure 3. Ground Shaking Map for Adapazari
The liquefaction map should be applied to the urban master plan to avoid construction of
structures or infrastructure over areas of high liquefaction potential. Where such construction
cannot be avoided, appropriate structural provision for anticipated liquefaction must be
required.
The map of three different zones defined according to the criteria given below.
AL: High susceptibility ( PL > 15) BL: Medium susceptibility (5 ≤ PL ≤ 15) CL: Low susceptibility (PL < 5)
Landslides are very damaging to structures built on or below slopes that fail. It is preferable to
avoid construction on or below unstable slopes. If construction is necessary in such areas it
requires special geotechnical site investigation and specifically qualified design and construction.
The map of three different zones defined according to the criteria given below.
ASL: High hazard Fs ≤ 1.0 BSL: Medium hazard Fs between 1.0 and 2.0 CSL: Low hazard Fs > 2.0

Seismic Microzonation | 9
Figure 4. Liquefaction Map for Adapazari Figure 5. Landslide Map for Adapazari
3.2 Switzerland Map
The microzonation study included the mapping of the geological and geotechnical soil conditions
which are known from over 2700 shallow wells. This comprises also detailed lithological
descriptions of the cores, thickness of the strata, groundwater data, and SPT measurements. The
microzonation was performed by means of a qualitative rating scheme that takes into account the
influence of seven characteristic parameters of the local soils which can be the cause of
amplification of ground motion during earthquakes.
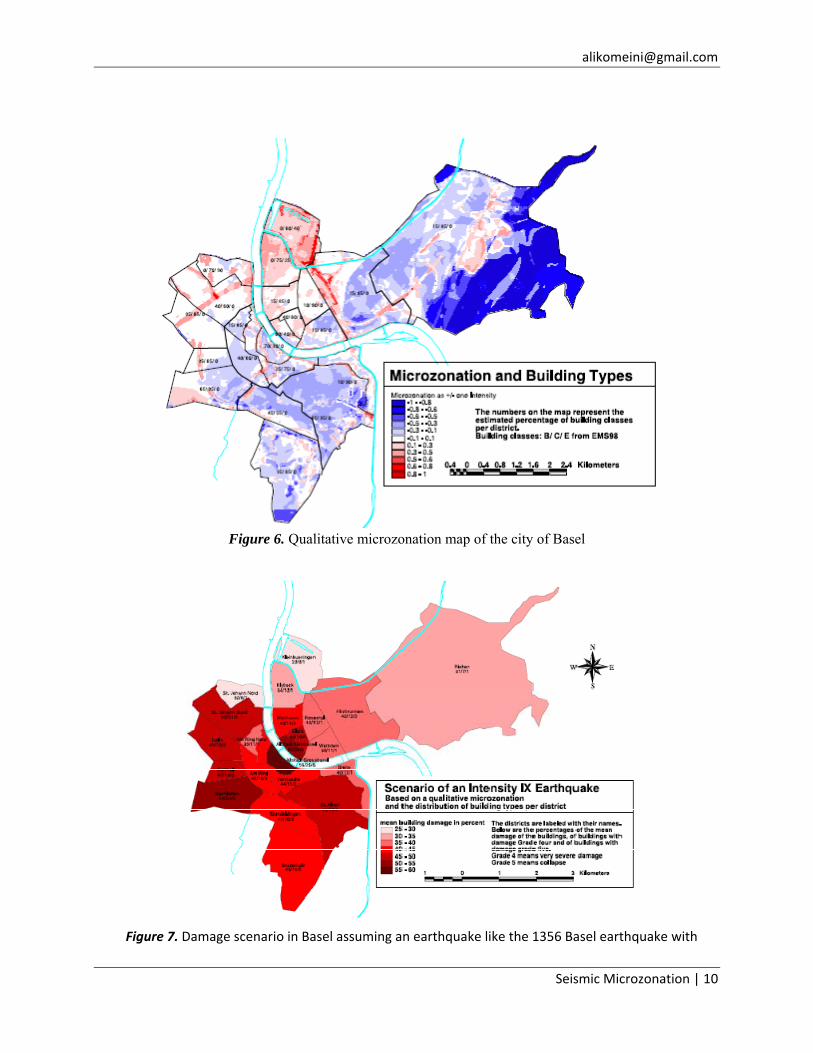
Figure below is Qualitative microzonation map of the city of Basel (from Noack, Fäh and
Kruspan, 1999). The expected amplification corresponds to plus and minus one intensity degree
(EMS-scale) from an average regional intensity. The distribution of the vulnerability classes in
the districts are given in percent.
Red colors indicate an increased susceptibility and blue colors show a reduced susceptibility with
respect to a regional value. From observed intensity variations in the area, the rating can be
transformed into plus and minus one intensity degree from the average regional intensity value.
Seismic Microzonation | 10
Figure 6. Qualitative microzonation map of the city of Basel
Figure 7. Damage scenario in Basel assuming an earthquake like the 1356 Basel earthquake with
Seismic Microzonation | 11
an Intensity of IX in the city
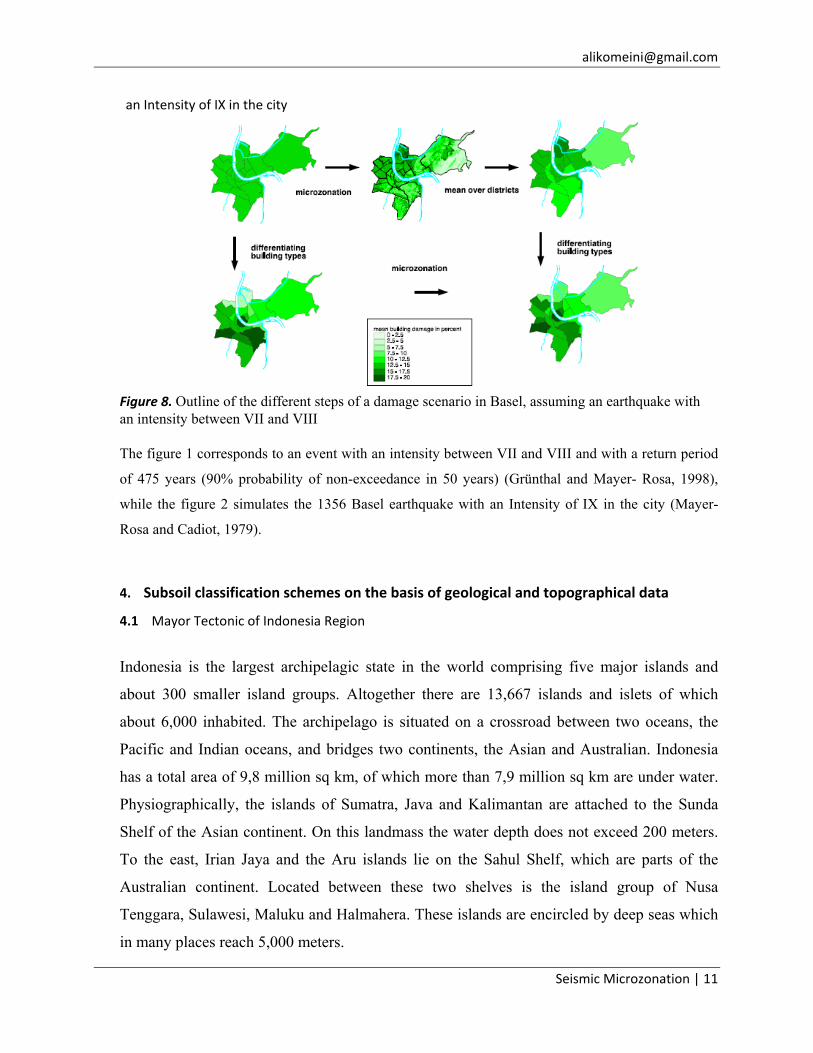
Figure 8. Outline of the different steps of a damage scenario in Basel, assuming an earthquake with an intensity between VII and VIII
The figure 1 corresponds to an event with an intensity between VII and VIII and with a return period
of 475 years (90% probability of non-exceedance in 50 years) (Grünthal and Mayer- Rosa, 1998),
while the figure 2 simulates the 1356 Basel earthquake with an Intensity of IX in the city (Mayer-
Rosa and Cadiot, 1979).
4. Subsoil classification schemes on the basis of geological and topographical data
4.1 Mayor Tectonic of Indonesia Region
Indonesia is the largest archipelagic state in the world comprising five major islands and
about 300 smaller island groups. Altogether there are 13,667 islands and islets of which
about 6,000 inhabited. The archipelago is situated on a crossroad between two oceans, the
Pacific and Indian oceans, and bridges two continents, the Asian and Australian. Indonesia
has a total area of 9,8 million sq km, of which more than 7,9 million sq km are under water.
Physiographically, the islands of Sumatra, Java and Kalimantan are attached to the Sunda
Shelf of the Asian continent. On this landmass the water depth does not exceed 200 meters.
To the east, Irian Jaya and the Aru islands lie on the Sahul Shelf, which are parts of the
Australian continent. Located between these two shelves is the island group of Nusa
Tenggara, Sulawesi, Maluku and Halmahera. These islands are encircled by deep seas which
in many places reach 5,000 meters.

Seismic Microzonation | 12
About 60 Tertiary sedimentary basins, spread out from Sumatra in the west to Irian Jaya in
the east, are identified in Indonesia. So far only 38 basins have been explored and drilled for
petroleum and 14 of them are now producing oil and gas. Seventy three percent of these
basins are located offshore, about one third of them in the deeper sea, with water depth
exceeding 200 m.
Figure 9. Mayor Tectonic map in Indonesia
Figure 10. Minor Tectonic map in Indonesia
Seismic Microzonation | 13
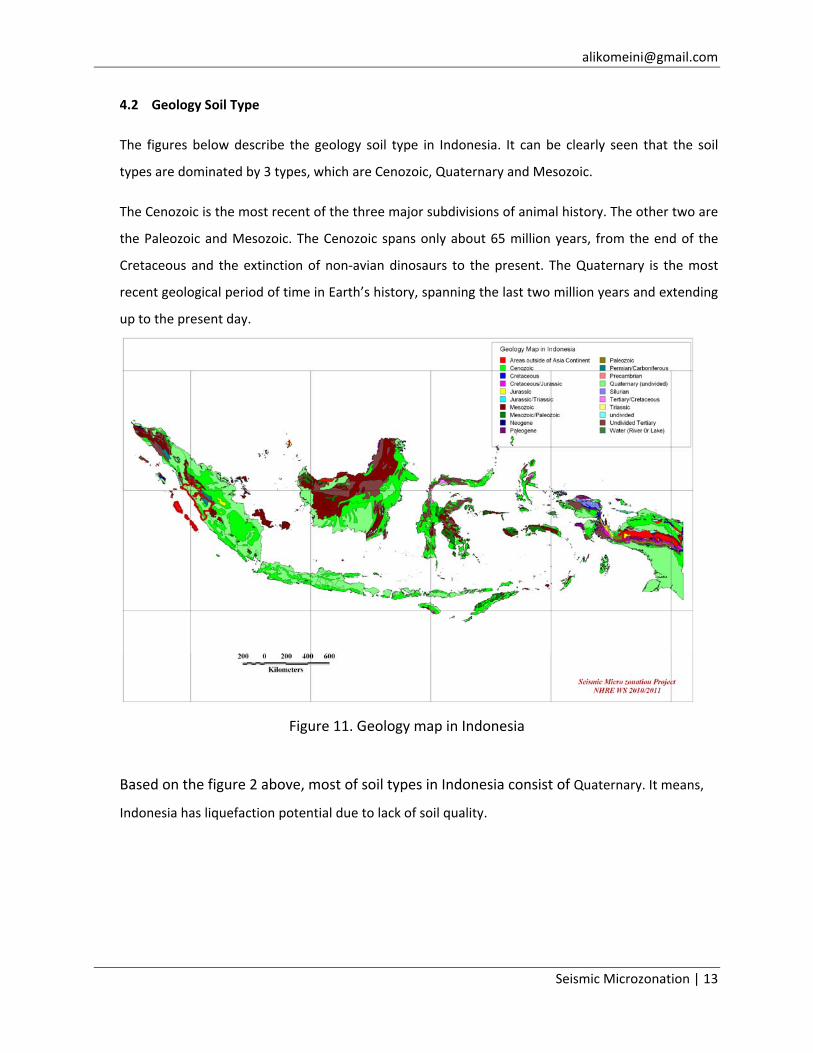
4.2 Geology Soil Type
The figures below describe the geology soil type in Indonesia. It can be clearly seen that the soil
types are dominated by 3 types, which are Cenozoic, Quaternary and Mesozoic.
The Cenozoic is the most recent of the three major subdivisions of animal history. The other two are
the Paleozoic and Mesozoic. The Cenozoic spans only about 65 million years, from the end of the
Cretaceous and the extinction of non‐avian dinosaurs to the present. The Quaternary is the most
recent geological period of time in Earth’s history, spanning the last two million years and extending
up to the present day.
Figure 11. Geology map in Indonesia
Based on the figure 2 above, most of soil types in Indonesia consist of Quaternary. It means,
Indonesia has liquefaction potential due to lack of soil quality.
Seismic Microzonation | 14
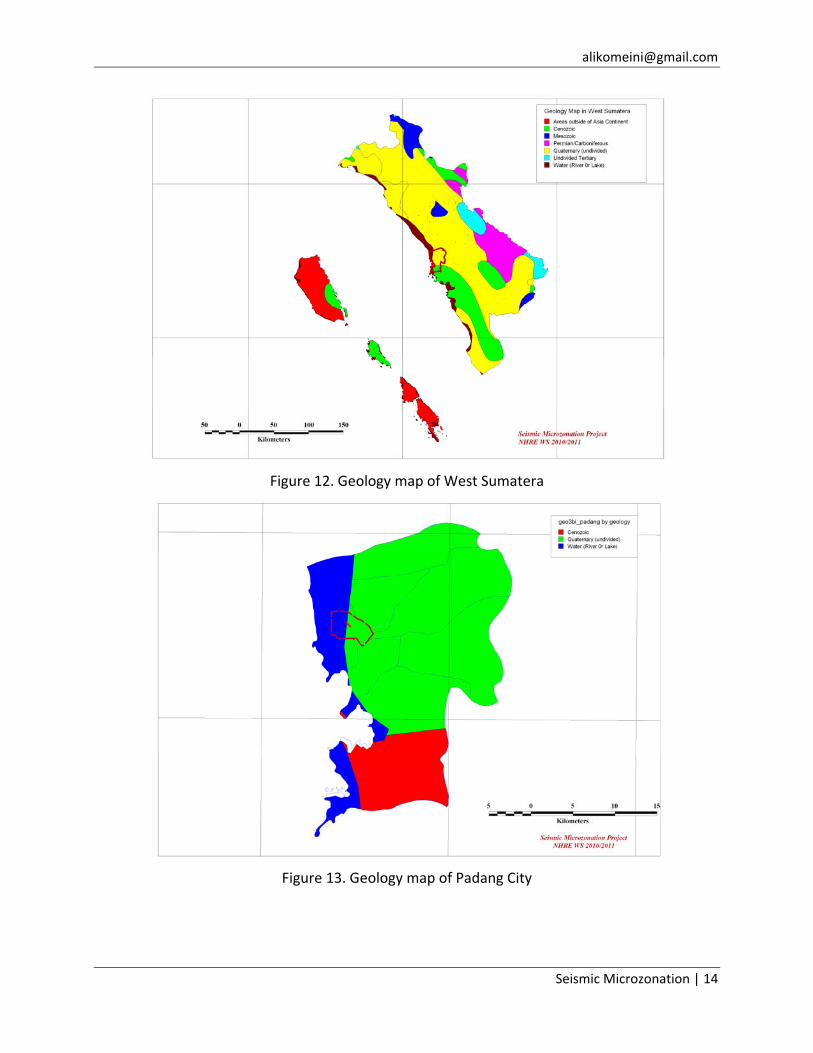
Figure 12. Geology map of West Sumatera
Figure 13. Geology map of Padang City

Seismic Microzonation | 15
Figure 14. Geology map of East Padang
These figures above describe geology soil type in West Sumatera and Padang City. Both pictures give
a information that the main geology soil type is Quaternary
4.3 Topographical Data
Indonesia's location on the edges of the Pacific, Eurasian, and Australian tectonic plates makes it the
site of numerous volcanoes and frequent earthquakes. Indonesia has at least 150 active volcanoes,
including Krakatau and Tambour, both famous for their devastating eruptions in the 19th century.
Recent disasters due to seismic activity include the 2004 tsunami that killed an estimated 167,736 in
northern Sumatra, and the Yogyakarta earthquake in 2006. However, volcanic ash is a major
contributor to the high agricultural fertility that has historically sustained the high population
densities of Java and Bali.
The topography map and seismic zone in Indonesia are really related each other because most of
the earthquake location are nearly to volcano area. It will be a benefit for people if the Tsunami
occurs due to big Earthquake.
Seismic Microzonation | 16
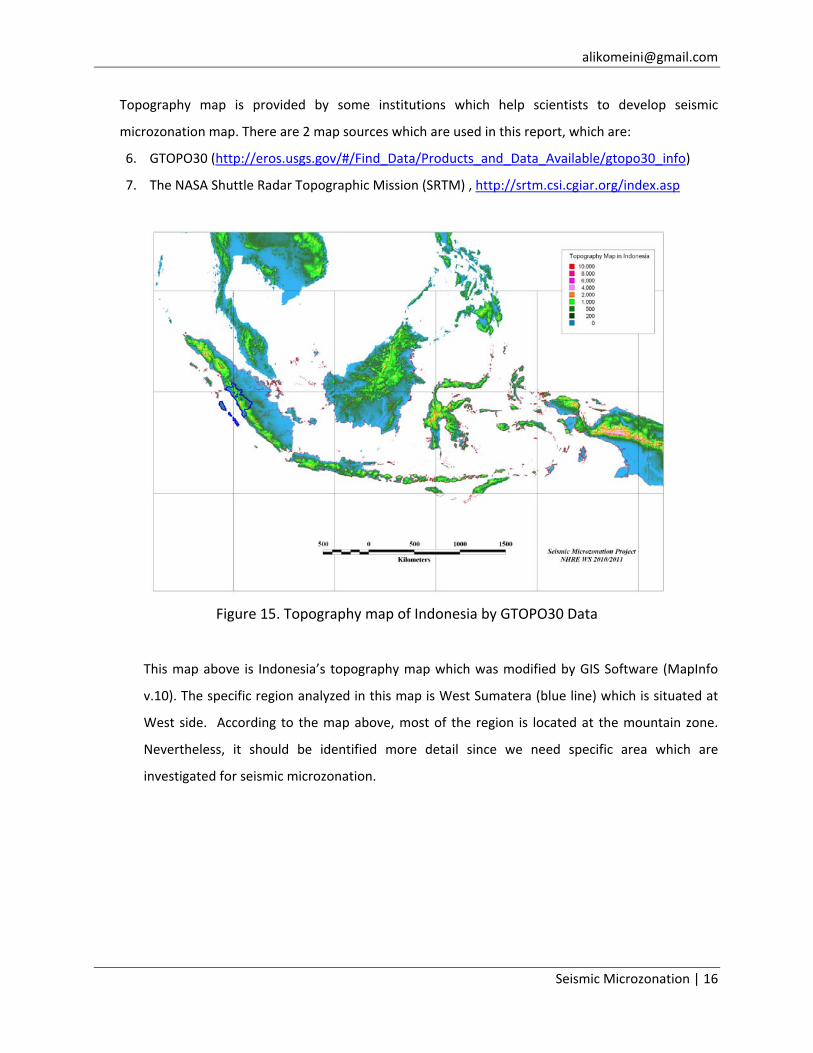
Topography map is provided by some institutions which help scientists to develop seismic
microzonation map. There are 2 map sources which are used in this report, which are:
6. GTOPO30 (http://eros.usgs.gov/#/Find_Data/Products_and_Data_Available/gtopo30_info)
7. The NASA Shuttle Radar Topographic Mission (SRTM) , http://srtm.csi.cgiar.org/index.asp
Figure 15. Topography map of Indonesia by GTOPO30 Data
This map above is Indonesia’s topography map which was modified by GIS Software (MapInfo
v.10). The specific region analyzed in this map is West Sumatera (blue line) which is situated at
West side. According to the map above, most of the region is located at the mountain zone.
Nevertheless, it should be identified more detail since we need specific area which are
investigated for seismic microzonation.

Seismic Microzonation | 17
4.4 Application to test sites in Indonesia (affected areas)
Seismic Microzonation needs a specific area which was affected by big earthquake events. In this
case, West Sumatera is appropriate target which are situated at West site of Indonesia and
surrounded by mountains and faults. On 30 September 2009, there was big earthquake at West
Sumatera where the source depth was 87 km and the epicenter from Padang city was 45 km. The
seismic effect will be explained in the next chapter.
The figure below describes the topography map of West Sumatera which is located at mountain
zone (Barisan mountain) and also it is near to the South Sumatera Subduction and Sumpur, Sianok,
Sumani, Sulitik fault.
This maps is generated by using MAPINFO V.10 and the topography data is taken from SRTM. The
target area is shown the green line.
Figure 16. Topography map of West Sumatera by SRTM data
Seismic Microzonation | 18
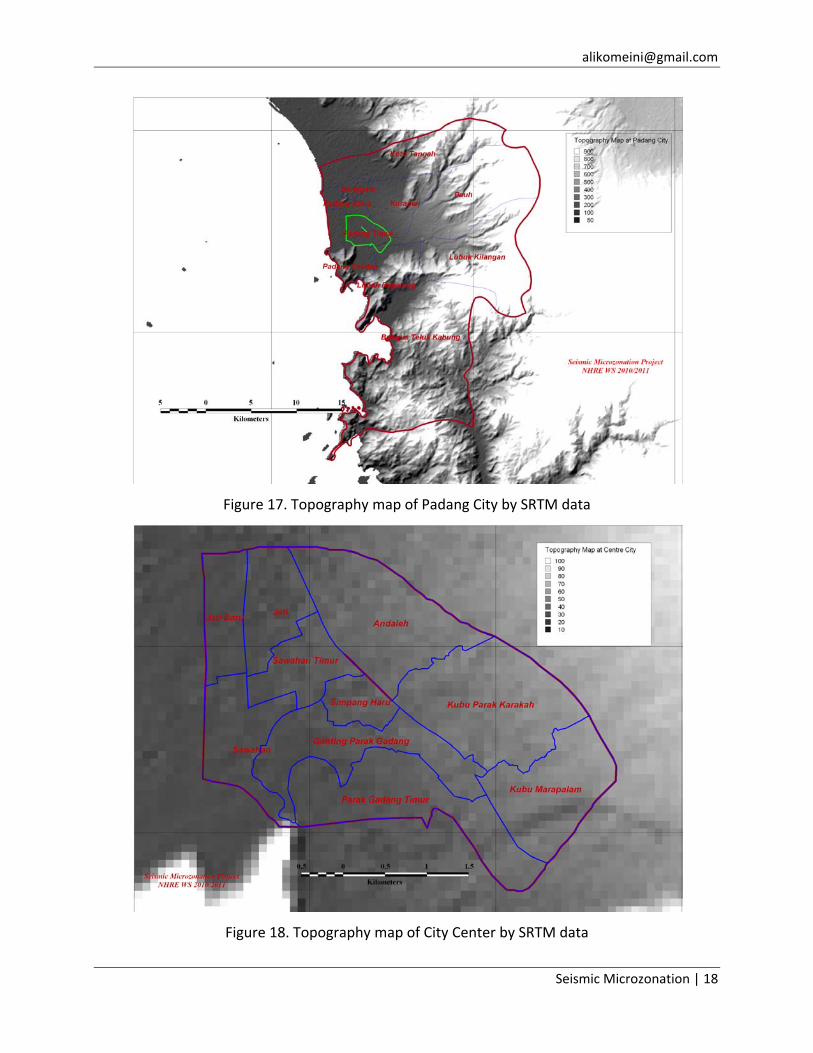
Figure 17. Topography map of Padang City by SRTM data
Figure 18. Topography map of City Center by SRTM data

Seismic Microzonation | 19
The maps above are detail of topography map which were generated by SRTM data. It can be clearly
seen that the main city is situated at the 50 m from sea level. This elevation is relatively dangerous if
Tsunami occurs due to big earthquake event. Therefore, the accessibility for evacuation is really
necessary to be provided in this city in order to help inhabitants in the future.
5. Correlation between microzoning and ground motion
5.1 Available ground motion data
Indonesia is located in a tectonically very active area at the point of convergence of three major
plates and nine smaller plates to create a complex network of plate boundaries. High seismic
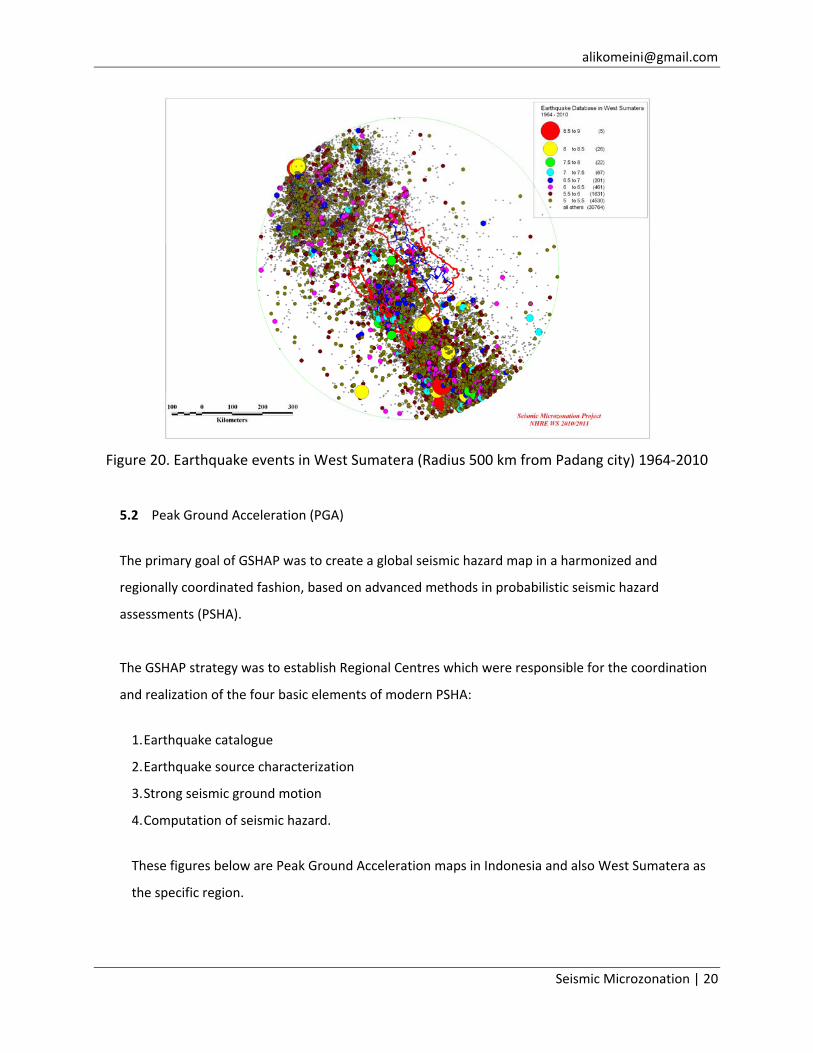
According to earthquake database in IRIS.edu, there were more than 300.000 earthquake events
with magnitude (M) larger than 3 and more than 4000 earthquake events with significant magnitude
(M) larger than 6. Several great earthquake occurrences in Indonesia since six years ago inquire
revision of seismic hazard parameters. Some of them are 26 December 2004 earthquake (Mw = 9.3),
28 March 2005 earthquake (Mw = 8.7), and the latest is 30 September 2009 earthquake (Mw = 7.6).
These earthquakes have caused thousands of casualties, destruction and damage to thousands of
infrastructures and buildings, as well as billions of US dollars required for reconstruction and
rehabilitation.
Figure 19. Earthquake catalogue in Indonesia 1964‐2010
Seismic Microzonation | 20
Figure 20. Earthquake events in West Sumatera (Radius 500 km from Padang city) 1964‐2010
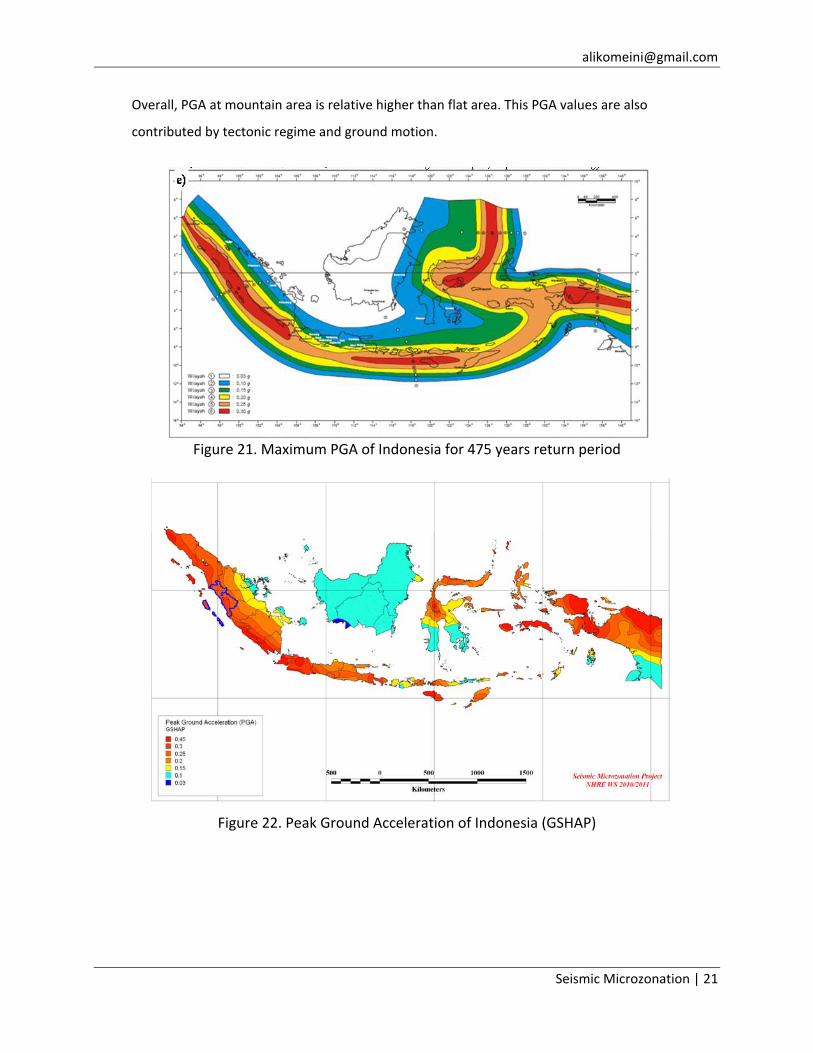
5.2 Peak Ground Acceleration (PGA)
The primary goal of GSHAP was to create a global seismic hazard map in a harmonized and
regionally coordinated fashion, based on advanced methods in probabilistic seismic hazard
assessments (PSHA).
The GSHAP strategy was to establish Regional Centres which were responsible for the coordination
and realization of the four basic elements of modern PSHA:
1. Earthquake catalogue
2. Earthquake source characterization
3. Strong seismic ground motion
4. Computation of seismic hazard.
These figures below are Peak Ground Acceleration maps in Indonesia and also West Sumatera as
the specific region.
Seismic Microzonation | 21
Overall, PGA at mountain area is relative higher than flat area. This PGA values are also
contributed by tectonic regime and ground motion.
Figure 21. Maximum PGA of Indonesia for 475 years return period
Figure 22. Peak Ground Acceleration of Indonesia (GSHAP)

Seismic Microzonation | 22
Figure 23. Peak Ground Acceleration of West Sumatera (GSHAP)
Figure 24. Peak Ground Acceleration of Padang City (GSHAP)
Figure 2 and 3 describe Peak Ground Acceleration (PGA) at West Sumatera and Padang City
which were generated to create seismic microzonation. It can be clearly seen that this city
contains high PGA value which is distributed from 0.258g – 0.264g.
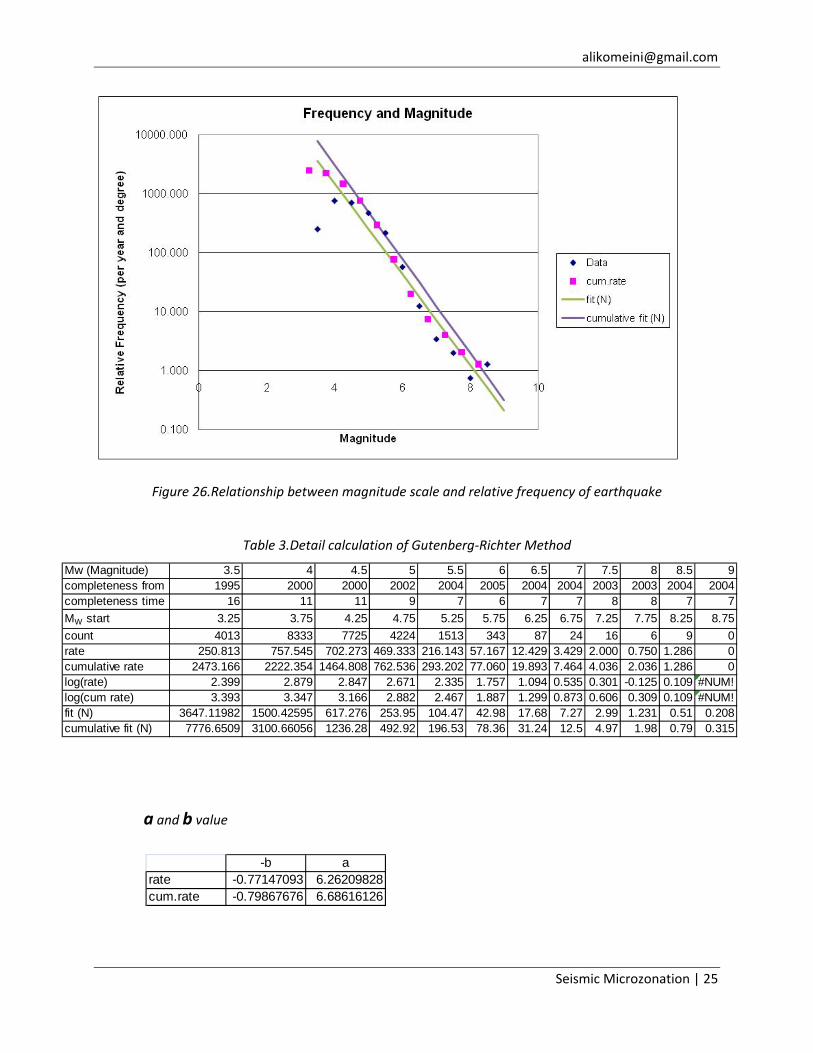
5.3
G
Th
sh
in
Th
lo
Th
th
Pa
Ground Shak
round shakin
his is caused
haking increa
ncreases.
he map of g
ogνn(I0) = a ‐ b
he Paramete
hese paramet
Where:
• N is th
• M is th
• and
arameters ‘a’
ing Intensity
ng is a term
by body and
ases as magn
ground shaki
b I0.
rs ‘a’ and ‘b’
ters and mag
e number of
he minimum
are consta
’ and ‘b’ are t
Figur
used to desc
d surface seis
nitude increas
ng intensity
are taken fro
nitudes are:
events in a g
magnitude
ants
taken from th
re 25. The Ca
cribe the vibr
smic waves.
ses and decr
is calculated
om Gutenber
iven magnitu
he Completen
talog Comple
ration of the
As a general
reases as dist
d by annual
rg–Richter law
de range
ness graph as
eteness graph
aliko
Seismic M
ground durin
ization, the s
tance from t
intensity‐fre
w, where the
following bel
h
omeini@gmai
Microzonation
ng an earthq
severity of gr
the causative
equency rela
e relation bet
low:
il.com
n | 23
quake.
round
e fault
tions,
tween
Seismic Microzonation | 24
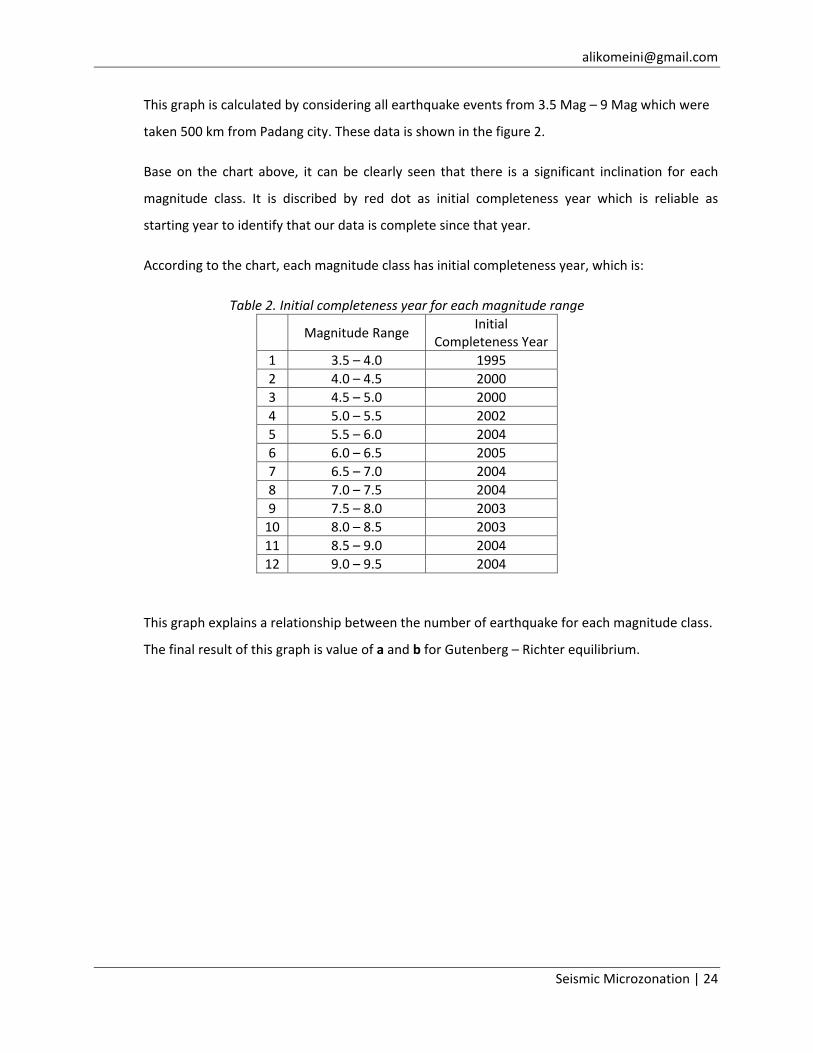
This graph is calculated by considering all earthquake events from 3.5 Mag – 9 Mag which were
taken 500 km from Padang city. These data is shown in the figure 2.
Base on the chart above, it can be clearly seen that there is a significant inclination for each
magnitude class. It is discribed by red dot as initial completeness year which is reliable as
starting year to identify that our data is complete since that year.
According to the chart, each magnitude class has initial completeness year, which is:
Table 2. Initial completeness year for each magnitude range
Magnitude Range Initial
Completeness Year 1 3.5 – 4.0 1995 2 4.0 – 4.5 2000 3 4.5 – 5.0 2000 4 5.0 – 5.5 2002 5 5.5 – 6.0 2004 6 6.0 – 6.5 2005 7 6.5 – 7.0 2004 8 7.0 – 7.5 2004 9 7.5 – 8.0 2003 10 8.0 – 8.5 2003 11 8.5 – 9.0 2004 12 9.0 – 9.5 2004
This graph explains a relationship between the number of earthquake for each magnitude class.
The final result of this graph is value of a and b for Gutenberg – Richter equilibrium.
Seismic Microzonation | 25
Figure 26.Relationship between magnitude scale and relative frequency of earthquake
Table 3.Detail calculation of Gutenberg‐Richter Method
a and b value
Mw (Magnitude) 3.5 4 4.5 5 5.5 6 6.5 7 7.5 8 8.5 9completeness from 1995 2000 2000 2002 2004 2005 2004 2004 2003 2003 2004 2004completeness time 16 11 11 9 7 6 7 7 8 8 7 7MW start 3.25 3.75 4.25 4.75 5.25 5.75 6.25 6.75 7.25 7.75 8.25 8.75count 4013 8333 7725 4224 1513 343 87 24 16 6 9 0rate 250.813 757.545 702.273 469.333 216.143 57.167 12.429 3.429 2.000 0.750 1.286 0cumulative rate 2473.166 2222.354 1464.808 762.536 293.202 77.060 19.893 7.464 4.036 2.036 1.286 0log(rate) 2.399 2.879 2.847 2.671 2.335 1.757 1.094 0.535 0.301 -0.125 0.109 #NUM!log(cum rate) 3.393 3.347 3.166 2.882 2.467 1.887 1.299 0.873 0.606 0.309 0.109 #NUM!fit (N) 3647.11982 1500.42595 617.276 253.95 104.47 42.98 17.68 7.27 2.99 1.231 0.51 0.208cumulative fit (N) 7776.6509 3100.66056 1236.28 492.92 196.53 78.36 31.24 12.5 4.97 1.98 0.79 0.315
-b arate -0.77147093 6.26209828cum.rate -0.79867676 6.68616126
Seismic Microzonation | 26
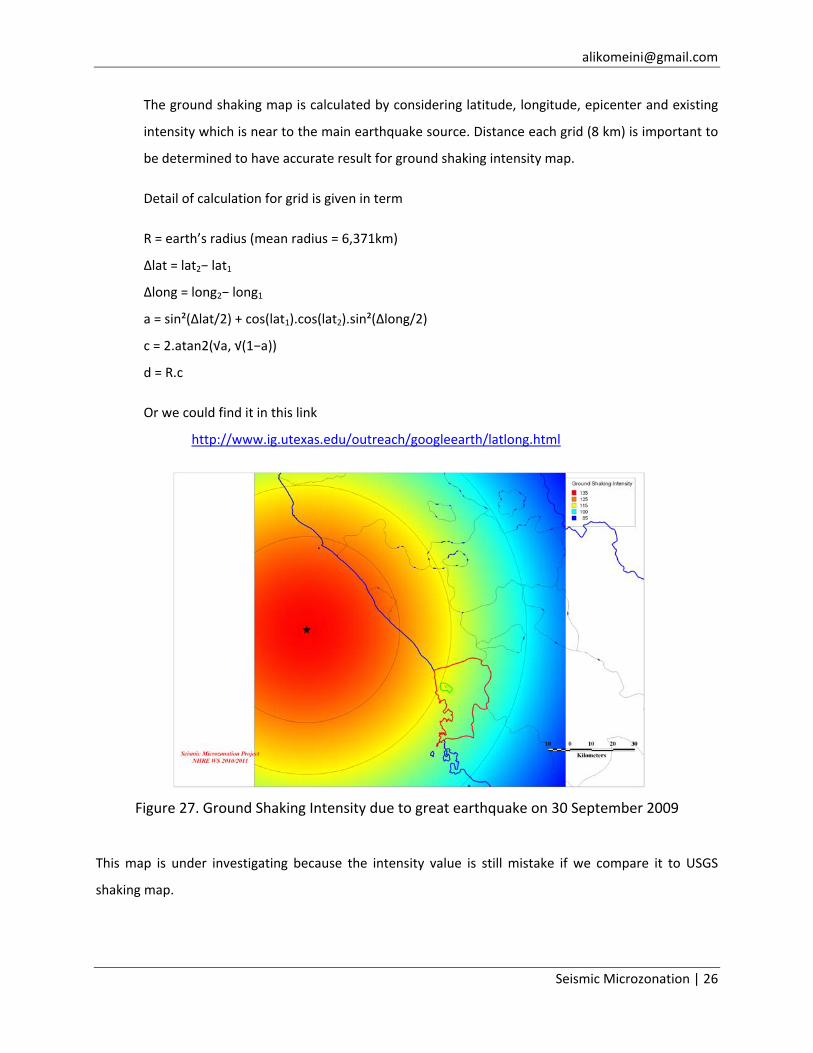
The ground shaking map is calculated by considering latitude, longitude, epicenter and existing
intensity which is near to the main earthquake source. Distance each grid (8 km) is important to
be determined to have accurate result for ground shaking intensity map.
Detail of calculation for grid is given in term
R = earth’s radius (mean radius = 6,371km)
Δlat = lat2− lat1
Δlong = long2− long1
a = sin²(Δlat/2) + cos(lat1).cos(lat2).sin²(Δlong/2)
c = 2.atan2(√a, √(1−a))
d = R.c
Or we could find it in this link
http://www.ig.utexas.edu/outreach/googleearth/latlong.html
Figure 27. Ground Shaking Intensity due to great earthquake on 30 September 2009
This map is under investigating because the intensity value is still mistake if we compare it to USGS
shaking map.
Seismic Microzonation | 27
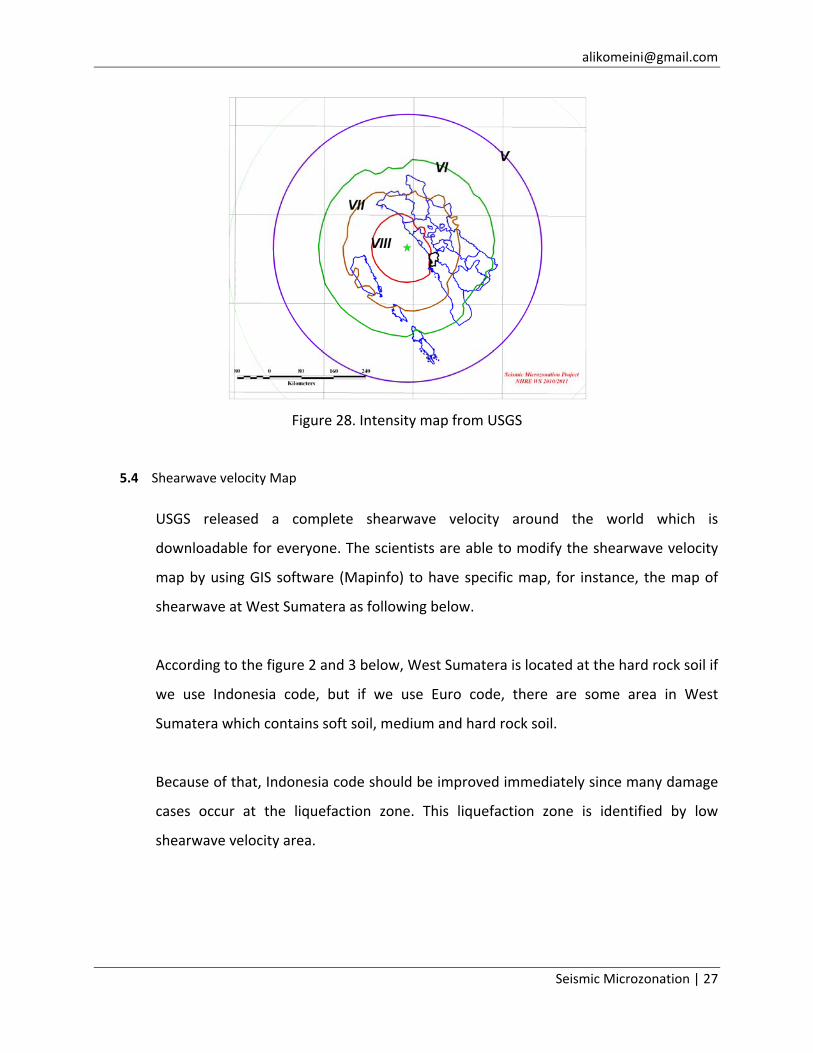
Figure 28. Intensity map from USGS
5.4 Shearwave velocity Map
USGS released a complete shearwave velocity around the world which is
downloadable for everyone. The scientists are able to modify the shearwave velocity
map by using GIS software (Mapinfo) to have specific map, for instance, the map of
shearwave at West Sumatera as following below.
According to the figure 2 and 3 below, West Sumatera is located at the hard rock soil if
we use Indonesia code, but if we use Euro code, there are some area in West
Sumatera which contains soft soil, medium and hard rock soil.
Because of that, Indonesia code should be improved immediately since many damage
cases occur at the liquefaction zone. This liquefaction zone is identified by low
shearwave velocity area.

Seismic Microzonation | 28
Figure 29. Shearwave velocity map in West Sumatera
Figure 30. Shearwave velocity map in Padang City

Seismic Microzonation | 29
Table 4. Shearwave velocity from Indonesia code
Figure 5. Shearwave velocity from Euro Code (EC‐8)

Seismic Microzonation | 30
5.5 Impact on building types
5.5.1 Population in Indonesia
The national population from the 2000 national census is 205 million, and the Indonesian
Central Statistics Bureau and Statistics Indonesia estimate a population of 218 million for 2005.
130 million people live on the island of Java, the world's most populous island.
In this project, the main region taken for the seismic microzonation analysis is number 3
(yellow). This province has many inhabitants and it is located to the main earthquake sources.
Therefore, it will be very interesting to be investigated more detail in Seismic microzonation.
Table 6. Population distribution in Indonesia
ID Province 2000 2005Population
Density at 2005
1 Nanggroe Aceh Darussalam 3,929,234 4,031,589 712 Sumatera Utara 11,642,488 12,450,911 1743 Sumatera Barat 4,248,515 4,566,126 1094 Riau 3,907,763 4,579,219 515 Jambi 2,407,166 2,635,968 536 Sumatera Selatan 6,210,800 6,782,339 797 Bengkulu 1,455,500 1,549,273 738 Lampung 6,730,751 7,116,177 2119 Kep. Bangka Belitung 899,968 1,043,456 6410 Kepulauan Riau 1,040,207 1,274,848 14111 DKI Jakarta 8,361,079 8,860,381 1274312 Jawa Barat 35,724,093 38,965,440 104913 Jawa Tengah 31,223,258 31,977,968 93014 DI Yogyakarta 3,121,045 3,343,651 105815 Jawa Timur 34,765,993 36,294,280 75316 Banten 8,098,277 9,028,816 96417 Bali 3,150,057 3,383,572 59718 Nusa Tenggara Barat 4,008,601 4,184,411 21119 Nusa Tenggara Timur 3,823,154 4,260,294 9020 Kalimantan Barat 4,016,353 4,052,345 2721 Kalimantan Tengah 1,855,473 1,914,900 1222 Kalimantan Selatan 2,984,026 3,281,993 8823 Kalimantan Timur 2,451,895 2,848,798 1424 Sulawesi Utara 2,000,872 2,128,780 14425 Sulawesi Tengah 2,175,993 2,294,841 3826 Sulawesi Selatan 7,159,170 7,509,704 16127 Sulawesi Tenggara 1,820,379 1,963,025 5328 Gorontalo 833,496 922,176 7629 Sulawesi Barat 891,618 969,429 5930 Maluku 1,166,300 1,251,539 2731 Maluku Utara 815,101 884,142 2832 Irian Jaya Barat 529,689 643,012 733 Papua 1,684,144 1,875,388 6
Total 205,132,458 218,868,791 20,161

Seismic Microzonation | 31
The number of population and damage cases is related to each other. It was shown in the
Turkey and Switzerland guideline for seismic microzonation. Damage cases are just given in a
region as long as there are existing buildings or building stocks which are collapse due to
earthquake events.
Figure 31. Population Density map in Indonesia
According to the map above, the blue line is West Sumatera which is taken as a target for
seismic microzonation. Detail of population density in this province is
Table 7. Population distribution in West Sumatera
No District populationPopulation
Density at 2005
1 Mentawai 76,421 132 Pesisir Selatan 406,666 683 Tanah Datar 338,584 2474 Pariaman 390,204 2455 agam 455,495 2016 Liam Puluh Kota 348,249 1217 Kota Padang 819,740 14788 Kota Solok 59,317 4969 Sawahlunto 56,812 15110 Padang Panjang 47,008 98511 Bukit Tinggi 110,954 181412 Payakumbuh 116,910 130313 Kota Pariaman 79,449 97614 Solok Selatan 144,236 4015 Solok 348,991 10716 Dharmasraya 191,277 6417 Sijunjung 201,627 7018 Pasaman Barat 364,587 9319 Pasaman 252,981 65
Total 4,809,508 8,537
Seismic Microzonation | 32
Every district has different damage cases and victims. It depends on the building stocks, vulnerability classes, sub soil properties and distance
from epicenter.
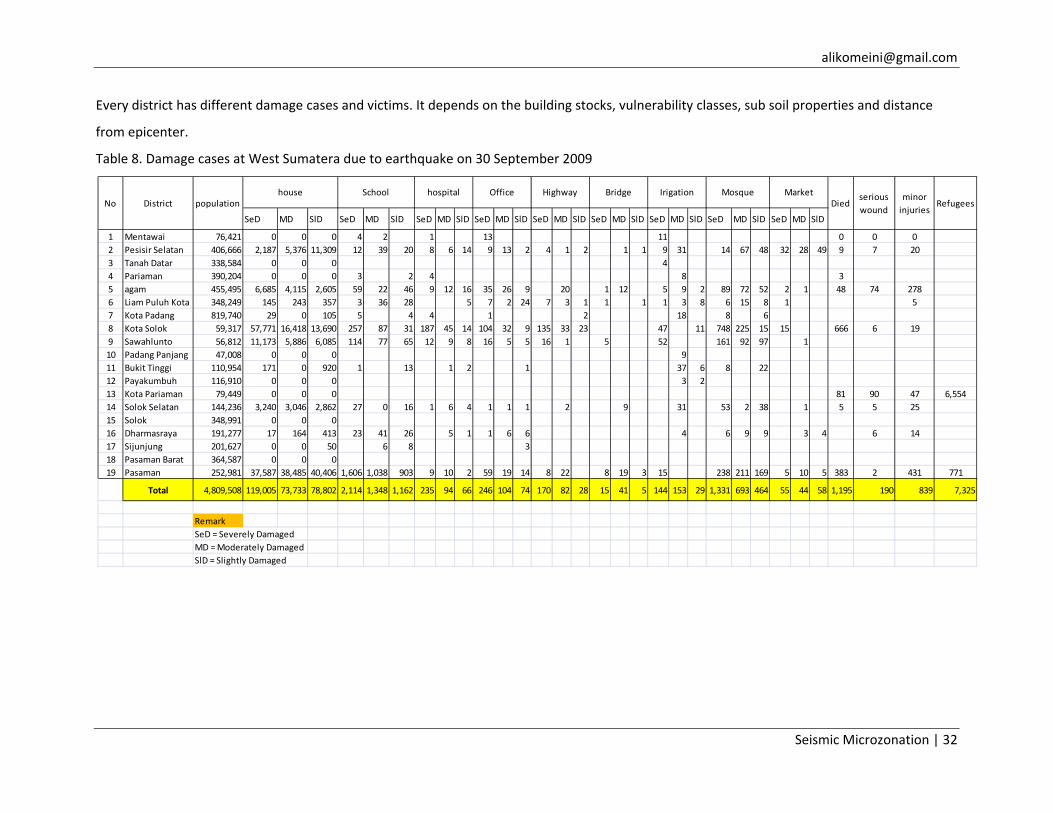
Table 8. Damage cases at West Sumatera due to earthquake on 30 September 2009
SeD MD SlD SeD MD SlD SeD MD SlD SeD MD SlD SeD MD SlD SeD MD SlD SeD MD SlD SeD MD SlD SeD MD SlD
1 Mentawai 76,421 0 0 0 4 2 1 13 11 0 0 02 Pesisir Selatan 406,666 2,187 5,376 11,309 12 39 20 8 6 14 9 13 2 4 1 2 1 1 9 31 14 67 48 32 28 49 9 7 203 Tanah Datar 338,584 0 0 0 44 Pariaman 390,204 0 0 0 3 2 4 8 35 agam 455,495 6,685 4,115 2,605 59 22 46 9 12 16 35 26 9 20 1 12 5 9 2 89 72 52 2 1 48 74 2786 Liam Puluh Kota 348,249 145 243 357 3 36 28 5 7 2 24 7 3 1 1 1 1 3 8 6 15 8 1 57 Kota Padang 819,740 29 0 105 5 4 4 1 2 18 8 68 Kota Solok 59,317 57,771 16,418 13,690 257 87 31 187 45 14 104 32 9 135 33 23 47 11 748 225 15 15 666 6 199 Sawahlunto 56,812 11,173 5,886 6,085 114 77 65 12 9 8 16 5 5 16 1 5 52 161 92 97 110 Padang Panjang 47,008 0 0 0 911 Bukit Tinggi 110,954 171 0 920 1 13 1 2 1 37 6 8 2212 Payakumbuh 116,910 0 0 0 3 213 Kota Pariaman 79,449 0 0 0 81 90 47 6,55414 Solok Selatan 144,236 3,240 3,046 2,862 27 0 16 1 6 4 1 1 1 2 9 31 53 2 38 1 5 5 2515 Solok 348,991 0 0 016 Dharmasraya 191,277 17 164 413 23 41 26 5 1 1 6 6 4 6 9 9 3 4 6 1417 Sijunjung 201,627 0 0 50 6 8 318 Pasaman Barat 364,587 0 0 019 Pasaman 252,981 37,587 38,485 40,406 1,606 1,038 903 9 10 2 59 19 14 8 22 8 19 3 15 238 211 169 5 10 5 383 2 431 771
Total 4,809,508 119,005 73,733 78,802 2,114 1,348 1,162 235 94 66 246 104 74 170 82 28 15 41 5 144 153 29 1,331 693 464 55 44 58 1,195 190 839 7,325
RemarkSeD = Severely DamagedMD = Moderately DamagedSlD = Slightly Damaged
Diedserious wound
minor injuries
RefugeesIrigation Mosque Market
populationDistrictNohouse School hospital Office Highway Bridge
Seismic Microzonation | 33
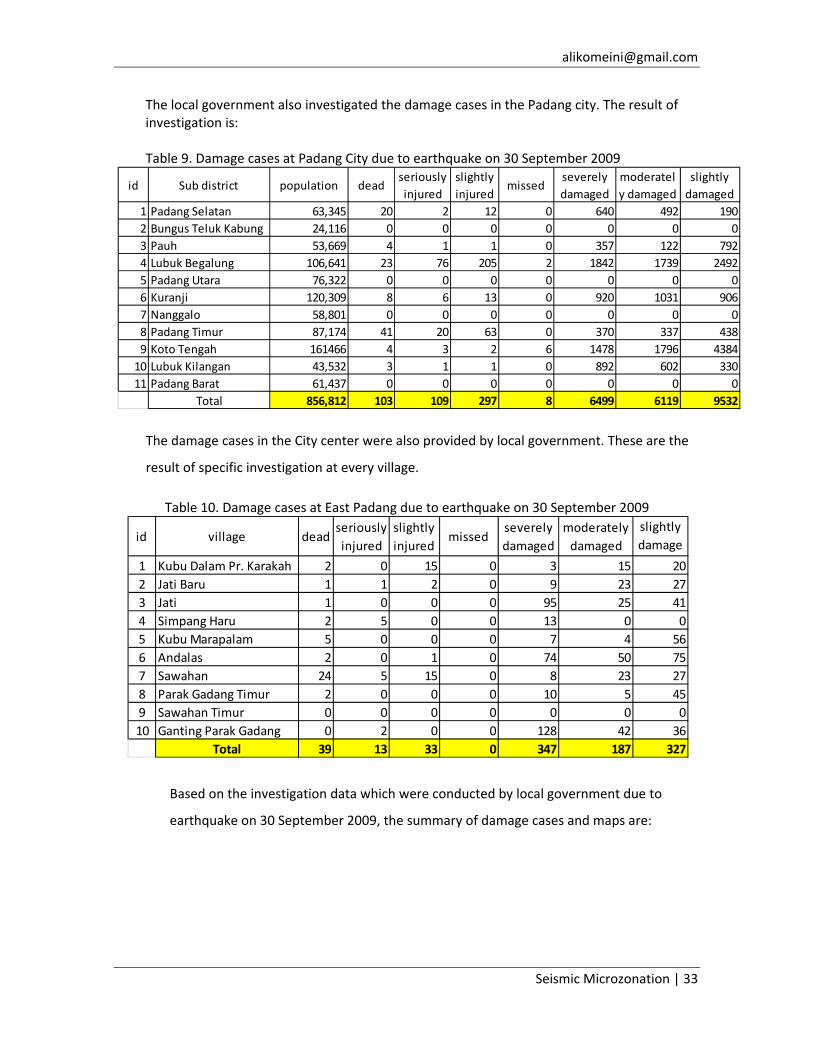
The local government also investigated the damage cases in the Padang city. The result of investigation is: Table 9. Damage cases at Padang City due to earthquake on 30 September 2009
The damage cases in the City center were also provided by local government. These are the
result of specific investigation at every village.
Table 10. Damage cases at East Padang due to earthquake on 30 September 2009
Based on the investigation data which were conducted by local government due to
earthquake on 30 September 2009, the summary of damage cases and maps are:
id Sub district population deadseriously injured
slightly injured
missedseverely damaged
moderately damaged
slightly damaged
1 Padang Selatan 63,345 20 2 12 0 640 492 1902 Bungus Teluk Kabung 24,116 0 0 0 0 0 0 03 Pauh 53,669 4 1 1 0 357 122 7924 Lubuk Begalung 106,641 23 76 205 2 1842 1739 24925 Padang Utara 76,322 0 0 0 0 0 0 06 Kuranji 120,309 8 6 13 0 920 1031 9067 Nanggalo 58,801 0 0 0 0 0 0 08 Padang Timur 87,174 41 20 63 0 370 337 4389 Koto Tengah 161466 4 3 2 6 1478 1796 438410 Lubuk Kilangan 43,532 3 1 1 0 892 602 33011 Padang Barat 61,437 0 0 0 0 0 0 0
Total 856,812 103 109 297 8 6499 6119 9532
id village deadseriously injured
slightly injured
missedseverely damaged
moderately damaged
slightly damage
1 Kubu Dalam Pr. Karakah 2 0 15 0 3 15 202 Jati Baru 1 1 2 0 9 23 273 Jati 1 0 0 0 95 25 414 Simpang Haru 2 5 0 0 13 0 05 Kubu Marapalam 5 0 0 0 7 4 566 Andalas 2 0 1 0 74 50 757 Sawahan 24 5 15 0 8 23 278 Parak Gadang Timur 2 0 0 0 10 5 459 Sawahan Timur 0 0 0 0 0 0 010 Ganting Parak Gadang 0 2 0 0 128 42 36
Total 39 13 33 0 347 187 327

Seismic Microzonation | 34
Figure 32. Damage cases in West Sumatera due to earthquake on 30 September 2009
Figure 33. Damage cases in Padang city due to earthquake on 30 September 2009
Seismic Microzonation | 35
Figure 34. Damage cases in Center of city due to earthquake on 30 September 2009
Figure 35. Number of victims due to earthquake on 30 September 2009
Seismic Microzonation | 36
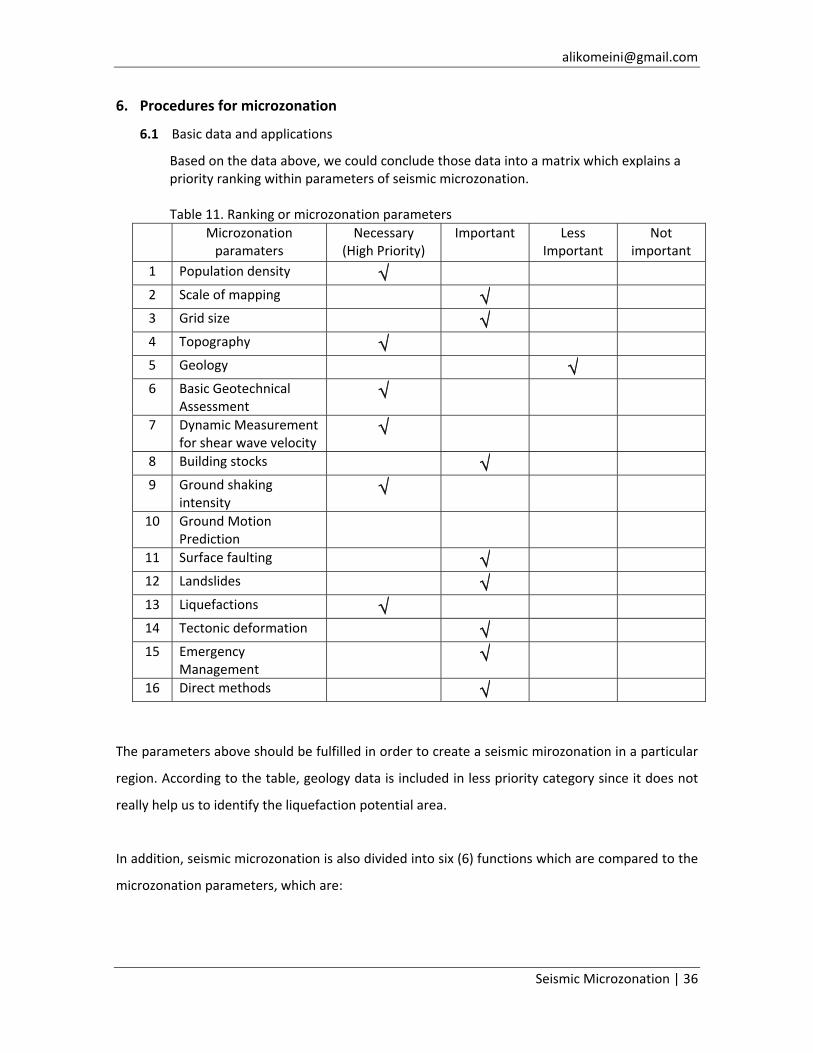
6. Procedures for microzonation
6.1 Basic data and applications
Based on the data above, we could conclude those data into a matrix which explains a priority ranking within parameters of seismic microzonation. Table 11. Ranking or microzonation parameters
Microzonation paramaters
Necessary (High Priority)
Important Less Important
Not important
1 Population density √
2 Scale of mapping √
3 Grid size √
4 Topography √
5 Geology √
6 Basic Geotechnical Assessment
√
7 Dynamic Measurement for shear wave velocity
√
8 Building stocks √
9 Ground shaking intensity
√
10 Ground Motion Prediction
11 Surface faulting √
12 Landslides √
13 Liquefactions √
14 Tectonic deformation √
15 Emergency Management
√
16 Direct methods √
The parameters above should be fulfilled in order to create a seismic mirozonation in a particular
region. According to the table, geology data is included in less priority category since it does not
really help us to identify the liquefaction potential area.
In addition, seismic microzonation is also divided into six (6) functions which are compared to the
microzonation parameters, which are:
Seismic Microzonation | 37
Table 12. Evaluation of seismic microzonation parameters with respect to function
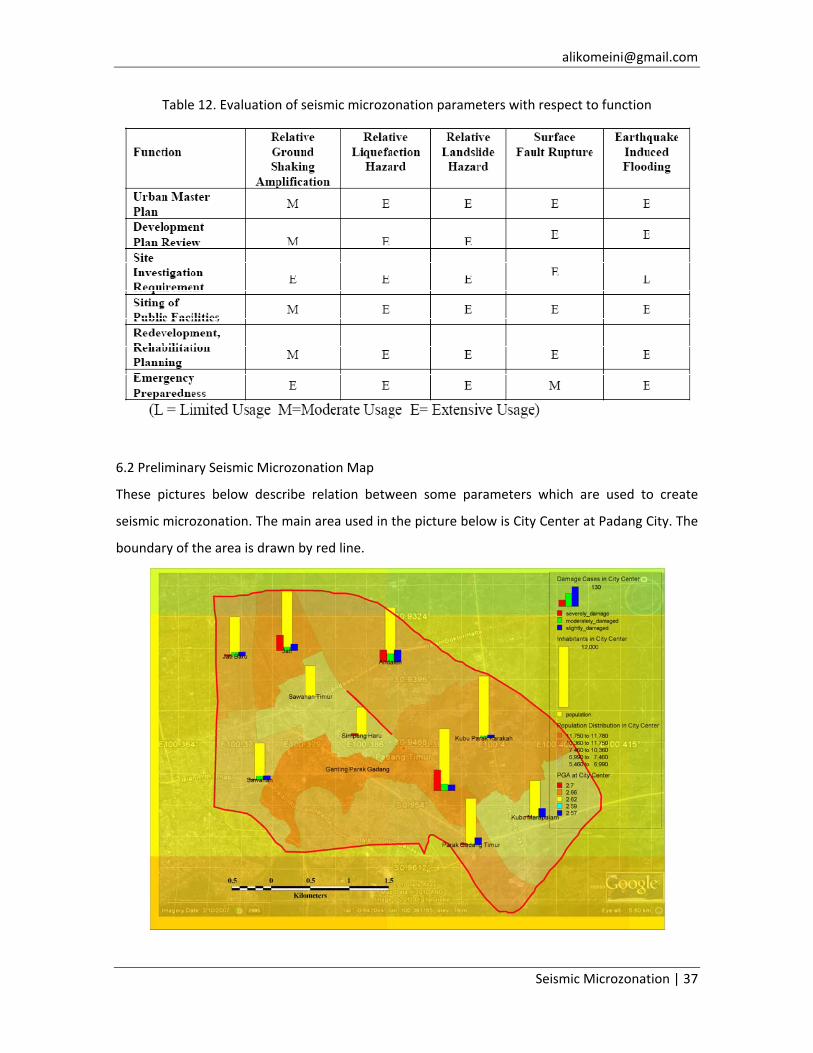
6.2 Preliminary Seismic Microzonation Map
These pictures below describe relation between some parameters which are used to create
seismic microzonation. The main area used in the picture below is City Center at Padang City. The
boundary of the area is drawn by red line.
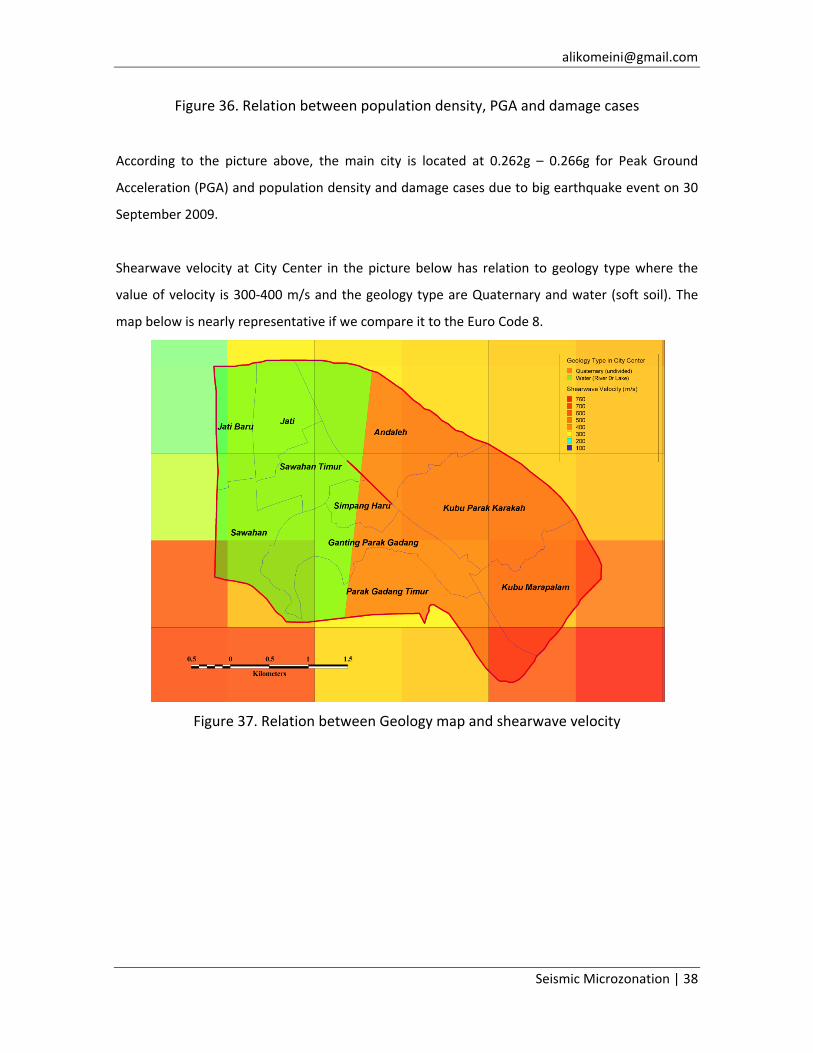
Seismic Microzonation | 38
Figure 36. Relation between population density, PGA and damage cases
According to the picture above, the main city is located at 0.262g – 0.266g for Peak Ground
Acceleration (PGA) and population density and damage cases due to big earthquake event on 30
September 2009.
Shearwave velocity at City Center in the picture below has relation to geology type where the
value of velocity is 300‐400 m/s and the geology type are Quaternary and water (soft soil). The
map below is nearly representative if we compare it to the Euro Code 8.
Figure 37. Relation between Geology map and shearwave velocity
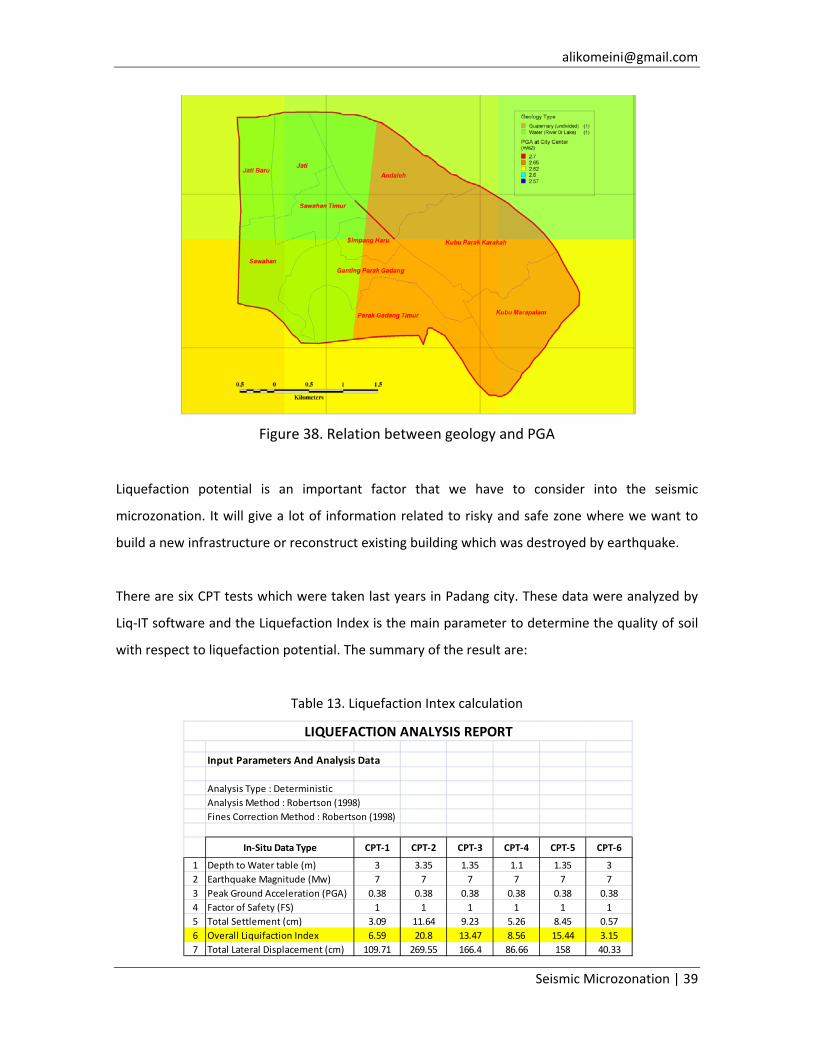
Seismic Microzonation | 39
Figure 38. Relation between geology and PGA
Liquefaction potential is an important factor that we have to consider into the seismic
microzonation. It will give a lot of information related to risky and safe zone where we want to
build a new infrastructure or reconstruct existing building which was destroyed by earthquake.
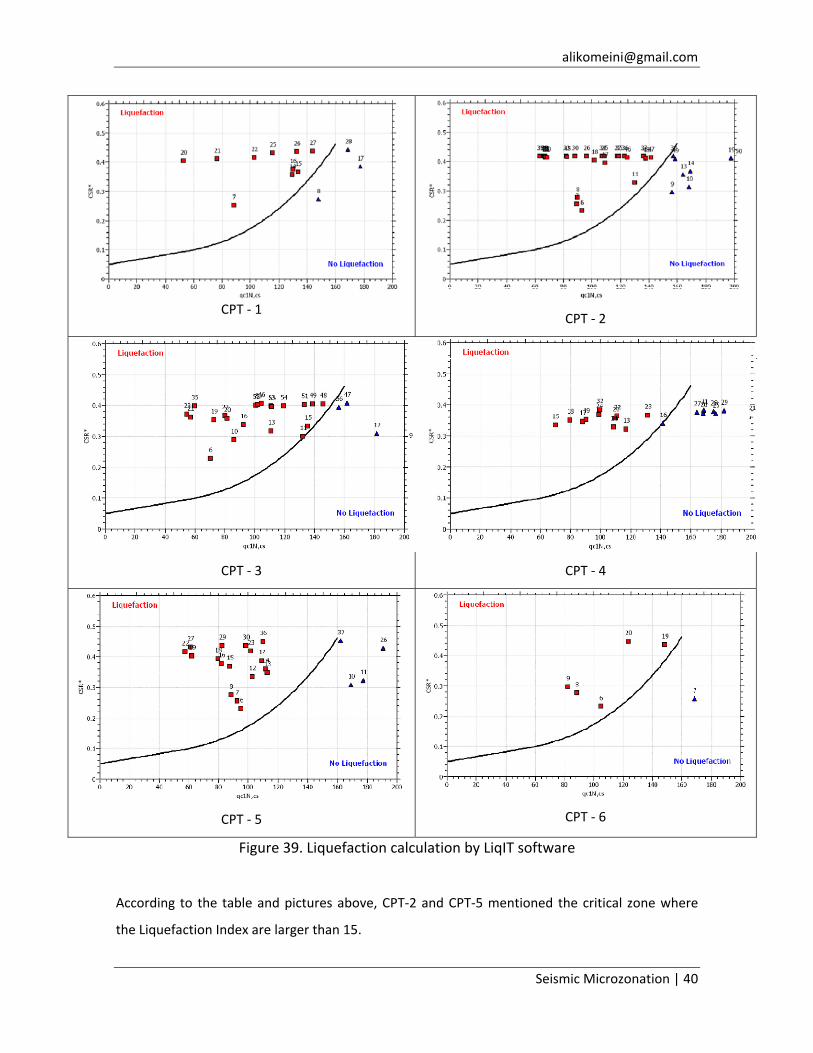
There are six CPT tests which were taken last years in Padang city. These data were analyzed by
Liq‐IT software and the Liquefaction Index is the main parameter to determine the quality of soil
with respect to liquefaction potential. The summary of the result are:
Table 13. Liquefaction Intex calculation
Input Parameters And Analysis Data
Analysis Type : DeterministicAnalysis Method : Robertson (1998)Fines Correction Method : Robertson (1998)
In‐Situ Data Type CPT‐1 CPT‐2 CPT‐3 CPT‐4 CPT‐5 CPT‐6
1 Depth to Water table (m) 3 3.35 1.35 1.1 1.35 32 Earthquake Magnitude (Mw) 7 7 7 7 7 73 Peak Ground Acceleration (PGA) 0.38 0.38 0.38 0.38 0.38 0.384 Factor of Safety (FS) 1 1 1 1 1 15 Total Settlement (cm) 3.09 11.64 9.23 5.26 8.45 0.576 Overall Liquifaction Index 6.59 20.8 13.47 8.56 15.44 3.157 Total Lateral Displacement (cm) 109.71 269.55 166.4 86.66 158 40.33
LIQUEFACTION ANALYSIS REPORT
Seismic Microzonation | 40
CPT ‐ 1
CPT ‐ 2
CPT ‐ 3 CPT ‐ 4
CPT ‐ 5 CPT ‐ 6
Figure 39. Liquefaction calculation by LiqIT software
According to the table and pictures above, CPT‐2 and CPT‐5 mentioned the critical zone where
the Liquefaction Index are larger than 15.
Seismic Microzonation | 41
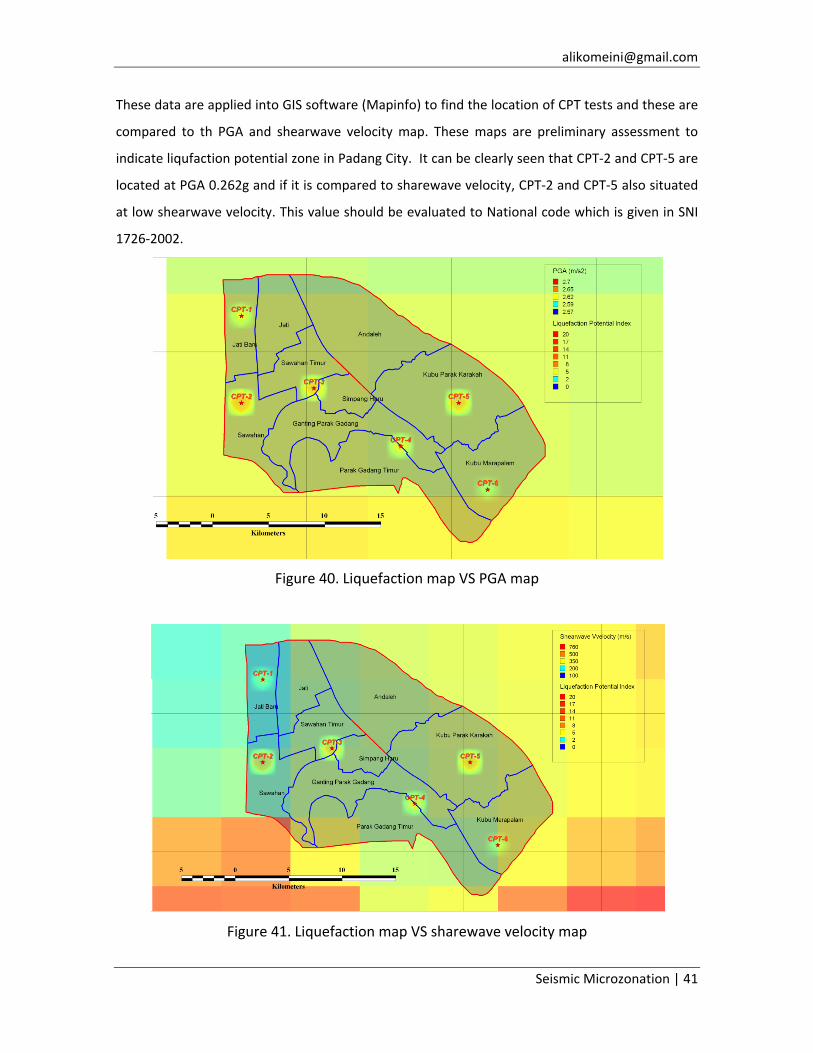
These data are applied into GIS software (Mapinfo) to find the location of CPT tests and these are
compared to th PGA and shearwave velocity map. These maps are preliminary assessment to
indicate liqufaction potential zone in Padang City. It can be clearly seen that CPT‐2 and CPT‐5 are
located at PGA 0.262g and if it is compared to sharewave velocity, CPT‐2 and CPT‐5 also situated
at low shearwave velocity. This value should be evaluated to National code which is given in SNI
1726‐2002.
Figure 40. Liquefaction map VS PGA map
Figure 41. Liquefaction map VS sharewave velocity map

Seismic Microzonation | 42
These maps should be improved by doing some soil investigations at every grid which is
determined by Mapinfo. The output of this map could be an evaluation for local government to
indicate the safe zone for inhabitants or significant building, for example power plant
infrastructures, Nuclear power plants building and others specific building.
Seismic Microzonation | 43
7. Recommendations and Conclusions
1. High priority parameters are really important to be applied at the target area.
2. Seismic microzonation is really important to be implemented at the risky area caused by
earthquake.
3. Ground shaking, liquefaction and landslide map are necessary to be provided by local
government as a guideline to relocate inhabitants which are leaving at that zone.
4. During periodic review of urban master plans, review and revise, if needed the uses for
lands shown as hazardous on the microzonation maps.
5. To determine when seismic hazard evaluations are needed before land is subdivided or
services are provided
6. Before new building plots are approved, use seismic microzonation maps to assess the
vulnerability of the lots, access and infrastructure in the event of an earthquake.
7. Adopt policies to acquire additional seismic hazard information before development of
areas shown to be potentially hazardous on seismic microzonation maps.
8. Seek qualified engineering geologists or geotechnical engineers to review site‐specific
geotechnical reports submitted by applicants for development permits.
9. Identify potential hazards to be addressed in the selection of sites and design of public
facilities and infrastructure systems.
10. To help guide investment in strengthening and mitigation measures for public facilities and
infrastructure.
11. Use seismic microzonation maps in establishing priorities for redevelopment to relocate
existing settlements to less hazardous sites and to create safer land uses and buildings in
the course of redevelopment.
12. Use seismic microzonation maps with structural and other information to set priorities for
seismic retrofit for existing hazardous buildings and facilities.
13. To inform the public on the earthquake vulnerability of the municipality and the region.
14. To create realistic scenarios for emergency planning and training exercises for municipal
level organizations.
15. To evaluate the vulnerability to earthquake damage in addressing hazardous material
storage, transport and use.
Seismic Microzonation | 44
8. References
1. Amann P. and Heil M. (1995). "Cone penetration testing in Switzerland", CPT ’95, International Symposium on cone penetration testing, Linköping, Sweden, vol. 1, S. 235‐242.
2. Amann P., Heil M. and Huder J. (1997). "Determination of shear strength of soft lacustrine clays", XIV ICSMFE, Vol. 1, Hamburg 1997, S. 507‐510.
3. Boore, D.M., Joyner, W.B. and Fumal, T.E. (1997). "Equations for Estimating Horizontal Response Spectra and Peak Accelerations from Western North American Earthquakes: A summary of Recent Work", Seismological Research Letters, (68) 1:128‐153.
4. EMS‐98 (1998). European Seismological Commission, Subcommission on Engineering Seismology, Working Group Macroseismic Scales, "European Macroseismic Scale 1998, EMS‐98", Editor G. Grünthal. Luxembourg, 1998. Homepage: http://www.gfz‐potsdam.de/pb5/pb53/projekt/ems/
5. Fäh D., Kind F. and Giardini D. (2002). "Structural Information Extracted from Microtremor Wavefields", 12th European Conference on Earthquake Engineering, London, 2002.
6. Finn W.D.L. (1972). "Soil Dynamics and Liquefaction of Sand", Proc. Of Int. Conf. on Microzonation for Safer Construction – Research and Application, Seattle.
7. Hardin, B.O. (1978). "The Nature of Stress‐Strain Behaviour of Soils", Earthquake Engineering and Soil Dynamics, ASCE, Vol. 1, pp. 3‐90.
8. Hardin, B.O. and Drnevich, V. (1972). "Shear Modulus and Damping in Soils: Design Equations and Curves", Journal of the Soil Mechanics and Foundations Division, ASCE, Vol. 98, No. 7, pp. 667‐691.
9. Iwasaki, T., F. Tatsuoka, K. Tokida, and S. Yasuda (1978). "A practical method for assessing soil liquefaction potential based on case studies at various sites in Japan", 2nd International conference on microzonation, San Francisco, p. 885‐896.
10. Iyisan, R. (1996). "Correlations between Shear Wave Velocity and In situ Penetration Test Results", Technical Journal of Turkish Chamber of Civil Engineers, 7(2): 1187‐1199 (in Turkish).
11. Jamiolkowski, M., Ghionna, V., Lancellotta, R. and Pasqualini, E. (1988). "New Correlations of Penetratio Tests for Design Practice", Proc. ISOPT‐1, Orlando, FL, Vol. 1: 263‐296.
12. Kayen, R.E., Mitchell, J.K., Seed, R.B., Lodge, A., Nishio and Coutinho, R. (1992). "Evaluation of SPT‐, CPT‐, and Shear Wave‐Based Methods for Liquefaction Potential Assessment Using Loma Prieta Data”, Proc. 4th Japan‐US Workshop on Earthquake Resistant Design of Lifeline Facilities and Countermeasures for Soil Liquefaction, (1):177‐204.
13. Lee, S.H.H. (1990). "Regression models of shear wave velocities” Journal of the Chinese Institute of Engineers,(13)5:519‐532.
14. Midorikawa, S. (1987). "Prediction of Isoseismal Map in the Kanto Plain due to Hypothetical Earthquake", Journal of Structural Engineering 33B, 43‐48.
15. Mitchell J. K., Yu H. S. (1998). "Analysis of cone resistance: Review of methods", Journal of Geotechnical and Geoenvironmental Engineering, Vol. 124, N. 2, Feb. 1998, S. 140‐149.