seismic hazard zone report for the...
TRANSCRIPT

SEISMIC HAZARD ZONE REPORT 051
SEISMIC HAZARD ZONE REPORT FOR THE MILPITAS 7.5-MINUTE QUADRANGLE,
ALAMEDA AND SANTA CLARA COUNTIES, CALIFORNIA
2001
DEPARTMENT OF CONSERVATION California Geological Survey
STATE OF CALIFORNIA
ARNOLD SCHWARZENEGGER GOVERNOR
THE RESOURCES AGENCY MICHAEL CHRISMAN
SECRETARY FOR RESOURCES
DEPARTMENT OF CONSERVATION DEBBIE SAREERAM INTERIM DIRECTOR

CALIFORNIA GEOLOGICAL SURVEY
MICHAEL S. REICHLE, ACTING STATE GEOLOGIST
Copyright © 2004 by the California Department of Conservation. All rights reserved. No part of this publication may be reproduced without written consent of the Department of Conservation.
“The Department of Conservation makes no warrantees as to the suitability of this product for any particular purpose.”

SEISMIC HAZARD ZONE REPORT 051
SEISMIC HAZARD ZONE REPORT FOR THE MILPITAS 7.5-MINUTE QUADRANGLE,
ALAMEDA AND SANTA CLARA COUNTIES, CALIFORNIA
CALIFORNIA GEOLOGICAL SURVEY'S PUBLICATION SALES OFFICES:
Southern California Regional Office 888 South Figueroa Street, Suite 475 Los Angeles, CA 90017 (213) 239-0878
Publications and Information Office 801 K Street, MS 14-31 Sacramento, CA 95814-3531 (916) 445-5716
Bay Area Regional Office 345 Middlefield Road, MS 520 Menlo Park, CA 94025 (650) 688-6327

2
List of Revisions – Milpitas SHZR 051
2004 Text revised
5/25/05 BPS address corrected, updated weblinks
1/13/06 Southern California and Bay Area Regional offices address update

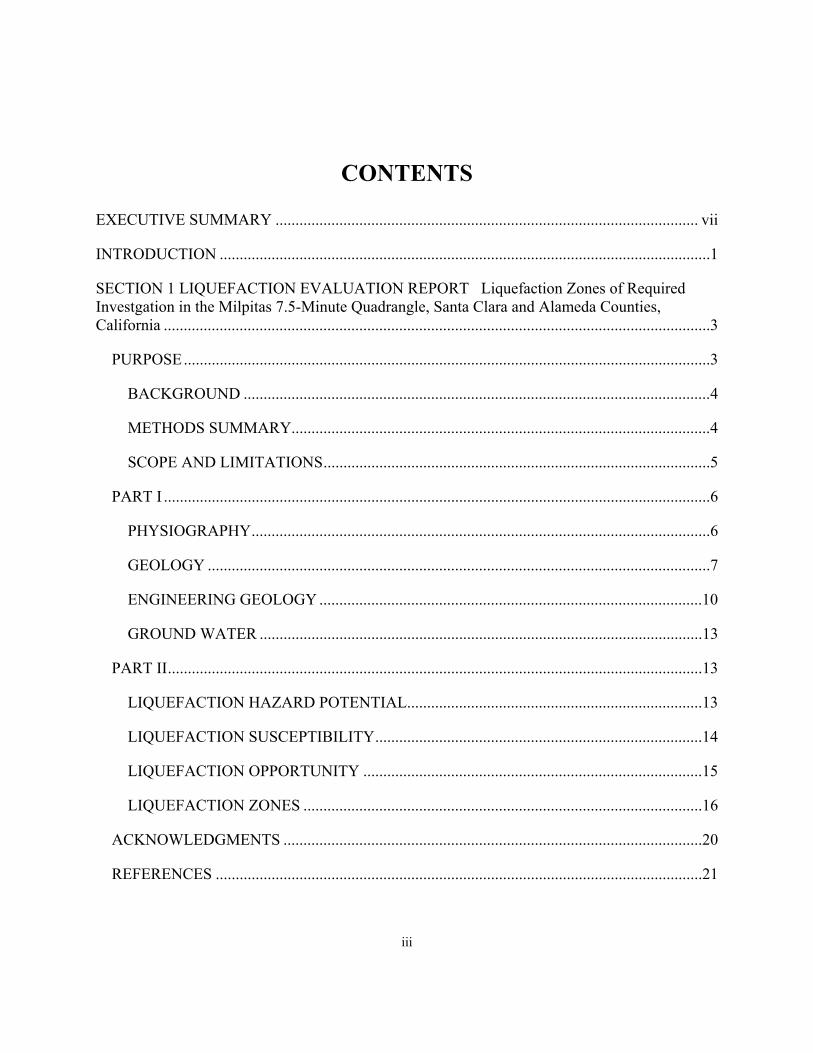
CONTENTS
EXECUTIVE SUMMARY .......................................................................................................... vii
INTRODUCTION ...........................................................................................................................1
SECTION 1 LIQUEFACTION EVALUATION REPORT Liquefaction Zones of Required Investgation in the Milpitas 7.5-Minute Quadrangle, Santa Clara and Alameda Counties, California .........................................................................................................................................3
PURPOSE....................................................................................................................................3
BACKGROUND .....................................................................................................................4
METHODS SUMMARY.........................................................................................................4
SCOPE AND LIMITATIONS.................................................................................................5
PART I .........................................................................................................................................6
PHYSIOGRAPHY...................................................................................................................6
GEOLOGY ..............................................................................................................................7
ENGINEERING GEOLOGY ................................................................................................10
GROUND WATER ...............................................................................................................13
PART II......................................................................................................................................13
LIQUEFACTION HAZARD POTENTIAL..........................................................................13
LIQUEFACTION SUSCEPTIBILITY..................................................................................14
LIQUEFACTION OPPORTUNITY .....................................................................................15
LIQUEFACTION ZONES ....................................................................................................16
ACKNOWLEDGMENTS .........................................................................................................20
REFERENCES ..........................................................................................................................21
iii

SECTION 2 EARTHQUAKE-INDUCED LANDSLIDE EVALUATION REPORT Earthquake-Induced Landslide Zones of Required Investigation in the Milpitas 7.5-Minute Quadrangle, Alameda and Santa Clara Counties, California .............................................................................27
PURPOSE..................................................................................................................................27
BACKGROUND ...................................................................................................................28
METHODS SUMMARY.......................................................................................................28
SCOPE AND LIMITATIONS...............................................................................................28
PART I .......................................................................................................................................30
PHYSIOGRAPHY.................................................................................................................30
GEOLOGY ............................................................................................................................31
ENGINEERING GEOLOGY ................................................................................................33
PART II......................................................................................................................................37
EARTHQUAKE-INDUCED LANDSLIDE HAZARD POTENTIAL.................................37
EARTHQUAKE-INDUCED LANDSLIDE HAZARD ZONE ............................................40
ACKNOWLEDGMENTS .........................................................................................................42
REFERENCES ..........................................................................................................................42
AIR PHOTOS ............................................................................................................................44
APPENDIX A Source of Rock Strength Data...........................................................................44
SECTION 3 GROUND SHAKING EVALUATION REPORT Potential Ground Shaking in the Milpitas 7.5-Minute Quadrangle, Alameda and Santa Clara Counties, California.................45
PURPOSE..................................................................................................................................45
EARTHQUAKE HAZARD MODEL .......................................................................................46
APPLICATIONS FOR LIQUEFACTION AND LANDSLIDE HAZARD ASSESSMENTS 50
USE AND LIMITATIONS........................................................................................................53
REFERENCES ..........................................................................................................................54
iv

ILLUSTRATIONS
Figure 2.1. Yield Acceleration vs. Newmark Displacement for the 1989 Loma Prieta Earthquake Corralitos Record................................................................................................37
Figure 3.1. Milpitas 7.5-Minute Quadrangle and portions of adjacent quadrangles, 10 percent exceedance in 50 years peak ground acceleration (g)—Firm rock conditions. .....................47
Figure 3.2. Milpitas 7.5-Minute Quadrangle and portions of adjacent quadrangles, 10 percent exceedance in 50 years peak ground acceleration (g)—Soft rock conditions. ......................48
Figure 3.3. Milpitas 7.5-Minute Quadrangle and portions of adjacent quadrangles, 10 percent exceedance in 50 years peak ground acceleration (g)—Alluvium conditions.......................49
Figure 3.4. Milpitas 7.5-Minute Quadrangle and portions of adjacent quadrangles, 10 percent exceedance in 50 years peak ground acceleration—Predominant earthquake. .....................51
Figure 3.5. Milpitas 7.5-Minute Quadrangle and portions of adjacent quadrangles, 10 percent exceedance in 50 years magnitude-weighted pseudo-peak acceleration for alluvium - Liquefaction opportunity .......................................................................................................52
Table 2.1. Summary of Shear-Strength Statistics for the Milpitas Quadrangle......................36
Table 2.2. Summary of the Shear-Strength Groups for the Milpitas Quadrangle. .................36
Table 2.3. Hazard Potential Matrix for Earthquake-Induced Landslides in the Milpitas Quadrangle. Values in the table show the range of slope gradient (expressed as percent slope) corresponding to calculated Newmark displacement ranges from the design earthquake for each material strength group..........................................................................40
Table 2.1. Summary of Shear-Strength Statistics for the Milpitas Quadrangle.........................36
Table 2.2. Summary of the Shear-Strength Groups for the Milpitas Quadrangle. ....................36
Table 2.3. Hazard Potential Matrix for Earthquake-Induced Landslides in the Milpitas Quadrangle.. ...........................................................................................................................40
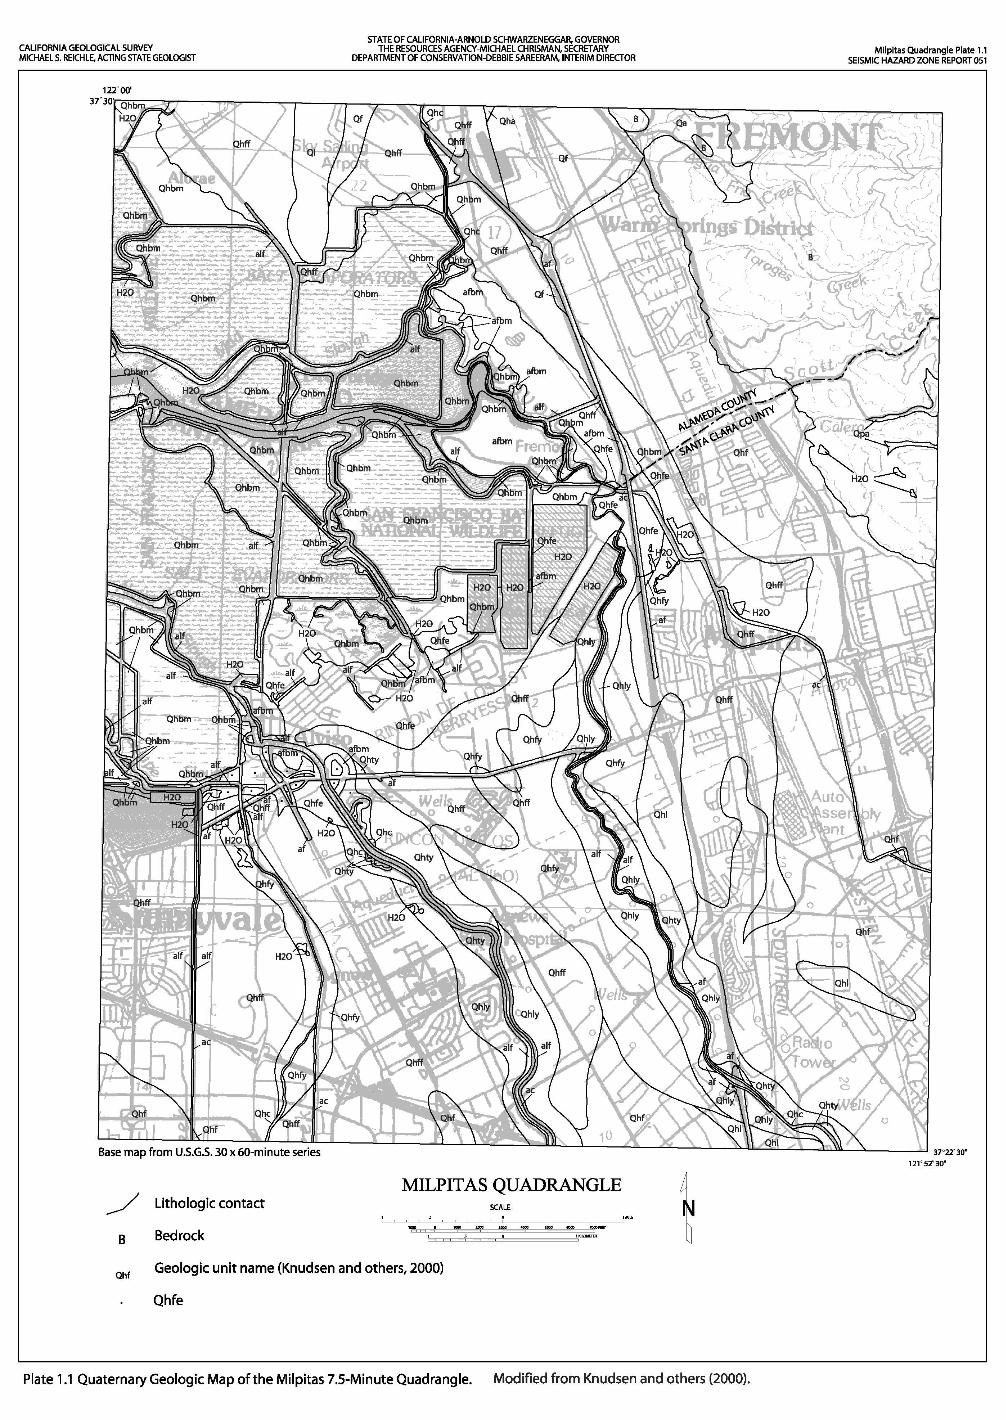
Plate 1.1. Quaternary geologic map of the Milpitas 7.5-Minute Quadrangle, California.........56
Plate 1.2. Depth to historically highest ground water and location of boreholes used in this study, Milpitas 7.5-Minute Quadrangle, California...............................................................57
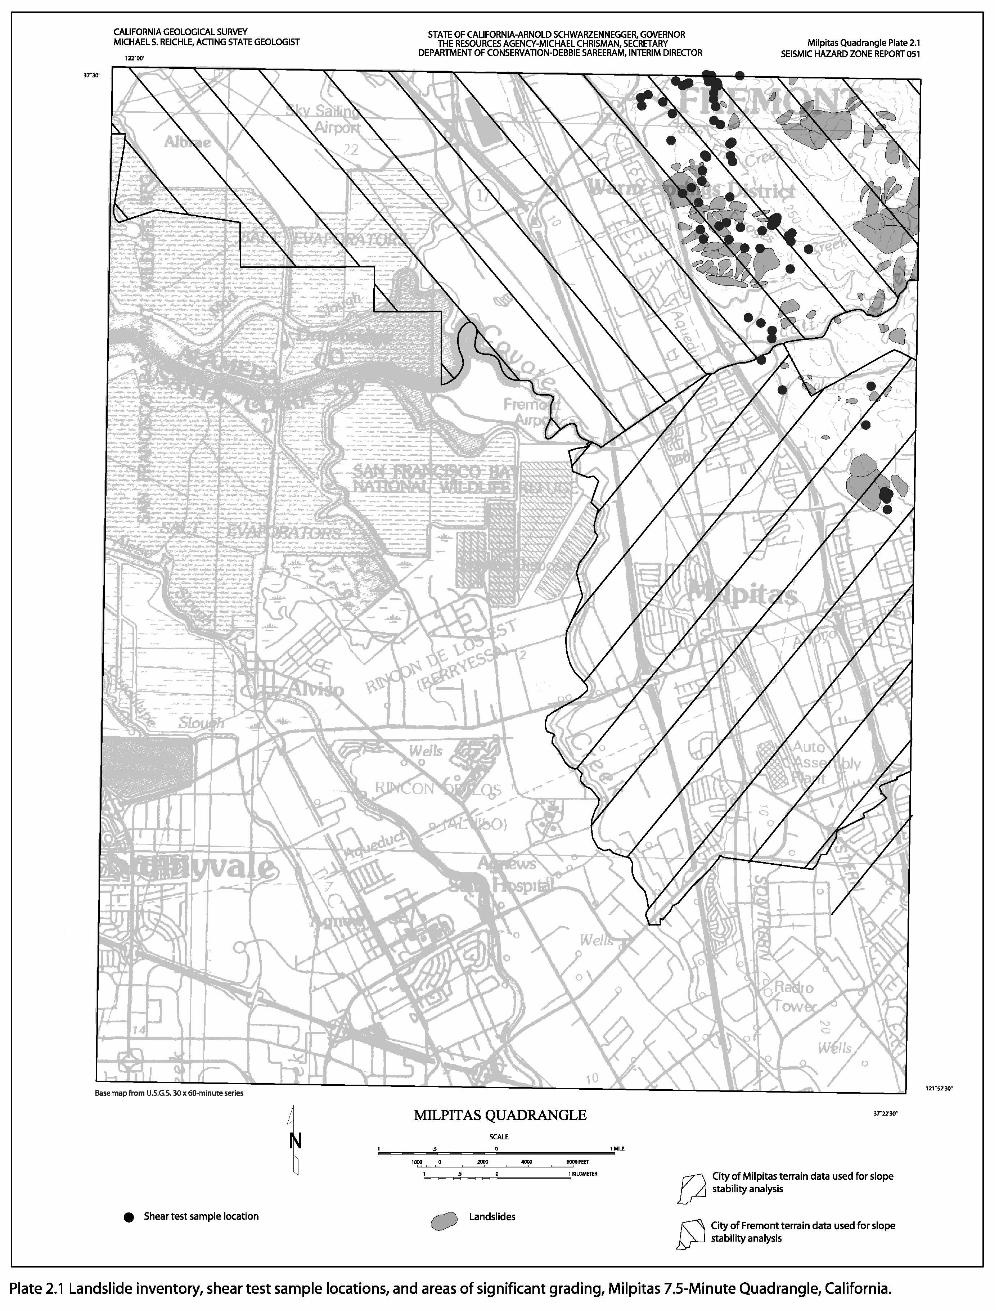
Plate 2.1. Landslide inventory, shear test sample locations, and areas of significant grading, Milpitas 7.5-Minute Quadrangle............................................................................................58
v


EXECUTIVE SUMMARY
This report summarizes the methods and sources of information used to prepare the Seismic Hazard Zone Map for the Milpitas 7.5-Minute Quadrangle, Alameda and Santa Clara counties, California. The map displays the boundaries of zones of required investigation for liquefaction and earthquake-induced landslides over an area of approximately 60 square miles at a scale of 1 inch = 2,000 feet.
The Milpitas Quadrangle lies along the southeastern margin of San Francisco Bay and includes portions of the cities of Fremont, Milpitas, Sunnyvale, Santa Clara, San Jose and unincorporated county land. The boundary between Alameda County and Santa Clara County crosses the northern half of the quadrangle, along Scott Creek and Coyote Creek. Salt evaporation ponds and associated levees occupy the northwestern part of the quadrangle along San Francisco Bay. The gently sloping floor of the Santa Clara Valley, which is extensively developed for residential, commercial and industrial uses, occupies most of the map area. Interstate 80, Interstate 680, U.S. Highway 101 and State Highway 237 all cross the valley floor. The hills on the east have scattered residential developments, open ranch land and several active and inactive quarries.
The map was prepared by employing geographic information system (GIS) technology, which allows the manipulation of three-dimensional data. Information considered includes topography, surface and subsurface geology, borehole data, historical ground-water levels, existing landslide features, slope gradient, rock-strength measurements, geologic structure, and probabilistic earthquake shaking estimates. The shaking inputs are based upon probabilistic seismic hazard maps that depict peak ground acceleration, mode magnitude, and mode distance with a 10 percent probability of exceedance in 50 years.
Most of the western two thirds of the Milpitas Quadrangle is underlain by gently sloping alluvial fan and nearly flat bay mud deposits. Ground water is very shallow in this area, typically within 10 feet of the surface. These conditions result in nearly the entire area west of Interstate Highway 680 being designated as a liquefaction zone of required investigation. Within the upland terrain in the northeastern part of the quadrangle there are generally weak rocks and abundant existing landslides. About 7.3 percent of the Milpitas Quadrangle lies within the earthquake-induced landslide zone of required investigation east of Interstate Highway 680.
vii

How to view or obtain the map
Seismic Hazard Zone Maps, Seismic Hazard Zone Reports and additional information on seismic hazard zone mapping in California are available on the California Geological Survey's Internet page: http://www.conservation.ca.gov/CGS/index.htm.
Paper copies of Official Seismic Hazard Zone Maps, released by CGS, which depict zones of required investigation for liquefaction and/or earthquake-induced landslides, are available for purchase from:
BPS Reprographic Services 945 Bryant Street San Francisco, California 94105 (415) 512-6550
Seismic Hazard Zone Reports (SHZR) summarize the development of the hazard zone map for each area and contain background documentation for use by site investigators and local government reviewers. These reports are available for reference at CGS offices in Sacramento, San Francisco, and Los Angeles. NOTE: The reports are not available through BPS Reprographic Services.
INTRODUCTION
The Seismic Hazards Mapping Act (the Act) of 1990 (Public Resources Code, Chapter 7.8, Division 2) directs the California Department of Conservation (DOC), Division of Mines and Geology (DMG) [now called California Geological Survey (CGS)] to delineate seismic hazard zones. The purpose of the Act is to reduce the threat to public health and safety and to minimize the loss of life and property by identifying and mitigating seismic hazards. City, county, and state agencies are directed to use the seismic hazard zone maps in their land-use planning and permitting processes. They must withhold development permits for a site within a zone until the geologic and soil conditions of the project site are investigated and appropriate mitigation measures, if any, are incorporated into development plans. The Act also requires sellers (and their agents) of real property within a mapped hazard zone to disclose at the time of sale that the property lies within such a zone. Evaluation and mitigation of seismic hazards are to be conducted under guidelines adopted by the California State Mining and Geology Board (SMGB) (DOC, 1997). The text of this report is on the Internet at http://gmw.consrv.ca.gov/shmp/webdocs/sp117.pdf.
The Act directs SMGB to appoint and consult with the Seismic Hazards Mapping Act Advisory Committee (SHMAAC) in developing criteria for the preparation of the seismic hazard zone maps. SHMAAC consists of geologists, seismologists, civil and structural engineers, representatives of city and county governments, the state insurance commissioner and the insurance industry. In 1991, SMGB adopted initial criteria for delineating seismic hazard zones to promote uniform and effective statewide implementation of the Act. These initial criteria provide detailed standards for mapping regional liquefaction hazards. The Act also directed CGS to develop a set of probabilistic seismic maps for California and to research methods that might be appropriate for mapping earthquake-induced landslide hazards.
In 1996, working groups established by SHMAAC reviewed the prototype maps and the techniques used to create them. The reviews resulted in recommendations that 1) the process for zoning liquefaction hazards remain unchanged and 2) earthquake-induced landslide zones be delineated using a modified Newmark analysis.
This Seismic Hazard Zone Report summarizes the development of the hazard zone map. The process of zoning for liquefaction uses a combination of Quaternary geologic mapping, historical ground-water information, and subsurface geotechnical data. The process for zoning earthquake-induced landslides incorporates earthquake loading, existing landslide features, slope gradient, rock strength, and geologic structure. Probabilistic seismic hazard maps, which are the underpinning for delineating seismic hazard zones, have been prepared for peak ground acceleration, mode magnitude, and mode distance with a 10 percent probability of exceedance in 50 years (Petersen and others, 1996) in accordance with the mapping criteria.
1

This report summarizes seismic hazard zone mapping for potentially liquefiable soils and earthquake-induced landslides in the Milpitas 7.5-Minute Quadrangle.

SECTION 1 LIQUEFACTION EVALUATION REPORT
Liquefaction Zones of Required Investigation in the Milpitas 7.5-Minute Quadrangle,
Santa Clara and Alameda Counties, California
By Kevin B. Clahan, Elise Mattison, Anne M. Rosinski
and Jacqueline D. J. Bott
California Department of Conservation California Geological Survey
PURPOSE
The Seismic Hazards Mapping Act (the Act) of 1990 (Public Resources Code, Chapter 7.8, Division 2) directs the California Department of Conservation (DOC), California Geological Survey (CGS) to delineate Seismic Hazard Zones. The purpose of the Act is to reduce the threat to public health and safety and to minimize the loss of life and property by identifying and mitigating seismic hazards. Cities, counties, and state agencies are directed to use seismic hazard zone maps developed by CGS in their land-use planning and permitting processes. The Act requires that site-specific geotechnical investigations be performed prior to permitting most urban development projects within seismic hazard zones. Evaluation and mitigation of seismic hazards are to be conducted under guidelines adopted by the California State Mining and Geology Board (SMGB) (DOC, 1997). The text of this report is on the Internet at http://gmw.consrv.ca.gov/shmp/webdocs/sp117.pdf.
Following the release of DMG Special Publication 117 (DOC, 1997), agencies in the Los Angeles metropolitan region sought more definitive guidance in the review of geotechnical investigations addressing liquefaction hazards. The agencies made their request through the Geotechnical Engineering Group of the Los Angeles Section of the American Society of Civil Engineers (ASCE). This group convened an implementation
3

CALIFORNIA GEOLOGICAL SURVEY SHZR 051 4
committee under the auspices of the Southern California Earthquake Center (SCEC). The committee, which consisted of practicing geotechnical engineers and engineering geologists, released an overview of the practice of liquefaction analysis, evaluation, and mitigation techniques (SCEC, 1999). This text is also on the Internet at: http://www.scec.org/.
This section of the evaluation report summarizes seismic hazard zone mapping for potentially liquefiable soils in the Milpitas 7.5-Minute Quadrangle. Section 2 (addressing earthquake-induced landslides) and Section 3 (addressing potential ground shaking) complete the report, which is one of a series that summarizes production of similar seismic hazard zone maps within the state (Smith, 1996). Additional information on seismic hazards zone mapping in California is on CGS’s Internet web page: http://www.conservation.ca.gov/CGS/index.htm.
BACKGROUND
Liquefaction-induced ground failure historically has been a major cause of earthquake damage in northern California. During the 1989 Loma Prieta earthquake and the 1906 San Francisco earthquake, significant damage to roads, utility pipelines, buildings, and other structures in the San Francisco Bay area was caused by liquefaction-induced ground displacement.
Localities most susceptible to liquefaction-induced damage are underlain by loose, water-saturated, granular sediment within 40 feet of the ground surface. These geological and ground-water conditions are widespread in the San Francisco Bay Area, most notably in some densely populated valley regions and alluviated floodplains. In addition, the potential for strong earthquake ground shaking is high because of the many nearby active faults. The combination of these factors constitutes a significant seismic hazard, especially in areas marginal to the San Francisco Bay, including areas in the Milpitas Quadrangle.
METHODS SUMMARY
Characterization of liquefaction hazard presented in this report requires preparation of maps that delineate areas underlain by potentially liquefiable sediment. The following were collected or generated for this evaluation:
• Existing geologic maps were used to provide an accurate representation of the spatial distribution of Quaternary deposits in the study area. Geologic units that generally are susceptible to liquefaction include late Quaternary alluvial and fluvial sedimentary deposits and artificial fill
• Ground-water maps constructed to show the historically highest known ground-water levels
• Geotechnical data analyzed to evaluate liquefaction potential of deposits

2004 SEISMIC HAZARD ZONE REPORT FOR THE MILPITAS QUADRANGLE 5
• Information on potential ground shaking intensity based on CGS probabilistic shaking maps
The data collected for this evaluation were processed into a series of geographic information system (GIS) layers using commercially available software. The liquefaction zone map was derived from a synthesis of these data and according to criteria adopted by the SMGB (DOC, 2000).
SCOPE AND LIMITATIONS
Evaluation for potentially liquefiable soils generally is confined to areas covered by Quaternary (less than about 1.6 million years) sedimentary deposits. Such areas within the Milpitas Quadrangle consist mainly of low-lying shoreline regions, alluviated valleys, floodplains, and canyon regions. CGS’s liquefaction hazard evaluations are based on information on earthquake ground shaking, surface and subsurface lithology, geotechnical soil properties, and ground-water depth, which is gathered from various sources. Although selection of data used in this evaluation was rigorous, the quality of the data used varies. The State of California and the Department of Conservation make no representations or warranties regarding the accuracy of the data obtained from outside sources.
Liquefaction zone maps are intended to prompt more detailed, site-specific geotechnical investigations, as required by the Act. As such, liquefaction zone maps identify areas where the potential for liquefaction is relatively high. They do not predict the amount or direction of liquefaction-related ground displacements, or the amount of damage to facilities that may result from liquefaction. Factors that control liquefaction-induced ground failure are the extent, depth, density, and thickness of liquefiable materials, depth to ground water, rate of drainage, slope gradient, proximity to free faces, and intensity and duration of ground shaking. These factors must be evaluated on a site-specific basis to assess the potential for ground failure at any given project site.
Information developed in the study is presented in two parts: physiographic, geologic, and hydrologic conditions in PART I, and liquefaction and zoning evaluations in PART II.

CALIFORNIA GEOLOGICAL SURVEY SHZR 051 6
PART I
PHYSIOGRAPHY
Study Area Location and Physiography
The Milpitas 7.5-Minute Quadrangle includes approximately 60 square miles of land surface in Alameda and Santa Clara counties, along the southeastern margin of San Francisco Bay. The boundary between Alameda County and Santa Clara County trends east-west through the northern half of the quadrangle, along Scott Creek and Coyote Creek. Approximately 20.5 square miles (33 percent of the quadrangle) along the northern boundary of the quadrangle is within Alameda County and is included in this revised report and accompanying Seismic Hazard Zone Map that now cover the entire Milpitas Quadrangle.
The cities of Sunnyvale and Santa Clara are in the southwestern part of the quadrangle. The northern part of the city of San Jose lies within the central part of the quadrangle and the western half of the city of Milpitas is in the eastern part of the quadrangle. The former city of Alviso, in the southwestern part of the quadrangle, is now under the jurisdiction of the city of San Jose. The city of Fremont occupies the region within Alameda County, north of Scott and Coyote Creeks. Salt evaporation ponds and associated levees occupy the northwestern portion of the quadrangle, along the San Francisco Bay margin. The remainder of the quadrangle is heavily urbanized.
Broad, low-lying alluvial fan deposits of the Santa Clara Valley that slope gently toward the bay cover most of the quadrangle. A small portion of the foothills of the Diablo Range (also informally called the San Jose Foothills) occupies the northeastern corner of the quadrangle. Three perennial streams, Coyote Creek, Saratoga Creek and the Guadalupe River, along with numerous intermittent streams, flow from the Santa Clara Valley in this area. Saratoga Creek and the Guadalupe River originate in the Santa Cruz Mountains on the western margin of the Santa Clara Valley, whereas Coyote Creek flows from the foothills of the Diablo Range. These streams flow northward into the tidal marshes that delimit the active margin of San Francisco Bay.
Four freeways and several other arterial roadways cross the map area. Subparallel, north-northwesterly trending Interstate 80 and Interstate 680 are in the eastern half of the map area. U.S. Highway 101 (Bayshore Freeway) trends east-southeast, and State Highway 237 trends east-northeast in the southern half of the map area. A network of secondary roads links these major highways. The city of Milpitas operates four large, man-made, sewage treatment ponds in the center of the quadrangle.

2004 SEISMIC HAZARD ZONE REPORT FOR THE MILPITAS QUADRANGLE 7
GEOLOGY
Bedrock and Surficial Geology
Geologic units that generally are susceptible to liquefaction include late Quaternary alluvial sedimentary deposits and artificial fill. To identify and characterize deposits susceptible to liquefaction in the Milpitas Quadrangle, recently completed maps of the nine-county San Francisco Bay Area showing Quaternary deposits (Knudsen and others, 2000a) and bedrock units (Wentworth and others, 1999) were obtained from the U.S. Geological Survey in digital form. These Geographic Information Systems (GIS) maps were combined, with minor modifications along the bedrock/Quaternary contact, to form a single, 1:24,000-scale geologic map of the Milpitas Quadrangle. This map (Plate 1.1) was used to evaluate liquefaction susceptibility and develop the Seismic Hazard Zone Map.
The Quaternary geologic mapping methods described by Knudsen and others (2000a) consist of interpretation of topographic maps, aerial photographs, and soil surveys, as well as compiled published and unpublished geologic maps. The authors estimate the ages of deposits using: landform shape, relative geomorphic position, crosscutting relationships, superposition, depth and degree of surface dissection, and relative degree of soil profile development. Table 1.1 compares stratigraphic nomenclature used in Knudsen and others (2000a) and the CGS GIS database, with that of several previous studies performed in northern California.
Other geologic maps and reports were reviewed to evaluate the areal and vertical distribution of shallow Quaternary deposits and to provide information on subsurface geologic, lithologic and engineering properties of the map units. Among the references consulted were Crittenden (1951), California Department of Water Resources (1967), Helley and Brabb (1971), Poland (1971), Nilsen and Brabb (1972), Brown and Jackson (1973), Cooper-Clark and Associates (1974), Rogers and Williams (1974), Atwater and others (1976), Helley and others (1979), Falls (1988), Helley and Wesling (1989), Helley (1990), Geomatrix Consultants Inc. (1992a, 1992b), Helley and others (1994), Iwamura (1995) and Graymer (2000). Limited field reconnaissance was conducted to confirm the location of geologic contacts, map recently modified ground surfaces, observe properties of near-surface deposits, and characterize the surface expression of individual geologic map units.

CALIFORNIA GEOLOGICAL SURVEY SHZR 051 8
UNIT Knudsen
and others (2000a)
Helley and Wesling (1989)
Helley and others (1994)
Helley and others (1979)
Wentworth and others
(1999)
CGS GIS database
Artificial fill af Qha af af
Artificial fill over Bay Mud afbm afbm
Artificial fill, levee alf alf
Artificial stream channel ac ac
Modern stream channel deposits Qhc Qhsc Qhsc Qhsc Qhc Qhc
Latest Holocene alluvial fan deposits Qhfy Qhfy
Latest Holocene alluvial fan levee deposits
Qhly
Qhly
Latest Holocene stream terrace deposits Qhty Qhty
Holocene San Francisco Bay Mud Qhbm Qhbm Qhbm Qhbm Qhbm Qhbm
Holocene basin-estuarine complex deposits
Qhfe Qhbs Qhbs Qhfe
Holocene alluvial fan deposits Qhf Qhaf, Qhfp Qhaf, Qhfp Qham, Qhac Qhf, Qhfp Qhf
Holocene alluvial fan deposits, fine grained facies
Qhff Qhaf Qhff
Holocene alluvial fan levee deposits Qhl Qhl Qhl Qh1 Qhl
Holocene alluvium, undifferentiated Qha Qha Qha
Latest Pleistocene to Holocene alluvial fan deposits
Qf
Qf
Latest Pleistocene to Holocene alluvial fan levee deposits
Ql Ql
Latest Pleistocene to Holocene alluvium, undifferentiated
Qa Qa
Latest Pleistocene alluvium, undifferentiated
Qpa Qpaf Qpaf Qpa Qpa Qpa
Bedrock br br br
Table 1.1. Correlation Chart of Quaternary Stratigraphic Nomenclatures Used in Previous Studies. For this study, CGS has adopted the nomenclature of Knudsen and others (2000a).
2004 SEISMIC HAZARD ZONE REPORT FOR THE MILPITAS QUADRANGLE 9
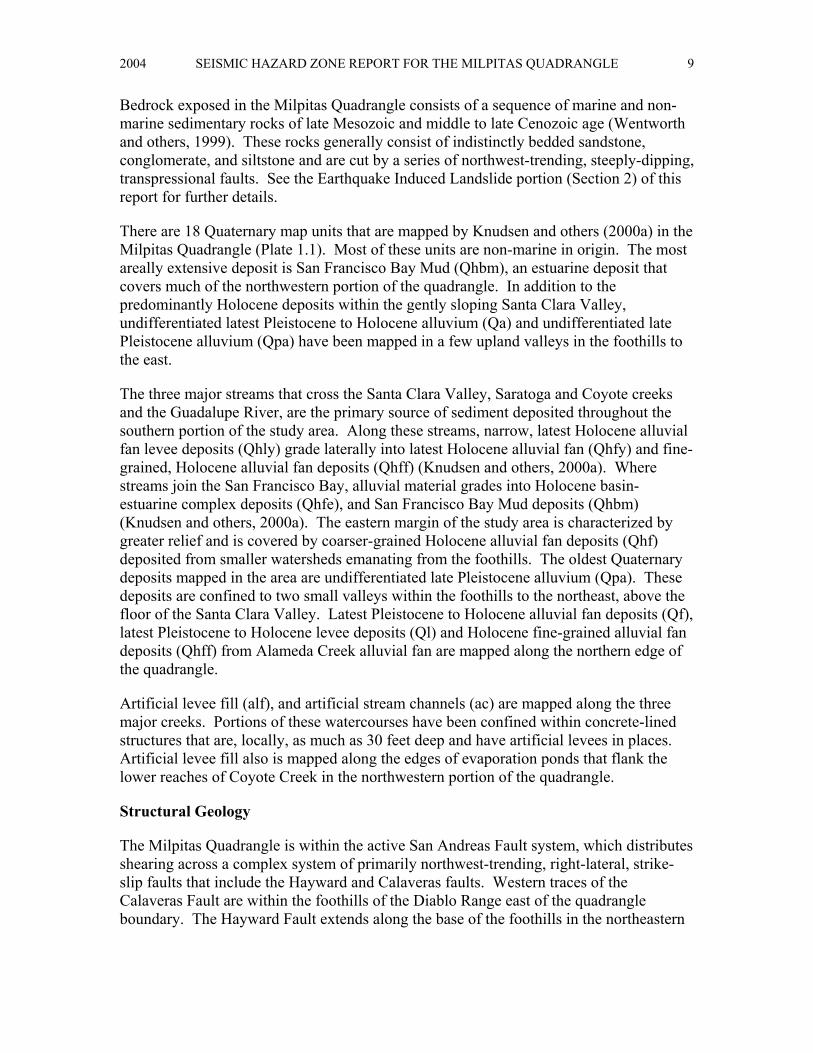
Bedrock exposed in the Milpitas Quadrangle consists of a sequence of marine and non-marine sedimentary rocks of late Mesozoic and middle to late Cenozoic age (Wentworth and others, 1999). These rocks generally consist of indistinctly bedded sandstone, conglomerate, and siltstone and are cut by a series of northwest-trending, steeply-dipping, transpressional faults. See the Earthquake Induced Landslide portion (Section 2) of this report for further details.
There are 18 Quaternary map units that are mapped by Knudsen and others (2000a) in the Milpitas Quadrangle (Plate 1.1). Most of these units are non-marine in origin. The most areally extensive deposit is San Francisco Bay Mud (Qhbm), an estuarine deposit that covers much of the northwestern portion of the quadrangle. In addition to the predominantly Holocene deposits within the gently sloping Santa Clara Valley, undifferentiated latest Pleistocene to Holocene alluvium (Qa) and undifferentiated late Pleistocene alluvium (Qpa) have been mapped in a few upland valleys in the foothills to the east.
The three major streams that cross the Santa Clara Valley, Saratoga and Coyote creeks and the Guadalupe River, are the primary source of sediment deposited throughout the southern portion of the study area. Along these streams, narrow, latest Holocene alluvial fan levee deposits (Qhly) grade laterally into latest Holocene alluvial fan (Qhfy) and fine-grained, Holocene alluvial fan deposits (Qhff) (Knudsen and others, 2000a). Where streams join the San Francisco Bay, alluvial material grades into Holocene basin-estuarine complex deposits (Qhfe), and San Francisco Bay Mud deposits (Qhbm) (Knudsen and others, 2000a). The eastern margin of the study area is characterized by greater relief and is covered by coarser-grained Holocene alluvial fan deposits (Qhf) deposited from smaller watersheds emanating from the foothills. The oldest Quaternary deposits mapped in the area are undifferentiated late Pleistocene alluvium (Qpa). These deposits are confined to two small valleys within the foothills to the northeast, above the floor of the Santa Clara Valley. Latest Pleistocene to Holocene alluvial fan deposits (Qf), latest Pleistocene to Holocene levee deposits (Ql) and Holocene fine-grained alluvial fan deposits (Qhff) from Alameda Creek alluvial fan are mapped along the northern edge of the quadrangle.
Artificial levee fill (alf), and artificial stream channels (ac) are mapped along the three major creeks. Portions of these watercourses have been confined within concrete-lined structures that are, locally, as much as 30 feet deep and have artificial levees in places. Artificial levee fill also is mapped along the edges of evaporation ponds that flank the lower reaches of Coyote Creek in the northwestern portion of the quadrangle.
Structural Geology
The Milpitas Quadrangle is within the active San Andreas Fault system, which distributes shearing across a complex system of primarily northwest-trending, right-lateral, strike-slip faults that include the Hayward and Calaveras faults. Western traces of the Calaveras Fault are within the foothills of the Diablo Range east of the quadrangle boundary. The Hayward Fault extends along the base of the foothills in the northeastern

CALIFORNIA GEOLOGICAL SURVEY SHZR 051 10
part of the quadrangle. Historical ground-rupturing earthquakes have occurred on both of these faults (Lawson, 1908; Keefer and others, 1980).
ENGINEERING GEOLOGY
Geotechnical and environmental borehole logs provided lithologic and engineering characteristics of Quaternary deposits within the study area. All materials identified in the borehole logs were assigned geologic map unit names based on the unit descriptions of Knudsen and others (2000a) as well as characteristics identified in the field. Summaries of the geotechnical characteristics of the units as interpreted from the GIS database are presented in Tables 1.2 and 1.3.
Standard Penetration Tests (SPTs) provide a standardized measure of the penetration resistance of geologic deposits and are commonly used as an index of soil density. This in-field test consists of counting the number of blows required to drive a split-spoon sampler (1.375-inch inside diameter) 1 foot into the soil at the bottom of a borehole at chosen intervals while drilling. The driving force is provided by dropping a 140-pound hammer weight 30 inches. The SPT method is formally defined and specified by the American Society for Testing and Materials in test method D1586 (ASTM, 1999). Recorded blow counts for non-SPT geotechnical sampling where the sampler diameter, hammer weight or drop distance differs from that specified for an SPT (ASTM D1586), are converted to SPT-equivalent blow counts. The actual and converted SPT blow counts are normalized to a common-reference, effective-overburden pressure of 1 atmosphere (approximately 1 ton per square foot) and a hammer efficiency of 60 percent using a method described by Seed and Idriss (1982) and Seed and others (1985). This normalized blow count is referred to as (N1)60.
Information on subsurface geology and engineering characteristics of flatland deposits was obtained from borehole logs collected from reports on geotechnical and environmental projects. For this investigation, 212 borehole logs were collected from the files of the California Department of Transportation and departments of public works and engineering in the cities of San Jose, Milpitas, Santa Clara and Fremont. Data from 170 borehole logs were entered into a CGS geotechnical GIS database (Table 1.2, Plate 1.2). This database is used to assess the susceptibility of subsurface materials to earthquake-induced liquefaction. Additional ground-water information from approximately 125 boreholes within the Milpitas Quadrangle was obtained from the Santa Clara Valley Water District, Underground Storage Tank Monitoring Program, and for about 25 boreholes in Alameda County from the Regional Water Quality Control Board.
Geotechnical and environmental borehole logs provide information on lithologic and engineering characteristics of Quaternary deposits. Geotechnical characteristics of the Quaternary map units are summarized in Table 1.2 and their composition by soil type is presented in Table 1.3. These tables reveal that: 1) Holocene materials generally are less dense and more readily penetrated than Pleistocene materials; 2) latest Pleistocene alluvial fan deposits (Qpf) have higher dry density and higher penetration resistance than Holocene alluvial fan deposits (Qhf); 3) latest Pleistocene alluvial fan deposits (Qpf) have a similar lithologic composition to the Holocene alluvial fan deposits (Qhf); 4) Holocene and Pleistocene alluvial fan deposits are predominantly fine grained, but

2004 SEISMIC HAZARD ZONE REPORT FOR THE MILPITAS QUADRANGLE 11
contain silt and sand lenses that have the potential to liquefy; 5) most units have a wide range in their dry density and penetration resistance; and 6) deposits are generally fine-grained in the Milpitas Quadrangle probably because at the distal (and gently sloping) ends of alluvial systems.
GEOLOGIC MAP UNIT
DRY DENSITY (pounds per cubic foot)
STANDARD PENETRATION RESISTANCE (blows per foot, (N1)60)
Unit (1)
Texture (2)
Number of Tests Mean CV
(3) Median Min Max Number of Tests Mean CV
(3) Median Min Max
Fine 22 105.1 0.11 106.5 86 133 42 21 0.78 16 5 80 af Coarse 5 104.5 0.10 110 86 113 6 12 0.93 8 1 27 Fine 13 99.9 0.07 103 84 108 19 19 0.46 15 10 36 Qhfy Coarse 1 104 - 104 104 104 3 15 0.77 9 8 29 Fine 11 99.6 0.07 99 88 107 7 16 0.28 14 12 26 Qhly Coarse 3 93.4 0.19 87 80 113 4 16 0.66 13 7 30 Fine 3 102.2 0.11 97 95 115 11 28 0.74 21 10 68 Qhty Coarse 0 - - - - - 1 9 - - - - Fine 3 100.3 0.07 101 93 107 6 10 0.59 7 5 20 Qhfe Coarse 0 - - - - - 2 5 0.25 5 4 6 Fine 174 102.6 0.08 103 76 124 357 17 0.66 14 2 97 Qhf Coarse 64 106.3 0.14 106 22 132 175 18 0.65 15 1 63 Fine 56 98.3 0.09 96 75 116 89 19 0.54 16 4 51 Qhff Coarse 5 105.3 0.06 107 96 111 10 15 0.69 12 1 33 Fine 4 101.5 0.09 102 90 112 7 18 0.44 16 9 29 Qhl Coarse 0 - - - - - 3 21 0.68 24 5 33 Fine 19 106 0.07 106 94 112 26 21 0.80 20 3 73 Qf Coarse 0 - - - - - 5 23 0.53 20 14 45 Fine 88 107.6 0.11 108 85 195 119 24 0.71 19 3 >99 Qpf
(4) Coarse 37 115.7 0.09 114 99 140 73 31 0.69 26 7 90 Notes: (1) See Table 1.3 for names of the units listed here. (2) Fine soils (silt and clay) contain a greater percentage passing the #200 sieve (<0.074 mm); coarse soils (sand and
gravel) contain a greater percentage not passing the #200 sieve. (3) CV = coefficient of variation (the standard deviation divided by the mean). (4) Qpf is interpreted in the subsurface only; it is not mapped at the surface by Knudsen and other, (2000a).
Table 1.2. Summary of Geotechnical Characteristics for Quaternary Map Units in the Milpitas Quadrangle.
CALIFORNIA GEOLOGICAL SURVEY SHZR 051 12
Geologic Unit (1)
Description
Total Layer
Thickness (ft)
Hist.Liq.(2)
Composition by Soil Type
(Unified Soil Classification System)
Depth to ground water (ft) and liquefaction susceptibility
category assigned to geologic unit (3)
<10 10 to 30 30 to 40 >40
af Artificial fill (4) 282 1 CL 56%; CH 8% Other 36%
VH - L H - L M - L VL
afbm Artificial fill over Bay Mud 0 2 - VH H M VL
alf Artificial fill, levee 0 1 - VH-L H-L M-L VL
ac Artificial stream channel 1 0 GC 100% VH-L H M VL
Qhc Modern stream channel deposits 0 2 - VH H M VL
Qhfy Latest Holocene alluvial fan deposits 149 3
CL 75%; CH 9%; ML 8%; SC 8% VH H M VL
Qhly Latest Holocene alluvial fan levee deposits 79 2 CL 41%; CH 27%;
SC 17%; GP 8%; ML 7% VH H M VL
Qhty Latest Holocene stream terrace deposits 50 0 CL 71%; ML 16% CH 11%;
Other 2% VH H M VL
Qhb Holocene Basin Deposits 2 0 CL 100% M M L VL
Qhfe Holocene fine grained alluvial fan-estuarine complex deposits 37 1 CL 52%; CH 37%;
SM-SP 11% H M L VL
Qhf Holocene alluvial fan deposits 2785 2 CL 53%; SC 11%; SM 10% ML 10%; Other 16% H M L VL
Qhff Holocene alluvial fan deposits, fine grained facies 541 4 CL 66%; CH 22%
Other 12% M M L VL
Qhl Holocene alluvial fan levee deposits 34 0 ML 45%; CL 26%
SW 15%; Other 14% H M L VL
Qf Late Pleistocene to Holocene alluvial fan deposits 271 0 CL 76%; ML 8%; Other
16% M L L VL
Qpf (5) Late Pleistocene alluvial fan deposits 2090 0
CL 54%; SM 13%; ML 7%; SP 7%; Other 19% L L VL VL
Qpa Latest Pleistocene alluvium, undifferentiated 0 0 - L L VL VL
B Bedrock n/a n/a n/a (6) VL VL VL VL Notes: (1) Susceptibility assignments are specific to the materials within the Milpitas 7.5-Minute Quadrangle. (2) Number of recorded sites with historical ground failures related to liquefaction in the Milpitas 7.5-Minute
Quadrangle within each map unit. See Plate 1.2 for type and location of historical ground failure effects. (3) Based on the Simplified Seed Procedure (Seed and Idriss, 1971; Youd and Idriss, 1997) and a small number of
borehole analyses for some units. (4) The liquefaction susceptibility of artificial fill ranges widely, depending largely on the nature of the fill, its age,
and whether it was compacted during emplacement. (5) Qpf interpreted in the subsurface only; Qpf is not mapped at the surface Knudsen and others (2000a). (6) n/a = not applicable
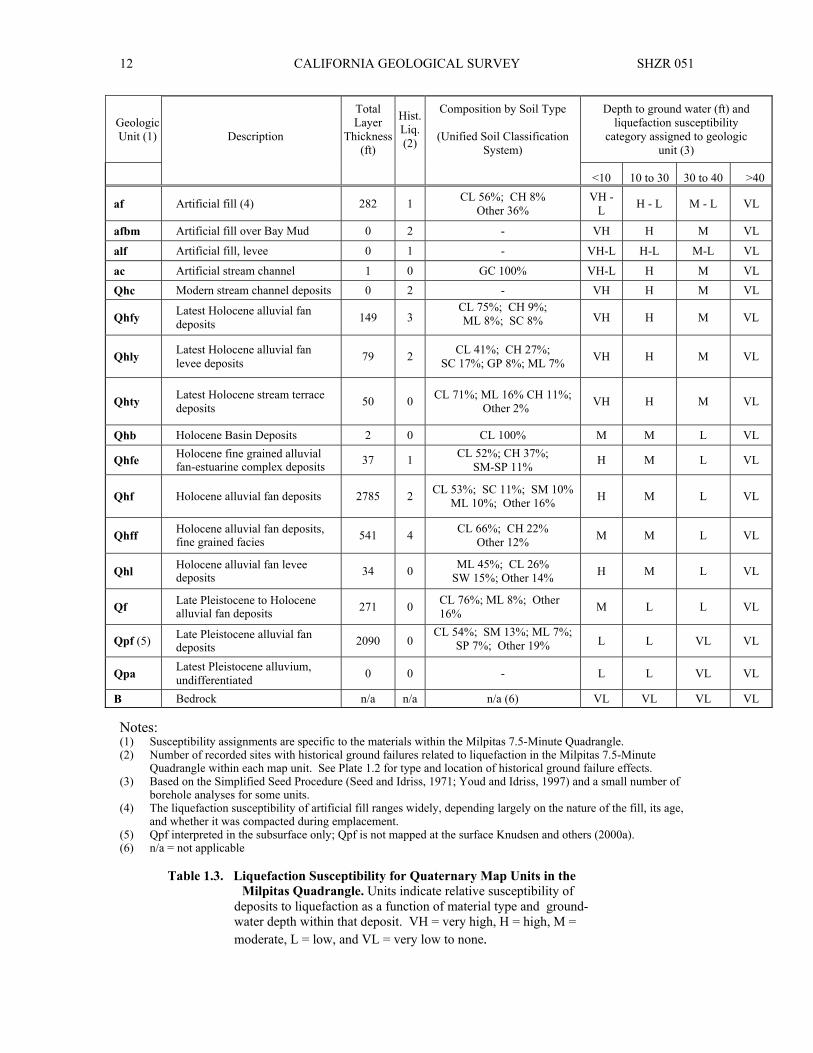
Table 1.3. Liquefaction Susceptibility for Quaternary Map Units in the Milpitas Quadrangle. Units indicate relative susceptibility of
deposits to liquefaction as a function of material type and ground- water depth within that deposit. VH = very high, H = high, M = moderate, L = low, and VL = very low to none.

2004 SEISMIC HAZARD ZONE REPORT FOR THE MILPITAS QUADRANGLE 13
GROUND WATER
Liquefaction hazard may exist in areas where depth to ground water is 40 feet or less. CGS uses the highest known ground-water levels because water levels during an earthquake cannot be anticipated because of the unpredictable fluctuations caused by natural processes and human activities. (A historical-high ground-water map differs from most ground-water maps, which show the actual water table at a particular time. Plate 1.2 depicts a hypothetical ground-water table within alluviated areas.)
Ground-water conditions were investigated in the Milpitas Quadrangle to evaluate the depth to saturated materials. Saturated conditions reduce the effective normal stress, thereby increasing the likelihood of earthquake-induced liquefaction (Youd, 1973). The evaluation was based on first-encountered water noted in geotechnical borehole logs acquired from the cities of San Jose, Milpitas, Fremont and Santa Clara, as well as water-level data provided by the Santa Clara Valley Water District and for Alameda County by the Regional Water Quality Control Board. The depths to first-encountered unconfined ground water were plotted onto a map of the project area and contoured to constrain the estimate of historically shallowest ground water (Plate 1.2). Depth to water surface in stream channels, creeks, and drainage ditches was observed in the field. Water depths from boreholes known to penetrate confined aquifers were not utilized.
The Santa Clara Valley Water District recently has observed an increasing number of artesian wells, which reflects rising ground-water levels (Seena Hoose, SCVWD, oral communication, 2000). Regional ground-water contours on Plate 1.2 show historical-high water depths, as interpreted from borehole logs from 1953 through the 1990s.
Depths to first-encountered water in the Milpitas Quadrangle range from 2.5 to 45 feet below the ground surface. Most of the study area has ground-water levels within 10 feet of the ground surface (Plate 1.2). San Francisco Bay, in the northwestern part of the study area, influences the ground-water levels for most of the quadrangle. Ground-water levels gradually deepen towards the east and southeast, away from the Bay. Ground-water levels are deepest in the northeastern portion of the study area, near the base of the foothills.
PART II
LIQUEFACTION HAZARD POTENTIAL
Liquefaction may occur in water-saturated sediment during moderate to great earthquakes. Liquefied sediment loses strength and may fail, causing damage to buildings, bridges, and other structures. Many methods for mapping liquefaction hazard have been proposed. Youd (1991) highlights the principal developments and notes some

CALIFORNIA GEOLOGICAL SURVEY SHZR 051 14
of the widely used criteria. Youd and Perkins (1978) demonstrate the use of geologic criteria as a qualitative characterization of liquefaction susceptibility and introduce the mapping technique of combining a liquefaction susceptibility map and a liquefaction opportunity map to produce a liquefaction potential map. Liquefaction susceptibility is a function of the capacity of sediment to resist liquefaction. Liquefaction opportunity is a function of the potential seismic ground shaking intensity.
The method applied in this study for evaluating liquefaction potential is similar to that of Tinsley and others (1985). Tinsley and others (1985) applied a combination of the techniques used by Seed and others (1983) and Youd and Perkins (1978) for their mapping of liquefaction hazards in the Los Angeles region. CGS’s method combines geotechnical analyses, geologic and hydrologic mapping, and probabilistic earthquake shaking estimates, but follows criteria adopted by the SMGB (DOC, 2000).
LIQUEFACTION SUSCEPTIBILITY
Liquefaction susceptibility reflects the relative resistance of a soil to loss of strength when subjected to ground shaking. Physical properties of soil such as sediment grain-size distribution, compaction, cementation, saturation, and depth govern the degree of resistance to liquefaction. Some of these properties can be correlated to a sediment’s geologic age and environment of deposition. With increasing age, relative density may increase through cementation of the particles or compaction caused by the weight of the overlying sediment. Grain-size characteristics of a soil also influence susceptibility to liquefaction. Sand is more susceptible than silt or gravel, although silt of low plasticity is treated as liquefiable in this investigation. Cohesive soils generally are not considered susceptible to liquefaction. Such soils may be vulnerable to strength loss with remolding and represent a hazard that is not addressed in this investigation. Soil characteristics and processes that result in higher measured penetration resistances generally indicate lower liquefaction susceptibility. Thus, blow count and cone penetrometer values are useful indicators of liquefaction susceptibility.
Saturation is required for liquefaction, and the liquefaction susceptibility of a soil varies with the depth to ground water. Very shallow ground water increases the susceptibility to liquefaction (soil is more likely to liquefy). Soils that lack resistance (susceptible soils) typically are saturated, loose and sandy. Soils resistant to liquefaction include all soil types that are dry, cohesive, or sufficiently dense. CGS’s map inventory of areas containing soils susceptible to liquefaction begins with evaluation of geologic maps and historical occurrences, cross-sections, geotechnical test data, geomorphology, and ground-water hydrology. Soil properties and soil conditions such as type, age, texture, color, and consistency, along with historical depths to ground water are used to identify, characterize, and correlate susceptible soils. Because Quaternary geologic mapping is based on similar soil observations, liquefaction susceptibility maps typically are similar to Quaternary geologic maps. CGS’s qualitative relations between susceptibility, geologic map unit and depth to ground water are summarized in Table 1.3.

2004 SEISMIC HAZARD ZONE REPORT FOR THE MILPITAS QUADRANGLE 15
Most Holocene materials within the quadrangle, where water levels are within 30 feet of the ground surface, have been given susceptibility assignments of high (H) to very high (VH) (Table 1.3). This differs from Geomatrix’s (1992a) susceptibility assignments. Geomatrix (1992a) mapped Holocene alluvial fan deposits having water table depths within 30 feet of the ground surface as having low susceptibility. This difference in susceptibility mapping is evident in dissimilar zone lines in the southeastern corner of the quadrangle. Holocene basin-estuarine complex deposits (Qhfe), undifferentiated Holocene alluvium (Qha) and Holocene alluvial fan fine facies deposits (Qhff) primarily are composed of fine-grained material in this area and have correspondingly lower susceptibility assignments. Undifferentiated latest Pleistocene alluvium (Qpa) in the upland valley within the foothills has been given a low (L) susceptibility assignment.
LIQUEFACTION OPPORTUNITY
Liquefaction opportunity is a measure, expressed in probabilistic terms, of the potential for strong ground shaking. Analyses of in-situ liquefaction resistance require assessment of liquefaction opportunity. The minimum level of seismic excitation to be used for such purposes is the level of peak ground acceleration (PGA) with a 10 percent probability of exceedance over a 50-year period (DOC, 2000). The earthquake magnitude used in CGS’s analysis is the magnitude that contributes most to the calculated PGA for an area.
For the Milpitas Quadrangle, PGA’s of 0.54 g to 0.80 g, resulting from earthquakes of moment magnitude 6.4 to 7.9, were used for liquefaction analyses. The PGA and magnitude values were based on de-aggregation of the probabilistic hazard at the 10 percent in 50-year hazard level (Petersen and others, 1996). See the ground motion portion (Section 3) of this report for further details.
Quantitative Liquefaction Analysis
CGS performs quantitative analysis of geotechnical data to evaluate liquefaction potential using the Seed-Idriss Simplified Procedure (Seed and Idriss, 1971; Seed and others, 1983; National Research Council, 1985; Seed and others, 1985; Seed and Harder, 1990; Youd and Idriss, 1997; Youd and others, 2001). Using the Seed-Idriss Simplified Procedure one can calculate soil resistance to liquefaction, expressed in terms of cyclic resistance ratio (CRR), based on SPT results, ground-water level, soil density, moisture content, soil type, and sample depth. CRR values are then compared to calculated earthquake-generated shear stresses expressed in terms of cyclic stress ratio (CSR). The Seed-Idriss Simplified Procedure requires normalizing earthquake loading relative to a M7.5 event for the liquefaction analysis. To accomplish this, CGS’s analysis uses the Idriss magnitude-scaling factor (MSF) (Youd and Idriss, 1997). It is convenient to think in terms of a factor of safety (FS) relative to liquefaction, where: FS = (CRR / CSR) * MSF. FS, therefore, is a quantitative measure of liquefaction potential. CGS uses a factor of safety of 1.0 or less, where CSR equals or exceeds CRR, to indicate the presence of potentially liquefiable soil. While an FS of 1.0 is considered the “trigger” for liquefaction, for a site-specific analysis an FS of as much as 1.5 may be appropriate depending on the vulnerability of the site and related structures.

CALIFORNIA GEOLOGICAL SURVEY SHZR 051 16
The CGS liquefaction analysis program calculates an FS for each geotechnical sample where blow counts were collected. Typically, multiple samples are collected for each borehole. The program then independently calculates an FS for each non-clay layer that includes at least one penetration test using the minimum (N1)60 value for that layer. The minimum FS value of the layers penetrated by the borehole is used to determine the liquefaction potential for each borehole location. The reliability of FS values varies according to the quality of the geotechnical data. FS, as well as other considerations such as slope, presence of free faces, and thickness and depth of potentially liquefiable soil, are evaluated in order to construct liquefaction potential maps, which are then used to make a map showing zones of required investigation.
Of the 170 geotechnical borehole logs analyzed in this study (Plate 1.2), 153 include blow-count data from SPT’s or from penetration tests that allow reasonable blow count translations to SPT-equivalent values. Non-SPT values, such as those resulting from the use of 2-inch or 2 ½-inch inside-diameter ring samplers, were translated to SPT-equivalent values if reasonable factors could be used in conversion calculations. The reliability of the SPT-equivalent values varies. Therefore, they are weighted and used in a more qualitative manner. Few borehole logs, however, include all the information (e.g. soil density, moisture content, sieve analysis, etc.) required for an ideal Simplified Seed Procedure. For boreholes having acceptable penetration tests, liquefaction analysis is performed using recorded density, moisture, and sieve test values or using average test values of similar materials.
The Seed-Idriss Simplified Procedure for liquefaction evaluation was developed primarily for clean sand and silty sand. As described above, results depend greatly on accurate evaluation of in-situ soil density as measured by the number of soil penetration blow counts (N) using an SPT sampler. However, many of the Holocene alluvial deposits in the study area contain significant gravel content. In the past, gravelly soils were considered not to be susceptible to liquefaction because the high permeability of these soils would allow the dissipation of pore pressures before liquefaction could occur. However, liquefaction in gravelly soils has been observed during earthquakes and recent laboratory studies have shown that some gravelly soils are susceptible to liquefaction (Ishihara, 1985; Harder and Seed, 1986; Budiman and Mohammadi, 1995; Evans and Zhou, 1995; and Sy and others, 1995). SPT-derived density measurements in gravelly soils are unreliable and generally too high. These tests are likely to lead to overestimation of the density of the soil and, therefore, result in an underestimation of the liquefaction susceptibility. To identify potentially liquefiable units where the N values appear to have been affected by gravel content, correlations were made with boreholes in the same unit where the N values do not appear to have been affected by gravel content.
LIQUEFACTION ZONES
Criteria for Zoning
Areas underlain by materials susceptible to liquefaction during an earthquake were included in liquefaction zones using criteria developed by the Seismic Hazards Mapping
2004 SEISMIC HAZARD ZONE REPORT FOR THE MILPITAS QUADRANGLE 17
Act Advisory Committee and adopted by the California State Mining and Geology Board (DOC, 2000). Under those guideline criteria, liquefaction zones are areas meeting one or more of the following:
1. Areas known to have experienced liquefaction during historical earthquakes
2. All areas of uncompacted artificial fill containing liquefaction-susceptible material that are saturated, nearly saturated, or may be expected to become saturated
3. Areas where sufficient existing geotechnical data and analyses indicate that the soils are potentially liquefiable
4. Areas where existing geotechnical data are insufficient
In areas of limited or no geotechnical data, susceptibility zones may be identified by geologic criteria as follows:
a) Areas containing soil deposits of late Holocene age (current river channels and their historic floodplains, marshes and estuaries), where the M7.5-weighted peak acceleration that has a 10 percent probability of being exceeded in 50 years is greater than or equal to 0.10 g and the water table is less than 40 feet below the ground surface; or
b) Areas containing soil deposits of Holocene age (less than 11,000 years), where the M7.5-weighted peak acceleration that has a 10 percent probability of being exceeded in 50 years is greater than or equal to 0.20 g and the historical high water table is less than or equal to 30 feet below the ground surface; or
c) Areas containing soil deposits of latest Pleistocene age (11,000 to 15,000 years), where the M7.5-weighted peak acceleration that has a 10 percent probability of being exceeded in 50 years is greater than or equal to 0.30 g and the historical high water table is less than or equal to 20 feet below the ground surface.
Application of SMGB criteria to liquefaction zoning in the Milpitas Quadrangle is summarized below.
Areas of Past Liquefaction
Tinsley and others (1998) compiled observations of evidence for liquefaction caused by the 1989 Loma Prieta earthquake and Youd and Hoose (1978) compiled them for the 1868 Hayward and 1906 San Andreas earthquakes. Knudsen and others (2000a) have developed a digital compilation of these two previous sources. This digital database differs from earlier compilation efforts in that the observations are plotted on a 1:24,000 scale base map versus the smaller scale base maps used in the earlier publications. Site locations were reevaluated and single sites were sometimes broken into two or more where the greater base map detail allowed. These sites of past liquefaction-related ground failure are shown on Plate 1.2. The Milpitas Quadrangle contains an abundance of recorded historical ground failures resulting from liquefaction.

CALIFORNIA GEOLOGICAL SURVEY SHZR 051 18
Historical liquefaction events within the study area are concentrated within three specific areas: 1) adjacent to the Guadalupe River; 2) adjacent to Coyote Creek; and 3) east of Coyote Creek along the east side of the Milpitas Quadrangle. In the vicinity of the Guadalupe River and Coyote Creek, ground failures caused by liquefaction have occurred where the following geologic map units are mapped: artificial fill (af), artificial fill over Bay Mud (afbm), artificial levee fill (alf), modern stream channel deposits (Qhc), latest Holocene alluvial fan deposits (Qhfy), latest Holocene alluvial fan levee deposits (Qhly), Holocene fine grained alluvial fan-estuarine complex deposits (Qhfe), Holocene alluvial fan deposits (Qhf) and Holocene alluvial fan deposits, fine-grained facies (Qhff) (Table 1.3). In the area on the east side of the quadrangle, ground failures caused by liquefaction are recognized in Holocene alluvial fan deposits (Qhf) and Holocene alluvial fan deposits, fine-grained facies (Qhff) (Table 1.3). All historical liquefaction events within the Milpitas Quadrangle occurred in young, saturated, and poorly consolidated sediments.
Near the Guadalupe River, Youd and Hoose (1978) recorded historical ground failures due to liquefaction caused by the 1906 earthquake. Near Alviso, trees sliding away from the rest of an orchard and into the slough, ground fractures with muddy and/or sandy water flowing out of them, and disturbances of a railroad bed indicate ground failure characterized by lateral spread, sand boils, and settlement, respectively. Reports of disturbed wells, in some cases with free-flowing water also are recorded. Within the city of Alviso, reports of a hotel sinking “at least 10 feet” indicate ground failure characterized by settlement. Tinsley and others (1998) collected reports of liquefaction along the Guadalupe River associated with the 1989 Loma Prieta earthquake. During the 1989 Loma Prieta earthquake, settlement occurred near the Gold Street Bridge in Alviso and one kilometer north of the San Jose Municipal Airport along the east bank of the Guadalupe River.
In the vicinity of Coyote Creek, Youd and Hoose (1978) record a total of nine instances of ground failure attributed to liquefaction. Reports of two instances associated with the 1868 earthquake include water pouring out of ground fractures, failures along the banks of Coyote Creek, and a rise in the level of water within Coyote Creek. Damage similar to that induced by the 1868 earthquake was recorded during the 1906 earthquake as well. Also in the vicinity of Coyote Creek, structural damage to bridge foundations and houses, and subsidence of roads indicate ground failure caused by lateral spreading and/or ground settlement. The absence of damage or ground failures associated with the 1989 Loma Prieta earthquake was recorded in the vicinity of Coyote Creek, north of the Highway 237 bridge (Tinsley and others, 1998).
On the eastern side of the Milpitas Quadrangle, Youd and Hoose (1978) recorded four cases of historical liquefaction in Santa Clara County. Two instances associated with the 1868 earthquake include reports of water pouring out of ground fractures and sand boils near the City of Milpitas (sites 151 and 153). Several occurrences of liquefaction during the 1906 earthquake include slumping and small ground fractures associated with lateral spreading in the vicinity of the city of Milpitas (sites 151 and 152).

2004 SEISMIC HAZARD ZONE REPORT FOR THE MILPITAS QUADRANGLE 19
In Alameda County, possibly one case of historical ground failure has been recorded for the 1906 earthquake (Youd and Hoose, 1978) within the Milpitas 7.5-Minute Quadrangle. The description in Youd and Hoose (1978) for this site (162) implies that the location is poorly constrained and is described as occurring somewhere between Niles and San Jose along the Southern Pacific railroad. Knudsen and others (2000a) have designated the location of this ground failure occurrence to be indefinite or approximate. A horizontal movement of 3 feet and vertical movement of 6 inches were reported.
Each of the above-described locations of past liquefaction-related ground failure are included within the liquefaction zone of required investigation.
Artificial Fills
In the Milpitas Quadrangle, areas of artificial fill large enough to show at the scale of mapping consist of presumably engineered fill for some river levees and elevated freeways, as well as possibly non-engineered fill along the margin of San Francisco Bay. Engineered fills emplaced since 1965 tend to be better engineered and compacted, so zoning for liquefaction in such areas depends on soil conditions in underlying strata. Non-engineered fills are commonly loose, uncompacted fills of varying sizes and types of material. Large deposits of likely non-engineered fill exist within and along the margin of San Francisco Bay and in the area occupied by the former city of Alviso. These areas have been included within the liquefaction zone of required investigation.
Areas with Sufficient Existing Geotechnical Data
Borehole logs that include penetration test data and reasonably sufficient lithologic descriptions were used to evaluate liquefaction potential. These areas with sufficient geotechnical data are evaluated for zoning based on the liquefaction potential calculated using the Simplified Seed Procedure (Seed and Idriss, 1971; Seed and others, 1983; National Research Council, 1985; Seed and others, 1985; Seed and Harder, 1990; Youd and Idriss, 1997; Youd and others, 2001). For Holocene alluvial deposits that cover much of the Milpitas Quadrangle, most of the borehole logs that were analyzed using the Simplified Seed Procedure contain sediment layers that may liquefy under the expected earthquake loading (see Section 3 for description of ground motions). Table 1.2 shows that only about 25 percent of all deposits are coarser than silt, and thus potentially susceptible to liquefaction. However, many boreholes contain either some sandy or silty material that may liquefy under the predicted earthquake shaking. These areas containing saturated potentially liquefiable material are included in the zone of required investigation.
Along the base of the foothills in the eastern section of the Milpitas Quadrangle, the liquefaction zone boundary is in part delineated by the depth to denser material, primarily late Pleistocene alluvial fan deposits (Qpf), and the depth to ground water. Where lower density, younger material is above the historically highest ground-water levels (i.e. unsaturated) and only denser Pleistocene material is saturated, these areas are excluded from the zone.

CALIFORNIA GEOLOGICAL SURVEY SHZR 051 20
The areas of the Milpitas Quadrangle mapped as latest Holocene alluvial fan deposits (Qhfy), latest Holocene stream terrace deposits (Qhty), Holocene alluvial fan deposits (Qhf), and Holocene alluvial fan deposits, fine-grained facies (Qhff) are included in the zone of required investigation where they are saturated above 40 feet. These map units have a relatively small percentage of sandy and/or gravelly deposits; however, they do contain layers of fine sand and silt, are young and loosely consolidated, and in many places have experienced historical liquefaction. In a fluvial environment, potentially liquefiable layers commonly are discontinuous and lens-shaped deposits, which may not have been sampled by the geotechnical investigations that were compiled in our regional analysis.
Areas with Insufficient Existing Geotechnical Data
Adequate geotechnical borehole information for Quaternary geologic units including artificial fill over Bay Mud (afbm), modern stream channel deposits (Qhc), and Holocene San Francisco Bay Mud (Qhbm) is generally lacking. Soil characteristics for these units are assumed to correspond to similar deposits where subsurface information is available. Because these deposits are typically young, loose and saturated, they are included in the liquefaction zone of required investigation. Conversely, undifferentiated latest Pleistocene alluvium (Qpa) in an upland valley on the east side of the Milpitas Quadrangle is not included in the liquefaction zone for reasons presented in criterion 4-c, above. Also latest Pleistocene to Holocene alluvium (Qa) in an upland valley just east of the Hayward Fault, in the northern part of the quadrangle, is not included in the zone for similar reasons. Geologic interpretation of a geotechnical borehole in similar deposits in the adjacent Niles Quadrangle, suggests that these deposits are probably late Pleistocene in age and probably unlikely to liquefy.
ACKNOWLEDGMENTS
The authors would like to thank Mike Shimamoto, City of San Jose, and Roger Pierno, Seena Hoose and Richard Volpe, Santa Clara Valley Water District, and staff in the building, engineering, and planning departments of the cities of Milpitas and Fremont for access to files and discussions of local geology. At the U.S. Geological Survey we would like to thank Carl Wentworth, Tom Holzer and Michael Bennett for geologic information. Thanks to Chris Hitchcock for providing additional environmental reports that he had collected from the Alameda County Water District. At CGS, special thanks to Teri McGuire, Bob Moskovitz, Barbara Wanish and Marvin Woods for their GIS operations support and Keith Knudsen, Mark DeLisle, Ralph Loyd and Al Barrows for technical and editorial review.

2004 SEISMIC HAZARD ZONE REPORT FOR THE MILPITAS QUADRANGLE 21
REFERENCES
Atwater, B.F., Hedel, C.W. and Helley, E.J., 1976, Late Quaternary depositional history, Holocene sea-level changes, and vertical crustal movement, southern San Francisco Bay, California: U.S. Geological Survey Professional Paper 1014, 15 p.
American Society for Testing and Materials, 1999, Standard test method for penetration test and split-barrel sampling of soils, Test Method D1586-99, in Annual Book of ASTM Standards, v. 4.08.
Brown, W.M., III and Jackson, L.E., Jr., 1973, Erosional and depositional provinces and sediment transport in the south and central part of the San Francisco Bay region, California: U.S. Geological Survey Miscellaneous Field Studies Map MF-515, scale 1:125,000.
Budiman, J.S. and Mohammadi, J., 1995, Effect of large inclusions on liquefaction of sands, in Evans, M.D. and Fragaszy, R.J., editors, Static and Dynamic properties of Gravelly Soils: American Society of Civil Engineers Geotechnical Special Publication no. 56, p. 48-63.
California Department of Conservation, Division of Mines and Geology, 1997, Guidelines for evaluating and mitigating seismic hazards in California: California Division of Mines and Geology Special Publication 117, 74 p.
California Department of Conservation, Division of Mines and Geology, 2000, Recommended criteria for delineating seismic hazard zones in California: California Division of Mines and Geology Special Publication 118, 12 p.
California Department of Water Resources, 1967, Evaluation of ground water resources, South Bay, Appendix A, Geology: California Department of Water Resources Bulletin no. 118-1, 153 p.
Cooper-Clark & Associates, 1974, Technical report, geotechnical investigation, City of San Jose's sphere of influence: Report submitted to City of San Jose Department of Public Works, 185 p., 26 plates, scale 1:48,000.
Crittenden, M.D. Jr., 1951, Geology of the San Jose-Mount Hamilton area, California: California Division of Mines and Geology Bulletin 157, 67 p.
Evans, M.D. and Zhou, S., 1995, Liquefaction behaviour of sand-gravel composites: American Society of Civil Engineers, Journal of Geotechnical Engineering, v. 121, no. 3, p. 287-298.
Falls, J.N., 1988, The development of a liquefaction hazard map for the city of San Jose, California: Master of Science thesis, San Jose State University, 188 p., scale 1:36,000.
CALIFORNIA GEOLOGICAL SURVEY SHZR 051 22
Geomatrix Consultants, Inc., 1992a, Evaluation of liquefaction potential in San Jose, California: U.S. Geological Survey, National Earthquake Hazards Reduction Program, final technical report, award no. 14-08-0001-G1359, 65 p.
Geomatrix Consultants, Inc., 1992b, Assessment of non-liquefaction along Coyote Creek during the 1989 Loma Prieta Earthquake, San Jose, California: U.S. Geological Survey, National Earthquake Hazards Reduction Program, final technical report, award no. 14-08-0001-G1859, 18 p.
Harder, L.F. and Seed, H.B., 1986, Determination of penetration resistance for coarse-grained soils using the Becker hammer drill: University of California at Berkeley, College of Engineering, Earthquake Engineering Research Center, report no. UCB/EERC-86/06, 126 p.
Helley, E.J., 1990, Preliminary contour map showing elevation of surface of Pleistocene alluvium under Santa Clara Valley, California: U.S. Geological Survey Open-File Report 90-633, scale 1:24,000.
Helley, E.J. and Brabb, E.E., 1971, Geologic map of late Cenozoic deposits, Santa Clara County, California: U.S. Geological Survey Miscellaneous Field Studies Map MF-335, scale 1:62,500.
Helley, E.J., Graymer, R.W., Phelps, G.A., Showalter, P.K. and Wentworth, C.M., 1994, Preliminary Quaternary geologic maps of Santa Clara Valley, Santa Clara, Alameda, and San Mateo Counties, California, a digital database: U.S. Geological Survey Open-File Report 94-231, 8 p., scale 1:24,000.
Helley, E.J., LaJoie, K.R., Spangle, W.E. and Blair, M.L., 1979, Flatland deposits of the San Francisco Bay region, California—their geology and engineering properties, and their importance to comprehensive planning: U.S. Geological Survey Professional Paper 943, scale 1:125,000.
Helley, E.J., and Wesling, J.R., 1989, Quaternary Geologic Map of the Milpitas Quadrangle, Alameda and Santa Clara Counties, California: U.S. Geological Survey Open File Report 89-671, scale 1:24:000.
Ishihara, K., 1985, Stability of natural deposits during earthquakes, in Proceedings of the Eleventh International Conference on Soil Mechanics and Foundation Engineering, San Francisco, v. 1, p. 321-376.
Iwamura, T.I., 1995, Hydrology of the Santa Clara and Coyote Valleys groundwater basins, California, in Sangines, E.M., Andersen, D.W., and Buising, A.B., editors, Recent geologic studies in the San Francisco Bay Area: Pacific Section S.E.P.M., v. 76, p. 173-192.
Keefer, D.K., Wilson, R.C. and Tannaci, N.E., 1980, Reconnaissance report on ground failures and ground cracks resulting from the Coyote Lake, California, earthquake of August 6, 1979: U.S. Geological Survey Open-File Report 80-139, 14 p.

2004 SEISMIC HAZARD ZONE REPORT FOR THE MILPITAS QUADRANGLE 23
Knudsen, K.L., Sowers, J.M., Witter, R.C., Wentworth, C.M., Helley, E.J., Nicholson, R.S., Wright, H.M. and Brown, K.H., 2000a, Preliminary maps of Quaternary deposits and liquefaction susceptibility, nine-county San Francisco Bay region, California; a digital database: U.S. Geological Survey Open-File Report 00-444.
Knudsen, K.L., DeLisle, M.J., Clahan, K.B., Mattison, E., Perkins, J.B. and Wentworth, C.M., 2000b, Applicability of Quaternary geologic mapping in assessing earthquake-induced liquefaction hazard: San Francisco Bay Area: Earthquake Engineering Research Institute, Proceedings of the Sixth International Conference on Seismic Zonation (6ICSZ), November 12-15, Palm Springs, California, CD-ROM, 6 p.
Lawson, A.C., chairman, 1908, The California earthquake of April 18, 1906; Report of the State Earthquake Investigation Commission: Carnegie Institute Washington Publication 87, v. 1, 451 p. (Reprinted, 1969).
National Research Council, 1985, Liquefaction of soils during earthquakes: National Research Council Special Publication, Committee on Earthquake Engineering, National Academy Press, Washington, D.C., 240 p.
Nilsen, T.H. and Brabb, E.E., 1972, Preliminary photointerpretation and damage maps of landslide and other surficial deposits in northeastern San Jose, Santa Clara County, California: U.S. Geological Survey Miscellaneous Field Studies Map MF-361, scale 1:24,000.
Petersen, M.D., Bryant, W.A., Cramer, C.H., Cao. T., Reichle, M.S., Frankel, A.D., Lienkaemper, J.J., McCrory, P.A. and Schwartz, D.P., 1996, Probabilistic seismic hazard assessment for the State of California: California Department of Conservation, Division of Mines and Geology, Open-File Report 96-08; U.S. Geological Survey Open-File Report 96-706, 33 p.
Poland, J.F., 1971, Land subsidence in the Santa Clara Valley, Alameda, San Mateo, and Santa Clara counties, California: U.S. Geological Survey Miscellaneous Field Studies Map MF-336, scale 1:125,000.
Rogers, T.H. and Williams, J.W., 1974, Potential seismic hazards in Santa Clara County, California: California Division of Mines and Geology Special Report 107, scale 1:62,500.
Seed, H.B. and Idriss, I.M., 1971, Simplified procedure for evaluating soil liquefaction potential: Journal of the Soil Mechanics and Foundations Division of ASCE, v. 97: SM9, p. 1,249-1,273.
Seed, H.B. and Idriss, I.M., 1982, Ground motions and soil liquefaction during earthquakes: Monograph Series, Earthquake Engineering Research Institute, Berkeley, California, 134 p.

CALIFORNIA GEOLOGICAL SURVEY SHZR 051 24
Seed, H.B., Idriss, I.M. and Arango, I., 1983, Evaluation of liquefaction potential using field performance data: Journal of Geotechnical Engineering, v. 109, no. 3, p. 458-482.
Seed, H.B., Tokimatsu, K., Harder, L.F., and Chung, R.M., 1985, Influence of SPT procedures in soil liquefaction resistance evaluations: Journal of Geotechnical Engineering, ASCE, v. 111, no. 12, p. 1,425-1,445.
Seed, R.B. and Harder, L.F., 1990, SPT-based analysis of cyclic pore pressure generation and undrained residual strength: Proceedings of the H. Bolton Seed Memorial Symposium, v. 2, p. 351-376.
Smith, T.C., 1996, Preliminary maps of seismic hazard zones and draft guidelines for evaluating and mitigating seismic hazards: California Geology, v. 49, no. 6, p. 147-150.
Sy, A., Campanella, R.G. and Stewart, R.A., 1995, BPT-SPT correlations for evaluations of liquefaction resistance in gravelly soils, in Evans, M.D. and Fragaszy, R.J., editors, Static and Dynamic Properties of Gravelly Soils: American Society of Civil Engineers Geotechnical Special Publication no. 56, p. 1-19.
Tinsley, J.C., III, Egan, J.A., Kayen, R.E., Bennett, M.J., Kropp, A. and Holzer, T.L., 1998, Appendix: maps and descriptions of liquefaction and associated effects, in Holzer, T.L, editor, The Loma Prieta, California, earthquake of October 17, 1989: liquefaction, strong ground motion and ground failure: U.S. Geological Survey Professional Paper 1551-B, p. B287-314, scale 1:100,000.
Tinsley, J.C., Youd, T.L., Perkins, D.M. and Chen, A.T.F., 1985, Evaluating liquefaction potential, in Ziony, J.I., editor, Evaluating earthquake hazards in the Los Angeles region — An earth science perspective: U.S. Geological Survey Professional Paper 1360, p. 263-316.
Wentworth, C.M., Blake, M.C. Jr., McLaughlin, R.J. and Graymer, R.W., 1999, Preliminary geologic map of the San Jose 30 X 60-Minute Quadrangle, California: a digital database, U.S. Geological Survey Open-File Report 98-795, 14 p., scale 1:24,000.
Youd, T.L., 1973, Liquefaction, flow and associated ground failure: U.S. Geological Survey Circular 688, 12 p.
Youd, T.L., 1991, Mapping of earthquake-induced liquefaction for seismic zonation: Earthquake Engineering Research Institute, Proceedings, Fourth International Conference on Seismic Zonation, v. 1, p. 111-138.
Youd, T.L. and Hoose, S.N., 1978, Historic ground failures in northern California triggered by earthquakes: U.S. Geological Survey Professional Paper 993, scales 1:250,000 and 1:24,000.

2004 SEISMIC HAZARD ZONE REPORT FOR THE MILPITAS QUADRANGLE 25
Youd, T.L. and Idriss, I.M., 1997, editors, Proceedings of the NCEER workshop on evaluation of liquefaction resistance of soils: National Center for Earthquake Engineering Research Technical Report NCEER-97-0022, 276 p.
Youd, T.L. and Perkins, D.M., 1978, Mapping liquefaction-induced ground failure potential: Journal of Geotechnical Engineering, v. 104, p. 433-446.
Youd, T.L., Idriss, I.M., Andrus, R.D., Arango, I., Castro, G., Christian, J.T., Dobry, R., Finn, W.D.L., Harder, L.F. Jr., Hynes, M.E., Ishihara, K., Koester, J.P., Liao, S.S.C., Marcusson, W.F., Martin, G.R., Mitchell, J.K., Moriwaki, Y., Power, M.S., Robertson, P.K., Seed, R.B. and Stokoe, K.H., 2001, Liquefaction resistance of soils; Summary report from the 1996 NCEER and 1998 NCEER/NSF workshops on evaluation of liquefaction resistance of soils: Journal of Geotechnical and Geoenvironmental Engineering, October 2001, p. 817-833.


2004 SEISMIC HAZARD ZONE REPORT FOR THE MILPITAS QUADRANGLE 27
SECTION 2 EARTHQUAKE-INDUCED LANDSLIDE
EVALUATION REPORT
Earthquake-Induced Landslide Zones of Required Investigation in
the Milpitas 7.5-Minute Quadrangle, Alameda and Santa Clara Counties, California
By Mark O. Wiegers, Kent Aue, and Timothy P. McCrink
California Department of Conservation California Geological Survey
PURPOSE
The Seismic Hazards Mapping Act (the Act) of 1990 (Public Resources Code, Chapter 7.8, Division 2) directs the California Department of Conservation (DOC), Division of Mines and Geology (DMG) [now called California Geological Survey (CGS)] to delineate Seismic Hazard Zones. The purpose of the Act is to reduce the threat to public health and safety and to minimize the loss of life and property by identifying and mitigating seismic hazards. Cities, counties, and state agencies are directed to use seismic hazard zone maps prepared by CGS in their land-use planning and permitting processes. The Act requires that site-specific geotechnical investigations be performed prior to permitting most urban development projects within the hazard zones. Evaluation and mitigation of seismic hazards are to be conducted under guidelines established by the California State Mining and Geology Board (DOC, 1997). The text of this report is on the Internet at http://gmw.consrv.ca.gov/shmp/webdocs/sp117.pdf
CALIFORNIA GEOLOGICAL SURVEY SHZR 051 28
Following the release of DMG Special Publication 117 (DOC, 1997), agencies in the Los Angeles metropolitan region sought more definitive guidance in the review of geotechnical investigations addressing landslide hazards. The agencies made their request through the Geotechnical Engineering Group of the Los Angeles Section of the American Society of Civil Engineers (ASCE). This group convened an implementation committee in 1998 under the auspices of the Southern California Earthquake Center (SCEC). The committee, which consisted of practicing geotechnical engineers and engineering geologists, released an overview of the practice of landslide analysis, evaluation, and mitigation techniques (SCEC, 2002). This text is also on the Internet at: http://www.scec.org/.
This section of the evaluation report summarizes seismic hazard zone mapping for earthquake-induced landslides in the Milpitas 7.5-Minute Quadrangle. Section 1 (addressing liquefaction) and Section 3 (addressing earthquake shaking), complete the report, which is one of a series that summarizes the preparation of seismic hazard zone maps within the state (Smith, 1996). Additional information on seismic hazard zone mapping in California can be accessed on the California Geological Survey's Internet page: http://www.conservation.ca.gov/CGS/index.htm.
BACKGROUND
Landslides triggered by earthquakes historically have been a significant cause of earthquake damage. In California, large earthquakes such as the 1971 San Fernando, 1989 Loma Prieta, and 1994 Northridge earthquakes triggered landslides that were responsible for destroying or damaging numerous structures, blocking major transportation corridors, and damaging life-line infrastructure. Areas that are most susceptible to earthquake-induced landslides are steep slopes in poorly cemented or highly fractured rocks, areas underlain by loose, weak soils, and areas on or adjacent to existing landslide deposits. These geologic and terrain conditions exist in many parts of California, including numerous hillside areas that have already been developed or are likely to be developed in the future. The opportunity for strong earthquake ground shaking is high in many parts of California because of the presence of numerous active faults. The combination of these factors constitutes a significant seismic hazard throughout much of California, including the hillside areas of the Milpitas Quadrangle.
METHODS SUMMARY
The mapping of earthquake-induced landslide hazard zones presented in this report is based on the best available terrain, geologic, geotechnical, and seismological data. If unavailable or significantly outdated, new forms of these data were compiled or generated specifically for this project. The following were collected or generated for this evaluation:
• Digital terrain data were used to provide an up-to-date representation of slope gradient and slope aspect in the study area

2004 SEISMIC HAZARD ZONE REPORT FOR THE MILPITAS QUADRANGLE 29
• Geologic mapping was used to provide an accurate representation of the spatial distribution of geologic materials in the study area. In addition, a map of existing landslides, whether triggered by earthquakes or not, was prepared
• Geotechnical laboratory test data were collected and statistically analyzed to quantitatively characterize the strength properties and dynamic slope stability of geologic materials in the study area
• Seismological data in the form of CGS probabilistic shaking maps and catalogs of strong-motion records were used to characterize future earthquake shaking within the mapped area
The data collected for this evaluation were processed into a series of GIS layers using commercially available software. A slope stability analysis was performed using the Newmark method of analysis (Newmark, 1965), resulting in a map of landslide hazard potential. The earthquake-induced landslide hazard zone was derived from the landslide hazard potential map according to criteria developed in a CGS pilot study (McCrink and Real, 1996; McCrink, 2001) and adopted by the State Mining and Geology Board (DOC, 2000).
SCOPE AND LIMITATIONS
The methodology used to make this map is based on earthquake ground-shaking estimates, geologic material-strength characteristics and slope gradient. These data are gathered from a variety of outside sources. Although the selection of data used in this evaluation was rigorous, the quality of the data is variable. The State of California and the Department of Conservation make no representations or warranties regarding the accuracy of the data gathered from outside sources.
Earthquake-induced landslide zone maps are intended to prompt more detailed, site-specific geotechnical investigations as required by the Act. As such, these zone maps identify areas where the potential for earthquake-induced landslides is relatively high. Due to limitations in methodology, it should be noted that these zone maps do not necessarily capture all potential earthquake-induced landslide hazards. Earthquake-induced ground failures that are not addressed by this map include those associated with ridge-top spreading and shattered ridges. It should also be noted that no attempt has been made to map potential run-out areas of triggered landslides. It is possible that such run-out areas may extend beyond the zone boundaries. The potential for ground failure resulting from liquefaction-induced lateral spreading of alluvial materials, considered by some to be a form of landsliding, is not specifically addressed by the earthquake-induced landslide zone or this report. See Section 1, Liquefaction Evaluation Report for the Milpitas Quadrangle, for more information on the delineation of liquefaction zones.
The remainder of this report describes in more detail the mapping data and processes used to prepare the earthquake-induced landslide zone map for the Milpitas Quadrangle. The information is presented in two parts. Part I covers physiographic, geologic and

CALIFORNIA GEOLOGICAL SURVEY SHZR 051 30
engineering geologic conditions in the study area. Part II covers the preparation of landslide hazard potential and landslide zone maps.
PART I
PHYSIOGRAPHY
Study Area Location and Physiography
The Milpitas 7.5-Minute Quadrangle covers approximately 60 square miles in Alameda and Santa Clara counties, along the southeastern margin of San Francisco Bay. The quadrangle includes portions of the cities of Milpitas, Sunnyvale, Santa Clara, San Jose, Fremont and unincorporated parts of Santa Clara County and Alameda County. Most of the map area is occupied by the gently sloping floor of the Santa Clara Valley and by tidal marsh and salt-evaporation ponds on the southeast margin of San Francisco Bay. Major streams include the Guadalupe River and Coyote Creek, which flow north across the valley floor into San Francisco Bay. The northeastern portion of the map area is occupied by hills on the southeastern flank of the Diablo Range. Several streams that flow onto the valley floor drain the hills. Elevations in the map area range from sea level along the bay to a little more than 2,000 feet above sea level in the northeastern part of the quadrangle.
Much of the valley floor is developed for residential, commercial and industrial uses. Several major highways extend across the valley floor, including Interstate 880, Interstate 680, U.S. Highway 101 and State Highways 237 and 262. Tidal marshes along the shore of San Francisco Bay have been converted to salt evaporation ponds by the construction of dikes in many areas. Within the hills are scattered residential developments, open ranchland and several active and inactive quarries.
Digital Terrain Data
The calculation of slope gradient is an essential part of the evaluation of slope stability under earthquake conditions. An accurate slope gradient calculation begins with an up-to-date map representation of the earth’s surface. Within the Milpitas Quadrangle, three sources of terrain data were used: 1) a U.S. Geological Survey digital elevation model (DEM) for areas outside of the city limits of Fremont and Milpitas; 2) digital contours derived from low altitude aerial photography flown in 1995 and photogrammetric methods for areas within the City of Milpitas; 3) digital contours derived from an airborne LIDAR (Light Detection and Ranging) system flown in May 2002 for areas within the City of Fremont.
The USGS DEM was prepared from the 7.5-minute quadrangle topographic contours derived from 1960 aerial photographs by photogrammetric methods and from plane table surveys. It is a Level 2 DEM that has a 10-meter horizontal resolution and a 7.5-meter vertical accuracy.

2004 SEISMIC HAZARD ZONE REPORT FOR THE MILPITAS QUADRANGLE 31
Terrain data were provided by the cities of Fremont and Milpitas in the form of digital two-foot contours. The contour data were converted to a DEM format with a 10-meter horizontal resolution and applied as a replacement of the USGS DEM data wherever available. The Milpitas and Fremont terrain data depict both natural slopes and slopes modified by grading for developments. Vertical accuracies of these data are estimated to be on the order of one to two meters. Plate 2.1 shows the areas within which the Fremont and Milpitas terrain data are used.
A slope map was made from the updated DEM using a third-order, finite difference, center-weighted algorithm (Horn, 1981). The DEM also was used to make a slope aspect map. The manner in which the slope and aspect maps were used to prepare the zone map will be described in subsequent sections of this report.
GEOLOGY
Bedrock and Surficial Geology
The bedrock geologic mapping used in this slope stability evaluation was obtained from the digital geologic map database of the 30 X 60 Minute San Jose Quadrangle by Wentworth and others (1999). A 1:24,000-scale digital geologic map of the Milpitas 7.5-Minute Quadrangle was obtained from this database. Knudsen and others (2000) prepared a Quaternary geologic map for the Milpitas Quadrangle, also at a scale of 1:24,000.
CGS geologists merged digital versions of the Quaternary and bedrock geologic maps. Geologic contacts were modified in some areas to resolve differences between the two maps. Geologic field reconnaissance was performed to assist in adjusting contacts and to review the lithology of geologic units and geologic structure.
Bedrock sequences in the 30 x 60 Minute San Jose Quadrangle have been divided into eight individual fault-bounded structural blocks based on differing stratigraphic sequences and geologic histories (Wentworth and others, 1999). One of these structural blocks, the Alum Rock Block, extends into the Milpitas 7.5-Minute Quadrangle. The following descriptions of bedrock units exposed in the Milpitas Quadrangle are based primarily on the work of Wentworth and others (1999), supplemented by observations made during field reconnaissance by CGS geologists.
The Alum Rock Block consists of Jurassic through Quaternary strata that were deposited on the Jurassic Coast Range Ophiolite and associated intermediate and silicic volcanic rocks (Wentworth and others, 1999). Franciscan melange of Cretaceous age occurs as small fault-bound slivers that are juxtaposed against the Coast Range Ophiolite. The ophiolitic rocks and melange are overlain by Cretaceous rocks that are, in turn, overlain by middle Miocene through Quaternary rocks and young sediments. The Alum Rock Block is cut by a system of strike-slip and transpressional faults that displace units as young as Holocene. Bedrock units exposed within the Milpitas 7.5-Minute Quadrangle are described below.

CALIFORNIA GEOLOGICAL SURVEY SHZR 051 32
The Cretaceous Berryessa Formation is the oldest bedrock unit exposed in the map area. The Berryessa Formation is part of the Great Valley Sequence and is divided into a basal conglomerate unit (Kbc) and an overlying sandstone and mudstone unit (Kbs) (Wentworth and others, 1999). The conglomerate (Kbc) occurs as thick, indistinct beds with pebble, cobble, and occasional boulder clasts, intercalated with coarse-grained mica-quartz-lithic wacke. Clasts include silicic to intermediate volcanic rocks, black chert and argillite, quartz, mica schist, meta-andesite, granodiorite and granite, black hornfels, and rip-up clasts of mudstone and lithic wacke. The sandstone and mudstone unit (Kbs) consists of layers of massive, indistinctly bedded, coarse- to fine-grained, mica-quartz-lithic wacke interbedded with poorly bedded mica-bearing siltstone and claystone. Locally, small lenses of conglomerate occur within the sandstone and mudstone unit.
The middle to upper Miocene Claremont Formation (Tcc) is the oldest Tertiary unit in the map area and unconformably overlies the Mesozoic rocks of the Alum Rock Block. The Claremont Formation primarily consists of interbedded chert and siliceous shale (Wentworth and others, 1999). Siltstone and fine-grained quartz sandstone are present locally.
The upper Miocene Briones Formation (Tbr) unconformably overlies the Claremont Formation. It consists of interbedded sandstone and siltstone, shell-hash conglomerate, cross-bedded sandstone, and occasional pebble and cobble conglomerate beds (Wentworth and others, 1999). The lower part is thin-bedded, fine-grained sandstone and shale interbedded with thick, massive sandstone beds. Indistinctly bedded conglomeratic shell beds occur in the middle part of this unit and are characteristic of this formation. The shell-rich beds typically form prominent ridges and peaks due to a resistant calcareous matrix. The upper part of the unit consists of distinctly to indistinctly bedded, massive to cross-bedded, fine- to coarse-grained sandstone.
The non-marine upper Miocene Orinda Formation (Tor) unconformably overlies the Briones Formation. It is comprised of non-marine pebble to boulder conglomerate, conglomeratic sandstone, and coarse- to medium-grained lithic sandstone (Wentworth and others, 1999). The unit is weakly consolidated and prone to landsliding.
The Plio-Pleistocene Irvington Gravels (QTi) consist of poorly to well-consolidated sand and sandy conglomerate. These deposits are exposed in the lower foothills along the margins of the Santa Clara Valley.
Unconsolidated Quaternary deposits underlie the floor of the Santa Clara Valley as well as small valleys in the hillside areas. A detailed discussion of Quaternary units can be found in Section 1.
Structural Geology
The Mesozoic and Tertiary bedrock units in the Milpitas Quadrangle are strongly deformed by faults and folds. Most of the major faults and fold axes trend in a northwesterly direction. Sedimentary units generally dip moderately to steeply to the northeast and locally are overturned (Dibblee, 1972). A northwest-trending syncline

2004 SEISMIC HAZARD ZONE REPORT FOR THE MILPITAS QUADRANGLE 33
extends through the northeastern corner of the map area. Resistant ridge-forming beds of the Briones Formation are exposed on the limbs of this syncline. Weak landslide-prone beds of the Orinda Formation are exposed in the core of this syncline. Major faults in the study area include strike-slip and transpressive faults (Graymer, 1995). Faults with the most recent displacements in the region are the Hayward and Calaveras faults. These faults are seismically active, predominantly right-lateral strike-slip faults with Holocene surface displacement. The southernmost stretch of the Hayward Fault extends into the map area, whereas the Calaveras Fault lies a few miles east of the map area. Transpressional faults include the Warm Springs and Mission Peak faults.
Landslide Inventory
As a part of the geologic data compilation, an inventory of existing landslides in the Milpitas Quadrangle was prepared by field reconnaissance, analysis of stereo-paired aerial photographs and a review of previously published landslide mapping. Landslides were mapped and digitized at a scale of 1:24,000. For each landslide included on the map a number of characteristics were compiled. These characteristics included the confidence of interpretation (definite, probable and questionable) and other properties, such as activity, thickness, and associated geologic unit(s). Landslides rated as definite and probable were carried into the landslide zoning, and landslides rated as questionable were not carried into the landslide zoning due to the uncertainty of their existence. The completed landslide map was scanned, digitized, and the attributes were compiled in a database. A version of this landslide inventory is included with Plate 2.1.
The distribution of landslides mapped for this study is roughly similar to that mapped by Nilsen (1975). However, Nilsen mapped the landslide deposits and did not include the source areas as part of his mapped landslide features. In some areas, there are some significant differences in interpretation between CGS’s inventory and that of Nilsen. Landslides mapped for this inventory generally include landslide deposits mapped by Wentworth and others (1999), with some modifications.
Landslides are relatively abundant in the hillside areas in the northeast part of the Milpitas Quadrangle. In particular, landslides are common on slopes underlain by the Orinda Formation (Tor) and on some slopes underlain by the Irvington Gravels (QTi).
Because it is not within the scope of the Act to review and monitor grading practices to ensure past slope failures have been properly mitigated, all documented slope failures, whether or not surface expression currently exists, are included in the landslide inventory.
ENGINEERING GEOLOGY
Geologic Material Strength
To evaluate the stability of geologic materials under earthquake conditions, the geologic map units described above were ranked and grouped on the basis of their shear strength. Generally, the primary source for rock shear-strength measurements is geotechnical reports prepared by consultants on file with local government permitting departments.

CALIFORNIA GEOLOGICAL SURVEY SHZR 051 34
Shear-strength data for the rock units identified on the Milpitas Quadrangle geologic map were obtained from the city of San Jose, Santa Clara County, the city of Milpitas and the city of Fremont (see Appendix A). The locations of rock and soil samples taken for shear testing within the Milpitas Quadrangle are shown on Plate 2.1. Shear tests from the adjoining Calaveras Reservoir, San Jose East and Niles quadrangles were used to augment data for several geologic formations for which little or no shear test information was available within the Milpitas Quadrangle.
Shear strength data gathered from the above sources were compiled for each geologic map unit. Geologic units were grouped on the basis of average angle of internal friction (average phi) and lithologic character. Average (mean or median) phi values for each geologic map unit and corresponding strength groups are summarized in Table 2.1. For each geologic strength group (Table 2.2) in the map area, the average shear strength value was assigned and used in our slope stability analysis. A geologic material strength map was made based on the groupings presented in Table 2.1 and Table 2.2, and this map provides a spatial representation of material strength for use in the slope stability analysis. The Briones and Orinda formations were subdivided further, as described below.
Adverse Bedding Conditions
Adverse bedding conditions are an important consideration in slope stability analyses. Adverse bedding conditions occur where the dip direction of bedded sedimentary rocks is roughly the same as the slope aspect, and where the dip magnitude is less than the slope gradient. Under these conditions, landslides can slip along bedding surfaces due to a lack of lateral support.
To account for adverse bedding in our slope stability evaluation, we used geologic structural data in combination with digital terrain data to identify areas with potentially adverse bedding, using methods similar to those of Brabb (1983). The structural data, derived from the geologic map database, was used to categorize areas of common bedding dip direction and magnitude. The dip direction was then compared to the slope aspect and, if the same the dip magnitude and slope gradient categories were compared. If the dip magnitude was less than or equal to the slope gradient category but greater than 25 percent (4:1 slope), the area was marked as a potential adverse bedding area.
The Briones Formation and Orinda Formation were subdivided based on shear strength differences between coarse-grained (higher strength) and fine-grained (lower strength) rocks. Shear strength values for the fine- and coarse-grained rocks were then applied to areas of favorable and adverse bedding orientation, which were determined from structural and terrain data as discussed above. It was assumed that coarse-grained material (higher strength) dominates where bedding dips into a slope (favorable bedding) while fine-grained (lower strength) material dominates where bedding dips out of a slope (adverse bedding). The geologic material strength map was modified by assigning the lower, fine-grained shear strength values to areas where potential adverse bedding conditions were identified. Areas of adverse bedding were found to be limited in extent in the Milpitas Quadrangle because bedding is generally steeper than slope gradients in

2004 SEISMIC HAZARD ZONE REPORT FOR THE MILPITAS QUADRANGLE 35
the hilly areas. The favorable and adverse bedding shear strength parameters for the Briones Formation and Orinda Formation are included in Table 2.1.
Existing Landslides
As discussed later in this report, the criteria for landslide zone mapping state that all existing landslides that are mapped as definite or probable are automatically included in the landslide zone of required investigation. Therefore, an evaluation of shear strength parameters for existing landslides is not necessary for the preparation of the zone map. However, in the interest of completeness for the material strength map, to provide relevant material strength information to project plan reviewers, and to allow for future revisions of our zone mapping procedures, we have collected and compiled shear strength data considered representative of existing landslides within the quadrangle.
The strength characteristics of existing landslides (Qls) must be based on tests of the materials along the landslide slip surface. Ideally, shear tests of slip surfaces formed in each mapped geologic unit would be used. However, this amount of information is rarely available. We collect and compile primarily “residual” strength parameters from laboratory tests of slip surface materials tested in direct shear or ring shear test equipment. Back-calculated strength parameters, if the calculations appear to have been performed appropriately, have also been included in our compilation. Within the Milpitas Quadrangle, no direct shear tests of landslide slip surface materials were available. The value shown in Table 2.1 was obtained from shear tests of a landslide in the adjacent Calaveras Reservoir Quadrangle.
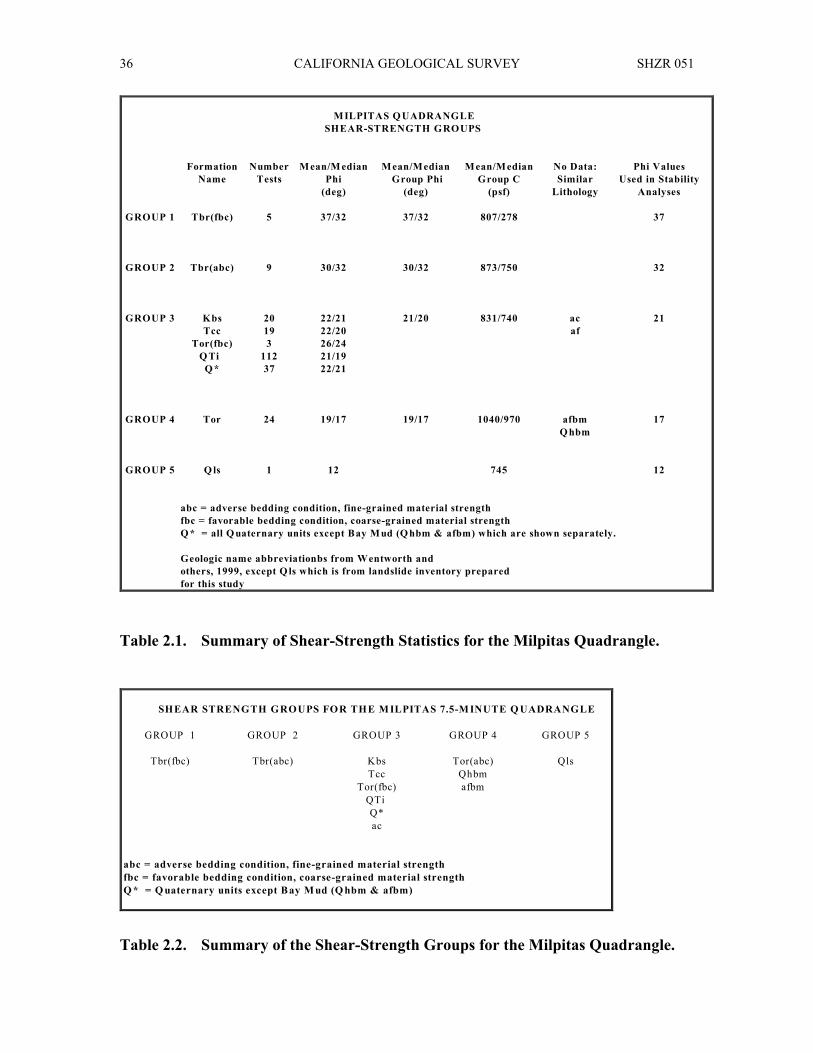
CALIFORNIA GEOLOGICAL SURVEY SHZR 051 36
MILPITAS Q UADRANGLE SHEAR-STRENGTH GROUPS
Formation Number M ean/M edian Mean/Median Mean/Median No Data: Phi ValuesName Tests Phi Group Phi Group C Similar Used in Stability
(deg) (deg) (psf) Lithology Analyses
GROUP 1 Tbr(fbc) 5 37/32 37/32 807/278 37
GROUP 2 Tbr(abc) 9 30/32 30/32 873/750 32
GROUP 3 Kbs 20 22/21 21/20 831/740 ac 21Tcc 19 22/20 af
Tor(fbc) 3 26/24Q Ti 112 21/19
Q * 37 22/21
GROUP 4 Tor 24 19/17 19/17 1040/970 afbm 17Q hbm
GROUP 5 Q ls 1 12 745 12
abc = adverse bedding condition, fine-grained material strengthfbc = favorable bedding condition, coarse-grained material strengthQ * = all Q uaternary units except Bay M ud (Q hbm & afbm) which are shown separately.
Geologic name abbreviationbs from Wentworth andothers, 1999, except Q ls which is from landslide inventory preparedfor this study
Table 2.1. Summary of Shear-Strength Statistics for the Milpitas Quadrangle.
SHEAR STRENGTH GROUPS FOR THE M ILPITAS 7.5-M INUTE Q UADRANGLE
GROUP 1 GROUP 2 GROUP 3 GROUP 4 GROUP 5
Tbr(fbc) Tbr(abc) Kbs Tor(abc) QlsTcc Qhbm
Tor(fbc) afbm QTi
Q*ac
abc = adverse bedding condition, fine-grained material strengthfbc = favorable bedding condition, coarse-grained material strengthQ * = Q uaternary units except Bay M ud (Q hbm & afbm)
Table 2.2. Summary of the Shear-Strength Groups for the Milpitas Quadrangle.

2004 SEISMIC HAZARD ZONE REPORT FOR THE MILPITAS QUADRANGLE 37
PART II
EARTHQUAKE-INDUCED LANDSLIDE HAZARD POTENTIAL
Design Strong-Motion Record
To evaluate earthquake-induced landslide hazard potential in the study area, a method of dynamic slope stability analysis developed by Newmark (1965) was used. The Newmark method analyzes dynamic slope stability by calculating the cumulative down-slope displacement for a given earthquake strong-motion time history. As implemented for the preparation of earthquake-induced landslide zones, the Newmark method necessitates the selection of a design earthquake strong-motion record to provide the “ground shaking opportunity.” For the Milpitas Quadrangle, selection of a strong motion record was based on an estimation of probabilistic ground motion parameters for modal magnitude, modal distance, and peak ground acceleration (PGA). The parameters were estimated from maps prepared by CGS for a 10 percent probability of being exceeded in 50 years (Petersen and others, 1996). The parameters used in the record selection are:
Modal Magnitude: 6.5 – 7.9
Modal Distance: 2.8 – 17.1
PGA: 0.54 – 0.96 g
The strong-motion record selected for the slope stability analysis in the Milpitas Quadrangle is the Corralitos record from the 1989 magnitude 6.9 (Mw) Loma Prieta earthquake (Shakal and others, 1989). This record had a source to recording site distance of 5.1 km and a peak ground acceleration (PGA) of 0.64. The selected strong-motion record was not scaled or otherwise modified prior to its use in the analysis.
Displacement Calculation
The design strong-motion record was used to develop a relationship between landslide displacement and yield acceleration (ay), defined as the earthquake horizontal ground acceleration above which landslide displacements take place. This relationship was prepared by integrating the design strong-motion record twice for a given acceleration value to find the corresponding displacement, and the process was repeated for a range of acceleration values (Jibson, 1993). The resulting curve in Figure 2.1 represents the full spectrum of displacements that can be expected for the design strong-motion record. This curve provides the required link between anticipated earthquake shaking and estimates of displacement for different combinations of geologic materials and slope gradient, as described in the Slope Stability Analysis section below.

CALIFORNIA GEOLOGICAL SURVEY SHZR 051 38
The amount of displacement predicted by the Newmark analysis provides an indication of the relative amount of damage that could be caused by earthquake-induced landsliding. Displacements of 30, 15 and 5 cm were used as criteria for rating levels of earthquake-induced landslide hazard potential based on the work of Youd (1980), Wilson and Keefer (1983), and a CGS pilot study for earthquake-induced landslides (McCrink, 2001; McCrink and Real, 1996). Applied to the curve in Figure 2.1, these displacements correspond to yield accelerations of 0.086, 0.133 and 0.234g. Because these yield acceleration values are derived from the design strong-motion record, they represent the ground shaking opportunity thresholds that are significant in the Milpitas Quadrangle.
0.10
1.00
10.00
100.00
1000.00
Dis
plac
emen
t (cm
)
0.01 0.1 1 Yield Acceleration (g)
Yield Acceleration vsNewmark Displacement
SMIP Corralitos Record - North Component
5 cm
15 cm
30 cm
0.234 g0.086g 0.133g
Figure 2.1. Yield Acceleration vs. Newmark Displacement for the 1989 Loma Prieta Earthquake Corralitos Record. Record from California Strong Motion Instrumentation Program (CSMIP) Station 57007.
Slope Stability Analysis
A slope stability analysis was performed for each geologic material strength group at slope increments of 1 degree. An infinite-slope failure model under unsaturated slope

2004 SEISMIC HAZARD ZONE REPORT FOR THE MILPITAS QUADRANGLE 39
conditions was assumed. A factor of safety was calculated first, followed by the calculation of yield acceleration from Newmark’s equation:
ay = ( FS - 1 )g sin α
where FS is the Factor of Safety, g is the acceleration due to gravity, and α is the direction of movement of the slide mass, in degrees measured from the horizontal, when displacement is initiated (Newmark, 1965). For an infinite slope failure α is the same as the slope angle.
The yield accelerations resulting from Newmark’s equations represent the susceptibility to earthquake-induced failure of each geologic material strength group for a range of slope gradients. Based on the relationship between yield acceleration and Newmark displacement shown in Figure 2.1, hazard potentials were assigned as follows:
1. If the calculated yield acceleration was less than 0.086g, Newmark displacement greater than 30 cm is indicated, and a HIGH hazard potential was assigned (H on Table 2.3)
2. If the calculated yield acceleration fell between 0.086g and 0.133g, Newmark displacement between 15 cm and 30 cm is indicated, and a MODERATE hazard potential was assigned (M on Table 2.3)
3. If the calculated yield acceleration fell between 0.133g and 0.234g, Newmark displacement between 5 cm and 15 cm is indicated, and a LOW hazard potential was assigned (L on Table 2.3)
4. If the calculated yield acceleration was greater than 0.234g, Newmark displacement of less than 5 cm is indicated, and a VERY LOW potential was assigned (VL on Table 2.3)
Table 2.3 summarizes the results of the stability analyses. The earthquake-induced landslide hazard potential map was prepared by combining the geologic material-strength map and the slope map according to this table.

CALIFORNIA GEOLOGICAL SURVEY SHZR 051 40
MILPITAS QUADRANGLE HAZARD POTENTIAL MATRIX
HAZARD POTENTIAL (Percent Slope)
Geologic Material Strength Group
(Average Phi) Very Low Low Moderate High
1 (37) 0 to 49% 49 to 53% 53 to 67% > 67%
2 (32) 0 to 38% 38 to 49% 49 to 53% > 53%
3 (27) 0 to 15% 15 to 23% 23 to 30% > 30%
4 (17) 0 to 9% 9 to 15% 15 to 23% > 23%
5 (12) 0 % 0 to 9% 9 to 15% > 15%
Table 2.3. Hazard Potential Matrix for Earthquake-Induced Landslides in the Milpitas Quadrangle. Values in the table show the range of slope gradient (expressed as percent slope) corresponding to calculated Newmark displacement ranges from the design earthquake for each material strength group.
EARTHQUAKE-INDUCED LANDSLIDE HAZARD ZONE
Criteria for Zoning
Earthquake-induced landslide zones were delineated using criteria adopted by the California State Mining and Geology Board (DOC, 2000). Under these criteria, earthquake-induced landslide hazard zones are defined as areas that meet one or both of the following conditions:
1. Areas that have been identified as having experienced landslide movement in the past, including all mappable landslide deposits and source areas as well as any landslide that is known to have been triggered by historic earthquake activity.
2. Areas where the geologic and geotechnical data and analyses indicate that the earth materials may be susceptible to earthquake-induced slope failure.
These conditions are discussed in further detail in the following sections.

2004 SEISMIC HAZARD ZONE REPORT FOR THE MILPITAS QUADRANGLE 41
Existing Landslides
Existing landslides typically consist of disrupted soils and rock materials that are generally weaker than adjacent undisturbed rock and soil materials. Previous studies indicate that existing landslides can be reactivated by earthquake movements (Keefer, 1984). Earthquake-triggered movement of existing landslides is most pronounced in steep head scarp areas and at the toe of existing landslide deposits. Although reactivation of deep-seated landslide deposits is less common (Keefer, 1984), a significant number of deep-seated landslide movements have occurred during, or soon after, several recent earthquakes. Based on these observations, all existing landslides with a definite or probable confidence rating are included within the earthquake-induced landslide hazard zone.
Geologic and Geotechnical Analysis
Based on the conclusions of a pilot study performed by CGS (McCrink, 2001; McCrink and Real, 1996), it has been concluded that earthquake-induced landslide hazard zones should encompass all areas that have a High, Moderate or Low level of hazard potential (see Table 2.3). This would include all areas where the analyses indicate earthquake displacements of 5 centimeters or greater. Areas with a Very Low hazard potential, indicating less than 5 centimeters displacement, are excluded from the zone.
As summarized in Table 2.3, all areas characterized by the following geologic strength group and slope gradient conditions are included in the earthquake-induced landslide hazard zone:
1. Geologic Strength Group 5 is included for all slope gradient categories. (Note: The only geologic unit included in Geologic Strength Group 5 is Qls, existing landslides. They have been included or excluded from the landslide zones on the basis of the criteria described in the previous section)
2. Geologic Strength Group 4 is included for all slopes steeper than 9 percent.
3. Geologic Strength Group 3 is included for all slopes steeper than 15 percent.
4. Geologic Strength Group 2 is included for all slopes steeper than 38 percent.
5. Geologic Strength Group 1 is included for all slopes greater than 49 percent.
Altogether, about 7.3 percent of the Milpitas Quadrangle lies within the earthquake-induced landslide zone of required investigation. Virtually all of these zones are in the hilly area in the northeastern part of the quadrangle.

CALIFORNIA GEOLOGICAL SURVEY SHZR 051 42
ACKNOWLEDGMENTS
The authors would like to thank the following individuals and organizations for their assistance in obtaining the data necessary to complete this project. Michael Shimamoto with the city of San Jose, Dianna Rapposelli with the city of Fremont, and staff in the building, engineering, and planning departments of the city of Milpitas arranged access and provided assistance in retrieving geotechnical data from files maintained by their respective cities. Alan Rich with the city of Milpitas, and Ron Chan and Ron Fong with the city of Fremont generously provided digital topographic contours for updating terrain within their cities. At CGS, Terilee McGuire, Lee Wallinder and Bob Moscovitz provided GIS support. Troy McKee and Cathy Slater assisted in the shear test data collection and data entry. Barbara Wanish prepared the DEM from the city of Milpitas terrain data, and Harold Feinberg prepared the DEM from the city of Fremont terrain data. Barbara Wanish prepared the final landslide hazard zone maps and the graphic displays for this report. Al Barrows and Diane Vaughn provided editorial and compilation services for the preparation of this report.
REFERENCES
Brabb, E.E., 1983, Map showing direction and amount of bedding dip of sedimentary rocks in San Mateo County, California: U.S. Geological Survey Miscellaneous Investigations Series Map I-1257C, 1 sheet, scale 1:62,500.
California Department of Conservation, Division of Mines and Geology, 1997, Guidelines for evaluating and mitigating seismic hazards in California: California Division of Mines and Geology Special Publication 117, 74 p.
California Department of Conservation, Division of Mines and Geology, 2000, Recommended criteria for delineating seismic hazard zones: California Division of Mines and Geology Special Publication 118, 12 p.
Dibblee, T.W., Jr., 1972, Preliminary Geologic Map of the Milpitas Quadrangle, Alameda and Santa Clara Counties, California: U.S. Geological Survey Open-File Report, scale 1:24,000.
Graymer, R., 1995, Geology of the Southeast San Francisco Bay Area Hills, California: in Sangines, E.M., Andersen, D.W. and Buising, A.B., editors, 1995, Recent geologic studies in the San Francisco Bay Area: Pacific Section Society of Economic Paleontologists and Mineralogists, v. 76, p. 115-124.
Horn, B.K.P., 1981, Hill shading and the reflectance map: Proceedings of the IEEE, v. 69, no. 1, p.14-47.

2004 SEISMIC HAZARD ZONE REPORT FOR THE MILPITAS QUADRANGLE 43
Jibson, R.W., 1993, Predicting earthquake-induced landslide displacements using Newmark’s sliding block analysis: Transportation Research Board, National Research Council, Transportation Research Record 1411, 17 p.
Keefer, D.K., 1984, Landslides caused by earthquakes: Geological Society of America Bulletin, v. 95, no. 4, p. 406-421.
Knudsen, K.L., Sowers, J.M., Witter, R.C., Wentworth, C.M., Helley, E.J., Nicholson, R.S., Wright, H.M. and Brown, K.H., 2000a, Preliminary maps of Quaternary deposits and liquefaction susceptibility, nine-county San Francisco Bay region, California; a digital database: U.S. Geological Survey Open-File Report 00-444.
McCrink, T.P., 2001, Mapping earthquake-induced landslide hazards in Santa Cruz County in Ferriz, H. and Anderson, R., editors, Engineering geology practice in northern California: California Geological Survey Bulletin 210 / Association of Engineering Geologists Special Publication 12, p.77-94.
McCrink, T.P. and Real, C.R., 1996, Evaluation of the Newmark method for mapping earthquake-induced landslide hazards in the Laurel 7-1/2 Minute Quadrangle, Santa Cruz County, California: California Division of Mines and Geology Final Technical Report for U.S. Geological Survey Contract 143-93-G-2334, U.S. Geological Survey, Reston, Virginia, 31 p.
Newmark, N.M., 1965, Effects of earthquakes on dams and embankments: Geotechnique, v. 15, no. 2, p. 139-160.
Nilsen, T.H., 1975, Preliminary Photointerpretation Map of Landslide and other Surficial Deposits of the Milpitas 7-1/2 Minute Quadrangle, Alameda and Santa Clara Counties, California: U.S. Geological Survey Open-File Map 75-277-31, scale 1:24,000.
Petersen, M.D., Bryant, W.A., Cramer, C.H., Cao. T., Reichle, M.S., Frankel, A.D., Lienkaemper, J.J., McCrory, P.A. and Schwartz, D.P., 1996, Probabilistic seismic hazard assessment for the State of California: California Department of Conservation, Division of Mines and Geology, Open File Report 96-08; U.S. Geological Survey Open File Report 96-706, 33 p.
Shakal, A., Huang, M., Reichle, M., Ventura, C., Cao, T., Sherburne, R., Savage, M., Darragh, R. and Peterson, C., 1989, CSMIP strong-motion records from the Santa Cruz Mountains (Loma Prieta), California earthquake of 17 October 1989: California Department of Conservation, Division of Mines and Geology, Office of Strong Motion Studies Report OSMS 89-06, 196 p.
Smith, T.C., 1996, Preliminary maps of seismic hazard zones and draft guidelines for evaluating and mitigating seismic hazards: California Geology, v. 49, no. 6, p. 147-150.

CALIFORNIA GEOLOGICAL SURVEY SHZR 051 44
U.S. Geological Survey, 1993, Digital Elevation Models: National Mapping Program, Technical Instructions, Data Users Guide 5, 48 p.
Wentworth, C.M., Blake, M.C., Jr., McLaughlin, R.J. and Gramer, R.W., 1999, Preliminary Geologic Map of the San Jose 30 X 60 Minute Quadrangle, California: A Digital Database: U. S. Geological Survey Open-File Report 98-795
Wilson, R.C. and Keefer, D.K., 1983, Dynamic analysis of a slope failure from the 1979 Coyote Lake, California, earthquake: Bulletin of the Seismological Society of America, v. 73, p. 863-877.
Youd, T.L., 1980, Ground failure displacement and earthquake damage to buildings: American Society of Civil Engineers Conference on Civil Engineering and Nuclear Power, 2d, Knoxville, Tennessee, 1980, v. 2, p. 7-6-2 to 7-6-26.
Youd, T.L. and Hoose, S.N., 1978, Historic Ground Failures in Northern California Triggered by Earthquakes: U. S. Geological Survey Professional Paper 993
AIR PHOTOS
WAC Corporation, Inc. dated 4-12-85, Flight No. WAC85CA, Photos 12-231 through 234, 12-2 through 12-6
WAC Corporation, Inc. dated 4-13-99, Flight No. WAC-C-99CA, Photo Nos. 2-20 through 24, 6-60 through 65, 6-123 through 128.
APPENDIX A SOURCE OF ROCK STRENGTH DATA
SOURCE* NUMBER OF TESTS SELECTED City of Milpitas 78 City of Fremont 24 City of San Jose 10
Total Number of Shear Tests 112 *Note: Shear test data from adjoining Calaveras Reservoir and Niles quadrangles were
used for some units for which little or no shear test data in the Milpitas Quadrangle was available.

2004 SEISMIC HAZARD ZONE REPORT FOR THE MILPITAS QUADRANGLE 45
SECTION 3 GROUND SHAKING EVALUATION REPORT
Potential Ground Shaking in the Milpitas 7.5-Minute Quadrangle,
Alameda and Santa Clara Counties, California
By
Mark D. Petersen*, Chris H. Cramer*, Geoffrey A. Faneros, Charles R. Real, and Michael S. Reichle
California Department of Conservation
California Geological Survey *Formerly with CGS, now with U.S. Geological Survey
PURPOSE
The Seismic Hazards Mapping Act (the Act) of 1990 (Public Resources Code, Chapter 7.8, Division 2) directs the California Department of Conservation (DOC), Division of Mines and Geology (DMG) [now called California Geological Survey (CGS)] to delineate Seismic Hazard Zones. The purpose of the Act is to reduce the threat to public health and safety and to minimize the loss of life and property by identifying and mitigating seismic hazards. Cities, counties, and state agencies are directed to use the Seismic Hazard Zone Maps in their land-use planning and permitting processes. The Act requires that site-specific geotechnical investigations be performed prior to permitting most urban development projects within the hazard zones. Evaluation and mitigation of seismic hazards are to be conducted under guidelines established by the California State Mining and Geology Board (DOC, 1997). The text of this report is on the Internet at http://gmw.consrv.ca.gov/shmp/webdocs/sp117.pdf.
This section of the evaluation report summarizes the ground motions used to evaluate liquefaction and earthquake-induced landslide potential for zoning purposes. Included are ground motion and related maps, a brief overview on how these maps were prepared, precautionary notes concerning their use, and related references. The maps provided
CALIFORNIA GEOLOGICAL SURVEY SHZR 051 46
herein are presented at a scale of approximately 1:150,000 (scale bar provided on maps), and show the full 7.5-minute quadrangle and portions of the adjacent eight quadrangles. They can be used to assist in the specification of earthquake loading conditions for the analysis of ground failure according to the “Simple Prescribed Parameter Value” method (SPPV) described in the site investigation guidelines (DOC, 1997). Alternatively, they can be used as a basis for comparing levels of ground motion determined by other methods with the statewide standard.
This section and Sections 1 and 2 (addressing liquefaction and earthquake-induced landslide hazards) constitute a report series that summarizes development of seismic hazard zone maps in the state. Additional information on seismic hazard zone mapping in California can be accessed on the California Geological Survey's Internet page: http://www.conservation.ca.gov/CGS/index.htm.
EARTHQUAKE HAZARD MODEL
The estimated ground shaking is derived from the statewide probabilistic seismic hazard evaluation released cooperatively by the California Department of Conservation, Division of Mines and Geology [California Geological Survey], and the U.S. Geological Survey (Petersen and others, 1996). That report documents an extensive 3-year effort to obtain consensus within the scientific community regarding fault parameters that characterize the seismic hazard in California. Fault sources included in the model were evaluated for long-term slip rate, maximum earthquake magnitude, and rupture geometry. These fault parameters, along with historical seismicity, were used to estimate return times of moderate to large earthquakes that contribute to the hazard.
The ground shaking levels are estimated for each of the sources included in the seismic source model using attenuation relations that relate earthquake shaking with magnitude, distance from the earthquake, and type of fault rupture (strike-slip, reverse, normal, or subduction). The published hazard evaluation of Petersen and others (1996) only considers uniform firm-rock site conditions. In this report, however, we extend the hazard analysis to include the hazard of exceeding peak horizontal ground acceleration (PGA) at 10 percent probability of exceedance in 50 years on spatially uniform conditions of rock, soft rock, and alluvium. These soil and rock conditions approximately correspond to site categories defined in Chapter 16 of the Uniform Building Code (ICBO, 1997), which are commonly found in California. We use the attenuation relations of Boore and others (1997), Campbell (1997), Sadigh and others (1997), and Youngs and others (1997) to calculate the ground motions.
The seismic hazard maps for ground shaking are produced by calculating the hazard at sites separated by about 5 km. Figures 3.1 through 3.3 show the hazard for PGA at 10 percent probability of exceedance in 50 years assuming the entire map area is firm rock, soft rock, or alluvial site conditions respectively. The sites where the hazard is calculated are represented as dots and ground motion contours as shaded regions. The quadrangle of interest is outlined by bold lines and centered on the map. Portions of the eight

((((((((((((((((((((((((((((((((((((((((((((((((( ((((((((((((((((((((((((((((((((((((((((((((((((( ((((((((((((((((((((((((((((((((((((((((((((((((( ((((((((((((((((((((((((((((((((((((((((((((((((( ((((((((((((((((((((((((((((((((((((((((((((((((( (((((((((((((((((((((((((((((((((((((((((((((((((
(((((((((((((((((((((((((((((((((((((((((((((((((((((((((((((((((((((((((((((((((((((((((((((((((( ((((((((((((((((((((((((((((((((((((((((((((((((( ((((((((((((((((((((((((((((((((((((((((((((((((( ((((((((((((((((((((((((((((((((((((((((((((((((( (((((((((((((((((((((((((((((((((((((((((((((((((
((((((((((((((((((((((((((((((((((((((((((((((((( ((((((((((((((((((((((((((((((((((((((((((((((((( ((((((((((((((((((((((((((((((((((((((((((((((((( ((((((((((((((((((((((((((((((((((((((((((((((((( ((((((((((((((((((((((((((((((((((((((((((((((((( (((((((((((((((((((((((((((((((((((((((((((((((((
((((((((((((((((((((((((((((((((((((((((((((((((( ((((((((((((((((((((((((((((((((((((((((((((((((( ((((((((((((((((((((((((((((((((((((((((((((((((( ((((((((((((((((((((((((((((((((((((((((((((((((( ((((((((((((((((((((((((((((((((((((((((((((((((( (((((((((((((((((((((((((((((((((((((((((((((((((
(((((((((((((((((((((((((((((((((((((((((((((((((((((((((((((((((((((((((((((((((((((((((((((((((( ((((((((((((((((((((((((((((((((((((((((((((((((( ((((((((((((((((((((((((((((((((((((((((((((((((( ((((((((((((((((((((((((((((((((((((((((((((((((( (((((((((((((((((((((((((((((((((((((((((((((((((0.530.530.530.530.530.530.530.530.53 0.490.490.490.490.490.490.490.490.49 0.470.470.470.470.470.470.470.470.47 0.490.490.490.490.490.490.490.490.49 0.560.560.560.560.560.560.560.560.56 0.640.640.640.640.640.640.640.640.64
0.470.470.470.470.470.470.470.470.47 0.460.460.460.460.460.460.460.460.46 0.500.500.500.500.500.500.500.500.50 0.590.590.590.590.590.590.590.590.59 0.740.740.740.740.740.740.740.740.74 0.770.770.770.770.770.770.770.770.77
0.450.450.450.450.450.450.450.450.45 0.490.490.490.490.490.490.490.490.49 0.590.590.590.590.590.590.590.590.59 0.740.740.740.740.740.740.740.740.74 0.890.890.890.890.890.890.890.890.89 0.950.950.950.950.950.950.950.950.95
0.470.470.470.470.470.470.470.470.47 0.540.540.540.540.540.540.540.540.54 0.670.670.670.670.670.670.670.670.67 0.860.860.860.860.860.860.860.860.86 0.880.880.880.880.880.880.880.880.88 0.770.770.770.770.770.770.770.770.77
0.510.510.510.510.510.510.510.510.51 0.650.650.650.650.650.650.650.650.65 0.80.80.80.80.80.80.80.80.8 0.780.780.780.780.780.780.780.780.78 0.840.840.840.840.840.840.840.840.84 0.620.620.620.620.620.620.620.620.62
MILPITAS 7.5 MINUTE QUADRANGLE AND PORTIONS OFADJACENT QUADRANGLES
10% EXCEEDANCE IN 50 YEARS PEAK GROUND ACCELERATION (g)1998
FIRM ROCK CONDITIONS
Department of ConservationCalifornia Geological Survey
Figure 3.1
0 1.5
Miles
3
Base map from GDT
SEISMIC HAZARD EVALUATION OF THE MILPITAS QUADRANGLE
472004

((((((((((((((((((((((((((((((((((((((((((((((((( ((((((((((((((((((((((((((((((((((((((((((((((((( ((((((((((((((((((((((((((((((((((((((((((((((((( ((((((((((((((((((((((((((((((((((((((((((((((((( ((((((((((((((((((((((((((((((((((((((((((((((((( (((((((((((((((((((((((((((((((((((((((((((((((((
((((((((((((((((((((((((((((((((((((((((((((((((( ((((((((((((((((((((((((((((((((((((((((((((((((( ((((((((((((((((((((((((((((((((((((((((((((((((( ((((((((((((((((((((((((((((((((((((((((((((((((( ((((((((((((((((((((((((((((((((((((((((((((((((( (((((((((((((((((((((((((((((((((((((((((((((((((
((((((((((((((((((((((((((((((((((((((((((((((((( ((((((((((((((((((((((((((((((((((((((((((((((((( ((((((((((((((((((((((((((((((((((((((((((((((((( ((((((((((((((((((((((((((((((((((((((((((((((((( ((((((((((((((((((((((((((((((((((((((((((((((((( (((((((((((((((((((((((((((((((((((((((((((((((((
((((((((((((((((((((((((((((((((((((((((((((((((( ((((((((((((((((((((((((((((((((((((((((((((((((( ((((((((((((((((((((((((((((((((((((((((((((((((( ((((((((((((((((((((((((((((((((((((((((((((((((( ((((((((((((((((((((((((((((((((((((((((((((((((( (((((((((((((((((((((((((((((((((((((((((((((((((
((((((((((((((((((((((((((((((((((((((((((((((((( ((((((((((((((((((((((((((((((((((((((((((((((((( ((((((((((((((((((((((((((((((((((((((((((((((((( ((((((((((((((((((((((((((((((((((((((((((((((((( ((((((((((((((((((((((((((((((((((((((((((((((((( (((((((((((((((((((((((((((((((((((((((((((((((((
0.580.580.580.580.580.580.580.580.58 0.530.530.530.530.530.530.530.530.53 0.520.520.520.520.520.520.520.520.52 0.540.540.540.540.540.540.540.540.54 0.610.610.610.610.610.610.610.610.61 0.690.690.690.690.690.690.690.690.69
0.510.510.510.510.510.510.510.510.51 0.510.510.510.510.510.510.510.510.51 0.550.550.550.550.550.550.550.550.55 0.640.640.640.640.640.640.640.640.64 0.790.790.790.790.790.790.790.790.79 0.830.830.830.830.830.830.830.830.83
0.500.500.500.500.500.500.500.500.50 0.540.540.540.540.540.540.540.540.54 0.640.640.640.640.640.640.640.640.64 0.790.790.790.790.790.790.790.790.79 0.940.940.940.940.940.940.940.940.94 0.980.980.980.980.980.980.980.980.98
0.520.520.520.520.520.520.520.520.52 0.590.590.590.590.590.590.590.590.59 0.720.720.720.720.720.720.720.720.72 0.910.910.910.910.910.910.910.910.91 0.920.920.920.920.920.920.920.920.92 0.820.820.820.820.820.820.820.820.82
0.560.560.560.560.560.560.560.560.56 0.700.700.700.700.700.700.700.700.70 0.840.840.840.840.840.840.840.840.84 0.830.830.830.830.830.830.830.830.83 0.880.880.880.880.880.880.880.880.88 0.670.670.670.670.670.670.670.670.67
MILPITAS 7.5 MINUTE QUADRANGLE AND PORTIONS OFADJACENT QUADRANGLES
10% EXCEEDANCE IN 50 YEARS PEAK GROUND ACCELERATION (g)
1998SOFT ROCK CONDITIONS
Department of ConservationCalifornia Geological Survey
Figure 3.2
0 1.5
Miles
3
Base map from GDT
SEISMIC HAZARD EVALUATION OF THE MILPITAS QUADRANGLE200448
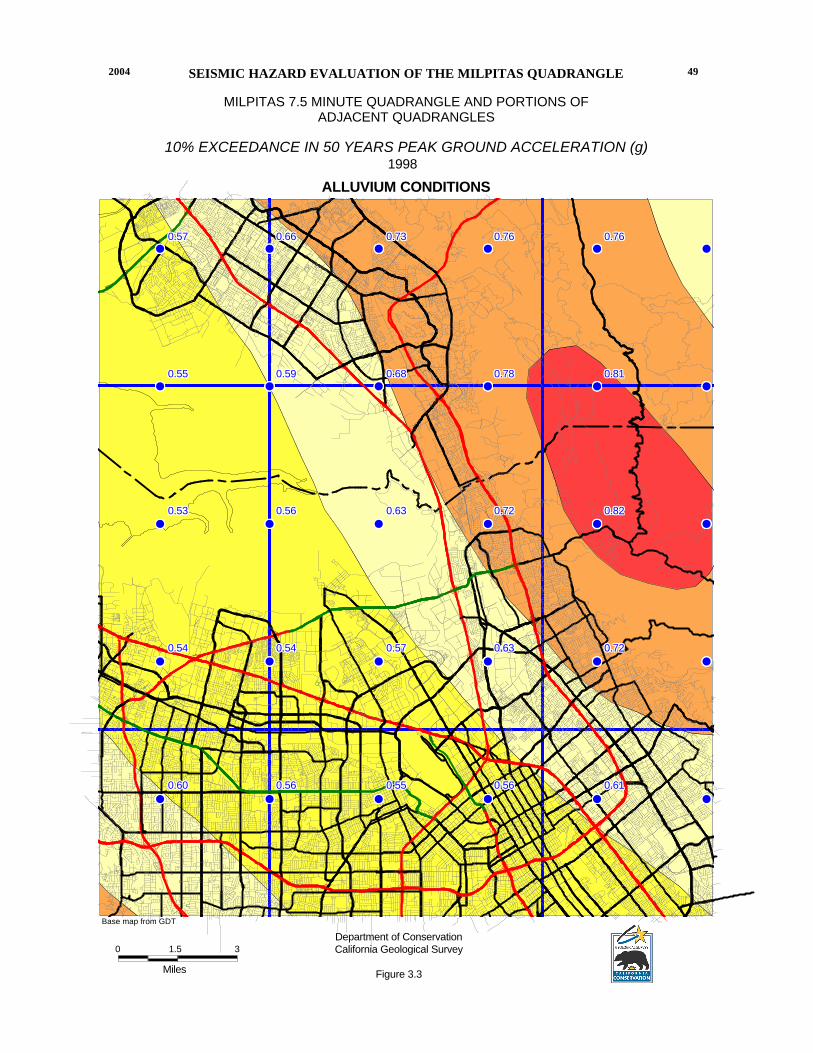
((((((((((((((((((((((((((((((((((((((((((((((((( ((((((((((((((((((((((((((((((((((((((((((((((((( ((((((((((((((((((((((((((((((((((((((((((((((((( ((((((((((((((((((((((((((((((((((((((((((((((((( ((((((((((((((((((((((((((((((((((((((((((((((((( (((((((((((((((((((((((((((((((((((((((((((((((((
((((((((((((((((((((((((((((((((((((((((((((((((( ((((((((((((((((((((((((((((((((((((((((((((((((( ((((((((((((((((((((((((((((((((((((((((((((((((( ((((((((((((((((((((((((((((((((((((((((((((((((( ((((((((((((((((((((((((((((((((((((((((((((((((( (((((((((((((((((((((((((((((((((((((((((((((((((
(((((((((((((((((((((((((((((((((((((((((((((((((((((((((((((((((((((((((((((((((((((((((((((((((( ((((((((((((((((((((((((((((((((((((((((((((((((( ((((((((((((((((((((((((((((((((((((((((((((((((( ((((((((((((((((((((((((((((((((((((((((((((((((( (((((((((((((((((((((((((((((((((((((((((((((((((
(((((((((((((((((((((((((((((((((((((((((((((((((((((((((((((((((((((((((((((((((((((((((((((((((( ((((((((((((((((((((((((((((((((((((((((((((((((( ((((((((((((((((((((((((((((((((((((((((((((((((( ((((((((((((((((((((((((((((((((((((((((((((((((( (((((((((((((((((((((((((((((((((((((((((((((((((
((((((((((((((((((((((((((((((((((((((((((((((((( ((((((((((((((((((((((((((((((((((((((((((((((((( ((((((((((((((((((((((((((((((((((((((((((((((((( ((((((((((((((((((((((((((((((((((((((((((((((((( ((((((((((((((((((((((((((((((((((((((((((((((((( (((((((((((((((((((((((((((((((((((((((((((((((((
0.600.600.600.600.600.600.600.600.60 0.560.560.560.560.560.560.560.560.56 0.550.550.550.550.550.550.550.550.55 0.560.560.560.560.560.560.560.560.56 0.610.610.610.610.610.610.610.610.61 0.650.650.65
0.540.540.540.540.540.540.540.540.54 0.540.540.540.540.540.540.540.540.54 0.570.570.570.570.570.570.570.570.57 0.630.630.630.630.630.630.630.630.63 0.720.720.720.720.720.720.720.720.72 0.750.750.75
0.530.530.530.530.530.530.530.530.53 0.560.560.560.560.560.560.560.560.56 0.630.630.630.630.630.630.630.630.63 0.720.720.720.720.720.720.720.720.72 0.820.820.820.820.820.820.820.820.82 0.820.820.82
0.550.550.550.550.550.550.550.550.55 0.590.590.590.590.590.590.590.590.59 0.680.680.680.680.680.680.680.680.68 0.780.780.780.780.780.780.780.780.78 0.810.810.810.810.810.810.810.810.81 0.740.740.74
0.570.570.570.570.570.570.570.570.57 0.660.660.660.660.660.660.660.660.66 0.730.730.730.730.730.730.730.730.73 0.760.760.760.760.760.760.760.760.76 0.760.760.760.760.760.760.760.760.76 0.640.640.64
MILPITAS 7.5 MINUTE QUADRANGLE AND PORTIONS OFADJACENT QUADRANGLES
10% EXCEEDANCE IN 50 YEARS PEAK GROUND ACCELERATION (g)1998
ALLUVIUM CONDITIONS
Department of ConservationCalifornia Geological Survey
Figure 3.3
0 1.5
Miles
3
Base map from GDT
SEISMIC HAZARD EVALUATION OF THE MILPITAS QUADRANGLE2004 49

CALIFORNIA GEOLOGICAL SURVEY SHZR 051 50
adjacent quadrangles are also shown so that the trends in the ground motion may be more apparent. We recommend estimating ground motion values by selecting the map that matches the actual site conditions, and interpolating from the calculated values of PGA rather than the contours, since the points are more accurate.
APPLICATIONS FOR LIQUEFACTION AND LANDSLIDE HAZARD ASSESSMENTS
Deaggregation of the seismic hazard identifies the contribution of each of the earthquakes (various magnitudes and distances) in the model to the ground motion hazard for a particular exposure period (see Cramer and Petersen, 1996). The map in Figure 3.4 identifies the magnitude and the distance (value in parentheses) of the earthquake that contributes most to the hazard at 10 percent probability of exceedance in 50 years on alluvial site conditions (predominant earthquake). This information gives a rationale for selecting a seismic record or ground motion level in evaluating ground failure. However, it is important to keep in mind that more than one earthquake may contribute significantly to the hazard at a site, and those events can have markedly different magnitudes and distances. For liquefaction hazard the predominant earthquake magnitude from Figure 3.4 and PGA from Figure 3.3 (alluvium conditions) can be used with the Youd and Idriss (1997) approach to estimate cyclic stress ratio demand. For landslide hazard the predominant earthquake magnitude and distance can be used to select a seismic record that is consistent with the hazard for calculating the Newmark displacement (Wilson and Keefer, 1983). When selecting the predominant earthquake magnitude and distance, it is advisable to consider the range of values in the vicinity of the site and perform the ground failure analysis accordingly. This would yield a range in ground failure hazard from which recommendations appropriate to the specific project can be made. Grid values for predominant earthquake magnitude and distance should not be interpolated at the site location, because these parameters are not continuous functions.
A preferred method of using the probabilistic seismic hazard model and the “simplified Seed-Idriss method” of assessing liquefaction hazard is to apply magnitude scaling probabilistically while calculating peak ground acceleration for alluvium. The result is a “magnitude-weighted” ground motion (liquefaction opportunity) map that can be used directly in the calculation of the cyclic stress ratio threshold for liquefaction and for estimating the factor of safety against liquefaction (Youd and Idriss, 1997). This can provide a better estimate of liquefaction hazard than use of predominate magnitude described above, because all magnitudes contributing to the estimate are used to weight the probabilistic calculation of peak ground acceleration (Real and others, 2000). Thus, large distant earthquakes that occur less frequently but contribute more to the liquefaction hazard are appropriately accounted for.
Figure 3.5 shows the magnitude-weighted alluvial PGA based on Idriss’ weighting function (Youd and Idriss, 1997). It is important to note that the values obtained from this map are pseudo-accelerations and should be used in the formula for factor of safety without any magnitude-scaling (a factor of 1) applied.
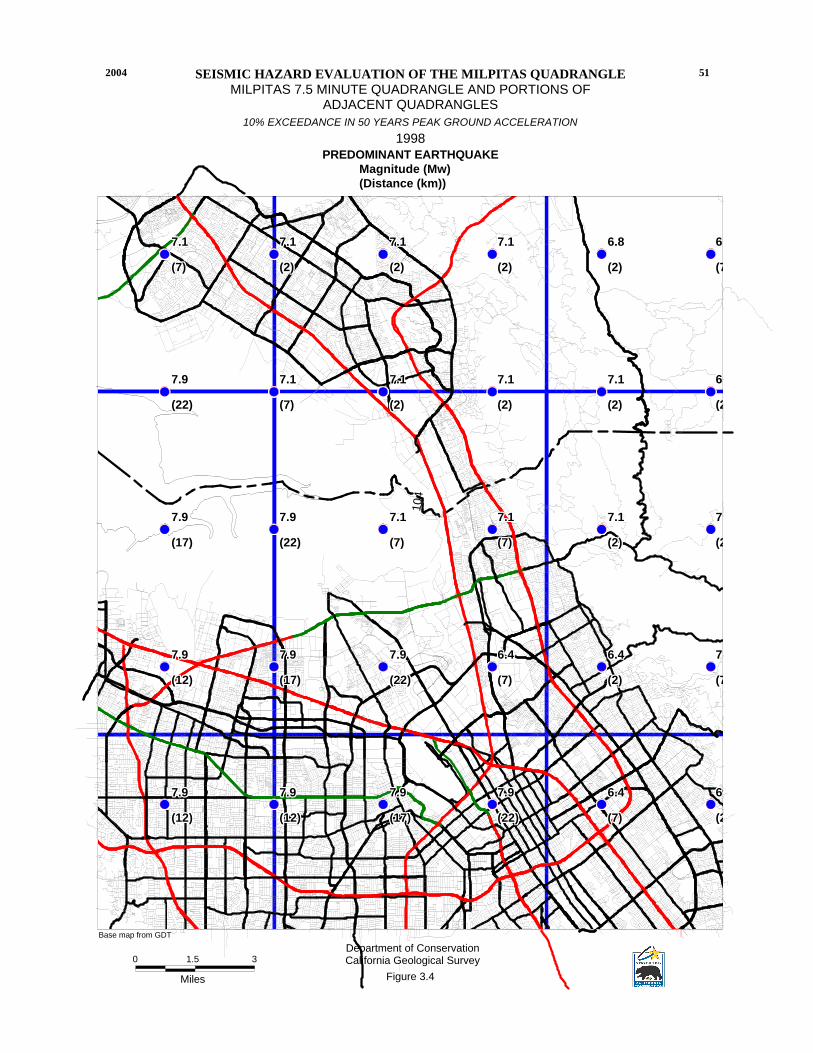
((((((((((((((((((((((((((((((((((((((((((((((((( ((((((((((((((((((((((((((((((((((((((((((((((((( ((((((((((((((((((((((((((((((((((((((((((((((((( ((((((((((((((((((((((((((((((((((((((((((((((((( ((((((((((((((((((((((((((((((((((((((((((((((((( (((((((((((((((((((((((((((((((((((((((((((((((((
((((((((((((((((((((((((((((((((((((((((((((((((( ((((((((((((((((((((((((((((((((((((((((((((((((( ((((((((((((((((((((((((((((((((((((((((((((((((( ((((((((((((((((((((((((((((((((((((((((((((((((( ((((((((((((((((((((((((((((((((((((((((((((((((( (((((((((((((((((((((((((((((((((((((((((((((((((
(((((((((((((((((((((((((((((((((((((((((((((((((((((((((((((((((((((((((((((((((((((((((((((((((( ((((((((((((((((((((((((((((((((((((((((((((((((( ((((((((((((((((((((((((((((((((((((((((((((((((( (((((((((((((((((((((((((((((((((((((((((((((((((
((((((((((((((((((((((((((((((((((((((((((((((((( ((((((((((((((((((((((((((((((((((((((((((((((((( ((((((((((((((((((((((((((((((((((((((((((((((((( ((((((((((((((((((((((((((((((((((((((((((((((((( ((((((((((((((((((((((((((((((((((((((((((((((((( (((((((((((((((((((((((((((((((((((((((((((((((((
((((((((((((((((((((((((((((((((((((((((((((((((( ((((((((((((((((((((((((((((((((((((((((((((((((( ((((((((((((((((((((((((((((((((((((((((((((((((( ((((((((((((((((((((((((((((((((((((((((((((((((( ((((((((((((((((((((((((((((((((((((((((((((((((( (((((((((((((((((((((((((((((((((((((((((((((((((
(((((((((((((((((((((((((((((((((((((((((((((((((
104
7.97.97.97.97.97.97.97.97.9 7.97.97.97.97.97.97.97.97.9 7.97.97.97.97.97.97.97.97.9 7.97.97.97.97.97.97.97.97.9 6.46.46.46.46.46.46.46.46.4 6.46.46.46.46.46.46.46.46.4
7.97.97.97.97.97.97.97.97.9 7.97.97.97.97.97.97.97.97.9 7.97.97.97.97.97.97.97.97.9 6.46.46.46.46.46.46.46.46.4 6.46.46.46.46.46.46.46.46.4 7.17.17.17.17.17.17.17.17.1
7.97.97.97.97.97.97.97.97.9 7.97.97.97.97.97.97.97.97.9 7.17.17.17.17.17.17.17.17.1 7.17.17.17.17.17.17.17.17.1 7.17.17.17.17.17.17.17.17.1 7.17.17.17.17.17.17.17.17.1
7.97.97.97.97.97.97.97.97.9 7.17.17.17.17.17.17.17.17.1 7.17.17.17.17.17.17.17.17.1 7.17.17.17.17.17.17.17.17.1 7.17.17.17.17.17.17.17.17.1 6.86.86.86.86.86.86.86.86.8
7.17.17.17.17.17.17.17.17.1 7.17.17.17.17.17.17.17.17.1 7.17.17.17.17.17.17.17.17.1 7.17.17.17.17.17.17.17.17.1 6.86.86.86.86.86.86.86.86.8 6.86.86.86.86.86.86.86.86.8
(12)(12)(12)(12)(12)(12)(12)(12)(12) (12)(12)(12)(12)(12)(12)(12)(12)(12) (17)(17)(17)(17)(17)(17)(17)(17)(17) (22)(22)(22)(22)(22)(22)(22)(22)(22) (7)(7)(7)(7)(7)(7)(7)(7)(7) (2)(2)(2)(2)(2)(2)(2)(2)(2)
(12)(12)(12)(12)(12)(12)(12)(12)(12) (17)(17)(17)(17)(17)(17)(17)(17)(17) (22)(22)(22)(22)(22)(22)(22)(22)(22) (7)(7)(7)(7)(7)(7)(7)(7)(7) (2)(2)(2)(2)(2)(2)(2)(2)(2) (7)(7)(7)(7)(7)(7)(7)(7)(7)
(17)(17)(17)(17)(17)(17)(17)(17)(17) (22)(22)(22)(22)(22)(22)(22)(22)(22) (7)(7)(7)(7)(7)(7)(7)(7)(7) (7)(7)(7)(7)(7)(7)(7)(7)(7) (2)(2)(2)(2)(2)(2)(2)(2)(2) (2)(2)(2)(2)(2)(2)(2)(2)(2)
(22)(22)(22)(22)(22)(22)(22)(22)(22) (7)(7)(7)(7)(7)(7)(7)(7)(7) (2)(2)(2)(2)(2)(2)(2)(2)(2) (2)(2)(2)(2)(2)(2)(2)(2)(2) (2)(2)(2)(2)(2)(2)(2)(2)(2) (2)(2)(2)(2)(2)(2)(2)(2)(2)
(7)(7)(7)(7)(7)(7)(7)(7)(7) (2)(2)(2)(2)(2)(2)(2)(2)(2) (2)(2)(2)(2)(2)(2)(2)(2)(2) (2)(2)(2)(2)(2)(2)(2)(2)(2) (2)(2)(2)(2)(2)(2)(2)(2)(2) (7)(7)(7)(7)(7)(7)(7)(7)(7)
MILPITAS 7.5 MINUTE QUADRANGLE AND PORTIONS OFADJACENT QUADRANGLES
10% EXCEEDANCE IN 50 YEARS PEAK GROUND ACCELERATION
1998PREDOMINANT EARTHQUAKE Magnitude (Mw) (Distance (km))
Department of ConservationCalifornia Geological Survey0 1.5
Miles
3
Figure 3.4
Base map from GDT
SEISMIC HAZARD EVALUATION OF THE MILPITAS QUADRANGLE2004 51

(((((((((((((((((((((((((((((((((((((((((((((((((((((((((((((((((((((((((((((((((((((((((((((((((( ((((((((((((((((((((((((((((((((((((((((((((((((( ((((((((((((((((((((((((((((((((((((((((((((((((( ((((((((((((((((((((((((((((((((((((((((((((((((( (((((((((((((((((((((((((((((((((((((((((((((((((
((((((((((((((((((((((((((((((((((((((((((((((((( ((((((((((((((((((((((((((((((((((((((((((((((((( ((((((((((((((((((((((((((((((((((((((((((((((((( ((((((((((((((((((((((((((((((((((((((((((((((((( ((((((((((((((((((((((((((((((((((((((((((((((((( (((((((((((((((((((((((((((((((((((((((((((((((((
((((((((((((((((((((((((((((((((((((((((((((((((( ((((((((((((((((((((((((((((((((((((((((((((((((( ((((((((((((((((((((((((((((((((((((((((((((((((( ((((((((((((((((((((((((((((((((((((((((((((((((( ((((((((((((((((((((((((((((((((((((((((((((((((( (((((((((((((((((((((((((((((((((((((((((((((((((
((((((((((((((((((((((((((((((((((((((((((((((((( ((((((((((((((((((((((((((((((((((((((((((((((((( ((((((((((((((((((((((((((((((((((((((((((((((((( ((((((((((((((((((((((((((((((((((((((((((((((((( ((((((((((((((((((((((((((((((((((((((((((((((((( (((((((((((((((((((((((((((((((((((((((((((((((((
((((((((((((((((((((((((((((((((((((((((((((((((( ((((((((((((((((((((((((((((((((((((((((((((((((( ((((((((((((((((((((((((((((((((((((((((((((((((( ((((((((((((((((((((((((((((((((((((((((((((((((( ((((((((((((((((((((((((((((((((((((((((((((((((( (((((((((((((((((((((((((((((((((((((((((((((((((
0.610.610.610.610.610.610.610.610.61 0.550.550.550.550.550.550.550.550.55 0.510.510.510.510.510.510.510.510.51 0.50.50.50.50.50.50.50.50.5 0.510.510.510.510.510.510.510.510.51
0.530.530.530.530.530.530.530.530.53 0.50.50.50.50.50.50.50.50.5 0.50.50.50.50.50.50.50.50.5 0.520.520.520.520.520.520.520.520.52 0.570.570.570.570.570.570.570.570.57
0.510.510.510.510.510.510.510.510.51 0.490.490.490.490.490.490.490.490.49 0.520.520.520.520.520.520.520.520.52 0.580.580.580.580.580.580.580.580.58 0.640.640.640.640.640.640.640.640.64
0.50.50.50.50.50.50.50.50.5 0.520.520.520.520.520.520.520.520.52 0.560.560.560.560.560.560.560.560.56 0.630.630.630.630.630.630.630.630.63 0.640.640.640.640.640.640.640.640.64
0.510.510.510.510.510.510.510.510.51 0.560.560.560.560.560.560.560.560.56 0.60.60.60.60.60.60.60.60.6 0.610.610.610.610.610.610.610.610.61 0.60.60.60.60.60.60.60.60.6
MILPITAS 7.5 MINUTE QUADRANGLE AND PORTIONS OFADJACENT QUADRANGLES
10% EXCEEDANCE IN 50 YEARS MAGNITUDE-WEIGHTED PSEUDO-PEAK ACCELERATION (g) FOR ALLUVIUM
1998LIQUEFACTION OPPORTUNITY
Department of ConservationCalifornia Geological Survey
Figure 3.5
0 1.5
Miles
3
Base map from GDT
SEISMIC HAZARD EVALUATION OF THE MILPITAS QUADRANGLE
522004

2004 SEISMIC HAZARD ZONE REPORT FOR THE MILPITAS QUADRANGLE 53
USE AND LIMITATIONS
The statewide map of seismic hazard has been developed using regional information and is not appropriate for site specific structural design applications. Use of the ground motion maps prepared at larger scale is limited to estimating earthquake loading conditions for preliminary assessment of ground failure at a specific location. We recommend consideration of site-specific analyses before deciding on the sole use of these maps for several reasons.
1. The seismogenic sources used to generate the peak ground accelerations were digitized from the 1:750,000-scale fault activity map of Jennings (1994). Uncertainties in fault location are estimated to be about 1 to 2 kilometers (Petersen and others, 1996). Therefore, differences in the location of calculated hazard values may also differ by a similar amount. At a specific location, however, the log-linear attenuation of ground motion with distance renders hazard estimates less sensitive to uncertainties in source location.
2. The hazard was calculated on a grid at sites separated by about 5 km (0.05 degrees). Therefore, the calculated hazard may be located a couple kilometers away from the site. We have provided shaded contours on the maps to indicate regional trends of the hazard model. However, the contours only show regional trends that may not be apparent from points on a single map. Differences of up to 2 km have been observed between contours and individual ground acceleration values. We recommend that the user interpolate PGA between the grid point values rather than simply using the shaded contours.
3. Uncertainties in the hazard values have been estimated to be about +/- 50 percent of the ground motion value at two standard deviations (Cramer and others, 1996).
4. Not all active faults in California are included in this model. For example, faults that do not have documented slip rates are not included in the source model. Scientific research may identify active faults that have not been previously recognized. Therefore, future versions of the hazard model may include other faults and omit faults that are currently considered.
5. A map of the predominant earthquake magnitude and distance is provided from the deaggregation of the probabilistic seismic hazard model. However, it is important to recognize that a site may have more than one earthquake that contributes significantly to the hazard. Therefore, in some cases earthquakes other than the predominant earthquake should also be considered.
Because of its simplicity, it is likely that the SPPV method (DOC, 1997) will be widely used to estimate earthquake shaking loading conditions for the evaluation of ground failure hazards. It should be kept in mind that ground motions at a given distance from an earthquake will vary depending on site-specific characteristics such as geology, soil properties, and topography, which may not have been adequately accounted for in the regional hazard analysis. Although this variance is represented to some degree by the

CALIFORNIA GEOLOGICAL SURVEY SHZR 051 54
recorded ground motions that form the basis of the hazard model used to produce Figures 3.1, 3.2, and 3.3, extreme deviations can occur. More sophisticated methods that take into account other factors that may be present at the site (site amplification, basin effects, near source effects, etc.) should be employed as warranted. The decision to use the SPPV method with ground motions derived from Figures 3.1, 3.2, or 3.3 should be based on careful consideration of the above limitations, the geotechnical and seismological aspects of the project setting, and the “importance” or sensitivity of the proposed building with regard to occupant safety.
REFERENCES
Boore, D.M., Joyner, W.B. and Fumal, T.E., 1997, Empirical near-source attenuation relationships for horizontal and vertical components of peak ground acceleration, peak ground velocity, and pseudo-absolute acceleration response spectra: Seismological Research Letters, v. 68, p. 154-179.
California Department of Conservation, Division of Mines and Geology, 1997, Guidelines for evaluating and mitigating seismic hazards in California: Special Publication 117, 74 p.
Campbell, K.W., 1997, Attenuation relationships for shallow crustal earthquakes based on California strong motion data: Seismological Research Letters, v. 68, p. 180-189.
Cramer, C.H. and Petersen, M.D., 1996, Predominant seismic source distance and magnitude maps for Los Angeles, Orange and Ventura counties, California: Bulletin of the Seismological Society of America, v. 85, no. 5, p. 1645-1649.
Cramer, C.H., Petersen, M.D. and Reichle, M.S., 1996, A Monte Carlo approach in estimating uncertainty for a seismic hazard assessment of Los Angeles, Ventura, and Orange counties, California: Bulletin of the Seismological Society of America, v. 86, p. 1681-1691.
International Conference of Building Officials (ICBO), 1997, Uniform Building Code: v. 2, Structural engineering and installation standards, 492 p.
Jennings, C.W., compiler, 1994, Fault activity map of California and adjacent areas: California Department of Conservation, Division of Mines and Geology, California Geologic Data Map Series, map no. 8.
Petersen, M.D., Bryant, W.A., Cramer, C.H., Cao, T., Reichle, M.S., Frankel, A.D., Lienkaemper, J.J., McCrory, P.A. and Schwartz, D.P., 1996, Probabilistic seismic hazard assessment for the State of California: California Department of Conservation, Division of Mines and Geology Open-File Report 96-08; also U.S. Geological Survey Open-File Report 96-706, 33 p.
2004 SEISMIC HAZARD ZONE REPORT FOR THE MILPITAS QUADRANGLE 55
Real, C.R., Petersen, M.D., McCrink, T.P. and Cramer, C.H., 2000, Seismic Hazard Deaggregation in zoning earthquake-induced ground failures in southern California: Proceedings of the Sixth International Conference on Seismic Zonation, November 12-15, Palm Springs, California, EERI, Oakland, CA.
Sadigh, K., Chang, C.-Y., Egan, J.A., Makdisi, F. and Youngs, R.R., 1997, SEA96- A new predictive relation for earthquake ground motions in extensional tectonic regimes: Seismological Research Letters, v. 68, p. 190-198.
Wilson, R.C. and Keefer, D.K., 1983, Dynamic analysis of a slope failure from the 1979 Coyote Lake, California, Earthquake: Bulletin of the Seismological Society of America, v. 73, p. 863-877.
Youd, T.L. and Idriss I.M., 1997, Proceedings of the NCEER workshop on evaluation of liquefaction resistance of soils: Technical Report NCEER-97-0022, 40 p.
Youngs, R.R., Chiou, S.-J., Silva, W.J. and Humphrey, J.R., 1997, Stochastic point-source modeling of ground motions in the Cascadia Region: Seismological Research Letters, v. 68, p. 74-85.