seismic effect of masonry infill with open and shear wall ... · seismic effect of masonry infill...
TRANSCRIPT
M. H Janardanachar, Prakash .D; International Journal of Advance Research, Ideas and Innovations in Technology.
© 2017, www.IJARIIT.com All Rights Reserved Page | 647
ISSN: 2454-132X
Impact factor: 4.295 (Volume3, Issue4)
Available online at www.ijariit.com
Seismic Effect of Masonry Infill with Open and Shear Wall on
Flat Slab Structures
Janardanachar M. H P.G. Student., Civil Engineering Department
Ghousia College of Engineering Ramanagara, Karnataka
D. Prakash Associate Professor. Civil Engineering Department
Ghousia College of Engineering Ramanagara, Karnataka [email protected]
Abstract: In the design of tall structures it is essential that the structure must be enough stiff to resist the lateral loads caused
by the wind and seismic motion. Lateral loads lead to developing high stresses, produce sway movement or cause vibration.
Therefore, it is a must for the structure to have sufficient strength against vertical loads together with adequate stiffness to
resist lateral forces. Many types of research have been carried which describes the suitability of various lateral load resisting
system against deformation and shear exerted due to the seismic and wind forces. The RC structures with shear wall and MI
frame have been recognized as one of the most efficient structural systems for such a purpose.
A flat slab is a typical type of construction in which a reinforced slab is built monolithically with the supporting columns
and is reinforced in two or more directions, without any provision of beams.
Flat slab structures in areas of low seismicity (Zone I & II) can be designed to resist both vertical and lateral loads as
permitted by code IS 1893(Part1)-2002. However, for areas of high seismicity (Zone III, IV & V) code does not permit flat slab
construction without any lateral load resisting system. In a building having frames (without beam) and with the shear wall, the
frames are designed for at least 25% of the seismic force and 75% is taken by the shear wall. If the effect of lateral load
analysis and other design features are to be studied in flat slabs; punching shear is a matter of concern for any structural
designer.
Keyword: BF = Bare frame building, MI = Masonry infill frame with opening, SSMI = Soft storey and masonry infill with
opening, AMI = Alternate MI storey with opening, BFSW = Bare frame with shear wall at core, MISW = masonry infill with
shear wall at core, SSMISW = Soft storey and masonry infill with opening and shear wall at core, AMISW = Alternate MI
storey with opening and shear wall at core.
I.INTRODUCTION This paper includes detailed step by step procedure of modeling and analysis of the models considered in the present study using
standard ETABS software. The grid system is used to draw a plan of the building. Materials property and section properties are
defined and assigned. Reinforced concrete frame element is modeled as beam element. Slab and shear walls are modeled as area
and wall element. The equivalent diagonal strut is used for modeling of MI in which thickness is assumed to be wall thickness.
Modal analysis, Equivalent static analysis, and response spectra analysis are performed on models. Based on the analysis,
parameters such as natural frequency, mode shapes, base shear, storey drift, displacement, acceleration are obtained.
.
1.1 OBJECTIVE
The main objective of the present study is to generate the 3D model of the conventional building, flat slab with and
without drop structures. FE modeling and analysis is carried out using FEM software.
Firstly modal analysis is conducted to know the natural frequency and mode shapes.
A response spectrum is generated for all zones as per IS: 1893 (Part 1)-2002 used for equivalent static analysis and
response spectrum analysis.
To study the behaviour of the structures with different slab systems with MI with 20% opening.
To study the behaviour of the structures with different slab systems under the provision of the shear wall.
M. H Janardanachar, Prakash .D; International Journal of Advance Research, Ideas and Innovations in Technology.
© 2017, www.IJARIIT.com All Rights Reserved Page | 648
To compare buildings with different slab systems with respect to their natural frequency, base shear, storey drift,
displacement, Response acceleration.
II.METHODOLOGY
The literature survey is carried out to find the effect of the shear wall as lateral load resisting system on conventional &
flat slab structures with MI, and FEM modeling of MI as equivalent diagonal strut is studied.
Models are generated using standard ETABS software package. The following three distinct building models are
considered.
Conventional Beam column slab system.
Flat plate slab system.
Flat slab with the drop.
The above floor systems are modeled with following conditions
Bare frame (BF).
Masonry Infill with 20% opening at the periphery (MI).
Soft storey and infill with 20% opening at the periphery (SSMI).
Alternate Masonry infill floors with 20% opening at the periphery (AMI).
Bare frame with the shear wall at the core (BFSW).
Infill frame with 20% opening at periphery and shear wall at the core (MISW).
Soft story and infill with 20% opening at periphery and shear wall at the core (SSMISW).
Alternate infill with 20% opening at periphery and shear wall at the core (AMISW).
Modal analysis is carried out for all floor systems to determine natural frequency and mode shapes.
A response spectrum is generated for all zones as per IS: 1893 (Part 1)-2002.
Equivalent static analysis and response spectrum analysis are carried and parameters such as natural frequency, base
shear, story drift, displacements, and acceleration are obtained. Results are compared and conclusions are drawn.
2.1PARAMETERS OF THE STUDY
Parameters considered in the Present investigation are discussed in detail for three-dimensional models in case of 5, 10,
15, 20-storey buildings for 7mx7m panel dimensions. Parameters considered in the study are given below.
a) Types of Slab Systems Considered
The following three distinct building models are considered in present work.
Conventional Beam column slab.
Flat plate slab system.
Flat slab with the drop.
The above floor systems are modeled with following conditions
Bare frame (BF).
Masonry infill frame with 20% opening at the periphery (MI).
Soft story and infill with 20% opening at the periphery (SSMI).
Alternate MI floors with 20% opening at the periphery (AMI).
Bare frame with the shear wall at core (BFSW).
Masonry infill frame with 20% opening at periphery and shear wall at core (MISW).
Soft storey and MI with 20% opening at periphery and shear wall at core (SSMISW).
Alternate MI floors with 20% opening at periphery and shear wall at core (AMISW).
b) Model Geometry
5 Number of Bays considered in horizontal direction X and vertical direction Y and each bay are having a constant panel
dimension of 7m x 7m.
c) Building Heights
The project is carried out for following stories: The height of each storey is 3.5m
i. 5 Storey.
ii. 10 Storey.
iii. 15 Storey.
iv. 20 Storey.
2.2 MATERIAL PROPERTIES
Concrete grade = M30
Density of brick wall = 19 kN/m3
Steel grade = Fe415
Density of RCC = 25 kN/m3
Modulus of Elasticity of concrete = 27386.1 N/mm2
Modulus of Elasticity of masonry infill = 14000 N/mm2
Poisson’s Ratio of Concrete = 0.17

M. H Janardanachar, Prakash .D; International Journal of Advance Research, Ideas and Innovations in Technology.
© 2017, www.IJARIIT.com All Rights Reserved Page | 649
2 .3 PROPERTIES OF STRUCTURAL ELEMENTS The dimensions of beams and columns are designed for 10 & 20 storey Conventional Beam-Slab system in Seismic Zone
V for live load intensity of 4kN/m2.
i. Cross-Section of Column
Square columns for 5 &10 storey: 700mmx700mm
Square columns for 15 &20 storey: 900mmx900mm
Square columns are selected because they offer equal resistance in X and Y directions, irrespective of the direction of
earthquake forces.
ii. Cross-Section of Beam
All beams including plinth beams are of the uniform size of 450mmx600mm for all frames considered.
iii. Shear Wall Thickness
For all models 150mm thick Shear Wall considered.
iv. Slab Thickness
These values are obtained from design for gravity loads for live load intensity of 4kN/m2 as per IS 456:2000 (Appendix E)
For Conventional RC Beam Slab System: 195mm
For Flat Plate System: 210mm
For Flat Slab System: 190mm with a drop of 50mm
v. Masonry Wall Thickness
For all models 230mm thick Masonry Wall considered.
vi. Size Of Drop (For Flat Slab System)
Flab slabs with drops but without column capitals are considered in the present study. Around the column, a drop of
50mm is provided thereby making the slab thickness at the column top location equal to 240mm. The size of the drop is
3.5mx3.5m so that the width of the drop is equal to the column strip.
2.4 LOAD CALCULATIONS All the structural systems are subjected to three types of primary load cases as per the provisions of IS 875-1987 (Part I).
They are:
Dead Load (IS:875(Part I)-1987)
Live Load (IS:875(Part II)-1987)
Seismic Load (IS:1893(Part III)-2002)
i. Dead load
Self-weight of structure:
Self-weight of the structure is calculated by the software based on the section properties and material constants.
ii. Super-imposed dead load on slab:
At roof level:
Floor finishes: 3kN/m2
At intermediate floor levels:
Floor finishes: 1.5kN/m2
Live Load: 4 kN/m2
iii. Wall load on beam:
At plinth level and intermediate floor levels = 2.9 x 0.23 x 25 = 16.67 kN/m
iv. Earthquake Forces Data
Lateral load consists of earth quake load in X and Y direction as per the IS: 1893 (Part 1)-2002.
Earthquake load for the building has been calculated as per IS: 1893-2002:
Zone (Z) = 5
Response Reduction Factor ( RF ) = 5 (for SMRF)
Importance Factor ( I ) = 1.5
Rock and soil site factor (SS) = 2 (Medium soil)
Type of Structures = 1 (RC Structure)
Damping Ratio (DM) = 0.05
v. Percentage of Imposed Load For Seismic Weight
As per Clause 7.3.1 & Table 8 of IS: 1893(Part I)-2002, for uniformly distributed live loads intensities of up to 3kN/m2,
25% of imposed loads have been considered and above 3kN/m2, 50% of the imposed loads have been considered.
M. H Janardanachar, Prakash .D; International Journal of Advance Research, Ideas and Innovations in Technology.
© 2017, www.IJARIIT.com All Rights Reserved Page | 650
vi. Support Condition
The columns are assumed to be fixed at the bottom.
2.5 TYPES OF PRIMARY LOADS
The structural systems are subjected to 3 types of Primary Load Cases as per the provisions of IS: 872-1987 (Part I).
They are:
1. Dead Load Case (Vertical or Gravity Load), denoted as ‘DL’
2. Live Load Case (Vertical or Gravity Load), denoted as ‘LL’
3. Wall Load Case (Super-imposed dead load), denoted as ‘WAL’
4. Seismic Load in X-direction (Static Load), denoted as ‘EQX’
5. Seismic Load in Y-direction (Static Load), denoted as ‘EQY’
6. Response Spectrum in X-direction (Dynamic Load), denoted as ‘RSX’
7. Response Spectrum in Y-direction (Dynamic Load), denoted as ‘RSY’
The gravity loads (dead, super-imposed dead and live to load) on the frame have been calculated based on the provisions
of IS: 872-1987 (Part II). The dead load consists of self-weight of structural elements and the superimposed dead load consists of
the masonry wall load acting on the structure. The live load is based on requirements as 4kN/m2. The lateral loads (Seismic loads)
on the frame have been calculated based on the provisions of IS: 1893(Part I)-2000 that deals with ‘Criteria for Earthquake
Resistant Design of Structures’. The aim is to carry out the seismic analyses of all the structural systems by “Equivalent Static
Force Method” & “Response Spectrum Method”.
The results obtained from the analysis are thoroughly investigated for various slab systems with respect to their Natural
frequency, Maximum displacement, Maximum storey drift, Response acceleration, and the Base Shear; their variations are
compared.
3.0 MODELLING AND ANALYSIS PROCEDURE
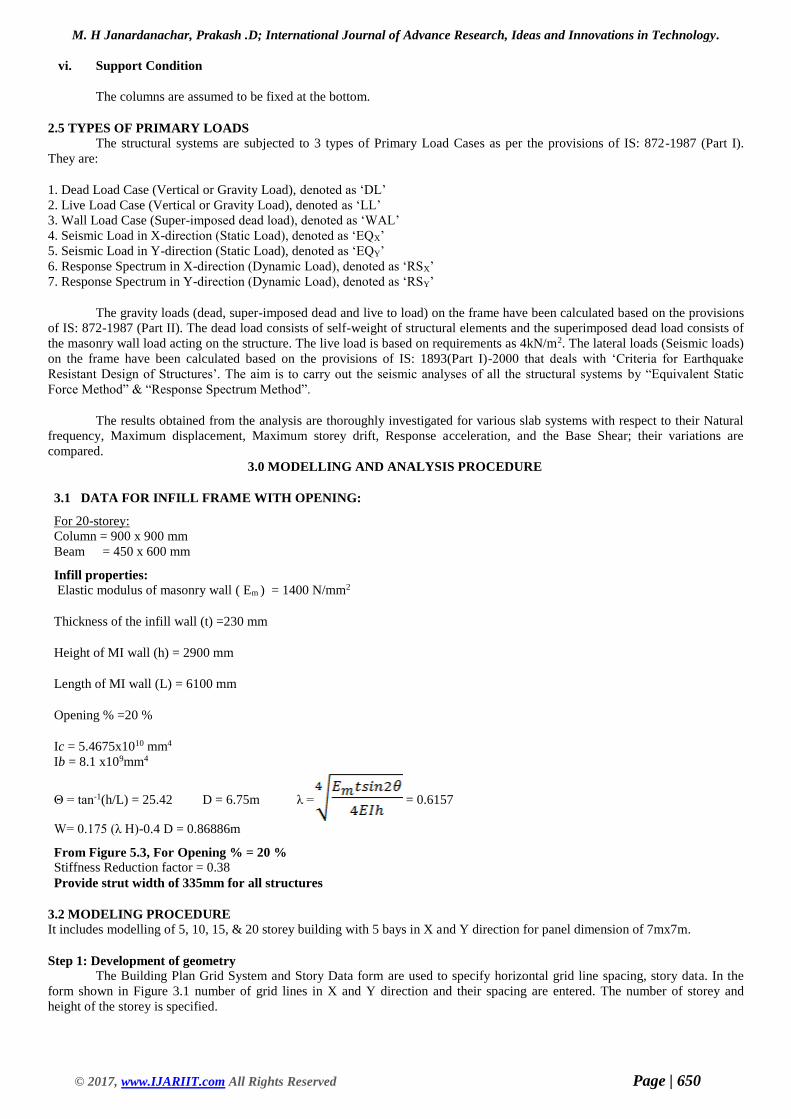
3.1 DATA FOR INFILL FRAME WITH OPENING:
For 20-storey:
Column = 900 x 900 mm
Beam = 450 x 600 mm
Infill properties:
Elastic modulus of masonry wall ( Em ) = 1400 N/mm2
Thickness of the infill wall (t) =230 mm
Height of MI wall (h) = 2900 mm
Length of MI wall (L) = 6100 mm
Opening % =20 %
Ic = 5.4675x1010 mm4
Ib = 8.1 x109mm4
Θ = tan-1(h/L) = 25.42 D = 6.75m λ = = 0.6157
W= 0.175 (λ H)-0.4 D = 0.86886m
From Figure 5.3, For Opening % = 20 %
Stiffness Reduction factor = 0.38
Provide strut width of 335mm for all structures
3.2 MODELING PROCEDURE
It includes modelling of 5, 10, 15, & 20 storey building with 5 bays in X and Y direction for panel dimension of 7mx7m.
Step 1: Development of geometry
The Building Plan Grid System and Story Data form are used to specify horizontal grid line spacing, story data. In the
form shown in Figure 3.1 number of grid lines in X and Y direction and their spacing are entered. The number of storey and
height of the storey is specified.
M. H Janardanachar, Prakash .D; International Journal of Advance Research, Ideas and Innovations in Technology.
© 2017, www.IJARIIT.com All Rights Reserved Page | 651
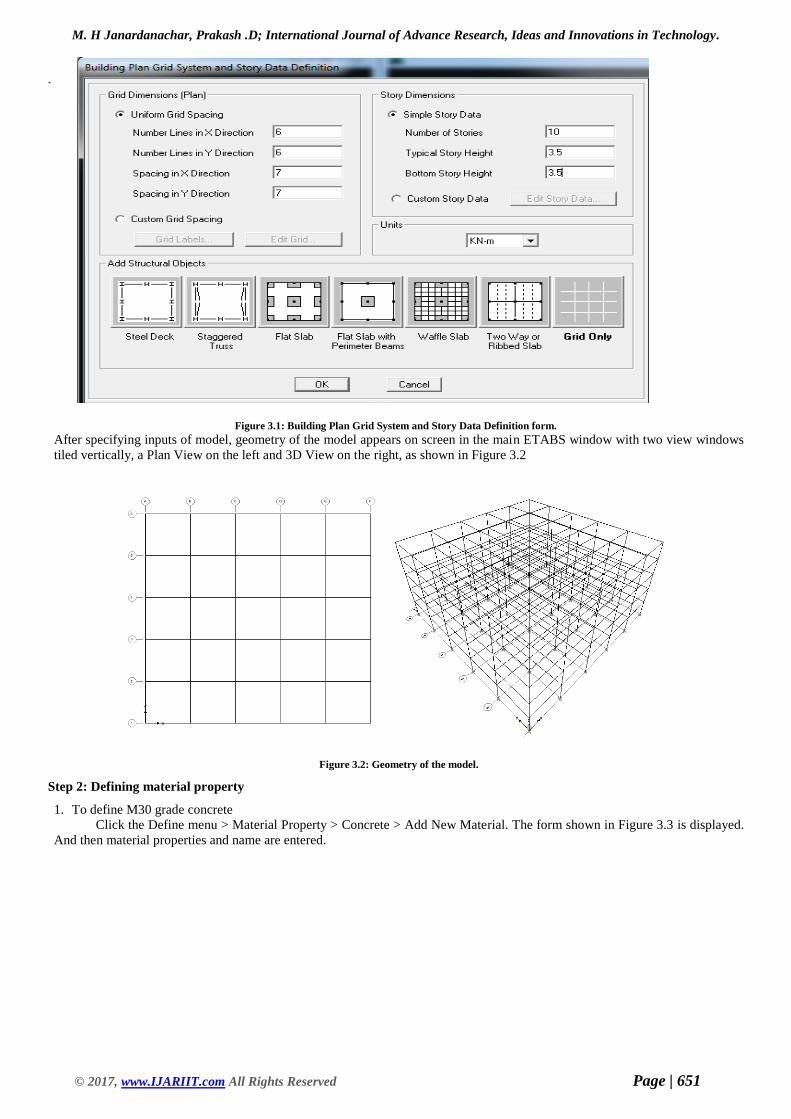
Figure 3.1: Building Plan Grid System and Story Data Definition form.
After specifying inputs of model, geometry of the model appears on screen in the main ETABS window with two view windows
tiled vertically, a Plan View on the left and 3D View on the right, as shown in Figure 3.2
Figure 3.2: Geometry of the model.
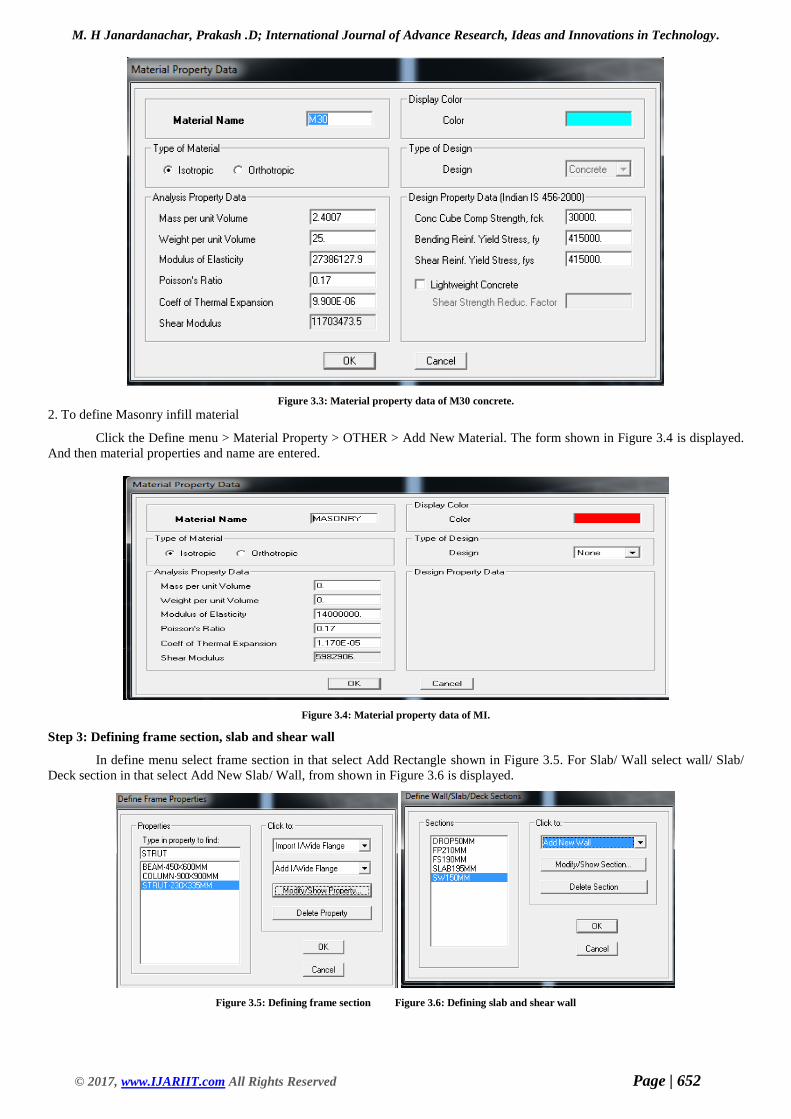
Step 2: Defining material property
1. To define M30 grade concrete
Click the Define menu > Material Property > Concrete > Add New Material. The form shown in Figure 3.3 is displayed.
And then material properties and name are entered.
M. H Janardanachar, Prakash .D; International Journal of Advance Research, Ideas and Innovations in Technology.
© 2017, www.IJARIIT.com All Rights Reserved Page | 652
Figure 3.3: Material property data of M30 concrete. 2. To define Masonry infill material
Click the Define menu > Material Property > OTHER > Add New Material. The form shown in Figure 3.4 is displayed.
And then material properties and name are entered.
Figure 3.4: Material property data of MI.
Step 3: Defining frame section, slab and shear wall
In define menu select frame section in that select Add Rectangle shown in Figure 3.5. For Slab/ Wall select wall/ Slab/
Deck section in that select Add New Slab/ Wall, from shown in Figure 3.6 is displayed.
Figure 3.5: Defining frame section Figure 3.6: Defining slab and shear wall
M. H Janardanachar, Prakash .D; International Journal of Advance Research, Ideas and Innovations in Technology.
© 2017, www.IJARIIT.com All Rights Reserved Page | 653
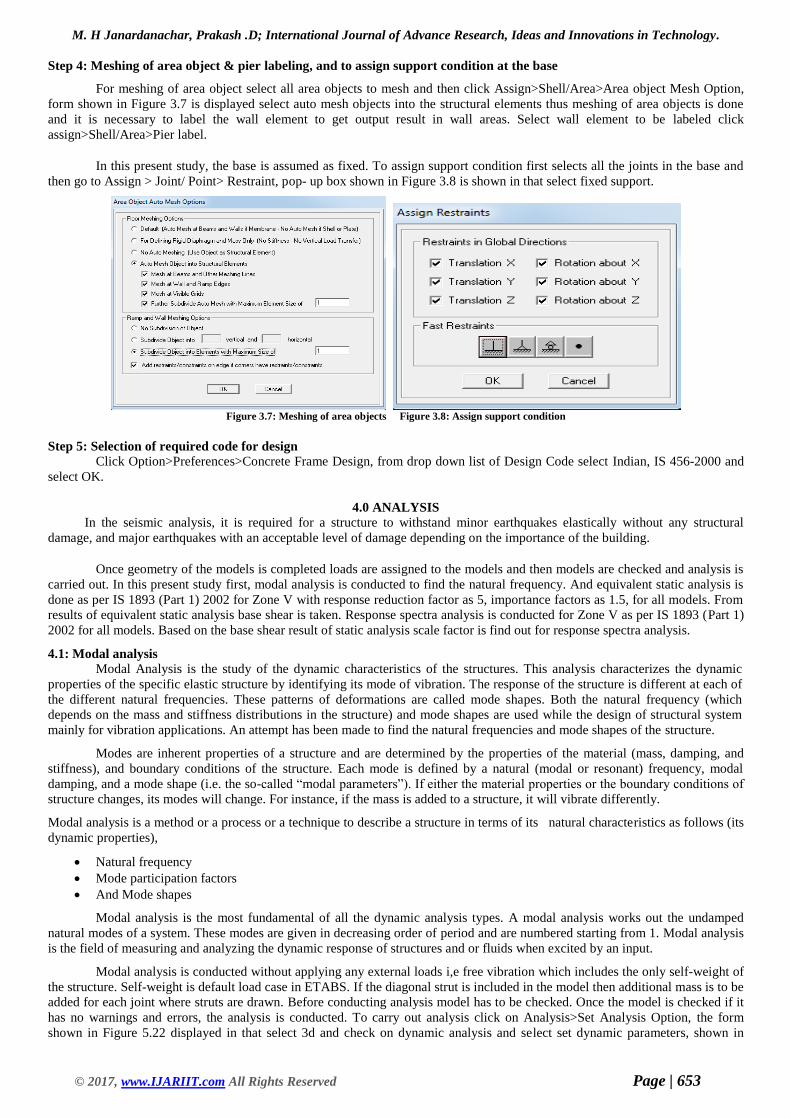
Step 4: Meshing of area object & pier labeling, and to assign support condition at the base
For meshing of area object select all area objects to mesh and then click Assign>Shell/Area>Area object Mesh Option,
form shown in Figure 3.7 is displayed select auto mesh objects into the structural elements thus meshing of area objects is done
and it is necessary to label the wall element to get output result in wall areas. Select wall element to be labeled click
assign>Shell/Area>Pier label.
In this present study, the base is assumed as fixed. To assign support condition first selects all the joints in the base and
then go to Assign > Joint/ Point> Restraint, pop- up box shown in Figure 3.8 is shown in that select fixed support.
Figure 3.7: Meshing of area objects Figure 3.8: Assign support condition
Step 5: Selection of required code for design Click Option>Preferences>Concrete Frame Design, from drop down list of Design Code select Indian, IS 456-2000 and
select OK.
4.0 ANALYSIS
In the seismic analysis, it is required for a structure to withstand minor earthquakes elastically without any structural
damage, and major earthquakes with an acceptable level of damage depending on the importance of the building.
Once geometry of the models is completed loads are assigned to the models and then models are checked and analysis is
carried out. In this present study first, modal analysis is conducted to find the natural frequency. And equivalent static analysis is
done as per IS 1893 (Part 1) 2002 for Zone V with response reduction factor as 5, importance factors as 1.5, for all models. From
results of equivalent static analysis base shear is taken. Response spectra analysis is conducted for Zone V as per IS 1893 (Part 1)
2002 for all models. Based on the base shear result of static analysis scale factor is find out for response spectra analysis.
4.1: Modal analysis
Modal Analysis is the study of the dynamic characteristics of the structures. This analysis characterizes the dynamic
properties of the specific elastic structure by identifying its mode of vibration. The response of the structure is different at each of
the different natural frequencies. These patterns of deformations are called mode shapes. Both the natural frequency (which
depends on the mass and stiffness distributions in the structure) and mode shapes are used while the design of structural system
mainly for vibration applications. An attempt has been made to find the natural frequencies and mode shapes of the structure.
Modes are inherent properties of a structure and are determined by the properties of the material (mass, damping, and
stiffness), and boundary conditions of the structure. Each mode is defined by a natural (modal or resonant) frequency, modal
damping, and a mode shape (i.e. the so-called “modal parameters”). If either the material properties or the boundary conditions of
structure changes, its modes will change. For instance, if the mass is added to a structure, it will vibrate differently.
Modal analysis is a method or a process or a technique to describe a structure in terms of its natural characteristics as follows (its
dynamic properties),
Natural frequency
Mode participation factors
And Mode shapes
Modal analysis is the most fundamental of all the dynamic analysis types. A modal analysis works out the undamped
natural modes of a system. These modes are given in decreasing order of period and are numbered starting from 1. Modal analysis
is the field of measuring and analyzing the dynamic response of structures and or fluids when excited by an input.
Modal analysis is conducted without applying any external loads i,e free vibration which includes the only self-weight of
the structure. Self-weight is default load case in ETABS. If the diagonal strut is included in the model then additional mass is to be
added for each joint where struts are drawn. Before conducting analysis model has to be checked. Once the model is checked if it
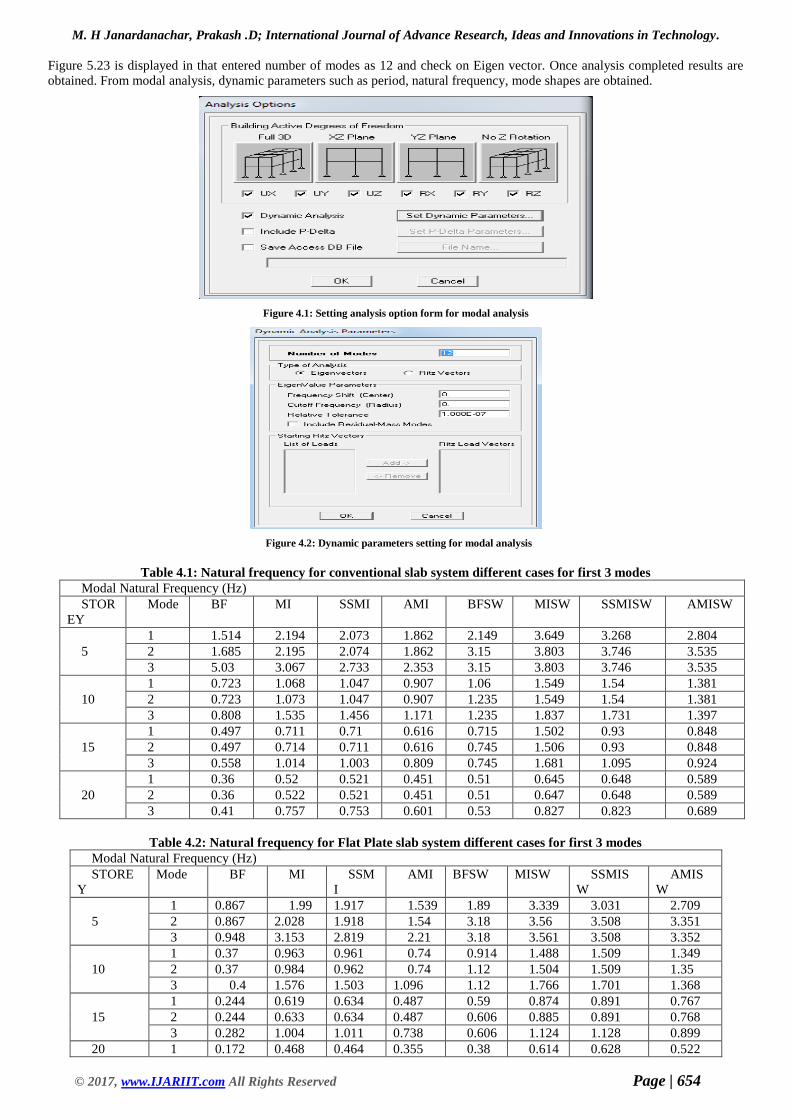
has no warnings and errors, the analysis is conducted. To carry out analysis click on Analysis>Set Analysis Option, the form
shown in Figure 5.22 displayed in that select 3d and check on dynamic analysis and select set dynamic parameters, shown in
M. H Janardanachar, Prakash .D; International Journal of Advance Research, Ideas and Innovations in Technology.
© 2017, www.IJARIIT.com All Rights Reserved Page | 654
Figure 5.23 is displayed in that entered number of modes as 12 and check on Eigen vector. Once analysis completed results are
obtained. From modal analysis, dynamic parameters such as period, natural frequency, mode shapes are obtained.
Figure 4.1: Setting analysis option form for modal analysis
Figure 4.2: Dynamic parameters setting for modal analysis
Table 4.1: Natural frequency for conventional slab system different cases for first 3 modes
Table 4.2: Natural frequency for Flat Plate slab system different cases for first 3 modes
Modal Natural Frequency (Hz)
STORE
Y
Mode BF MI SSM
I
AMI BFSW MISW SSMIS
W
AMIS
W
5
1 0.867 1.99 1.917 1.539 1.89 3.339 3.031 2.709
2 0.867 2.028 1.918 1.54 3.18 3.56 3.508 3.351
3 0.948 3.153 2.819 2.21 3.18 3.561 3.508 3.352
10
1 0.37 0.963 0.961 0.74 0.914 1.488 1.509 1.349
2 0.37 0.984 0.962 0.74 1.12 1.504 1.509 1.35
3 0.4 1.576 1.503 1.096 1.12 1.766 1.701 1.368
15
1 0.244 0.619 0.634 0.487 0.59 0.874 0.891 0.767
2 0.244 0.633 0.634 0.487 0.606 0.885 0.891 0.768
3 0.282 1.004 1.011 0.738 0.606 1.124 1.128 0.899
20 1 0.172 0.468 0.464 0.355 0.38 0.614 0.628 0.522
Modal Natural Frequency (Hz)
STOR
EY
Mode BF MI SSMI AMI BFSW MISW SSMISW AMISW
5
1 1.514 2.194 2.073 1.862 2.149 3.649 3.268 2.804
2 1.685 2.195 2.074 1.862 3.15 3.803 3.746 3.535
3 5.03 3.067 2.733 2.353 3.15 3.803 3.746 3.535
10
1 0.723 1.068 1.047 0.907 1.06 1.549 1.54 1.381
2 0.723 1.073 1.047 0.907 1.235 1.549 1.54 1.381
3 0.808 1.535 1.456 1.171 1.235 1.837 1.731 1.397
15
1 0.497 0.711 0.71 0.616 0.715 1.502 0.93 0.848
2 0.497 0.714 0.711 0.616 0.745 1.506 0.93 0.848
3 0.558 1.014 1.003 0.809 0.745 1.681 1.095 0.924
20
1 0.36 0.52 0.521 0.451 0.51 0.645 0.648 0.589
2 0.36 0.522 0.521 0.451 0.51 0.647 0.648 0.589
3 0.41 0.757 0.753 0.601 0.53 0.827 0.823 0.689
M. H Janardanachar, Prakash .D; International Journal of Advance Research, Ideas and Innovations in Technology.
© 2017, www.IJARIIT.com All Rights Reserved Page | 655
2 0.172 0.468 0.464 0.355 0.38 0.614 0.628 0.522
3 0.199 0.769 0.757 0.546 0.438 0.858 0.893 0.668
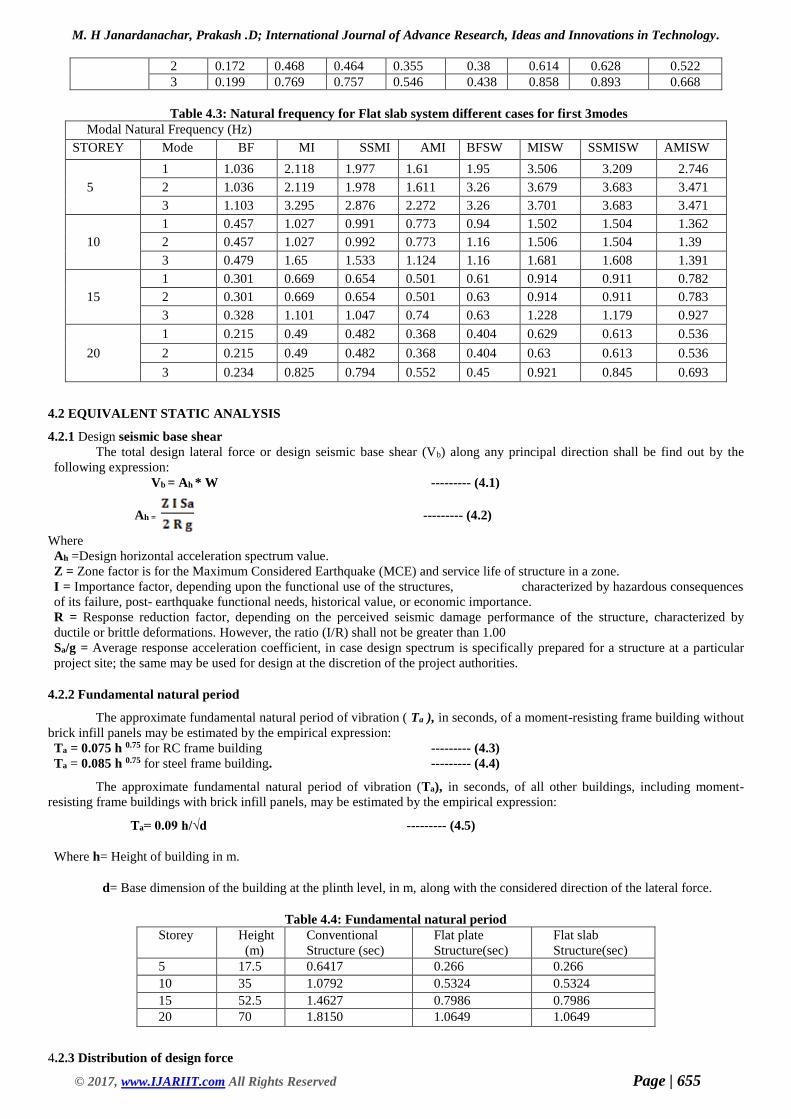
Table 4.3: Natural frequency for Flat slab system different cases for first 3modes
Modal Natural Frequency (Hz)
STOREY Mode BF MI SSMI AMI BFSW MISW SSMISW AMISW
5
1 1.036 2.118 1.977 1.61 1.95 3.506 3.209 2.746
2 1.036 2.119 1.978 1.611 3.26 3.679 3.683 3.471
3 1.103 3.295 2.876 2.272 3.26 3.701 3.683 3.471
10
1 0.457 1.027 0.991 0.773 0.94 1.502 1.504 1.362
2 0.457 1.027 0.992 0.773 1.16 1.506 1.504 1.39
3 0.479 1.65 1.533 1.124 1.16 1.681 1.608 1.391
15
1 0.301 0.669 0.654 0.501 0.61 0.914 0.911 0.782
2 0.301 0.669 0.654 0.501 0.63 0.914 0.911 0.783
3 0.328 1.101 1.047 0.74 0.63 1.228 1.179 0.927
20
1 0.215 0.49 0.482 0.368 0.404 0.629 0.613 0.536
2 0.215 0.49 0.482 0.368 0.404 0.63 0.613 0.536
3 0.234 0.825 0.794 0.552 0.45 0.921 0.845 0.693
4.2 EQUIVALENT STATIC ANALYSIS
4.2.1 Design seismic base shear
The total design lateral force or design seismic base shear (Vb) along any principal direction shall be find out by the
following expression:
Vb = Ah * W --------- (4.1)
Ah = --------- (4.2)
Where
Ah =Design horizontal acceleration spectrum value.
Z = Zone factor is for the Maximum Considered Earthquake (MCE) and service life of structure in a zone.
I = Importance factor, depending upon the functional use of the structures, characterized by hazardous consequences
of its failure, post- earthquake functional needs, historical value, or economic importance.
R = Response reduction factor, depending on the perceived seismic damage performance of the structure, characterized by
ductile or brittle deformations. However, the ratio (I/R) shall not be greater than 1.00
Sa/g = Average response acceleration coefficient, in case design spectrum is specifically prepared for a structure at a particular
project site; the same may be used for design at the discretion of the project authorities.
4.2.2 Fundamental natural period
The approximate fundamental natural period of vibration ( Ta ), in seconds, of a moment-resisting frame building without
brick infill panels may be estimated by the empirical expression:
Ta = 0.075 h 0.75 for RC frame building --------- (4.3)
Ta = 0.085 h 0.75 for steel frame building. --------- (4.4)
The approximate fundamental natural period of vibration (Ta), in seconds, of all other buildings, including moment-
resisting frame buildings with brick infill panels, may be estimated by the empirical expression:
Ta= 0.09 h/√d --------- (4.5)
Where h= Height of building in m.
d= Base dimension of the building at the plinth level, in m, along with the considered direction of the lateral force.
Table 4.4: Fundamental natural period
Storey Height
(m)
Conventional
Structure (sec)
Flat plate
Structure(sec)
Flat slab
Structure(sec)
5 17.5 0.6417 0.266 0.266
10 35 1.0792 0.5324 0.5324
15 52.5 1.4627 0.7986 0.7986
20 70 1.8150 1.0649 1.0649
4.2.3 Distribution of design force
M. H Janardanachar, Prakash .D; International Journal of Advance Research, Ideas and Innovations in Technology.
© 2017, www.IJARIIT.com All Rights Reserved Page | 656
The design base shear (Vb) computed in 4.1 shall be distributed along the height of the building as per the following
expression:
Qi = VB*(Wihi2) / Σ (Wihi
2), --------- (4.6)
Where Qi = Design lateral force at floor i,
Wi = Seismic weight of floor i,
hi = Height of floor i measured from the base, and
n = Number of storeys in the building is the number of levels in which the masses are located.
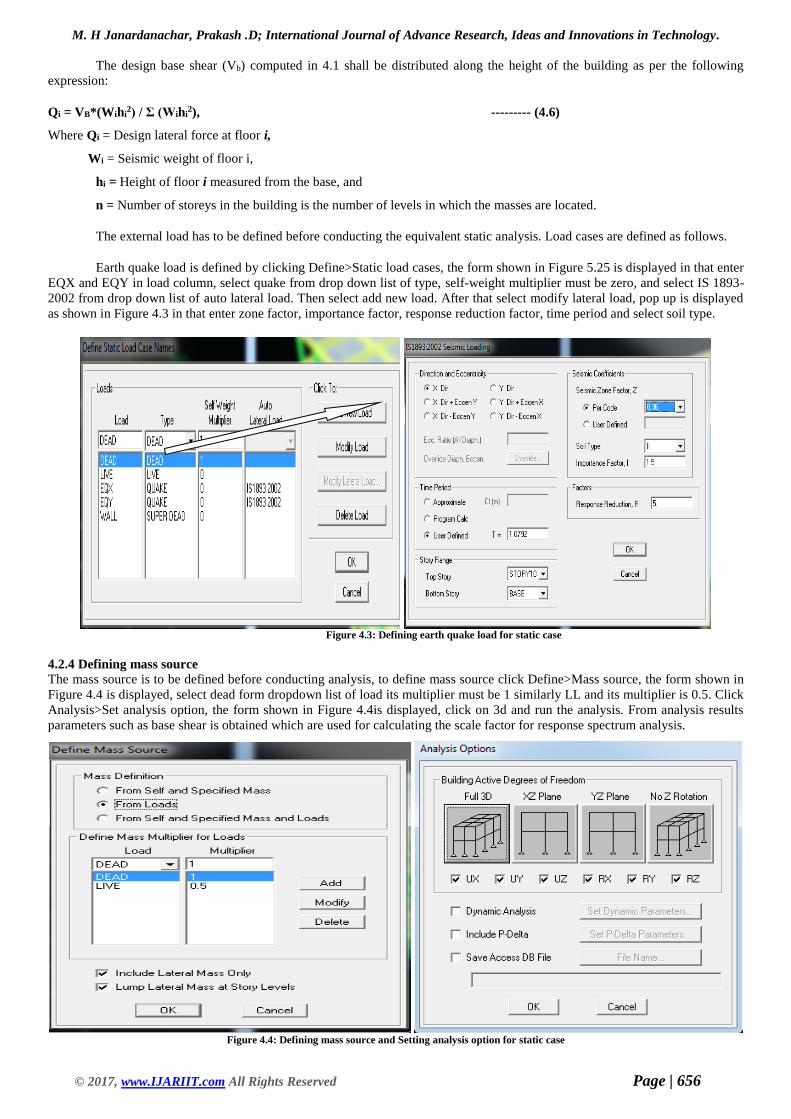
The external load has to be defined before conducting the equivalent static analysis. Load cases are defined as follows.
Earth quake load is defined by clicking Define>Static load cases, the form shown in Figure 5.25 is displayed in that enter
EQX and EQY in load column, select quake from drop down list of type, self-weight multiplier must be zero, and select IS 1893-
2002 from drop down list of auto lateral load. Then select add new load. After that select modify lateral load, pop up is displayed
as shown in Figure 4.3 in that enter zone factor, importance factor, response reduction factor, time period and select soil type.
Figure 4.3: Defining earth quake load for static case
4.2.4 Defining mass source
The mass source is to be defined before conducting analysis, to define mass source click Define>Mass source, the form shown in
Figure 4.4 is displayed, select dead form dropdown list of load its multiplier must be 1 similarly LL and its multiplier is 0.5. Click
Analysis>Set analysis option, the form shown in Figure 4.4is displayed, click on 3d and run the analysis. From analysis results
parameters such as base shear is obtained which are used for calculating the scale factor for response spectrum analysis.
Figure 4.4: Defining mass source and Setting analysis option for static case
M. H Janardanachar, Prakash .D; International Journal of Advance Research, Ideas and Innovations in Technology.
© 2017, www.IJARIIT.com All Rights Reserved Page | 657
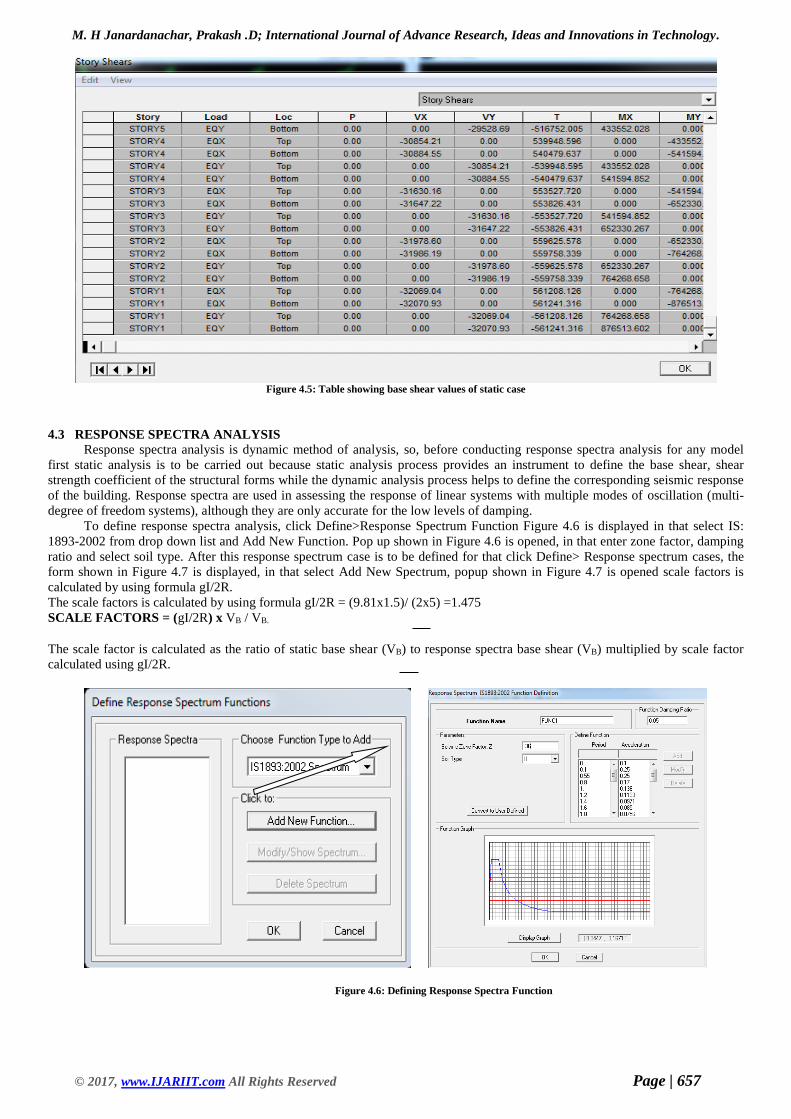
Figure 4.5: Table showing base shear values of static case
4.3 RESPONSE SPECTRA ANALYSIS
Response spectra analysis is dynamic method of analysis, so, before conducting response spectra analysis for any model
first static analysis is to be carried out because static analysis process provides an instrument to define the base shear, shear
strength coefficient of the structural forms while the dynamic analysis process helps to define the corresponding seismic response
of the building. Response spectra are used in assessing the response of linear systems with multiple modes of oscillation (multi-
degree of freedom systems), although they are only accurate for the low levels of damping.
To define response spectra analysis, click Define>Response Spectrum Function Figure 4.6 is displayed in that select IS:
1893-2002 from drop down list and Add New Function. Pop up shown in Figure 4.6 is opened, in that enter zone factor, damping
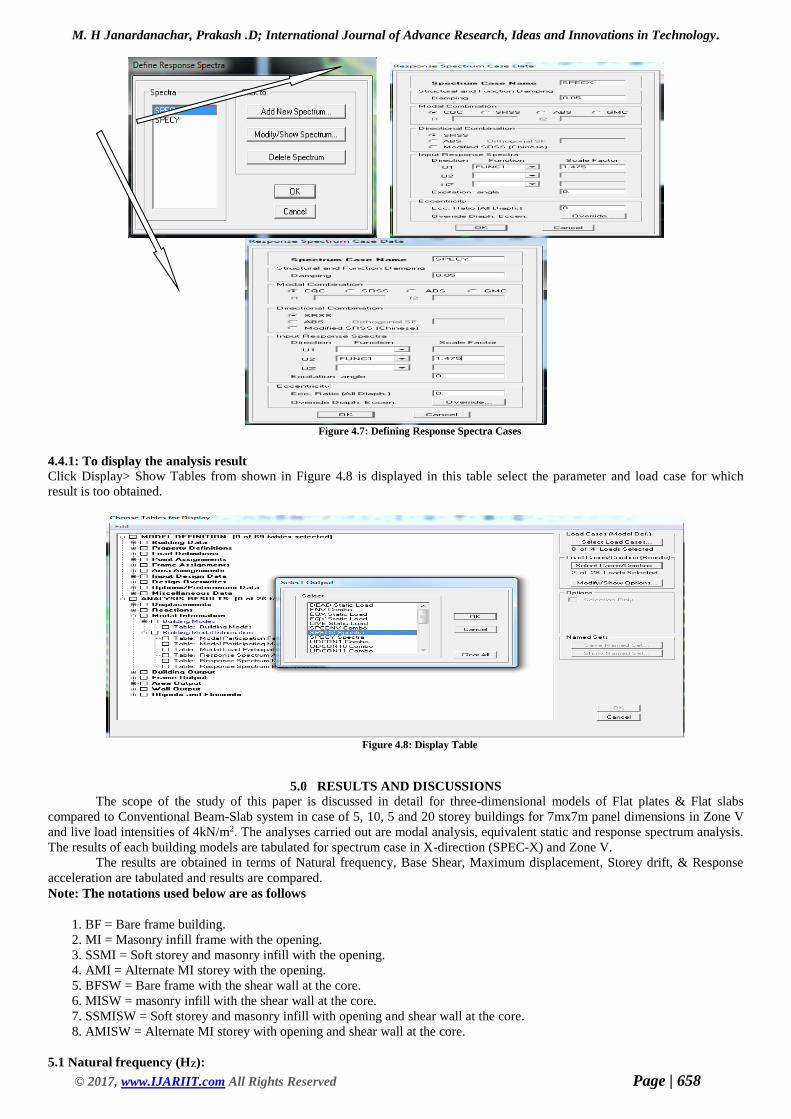
ratio and select soil type. After this response spectrum case is to be defined for that click Define> Response spectrum cases, the
form shown in Figure 4.7 is displayed, in that select Add New Spectrum, popup shown in Figure 4.7 is opened scale factors is
calculated by using formula gI/2R.
The scale factors is calculated by using formula gI/2R = (9.81x1.5)/ (2x5) =1.475
SCALE FACTORS = (gI/2R) x VB / VB.
The scale factor is calculated as the ratio of static base shear (VB) to response spectra base shear (VB) multiplied by scale factor
calculated using gI/2R.
Figure 4.6: Defining Response Spectra Function
M. H Janardanachar, Prakash .D; International Journal of Advance Research, Ideas and Innovations in Technology.
© 2017, www.IJARIIT.com All Rights Reserved Page | 658
Figure 4.7: Defining Response Spectra Cases
4.4.1: To display the analysis result
Click Display> Show Tables from shown in Figure 4.8 is displayed in this table select the parameter and load case for which
result is too obtained.
Figure 4.8: Display Table
5.0 RESULTS AND DISCUSSIONS
The scope of the study of this paper is discussed in detail for three-dimensional models of Flat plates & Flat slabs
compared to Conventional Beam-Slab system in case of 5, 10, 5 and 20 storey buildings for 7mx7m panel dimensions in Zone V
and live load intensities of 4kN/m2. The analyses carried out are modal analysis, equivalent static and response spectrum analysis.
The results of each building models are tabulated for spectrum case in X-direction (SPEC-X) and Zone V.
The results are obtained in terms of Natural frequency, Base Shear, Maximum displacement, Storey drift, & Response
acceleration are tabulated and results are compared.
Note: The notations used below are as follows
1. BF = Bare frame building.
2. MI = Masonry infill frame with the opening.
3. SSMI = Soft storey and masonry infill with the opening.
4. AMI = Alternate MI storey with the opening.
5. BFSW = Bare frame with the shear wall at the core.
6. MISW = masonry infill with the shear wall at the core.
7. SSMISW = Soft storey and masonry infill with opening and shear wall at the core.
8. AMISW = Alternate MI storey with opening and shear wall at the core.
5.1 Natural frequency (HZ):
M. H Janardanachar, Prakash .D; International Journal of Advance Research, Ideas and Innovations in Technology.
© 2017, www.IJARIIT.com All Rights Reserved Page | 659
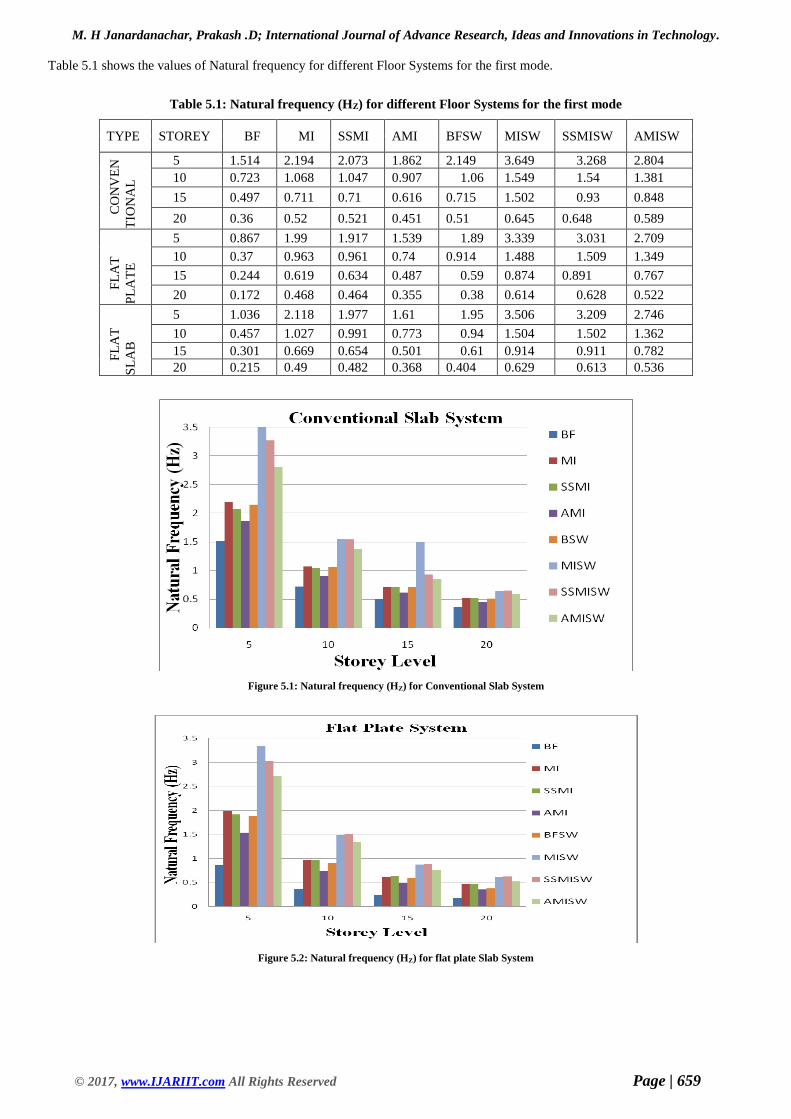
Table 5.1 shows the values of Natural frequency for different Floor Systems for the first mode.
Table 5.1: Natural frequency (HZ) for different Floor Systems for the first mode
TYPE STOREY BF MI SSMI AMI BFSW MISW SSMISW AMISW
CO
NV
EN
TIO
NA
L
5 1.514 2.194 2.073 1.862 2.149 3.649 3.268 2.804
10 0.723 1.068 1.047 0.907 1.06 1.549 1.54 1.381
15 0.497 0.711 0.71 0.616 0.715 1.502 0.93 0.848
20 0.36 0.52 0.521 0.451 0.51 0.645 0.648 0.589
FL
AT
PL
AT
E
5 0.867 1.99 1.917 1.539 1.89 3.339 3.031 2.709
10 0.37 0.963 0.961 0.74 0.914 1.488 1.509 1.349
15 0.244 0.619 0.634 0.487 0.59 0.874 0.891 0.767
20 0.172 0.468 0.464 0.355 0.38 0.614 0.628 0.522
FL
AT
SL
AB
5 1.036 2.118 1.977 1.61 1.95 3.506 3.209 2.746
10 0.457 1.027 0.991 0.773 0.94 1.504 1.502 1.362
15 0.301 0.669 0.654 0.501 0.61 0.914 0.911 0.782
20 0.215 0.49 0.482 0.368 0.404 0.629 0.613 0.536
Figure 5.1: Natural frequency (HZ) for Conventional Slab System
Figure 5.2: Natural frequency (HZ) for flat plate Slab System
M. H Janardanachar, Prakash .D; International Journal of Advance Research, Ideas and Innovations in Technology.
© 2017, www.IJARIIT.com All Rights Reserved Page | 660
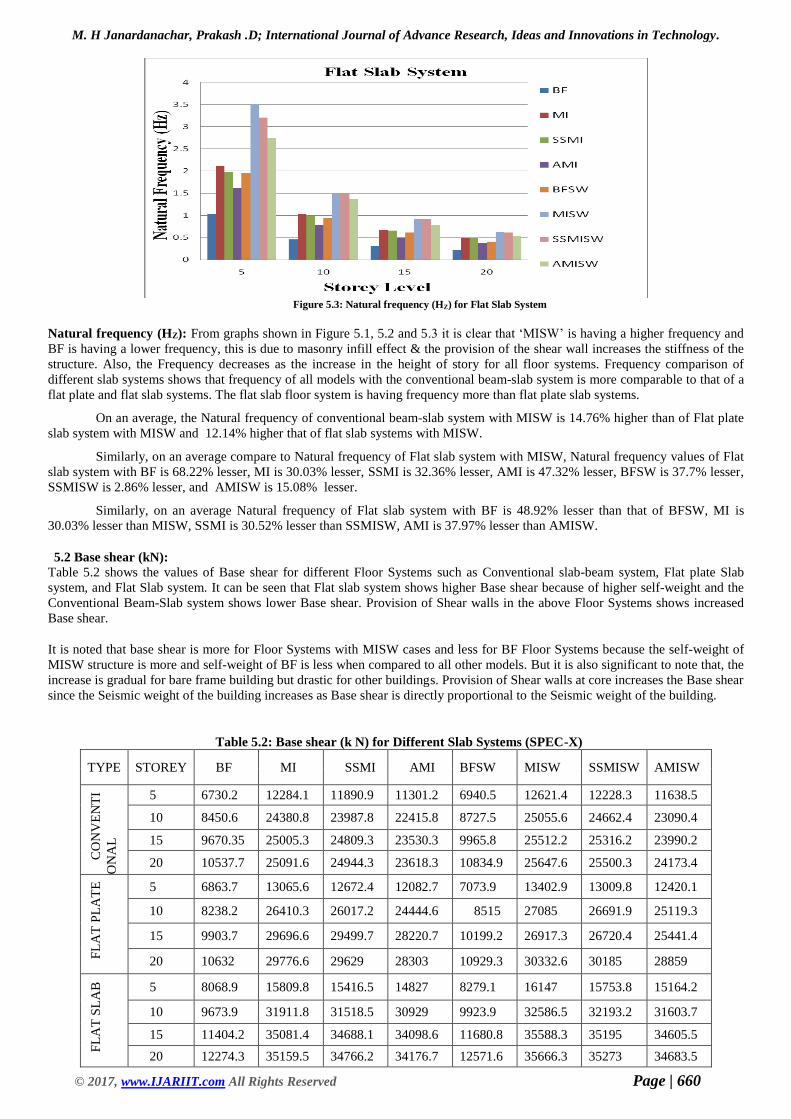
Figure 5.3: Natural frequency (HZ) for Flat Slab System
Natural frequency (HZ): From graphs shown in Figure 5.1, 5.2 and 5.3 it is clear that ‘MISW’ is having a higher frequency and
BF is having a lower frequency, this is due to masonry infill effect & the provision of the shear wall increases the stiffness of the
structure. Also, the Frequency decreases as the increase in the height of story for all floor systems. Frequency comparison of
different slab systems shows that frequency of all models with the conventional beam-slab system is more comparable to that of a
flat plate and flat slab systems. The flat slab floor system is having frequency more than flat plate slab systems.
On an average, the Natural frequency of conventional beam-slab system with MISW is 14.76% higher than of Flat plate
slab system with MISW and 12.14% higher that of flat slab systems with MISW.
Similarly, on an average compare to Natural frequency of Flat slab system with MISW, Natural frequency values of Flat
slab system with BF is 68.22% lesser, MI is 30.03% lesser, SSMI is 32.36% lesser, AMI is 47.32% lesser, BFSW is 37.7% lesser,
SSMISW is 2.86% lesser, and AMISW is 15.08% lesser.
Similarly, on an average Natural frequency of Flat slab system with BF is 48.92% lesser than that of BFSW, MI is
30.03% lesser than MISW, SSMI is 30.52% lesser than SSMISW, AMI is 37.97% lesser than AMISW.
5.2 Base shear (kN): Table 5.2 shows the values of Base shear for different Floor Systems such as Conventional slab-beam system, Flat plate Slab
system, and Flat Slab system. It can be seen that Flat slab system shows higher Base shear because of higher self-weight and the
Conventional Beam-Slab system shows lower Base shear. Provision of Shear walls in the above Floor Systems shows increased
Base shear.
It is noted that base shear is more for Floor Systems with MISW cases and less for BF Floor Systems because the self-weight of
MISW structure is more and self-weight of BF is less when compared to all other models. But it is also significant to note that, the
increase is gradual for bare frame building but drastic for other buildings. Provision of Shear walls at core increases the Base shear
since the Seismic weight of the building increases as Base shear is directly proportional to the Seismic weight of the building.
Table 5.2: Base shear (k N) for Different Slab Systems (SPEC-X)
TYPE STOREY BF MI SSMI AMI BFSW MISW SSMISW AMISW
CO
NV
EN
TI
ON
AL
5 6730.2 12284.1 11890.9 11301.2 6940.5 12621.4 12228.3 11638.5
10 8450.6 24380.8 23987.8 22415.8 8727.5 25055.6 24662.4 23090.4
15 9670.35 25005.3 24809.3 23530.3 9965.8 25512.2 25316.2 23990.2
20 10537.7 25091.6 24944.3 23618.3 10834.9 25647.6 25500.3 24173.4
FL
AT
PL
AT
E
5 6863.7 13065.6 12672.4 12082.7 7073.9 13402.9 13009.8 12420.1
10 8238.2 26410.3 26017.2 24444.6 8515 27085 26691.9 25119.3
15 9903.7 29696.6 29499.7 28220.7 10199.2 26917.3 26720.4 25441.4
20 10632 29776.6 29629 28303 10929.3 30332.6 30185 28859
FL
AT
SL
AB
5 8068.9 15809.8 15416.5 14827 8279.1 16147 15753.8 15164.2
10 9673.9 31911.8 31518.5 30929 9923.9 32586.5 32193.2 31603.7
15 11404.2 35081.4 34688.1 34098.6 11680.8 35588.3 35195 34605.5
20 12274.3 35159.5 34766.2 34176.7 12571.6 35666.3 35273 34683.5
M. H Janardanachar, Prakash .D; International Journal of Advance Research, Ideas and Innovations in Technology.
© 2017, www.IJARIIT.com All Rights Reserved Page | 661
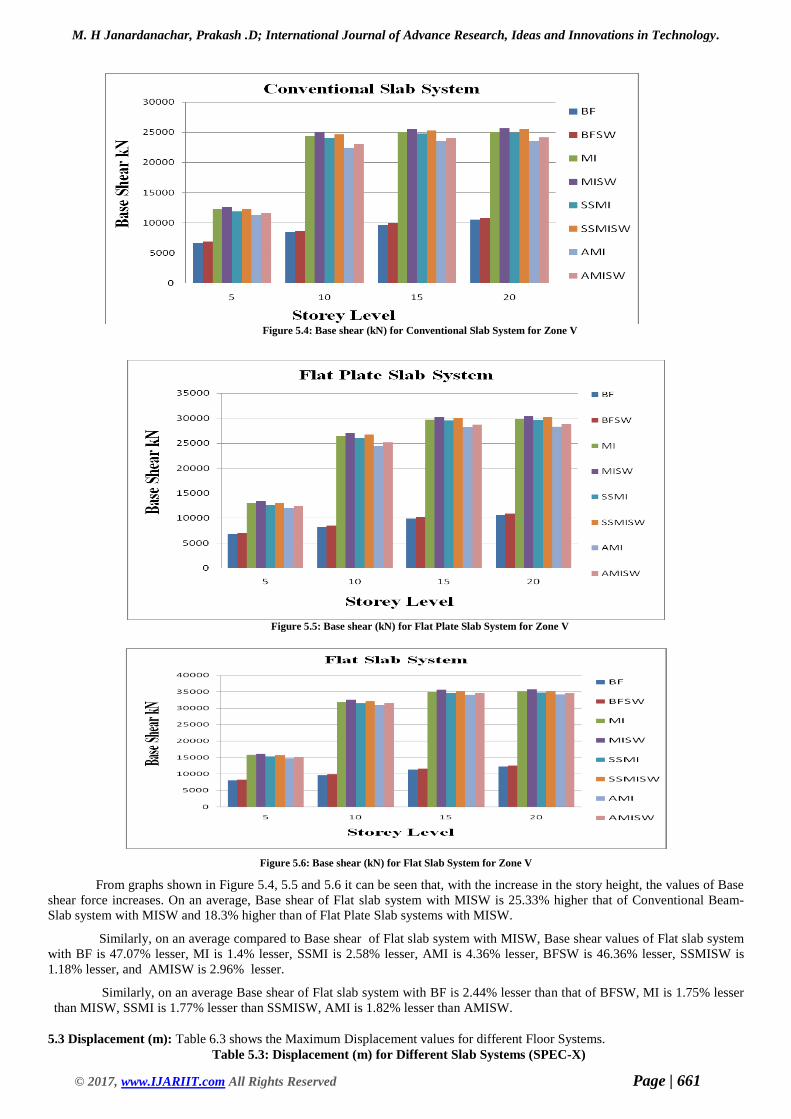
Figure 5.4: Base shear (kN) for Conventional Slab System for Zone V
Figure 5.5: Base shear (kN) for Flat Plate Slab System for Zone V
Figure 5.6: Base shear (kN) for Flat Slab System for Zone V
From graphs shown in Figure 5.4, 5.5 and 5.6 it can be seen that, with the increase in the story height, the values of Base
shear force increases. On an average, Base shear of Flat slab system with MISW is 25.33% higher that of Conventional Beam-
Slab system with MISW and 18.3% higher than of Flat Plate Slab systems with MISW.
Similarly, on an average compared to Base shear of Flat slab system with MISW, Base shear values of Flat slab system
with BF is 47.07% lesser, MI is 1.4% lesser, SSMI is 2.58% lesser, AMI is 4.36% lesser, BFSW is 46.36% lesser, SSMISW is
1.18% lesser, and AMISW is 2.96% lesser.
Similarly, on an average Base shear of Flat slab system with BF is 2.44% lesser than that of BFSW, MI is 1.75% lesser
than MISW, SSMI is 1.77% lesser than SSMISW, AMI is 1.82% lesser than AMISW.
5.3 Displacement (m): Table 6.3 shows the Maximum Displacement values for different Floor Systems.
Table 5.3: Displacement (m) for Different Slab Systems (SPEC-X)
M. H Janardanachar, Prakash .D; International Journal of Advance Research, Ideas and Innovations in Technology.
© 2017, www.IJARIIT.com All Rights Reserved Page | 662
TYPE STOREY BF MI SSMI AMI BFSW MISW SSMISW AMISW
CO
NV
EN
TIO
NA
L
5 0.0374 0.0264 0.0285 0.0294 0.0125 0.0063 0.0109 0.0111
10 0.152 0.0737 0.11 0.1125 0.0748 0.0292 0.0626 0.0631
15 0.2289 0.1155 0.1691 0.1694 0.1252 0.0535 0.1048 0.1053
20 0.319 0.1736 0.2388 0.2377 0.194 0.0862 0.1577 0.1584
FL
AT
PL
AT
E
5 0.099 0.0336 0.0356 0.0622 0.0445 0.0076 0.0106 0.0108
10 0.3192 .1399 0.14 .2438 0.0836 0.0543 0.0672 0.0914
15 0.5655 0.2239 0.2315 0.3939 0.153
1
0.106
3 0.116 0.118
20 0.7312 0.3108 0.3135 0.5511 0.328 0.1616 0.1816 0.2314
FL
AT
SL
AB
5 0.0658 0.0291 0.0318 0.0538 0.0128 0.007 0.0097 0.0099
10 0.2216 0.1205 0.1256 0.2117 0.0766 0.0386 0.0611 0.0625
15 0.3862 0.1934 0.199 0.351 0.1504 0.0778 0.1111 0.1426
20 0.5932 0.272 0.2771 0.486 0.2485 0.118 0.1667 0.1837
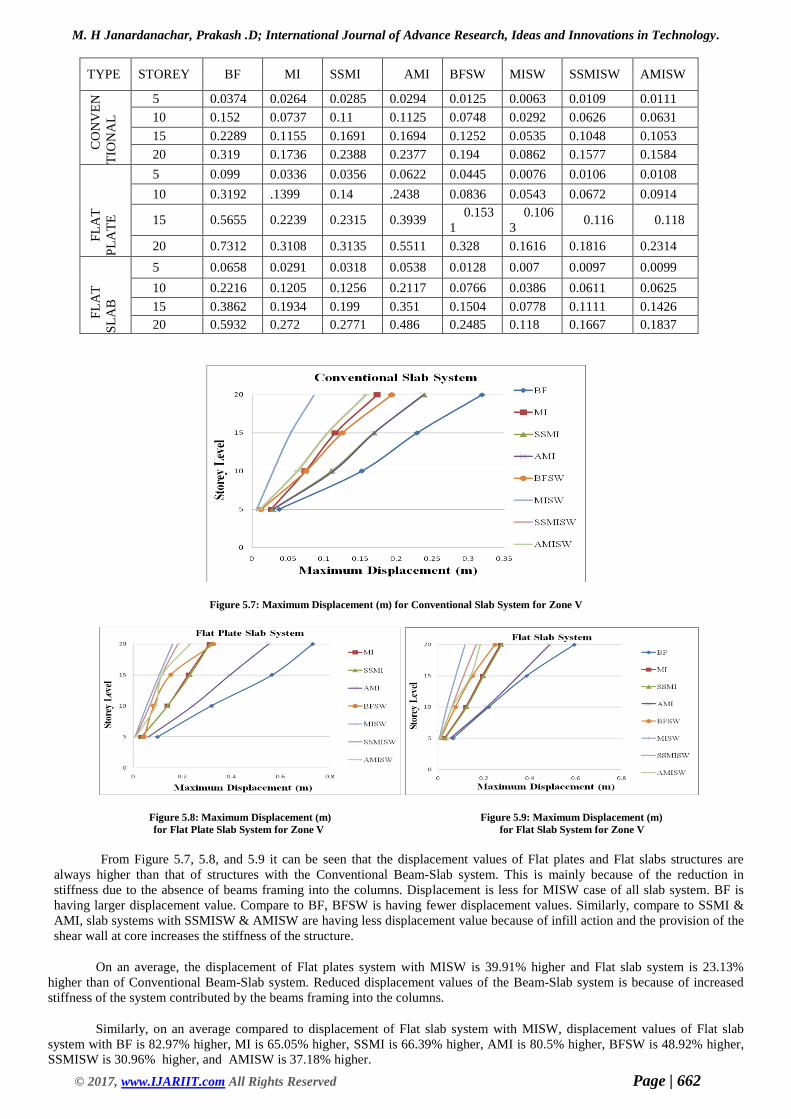
Figure 5.7: Maximum Displacement (m) for Conventional Slab System for Zone V
Figure 5.8: Maximum Displacement (m) Figure 5.9: Maximum Displacement (m)
for Flat Plate Slab System for Zone V for Flat Slab System for Zone V
From Figure 5.7, 5.8, and 5.9 it can be seen that the displacement values of Flat plates and Flat slabs structures are
always higher than that of structures with the Conventional Beam-Slab system. This is mainly because of the reduction in
stiffness due to the absence of beams framing into the columns. Displacement is less for MISW case of all slab system. BF is
having larger displacement value. Compare to BF, BFSW is having fewer displacement values. Similarly, compare to SSMI &
AMI, slab systems with SSMISW & AMISW are having less displacement value because of infill action and the provision of the
shear wall at core increases the stiffness of the structure.
On an average, the displacement of Flat plates system with MISW is 39.91% higher and Flat slab system is 23.13%
higher than of Conventional Beam-Slab system. Reduced displacement values of the Beam-Slab system is because of increased
stiffness of the system contributed by the beams framing into the columns.
Similarly, on an average compared to displacement of Flat slab system with MISW, displacement values of Flat slab
system with BF is 82.97% higher, MI is 65.05% higher, SSMI is 66.39% higher, AMI is 80.5% higher, BFSW is 48.92% higher,
SSMISW is 30.96% higher, and AMISW is 37.18% higher.
M. H Janardanachar, Prakash .D; International Journal of Advance Research, Ideas and Innovations in Technology.
© 2017, www.IJARIIT.com All Rights Reserved Page | 663
Similarly, on an average displacement of Flat slab system with BF is 66.28% higher than that of BFSW, MI is 65.07%
higher than MISW, SSMI is 51.21% higher than SSMISW, AMI is 68.41% higher than AMISW.
5.4: Storey Drift (mm)
Inter-storey drift or Storey drift is defined as the relative horizontal displacement of one level relative to the other level
above or below it, or between two adjacent floors bounding the story. Table 5.4 shows the Storey Drift values for 5-story Building
with different Floor Systems for Zone V.
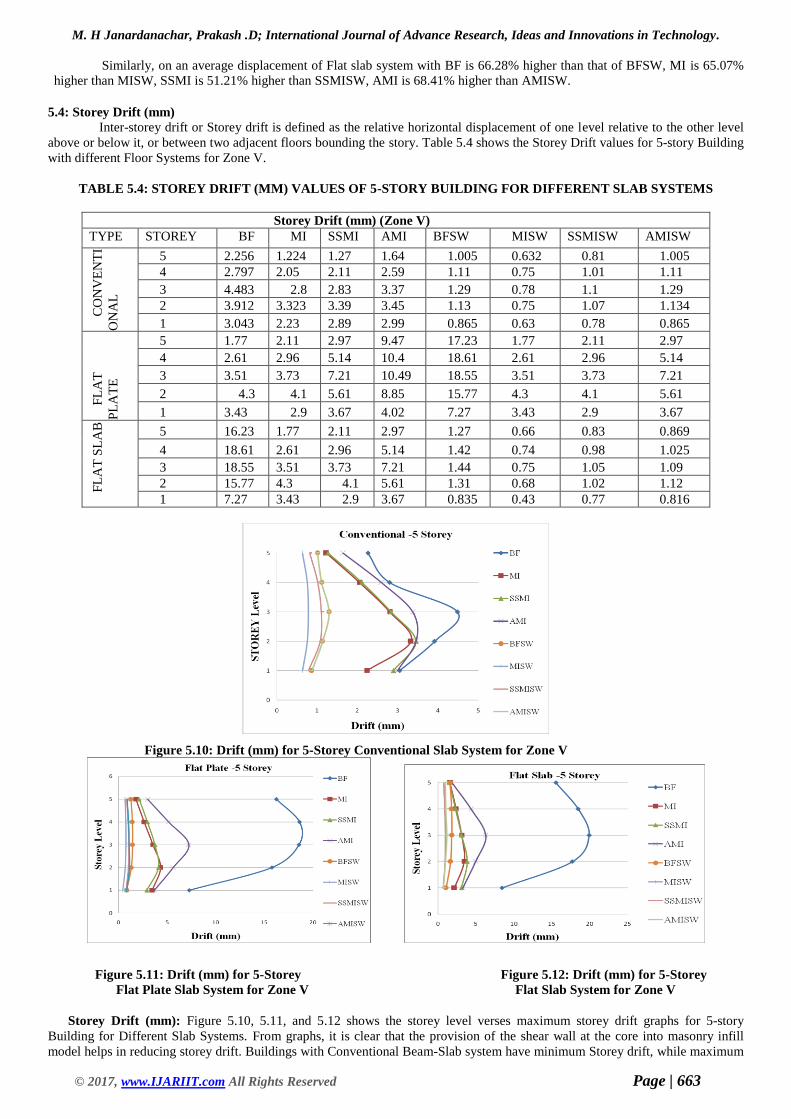
TABLE 5.4: STOREY DRIFT (MM) VALUES OF 5-STORY BUILDING FOR DIFFERENT SLAB SYSTEMS
Storey Drift (mm) (Zone V)
TYPE STOREY BF MI SSMI AMI BFSW MISW SSMISW AMISW
CO
NV
EN
TI
ON
AL
5 2.256 1.224 1.27 1.64 1.005 0.632 0.81 1.005
4 2.797 2.05 2.11 2.59 1.11 0.75 1.01 1.11
3 4.483 2.8 2.83 3.37 1.29 0.78 1.1 1.29
2 3.912 3.323 3.39 3.45 1.13 0.75 1.07 1.134
1 3.043 2.23 2.89 2.99 0.865 0.63 0.78 0.865
FL
AT
PL
AT
E
5 1.77 2.11 2.97 9.47 17.23 1.77 2.11 2.97
4 2.61 2.96 5.14 10.4 18.61 2.61 2.96 5.14
3 3.51 3.73 7.21 10.49 18.55 3.51 3.73 7.21
2 4.3 4.1 5.61 8.85 15.77 4.3 4.1 5.61
1 3.43 2.9 3.67 4.02 7.27 3.43 2.9 3.67
FL
AT
SL
AB
5 16.23 1.77 2.11 2.97 1.27 0.66 0.83 0.869
4 18.61 2.61 2.96 5.14 1.42 0.74 0.98 1.025
3 18.55 3.51 3.73 7.21 1.44 0.75 1.05 1.09
2 15.77 4.3 4.1 5.61 1.31 0.68 1.02 1.12
1 7.27 3.43 2.9 3.67 0.835 0.43 0.77 0.816
Figure 5.10: Drift (mm) for 5-Storey Conventional Slab System for Zone V
Figure 5.11: Drift (mm) for 5-Storey Figure 5.12: Drift (mm) for 5-Storey
Flat Plate Slab System for Zone V Flat Slab System for Zone V
Storey Drift (mm): Figure 5.10, 5.11, and 5.12 shows the storey level verses maximum storey drift graphs for 5-story
Building for Different Slab Systems. From graphs, it is clear that the provision of the shear wall at the core into masonry infill
model helps in reducing storey drift. Buildings with Conventional Beam-Slab system have minimum Storey drift, while maximum
M. H Janardanachar, Prakash .D; International Journal of Advance Research, Ideas and Innovations in Technology.
© 2017, www.IJARIIT.com All Rights Reserved Page | 664
Storey drift is obtained for buildings with Flat plate slab system. Drift values of structures having Flat slab lie between structures
having Flat plates and Conventional Beam-Slab system.
Storey drift is less for MISW case of all slab system. BF is having larger drift value. Compare to BF model, BFSW is
having less storey drift values. Similarly compare to SSMI & AMI, SSMISW & AMISW is having less drift value because of the
provision of the core. It can be observed that fully infilled Slab systems show fewer values of Storey drift compare to the bare
frame and partially infilled Slab systems.
Hence, it can be observed that the Slab systems with masonry infill & without Shear walls show high values of Storey
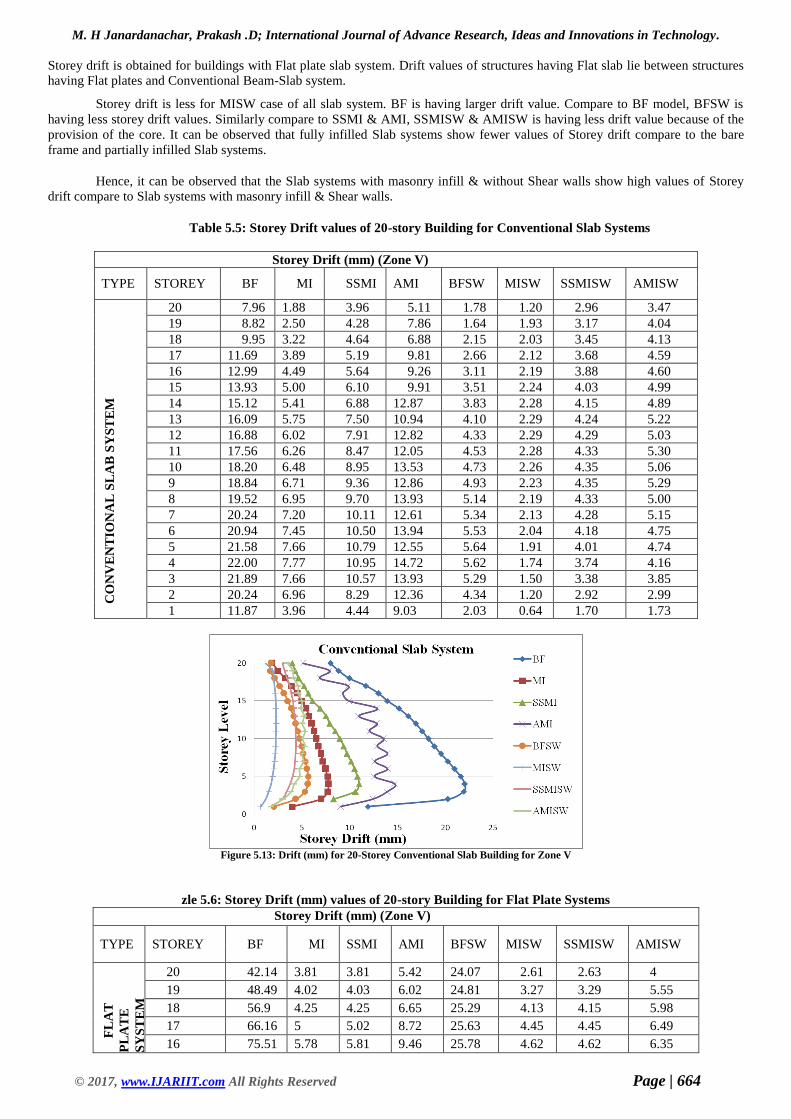
drift compare to Slab systems with masonry infill & Shear walls.
Table 5.5: Storey Drift values of 20-story Building for Conventional Slab Systems
Storey Drift (mm) (Zone V)
TYPE STOREY BF MI SSMI AMI BFSW MISW SSMISW AMISW
CO
NV
EN
TIO
NA
L S
LA
B S
YS
TE
M
20 7.96 1.88 3.96 5.11 1.78 1.20 2.96 3.47
19 8.82 2.50 4.28 7.86 1.64 1.93 3.17 4.04
18 9.95 3.22 4.64 6.88 2.15 2.03 3.45 4.13
17 11.69 3.89 5.19 9.81 2.66 2.12 3.68 4.59
16 12.99 4.49 5.64 9.26 3.11 2.19 3.88 4.60
15 13.93 5.00 6.10 9.91 3.51 2.24 4.03 4.99
14 15.12 5.41 6.88 12.87 3.83 2.28 4.15 4.89
13 16.09 5.75 7.50 10.94 4.10 2.29 4.24 5.22
12 16.88 6.02 7.91 12.82 4.33 2.29 4.29 5.03
11 17.56 6.26 8.47 12.05 4.53 2.28 4.33 5.30
10 18.20 6.48 8.95 13.53 4.73 2.26 4.35 5.06
9 18.84 6.71 9.36 12.86 4.93 2.23 4.35 5.29
8 19.52 6.95 9.70 13.93 5.14 2.19 4.33 5.00
7 20.24 7.20 10.11 12.61 5.34 2.13 4.28 5.15
6 20.94 7.45 10.50 13.94 5.53 2.04 4.18 4.75
5 21.58 7.66 10.79 12.55 5.64 1.91 4.01 4.74
4 22.00 7.77 10.95 14.72 5.62 1.74 3.74 4.16
3 21.89 7.66 10.57 13.93 5.29 1.50 3.38 3.85
2 20.24 6.96 8.29 12.36 4.34 1.20 2.92 2.99
1 11.87 3.96 4.44 9.03 2.03 0.64 1.70 1.73
Figure 5.13: Drift (mm) for 20-Storey Conventional Slab Building for Zone V
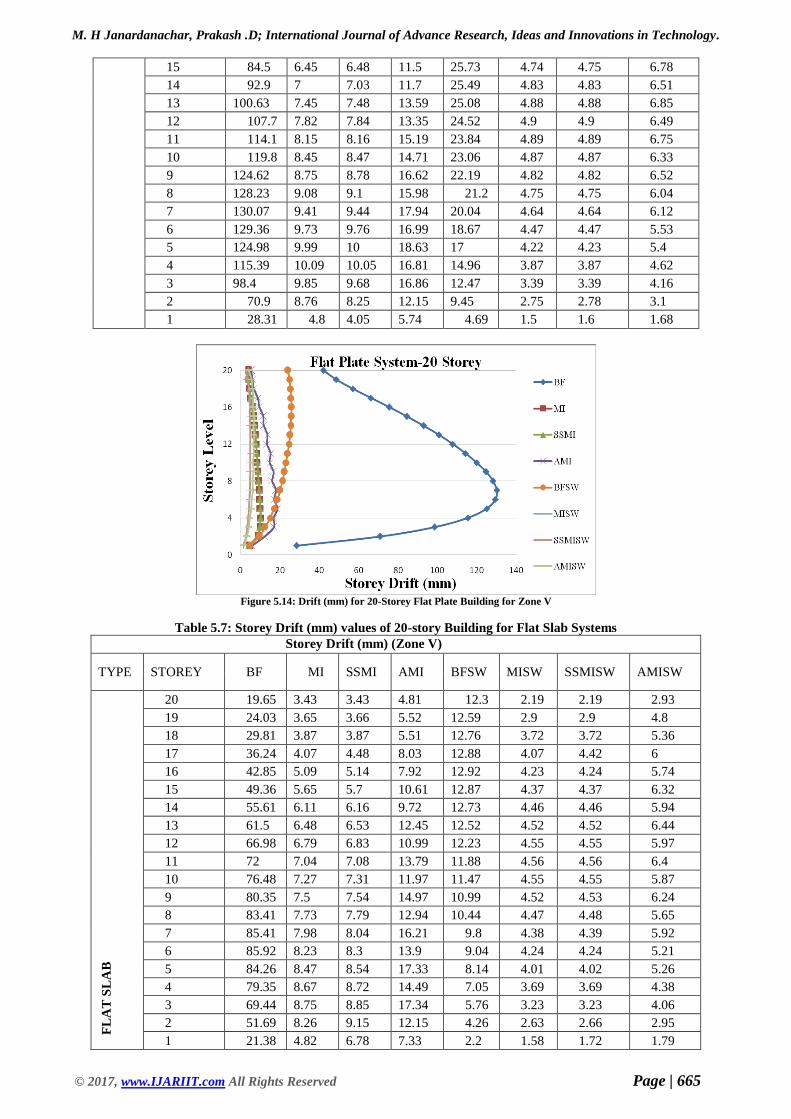
zle 5.6: Storey Drift (mm) values of 20-story Building for Flat Plate Systems
Storey Drift (mm) (Zone V)
TYPE STOREY BF MI SSMI AMI BFSW MISW SSMISW AMISW
FL
AT
PL
AT
E
SY
ST
EM
20 42.14 3.81 3.81 5.42 24.07 2.61 2.63 4
19 48.49 4.02 4.03 6.02 24.81 3.27 3.29 5.55
18 56.9 4.25 4.25 6.65 25.29 4.13 4.15 5.98
17 66.16 5 5.02 8.72 25.63 4.45 4.45 6.49
16 75.51 5.78 5.81 9.46 25.78 4.62 4.62 6.35
M. H Janardanachar, Prakash .D; International Journal of Advance Research, Ideas and Innovations in Technology.
© 2017, www.IJARIIT.com All Rights Reserved Page | 665
15 84.5 6.45 6.48 11.5 25.73 4.74 4.75 6.78
14 92.9 7 7.03 11.7 25.49 4.83 4.83 6.51
13 100.63 7.45 7.48 13.59 25.08 4.88 4.88 6.85
12 107.7 7.82 7.84 13.35 24.52 4.9 4.9 6.49
11 114.1 8.15 8.16 15.19 23.84 4.89 4.89 6.75
10 119.8 8.45 8.47 14.71 23.06 4.87 4.87 6.33
9 124.62 8.75 8.78 16.62 22.19 4.82 4.82 6.52
8 128.23 9.08 9.1 15.98 21.2 4.75 4.75 6.04
7 130.07 9.41 9.44 17.94 20.04 4.64 4.64 6.12
6 129.36 9.73 9.76 16.99 18.67 4.47 4.47 5.53
5 124.98 9.99 10 18.63 17 4.22 4.23 5.4
4 115.39 10.09 10.05 16.81 14.96 3.87 3.87 4.62
3 98.4 9.85 9.68 16.86 12.47 3.39 3.39 4.16
2 70.9 8.76 8.25 12.15 9.45 2.75 2.78 3.1
1 28.31 4.8 4.05 5.74 4.69 1.5 1.6 1.68
Figure 5.14: Drift (mm) for 20-Storey Flat Plate Building for Zone V
Table 5.7: Storey Drift (mm) values of 20-story Building for Flat Slab Systems
Storey Drift (mm) (Zone V)
TYPE STOREY BF MI SSMI AMI BFSW MISW SSMISW AMISW
FL
AT
SL
AB
20 19.65 3.43 3.43 4.81 12.3 2.19 2.19 2.93
19 24.03 3.65 3.66 5.52 12.59 2.9 2.9 4.8
18 29.81 3.87 3.87 5.51 12.76 3.72 3.72 5.36
17 36.24 4.07 4.48 8.03 12.88 4.07 4.42 6
16 42.85 5.09 5.14 7.92 12.92 4.23 4.24 5.74
15 49.36 5.65 5.7 10.61 12.87 4.37 4.37 6.32
14 55.61 6.11 6.16 9.72 12.73 4.46 4.46 5.94
13 61.5 6.48 6.53 12.45 12.52 4.52 4.52 6.44
12 66.98 6.79 6.83 10.99 12.23 4.55 4.55 5.97
11 72 7.04 7.08 13.79 11.88 4.56 4.56 6.4
10 76.48 7.27 7.31 11.97 11.47 4.55 4.55 5.87
9 80.35 7.5 7.54 14.97 10.99 4.52 4.53 6.24
8 83.41 7.73 7.79 12.94 10.44 4.47 4.48 5.65
7 85.41 7.98 8.04 16.21 9.8 4.38 4.39 5.92
6 85.92 8.23 8.3 13.9 9.04 4.24 4.24 5.21
5 84.26 8.47 8.54 17.33 8.14 4.01 4.02 5.26
4 79.35 8.67 8.72 14.49 7.05 3.69 3.69 4.38
3 69.44 8.75 8.85 17.34 5.76 3.23 3.23 4.06
2 51.69 8.26 9.15 12.15 4.26 2.63 2.66 2.95
1 21.38 4.82 6.78 7.33 2.2 1.58 1.72 1.79
M. H Janardanachar, Prakash .D; International Journal of Advance Research, Ideas and Innovations in Technology.
© 2017, www.IJARIIT.com All Rights Reserved Page | 666
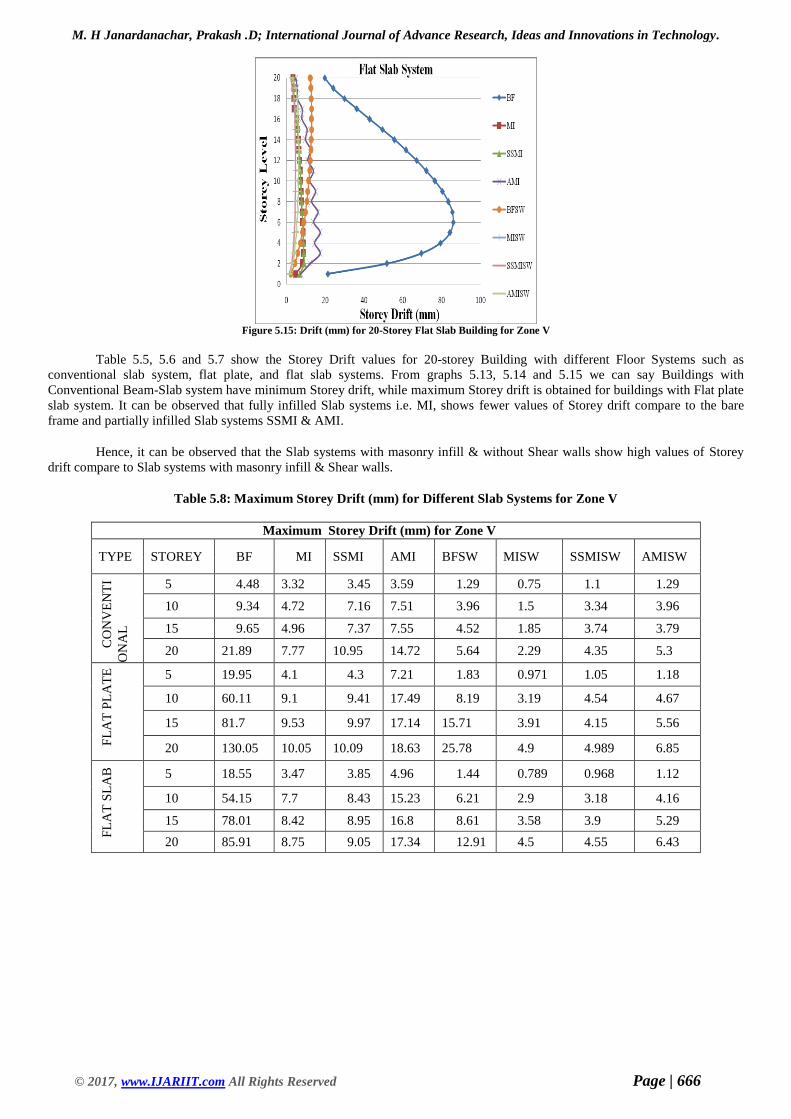
Figure 5.15: Drift (mm) for 20-Storey Flat Slab Building for Zone V
Table 5.5, 5.6 and 5.7 show the Storey Drift values for 20-storey Building with different Floor Systems such as
conventional slab system, flat plate, and flat slab systems. From graphs 5.13, 5.14 and 5.15 we can say Buildings with
Conventional Beam-Slab system have minimum Storey drift, while maximum Storey drift is obtained for buildings with Flat plate
slab system. It can be observed that fully infilled Slab systems i.e. MI, shows fewer values of Storey drift compare to the bare
frame and partially infilled Slab systems SSMI & AMI.
Hence, it can be observed that the Slab systems with masonry infill & without Shear walls show high values of Storey
drift compare to Slab systems with masonry infill & Shear walls.
Table 5.8: Maximum Storey Drift (mm) for Different Slab Systems for Zone V
Maximum Storey Drift (mm) for Zone V
TYPE STOREY BF MI SSMI AMI BFSW MISW SSMISW AMISW
CO
NV
EN
TI
ON
AL
5 4.48 3.32 3.45 3.59 1.29 0.75 1.1 1.29
10 9.34 4.72 7.16 7.51 3.96 1.5 3.34 3.96
15 9.65 4.96 7.37 7.55 4.52 1.85 3.74 3.79
20 21.89 7.77 10.95 14.72 5.64 2.29 4.35 5.3
FL
AT
PL
AT
E
5 19.95 4.1 4.3 7.21 1.83 0.971 1.05 1.18
10 60.11 9.1 9.41 17.49 8.19 3.19 4.54 4.67
15 81.7 9.53 9.97 17.14 15.71 3.91 4.15 5.56
20 130.05 10.05 10.09 18.63 25.78 4.9 4.989 6.85
FL
AT
SL
AB
5 18.55 3.47 3.85 4.96 1.44 0.789 0.968 1.12
10 54.15 7.7 8.43 15.23 6.21 2.9 3.18 4.16
15 78.01 8.42 8.95 16.8 8.61 3.58 3.9 5.29
20 85.91 8.75 9.05 17.34 12.91 4.5 4.55 6.43
M. H Janardanachar, Prakash .D; International Journal of Advance Research, Ideas and Innovations in Technology.
© 2017, www.IJARIIT.com All Rights Reserved Page | 667
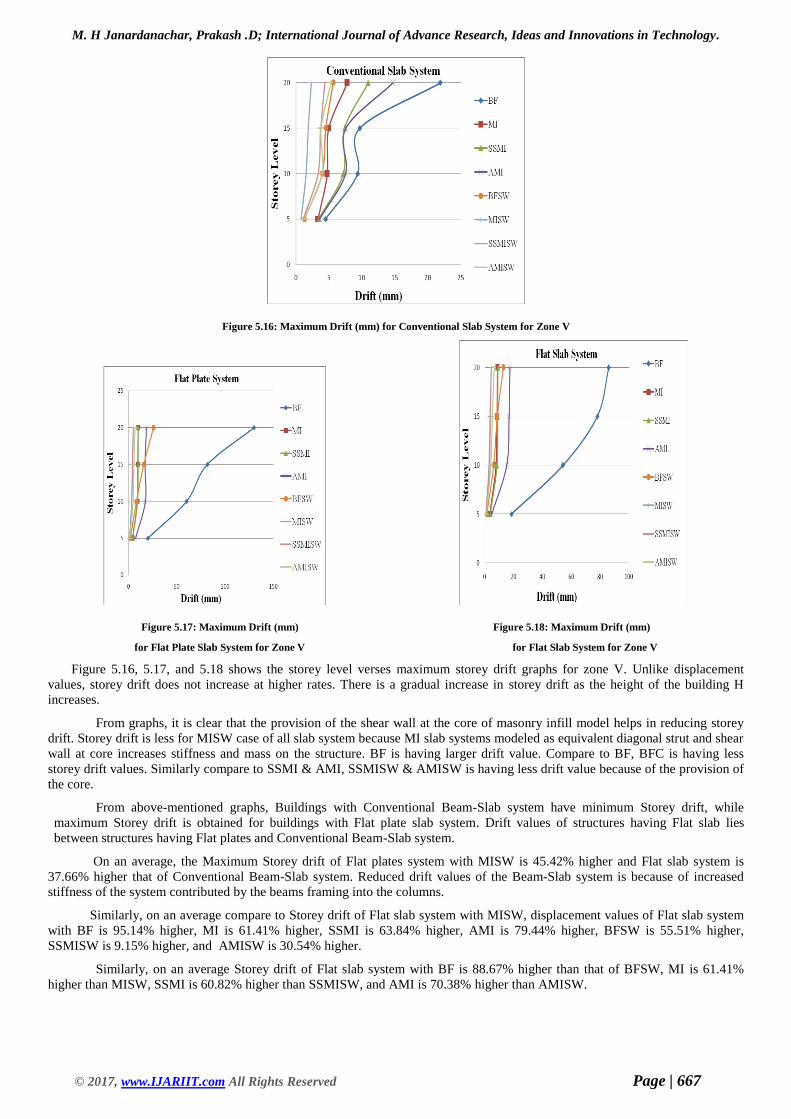
Figure 5.16: Maximum Drift (mm) for Conventional Slab System for Zone V
Figure 5.17: Maximum Drift (mm) Figure 5.18: Maximum Drift (mm)
for Flat Plate Slab System for Zone V for Flat Slab System for Zone V
Figure 5.16, 5.17, and 5.18 shows the storey level verses maximum storey drift graphs for zone V. Unlike displacement
values, storey drift does not increase at higher rates. There is a gradual increase in storey drift as the height of the building H
increases.
From graphs, it is clear that the provision of the shear wall at the core of masonry infill model helps in reducing storey
drift. Storey drift is less for MISW case of all slab system because MI slab systems modeled as equivalent diagonal strut and shear
wall at core increases stiffness and mass on the structure. BF is having larger drift value. Compare to BF, BFC is having less
storey drift values. Similarly compare to SSMI & AMI, SSMISW & AMISW is having less drift value because of the provision of
the core.
From above-mentioned graphs, Buildings with Conventional Beam-Slab system have minimum Storey drift, while
maximum Storey drift is obtained for buildings with Flat plate slab system. Drift values of structures having Flat slab lies
between structures having Flat plates and Conventional Beam-Slab system.
On an average, the Maximum Storey drift of Flat plates system with MISW is 45.42% higher and Flat slab system is
37.66% higher that of Conventional Beam-Slab system. Reduced drift values of the Beam-Slab system is because of increased
stiffness of the system contributed by the beams framing into the columns.
Similarly, on an average compare to Storey drift of Flat slab system with MISW, displacement values of Flat slab system
with BF is 95.14% higher, MI is 61.41% higher, SSMI is 63.84% higher, AMI is 79.44% higher, BFSW is 55.51% higher,
SSMISW is 9.15% higher, and AMISW is 30.54% higher.
Similarly, on an average Storey drift of Flat slab system with BF is 88.67% higher than that of BFSW, MI is 61.41%
higher than MISW, SSMI is 60.82% higher than SSMISW, and AMI is 70.38% higher than AMISW.
M. H Janardanachar, Prakash .D; International Journal of Advance Research, Ideas and Innovations in Technology.
© 2017, www.IJARIIT.com All Rights Reserved Page | 668
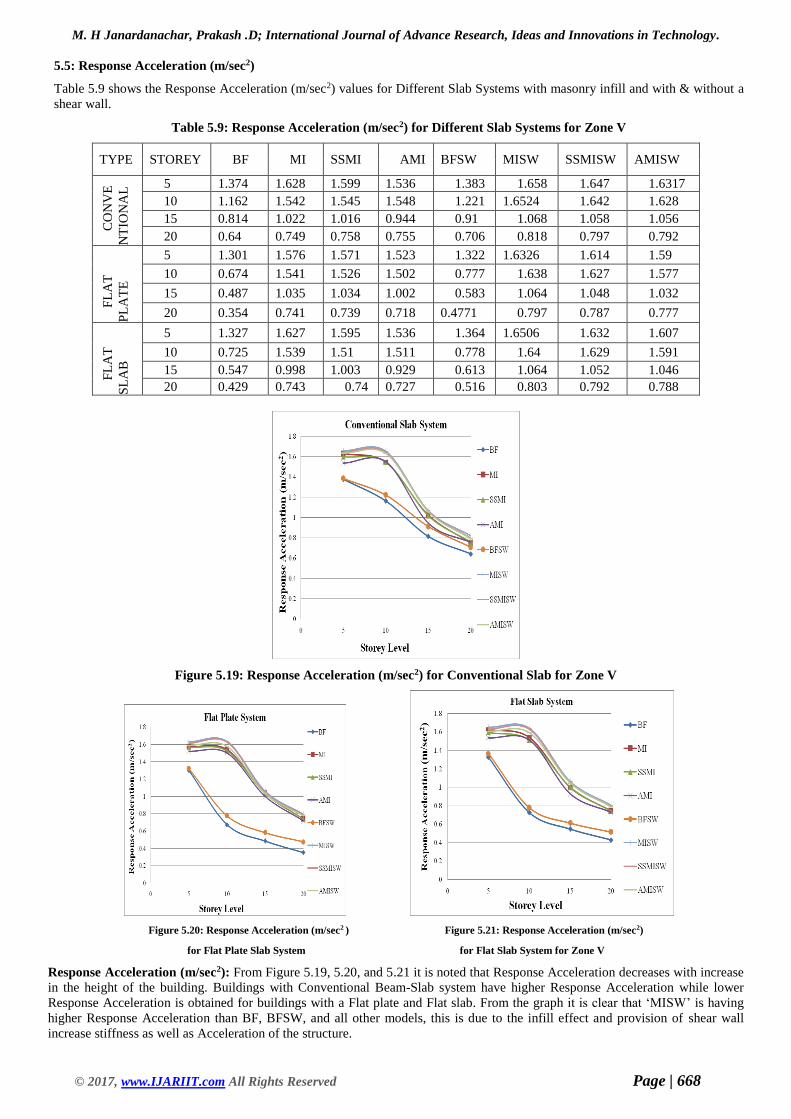
5.5: Response Acceleration (m/sec2)
Table 5.9 shows the Response Acceleration (m/sec2) values for Different Slab Systems with masonry infill and with & without a
shear wall.
Table 5.9: Response Acceleration (m/sec2) for Different Slab Systems for Zone V
TYPE STOREY BF MI SSMI AMI BFSW MISW SSMISW AMISW
CO
NV
E
NT
ION
AL
5 1.374 1.628 1.599 1.536 1.383 1.658 1.647 1.6317
10 1.162 1.542 1.545 1.548 1.221 1.6524 1.642 1.628
15 0.814 1.022 1.016 0.944 0.91 1.068 1.058 1.056
20 0.64 0.749 0.758 0.755 0.706 0.818 0.797 0.792
FL
AT
PL
AT
E
5 1.301 1.576 1.571 1.523 1.322 1.6326 1.614 1.59
10 0.674 1.541 1.526 1.502 0.777 1.638 1.627 1.577
15 0.487 1.035 1.034 1.002 0.583 1.064 1.048 1.032
20 0.354 0.741 0.739 0.718 0.4771 0.797 0.787 0.777
FL
AT
SL
AB
5 1.327 1.627 1.595 1.536 1.364 1.6506 1.632 1.607
10 0.725 1.539 1.51 1.511 0.778 1.64 1.629 1.591
15 0.547 0.998 1.003 0.929 0.613 1.064 1.052 1.046
20 0.429 0.743 0.74 0.727 0.516 0.803 0.792 0.788
Figure 5.19: Response Acceleration (m/sec2) for Conventional Slab for Zone V
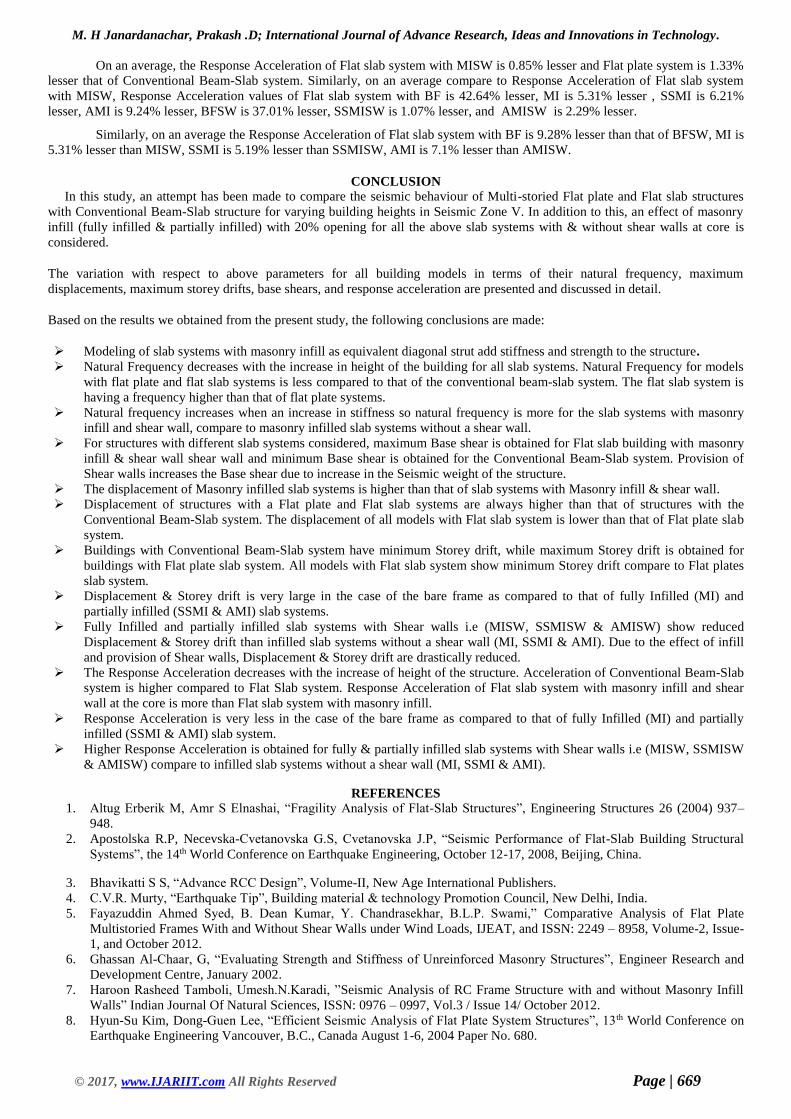
Figure 5.20: Response Acceleration (m/sec2 ) Figure 5.21: Response Acceleration (m/sec2)
for Flat Plate Slab System for Flat Slab System for Zone V
Response Acceleration (m/sec2): From Figure 5.19, 5.20, and 5.21 it is noted that Response Acceleration decreases with increase
in the height of the building. Buildings with Conventional Beam-Slab system have higher Response Acceleration while lower
Response Acceleration is obtained for buildings with a Flat plate and Flat slab. From the graph it is clear that ‘MISW’ is having
higher Response Acceleration than BF, BFSW, and all other models, this is due to the infill effect and provision of shear wall
increase stiffness as well as Acceleration of the structure.
M. H Janardanachar, Prakash .D; International Journal of Advance Research, Ideas and Innovations in Technology.
© 2017, www.IJARIIT.com All Rights Reserved Page | 669
On an average, the Response Acceleration of Flat slab system with MISW is 0.85% lesser and Flat plate system is 1.33%
lesser that of Conventional Beam-Slab system. Similarly, on an average compare to Response Acceleration of Flat slab system
with MISW, Response Acceleration values of Flat slab system with BF is 42.64% lesser, MI is 5.31% lesser , SSMI is 6.21%
lesser, AMI is 9.24% lesser, BFSW is 37.01% lesser, SSMISW is 1.07% lesser, and AMISW is 2.29% lesser.
Similarly, on an average the Response Acceleration of Flat slab system with BF is 9.28% lesser than that of BFSW, MI is
5.31% lesser than MISW, SSMI is 5.19% lesser than SSMISW, AMI is 7.1% lesser than AMISW.
CONCLUSION
In this study, an attempt has been made to compare the seismic behaviour of Multi-storied Flat plate and Flat slab structures
with Conventional Beam-Slab structure for varying building heights in Seismic Zone V. In addition to this, an effect of masonry
infill (fully infilled & partially infilled) with 20% opening for all the above slab systems with & without shear walls at core is
considered.
The variation with respect to above parameters for all building models in terms of their natural frequency, maximum
displacements, maximum storey drifts, base shears, and response acceleration are presented and discussed in detail.
Based on the results we obtained from the present study, the following conclusions are made:
Modeling of slab systems with masonry infill as equivalent diagonal strut add stiffness and strength to the structure.
Natural Frequency decreases with the increase in height of the building for all slab systems. Natural Frequency for models
with flat plate and flat slab systems is less compared to that of the conventional beam-slab system. The flat slab system is
having a frequency higher than that of flat plate systems.
Natural frequency increases when an increase in stiffness so natural frequency is more for the slab systems with masonry
infill and shear wall, compare to masonry infilled slab systems without a shear wall.
For structures with different slab systems considered, maximum Base shear is obtained for Flat slab building with masonry
infill & shear wall shear wall and minimum Base shear is obtained for the Conventional Beam-Slab system. Provision of
Shear walls increases the Base shear due to increase in the Seismic weight of the structure.
The displacement of Masonry infilled slab systems is higher than that of slab systems with Masonry infill & shear wall.
Displacement of structures with a Flat plate and Flat slab systems are always higher than that of structures with the
Conventional Beam-Slab system. The displacement of all models with Flat slab system is lower than that of Flat plate slab
system.
Buildings with Conventional Beam-Slab system have minimum Storey drift, while maximum Storey drift is obtained for
buildings with Flat plate slab system. All models with Flat slab system show minimum Storey drift compare to Flat plates
slab system.
Displacement & Storey drift is very large in the case of the bare frame as compared to that of fully Infilled (MI) and
partially infilled (SSMI & AMI) slab systems.
Fully Infilled and partially infilled slab systems with Shear walls i.e (MISW, SSMISW & AMISW) show reduced
Displacement & Storey drift than infilled slab systems without a shear wall (MI, SSMI & AMI). Due to the effect of infill
and provision of Shear walls, Displacement & Storey drift are drastically reduced.
The Response Acceleration decreases with the increase of height of the structure. Acceleration of Conventional Beam-Slab
system is higher compared to Flat Slab system. Response Acceleration of Flat slab system with masonry infill and shear
wall at the core is more than Flat slab system with masonry infill.
Response Acceleration is very less in the case of the bare frame as compared to that of fully Infilled (MI) and partially
infilled (SSMI & AMI) slab system.
Higher Response Acceleration is obtained for fully & partially infilled slab systems with Shear walls i.e (MISW, SSMISW
& AMISW) compare to infilled slab systems without a shear wall (MI, SSMI & AMI).
REFERENCES 1. Altug Erberik M, Amr S Elnashai, “Fragility Analysis of Flat-Slab Structures”, Engineering Structures 26 (2004) 937–
948.
2. Apostolska R.P, Necevska-Cvetanovska G.S, Cvetanovska J.P, “Seismic Performance of Flat-Slab Building Structural
Systems”, the 14th World Conference on Earthquake Engineering, October 12-17, 2008, Beijing, China.
3. Bhavikatti S S, “Advance RCC Design”, Volume-II, New Age International Publishers.
4. C.V.R. Murty, “Earthquake Tip”, Building material & technology Promotion Council, New Delhi, India.
5. Fayazuddin Ahmed Syed, B. Dean Kumar, Y. Chandrasekhar, B.L.P. Swami,” Comparative Analysis of Flat Plate
Multistoried Frames With and Without Shear Walls under Wind Loads, IJEAT, and ISSN: 2249 – 8958, Volume-2, Issue-
1, and October 2012.
6. Ghassan Al-Chaar, G, “Evaluating Strength and Stiffness of Unreinforced Masonry Structures”, Engineer Research and
Development Centre, January 2002.
7. Haroon Rasheed Tamboli, Umesh.N.Karadi, ”Seismic Analysis of RC Frame Structure with and without Masonry Infill
Walls” Indian Journal Of Natural Sciences, ISSN: 0976 – 0997, Vol.3 / Issue 14/ October 2012.
8. Hyun-Su Kim, Dong-Guen Lee, “Efficient Seismic Analysis of Flat Plate System Structures”, 13th World Conference on
Earthquake Engineering Vancouver, B.C., Canada August 1-6, 2004 Paper No. 680.
M. H Janardanachar, Prakash .D; International Journal of Advance Research, Ideas and Innovations in Technology.
© 2017, www.IJARIIT.com All Rights Reserved Page | 670
9. I.S: 875 ( Part 2 ) - 1987- Indian Standard code of practice for design loads(other than earthquake)for building and
structures, part 2 imposed loads(Second Revision)
10. IS: 1893(part 1):2002- Criteria for Earthquake Resistant Design of Structures Part 1 General Provisions and Buildings
(Fifth Revision).
11. IS: 456-2000- Indian Standard Plain and Reinforced Concrete Code of Practice, Bureau of Indian Standards, New Delhi.
(Fourth Revision)
12. J. Dorji, D.P. Thambiratnam, “Modelling and Analysis of Infilled Frame Structures under Seismic Loads”, the Open
Construction and Building Technology Journal, 2009, 3, 119-126.
13. Mohebkhah, A.A. Tasnimi, and H.A. Moghadam,”A Modified Three-Strut Model for Masonry-Infilled Steel Frames with
Openings”, JSEE: Vol. 9, No. 1, 2, 2007.
14. Ms. Kiran Parmar, Prof. Mazhar Dhankot, ”Comparative Study Between Dual Systems For Lateral Load Resistance In
Buildings Of Variable Heights” GTU university, India Volume – 02, Issue – 02.
15. Nikhil Agrawal, Prof.P.B Kulkarni, Pooja Raut, ”Analysis of Masonry Infilled R.C.Frame with & without Opening
Including Soft Storey by using “Equivalent Diagonal Strut Method”, International Journal of Scientific and Research
Publications, Volume 3, Issue 9, September 2013
16. Pankaj Aggarwal and Manish Shrikhande, “Earthquake Resistant Design of Structures”, PHI Learning Private Limited,
New Delhi.
17. Rahul P. Rathi , Dr. P.S. Pajgade, “ Study of Masonary Infilled R.C. Frame With & Without Opening”, International
Journal of Scientific & Engineering Research Volume 3, Issue 6, June-2012.
18. Sable K S, Ghodechor V A, Kandekar S B, “Comparative Study of Seismic Behaviour of Multistory Flat Slab and
Conventional Reinforced Concrete Framed Structures” IJCTEE, Volume 2, Issue 3, June 2012.
19. Sharad P. Desai, Swapnil B. Cholekar, “Seismic Behaviour of Flat Slab Framed Structure With and Without Masonry
Infill Wall”, (IJERT), Vol. 2 Issue 7, July - 2013.
20. Uttamasha Gupta, Shruti Ratnaparkhe, Padma Gome, “Seismic Behaviour of Buildings Having Flat Slabs with Drops”
International Journal of Emerging Technology and Advanced Engineering, Volume 2, Issue 10, October 2012.
21. Vikunj K.Tilva,” Enhancing the punching shear resistance of flat plates using shear heads, shear stud rails, and shear
stirrups”, International Journal of Earth Sciences and Engineering, ISSN 0974-5904, Volume 04, No 06 SPL, 2011.