seigniorage and inflation tax in mexico … · the definition of total real seigniorage (st) can be...
TRANSCRIPT

SEIGNIORAGE AND INFLATION TAX IN MEXICO 1985-2011
Carlos Encinas Ferrer1
Abstract: This research analyzes the changes of seigniorage and inflation tax in Mexico during the last decades associated with the excess liquidity that the central bank has injected into the economy. Taking into account that theory points out that in economies with high inflation rates, both, seigniorage and tax inflation, have been important sources for financing public expenditure, we study whether that was the case in our country and by what amount in relation with public finances in times of high inflation (1982, 1982, 1988 and 1995) and what is their current weight. Keywords: seigniorage, inflation tax, monetary base, money measurement. JEL classification: E4, E5, E6. SEÑOREAJE, IMPUESTO INFLACIONARIO Y EXCESO DE LIQUI DEZ EN MÉXICO: 1985-2009
Resumen: En esta investigación se analiza la evolución que en las últimas décadas han tenido en México tanto el señoreaje puro como el impuesto inflacionario y su relación con el exceso de liquidez que el banco central inyecta a la economía. Tomando en cuenta que la teoría señala que en economías con tasas de inflación altas, tanto el primero como el segundo han sido fuentes importantes para el financiamiento del gasto público, se estudia si ese ha sido el caso en nuestro país y en qué monto participaron en las finanzas públicas en épocas de elevada inflación (1982, 1982, 1988 y 1995) y cuál es su peso actual. Palabras clave: señoreaje, impuesto inflacionario, base monetaria, medición del dinero. Clasificación JEL: E4, E5, E6.
1 PHD in Economics; professor and researcher at Universidad De La Salle Bajío, Instituto Tecnológico
de Estudios Superiores de Monterrey (ITESM) Campus León and in Escuela de Nacional de Estudios Superiores (ENES), UNAM in León.

Introduction
The study of seigniorage in general, along with that of one of its components,
inflation tax, has received very little attention, if not none at all, from economic research
in our country. This lack of interest is stranger still when we observe that the literature
specializing in seigniorage is the object of increasing attention, as various recent
theoretical investigations show (Sims, 2004, 2005; Buiter, 2004, 2005, 2007), as well as
important papers and text books that devote considerable space to the subject (Walsh,
2003; Romer, 2006). Furthermore, while various central banks and universities in Latin
America have published studies focusing on seigniorage and inflation tax(Zuleta, 1995;
Posada, 1995 y 2000; González Alvaredo, 1999; Risquez, 2002), few issues of
publications by the Bank of Mexico mention them, and mostly only to refer to them in
passing. In the international literature, there can be found one solitary reference to
seigniorage in Mexico (Sargent, 1999).
The topic of seigniorage has been dealt with in international literature from the
perspective of dollar remonetization, especially in analyses of the effects of official
unilateral dollarization and the accompanying loss of the ability to issue money, but
without, however, going into any calculations.
In the course of this study, I analyze the evolution in recent decades in Mexico
both of seigniorage per se and inflation tax. Given that the objective is to measure the
amount collected first by the issuer and subsequently by the Government, the monetary
aggregate I will use is the monetary base (M o M0).
My research here is not going into any aspects suffering from a lack of study in
the international literature, and although debatable, it can be considered as directly
related to seigniorage. I am referring here to that part consisting of the difference
between the change in the monetary base and the change in M1, a difference
appropriated by the financial sector and including that which corresponds to the
inflationary effect, since there is a real negative interest in both the issuing of bills and
the current accounts (Zuleta, 1995, p. 3). This is not inflation tax, as it is not collected
by the Government. I am convinced that there is a direct relationship between
seigniorage and the increase in the financial sector's credit capacity.
Considering that theory points out that in economies with high inflation, both
pure seigniorage and inflation tax have been important sources for the financing of

public expenditure, I analyze whether this has been the case in our country, together
with the amount and percentage of national public finances attained in times of high
inflation.
The rate of inflation I use to calculate the inflation tax rate is arrived at by means
of the annual average of the National Consumer Price Index, since for M, I also take the
annual average for the monetary base.
1. Definitions
Now to see what we understand by seigniorage: “In a historical context, the term
seigniorage was used to refer to the portion, payment or tax that the lord or sovereign
took in order to cover mintage expenses and to obtain additional resources. With the
introduction of paper currency, greater profits could be generated, as the production
costs for bills are far less than their nominal value. When central banks began to
exercise a monopoly on the supply of bills, seigniorage started to be reflected in the
profits they generated and, ultimately, in their major or sole shareholder, the
Government”2
Although the bills and coins in circulation are considered assets by their
possessors, and thus liabilities by the issuing bank – generally the central bank – in
reality, they became an irredeemable liability the moment the gold standard was
abandoned.
2. Measuring seigniorage and inflation tax
There are two common measures of total seigniorage, understood as the sum
total of resources appropriated by the monetary authority through its ability to issue
zero-interest fiduciary money. The first refers to the change in the monetary base and
the second to the interest earned from investment in income from those resources
obtained through increasing the monetary base. Regarding the latter, the Bank for
International Settlements (BIS) points out: Seigniorage can be calculated by multiplying
the bills and coins in circulation (cost-free or non-interest-generating liabilities of the
2 Banco de Pagos Internacionales (Bank for International Settlements, BIS), “Glosario de términos
utilizados en los sistemas de pago y liquidación”, Comité de Sistemas de Pago y Liquidación (CPSS), Marzo de 2003. http://www.banxico.org.mx/sistemas-de-pago/material-educativo/basico/%7B2E63533B-6370-9755-B068-51CF985F8A2B%7D.pdf

central bank) by the long-term interest on the government securities (an approximation
of yield on central bank assets).”3
In the case of the former, which is the focus of this research, it is important to
distinguish the part we call pure seigniorage, which corresponds to the increase in
money in circulation from one year to the next, a sum which allows the circulation at
current values of merchandise representing the growth of GDP, including changes in the
velocity of money (V in Irving Fisher's famous equation: MV=PT), and that which we
call inflation tax, which is the increase in M necessary to cover the reduction caused by
inflation in the real value of the balances under public control.
The following paragraph explains the mechanism by which inflation tax
operates: “Inflation acts in exactly the same way as tax, since the public is obligated to
spend a lower amount of its income and pay the difference to the State in exchange for
additional money. Thus, the State can spend more and the public fewer resources,
exactly as if taxes had be raised to finance additional expenditure.”4
The definition of real total seigniorage (St) can be expressed in discrete terms as:
St = Sp + π taxt (1)
In order to clarify the meaning of the equation, there follows the formulation by
Ahumada, Canavese and González Alvaredo (2000).
The definition of total real seigniorage (St) can be expressed in discrete terms as:
Where:
St = seigniorage at the moment t
Mt = monetary balances in nominal terms which agents maintain at moment t
Pt = general level of prices at moment t
Pt - 1 = general level of prices at moment t -1
The above formula assumes, like that of Fisher, that there is immediate and total
transmission of the variations in M to prices.
3 Ibid. 4 Rudiger Dornbusch y Stanley Fischer (1994), Macroeconomía, McGraw-Hill, Sexta Edición, Madrid, p. 632.

Given that:
mt = : monetary balances in real terms at moment t, and
mt-1 = : monetary balances in real terms at moment t-1,
the expression (2) can be rewritten as:
Adding and subtracting mt-1 (3) we have:
St = mt – mt-1 + mt-1 (4)
Given that the rate of inflation between t-1 y t is defined as πt =
then (4) is equivalent to:
St = = mt –mt-1 +mt-1 (5)
As the expression (5) shows, total seigniorage in real terms breaks down into
two parts: pure seigniorage and inflation tax.
The first (mt – mt-1) refers specifically to the variation in the real amount of
money that may be placed by the issuer without causing inflation; the second
term, , “ “ takes in the increases in money holdings necessary to maintain a
constant quantity given real balances when prices are varying. It is clear that is
the tax base and y is the rate.” 5
5 Ahumada, Hildegart, Alfredo Juan Canavese y Facundo González Alvaredo (2000), Un Análisis Comparativo del Impacto Distributivo del Impuesto Inflacionario y de un impuesto sobre el Consumo, Departamento de Economía, Facultad de Ciencias Económicas, Universidad Nacional de La Plata, Paper presented during the Quintas Jornadas de Economía Monetaria e Internacional, La Plata, May 11-12,

Therefore, inflation tax is:
(6)
As mt and mt-1 are expressions of monetary balances in real terms, the formula
that I will use here to convert them into prices at moment t is as follows:
St = (7)
In the construction of the databases, I used for the Bank of Mexico's daily
figures for the Monetary Base from the period 1994 through 2010. From these, I
obtained the annual average, which will be used to calculate seigniorage. The figures for
1985-1993 are also from the Bank of Mexico’s Fuentes y usos de la base monetaria,
monthly information (Sources and Uses of the Monetary Base,)6. Given that the last-
mentioned provides the figure for the monetary base on the last day of the month, the
figure was adjusted according to the average on our complete series, giving a margin of
error of ± 0.3%, which we do not consider to be significant.
3. The Evolution of Seigniorage and Inflation Tax in Mexico
Between 1971 and 1982, inflation and seigniorage reached, on average, very
high percentages. 21.2% y 23.9% respectively.7 In the final years of the period,
seigniorage represented between 4% y 6% of GDP and up to 25% of government
income8.
These data suggest that reducing inflation from the levels reached during those
years to that current during the term of President Miguel de la Madrid involved a series
of wide-ranging measures of economic policy capable of consolidation up to the final
years of the government of Ernesto Zedillo, specifically from 1998 on, with the action
taken to confront the international financial crisis that began in 1997. In support of the
above we have the following by Dornbusch and Fischer: “The heavy dependence of
2000. p.6. http://www. depeco.econo.unlp.edu.ar/ economica/ing /resumen-articulo.php?param= 11¶m2=53 6 Ibid. 7 Cukierman, Alex, Sebastian Edwards and Guido Tabellini. "Seigniorage And Political Instability," American Economic Review, 1992, v82(3), p. 538. http: //www. nber.org /papers/w3199. 8 Dornbusch, Rudiger y Stanley Fischer. “Moderate Inflation”, World Bank Policy Research Working
Papers, Development Economics, WPS 807, p. 32. http://www-ds.worldbank.org/servlet/WDSContentServer/WDSP/IB/1991/11/01/000009265_3961002035605 /Rendered /PDF/multi0page.pdf.

Mexico on seigniorage in 1984 means that the reduction of inflation required a great
fiscal effort, as in fact happened in the second half of the 1980s.”9
Tables 1 and 2 summarize the information in the data base compiled for this
investigation along with the corresponding calculations. Using these tables, I created the
graphs that allow us to see the trends and relationships between the main variables. Both
inflation and the monetary base are annual averages.
9 Ibid. p. 32. “Mexico's heavy dependence on seigniorage through 1984 meant that reduction of inflation required a large fiscal effort, as indeed was made in the second half of the 1980s”.

TABLE 2
MEXICO: EVOLUTION OF SEIGNIORAGE IN RELATION TO GDP AND PUBLIC BUDGETS (PESOS IN MILLIONS)
TABLE 1 MEXICO: EVOLUTION OF THE MONETARY BASE AND SEIGNIOR AGE
(Pesos in millions)
YEAR
Current
Monetary
Base
Previous
Year’s
Monetary
Base
CPI Annual
Inflation
Monetary
Base
Current
Year
Previous
Year’s
Monetary
Base at
Prices mt
Pure
Seigniorage
Inflation
Tax
Total
Seigniorage
Mt Mt-1 Pt Pt-1 πt mt mt-1 mt - mt-1 π taxt St
1986 3,416.18 1,888.00 80.94% 2.2071 1.1851 86.23% 3,416.18 3,516.08 -99.91 1,628.08 1,528.18
1987 6,986.02 3,416.18 104.50% 5.1167 2.2071 131.83% 6,986.02 7,919.63 -933.61 4,503.46 3,569.85
1988 13,902.01 6,986.02 99.00% 10.958 5.1167 114.16% 13,902.01 14,961.42 -1,059.41 7,975.40 6,915.99
1989 17,026.74 13,902.01 22.48% 13.1505 10.958 20.01% 17,026.74 16,683.51 343.22 2,781.50 3,124.72
1990 21,088.89 17,026.74 23.86% 16.6553 13.1505 26.65% 21,088.89 21,564.65 -475.75 4,537.91 4,062.16
1991 28,690.79 21,088.89 36.05% 20.4298 16.6553 22.66% 28,690.79 25,868.14 2,822.65 4,779.24 7,601.89
1992 34,359.18 28,690.79 19.76% 23.598 20.4298 15.51% 34,359.18 33,140.13 1,219.05 4,449.34 5,668.39
1993 36,840.07 34,359.18 7.22% 25.8992 23.598 9.75% 36,840.07 37,709.70 -869.63 3,350.52 2,480.89
1994 44,050.38 36,840.07 19.57% 27.7033 25.8992 6.97% 44,050.38 39,406.28 4,644.09 2,566.21 7,210.30
1995 49,402.71 44,050.38 12.15% 37.3992 27.7033 35.00% 49,402.71 59,467.68 -10,064.97 15,417.31 5,352.33
1996 61,561.21 49,402.71 24.61% 50.2565 37.3992 34.38% 61,561.21 66,386.56 -4,825.35 16,983.85 12,158.50
1997 81,429.93 61,561.21 32.27% 60.6222 50.2565 20.63% 81,429.93 74,258.60 7,171.33 12,697.39 19,868.72
1998 101,766.45 81,429.93 24.97% 70.2783 60.6222 15.93% 101,766.45 94,400.41 7,366.04 12,970.48 20,336.52
1999 126,642.67 101,766.45 24.44% 81.9344 70.2783 16.59% 126,642.67 118,645.03 7,997.64 16,878.58 24,876.22
2000 161,606.16 126,642.67 27.61% 89.7113 81.9344 9.49% 161,606.16 138,663.06 22,943.10 12,020.38 34,963.49
2001 182,496.15 161,606.16 12.93% 95.4239 89.7113 6.37% 182,496.15 171,896.82 10,599.33 10,290.65 20,889.99
2002 211,964.55 182,496.15 16.15% 100.2244 95.4239 5.03% 211,964.55 191,677.04 20,287.51 9,180.89 29,468.40
2003 246,791.33 211,964.55 16.43% 104.7808 100.2244 4.55% 246,791.33 221,600.79 25,190.54 9,636.24 34,826.78
2004 281,646.75 246,791.33 14.12% 109.6941 104.7808 4.69% 281,646.75 258,363.74 23,283.01 11,572.41 34,855.42
2005 315,799.40 281,646.75 12.13% 114.0688 109.6941 3.99% 315,799.40 292,878.99 22,920.41 11,232.24 34,152.65
2006 366,830.74 315,799.40 16.16% 118.2088 114.0688 3.63% 366,830.74 327,261.22 39,569.51 11,461.82 51,031.34
2007 413,442.88 366,830.74 12.71% 122.898 118.2088 3.97% 413,442.88 381,382.36 32,060.52 14,551.62 46,612.15
2008 465,240.12 413,442.88 12.53% 129.1965 122.898 5.12% 465,240.12 434,631.76 30,608.36 21,188.87 51,797.23
2009 541,108.10 465,240.12 16.31% 136.0405 129.1965 5.30% 541,108.10 489,885.55 51,222.55 24,645.43 75,867.98
2010 593,802.76 541,108.10 9.74% 141.6953 136.0405 4.16% 593,802.76 563,600.49 30,202.27 22,492.39 52,694.66
2011 652,460.41 593,802.76 9.88% 101.0416 97.7122 3.41% 652,460.41 614,035.87 51,296.57 20,233.11 58,657.65
Source: Created by author using Bank of Mexico and INEGI data.

YEAR GDP St %
GDP
Federal Govt.
Income
Public Sector
Income
%
Federal
Budget
%
Public
Sector
Budget
1986 79,191.0 1,528.18 1.93% 12,670.30 25,056.60 12.06% 6.10%
1987 193,312.0 3,569.85 1.85% 32,973.60 57,061.70 10.83% 6.26%
1988 390,451.0 6,915.99 1.77% 68,014.80 115,506.80 10.17% 5.99%
1989 507,618.0 3,124.72 0.62% 90,204.40 141,550.10 3.46% 2.21%
1990 738,897.5 4,062.16 0.55% 117,710.30 186,937.70 3.45% 2.17%
1991 949,147.6 7,601.89 0.80% 177,372.00 252,818.10 4.29% 3.01%
1992 1,125,334.3 5,668.39 0.50% 210,446.00 296,455.90 2.69% 1.91%
1993 1,256,196.0 2,480.89 0.20% 194,813.00 290,723.60 1.27% 0.85%
1994 1,420,159.5 7,210.30 0.51% 220,382.50 328,798.20 3.27% 2.19%
1995 2,041,132.3 5,352.33 0.26% 280,144.40 418,882.60 1.91% 1.28%
1996 2,806,194.4 12,158.50 0.43% 392,566.00 580,722.20 3.10% 2.09%
1997 3,526,972.4 19,868.72 0.56% 503,554.00 731,991.20 3.95% 2.71%
1998 4,273,722.1 20,336.52 0.48% 545,175.70 783,046.00 3.73% 2.60%
1999 5,105,249.1 24,876.22 0.49% 674,348.10 956,495.10 3.69% 2.60%
2000 6,101,898.2 34,963.49 0.57% 868,267.70 1,187,704.10 4.03% 2.94%
2001 6,455,209.1 20,889.99 0.32% 939,114.50 1,271,376.60 2.22% 1.64%
2002 6,959,040.7 29,468.40 0.42% 989,353.40 1,387,235.50 2.98% 2.12%
2003 7,555,803.8 34,826.78 0.46% 1,132,985.10 1,600,286.30 3.07% 2.18%
2004 8,574,823.3 34,855.42 0.41% 1,270,211.10 1,771,314.20 2.74% 1.97%
2005 9,251,737.5 34,152.65 0.37% 1,412,504.90 1,745,388.30 2.42% 1.96%
2006 10,379,091.0 51,031.34 0.49% 1,558,808.00 2,263,602.60 3.27% 2.25%
2007 11,320,836.4 46,612.15 0.41% 1,711,539.20 2,485,785.00 2.72% 1.88%
2008 12,200,132.0 51,797.23 0.42% 2,049,936.30 2,860,926.40 2.53% 1.81%
2009 11,929.517.3 75,867.98 0.64% 2,000,448.10 2,817,185.50 3.79% 2.69%
2010 13,137.171.6 52,694.66 0.40% 2,080,064.30 2,960,268.20 2.53% 1.78%
2011 14,352,866.8 58,657.65 0.41% 2,320,324.30 3,269,631.30 2.53% 1.79%
Source: Created by the author using Bank of Mexico and INEGI data.
Inflation remained high throughout 1986, 1987 and 1988, only to drop
significantly from 1989 on. In those first three years, pure seigniorage was negative,
while inflation tax was extremely high. In line with this, the weight of seigniorage in
relation to Federal Government income was markedly high. Similarly, in 1995 and
1996, pure seigniorage is once more negative and inflation tax very high, but its weight

in relation to Federal Government income does not vary significantly, thanks to the
increase in Government intake as shown in Table 2.
Cagan (1956) and Bailey (1956), among others, point out that pure negative
seigniorage probably reflects the decrease in demand (L) in relation to the monetary
base, a decrease coinciding with periods that see a rise in inflation. The data in Table 1
corroborate this. The above would also explain why it is not possible to consider V, the
velocity of the circulation of money in Fisher's formula, as a short-term constant, as we
shall see further on.
Graph 1 shows the evolution from 1986 to 2010 of seigniorage as an average of
the income of both the Federal Government and the public sector together (bearing in
mind that the latter variable is heavily influenced by income from oil exports).
From 1989, the weight of seigniorage as a percentage of the Mexican State's
budgetary income falls drastically, oscillating in the region of 3% in relation to Federal
Government income and stabilizing at some 2% with respect to overall public sector
income. In both cases, we can see a significant increase due to the crisis of 2009 and the
resulting fall in tax income.
GRAPH 1 MEXICO: EVOLUTION OF SEIGNIORAGE AS A PERCENTAGE OF
FEDERAL GOVERNMENT BUDGETARY INCOME (1986-2011)
Source: Created by the author with Bank of Mexico data.
The same occurs with seigniorage as a percentage of GDP, as in Graph 2 shows.

GRAPH 2 MEXICO: EVOLUTION OF TOTAL SEIGNIORAGE (%GDP)
(1986–2011)
Source: Created by the author with Bank of Mexico and INEGI data. The above corroborates what analysts have observed regarding the topic in the
sense that there is a positive correlation between inflation and seigniorage and therefore
less of the latter in relation to GDP when inflation is low.
However, while the percentage of seigniorage stays low in absolute and current
price terms, its rate of increase is constant, even rising significantly since 2006, as we
can see from Graph 3, which explains the increase in its weight in the Federal Budget.
GRAPH 3 MEXICO: EVOLUTION OF SEIGNIORAGE AT CURRENT PRICES
(Pesos in millions)

Source: Created by author using Bank of Mexico and INEGI data.
4. Growth of Monetary Base and Liquidity
Total seigniorage in 2009 of over $75 billion pesos, remaining through 2011 at
over $50 billion and, within this, an inflation tax of over $20 billion are significant
amounts in absolute terms. However, this is not the only area of interest aroused by this
research topic. Two things in particular leap out from the above graph. Firstly, it is
important to point out the behavior of inflation tax, as, beginning in 2000 and up to
2006, it had stayed, in absolute numbers and current prices, at an amount that hovered
around $10 billion pesos, but from 2006 on, the amount begins to rise constantly,
eventually overtaking $20 billion. This leads us to the second point that calls the
attention, since the increase in the monetary base between 2006 and 2010 was 61.87%,
while GDP at current prices, including inflation, grew only 26.57%. Subtracting the rise
in GDP, 2006-2010 from the monetary base, we find that the difference, 35.3% greater
in M, could be explained by both the variation in V and a GDP larger than that claimed
by the INEGI surveys, which would not be surprising, given the size of the informal
economy in Mexico.
It should be remembered that “It is difficult to measure what happens with
liquidity. This factor can be calculated with reference to the margins between purchase
and sales prices and also with reference to the depth of the market (i.e. the ability to

absorb sales without any significant change in price).”10 In view of this, by including the
subject of liquidity in this article, rather than delving into the topic itself, the intention is
to show the relationship that exists between seigniorage, inflationary tax and liquidity,
as well as the need to carry out special research in this area.
The excessive increase in liquidity in relation to GDP and the National
Consumer Price Index has been analyzed using the aforementioned equation from
Irving Fisher (Sepulveda, 2005)
MV = PT (7)
Where:
M = money supply
V = velocity of money
P = general price level
T = Gross National Product (GDP) equivalent to real income (Y)
Fisher sees M as exogenous to the model (since it is already determined by
monetary authorities, a fundamental assumption for monetary analysis); V as constant as
it is determined by stable factors; T (GDP) and its equivalent Y (income) as determined
by investment and employment and thus exogenous to the model and equation
constants. The only endogenous variable in the equation, according to monetary theory,
is P, which, given that V and T are constants, is dependent on M.
At this point, it stands out that V, in order to be considered as an exogenous
constant, cannot be calculated simply as the coefficient resulting from the division of
GDP by M1 or M2, since doing this at once hides any excess of liquidity that the
monetary authority might bring about, and which was not immediately reflected in
inflation. This phenomenon occurs mainly when official statistics are incapable of
calculating the real size of the informal economy with respect to GDP and less during
recessive cycles such as the one we are currently experiencing, when formal
employment increases the amount of informal activity.
10 Banco de México (Diversos Colaboradores). Estabilización y Política Monetaria: la Experiencia Internacional. Documentos presentados en el Seminario del 75 Aniversario, México D.F. , Noviembre 14-15, 2000. Banco de México. http://www.banxico.org.mx/tipo/publicaciones/seminarios/Completo.pdf

In support of the above, the National Employment and Occupational Survey
carried out by INEGI reveals that the number Mexicans in informal employment during
the first quarter of 2010 rose to 12.5 million, some 365 thousand more than for the same
period in 2009. If we take into account the fact that, in March of 2010, permanent and
casual urban workers registered with the IMSS (Mexican Institute of Social Security)
totaled 14.2 million, we find that, in the midst of the crisis, for every 100 formally
employed workers, there were 88 people occupied in the informal sector of the
economy. Trying to estimate the current output of the informal sector would make an
interesting subject for research.
In order to determine the magnitude of V, my research here has used M1
(excluding accounts in foreign currencies), since, as the period studied is a year, I
believe it better reflects the amount of money for transactions in circulation in the
economy.
To calculate the velocity of money, we divide the nominal value of production
(nominal GDP). It is obvious that, in this approach, V is not a constant, as stated above,
as it varies with M and T, and much less exogenous to the equation. Thus V and P also
interact with each other. Any operation we perform with the four variables involves a
circular reference and this limits practical application. For this reason, I have chosen to
estimate velocity of money based on the statistical tendency of the coefficient
GDPnominal /M1, excluding from the latter deposits made in foreign currencies.
It is interesting to consider what happened in the US with respect to the velocity
of money. The following graph shows its evolution during the half century from 1959 to
2009.
GRAPH 4 USA: EVOLUTION OF THE VELOCITY OF CIRCULATION OF M1
(M1/GDP)

Source: Created by the author using data from the U.S. Treasury Department and Bureau of Economic Research (BEA).
We can see that between 1959 and 1981 there was constant growth in the
velocity of money. Beginning in 1982, probably as a consequence of the worldwide
debt crisis, V decreases to 6 units in 1994 and then in 1995 starts to rise once more until
halting in 2000 and heading down in line with the first economic crisis of the 21st
century, behavior which we see repeated with that of 2008.
It is interesting that the positive correlation between economic cycles and the
velocity of money did not appear until 1981, when Neoliberal economic policies began
to implemented worldwide, and is not seen at all in the period from 1959-1980, not even
at the time of the oil embargo during the 1970s.
Graph 5 presents a comparison of the trends in the evolution of V in the US and
Mexico. We can see a convergence of the variables that strengthens in line with the
crisis of 2008.
GRAPH 5 U.S.A. AND MEXICO: EVOLUTION OF THE VELOCITY OF CIRCULATION OF M1
(M1/GDP)

Source: Created by the author using data from the U.S. Treasury Department, BEA, and the Bank of Mexico.
The graph below shows how V has varied over recent years, both as a coefficient
of PIB/M0 and PIB/M1.
GRAPH 6 MEXICO: VARIATION IN V AS A COEFFICIENT OF GDP/M
Source: Created by the author using Bank of Mexico and INEGI data.
If we compare the above graph with similar work carried out in the US, we find
similar behavior in the coefficients measuring the velocity of money in 2007, at the start

of the financial crisis. The increase in M is reflected in a variation in the speed of money
in the same direction.
The variations in VM0 and VM1, although in the same direction, are not in the
same proportion, as the following graph shows... In the year 2010, the percentage of
variation in VM0 was greater than that in VM1, a phenomenon that was also present in
the years 2001 and 2002.
GRAPH 7 MEXICO: PERCENTAGE OF VARIATION IN V
Source: Created by the author using Bank of Mexico and INEGI data.
The dramatic fall of V between 2008 and 2009 is the result of the excess of
liquidity ensuing from the increase in pure seigniorage, as clearly shown by the
calculations presented in Table 3, below.
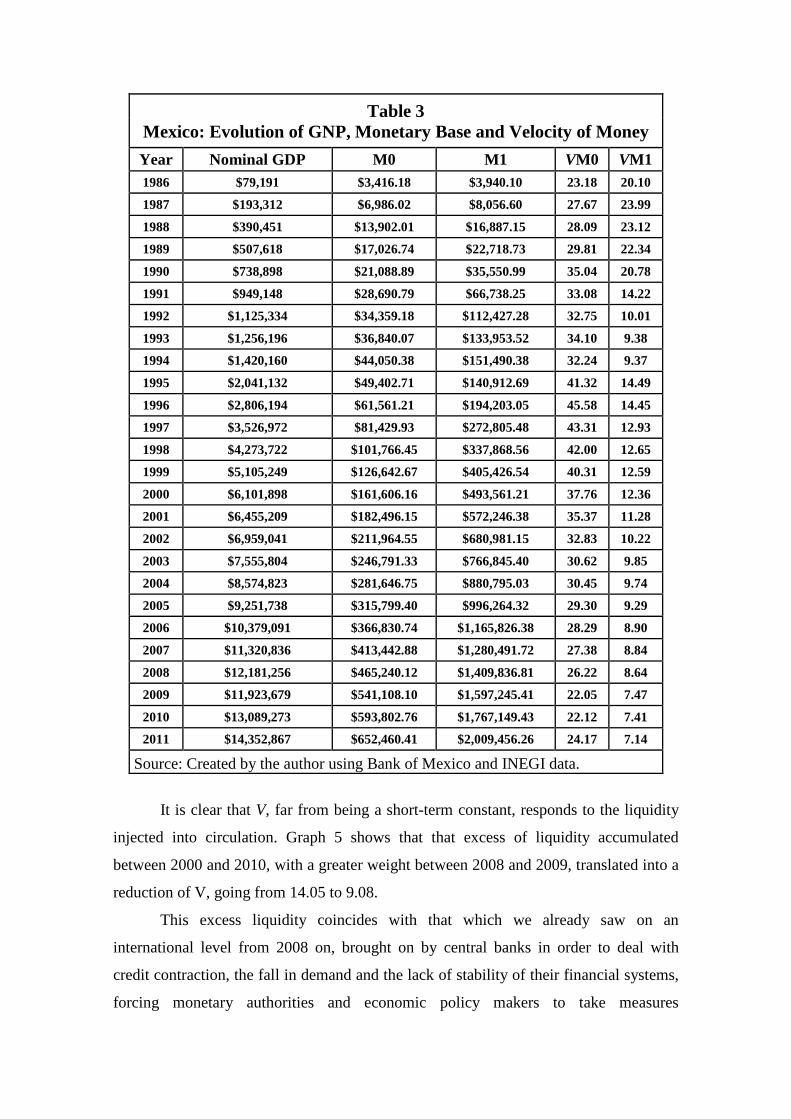
Table 3 Mexico: Evolution of GNP, Monetary Base and Velocity of Money
Year Nominal GDP M0 M1 VM0 VM1 1986 $79,191 $3,416.18 $3,940.10 23.18 20.10
1987 $193,312 $6,986.02 $8,056.60 27.67 23.99
1988 $390,451 $13,902.01 $16,887.15 28.09 23.12
1989 $507,618 $17,026.74 $22,718.73 29.81 22.34
1990 $738,898 $21,088.89 $35,550.99 35.04 20.78
1991 $949,148 $28,690.79 $66,738.25 33.08 14.22
1992 $1,125,334 $34,359.18 $112,427.28 32.75 10.01
1993 $1,256,196 $36,840.07 $133,953.52 34.10 9.38
1994 $1,420,160 $44,050.38 $151,490.38 32.24 9.37
1995 $2,041,132 $49,402.71 $140,912.69 41.32 14.49
1996 $2,806,194 $61,561.21 $194,203.05 45.58 14.45
1997 $3,526,972 $81,429.93 $272,805.48 43.31 12.93
1998 $4,273,722 $101,766.45 $337,868.56 42.00 12.65
1999 $5,105,249 $126,642.67 $405,426.54 40.31 12.59
2000 $6,101,898 $161,606.16 $493,561.21 37.76 12.36
2001 $6,455,209 $182,496.15 $572,246.38 35.37 11.28
2002 $6,959,041 $211,964.55 $680,981.15 32.83 10.22
2003 $7,555,804 $246,791.33 $766,845.40 30.62 9.85
2004 $8,574,823 $281,646.75 $880,795.03 30.45 9.74
2005 $9,251,738 $315,799.40 $996,264.32 29.30 9.29
2006 $10,379,091 $366,830.74 $1,165,826.38 28.29 8.90
2007 $11,320,836 $413,442.88 $1,280,491.72 27.38 8.84
2008 $12,181,256 $465,240.12 $1,409,836.81 26.22 8.64
2009 $11,923,679 $541,108.10 $1,597,245.41 22.05 7.47
2010 $13,089,273 $593,802.76 $1,767,149.43 22.12 7.41
2011 $14,352,867 $652,460.41 $2,009,456.26 24.17 7.14
Source: Created by the author using Bank of Mexico and INEGI data.
It is clear that V, far from being a short-term constant, responds to the liquidity
injected into circulation. Graph 5 shows that that excess of liquidity accumulated
between 2000 and 2010, with a greater weight between 2008 and 2009, translated into a
reduction of V, going from 14.05 to 9.08.
This excess liquidity coincides with that which we already saw on an
international level from 2008 on, brought on by central banks in order to deal with
credit contraction, the fall in demand and the lack of stability of their financial systems,
forcing monetary authorities and economic policy makers to take measures

unprecedented in the post-war era. Traditional instruments, such as interest rates, which
were pushed to a minimum, show themselves unable to cope with the magnitude of the
crisis, compelling central banks in the industrialized countries to make huge purchases
of a vast variety of assets: The liquidity trap has made an appearance; monetary policy
is helpless to stimulate economic activity. The major worry when faced with the events
of the second half of 2011, which we could call the worldwide debt crisis, lies in the
question of what will happen if new worldwide recession occurs.
The monetary policy implemented on an international level, principally by the
Central European Bank (CEB) and the US Federal Reserve (FED), consistent with
respect to the application of both the usual measures, mainly the reduction of interest
rates, and not so usual measures, has sought to keep the credit markets in operation11.
Starting in the last three months of 2008, the central banks significantly increased the
money supply by buying private debt. In the case of the US, the Government there
temporarily bought up large quantities of assets in companies with serious financial
problems. Nevertheless, all this has not been enough, particularly since, a few short
months after this happened, the rest of the world realized that, with the issue of private
debt only partially resolved, a much bigger problem has reared its head in the form of
public debt, both in the US and the majority of the European Union.
Conclusions
The evolution of seigniorage and inflationary tax in Mexico from 1985 on has
shown a marked reduction as a percentage of Federal Government tax income. The
same has happened in relation to GDP. The relation observed between seigniorage and
inflation shows a clear relationship between both variables.
Independently of the reduction in the percentage of the sum of pure seigniorage
and inflationary tax in relation to the Government budget and GDP, the total amount
accumulated in the 26 years studied approaches $651 billion pesos (the total shown in
the second column of Table 2), a quantity that has served to finance an accumulated
11 Alfonso Novales, “Política Monetaria antes y después de la Crisis Financiera”, Departamento de Economía Cuantitativa, Universidad Complutense, Marzo 2010, p.6. Madrid. Consulted May 24, 2011. http://www.ucm.es/info/ecocuan/anc/Crisis.pdf

public-sector budget of $30.8 trillion pesos. Total seigniorage is equivalent to 2.11% of
this figure.
The study shows us that the evolution of seigniorage between 2000 and 2011 can
be seen reflected in an excess of liquidity which coincides once again with monetary
policies adopted at an international level.

BIBLIOGRAPHY
Ahumada, Hildegart, Alfredo Juan Canavese y Facundo González Alvaredo (2000),
“Un Análisis Comparativo del Impacto Distributivo del Impuesto Inflacionario y de un
impuesto sobre el Consumo”, Departamento de Economía, Facultad de Ciencias
Económicas, Universidad Nacional de La Plata, Working Paper presentado en las
Quintas Jornadas de Economía Monetaria e Internacional, La Plata, 11 y 12 de mayo de
2000. Disponible en: http://www.depeco.econo.unlp.edu.ar/jemi/2000/trabajo2.pdf.
Consultado el 7 de noviembre de 2010.
Bailliu, Jeannine; Daniel Garcés Díaz, Mark Kruger y Miguel Messmacher;
“Explicación y Predicción de la Inflación en Mercados Emergentes: El Caso de
México”; Febrero de 2003,
Documento de Investigación No. 2003-3, Dirección General de Investigación
Económica
Banco de México y Banco de Canadá. http://www.banxico.org.mx/publicaciones-y-
discursos/publicaciones/documentos-de-investigacion/banxico/%7BD88107FE-9EB3-
C8D4-1F25-F9482A762BA1%7D.pdf. Consultado el 1 de diciembre de 2010.
Banco de México en Estadísticas: Agregados Monetarios y flujo de fondos, Base
Monetaria, circulante y depósitos, base monetaria. Disponible en:
http://www.banxico.org. mx/sistema-financiero/estadisticas/intermediacion-
financiera/agregados-monetarios-flujo-fo.html. Consultado el 7 de noviembre de 2010.
Banco de Pagos Internacionales (Bank for International Settlements, BIS), “Glosario de
términos utilizados en los sistemas de pago y liquidación”, Comité de Sistemas de Pago
y Liquidación (CPSS), Marzo de 2003. Disponible en:
http://www.bis.org/publ/cpss00b_es.pdf. Consultado el 7 de noviembre de 2010.
Bailey, Martín J. (1956). “The Welfare Cost of inflationary Finance". Journal of
political economy. Volúmen 64, Núm. 2, Chicago, The University of Chicago Press,
Abril 1956, PP. 93-110.

Buiter, Willem H., “Seigniorage”, Economics Discussion Papers, No 2007-8, Marzo 1,
2007. Disponible en: http://www.economics-ejournal.org/economics/discussionpapers/
2007-8. Consultado el 7 de noviembre de 2010.
Cagan, Phillip D., “The Monetary Dynamics of Hyper-inflation”, en Studies in the
Quantity Theory of Money, Milton Friedman (ed.), Chicago University Press, Chicago,
Illinois, 1956.
Cukierman, Alex (2005), “Independencia de los bancos centrales y resultados de
política: teoría y evidencia”, Estabilidad y Crecimiento Económico: El Papel del Banco
Central, Documentos presentados en la Conferencia Internacional para conmemorar el
80 Aniversario del Banco de México, realizada en la Ciudad de México, 14 y 15 de
noviembre de 2005, p. 46. Disponible en:
http://www.banxico.org.mx/documents/%7BCD1B782C-F13F-37EA-AAF1-
06460A3100E7%7D.pdf. Consultado el 7 de noviembre de 2010.
Cukierman, Alex, Sebastian Edwards and Guido Tabellini (1992), “Seigniorage And
Political Instability”, American Economic Review, 1992, volume 82, Núm. 3, pp. 537-
555, Pittsburgh, PA. Disponible en: http://www.nber.org/papers/w3199.pdf. Consultado
el 7 de noviembre de 2010.
Dornbusch, Rudiger y Stanley Fischer (1993). “Moderate Inflation”, The World Bank
Economic Review, vol. 7, núm. 1, pp. 1-44 (Enero 1993). Washington, D.C. Disponible
en: http://www.nber.org/papers/w3896.pdf?new_window=1. Consultado el 7 de
noviembre de 2010.
García, Pablo, Klaus Schmidt-Hebbel (2000), “Modelos Macroeconómicos Dinámicos
para Chile”, en Estabilización y Política Monetaria: La Experiencia Internacional,
Documentos presentados en el Seminario del 75 Aniversario. México D.F., Noviembre
14-15, 2000. Banco de México, pp. 552. Disponible en:
http://www.banxico.org.mx/tipo/publicaciones/seminarios/Pablo%20y%20Klaus.pdf
Consultado el 7 de noviembre de 2010.
González Alvaredo, Facundo, “Algunos resultados acerca del impacto de la inflación
sobre la distribución del ingreso: el impuesto inflacionario”,
http://cdi.mecon.gov.ar/biblio/docelec/MU1027.pdf; consultado el 4 de marzo de 2011.
İmrohoroğlu, Ayşe y Edward C. Prescot (1991), “Seigniorage as a Tax: A Quantitative
Evaluation”. Journal of Money, Credit and Banking, August 1991, vol. 23, núm. 3
(agosto), pp. 476-480, The Ohio State University
Issing, Otmar (2005), “El papel de las políticas fiscal y monetaria en la estabilización
del ciclo económico”, en Estabilidad y Crecimiento Económico: El Papel del Banco
Central, Documentos presentados en la Conferencia Internacional para conmemorar el
80 Aniversario del Banco de México, realizada en la Ciudad de México, 14 y 15 de
noviembre de 2005, pp. 133 y 134. Disponible en:
http://www.banxico.org.mx/tipo/publicaciones/ seminarios/IssingDocIng.pdf.
Consultado el 7 de noviembre de 2010.
Lechuga Montenegro, Jesús y Jorge Bustamante Torres (2008). “Estado y bancos en la
creación monetaria: El valor del dinero electrónico”, Trayectorias, Vol. X, Núm. 27,
Julio-Diciembre 2008, Monterrey, Universidad Autónoma de Nuevo León, pp. 35-46.
Messmacher, Miguel (2000), “Políticas de Estabilización en México, 1982-2000”, en
Estabilización y Política Monetaria: La Experiencia Internacional, Documentos
presentados en el Seminario del 75 Aniversario. México D.F., Noviembre 14-15, 2000.
Banco de México, p. 355-398. Disponible en:
http://www.banxico.org.mx/tipo/publicaciones/seminarios/Completo.pdf. Consultado el
7 de noviembre de 2010.
Novales, Alfonso, “Política Monetaria antes y después de la Crisis Financiera”,
Departamento de Economía Cuantitativa, Universidad Complutense, Marzo 2010,
Madrid. Consultado el 24 de mayo de 2011 en
http://www.ucm.es/info/ecocuan/anc/Crisis.pdf
Posada, Carlos Esteban (2000), “Señoraje, Impuesto Inflacionario y Utilidades (Brutas)
del Emisor: Definiciones y Medidas del Caso Colombiano Reciente, Revista del Banco
de la República Núm. 871, mayo de 2000, Colombia. Disponible en:

http://www.banrep.gov.co/docum/ftp/borra140.pdf. Consultado el 7 de noviembre de 2010.
Posada, Carlos Esteban (1995); “El costo de la inflación (con racionalidad y previsión
perfectas)”, Revista del Banco de la República, vol. LXVIII, núm. 810 (abril).
Disponible en: http://129.3.20.41/eps/mac/papers/0411/0411013.pdf. Consultado el 7 de
noviembre de 2010.
Rajan, Raghuram G., “Has Financial Development Made the World Riskier?”, Federal
Reserve Bank of Kansas City, issue Aug, pages 313-369
http://www.kansascityfed.org/Publicat/sympos/2005/PDF/Rajan2005.pdf. Consultado el
28 de febrero de 2011.
Risquez, Justino (2002), “Venezuela: un caso de inflación media”, Revista de Ciencias
Sociales, mayo-agosto, año/vol. VIII, núm. 002, Universidad de Zulia, Maracaibo,
Venezuela, pp. 228-233. Disponible en:
http://redalyc.uaemex.mx/redalyc/pdf/280/28080203.pdf. Consultado el 7 de noviembre
de 2010.
Romer, David (2006), Advanced Macroeconomics, Tercera Edición, Capítulo 10.
McGraw-Hill, Nueva York.
Rudiger Dornbusch y Stanley Fischer (1994), Macroeconomía, McGraw-Hill, Sexta
Edición, Madrid, p. 632.
Sargent, Thomas J., “A primer on monetary and fiscal policy”, Journal of banking &
finance, Volume 23, Issue 10, Pages 1457-1555 (October 1999), Amsterdam.
Sepúlveda Villarreal, Ernesto, “Una hipótesis alternativa sobre el crecimiento de la base
monetaria”, Entorno Económico. Marzo/Abril de 2005, Vol. XLI, No. 249.pp. 1-7.
Centro de Investigaciones Económicas, Facultad de Economía, Universidad Autónoma
de Nuevo León. Disponible en: http://www.esepulveda.net/mar-abr-04.pdf. Consultado
el 7 de noviembre de 2010.
Sims, Christopher A. (2004), “Fiscal Aspects of Central Bank Independence”, en
European Monetary Integration, Hans-Werner Sinn, Mika Widgrén, and Marko
Köthenbürger, Capítulo 4, pp.103-115, The MIT Press, Cambridge Massachusetts.
Disponible en:
http://books.google.com.mx/books?hl=es&lr=&id=C-
D_0b4yMKUC&oi=fnd&pg=PA103&dq=Fiscal+Aspects+of+Central+Bank+Independ
ence&ots=8-gFSnRnNu&sig=X0MfCIAk2f4MG__5x0llVrxM8-
M#v=onepage&q=Fiscal%20Aspects%20of%20Central%20Bank%20Independence&f
=false. Consultado el 7 de noviembre de 2010.
Sims, Christopher A. (2005), “Limits to Inflation Targeting”, en The Inflation-Targeting
Debate, Ben S. Bernanke and Michael Woodford, editores, Capítulo 7, Chicago, NBER
Studies in Business Cycles Volume 32, p. 283-298.
Szapiro, Susana; José María Fanelli y Mario Damill (1989), “El Impuesto Inflacionario.
Metodología de cálculo y estimaciones para la economía argentina”, CEDES 1989,
Documentos CEDES/18, Argentina. Disponible en:
http://201.231.178.100/Publicaciones/Doc_c/ Doc_ c18. Pdf. Consultado 7 de
noviembre de 2010.
Velasco, Andrés (2000), “Tipos de Cambio en Mercados Emergentes: El Futuro de los
Regímenes de Flotación” en Estabilización y Política Monetaria: La Experiencia
Internacional, Documentos presentados en el Seminario del 75 Aniversario. México
D.F., Noviembre 14-15, 2000. Banco de México, pp. 181, 206. Disponible en:
http://www.banxico.org.mx/tipo/publicaciones/seminarios/Completo.pdf . Consultado el
7 de noviembre de 2010.
Walsh, Carl E., Monetary Theory and Policy, 2a. Edicion, Capítulo 4, pp. 135-197, The
MIT Press, Cambridge Massachusetts, 2003.
Zuleta G., Hernando (1995), Impuesto Inflacionario y Señoreaje, Banco de la República
de Colombia, Subgerencia de Estudios Económicos, Serie Borradores Semanales de
Economía Núm. 38. Disponible en: http://www.banrep.gov.co/docum/ftp/borra038.pdf.
Consultado el 7 de noviembre de 2010.