segmenting casino tourists by mode of experience
TRANSCRIPT
RESEARCH NOTES
Segmenting Casino Touristsby Mode of Experience
Gordon J. WalkerUniversity of Alberta, Canada
Tom HinchUniversity of Alberta, Canada
According to Newsome, Moore, and Dowling (2002), limited research has beenconducted on how tourists experience the environment. In contrast, Williams,Patterson, Roggenbuck and Watson (1992) found that outdoor recreationists didso via three modes: activity, social group, and place. They also found that placescan have multiple geographic levels (such as building and destination); one modecan be primary (activity ranked as most important); and sociodemographic fea-tures and trip profiles can vary by geographic level, or primary mode, or both.Thus, a segmentation strategy can be developed, with the result proving beneficialin terms of, for example, the creation of more focused marketing strategies(Newsome et al 2002). In order to investigate this possibility, the study reportedhere examines the environmental experiences of a growing tourism market: casinotourists.
In the United States, in 1999, 72 million people gambled, with 7% of person-trips reporting gambling as an activity (TIA 2000). Similarly, the 1998 CanadianTravel Survey (Statistics Canada 2000) found that 2% of all domestic trips by Cana-dians involved visiting a casino, a 33% increase from 1996. Azmier (2001) notesthat in 1999/2000 net gambling revenue from Canadian casinos actually exceededthat of lottery products (US$1,274 million vs. US$1,266 million, respectively) and,further, that while casino gambling accounted for only 1% of the national grossgambling profit in 1992, it accounted for 29% in 2000.
To evaluate whether casino tourists can be segmented using geographiclevel and primary mode, a random sample of Alberta telephone numbers was
Annals of Tourism Research, Vol. 33, No. 2, pp. 568–571, 2006� 2006 Elsevier Ltd. All rights reserved.
Printed in Great Britain0160-7383/$32.00
www.elsevier.com/locate/atoures
RESEARCH NOTES AND REPORTS
This Department publishes research notes, conference reports, reports on thework of public agencies and associations, field (industry) reports, and other rele-vant topics and timely issues. Contributions to this department are submittedto its two Associate Editors: Research Notes to Juergen Gnoth (Department ofMarketing, University of Otago, Dunedin, New Zealand. Email <[email protected]>) and Conference Reports to Russell Smith (Hospitalityand Tourism, Nanyang Technological University, Singapore 639798, Rep. ofSingapore. Email <[email protected]>). Unsolicited conference and agencyreports will not be accepted.
568
generated. Respondents were asked whether they had gambled in a casino in thepast year and, if so, how frequently they had visited ‘‘local’’ (under 80 kilometers)and/or ‘‘distant’’ casinos (over 80 kilometers). If they reported taking a distanttrip, information on their last casino trip’s characteristics, primary mode, and geo-graphic level was also gathered. A total of 19,002 telephone numbers were calledover a six-week period, with 94% being excluded due to technical reasons or elim-inated because the person had not gambled. Of the 1,203 respondents, 563 (47%)had traveled to a distant casino in the past year. Although there were slightly morefemale participants (53%), the sample had a broad range of demographics: 26%were 18–29 old; 18%, 30–39; 20%, 40–49; 17%, 50–59; 12%, 60–69; and 8%, 70or more. In terms of education levels, 37% had, at most, completed high school;38%, some post-secondary training; and 25%, at least a bachelor degree. Regardingemployment, 60% were employed full-time; 22%, retired or unemployed; 8%,part-time; 6%, homemakers; and 5%, students. Over the past year 31% had visiteda casino once; 34%, two–four times; and 35%, five or more times. When askedwhich geographic level was most important—the distant casino or the destinationin which it was located—476 (85%) indicated that the destination was the mostimportant geographic space. Of those who selected casino, 47 (54%) reported thatthe ‘‘social group’’ was their primary experience mode, 22 (25%) ‘‘the place,’’ and18 (21%) ‘‘the activity.’’ Of those who selected the ‘‘destination’’, 281 (59%)reported the ‘‘social group’’, 123 (46%) ‘‘the place,’’ and 72 (15%) ‘‘the activity.’’Based on the above, a two-by-three matrix was developed for segmentation pur-poses, and chi-square tests were conducted for comparison purposes.
Although the six casino tourist groups did not differ significantly in terms ofgender or employment, they did vary in age (df = 25, v2 = 39.60, p = .03), with mostof this difference due to the 30–39 group being more likely than expected to becasino/activity and destination/activity and less likely to be casino/social groupand destination/place. Those 70 years and older were more likely than expectedto be casino/social group and destination/place and less likely to be destina-tion/social group. The groups also varied in education (df = 10, v2 = 19.34,p = .04), with those who had completed high school being more likely than ex-pected to be casino/activity and casino/social group, while those who had somepost-secondary training were less likely to report being either of these modes. Sig-nificant differences were found in the total number of casinos visited over the pastyear (df = 10, v2 = 22.88, p = .01), primarily because those who had visited only onecasino were less likely than expected to be casino/activity and casino/place, whilethose who visited five or more casinos were more likely to be casino/activity. Signif-icant differences were also found in the number of visits to distant casinos (df = 10,v2 = 19.34, p = .04), mostly due to those visiting only one being much less likely tobe casino/activity, those going to two to four being somewhat less likely to becasino/activity, and those frequenting five or more being much more likely tobe casino/activity.
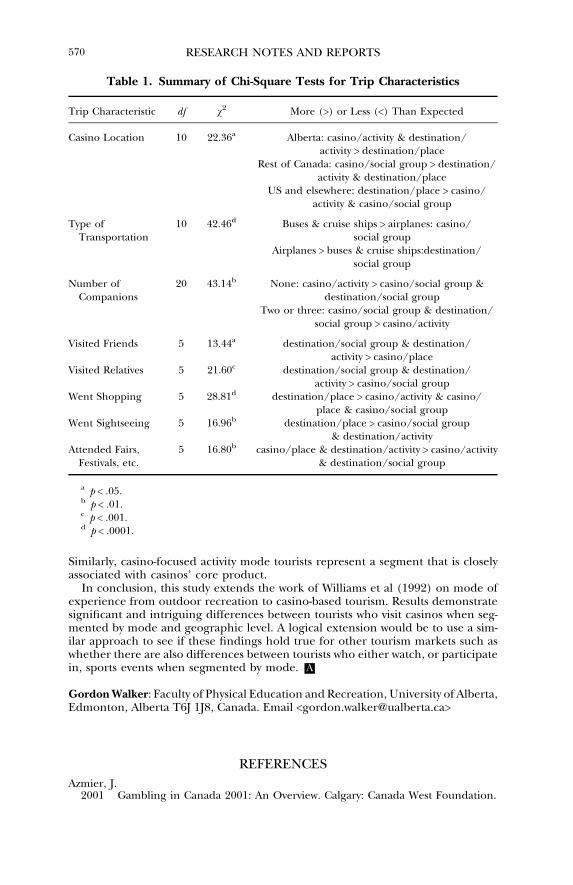
Chi-square tests also suggested that the six casino tourist groups varied signifi-cantly on a number of trip characteristics (Table 1), including where they had trav-eled, what type of transportation they had used to get there, how manycompanions had accompanied them, and which nongambling activities they hadparticipated in.
These findings indicate that casino tourists’ sociodemographic features and tripprofiles differ depending on which mode and geographic level is given primacy.Segmenting the market on this basis could thus provide managers with insight intoprospective target markets and the unique combinations of trip behaviors likely tobe exhibited by specific segments. This in turn could enable tourism managers toanticipate potential impacts resulting from a specific segment. For example, thesegment of most interest to destinations trying to encourage additional nongamingtrip activity (such as shopping) would be destination-focused place mode tourists.
RESEARCH NOTES AND REPORTS 569
Similarly, casino-focused activity mode tourists represent a segment that is closelyassociated with casinos’ core product.
In conclusion, this study extends the work of Williams et al (1992) on mode ofexperience from outdoor recreation to casino-based tourism. Results demonstratesignificant and intriguing differences between tourists who visit casinos when seg-mented by mode and geographic level. A logical extension would be to use a sim-ilar approach to see if these findings hold true for other tourism markets such aswhether there are also differences between tourists who either watch, or participatein, sports events when segmented by mode. A
Gordon Walker: Faculty of Physical Education and Recreation, University of Alberta,Edmonton, Alberta T6J 1J8, Canada. Email <[email protected]>
REFERENCES
Azmier, J.2001 Gambling in Canada 2001: An Overview. Calgary: Canada West Foundation.
Table 1. Summary of Chi-Square Tests for Trip Characteristics
Trip Characteristic df v2 More (>) or Less (<) Than Expected
Casino Location 10 22.36a Alberta: casino/activity & destination/activity > destination/place
Rest of Canada: casino/social group > destination/activity & destination/place
US and elsewhere: destination/place > casino/activity & casino/social group
Type ofTransportation
10 42.46d Buses & cruise ships > airplanes: casino/social group
Airplanes > buses & cruise ships:destination/social group
Number ofCompanions
20 43.14b None: casino/activity > casino/social group &destination/social group
Two or three: casino/social group & destination/social group > casino/activity
Visited Friends 5 13.44a destination/social group & destination/activity > casino/place
Visited Relatives 5 21.60c destination/social group & destination/activity > casino/social group
Went Shopping 5 28.81d destination/place > casino/activity & casino/place & casino/social group
Went Sightseeing 5 16.96b destination/place > casino/social group& destination/activity
Attended Fairs,Festivals, etc.
5 16.80b casino/place & destination/activity > casino/activity& destination/social group
a p < .05.b p < .01.c p < .001.d p < .0001.
570 RESEARCH NOTES AND REPORTS
Newsome, D., S. Moore, and R. Dowling2002 Natural Area Tourism: Ecology, Impacts and Management. Clevedon:
Channel View Publications.Statistics Canada
2000 Canadian Travel Survey: Domestic Travel, 1998. Ottawa: Ministry of Industry,Government of Canada.
Travel Industry Association of America2000 Profile of Travelers Who Participate in Gambling. Washington DC: Travel
Industry Association of America.Williams, D., M. Patterson, J. Roggenbuck, and A. Watson
1992 Beyond the Commodity Metaphor: Examining Emotional and SymbolicAttachment to Place. Leisure Sciences 14:29–46.
Submitted 17 December 2004. Resubmitted 2 February 2005. Resubmitted 17 February 2005. Accepted5 April 2005. Revised 10 September 2005. Accepted 3 October 2005
doi:10.1016/j.annals.2005.12.005
Annals of Tourism Research, Vol. 33, No. 2, pp. 571–574, 2006� 2006 Elsevier Ltd. All rights reserved.
Printed in Great Britain0160-7383/$32.00
Productivity and Service Quality Changesin International Hotels in Taiwan
Fei-Ching WangJui-Kou Shang
Jin-Wen Institute of Technology, TaiwanWei-Ting Hung
Vanung University, Taiwan
Because international tourist arrivals in Taiwan have been increasing rapidly,more and more hotels have been established, and this has spawned a highly compet-itive market. Facing this competitive environment, considering how to strengthenproductivity and upgrade service quality has become essential for survival.
While service quality has received considerable attention from managers, ithas been neglected in the hotel performance literature. Enhancement in thisarea will generate increased client satisfaction levels and purchase intentions(Cronin and Taylor 1992); however, this commitment requires more resources.To compare fairly different hotels, it is essential to incorporate service qualityattributes into the productivity analysis (Gummesson 1998). This study is thefirst to apply the quality-incorporated Malmquist productivity index to the hotelsector.
The Malmquist indices were initiated by Caves, Christensen and Diewert (1982)based on the concept of distance function developed by Malmquist (1953). Fare,Grosskopf, Lindgren, and Roos (1995) decomposed the index into two mutuallyexclusive components: efficiency change and technological change indices. Fare,Grosskopf, and Roos (1995) extended the Malmquist index in Fare et al (1995)
RESEARCH NOTES AND REPORTS 571