seepage management plan - restoresjr.net management plan draft i ... lsjld lower san joaquin levee...
TRANSCRIPT

Seepage Management Plan
Draft September 2014
Subject to Revision

This page left blank intentionally.

Seepage Management Plan Draft i – September 2014
Table of Contents 1
2
3
4
5
6
7
8
9
10
11
12
13
14
15
16
17
18
19
20
21
1 Introduction ........................................................................................................... 1-1 2 Purpose and Objectives ........................................................................................ 2-1 3 Seepage Effects ...................................................................................................... 3-1 4 Locations of Known Risks .................................................................................... 4-1 5 Monitoring Program............................................................................................. 5-1 6 Thresholds ............................................................................................................. 6-1 7 Operations Plan..................................................................................................... 7-1 8 Triggers .................................................................................................................. 8-1
9 Site Visits and Response Actions ......................................................................... 9-1 10 Projects ................................................................................................................ 10-1 11 Revisions .............................................................................................................. 11-1
Tables
Table 6-1. Thresholds for Groundwater and Soil Salinity Underlying
Agricultural Lands ......................................................................................... 6-2
Figures
Figure 1-1. San Joaquin River Restoration Program Area ..................................... 1-1
Figure 1-2. Schematic Representation of Losing and Gaining Streams ................. 1-3
Figure 5-1. SJRRP Monitoring Well Network, Including Stakeholder
Wells .............................................................................................................. 5-2

Draft Seepage Management Plan ii – September 2014
Appendices 1
2 3 4
5
6 7 8 9
10 11 12
13
14
15
16
17 18 19 20
21
22 23 24 25
26
27 28 29
30
31 32 33 34 35
36
37 38 39 40 41
Appendix A Seepage Effects of Concern .................................................................. A-1 A.1 Seepage Effects ................................................................................. A-1 A.2 Impact Mechanisms Affecting Crop Quality .................................... A-1
Appendix B Historic Groundwater Levels and Surface Water Flow .....................B-1
B.1 Groundwater Level Database .............................................................B-1 B.2 Methodology for Developing Water Table Maps ..............................B-1 B.3 Maps of Historical Groundwater Table Elevation ...........................B-16 B.4 Representative Hydrographs ............................................................B-16 B.5 Surface Water Flow .........................................................................B-16
Appendix C Areas Potentially Vulnerable to Seepage Effects ............................... C-1
C.1 Historical Depth to the Water Table ..................................................C-1
C.2 Anecdotal Information .......................................................................C-6
C.3 Elevation ..........................................................................................C-13
C.4 Prioritization of Parcel Groups for Seepage Projects ......................C-26
Appendix D Sediment Texture and Other Data ...................................................... D-1
D.1 Importance of Sediment Texture ...................................................... D-1 D.2 Sediment Texture Models ................................................................. D-2 D.3 NRCS Soil Data ................................................................................ D-6 D.4 Geomorphology .............................................................................. D-11
Appendix E Monitoring Network ..............................................................................E-1
E.1 Groundwater Levels ........................................................................... E-1 E.2 Real-Time Wells ................................................................................ E-7 E.3 Shallow Groundwater and Soil Salinity ............................................. E-8 E.4 Visual Observations ........................................................................... E-9
Appendix F Aerial Imagery, Remote Sensing Data ................................................. F-1
F.1 Landsat ............................................................................................... F-1 F.2 Cropland Data Layer .......................................................................... F-9 F.3 National Agriculture Imagery Program ........................................... F-18
Appendix G Soil Salinity Thresholds ........................................................................ G-1
G.1 General Salinity Considerations ....................................................... G-1 G.2 Common Crop Salt Tolerance Data .................................................. G-1 G.3 Preliminary Salinity Thresholds ....................................................... G-2 G.4 Other Indicators of Increasing Soil Salinity ...................................... G-3 G.5 General Description of Soil Monitoring Methods ............................ G-3
Appendix H Groundwater Level Thresholds ........................................................... H-1
H.1 Conceptual Development of Thresholds ........................................... H-1 H.2 Method 1 – Agricultural Practices .................................................... H-4 H.3 Method 2 – Historical Groundwater Levels.................................... H-21 H.4 Validation of thresholds .................................................................. H-39 H.5 Threshold Results............................................................................ H-39

Seepage Management Plan Draft iii – September 2014
Appendix I Groundwater Modeling .......................................................................... I-1 1
2
3
4
5
6 7
8
9
10
11
12 13
14
15 16
17
18
I.1 Current Objectives of Groundwater Modeling Efforts ....................... I-1
I.2 Status of Groundwater Model Development ...................................... I-1
I.3 Groundwater/Surface Water Interaction ............................................. I-6
I.4 Maximum Lateral Extent of SJRRP Flow Impacts............................. I-6
I.5 Effects of Precipitation, Irrigation, and River Flows on Groundwater Levels ............................................................................ I-6
I.6 Assessment of Monitoring Thresholds ............................................... I-6
I.7 Local Seepage Effects on Susceptible Lands ...................................... I-7
I.8 Potential Response Actions................................................................. I-7
Appendix J Operations .............................................................................................. J-1
J.1 Evaluations .......................................................................................... J-1 J.2 Site Visit and Response Actions ......................................................... J-6
Appendix K Landowner Claims Process .................................................................. K-1
K.1 Seepage Hotline for Real-Time Concerns ........................................ K-1 K.2 Potential Project Process ................................................................... K-2
Appendix L Seepage Project Handbook ...................................................................L-1
Appendix M References Cited................................................................................... M-1

Draft Seepage Management Plan iv – September 2014
1
2
3
4
This page left blank intentionally.

Seepage Management Plan Draft v – September 2014
List of Abbreviations and Acronyms 1
2
3
4
5
6
7
8
9
10
11
12
13
14
15
16
17
18
19
20
21
22
23
24
25
26
27
28
29
30
31
32
33
34
35
36
37
38
39
40
41
42
ASCE American Society of Civil Engineers
BA Biological Assessment
bgs Below Ground Surface
BLSD Below Land Surface Datum
BNLL Blunt Nosed Leepard Lizard
CCC Columbia Canal Company
CCID Central California Irrigation District
CDEC California Data Exchange Center
CDFG California Department of Fish and Game
CDL Cropland Data Layer
CEC Categoircal Exclusion Checklist
CEQA California Environmental Quality Act
CF Cubic- Feet
CFR Code of Federal Regulations
cfs cubic-feet per second
CNDDB California Natural Diversity Database
CVHM Central Valley Hydrologic Model
CVRWQCB Central Valley Regional Water Quality Control Board
dBA A-weighted decibel
DEC Design Estimates and Constructability
DMC Delta-Mendota Canal
dS/m decisiemens per meter
DTW Depth to Water
DWR Department of Water Resources
EA/IS Environmental Assessment/Initial Study
EC electrical conductivity
ECe Electrical conductivity of soil-water extract
EIS/EIR Environmental Impact Statement/Environmental Impact Report
EM Electromagnetic
EM38 Electromagnetic measurement device
EMh Electromagnetic reading in the horizontal direction
EMv Electromagnetic reading in the vertical direction
ESA Endangered Species Act
ESBP Eastside Bypass
ET Evapotranspiration
ETM+ Enhanced Thematic Mapper Plus
FAO Food and Agriculture Organization of the United Nations
FAPIIS Federal Awardee Performance and Integrity Information System
FONSI Finding of No Significant Impact
FSA Farm Service Agency
GIS Geographic information system

Draft Seepage Management Plan vi – September 2014
GPS Global Positioning System 1
2
3
4
5
6
7
8
9
10
11
12
13
14
15
16
17
18
19
20
21
22
23
24
25
26
27
28
29
30
31
32
33
34
35
36
37
38
39
40
41
42
43
44
45
46
GW Groundwater
HEC-RAS Hydrologic Engineering Center’s River Analysis System
HDPE High-density polyethylene
ID Identification
IDW Inverse distance weighting
IGCE Independent Government Cost Estimate
IRPGW Local groundwater model near Sand Slough Control Structure
ITA Indian Trust Asset
ITRC Irrigation Training and Research Center
LiDAR Light Detection and Ranging
LM Local groundwater flow model
LOC Level of Concern
LSJLD Lower San Joaquin Levee District
LTAA Likely to adversely affect
meq/100g milliequivlevents per 100 grams
meq/L milliequivelents per liter
MOA Memorandum of Agreement
MODFLOW Modular three-dimensional finite-difference groundwater flow
model
mS/m microseimen per meter
MW Monitoring well
NA Not available
NAIP National Agriculture Imagery Program
NASA National Aeronautics and Space Administration
NASS National Agricultural Statistics Service
NAVD North American Vertical Datum
NED National Elevation Dataset
NEPA National Environmental Policy Act
NHPA National Historic Preservation Act
NMFS National Marine Fisheries Service
NLTAA Not likely to adversely affect
NPDES National Pollution Discharge Elimination System
NRCS National Resources Conservation Service
NRDC National Resources Defense Council
NULE Non-Urban Levee Evaluation
OLI Operational Land Imager
OMB Office of Management and Budget
OVS Office of Valuation Services
pHp pH paste
PVC Polyvinyl chloride
PZ piezometer
QA/QC Quality Assurance/Quality Control
QAPP Quality Assurance Project Plan
Reclamation United States Bureau of Reclamation
RFP Request for Proposal

Seepage Management Plan Draft vii – September 2014
RMC Resource Management Council 1
2
3
4
5
6
7
8
9
10
11
12
13
14
15
16
17
18
19
20
21
22
23
24
25
26
27
28
ROD Record of Decision
RPA Reasonable and Prudent Alternatives
SJVAPCD San Joaquin Valley Air Pollution Control District
SAR Sodium Adsorption Ratio
SCTFG Seepage and Conveyance Technical Feedback Group
SHPO California State Historic Preservation Office
SJR San Joaquin River
SJRRP San Joaquin River Restoration Program
SJRRPGW San Joaquin River Restoration Program Groundwater Model
SLCC San Luis Canal Company
SLDMWA San Luis Delta Mendota Water Authority
SMAQMD Sacramento Metropolitan Air Quality Management District
SMP Seepage Management Plan
SOW Scope of Work
SSURGO Soil Survey Geographic database
TEP Temporary Entry Permit
TIRS Thermal Infrared Sensor
TM Technical Memorandum
TProGS Transition Probability Geostatistical Software
USACOE United Stated Army Corps of Engineers
USBR United Stated Bureau of Reclamation
USDA United States Department of Agriculture
USFWS United States Fish and Wildlife Service
USGS United States Geological Survey
VdB Vibration decibels
WDL Water Data Library
WSEL Water Surface Elevation

Seepage Management Plan Draft 1-1 – September 2014
1 Introduction 1
2
3
4
5
6
7
8
9
10
11
12
13 14
15
16
17
18
19
20
21
22
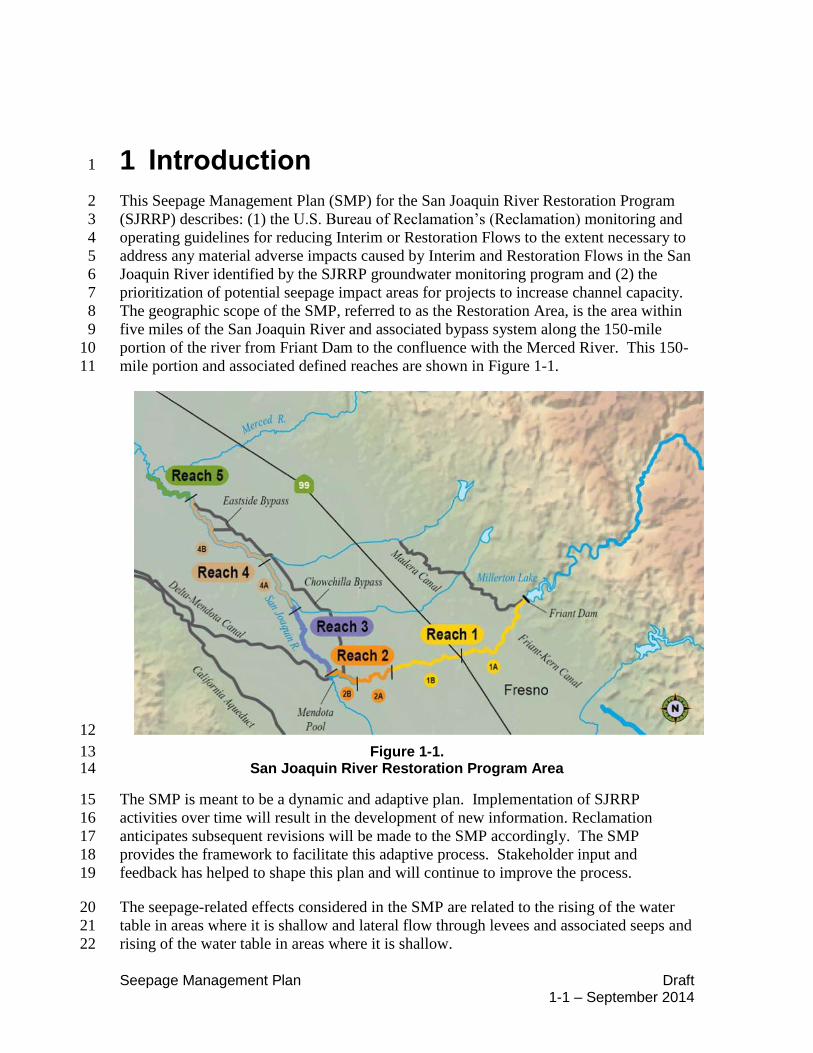
This Seepage Management Plan (SMP) for the San Joaquin River Restoration Program
(SJRRP) describes: (1) the U.S. Bureau of Reclamation’s (Reclamation) monitoring and
operating guidelines for reducing Interim or Restoration Flows to the extent necessary to
address any material adverse impacts caused by Interim and Restoration Flows in the San
Joaquin River identified by the SJRRP groundwater monitoring program and (2) the
prioritization of potential seepage impact areas for projects to increase channel capacity.
The geographic scope of the SMP, referred to as the Restoration Area, is the area within
five miles of the San Joaquin River and associated bypass system along the 150-mile
portion of the river from Friant Dam to the confluence with the Merced River. This 150-
mile portion and associated defined reaches are shown in Figure 1-1.
Figure 1-1. San Joaquin River Restoration Program Area
The SMP is meant to be a dynamic and adaptive plan. Implementation of SJRRP
activities over time will result in the development of new information. Reclamation
anticipates subsequent revisions will be made to the SMP accordingly. The SMP
provides the framework to facilitate this adaptive process. Stakeholder input and
feedback has helped to shape this plan and will continue to improve the process.
The seepage-related effects considered in the SMP are related to the rising of the water
table in areas where it is shallow and lateral flow through levees and associated seeps and
rising of the water table in areas where it is shallow.

San Joaquin River Restoration Program
Draft Seepage Management Plan 1-2– September 2014
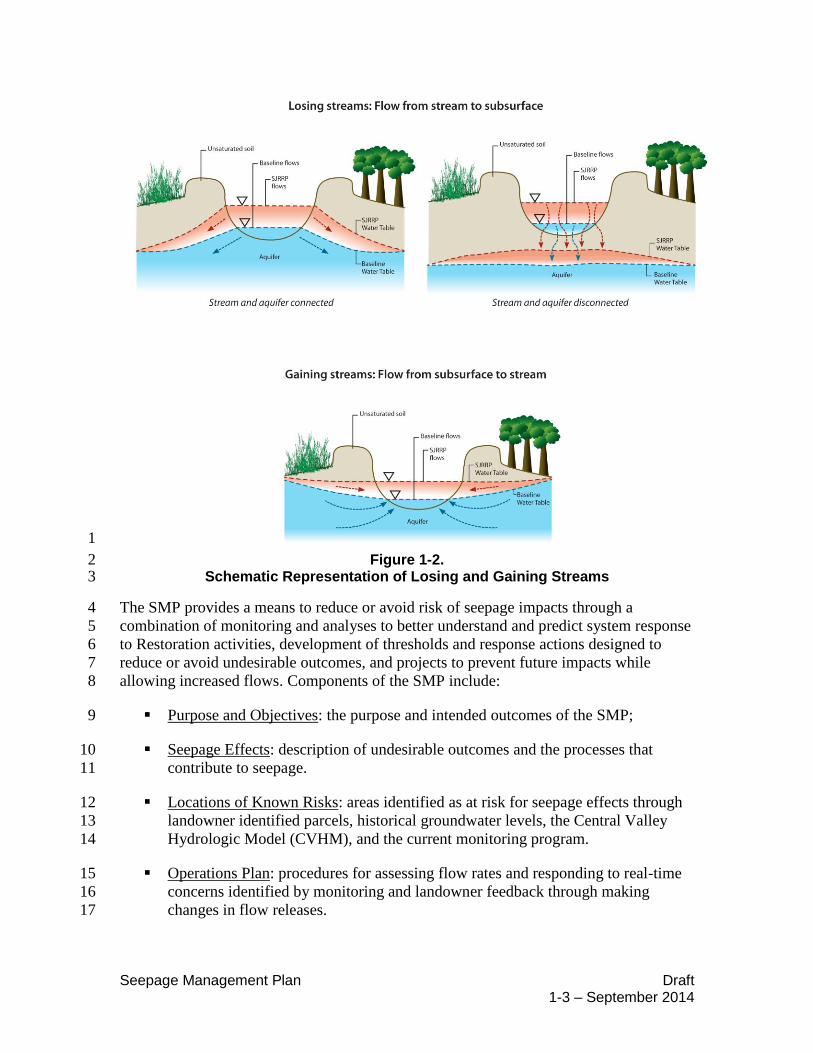
Two mechanisms may cause the water table to rise in association with Restoration Flows. 1
2
3
4
5
6
7
8
9
10
11
12
13
14
15
16
17
18
19
20
21
22
23
24
25
26
These mechanisms differ depending on whether the river is losing or gaining at a
particular area, as shown in Figure 1-2.
Losing Reaches: Along reaches where the river/bypass water surface elevation
(stage) is above the groundwater level, water flows from the river into the
groundwater system. An increase in the river/bypass stage in losing reaches
would cause additional water to flow into the groundwater system from the river.
Increased seepage from the river/bypass system may result in increased
groundwater levels.
Gaining Reaches: Along reaches where the river/bypass stage is below the
groundwater level, water flows from the groundwater system into the river. An
increase in the river stage in gaining reaches would reduce the water flowing from
the groundwater system into the river. This reduction in flow back to the
river/bypass could result in increased groundwater levels.
In response to either of these two mechanisms, the water table will rise until equilibrium
with surface water is established. In this document, all effects caused by groundwater
rise associated with changes in river/bypass stage, regardless of mechanism, are referred
to as seepage effects.
The effects of Restoration flows to the structural integrity of the levees, which includes
underseepage, through seepage, and stability, will also need to be addressed by the
SJRRP. However, Restoration Flows are currently being kept in-channel (below the
landside ground of the levee) to avoid impacts on the levees. Therefore, monitoring and
operating guidelines for reducing impacts to levees are not included in the SMP. The
California Department of Water Resources (DWR) is currently developing a strategy to
assist the program in addressing impacts to levees and future versions of the SMP may
incorporate these strategies.
Seepage Management Plan Draft 1-3 – September 2014
1
2 3
4
c5
t6
r7
a8
9
10
11
12
13
14
15
16
17
Figure 1-2. Schematic Representation of Losing and Gaining Streams
The SMP provides a means to reduce or avoid risk of seepage impacts through a
ombination of monitoring and analyses to better understand and predict system response
o Restoration activities, development of thresholds and response actions designed to
educe or avoid undesirable outcomes, and projects to prevent future impacts while
llowing increased flows. Components of the SMP include:
Purpose and Objectives: the purpose and intended outcomes of the SMP;
Seepage Effects: description of undesirable outcomes and the processes that
contribute to seepage.
Locations of Known Risks: areas identified as at risk for seepage effects through
landowner identified parcels, historical groundwater levels, the Central Valley
Hydrologic Model (CVHM), and the current monitoring program.
Operations Plan: procedures for assessing flow rates and responding to real-time
concerns identified by monitoring and landowner feedback through making
changes in flow releases.

San Joaquin River Restoration Program
Draft Seepage Management Plan 1-4– September 2014
Monitoring Program: the data collection program including a series of telemetry, 1
2
3
4
5
6
7
8
9
10
11
12
13
14
15
16
17
18
19
20
21
22
23
24
25
26
27
28
29
30
31
32
33
34
35
36
logged, and manually measured monitoring well transects and staff gages spaced
roughly eight to ten miles apart with additional wells at locations identified by the
SJRRP and landowners to document the hydrologic response to Interim and
Restoration Flows, inform analyses, constrain modeling, and identify potential or
actual seepage impacts. The SJRRP has currently installed over 200 monitoring
wells and piezometers.
Thresholds, Triggers, and Operational Criteria: groundwater levels that identify
the potential for seepage effects, and events that result in increased scrutiny and
provide operational criteria to restrict the magnitude, timing, or duration of flows.
Site Visits and Response Actions: specific actions or alternative actions that will
be implemented as necessary to meet operational criteria and avoid or reduce
seepage impacts;
Projects: potential modifications to reduce seepage effects and allow for higher
flows that require independent, supplemental environmental documentation and
regulatory review; and
Revision Process: process for modifying and/or updating the SMP on the basis of
information obtained during implementation of the SMP.
Data and tools to support the SMP include recent measurements, anecdotal evidence,
hydrologic models, and analytical computations. Implementation of these tools requires a
number of site-specific tasks to determine monitoring locations, install monitoring
systems, establish thresholds, and prescribe response actions for various levels of SJRRP-
induced changes. Local landowners can provide information to improve the effectiveness
of the program including continued input through the Seepage and Conveyance Technical
Feedback Group1 (SCTFG) meetings. The main body of the SMP describes the
components and interactions of operations to reduce or avoid seepage impacts. The
following appendices contain supporting technical information:
A: Seepage Effects of Concern
B: Historic Groundwater Levels and Surface-Water Flow
C: Areas Potentially Vulnerable to Seepage Effects
D: Sediment Texture and Other Soil Data
E: Monitoring Network
F: Aerial Imagery, Remote Sensing Data
G: Soil Salinity Thresholds
H: Groundwater Level Thresholds
I: Groundwater Modeling
1 The SCTFG is a group of interested stakeholders that includes Reclamation, members of the Settling
Parties, landowners, and other interested entities. These meetings are open to the public. Meeting times
and locations are posted on the SJRRP website at restoresjr.net.

Seepage Management Plan Draft 1-5 – September 2014
J: Operations 1
2
3
4
5
6
7
K: Landowner Claims Process
L: Seepage Project Handbook
M: References Cited
The SMP is part of the project description for the SJRRP and the expected environmental
impacts of implementing the SMP must comply with the National Environmental Policy
Act (NEPA) and California Environmental Quality Act (CEQA) criteria.

San Joaquin River Restoration Program
Draft Seepage Management Plan 1-6– September 2014
1
2
3
4 This page left blank intentionally.

Seepage Management Plan Draft 2-1 – September 2014
2 Purpose and Objectives 1
2
3
4
5
6
7
8
9
10
11
12
13
14
15
16
17
18
19
20
The SMP will lead to conveyance of Restoration Flows while reducing or avoiding
SJRRP-induced seepage impacts along the San Joaquin River and the Eastside and
Mariposa Bypasses from Friant Dam to the confluence with the Merced River. The SMP
addresses several components of the San Joaquin River Restoration Settlement Act,
Public Law 111-11, which requires the Secretary of the Interior to:
1. Prepare an analysis that includes channel conveyance capacities and the potential
for levee or groundwater seepage;
2. Describe a seepage monitoring program; and
3. Evaluate possible impacts associated with the release of Interim and/or
Restoration Flows.
Though the plan does not assess flood impacts associated with the Restoration Flows
with respect to the structural integrity of the levee, which include underseepage, through
seepage, and stability, DWR is identifying potential strategies to assist the program in
addressing flood impacts. As an initial step, DWR is identifying and prioritizing levees
with the greatest impact from short term and long term restoration flows and performing
geotechnical explorations. DWR will coordinate with SJRRP and provide data and
analyses regarding the structural integrity of the levees for its consideration of
incorporating management strategies in future versions of the SMP to address flood
impacts.

San Joaquin River Restoration Program
Draft Seepage Management Plan 2-2– September 2014
1
2
3 This page left blank intentionally.

Seepage Management Plan Draft 3-1 – September 2014
3 Seepage Effects 1
2
3
4
5
6
7
8
9
10
11
12
13
14
15
The SMP identifies and evaluates a physical impact by describing the measurable impact
mechanisms, processes, and thresholds where actual or pending seepage could cause
damage. Impact mechanisms under the SMP include:
Waterlogging of Crops: inundation of the root zone resulting in mortality or
reduced crop yields;
Root Zone Salinization: salinity increases resulting in mortality or reduced crop
yields; or
Levee Impacts: movement of water through or underneath levees, commonly
appearing as boils or piping (seeps), that may saturate the levee or transport
foundation materials and compromise the short- or long-term integrity of the
levee. Since the SJRRP is keeping flows in-channel, the SMP does not identify or
evaluate the seepage effects associated with levee impacts. Future versions of the
SMP may include information on DWR’s strategies to assist the program in
addressing seepage impacts to levees.

San Joaquin River Restoration Program
Draft Seepage Management Plan 3-2– September 2014
1
2
3
This page left blank intentionally.

Seepage Management Plan Draft 4-1 – September 2014
4 Locations of Known Risks 1
2
3
4
5
6
7
8
9
10
11
This plan represents potential risks by sites and areas of likely or known vulnerability to
seepage effects on the basis of:
Mapped depth to the water table using measured water levels;
Problematic areas identified by landowners;
Analysis of flow, precipitation, and water-level data; and /or
Simulation results using a regional hydrologic model, particularly in areas where
water-level data are sparse.
Appendix C, Areas Potentially Vulnerable to Seepage Effects, includes documentation of
these data and analyses. The analysis of potential risks documents local knowledge,
assists in siting monitoring stations, and prioritizes projects.

San Joaquin River Restoration Program
Draft Seepage Management Plan 4-2– September 2014
1
2
3 This page left blank intentionally.

Seepage Management Plan Draft 5-1 – September 2014
5 Monitoring Program 1
2
3
4
5
6
7
8
9
10
11
12
13
14
15
16
17
18
19
20
21
22
23
24
25
26
27
28
29
30
31
32
Reclamation monitors the effects of SJRRP activities which informs identification of
when, where, what, and how potential response actions may be implemented.
Thresholds, discussed in Section 6, are groundwater levels that suggest the need for
potential response actions and/or additional data collection needs. The monitoring
program informs modeling and analysis to evaluate strategies for implementing response
actions. See Appendix E, Monitoring Well Network Plan and Other Seepage-Related
Monitoring, for details on the existing Monitoring Plan and future directions.
Areas underlain by a shallow water table, herein referred to as shallow (less than 20 feet
bgs) groundwater areas, are of particular interest in the monitoring program. The SJRRP
has installed over 200 monitoring wells and piezometers as of mid-2014. The monitoring
program includes:
1. Well transects spaced at roughly every eight to ten miles with four to six shallow
monitoring wells (representative of the water table aquifer), a staff gage
measuring river stage, and one to two deeper monitoring wells (potentially
representative of the underlying semi-confined or confined aquifer) at each
transect;
2. Additional shallow wells located in known shallow groundwater areas that may
be affected by seepage, in collaboration with local landowners and the Central
California Irrigation District (CCID);
3. Soil sampling and soil salinity surveys using electromagnetic (EM)
methodology, in collaboration with local landowners; and
4. Reporting from local landowners on visual crop health, levee seeps, and other
observations.
Figure 5-1 shows the current network of wells in the SJRRP monitoring program.
Information from monitoring, analysis, and local landowners will be used to determine
well locations, subject to potential access limitations. New information may indicate that
wells should be added, decommissioned, excluded from particular cross-sections or
otherwise modified in the future. The Monitoring Well Atlas, available on the SJRRP
website (restoresjr.net), contains details of the monitoring well network and will be
updated periodically as additional information is gained and wells are installed or
modified.

San Joaquin River Restoration Program
Draft Seepage Management Plan 5-2– September 2014
1
2 3
Figure 5-1. SJRRP Monitoring Well Network, Including Stakeholder Wells

Seepage Management Plan Draft 6-1 – September 2014
6 Thresholds 1
2
3
4
5
6
7
8
9
10
11
12
13
14
15
16
17
18
19
20
21
22
23
24
25
26
Thresholds identify transition points where seepage effects cross into a range that may
cause damages. Thresholds also collect information before an impact occurs and provide
time to initiate a response. Thresholds may take the following forms:
Water Surface Elevation: measured elevation of the water surface in a well
relative to a vertical datum.
Depth to Water: measured vertical distance to the water surface in a well relative
to the land surface.
Root Zone Salinity: measured (using direct or indirect methods) salinity in the
plow layer or root zone and/or distribution of salinity in soil profiles.
Groundwater levels shallower than a threshold indicates the potential for impacts in the
absence of actions to avoid, minimize, rectify, reduce, or compensate for seepage
impacts. Site-specific customization of specific thresholds will continue to be enhanced
by coordination with local landowners and may depend upon characteristics such as:
Local geology;
Presence, design considerations, and state/condition of the levee system;
Historical experience and areas of known historical seepage problems;
Structures and operations;
Soil salinity profile;
Crop type; or
Purpose of threshold.
Draft thresholds associated with the water table and monitoring thresholds for soil
salinity in farmed shallow groundwater areas are shown in Table 6-1. The salinity
thresholds apply only where current conditions are more favorable than the threshold
values. If current conditions exceed threshold values, thresholds will be a specified
change from current conditions.

San Joaquin River Restoration Program
Draft Seepage Management Plan 6-2– September 2014
Table 6-1. 1 2
3
4
5
6
7
8
9
10
11
12
13
Thresholds for Groundwater and Soil Salinity Underlying Agricultural Lands
Impact indicator Threshold Basis
Plow layer soil salinity (0-12 inches below land surface)
ECe1 = 2.0 deciSiemens/m (ds/m)
(See Appendix G)
Salinity affects germination or emergence of vegetable and other crops
Active root zone soil salinity (0-30 inches below land surface)
River-reach-specific; e.g., ECe1 = 1.5
ds/m for reach 2B
(See Appendix G)
Known salt tolerance for crops
Minimum depth to water table Variable, depending on crop type, historical water levels, and local conditions (see Appendix H)
Waterlogging affects crop yields and increases soil salinity
1 ECe is electrical conductivity of soil-water extract (saturation extract)
The SJRRP has identified specific groundwater thresholds for each well and priority
wells for measuring groundwater thresholds in areas of known risk. There are two
methods for determining the groundwater threshold. These include:
Agricultural practices, and
Historical groundwater conditions.
The thresholds are generalized, and adjustments may be required to account for on-site
and/or seasonal conditions. Crop health can be affected by conditions unrelated to
SJRRP activities, including various climatic conditions and other factors such as plant
diseases. The procedures used for establishing thresholds are described in Appendix G,
Development of Soil-Salinity Thresholds, and Appendix H, Development of
Groundwater Level Thresholds.

Seepage Management Plan Draft 7-1 – September 2014
7 Operations Plan 1
2
3
4
5
6
7
8
9
10
11
12
13
14
15
16
17
18
19
20
21
22
23
24
25
26
27
28
29
30
31
32
33
34
35
36
37
38
39
The approach to operations is a conservative, iterative one. Prior to an increase in the
targeted Friant Dam release, the SJRRP conducts a Flow Bench Evaluation. The purpose
of the Flow Bench Evaluation is to avoid seepage impacts through checking factors and
reducing or eliminating the proposed increase accordingly. The SJRRP will estimate a
release from Friant Dam, Mendota Dam, and Sack Dam that avoids seepage impacts.
The SJRRP will estimate non-damaging flows by linking thresholds to river stage
through a conceptual model. The conceptual model initially (and conservatively)
assumes one foot of increase in river stage causes one foot of increase in groundwater
and there is no groundwater gradient. If the monitoring program identifies areas where
the conceptual model predicts overly conservative flow limits, the SJRRP may update
flow releases based on site specific information. When the SJRRP cannot estimate a
higher release that will not exceed a threshold, the stage or flow rate in the river becomes
an operational criterion. An operational criterion is a specific measurable or observable
criterion (such as a river stage) that indicates impending impacts, is established based on
site-specific analysis, and will limit flow releases.
Flow Bench Evaluations analyze the following:
1. Conveyance Capacity: The evaluation attempts to avoid levee instability by
limiting flows to the rated conveyance capacity of the channel.
2. Flow Stability: The evaluation will account for travel time and potential changes
that may not have materialized since the prior change in releases by allowing
flows to stabilize before the next change in releases.
3. Groundwater Projections: The evaluation attempts to avoid seepage impacts by
predicting groundwater level rise from the proposed increase either a one foot
increase in river stage equates to a one foot increase in groundwater level or
evaluating drainage conditions, ensuring groundwater levels above the threshold
are able to drain to the river or bypass. If groundwater levels are predicted to rise
above thresholds, this triggers a site visit, prior to the change in flow.
4. Groundwater Telemetry: Avoid seepage impacts by monitoring real-time
groundwater wells and conducting a site visit if levels are near thresholds.
5. Groundwater Manual Measurements: Groundwater wells are measured weekly to
identify and avoid potential seepage impacts. A site visit would be conducted if
groundwater levels are near thresholds.
6. Mendota Pool Operations: The analysis will attempt to avoid infeasible
operations through coordination with Mendota Pool operators, including
potential concerns regarding exchange contractor demand, water quality, and
Central Valley Project South of the Delta operations.
7. Landowner Feedback (Seepage Hotline): Gathering data from Seepage Hotline
calls and subsequent site visits attempts to avoid seepage impacts.

San Joaquin River Restoration Program
Draft Seepage Management Plan 7-2– September 2014
8. Operations Feedback: Providing feedback on operations will avoid infeasible 1
2
3
4
5
6
7
8
9
10
11
12
13
operations and levee instability through coordination with the CCID, San Luis
Canal Company (SLCC), and Lower San Joaquin Levee District (LSJLD) on
potential concerns with the proposed flow increase.
In addition to Flow Bench Evaluations, the SJRRP conducts Daily Flow Evaluations
when flows are above 475 cfs. Daily Flow Evaluations include documentation of the
checks on conveyance capacity, Mendota Pool operations, and landowner feedback as
described above. Daily Flow Evaluations also trigger site visits if real-time or measured
groundwater levels are near thresholds.
Flow Bench Evaluations and Daily Flow Evaluations help the SJRRP avoid seepage
impacts and document decisions to increase flows. These evaluations also trigger site
visits and response actions based on SJRRP’s monitoring network. An example Flow
bench Evaluation is shown in Appendix J, Operations.

Seepage Management Plan Draft 8-1 – September 2014
8 Triggers 1
2
3
4
5
6
7
8
9
10
11
12
13
Triggers describe when the SJRRP will take action through site visits and flow
management. There are three different types of triggers. Two of these triggers are SJRRP
actions. The third trigger allows landowners observations to initiate SJRRP action. These
triggers include:
1. Flow Bench Evaluations: A site visit and response action is triggered when
groundwater levels are predicted to rise above thresholds.
2. Daily Flow Evaluations: A site visit and response action is triggered when
measured groundwater levels are at monitoring thresholds.
3. Seepage Hotline Call: A site visit and response action is triggered when
landowners observe seepage-related issues.
Following a trigger, the SJRRP will initiate a site visit. The SJRRP may re-evaluate the
estimated flow rate and/or the threshold as a result of information collected at a site visit.

San Joaquin River Restoration Program
Draft Seepage Management Plan 8-2– September 2014
1
2
3
4
This page left blank intentionally.

Seepage Management Plan Draft 9-1 – September 2014
1
2
3
4
5
6
7
8
9
10
11
12
13
14
15
16
17
18
19
20
21
22
23
24
25
26
27
28
29
30
31
32
33
34
9 Site Visits and Response Actions
Site visits triggered by Flow Bench Evaluations, daily flow evaluations, or seepage
hotline calls, collect a variety of information to inform management response decisions.
Site visits provide an initial assessment to determine the type of impact, description of the
seepage, the relationship to interim flows, the immediacy of the response, a
recommended real-time response action, and any needed follow-up regarding projects.
Site visits may include collection of field data and conversation with the landowner to
gather the following types of data:
1. Landowner input on seepage effects;
2. River stage;
3. Soil texture;
4. Hand auger groundwater levels (allows rapid response rather than waiting for
backhoe procurement or well installation);
5. Soil salinity (EM38 evaluations);
6. Information about existing infrastructure (e.g., drains, pumps, canals);
7. Crop health; and
8. Photos.
The operations for releasing Restoration Flows are designed to safely convey flows
without triggering the need for response actions. If site visits are triggered, response
actions will be evaluated and implemented as soon as practicable to avoid or reduce
seepage impacts. Flood operations supersede SJRRP releases and may occur irrespective
of groundwater monitoring. Potential response actions include:
1. Continue with Planned Releases. No seepage impacts are anticipated at the site
based on the planned release schedule. Anticipated releases can occur.
2. Increased Monitoring. No seepage impacts are anticipated at the site for the near-
term anticipated releases; however, an increased monitoring frequency will
gather additional information to assist in evaluating the potential seepage impacts
of future releases.
3. Flow Rate Adjustment. The conceptual model linking thresholds to river stage
may be adjusted based on information gathered at the site visit. This may or may
not create a new restriction on maximum release.
4. Threshold Adjustment. Information gathered at the site visits regarding crops,
historical groundwater conditions, or drainage suggest the threshold(s) at the site
be adjusted. The adjustment will be done in collaboration with the landowner.

San Joaquin River Restoration Program
Draft Seepage Management Plan 9-2– September 2014
5. Flow Response Actions: An immediate or future change in flows is needed to 1
2
3
4
5
6
7
8
9
10
11
12
13
14
15
16
17
18
19
20
21
22
23
24
25
26
27
28
29
30
31
32
33
34
35
36
prevent material adverse seepage impacts. Potential flow response actions
include:
a. Restrictions on Maximum Release. Flow rates in each reach will be
established below documented historical rates known to cause seepage
impacts, to be accomplished through a combination of releases from Friant
Dam, infiltration, and agreements with diverters.
b. Restrictions on Ramping Rates and Duration. Limits on the incremental
increases in flow rates provide the ability to evaluate the system response
through the monitoring program while limiting the volume of upstream
water if an impending impact is observed, measured, or predicted through
simulation.
c. Reduction of Restoration Flow Releases at Friant Dam. Reductions in
Restoration Flows released from Friant Dam will limit the amount of
water available to cause seepage impacts. Reductions at Friant Dam
would need to consider travel time and the associated delay in response.
d. Redirection of Flows at Chowchilla Bifurcation Structure. Directing flow
into the bypass system at the Chowchilla Bifurcation Structure will
provide a faster response for downstream reaches compared to Friant Dam
operational changes. This response requires coordination with the LSJLD
for such operations.
e. Delivery of Flows to Exchange Contractors and Refuges at Mendota Pool.
Delivery of water to Mendota Pool will reduce flows in Reach 3 and
downstream. Use of diversion into Mendota Pool to reduce downstream
flows requires coordination with the CCID and the San Luis Delta-
Mendota Water Authority (SLDMWA).
f. Delivery of Flows to Exchange Contractors and Refuges at Sack Dam. At
times when the SLCC has canal conveyance capacity, additional water
diversions at Sack Dam can assist with reducing potential seepage impacts
in Reach 4A and downstream. Use of the Sack Dam response requires
coordination with the SLCC.
g. Redirection of flows at Sand Slough Control Structure. Currently,
Restoration Flows will not be directed into Reach 4B of the San Joaquin
River channel. In subsequent years, water causing concerns in Reach 4B
may be diverted into the Eastside Bypass (ESBP). Use of the ESBP
requires coordination with the LSJLD.

Seepage Management Plan Draft 10-1 – September 2014
10 Projects 1
2
3
4
5
6
7
8
9
10
11
12
13
14
15
16
17
18
19
20
Potential future actions may be needed if meeting Settlement goals through specified
Restoration Flows is sufficiently compromised by seepage-related constraints. Such
actions may include real estate actions or structural additions. These actions likely would
require landowner agreements and initiation of project-specific environmental
documentation to comply with NEPA, CEQA, and other regulatory requirements.
Potential future actions may include:
1. Easements and/or compensation for seepage effects;
2. Acquisition of lands;
3. Cut-off walls between the river/bypass and seepage-impacted lands to reduce
water-table response to increased surface-water stage;
4. Seepage plugs to protect against levee failure;
5. Drainage interceptor ditches to lower the water table;
6. Interceptor drains to lower the water table;
7. Operation of new drainage and/or existing irrigation wells to lower the water
table;
8. Building up the land surface; and/or
9. Conveyance improvements such as sand removal.
The SMP will not include design, environmental compliance, or construction of potential
projects, but will assist in identifying such actions.

San Joaquin River Restoration Program
Draft Seepage Management Plan 10-2– September 2014
1
2
3 This page left blank intentionally.

Seepage Management Plan Draft 11-1 – September 2014
11 Revisions 1
2
3
4
5
6
7
8
9
10
11
12
13
14
15
Updates to the SMP may include changes derived from data obtained through the
monitoring program, results from improved modeling and analysis tools, modified
objectives or thresholds, and/or identification of additional concerns that arise through
SMP implementation. The steps for revising the SMP include:
1. Stakeholders may submit recommendations to the SJRRP Program Manager at
any time;
2. The SJRRP Program Manager will acknowledge and respond to
recommendations; and
3. A periodic review of the SMP through the SCTFG meetings may incorporate
changes, including any new information such as the findings of a peer review
panel.
The revision process sets the expectations for stakeholder and management participation.
The SJRRP may not be able to commit to specific recommended actions, but all
comments and recommendations will be considered.

San Joaquin River Restoration Program
Draft Seepage Management Plan 11-2– September 2014
1
2
3 This page left blank intentionally.