seeing the unseen: revealing mobile malware hidden ... · pdf file1 seeing the unseen:...
TRANSCRIPT
HAL Id: hal-01247495https://hal.archives-ouvertes.fr/hal-01247495
Submitted on 22 Dec 2015
HAL is a multi-disciplinary open accessarchive for the deposit and dissemination of sci-entific research documents, whether they are pub-lished or not. The documents may come fromteaching and research institutions in France orabroad, or from public or private research centers.
L’archive ouverte pluridisciplinaire HAL, estdestinée au dépôt et à la diffusion de documentsscientifiques de niveau recherche, publiés ou non,émanant des établissements d’enseignement et derecherche français ou étrangers, des laboratoirespublics ou privés.
Seeing the Unseen: Revealing Mobile Malware HiddenCommunications via Energy Consumption and Artificial
IntelligenceLuca Caviglione, Mauro Gaggero, Jean-François Lalande, Wojciech
Mazurczyk, Marcin Urbanski
To cite this version:Luca Caviglione, Mauro Gaggero, Jean-François Lalande, Wojciech Mazurczyk, Marcin Urbanski.Seeing the Unseen: Revealing Mobile Malware Hidden Communications via Energy Consumptionand Artificial Intelligence. IEEE Transactions on Information Forensics and Security, Institute ofElectrical and Electronics Engineers, 2016, 11 (4), pp.799-810. <10.1109/TIFS.2015.2510825>. <hal-01247495>
1
Seeing the Unseen: Revealing Mobile Malware
Hidden Communications via Energy Consumption
and Artificial IntelligenceLuca Caviglione, Mauro Gaggero, Jean-Francois Lalande, Wojciech Mazurczyk, and Marcin Urbanski
Abstract—Modern malware uses advanced techniques to hidefrom static and dynamic analysis tools. To achieve stealthinesswhen attacking a mobile device, an effective approach is theuse of a covert channel built by two colluding applicationsto locally exchange data. Since this process is tightly coupledwith the used hiding method, its detection is a challengingtask, also worsened by the very low transmission rates. As aconsequence, it is important to investigate how to reveal thepresence of malicious software by using general indicators suchas the energy consumed by the device. In this perspective, thepaper aims to spot malware covertly exchanging data by usingtwo detection methods based on artificial intelligence tools such asneural networks and decision trees. To verify their effectiveness,seven covert channels have been implemented and tested over ameasurement framework using Android devices. Experimentalresults show the feasibility and effectiveness of the proposedapproach to detect the hidden data exchange between colludingapplications.
Index Terms—Energy-based malware detection, covert chan-nels, colluding applications, neural networks, decision trees.
I. INTRODUCTION
Modern malware uses advanced techniques to defeat static
analysis tools or live detection systems. Even if designing
a malware is nowadays considered quite common [1], the
most advanced programmers try to hide malicious behaviors
by using different techniques, such as the repackaging of
legitimate applications or the obfuscation/ciphering of code.
Besides, by automating such mechanisms, a single attacker can
add malicious code to several applications that may be sent
This research was partially supported by the Polish National ScienceCenter under grant no. 2015/18/E/ST7/00227.
L. Caviglione and M. Gaggero are with the Institute of Intelligent Systemsfor Automation, National Research Council of Italy, Genoa, Italy (e-mail:[email protected]; [email protected]).
J.-F. Lalande is with the INSA Centre Val de Loire, Bourges, Franceand with the CIDRE team, CentraleSupelec/Inria, Rennes, France (e-mail:[email protected]).
W. Mazurczyk and M. Urbanski are with the Warsaw University ofTechnology, Institute of Telecommunications, Warsaw, Poland (e-mail:[email protected]; [email protected]).
The source code of the covert channels and the measurementframework described in this paper is available online athttp://steganocc.gforge.inria.fr.
c© 2015 IEEE. Personal use of this material is permitted. Permission fromIEEE must be obtained for all other uses, in any current or future media,including reprinting/republishing this material for advertising or promotionalpurposes, creating new collective works, for resale or redistribution to serversor lists, or reuse of any copyrighted component of this work in other works.
This article is a post-print version of the paper published inIEEE Transactions on Information Forensics and Security with DOI10.1109/TIFS.2015.2510825.
to alternative markets. As a consequence, classical signature-
based methods have limited results [2].
One of the most advanced mechanisms used by malware
to exfiltrate information or to bypass the security frameworks
of mobile devices relies upon information-hiding techniques
to exchange data between different processes. Especially, as
in the case of smartphones, a local covert channel can be
used to setup a communication path between two colluding
applications to extract personal information [3], [4]. As it has
been observed in [5], mobile devices are particularly prone to
hidden-communication attacks due to their variety of hardware
resources, as they incorporate cameras, GPS, WLAN, Blue-
tooth, cellular networks, and many sensors. Moreover, mal-
ware developers turned a significant portion of their attention
to mobile devices, leading to an increase of 1800% in mobile
malware over the past two years [6]. Therefore there is an urge
for research efforts to design original countermeasures and
enable early prevention. Unfortunately, this is very difficult
since the detection strictly depends on the type of covert
channel. For instance, exploiting electromagnetic signals to
covertly transmit data is very different from manipulating the
statistics of the available RAM to embed secrets [5]. Addi-
tionally, covert channels typically achieve limited bandwidths,
thus increasing the complexity of finding out whether a hidden
exchange is ongoing.
In this perspective, a promising approach aims at exploit-
ing general information to detect covert channels. A recent
debate has emerged about the possibility of using the power
consumption as an indicator to identify malicious activities.
Despite [7] claims that malware cannot be detected by high-
level applications measuring energy consumption of processes,
other works demonstrate that proper power measurements can
reveal some threats [8]–[10].
In this paper, we show the feasibility of using measure-
ments of the energy consumed by a device to detect malware
exploiting a covert channel. To this aim, we have implemented
five popular covert channels available in the literature targeting
the Android platform [4], [11], together with two new ones.
Further, we have developed an experimental setup to quantify
the energy consumption of the software components running
on a mobile device. In more details, we have used measure-
ments provided by the high-level model of PowerTutor [8]
together with values available in the /sys portion of the file
system [10], [12].
To perform the detection, we developed an approach based
on two well-known artificial intelligence tools, i.e., neural
2
networks [13] and decision trees [14]. They are able to learn
from a set of past collected energy measurements whether
hidden communication is present, and then reveal threats.
Specifically, two detection methods have been developed, each
one using both neural networks and decision trees. The first
approach requires the solution of a regression problem to
predict the future behavior of energy consumption. A hidden
communication is spotted if the difference between the actual
and predicted consumption exceeds a certain threshold. The
second method is based on a classification problem, and
provides information on hidden communications by using a set
of features characterizing the energy behavior of the device.
The considered artificial intelligence tools have been already
used to reveal malicious code [15], [16] or to prevent the
execution of hazardous software on Android devices [17].
However, no previous works using energy consumption to spot
information-hiding-capable malware exist in the literature.
To summarize, the main contributions of this paper are:
(i) showcase the feasibility of using energy footprints for
the detection of malware implementing information-hiding
techniques, (ii) the creation of an ad-hoc testbed and a hybrid
measurement method to characterize seven covert channels,
including two new implementations, and (iii) the development
of two “intelligent” frameworks to perform the detection with
low computational requirements.
The rest of this paper is structured as follows. Section II
reviews the literature dealing with the detection of malware by
using energy measurements. Section III details the reference
scenario and the considered covert channels, while Section IV
describes the methodology used for the measurements of
power consumption. Section V introduces the two detection
methods based on neural networks and decision trees, and
Section VI discusses experimental results. Finally, Section VII
concludes the paper.
II. RELATED WORKS
Anomaly detection using energy footprints has been par-
tially investigated in the literature, primarily for malware and
network attacks. However, at best of the authors’ knowledge,
it has never been applied to covert channels.
In general, energy-based anomaly detection methods are
grouped according to how measurements are performed. In
more details, we have the following approaches.
1) System-based [7], [18]–[20]: an energy footprint is cre-
ated by considering the whole consumption of the device
or some specific sets of applications and/or hardware
parts. The obtained data represents the “clean system”
that serves as a baseline for malware discovery.
2) Application-based [21]: similarly to the previous case,
an energy footprint is created for a well-defined pool
of applications (e.g., games), and each one is measured
separately. The collected traces are then compared at
runtime against the data obtained with a single-process
granularity.
3) User-based [22]–[24]: an energy footprint is created by
analyzing the typical behavior of users and the related
power consumption. This also includes, for instance, the
applications and device features that are active, as well
as their timing statistics.
4) Attack-based [9], [10], [25]–[27]: measurements are done
while real attacks or malicious malware activities are
performed in a controlled environment. The acquired
traces form a database of energy signatures used for the
detection.
It is worth noting that methods belonging to the first three
groups can potentially deal with unknown threats, while the
last one only allows to recognize attacks for which signatures
are available.
Concerning system-based methods, Jacoby et al. [19]
demonstrated how to reveal network attacks by using a
battery-based Intrusion Detection System (IDS) analyzing the
power consumption and the utilization levels of some critical
hardware/software components like the CPU. Later, Nash
et al. [20] proposed to estimate the energy footprint of a
desktop computer by using a multiple linear regression model
considering the CPU load, read/write accesses to the storage
unit, and network transmissions. To evaluate the presence of
malicious activities, the measured parameters are combined
with performance data counters available in the operating
system, and the results are compared with different thresholds.
Such approach was proven to be effective, but its main
drawback is the complexity to compute proper numerical
values for the needed thresholds. Liu et al. [18] proposed
the VirusMeter tool for Symbian smartphones that computes
the energy profile for the whole “clean” system. The user
is alerted by using a heuristic to compare the actual energy
consumption with a reference value. Lastly, Hoffman et al. [7]
performed comprehensive experiments with both artificial and
real-world malware using observation windows of different
lengths. They created energy footprints in a controlled setting
for the IEEE 802.11 and 3G hardware of a smartphone, and
the resulting power consumption was treated as a baseline for
detection. Even if such an approach is effective, the main
contribution of the work is about the noise level of tools
used for measurements: the additional power consumed by a
malware is often too small to be detectable with the resolution
of many measurement software.
Among the techniques using application-based methods, the
most notable work has been proposed by Kim et al. [21],
where the power consumption is monitored to detect malware
in Windows Mobile devices. Their proof-of-concept solution
is based on the energy footprints of the applications running
on the smartphone, which are compared against “clean” con-
sumption templates.
Concerning methods explicitly considering the behavior of
the user, Dixon et al. [22]–[24] showed that there is a strong
correlation between the battery drain of a mobile device and
the user’s location. This can be exploited to determine the
average power consumption for different locations and make
the detection of abnormalities more efficient. In fact, instead
of considering the required power only as a function of
time, location-specific energy profiles are used as additional
indicators.
Regarding attack-based approaches, Buennemeyer et al. [26]
investigated the energy signatures of some network threats
3
against mobile devices. In more details, the power consump-
tion of a device is correlated with IEEE 802.11 activities.
If an irregularity is discovered, it is compared with existing
signatures to perform the detection of the attack. Then, each
mobile device exchanges alerts with peers, thus implement-
ing a distributed network IDS. This work has been further
extended by modifying the rates at which the battery status
is polled, and by considering the activity of the Bluetooth
air interface to increase the performance in terms of correct
detections [27]. Moreover, Caviglione and Merlo [9] focused
on how antivirus and network attacks such as port scan and
ping floods impact over the battery depletion of different
smartphones. They state the need for “green security” mech-
anisms to effectively develop consumption-based malware
detection systems [28]. Curti et al. [25] studied the energy
footprints for benign applications like Skype or YouTube
and also for network attacks like Denial of Service. They
also provided a power consumption model for the hardware
involved in IEEE 802.11 communications allowing to distin-
guish a normal traffic pattern from a network threat. This work
has been further extended by Merlo et al. [10] by analyzing
the feasibility of porting the two aforementioned approaches
on Android devices with the aim of developing a malware
detection framework. Unfortunately, the proposed solutions
turned out to be unsuitable, mainly due to implementation
issues, which can be overcome by introducing the direct
observation of power consumption from the battery hardware
without the need to dwell deeply into the drivers.
Literature also indicates that future research directions
should consider hybrid approaches, i.e., the power consump-
tion should be enriched with additional information such as
the memory usage. Even if hybrid approaches are possible,
they are typically implemented in a standalone fashion [19]
or as a part of a larger network-based IDS (see, e.g., [26]).
Furthermore, the technology evolves very dynamically, thus
studies performed even few years ago could quickly become
obsolete as functionality and capabilities of modern devices
significantly outrun the old ones.
III. COVERT CHANNELS
In this section, we describe how a prototypical malware
exploiting a local covert channel to secretly leak sensitive
data has been developed, and how we have studied its main
characteristics.
A. Reference Scenario
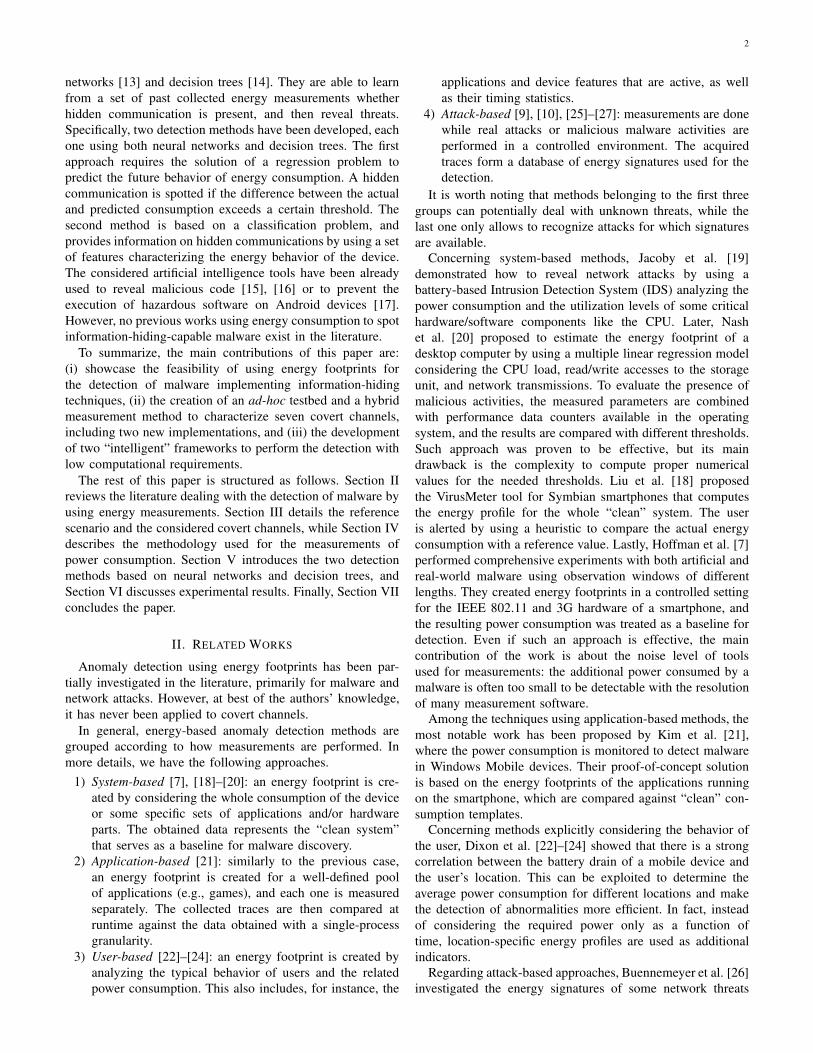
We consider the typical scenario depicted in Figure 1, where
a malware composed of two colluding applications exchanges
data through a local covert channel built within the device in
order to exfiltrate sensitive information [3], [4], [11]. In more
details, the process CCSender has access to the data but has
not the permission to use the network. Instead, the colluding
application CCReceiver has access to the network, hence it
is able to exfiltrate the received data to an external server
or a Command & Control (C&C) facility. Obviously, the
communications of the CCReceiver towards the C&C could
be detected, for instance, by inspecting the traffic produced
Fig. 1. Typical communication scenario of two colluding parts of a malware:CCSender and CCReceiver exchange data through a local covert channel.
by the device. Thus, it is common to use other information-
hiding methods to build a network covert channel within
the produced flow. For instance, some malware uses a TOR
client to reach the server anonymously, making classic traffic
analysis ineffective [29]. Consequently, analyzing an encrypted
flow of information produced by the CCReceiver does not
help to reveal the presence of a malware, and this is why
this paper focuses on the detection of the local covert channel
itself.
Moreover, we assume that the malware monitors the oper-
ations performed by the user in order to transmit data when
he/she is not active [30]. Indeed, waking up the covert channel
during user’s activity could degrade the performances of the
device and reveal the presence of the threat. To this aim, many
modern malware delay their activation in order to be invisible
or not rise attention. Thus, even if the triggering of the malware
may occur at any time, it is more likely to happen when
the user is not active. For example, the families of malware
DroidKungFu 1 and 2 include a time bomb mechanism that
triggers the malicious behavior after a predefined period of
time [31]. With such a protection, a malware would be running
statistically when the smartphone is idle. Therefore, we focus
on such low attention-raising hazards operating when the
device is idle since they are the preferred choice to perform
attacks and to avoid detection [3].
B. Implemented Covert Channels
For experimental purposes we implemented on the Android
platform seven local covert channels between the processes
CCSender and CCReceiver. Five of them have been
already proposed in the literature and they are listed as follows.
1) Type of Intent [11]: the secret receiver registers 256 types
of intent listeners and the secret sender encodes data by
choosing and sending an intent of the right type.
2) File Lock [32]: the secret sender communicates by lock-
ing a file. The secret receiver also tries to lock the same
file and, if it succeeds, a 0 is inferred. Otherwise, an
exception is raised, meaning that the secret sender has
locked the file before the secret receiver. In this case, a
1 is received.
3) System Load [11]: the secret sender sends a 1 by burden-
ing the CPU of the device. The secret receiver checks how
many clock ticks the sender has got since the previous
iteration. If the value is greater than a certain threshold,
a 1 is inferred, a 0 otherwise.
4) Volume Settings [32]: the secret data is encoded into the
ringtone volume level of the device. If the sender can use
4
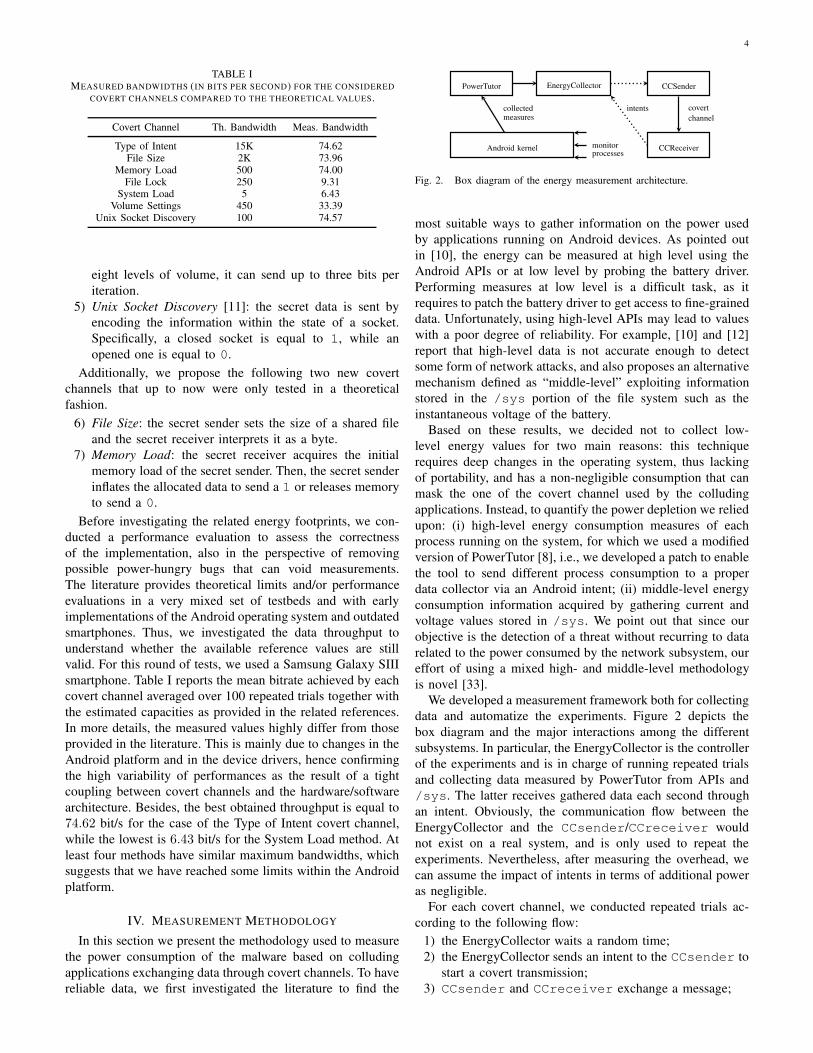
TABLE IMEASURED BANDWIDTHS (IN BITS PER SECOND) FOR THE CONSIDERED
COVERT CHANNELS COMPARED TO THE THEORETICAL VALUES.
Covert Channel Th. Bandwidth Meas. Bandwidth
Type of Intent 15K 74.62File Size 2K 73.96
Memory Load 500 74.00File Lock 250 9.31
System Load 5 6.43Volume Settings 450 33.39
Unix Socket Discovery 100 74.57
eight levels of volume, it can send up to three bits per
iteration.
5) Unix Socket Discovery [11]: the secret data is sent by
encoding the information within the state of a socket.
Specifically, a closed socket is equal to 1, while an
opened one is equal to 0.
Additionally, we propose the following two new covert
channels that up to now were only tested in a theoretical
fashion.
6) File Size: the secret sender sets the size of a shared file
and the secret receiver interprets it as a byte.
7) Memory Load: the secret receiver acquires the initial
memory load of the secret sender. Then, the secret sender
inflates the allocated data to send a 1 or releases memory
to send a 0.
Before investigating the related energy footprints, we con-
ducted a performance evaluation to assess the correctness
of the implementation, also in the perspective of removing
possible power-hungry bugs that can void measurements.
The literature provides theoretical limits and/or performance
evaluations in a very mixed set of testbeds and with early
implementations of the Android operating system and outdated
smartphones. Thus, we investigated the data throughput to
understand whether the available reference values are still
valid. For this round of tests, we used a Samsung Galaxy SIII
smartphone. Table I reports the mean bitrate achieved by each
covert channel averaged over 100 repeated trials together with
the estimated capacities as provided in the related references.
In more details, the measured values highly differ from those
provided in the literature. This is mainly due to changes in the
Android platform and in the device drivers, hence confirming
the high variability of performances as the result of a tight
coupling between covert channels and the hardware/software
architecture. Besides, the best obtained throughput is equal to
74.62 bit/s for the case of the Type of Intent covert channel,
while the lowest is 6.43 bit/s for the System Load method. At
least four methods have similar maximum bandwidths, which
suggests that we have reached some limits within the Android
platform.
IV. MEASUREMENT METHODOLOGY
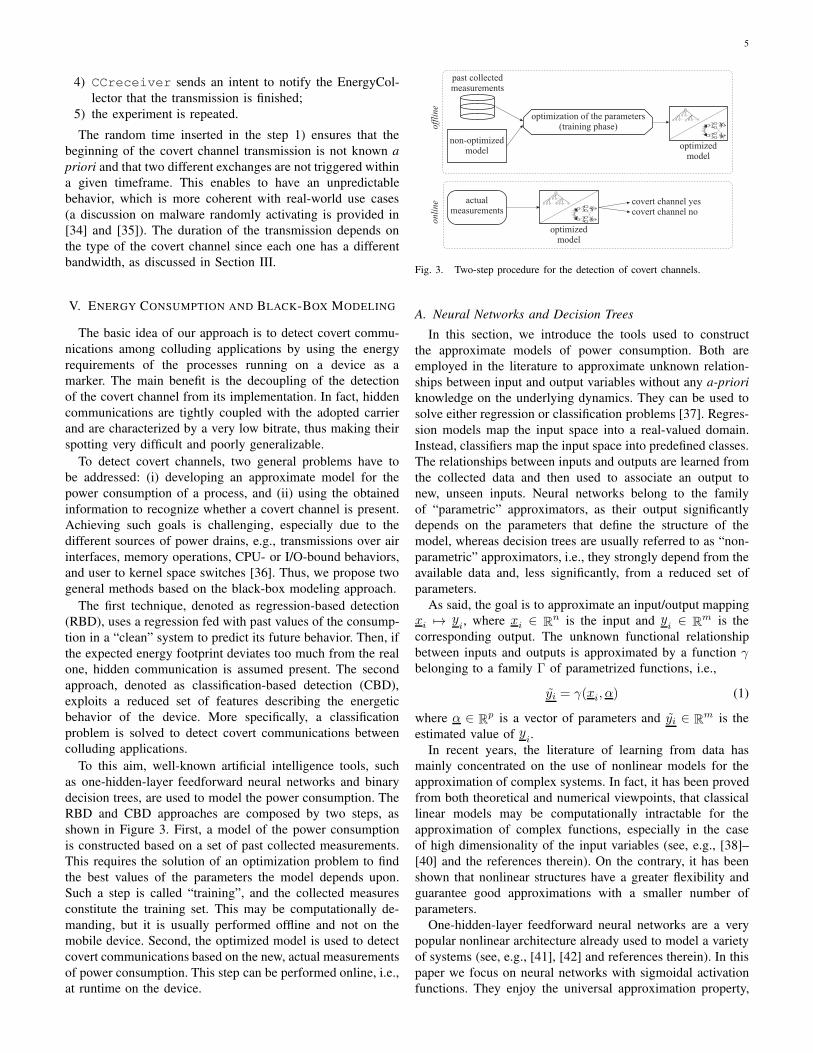
In this section we present the methodology used to measure
the power consumption of the malware based on colluding
applications exchanging data through covert channels. To have
reliable data, we first investigated the literature to find the
PowerTutor EnergyCollector CCSender
CCReceiverAndroid kernel
intents covert
channel
collectedmeasures
monitorprocesses
Fig. 2. Box diagram of the energy measurement architecture.
most suitable ways to gather information on the power used
by applications running on Android devices. As pointed out
in [10], the energy can be measured at high level using the
Android APIs or at low level by probing the battery driver.
Performing measures at low level is a difficult task, as it
requires to patch the battery driver to get access to fine-grained
data. Unfortunately, using high-level APIs may lead to values
with a poor degree of reliability. For example, [10] and [12]
report that high-level data is not accurate enough to detect
some form of network attacks, and also proposes an alternative
mechanism defined as “middle-level” exploiting information
stored in the /sys portion of the file system such as the
instantaneous voltage of the battery.
Based on these results, we decided not to collect low-
level energy values for two main reasons: this technique
requires deep changes in the operating system, thus lacking
of portability, and has a non-negligible consumption that can
mask the one of the covert channel used by the colluding
applications. Instead, to quantify the power depletion we relied
upon: (i) high-level energy consumption measures of each
process running on the system, for which we used a modified
version of PowerTutor [8], i.e., we developed a patch to enable
the tool to send different process consumption to a proper
data collector via an Android intent; (ii) middle-level energy
consumption information acquired by gathering current and
voltage values stored in /sys. We point out that since our
objective is the detection of a threat without recurring to data
related to the power consumed by the network subsystem, our
effort of using a mixed high- and middle-level methodology
is novel [33].
We developed a measurement framework both for collecting
data and automatize the experiments. Figure 2 depicts the
box diagram and the major interactions among the different
subsystems. In particular, the EnergyCollector is the controller
of the experiments and is in charge of running repeated trials
and collecting data measured by PowerTutor from APIs and
/sys. The latter receives gathered data each second through
an intent. Obviously, the communication flow between the
EnergyCollector and the CCsender/CCreceiver would
not exist on a real system, and is only used to repeat the
experiments. Nevertheless, after measuring the overhead, we
can assume the impact of intents in terms of additional power
as negligible.
For each covert channel, we conducted repeated trials ac-
cording to the following flow:
1) the EnergyCollector waits a random time;
2) the EnergyCollector sends an intent to the CCsender to
start a covert transmission;
3) CCsender and CCreceiver exchange a message;
5
4) CCreceiver sends an intent to notify the EnergyCol-
lector that the transmission is finished;
5) the experiment is repeated.
The random time inserted in the step 1) ensures that the
beginning of the covert channel transmission is not known a
priori and that two different exchanges are not triggered within
a given timeframe. This enables to have an unpredictable
behavior, which is more coherent with real-world use cases
(a discussion on malware randomly activating is provided in
[34] and [35]). The duration of the transmission depends on
the type of the covert channel since each one has a different
bandwidth, as discussed in Section III.
V. ENERGY CONSUMPTION AND BLACK-BOX MODELING
The basic idea of our approach is to detect covert commu-
nications among colluding applications by using the energy
requirements of the processes running on a device as a
marker. The main benefit is the decoupling of the detection
of the covert channel from its implementation. In fact, hidden
communications are tightly coupled with the adopted carrier
and are characterized by a very low bitrate, thus making their
spotting very difficult and poorly generalizable.
To detect covert channels, two general problems have to
be addressed: (i) developing an approximate model for the
power consumption of a process, and (ii) using the obtained
information to recognize whether a covert channel is present.
Achieving such goals is challenging, especially due to the
different sources of power drains, e.g., transmissions over air
interfaces, memory operations, CPU- or I/O-bound behaviors,
and user to kernel space switches [36]. Thus, we propose two
general methods based on the black-box modeling approach.
The first technique, denoted as regression-based detection
(RBD), uses a regression fed with past values of the consump-
tion in a “clean” system to predict its future behavior. Then, if
the expected energy footprint deviates too much from the real
one, hidden communication is assumed present. The second
approach, denoted as classification-based detection (CBD),
exploits a reduced set of features describing the energetic
behavior of the device. More specifically, a classification
problem is solved to detect covert communications between
colluding applications.
To this aim, well-known artificial intelligence tools, such
as one-hidden-layer feedforward neural networks and binary
decision trees, are used to model the power consumption. The
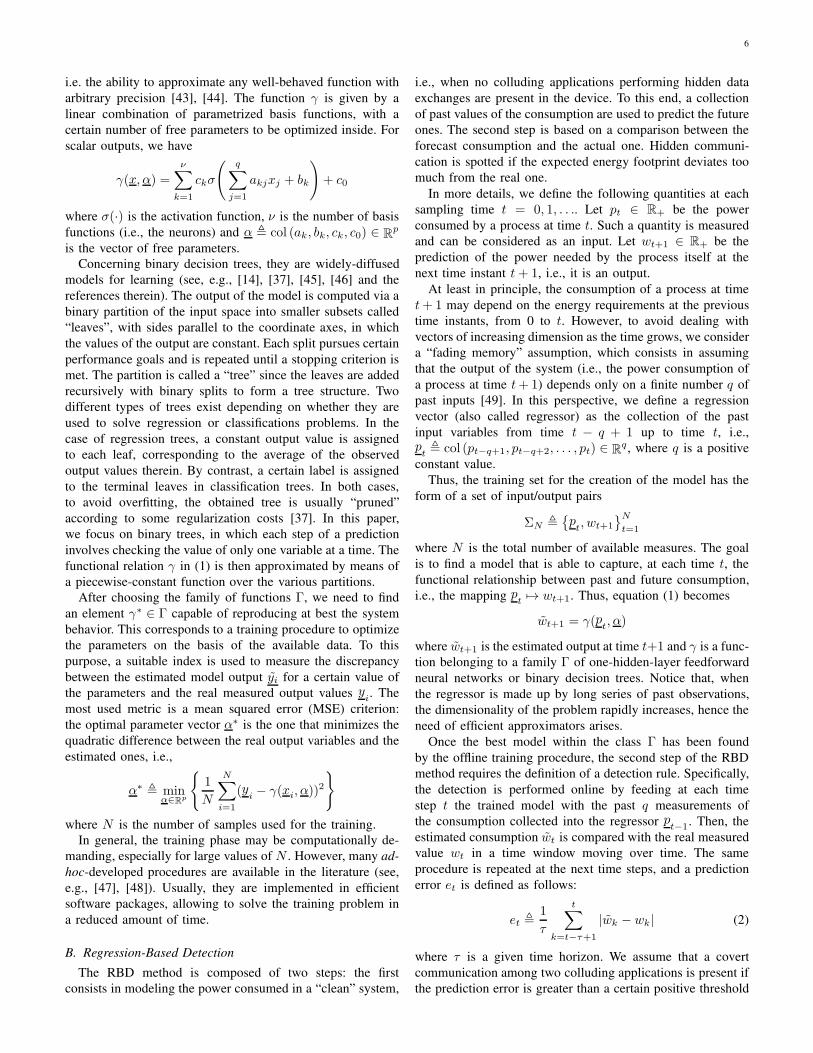
RBD and CBD approaches are composed by two steps, as
shown in Figure 3. First, a model of the power consumption
is constructed based on a set of past collected measurements.
This requires the solution of an optimization problem to find
the best values of the parameters the model depends upon.
Such a step is called “training”, and the collected measures
constitute the training set. This may be computationally de-
manding, but it is usually performed offline and not on the
mobile device. Second, the optimized model is used to detect
covert communications based on the new, actual measurements
of power consumption. This step can be performed online, i.e.,
at runtime on the device.
past collectedmeasurements
non-optimizedmodel
optimization of the parameters(training phase)
optimizedmodel
actualmeasurements
covert channel yescovert channel no
+
+
optimizedmodel
+
+
off
lin
eo
nli
ne
Fig. 3. Two-step procedure for the detection of covert channels.
A. Neural Networks and Decision Trees
In this section, we introduce the tools used to construct
the approximate models of power consumption. Both are
employed in the literature to approximate unknown relation-
ships between input and output variables without any a-priori
knowledge on the underlying dynamics. They can be used to
solve either regression or classification problems [37]. Regres-
sion models map the input space into a real-valued domain.
Instead, classifiers map the input space into predefined classes.
The relationships between inputs and outputs are learned from
the collected data and then used to associate an output to
new, unseen inputs. Neural networks belong to the family
of “parametric” approximators, as their output significantly
depends on the parameters that define the structure of the
model, whereas decision trees are usually referred to as “non-
parametric” approximators, i.e., they strongly depend from the
available data and, less significantly, from a reduced set of
parameters.
As said, the goal is to approximate an input/output mapping
xi 7→ yi, where xi ∈ R
n is the input and yi ∈ R
m is the
corresponding output. The unknown functional relationship
between inputs and outputs is approximated by a function γ
belonging to a family Γ of parametrized functions, i.e.,
yi = γ(xi, α) (1)
where α ∈ Rp is a vector of parameters and yi ∈ R
m is the
estimated value of yi.
In recent years, the literature of learning from data has
mainly concentrated on the use of nonlinear models for the
approximation of complex systems. In fact, it has been proved
from both theoretical and numerical viewpoints, that classical
linear models may be computationally intractable for the
approximation of complex functions, especially in the case
of high dimensionality of the input variables (see, e.g., [38]–
[40] and the references therein). On the contrary, it has been
shown that nonlinear structures have a greater flexibility and
guarantee good approximations with a smaller number of
parameters.
One-hidden-layer feedforward neural networks are a very
popular nonlinear architecture already used to model a variety
of systems (see, e.g., [41], [42] and references therein). In this
paper we focus on neural networks with sigmoidal activation
functions. They enjoy the universal approximation property,
6
i.e. the ability to approximate any well-behaved function with
arbitrary precision [43], [44]. The function γ is given by a
linear combination of parametrized basis functions, with a
certain number of free parameters to be optimized inside. For
scalar outputs, we have
γ(x, α) =
ν∑
k=1
ckσ
(
q∑
j=1
akjxj + bk
)
+ c0
where σ(·) is the activation function, ν is the number of basis
functions (i.e., the neurons) and α , col (ak, bk, ck, c0) ∈ Rp
is the vector of free parameters.
Concerning binary decision trees, they are widely-diffused
models for learning (see, e.g., [14], [37], [45], [46] and the
references therein). The output of the model is computed via a
binary partition of the input space into smaller subsets called
“leaves”, with sides parallel to the coordinate axes, in which
the values of the output are constant. Each split pursues certain
performance goals and is repeated until a stopping criterion is
met. The partition is called a “tree” since the leaves are added
recursively with binary splits to form a tree structure. Two
different types of trees exist depending on whether they are
used to solve regression or classifications problems. In the
case of regression trees, a constant output value is assigned
to each leaf, corresponding to the average of the observed
output values therein. By contrast, a certain label is assigned
to the terminal leaves in classification trees. In both cases,
to avoid overfitting, the obtained tree is usually “pruned”
according to some regularization costs [37]. In this paper,
we focus on binary trees, in which each step of a prediction
involves checking the value of only one variable at a time. The
functional relation γ in (1) is then approximated by means of
a piecewise-constant function over the various partitions.
After choosing the family of functions Γ, we need to find
an element γ∗ ∈ Γ capable of reproducing at best the system
behavior. This corresponds to a training procedure to optimize
the parameters on the basis of the available data. To this
purpose, a suitable index is used to measure the discrepancy
between the estimated model output yi for a certain value of
the parameters and the real measured output values yi. The
most used metric is a mean squared error (MSE) criterion:
the optimal parameter vector α∗ is the one that minimizes the
quadratic difference between the real output variables and the
estimated ones, i.e.,
α∗ , minα∈R
p
{
1
N
N∑
i=1
(yi − γ(xi, α))2
}
where N is the number of samples used for the training.
In general, the training phase may be computationally de-
manding, especially for large values of N . However, many ad-
hoc-developed procedures are available in the literature (see,
e.g., [47], [48]). Usually, they are implemented in efficient
software packages, allowing to solve the training problem in
a reduced amount of time.
B. Regression-Based Detection
The RBD method is composed of two steps: the first
consists in modeling the power consumed in a “clean” system,
i.e., when no colluding applications performing hidden data
exchanges are present in the device. To this end, a collection
of past values of the consumption are used to predict the future
ones. The second step is based on a comparison between the
forecast consumption and the actual one. Hidden communi-
cation is spotted if the expected energy footprint deviates too
much from the real one.
In more details, we define the following quantities at each
sampling time t = 0, 1, . . .. Let pt ∈ R+ be the power
consumed by a process at time t. Such a quantity is measured
and can be considered as an input. Let wt+1 ∈ R+ be the
prediction of the power needed by the process itself at the
next time instant t+ 1, i.e., it is an output.
At least in principle, the consumption of a process at time
t+ 1 may depend on the energy requirements at the previous
time instants, from 0 to t. However, to avoid dealing with
vectors of increasing dimension as the time grows, we consider
a “fading memory” assumption, which consists in assuming
that the output of the system (i.e., the power consumption of
a process at time t+1) depends only on a finite number q of
past inputs [49]. In this perspective, we define a regression
vector (also called regressor) as the collection of the past
input variables from time t − q + 1 up to time t, i.e.,pt , col (pt−q+1, pt−q+2, . . . , pt) ∈ R
q , where q is a positive
constant value.
Thus, the training set for the creation of the model has the
form of a set of input/output pairs
ΣN ,{
pt, wt+1
}N
t=1
where N is the total number of available measures. The goal
is to find a model that is able to capture, at each time t, the
functional relationship between past and future consumption,
i.e., the mapping pt 7→ wt+1. Thus, equation (1) becomes
wt+1 = γ(pt, α)
where wt+1 is the estimated output at time t+1 and γ is a func-
tion belonging to a family Γ of one-hidden-layer feedforward
neural networks or binary decision trees. Notice that, when
the regressor is made up by long series of past observations,
the dimensionality of the problem rapidly increases, hence the
need of efficient approximators arises.
Once the best model within the class Γ has been found
by the offline training procedure, the second step of the RBD
method requires the definition of a detection rule. Specifically,
the detection is performed online by feeding at each time
step t the trained model with the past q measurements of
the consumption collected into the regressor pt−1
. Then, the
estimated consumption wt is compared with the real measured
value wt in a time window moving over time. The same
procedure is repeated at the next time steps, and a prediction
error et is defined as follows:
et ,1
τ
t∑
k=t−τ+1
|wk − wk| (2)
where τ is a given time horizon. We assume that a covert
communication among two colluding applications is present if
the prediction error is greater than a certain positive threshold
7
ξ. Otherwise, it is considered absent. The rationale is that
the approximate model, if properly trained, is able to predict
the future behavior of the energy consumption of the “clean”
system with a good level of accuracy. Hence, severe deviations
reveals the presence of two processes covertly exchanging
data.
Clearly, the performance of the RBD depends on the quality
of the approximating model and on the parameters q, τ ,
and ξ, which have to be properly tuned. We will observe
their impact on the quality of detection in a real scenario
in Section VI. Notice that the same model γ can be used to
detect covert communications with all the seven covert channel
types described in Section III since it has been obtained using
measurements obtained in a “clean” system.
C. Classification-Based Detection
The CBD method consists in solving a classification prob-
lem starting from a set of measurements both in the presence
and in the absence of colluding applications. It requires
the definition of a set of “features” representing the power
consumption of the device in a concise, effective manner.
More specifically, we focus on three different features
characterizing the energetic behavior of a process at each time
t, collected into the vector xt ∈ R3: (i) the average power
consumption from time t − λ + 1 to time t, where λ is a
positive constant defining a window of past measurements,
(ii) the total variation of the power consumption from time
t−λ+1 to time t, and (iii) the instantaneous consumption at
time t. Thus, we focus on the following vector of features at
each time t:
ft, col
(
t∑
l=t−λ+1
pl,
t∑
l=t−λ+1
|pl|, pt
)
∈ R3 (3)
Each vector ft
refers to a single measurement and is
associated to a certain class k among two possible ones,
corresponding to the cases in which covert channels are used
to exchanging data between colluding applications (k = 1)
and no covert channels are established (k = 0).
The training set for the creation of the model takes on the
form of a set of N input/output pairs
ΣN ,
{
ft, gt
}N
t=1
where the scalar output gt is equal to k if the input vector ft
belongs to the class k.
The goal is to find a model able to recognize the class
containing a given input vector that is not among the N used
for the training. As in the case of the RBD method, we rely
upon models belonging to a certain family Γ of one-hidden-
layer feedforward neural networks and binary decision trees,
i.e., equation (1) becomes:
gj = γ(fj, α)
where gj is the class assigned to the input vector fj
by the
model. The output gj must be one of the two possible classes.
Clearly, the goal of the classification is to ensure that the
assignment of the model is correct, i.e., the difference between
TABLE IIPARAMETERS OF THE RBD AND CBD DETECTION METHODS.
Method Parameter Description
q Length of the regressorRBD τ Time window of the prediction error
ξ Threshold of the prediction error
CBD λ Time window for feature construction
gj and gj is as small as possible. To this end, as in the case
of the RBD, a suitable training phase is performed offline to
find the optimal values of the parameter vector α. Once the
best model within the family Γ has been found, at each time t
the detection whether a covert channel is present is performed
online by feeding the trained model with the vector ft
of the
current features and analyzing the value of the output gt.
Differently from the RBD method, where the same approx-
imate model is used to detect covert communications with
all the seven techniques introduced in Section III, the CBD
approach requires the training of a different model for each
covert channel.
We point out that the accuracy of the CBD depends on
the quality of the approximating model and on the parameter
λ used to construct the vector of features. Section VI will
discuss its impact on the quality of detection in a real scenario.
Notice that the CBD requires the tuning of only this parameter,
whereas the RBD relies upon three parameters. Table II sum-
marizes the main parameters of the two considered detection
methods and their meaning.
VI. NUMERICAL RESULTS
To evaluate the effectiveness of the proposed approach, we
conducted experimental trials using two different smartphones,
i.e., a Samsung Galaxy SIII and a LG Optimus 4X HD P880.
We tested the RBD and CBD methods using Matlab with the
Neural Networks and Statistics Toolboxes. All the experiments
were done on a computer with a 2.5 GHz Intel i7 CPU and 4
GB of RAM.
A dataset containing the consumption of all the software
components running on the smartphones was generated using
the methodology presented in Section IV. In more details,
the consumption was measured with a per-process granularity,
both in a “clean” set-up and when a local covert channel
among two processes is created. Preliminary investigations
showcased that the overall power consumption of the smart-
phone is well represented by the energy required by processes
with OS-wide dynamics. More specifically, the energy con-
sumption of the process System gave us enough condensed
information to capture the general trend. Indeed, the System
process is the core of all mechanisms required to access
the low-level drivers of Android. It is used for manipulating
notifications, display, audio, alarms, and telephony, just for
naming a few. Therefore, for testing our methods, we relied
upon the information provided solely by the process System.
As said, we focused on a scenario in which information-
hiding-capable malware increases its stealthiness by acting
when the device is idle, i.e., there is no user activity involved.
8
0 1 2 360
70
80
90
100
Type intFile sizeMem loadFile lockSys loadVol setUnix sockno cov. ch.
time (h)
battery drain (%)
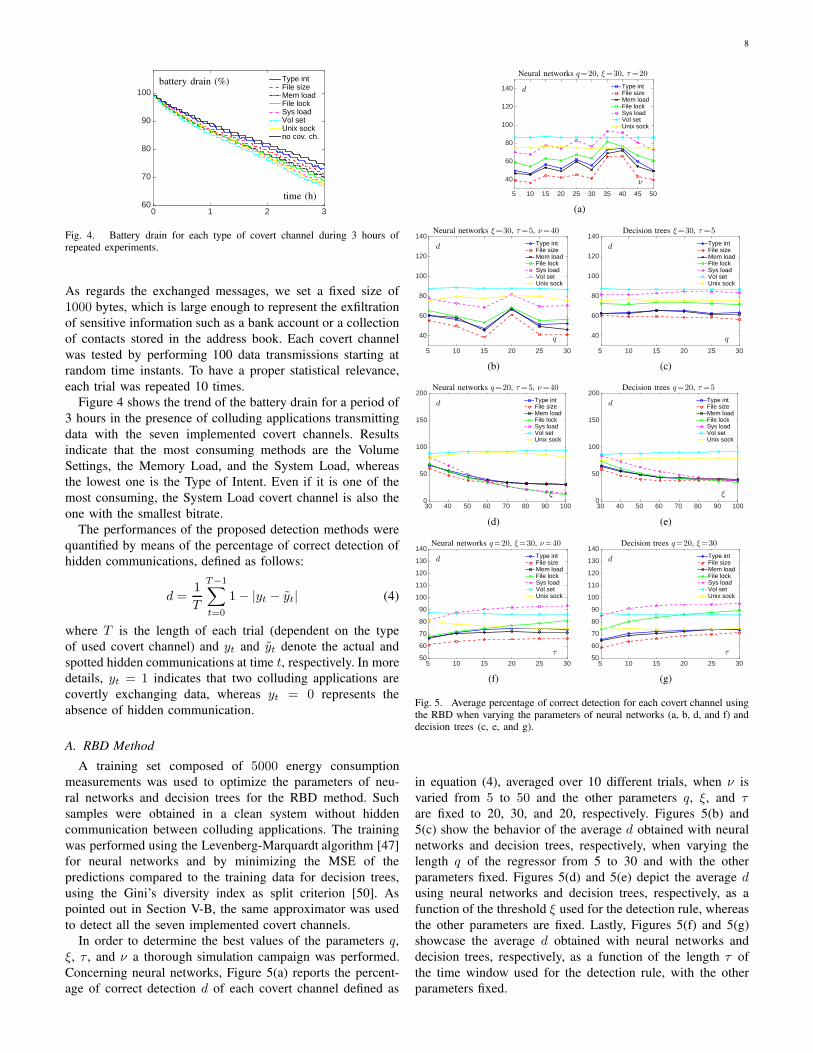
Fig. 4. Battery drain for each type of covert channel during 3 hours ofrepeated experiments.
As regards the exchanged messages, we set a fixed size of
1000 bytes, which is large enough to represent the exfiltration
of sensitive information such as a bank account or a collection
of contacts stored in the address book. Each covert channel
was tested by performing 100 data transmissions starting at
random time instants. To have a proper statistical relevance,
each trial was repeated 10 times.
Figure 4 shows the trend of the battery drain for a period of
3 hours in the presence of colluding applications transmitting
data with the seven implemented covert channels. Results
indicate that the most consuming methods are the Volume
Settings, the Memory Load, and the System Load, whereas
the lowest one is the Type of Intent. Even if it is one of the
most consuming, the System Load covert channel is also the
one with the smallest bitrate.
The performances of the proposed detection methods were
quantified by means of the percentage of correct detection of
hidden communications, defined as follows:
d =1
T
T−1∑
t=0
1− |yt − yt| (4)
where T is the length of each trial (dependent on the type
of used covert channel) and yt and yt denote the actual and
spotted hidden communications at time t, respectively. In more
details, yt = 1 indicates that two colluding applications are
covertly exchanging data, whereas yt = 0 represents the
absence of hidden communication.
A. RBD Method
A training set composed of 5000 energy consumption
measurements was used to optimize the parameters of neu-
ral networks and decision trees for the RBD method. Such
samples were obtained in a clean system without hidden
communication between colluding applications. The training
was performed using the Levenberg-Marquardt algorithm [47]
for neural networks and by minimizing the MSE of the
predictions compared to the training data for decision trees,
using the Gini’s diversity index as split criterion [50]. As
pointed out in Section V-B, the same approximator was used
to detect all the seven implemented covert channels.
In order to determine the best values of the parameters q,
ξ, τ , and ν a thorough simulation campaign was performed.
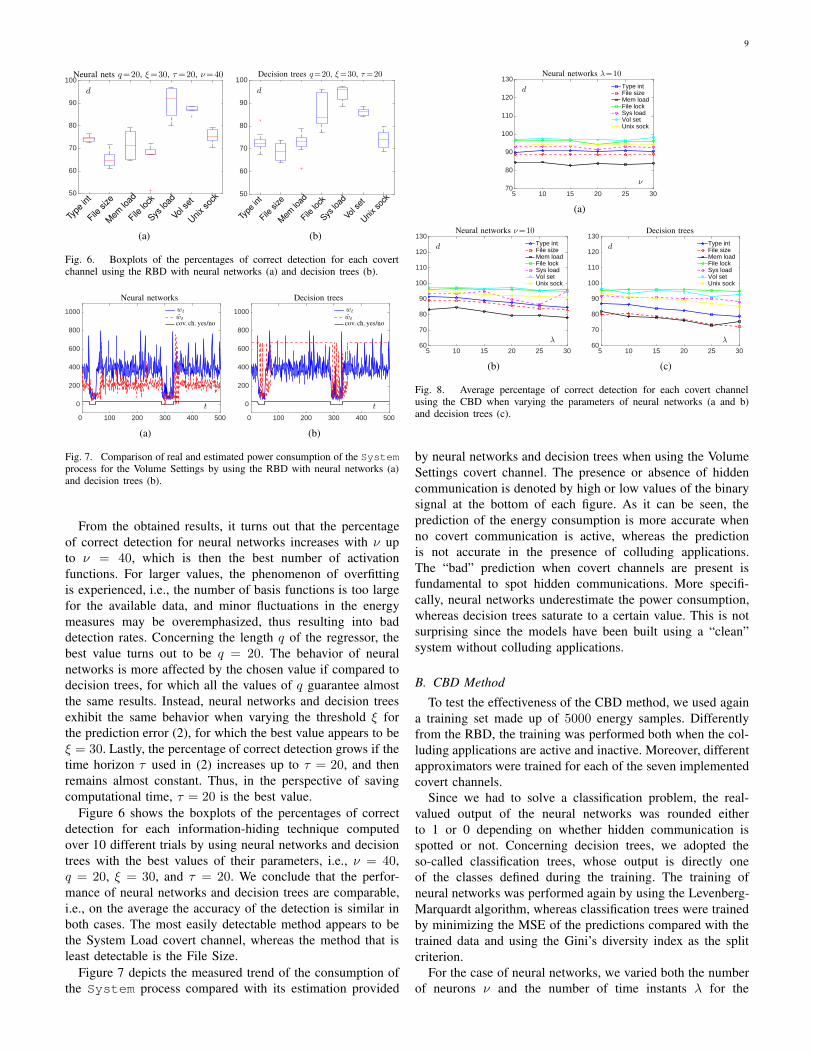
Concerning neural networks, Figure 5(a) reports the percent-
age of correct detection d of each covert channel defined as
5 10 15 20 25 30 35 40 45 50
40
60
80
100
120
140 Type intFile sizeMem loadFile lockSys loadVol setUnix sock
Neural networks q=20, ξ=30, τ=20
d
ν
(a)
5 10 15 20 25 30
40
60
80
100
120
140Type intFile sizeMem loadFile lockSys loadVol setUnix sock
Neural networks ξ=30, τ=5, ν=40
d
q
(b)
5 10 15 20 25 30
40
60
80
100
120
140Type intFile sizeMem loadFile lockSys loadVol setUnix sock
Decision trees ξ=30, τ=5
d
q
(c)
30 40 50 60 70 80 90 1000
50
100
150
200Type intFile sizeMem loadFile lockSys loadVol setUnix sock
Neural networks q=20, τ=5, ν=40
d
ξ
(d)
30 40 50 60 70 80 90 1000
50
100
150
200Type intFile sizeMem loadFile lockSys loadVol setUnix sock
Decision trees q=20, τ=5
d
ξ
(e)
5 10 15 20 25 3050
60
70
80
90
100
110
120
130
140Type intFile sizeMem loadFile lockSys loadVol setUnix sock
Neural networks q=20, ξ=30, ν=40
d
τ
(f)
5 10 15 20 25 3050
60
70
80
90
100
110
120
130
140Type intFile sizeMem loadFile lockSys loadVol setUnix sock
Decision trees q=20, ξ=30
d
τ
(g)
Fig. 5. Average percentage of correct detection for each covert channel usingthe RBD when varying the parameters of neural networks (a, b, d, and f) anddecision trees (c, e, and g).
in equation (4), averaged over 10 different trials, when ν is
varied from 5 to 50 and the other parameters q, ξ, and τ
are fixed to 20, 30, and 20, respectively. Figures 5(b) and
5(c) show the behavior of the average d obtained with neural
networks and decision trees, respectively, when varying the
length q of the regressor from 5 to 30 and with the other
parameters fixed. Figures 5(d) and 5(e) depict the average d
using neural networks and decision trees, respectively, as a
function of the threshold ξ used for the detection rule, whereas
the other parameters are fixed. Lastly, Figures 5(f) and 5(g)
showcase the average d obtained with neural networks and
decision trees, respectively, as a function of the length τ of
the time window used for the detection rule, with the other
parameters fixed.
9
50
60
70
80
90
100Neural nets q=20, ξ=30, τ=20, ν=40
d
Type
int
Filesize
Mem
load
Filelock
Sysload
Vol s
et
Unixso
ck
(a)
50
60
70
80
90
100Decision trees q=20, ξ=30, τ=20
d
Type
int
Filesize
Mem
load
Filelock
Sysload
Vol s
et
Unixso
ck
(b)
Fig. 6. Boxplots of the percentages of correct detection for each covertchannel using the RBD with neural networks (a) and decision trees (b).
0 100 200 300 400 500
0
200
400
600
800
1000
Neural networks
t
wt
wtcov. ch. yes/no
(a)
0 100 200 300 400 500
0
200
400
600
800
1000
Decision trees
t
wt
wtcov. ch. yes/no
(b)
Fig. 7. Comparison of real and estimated power consumption of the Systemprocess for the Volume Settings by using the RBD with neural networks (a)and decision trees (b).
From the obtained results, it turns out that the percentage
of correct detection for neural networks increases with ν up
to ν = 40, which is then the best number of activation
functions. For larger values, the phenomenon of overfitting
is experienced, i.e., the number of basis functions is too large
for the available data, and minor fluctuations in the energy
measures may be overemphasized, thus resulting into bad
detection rates. Concerning the length q of the regressor, the
best value turns out to be q = 20. The behavior of neural
networks is more affected by the chosen value if compared to
decision trees, for which all the values of q guarantee almost
the same results. Instead, neural networks and decision trees
exhibit the same behavior when varying the threshold ξ for
the prediction error (2), for which the best value appears to be
ξ = 30. Lastly, the percentage of correct detection grows if the
time horizon τ used in (2) increases up to τ = 20, and then
remains almost constant. Thus, in the perspective of saving
computational time, τ = 20 is the best value.
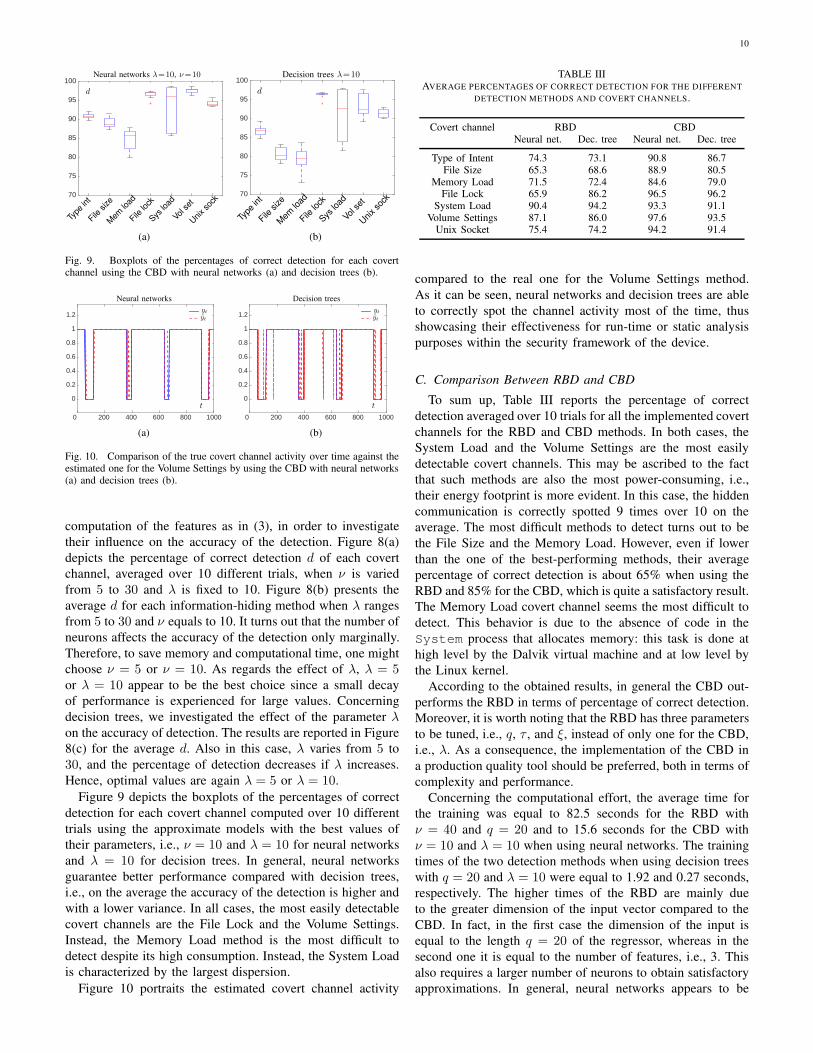
Figure 6 shows the boxplots of the percentages of correct
detection for each information-hiding technique computed
over 10 different trials by using neural networks and decision
trees with the best values of their parameters, i.e., ν = 40,
q = 20, ξ = 30, and τ = 20. We conclude that the perfor-
mance of neural networks and decision trees are comparable,
i.e., on the average the accuracy of the detection is similar in
both cases. The most easily detectable method appears to be
the System Load covert channel, whereas the method that is
least detectable is the File Size.
Figure 7 depicts the measured trend of the consumption of
the System process compared with its estimation provided
5 10 15 20 25 3070
80
90
100
110
120
130Type intFile sizeMem loadFile lockSys loadVol setUnix sock
Neural networks λ=10
d
ν
(a)
5 10 15 20 25 3060
70
80
90
100
110
120
130Type intFile sizeMem loadFile lockSys loadVol setUnix sock
Neural networks ν=10
d
λ
(b)
5 10 15 20 25 3060
70
80
90
100
110
120
130Type intFile sizeMem loadFile lockSys loadVol setUnix sock
Decision trees
d
λ
(c)
Fig. 8. Average percentage of correct detection for each covert channelusing the CBD when varying the parameters of neural networks (a and b)and decision trees (c).
by neural networks and decision trees when using the Volume
Settings covert channel. The presence or absence of hidden
communication is denoted by high or low values of the binary
signal at the bottom of each figure. As it can be seen, the
prediction of the energy consumption is more accurate when
no covert communication is active, whereas the prediction
is not accurate in the presence of colluding applications.
The “bad” prediction when covert channels are present is
fundamental to spot hidden communications. More specifi-
cally, neural networks underestimate the power consumption,
whereas decision trees saturate to a certain value. This is not
surprising since the models have been built using a “clean”
system without colluding applications.
B. CBD Method
To test the effectiveness of the CBD method, we used again
a training set made up of 5000 energy samples. Differently
from the RBD, the training was performed both when the col-
luding applications are active and inactive. Moreover, different
approximators were trained for each of the seven implemented
covert channels.
Since we had to solve a classification problem, the real-
valued output of the neural networks was rounded either
to 1 or 0 depending on whether hidden communication is
spotted or not. Concerning decision trees, we adopted the
so-called classification trees, whose output is directly one
of the classes defined during the training. The training of
neural networks was performed again by using the Levenberg-
Marquardt algorithm, whereas classification trees were trained
by minimizing the MSE of the predictions compared with the
trained data and using the Gini’s diversity index as the split
criterion.
For the case of neural networks, we varied both the number
of neurons ν and the number of time instants λ for the
10
70
75
80
85
90
95
100Neural networks λ=10, ν=10
d
Type
int
Filesize
Mem
load
Filelock
Sysload
Vol s
et
Unixso
ck
(a)
70
75
80
85
90
95
100Decision trees λ=10
d
Type
int
Filesize
Mem
load
Filelock
Sysload
Vol s
et
Unixso
ck
(b)
Fig. 9. Boxplots of the percentages of correct detection for each covertchannel using the CBD with neural networks (a) and decision trees (b).
0 200 400 600 800 1000
0
0.2
0.4
0.6
0.8
1
1.2
Neural networks
t
ytyt
(a)
0 200 400 600 800 1000
0
0.2
0.4
0.6
0.8
1
1.2
Decision trees
t
ytyt
(b)
Fig. 10. Comparison of the true covert channel activity over time against theestimated one for the Volume Settings by using the CBD with neural networks(a) and decision trees (b).
computation of the features as in (3), in order to investigate
their influence on the accuracy of the detection. Figure 8(a)
depicts the percentage of correct detection d of each covert
channel, averaged over 10 different trials, when ν is varied
from 5 to 30 and λ is fixed to 10. Figure 8(b) presents the
average d for each information-hiding method when λ ranges
from 5 to 30 and ν equals to 10. It turns out that the number of
neurons affects the accuracy of the detection only marginally.
Therefore, to save memory and computational time, one might
choose ν = 5 or ν = 10. As regards the effect of λ, λ = 5or λ = 10 appear to be the best choice since a small decay
of performance is experienced for large values. Concerning
decision trees, we investigated the effect of the parameter λ
on the accuracy of detection. The results are reported in Figure
8(c) for the average d. Also in this case, λ varies from 5 to
30, and the percentage of detection decreases if λ increases.
Hence, optimal values are again λ = 5 or λ = 10.
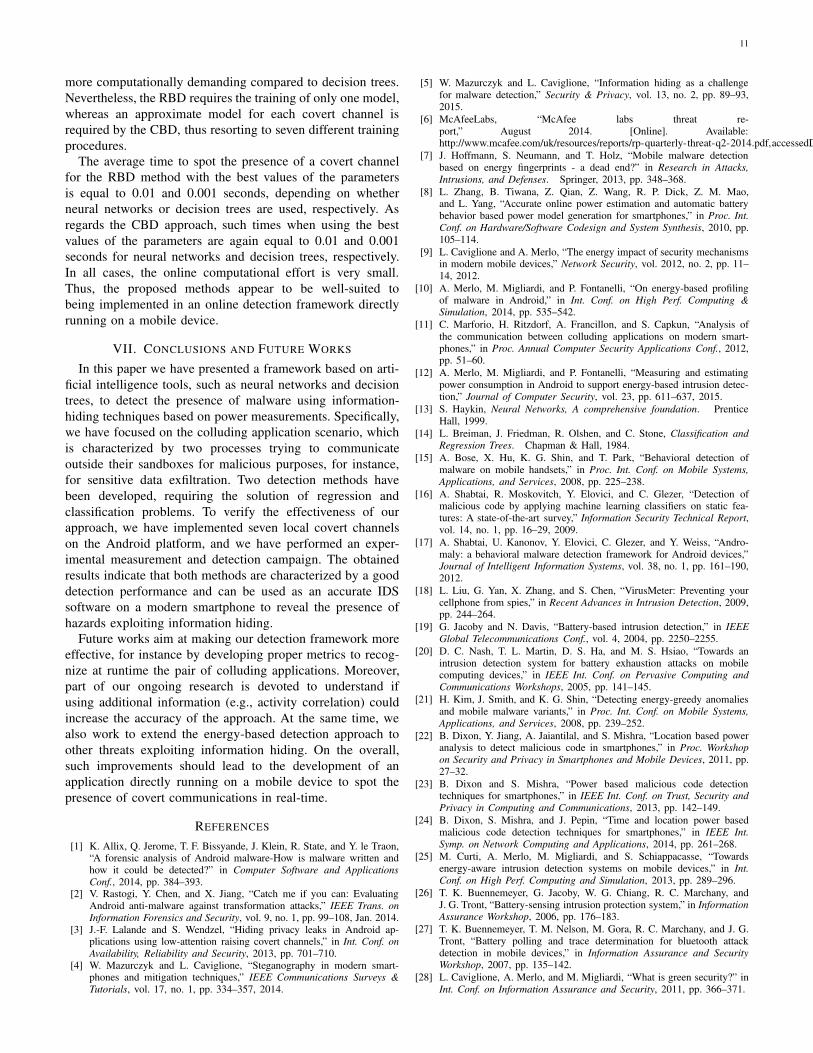
Figure 9 depicts the boxplots of the percentages of correct
detection for each covert channel computed over 10 different
trials using the approximate models with the best values of
their parameters, i.e., ν = 10 and λ = 10 for neural networks
and λ = 10 for decision trees. In general, neural networks
guarantee better performance compared with decision trees,
i.e., on the average the accuracy of the detection is higher and
with a lower variance. In all cases, the most easily detectable
covert channels are the File Lock and the Volume Settings.
Instead, the Memory Load method is the most difficult to
detect despite its high consumption. Instead, the System Load
is characterized by the largest dispersion.
Figure 10 portraits the estimated covert channel activity
TABLE IIIAVERAGE PERCENTAGES OF CORRECT DETECTION FOR THE DIFFERENT
DETECTION METHODS AND COVERT CHANNELS.
Covert channel RBD CBDNeural net. Dec. tree Neural net. Dec. tree
Type of Intent 74.3 73.1 90.8 86.7File Size 65.3 68.6 88.9 80.5
Memory Load 71.5 72.4 84.6 79.0File Lock 65.9 86.2 96.5 96.2
System Load 90.4 94.2 93.3 91.1Volume Settings 87.1 86.0 97.6 93.5
Unix Socket 75.4 74.2 94.2 91.4
compared to the real one for the Volume Settings method.
As it can be seen, neural networks and decision trees are able
to correctly spot the channel activity most of the time, thus
showcasing their effectiveness for run-time or static analysis
purposes within the security framework of the device.
C. Comparison Between RBD and CBD
To sum up, Table III reports the percentage of correct
detection averaged over 10 trials for all the implemented covert
channels for the RBD and CBD methods. In both cases, the
System Load and the Volume Settings are the most easily
detectable covert channels. This may be ascribed to the fact
that such methods are also the most power-consuming, i.e.,
their energy footprint is more evident. In this case, the hidden
communication is correctly spotted 9 times over 10 on the
average. The most difficult methods to detect turns out to be
the File Size and the Memory Load. However, even if lower
than the one of the best-performing methods, their average
percentage of correct detection is about 65% when using the
RBD and 85% for the CBD, which is quite a satisfactory result.
The Memory Load covert channel seems the most difficult to
detect. This behavior is due to the absence of code in the
System process that allocates memory: this task is done at
high level by the Dalvik virtual machine and at low level by
the Linux kernel.
According to the obtained results, in general the CBD out-
performs the RBD in terms of percentage of correct detection.
Moreover, it is worth noting that the RBD has three parameters
to be tuned, i.e., q, τ , and ξ, instead of only one for the CBD,
i.e., λ. As a consequence, the implementation of the CBD in
a production quality tool should be preferred, both in terms of
complexity and performance.
Concerning the computational effort, the average time for
the training was equal to 82.5 seconds for the RBD with
ν = 40 and q = 20 and to 15.6 seconds for the CBD with
ν = 10 and λ = 10 when using neural networks. The training
times of the two detection methods when using decision trees
with q = 20 and λ = 10 were equal to 1.92 and 0.27 seconds,
respectively. The higher times of the RBD are mainly due
to the greater dimension of the input vector compared to the
CBD. In fact, in the first case the dimension of the input is
equal to the length q = 20 of the regressor, whereas in the
second one it is equal to the number of features, i.e., 3. This
also requires a larger number of neurons to obtain satisfactory
approximations. In general, neural networks appears to be
11
more computationally demanding compared to decision trees.
Nevertheless, the RBD requires the training of only one model,
whereas an approximate model for each covert channel is
required by the CBD, thus resorting to seven different training
procedures.
The average time to spot the presence of a covert channel
for the RBD method with the best values of the parameters
is equal to 0.01 and 0.001 seconds, depending on whether
neural networks or decision trees are used, respectively. As
regards the CBD approach, such times when using the best
values of the parameters are again equal to 0.01 and 0.001
seconds for neural networks and decision trees, respectively.
In all cases, the online computational effort is very small.
Thus, the proposed methods appear to be well-suited to
being implemented in an online detection framework directly
running on a mobile device.
VII. CONCLUSIONS AND FUTURE WORKS
In this paper we have presented a framework based on arti-
ficial intelligence tools, such as neural networks and decision
trees, to detect the presence of malware using information-
hiding techniques based on power measurements. Specifically,
we have focused on the colluding application scenario, which
is characterized by two processes trying to communicate
outside their sandboxes for malicious purposes, for instance,
for sensitive data exfiltration. Two detection methods have
been developed, requiring the solution of regression and
classification problems. To verify the effectiveness of our
approach, we have implemented seven local covert channels
on the Android platform, and we have performed an exper-
imental measurement and detection campaign. The obtained
results indicate that both methods are characterized by a good
detection performance and can be used as an accurate IDS
software on a modern smartphone to reveal the presence of
hazards exploiting information hiding.
Future works aim at making our detection framework more
effective, for instance by developing proper metrics to recog-
nize at runtime the pair of colluding applications. Moreover,
part of our ongoing research is devoted to understand if
using additional information (e.g., activity correlation) could
increase the accuracy of the approach. At the same time, we
also work to extend the energy-based detection approach to
other threats exploiting information hiding. On the overall,
such improvements should lead to the development of an
application directly running on a mobile device to spot the
presence of covert communications in real-time.
REFERENCES
[1] K. Allix, Q. Jerome, T. F. Bissyande, J. Klein, R. State, and Y. le Traon,“A forensic analysis of Android malware-How is malware written andhow it could be detected?” in Computer Software and Applications
Conf., 2014, pp. 384–393.[2] V. Rastogi, Y. Chen, and X. Jiang, “Catch me if you can: Evaluating
Android anti-malware against transformation attacks,” IEEE Trans. on
Information Forensics and Security, vol. 9, no. 1, pp. 99–108, Jan. 2014.[3] J.-F. Lalande and S. Wendzel, “Hiding privacy leaks in Android ap-
plications using low-attention raising covert channels,” in Int. Conf. on
Availability, Reliability and Security, 2013, pp. 701–710.[4] W. Mazurczyk and L. Caviglione, “Steganography in modern smart-
phones and mitigation techniques,” IEEE Communications Surveys &
Tutorials, vol. 17, no. 1, pp. 334–357, 2014.
[5] W. Mazurczyk and L. Caviglione, “Information hiding as a challengefor malware detection,” Security & Privacy, vol. 13, no. 2, pp. 89–93,2015.
[6] McAfeeLabs, “McAfee labs threat re-port,” August 2014. [Online]. Available:http://www.mcafee.com/uk/resources/reports/rp-quarterly-threat-q2-2014.pdf,accessedDec
[7] J. Hoffmann, S. Neumann, and T. Holz, “Mobile malware detectionbased on energy fingerprints - a dead end?” in Research in Attacks,
Intrusions, and Defenses. Springer, 2013, pp. 348–368.
[8] L. Zhang, B. Tiwana, Z. Qian, Z. Wang, R. P. Dick, Z. M. Mao,and L. Yang, “Accurate online power estimation and automatic batterybehavior based power model generation for smartphones,” in Proc. Int.
Conf. on Hardware/Software Codesign and System Synthesis, 2010, pp.105–114.
[9] L. Caviglione and A. Merlo, “The energy impact of security mechanismsin modern mobile devices,” Network Security, vol. 2012, no. 2, pp. 11–14, 2012.
[10] A. Merlo, M. Migliardi, and P. Fontanelli, “On energy-based profilingof malware in Android,” in Int. Conf. on High Perf. Computing &Simulation, 2014, pp. 535–542.
[11] C. Marforio, H. Ritzdorf, A. Francillon, and S. Capkun, “Analysis ofthe communication between colluding applications on modern smart-phones,” in Proc. Annual Computer Security Applications Conf., 2012,pp. 51–60.
[12] A. Merlo, M. Migliardi, and P. Fontanelli, “Measuring and estimatingpower consumption in Android to support energy-based intrusion detec-tion,” Journal of Computer Security, vol. 23, pp. 611–637, 2015.
[13] S. Haykin, Neural Networks, A comprehensive foundation. PrenticeHall, 1999.
[14] L. Breiman, J. Friedman, R. Olshen, and C. Stone, Classification andRegression Trees. Chapman & Hall, 1984.
[15] A. Bose, X. Hu, K. G. Shin, and T. Park, “Behavioral detection ofmalware on mobile handsets,” in Proc. Int. Conf. on Mobile Systems,
Applications, and Services, 2008, pp. 225–238.
[16] A. Shabtai, R. Moskovitch, Y. Elovici, and C. Glezer, “Detection ofmalicious code by applying machine learning classifiers on static fea-tures: A state-of-the-art survey,” Information Security Technical Report,vol. 14, no. 1, pp. 16–29, 2009.
[17] A. Shabtai, U. Kanonov, Y. Elovici, C. Glezer, and Y. Weiss, “Andro-maly: a behavioral malware detection framework for Android devices,”Journal of Intelligent Information Systems, vol. 38, no. 1, pp. 161–190,2012.
[18] L. Liu, G. Yan, X. Zhang, and S. Chen, “VirusMeter: Preventing yourcellphone from spies,” in Recent Advances in Intrusion Detection, 2009,pp. 244–264.
[19] G. Jacoby and N. Davis, “Battery-based intrusion detection,” in IEEE
Global Telecommunications Conf., vol. 4, 2004, pp. 2250–2255.
[20] D. C. Nash, T. L. Martin, D. S. Ha, and M. S. Hsiao, “Towards anintrusion detection system for battery exhaustion attacks on mobilecomputing devices,” in IEEE Int. Conf. on Pervasive Computing and
Communications Workshops, 2005, pp. 141–145.
[21] H. Kim, J. Smith, and K. G. Shin, “Detecting energy-greedy anomaliesand mobile malware variants,” in Proc. Int. Conf. on Mobile Systems,
Applications, and Services, 2008, pp. 239–252.
[22] B. Dixon, Y. Jiang, A. Jaiantilal, and S. Mishra, “Location based poweranalysis to detect malicious code in smartphones,” in Proc. Workshop
on Security and Privacy in Smartphones and Mobile Devices, 2011, pp.27–32.
[23] B. Dixon and S. Mishra, “Power based malicious code detectiontechniques for smartphones,” in IEEE Int. Conf. on Trust, Security and
Privacy in Computing and Communications, 2013, pp. 142–149.
[24] B. Dixon, S. Mishra, and J. Pepin, “Time and location power basedmalicious code detection techniques for smartphones,” in IEEE Int.
Symp. on Network Computing and Applications, 2014, pp. 261–268.
[25] M. Curti, A. Merlo, M. Migliardi, and S. Schiappacasse, “Towardsenergy-aware intrusion detection systems on mobile devices,” in Int.
Conf. on High Perf. Computing and Simulation, 2013, pp. 289–296.
[26] T. K. Buennemeyer, G. Jacoby, W. G. Chiang, R. C. Marchany, andJ. G. Tront, “Battery-sensing intrusion protection system,” in InformationAssurance Workshop, 2006, pp. 176–183.
[27] T. K. Buennemeyer, T. M. Nelson, M. Gora, R. C. Marchany, and J. G.Tront, “Battery polling and trace determination for bluetooth attackdetection in mobile devices,” in Information Assurance and SecurityWorkshop, 2007, pp. 135–142.
[28] L. Caviglione, A. Merlo, and M. Migliardi, “What is green security?” inInt. Conf. on Information Assurance and Security, 2011, pp. 366–371.
12
[29] F.-E. Kioupakis and E. Serrelis, “Preparing for malware that uses covertcommunication channels: The case of Tor-based Android malware,” inInt. Conf. Information Security and Digital Forensics, 2014, pp. 85–96.
[30] P. Faruki, V. Ganmoor, V. Laxmi, M. S. Gaur, and A. Bharmal,“AndroSimilar: robust statistical feature signature for Android malwaredetection,” in Proc. Int. Conf. on Security of Information and Networks,2013, pp. 152–159.
[31] R. Andriatsimandefitra and V. V. T. Tong, “Detection and identificationof Android malware based on information flow monitoring,” in Int. Conf.
on Cyber Security and Cloud Computing, 2015, pp. 1–4.[32] R. Schlegel, K. Zhang, X. Zhou, M. Intwala, A. Kapadia, and X. Wang,
“Soundcomber: A stealthy and context-aware sound trojan for smart-phones,” in NDSS, vol. 11, 2011, pp. 17–33.
[33] A. Merlo, M. Migliardi, and L. Caviglione, “A survey on energy-awaresecurity mechanisms,” Pervasive and Mobile Computing, vol. 24, pp.77–90, 2015.
[34] A. Armando, A. Merlo, M. Migliardi, and L. Verderame, “Breaking andfixing the Android launching flow,” Computers and Security, vol. 39,pp. 104–115, 2013.
[35] A. Armando, A. Merlo, and L. Verderame, “An empirical evaluation ofthe Android security framework,” in Security and Privacy Protection in
Information Processing Systems, ser. IFIP Advances in Information andCommunication Technology, L. Janczewski, H. Wolfe, and S. Shenoi,Eds. Springer Berlin Heidelberg, 2013, vol. 405, pp. 176–189.
[36] S. Lee, W. Jung, Y. Chon, and H. Cha, “EnTrack: a system facility foranalyzing energy consumption of Android system services,” in Proc. Int.
Joint Conf. on Pervasive and Ubiquitous Computing, 2015, pp. 191–202.[37] T. Hastie, R. Tibshirani, and J. Friedman, The Elements of Statistical
Learning (2nd Ed.). New York: Springer, 2009.[38] R. Zoppoli, T. Parisini, and M. Sanguineti, “Approximating networks
and extended Ritz method for the solution of functional optimizationproblems,” J. of Optimization Theory and Applications, vol. 112, pp.403–439, 2002.
[39] M. Gaggero, G. Gnecco, and M. Sanguineti, “Dynamic programmingand value-function approximation in sequential decision problems: erroranalysis and numerical results,” Journal of Optimization Theory andApplications, vol. 156, no. 2, pp. 380–416, 2013.
[40] M. Gaggero, G. Gnecco, and M. Sanguineti, “Approximate dynamicprogramming for stochastic N-stage optimization with application tooptimal consumption under uncertainty,” Computational Optimizationand Applications, vol. 58, no. 1, pp. 31–85, 2014.
[41] L. Caviglione, “Enabling cooperation of consumer devices through peer-to-peer overlays,” IEEE Trans. Consumer Electronics, vol. 55, no. 2, pp.414–421, 2009.
[42] A. Alessandri, C. Cervellera, and M. Gaggero, “Nonlinear predictivecontrol of container flows in maritime intermodal terminals,” IEEE
Trans. Contr. Syst. Technol., vol. 21, no. 4, pp. 1423–1431, 2013.[43] K. Hornik, M. Stinchombe, and H. White, “Multilayer feedforward
networks are universal approximators,” Neural Networks, vol. 2, pp.359–366, 1989.
[44] A. Barron, “Universal approximation bounds for superpositions of asigmoidal function,” IEEE Trans. Inf. Theory, vol. 39, no. 3, pp. 930–945, 1993.
[45] R. A. Berk, Statistical Learning from a Regression Perspective. NewYork: Springer-Verlag, 2008.
[46] C. Cervellera, M. Gaggero, and D. Maccio, “An analysis based on F-discrepancy for sampling in regression tree learning,” in Proc. Int. JointConf. on Neural Networks, 2014, pp. 1115–1121.
[47] D. W. Marquardt, “An algorithm for least-squares estimation of nonlinearparameters,” Journal of the Society for Industrial & Applied Mathemat-
ics, vol. 11, no. 2, pp. 431–441, 1963.[48] P. Werbos, The Roots of Backpropagation: From Ordered Derivatives
to Neural Networks and Political Forecasting. New York, NY, USA:Wiley-Interscience, 1994.
[49] A. Sen and M. Srivastava, Regression Analysis - Theory, Methods, andApplications. Springer-Verlag, 2011.
[50] T. Cover and T. Joy, Elements of Information Theory. Wiley, 1991.
Luca Caviglione received the Ph.D. degree in elec-tronics and computer engineering from the Univer-sity of Genoa, Genoa, Italy. He has been involved inresearch projects funded by ESA, EU, and MIUR.He is currently a Research Scientist with the Insti-tute of Intelligent Systems for Automation, NationalResearch Council of Italy, Genoa. He is a WorkGroup Leader of the Italian IPv6 Task Force, aContract Professor, and a Professional Engineer. Hehas authored or co-authored over 90 academic pub-lications, and several patents. His current research
interests include P2P systems, wireless communications, cloud architectures,and network security. Dr. Caviglione is involved in the technical programcommittee of many international conferences and regularly serves as aReviewer for the major international journals. Since 2011, he has been an As-sociate Editor of Transactions on Emerging Telecommunications Technologies(Wiley).
Mauro Gaggero received the B.Sc. and M.Sc. de-grees in electronics engineering and the Ph.D. degreein mathematical engineering from the Universityof Genoa, Genoa, Italy, in 2003, 2005, and 2010,respectively. He was a Post-Doctoral Fellow withthe Faculty of Engineering, University of Genoa,in 2010. Since 2011, he has been a Research Sci-entist with the Institute of Intelligent Systems forAutomation, National Research Council of Italy,Genoa. His current research interests include controland optimization of nonlinear systems, distributed
parameter systems, neural networks, and learning from data. Dr. Gaggero isan Associate Editor of the European Control Association Conference EditorialBoard and of the IEEE Control Systems Society Conference Editorial Board.
Jean-Francois Lalande received the Ph.D. de-gree in computer science from Inria, Sophia-Antipolis, France, within the Mascotte Project(CNRS/Inria/UNSA) in 2004. He is currently an As-sociate Professor with the INSA Centre Val de Loire,in the Laboratoire d’Informatique de l’Universited’Orleans (LIFO). He is also temporarily associatedwith Inria in the CIDRE team. During the Ph.D.,his research interests focused on the combinatorialoptimization for optical and satellite networks. Since2005, he has been working on security of operating
systems, C-embedded software (including smart cards), and Android appli-cations. Currently, he is interested in mobile software security. Prof. Lalandeactively participates to the release of open-source software in order to makesecurity experiments reproducible.
Wojciech Mazurczyk (SM’13) received the B.Sc.,M.Sc., Ph.D. (with honors), and D.Sc. (habilitation)degrees in telecommunications from the WarsawUniversity of Technology (WUT), Warsaw, Poland,in 2003, 2004, 2009, and 2014, respectively. Heis currently an Associate Professor with the In-stitute of Telecommunications at WUT, where heis the Head of the Bio-inspired Security ResearchGroup (bsrg.tele.pw.edu.pl). His researchinterests include bio-inspired cybersecurity and net-working, information hiding, and network security.
Prof. Mazurczyk is involved in the technical program commitee of manyinternational conferences, including IEEE INFOCOM, IEEE GLOBECOM,IEEE ICC, and ACSAC. Also, he serves as a Reviewer for the majorinternational magazines and journals. Since 2013, he is an Associate TechnicalEditor of the IEEE Communications Magazine (IEEE Comsoc).
Marcin Urbanski received the B.Eng. in computerscience from the Warsaw University of Technology(WUT), Warsaw, Poland, in 2015. He currentlyworks at the Norwegian University of Science andTechnology, Trondheim, Norway, where he is im-plementing applications for interactive lectures. Hisresearch interests include steganography and mobilesoftware security.