see-and-avoid quadcopter using fuzzy control optimized...
TRANSCRIPT

See-and-Avoid Quadcopter using Fuzzy Control Optimized by Cross-Entropy
Miguel A. Olivares-Mendez Luis Mejias Pascual Campoy
and Ignacio Mellado-Bataller
Abstract—In this work we present an optimized fuzzy visual servoing system for obstacle avoidance using an unmanned aerial vehicle. The cross-entropy theory is used to optimise the gains of our controllers. The optimization process was made using the ROS-Gazebo 3D simulation with purposeful extensions developed for our experiments. Visual servoing is achieved through an image processing front-end that uses the Camshift algorithm to detect and track objects in the scene. Experimental flight trials using a small quadrotor were performed to validate the parameters estimated from simulation. The integration of cross-entropy methods is a straightforward way to estimate optimal gains achieving excellent results when tested in real flights.
I. INTRODUCTION
Aerial robotics is getting more importance each year in the field of robotic community. The advances in electronics have allowedthe miniaturization of sensors and the systems onboard aircraft, causing a radical increasing in the manufacturing of all sort of aerial robots at an affordable price. Nowadays is possible to acquire a basic quadcopter in standard electronic or toy shops, when years ago the possibility of research with aerial robots was affordable only by few research groups in the world. Actually there are so much research groups involve to obtain results for different type of tasks with this kind of platform.
Multiple sensors are used onboard aerial robots in order to acquire information of the environment. For instance, Laser ranger finder [1] and sonars [2]. But the most widely used sensor are cameras. An example of the use of cameras for attitude estimation can be found in [3], [4]. Furthermore, advanced systems such as the "kinect" [5] have been demonstarted with quadrotors [6].
On the other side the Soft-computing techniques in engineering applications are becoming common. Tasks such as prediction [7], data mining [8], control are some of the uses of these techniques.The way Soft-Computing can manage uncertainty and inaccuracies of sensors made them very suitable for automatize robotic systems. Some examples for control purposes can be found in [9], [10]. In order to obtain a robust control system once the controller was developed an optimization process is required. One of the last optimization
method developed is the Cross-entropy [11] which has not been widely used for control tasks [12], [13].
This paper is structured as follows. In section II we describe the image processing front-end used in our approach. In section III we explain the visual servoing approach using fuzzy logic for heading control. The cross-entropy theory is introduced in section IV. Experimental results are presented in section V. Finally, concluding remarks and future work are presented in section VI.
II. VISUAL SYSTEM
Information (image) from the environment is acquired using an onboard forward-looking camera. This information is then sent for off-board processing in a laptop ground-station. The result of the visual processing (including servoing commands) are then send back to the vehicle using a 802.1 In link. In this section we describe briefly the image processing front-end used for detection and tracking of objects.
In a nutshell, the avoidance task is based on the idea of keeping the target in the image plane at constant bearing, either right of left (as seen from image centre). When the object is first detected is pushed to the edge (far left of right side) of the image. Objects will be placed in the far edge on the same side of first detection.
The problem of target detection is approached pre-defining a color and then designing an algorithm to highlight this color that then will be tracked. For this purpose, we use a color representation that allows us to keep color distributions derived from video image sequences approximately constant (in outdoor settings). This process is not always perfect, and changes still occur in colour distributions over time. This dynamic nature of changes in lighting can be addressed by dynamically adapting to changes in probability distributions of color. An algorithm that adopts this strategy is the Continuously Adaptive Mean Shift [14] (CamShift). This algorithm is based on the mean shift originally introduced by Fukunaga and Hostetler [15].
Using Camshift algorithm we are able to track and extract the centre of the color region that describes the object. Figure 16 shows an example of the tracking processes on
red coloured object. Using the coordinates of the object’s centre in the image plane, we are able to generate desired yaw commands which in turn will modify the trajectory of the vehicle in order to keep the object at constant relative bearing. This is performed keeping forward velocity constant.
I I I . FUZZY CONTROLLER
The aim of the controller is to generate desired yaw commands for the vehicle based on the location of the target in the image plane.This section will describe the details of this controller.
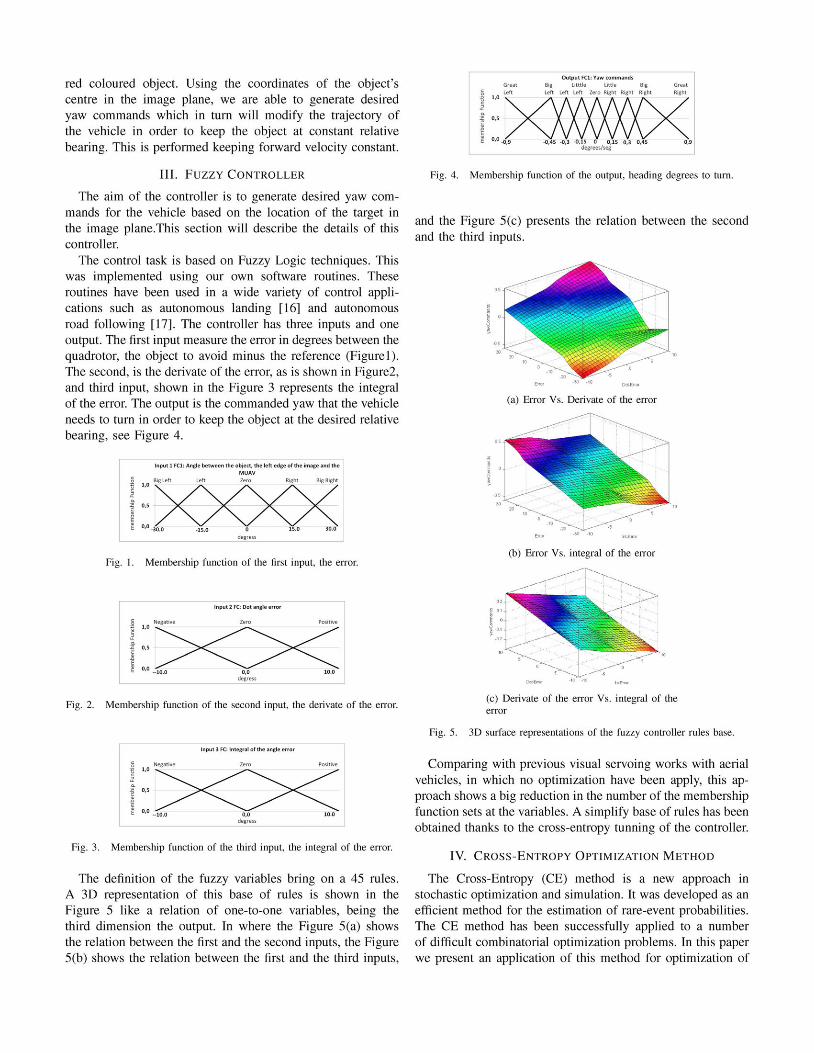
The control task is based on Fuzzy Logic techniques. This was implemented using our own software routines. These routines have been used in a wide variety of control applications such as autonomous landing [16] and autonomous road following [17]. The controller has three inputs and one output. The first input measure the error in degrees between the quadrotor, the object to avoid minus the reference (Figure1). The second, is the derivate of the error, as is shown in Figure2, and third input, shown in the Figure 3 represents the integral of the error. The output is the commanded yaw that the vehicle needs to turn in order to keep the object at the desired relative bearing, see Figure 4.
Fig. 1. Membership function of the first input, the error.
Fig. 2. Membership function of the second input, the derivate of the error.
Fig. 3. Membership function of the third input, the integral of the error.
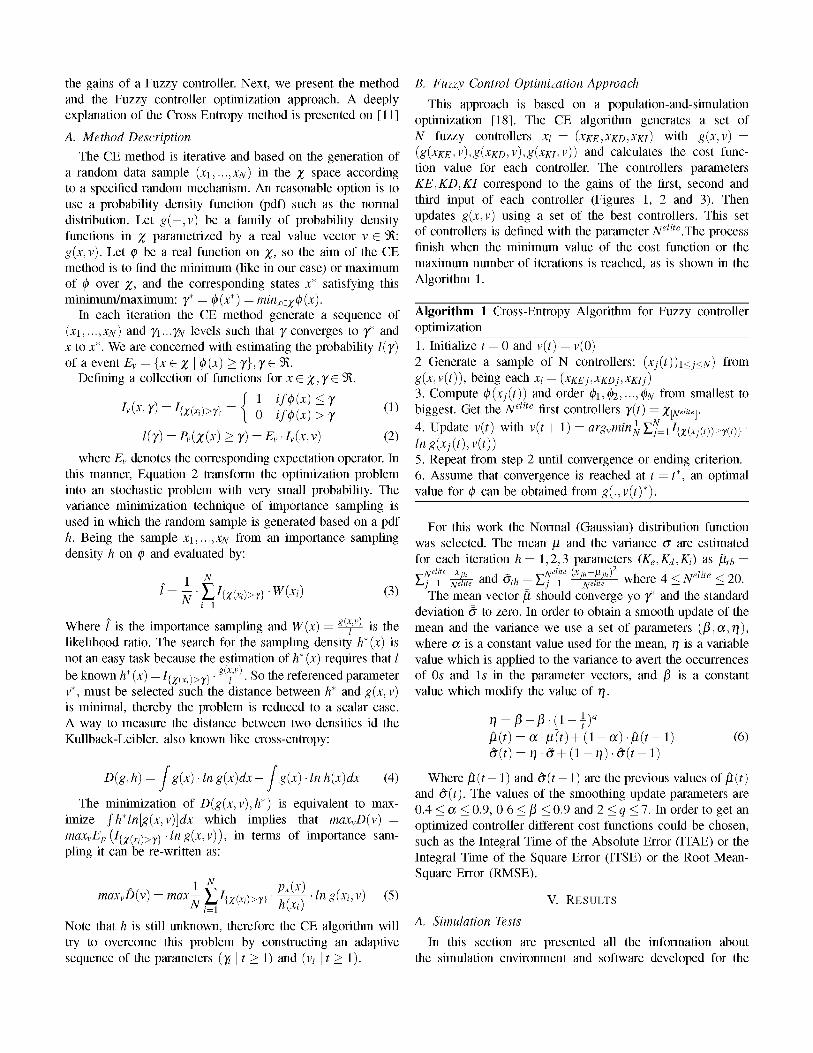
The definition of the fuzzy variables bring on a 45 rules. A 3D representation of this base of rules is shown in the Figure 5 like a relation of one-to-one variables, being the third dimension the output. In where the Figure 5(a) shows the relation between the first and the second inputs, the Figure 5(b) shows the relation between the first and the third inputs,
Fig. 4. Membership function of the output, heading degrees to turn.
and the Figure 5(c) presents the relation between the second and the third inputs.
(a) Error Vs. Derivate of the error
(b) Error Vs. integral of the error
(c) Derivate of the error Vs. integral of the error
Fig. 5. 3D surface representations of the fuzzy controller rules base.
Comparing with previous visual servoing works with aerial vehicles, in which no optimization have been apply, this approach shows a big reduction in the number of the membership function sets at the variables. A simplify base of rules has been obtained thanks to the cross-entropy tunning of the controller.
I V . CROSS-ENTROPY OPTIMIZATION METHOD
The Cross-Entropy (CE) method is a new approach in stochastic optimization and simulation. It was developed as an efficient method for the estimation of rare-event probabilities. The C E method has been successfully applied to a number of difficult combinatorial optimization problems. In this paper we present an application of this method for optimization of
the gains of a Fuzzy controller. Next, we present the method and the Fuzzy controller optimization approach. A deeply explanation of the Cross Entropy method is presented on [11]
A. Method Description
The CE method is iterative and based on the generation of a random data sample (X1,...,XN) in the % space according to a specified random mechanism. An reasonable option is to use a probability density function (pdf) such as the normal distribution. Let g( —,v) be a family of probability density functions in % parametrized by a real value vector v G 9Í: g(x,v). Let <p be a real function on %, so the aim of the CE method is to find the minimum (like in our case) or maximum of <p over %, and the corresponding states x* satisfying this minimum/maximum: 7* = 0 (x*) = tninxex <p (x).
In each iteration the CE method generate a sequence of (X1,...,XN) and 71... 7v levels such that /converges to 7* and x to x*. We are concerned with estimating the probability /(y) of a event Ev = {x G % \ <p (x) > 7}, 7 G 9Í.
Defining a collection of functions for x G #, 7G 9Í.
/ ( / ) = Pv(Z(X) ^ 7) = Ev • ^V(XJ v) (2)
where £v denotes the corresponding expectation operator. In this manner, Equation 2 transform the optimization problem into an stochastic problem with very small probability. The variance minimization technique of importance sampling is used in which the random sample is generated based on a pdf h. Being the sample X1,...,XN from an importance sampling density h on <¡> and evaluated by:
1 1= •E/{zfe)>r}'w(Xi') N
(3) (=1
Where ˆ is the importance sampling and W(x) = y¡ is the likelihood ratio. The search for the sampling density h* (x) is not an easy task because the estimation of h* (x) requires that / be known h* (x) = I{yíx¡)>y} • ¿ . So the referenced parameter v*, must be selected such the distance between h* and g(x,v) is minimal, thereby the problem is reduced to a scalar case. A way to measure the distance between two densities id the Kullback-Leibler, also known like cross-entropy:
D(g,h) = g{x) • Ing{x)dx — g{x) -lnh{x)dx (4)
The minimization of D(g(x,v),h*) is equivalent to maximize Jh*ln[g(x,v)]dx which implies that maxvD(v) = maxvEp(Ifyix.\>y\-Ing(x,v)), in terms of importance sampling it can be re-written as:
1 Px{x) maxvD(v) = max— J_,hr(x-)>y\' TT—r ' 'n S\xiiv) (5)
Note that h is still unknown, therefore the CE algorithm wil l try to overcome this problem by constructing an adaptive sequence of the parameters (7 11 > 1) and (yt \t > 1).
B. Fuzzy Control Optimization Approach
This approach is based on a population-and-simulation optimization [18]. The CE algorithm generates a set of JV fuzzy controllers x,- = (XKE,XKD,XKI) with g(x,v) = (g(xKE,v),g(xKD,v),g(xKi,v)) and calculates the cost function value for each controller. The controllers parameters KE,KD,KI correspond to the gains of the first, second and third input of each controller (Figures 1, 2 and 3). Then updates g(x,v) using a set of the best controllers. This set of controllers is defined with the parameter Nel,te.The process finish when the minimum value of the cost function or the maximum number of iterations is reached, as is shown in the Algorithm 1.
Algorithm 1 Cross-Entropy Algorithm for Fuzzy controller optimization
1. Initialize f = 0 and v(f) = v(0) 2 Generate a sample of N controllers: (xj(t))1<j<N) from g(x,v(t)), being each x,- = (XKEJ,XKDJ,XKIJ) 3. Compute <¡)(xj(t)) and order <¡>1,<¡y2,...,<¡>N from smallest to biggest. Get the Nel,te first controllers y{t) = X\Nditey
4. Update v(f) with v(f + 1) = argvminjjY*:=1I{x{x-(t))>y(t)\' In g(xj(t),v(t)) 5. Repeat from step 2 until convergence or ending criterion. 6. Assume that convergence is reached at t = t*, an optimal value for <¡> can be obtained from g(.,v(t)*).
For this work the Normal (Gaussian) distribution function was selected. The mean ¡j, and the variance a are estimated for each iteration h= 1,2,3 parameters (Ke,Kd,Ki) as p,th =
11}=1 ^L and ath = Y?}=1 (*'hN!}£)2 where 4 < Nelite < 20.
The mean vector p, should converge yo 7* and the standard deviation a to zero. In order to obtain a smooth update of the mean and the variance we use a set of parameters (/3,a,r/), where a is a constant value used for the mean, r¡ is a variable value which is applied to the variance to avert the occurrences of 0s and 1s in the parameter vectors, and /3 is a constant value which modify the value of r¡.
r¡ = ¡5 - ¡5 • (1 - j)q
fi(t) = a-/x(i) + (1 — a)-fi(i a(t) = TJ -cr + (1 — TJ) -a(t -
(6)
1)
Where fl(t — 1) and o(t — 1) are the previous values of /x(i) and d(f) . The values of the smoothing update parameters are 0.4 < a < 0.9, 0.6 < /3 < 0.9 and 2 < q < 7. In order to get an optimized controller different cost functions could be chosen, such as the Integral Time of the Absolute Error (ITAE) or the Integral Time of the Square Error (ITSE) or the Root Mean-Square Error (RMSE).
V. RESULTS
A. Simulation Tests
In this section are presented all the information about the simulation environment and software developed for the

optimization using the Cross-Entropy method. The explanation of the 330 tests accomplished, the evolution of the gains, its probability density functions and the evaluated error is presented in the second part of this subsection.
1) Simulation Environment: The simulation tests were performed using the ROS (Robotics Operative System) and the 3D simulation Gazebo [19]. In the simulations, a quadcopter model of starmack ros-pkg developed by the Berkeley University [20] used. The obstacle to avoid is defined by a virtual yellow balloon.
Two external software in C + + were developed for accomplish these tests. One of then is the cross-entropy method. This program is responsible for the optimization process. Generate a set of controllers, select the control to test and when all the controllers are tested, update the pdf with the tests results to obtain the new set of controllers. The other one is the responsible to execute iteratively the ROS-Gazebo system. In order to test all the controllers in the same conditions, the ROS-Gazebo is restarted for each test getting same initial stage for all the tests. The Figure 6 shows the tests flowchart.
Fig. 6. Flowchart of the optimization process.
Besides this external software to execute in a loop the 3D simulator, two nodes have been added to the ROS-Gazebo. One is the visual algorithm which get the visual image obtained by the simulated camera onboard the quadcopter. Each frame is converted in to a OpenCV image to be processed. Then the visual information is sent to the Fuzzy controller node. The controller evaluates the this data to obtain the correct yaw value. Finally this command is sent to the simulated aircraft at the 3D simulator.
2) Optimization process using the simulation: In order to obtain the optimal controller, we define a 3 seconds test for each controller. The quadcopter start position is in front of the object to avoid. A constant pitch speed during all the test is sent to the aircraft. In five seconds the controller must oriented the quadcopter in order to keep the object at the left side of the image. To evaluate each test the Integral Time Absolute
Fig. 7. Interaction between the ROS-Gazebo 3D simulator and the two other process developed for this work.
Error (ITAE) function cost was used. Some tests were made with the Root Mean Square Error (RMSE) cost function with similar results. We choice the ITAE error estimator because it penalizes so hard the error at the end of the test. Being more important estimator during a optimization process. The cross-entropy system generate per each iteration N = 30 controllers based on the last update of the probabilistic density functions of each gains. From this set of controllers the five with the lower value of the ITAE have been selected (N elite — 5) to update the next pdf parameters. The initial values for the pdf of all the gains are ¡10 = 0.5, O0 = 0.5. The rest of the parameters of the cross-entropy method are q = 2, ¡5t0 = 0, /30 = 0.92, (X0 = 0. Those values are based on the researches of [12] and [18].
Fig. 8. Control loop with the optimization of the Cross-Entropy method.
Fig. 9. Evolution of the probability density function for the first input gain. The standard variance converge in 12 iterations to a value of 0.0028 so that the obtained mean 0.9572 can be used in the real tests.
330 tests have been made to obtain the optimal controller. This process corresponds to a 11 updates of the gains-pdf. The Figure 9 shows the evolution of the probability density
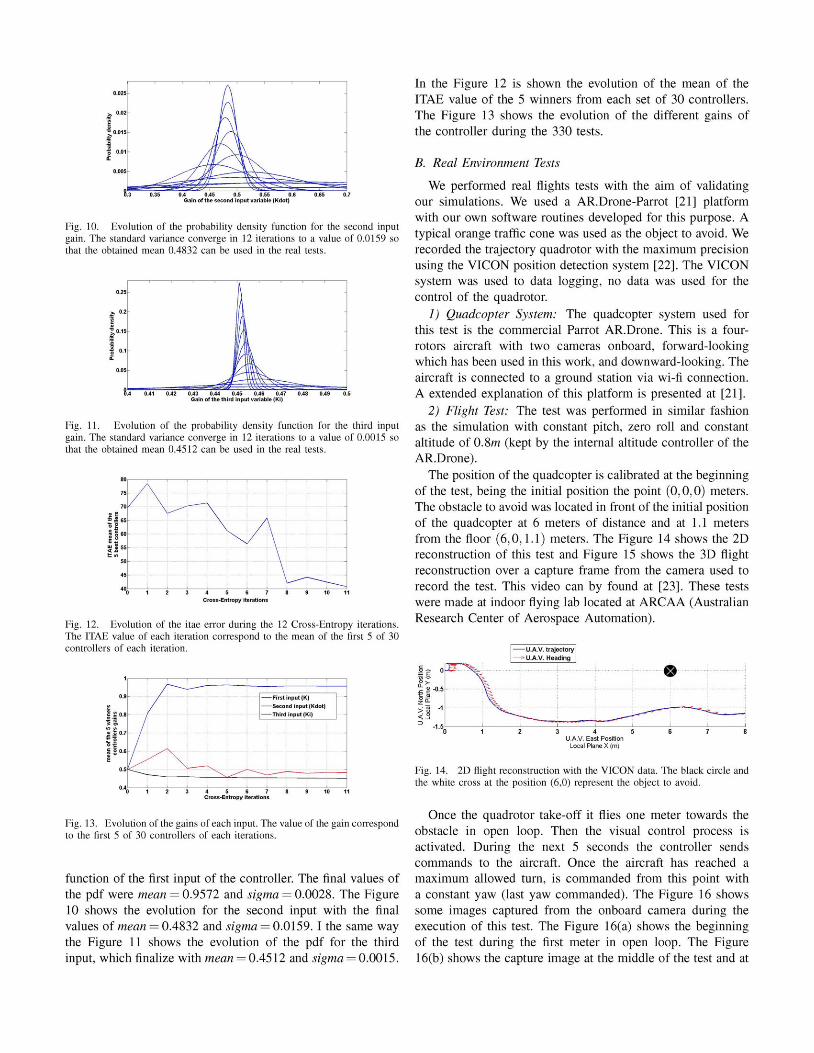
Fig. 10. Evolution of the probability density function for the second input gain. The standard variance converge in 12 iterations to a value of 0.0159 so that the obtained mean 0.4832 can be used in the real tests.
Fig. 11. Evolution of the probability density function for the third input gain. The standard variance converge in 12 iterations to a value of 0.0015 so that the obtained mean 0.4512 can be used in the real tests.
Fig. 12. Evolution of the itae error during the 12 Cross-Entropy iterations. The ITAE value of each iteration correspond to the mean of the first 5 of 30 controllers of each iteration.
Fig. 13. Evolution of the gains of each input. The value of the gain correspond to the first 5 of 30 controllers of each iterations.
function of the first input of the controller. The final values of the pdf were mean = 0.9572 and sigma = 0.0028. The Figure 10 shows the evolution for the second input with the final values of mean = 0.4832 and sigma = 0.0159. I the same way the Figure 11 shows the evolution of the pdf for the third input, which finalize with mean = 0.4512 and sigma = 0.0015.
In the Figure 12 is shown the evolution of the mean of the ITAE value of the 5 winners from each set of 30 controllers. The Figure 13 shows the evolution of the different gains of the controller during the 330 tests.
B. Real Environment Tests
We performed real flights tests with the aim of validating our simulations. We used a AR.Drone-Parrot [21] platform with our own software routines developed for this purpose. A typical orange traffic cone was used as the object to avoid. We recorded the trajectory quadrotor with the maximum precision using the VICON position detection system [22]. The VICON system was used to data logging, no data was used for the control of the quadrotor.
1) Quadcopter System: The quadcopter system used for this test is the commercial Parrot AR.Drone. This is a four-rotors aircraft with two cameras onboard, forward-looking which has been used in this work, and downward-looking. The aircraft is connected to a ground station via wi-fi connection. A extended explanation of this platform is presented at [21].
2) Flight Test: The test was performed in similar fashion as the simulation with constant pitch, zero roll and constant altitude of 0.8m (kept by the internal altitude controller of the AR.Drone).
The position of the quadcopter is calibrated at the beginning of the test, being the initial position the point (0,0,0) meters. The obstacle to avoid was located in front of the initial position of the quadcopter at 6 meters of distance and at 1.1 meters from the floor (6,0,1.1) meters. The Figure 14 shows the 2D reconstruction of this test and Figure 15 shows the 3D flight reconstruction over a capture frame from the camera used to record the test. This video can by found at [23]. These tests were made at indoor flying lab located at ARCAA (Australian Research Center of Aerospace Automation).
Fig. 14. 2D flight reconstruction with the VICON data. The black circle and the white cross at the position (6,0) represent the object to avoid.
Once the quadrotor take-off it flies one meter towards the obstacle in open loop. Then the visual control process is activated. During the next 5 seconds the controller sends commands to the aircraft. Once the aircraft has reached a maximum allowed turn, is commanded from this point with a constant yaw (last yaw commanded). The Figure 16 shows some images captured from the onboard camera during the execution of this test. The Figure 16(a) shows the beginning of the test during the first meter in open loop. The Figure 16(b) shows the capture image at the middle of the test and at
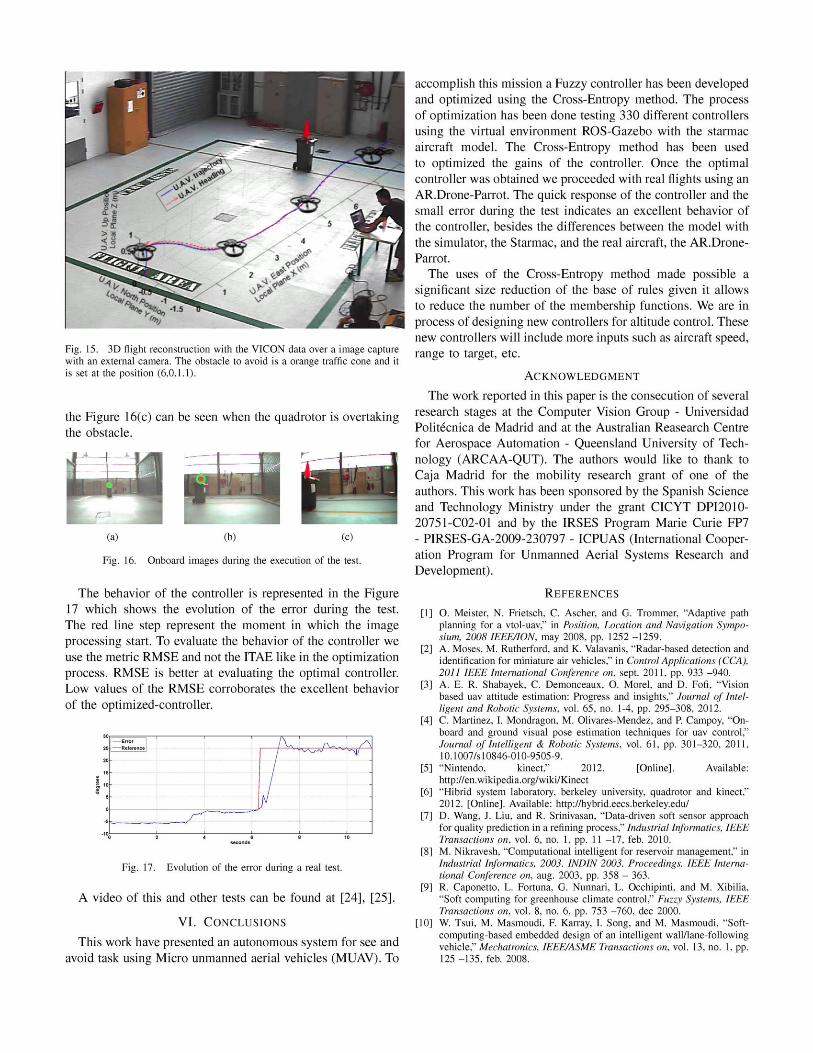
Fig. 15. 3D flight reconstruction with the VICON data over a image capture with an external camera. The obstacle to avoid is a orange traffic cone and it is set at the position (6,0,1.1).
the Figure 16(c) can be seen when the quadrotor is overtaking the obstacle.
(a) (b)
Fig. 16. Onboard images during the execution of the test.
The behavior of the controller is represented in the Figure 17 which shows the evolution of the error during the test. The red line step represent the moment in which the image processing start. To evaluate the behavior of the controller we use the metric RMSE and not the ITAE like in the optimization process. RMSE is better at evaluating the optimal controller. Low values of the RMSE corroborates the excellent behavior of the optimized-controller.
Fig. 17. Evolution of the error during a real test.
A video of this and other tests can be found at [24], [25].
V I . CONCLUSIONS
This work have presented an autonomous system for see and avoid task using Micro unmanned aerial vehicles (MUAV). To
accomplish this mission a Fuzzy controller has been developed and optimized using the Cross-Entropy method. The process of optimization has been done testing 330 different controllers using the virtual environment ROS-Gazebo with the starmac aircraft model. The Cross-Entropy method has been used to optimized the gains of the controller. Once the optimal controller was obtained we proceeded with real flights using an AR.Drone-Parrot. The quick response of the controller and the small error during the test indicates an excellent behavior of the controller, besides the differences between the model with the simulator, the Starmac, and the real aircraft, the AR.Drone-Parrot.
The uses of the Cross-Entropy method made possible a significant size reduction of the base of rules given it allows to reduce the number of the membership functions. We are in process of designing new controllers for altitude control. These new controllers will include more inputs such as aircraft speed, range to target, etc.
ACKNOWLEDGMENT
The work reported in this paper is the consecution of several research stages at the Computer Vision Group - Universidad Polite´cnica de Madrid and at the Australian Reasearch Centre for Aerospace Automation - Queensland University of Technology (ARCAA-QUT) . The authors would like to thank to Caja Madrid for the mobility research grant of one of the authors. This work has been sponsored by the Spanish Science and Technology Ministry under the grant C I C Y T DPI2010-20751-C02-01 and by the IRSES Program Marie Curie FP7 - PIRSES-GA-2009-230797 - ICPUAS (International Cooperation Program for Unmanned Aerial Systems Research and Development).
REFERENCES
[1] O . Meister, N . Frietsch, C . Ascher, and G . Trommer, “Adaptive path planning for a vtol-uav,” in Position, Location and Navigation Symposium, 2008 IEEE/ION, may 2008, pp. 1252 –1259.
[2] A . Moses, M . Rutherford, and K . Valavanis, “Radar-based detection and identification for miniature air vehicles,” in Control Applications (CCA), 2011 IEEE International Conference on, sept. 2011, pp. 933 –940.
[3] A . E . R. Shabayek, C . Demonceaux, O . Morel, and D . Fofi, “Vision based uav attitude estimation: Progress and insights,” Journal of Intelligent and Robotic Systems, vol. 65, no. 1-4, pp. 295–308, 2012.
[4] C . Martinez, I . Mondragon, M . Olivares-Mendez, and P. Campoy, “Onboard and ground visual pose estimation techniques for uav control,” Journal of Intelligent & Robotic Systems, vol. 61, pp. 301–320, 2011, 10.1007/s10846-010-9505-9.
[5] “Nintendo, kinect,” 2012. [Online]. Available: http://en.wikipedia.org/wiki/Kinect
[6] “Hibrid system laboratory, berkeley university, quadrotor and kinect,” 2012. [Online]. Available: http://hybrid.eecs.berkeley.edu/
[7] D . Wang, J . Liu, and R. Srinivasan, “Data-driven soft sensor approach for quality prediction in a refining process,” Industrial Informatics, IEEE Transactions on, vol. 6, no. 1, pp. 11 –17, feb. 2010.
[8] M . Nikravesh, “Computational intelligent for reservoir management,” in Industrial Informatics, 2003. INDIN 2003. Proceedings. IEEE International Conference on, aug. 2003, pp. 358 – 363.
[9] R. Caponetto, L . Fortuna, G . Nunnari, L . Occhipinti, and M . Xibilia, “Soft computing for greenhouse climate control,” Fuzzy Systems, IEEE Transactions on, vol. 8, no. 6, pp. 753 –760, dec 2000.
[10] W. Tsui, M . Masmoudi, F. Karray, I . Song, and M . Masmoudi, “Soft-computing-based embedded design of an intelligent wall/lane-following vehicle,” Mechatronics, IEEE/ASME Transactions on, vol. 13, no. 1, pp. 125 –135, feb. 2008.

[11] R. Y. Rubinstein and D. P. Kroese, The Cross Entropy Method: A Unified Approach To Combinatorial Optimization, Monte-carlo Simulation (Information Science and Statistics). Secaucus, NJ, USA: Springer-Verlag New York, Inc., 2004.
[12] R. E. Haber, R. M. del Toro, and A. Gajate, “Optimal fuzzy control system using the cross-entropy method. a case study of a drilling process,” Information Sciences. Special Section on Hybrid Intelligent Algorithms and Applications, vol. 180, pp. 2777–2792, July 2010.
[13] M. Bodur, “An adaptive cross-entropytuning of the pid control for robot manipulators,” in Proceedings of the World Congress on Engineering, WCE 2007, 2007, 2007, pp. 93–98.
[14] G. R. Bradski, “Computer vision face tracking for use in a perceptual user interface,” Intel Technology Journal, no. Q2, 1998. [Online]. Available: http://citeseer.ist.psu.edu/585206.html
[15] K. Fukunaga and L. Hostetler, “The estimation of the gradient of a density function, with applications in pattern recognition,” Information Theory, IEEE Transactions on, vol. 21, no. 1, pp. 32 – 40, Jan. 1975.
[16] M. Olivares-Mendez, I. Mondragon, P. Campoy, and C. Martinez, “Fuzzy controller for uav-landing task using 3d-position visual estimation,” in Fuzzy Systems (FUZZ), 2010 IEEE International Conference on, july 2010, pp. 1 –8.
[17] M. Olivares-Mendez, I. Mellado, P. Campoy, I. Mondragon, and C. Martinez, “A visual agv-urban car using fuzzy control,” in Automation, Robotics and Applicatios (ICARA), 2011 IEEE International Conference on, December 2011.
[18] Z. Botev and D. P. Kroese, “Global likelihood optimization via the cross-entropy method with an application to mixture models,” in Proceedings of the 36th conference on Winter simulation, 2004, pp. 529–535.
[19] “Robot operating system (ros),” 2012. [Online]. Available: http://ros.org/wiki/gazebo
[20] “Starmac-ros package. hybrid systems laboratory, uc berkeley,” 2012. [Online]. Available: http://www.ros.org/wiki/starmac-ros-pkg
[21] “Ar.drone parrot,” 2010. [Online]. Available: http://ardrone.parrot.com [22] “Motion capture system from vicon,” 2012. [Online]. Available:
http://www.vicon.com [23] “Computer vision group-upm. see and avoid fuzzy controller
optimized using cross-entropy,” 2012. [Online]. Available: http://vision4uav.eu/?q=researchline/SeeAndAvoidCE
[24] “Computer vision group-upm,” 2012. [Online]. Available: http://www.vision4uav.eu
[25] “Youtube channel computer vision group-upm,” 2012. [Online]. Available: http://www.youtube.com/colibriprojectUAV