see 2011 corporate social responsibility report for details
TRANSCRIPT

Toronto and Region Conservation Authority
Corporate Sustainability Report (CSR)
2011
TRCA’s People Power

II TRCA Corporate Social Responsibility Report 2011
Message from Brian Denney, Chief Administrative Officer, TRCAAt Toronto and Region Conservation our people are the key to our success
and our sustainability. As such, I am pleased to present the 2011 Corporate
Social Responsibility Report, which highlights the role of our people in pursuing
operational sustainability at TRCA.
I am proud to be able to identify at least some of the many actions being
taken by staff to help us along our corporate sustainability journey. We also
share some stories from the new Canadians that we helped with their careers,
many of whom found jobs in their field through our award winning social
development programs. I am very pleased to say that our employee survey
continues to show that our people are happy to be working with us and feel
that they are a valued part of the organization. Of course we also report on
how we measure up in advancing our operational sustainability with our key
performance indicators. But sustainability is, at its very core, about people.
TRCA Corporate Social Responsibility Report 2011 III
Table of ContentsQuotes from Staff Survey ................................................................................................................................. 1
TRCA Sustainability Scorecard ....................................................................................................................... 2
1.0 Introduction ................................................................................................................................................ 6
2.0 Our People ................................................................................................................................................... 8
2.1 Equity, Diversity, and Staff Retention .......................................................................................................................................... 8
2.2 Employee Engagement ................................................................................................................................................................... 10
3.0 Our Environment ......................................................................................................................................17
3.1 Carbon Footprint ................................................................................................................................................................................. 17
3.2 Energy Use ............................................................................................................................................................................................... 20
3.3 Water Use .................................................................................................................................................................................................. 27
3.4 Vehicles, Fuel and Travel .................................................................................................................................................................. 30
3.4.2 Where We Are Going ..................................................................................................................................................................... 33
3.5 Land Management ............................................................................................................................................................................. 34
3.6 Waste Management ........................................................................................................................................................................... 37
4.0 Our Business ..............................................................................................................................................41
4.1 Sustainable Business Practice ...................................................................................................................................................... 41
4.2 Green Purchasing ................................................................................................................................................................................ 42
5.0 Our Community .........................................................................................................................................46
5.1 Our Community – Social .................................................................................................................................................................. 46
Appendices ......................................................................................................................................................55
Cover photo: TRCA’s Education Field Centres have been leading the TRCA charge towards sustainability from the very beginning.

TRCA Corporate Social Responsibility Report 2011 1
Quotes from Staff SurveyQ2. Why is it important for TRCA to act sustainable and practice Corporate Social Responsibility (i.e. act
with financial, social, and environmental sustainability in mind)?
“ Leading by example motivates other (public and external partners) and adds legitimacy to our
collective cause. A demonstrated commitment to sustainability can also be good for employee
morale and will attract potential employees who share the same ethic.”“ set positive example, act as leader for others to follow, test new ideas/technologies/boost
staff morale and loyalty.”“ corporate social responsibility is a core component of all business practices and we need to
demonstrate our effectiveness and promote our success stories to the public.”“ The TRCA has branded itself for the Living City, we are supposed to be a leader in sustainability,
it is not enough to just tow the line. How could we think we are going to have healthy waterways
unless we live sustainable on there banks, we are responsible for maintaining at least one piece of
the Green Infrastructure, the water ways.”“ To be a role model- “to practice what we preach.”
“ It’s everyones responsibility. The sum of all contributions is what will make the day.”“ For a lot of reasons, but I think a big one is that we are such a large organization that works with
so many municipalities that we want to be the leader in this regard. If the organizations at the top
aren’t acting responsibly, why will anyone else?.”“ Walk the talk!!!.”
“ it is the right thing to do for the future, yours mind and our childrens..”“ TRCA unofficially sets the standard for the private sector to aspire to. We should always look to
set the bar higher..”“ 1 - practice what we preach, 2 - right thing to do (which increases employee morale).”
“ More and more organizations are conducting business with the triple bottom line in mind and
it is to TRCA’s advantage to be a leader rather than a late adopter in this regard. Furthermore,
TRCA should be walking the talk on the sustainability front and financial sustainability is
important because public funds support a lot of our work and it would be prudent of us to spend it
wisely and responsibly..”

2 TRCA Corporate Social Responsibility Report 2011
TRCA Sustainability Scorecard New for the 2011 CSR report, staff has prepared a Sustainability Scorecard. The purpose of the Scorecard is to provide a
concise summary of TRCA progress towards its CSR targets as of the end of 2011, including whether the measure is improving
(up arrow), getting worse (down arrow), or remains unchanged (horizontal arrows). These measures, our CSR key performance
indicators, are presented under four categories: Our People; Our Environment; Our Business; Our Community. TRCA is proud
to highlight that TRCA continues to be an employer of choice with staff retention well above the national average. TRCA
continues to leverage its core municipal funding allocation through revenue from a wide range of other sources, and the sale
of products and services. The corporate carbon footprint has continued to decline in 2011 and is expected to fall further as
retrofits of facilities such as the Kortright Centre are completed in 2012. The award winning PAIE and M2P programs continue
to be oversubscribed and provide new Canadians with valuable mentoring and training.
*Green shading indicates targets met or exceeded.
Our PeopleMeasure 2011 Performance/Status Trend Target
Equity, Diversity, and Staff Retention
My work gives me a sense of
accomplishment
92.8% Achieve 90% on staff survey.
I would recommend TRCA as a
good place to work
91.8% Achieve 90% on staff survey.
Overall I am satisfied with my job 88.0% Achieve 90% on staff survey.
TRCA is socially responsible 83.6% Achieve 90% on staff survey.
TRCA is environmentally
responsible
87.5% Achieve 90% on staff survey.
Morale at TRCA is high 73.9% Achieve by 2025, 80% on staff survey.
TRCA is well managed 71.1% Achieve by 2025, 80% on staff survey.
I am sufficiently informed about
where TRCA is going in the future
61.2% Achieve by 2025, 80% on staff survey.
TRCA is economically responsible 74.5% Achieve by 2025, 80% on staff survey.
Staff Retention 87% Not reported
last year.
Achieve, annually, at least 2% below
national average in employee turnover.

TRCA Corporate Social Responsibility Report 2011 3
Our People
Measure 2011 Performance/Status Trend Target
Employee Engagement
Staff participation in Clean
Air Commute
62
Have 80 staff members participate in
Pollution Probe’s Clean Air Commute
by 2012.
Staff participation in 20
minute makeover
68
Have at least 200 staff members
participate in the 20-Minute Makeover
by 2012.
Work location green programs Green teams or Audubon
in place at 10 TRCA
work locations.
Have EcoSchool/EcoOffice type “ecoteam”
programs at all work locations (18 total)
by 2012.
Our Environment
Measure 2011 Performance/Status Trend Target
Carbon Footprint
Carbon neutrality 2,760 tonnes
TRCA will be carbon neutral by 2025.
Energy
Energy reduction 6%
Reduce total energy consumption by 30%
from 2005 levels by 2015; and by 50%
by 2025.
Renewable energy 31.4%
50% of TRCA facility space is heated and
cooled from renewable sources by 2015.
Green electricity 24% Source 80% of electrical energy from green
sources by 2015.
Water
Water use 19% Reduce total potable water consumption
from 2009 levels by 35% by 2025.
Vehicles, Fuel, and Travel
Fleet fuel efficiency 17.1 litres per 100 km
(average, all vehicles)
TRCA’s average fleet fuel efficiency is 12
litres per 100 kilometres by 2018.

4 TRCA Corporate Social Responsibility Report 2011
Measure 2011 Performance/Status Trend Target
Fleet GHG emissions 3% Reduce TRCA greenhouse gas emissions
from fleet and travel by 50% from 2009
levels by 2018.
Alternative fuel vehicles 12% TRCA’s fleet will be 50% alternative fuel
vehicles by 2020.
Our EnvironmentMeasure 2011 Performance/Status Trend Target
Land Management
Land Management
Plans
8 of 14 land management
plans completed.
Complete baseline land management plans for 14
major TRCA properties.
Waste Management
Waste diversion 21% Diverting 80% of total waste at all TRCA facilities
by 2018.
Our Business
Measure 2011 Performance/Status Trend Target
Sustainable Business
Funding diversity –
leveraging partnerships
55% At least 50% of funding from non-
municipal sources.
Green Purchasing
Local Food 29% Not measured
last year.
40% of food purchased by TRCA is
sourced locally by 2012.

TRCA Corporate Social Responsibility Report 2011 5
Our Community – SocialMeasure 2011 Performance/Status Trend Target
Employment programs for internationally trained professionals (PAIE and M2P)
Number applicants 647 435 applications received by end
of 2014.
Number participants accessing
programs
97 170 participants accessing programs
by end of 2014.
Number participants completing
program
35 150 participants complete program by
end of 2014.
Number participants obtaining
employment in professional field
64 133 participants gain employment by
end of 2014.
Number participants obtaining
licensure/Certification/Credential
for Employment
29 55 participants receive credential for
licensure by end of 2014.
Number M2P Participants
(mentees) matched to a Mentor in
their field
100% 100 % M2P participants matched to
mentor in field by end of 2014.
Percent M2P Mentors from TRCA 50% 50% mentors recruited from
community at large for M2P program
by end of 2014.
Our Community – Social
Measure 2011 Performance/Status Trend Target
Environmental Volunteer Network (EVN)
Number new volunteers
registered with EVN
570 900 new registrants by end of 2014.
Number volunteer passes
issued to individuals who have
volunteered 30 or more hours
at TRCA
280 625 volunteer passes issued by end
of 2014.
Number external (non TRCA)
volunteer opportunities posted
on EVN
530 900 external volunteer opportunities
posted on EVN by end of 2014.

6 TRCA Corporate Social Responsibility Report 2011
1.0 Introduction Without the continual and concentrated efforts of TRCA staff, we could never become sustainable. This year’s CSR report is
dedicated to the people behind TRCA’s sustainability ethic and performance. Throughout the report, staff stories are presented
which give some perspective into what motivates our people to live sustainable lives, at home and at work. The story of
sustainability is a story of our people.
At TRCA, staff recognizes the leadership role we play in helping move our region toward the Living City vision. And they
recognize that our daily operations have an impact on the environment. The use of our vehicle and equipment fleet, our energy
consumption, the products and services we buy, how we manage our lands and what we do with our waste, all contribute to
humanity’s environmental impact.
Since the adoption of the Living City vision, and the formal institution of our Corporate Social Responsibility program, TRCA’s
staff has become an increasingly vital force for innovation and change in an effort to reduce our impacts and conduct our
business in a sustainable manner.
The Corporate Social Responsibility Program
TRCA is committed to a process of continual improvement toward operational sustainability. TRCA’s Corporate Social
Responsibility Program is the administrative process through which we assure operational sustainability is a top priority.
Through the CSR program we:
• measure and track indicators of operational sustainability;
• track actions taken toward sustainable operations;
• engage staff in sustainability at work and at home; and
• report on and celebrate progress toward operational sustainability.
In 2011 we also introduce a new section to CSR, Our Community, where we begin to measure and report on the impact
our programs have on the community.
TRCA tracks operational sustainability in 3 different areas:
1. Our People
2. Our Environment
3. Our Business

TRCA Corporate Social Responsibility Report 2011 7
For the 2011 report we have created a new section, Our Community, to report on the impact of our programs on the
surrounding community and beyond.
Each of these categories form a section of this report and for each, the following information is presented:
• Vision
• Goals
• Objectives
• Where We Are
• Where We Are Going
Scope of Sustainability Reporting on Operations at TRCA
For the purposes of this report, calculations of TRCA’s environmental impact are based on the following:
• Only internal operations are considered.
• Operations by consultants and/or contractors are not considered at this time.
• TRCA environmental achievements resulting from TRCA business such as our extensive forest holdings; tree plantings, habitat restorations, etc., are not considered.
• Offsets are not included, at this time.
• Travel to and from work is outside the scope of this report; however, all business travel is included.
• All facilities owned, operated or leased to TRCA are included in calculations under the 8 categories of sustainability performance (see page 3).
• Rental properties, whether currently rented or not, are not included.

8 TRCA Corporate Social Responsibility Report 2011
2.0 Our People For an organization to function and be sustainable, the basic needs of its staff and stakeholders must be met. A socially
sustainable organization is one that has the ability to maintain and build on its own resources, and the resiliency to prevent
and/or address problems in the future. The story of social sustainability at TRCA is the story of the sustainability of its
employees, partners, and all its stakeholders.
2.1 Equity, Diversity, and Staff Retention
Vision
• TRCA is an employer of choice, which adds social value to the community and all stakeholders it serves.
Specific Objectives
• Achieve annually at least 90% in employee survey agreeing on the following:
◦ My work gives me a sense of accomplishment.
◦ I would recommend TRCA as a good place to work.
◦ Overall I am satisfied with my job.
◦ TRCA is socially responsible.
◦ TRCA is environmentally responsible.
• Achieve by 2025 80% staff agreement when surveyed on:
◦ Morale at TRCA is high.
◦ TRCA is well managed.
◦ I am sufficiently informed about where TRCA is going in the future.
◦ TRCA is good at performance measurement of staff.
• Achieve, annually, at least 2% below national average in employee turnover.

TRCA Corporate Social Responsibility Report 2011 9
2.1.1 Where We Are
The national average rate of employee turnover is approximately 22% across all industries in Canada. At TRCA, employee
resignations were only 3.6% in 2008, 4.1% in 2009, 4.5% in 2010, and 2.85% in 2011. TRCA is exceeding its objectives
on this metric.
As well, TRCA exceeds it objectives on the following employee survey indicators:
• 92.8% agreed or somewhat agreed that “My work gives me a sense of accomplishment.”
• 91.8% agreed or somewhat agreed that “I would recommend TRCA as a good place to work.”
Through the survey we were also able to identify areas where we needed to work harder:
• 83.6% agree or somewhat agree that “TRCA is socially responsible.”
• 87.5% agreed or somewhat agreed that “TRCA is environmentally responsible.”
• 88% agree or somewhat agree that “Overall I am satisfied with my job.”
• 73.9% agreed or somewhat agreed that “Morale at TRCA was high.”
• 71.1% agreed or somewhat agreed that “TRCA is well managed.”
• 61.2% agreed or somewhat agreed that “I am sufficiently informed about where TRCA is going in the future.”
• 74.5% agreed or somewhat agreed that “TRCA is economically responsible.”
• 64.7% agreed or somewhat agreed that “TRCA is good at performance management of staff.”
Ways to improve on these scores will be explored on an ongoing basis.
2.1.2 Where We Are Going
Planned Actions:
2012
• Continue staff surveys and develop programs and strategies to meet Equity, Diversity, and Staff Retention objectives.
• Engage staff in the development of the corporate strategic plan.
• Develop a cross divisional staff mentoring program.

10 TRCA Corporate Social Responsibility Report 2011
2.2 Employee Engagement An organization can only be as sustainable as its employees. In addition to a commitment to environmental sustainability, both
at work and at home, a cultural commitment to a sustainable community ethic is fundamental to TRCA’s CSR program. TRCA’s
Living City Vision is dependent on employees and volunteers who are engaged, driven and committed to environmental and
social issues throughout the year.
Employee engagement at TRCA takes place on many levels. TRCA reaches out to all staff through its CarbonCats program,
publicizing sustainability related events, holding employee challenges, and providing information on best practices. CarbonCats
is designed to be an inclusive staff outreach effort which:
• Promotes sustainable behaviour at work and at home
• Educates staff with information and tips on becoming sustainable
• Furthers staff morale and team spirit
• Celebrates TRCA’s corporate sustainability achievements and efforts
CarbonCats uses blog postings, user emails, contests, events, and newsletters in order to achieve these objectives. In 2012,
CarbonCats will continue to focus on engaging staff through the promotion of sustainable ideals and practices. At the same
time, EcoTeams (green teams) at our offices and education centres engage employees at the site specific level.
Vision
• TRCA staff members are champions of sustainability where they work, learn, live and play.
Corporate Goals
• Develop and carry out an annual employee engagement program to facilitate and assist staff involvement in sustainability related activities in all aspects of their lives.
Specific Objectives
• Have 80 staff members participate in Pollution Probe’s Clean Air Commute by 2012.
• Have at least 200 staff members participate in the 20-Minute Makeover by 2012.
• Have EcoSchool/EcoOffice type programs at all work locations by 2012.
TRCA Corporate Social Responsibility Report 2011 11
2.2.1 Where We Are
Summary
TRCA had another great year in 2011 by engaging employees around the core issues of sustainability and continuing efforts
in community outreach. It was the first full year of CarbonCats, the employee outreach program designed to engage staff in
sustainability issues in a fun and interactive way. TRCA had approximately 150 staff members participate in CarbonCats
initiatives this year. Under CarbonCats participating staff calculated their carbon footprint and pledged actions to reduce vehicle
travel at work and at home. The CarbonCat became the recognized symbol of employee engagement at TRCA.
2.2.1.1 Green Commuting
Pollution Probe’s Clean Air Commute is an annual week-long program that encourages employees of participating organizations
to commute to work in sustainable ways. Organized in part by SmartCommute North Toronto and Vaughan (NTV), a
membership-directed NGO of which TRCA is a founding member. The aim of this program is to reduce single occupancy
vehicle travel. TRCA participates with initiatives such as providing free cab rides home in case of emergency, free internet-
based ride matching, and seminars on safe biking and transit use. TRCA continues to reserve four prime parking spaces in its
head office parking lot for registered carpools .
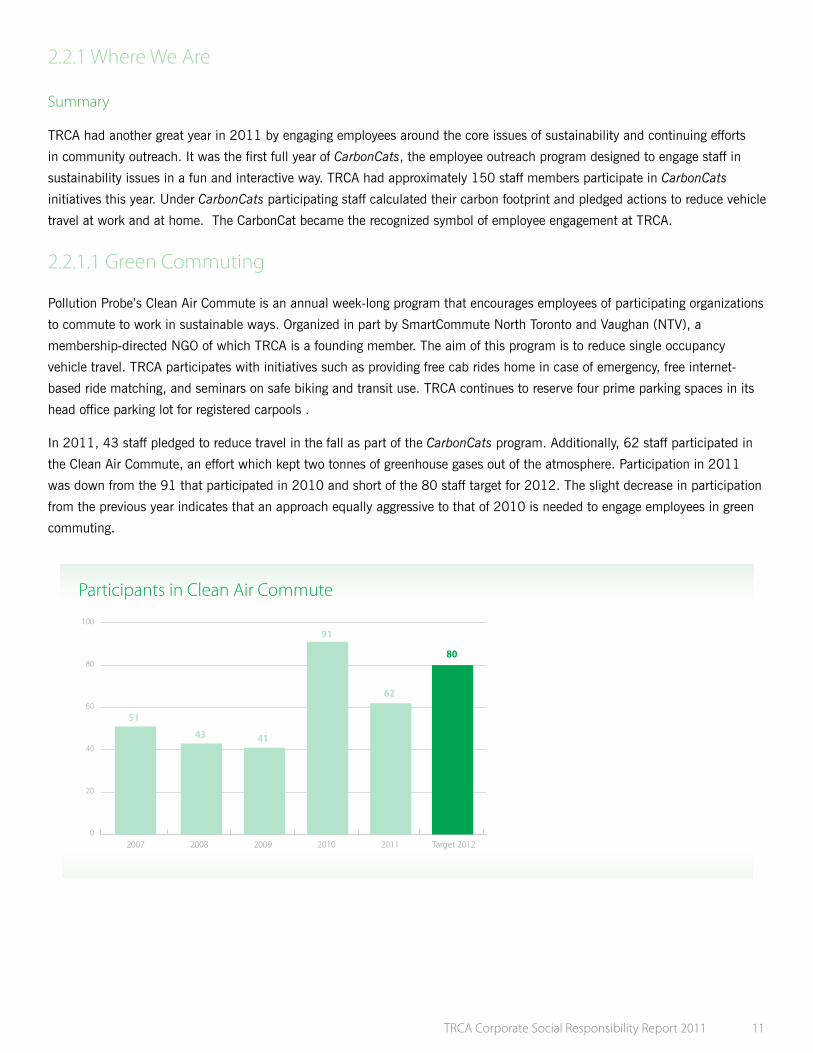
In 2011, 43 staff pledged to reduce travel in the fall as part of the CarbonCats program. Additionally, 62 staff participated in
the Clean Air Commute, an effort which kept two tonnes of greenhouse gases out of the atmosphere. Participation in 2011
was down from the 91 that participated in 2010 and short of the 80 staff target for 2012. The slight decrease in participation
from the previous year indicates that an approach equally aggressive to that of 2010 is needed to engage employees in green
commuting.
Participants in Clean Air Commute
2007 20092008 2010 2011 Target 20120
20
40
60
80
100
51
43 41
91
62
80

12 TRCA Corporate Social Responsibility Report 2011
2.2.1.2 City of Toronto 20-Minute MakeoverThe 20-Minute Makeover is a city-led effort to take 20 minutes out of the workday to clean up litter from around the city’s
businesses each spring. The program encourages participants to collect materials for both garbage and recycling. TRCA has
since expanded its participation in this program to include many of its locations outside the City of Toronto. While TRCA has
been participating in the Makeover since its inception in 2003, accurate participation numbers were only kept for the first time
in 2010.
Participants in 20-Minute Makeover
2010 2011 Target 20120
50
100
150
200
91
68
200
Participation levels dropped somewhat in 2011. The 20 Makeover takes place on a particularly busy time of the year when
many of our staff are out organizing plantings and other community engagement projects. Staff members from our office
EcoTeams have suggested we expand the window of the makeover over the course of the entire week, or at varied times in
the day to allow for more participation. This approach would allow staff members working at project sites or in meetings to
participate when the time permits. Otherwise, the target of 200 staff participants will need to be revisited.
2.2.1.3 EcoTeams
EcoCentres
2011 was the first year of the new EcoCentres provincial sustainability certification program for non-school education facilities,
such as our outdoor education centres. The EcoCentres program is an initiative of TRCA, in conjunction with other partners.
One requirement of EcoCentres is to establish an EcoTeam to oversee facility progress toward certification. In 2011, our three
education field centre’s, Black Creek Pioneer Village, and the Kortright Centre, were each certified among the first ever class of
EcoCentres.
EcoOffices
In 2007, TRCA launched its EcoOffices program (modeled on the Ontario EcoSchools Program) for Boyd Office, Restoration
Services Centre, Head Office and Downsview office. EcoTeams meet regularly to assess office performance and develop and
implement office greening plans. In 2011, each of these four offices was once again certified as a TRCA EcoOffice. See box
for the 2011 achievements of the EcoTeams representing these four offices.

TRCA Corporate Social Responsibility Report 2011 13
2011 EcoOffices EcoTeam Achievements
Head Office
Head Office’s 11 green team members in 2011 accomplished the following:
• Held Lunch and Learn: Sustainable Commuting Options - Smart Commute NTV
• Coordinated staff participation in Car Free Day
• Threw a “Happy Meat” BBQ (Rowe Farms, sustainable meat)
• Held a staff tree planting event for National Tree Day
• Lobbied for and oversaw installation of efficient hand dryers in washrooms (replacing paper towels)
• Planned for new enhanced waste and recyclables centre to be installed in 2012
• Erected EcoTeam/CarbonCat Sustainability board in lunchroom in order to engage staff in sustainability efforts
• Held the first ever Energy Night Out – audit of work spaces after hours for computers, monitors, or other equipment left on
Restoration Services Centre (RSC)/Boyd Office (BFC)
RSC and Boyd Offices 8 green team members in 2011 accomplished the following:
• Had one carpool parking spot designated at BFC & RSC.
• Purchased new coffee machine and grinder and implemented use of free-trade coffee beans at RSC.
• Installed recycling in both RSC & BFC workshop facilities
• Established bulletin board space at BFC to engage staff in sustainability efforts
• Composed and conducted a sustainability survey of office staff
• Stewardship is now using compostable cups for refreshments at their events, and working towards zero waste at our events
• Held EcoTeam BBQ in order to introduce the team, its history, future direction and purpose
• Presented eco tips on car maintenance and energy consumption.
• Began meeting with other TRCA EcoTeams to exchange information and ideas.
• Established process to recycle Tim Hortons cups at RSC.
In Process:
• Began looking into new coffee machine and grinder and possibly free trade coffee beans for BFC.
• BFC waiting on decision on Dyson hand dryers.
• Waiting on tender to go out to contract a green cleaning company at BFC.
• Discussing and trying to organize a communal garden.
• Trying to organize recycling of Tim Horton cups and lids at BFC.

14 TRCA Corporate Social Responsibility Report 2011
Downsview Office
• Threw a “Happy Meat” BBQ (Rowe Farms, sustainable meat)
• Erected EcoTeam/CarbonCat Sustainability board in lunchroom in order to engage staff in sustainability efforts
• Held the first ever Energy Night Out – audit of work spaces after hours for computers, monitors, or other equipment left on
• Enhanced CarbonCats signage for promoting sustainable office practices (e.g. copying double-sided, teleconferencing
• Lobbied for recently enacted 50% reduction in courier trips to head office
• Presented to staff at all staff office event
• Initiated an office greening suggestion program
Staff Profile: Gary’s Garden
Gary Wilkins is passionate about agriculture. “Food is one of
the elements we all need for survival, but too often, in urban
areas, agriculture takes the back seat,” he says. Gary is so
passionate about the issue that he voluntarily took on TRCA’s
urban and near-urban agricultural agenda, in addition to his
regular job as the Humber River Specialist. He says he knew
it was time for him to move into this area when TRCA
adopted Sustainable Communities, as one of its core Living
City tenants.
“Sustainability is more than just natural heritage,” he says.
“You simply can’t have a sustainable community without
local agriculture. The ecological footprint of local agriculture
is smaller, it helps address emissions and climate change
problems, and it is a terrific economic opportunity. It is a sector that will provide many green jobs in the future.”
In the spirit of walking the talk, Gary spearheaded, designed, and implemented a staff community garden at TRCA’s
Downsview Office. “I thought our employees should be given the opportunity to try it out, develop the skills” he says.
“City kids grow up with little connection to food, how it is grown, and where it comes from. By getting our employees
involved we’re helping create a new generation of advocates for urban agriculture.”
Downsview’s garden has been a major success. Now entering its fourth year, the initiative had to overcome some early
growing pains. “You know, it was funny,” Gary says, “that first year, some of our staff had no idea what to do. After I tilled
the land and got things ready, some of them asked, ‘OK, what now?’ ‘Get some seeds and plant them,’ I said.”
Now there is talk of more community gardens at other TRCA locations. Stay tuned.

TRCA Corporate Social Responsibility Report 2011 15
2011 Actions/Achievements
• 5 certified Ontario EcoCentres – first year of program.
• 4 certified EcoOffices.
• Liaised with Ministry of Environment staff on potential for cooperation and joint learning on green office strategies.
• Continued membership and participation on the POSI, a green office consortium program administered through Partners in Project Green.
• Participated in Clean Air Commute.
• Participated in the City of Toronto 20 Minute Makeover.
• Held office clean up days at Head Office and Downsview office – sharing and reuse of unwanted equipment, furniture and materials.
• Continued CarbonCats sustainability employee engagement program.
• Conservation Area staff led installation of bird boxes, planting of aquatic plants and wildflowers, other naturalization efforts.
Staff Profile: Brooke Erickson
Brooke Erickson chairs the Downsview office EcoTeam.
Brooke says she got involved because “TRCA has some gaps
when it comes to sustainability, and I wanted to be part of
the solution.”
Brooke practices sustainability at home as well. She and her
husband have a new child, meaning their focus is securely
on the domestic front. Brooke makes her own green skin
care and cleaning products, she and her husband drive
efficient cars; they use cloth diapers and buy local food and
used products when they can.

16 TRCA Corporate Social Responsibility Report 2011
2.2.2 Where We Are Going
Over the next few years, the primary focus will be to build on the CarbonCats outreach program and to strengthen the
EcoOffice program to provide greater support, at the facility level, for our overall, corporate, CSR goals and objectives.
TRCA’s EcoTeams will be increasingly engaged to focus their attention on the goals and objectives of the TRCA CSR program.
Planned Actions:
2012
• 5 certified Ontario EcoSchools
• 4 certified EcoOffices
• Enhance EcoOffice support and coordination
• Participate in Clean Air Commute
• Participate in the City of Toronto 20 Minute Makeover
• Hold office clean up days at Head Office and Downsview office
• Continue and improve CarbonCats sustainability employee engagement program
• Hold staff led rehabilitation projects at Conservation Areas
• Achieve Audubon certification for CA’s and Kortright.
• Investigate TRCA-wide standards for holding green events – including best practices, information sharing, and promotion.
TRCA’s Green Teams
Members of The Downsview office EcoTeam
Our green teams, called “EcoTeams” are teams
of staff at TRCA’s work locations who supply the
grass roots momentum behind our movement to
sustainable operations.
We have 8 employee-driven Green Teams in place
at TRCA. Five of these teams drive their work
location’s achievement of annual certification
under the EcoCentres, program, a program of
sustainability certification for outdoor education
centres developed by TRCA in partnership with a
number of organizations.
The remaining three EcoTeams pursue annual certification under EcoOffices, a TRCA internal program which focuses on
green objectives at its 4 office locations. Restoration Services Centre and Boyd Office, located within one kilometer of
each other, share one EcoTeam.

TRCA Corporate Social Responsibility Report 2011 17
3.0 Our Environment 3.1 Carbon Footprint Carbon footprint is a measure of an organization’s emissions of greenhouse gases, and, consequently, provides an indication
of its contribution to climate change. It is one very significant measure of an organization’s sustainability. TRCA’s carbon
footprint is calculated from quantitative results reported in the other sections of this report.
Vision
• TRCA operations will have a positive effect on greenhouse gas emissions and thus help mitigate climate change (offset the emissions of others).
Corporate Goals
• TRCA will be carbon neutral by 2025.
• Reduce greenhouse gas emissions by 50% from 2005 levels by 2018.
Specific Objectives
• 70% reduction in carbon footprint at Field Centres, by 2018.
3.1.1 Where We Are
Summary
TRCA’s carbon footprint has decreased by 468 tonnes from 2009, a percentage decrease of 14%. From 2010 to 2011, the
carbon footprint decreased 124 tonnes. This decrease in carbon footprint has been primarily driven by three factors. The first
and most impactful was a dramatic reduction in the amount of waste sent to landfill between 2009 and 2010, and sustained
at the lower level in 2011. The second most important factor was a reduction in facility energy consumption in 2011 over
2010. This may be partially weather related, but is more likely related to a meter failure at one of our facilities. Staff is
investigating and more detailed analysis will be conducted to assess trends. Finally, purchasing green natural gas at Head
Office also reduced the carbon footprint.
Scope of Carbon Accounting in This Report
The globally accepted standardized methodology for reporting on carbon requires an organization to define the “scope” of
its reporting and to reliably collect representative data from across the organization. With the assistance of CarbonCounted,
TRCA has calculated a carbon footprint for 2011 based on the mandatory elements Scopes One and Two, as well as the waste
component of Scope 3 of the International Standards (see box “Carbon Emissions Accounting – How it is Done”). Coolant
loss from cooling systems, as well as the impact from TRCA’s small livestock holdings, while mandatory items for Scopes One
and Two, are not included in our reporting, as coolant-loss from our many facilities are not available, and the impacts of our
modest livestock holdings are expected to be small. As well, it is not yet possible to accurately assign each miscellaneous
fuel purchase (i.e. for small equipment etc.) to either a specific type of fuel or a specific piece of equipment. Therefore,
miscellaneous fuel purchases were assigned to “off-road gasoline vehicles”, which may, in fact, result in a higher carbon output
than would have been the case if specifics were identified.

18 TRCA Corporate Social Responsibility Report 2011
In addition to the mandatory elements in Scope One and Scope Two of the standards, TRCA also calculated the carbon
emissions for one important Scope Three item: waste sent to landfill. Because the amount of waste generated is under our
influence if not under our control, this Scope Three element is included in the overall carbon emissions reported.
Staff Profile: Enrique Guzman
Enrique commutes to work by bicycle almost every day, at
least 9 months a year. He rides over 40 kilometres a day,
keeping fit, and saving approximately one tonne of
greenhouse gas emissions annually.
TRCA Total Corporate Carbon Footprint – Mandatory Factors Plus Scope Three
2009 2010 20110
500
1000
1500
2000
2500
3000
3500
Scope 1 and 2 Carbon Footprint (tonnes CO2 e)
The 18% reduction in our footprint from 2009 to 2011 is explained primarily by a decrease in waste sent to landfill, energy
consumption reductions at TRCA facilities, and new carbon accounting procedures recognizing the consumption of green
electricity and green natural gas.

TRCA Corporate Social Responsibility Report 2011 19
Facilities - 1577 tonnes GHG
Vehicles and Equipment - 698 tonnes GHG
Waste - 606 tonnes GHG
Breakdown of Operational Contributions to 2011 TRCA Total Carbon Footprint
Carbon Emissions Accounting – How it is done!
Scope 1 - Direct GHG emissions: Carbon emissions occurring from sources that are owned or controlled by the company
(e.g. emissions from combustion in owned or controlled boilers, furnaces and vehicles).
Scope 2 - Electricity indirect GHG emissions: Carbon emissions from the generation of purchased electricity consumed by
the company.
Scope 3 - Other indirect GHG emissions: Carbon emissions which are a consequence of a company’s activities, but
occur from sources not owned or controlled by the company (e.g. emissions from waste, the extraction and production of
purchased materials; and employee travel to and from work).
The GHG protocol describes scopes 1 and 2 as mandatory reporting categories, and scope 3 as a voluntary
reporting category.
3.1.2 Where We Are Going
Based on the data, more than half of TRCA’s operational carbon footprint is comprised of facility energy use. In the years to
come, the movement to more energy efficient facilities powered by renewable energy will allow TRCA to approach or meet its
carbon neutral goal.

20 TRCA Corporate Social Responsibility Report 2011
Planned Actions:
2012
Engage TRCA CSR Sustainable facilities working group to improve data collection necessary for more accurate carbon
footprinting at both the corporate and facility levels.
Develop a corporate energy management plan.
3.2 Energy Use Energy consumption at TRCA’s many facilities accounts for the bulk of our greenhouse gas emissions, and consequently, our
carbon footprint. Reducing energy consumption and/or switching to green energy sources is the most important direction we
can take to meet our long term corporate goals of mitigating our impact on climate change. TRCA staff members are heavily
involved in efforts to reduce the energy we consume and the reliance on carbon intensive energy sources. From facilities
managers, to new facility design teams, to EcoTeam members and general staff working at one of our 17 major facilities,
managing energy use and transitioning to more sustainable fuels is a driving focus.
Vision
• TRCA is a net producer of green energy for the community.
Corporate Goals
• TRCA produces renewable energy equivalent to 80% of its total energy consumption by 2025.
• Total energy consumption is reduced by 50% from 2005 levels by 2025.
Specific Objectives
• 50% of TRCA facility space is heated and cooled from renewable sources by 2015.
• Reduce total energy consumption by 30% from 2005 levels by 2015.
• Source 80% of electrical energy from green sources by 2015.

TRCA Corporate Social Responsibility Report 2011 21
3.2.1 Where We Are
Summary
Total TRCA energy use in 2011 was down 6% from our 2005 base year. Over the same period, TRCA staff levels have
increased, attesting to the conservation measures TRCA has taken. In 2011 total facility energy consumption decreased 11%
from 2010. Most of the decrease was in electricity consumption, particularly at one of our facilities. Staff is investigating, but
early indications are that an electricity meter may have partially failed. However, more analysis of individual facilities will be
done in 2012 in order to assess the reasons for these trends.
Total Energy Use
In 2011, electricity accounted for the bulk of TRCA facility energy use (65%), followed by natural gas (24%), heating oil (9%),
and propane (1%)
Electricity - 67%
Natural Gas - 25%
Heating Oil - 9%
TRCA Facility Energy Breakdown, 2011

22 TRCA Corporate Social Responsibility Report 2011
The graph below illustrates the progression of TRCA total energy use (natural gas, oil, electricity) from 2003 to present.
Despite increases of staff and the number of facilities in TRCA’s portfolio, consumption, efficiencies have been attained through
conservation efforts in recent years. However, equipment related factors may have contributed to the reduction in 2011.
The trend line looks promising, particularly in the period from 2008 to present, TRCA will continue its progress towards the
objectives of energy conservation and adoption of renewable energy sources in order to meet its medium and long term goals.
2003
Gigajoules
2005 2007 2009 2011 Target 20150
5000
10000
15000
20000
25000
30000
35000
Target 2015
Existing TRCA Energy Use GJ (excluding renewables)
* The total energy use excludes energy produced from on-site renewable sources such as solar pv at Restoration Service Building and the Kortright Living Machine) but DOES include green electrical energy purchased through Bullfrog Inc.
Total Energy Consumption at TRCA
Another way of illustrating the energy efficiency performance at TRCA is to graph total gigajoules (GJ) of facility energy used
per employee (average number per year). As the graph below shows, this measure has trended downward since 2003.
2003 2005 2007 2009 20110
10
20
30
40
50
60
GJ Energy consumed per employee
Energy Use per Employee over Time
TRCA Corporate Social Responsibility Report 2011 23
Renewable Energy
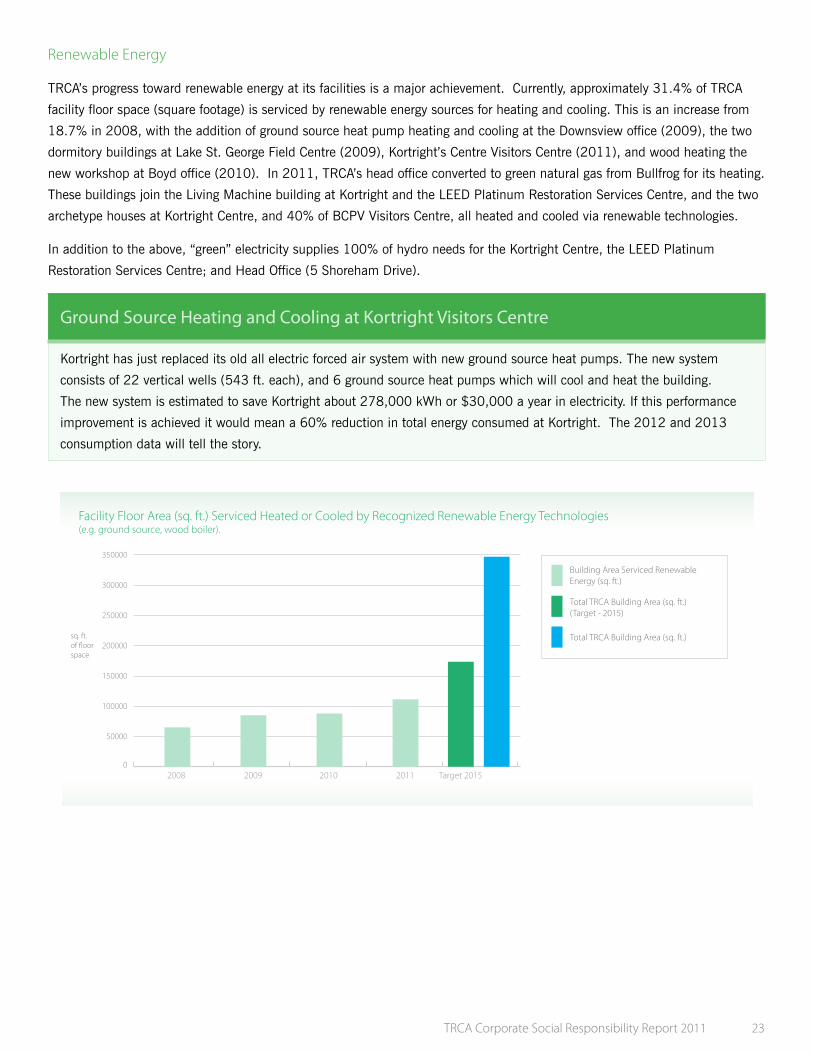
TRCA’s progress toward renewable energy at its facilities is a major achievement. Currently, approximately 31.4% of TRCA
facility floor space (square footage) is serviced by renewable energy sources for heating and cooling. This is an increase from
18.7% in 2008, with the addition of ground source heat pump heating and cooling at the Downsview office (2009), the two
dormitory buildings at Lake St. George Field Centre (2009), Kortright’s Centre Visitors Centre (2011), and wood heating the
new workshop at Boyd office (2010). In 2011, TRCA’s head office converted to green natural gas from Bullfrog for its heating.
These buildings join the Living Machine building at Kortright and the LEED Platinum Restoration Services Centre, and the two
archetype houses at Kortright Centre, and 40% of BCPV Visitors Centre, all heated and cooled via renewable technologies.
In addition to the above, “green” electricity supplies 100% of hydro needs for the Kortright Centre, the LEED Platinum
Restoration Services Centre; and Head Office (5 Shoreham Drive).
Ground Source Heating and Cooling at Kortright Visitors Centre
Kortright has just replaced its old all electric forced air system with new ground source heat pumps. The new system
consists of 22 vertical wells (543 ft. each), and 6 ground source heat pumps which will cool and heat the building.
The new system is estimated to save Kortright about 278,000 kWh or $30,000 a year in electricity. If this performance
improvement is achieved it would mean a 60% reduction in total energy consumed at Kortright. The 2012 and 2013
consumption data will tell the story.
Facility Floor Area (sq. ft.) Serviced Heated or Cooled by Recognized Renewable Energy Technologies(e.g. ground source, wood boiler).
2008 2009 2010 2011 Target 20150
50000
100000
150000
200000
250000
300000
350000
Total TRCA Building Area (sq. ft.)
Total TRCA Building Area (sq. ft.)(Target - 2015)
Building Area Serviced Renewable Energy (sq. ft.)
sq. ft.of �oorspace

24 TRCA Corporate Social Responsibility Report 2011
Electricity Sourcing
TRCA’s objective is to source 80% of its electricity from green sources by 2025. The chart below illustrates the current
breakdown of Bullfrog sourced green electricity and conventional grid electricity in 2011 (column one) and shows what 80%
would look like in 2025 at the targeted level of electricity consumption (50% of 2005 baseline).
2011 Target 20250
1000000
2000000
3000000
4000000
5000000
Eletricity kwhs
Conventional Electricity
Green Electricity
Proportion of TRCA Electricity Consumption from Green Sources
The Target 2025 column shows TRCA’s total electricity consumption reduced at the same time as the proportion of green
sourced electricity is raised to 80%.

TRCA Corporate Social Responsibility Report 2011 25
2011 Actions/Achievements
• Launched TRCA’ Facility Sustainability Working Group.
• Initiated LEED Existing Buildings survey at Black Creek Pioneer Village.
• Conducted energy audit for Lake St. George Field Centre, Indian Line Camp Ground and Albion Hills Field Centre.
• Conducted lighting audit at Black Creek Pioneer Village and prepared plans for retrofit in 2011.
• Student-led study on Restoration Services Centre energy efficiency and performance determines RSC is one of a few LEED buildings operating as designed.
• Installed new biomass boiler in new Boyd Office workshop.
• Kortright energy retrofit design prepared.
• Energy Star printers at Boyd Office.
• 2 Navien Tankless hot water heaters at Chalet building at Albion Hills Conservation Area.
• Install 2, 92% high-efficiency propane furnaces in buildings at Albion Hills Conservation Area.
• 2 Navien Tankless hot water heaters at washroom facility at Indian Line.
• Install a 92% high-efficiency propane furnace at Indian Line.
• Install solar thermal panel at Indian Line for preheating hot water tanks.
• Installed energy star rated window at Albion Hills CA.
• High efficiency hand dryers installed at Albion Hills CA and Head Office.
• Energy Audit conducted for Albion Hills CA and Indian Line.
• Solar tubes lighting installed at Claremont FC.
• Smart meter with a pulse to a data logger installed at Claremont for great water consumption monitoring and control.
• Replaced 15 T-12 light fixtures with T-8’s at Heart Lake CA.
• Replaced 4 standard light switches with motion detector switches at Heart Lake CA.
• Replaced 6 outdoor standard lighting units with photocell and time controlled units at Heart Lake CA.
• Switched to Bullfrog natural gas at Head Office.
• Joined CivicAction`s Race to Reduce for Commercial Buildings.

26 TRCA Corporate Social Responsibility Report 2011
3.2.2 Where We Are Going
TRCA’s sustainable energy goals will be met with a combination of conservation and a move to renewables. In order to plan
for this, TRCA will develop corporate Energy Management Plan to guide further retrofits, identify expectations for new facilities
and conversions to renewable energy. Purchase of green electricity is an interim step along our path to the production of our
own electricity from renewable sources.
Planned Actions:
2012
• Develop the corporate energy management plan.
• Lighting retrofit at Black Creek Pioneer Village.
• Lighting retrofit at Lake St. George Field Centre.
• Energy Audits for all major TRCA facilities.
• Re-insulating walls and replacement of windows in Albion Hills workshop.
• Solar panels to be installed at the Cabin Extension at Glen Haffy CA.
• 2 new energy star rated AC units to replace old units at Albion Hills CA.
• Enact recommendations from 2011 Energy Audits at Albion Hills CA and Indian Line.
• High efficiency heating at Poplar/Humber washroom facilities, Indian Line.
• Investigate solar power installation at three Field Centres.
• Enact third phase of retrofit - insulation of entire building, windows upgrade.
• LED installations at Claremont FC.
• Install real time display of energy and water consumption for student education and facility management purposes at Claremont FC.
• Kortright Visitor’s Centre retrofits – re-skinning of main building, upgraded insulation, window installation, new roof with rain water collection.
• Conduct weather normalized energy trend analyses for large, applicable facilities.
• Investigate geothermal heating and cooling for Davies building at Lake St. George FC.
TRCA Corporate Social Responsibility Report 2011 27
3.3 Water Use In Canada we host 6% of the world`s fresh water but 60% of that water drains north away from most of the population
and agriculture. Per capita Canadian use is 335L per day, second only to the United States. With climate change and
population growth sending society toward a global water crisis, conservation and rethinking how we use water are central to
TRCA`s sustainability.
Vision
• TRCA operations and facilities are models for managing potable water and stormwater runoff.
Corporate Goals
• Minimum 15mm of storm water controlled at source at all TRCA facilities.
• Reduce total potable water consumption from 2009 levels by 35% by 2025.
Specific Objectives
• Reduce water consumption at corporate offices (Downsview, Head Office, and Boyd) Kortright and Black Creek Pioneer Village 25% from 2011 levels by 2017.
3.3.1 Where We Are
Since 2007, when a number of TRCA facilities switched from well to municipal water, TRCA’s water use has varied between
43,000 m3 and 61,000 m3 annually. This range would have been narrower were it not for a large water leak at Albion Hills
in 2009. Petticoat Creek pool, traditionally, a consumer of 30 to 40% of TRCA’s municipal water use, was not operational in
2010 or 2011, but at the same time the pool at Albion Hills became active, effectively offsetting any potential reduction in
water use at Petticoat Creek. With both pools expected to be operational in 2012 we are likely to see an overall increase in
water use.

28 TRCA Corporate Social Responsibility Report 2011
Total TRCA Water Consumption from Municipal Systems
2006 20082007 2009 2010 2011 Target0
10000
20000
30000
40000
50000
60000
70000
80000
Target
Municipal Water Use - TRCA Total Cubic metres
Cubicmetres
* See Appendix for explanation of changes to water sourcing at TRCA.
In addition, two more facilities are included in the municipal water usage for 2011, Boyd Conservation Area, and
Earth Rangers.
Due to significant changes in water usage and metering, the actual impact of TRCA’s water conservation efforts are difficult to
assess. In the next few years the trend should come into better focus.
TRCA’s many water conservation efforts over the years have been directed at its offices (low flow toilets, sensor taps, etc.) and
thus are overshadowed by large water consumption from pools and splash pads and the addition of facilities.
2011 Actions/Achievements
• Completed design of new sustainable pool at Petticoat Creek to replace the old pool.
• Replaced 5 standard top load washing machines with low flow at Albion Hills CA.
• Water meter with data-logger installed at Claremont.
• Touchless sensor water taps installed in Head Office bathrooms.
• Replaced 6 standard sink faucets with low flow metered faucets (motion activated) at Heart Lake CA.
• Replaced 10 toilets and urinals with low units equipped with flush-o-meters at Heart Lake CA.

TRCA Corporate Social Responsibility Report 2011 29
3.4.2 Where We Are Going
Planned Actions:
2012
• Completion of new Petticoat Creek Aquatic Facility – a sustainable pool (see box, next page)
• Determine metrics for measuring and reporting on TRCA stormwater practices at its facilities
• Water use will be addressed as part of the energy management plan
Petticoat Creek Conservation Area Aquatic Facility
In 2012, a new sustainable pool will open at TRCA’s Petticoat Creek Conservation Area. Some of the features of the pool are as follows:
• Fully accessible;
• 6 feet deep, over 1600m2 (510m2 deep area and 1,090 m2 shallow area) concrete pool with beach entry;
• State of the art vacuum DE filtration system with skimmers and recycled backwash waters;
• Main pool and 3 splash pads with closed loop water conservation system;
• Large splash pad with water conservation recycling system;
• Energy star equipment where ever possible;
• Large seating, picnicking, and viewing areas;
• Barrier-free, 1,500 sq. ft. adjacent pool complex facility featuring low flow toilets, faucets, motion occupancy and T8 lighting.

30 TRCA Corporate Social Responsibility Report 2011
Staff Profile: Carey Gurden
Carey Gurden takes a cool, relaxed, but “greenly-serious”
approach to Claremont’s sustainability. Here, he kicks back
under a few of Claremont’s new green walls.
3.4 Vehicles, Fuel and Travel Fleet use is the second biggest contributor to our carbon footprint behind facility energy use.
Vision
• TRCA’s transportation needs will be met by sustainable electric and biofuel based-vehicles.
Corporate Goals
• TRCA’s fleet will achieve an average of 12 litres per 100 kilometres fuel efficiency by 2018.
• TRCA’s fleet sustainability will continue to lead other agencies based on external independent audit.
• Reduce TRCA greenhouse gas emissions from fleet and travel by 50% from 2009 levels by 2018
Specific Objectives
• TRCA’s fleet will be 50% alternative fuel vehicles by 2020.

TRCA Corporate Social Responsibility Report 2011 31
3.4.1 Where We Are
Summary
TRCA employees continue to consume more fuel and drive more kilometres on business each year, most of which is explained
by organizational growth. TRCA staff drove approximately 40,000 more kilometres in 2011 over 2010. Fleet fuel efficiency
was essentially unchanged.
TRCA promotes transit use when on TRCA business and makes transit tokens available at each main office.
Kilometres driven by employees
2003 2008 2009 2010 2011500000
1000000
1500000
2000000
Kilometers Driven
kilometres
* In 2003, TRCA had 495 employees * In 2011, TRCA had 736 employees
Since 2003, TRCA’s staffing level has increased from 495 to 736. The following graph shows the kilometers driven per
employee, and the slight decrease since 2009.
Kilometres driven per employee
2003 2008 2009 2010 20111500
2000
2500
Kilometers Driven
kilometres
* In 2003, TRCA had 495 employees * In 2011, TRCA had 736 femployees

32 TRCA Corporate Social Responsibility Report 2011
TRCA’s continues its commitment to right-sizing vehicles for their intended usage as part of its Green Fleet Strategy, and
increasing the number of hybrids and alternative-fuel vehicles it owns. In 2011, 12% of TRCA’s fleet vehicles were alternative-
fuel powered (all hybrids).
TRCA Fleet Fuel E�ciency Since 2003
2003 2005 2007 2009 2011 Target 20180
5
10
15
20
Targeted E�ciency
Average Fleet Fuel E�ciency - litres/100 km
Litres/100 km
To date, the addition of efficient and/or alternative-fuel vehicles has not significantly impacted the overall fuel efficiency of the
fleet. Since 2003, fleet fuel efficiency has fluctuated between 16.1 litres/100km and 17.7 litres/100km (17.1 in 2011).
However, over time it is expected that alternative fuel vehicles, such as electric vehicles, will be acquired more aggressively
where they can be shown to perform as required. Over time, this will improve our average vehicle efficiency and thus reduce
carbon emissions.
TRCA Fleet Fuel E�ciency Since 2003
2003 2005 2007 2009 2011 Target 20180
5
10
15
20
Targeted E�ciency
Average Fleet Fuel E�ciency - litres/100 km
Litres/100 km
* See Appendix for explanation of changes to water sourcing at TRCA.

TRCA Corporate Social Responsibility Report 2011 33
It will take time for cost effective green fuels and low carbon vehicles to become readily available in the marketplace. TRCA’s
GreenFleet Strategy, to be modified to more aggressively pursue alternative fuel vehicles, will be the primary mechanism for
making this transition, improving efficiencies, and ultimately, reducing absolute amounts of fossil fuels consumed.
2011 Actions/Achievements
• Establishment of designated car pool slots at Boyd Office, Restoration Services office, and Head Office.
• Completed study of 5 TRCA vehicles to determine feasibility of replacing them with electric cars (see box this page).
• Initiated use of non-corn-based biodiesel at Claremont Field Centre.
3.4.2 Where We Are Going
Planned Actions:
2012
• Research options for replacing or retrofitting equipment powered by two-stroke engines (e.g. weed whackers, chains saws).
• Implement video conferencing room at Downsview office.
• Purchase web meeting and training software.
• Develop method of calculating baseline work-related transit use at TRCA.
• Prepare report on best practices on Green Fleet and Green Commuting in Canada.
• Continue feasibility study for acquiring electric vehicles.
34 TRCA Corporate Social Responsibility Report 2011
3.5 Land Management As one of the largest land holders in Ontario (and the largest in the GTA), TRCA’s stewardship of its land holdings is a crucial
component of its sustainable operations.
Vision
• TRCA will protect, conserve and manage its properties within an ecosystem framework, and in consultation with the local community. This will ensure that our watersheds are healthy, enjoyed by the public, and are managed in environmentally sustainable ways.
Corporate Goals
• Complete baseline land management plans for 14 major TRCA properties.
3.5.1 Where We Are
Summary
TRCA remains on schedule to complete its Conservation Land Planning process, and continues to ensure that all land acquired
is free of contamination through environmental site assessments.
Land Planning
TRCA has committed to inventory and evaluate existing public uses, environmental conditions and property management
issues, in order to determine appropriate management actions that will ensure long term environmental protection and
enhanced nature-based recreation and public use of our lands. Land Management Plans are developed to ensure public
safety and appropriate use. Finally, property management issues are addressed and appropriate actions identified through this
planning process.
Land Management Plans define specific management zones for each property within which a certain type of activity may be
undertaken. Detailed site management, trail and environmental restoration plans are included along with design guidelines,
user impact analysis and implementation strategies. The plans are developed in consultation with the community, ensuring
appropriate public participation in the development and implementation of the plans. It is recommended that Management
Plans be updated every eight to ten years. At the end of 2011, management plans had been completed for eight properties,
with plans in development for five more. There is also key plan implementation work that is ongoing for the properties which
have completed plans. Below is a site-by-site summary of our progress in 2011.

TRCA Corporate Social Responsibility Report 2011 35
Status of Land Management Plans and Master Plans for TRCA Lands
Conservation Areas
Albion Hills Albion Hills Master Plan, starts September, 2012
Boyd Boyd Master Plan, incomplete
Bruce’s Mill Bruce’s Mill Master Plan, completed, 2011
Glen Haffy Humber Headwaters Management Plan, incomplete
Heart Lake Heart Lake Master Plan, completed
Indian Line Claireville Management Plan Update, completed, June 2011
Petticoat Creek Petticoat Creek Master Plan, incomplete
Offices
Boyd Boyd North and Glassco Park Management Plan, completed
Earth Rangers Boyd North and Glassco Park Management Plan, completed
Restoration Services Centre Boyd North and Glassco Park Management Plan, completed
Education
Albion Hills Albion Hills Master Plan, starts September 2012
Claremont East Duffins Creek Headwaters Management Plan, starts September 2012
Kortright Boyd North and Glassco Park Management Plan, completed
Other
Bathurst Glen Golf Course Oak Ridges Corridor Management Plan, completed
2011 Actions/Achievements
• Continued pursuit of Audubon certification at Conservation Areas.
• Continued land acquisition environmental assessments, ensuring acquired lands are free of contamination.
• Completed Land Management Plans for Bruce’s Mill.
• Completed Claireville Master Plan Update.
• Bathurst Glen Golf Course reduced inputs of Class 9 Pest Control Active Ingredients by 40% as compared to 2010.

36 TRCA Corporate Social Responsibility Report 2011
Land Management at Conservation Areas and Bathurst Glenn Golf Course
In 2011, TRCA continued the process for its Conservation Areas to become certified Audubon Cooperative Sanctuary
(ACSP). The ACSP is an education and certification program that helps organizations and businesses protect the
environment while enhancing their bottom line. The program offers information and guidance to help participants
implement an environmental management plan that improves efficiency, conserves resources, and promotes conservation
efforts. Audubon International awards certification to publicly recognize and reward the environmental achievements and
leadership of ACSP members.
Bathurst Glen Golf Course achieved the status of certified ACSP in 2010. Our Conservation Areas are on track for
certification in 2012.
3.5.2 Where We Are Going
Planned Actions:
2012
• Commence Albion Hills Master Plan
• Commence East Duffins Creek Headwaters Management Plan
• Achieve Audubon certification for Conservation Areas
• Indian Line shoreline Culvert mitigation
Duffins - Carruthers watershed lands

TRCA Corporate Social Responsibility Report 2011 37
3.6 Waste Management The sustainable management of waste is a central area of concern for TRCA’s Corporate Social Responsibility program,
and an area of active participation for our staff. Waste to landfill accounts for between 20 and 30% of our total carbon
footprint annually.
Vision
• TRCA minimizes the amount of waste from operations and treats what waste it does generate as a resource.
Corporate Goals
• Diverting 80% of total waste at all TRCA facilities by 2018.
Specific Objectives
• 80% reduction in waste at educational field centres by 2018.
• Reduce landfill waste stream originating from Parks and Culture Facilities by 80% by 2018.
• Increase staff and visitor awareness and participation in Recycling Program.
• Be certified members Recycling Council of Ontario and Audubon International by 2012 for all Parks and Culture Facilities.
3.6.1 Where We Are
Summary
TRCA diverted 40% in 2007, 41% in 2008, 22% in 2009, and 21% in 2010, and 21% in 2011. TRCA continues to struggle
with unreliable data from haulers, and, consequently will include an internal auditing process in 2012 in order to check the
hauler data.
Analysis of Waste and Data Issues
According to reports provided by TRCA’s contracted waste hauler companies, TRCA generated 579 tonnes of waste in 2009
from its 17 sites/facilities. In 2010, the mass of total waste reported by haulers was 442 tonnes. In 2011, the total mass of
waste reported by haulers was 470 tonnes.
The actual 2011 diversion rate is likely more than the reported 19%, as not all diverted waste data is available. For example,
recyclables going to municipally run systems, or organics dealt with at TRCA sites (e.g. composted materials) are not contained
in the 19%. Moving to an internal auditing process will also allow TRCA to estimate the mass of all waste streams, and arrive
at more accurate diversion numbers.

38 TRCA Corporate Social Responsibility Report 2011
Recycled materials, tonnes
Waste to Land�ll, tonnes
Breakdown of Waste and Recyclables - tonnes, 2011
379tonnes
91tonnes
20082007 2009 2010 2011 Target 20120
10
20
30
40
50
60
70
80
Target
Diversion Rate (%)
%
Waste Diversion Performance at TRCA (all 17 sites)
TRCA Corporate Social Responsibility Report 2011 39
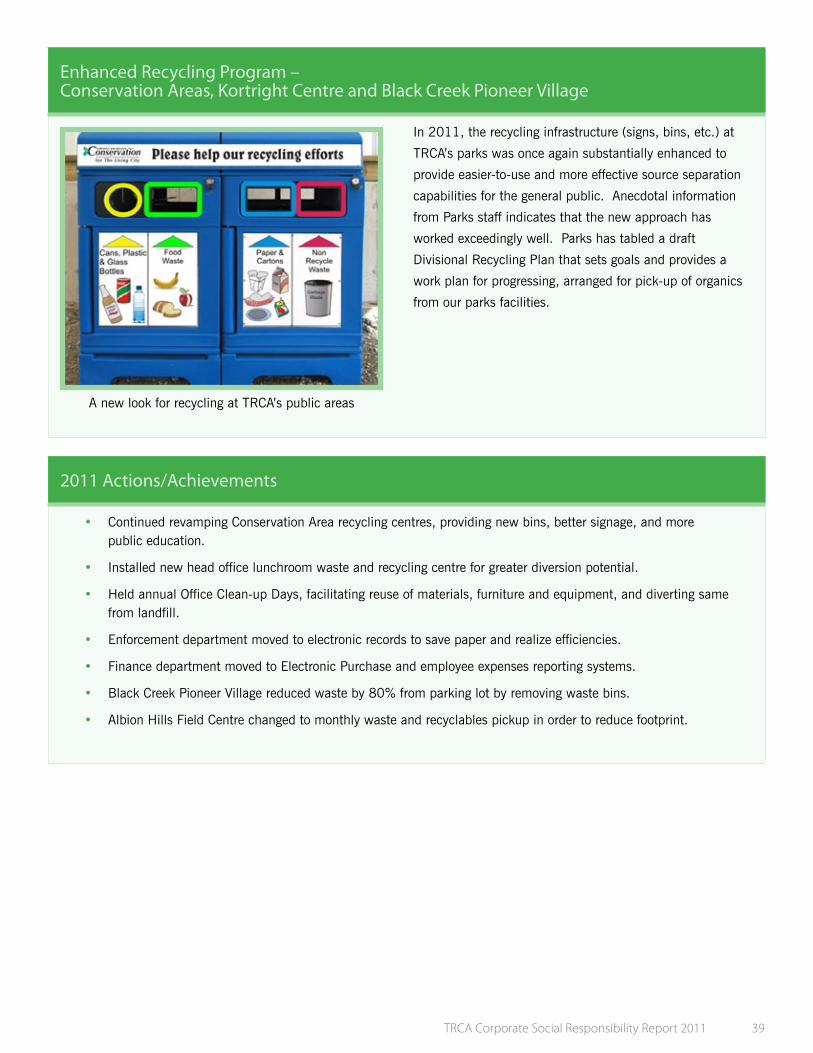
Enhanced Recycling Program – Conservation Areas, Kortright Centre and Black Creek Pioneer Village
In 2011, the recycling infrastructure (signs, bins, etc.) at
TRCA’s parks was once again substantially enhanced to
provide easier-to-use and more effective source separation
capabilities for the general public. Anecdotal information
from Parks staff indicates that the new approach has
worked exceedingly well. Parks has tabled a draft
Divisional Recycling Plan that sets goals and provides a
work plan for progressing, arranged for pick-up of organics
from our parks facilities.
2011 Actions/Achievements
• Continued revamping Conservation Area recycling centres, providing new bins, better signage, and more public education.
• Installed new head office lunchroom waste and recycling centre for greater diversion potential.
• Held annual Office Clean-up Days, facilitating reuse of materials, furniture and equipment, and diverting same from landfill.
• Enforcement department moved to electronic records to save paper and realize efficiencies.
• Finance department moved to Electronic Purchase and employee expenses reporting systems.
• Black Creek Pioneer Village reduced waste by 80% from parking lot by removing waste bins.
• Albion Hills Field Centre changed to monthly waste and recyclables pickup in order to reduce footprint.
A new look for recycling at TRCA’s public areas
40 TRCA Corporate Social Responsibility Report 2011
3.6.2 Where We Are Going
Planned Actions:
2012
• Enact internal waste auditing for waste volumes and diversion rates for all TRCA sites.
• Establish new waste baseline performance, and set new Goals and Objectives.
• Prepare a corporate waste management plan.
• Continue revamping Conservation Area recycling centres, providing new bins, better signage, and more public education. 1 outdoor 4 stream recycling receptacle set in place to further enhance recycling efforts at Albion Hills Conservation Area.
• Investigate paper towel recycling at Head Office.

TRCA Corporate Social Responsibility Report 2011 41
4.0 Our Business In 2011 TRCA has included a section on business in the CSR report. Although only funding and procurement are addressed,
this section will be expanded in future years.
4.1 Sustainable Business Practice TRCA is committed to pursuing continuous improvement in the development and delivery of all programs through creative
partnerships, diverse funding sources, and careful auditing of outcomes.
Vision
• TRCA is a leader in the transparency, efficiency and effectiveness of its business practices among government agencies.
Specific Objectives
• Efficient and effective use of government funding – At least 50% of funding from non core-municipal sources.
• Resiliency in program delivery through diverse funding sources.
• Equitable and supportive employee relations.
4.1.1 Where We Are
TRCA strives to leverage the funding it receives from its 4 main sources; Toronto, Peel, York and Durham, with revenue from
products and services it supplies to the market. For the past 4 years core government funding made up less than half at
TRCA`s revenue.
Through a diverse client base TRCA is able to bring a level of resilience to the funding for the programming it provides.

42 TRCA Corporate Social Responsibility Report 2011
2006 2007 20112010200920080
20
40
60
80
100
% of revenue from other sources
% of revenue from core municipal Sources
TRCA revenue sources since 2006
Employee relations is another indicator of TRCA business practice and the annual staff survey, presented in Our People, Section
2.0 of this report, contains a number of measures reflecting the view of TRCA by its staff. Contented, hardworking, dedicated
staff are an indicator of an efficiently run agency. As discussed in Section 2.0, in 2011 TRCA achieved its goals with respect
to low turnover rates, and employee opinions of the value of their work and whether or not they would recommend TRCA to
others as a good place to work. The staff survey also indicates that, while most measures are performing well, a number of
objectives are not yet met.
4.1.2 Where We Are Going
Planned Actions:
2012
• Develop and refine goals, objectives, and metrics for measuring TRCA Business Practice
• Complete first draft of TRCA Strategic Plan – including greater levels of input from all staff
• Develop a TRCA Partnership map, identifying all TRCA partnership relationships across all TRCA offerings
4.2 Green Purchasing The goods and services an organization purchases directly impact the local and global environment in two ways. Firstly, goods
and services have different ecological footprints associated with their life cycles and consequently, buying the more sustainable
offerings reduces our own corporate footprint. Secondly, the simple act of directing our dollars from unsustainable companies/
suppliers to sustainable ones helps to support and broaden the sustainability ethic in the greater economy.

TRCA Corporate Social Responsibility Report 2011 43
Vision
• TRCA procures all the products it consumes and services it hires from environmentally and socially responsible sources.
Corporate Goals
• 40% of food purchased by TRCA is sourced locally by 2012.
Specific Objectives
• Establish facility/area/operation specific objectives by 2013.
• Determine methodology for assessing performance (and, consequently, setting additional, quantifiable corporate goals) by 2012.
4.2.1 Where We Are
Summary
TRCA continues to pursue responsible, “green” procurement of products and services through both its Corporate Procurement
Policy and its Mandatory Green Procurement List (see next page).
Procurement Practices
From the early years of the CSR Program, TRCA senior management has recognized the importance of procuring sustainable
products and services as a method of both supporting ethical businesses and helping change the fundamentals of our
unsustainable economy. The result of this commitment was the TRCA list of Mandatory Green Product and Service List, which
has been in use since 2003, with various additions and modifications.
44 TRCA Corporate Social Responsibility Report 2011
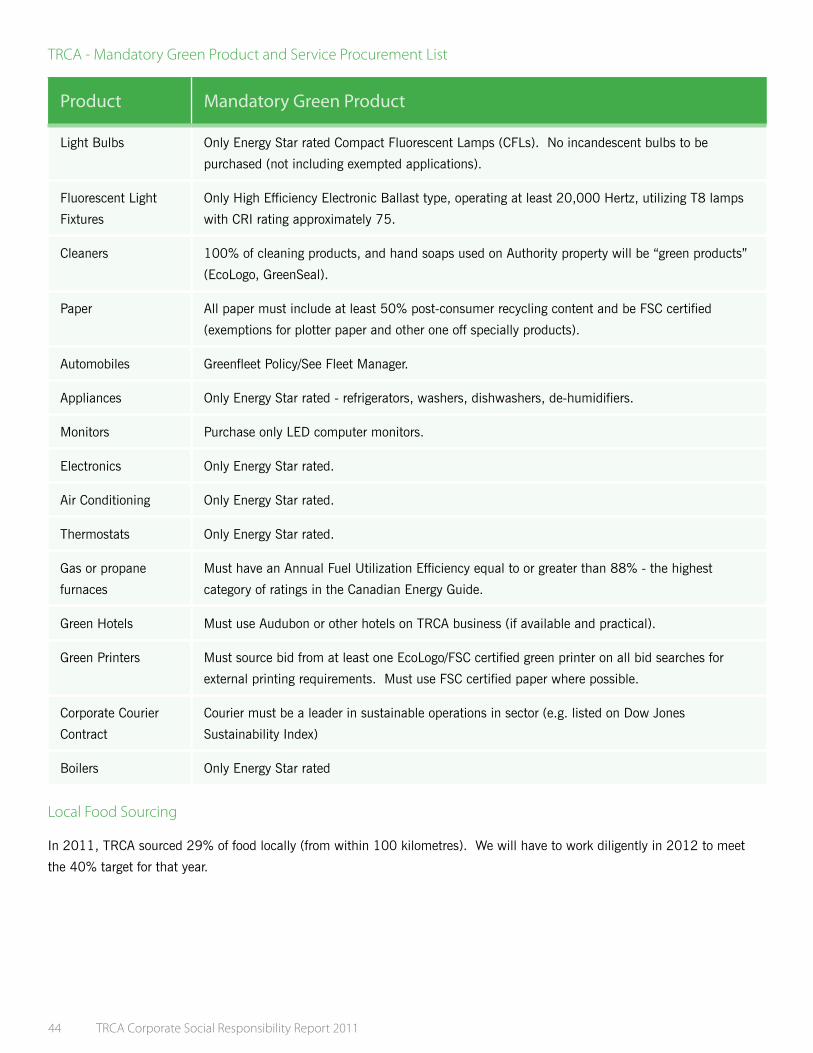
TRCA - Mandatory Green Product and Service Procurement List
Product Mandatory Green Product
Light Bulbs Only Energy Star rated Compact Fluorescent Lamps (CFLs). No incandescent bulbs to be
purchased (not including exempted applications).
Fluorescent Light
Fixtures
Only High Efficiency Electronic Ballast type, operating at least 20,000 Hertz, utilizing T8 lamps
with CRI rating approximately 75.
Cleaners 100% of cleaning products, and hand soaps used on Authority property will be “green products”
(EcoLogo, GreenSeal).
Paper All paper must include at least 50% post-consumer recycling content and be FSC certified
(exemptions for plotter paper and other one off specially products).
Automobiles Greenfleet Policy/See Fleet Manager.
Appliances Only Energy Star rated - refrigerators, washers, dishwashers, de-humidifiers.
Monitors Purchase only LED computer monitors.
Electronics Only Energy Star rated.
Air Conditioning Only Energy Star rated.
Thermostats Only Energy Star rated.
Gas or propane
furnaces
Must have an Annual Fuel Utilization Efficiency equal to or greater than 88% - the highest
category of ratings in the Canadian Energy Guide.
Green Hotels Must use Audubon or other hotels on TRCA business (if available and practical).
Green Printers Must source bid from at least one EcoLogo/FSC certified green printer on all bid searches for
external printing requirements. Must use FSC certified paper where possible.
Corporate Courier
Contract
Courier must be a leader in sustainable operations in sector (e.g. listed on Dow Jones
Sustainability Index)
Boilers Only Energy Star rated
Local Food Sourcing
In 2011, TRCA sourced 29% of food locally (from within 100 kilometres). We will have to work diligently in 2012 to meet
the 40% target for that year.

TRCA Corporate Social Responsibility Report 2011 45
2011 Actions/Achievements
• Completed new green cleaning standard operating procedures for TRCA facilities.
• Kortright converted to green office supplies.
• Education Centres adopted standard operating procedures for purchase and lifecycle use of carpeting.
Staff Profile: Jennifer Taves
Jennifer chooses fresh, local, organic food, delivered directly
to the TRCA office by a local farmer.
4.2.2 Where We Are Going
Planned Actions:
2012
• Carry out green procurement training for staff.
• Transition cleaning practices to meet new green cleaning SOP’s.
• Develop a green procurement policy.
• Investigate additional goals, objectives, and performance metrics for Green Procurement.

46 TRCA Corporate Social Responsibility Report 2011
5.0 Our Community5.1 Our Community – SocialTRCA’s external business delivery strives to impact the broader community’s progress toward sustainability and the realization
of the Living City vision. Traditionally, TRCA’s work has concentrated on environmental conservation. In the past decade,
in recognition of what Bob Willard calls the “three legged stool” model of sustainability, TRCA’s outreach activities have
broadened to include social and economic outreach into our communities. In short, a sustainable environment cannot exist
without sustainable social and economic systems. The Living City is one where all three elements of sustainability are healthy.
Vision
• TRCA adds social value to the community.
Specific Objectives
Employment programs for internationally trained professionals (PAIE and M2P)
• 435 applications received by end of 2014
• 170 participants accessing programs by end of 2014
• 150 participants complete program by end of 2014
• 133 participants gain employment by end of 2014
• 55 participants receive credential for licensure by end of 2014
• Have 100% of mentees matched to mentor by the end of 2014
• 50% of mentors to be from TRCA staff by the end of 2014
EVN Program
• 900 new registrants by end of 2014
• 625 volunteer passes issued by end of 2014
• 900 external volunteer opportunities posted on EVN by end of 2014

TRCA Corporate Social Responsibility Report 2011 47
5.1.1 Where We Are
TRCA’s Social Development Programs
TRCA operates a number of innovative and some award winning programs designed to assist the social development of the
community in which it operates. This work is not traditionally done by Conservation Authorities. Catherine MacEwen, TRCA’s
Director of Human Resources and Marketing, explains why TRCA got involved in this area:
“Sustainability is the core driver of our Living City vision. About nine years ago we recognized that while
our focus on environmental sustainability was our traditional area, we needed to reinvigorate our approach
to social sustainability. We quickly recognized that the opportunity to help new Canadians gather work
experience and, eventually, find work in their fields, was an under-served area, and an area in which we were
uniquely capable of acting. The GTA is the most diverse region in Canada, yet this diversity was not reflected
in the environmental field.”
TRCA’s three Social Development Programs are the result of this early understanding. These programs achieve many positive
outcomes simultaneously. They help new Canadians gain access to meaningful experience and networking opportunities,
increase the pool of planning, geotech and engineering professionals in the GTA, and allow TRCA staff and program
participants to collaborate and share ideas and best practices pertaining to sustainability.
PAIE and M2P
Professional Access and Integration Enhancement (PAIE)
PAIE is a unique program developed and led by TRCA in collaboration with Professional Engineers Ontario, the Association
of Professional Geoscientists of Ontario and funded by the Government of Canada and Ontario. PAIE launches the careers
of highly qualified professional candidates with international training and experience by linking them with employers to
fulfill hiring needs in the environmental sector, while helping them to obtain valuable Canadian experience and obtain a
professional license as a P.Eng. or P.Geo.
Mentoring to Placement for Environmental Professionals (M2P)
Led by TRCA, the M2P Program is designed to connect employers and highly skilled environmental professionals with
international training and experience in:
• Green building / energy
• Planning: environmental, urban, community
• Ecology
M2P is an Ontario bridge training program designed to empower participants with increased understanding of and
exposure to the environmental industry and experts in the field with the goal of finding employment in a highly specialized
and competitive sector. Clients in the program access individual employment counseling, soft and technical skills
workshops, a mentor in their field and a work experience opportunity. M2P provides employers with suitable, effective and
streamlined hiring solutions while accessing highly qualified candidates to fill their employment needs.

48 TRCA Corporate Social Responsibility Report 2011
Environmental Volunteer Network (EVN)
EVN is a TRCA program which facilitates volunteer opportunities for individuals interested in the environment,
connecting the diverse residents of TRCA’s jurisdiction with hands-on volunteer opportunities and education in the field of
conservation. At no cost, EVN offers all employers an opportunity to post volunteer positions and select from an extensive
network of qualified and interested volunteers who are eager and ready to make a contribution in your organization. For
more information about EVN go to www.trca.on.ca and click on Volunteer.
2011 Social Development Program Scorecard
Program Goal or Objective 2011 Performance/Status
Target
Employment programs
for internationally trained
professionals (PAIE and M2P)
# Applicants 647 435 applications received
by end of 2014
# Participants accessing
programs
97 170 participants accessing
programs by end of 2014
# Participants completing
program
35 150 participants complete
program by end of 2014
# Participants obtaining
employment in professional field
64 133 participants gain
employment by end of 2014
# Participants obtaining
licensure/Certification/Credential
for Employment
29 55 participants receive
credential for licensure by
end of 2014
# M2P Participants (mentees)
matched to a Mentor in their
field
100% 100 % M2P participants
matched to mentor in field
by end of 2014
% M2P Mentors from
community at large
50% 50% mentors recruited from
community at large for M2P
program by end of 2014
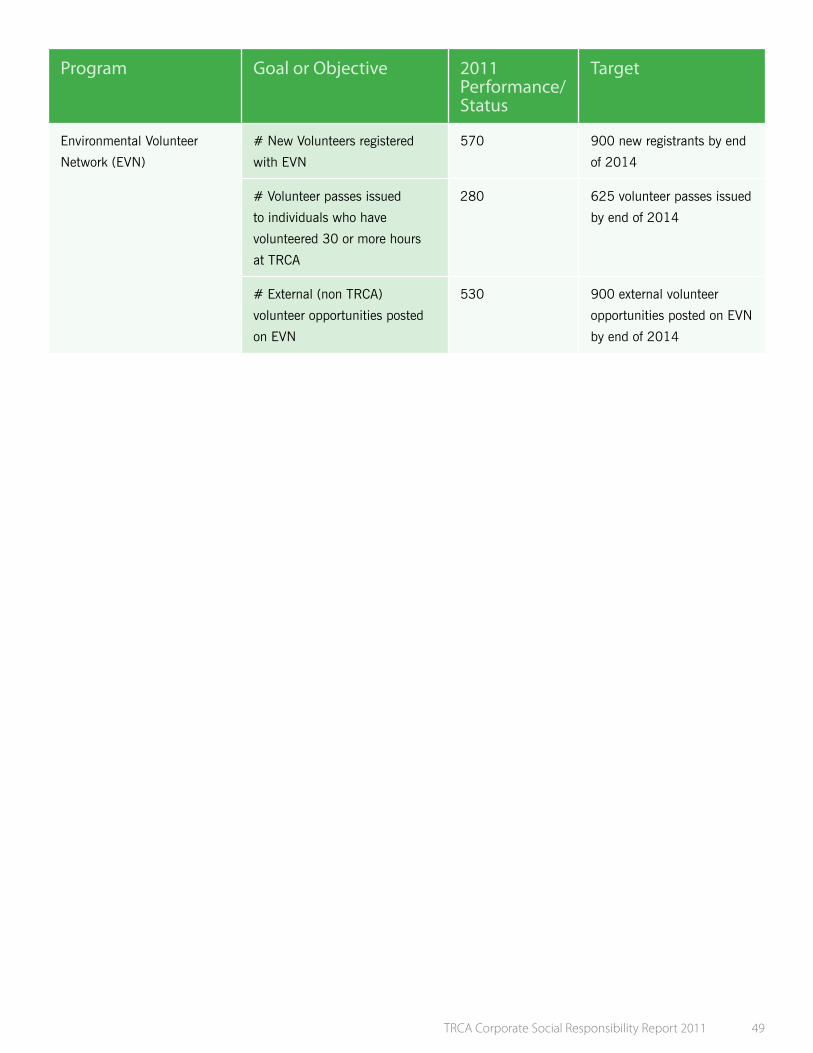
TRCA Corporate Social Responsibility Report 2011 49
Program Goal or Objective 2011 Performance/Status
Target
Environmental Volunteer
Network (EVN)
# New Volunteers registered
with EVN
570 900 new registrants by end
of 2014
# Volunteer passes issued
to individuals who have
volunteered 30 or more hours
at TRCA
280 625 volunteer passes issued
by end of 2014
# External (non TRCA)
volunteer opportunities posted
on EVN
530 900 external volunteer
opportunities posted on EVN
by end of 2014

50 TRCA Corporate Social Responsibility Report 2011
Highlights from TRCA’s Social Development Programs
PAIE Highlights, 2011
• 21 PAIE participants obtained salaried positions in their professional field
• 1 PAIE participant obtained salaried employment in a related field
• 10 PAIE participants obtained a paid work placement in their professional field (3 of whom advanced in their careers and moved on to salaried employment)
• 1 PAIE participant secured a volunteer opportunity (and has since progressed into salaried employment)
• In total, 34 opportunities were secured by 29 participants
Frida Takang, M2P Participant from 2009 – 2011
I first arrived in Canada in November 2008. The biggest
challenges I faced since coming to Canada were integrating
into the Canadian society, getting a job in my field and
learning where I can get help—now it is no longer a problem:
M2P program staff helps me a lot. I have a Masters degree in
Natural Resources Management, and I wanted to find
something in my field.
Through the M2P Program I have been able to find a
volunteer opportunity and utilize my skills. I was also
matched with a wonderful mentor, Darryl Gray of TRCA.
M2P also hosted many workshops which I attended. These
experiences were very positive and have changed my life
overall. I have been exposed to a lot of advice and follow up.
The most important lessons I have learned are to always tailor my resume, to be consistent during my job search journey,
and develop good interview skills through the M2P program. I think I can face interviews better now after all the practice!

TRCA Corporate Social Responsibility Report 2011 51
Carlos Mario Duero – Account Manager, Turtle Island Recycling
I came to Canada in 2007 from Colombia with a Bachelor’s
degree in Environmental Engineering. Having a lot of
expectations and a strong willingness to succeed, I spent the
first three years here improving my English skills and
working to obtain a graduate certificate in Environmental
Management and Assessment from Niagara College. I was
young and I thought I had done everything possible to be
successful in this country, but I was not aware of all the
challenges that I would have to face. I was a recent
graduate and I guess at that age, everyone thinks good
things will happen right away, but I was wrong. Time went
by and I started to get frustrated because there was no
indication of me getting a job in my professional field.
One day, while surfing the internet I came across information about the PAIE Program. As I read the description through,
I got really excited because this was the perfect opportunity for me and one that I could not miss. After submitting my
application and attending an interview, I was offered a place in the program which ended up being one of the biggest
accomplishments of my life so far.
During orientation, we were told that the success of the program would primarily depend on our desire, effort, and
commitment. We were not guaranteed jobs, but we were guaranteed to gain the tools necessary to understand Canada
in all aspects, and to be successful in our job search. I am happy to tell you that after attending many hours of training
through PAIE, I was successful in gaining a job in my field of expertise; and am now working for the kind company I
always dreamed of. I am currently working for Turtle Island Recycling which is one of the biggest waste management
companies in the GTA. My responsibilities are associated with providing top-notch customer service to support the
achievement of waste reduction targets by advising and implementing waste diversion approaches and waste reduction
strategies. I work with different levels of the organization and my job requires a high level of communication skills, which
PAIE training focused on extensively.
In fact, I really started to see the results of the program when I started to interact with my colleagues in the workplace.
It was easy for me to link and apply every workshop and piece of advice from PAIE Staff and Instructors. I realized that
everything we were taught was practical and happening in the workplace; and I’m sure that if I had not had the kind of
support I found through PAIE, I would not have been able to fit as easily into my position.
The accomplishments of PAIE Participants are real, measurable and tangible. The degree of professionalism demonstrated
by this program and its staff is unique. They have charisma and a willingness to help great people succeed in this country.

52 TRCA Corporate Social Responsibility Report 2011
M2P Highlights, 2011
The pilot phase of the M2P program which ended in 2011 resulted in the following accomplishments:
Target Outcome
# Applicants 60 166
# Participants accessing program 40 49
# Participants completing program 35 35
# Technical and Soft skills Workshops 20 30
# Mentors recruited* 40 70
# Participants who gained employment 30 32
*all participants were matched to a mentor
EVN Highlights, 2011
• 3280 volunteers are registered in the TRCA database (up by 570 from 2010)
• 39 TRCA volunteer opportunities posted seeking over 1000 volunteers
• 11 external organizations posted seeking 530 volunteers
• 11,860 volunteers have participated in TRCA volunteer activities
• 280 volunteers reported having completed 30 or more volunteer hours at TRCA and therefore became eligible for a TRCA pass
• All TRCA divisions are working with volunteers and have been active in reporting or posting volunteer opportunities
Planned Actions:
2012
• Continue to operate and strengthen PAIE, EVN, M2P.
• Initiate tracking of number of people participating in TRCA events.
• Launch the PAIE and M2P programs with additional new clients.
• Investigate new ways and develop new partnerships to assist new Canadians to secure employment in their field.

TRCA Corporate Social Responsibility Report 2011 53
Harsha Gamanpilla, M2P Participant from 2009 – 2011
I arrived in Canada on August 7 2007. The main
challenge when I first arrived is how to make ends
meet while searching for a job in my field. I have a
Masters of Science in Environmental Management
and Forestry, and a Bachelors of Science in Biology.
Through M2P I was able to have a mentor, attend
workshops and training and get help on my resume,
interview and job search. I also had a volunteer
opportunity that led to a Planner 1 position at TRCA.
My journey was slow going at first, and my motivation
was in and out. After one year I couldn’t find anything
but I was sticking to it. Sometimes you feel forced
to give up. When you’re not sure whether or not to pursue your dreams, it can be a very hard time. The main thing that
helped was volunteering in the planning field and this opened the door. The experience of the volunteering program at
TRCA has been very productive as they accept you as you are and treat you like a regular on-the-job employee. It is very
good training and I learned every aspect of the planning process. My experience in the M2P program was very good and it
was a great opportunity.

54 TRCA Corporate Social Responsibility Report 2011
Dilnesaw Chekol – Water Resources Technician, TRCA
I am from Ethiopia and I have over 9 years of experience in
watershed hydrology and soil and water conservation
engineering. My family and I immigrated to Canada in
January, 2007 because we wanted to live in a country
where multiculturalism is embraced, people of different
backgrounds live peacefully together, society is free and fair;
and one can realize their full potential.
I expected I would find a job in my profession within a
short time, since Canada invites skilled workers. However,
this did not happen. I looked actively for employment
opportunities and worked on improving my English skills by
listening to the radio and interacting with English speaking
people as much as possible. After submitting an average of
10 resumes each day and receiving no response I became frustrated and decided to attend job search training at various
community centers.
As a result of my efforts, I was invited for six interviews with different provincial ministries. I was told that I did very
well but lacked local experience. My frustration began to build up, and it was at this time that I learned about TRCA’s
PAIE Program.
PAIE is an excellent opportunity to get to know other Internationally Trained Professionals who are in related professions
and have had similar experiences. In PAIE we are able to share information and encourage each other.
PAIE helped me analyze my employable skills, prepare targeted resumes, establish and expand my professional network,
and work effectively with people from different cultural backgrounds smoothly and harmoniously. The technical workshops
gave me insight into Ontario practices and legislation which has been very important for my success. I found the courses
provided to be well thought-out and consistent staff presence made it easy for us to get counsel whenever we needed it.
PAIE staff were always available and they valued our feedback. It was good to know that they cared.
Because of the support I received through PAIE, I received a Water Resources Engineering work placement opportunity
with TRCA’s Ecology Division and was later hired into the salaried position of Water Resources Technician where I am now
gaining the professional experience I need to obtain my license as a Professional Engineer in Ontario. I am very happy to
have achieved my professional aspiration to work in the water resources sector where I can solve problems associated with
flood, erosion and water quality. I am proud to be contributing to the efforts being made to protect and manage the health
of the Ontario environment.

TRCA Corporate Social Responsibility Report 2011 55
Appendices Appendix A: Staff Levels by Year and Facility Floor Area.
Staff Levels
Year Average Employees Per Year
2003 495
2004 492
2005 556
2006 598
2007 620
2008 666
2009 701
2010 703
2011 736
Appendix B: Total TRCA Facility Floor Area
Year Square Footage
2003 336,466
2004 336,466
2005 343,109 (BCPV Event pavilion added)
2006 343,109
2007 343,109
2008 349,466 (Restoration Services Centre added)
2009 349,466
2010 352,266 (added new workshop at Boyd Office)
2011 354,466 (added new office space at Earth Rangers)

56 TRCA Corporate Social Responsibility Report 2011
Appendix C
Vehicle and Fuel Sustainability Indicator Statistics
Fuel and Transportation 2003 2004 2005 2006 2007 2008 2009 2010 2011
Kilometres driven in personal cars (kms) 333,504 330,540 388,617 391,116 427,813 465,365 482,591 490,592 486,866
TRCA Fleet vehicle kilometres 628,508 692,417 773,288 782,591 899,034 1,010,151 1,140,330 1,155,181 1,200,487
Total kilometers driven per employee (kms, excluding rentals) 1943 2079 2089 1963 2,140 2,215 2,315 2,341 2,292
Total fuel (litres) (Fleet Only) 109,360 111,479 130,460 138,630 156,925 170,450 186,883 199,186 205,632
Total Fuel (litres, all vehicles) 179,234 186,377 205,132 211,207 253,064 235,417 242,406 248,481 239,979
Fleet Fuel Mileage (litres/100 km) 17.4 litres/ 100 km 16.1 litres/ 100 km 16.9 litres/ 100 km 17.7 litres/ 100 km 17.5 16.87 16.4 17.2 17.1
Equipment gas and possibly diesel (litres) 29000 Included on energy table
Included on energy table
Propane equipment 24728 Included on facility table
Included on energy table
*Co2 e from Vehicles, equipment, and propane 721 tonnes 698 677
* Approximate calculation using the following methodology:
1. Scan of account entries to pick up all non tranperaction fuel purchases – propane, diesel (assigned to facilities) and misc gas.
2. Use propane and misc gas numbers from 1 (above) as propane equipment and gas equipment on carbon counted calculator for “trca fleet”
3. Took total litres of fleet fuel used (provided by fleet manager) and, because this number is not broken down by either fuel type or vehicle type (ie. the 6 carboncounted categories) assigned 1/6 of the total to each of
the 6 categories on carbon counted.

TRCA Corporate Social Responsibility Report 2011 57
Appendix D
Relevant Energy Statistics for 2003 – 2011
Performance Category 2003 Results 2004 Results 2005 Results 2006 Results 2007 Results 2008 Results 2009 Results 2010 2011
Hydro consumption 18,668 GJ (5,185,578 kwh)
17,928 GJ (4,980,211 kwh)
19,618 GJ (5,449,904 kwh)
20,476 GJ (5,688,079 kwh)
20,686 GJ (5,745,050 kWh)
21,511 GJ (5,975,738 kWh)
20,865 GJ (5,796,346 kwh)
20650 GJ (5,736,642 kwh)
18,479 GJ (5,133,033 kwh)
Green Hydro n/a n/a n/a 416,671 kWh
(7.4% of TRCA hydro)
933,081 kWh
(16.2% of TRCA hydro)
1026996, kWh
(17.1% of TRCA hydro)
1050160 kwh (18% of TRCA hydro)
1007741 kwh (19.6% of TRCA hydro)
Natural Gas Consumption 5,190 GJ (139,100 cu. m)
6,305 GJ (168,991 cu. m)
6,682 GJ (179,089 cu. m)
6115 GJ (163,833 cu. m)
8,569 GJ (229,558 cu. m)
8,244 GJ (220,867 cu. m)
7751 GJ (207, 671 cu. m)
7516 GJ (202,027 cu. m)
6776 GJ (182,144 cu. m)
Heating Oil (and propane) 3,286 GJ (87,476 litres)
3,372 GJ (89,768 litres)
2,816 GJ (74,958 litres)
3001 GJ (79,894 litres)
2744 GJ (73,052 litres)
3,334 GJ 88,752 litres
3076 GJ (72,391 litres)
2526 GJ (59439 litres) 2634 GJ (61,982 litres)
Facility Propane 73.35GJ (2934 litres) 366 GJ (9344 litres)
Total Corporate Energy Use in Gigajoules 27144 GJ 27605 GJ 29,117 GJ 29,427 GJ 31,999 GJ 33,089 GJ 31692 GJ 30765 GJ 28255 GJ
Total GJ per square foot 0.081 GJ/sq. ft. 0.082 GJ/sq. ft. 0.085 GJ/sq. ft. 0.086 GJ/sq. ft. 0.093 GJ/sq. ft. 0.095 GJ/sq.ft.
(added sq. footage of RSS building)
0.091 GJ/sq.ft 0.087GJ/sq. ft. 0.080 GJ/sq. ft.
Corporate Gigajoules consumed per employee
54.8 GJ/employee 56.1 GJ/employee 52.4 GJ/employee 49.2 GJ/employee 51.6 GJ/employee 49.7 GJ/employee 45.2 GJ/employee 43.8 GJ/employee 38.41 GJ/employee
Water Cu. m **46,699 cu. m **61,272 cu. m 43,707 cu. m 49,650 cu. m
* Scope one and two only without animals at BCPV. All TRCA propane assigned to vehicle and equipment, not to facilities.
** Municipal water totals only. No well water consumption was included. Bathurst Glenn municipal water consumption was not included.
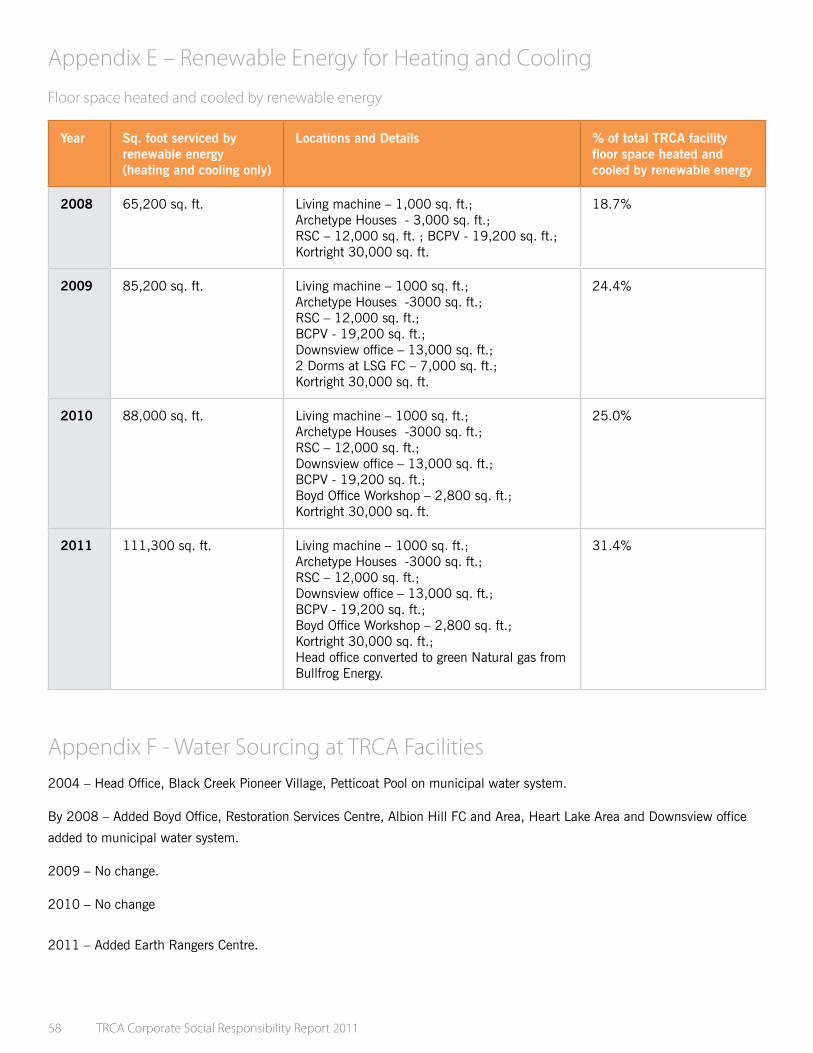
58 TRCA Corporate Social Responsibility Report 2011
Appendix E – Renewable Energy for Heating and Cooling
Floor space heated and cooled by renewable energy
Year Sq. foot serviced by renewable energy (heating and cooling only)
Locations and Details % of total TRCA facility floor space heated and cooled by renewable energy
2008 65,200 sq. ft. Living machine – 1,000 sq. ft.; Archetype Houses - 3,000 sq. ft.; RSC – 12,000 sq. ft. ; BCPV - 19,200 sq. ft.; Kortright 30,000 sq. ft.
18.7%
2009 85,200 sq. ft. Living machine – 1000 sq. ft.; Archetype Houses -3000 sq. ft.; RSC – 12,000 sq. ft.; BCPV - 19,200 sq. ft.; Downsview office – 13,000 sq. ft.; 2 Dorms at LSG FC – 7,000 sq. ft.; Kortright 30,000 sq. ft.
24.4%
2010 88,000 sq. ft. Living machine – 1000 sq. ft.; Archetype Houses -3000 sq. ft.; RSC – 12,000 sq. ft.; Downsview office – 13,000 sq. ft.; BCPV - 19,200 sq. ft.; Boyd Office Workshop – 2,800 sq. ft.; Kortright 30,000 sq. ft.
25.0%
2011 111,300 sq. ft. Living machine – 1000 sq. ft.; Archetype Houses -3000 sq. ft.; RSC – 12,000 sq. ft.; Downsview office – 13,000 sq. ft.; BCPV - 19,200 sq. ft.; Boyd Office Workshop – 2,800 sq. ft.; Kortright 30,000 sq. ft.; Head office converted to green Natural gas from Bullfrog Energy.
31.4%
Appendix F - Water Sourcing at TRCA Facilities2004 – Head Office, Black Creek Pioneer Village, Petticoat Pool on municipal water system.
By 2008 – Added Boyd Office, Restoration Services Centre, Albion Hill FC and Area, Heart Lake Area and Downsview office
added to municipal water system.
2009 – No change.
2010 – No change
2011 – Added Earth Rangers Centre.

TRCA Corporate Social Responsibility Report 2011 59
Appendix G – Corporate Carbon Footprint
2009 2010 2011
Total Corporate Carbon Footprint (GHG emissions – CO2 e)
3,228 tonnes
• Waste – 871 tonnes
• Facility Energy – 1,850 tonnes
• Vehicle, Equipment, Fuel – 701 tonnes
2,884 tonnes
• Waste – 606 tonnes
• Facility Energy – 1,815 tonnes
• Vehicle, Equipment, Fuel – 698 tonnes
2,760 tonnes
• Waste – 661tonnes
• Facility Energy – 1,501 tonnes
• Vehicle, Equipment, Fuel – 677 tonnes

www.trca.on.ca