sedimentology, age and stable isotope evolution of the ... · sedimentology, age and stable isotope...
TRANSCRIPT

Sedimentology, Age and Stable Isotope Evolution of the Kurnool Group,
Cuddapah Basin
Cari N. Bertram University of Adelaide [email protected]
C. Bertram
2
Contents Abstract .................................................................................................................................................. 3 1. Introduction ....................................................................................................................................... 4 2. Geological Setting .............................................................................................................................. 6 3. Methods ............................................................................................................................................ 10
3.1 LA-ICPMS Geochronology ....................................................................................................... 10 3.2 In-situ zircon Hf isotope LA-MC-ICPMS ................................................................................. 11 3.3 Stable Isotopes Geochemistry .................................................................................................... 13 3.4 Sequence Stratigraphy ............................................................................................................... 13 3.5 Issues and Potential Errors ......................................................................................................... 14
4. Stratigraphy ..................................................................................................................................... 14 4.1 Facies Descriptions .................................................................................................................... 14
4.1.1 Cross Bedded Sandstone ...................................................................................................... 14 4.1.2 Carbonate Mud Shale .......................................................................................................... 15 4.1.3 Silicate Limestone ................................................................................................................ 15 4.1.4 Grainstone ............................................................................................................................ 16 4.1.5 Shaley Limestone .................................................................................................................. 16 4.1.6 Calcareous Shale ................................................................................................................. 16 4.1.7 Massive Sandstone .............................................................................................................. 17 4.1.8 Clay-Rich Limestone ............................................................................................................ 17 4.1.9 Mud-Rich Shale .................................................................................................................... 17
4.2 Palaeogeography ........................................................................................................................ 18 4.2.1 Banaganapalle Formation ................................................................................................... 18 4.2.2 Narji Limestone .................................................................................................................... 19 4.2.3 Auk Shale .............................................................................................................................. 20 4.2.4 Panium Quartzite ................................................................................................................. 20 4.2.5 Koilkuntla Limestone and Nandyal Shale ............................................................................ 21
4.3 Geophysical Logs ...................................................................................................................... 21 5. Results .............................................................................................................................................. 22
5.1 LA-ICPMS U-Pb Geochronology .............................................................................................. 22 5.1.1 Sample CU10-05 .................................................................................................................. 22 5.1.2 Sample CU10-06 .................................................................................................................. 23 5.1.3 Sample CU10-22 .................................................................................................................. 23
5.2 In-situ zircon Hf isotope LA-MC-ICPMS ................................................................................. 24 5.3 Carbon and Oxygen Stable Isotopes .......................................................................................... 24
6. Discussion ......................................................................................................................................... 26 6.1 Age Constraints of Sedimentation in the Kurnool Sub-Basin .................................................... 26 6.2 Deposition of the Kurnool Group ............................................................................................... 26 6.3 Provenance of the Kurnool Group Sediments ............................................................................. 27 6.4 Petroleum Potential ..................................................................................................................... 31
7. Conclusion ........................................................................................................................................ 32 8. Acknowledgements .......................................................................................................................... 32 9. References ........................................................................................................................................ 34 10. Figure Captions ............................................................................................................................. 40 11. List of Tables ................................................................................................................................. 43 12. Figures ............................................................................................................................................ 44 14. Tables ............................................................................................................................................. 57

Sedimentology, Age and Stable Isotope Evolution of the Kurnool Group, Cuddapah Basin
3
Abstract The Kurnool Group unconformably overlies the Cuddapah Supergroup in the Cuddapah Basin, one of several Proterozoic basins in India. Neither the Kurnool Group nor the origin of the basin in which it is deposited is well constrained. In order to better establish its depositional age and basin evolution, I have performed a combined sedimentological, geochronological and isotope geochemical study of the Banaganapalle Formation, Narji Limestone, Auk Shale, Panium Quartzite, Koilkuntla Limestone and Nandyal shale, from bottom to top respectively. This study used U-Pb and Hf isotope analyses on detrital zircons to constrain the maximum depositional age and provenance of the sediments. Carbon (C) and oxygen (O) stable isotopes constrained the depositional period for the Narji Limestone and Auk Shale. Stratigraphic analysis was used in conjunction with gamma ray spectrometry (GRS) U, Th and K data to determine the depositional environment. U-Pb zircon geochronology shows that the Kurnool Group is younger than 2516 ± 19 Ma sourced from a detrital zircon in the Banaganapalle Formation. Due to peak ages at 2514 ± 13 Ma from the Panium Formation and 2623 ± 27 Ma and 3167 ± 22 Ma in the Banaganapalle Formation is it clear that the sediments are sourced from the Dharwar Craton. A clear trend in O and C isotopes reveals that sediments were deposited sometime between the Mesoproterozoic to the Early Neoproterozoic in a sub-tidal environment. There is moderate petroleum potential for the Narji Limestone and it shows potential as a frontier basin.
C. Bertram
4
1. Introduction
The crescent shaped Cuddapah Basin is the second largest Proterozoic basin in India. It is
located in eastern Peninsular India and has an area of 44, 500 km2 with a maximum width of
440 km. It is filled with 12 km of mixed carbonate-siliciclastic sediments and is intruded by
minor igneous activity including dykes and sills. The basin is bound to the west and underlain
by the Archean Dharwar Craton and to the east by the southern Eastern Ghats (Fig. 1). The
Dharwar Craton comprises orthogneisses that are often referred to as ‘Peninsular Gneiss’,
volcano-sedimentary greenstone belts and granitic intrusions. These all terminate at the basin
boundary and had completed forming at the start of deposition. Deep seismic soundings have
shown that the basin and the basement thicken eastward, towards the Eastern Ghats
(Kalislam, 1976; Naganjaneyulu and Harinarayana, 2004).
The sediments in the Kurnool Group represent Neoproterozoic deposition which unconform-
ably overlies the older Cuddapah Supergroup. The Cuddapah Supergroup is Meso- to
Neoproterozoic in age (Crawford & Compston, 1972; Zachariah, 1999; Chakraborty, 2010)
and is present throughout the basin whereas the Kurnool Group is only in two smaller sub-
basins in the west and northeast of the basin (Fig. 2). This study focuses on all six formations
in the Kurnool Group in the western Kurnool Sub-basin.
Two cycles of sandstone, limestone and shale make up the sediments in the Kurnool Group.
This basin experienced multiple sequences of transgression and regression. From top to
bottom the formations are Banaganapalle Formation (made up of conglomerates and
sandstone), Narji Limestone, Auk Shale, Panium Quartzite, Koilkuntla Limestone and
Nandyal Shale (Table 1). Currently there are no direct constraints on the Kurnool Group.
Sedimentology, Age and Stable Isotope Evolution of the Kurnool Group, Cuddapah Basin
5
The Cuddapah Basin shows a considerable amount of outcrop that is also easily accessible.
Considering this, the Kurnool Group is extremely poorly dated. No modern geochronology
has been attempted in the basin and any absolute age constraints will significantly advance
knowledge of the evolution of this part of India. At this stage, it is necessary to set up a
foundation for future studies of the Kurnool Group. There is a lack of very basic information
regarding the age of sediments, deposition and the evolution of the basin. The Cuddapah
Basin is a frontier basin, and it has been overlooked as a possible petroleum source
considering the limestone in the Kurnool Group. The aim of this study is to examine the
depositional environment, confirm the age of the deposition and test whether the sediments
are derived from erosion of the newly exposed Eastern Ghats or the underlying Dharwar
Craton.
These objectives have been completed using stratigraphic logs that will be correlated with the
carbon and oxygen isotope data from a stable isotope mass spectrometer and gamma ray
spectrometry data collected in the field. In this study I am also presenting new
geochronological U-Pb detrital zircon laser ablation - inductively coupled plasma mass
spectrometer (LA-ICPMS) data and laser ablation - multi collector - inductively coupled
plasma mass spectrometer (LA-MC-ICPMS) Hafnium (Hf) isotope data. The Hf isotope data
is important as it will place additional constraints on the detrital zircon ages (Veevers et al,
2004; Andersen, 2005; Belousova et al, 2009; Howard et al, 2009). This data collection will
constrain the maximum depositional age and examine the provenance of this section of the
basin.
C. Bertram
6
2. Geological Setting
The Dharwar Craton in Peninsular India consists mostly of Archaean continental crust. It is
bounded to the east by the Cuddapah Basin and the Eastern Ghats. The minimum age for the
tonalitic–trondhjemitic–granodioritic (TTG) basement is 3127 Ma (Jayananda, 2000). Of the
three distinct terrains in the Eastern Dharwar Craton, the Peninsular Gneiss is the oldest
ranging from 3000-3400 Ma (Meen et al, 1992; Peucat et al, 1993; Jayananda et al, 2000).
The volcano-sedimentary greenstone beltscomprise two sequences: the older Sargur Group
and the younger Dharwar Supergroup. These have been aged between 3000-2500 Ma (Anil
Kumar et al, 1995; Radhakrishna & Naqvi, 1986; Raase et al, 1986; Taylor et al, 1984). A
calc-alkaline to potassium rich granitic intrusion terminates the deformation in the Dharwar
Craton. This intrusion has been dated at between 2500-2600 Ma (Rogers, 1986; Jayanada et
al, 2000).
The Eastern Ghats belt is located to the east of the Cuddapah Basin and runs along the coast
of Peninsular India. To the west it is bordered by Archaean continental crust, including the
Dharwar Craton and the Baster Craton. Different deformation cycles have influenced the
structure of the Eastern Ghats belt. It corresponds to a polycyclic granulite terrain which has
undergone repeated high temperature metamorphism and deformation from the Proterozoic to
the early Phanerozoic. The Krishna Province, which corresponds to the southernmost
extension of the Eastern Ghats, is in direct tectonic contact with the Cuddapah Basin to which
is forms its eastern borders. The Krishna orogens consist of three domains respectively from
east to west: Ongole, Vinjamuru and Udayagiri (Fig. 1). The earliest deformation event to
occur in the Ongole Domain was a calc-silicate rock intrusion of enderbitic to charnockite
granulites between 1720 to 1704 Ma (Dobmeier & Raith, 2003; Dobmeier et al, 2006;
Simmat & Raith, 2007; Upadhyay et al, 2009). High to Ultrahigh-temperature metamorphism
Sedimentology, Age and Stable Isotope Evolution of the Kurnool Group, Cuddapah Basin
7
occurred in the Ongole Domain between 1650 and 1590 Ma (Simmat & Raith, 2008;
Upadhyay et al, 2009). Localised ductile-brittle deformation and hydration occurred from
1450-1350 Ma (Simmat & Raith, 2008; Upadhyay et al, 2009) with a thermal overprint at
~1100 Ma (Simmat & Raith, 2008; Upadhyay et al, 2009). The Ongole Domain is thrust
westward over the Vinjamuru Domain, which has a dominant lithology of granitic gneiss
(Dobmeier et al, 2006; Mukhopadhyay & Basak, 2009). This was intruded by granitic magma
which has identical U-Pb upper intercepts of 1588.4 ± 7.7 and 1589.7 ± 5.7 Ma that dates the
emplacement (Dobmeier et al, 2006). The Udayagiri Domain consists of greenshist facies
volcanosedimentary sequence which holds conglomerates, pelites and psammites with local
intraclasts of cherts, limestones and felsic volcanics (Dobmeier & Raith, 2003; Vasudevan et
al (in press), quoted in Dobmeier et al (2006)). Metavolcanic rocks have Pb-Pb zircon
evaporation ages of 1868 ± 6 Ma and 1771 ± 8 Ma and this reflects the deposition age
(Vasudevan et al (in press), quoted in Dobmeier et al (2006)). Little else is known about this
domain.
Peninsular India is covered with Proterozoic sedimentary basins which are commonly known
as the Purana Basins (Chaudhuri et al, 1999; Meert et al, 2010). There is no consensus as to
how they have formed. Radhakrishna & Naqvi (1986) have studied these basins and believe
that between 2000-1500 Ma these basins were formed from subduction and flexture at the
eastern and northern margins of the Dharwar-Singhbhum Protocontinent. Chaudhuri et al
(2001) believes that these basins were formed due to controls from pre-existing sutures
and/or weak zones. It can be seen that these basins have a broad similarity to each other and
in general represent shallow marine, epicratonic, passive margin sequences deposited in an
extensional tectonic regime (Dasgupta & Biswas, unknown).

C. Bertram
8
As for the Cuddapah Basin, there are many theories for it its creation. Pandey et al (1997) and
Chatterjee & Bhattacharji (2001) agree that mafic dyke swarms Eastern Dharwar Craton are
associated with thermal extension and fracturing of the crust which may have lead to its
formation. An agreeing theory is where the basin geometry and evolution is primarily
controlled by basin-marginal faults where the basin developed in a failed rift setting
(Chadauri et al, 2002). Evidence of rifting is oscillatory movements which were shown by the
variation from fluvial-shallow marine to slope-basin deposition. Singh and Mishra (2002)
have proposed that the Cuddapah Basin was formed in a peripheral foreland basin setting due
to eastward dipping continental crust under the eastern part of the Cuddapah Basin. An
agreeing theory is that the Cuddapah Basin is a foreland basin due to its position close to the
Eastern Ghats (Manikyamba et al, 2007) which had a higher tendency for crustal sagging
(Raman and Murty (1997), quoted in Chakraborty et al (2010)). Although the Cuddapah
Basin may have a foreland origin, Rogers (1986) is suggesting that the basin started off as
circular, and was then deformed by the Eastern Ghats Orogeny to form the crescent shape
which can be seen by the Nallamali Fold Belt.
The formation of the Kurnool sub-basin is less disputed than that of the Cuddapah Basin. The
Kurnool basin is a distinct technostratigraphic unit from the Cuddapah Basin. Gravity-
induced block faulting and subsidence were the triggers that caused the basin to form in a
depocentre (in press Chakraborty, 2010). During deposition the Kurnool Group underwent
subsidence controlled by deep faults, and strong local movements all of which varied during
the cycles (Meijerink, 1984; Chakraborty, 2010). Post deposition there has been eastward
thrusting movements of deep faults, epeirogenic movements and folding and metamorphism
in the eastern parts of the basin (Chakraborty, 2010).
Sedimentology, Age and Stable Isotope Evolution of the Kurnool Group, Cuddapah Basin
9
The Cuddapah Basin is situated in eastern Peninsular India and has an area of 44, 500 sq. km
with the largest width at 440 km west to east. It contains ~12 km thick stratigraphy which is
at its deepest at the east of the basin, which overlies over a 40km thick crust of the Eastern
Dharwar Craton (Kalislam, 1976; Naganjaneyulu and Harinarayana, 2004). Structures in the
sediments show that they may be derived from the south and west (Murthy, 1976, as quoted
in Dasgupta et al, 2005). Madhava Rao & Gokhale (1973) have also observed through
ripples that current is from the west to east in the Banaganapalle Formation, which is
consistent with the sediments being sourced from the Dharwar Craton. In the western part of
the basin the sediments are generally unmetamorphosed, except for parts of the Kurnool
Group, whereas in the eastern part they show deformation in the form of the Nallamali fold
thrust belt (Chakraborty, 2010; Meijerink, 1984).
The basin is suspected to be of Palaeoproterozoic age, with deposition occurring from the
Palaeoproterozoic to the Neoproterozoic. Age constrains for the age of deposition of the
Kurnool Group formations come from the underlying Cuddapah Supergroup as well as within
the Kurnool Group. The youngest Cuddapah Supergroup formation is the Cumbum
Formation which is in the Nallamali Group and this underlies the Kurnool Sub-basin (Table
1). This has been dated using detrital zircons and yielded a 206Pb/238U age of 913±11 Ma
(unpublished data by Mackintosh, 2010). This constrains the maximum depositional age for
the Kurnool Group. The Cuddapah Basin is said to be mid-late Proterozoic in age, due to a
lack of any known Phanerozoic body-fossils/floral impressions within the formations (Gupta,
1998). Kimberlite and lamproite pipes are cross-cutting the underlying sediments of the
Cuddapah Supergroup, and the pipes show ages younger than 1090 Ma or 1140 Ma from Rb-
Sr and K-Ar dating (Crawford & Compston, 1972; Chaudhuri et al, 1999; Chakraborty,
2010). Chalapathi Rao et al. (1995) have dated lamporite which lies in the Cuddapah Basin

C. Bertram
10
with K-Ar methods at 1350-1380 Ma which may indicate a second magmatic event as it was
previously thought that there was only one magmatic event. This is significant because the
Banaganapalle Formation is diamondiferous and this composition is most likely a result of
the weathering of the pipes. Carbonaceous megaremains in Auk Shale have been dated as
Neoproterozoic in age (Sharma & Shukla, 1999). There are carbonaceous impressions and
compressions in the bedding planes of the boundaries between the siltstone and the shales,
and the shale to claystone (Sharma & Shukla, 1999). There are five megaremains which are
Chuaria circularis, Tawid remains, Ellypsophysid remains, Moranid remains and Beltinid
remains (Sharma & Shukla, 1999).
3. Methods
3.1 LA-ICPMS Geochronology
LA-ICPMS geochronology was undertaken to determine the age of detrital zircon. Samples
were chosen for geochronology based upon their relative location, sample ‘freshness’ and
perceived potential for detrital zircons, i.e. sandstones. These samples were crushed, coarsely
milled using a tungsten-carbide mill and sieved with the 75-425 µm fraction retained for
zircon separation which involved hand panning and hand held Nd magnets and the zircon
grains were then handpicked and mounted in a 1 inch epoxy disc. The disc was polished so
the zircons were half their depth and imaged using backscatter electron (BSE) and
cathodoluminescence (CL) using a Phillips XL-20 with attached Gatan CL located at
Adelaide Microscopy, University of Adelaide.
The U-Pb detrital zircon geochronology was undertaken using an LA-ICPMS located at
Adelaide Microscopy. Data was acquired using a New Wave 213 nm Nd-YAG laser in a He
Sedimentology, Age and Stable Isotope Evolution of the Kurnool Group, Cuddapah Basin
11
ablation atmosphere, coupled to an Agilent 7500cs ICP-MS. The LA-ICPMS operating
procedures are set up similarly to Payne et al. (2006). 206Pb, 207Pb, 208Pb, 232Th and 238U were
analysed with 235U calculated from 238U using a 238U/235U ratio of 137.88. 204Pb has Hg
interferences on the LA-ICPMS so an offline integration of the signal was used to select the
part of the signal which was common Pb free this can be used to assess the validity of the
results. An external zircon matrix-matched standard GJ-1 (TIMS normalisation data
207Pb/206Pb = 608.3 Ma, 206Pb/238U = 600.7 Ma and 207Pb/235U = 602.2 Ma, Jackson et al,
2004) was used to correct for mass bias and fractionation in combination with the Plešovice
zircon standard (concordant U–Pb age with a weighted mean 206Pb/238U date of
337.13 ± 0.37 Ma, Sláma, 2008) to monitor data quality. Isotopic analysis software Glitter
(version 0.4) was used to process raw data (Griffin et al, 2008). Concordia diagrams and
probability distribution curves where constructed using the ISOPLOT macro (Ludwig 2000).
The concordancy was calculated by dividing the 207Pb/206Pb age by the 206Pb/238U age and the
207Pb/206Pb age was used. The GJ-1 standard had a 206Pb/238Ub weighted average of
601.0±1.6 (95% conf., n = 92, MSWD = 0.28). The Plešovice zircon standard was used to
monitor data quality, which produced a 206Pb/238Ub weighted average of 343.6±4.0 (95%
conf., n=26, MSWD=4.5).
3.2 In-situ zircon Hf isotope LA-MC-ICPMS
In-situ Hf isotope data was collected with a Thermo-Scientific Neptune Multi Collector ICP-
MS coupled to a New Wave UP-193 Excimer laser (193nm) at Waite Campus, University of
Adelaide, Adelaide, following procedures of Payne et al. (in prep). The samples analysed
were two of the three used for LA-ICPMS analysis. Concordant zircon grains (90-110%
concordance) were analysed in the same domain as they were for U-Pb LA-ICPMS
C. Bertram
12
geochronology. The laser conditions were 4ns pulse length, 5 Hz with a 50 um spot size
(~10J/cm2). The ablated material travelled through a He ablation atmosphere mixed with Ar
sample gas. Set-up of the system prior to ablation sessions was conducted using analysis of
JMC475 Hf solution and an AMES Hf solution. 171Yb, 173Yb, 175Lu, 176Hf, 177Hf, 178Hf, 179Hf
and 180Hf were measured on Faraday detectors with 1012Ω amplifiers and an integration
interval of 0.232 seconds. Hf mass bias was corrected using exponential law fractionation
correction using a stable Hf isotope ratio of 179Hf/177Hf=0.7325.
Yb isobaric interference on 176Hf was corrected by direct measurement of Yb fractionation
using 171Yb/173Yb coupled with the Yb isotopic values of Segal et al. (2003). The
applicability of these values were verified by analysing JMC 475 Hf solutions doped with
varying levels of Yb with interferences up to 176Yb/177Hf= ~0.5. Lu isobaric interference on
176Hf corrected using a 176Lu/175Lu ratio of 0.02655 (Vervoort et al., 2004) assuming the same
mass bias behaviour as Yb. For Yb signals below 10 mV interference corrections were made
using an empirically derived 176Yb/173Yb ratio and the Hf mass bias factor similar to the
method described by Griffin et al. (2000). This was done as the potential errors involved in
the method are outweighed by the significantly greater uncertainty caused by the small Yb
beam. In this case an empirically derived ratio of 0.739689 was used. This was derived by
analysis of a series of Yb and Hf doped glass beads. Interferences from REE may affect the
data. 160Gd160 and 160Dy160 both add up to 176 so there may be an overcorrection for Yt and
Lu. If the 176Lu/177Hf ratio is above 0.1, the value will be discarded. Confirmation of accuracy
of the technique for zircon analysis was monitored using a combination of the Plešovice,
Mudtank and QGNG standards. Crustal model ages (TCDM) were calculated for each zircon
Sedimentology, Age and Stable Isotope Evolution of the Kurnool Group, Cuddapah Basin
13
assuming average continental crust with 176Lu/177Hf values of 0.0015 (Griffin et al, 2002) as
the zircon grain growth reservoir.
3.3 Stable Isotopes Geochemistry
Carbonate hand samples were collected approximately every 5 metres in the course of
measuring stratigraphic sections. Carbonate samples were cut to expose a clean surface,
which was then drilled to produce a fine powder. δ13C and δ18O isotope data were acquired
simultaneously on a Micromass Isoprime dual inlet mass spectrometer at L'Université du
Québec à Montréal. Approximately 100 µg of powder was reacted in singular glass reaction
cells with purified H3PO4 at 90 ºC for 10 minutes while being constantly cryogenically
trapped. Evolved CO2 was cryogenically distilled then measured against an in-house
reference gas. Both δ13C and δ18O samples were calibrated to VPDB using an in-house
calcite standard. All δ13C and δ18O are reported with respect to the Vienna Pee Dee
Belemnite (VPDB) as per mil deviations.
3.4 Sequence Stratigraphy
Sequence stratigraphy is important for detailed depositional and sedimentary observations in
the Kurnool Group using the accessible outcrop. The three transects were done: 1) from the
Banaganapalle to the top of the Narji Limestone 2) from the Narji Limestone to the Panium
Sandstone and 3) through the Auk Shale to the Panium Limestone (Table 1). The total lengths
of these sections were 65.5m, 124.4m and 73.6m respectively. The location for the logged
sections was chosen on accessibility, length (known or possible), and sediments. The location
of each of the sections is in Table 2. Stratigraphic logs were created to compare the intervals
over different locations as well to provide as a detailed look at the relationships between
C. Bertram
14
formations. Th, U and K concentration were acquired every 5 metres using a hand-help
gamma ray spectrometer.
3.5 Issues and Potential Errors
Contamination is the highest risk when using samples that are not whole rock. Action was
undertaken to prevent contamination of the sample such as cleaning labs before and after
preparation, and cleaning any machinery such as the rock crusher, diamond saw and drill bit
before and after using them. An error which may not be accounted for is human error when
using the equipment in Adelaide Microscopy and when organising data. There could also be
an issue with the LA-MC-ICPMS and LA-ICPMS not properly tuned or set up for zircon
analysis. Standards are used in conjunction with the sample. Generally the sample shows the
same age over the grain(s) but in some cases there are areas of the grain which are more
accurate than other areas. If the incorrect part of the grain was used as a standard it may
throw the results out but not to any great consequence. Undetected interferences from REE in
the LA-MC-ICPMS and LA-ICPMS might pose an issue on corrections made based on the
amount of elements detected.
4. Stratigraphy
4.1 Facies Descriptions
4.1.1 Cross Bedded Sandstone
This facies makes up most of the Banaganapalle Formation and typically consists of a fine to
medium grained quartz arenite. Rocks in this facies are usually brown in colour and contain
well rounded grains. Isolated clasts are sporadic through parts of the observed facies (Fig. 3a)
Sedimentology, Age and Stable Isotope Evolution of the Kurnool Group, Cuddapah Basin
15
and they are sub rounded to rounded and no larger than 2 cm in diameter. There are distinct
laminations, and as the laminations are up to 2 cm thicker as the grains coarsen (Fig. 3b).
Cross bedding and trough cross bedding (Fig. 3c and 3d respectively) at both a scale of 20 cm
and a scale of 5 cm are very common. These had a varied direction as expected; they included
dip/dip directions of 31/148 and 18/267 (Table 3). Ripples appear on some surfaces and
these may change from a 3 cm wavelength on one surface to a 10 cm wavelength on only 30
cm apart vertically adjacent surfaces. Four sets of ripples seen in the observed sections of the
sandstone in the Banaganapalle Formation. These values can be found in Table 3. This
formation can be seen in the Narji 2 stratigraphic log before the transition into the Narji
Limestone (Fig. 6).
4.1.2 Carbonate Mud Shale
The carbonate mud shale lies in the transition zone between Banaganapalle Formation and
the Narji Limestone. This can be seen between 0 and 8.8 m on the Narji 2 stratigraphic log
(Fig. 6). It is ~8 m of carbonate shale, which is composed of sandy and muddy layers.
4.1.3 Carbonate Cemented Sandstone
This facies represents the base of the Narji Limestone. Here are cross bedding and intraclasts
(Fig. 3e), although they do not co-exist in the sections observed. Further up in this facies it
transitions into ribbons (Fig. 3f) with some pyrite inclusions, hummocky cross stratification
(HCS) (Fig. 3g) and thick bedding with clay beds and fine laminations. The positions of these
sedimentary features can be seen in the Narji 1 and Narji 2 stratigraphic logs (Fig. 5 and 6
respectively). The pyrite inclusions are 5 mm - 10 mm across. The clay beds are 0.5 to 1cm
thick and contain pockets of sand (Fig. 3h). There are low angle truncations and dolomitised

C. Bertram
16
regions, as well as intermittent chert layers approximately 15m apart. The bedding is thinning
from 2cm to 5mm as the formation goes up.
4.1.4 Grainstone
In the middle fo the Narji Fomration the limestone can be defined as a grainstone (Fig. 3i).
This has thin bedding and <1mm grainsize. Within the grainstone there are stylolites between
the thick bedding. The grainstone is dark grey in colour due to a high amount of organic
matter, and stylotisation occurs about every 10cm. These sedimentary features can be seen in
the Narji 1 and Narji 2 stratigraphic logs (Fig. 5 and 6 respectively). Pyrite crystal inclusions
are between ~1mm to ~5mm across.
4.1.5 Shaley Limestone
This limestone is present at the top of the Narji Formation. It may be a transitional boundary
between the Narji Formation and the Auk Shale. This facies shows quite shaley bedding with
2 cm to 5 mm thick beds. It then transitions into suspension bedding which shows suspended
layers of sand and mud ~1.5 cm thick to 5 mm thick and alternating. Pyrite is small, and
limestone is dark in colour.
4.1.6 Calcareous Shale
This facies makes up the Auk Shale formation. It can be defined by shales trending from 2
cm thick grey mud beds to carbonate rich beds to more pale grey/greeny non-calcareous beds.
It is a highly weathered outcrop. Beds are approximately 1cm thick and do not change over
the interval. There is a sharp boundary between the carbonaceous shale and the massive
sandstone, which can be seen in the Narji 1 and Auk stratigraphy logs (Fig. 5 and 7
respectively).

Sedimentology, Age and Stable Isotope Evolution of the Kurnool Group, Cuddapah Basin
17
4.1.7 Massive Sandstone
This facies makes up the Panium Quartzite. Generally this facies is defined as a fine to
medium grained sandstone which shows no grading (Fig. 3k). It is a pure, grain supported
fabric with very little matrix. The grains are sub angular to rounded, and the rock weathers
the same. There is one area which shows 1m scale cross bedding and pinching and swelling
but this is very uncommon as it is mostly massively bedded. This can be seen in the Auk
stratigraphy log (Fig. 7). Lenses of shale and clay appear close to the boundary between
massive sandstone and calcareous shale in one observed transect.
4.1.8 Clay-Rich Limestone
This facies makes up the Koilkuntla Limestone. Only 3 m of this facies was observed and
that showed a rock which is light in colour, with small laminations up to 1cm, and large
bedding from 5-20cm. It is highly weathered and therefore outcropping is not common. This
limestone is more clay rich than the Narji Limestone.
4.1.9 Mud-Rich Shale
This facies represents the Nandyal Shale. The facies observed is characterised by well
laminated, fine purple/brown beds (Fig. 3l). It is slightly calcareous and rich in clay, and
highly weathered. There are silty coarser beds between the mud beds and it did not show
much significant change over the observed interval.

C. Bertram
18
4.2 Palaeogeography
4.2.1 Banaganapalle Formation
The Banaganapalle Formation unconformably overlies the Cuddapah Supergroup. The top of
the Cuddapah Supergroup is the Nallamali Formation, which holds shales, quartzite and slate.
The lower section of the Banaganapalle Formation is a conglomerate made up of rip-up clasts
of the underlying formation. Diamondiferous lamporite pipes run through the Nallamali
Group, and the Banaganapalle Formation also has diamondiferous clasts in the conglomerate
which are from the underlying formation. This shows a high energy environment as the
underlying formation was ripped up.
Another indication of a high energy environment are symmetric large and small ripples which
are vertically juxtapositioned where the larger ripples lie on top of the smaller ones. This may
suggest deepening water, due to tectonics or sea level change. This is also indicative of
increased flow strength conditions. The sediment is mature and this implies a beach
environment.
The palaeocurrent direction for ripples is approximately east/west with minimal dipping.
Evidence for this is four sets of ripples seen in the observed sections of the sandstone in the
Banaganapalle Formation. These values can be found in Table 3. Cross bedding was also
seen and this has a more varied direction, as expected. The dip/dip direction for those include
31/148 and 18/267.
There is a transitional boundary between the Banaganapalle Formation and the Narji
Limestone. There is ~8 m of carbonate mud shale between them, with sandy and muddy
layers suggesting a swash zone. At this time there might be a barrier preventing sediment
Sedimentology, Age and Stable Isotope Evolution of the Kurnool Group, Cuddapah Basin
19
coming in, or a change in energy which is why there is a change to limestone and a higher
carbonate input. The source could be shut off due to orogeny cycles and a lack of sediment
being deposited. This formation is the transition into a transgressive sequence in this part of
the basin.
4.2.2 Narji Limestone
At the edge of the calcareous mud shale and at the base of the Narji Limestone there are two
observed environments. In one part of the basin there were intraclasts present which is
evidence of a storm environment. Previously this would have been a mud as it is very thinly
bedded and there are layers of sand and clay and pockets of mud throughout the limestone.
This could be part of the transitional period which was then ripped up by storm waves. In
other parts of the basin where the transition could be seen from Banaganapalle to Narji there
was no evidence for any reworking of the seabed which shows that there were local storms
during this depositional period. This section is generally deepening due to the decrease in
clay and sand. As is it getting deeper there are ribbons forming which have then been affected
by storm waves. HCS is also visible in the carbonate cemented sandstone further up in the
sequence as it transitions from storm currents to fair-weather currents. These beds are of
varying thickness and show clay in between beds, which implies moderate to high energy
shallow sub-tidal conditions. This then transitions into a grainstone and then a dark shale.
Pyrite is visible through the formation which shows a reducing iron environment.
At the top of the formation there are multiple stages of suspension bedding where it cycles
between suspended and settled clay and mud which is a deep water depositional environment.
At this stage there may have been a break in the barrier which was holding back sediments, or
a decrease in seawater and it has therefore started to transition into a regressive environment

C. Bertram
20
with increased sediment supply/less water. There is also a high amount of pyrite which
relates to the increased reduced iron enrichment.
4.2.3 Auk Shale
The Auk Shale formation was progressively a more storm based environment. There are 1 cm
thin parallel mud beds at the base of the formation, with some clastic input. This implies
intermittent sediment supply and quiet waters. The beds then become more calcareous and
slightly thicker layers (~2 cm). This bedding was also parallel and silt was between the beds
in some areas. A weak storm wave base could be the force for this environment where the
pulses of sediment supply are longer than the previous sedimentation. This then moved to
silty shale which has been oxygenated so this would be shallower than the previous
deposition. This sediment and bedding continued until the Panium Quartzite where there was
a very sharp boundary.
4.2.4 Panium Quartzite
In two different parts of the basin there were different conditions for the boundary between
the shale and the sandstone. Where there is cross bedding and thin 5 mm laminations as well
as a few layers of shale and pockets of clay there was also little matrix and this suggests a
shallow-marine environment with storm erosion from the lower Auk Shale and sediment
flows. Here the direction of the cross beds were east/south east. In other sections of the basin
where there is massive bedding, mature sediments, and a lack of sedimentary features, this
may have been a beach environment. This regressive stage might have been halted by
another sediment barrier.

Sedimentology, Age and Stable Isotope Evolution of the Kurnool Group, Cuddapah Basin
21
4.2.5 Koilkuntla Limestone and Nandyal Shale
The Koilkuntla Limestone was formed in a calm environment which can be seen from the
thin 5 mm laminations. This laminated section is thick, and holds a lot of clay and
manganese. This environment would have formed after a barrier stopped silisiclastic
sediments from deposition. The Nandyal Shale formation has very thin horizontal bedding,
fine grained, clay rich and this suggests it was potentially deposited as tidal flats, although no
mud flats were observed. These formations are not able to be put in context we well as the
other formation due to no boundaries observed between the formations.
4.3 Geophysical Logs
Three transects were undertaken through different sections of the Kurnool Group (Table 2)
and the values for these are found in Table 4. The GRS data was collected whilst logging and
K, U and Th and total dose of elements were recorded. K correlates to the amount of clay
present in the rocks, due to the high K in clay. U and Th are close in the periodic table and
therefore when Th is recorded it may actually be responding to U and vice versa. However, if
the machine is calibrated correctly, this should not be a problem. When rocks weather they
will produce Th and this will then lead to a higher reading of Th than primary values which
will skew the data. When selecting an area of rock to log, weathered areas were eliminated.
The GRS data will show radioactivity as well as sequence changes. Shales at maximum
flooding surfaces will show a strong positive GRS total value due to radiogenic highs made
up of elements which have been collected from the water column during this part of
deposition.
There is a maximum total value of 4 in the grainstone, which also correlates with the Narji 2
log (Fig. 6). Th has a maximum of 1.4 ppm at the same level as the total maximum value and

C. Bertram
22
shows the same trend as the Narji 2 log (Fig. 6). The Narji 2 geophysical log shows a total
high of 30, with a K value of 0.6 % and Th value ~8 ppm (Fig. 6). This is about 5 m into the
calcareous shale of the Auk Formation. At the top of the Narji formation there are higher
values of total, K and Th than along the rest of the log. The Auk geophysical log has a
maximum total value of 85, with a K value of 3%, U value of 0.2 ppm, and a Th value of 15
(Fig. 7). These high values may relate to a higher elemental concentration due to collection
from the water column.
The Narji 1 geophysical log shows No K or U values at all (Fig. 5). However, this is
surprising as it was expected that the cross bedded sandstone might have higher values for U
as the Eastern Ghats have average levels of U from the metamorphism. In the calcareous
shale and the mud-rich shale there were Th/U ratios of 10-20. One GRS log in the silicate
limestone yielded a Th value of 27.1 ppm, and a U value of 0.4 ppm. The Th/U ratio is 67.8.
A GRS log in the calcareous shale yielded U values of 0.2 ppm and Th values of 14.7 ppm
which totals a Th/U ratio of 73.
5. Results
5.1 LA-ICPMS U-Pb Geochronology
5.1.1 Sample CU10-05
This sample is from the upper sandstone section of the Banaganapalle Formation, which is
before it transitions into the Narji Limestone. The sample is from the upper part of the
section, just above a thin ~5cm layer of storm clasts. The grains are rounded and frosted, and

Sedimentology, Age and Stable Isotope Evolution of the Kurnool Group, Cuddapah Basin
23
the sample has little matrix. The sample is indicative of a transgressive depositional
environment. Out of the 22 analysed detrital zircon grains 11 were 100 ± 10% concordant.
The concordant 207Pb/206Pb ages range from 2516.1± 18.73 Ma to 3389 ± 17.5 Ma (Fig. 8a).
Within the concordant data there are no statistically valid clusters (Fig. 8b). The youngest
207Pb/206Pb age for this sample is 2516.1± 18.73 Ma with 110% concordancy.
5.1.2 Sample CU10-06
This sample is also from the upper section of the Banaganapalle Formation, and it is 10m
higher stratigraphically than sample CU10-05. The main characteristics of this sample are
rounded grains with little matrix. Out of the 58 detrital zircons that were analysed, 10 were
100 ± 10% concordant. The concordant 207Pb/206Pb ages of this sample range from 2542.1 ±
17.71 Ma to 3316.1 ± 16.1 Ma (Fig. 8c). There are two main populations of zircons. On the
probability density distribution plots there is one population at 2623 ± 27 Ma (95% conf.,
n=2, MSWD=0.02) and another older group at 3167 ± 22 Ma (95% conf., n=2, MSWD=0.27)
(Fig. 8d). Since there are only 10 concordant grains, the peaks look more significant than they
really are. The youngest concordant age is 2542.3 ± 17.71 Ma with 96% concordancy.
5.1.3 Sample CU10-22
This sample is from the Panium Quartzite, which is in the middle of the Kurnool Group. It is
a pure quartzite with a medium sand grain and very little to no matrix. The sample is 18m
above the boundary between the Auk Shale and the Panium Quartzite and it represents the
start of the shallowing water level of the basin. Forty zircon grains were analysed and 26
were 100 ± 10% concordant. The concordant detrital zircon 207Pb/206Pb ages of this sample
range from 2060.9 ± 22.38 Ma to 3397 ± 16.9 Ma (Fig. 8e). There is a peak age at 2514 ± 13
Ma (95% conf., n=17, MSWD=2.6) where the main concordant population lies (Fig. 8f).

C. Bertram
24
There are two younger grains. One has a concordant 207Pb/206Pb age of 2161.7 ± 19.1 with
104% concordancy and the youngest concordant 207Pb/206Pb age is 2060.9 ± 22.38 Ma with
98.4% concordancy.
5.2 In-situ zircon Hf isotope LA-MC-ICPMS
In-situ zircon Hf isotope analysis was conducted on 2 samples, CU10-05 and CU10-22, from
the Banaganapalle Formation and Panium Quartzite respectively. Hf isotope data is reported
in Table 6.
Eleven zircon grains with 100 ± 10% age concordance were analysed from sample CU10-05.
Of these, 3 zircon grains yielded 176Yb/177Hf ratios above 0.1, and hence are not included in
this discussion. The remaining grains yield εHfT values ranging from + 0.4 to +18.3 at the
crystallisation ages of 2500 - 3400 Ma (Fig. 9). Crustal Depleted Mantle model ages (TCDM)
calculated using 176Lu/177Hf values of 0.0015 yield ages of 2.29 – 3.67 Ga (Fig. 10). Eighteen
zircon grains with 100 ± 10% age concordance were analysed for sample CU10-22. Of these
two grains are not in this discussion due to 176Yb/177Hf ratios above 0.1. The remaining grains
yield εHfT values ranging from -6 to +3.4 at the crystallisation ages of 2060 - 3250 Ma (Fig.
9). TCDM yielded ages of 2.50 – 3.59 Ga (Fig. 10). Both Banaganapalle and Panium samples
176Hf/177Hf values are highly variable ranging from 0.2807 to 0.2813 and 0.2814 respectively.
Although all the values plotted on the graph are valid, I am disregarding any above the
depleted mantle normalised curve.
5.3 Carbon and Oxygen Stable Isotopes
Carbon and oxygen stable isotope sections where constructed for two sections. This data can
be found in Table 7. The Narji Limestone has excellent exposure and accessibility and it was

Sedimentology, Age and Stable Isotope Evolution of the Kurnool Group, Cuddapah Basin
25
not difficult to sample. Two transects were sampled through the Narji Limestone, with one in
the same area as the Narji 1 stratigraphy log and the second one only for sampling. In the first
transect the δ13Ccarb profile is fairly scattered ranging from +0.2 to +2.5 ‰ and slowly
increasing as depth decreases (Fig 11). The δ18Ocarb from the same transect ranges between -
12.3‰ and -6.8‰ and then back to -10‰ shows more of a trend (Fig 11). The second set of
data is from Govindinne Quarry (15º 24’ 3.9” N, 78º 12’ 26.5” E) and it is 7.5 m long. This
shows a δ13Ccarb profile that is slowly decreasing from +2.4 to +1.45 ‰ (Fig. 12). The
δ18Ocarb values range from -9.3 to -10.83 ‰ and they also decrease as it gets higher (Fig. 12).
An sub-tidal environment formed the carbonates in the Narji Limestone. A lack of water
movement means that these carbonates would most likely reflect a restricted inorganic
environment. Diagenesis should be considered when interpreting δ13Ccarb and δ18Ocarb values
as it can change the values from the primary depositional values (Halverson et al. 2007).
Meteoric or hydrological fluids affect δ18Ocarb before it affects δ13Ccarb (Frank et al, 2003;
Bartely et al, 2001). If the rock has been affected then there will be a covariant trend of
sharply decreasing δ18Ccarb with a decreasing δ13Ccarb, which can be shown by a δ18Ocarb vs.
δ13Ccarb plot. From Fig. 14 we can see that there is correlation between δ18Ocarb and δ13Ccarb
therefore it has been affected by diagenesis. Due to diagenesis, it means that the δ18Ocarb
values are more likely to have measured burial temperature rather than relative seawater
values. The confidence of this data is limited due to the digenesis, and the short transect.
With this in mind, the δ18Ocarb values will not be included, as disgenesis affects O isotopes
before it affects C isotopes.

C. Bertram
26
6. Discussion
6.1 Age Constraints of Sedimentation in the Kurnool Sub-Basin
The Kurnool Group is thought to be Neoproterozoic in age. Previously the only age
constraints available have been from fossils (Gupta, 1998; Sharma & Shukla, 1999) and age
constraints from the Cuddapah Supergroup (Crawford & Compston, 1972; Chalapathi Rao et
al, 1995; Chaudhuri, et al. 1999; Chakraborty et al, 2010; Mackintosh, 2010). Sediments from
the Banaganapalle Formation, Panium Formation and Narji Limestone have been dated using
detrital zircon U-Pb ages, and O and C stable isotopes.
U-Pb detrital zircon dating of the Banaganapalle Formation produced a maximum
depositional age of 2516 ± 19 Ma. This shows that the Kurnool Group is younger than the
Archaean. It does not provide a good constraint of the deposition of the Kurnool Group as
there are no other igneous events which can constrain it further.
Carbon and oxygen stable isotope data from carbonate facies in the Narji Formation has
provided data for the time of deposition. From the data showing a shift in δ13Ccarb values from
~ 0 ‰ to +2.5 ‰ we can deduce that the carbonates were deposited in the isotopically
subdued area in the Mesoproterozoic to the Early Neoproterozoic (Kah et al, 1999; Frank et
al, 2003). Due to limitations in collecting data there could not be a more precise time width.
Further studies including strontium (Sr) isotopes will advance this knowledge.
6.2 Deposition of the Kurnool Group
The sediments in the Kurnool Group go from conglomerate to two cycles of sandstone,
limestone and shale. This represents two transgressional/regressional events caused by
sediment barriers, a reduction in energy, lack of sedimentation or rise and drop in sea level. It

Sedimentology, Age and Stable Isotope Evolution of the Kurnool Group, Cuddapah Basin
27
is still uncertain which of these scenarios can be agreed upon given the data available. The
deposition relates to a sub-tidal environment due to the deepening water and a trend from a
beach environment to a deepwater environment and back to a beach setting from the
Banaganapalle Formation to the Panium Formation. Very little is known about the nature of
the boundary between the Panium and the Koilkuntla Limestone and the relationship between
the Koilkuntla Limestone and the Nandyal Shale.
In relation to the spatial disposition there is a possibility that the sediments are not vertically
adjacent. Due to the nature of the Koilkuntla Limestone and the Nandyal Shale, it is possible
that parts of the Kurnool Group were deposited laterally, where the Panium and the
Koilkuntla are horizontally adjacent along the sub basin, with a transition into the overlying
Nandyal Shale. The quartzite would represent shallow areas of the basin, where as the
limestone would represent distal areas.
6.3 Provenance of the Kurnool Group Sediments
The provenance of the Kurnool Group sediments was found using detrital zircon U-Pb and Hf
isotope data and U, Th and K data collected in the field
The maximum depositional ages from the Banaganapalle Formation suggest that the
sediments are sourced from the Dharwar Craton. Out of the two Banaganapalle samples the
maximum depositional ages were 2516 ± 19 Ma (CU10-05) and 2542.3 ± 17.71 Ma (CU10-
06). These ages are most likely from the Dharwar Craton, sourced from the volcano-
sedimentary greenstone belts (3000-2500 Ma, Taylor et al, 1984; Raase et al, 1986;
Radhakrishna & Naqvi, 1986; Anil Kumar et al, 1995) or the cal-alkaline to potassium rich
granitic intrusion (2500-2600 Ma, Rogers, 1986; Jayanada et al, 2000).

C. Bertram
28
The Panium Quartzite shows a group of zircon grain U-Pb ages at around 2500 Ma, and two
younger zircon grain U-Pb ages at 2060.9 ± 22.38 Ma and 2161.7 ± 19.1 Ma. The Dharwar
Craton shows a U-Pb age for the greenstone belt between 2600 – 2500 Ma (Ramakrishnan &
Vaidyanadhan, 2008) and this data suggests that the greenstone belt is the source region for a
high amount of the sediment in the Panium Quartzite. This may also relate to the other Rb-Sr
age at 2.5 – 2.4 Ma age of the Mahbubnagar dyke swarm. The two younger ages may also be
from the Mahbubnagar dyke swarm. From this data it is clear that the Banaganapalle
Formation and the Panium Quartzite are most likely sourced from the Dharwar Craton.
Additional constrains on the source of sediments can be provided with Hf isotope data
(Andersen, 2005; Howard et al, 2009; Veevers et al, 2004; Belousova et al, 2009). Hf isotope
data was yielded from samples of the Banaganapalle Formation and the Panium Quartzite.
The εHfT values range from + 0.4 to +18.3 at the crystallisation ages of 2500-3400 Ma for
sample from the Banaganapalle Formation (Fig 10). The Panium Quartzite sample has a
mixed source, as some εHfT values cluster near the CHUR normalised curve (-6 to +3.4 at the
crystallisation ages of 2060 - 3250 Ma) and with scattered values closer to the depleted
mantle normalisation curve (Fig. 10). 176Hf/177Hf zircon grains from both samples are
characterised by 3.2 to 2.6 Tc (DM) crustal evolution lines (Fig. 11). This shows that there is
juvenile and evolved input with major crustal reworking between 3.2 and 2.6 Ga.
Pre-existing Hf isotope and Nd data for the Eastern Ghats and Dharwar Craton can correlate
this Hf isotope data with possible source regions. Zircons from the metapelites in the Eastern
Ghats Belt lie between 2.7 and 1.9 crustal evolution lines indicating late Archaean to
Mesoproterozoic juvenile provenance with major crust formation between 2.7 and 1.9 Ga
(Upadhyay, 2009). Metasediments in the Ongole Domain of the Eastern Ghats have Nd

Sedimentology, Age and Stable Isotope Evolution of the Kurnool Group, Cuddapah Basin
29
model ages of 2.6 to 2.8 Ga, which are similar to the adjoining Dharwar Craton granitoids
(Rickers et al, 2001). It is expected that the Dharwar Craton would show an evolved terrain
with Nd and Hf isotope values near the CHUR normalised curve and also areas of juvenile
terrain where there has been mantle activity, whereas the Eastern Ghats (Ongole Domain)
will show an evolved domain with negative εHfT values, and not much juvenile terrain. In
relation to possible events which may have produced zircons, The Dharwar Craton and
Eastern Ghats both have very different zircon-forming event ages. The minimum age of the
Dharwar Craton tonalitic–trondhjemitic–granodioritic basement is 3127 Ma. As well as this,
the Peninsular Gniess is aged between 3000 – 3400 Ma (Meen et al, 1992; Peucat et al, 1993;
Jayananda et al, 2000). In the significant parts of the Eastern Ghats (Ongole, Vinjamuru and
Udayagiri Domains) event ages range from 1868 ± 6 to ~1100 Ma (Simmat & Raith, 2008;
Upadhyay et al, 2009; Vasudevan et al, (in press), quoted in Dobmeier et al, (2006)).
Considering all the data collected for the Banaganapalle Formation are all above the CHUR
normalised curve, these grains are showing an Hf isotope signature similar to that of the
Dharwar Craton. The Panium values are more scattered but these Hf isotope values reflect the
Dharwar Craton composition due to a mixed source of high crustal depletion as well as
juvenile input. Since the Tc (DM) are 3.2 to 2.6 this shows that it is too old to have been formed
in the Eastern Ghats. The Dharwar Craton appears to be the source terrain due to older
zircon-forming events.
Nd-model ages calculated for the Eastern Ghats have shown that there is an older group from
2.9 to 3.9 Ga (Rickers et al, 2001). This is said to represent the granitoids from the Dharwar
and Eastern Indian Cratons and orthogneisses from the Eastern Ghats Belt. This shows that
C. Bertram
30
although the ages that have been yielded show distinctly Dharwar Craton ages, they may still
be sourced from the Eastern Ghats terrain.
Evidence from ripples in the Banaganapalle Formation suggest that water was flowing east
and west as only symmetric ripples were visible (Table 3). This agrees with Madhava Rao &
Gokhale (1973) who have also observed that the current was from the west to east due to
ripples in the Banaganapalle Formation, which is consistent with the sediments being sourced
from the Dharwar Craton.
Th, U and K GRS data was acquired through the Kurnool Group and has yielded data on the
properties of this group (Table 4.). The Eastern Ghats generally has an average value for U
found in metamorphic rocks and a high Th value due a terrain rich in monazite (Barker,
2010). The Th/U ratio for the Eastern Ghats is on average in the 20’s (Barker, 2010). In the
calcareous shale and the mud-rich shale there were Th/U ratios of 10-20. These values do not
show any distinct signature for the Eastern Ghats. One GRS log in the silicate limestone
yielded a Th value of 27.1 ppm, and a U value of 0.4 ppm. The Th/U ratio is 67.8. Another
GRS log in the calcareous shale yielded U values of 0.2 ppm and Th values of 14.7 ppm
which totals a Th/U ratio of 73. Due to the nature of the gamma ray spectrometer, I can
assume that Th may be read by the gamma ray spectrometer instead of U and provide
incorrect data. Due to the random nature of these values, it is unlikely that these values hold
any confidence unless more data is acquired.

Sedimentology, Age and Stable Isotope Evolution of the Kurnool Group, Cuddapah Basin
31
6.4 Petroleum Potential
The Kurnool Group goes through two stages of limestone deposition due to multiple
transgression-regression events. These two unmetamorphosed limestones, Narji and
Koilkuntla, may be a petroleum source. The Cuddapah Basin is grouped under Category IV
by the Directorate General of Hydrocarbons, India, which means that it has a possible
existence of hydrocarbons (Bastia, 2006). The Narji Limestone was the most well researched
limestone in this study. The organic matter in the Narji has not been buried but remineralised
in an environment. It is possible that this would be a rich gas reservoir if leakage has not
taken place, although most Proterozoic basins are overmature and barren. Lying on top of the
Narji Limestone is the Auk Shale, which could provide a potential seal for the reservoir. A
potential trap could be the Panium Sandstone. If the Narji is deposited close to the Nallamali
Fold Belt then there is a chance that there might be faulting or fracturing within the Panium
which may cause a structural trap for the reservoir. Stratigraphic traps may also exist at the
edges of the depositional area.
Although this may not be a conventional petroleum reservoir there is still the possibility that
it could be used for in inventional shale gas. If the limestone is buried to a depth below
~1000m then there is a possibility that this could be used for petroleum resources. Further
work should be completed to discover faults and fractures and confirm reservoir, seals and
traps.
C. Bertram
32
7. Conclusion
The main findings of this study are:
• The sediments from the Banaganapalle Formation and Panium Quartzite are sourced
fromthe Dharwar Craton, based on U-Pb ages and Hf isotope data.
• Deposition of these sediments was in the Mesoproterozoic to the early
Neoproterozoic, based on O and C stable isotopes.
• The sediments were deposited in a sub-tidal environment, ranging from a beach
environment to a deep sub-tidal environment.
• There may be a chance of a petroleum reservoir due to the potential seal and trap
formed by the sediments of the Kurnool Group.
8. Acknowledgements First and foremost I thank my supervisors Alan Collins and Guillaume Backé, and my
unofficial supervisor Galen Halverson, for assistance in the field and guiding me through the
year in Adelaide - no matter where they were in the world. Thank you to the Geological
Society of Australia for financial support and the Australian Government for supporting this
work through an Australia India Strategic Research Fund Grant. In the field I was grateful for
the help of Indian academics Sarbani Patranabis Deb and Dilip Saha, as well as the motivated
Julie Mackintosh who, despite sickness, helped me a lot in the field. Thanks must go to Justin
Payne for all his help this year from lab work to proof reading. Thanks must go to Grant Cox
at L'Université du Québec à Montréal for doing the Carbon and Oxygen stable isotopes. I
would also like to thank Adelaide Microscopy, especially Ben Wade and Angus Netting for
all the early morning and late night assistance. I would like to thank Julie Mackintosh and
Billy Reid for many discussions, as well as all of Honours 2010 for making it a very fun year.
And last but not least I would like to thank my parents for their support emotionally and
financially. They are always there to motivate me to do better. I would also like to thank
Robert Barteletti for putting up with me when I was stressed and listening when I ranted

Sedimentology, Age and Stable Isotope Evolution of the Kurnool Group, Cuddapah Basin
33
about my thesis, as well as family and friends any anyone else who asked how the thesis was
going.

C. Bertram
34
9. References
Anderson T., 2005. Detrital zircons as tracers of sedimentary provenance: limiting
conditions from startistics and numerical simulation. Chemical Geology, 216, 249-270.
Barker, A., 2010. The thermal properties, temperature structure and thermal evolution of the
Eastern Ghats, India. Unpublished.
Bartley J. K., Semikhatov M. K., Kaufman A. J., Knoll A. H., Pope M. C., and Jacobsen S.
B., 2000. Global events across the Mesoporterozoic-Neoproterozoic boundary: C and Sr
isotopic evidence from Siberia. Precambrain Research 111, 165-202.
Bastia R., 2006. An overview of Indian sedimentary basins with special focus on emerging
east coast deepwater frontiers. The Leading Edge, 818-829.
Belousova E. A., Reid A. J., Griffin W. L., and O’Reilly S. Y., 2009. Rejuvenation vs.
Recycling of Archaean cryst in the Gawler Craton, South Australia: Evidence from U-Pb and
Hf isotopes in detrital zircon. Lithos, 113, 570-582.
Chalapathi Rao N. V., Miller J. A., Pyle D. M., Madhavan V., 1995. New Proterozoic K-Ar
ages for some kimberlites and lamproites from the Cuddapah Basin and Dharwar Craton,
South India: evidence for non-contemporaneous emplacement. Precambrian Research 79,
363-369.
Chakraborty P. P., Dey S., and Mohanty S. P. 2010. Proterozoic platform sequences of
Peninsular India: Implications towards basin evolution and supercontinent assembly. Journal
of Asian Earth Sciences, unpublished.
Chatterjee N. and Bhattacharji S. 2001. Petrology, geochemistry and tectonic settings of the
mafic dikes and sills associated with the evolution of the Proterozoic Cuddapah Basin of
south India. Proc. Indian Acad. Sci. 110, 433-453.
Chaudhuri A. K., Mukhopadhyay J., Patranabis Deb S., Chanda S. K. 1999. The
Neoproterozoic Cratonic Successions of Peninsular India. Gondwana Research 2, no. 2, 213-
225.
Sedimentology, Age and Stable Isotope Evolution of the Kurnool Group, Cuddapah Basin
35
Chaudhuri A. K., Saha D., Deb G. K., Patranabis Deb S., Mukherjee M. K. and Ghosh G.,
2002. The Purana Basins of Southern Cratonic Provinve of India – A Case for
Mesoproterozoic Fossil Rifts. Gondwana Research 5, 23-33.
Craig H. 1957. Isotopic Standards For Carbon And Oxygen And Correction Factors For
Mass-Spectrometric Analysis Of Carbon Dioxide. Geochimica Et Cosmochimica Acta 12,
133-149.
Crawford, A. & Compston, W. (1973). The age of the Cuddapah and Kurnool systems,
southern India. Journal of the Geological Society of Australia, 19, 453-464.
Dasgupta P. K., Biswas A., and Mukherjee R. 2005. Cyclicity in Paleoproterozoic to
Neoproterozoic Cuddapah Supergroup and its Significance in Basinal Evolution.
Dobmeier C. J., and Raith M. M. 2003. Crustal architecture and evolution of the Eastern
Ghats Belt and adjacent regions of India. Geological Society of London, Special
Publications, 206, 145-168.
Frank T. D., Kah L. C. and Lyons T. W., 2003. Changes in organic matter production and
accumulation mechanismfor isotopic evolution in the Mesoporterozoic. Geol. Mag. 140, 397-
420.
Griffin W. L., Pearson N. J., Belousova E., Jackson S. E., Van Achterbergh E., O'Reilly S. Y.
& Shee S. R. 2000. The Hf isotope composition of cratonic mantle: LAM-MC-ICPMS
analysis of zircon megacrysts in kimberlites. Geochimica Et Cosmochimica Acta 64, 133-
147.
Griffin W. L., Powell W. J., Pearson N. J. & O'Reilly S. Y. (Editors) 2008. GLITTER: Data
Reduction Software for Laser Ablation ICP-MS. (Laser Ablation ICP-MS in the Earth
Science: Current Practices and Outstanding Issues). Mineralogical Association of Canada,
Ottowa.
Gupta A., 1997. Primordial Storms: An Overview of Depositional Environment in Mid-Late
Proterozoic Platforms of India. Gondwana Research 1, 291-298.
C. Bertram
36
Halverson G. P., Maloof A. C., Schrag D. P., Dudás F. Ö. and Hurtgen, M., 2006.
Stratigraphy and geochemistry of a ca 800 Ma negative carcon isotope interval in
northeastern Svalbard. Chemical Geology, 237, 23-45.
Howard K. E., Hand M., Barovich K. M., Reid A., Wade B. P. and Belousova E. A., 2009.
Detrital zircon ages: Improving interpretation via Nd and Hf isotopic data. Chemical
Geology 262, 277-292.
Jackson S. E., Pearson N. J., Griffin W. L. And Belousova E. A. 2004. The application of
laser ablation-inductively coupled plasma-mass spectrometry to in-situ u-Pb zircon
geochronology. Chemical Geology 211 (1-2), 47-69.
Jayananda M., Moyen J. –F., Martin H., Peucat J. –J., Auvray B., and Mahabaleswar B.,
2000. Late Archean (2550 – 2520 Ma) juvenile magmatism in the Eastern Dharwar craton,
southern India: constrains from geochronology, Nd-Sr isotopes and whole rock
geochemistry. Precambrian Research 99, 225-254.
Kah L. A., Sherman A. G., Narbonne G. M., Knoll A. H. And Kaufman A. J., 1998. δ13C
stratigraphy of the Proterozoic Bylot Supergroup, Baffin Island, Canada: implications for
regional lithostratigraphic correlations. Canadian Journal of Earth Science 36, 313-332.
Kailasam, L.N. 1976. Geophysical studies of the major sedimentary basins of the Indian
craton, their deep structural features and evolution. In: M.H.P. Bott (editor), Sedimentary
Basins of Continental Margins and Cratons. Tectonophysics, 36 (l-3): 225-245
Kumar A., Bhaskar Rao Y. J., Sivaraman T. V., and Gopalan K 1996. Sm-Nd ages of Archean
metavolcanics of the Dharwar Craton, South India. Precambrian Research 80, 205-216.
Ludwig K. R., 2000. Decay constant errors in U-Pb Concordia-intercept ages. Chemical Geology,
166, 315-318.
Madhava Rao D. and Gokhale K. V. G. K., 1973. Ripple marks in quartzites from Kurnool
Supergroup, Cuddapah Basin, India. Journal of Sedimentary Petrology 43 1122-1124.
Mackintosh J. N., 2010. Age and basin Evolution of the Cuddapah Basin, India. Unpublished.
Sedimentology, Age and Stable Isotope Evolution of the Kurnool Group, Cuddapah Basin
37
Meen J. K., Rogers J. J. W., and Fullagar P. D., 1992. Lead isotopic compositions of the Western
Dharwar Craton, southern India: Evidence for distinct Middle Archean terranes in a Late Archean
craton. Geochimrca ei Cosmockimico Acla, 56, 2455-2470.
Meert J. G., Pandit M. K., Pradhan V. R., Banks J., Sirianni R., Stroud M., Newstead B., and
Gifford J. 2010. Precambrian crustal evolution of Peninsular India: A 3.0 billion year
odyssey. Journal of Asian Earth Sciences, unpublished.
Meijerink A.M.J, Rao D.P, and Rupke J. 1985. Stratigraphic and structural development of
the Precambrian Cuddapah basin, S.E. India. Precambrian Research, 26, 57-97.
Mukhopadhyay D. and Basak K., 2009. The Eastern Ghats Belt...A Polycyclic Granulite
Terrain. Journal Geological Society of India, 73, 489-518.
Murthy, Y. G. K. 1978. Salient features of the revised geological map of the Cuddapah basin.
3rd Workshop on Status, Problems and Programmes in Indian Peninsular Shield. Institute of
Indian Peninsular Geology, Hyderabad, 1-21.
Naganjaneyulu K. and Harinarayana, T. 2004. Deep Crustal Electrical Signatres of Eastern
Dharwar Craton, India. Gondwana Research 7, 951-960.
Pandey B.K., Gupta J.N., Sarma K.J., Sastry C.A. 1997. Sm-Nd, Pb-Pb and Rb-Sr
geochronology and petrogenesis of the mafic dyke swarm of Mahbubnagar, South India:
implications for Paleoproterozoic crustal evolution of the Eastern Dharwar Craton.
Precambrian Research 84 181 – 196
Peucat J. J., Mahabaleswar B. And Jayananda M., 1993. Age of younger tonalitic magmatism
and granulitic metamorphism in the South Indian transition zone (Krishnagiri area);
comparison with older Peninsular gneisses from the Gorur-Hassan area. Journal of
Metamorphic Geology, 11, 879-888.
Payne J. L., Barovich K. M., and Hand M., 2006. Provenance of metasedimentary rocks in
the nornthern Gawler Craton, Australia: Implications for Palaeoproterozoic reconstructions.
Precambrian Research, 148, 275-291.
C. Bertram
38
Raase, P., Raith, M., Ackermand, D. and Lal, R.K., 1986. Progressive metamorphism of
mafic rocks from greenschist to granulite facies in the Dharwar craton of south India. J
Geol., 94, 261-282.
Radhakrishna B. P. And Naqvi S. M., 1986. Precambrian Continental Crust and Its
Evolution. The Journal of Geology, 94, 145-166.
Raman P.K., Murty, V.N., 1997. Geology of Andhra Pradesh. Geological Society of India, Bangalore.
Rickers K., Mezger K. and Raith M. M. 2001. Evolution of the Continental Crust in the Proterozoic eastern Ghats Belt, India and new constrains for Rodinia reconstruction: implications from Sm-Nd, Rb-Sr and Pb-Pb isotopes. Precambrian Research, 112, 183-210.
Rogers J. J. W. 1986. The Dharwar Craton and the Assembly of Peninsular India. The Journal of Geology, 94, 129-143.
Segal I., Halicz L. & Platzner I. T. 2003. Accurate isotope ratio measurements of ytterbium
by multiple collection inductively coupled plasma mass spectrometry applying erbium and
hafnium in an improved double external normalization procedure. Journal of Analytical
Atomic Spectrometry 18, 1217-1223.
Sharma M. And Shulka M., 1999. Carbonaceous mega remains from the Neoproterozoic
Owk Shale Fomration of the Kurnool Group, Andhra Pradesh, India. Current Science, 79,
1247-1251.
Simmat R. And Raith M. M., 2007. U-Th-Pb monazite geochronometry of the Eastern Ghats
Belt, India: Timing and spatial disposition of poly-metamorphism. Precambrian Research,
162, 16-39.
Singh A. P. And Mishra D. C. 2001. Tectonosedimentary evolution of Cuddapah basin and
Eastern Ghats mobile belt (India) as Proterozoic collision: gravity, seismic and geodynamic
constraints. Journal of Geodynamics 33, 249-267.
Sláma J., Kosler J., Condon D. J., Crowley J. L., Gerdes A., Hanchar J. M., Horstwood M. S.
A., Morris G. A., Nasdala L., Norberg N., Schaltegger U., Schoene B., Tubrett M. N. &

Sedimentology, Age and Stable Isotope Evolution of the Kurnool Group, Cuddapah Basin
39
Whitehouse M. J. 2008. Plešovice zircon -- A new natural reference material for U-Pb and
Hf isotopic microanalysis. Chemical Geology 249, 1-35.
Taylor, P.N., Chadwick, B., Moorbath, S., Ramakrishnan, M. and Viswanathal, M.N., 1984.
Petrography, chemistry and isotopic ages of Peninsular gneiss, Dharwar acid volcanic rocks
and the Chitradurga granite with special reference to the late Archaean evolution of the
Karnataka craton, Southern India. Precambrian Res., 23, 349-375.
Upadhay D., Gerdes A. And Raith M. M. 2009. Unravelling Sedeimentary Provenanse and
Tectonothermal History of High Temperature Metapelies, Using Zircon and Monazite
Chemistry: A Case Study from the Eastern Ghats Belt, India. Journal of Geology, 117, 665-
683.
Vasudevan, D., Kröner, A.,Wendt, I.,Tobschall, H., in press. Geochemistry, petrogenesis and age of felsic to intermediate metavolcanic rocks from the Palaeoproterozoic Nellore Schist Belt, Vinjamur, Andhra Pradesh, India, J. Asian Earth Sciences.
Veevers J. J., Saeed A., Belousova E. A., and Griffin W. L., 2004. U-Pb ages and source composition by Hf-isotope and trace-element analysis of detrital zircons in Permian sandstone and modern sand from southwestern Australia and a review of the paleogeographical and denudational history of the Yilgarn Craton. Earth Science Reviews, 68, 245-279.
Vervoort, J. D., Patchett P. J., Söderlund U., and M. Baker 2004. Isotopic composition of Yb
and the determination of Lu concentrations and Lu/Hf ratios by isotope dilution using MC-
ICPMS, Geochem. Geophys. Geosyst., 5, Q11002, doi:10.1029/2004GC000721.
Zachariah J. K., Bhaskar Rao Y. J., Srinivasan R., Gopalan K., 1999. Pb, Sr and Nd isotope
systematic of uranium mineralised stromatolitic dolomites from the Proterozoic Cuddapah
Supergroup, south India: constrains on age and provenance. Chemical Geology 162, 49-64.
C. Bertram
40
10. Figure Captions
Figure 1. Simple map fo India, showing the relationship between the Cuddpah Basin, Eastern Ghats and the Dharwar Craton.
Figure 2. Map of the Cuddpah Basin showing the main basin and the two sub-bains. The light grey dots indicate the location areas.
Figure 3. Photographs of facies characteristics in the Kurnool Group; A) isolated clatsts, B) fine and course grains, C) trough cross bedding, D) cross bedding, E) intraclasts insilicate limestone, F) ribbons, G) hummocky cross stratification, H) clay beds in silicate limestone, I) grainstone, J) maximum flooding surface suspension bedding, K) massive sandstone and L) characteristic mud-rich shale.
Figure 4. Key for sedimentary logs showing the type of facies and sedimentary structures.
Figure 5. Stratigraphic log of Narji 1 shows the tranision between Banaganapalle Formation and the Narji Limestone, at the bottom of the Kurnool Group. The key for the sedimentary structures and facies is given in Figure 4. Facies descriptions are given in text. GRS data is shown in Total, K, U and Th and this significance of this is discussed in text. There were no samples taken throughthis section.
Figure 6. Stratigraphic log of Narji 2 shows the transition between the Narji, Auk and Panium Formations in the middle of the Kurnool Group. The key for the sedimentary structures and facies is given in Figure 4. Facies descriptions are given in text. GRS data is shown in Total, K, U and Th and this significance of this is discussed in text. δ13Ccarb and δ18Ocarb values are plotted in ‰ relative to VPDB (Table 6.), where VPDB is 0‰. The sample for CU10-22 was sampled in this log.
Figure 7. Stratigraphic log of Auk. This shows the relationship between Auk Shale and Panium Quartzite, in the middle of the Kurnool Group. The key for the sedimentary structures and facies is given in Figure 4. Facies descriptions are given in text. GRS data is shown in Total, K, U and Th and this significance of this is discussed in text.
Sedimentology, Age and Stable Isotope Evolution of the Kurnool Group, Cuddapah Basin
41
Figure 8. Graphs of data from CU10-05, CU10-06, CU10-22. a) A concordia plot of the LA-ICPMS U-Pb data of zircons in the lower Banaganapalle Formation (CU10-05). The smaller box shows the Concordia diagram only with 100 ± 10% concordancy. b) Probability density distribution diagram showing 207 Pb/ 206 Pb for sample CU10-05, which is from the Banaganapalle Formation, and it shows that there is a range of possible sources. c) A concordia plot of the LA-ICPMS U-Pb data of zircons in the lower Banaganapalle Formation (CU10-06). The smaller box shows the Concordia diagram only with 100 ± 10% concordancy. d) Probability density distribution diagram showing 207 Pb/ 206 Pb for sample CU10-06, which is also from the Banaganapalle Formation, and it shows that there are two main groups of data which may relate to difference provenances. e) A concordia plot of the LA-ICPMS U-Pb data of zircons in the lower Panium Quartzite (CU10-22). The smaller box shows the Concordia diagram only with 100 ± 10% concordancy. f) Probability density distribution diagram showing 207 Pb/ 206 Pb for sample CU10-22, which is from the Panium Quartzite, and it shows that there is one main group of data.
Figure 9. This graph represents inital U-Pb detrital zircon ages for the LA-ICPMS plotted against the εHf
T and shows where the zircons lie relative to CHUR and depleted mantle (DM).
Figure 10. This shows initial U-Pb detrital zircon ages for the LA-ICPMS plotted against 176Hf/177Hf initial to display the crustal growth lines for average continental crustal 176Lu/177Hf values of 0.0015.
Figure 11. Stable isotope plor for Narji 2 where the δ13Ccarb and δ18Ocarb values are plotted in ‰ relative to VPDB (Table 6.), where VPDB is 0‰.
Figure 12. Stable isotope plot for Narji 3 where the δ13Ccarb and δ18Ocarb values are plotted in ‰ relative to VPDB (Table 6.), where VPDB is 0‰.
Figure 13. Stable isotope plots for both Narji 2 and Narji 3 sections showing the correlation between the two. The two plots show the same trends.

C. Bertram
42
Figure 14. Crossplot of δ13Ccarb against δ18Ocarb for all carbonate samples from the Narji Formation. Values are plotted in ‰ relative to VPDB (Table 6.), where VPDB is 0 ‰.
Sedimentology, Age and Stable Isotope Evolution of the Kurnool Group, Cuddapah Basin
43
11. List of Tables Table 1. Table showing the formations in the Kurnool Group and the significant Cuddapah Supergroup Formations.
Table 2. GPS location of the three stratigraphy logs from the Kurnool Group.
Table 3. Sets of dip/dip direction for ripples in the Banaganapalle Formation.
Table 4. Gamma ray spectrometry data for the facies in the Kurnool Group.
Table 5. U-Pb detrital zircon LA-ICPMS data for samples CU10-05, CU10-06 and CU10-22.
Table 6. Hf isotope LA-MC-ICPMS data for samples CU10-05 and CU10-22.
Table 7. Stable Isotope data for carbonates sampled in Narji 2 and Narji 3.
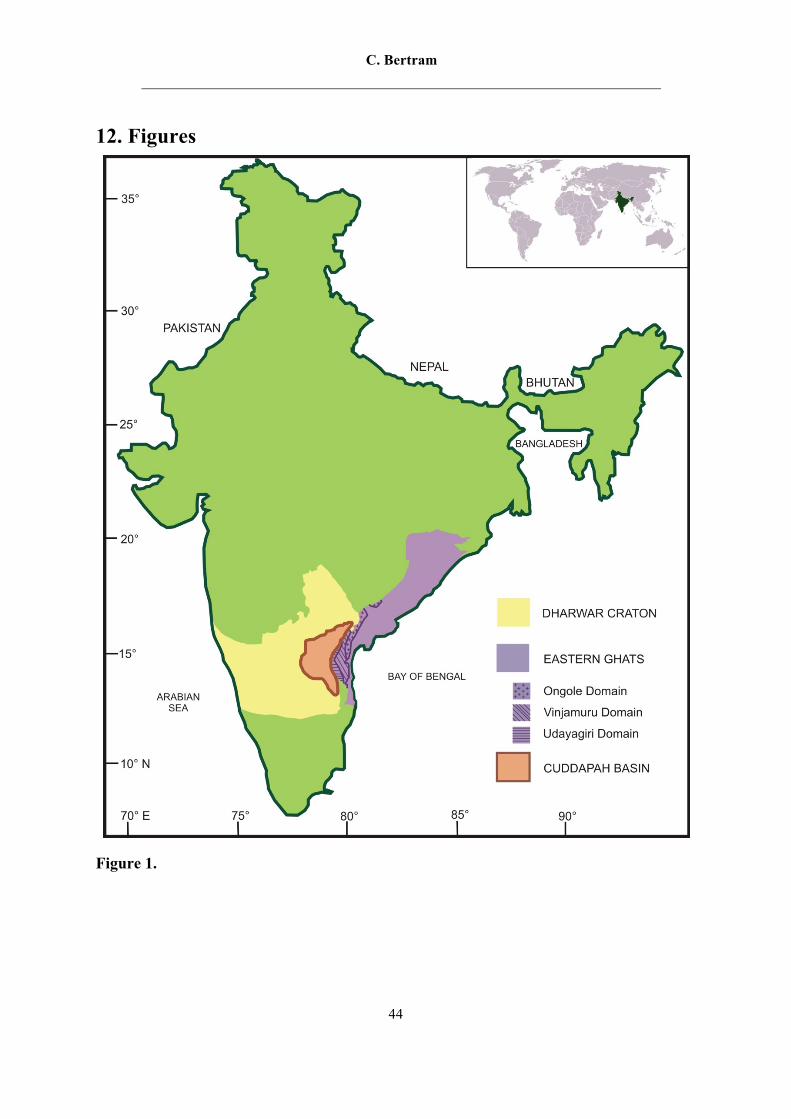
C. Bertram
44
12. Figures
Figure 1.
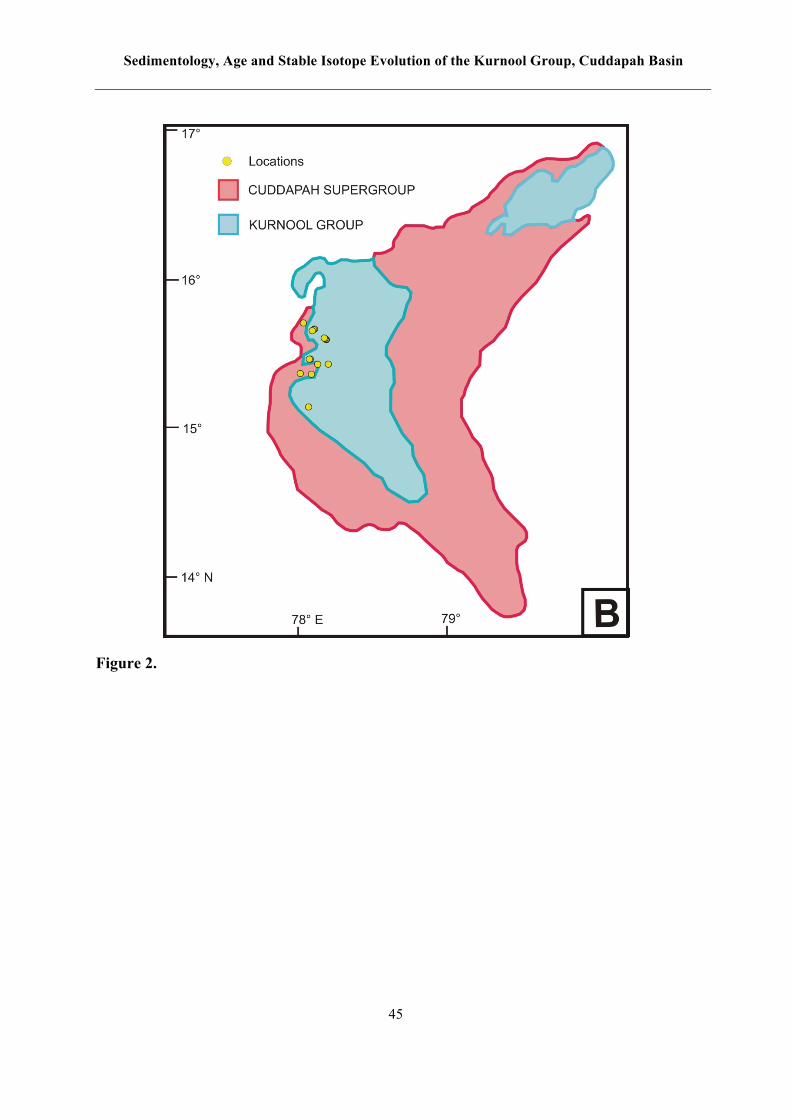
Sedimentology, Age and Stable Isotope Evolution of the Kurnool Group, Cuddapah Basin
45
Figure 2.
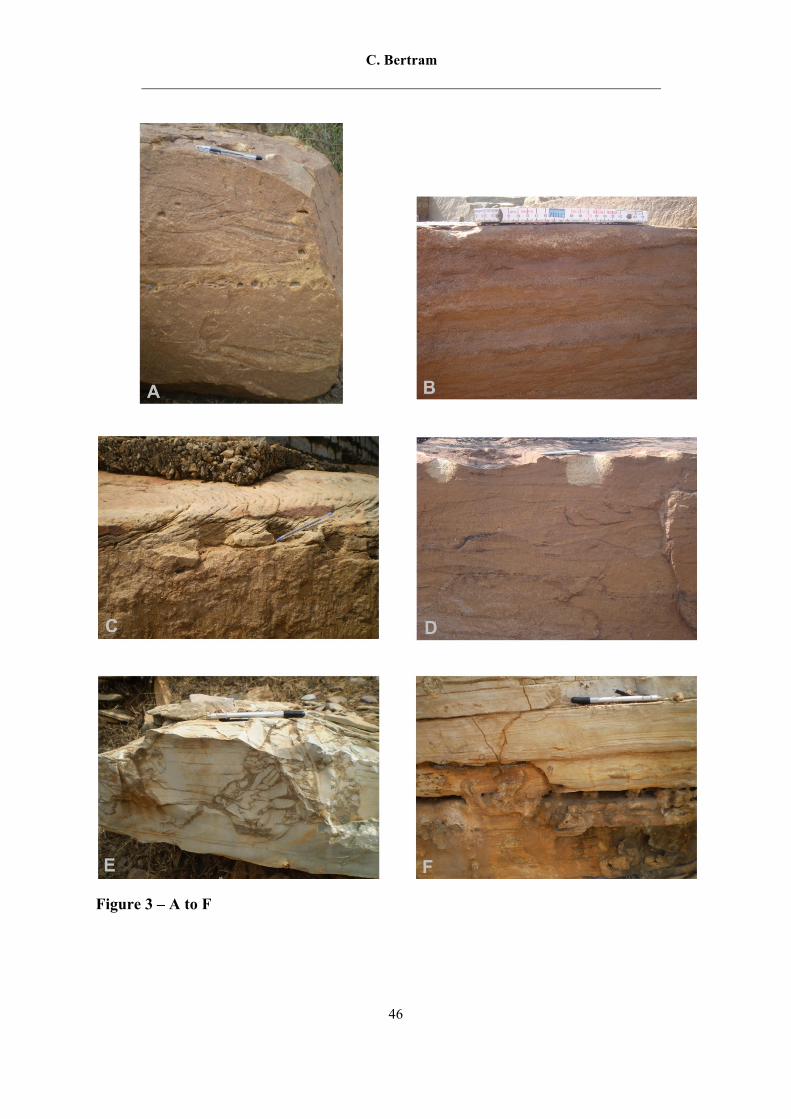
C. Bertram
46
Figure 3 – A to F

Sedimentology, Age and Stable Isotope Evolution of the Kurnool Group, Cuddapah Basin
47
Figure 3 – G to L

C. Bertram
48
Figures 4 and 5.
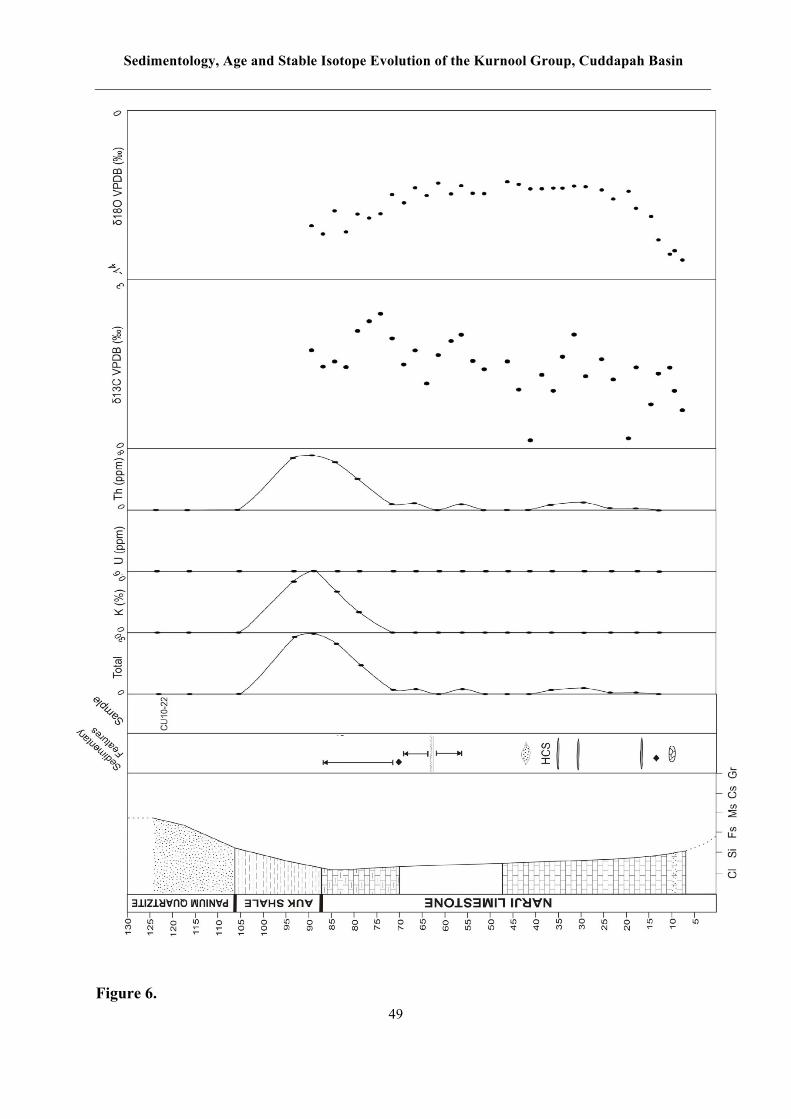
Sedimentology, Age and Stable Isotope Evolution of the Kurnool Group, Cuddapah Basin
49
Figure 6.
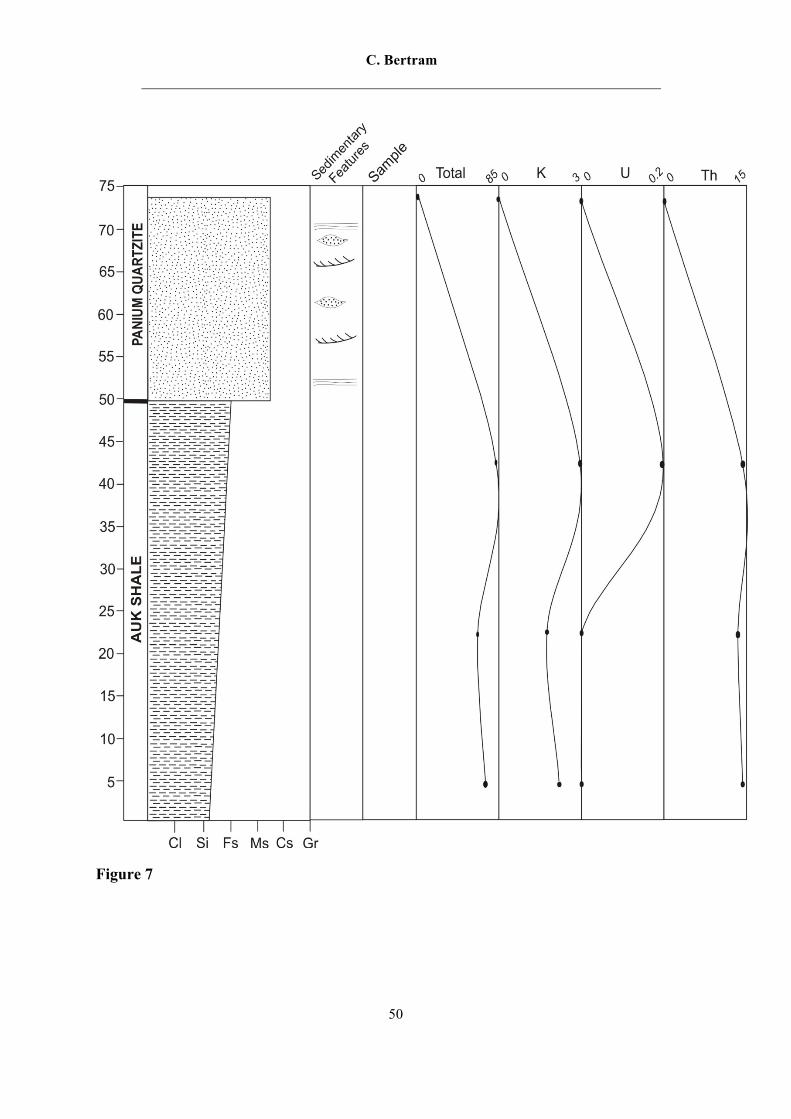
C. Bertram
50
Figure 7

Sedimentology, Age and Stable Isotope Evolution of the Kurnool Group, Cuddapah Basin
51
Figure 8.
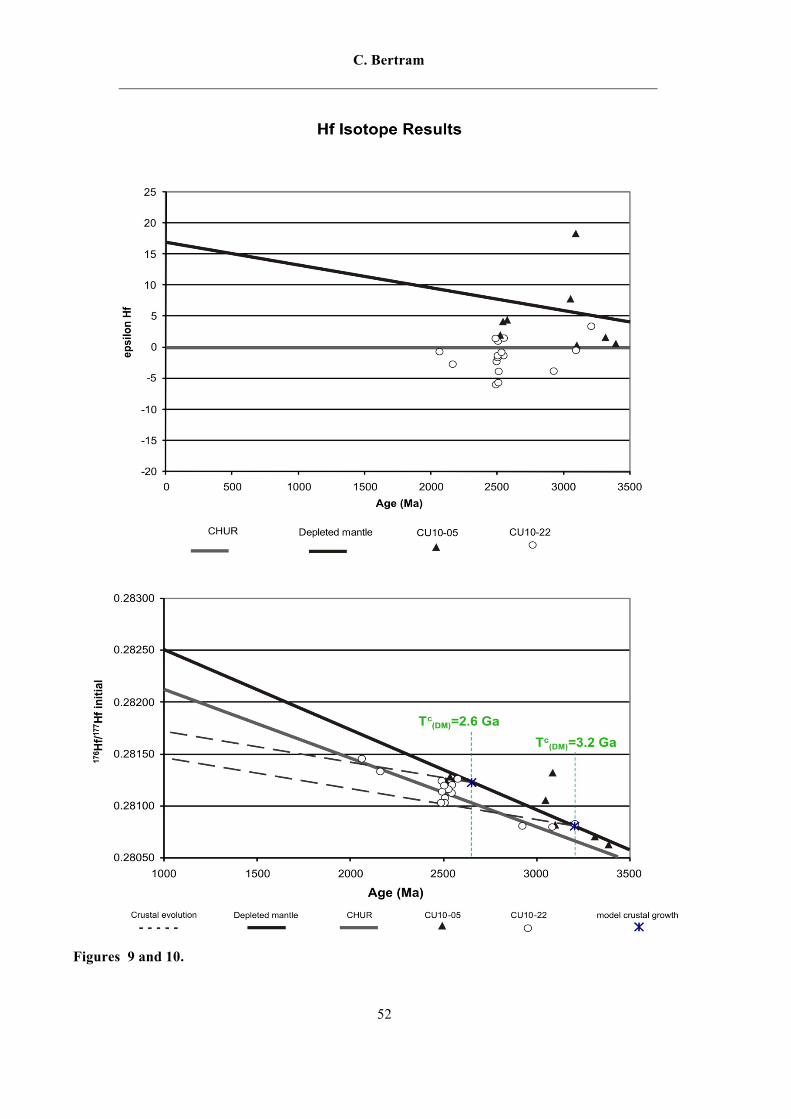
C. Bertram
52
Figures 9 and 10.

Sedimentology, Age and Stable Isotope Evolution of the Kurnool Group, Cuddapah Basin
53
Figure 11.

C. Bertram
54
Figure 12.

Sedimentology, Age and Stable Isotope Evolution of the Kurnool Group, Cuddapah Basin
55
Figure 13.
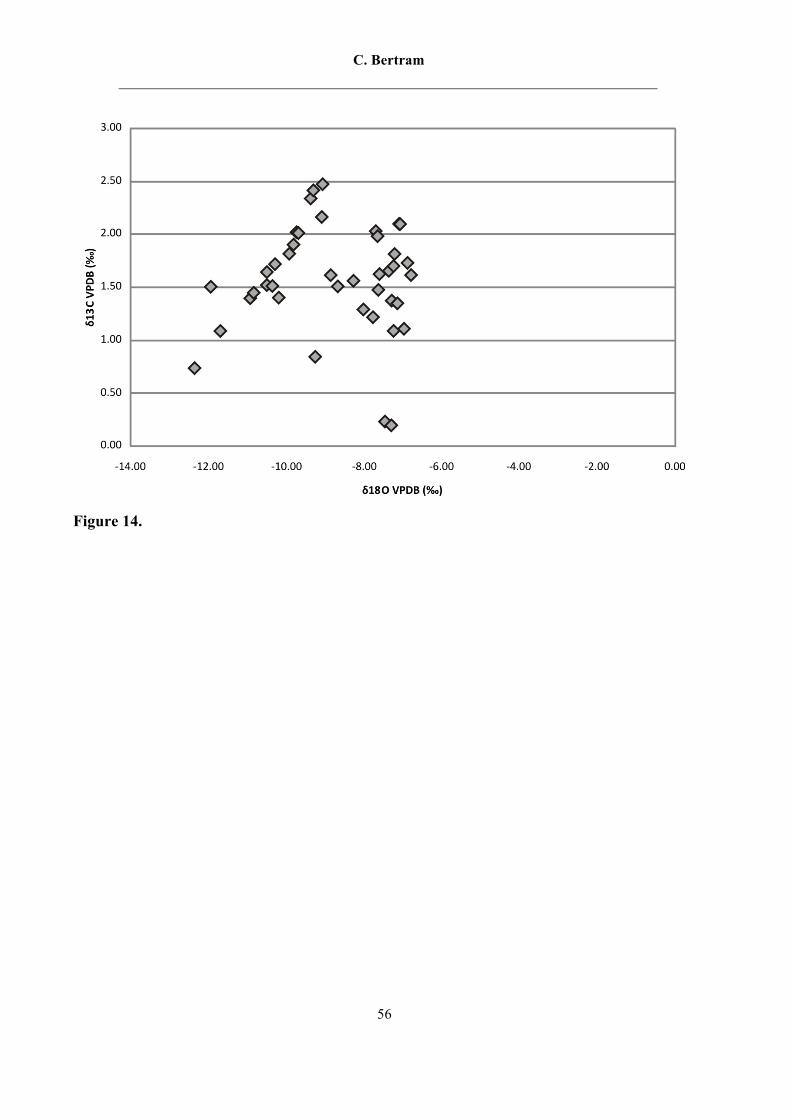
C. Bertram
56
Figure 14.

Sedimentology, Age and Stable Isotope Evolution of the Kurnool Group, Cuddapah Basin
57
14. Tables Table 1.
Table 2.
Table 3.
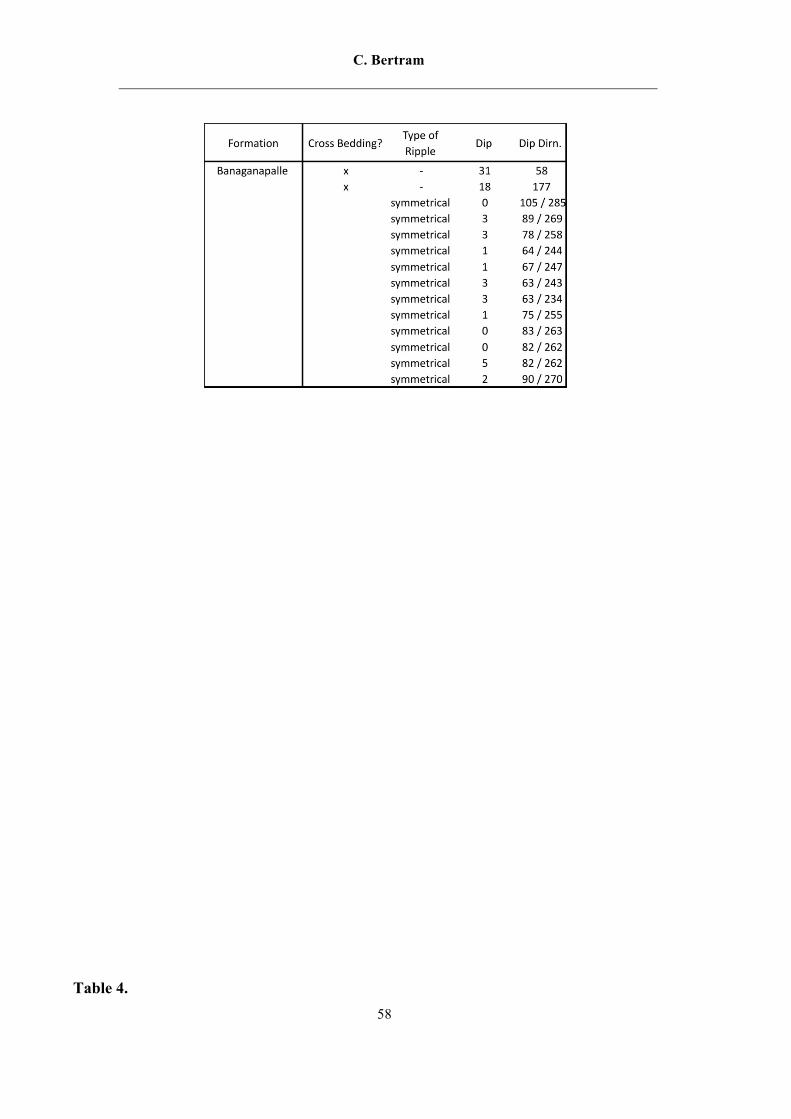
C. Bertram
58
Table 4.

Sedimentology, Age and Stable Isotope Evolution of the Kurnool Group, Cuddapah Basin
59
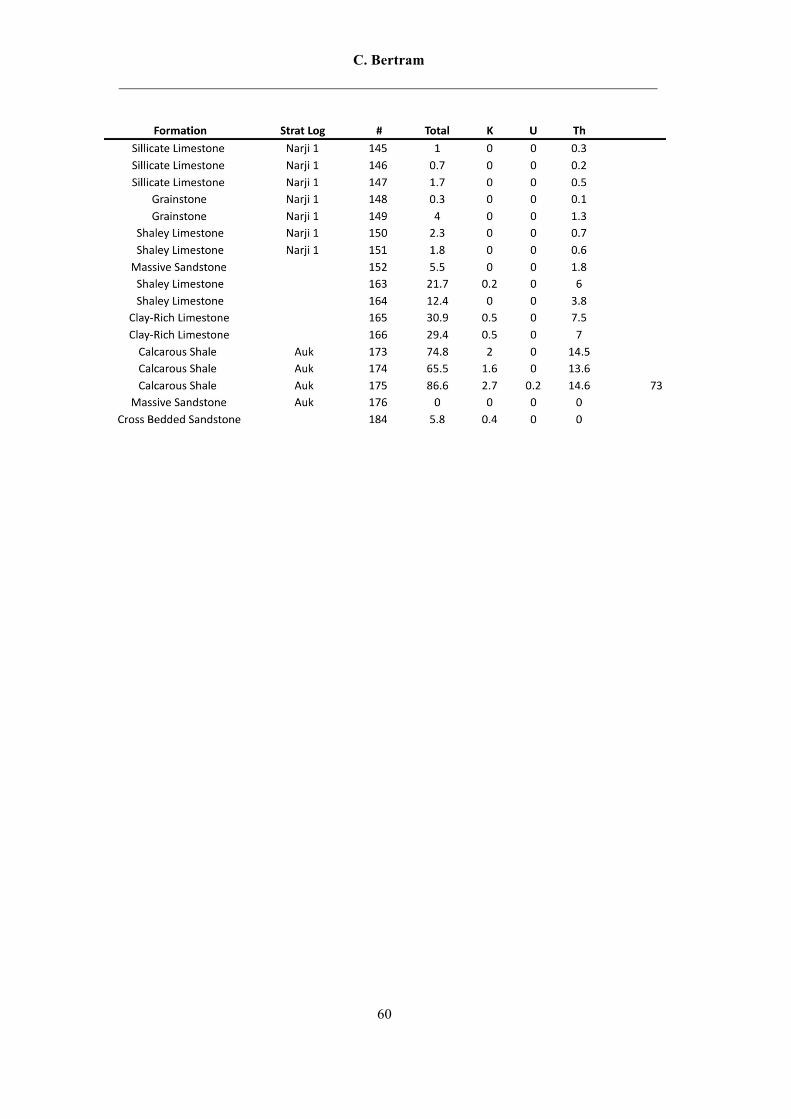
C. Bertram
60
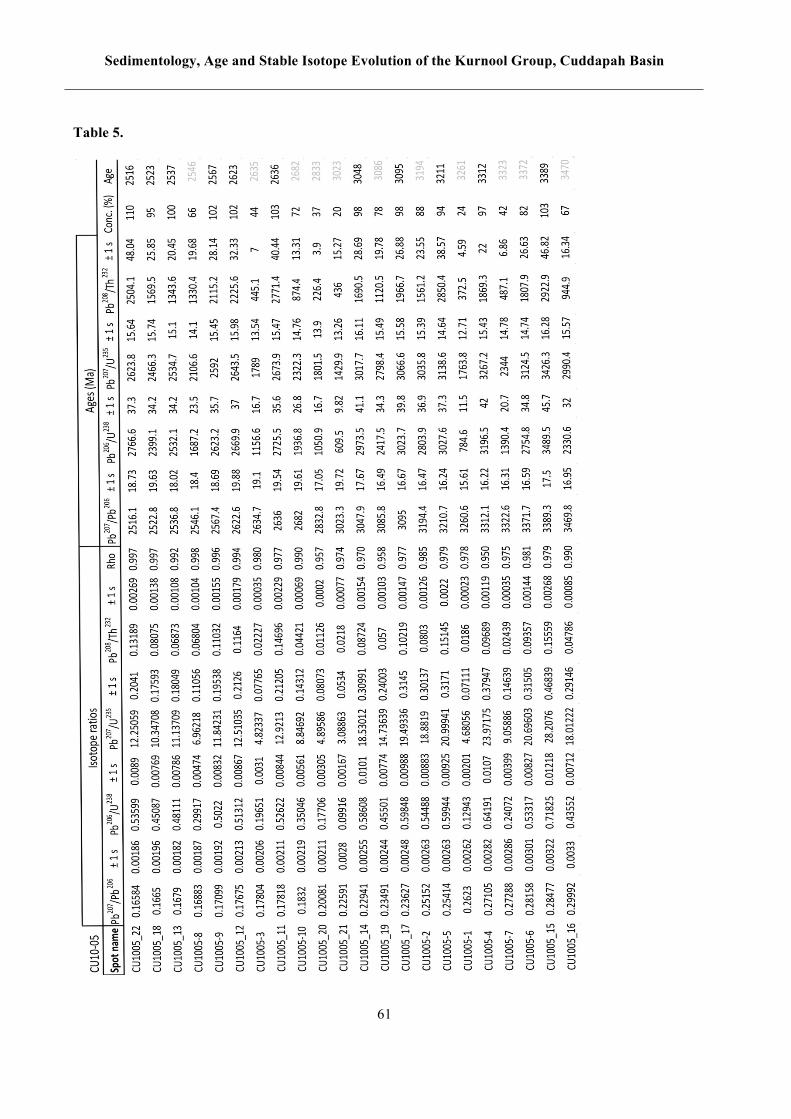
Sedimentology, Age and Stable Isotope Evolution of the Kurnool Group, Cuddapah Basin
61
Table 5.

C. Bertram
62

Sedimentology, Age and Stable Isotope Evolution of the Kurnool Group, Cuddapah Basin
63
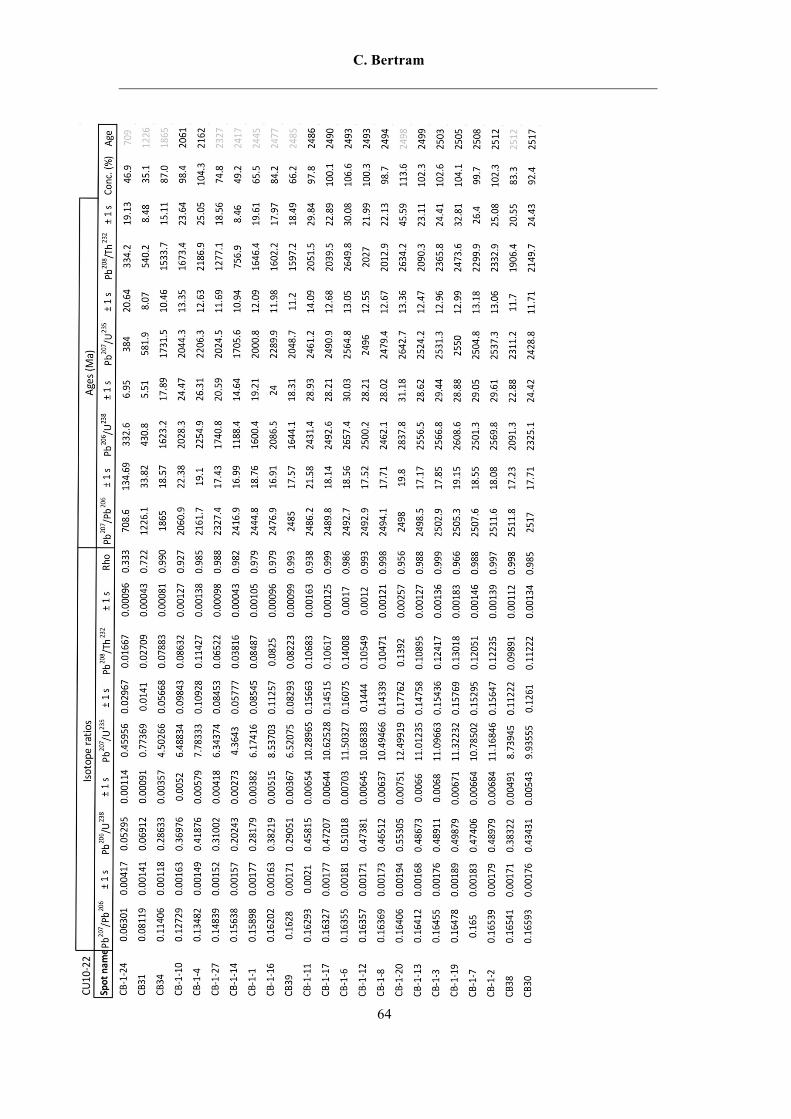
C. Bertram
64
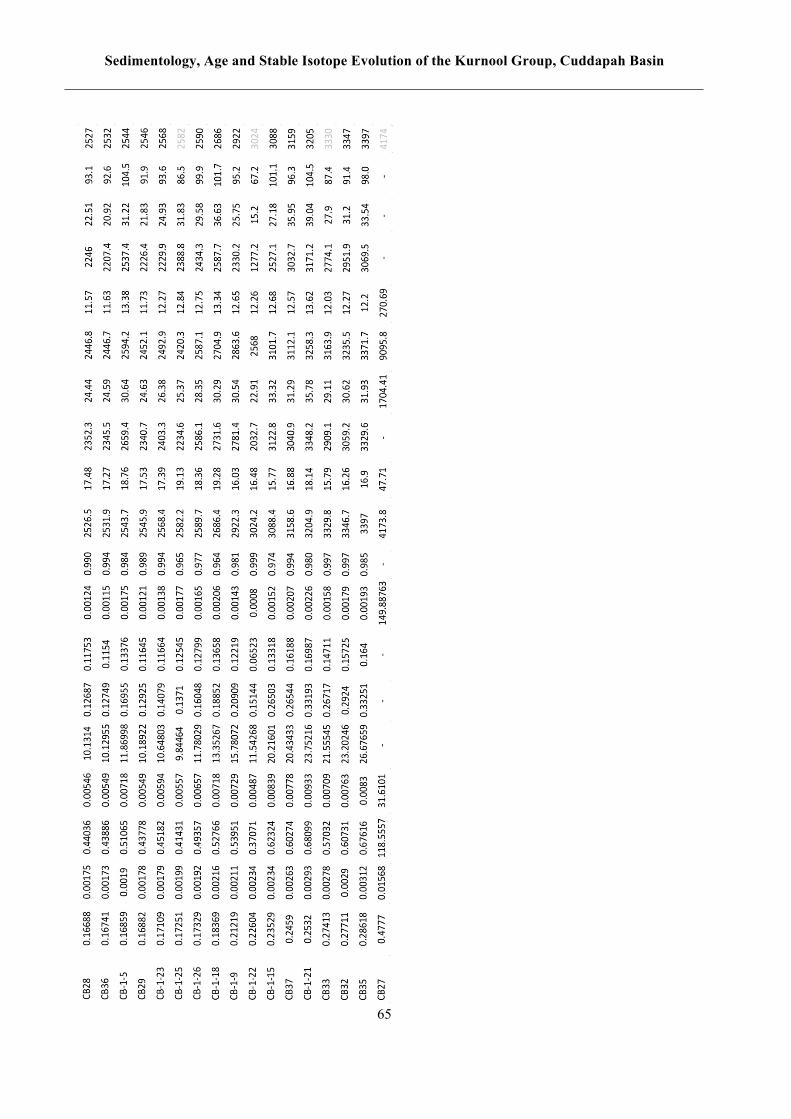
Sedimentology, Age and Stable Isotope Evolution of the Kurnool Group, Cuddapah Basin
65

C. Bertram
66
Table 6.

Sedimentology, Age and Stable Isotope Evolution of the Kurnool Group, Cuddapah Basin
67
Table 7.