sedimentological attributes and …ijsit.com/admin/ijsit_files/sedimentological attributes...
TRANSCRIPT

ACRA, E.J _et al., IJSIT, 2014, 3(4), 346-364
IJSIT (www.ijsit.com), Volume 3, Issue 4, July-August 2014
346
SEDIMENTOLOGICAL ATTRIBUTES AND STRATIGRAPHIC
ARCHITECTURE OF EBENEBE FORMATION, ANAMBRA BASIN, NIGERIA
ACRA E.J 1, ETU-EFEOTOR J.O 2, OMOBORIOWO A.O3
1Department of Geology, University of Port Harcourt, Port Harcourt, Nigeria
2,3 Dept. of Earth Sciences, Federal University of Petroleum Resources, Effurun, Nigeria
ABSTRACT
Sedimentology and stratigraphic architecture of the outcropping Tertiary Facies of the Anambra
basin were carried out using twenty lithologic outcrop units. The lithostratigraphic units in the study area
include: Ebenebe Sand Member (Palaeocene). These outcrops were exposed along the Onitsha-Otocha-Omor-
Nsukka road and the Onitsha-Enugu Expressway. The univariate, bivariate, multivariate, pebble
morphometry and sedimentary structures indicate that the sandstones were deposited in a variety of
depositional settings such as fluvial, lagoonal, tidal and shallow marine environments. Petrographic and
palaeocurrent results show that the sediments are derived from two sources namely the basement area and
from pre-existing sedimentary terrain which exist east and northeast of the study area. The stratigraphic
architecture shows various facies associations such as the tidally influenced channels, braided fluvial
channels, flood plains and fluvial channels. The sands are medium-coarse grained mainly moderately sorted,
subrounded, negatively to positively skewed and leptokurtic in distribution. The sands are mainly quartz
arenites with a good to excellent reservoir quality hence have the potential to accumulate hydrocarbons. A
new model of a tide dominated depositional system is thus proposed in this study based on integrated
ichnological and sedimentological data.
Keywords: Sedimentology, Anambra Basin, Stratigraphy, Outcrops, Lithostratigraphy,Facies.

ACRA, E.J _et al., IJSIT, 2014, 3(4), 346-364
IJSIT (www.ijsit.com), Volume 3, Issue 4, July-August 2014
347
INTRODUCTION
The Benue Trough is a linear NE-SW trending feature thought to have formed on the failed arm of a
rift associated with the splitting of the Godwana super-continent. It is an intracratonic basin subdivided into
the northern, central and southern parts (Murat, 1972; Burke, 1972; Nwajide and Reijers, 1996). The
Anambra Basin was formed following the Santonian tectonic pulse on a sub-basin formed by the differential
subsidence of the fault block in the southern Benue Trough. It was a deltaic complex filled with a
lithostratigraphic unit a kin to those of the Cenozoic Niger Delta (Reijers, 1996).
The Niger Delta Basin was formed in the early Tertiary due to continued subsidence below the
Anambra Basin was then filled with transgressive-regressive cycles between, in the Tertiary. The deposits are
characterized by a series of Mega units referred to as depobelts which strike NW-SE and subparallel to the
present day shoreline.
Several workers have studied the Anambra Basin and Niger Delta in terms of sedimentology,
stratigraphy and sequence stratigraphic concepts (Nwajide and Reijers 1996; Obi, 2000). This author studied
the depositional model of the outcrops along Isele Azagba-Onitsha-Akwa areas of the northern Niger Delta
and Anambra Basins. The analysis and interpretation of the data sets allow the reconstruction of sedimentary
facies parameters, diagenetic histories, dominant controls on sequence development, and allow an added
interpretation of the sediments of the northern Niger Delta and Anambra Basin reservoir qualities.
Aim of the Study: The aim of this research was to carry out a detailed study of the sedimentological and
stratigraphic architecture of outcropping Tertiary facies of the Anambra and northern Niger Delta Basins,
with a view to delineate the depositional model and to evaluate the outcropping units hydrocarbon potential.
Location of Study: The study area lies within latitudes 60 0’ N and 60 30’ N and longitudes 50 30’ E and 70 30’
E. The area delineated for the present study stretches through Onitsha, Umunya, Akwa, Nanka, Ekwulobia all
in Anambra State (See Location 1).

ACRA, E.J _et al., IJSIT, 2014, 3(4), 346-364
IJSIT (www.ijsit.com), Volume 3, Issue 4, July-August 2014
348
Figure 1: Location Map of the Study Area
Previous Work: Several workers have studied the Anambra and Niger Delta Basins. They include, Short and
Stauble (1967); Adegoke (1969), Agagu et al., (1980, 1986); Amajor (1986, 1987, 1991); Arua (1980, 1986);
Avbovbo (1978); Benerjee (1981); Coleman and Ladipo (1988); Burke (1971); Ekewozor et al., (1994);
Hoque (1977); Ladipo (1988); Ladipo et al., (1992); Knox et al, (1989); Koledeye et al., (2003); Nwajide
(1980, 1996, 2004); Obi (2001, 2003); Reijers and Nwajide (1997).Ladipo (1986) and Amajor (1991)
reported on the sedimentary facies and depositional mode of the Cretaceous Ajali Sandstone of the Anambra
Basin.
Ladipo (1988), Obi (2001, 2003) worked on sedimentary succession and response to tectonism in
the Cretaceous Anambra basin. They concluded that the response of sediments to tectonism is dependent on
overall facies organization in terms of transgressive-regressive cycles and synsedimentary soft sediment
deformation. Umeji (2003) obtained palynological data on the Ogwashi-Asaba Formation exposed at
Ogbunike and from the studies distinguished six lithological units from base to top as follows: cross bedded
medium grained sandstone, laminated carbonaceus grey shale, medium grained sandstone, massive grey
mudstone, and a thick overburden. She concluded that the boundary between the Nanka and Ogwashi
Formations is a lateritised erosion surface
Stratigraphic succession in the Anambra and Niger Delta Basins: Deltaic sedimentation in the Anambra
Basin was controlled by the morphologic proximity of sediment sources, sea movements during the
Campanian to Eocene times, and the circulation system leading to a gradual reshaping of the coastline.
Sample points
Fig. 2: The Location of Study Area

ACRA, E.J _et al., IJSIT, 2014, 3(4), 346-364
IJSIT (www.ijsit.com), Volume 3, Issue 4, July-August 2014
349
Therefore the stratigraphic succession documents transgressive-regressive cycles and the coastline
arrangement which relates to variations in sediment deposition. The oldest Formations (Palaeocene-Eocene)
in the Niger Delta form an arcuate exposure belt along the delta frame. These are the Palaeocene Imo Shale
(fossiliferous blue-grey shales with thin sandstones); the Eocene Ameki Group-fossiliferous, calcareous clays,
sandstone and shales; the late Eocene-Early-Oligocene lignitic clays and sandstone of the Ogwashi-Asaba
Formation and the Miocene-Recent Benin Formation (Coastal Plains Sands). These formations are
diachronous and extend into the subsurface where they have been assigned different formational names. The
Akata, Agbada and Benin Formations document prodelta, delta front and delta top environments respectively.
MATERIALS AND METHODS
The depth, scope and therefore methods employed in the study of sedimentary rocks are dependent
on the purpose of study, time and fund limitations. However most sedimentological studies aim at
interpreting the depositional environments and building the depositional model. This present work on
Ebenebe Sandstone. is the unit studied. Stratigraphic sections were measured and related exposures
examined for possible correlation.
Field work: The study of sedimentary rocks in the field is best done by observing, measuring and recording
as appropriate. The ultimate aim of the study of sedimentary rocks/outcrops is the interpretation or
reconstruction of ancient depositional environments, stratigraphic correlation all leading to
palaeogeographic reconstruction. (Tucker, 1988; Miall, 1990).
During the field work, which involved first the reconnaissance and then the actual mapping exercise,
several tools and aids were used: topographic/base maps, hammer, chisels, dilute acid, hand lens, penknife,
tape for measurement, camera, field notebook, safety coverings, binoculars, masking tape, logging template,
compass/ clinometer, sample bags.
The aspects of the sedimentary rocks usually recorded include bed thickness, texture, composition,
diagenetic features, sedimentary structures.
(i) Sampling In this study, the spot sampling method was employed whereby the outcrops were sampled as
they were encountered, ensuring that all the lithologies were duly represented. One hundred samples were
collected from the various locations studied.
(ii) Graphic Logging Graphic logs were generated by measuring and recording data through vertical section:
rock type, bed thicknesses/bed contacts, grain size, colour, sedimentary structures, palaeocurrent direction,
thicknesses.
ACRA, E.J _et al., IJSIT, 2014, 3(4), 346-364
IJSIT (www.ijsit.com), Volume 3, Issue 4, July-August 2014
350
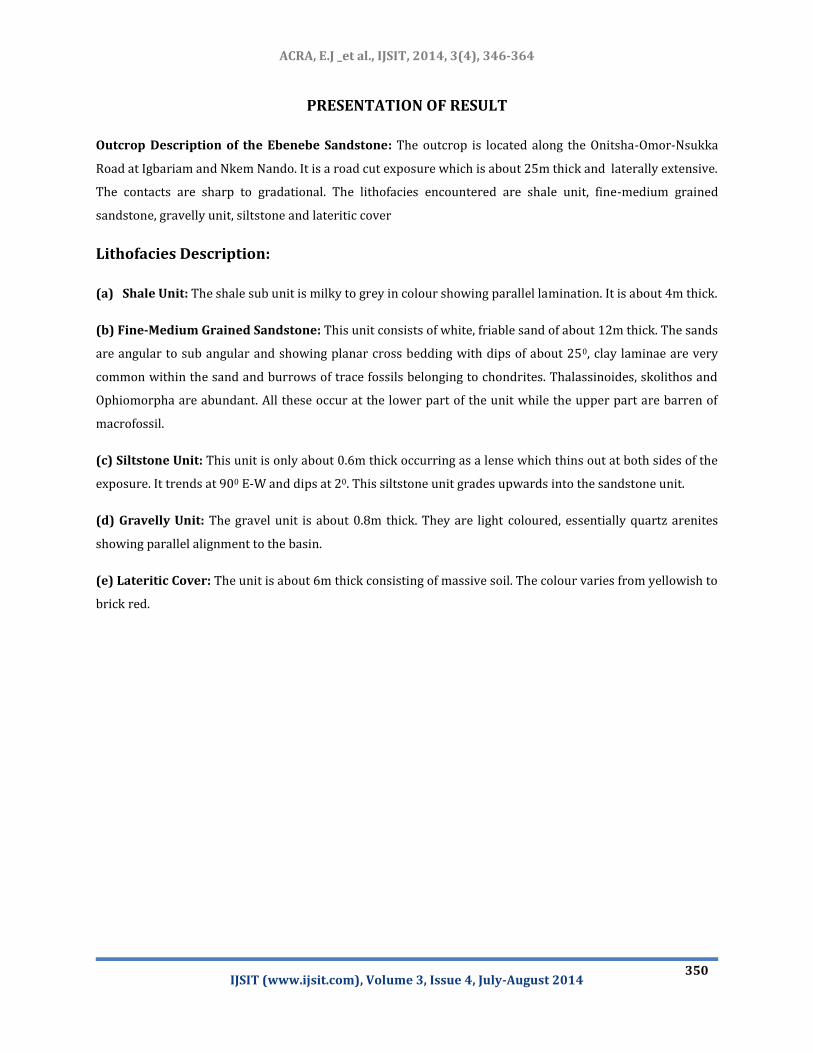
PRESENTATION OF RESULT
Outcrop Description of the Ebenebe Sandstone: The outcrop is located along the Onitsha-Omor-Nsukka
Road at Igbariam and Nkem Nando. It is a road cut exposure which is about 25m thick and laterally extensive.
The contacts are sharp to gradational. The lithofacies encountered are shale unit, fine-medium grained
sandstone, gravelly unit, siltstone and lateritic cover
Lithofacies Description:
(a) Shale Unit: The shale sub unit is milky to grey in colour showing parallel lamination. It is about 4m thick.
(b) Fine-Medium Grained Sandstone: This unit consists of white, friable sand of about 12m thick. The sands
are angular to sub angular and showing planar cross bedding with dips of about 250, clay laminae are very
common within the sand and burrows of trace fossils belonging to chondrites. Thalassinoides, skolithos and
Ophiomorpha are abundant. All these occur at the lower part of the unit while the upper part are barren of
macrofossil.
(c) Siltstone Unit: This unit is only about 0.6m thick occurring as a lense which thins out at both sides of the
exposure. It trends at 900 E-W and dips at 20. This siltstone unit grades upwards into the sandstone unit.
(d) Gravelly Unit: The gravel unit is about 0.8m thick. They are light coloured, essentially quartz arenites
showing parallel alignment to the basin.
(e) Lateritic Cover: The unit is about 6m thick consisting of massive soil. The colour varies from yellowish to
brick red.
ACRA, E.J _et al., IJSIT, 2014, 3(4), 346-364
IJSIT (www.ijsit.com), Volume 3, Issue 4, July-August 2014
351
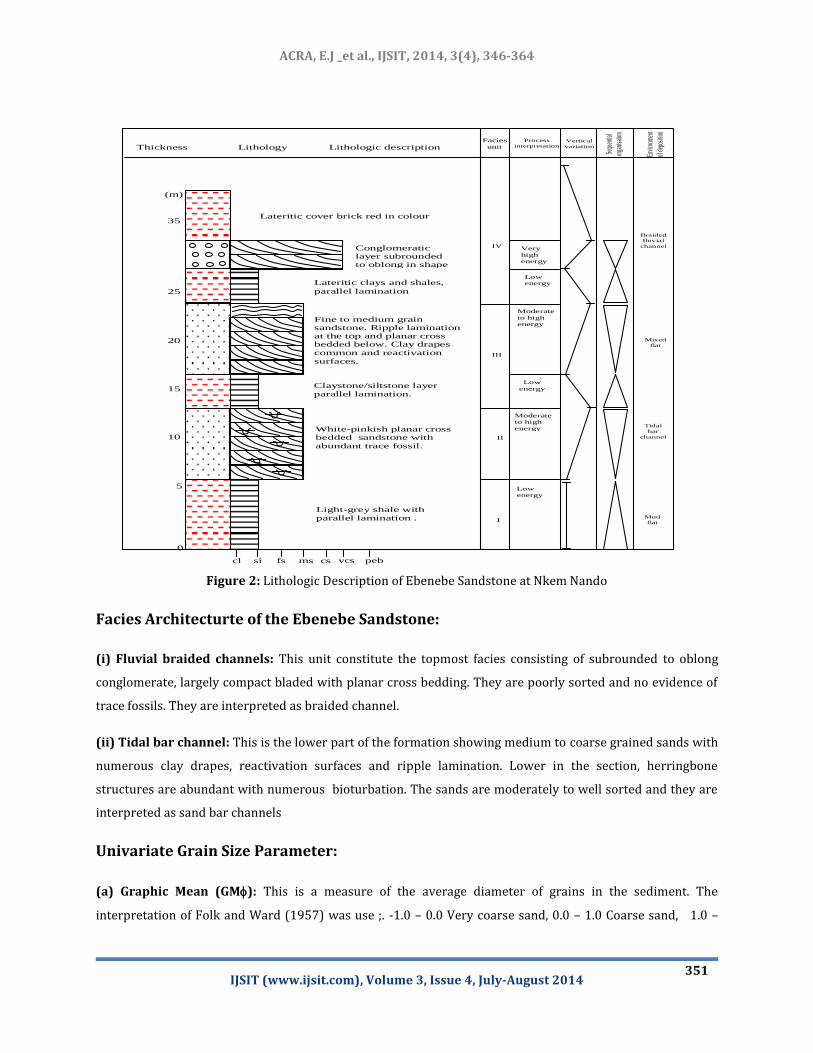
Figure 2: Lithologic Description of Ebenebe Sandstone at Nkem Nando
Facies Architecturte of the Ebenebe Sandstone:
(i) Fluvial braided channels: This unit constitute the topmost facies consisting of subrounded to oblong
conglomerate, largely compact bladed with planar cross bedding. They are poorly sorted and no evidence of
trace fossils. They are interpreted as braided channel.
(ii) Tidal bar channel: This is the lower part of the formation showing medium to coarse grained sands with
numerous clay drapes, reactivation surfaces and ripple lamination. Lower in the section, herringbone
structures are abundant with numerous bioturbation. The sands are moderately to well sorted and they are
interpreted as sand bar channels
Univariate Grain Size Parameter:
(a) Graphic Mean (GM): This is a measure of the average diameter of grains in the sediment. The
interpretation of Folk and Ward (1957) was use ;. -1.0 – 0.0 Very coarse sand, 0.0 – 1.0 Coarse sand, 1.0 –
Facies
unit Lithologic description Thickness Lithology
Lateritic cover brick red in colour
Claystone/siltstone layer
parallel lamination.
White-pinkish planar cross bedded sandstone with
abundant trace fossil.
Light-grey shale with
parallel lamination .
cl si fs ms cs
Moderate
to high
energy
Low
energy
Moderate
to high
energy
Low
energy
35
(m)
25
20
15
10
5
0
vcs
peb
Conglomeratic layer subrounded to oblong in shape
Lateritic clays and shales,
parallel lamination
Fine to medium grain sandstone. Ripple lamination at the top and planar cross bedded below. Clay drapes
common and reactivation
surfaces.
Low
energy
Very
high
energy
I
II
III
IV
Process
interpretation Vertical
variation
Sequ
entia
l
orga
nisa
tion
Envi
ronm
ent
of de
posit
ion
Braided fluvial
channel
Mixed
flat
Tidal
bar
channel
Mud
flat

ACRA, E.J _et al., IJSIT, 2014, 3(4), 346-364
IJSIT (www.ijsit.com), Volume 3, Issue 4, July-August 2014
352
2.00 Medium sand, 2.0 – 3.0 Fine sand, 3.0 – 4.0 Very fine sand, 4.0 – 5.0 Coarse silt
The analysed samples show that the sediments range from 0.88 (coarse sand) to 1.7 (medium
sand) with an average (1.25) medium sand. The samples are mostly medium to coarse which represents a
high energy environment with fluctuation of low energy at some periods of deposition (Pettijohn, 1975).
(b) Graphic Standard Deviation (GS) : This is a measure of the sorting or spread of the distribution around
the mean. Using Folk and Ward (1957) in Tucker (1988) interpretation. < 0.35Ø Very well sorted, 0.35 – 0.51
Well sorted, 0.51 – 0.71 Moderately well sorted, 0.71 – 1.00 Moderately sorted, 1.00 – 2.00 Poorly sorted,
2.00 – 4.00 Very poorly sorted, > 4.00 Extremely poorly sorted.
The samples range from (0.64) moderately well sorted to (0.86) moderately sorted with an
average of (0.74) moderately sorted. The result shows that hydrodynamic condition operating is high at the
time of deposition.
(c) Graphic Skewness (GSK): The skewness measures the degree of asymmetry of the distribution. The
results range from (0.10) positively skewed to (0.28) negatively skewed and (0.4) very negatively skewed
with an with an average of (-0.02) nearly symmetrical. This indicates that the sediments are fair to
uniformly skewed.
(d) Graphic Kurtosis (KG): The kurtosis parameter measures the peakedness of the distribution. The
results of the analysed samples show values ranging from (0.54), very platykurtic through (0.94),
mesokurtic to leptokurtic (1.12), leptokurtic with an average of (1.10) that is, mesokurtic. This is
suggestive of a generally better sorting at the tails than the central portion of the distribution.
Parameters Mean Sorting Skewness Kurtosis
0.88 – 1.70 0.64 – 0.86 0.10- 1 - 0.28 0.54 – 1.13
Average value 1.25 medium
sand
0.74 moderately
sorted
- 0.02 nearly
symmetrical
1.10 Mesokurtic
Table 1: Summary of Results (Univariate grain size)

ACRA, E.J _et al., IJSIT, 2014, 3(4), 346-364
IJSIT (www.ijsit.com), Volume 3, Issue 4, July-August 2014
353
Sample No Mean Sorting Skewness Kurtosis
EB 1 1.15 medium sand 0.84 moderately
sorted
-0.23 negatively
skewed
1.08 mesokurtic
EB 2 1.40 medium sand 0.93 moderately -0.29 negatively 1.23 leptokurtic
EB 3 1.46 medium sand 0.82 moderately
sorted
0.14 nearly
symmetrical
1.09 mesokurtic
EB 4 1.33 medium 0.75 moderately
sorted
0.013 symmetrical 1.02 mesokurtic
EB 5 1.63 medium sand 0.76 moderately
sorted
-0.21 negatively
skewed
1.03 mesokurtic
EB 6 1.22 medium sand 0.76 moderately
sorted
-0.09 negatively 1.05 mesokurtic
EB 7 1.4 medium sand 0.81 moderately
sorted
-0.06 negatively 0.92 mesokurtic
EB 8 0.8 coarse sand 0.83 moderately
sorted
-0.03 negatively 1.06 mesokurtic
EB 9 0.85 coarse sand 0.87 moderately
sorted
-0.05 negatively 1.09 mesokurtic
EB10 0.87 coarse sand 1.10 poorly
sorted
0.104 negatively 1.13 leptokurtic
Table 2: Size frequency parameters for the Ebenebe sandstone
ACRA, E.J _et al., IJSIT, 2014, 3(4), 346-364
IJSIT (www.ijsit.com), Volume 3, Issue 4, July-August 2014
354
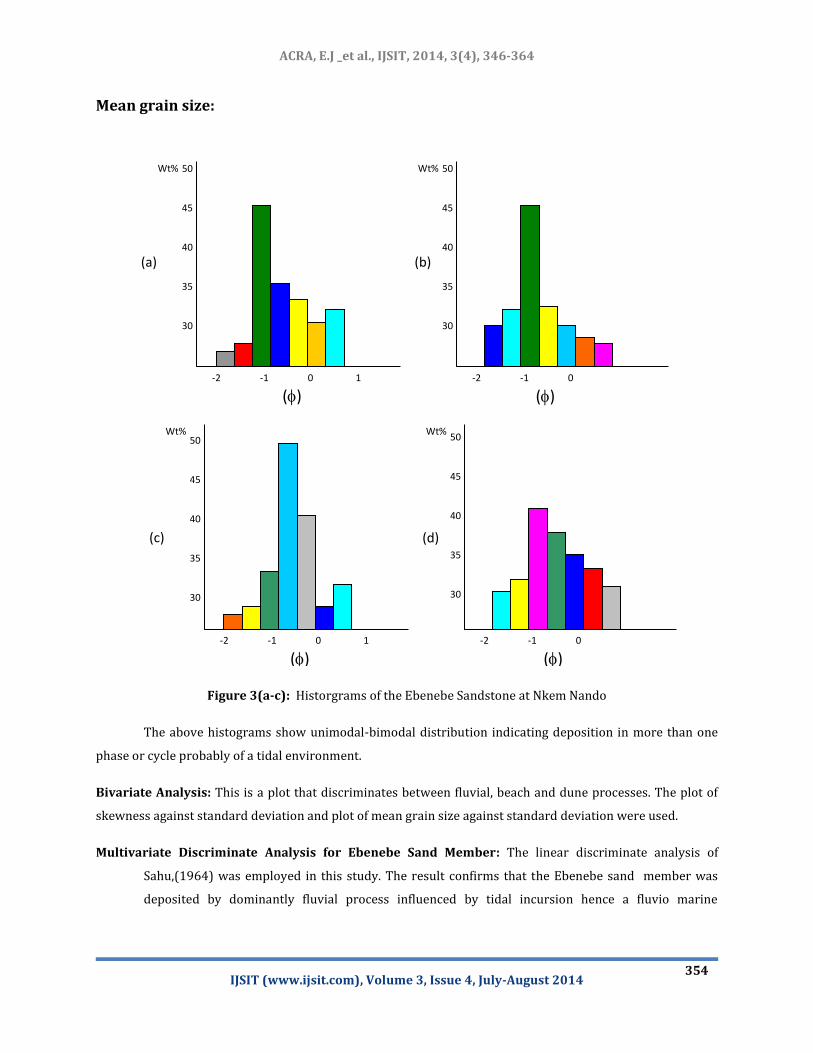
Mean grain size:
Figure 3(a-c): Historgrams of the Ebenebe Sandstone at Nkem Nando
The above histograms show unimodal-bimodal distribution indicating deposition in more than one
phase or cycle probably of a tidal environment.
Bivariate Analysis: This is a plot that discriminates between fluvial, beach and dune processes. The plot of
skewness against standard deviation and plot of mean grain size against standard deviation were used.
Multivariate Discriminate Analysis for Ebenebe Sand Member: The linear discriminate analysis of
Sahu,(1964) was employed in this study. The result confirms that the Ebenebe sand member was
deposited by dominantly fluvial process influenced by tidal incursion hence a fluvio marine
50
45
40
35
30
-2 -1 0 1
Wt%
()
50
45
40
35
30
-2 -1 0
Wt%
()
(a) (b)
50
45
40
35
30
-2 -1 0 1
Wt%
()
50
45
40
35
30
-2 -1 0
Wt%
()
(c) (d)
ACRA, E.J _et al., IJSIT, 2014, 3(4), 346-364
IJSIT (www.ijsit.com), Volume 3, Issue 4, July-August 2014
355
environment.
(a) Pebble Morphometry for Ebenebe Sandstone:
For the average computed result from the pebble morphometric analysis . The values of flatness ratio
L
S ranges from 0.422 through 6.46 with a mean of 0.592; the values for elongation ratio L
I ranges from
0.540 through 0.852 with a mean of 0.735; the values for Oblate-prolate index ranges from -0.231 through
6.822 with a mean of 3.200, the values for coefficient of flatness ranges from 42.44 through 64.10 with a
mean of 54.55.
Trends in the maximum sphericity projection (MPS) and Oblate-prolate index (OPI) of 0.755 and 3.20
all indicates a fluvial origin for the pebbles. This result confirms the work of Dobkins and Folk (1970); Hubert,
(1968); Snead and Folk, (1958) and Stratten (1974) that the maximum sphericity projection of pebbles are
generally higher for fluvial process and lower for surf processes where pebbles whose values fall below the
magic line of 0.65 denotes beach and those above 0.66 indicates a fluvial origin. Also Dobkins and Folk,
(1970) show that in a suite of pebbles and the oblate-prolate falls below -2, then it is 87% sure that they are
from the beach whereas if the oblate-prolate ranges from -1 to +5%, then it is 69% sure that the pebbles are
fluvial in origin. Dobkins and Folk (1970), noted that first cycle beach gravels tend to be discoidal in shape
whereas gravels in rivers are rod like in shape. They estimated the average maximum sphericity projection in
pebbles to be 0.68 for rivers, 0.64 for low wave energy beaches and 0.58 for high energy beaches. Roundness
average 0.38 for rivers, 0.47 for low wave energy beaches and 0.55 for high wave energy beaches. The oblate-
prolate index average of +0.8 (prolate, rods) for rivers, -0.18 for low wave energy beaches and -2.13 (oblate,
disc) for high wave energy beaches. Hence this study indicates a fluvial environment influenced by tidal
incursions.

ACRA, E.J _et al., IJSIT, 2014, 3(4), 346-364
IJSIT (www.ijsit.com), Volume 3, Issue 4, July-August 2014
356
Parameter Value Interpretation
Flatness ratio L
S 0.592 Beach
Elongation ratio L
I 0.735 Fluvial
MPSI 0.755 Fluvial
OP index 3.200 Fluvial
Roundness 42.8 Fluvial
Coefficient of flatness FI 54.55 Fluvial
Table 3: Mean values of Morphometric analysis for 240 Pebbles of the Ebenebe sandstone at Nando-Omor
Rd.
Bivariate Plots: The plots of MPS vs OPI Dobkins and Folk, (1970); and MPS vs FI Stratten, (1974) are
employed in this study since the method discriminates between fluvial and beach processes. Plots of MPSI vs
FI indicate a complete dominance of 100% fluvial process. Plots of MPSI vs OPI indicate a slightly different
result. About 92% of the samples plotted within the fluvial field while about 8% plotted within the beach
field. This result could be explained by the fact that there was a tidal incursion in the environment of
deposition.
(b) Pebble Geometric form for Ebenebe Sandstone:
The pebble geometric forms describe its three dimensional aspect and particular shape occurs more
in one environment than the other Sneed and Folk, (1958). The diagnostic shape classes for beach pebbles are
platy, very platy, and very bladed while the shape classes for fluvial action are Compact, Compact Bladed and
Compact Elongate Sneed and Folk, (1958); Dobkins and Folk, (1970); Gale, (1990).
From the plots, about 99% of pebbles of the Ebenebe sand member are largely compact bladed,
compact elongate and compact indicating a fluvial origin while about 1% show non-diagonistic feature of any
environment, that is, they are bladed. The bladed forms may show a transition or an interaction between
fluvial and surf processes that are common in a deltaic setting .

ACRA, E.J _et al., IJSIT, 2014, 3(4), 346-364
IJSIT (www.ijsit.com), Volume 3, Issue 4, July-August 2014
357
Figure 4: Maximum sphericity, oblate-prolate index form for Ebenebe sand member at Nando-Omor Rd
(after Dobkins and Folk, 1970)
Petrographic Analysis for Ebenebe Sandstone: Petrographic studies were carried out to ascertain the light
and heavy mineral in the samples. A total of eight thin sections were studied.
Light Minerals: The Ebenebe sandstone consists of primarily quartz as the dominant light mineral with iron
oxide and little silica as cements (See Table 4).
1
2
3
4
5
6
7
8
9
10
.1 .2 .3 .4 .5 .6 .7 .8 .9 1.0
1
2
3
4
5
6
7
8
9
0
CP CB
CE
*
*
*
* * *
* * *
*
*
*
*
C
PLATY ELONGATED
COMPACT
BLADED
L – I
L – S
-300
-200
-150
-100
-5.0 -2.5 5.0 2.5
300
200
150
100
L - I
L – S
S
L
.10
VB VP VE
P B
E * *
*
* *
*

ACRA, E.J _et al., IJSIT, 2014, 3(4), 346-364
IJSIT (www.ijsit.com), Volume 3, Issue 4, July-August 2014
358
Sample
No
Mineralogical Texture Type of
quartz
Type of
Extinction
Contact
type
Maturity Diagenesis
EB 1 Quartz = 98%
Felds = Nil
Silica cement
= 1%
Clay matrix =
1%
Sub
rounded
moderately
sorted
Mono-
crystalline
Undulose Point Matured Inclusion
and
bubbles
EB 2 Quartz = 96%
Felds = 1%
Rk frag = 1%
Clay matrix =
2%
Silica cement
Sub
rounded
moderately
sorted
Mono-
crystalline
Undulose Point Matured Inclusion
and
bubbles
EB 3 Quartz = 99%
Silica cement
and clay
matrix = 1%
Sub
rounded
well sorted
Mono-
crystalline
Undulose Point Matured Inclusion
and
bubbles
EB 4 Quartz = 84%
Rk frag = 2%
Feldspar = 4%
Clay matrix
Sub
angular to
sub
rounded
Mono-
crystalline
65% poly-
crystalline
35%
Non-
Undulose
Sutured Mineralogically
matured and
texturally
immature
Iron oxide
cement
authigenic
quartz
overgrowth
ACRA, E.J _et al., IJSIT, 2014, 3(4), 346-364
IJSIT (www.ijsit.com), Volume 3, Issue 4, July-August 2014
359
EB 5 Quartz = 96%
Felds = 1%
Clay matrix =
4%
Silica cement
= 1%
Subangular
to sub
rounded
poorly
sorted
Mono-
crystalline
Undulose Point Matured Iron oxide
cement and
inclusion
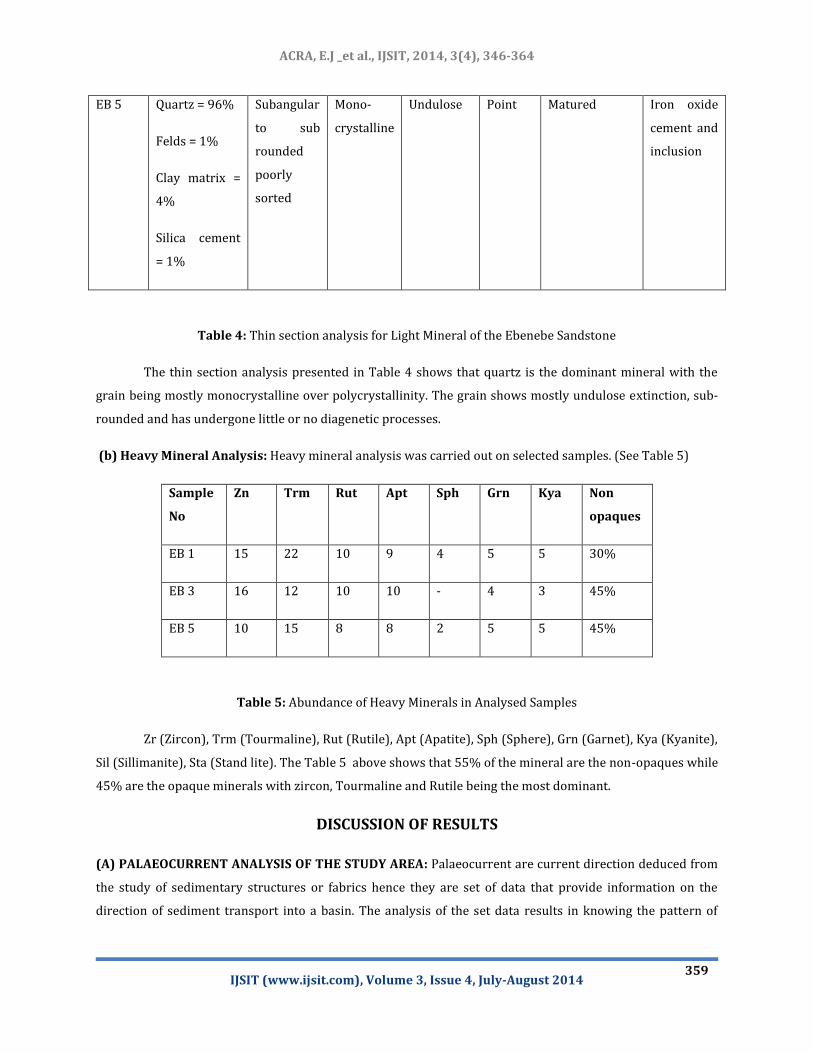
Table 4: Thin section analysis for Light Mineral of the Ebenebe Sandstone
The thin section analysis presented in Table 4 shows that quartz is the dominant mineral with the
grain being mostly monocrystalline over polycrystallinity. The grain shows mostly undulose extinction, sub-
rounded and has undergone little or no diagenetic processes.
(b) Heavy Mineral Analysis: Heavy mineral analysis was carried out on selected samples. (See Table 5)
Sample
No
Zn Trm Rut Apt Sph Grn Kya Non
opaques
EB 1 15 22 10 9 4 5 5 30%
EB 3 16 12 10 10 - 4 3 45%
EB 5 10 15 8 8 2 5 5 45%
Table 5: Abundance of Heavy Minerals in Analysed Samples
Zr (Zircon), Trm (Tourmaline), Rut (Rutile), Apt (Apatite), Sph (Sphere), Grn (Garnet), Kya (Kyanite),
Sil (Sillimanite), Sta (Stand lite). The Table 5 above shows that 55% of the mineral are the non-opaques while
45% are the opaque minerals with zircon, Tourmaline and Rutile being the most dominant.
DISCUSSION OF RESULTS
(A) PALAEOCURRENT ANALYSIS OF THE STUDY AREA: Palaeocurrent are current direction deduced from
the study of sedimentary structures or fabrics hence they are set of data that provide information on the
direction of sediment transport into a basin. The analysis of the set data results in knowing the pattern of

ACRA, E.J _et al., IJSIT, 2014, 3(4), 346-364
IJSIT (www.ijsit.com), Volume 3, Issue 4, July-August 2014
360
sediment dispersal, its relationship to sand body geometry, location of source area and direction of
palaeoslope. Palaeocurrent data are deduced from a variety of observation such as type of mineral
assemblage, presence or absence of boulders scalar properties such grain size, roundness, thickness etc and
directional properties such as height of flow, groove marks, ripple crests, imbrication, cross stratification and
flute marks. The directional properties are better used in palaeocurrent analysis since they contain more
information about a sedimentary basin, Potter and Pettijohn, (1977).
The most common sedimentary structures for paleocurrent analysis in the study area is cross
stratification. The foresets represent the formal slip faces of bedforms that migrated in the direction of
foreset dip and the average local flow direction with geometrical variability mirroring the natural variability
of bedforms. The cross beds, range from large scale planar and trough types to small ripples and
herringborne cross strata.
The bounding surface of the cross bedded units are almost horizontal (between 0 and 5o), hence tilt
direction of dips are not necessary. Selly (1979) has proposed that tilt correction of dips for low values have
no significant effect on the interpretation. The average thickness of cross beds is about 50cm and the foresets
contacts vary from gradational to sharp parallel surface.
The azimuthal reading of the cross strata dip directions encountered were measured because a
paleocurrent system may not be specified by a single type of cross bed in term of dynamic and directional
aspect, Allen, (1965). The measurement pattern proposed by Potter and Olsen (1954), was used in this study
since the variability at an outcrop is usually greater between cross beds than within cross beds. Also the
method provides the best estimate of foreset direction for a specified number of measurement, Potter and
Pettijohn, (1977).
Palaeocurrent measurement for four outcropping units:
Parameters
Locality
Pattern Mean vector azimuth
(MVA)
Variance Vector
Strength
Igbariam
Nando
Bipolar,
unimodal
Bimodal-
Bipolar
233
262
600
3894
0.38
0.65
Table 6: Ebenebe Sands Palaeocurrent Parameters

ACRA, E.J _et al., IJSIT, 2014, 3(4), 346-364
IJSIT (www.ijsit.com), Volume 3, Issue 4, July-August 2014
361
To determine the degree of sediment dispersion and current direction, the above data was treated as
vectors in order to obtain the dominant mean direction. The vector components were resolved to give the
vector means using the formula
The paleocurrent distribution of the outcropping units show a dominant bipolar-bimodal orientation
or pattern with a vector strength of high dispersion except for the Ebenebe which is low. The primary mode is
in the Northeast direction approximately 500 and the secondary mode in the southwest direction which
shows the types of cross bedding that occur in the study area. These results agree with the N-S regional
paleocurrent trend established for the Anambra basin and in the study area, Hoque and Nwajide, (1984);
Amajor, (1987); Nwajide and Reijers, (1996). The rose diagram for low angle dips (less than 200) and high
angle dips (greater than 200) for cross stratification are also constructed. These show that low angle cross
beds are unimodal to the Southwest while the high angle cross beds show northeasterly mode.
The sediment dispersal trend shows that the bimodal-bipolar orientation trending NE-SW is
indicative of a probable ebb and flood tide in a tidal flat environment, which may be normal or parallel to the
shoreline. This suggest that the original depositional environment of the sands may have a similar shape and
orientation with the paleoslope, paleocurrent system and the sediment dispersal pattern as they are all
parallel to one another. The northeasterly mode of the distribution is indicative of a subtidal zone while the
smaller modes may be due to the filling of the tidal channel
Figure 5: Current rose diagram for Ebenebe Sandstone
(B) Depositional Model for Ebenebe Formation: The depositional mode of the Ebenebe sandstone can be
deduced from the study of grain size, composition, sedimentary structures and pebble morphometry.
The mean grain size of the sandstone are medium to coarse which suggest a moderate to high
hydraulic energy environment. The observed general coarsening upward trend reflects the progressive
shallowing of the environment and the fining upward trend at the midpoint shows some fluvial processes
which may be the result of lateral migration of the fluvial channels, Pettijohn, (1975).The variation in sorting
n = 25 N

ACRA, E.J _et al., IJSIT, 2014, 3(4), 346-364
IJSIT (www.ijsit.com), Volume 3, Issue 4, July-August 2014
362
which ranges from moderately well sorted to poorly sorted sediments indicates water turbulence and current
velocity variation although with a mean of moderately sorted sands which shows smooth and stable flow.
The values for skewness show a nearly symmetrical trend which represents a broad spectrum of fluctuation
indicating a shallow marine (upper shoreface-foreshore) and littoral zones. This is in agreement with the
work of Duane (1964) who shows that the winnowing action of waves and tidal currents produces coarse
skewed distribution in littoral beach and tidal inlet environments.
The asymmetrical to symmetrical shapes of histograms and frequency distribution in this study with
variation in sorting suggests a fluvial process characterized by fluctuating energy of a deltaic setting.
The sandstones are texturally and mineralogical matured which suggests deposition in a high energy
environment. The pebble morphometric result indicates that about 90% of the pebbles are from fluvial origin
while about 10% indicates a marine environment. This also confirms the lateral migration of fluvial channel
and the incursion of tidal wave/tidal action. The primary sedimentary structures which include planar and
trough cross beds, parallel and horizontal lamination, From the above discussions, therefore, the Ebenebe
sandstone was deposited in a tidally influenced shoreline of the shallow marine environment.
Figure 6: Depositional Model of Ebenebe Formation.
(C) Reservoir Quality for the Ebenebe Formation: The reservoir quality of a sandstone is dependent on
both depositional and diagenetic fabrics i.e. grain size, shape, sorting, compaction, cementation, dissolation
and replacement. Hence in this study the method of Patrick et al, 2007, using stratigraphic, petrographic as
petrophysical techniques was employed since they concluded that porosity and permeability distribution
within a given reservoir system is dependent on the diagenetic and depositional fabrics. In this assessment,
the coefficient of variance and petrographic analysis was used.
The qualities of the reservoir of the Ebenebe sandstone were studied based on using the coefficient of

ACRA, E.J _et al., IJSIT, 2014, 3(4), 346-364
IJSIT (www.ijsit.com), Volume 3, Issue 4, July-August 2014
363
variance, petrographic and stratigraphic analysis. The results obtained are presented.
If CV ≤ 0.5 homogeneous or good sorting
If CV ≥ 0.5 ≤ 1heterogeneous or poor sorting
If CV ≥ 1very heterogeneous or very poor sorting.
From the results, the samples sorting ranges from very heterogeneous, (1.26) through heterogeneous
(0.73) to homogeneous (0.47). The plot of coefficient of variance against mean grain size Figure 70 place
the samples to be moderately sorted in more than a half of the sampled area. Hence the porosity in
interpreted as good.
REFERENCES
1. Agagu, O. K., Fayose, E. A., Peters, S. W. 1995, Stratigraphy and Sedimentation in the Senoman
Anambra Basin of Eastern Nigeria. Journal of Mining and Geology. 22, 25-36.
2. Akaegbobi, L. M. and Boboye 1999. Textural, Structural Features and Microfossil Assemblage
Relationship as a Delineating Criteria for the Stratigraphic Boundary between Mamu Formation and
Nkporo Shale within the Anambra Basin, Nigeria, NAPE Bull, Vol. 6, No. 14, p. 176-193.
3. Allen J. P. and Christopher, R. E. 2007, Sequence Architecture within a Low-accommodation Setting:
An Example from the Permian of Galilee and Bowen Basins, Queensland, Australia. AAPG Bulletin,
Vol. 91. No. 11, P. 1503-1539.
4. Allen, G. P. 1991. Sedimentary Process and Facies in the Girond Estuary, a Model for Macrofidal
Estuaries System. In Smith, D. G; Reinson, G. E.; Zaithin, B. A. and Rahmani, R. A. (eds). Classic Tidal
Sedimentology. Canadian Society of Petroleum Geologists, Memoirs, 16, 219-226.
5. Allen, J. R. L. 1964. Studies in Fluviatile Sedimentation: Sic Cychotherms from the Lower Old Red
Sandstones, Angloweish Basin, Sedimentology, p. 163-198.
6. Amajor, L. C. 1987, Paleocurrent, Petrography and Provenance Analysis of the Ajali Sandstone (Upper
Cretaceous). Southeastern Benue Trough, Nigeria. Sed. Geology Vol. 54, p. 47-60.
7. Avborbo, A. A. 1978. Geochemical Gradients in the southern Nigeria Basin Bull Canadian Petroleum
Geology. Vol. 26, 9. 268-274.
8. Avborbo, A. A. and Ayoola, O. 1981, Petroleum Prospects of Southern Nigeria’s Anambra Basin. Oil
and Gas Journal. Vol. 79, No. 18. P. 334-247.

ACRA, E.J _et al., IJSIT, 2014, 3(4), 346-364
IJSIT (www.ijsit.com), Volume 3, Issue 4, July-August 2014
364
9. Banerjee, I. 1979. Analysis of Cross-Bedded Sequences: An example from the Ajali Sandstone
(Maastrichtian) of Nigeria, Quartz JL. Geology. Mm. and Met. Soc. India, v. 51, p. 69-81.
10. Bann, K. L. and Fielding C. R. 2004, An Integrated Ichnological and Sedimentological Comparism of
non-deltaic Shoreface and Subaqueous Delta Deposits in Permian Reservior Units of Australia. In
Mcllroy, D. (ed). The Application of Ichnology to Palaenvironmental and Stratigraphic Analysis.
Geological Society. London, Special Publications. 228, 273-307.
11. Bjorlykke, K., 1983. Diagenetic reaction in sandstones. In: Sediment Diagenesis (Ed. By A. Parker arid
B.W. Seliwood). P. 169-214. NATO ASI Series C: vol.115. Reidel, Dordrecht.
12. Emery, D and Myers. 1996. Sequences Stratigraphy. Blackwell Science Oxford. p. 297.
13. Etu-Efeotor, J. O., 1988. Stratigraphy, sedimentology and depositional environment of Reservior sand
of the IVO field, Niger Delta. Glob. Jour. of Pure and Applied Science, Vol. 4 (3).
14. Etu-Efeotor, J. O., 1997. Fundamental of Petroleum Geology.
15. Friedman, G.M. 1979. Differences in Size Distribution of Population of Particles among Sands of
Various Origins. Sedimentology, v.26 p.3-32.
16. Nwajide, C.S. 1980. Eocene tidal sedimentation in the Anambra basin, southern Nigeria. Sed Geology
25, p. 189-207.
17. Nwajide, C.S. and Hoque, M. 1984. Effect of Diagenesis on the Sandstone of the Markurdi Formation
(Throman) Nigeria. Nig Jour. Mm. Geol, v 21 p. 143-150.
18. Obi, 0. C, Okogbue, C. 0. 2004. Sedimentary Response to Tectonism in the Camparian- Maastrichtian
Succession, Anambra Basin, Southeastern Nigeria. Journal of African Earth Sciences, Vol. 38, PP.99-
108.
19. Obi, G.C., 2000. Depositional Model for the Campanian Maastrichtian Anambra Basin, Southern
Nigeria. Unpublished Ph.D. Thesis, University of Nigeria, Nsukka, 291 pp.
20. Oloto, 1. N., 1992. Succession of Palynomorphs from the Early Eocene of Gbekebo-l well in the SW
Nigeria. Journal of African Earth Sicence. Vol. 15, No. ¾, PP. 441-452.
21. Oti, MN., Postuma, G. (Eds), 1995. Geology of Deltas. A.A. Balkema, Rotterdam, p. 315.