sediment transport in the bill williams river and ... · sediment transport in the bill williams...
TRANSCRIPT
U.S. Department of the InteriorU.S. Geological Survey
Scientific Investigations Report 2009-5195
Sediment Transport in the Bill Williams River and Turbidity in Lake Havasu During and Following Two High Releases from Alamo Dam, Arizona, in 2005 and 2006

FRONT COVER: Looking southwest over Lake Havasu. The mouth of the Bill Williams River is in the foreground. The Central Arizona Project inlets are at the upper left, and Parker Dam is at the upper middle. Photo taken by Andrew Pernick, U.S. Bureau of Reclamation, March 3, 2009.

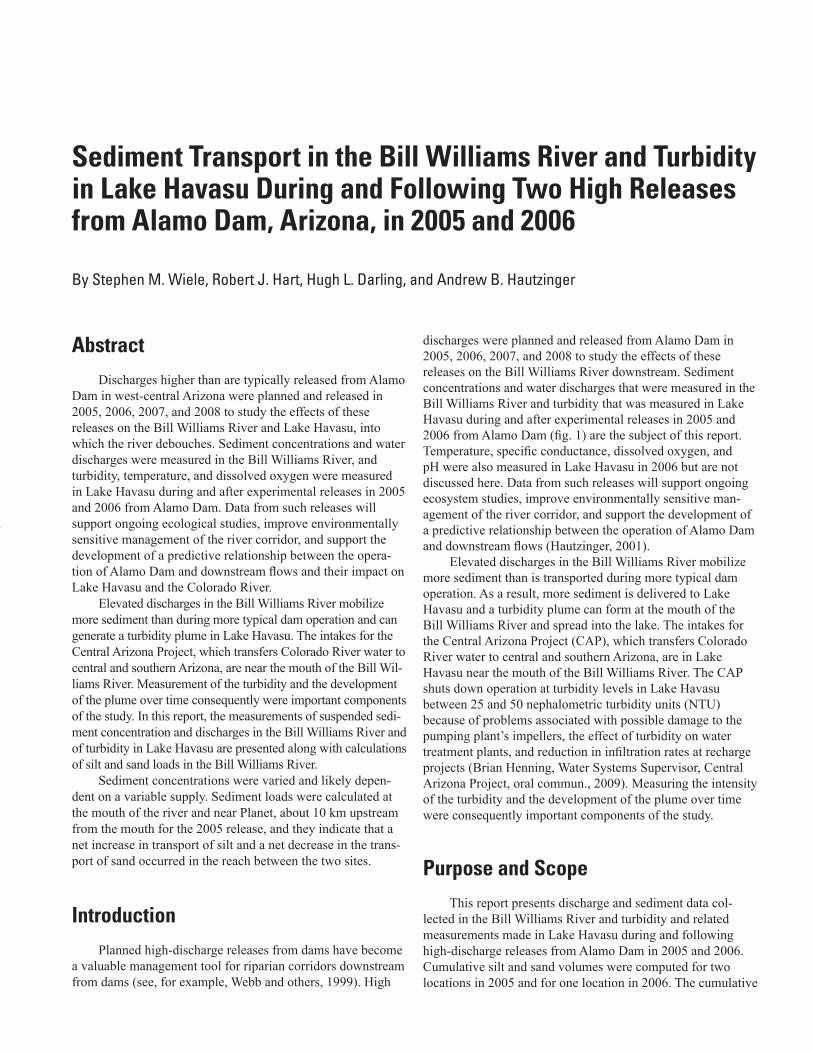
Sediment Transport in the Bill Williams River and Turbidity in Lake Havasu During and Following Two High Releases from Alamo Dam, Arizona, in 2005 and 2006
By Stephen M. Wiele, Robert J. Hart, Hugh L. Darling, and Andrew B. Hautzinger
Prepared in cooperation with the Bureau of Reclamation, Central Arizona Project, and the Fish and Wildlife Service
Scientific Investigations Report 2009–5195
U.S. Department of the InteriorU.S. Geological Survey

ii
U.S. Department of the InteriorKEN SALAZAR, Secretary
U.S. Geological SurveySuzette M. Kimball, Acting Director
U.S. Geological Survey, Reston, Virginia: 2009
This report and any updates to it are available online at: http://pubs.usgs.gov/SIR/2009/5195/
For more information on the USGS—the Federal source for science about the Earth, its natural and living resources, natural hazards, and the environment, visit http://www.usgs.gov or call 1-888-ASK-USGS
For an overview of USGS information products, including maps, imagery, and publications, visit http://www.usgs.gov/pubprod
To order this and other USGS information products, visit http://store.usgs.gov
Any use of trade, product, or firm names is for descriptive purposes only and does not imply endorsement by the U.S. Government.
Although this report is in the public domain, permission must be secured from the individual copyright owners to reproduce any copyrighted materials contained within this report.
Suggested citation:Wiele, S.M., Hart, R.J., Darling, H.L., and Hautzinger, A.B., 2009, Sediment transport in the Bill Williams River and turbidity in Lake Havasu during and following two high releases from Alamo Dam, Arizona, in 2005 and 2006: U.S. Geological Survey Scientific Investigations Report 2009-5195, 22 p. [http://pubs.usgs.gov/sir/2009/5195/].

iii
Figures1. Maps showing measurement locations on the Bill Williams River and in Lake Havasu. ............22. Daily average discharge record at the Bill Williams below Alamo Dam gage .............................33. Average annual discharge at the Bill Williams below Alamo and Bill Williams ................................34. Daily rainfall at the Alamo Dam rainfall gaging station before and during the 2005 release .....45. Daily rainfall at the Alamo Dam rainfall gaging station before and during the 2006 release .....46. Discharge record at the Bill Williams below Alamo Dam gage from the start of the 2005
water year to the end of the 2005 experimental release. ................................................................47. Discharge record at the Bill Williams below Alamo Dam gage from the start of the 2006
water year to the end of the 2006 experimental release ................................................................48. Hydrographs before and during the 2005 experimental release .....................................................59. Hydrographs during the 2006 experimental release. .........................................................................5
10. Sand and silt concentrations and discharge measured near Planet during the 2005 release ....................................................................................................6
11. Sand and silt concentrations and discharge measured near the mouth of the Bill Williams River during the 2005 release ........................................................................................6
12. Sand and silt concentrations and discharge measured near the mouth of the Bill Williams River during the 2006 release ................................................7
13. Concentrations of silt and sand sampled near Planet on the Bill Williams River in 2005 ............8
Contents
Abstract ..........................................................................................................................................................1Introduction ....................................................................................................................................................1Purpose and Scope ......................................................................................................................................1Description of Study Area ...........................................................................................................................2Streamflow Gaging Station Discharge Records and Measurements ..................................................3
Releases from Alamo Dam .................................................................................................................6Suspended Sediment Sampling in the Bill Williams River .....................................................................7Sediment Volumes Transported by the Bill Williams River During and Following
the Experimental Releases ............................................................................................................7Turbidity Measurements in Lake Havasu ....................................................................................................8Discussion ....................................................................................................................................................18Acknowledgments ......................................................................................................................................19References Cited .........................................................................................................................................19
Appendixes 1. Suspended Sediment Concentrations and Discharge Measurements
on the Bill Wiliams River ...............................................................................................................20 2. Turbidity and related measurements on Lake Havasu
[available only online at http://pubs.usgs.gov/sir/2009/5195/appendixes]
iv
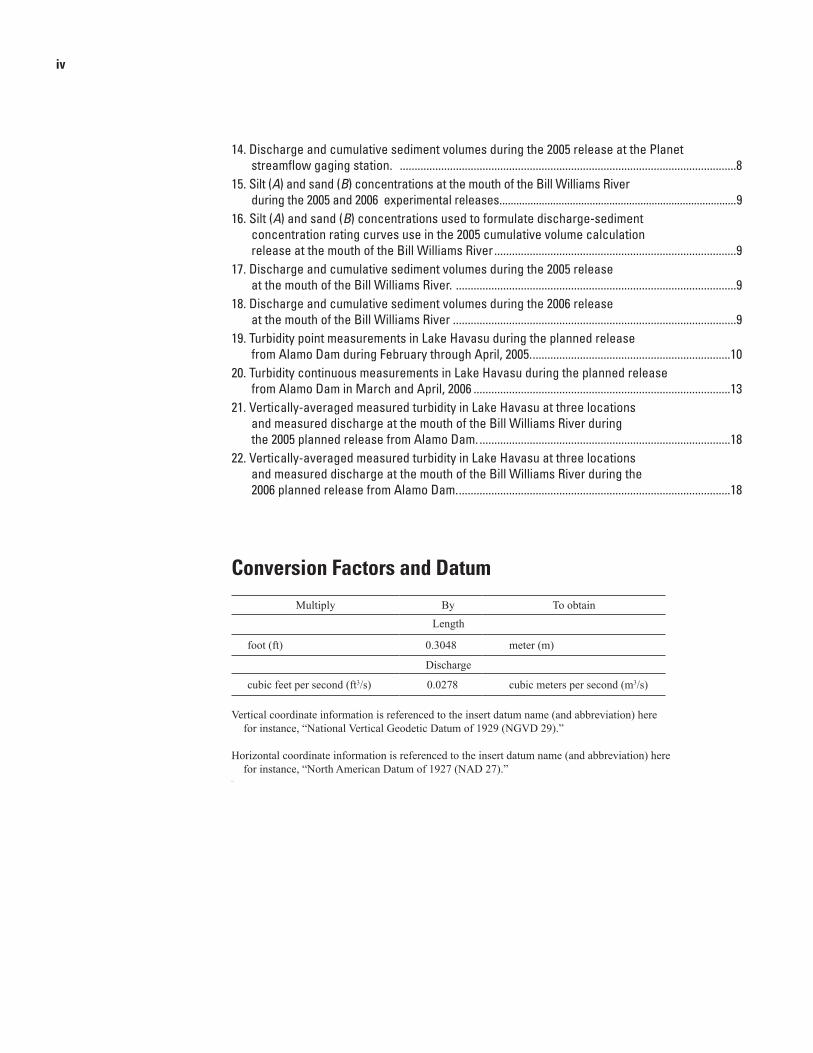
14. Discharge and cumulative sediment volumes during the 2005 release at the Planet streamflow gaging station. ..................................................................................................................8
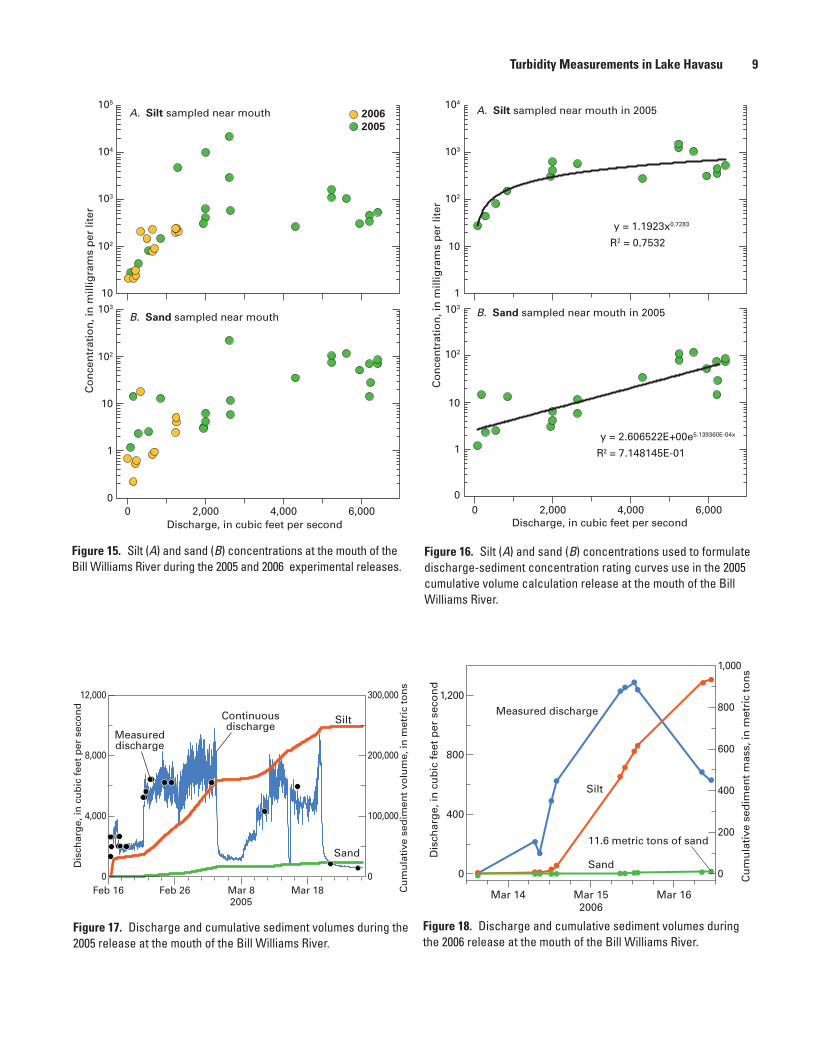
15. Silt (A) and sand (B) concentrations at the mouth of the Bill Williams River during the 2005 and 2006 experimental releases. ...................................................................................9
16. Silt (A) and sand (B) concentrations used to formulate discharge-sediment concentration rating curves use in the 2005 cumulative volume calculation release at the mouth of the Bill Williams River ..................................................................................9
17. Discharge and cumulative sediment volumes during the 2005 release at the mouth of the Bill Williams River. ...............................................................................................9
18. Discharge and cumulative sediment volumes during the 2006 release at the mouth of the Bill Williams River ................................................................................................9
19. Turbidity point measurements in Lake Havasu during the planned release from Alamo Dam during February through April, 2005. ...................................................................10
20. Turbidity continuous measurements in Lake Havasu during the planned release from Alamo Dam in March and April, 2006 .......................................................................................13
21. Vertically-averaged measured turbidity in Lake Havasu at three locations and measured discharge at the mouth of the Bill Williams River during the 2005 planned release from Alamo Dam. .....................................................................................18
22. Vertically-averaged measured turbidity in Lake Havasu at three locations and measured discharge at the mouth of the Bill Williams River during the 2006 planned release from Alamo Dam. ............................................................................................18
Multiply By To obtainLength
foot (ft) 0.3048 meter (m)
Discharge
cubic feet per second (ft3/s) 0.0278 cubic meters per second (m3/s)
Vertical coordinate information is referenced to the insert datum name (and abbreviation) here for instance, “National Vertical Geodetic Datum of 1929 (NGVD 29).”
Horizontal coordinate information is referenced to the insert datum name (and abbreviation) here for instance, “North American Datum of 1927 (NAD 27).”
Conversion Factors and Datum
Sediment Transport in the Bill Williams River and Turbidity in Lake Havasu During and Following Two High Releases from Alamo Dam, Arizona, in 2005 and 2006
By Stephen M. Wiele, Robert J. Hart, Hugh L. Darling, and Andrew B. Hautzinger
Abstract Discharges higher than are typically released from Alamo
Dam in west-central Arizona were planned and released in 2005, 2006, 2007, and 2008 to study the effects of these releases on the Bill Williams River and Lake Havasu, into which the river debouches. Sediment concentrations and water discharges were measured in the Bill Williams River, and turbidity, temperature, and dissolved oxygen were measured in Lake Havasu during and after experimental releases in 2005 and 2006 from Alamo Dam. Data from such releases will support ongoing ecological studies, improve environmentally sensitive management of the river corridor, and support the development of a predictive relationship between the opera-tion of Alamo Dam and downstream flows and their impact on Lake Havasu and the Colorado River.
Elevated discharges in the Bill Williams River mobilize more sediment than during more typical dam operation and can generate a turbidity plume in Lake Havasu. The intakes for the Central Arizona Project, which transfers Colorado River water to central and southern Arizona, are near the mouth of the Bill Wil-liams River. Measurement of the turbidity and the development of the plume over time consequently were important components of the study. In this report, the measurements of suspended sedi-ment concentration and discharges in the Bill Williams River and of turbidity in Lake Havasu are presented along with calculations of silt and sand loads in the Bill Williams River.
Sediment concentrations were varied and likely depen-dent on a variable supply. Sediment loads were calculated at the mouth of the river and near Planet, about 10 km upstream from the mouth for the 2005 release, and they indicate that a net increase in transport of silt and a net decrease in the trans-port of sand occurred in the reach between the two sites.
Introduction Planned high-discharge releases from dams have become
a valuable management tool for riparian corridors downstream from dams (see, for example, Webb and others, 1999). High
discharges were planned and released from Alamo Dam in 2005, 2006, 2007, and 2008 to study the effects of these releases on the Bill Williams River downstream. Sediment concentrations and water discharges that were measured in the Bill Williams River and turbidity that was measured in Lake Havasu during and after experimental releases in 2005 and 2006 from Alamo Dam (fig. 1) are the subject of this report. Temperature, specific conductance, dissolved oxygen, and pH were also measured in Lake Havasu in 2006 but are not discussed here. Data from such releases will support ongoing ecosystem studies, improve environmentally sensitive man-agement of the river corridor, and support the development of a predictive relationship between the operation of Alamo Dam and downstream flows (Hautzinger, 2001).
Elevated discharges in the Bill Williams River mobilize more sediment than is transported during more typical dam operation. As a result, more sediment is delivered to Lake Havasu and a turbidity plume can form at the mouth of the Bill Williams River and spread into the lake. The intakes for the Central Arizona Project (CAP), which transfers Colorado River water to central and southern Arizona, are in Lake Havasu near the mouth of the Bill Williams River. The CAP shuts down operation at turbidity levels in Lake Havasu between 25 and 50 nephalometric turbidity units (NTU) because of problems associated with possible damage to the pumping plant’s impellers, the effect of turbidity on water treatment plants, and reduction in infiltration rates at recharge projects (Brian Henning, Water Systems Supervisor, Central Arizona Project, oral commun., 2009). Measuring the intensity of the turbidity and the development of the plume over time were consequently important components of the study.
Purpose and Scope This report presents discharge and sediment data col-
lected in the Bill Williams River and turbidity and related measurements made in Lake Havasu during and following high-discharge releases from Alamo Dam in 2005 and 2006. Cumulative silt and sand volumes were computed for two locations in 2005 and for one location in 2006. The cumulative

2 Sediment Transport in the Bill Williams River and Turbidity in Lake Havasu, Arizona, in 2005 and 2006
114°6'114°8'114°10'114°12'
34°20'
34°18'
34°22'
95
0 1 2 KM
2 MI0 1
Parker Dam
L a k e H a v a s u
BillWilliams
River
Central ArizonaProject (CAP)
intake
RiverMile 0
29
30
2827
26
20
2122
23
2425
1718
19 141516
29
103546
7
81
1211 13
Colorado River
ARIZONANV
CA
Phoenix
Flagstaff
Tucson
0 5 10 MI
0 5 10 KMBill Williams River at Lake Havasu; 0926630
Bill Williams River at Planet; 09426500
Bill Williams River near Parker; 09426620
Bill Williams Riverbelow Alamo Dam;09426000
AlamoDam
34°20'
34°16'
34°12'
114°12' 114°02' 113°52' 113°42' 113°32'
Figure 1. Maps showing measurement locations on the Bill Williams River and in Lake Havasu.
sediment volumes quantify the total sediment load during the
and at the river mouth during both the 2005 and 2006 events.
Description of Study Area
The study area consists of the Bill Williams River between Alamo Dam and the mouth and Lake Havasu between
Corps of Engineers operates Alamo Dam and describes it as
http://www.spl.usace.army.mil/resreg/htdocs/almo_2.html). The gates of the dam were
River has been largely controlled by dam operation, except for contributions from tributaries downstream from the dam (Wilson and Owen-Joyce, 2002), and the peak discharges have

Streamflow Gaging Station Discharge Records and Measurements 3
0
10,000
20,000
Dec 1939 Aug 1953 Apr 1967 Dec 1980 Sept 1994 May 1908
2006 release
2005 release
Dis
char
ge,
in c
ub
ic f
eet
per
sec
on
d
y = 0.8893X − 11.867 R² = 0.9974
1
10
102
103
1 10 102 103
Ave
rag
e an
nu
al d
isch
arg
e at
Bill
Will
iam
s n
ear
Par
ker
and
at
Pla
net
gag
es, i
n c
ub
ic f
eet
per
sec
on
d
Average annual discharge at Bill Williams belowAlamo Dam gage, in cubic feet per second
Bill Williams River at Planet gage (1940–1946)
Bill Williams River near Parker gage (1989–2005)
National Wildlife Refuge is located in the reach upstream from the mouth. Operation of Alamo Dam also affects Alamo Lake State Park and Wilderness Area and the downstream river, which passes through Planet Ranch (owned by the City of Scottsdale, Arizona), Bureau of Land Management Wilder-ness, and two private land holdings.
The Bill Williams River occupies an alluvial bed and alternates between narrow gorges and wider alluvial reaches (House and others, 1999). The channel is braided at low flows, with a bed composed of sand and gravel (House and others, 1999). The river aquifer is well connected to surface water (Hautzinger, 2001), and the 39 miles between Alamo Dam and the mouth contain multiple sequences of reaches that gain and lose discharge through exchange with the river aquifer.
A significant fraction of the water released from Alamo Dam can infiltrate the channel bed. The fraction of the water released from Alamo Dam that passes gages located 26 mi. (Bill Williams River at Planet; 09426500) and 31 mi. (Bill Williams River near Parker; 09426620) below Alamo Dam is variable at base flows (discharges less than about 100 ft3/s; Shafroth and Beauchamp, 2006). At higher average annual discharges, the average annual discharge consistently declines about 10 percent between the dam and the lower gage sites (fig. 3). Other factors, such as evapotranspiration and tributary inputs, can also affect differences in water volume between the two gages.
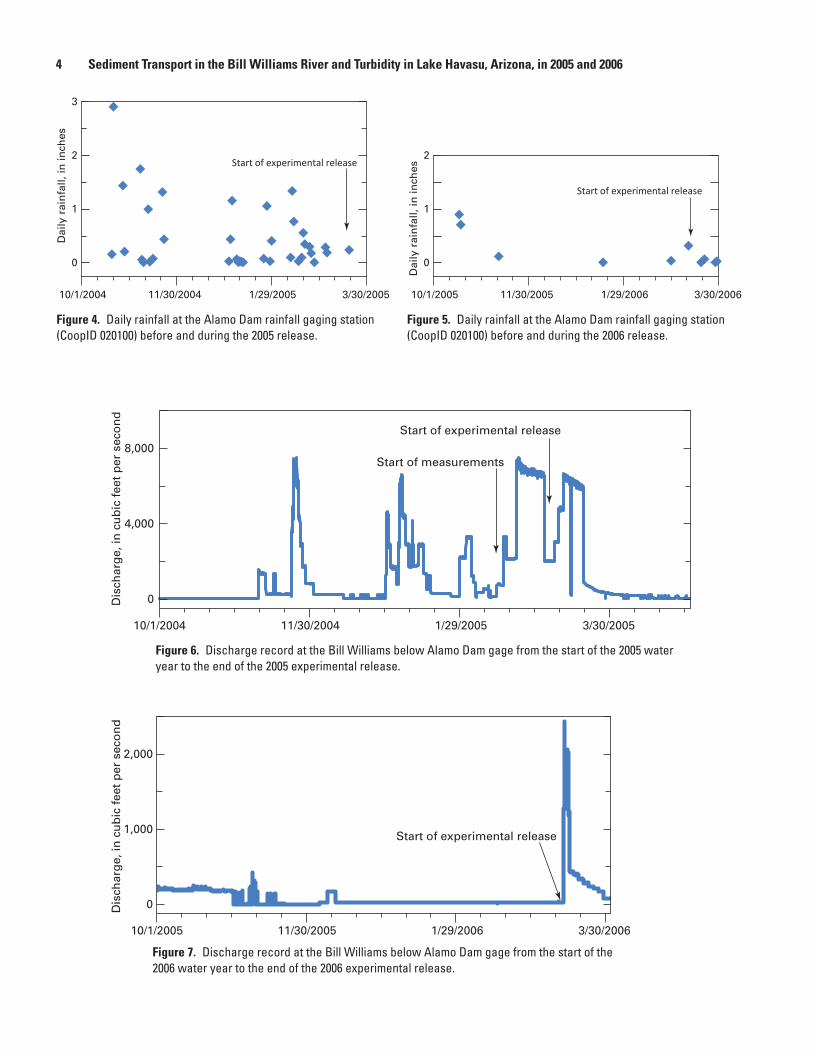
Leading up to the experimental releases, significantly more rain fell in water year (October 1 to September 30) 2005 (fig. 4) than in water year 2006 (fig. 5); water from 2005 storms was intentionally stored to support the 2006 experimental release. Tributaries to the Bill Williams River were running before and during the 2005 release but were dry before and during the 2006 release. The rainfall in 2005 also required high releases before and after the scheduled experi-mental release (fig. 6); in 2006, releases prior to the experi-mental release were much lower (fig. 7).
Locations along the Bill Williams River are designated by river mile upstream from the Highway 95 bridge near the river mouth. The distance along the river below the dam is also given in the context of flow processes.
Figure 2. Daily average discharge record at the Bill Williams below Alamo Dam gage for the period of record.
Figure 3. Average annual discharge at the Bill Williams below Alamo and Bill Williams at Planet and near Parker gages.
Streamflow Gaging Station Discharge Records and Measurements
There are currently two active streamflow gaging sta-tions on the Bill Williams River (fig. 1): Bill Williams River below Alamo Dam (gage number 09426000) and Bill Wil-liams River near Parker (09426620). Before the Bill Williams below Alamo Dam gage, which came into operation in 1968, a gage located 1.7 mi upstream from the current site moni-tored Bill Williams River streamflow. This gage was known as the Williams River near Alamo gage from October 1939 through September 1943 and as the Bill Williams River near
4 Sediment Transport in the Bill Williams River and Turbidity in Lake Havasu, Arizona, in 2005 and 2006
0
1
2
10/1/2005 11/30/2005 1/29/2006 3/30/2006
Dai
ly r
ain
fall,
in in
ches
Start of experimental release
Start of measurements
Start of experimental release
10/1/2004 11/30/2004 1/29/2005 3/30/2005
0
4,000
8,000
Dis
char
ge,
in c
ub
ic f
eet
per
sec
on
d
0
1
2
3
10/1/2004 11/30/2004 1/29/2005 3/30/2005
Dai
ly r
ain
fall,
in in
ches
Start of experimental release
Figure 7. Discharge record at the Bill Williams below Alamo Dam gage from the start of the 2006 water year to the end of the 2006 experimental release.
Start of experimental release
10/1/2005 11/30/2005 1/29/2006 3/30/2006
0
1,000
2,000
Dis
char
ge,
in c
ub
ic f
eet
per
sec
on
d
Figure 5. Daily rainfall at the Alamo Dam rainfall gaging station (CoopID 020100) before and during the 2006 release.
Figure 6. Discharge record at the Bill Williams below Alamo Dam gage from the start of the 2005 water year to the end of the 2005 experimental release.
Figure 4. Daily rainfall at the Alamo Dam rainfall gaging station (CoopID 020100) before and during the 2005 release.

Streamflow Gaging Station Discharge Records and Measurements 5
2/12/2005 2/22/2005 3/4/2005 3/14/2005 3/24/2005
0
4,000
8,000
12,000
Dis
char
ge,
in c
ub
ic f
eet
per
sec
on
dAlamo Dam gage
Parker gage
Measured at mouth
Measured at Planet
3/12/2006 3/14/2006 3/16/2006 3/18/2006
0
1,000
2,000
Dis
char
ge,
in c
ub
ic f
eet
per
sec
on
d
Alamo Dam gage
Measured at mouth
Figure 9. Hydrographs during the 2006 experimental
Figure 8. Hydrographs before and during the 2005 experimental
Alamo gage from October 1943 to September 1967. The two gages with three names near the current location of Alamo Dam have the same site identification number (09426000), and the data from these gages is stored as a continuous record in the U.S. Geological Survey (USGS) National Water Informa-tion System database. For brevity, the gages near Alamo and Alamo Dam will be referred to as the Alamo gage and the Bill Williams River near Parker streamflow gaging station will be referred to as the Parker gage. The locations of two additional sites are used to indicate measurement locations (fig. 1): Bill Williams River at Planet (09426500), which was active between 1928 and 1946, and Bill Williams River at Lake Havasu (09426630), which is located near the mouth of the Bill Williams River and was designated as a gaging site for the 2005 discharge measurements and sediment sampling. Also
for brevity, these two locations will be referred to as the Planet and Bill Williams mouth sites.
The current Alamo gage is 0.6 mi below Alamo Dam (river mile 36, 36 miles upstream from the Highway 95 bridge), the Planet site is about 26 mi below Alamo Dam (river mile 10), and the Parker gage is about 31 mi below Alamo Dam (river mile 5). The Alamo gage has a cableway, enabling measurement of discharge and sediment across the channel at any discharge. At the other locations, measure-ments across the channel must be made by wading or from a boat, but neither could be safely accomplished during the highest discharges. Measurements were made at the Alamo and Planet sites and at the Bill Williams mouth during the 2005 release (fig. 8) and only at the mouth during the 2006 release (fig. 9). The discharge records and related gage

6 Sediment Transport in the Bill Williams River and Turbidity in Lake Havasu, Arizona, in 2005 and 2006
1
102
104
Mar 1 Mar 15
2005
Mar 29 Apr 12
Discharge
Sand
Silt
Apr 26
Dis
char
ge,
in c
ub
ic f
eet
per
sec
on
d
Sed
imen
t co
nce
ntr
atio
n,
in m
illig
ram
s p
er li
ter
0
2,000
4,000
6,000
1
102
104
Mar 1Feb 15 Mar 152005
Mar 29 Apr 12
Discharge
Sand
Silt
Apr 26
Dis
char
ge,
in c
ub
ic f
eet
per
sec
on
d
Sed
imen
t co
nce
ntr
atio
n,
in m
illig
ram
s p
er li
ter
0
2,000
4,000
6,000
information for the Alamo, Planet, and Parker streamflow gaging stations are available at http://waterdata.usgs.gov/az/nwis/nwis.
The Parker gage is an active streamflow gaging site but is inaccessible during high flows. High-flow measurements were made instead at the Planet site during 2005, but they were limited to wading measurements at discharges less than about 500 ft3/s. The discharges at Parker were estimated from the Alamo discharge record and the Parker stage records. The Parker and Alamo gages were operating normally during the 2005 release, and 15-minute stage data are available for both sites. Discharges were measured at the Alamo gage during the high flows in 2005 and 2006. Those measurements were used to develop shifts to the rating curve to account for channel changes. Because direct discharge measurements were not possible during the experimental flows at the Parker gage, discharge measurements made at the mouth, incorporating the estimated traveltime between the two locations, were used to develop shifts for the Parker gage rating curve. The rating curve and associated shifts were applied to the stage record from the Parker gage to provide a continuous record of dis-charge at this site. For the 2006 release, 15-minute discharge data are available only from the Alamo gage.
Releases from Alamo Dam
In February 2005, measurements were made during a high-flow release from Alamo Dam designed to control lake level. This release reached a peak of 7,300 ft3/s and declined to 6,600 ft3/s over 11 days (fig. 8). A planned experimental release began on March 19 and reached a peak of about 6,700 ft3/s that declined to 5,800 ft3/s over about 8 days. The 2005 sediment and turbidity measurements presented in this report were made before, during, and after the planned experimen-tal releases. Before the high releases in February and March 2005, peaks of about 7,000 ft3/s in November 2004, 4,600 ft3/s in December 2004, and 6,500 ft3/s in January 2005 were recorded at the Alamo gage (fig. 6). The peak discharges in 2005 were in the range of moderate floods on the Bill Wil-liams River that would support the riparian corridor (Shafroth and Beauchamp, 2006).
The 2006 experimental release began on March 13 and rose from a steady discharge of about 36 ft3/s to a peak of about 2,400 ft3/s over a period of about 3 hours (fig. 9). About 11 hours after the initial rise, the discharge declined and was held at about 1,900 to 2,000 ft3/s for 38 hours. The discharge then was lowered to about 450 ft3/s over 3.5 hours,
Figure 11. Sand and silt concentrations and discharge measured near the mouth of the Bill Williams River during the 2005 release.
Figure 10. Sand and silt concentrations and discharge measured near Planet during the 2005 release.

Sediment Volumes Transported by the Bill Williams River During and Following the Experimental Releases 7
1
102
104
106
Mar 16Mar 12 Mar 202006
Mar 24
Discharge
Sand
Silt
Dis
char
ge,
in c
ub
ic f
eet
per
sec
on
d
Sed
imen
t co
nce
ntr
atio
n,
in m
illig
ram
s p
er li
ter
0
500
1,000
1,500
Two samples with no sand
then gradually declined to 36 ft3/s over the next 2 weeks. The 2006 sediment and turbidity measurements presented in this report were collected before, during, and after the experimental release in March 2006. Before the March 2006 release, a peak discharge of about 400 ft3/s in November 2005 was recorded at the Alamo gage. The peak discharges in 2006 after the November 2005 peak were less than about 200 ft3/s (fig. 7). The peak discharge of around 2,000 ft3/s in 2006 is near the middle of the magnitude of small floods on the Bill Williams River that would support the riparian cor-ridor (Shafroth and Beauchamp, 2006).
Suspended Sediment Sampling in the Bill Williams River
Suspended sediment samples were collected at the Alamo, Planet, and Bill Williams mouth sites (appendix 1; figs. 10 and 11) during the 2005 release. The samples at the mouth were collected from a boat and integrated vertically and across the channel using standard methods as described by Edwards and Glysson (1998). Point samples were col-lected at the Planet site by wading. As described in the previous section, discharges above 500 ft3/s were too swift to safely wade or operate a boat. When the discharge was greater than 500 ft3/s, the suspended sediment was sampled with a point sampler about five to ten feet from the bank and four feet below the surface. The samples at the Alamo gage were collected from a cableway and integrated vertically and across the channel using standard methods as described by Edwards and Glysson (1998).
During the 2006 release, sediment samples on the Bill Williams River were collected only at the mouth site (appen-dix 1; fig. 12) to estimate the sediment volume delivered to Lake Havasu. These samples were collected from a boat and integrated across the channel, as in 2005.
The sediment samples were analyzed by the USGS sediment laboratory at the Cascades Volcano Observatory in
Vancouver, Washington. The analysis determined the sediment concentration and the percent finer and coarser than 0.63 mm. Suspended sediment data and discharge measurements are in appendix 1.
Sediment Volumes Transported by the Bill Williams River During and Following the Experimental Releases
A significant factor in the geomorphological develop-ment of the Bill Williams riparian corridor and in the turbidity observed in Lake Havasu during high releases from Alamo Dam is the cumulative sediment load carried by the river. Estimates of the silt and sand loads could be made at the Planet site and at the mouth during the 2005 release and at the mouth during the 2006 release. Accuracy of these estimates of sediment load depends on the coverage of the measure-ments as well as on the accuracy of discharge and sediment measurements.
Because of logistical and resource limitations, continuous measurements were not possible. Consequently, there are gaps in the records during which changes in discharge and sediment load occurred. An approximation of the sediment load can be made by developing a discharge-sediment-transport rating curve and applying it to a discharge record to determine sedi-ment transport. During the 2005 release, the continuous stage record at the Parker gage provided a discharge record that can be used at both the Planet site and near the mouth with appro-priate offsets for traveltime (fig. 8). Because the Parker gage is only 5 mi. above the mouth, differences in peak discharges between the two sites are assumed to be small.
Power functions were fitted to the silt and sand concen-trations (fig. 13) to develop sediment concentration-discharge relations at the Planet site during the 2005 release. Those rela-tions were then used with the estimate of continuous discharge to compute the sediment mass transport over time (fig. 14). The cumulative mass was computed with
(1)
where ms is the cumulative sediment mass, qs is the silt or sand transport rate in mass/time, t is time, i is the index of sediment transport at time t, and n is the number of values used in the calculation.
A similar procedure was used to compute the cumulative silt and sand transport at the mouth site in 2005. The measure-ments at the mouth early in the 2005 release, however, indicate that an initial surge of sediment was transported as the flow rose (figs. 11 and 15), which generated substantially higher sediment concentrations than occurred later during the event. A similar surge may have occurred during the early part of the first sustained peak that preceded the planned experimental release (fig. 8) at the Planet site, but samples at that location
Figure 12. Sand and silt concentrations and discharge measured near the mouth of the Bill Williams River during the 2006 release.

8 Sediment Transport in the Bill Williams River and Turbidity in Lake Havasu, Arizona, in 2005 and 2006
Feb 7 Feb 17 Feb 272005
Mar 9 Mar 19 Mar 290
4,000
8,000
12,000
Dis
char
ge,
in c
ub
ic f
eet
per
sec
on
d
Cu
mu
lati
ve s
edim
ent,
in m
etri
c to
ns
0
40,000
80,000
120,000
Sand
Continuousdischarge
Measureddischarge
Silt
1
0
10
102
103
2,0000 4,000
Discharge, in cubic feet per second
6,000
Sed
imen
t co
nce
ntr
atio
n,in
mill
igra
ms
per
lite
r
y = 0.1618x0.8644
R² = 0.9785
y = 0.3151x0.7428
R² = 0.6152
Silt
Sand
were not collected until after the flow had peaked. Measure-ments of discharge and sediment concentration at the mouth were frequent enough to define the sediment transport during the rise of the first sustained peak. Because of this and the higher concentrations during that part of the flow, the cumula-tive sediment transport is computed directly from the measure-ments of sediment concentration and discharge at the mouth for the early part of the flow, up to February 16 at 14:00. For the same reasons, the sediment concentrations sampled up to February 16 at 14:00 are not included in the formulation of the sediment transport-discharge relation that was used to com-pute the silt and sand mass transport following that date and time (fig. 16). Equation 1 was used to compute the cumulative masses of sand and silt transported (fig. 17).
During the 2006 experimental release, measurements were made during the initial rise, during the peak, and during
the following low flow with gaps between those measurements (fig. 12). Unlike the data in 2005, these discharge measure-ments show a significant drop in peak discharge at the mouth, indicating that the hydrograph at the mouth cannot be reason-ably approximated by translating the hydrograph of the dam release downstream. In the absence of sufficient information to reconstruct the hydrograph at the mouth in 2006, estimates of sediment transport rates between measurements were not attempted and the cumulative sediment volumes are presented as straightforward summations of available data using equa-tion 1 (fig. 18).
Turbidity Measurements in Lake Havasu During the 2005 measurements, McVan (http://www.
mcvan.com/) and HACH 2100HP (http://www.hach.com/) tur-bidity instruments were used to measure turbidity at selected depths in Lake Havasu between the mouth of the Bill Williams River and Parker Dam and at two additional uplake locations (fig. 1). Both instruments were calibrated before each envi-ronmental measurement with turbidity standards of 0, 100, 500, and 1,000 NTUs. All calibrations were within 0 to 0.002 percent of the standard.
During 2006, a Sea-Bird Electronics (http://www.seabird.com/) SBE25 was used to make profile measurements. The sensors for pressure, water temperature, specific conductance, dissolved oxygen, and turbidity were calibrated annually by the manufacturer. Calibration coefficients were updated in the Sea-Bird software following calibration. All measurements from the SBE25 are included in the appendix, but only turbid-ity is discussed in this report.
The Sea-Bird SBE25 was programmed to scan the sen-sors at 2 Hz. The data were logged as raw voltages from the sensors in hexadecimal format. At this sampling interval and
Figure 14. Discharge and cumulative sediment volumes during the 2005 release at the Planet streamflow gaging station.
Figure 13. Concentrations of silt and sand sampled near Planet on the Bill Williams River in 2005 with fitted lines.
Turbidity Measurements in Lake Havasu 9
Figure 15. Silt (A) and sand (B) concentrations at the mouth of the Bill Williams River during the 2005 and 2006 experimental releases.
Figure 16. Silt (A) and sand (B) concentrations used to formulate discharge-sediment concentration rating curves use in the 2005 cumulative volume calculation release at the mouth of the Bill Williams River.
Figure 17. Discharge and cumulative sediment volumes during the 2005 release at the mouth of the Bill Williams River.
Feb 16 Feb 26 Mar 82005
Mar 180
4,000
8,000
12,000
Dis
char
ge,
in c
ub
ic f
eet
per
sec
on
d
Cu
mu
lati
ve s
edim
ent
volu
me,
in m
etri
c to
ns
0
100,000
200,000
300,000
Sand
Continuousdischarge
Measureddischarge
Silt
0
200
400
600
800
1,000
Mar 14 Mar 152006
Mar 16
Cu
mu
lati
ve s
edim
ent
mas
s, in
met
ric
ton
s
Dis
char
ge,
in c
ub
ic f
eet
per
sec
on
d
Measured discharge
Silt
Sand
11.6 metric tons of sand
0
400
800
1,200
10
102
103
104
105
20062005
1
0
10
102
103
2,0000 4,000
A. Silt sampled near mouth
B. Sand sampled near mouth
Discharge, in cubic feet per second6,000
Co
nce
ntr
atio
n, i
n m
illig
ram
s p
er li
ter
1
10
102
103
104
0
1
10
102
103
2,0000 4,000
A. Silt sampled near mouth in 2005
B. Sand sampled near mouth in 2005
Discharge, in cubic feet per second6,000
Co
nce
ntr
atio
n, i
n m
illig
ram
s p
er li
ter
y = 1.1923x0.7283
R2 = 0.7532
y = 2.606522E+00e5.139360E-04x
R² = 7.148145E-01
Figure 18. Discharge and cumulative sediment volumes during the 2006 release at the mouth of the Bill Williams River.

10 Sediment Transport in the Bill Williams River and Turbidity in Lake Havasu, Arizona, in 2005 and 2006
Figure 19. Turbidity point measurements in Lake Havasu during the planned release from Alamo Dam during February through April, 2005. Black dots show the location of each measurement site.
02/25/2005
18
511
109
25
1419
21
20
1518
22
2423
16
1726
27
28
Parker Dam
L a k e H a v a s u
Bill Williams River
0 2 4 8 16 32 64 128 256 512
Turbidity, in NTU
02/24/2005
18
6 74
10
1617
23 2425
Parker Dam
L a k e H a v a s u
Bill Williams River
Central ArizonaProject (CAP)intake
Central ArizonaProject (CAP)intake
0 2 4 8 16 32 64 128 256 512
Turbidity, in NTU

Turbidity Measurements in Lake Havasu 11
Figure 19. Turbidity point measurements in Lake Havasu during the planned release from Alamo Dam during February through April, 2005. Black dots show the location of each measurement site—Continued.
1
64
10
16
17
2524
23
22
26
27
28
03/08/2005
Parker Dam
L a k e H a v a s u
Bill Williams River
0 2 4 8 16 32 64 128 256 512
Turbidity, in NTU
4
10
16
17
2423
22
26
27
28
Parker Dam
L a k e H a v a s u
Bill Williams River
0 2 4 8 16 32 64 128 256 512
Turbidity, in NTU
03/24/2005
Central ArizonaProject (CAP)intake
Central ArizonaProject (CAP)intake

12 Sediment Transport in the Bill Williams River and Turbidity in Lake Havasu, Arizona, in 2005 and 2006
25
24
17
23
22
26
27
28
Parker Dam
L a k e H a v a s u
Bill Williams River
0 2 4 8 16 32 64 128 256 512
Turbidity, in NTU
04/06/2005
Central ArizonaProject (CAP)intake
Thirty sites were sampled on the lake and four sites were sampled on the river (fig 1). A numbering system consisting of 30 sampling points was designed for the area of study in Lake Havasu. Sampling points were selected to provide adequate coverage from the Bill Williams delta west toward the Central Arizona Project intake structures. Several sites were located closer to Parker Dam, and two sites were located, respectively, northwest of and uplake of Parker Dam (fig. 1). The sites were georeferenced using a handheld Brunton global positioning system. Depth-profile measure-ments of turbidity, specific conductance, water temperature, dissolved oxygen, and pH were made at the sampling points. The complete Lake Havasu data sets are in appendix 2 (available only online at http://pubs.usgs.gov/sir/2009/5195/appendixes).
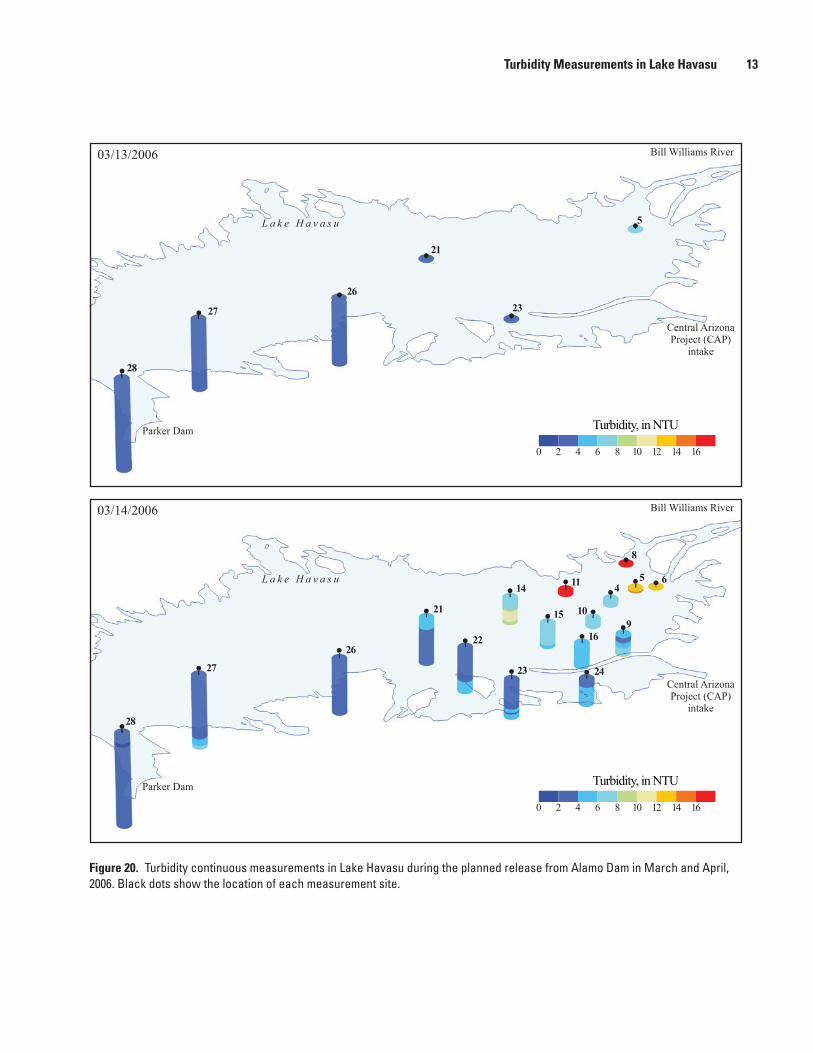
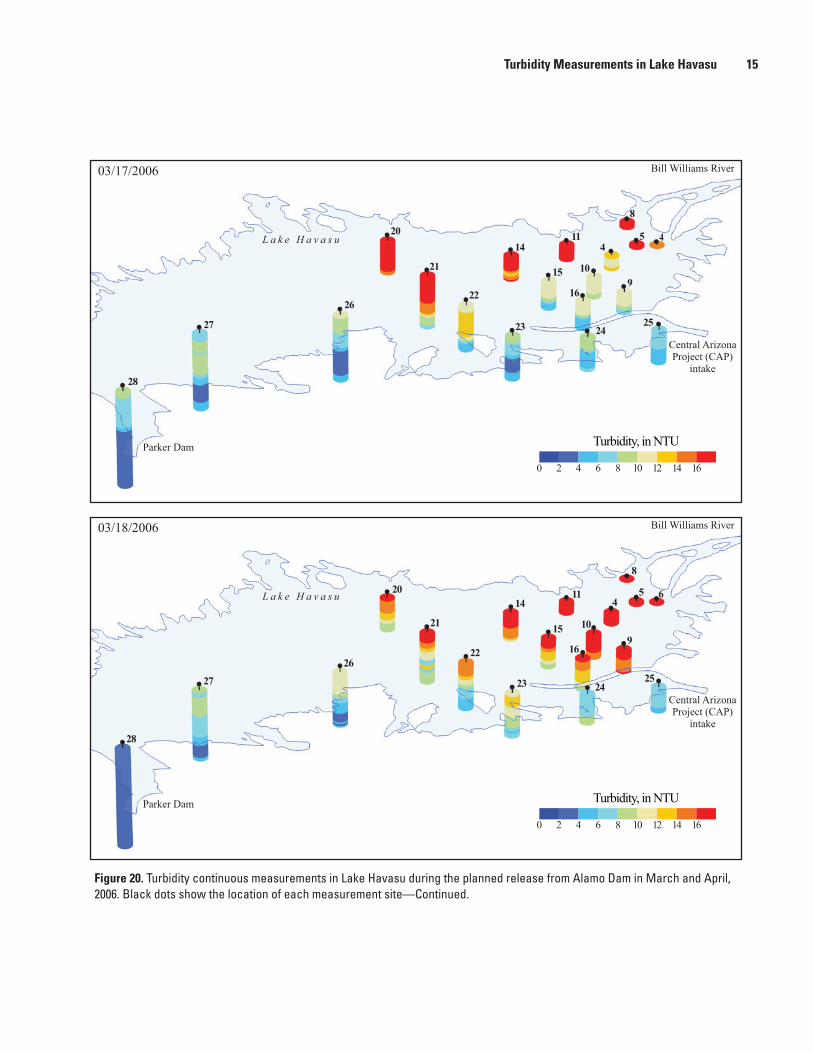
Measurements of turbidity profiles in 2005 started near the time of the peak discharge in the Bill Williams River. Tur-bidity profiles were measured on 5 days over a 6-week period and show the spread and dissipation of the turbidity plume (fig. 19). The profiles of turbidity in 2006 started before the peak discharge in the Bill Williams River and show the spread and dissipation of the turbidity plume, with measurements made on 10 days over about 5 weeks (fig. 20).
with a descent rate of about 1 m/s, the profiler scanned each sensor two times per meter. Start time of the downcast and other information pertinent to the measurement site were entered into the Sea-Bird software for site identification purposes. Profile graphs of the data presented in this report are based on derived, converted, and bin-averaged values from the raw hexadecimal data files. Raw data are avail-able, but the Sea-Bird processing software is needed for data conversion.
A 20-cm-diameter Secchi disk was used to measure the transparency of water as a way of inferring turbidity. Secchi-disk measurements were made from the shaded side of the boat while profile measurements and water samples were being collected. The disk was lowered through the water column until it was no longer visible, and the depth of the disk was recorded. This process was repeated three times, and the average value recorded. Secchi-disk transparency depends on several factors, including the observer’s eyesight, the contrast between the disk and the surrounding water, the reflectance of the disk, and the disk’s diameter (Cole, 1975). The surface condition of the lake also can affect the readings.
The study area extended westward from the mouth of the Bill Williams River toward the forebay of Parker Dam.
Figure 19. Turbidity point measurements in Lake Havasu during the planned release from Alamo Dam during February through April, 2005. Black dots show the location of each measurement site—Continued.
Turbidity Measurements in Lake Havasu 13
Figure 20. Turbidity continuous measurements in Lake Havasu during the planned release from Alamo Dam in March and April, 2006. Black dots show the location of each measurement site.
8
65
4
9
10
11
16
2423
15
14
22
21
26
27
28
Parker Dam
L a k e H a v a s u
Bill Williams River
0 2 4 6 8 10 12 14 16
Turbidity, in NTU
03/14/2006
5
23
21
26
27
28
Parker Dam
L a k e H a v a s u
Bill Williams River
0 2 4 6 8 10 12 14 16
Turbidity, in NTU
03/13/2006
Central ArizonaProject (CAP)
intake
Central ArizonaProject (CAP)
intake

14 Sediment Transport in the Bill Williams River and Turbidity in Lake Havasu, Arizona, in 2005 and 2006
Parker Dam
L a k e H a v a s u
Bill Williams River
0 2 4 6 8 10 12 14 16
Turbidity, in NTU
03/16/2006
28
27
26
20
21
22
23 24
14
15
16
11
10
9
25
5 6
8
4
Parker Dam
L a k e H a v a s u
Bill Williams River
0 2 4 6 8 10 12 14 16
Turbidity, in NTU
03/15/2006
28
27
26
20
21
22
23 24
25
14
15
16
11
10
9
4
5 6
8
Central ArizonaProject (CAP)
intake
Central ArizonaProject (CAP)
intake
Figure 20. Turbidity continuous measurements in Lake Havasu during the planned release from Alamo Dam in March and April, 2006. Black dots show the location of each measurement site—Continued.
Turbidity Measurements in Lake Havasu 15
Parker Dam
L a k e H a v a s u
Bill Williams River
0 2 4 6 8 10 12 14 16
Turbidity, in NTU
03/17/2006
28
27
26
20
21
22
23
14
15
16
2425
9
10
11
4
5 4
8
Parker Dam
L a k e H a v a s u
Bill Williams River
0 2 4 6 8 10 12 14 16
Turbidity, in NTU
03/18/2006
28
27
26
20
21
22
2324
25
14
15
16
11
10
9
4
5 6
8
Central ArizonaProject (CAP)
intake
Central ArizonaProject (CAP)
intake
Figure 20. Turbidity continuous measurements in Lake Havasu during the planned release from Alamo Dam in March and April, 2006. Black dots show the location of each measurement site—Continued.

16 Sediment Transport in the Bill Williams River and Turbidity in Lake Havasu, Arizona, in 2005 and 2006
Parker Dam
L a k e H a v a s u
Bill Williams River
0 2 4 6 8 10 12 14 16
Turbidity, in NTU
03/23/2006
28
27
26
20
21
22
2324
25
16
25
1411
10
9
4
5 6
8
Parker Dam
L a k e H a v a s u
Bill Williams River
0 2 4 6 8 10 12 14 16
Turbidity, in NTU
03/31/2006
28
27
26
20
21
22
23
14
15
16
24
25
9
10
11
4
5 6
8
Central ArizonaProject (CAP)
intake
Central ArizonaProject (CAP)
intake
Figure 20. Turbidity continuous measurements in Lake Havasu during the planned release from Alamo Dam in March and April, 2006. Black dots show the location of each measurement site—Continued.

Turbidity Measurements in Lake Havasu 17
Parker Dam
L a k e H a v a s u
Bill Williams River
0 2 4 6 8 10 12 14 16
Turbidity, in NTU
04/06/2006
28
27
26
20
21
22
2324
25
16
9
1510
1411
45 6
8
Parker Dam
L a k e H a v a s u
Bill Williams River
0 2 4 6 8 10 12 14 16
Turbidity, in NTU
04/20/2006
28
27
26
20
21
22
23 24
25
916
15
1411
10
4
5 6
8
Central ArizonaProject (CAP)
intake
Central ArizonaProject (CAP)
intake
Figure 20. Turbidity continuous measurements in Lake Havasu during the planned release from Alamo Dam in March and April, 2006. Black dots show the location of each measurement site—Continued.

18 Sediment Transport in the Bill Williams River and Turbidity in Lake Havasu, Arizona, in 2005 and 2006
Figure 21. Vertically-averaged measured turbidity in Lake Havasu at three locations and measured discharge at the mouth of the Bill Williams River during the 2005 planned release from Alamo Dam.
0
2,000
4,000
6,000Discharge (measured at mouth of Bill Williams River)
0
Feb 17 Mar 92005Mar 29 Apr 18 May 8
400
800
1,200
Dis
char
ge,
in c
ub
ic f
eet
per
sec
on
d
Tu
rbid
ity,
in N
TU Site 10 (near mouth of
Bill Williams River)Site 24 (near the CAP inlet)
Site 27 (near Parker Dam)
0
400
800
1,200Discharge (measured at mouth of Bill Williams River)
0
Mar 10 Mar 202006Mar 30 Apr 9 Apr 19
40
80
120
160
200
Dis
char
ge,
in c
ub
ic f
eet
per
sec
on
d
Tu
rbid
ity,
in N
TU
Site 10 (near mouth of Bill Williams River)Site 24 (near the CAP inlet)
Site 27 (near Parker Dam)
Figure 22. Vertically-averaged measured turbidity in Lake Havasu at three locations and measured discharge at the mouth of the Bill Williams River during the 2006 planned release from Alamo Dam.
Discussion During the 2005 release, silt loads calculated from
measurements indicate more silt was transported at the mouth of the Bill Williams River than at the Planet site, indicating that silt was entrained in the lower part of the river. About 2.5 times more silt, about 150,000 metric tons, was transported past the mouth than was transported at the Parker site. This is consistent with the domination of sand and gravel on the bed in the upper reaches and the favorable sites for storage of silt in the lower gradient, vegetation-rich part of the river downstream. The reverse pattern occurred with the sand: about three times more sand, about 45,000 metric tons, was trans-ported past the Planet site than past the mouth, indicating sand
deposition occurred between the two sites. The sediment load at Planet may be underestimated because no measurements were made during the early part of the high release. A surge in sediment transport similar to that which occurred near the mouth may have occurred at Planet, but this cannot be con-firmed or accounted for.
Sediment rating curves were constructed to estimate the volume transported at the measurements sites. The sediment concentrations as functions of discharge, however, show considerable scatter, especially at the mouth (figs. 15 and 16). Some of this scatter may be a result of sampling variability, but changes over time in the sediment supply, particularly dur-ing the initial rise in discharge, may be a significant contribu-tor and have been observed elsewhere in rivers dependant on tributary inputs for sediment supply (for example, Topping and others, 1999). Variations in sediment supply can be especially pronounced in channels downstream from dams, where tribu-taries are the sole source of fresh sediment. During the 2005 release, the silt and sand concentrations spiked with the first rise in discharge, then declined. This spiking is consistent with a limited or variable supply of such sediment.
Development of a predictive capability for sediment transport and discharge along the Bill Williams River as a function of dam releases is complicated by two characteristics: the sediment discharge is variable and appears to be supply dependant, and the water discharge along the channel can be reduced by infiltration into the river aquifer. The variability in the sediment transport was demonstrated by the high concen-trations measured during the rise of the 2005 release at the mouth. Silt concentrations were nearly two orders of magni-tudes higher, at around 2,000 ft3/s, during the rise than after the peak discharge. This variability in sediment supply makes problematic the tracking of net sediment deposition or erosion over reaches of the Bill Williams River with sediment rating curves applied to continuous hydrographs.
The turbidity in Lake Havasu followed the concentra-tion patterns in the Bill Williams River (figs. 19–22). In 2005, the maximum vertically averaged measured turbidity at site 10, about 500 m from the mouth of the Bill Williams River, was 575 NTU. The turbidity at this location declined from the peak, even though the releases continued for about three weeks (fig. 21). The change in turbidity over time near the CAP intake (site 24) and Parker Dam (site 27) followed simi-lar patterns, but the maximum measured vertically averaged turbidities at these two sites were lower than near the mouth at 184 (higher than CAP standards for Lake Havasu turbidity) and 222 NTU, respectively (fig. 21).
In 2006, the discharge peak at the mouth of the Bill Wil-liams River was only about a fourth of the peak discharge in 2005, and the duration was much shorter (figs. 8 and 9). The turbidity in 2006 reached a peak of 80 NTU at site 10 near the mouth and declined to less than 10 NTU in about 14 days. Near Parker Dam (site 27) and the CAP intake (site 24), the highest vertically averaged turbidity measurements did not exceed 10 NTU (fig. 22), which is below CAP standards for turbidity in Lake Havasu.
References Cited 19
In large part, this study was implemented to take advan-tage of the high flows in 2005 to better characterize the sediment dynamics of the Bill Williams River. The acquisi-tion of field data in 2005, which was conceived, arranged, and implemented in the midst of flood conditions, provided an excellent opportunity to learn more about how to design a systematic approach to collection of high-flow sediment data. The field experience in 2005 and 2006 demonstrated the difficulty in obtaining accurate discharge and sediment data in the Bill Williams River because of its complex morphol-ogy and dense vegetation. The collection of discharge and sediment data, especially between the two gage locations, may be enhanced by ongoing technological improvements and increased resources. The establishment of several stations where high discharges could be measured along the river cor-ridor of the Bill Williams River is a high priority of the U.S. Fish and Wildlife Service.
Improved discharge and sediment data collection would address priority management needs, as expressed by the member agencies of the Bill Williams River Corridor Steering Committee (http://billwilliamsriver.org). The current state of knowledge of the river’s sediment dynamics is very limited, with little ability to predict flow-sediment relations. An impor-tant management need exists to better characterize turbidity plumes in Lake Havasu and their relation to Alamo Dam releases (for example, looking at predicting plume intensity and the duration and rates of plume expansion and contrac-tion over a range of flows). The 2005–2006 data collected in this investigation help to address key management concerns, namely an improved understanding of flow and sediment dynamics, and will provide guidance for managing river flows to meet human and ecological concerns. The development of accurate numerical models to predict flow-sediment relation-ships would be highly beneficial, as they would contribute to resolving both of these management concerns.
Acknowledgments The U. S. Bureau of Reclamation provided funding for
the field measurements, and the Central Arizona Project and U.S. Fish and Wildlife Service provided funds for the writing and publication of this report.
References Cited
Cole, G.A., 1975, Textbook of limnology: Department of Zoology, Arizona State University, C.V. Mosby Company, 283 p.
Edwards, T.K., and Glysson, G.D., 1998, Field methods for measurement of fluvial sediment; Book 3, Applications of Hydraulics: U.S. Geological Survey Techniques of Water-Resources Investigations, book 3, chapter C2, 80 p.
Hautzinger, A., 2001, Surface water and groundwater mea-surements along the Bill Williams River, AZ associated with the mini-flush release from Alamo Dam, June 11 - to - 15, 2001: U.S. Fish and Wildlife Service, Technical Brief, 10 p.
House, P.K., Wood, M.L., and Pearthree, P.A., 1999, Hydro-logic and geomorphic characteristics of the Bill Williams River, Arizona: Arizona Geological Survey Open-File Report 99-4, 37 p.
Shafroth, P.B., and Beauchamp, V.B., 2006, Defining eco-system flow requirements for the Bill Williams River, Arizona: U.S. Geological Survey Open-File Report 2006-1314, 135 p. [http://www.fort.usgs.gov/products/publications/21745/21745.pdf; last accessed August 24, 2009].
Topping, D.J., Rubin, D.M., Nelson, J.M., Kinzel, P.J., and Bennet, J.P, 1999, Linkage between grain-size evolution and sediment depletion, during Colorado River floods, in Webb, R.H., Schmidt, J.C., Marzolf, G.R., and Valdez, R.A., (eds.), The controlled flood in Grand Canyon: Washington, D.C., American Geophysical Union, Geophysical Monograph 110.
Webb, R.H., Schmidt, J.C., Marzolf, G.R., and Valdez, R.A., (eds.), 1999, The controlled flood in Grand Canyon: Wash-ington, D.C., American Geophysical Union, Geophysical Monograph 110.
Wilson, R.P., and Owen-Joyce, S.J., 2002, Hydrologic condi-tions in the Bill Williams River National Wildlife Refuge and Planet Valley, Arizona, 2000: U.S. Geological Survey Water-Resources Investigations Report 02-4214, 16 p.
20 Sediment Transport in the Bill Williams River and Turbidity in Lake Havasu, Arizona, in 2005 and 2006
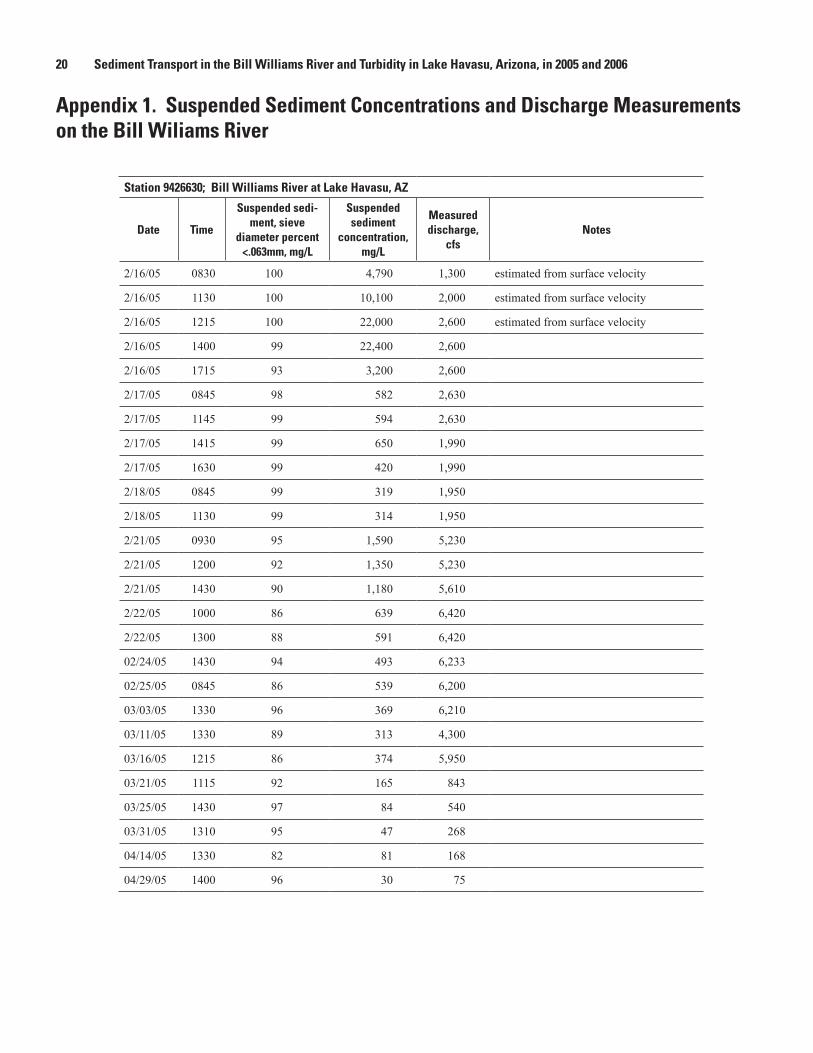
Station 9426630; Bill Williams River at Lake Havasu, AZ
Date Time
Suspended sedi-ment, sieve
diameter percent <.063mm, mg/L
Suspended sediment
concentration, mg/L
Measureddischarge,
cfsNotes
2/16/05 0830 100 4,790 1,300 estimated from surface velocity
2/16/05 1130 100 10,100 2,000 estimated from surface velocity
2/16/05 1215 100 22,000 2,600 estimated from surface velocity
2/16/05 1400 99 22,400 2,600
2/16/05 1715 93 3,200 2,600
2/17/05 0845 98 582 2,630
2/17/05 1145 99 594 2,630
2/17/05 1415 99 650 1,990
2/17/05 1630 99 420 1,990
2/18/05 0845 99 319 1,950
2/18/05 1130 99 314 1,950
2/21/05 0930 95 1,590 5,230
2/21/05 1200 92 1,350 5,230
2/21/05 1430 90 1,180 5,610
2/22/05 1000 86 639 6,420
2/22/05 1300 88 591 6,420
02/24/05 1430 94 493 6,233
02/25/05 0845 86 539 6,200
03/03/05 1330 96 369 6,210
03/11/05 1330 89 313 4,300
03/16/05 1215 86 374 5,950
03/21/05 1115 92 165 843
03/25/05 1430 97 84 540
03/31/05 1310 95 47 268
04/14/05 1330 82 81 168
04/29/05 1400 96 30 75
Appendix 1. Suspended Sediment Concentrations and Discharge Measurements on the Bill Wiliams River

Appendix 1. Suspended Sediment Concentrations and Discharge Measurements on the Bill Wiliams River 21
Station 9426500; Bill Williams River at Planet, AZ
Date Time
Suspended sedi-ment, sieve
diameter percent <.063mm, mg/L
Suspended sediment
concentration, mg/L
Measureddischarge,
cfsNotes
02/24/05 1115 56 761 6,233 point samples collected 5–10 ft from bank at depth of 4 ft
03/03/05 0930 84 304 6,210 point samples collected 5–10 ft from bank at depth of 4 ft
03/11/05 1015 38 537 4,300 point samples collected 5–10 ft from bank at depth of 4 ft
03/16/05 1000 69 313 6,000 point samples collected 5–10 ft from bank at depth of 4 ft
03/25/05 1030 34 144 540 point samples collected 5–10 ft from bank at depth of 4 ft
03/31/05 1020 36 71 324 sediment and discharge measured across channel
04/07/05 1000 72 35 225 sediment and discharge measured across channel
04/14/05 1045 11 53 85 sediment and discharge measured across channel
04/29/05 1015 81 3 28 sediment and discharge measured across channel
Station 9426000; Bill Williams River below Alamo Dam, AZ
Date Time
Suspended sediment, sieve
diameter percent <.063mm. mg/L
Suspended sediment
concentration, mg/L
Measured discharge,
cfsNotes
3/3/05 1035 0 91 6840 samples collected and discharge measured across channel from cableway
22 Sediment Transport in the Bill Williams River and Turbidity in Lake Havasu, Arizona, in 2005 and 2006
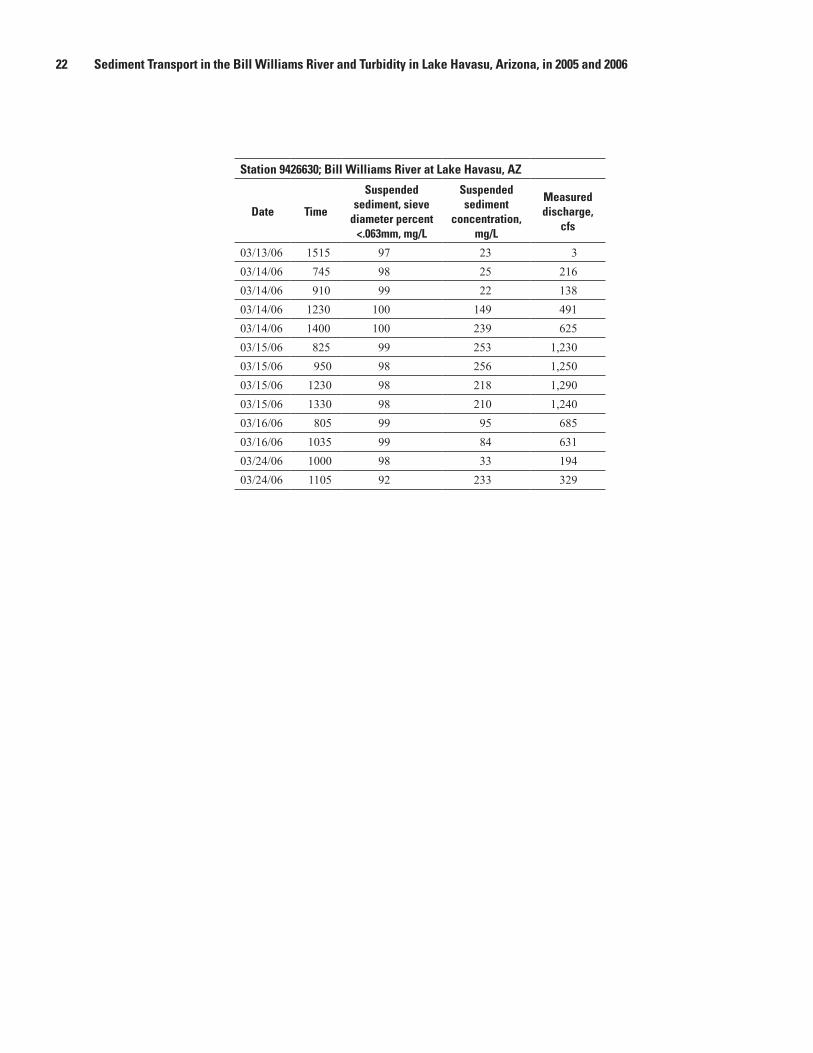
Station 9426630; Bill Williams River at Lake Havasu, AZ
Date Time
Suspended sediment, sieve
diameter percent <.063mm, mg/L
Suspended sediment
concentration, mg/L
Measureddischarge,
cfs
03/13/06 1515 97 23 303/14/06 745 98 25 21603/14/06 910 99 22 13803/14/06 1230 100 149 49103/14/06 1400 100 239 62503/15/06 825 99 253 1,23003/15/06 950 98 256 1,25003/15/06 1230 98 218 1,29003/15/06 1330 98 210 1,24003/16/06 805 99 95 68503/16/06 1035 99 84 63103/24/06 1000 98 33 19403/24/06 1105 92 233 329

Produced in the Western Region, Menlo Park, CaliforniaManuscript approved for publication, August 17, 2009Edited by Peter StaufferLayout by David R. Jones

24 Sediment Transport in the Bill Williams River and Turbidity in Lake Havasu, Arizona, in 2005 and 2006
Wiele and others—
Sediment Transport in the Bill W
illiams River and Turbidity in Lake Havasu, Arizona, in 2005 and 2006—
Scientific Investigations Report 2009-5195