sediment reduction strategy for the minnesota river … · · 2015-01-30sediment reduction...
TRANSCRIPT

Sediment Reduction Strategy for the Minnesota River Basin and South Metro Mississippi River Establishing a foundation for local watershed planning to reach sediment TMDL goals.
January 2015

Authors Larry Gunderson, MPCA Robert Finley, MPCA Heather Bourne, LimnoTech Dendy Lofton, Ph.D., LimnoTech Editing for final version: David Wall, Greg Johnson and Chris Zadak, MPCA
Contributors/acknowledgements Gaylen Reetz, MPCA Scott MacLean, MPCA Justin Watkins, MPCA Greg Johnson, MPCA Chris Zadak, MPCA Wayne Anderson, MPCA Hans Holmberg, P.E., LimnoTech Al Kean, BWSR Shawn Schottler Ph.D., St. Croix Watershed
Research Station Daniel R. Engstrom, Ph.D., St. Croix Watershed
Research Station Craig Cox, Environmental Working Group Patrick Belmont, Ph.D., Utah State University Dave Bucklin, Cottonwood SWCD Paul Nelson, Scott Co. WMO Dave Craigmile
The MPCA is reducing printing and mailing costs by using the Internet to distribute reports and information to wider audience. Visit our web site for more information.
MPCA reports are printed on 100% post-consumer recycled content paper manufactured without chlorine or chlorine derivatives.
Minnesota Pollution Control Agency 520 Lafayette Road North | Saint Paul, MN 55155-4194 | www.pca.state.mn.us | 651-296-6300 Toll free 800-657-3864 | TTY 651-282-5332 This report is available in alternative formats upon request, and online at www.pca.state.mn.us
Document number: wq-iw4-02

Contents Executive summary ............................................................................................................................1
1. Introduction ................................................................................................................................3
The landscape ......................................................................................................................................... 3
Defining the problem: Too much sediment ........................................................................................... 4
Call to action ........................................................................................................................................... 7
2. Total Maximum Daily Loads overview and interim milestones ......................................................9
Minnesota River Basin turbidity TMDLs ................................................................................................. 9
South Metro Mississippi River Total Suspended Solids TMDL ............................................................. 11
Minnesota River turbidity total maximum daily loads modeling scenarios ......................................... 13
Interim milestones ............................................................................................................................... 15
3. Sources of sediment ................................................................................................................... 17
Upland sources ..................................................................................................................................... 18
Near-channel sources ........................................................................................................................... 19
Land use and precipitation effects on river flow .................................................................................. 20
Areas with greatest contributions to sediment loading ....................................................................... 24
4. Sediment reduction options and strategies ................................................................................. 26
Options for sediment reduction ........................................................................................................... 26
Sediment reduction strategies ............................................................................................................. 28
Establish a sediment reduction task force and stakeholder workgroups ............................................ 33
Coordinate implementation with nutrient reduction strategy ............................................................ 33
Direct effective action toward implementation at the local level ....................................................... 34
Use the existing soil conservation policy.............................................................................................. 36
Learn from successes and failures at other large scale implementation efforts ................................. 37
Use Prioritization Tools ........................................................................................................................ 40
Additional study priorities .................................................................................................................... 40
5. Civic engagement: A key strategy for restoring and protecting the Minnesota and South Metro Mississippi Rivers ....................................................................................................................... 43
Civic engagement in the adaptive management framework ............................................................... 45
6. Monitoring, tracking, and adaptive management ........................................................................ 48
Monitoring and trends ......................................................................................................................... 48
Tracking progress ................................................................................................................................. 50
Adaptive management ......................................................................................................................... 51
References ....................................................................................................................................... 53
Appendix A ...................................................................................................................................... 57

Tables Table 1. Summary of interim milestones and final goals for reducing sediment loading in the
Minnesota River Basin, Upper Mississippi River and adjacent watersheds................................. 16
Table 2. Framework for evaluating combinations of sediment reductions which sum to a targeted reduction goal, such as a 25% milestone ..................................................................................... 36
Table 3. Case Study: Chesapeake Bay TMDL.............................................................................................. 38
Table 4. Example tools for prioritizing and targeting watershed restoration efforts ................................ 39
Figures Figure 1. South Metro Mississippi River drainage area, which includes the Minnesota River Basin ........ 3
Figure 2. Current land use within the major watersheds of the Minnesota River Basin ........................... 4
Figure 3. Whole-lake sediment accumulation rate for Lake Pepin based on cores collected in 1995 and 1996 and in 2008......................................................................................................... 6
Figure 4. The process by which this Sediment Reduction Strategy relates to overall planning and implementation efforts. .............................................................................................................. 8
Figure 5. Streams in the Minnesota River Basin that are impaired for turbidity ...................................... 9
Figure 6. Flow-weighted mean total suspended solids concentration for Minnesota River and Greater Blue Earth sampling sites during the monitoring season (April-September, 2000-2008; Annual, 2009-2010) ............................................................................................... 10
Figure 7. Flow-weighted mean total suspended solids concentration during the monitoring season for major tributaries of the Minnesota River (April-September, 2000-2008; Annual, 2009-2010) ................................................................................................................................ 10
Figure 8. South Metro Mississippi River turbidity impairment. ............................................................... 11
Figure 9. Total suspended solids data from stations along with South Metro Mississippi River collected from 1985-2006. ........................................................................................................ 12
Figure 10. Relationship between total suspended solids (TSS) and submerged aquatic vegetation (SAV) at Upper Pool 4 of the Mississippi River (Lake Pepin). Submersed aquatic vegetation (SAV) was sampled at the main and side channels ................................................................... 13
Figure 11. Alternative land use and management options used in the Minnesota River Basin TMDL model scenarios. ....................................................................................................................... 14
Figure 12. Relationship between baseline sediment loading in the Minnesota River at Jordan, Minnesota, and the modeled scenarios with varying degrees of land use changes that will be needed to meet interim milestones and the final goal of a 90% reduction in sediment loading....................................................................................................................... 15
Figure 13. TSS levels from the Minnesota River Watersheds .................................................................... 17
Figure 14. Historical change in dominant crops grown in Blue Earth County, Minnesota ........................ 18
Figure 15. Change in annual average river flow in the Minnesota River at Jordan, Minnesota, since 1935 ................................................................................................................................. 21
Figure 16. Load duration curve showing flows in Minnesota River at Jordan, Minnesota........................ 21
Figure 17. Schematic differences in evapotranspiration among row-crops and prairie grass throughout the summer growing season ................................................................................. 23
Figure 18. Longitudinal profiles of the Le Sueur, Maple, and Big Cobb Rivers showing the presence of a major knickpoint around 30-40 kilometers upstream from the mouth of the river ......... 25
Figure 19. How sediment reduction strategies can vary depending on the combination of where the sediment originates and where the BMPs are to be installed .................................................. 29
Figure 20. Example adaptive progress assessment process ...................................................................... 52

Figure 21. Relationship between baseline sediment loading from the Chippewa River Watershed and the modeled scenarios with varying degrees of land use changes that will be required to meet interim targets and the final goal of a 79% reduction in sediment loading. .............. 57
Figure 22. Relationship between baseline sediment loading from the Yellow Medicine River Watershed and the modeled scenarios with varying degrees of land use changes that will be required to meet interim targets and the final goal of a 77% reduction in sediment loading. ...................................................................................................................................... 58
Figure 23. Relationship between baseline sediment loading from the Hawk Creek Watershed and the modeled scenarios with varying degrees of land use changes that will be required to meet interim targets and the final goal of a 80% reduction in sediment loading. ................... 58
Figure 24. Relationship between baseline sediment loading from the Redwood River Watershed and the modeled scenarios with varying degrees of land use changes that will be required to meet interim targets and the final goal of a 73% reduction in sediment loading. ................... 59
Figure 25. Relationship between baseline sediment loading from the Cottonwood River Watershed and the modeled scenarios with varying degrees of land use changes that will be required to meet interim targets and the final goal of a 90% reduction in sediment loading. .............. 59
Figure 26. Relationship between baseline sediment loading in the Minnesota River at Mankato, Minnesota and the modeled scenarios with varying degrees of land use changes that will be required to meet interim targets and the final goal of a 88% reduction in sediment loading. ...................................................................................................................................... 60
Figure 27. Relationship between baseline sediment loading from the Greater Blue Earth Watershed and the modeled scenarios with varying degrees of land use changes that will be required to meet interim targets and the final goal of a 90% reduction in sediment loading. .............. 60
Figure 28. Relationship between baseline sediment loading from the Watonwan River Watershed and the modeled scenarios with varying degrees of land use changes that will be required to meet interim targets and the final goal of a 80% reduction in sediment loading. .............. 61
Figure 29. Relationship between baseline sediment loading from the Le Sueur River watershed and the modeled scenarios with varying degrees of land use changes that will be required to meet interim targets and the final goal of a 88% reduction in sediment loading. ................... 61

Executive summary High levels of suspended sediment flow through the Minnesota River Basin and subsequently into the Mississippi River. Consequently, many tributaries and river reaches do not meet water quality standards.
High sediment concentrations in surface waters can harm the health of rivers and lakes in the following ways:
· reduce light availability to aquatic plants · impact gill functioning of fish and aquatic invertebrates · reduce fish growth rates · degrade fish spawning habitat · lower aesthetic quality of rivers and lakes · fill in lakes and reservoirs with sediment The Minnesota River contributes approximately 75% of the total suspended solids (TSS) load in the Mississippi River between the Twin Cities and Lake Pepin. At the current sedimentation rate, scientists estimate that Lake Pepin will fill with sediment in approximately 340 years, a rate ten times faster than during pre-European settlement times and nearly four times faster than sediment accumulation rates in 1900.
The Minnesota River Basin’s geologic history makes the basin vulnerable to high sediment loads, which can increase further when land use changes occur. Near-channel sediment from bluffs, river banks and ravines has been identified as a dominant sediment source in many Minnesota River Basin Watersheds. While these sources are not new, increased river flows have led to near-channel erosion rates that significantly exceed pre-settlement rates. Factors contributing to the increased river flows include changes in precipitation patterns and widespread installation of artificial drainage networks, in addition to other possible contributing factors such as cropping changes. Upland areas, which are dominated by corn and soybean production, also contribute sediment to the river. Implementation of agricultural best management practices (BMPs) on numerous fields have helped reduce soil loss to waters, and further reductions are possible through additional BMPs.
As a result of sediment impairments, the Minnesota Pollution Control Agency (MPCA) has developed total maximum daily loads (TMDLs) for both the Minnesota River and the South Metro Mississippi River, which lies between the mouth of the Minnesota River and Lake Pepin. While these TMDLs are not yet finalized, we know that large reductions in sediment loads are needed to improve water quality in these rivers. Actions to reduce sediment loading in these waterbodies should not be delayed. This high-level, large-scale Sediment Reduction Strategy was developed to initiate action and inform watershed planning efforts prior to the completion of the TMDLs. This document does not provide a detailed sequence of instructions that will lead to the sediment reduction goals for each watershed. Rather, it is a starting point that outlines general strategies and actions for local watershed managers to consider while developing individual action plans to meet local and downstream sediment reduction goals.
The draft Minnesota River TMDL identified the need for up to a 90% reduction in sediment loading to meet the water quality needs of the Minnesota River and its tributaries. The draft South Metro Mississippi River TMDL identified the need for a 50% reduction (60% during high flow) in sediment load from the Minnesota River to meet water quality targets in the South Metro Mississippi River. Given that the Minnesota River is the major source of sediment to the South Metro Mississippi River, this strategy document focusses largely on the Minnesota River sediment sources and solutions. While sediment reduction goals and a changing landscape may make this process seem daunting, interim milestones are
Sediment Reduction Strategy • January 2015 Minnesota Pollution Control Agency
1

used to identify the needed level of implementation efforts over specific timeframes and to gauge incremental progress. The strategy presents a Minnesota River milestone sediment reduction target of 25% by 2020.
Sediment loading reductions to rivers can be achieved from a combination of traditional conservation practices that reduce soil erosion on cropland and urban development areas, activities directly controlling near-channel sources, and practices to reduce stream flow during high flow periods.
A priority initiative for this strategy is to reduce peak streamflow magnitude and duration, since the cause of much of the near-channel erosion is high flows that exert erosional energy on streambanks and bluffs. River flow goals include reducing the two-year annual peak flow by 25% by 2030, and to decrease the number of days that the two-year peak flow is exceeded by 25% by 2030. Temporary storage of upland waters will be needed to accomplish the flow reduction objectives. An additional priority includes reducing upland erosion through soil health enhancement techniques. Vegetative buffers and grassed waterways also continue to be important strategies to reduce sediment transport to waters.
Sediment reduction efforts at the magnitude needed to meet water quality standards will require participation from multiple organizations and all users of the land. Making the progress needed to reach sediment reduction goals will require significant time and effort. It will include building on existing research and sediment reduction efforts as well as identifying and implementing new and innovative programs and practices. Continued monitoring and assessment of the impaired waters will allow us to evaluate progress toward sediment reduction and adaptively manage future efforts. The strategy document will likely need to be adapted as progress is made, new information is obtained through future studies, new practices and programs are developed, and changes are made to the state’s water quality standards (and subsequent modifications to the TMDLs).
Sediment Reduction Strategy • January 2015 Minnesota Pollution Control Agency
2

1. Introduction
The landscape The Minnesota River drains to the Mississippi River near St. Paul, Minnesota. The South Metro Mississippi River extends from the mouth of the Minnesota River at Fort Snelling to upper Lake Pepin. The South Metro Mississippi River receives water from the Minnesota River Basin, Upper Mississippi River Basin, St. Croix River Basin, Cannon River Watershed, and Mississippi River - Lake Pepin Watershed (Figure 1). The landscape of Minnesota prior to the mid-1800’s looked very different from the present
day landscape. Prairie vegetation once covered roughly 18 million acres in Minnesota (approximately 32% of the total area in the state). Prairie areas constitute less than 200,000 acres of the land in Minnesota today. In addition, on a statewide basis, approximately half of the historical wetlands in Minnesota have been drained, with up to 90% drained in some parts of the Minnesota River Basin. Land use in the Minnesota River Basin is now dominated by agriculture (Figure 2). As of 2006, approximately 78% of the landscape in the Minnesota River Basin was covered by row-crop agricultural land use (Musser et al. 2009). The landscape surrounding the Mississippi River, on the other hand, is composed of a mixture of urban and rural land uses. The
construction of locks and dams to support river transportation in this reach in the 1930’s has resulted in reduced meandering of channels and impacted backwater wetlands upstream of Lake Pepin (MPCA 2012b).
The agricultural landscape has also changed dramatically. From about 1850-1900, agricultural crops in the upper Midwest were mostly small grains. Around 1940, a large shift in cropping patterns occurred with the expansion of corn and soybeans which replaced small grains. Coupled with the expansion of row-crop agriculture, artificial drainage networks also grew (Lenhart et al. 2013; Schottler et al. 2013). These alterations to the landscape have influenced local and regional hydrology (Anderson and Craig 1984; Musser et al. 2009; DNR 2013).
Figure 1. South Metro Mississippi River drainage area, which includes the Minnesota River Basin (Source: MPCA 2012b).
Sediment Reduction Strategy • January 2015 Minnesota Pollution Control Agency
3

Defining the problem: Too much sediment Although sediment is a naturally occurring component of the landscape, high sediment concentrations in surface waters and the resulting turbidity (reduced water clarity) can have several negative impacts on the health of the aquatic environment. Elevated sediment and turbidity limits light availability to aquatic plants living on the river bottom and in backwaters; impacts gill functioning of fish and aquatic invertebrates; and can reduce growth rates and degrade fish spawning habitat (MPCA 2008; MPCA 2011a). Elevated turbidity also lowers the aesthetic quality of waters, which can negatively impact recreation and tourism in Minnesota (MPCA 2008).
Excess sediment in rivers is one of the predominate stressors to the health of the aquatic life in those rivers. Minnesota’s water quality standards (Minn. R. ch. 7050) are designed to be protective of the waters of the state. In the case of the mainstem of the Minnesota River, its
major tributaries, and the South Metro Mississippi River, high turbidity (sediment and other suspended solids) is causing the designated aquatic life use of the waters to be impaired. Because these waterbodies are not supporting their designated uses, actions must be taken to meet the needed reductions that will enable compliance with water quality standards and to protect the designated uses.
Much of the sediment in the Minnesota and Mississippi Rivers flows into Lake Pepin, a natural impoundment on the Mississippi River lying approximately 50 miles south of the Twin Cities. With a surface area of roughly 39 square miles it provides important recreational and commercial benefits to the region. Current sediment accumulation rates in Lake Pepin are ten times greater than estimated pre-European settlement rates (Schottler et al. 2010). At the current rate of sediment accumulation, Lake Pepin is estimated to be filled with sediment within roughly 340 years (Engstrom et al. 2009). Numerous turbidity impairments have been identified in the greater Minnesota River Basin with TMDLs under development or approved. Eighteen stream reaches are specifically included in the Minnesota River Turbidity TMDL. The South Metro Mississippi River, from the confluence with the Minnesota River to upper Lake Pepin, is also impaired for TSS, which is due to high sediment loading from the Minnesota River. Currently, about 75-90% of the fine sediments accumulating in Lake Pepin are derived from the Minnesota River Basin (Engstrom et al. 2009; Schottler et al. 2010; MPCA 2012a).
Figure 2. Current land use within the major watersheds of the Minnesota River Basin (Source: MPCA 2011b).
Sediment Reduction Strategy • January 2015 Minnesota Pollution Control Agency
4

Sediment in rivers can be from both point and nonpoint sources. Point sources of sediment include wastewater and water treatment facilities and regulated stormwater including municipal, industrial, and construction stormwater. Nonpoint sources include upland (non-regulated urban stormwater and non-urban runoff and near-channel sources (gullies and ravines, stream banks, floodplains, and bluffs).
Point sources generally comprise a small portion of the sediment in the major rivers. While sediment contributions from regulated stormwater entities can be important sources at a small watershed scale, they contribute a relatively small percentage of the total sediment load in the Minnesota River Basin and South Metro Mississippi River.
Nonpoint sources of sediment are the largest sources to the rivers. Recent studies have drawn a distinction between nonpoint sources into upland and near-channel sources. In the 20th century, upland erosion from agricultural fields was a major source of sediment delivery to rivers (Lenhart et al. 2013). Increased awareness and conservation efforts helped to reduce surface erosion from agricultural fields; however, field erosion is still a problem in some areas (Lenhart et al. 2011c). In recent decades, higher river flows in the main stem of the Minnesota River and its major tributaries have been observed. The increased river flows are contributing to increased rates of erosion from non-field near-channel sources (MPCA 2012b; Lenhart et al. 2013; Schottler et. al 2013). The highest levels of sediment loading appear to be concentrated in the subwatersheds downstream of Mankato. The combined sediment from these subwatersheds make the Minnesota River the largest source of sediment to the South Metro Mississippi River.
The complexity of these sources and mechanisms of sediment erosion indicate that a significant effort will be required to make the needed reductions. The landscape cannot be returned to pre-European settlement times given the metropolitan and highly productive agricultural land in the watersheds. However, good stewardship of our soil and water resources is important for sustainable agricultural production and water quality.
Measures of sediment TSS and turbidity have been commonly used as measures of sediment in water. TSS can be composed of organic matter and inorganic sediment. Under high flow conditions, inorganic sediment usually is the dominant fraction of TSS; whereas, organic matter may play a larger role during low flow (Tetra Tech 2009). A measurement of the organic matter fraction of TSS is total suspended volatile solids (TSVS). In the Le Sueur River, TSVS ranged from 16-34% of TSS (Gran et al. 2009). Schottler et al. (2010) reported an average of 12% TSVS in 15 tributaries to the Minnesota River. This indicates that the largest component of TSS load in the Minnesota River Basin and the South Metro Mississippi River is the inorganic fraction.
Sediment erosion and transport Sediment erosion in the Minnesota River Basin and its tributaries is derived from a variety of sources and pathways, which can be grouped into four broad categories:
· Uplands – surface erosion from fields and other land uses · Ravines – ravines and gullies that cause mass loss of soil · Bluffs – collapse of bluff faces in areas where deeply incised tributary streams descend into the old
glacial river valley and where the Minnesota River is up against the valley wall · Streambanks – erosion of the stream banks and beds Ravines, bluffs, and streambanks are also referred to as “near-channel sources” and are currently the greatest contributor to increased turbidity in these waters.
Sediment Reduction Strategy • January 2015 Minnesota Pollution Control Agency
5

Near channel sediment erosion first occurred with the retreat of the Laurentide ice sheet and subsequent flow of water from Lake Agassiz. Lake Agassiz covered a large area northwest of the region currently occupied by the Minnesota River Basin (Gran et al. 2009; Wilcock 2009; Belmont et al. 2011). The flow of water from Lake Agassiz formed the glacial River Warren which carved a very large valley now partially occupied by the Minnesota River. Large floods from melting Lake Agassiz carved through glacial sediment and bedrock forming the steep valley walls and incision points. These incision points divide the tributaries into a) an upper flat-lying zone where sediment sources are primarily from fields and stream erosion, and b) a lower, steeply sloped zone where erosion is typically derived from ravines and bluffs (Gran et al 2009; Wilcock 2009; Belmont et al. 2011; MPCA 2012a).
Some near-channel erosion is natural as streams and rivers adjust laterally over time. However, the current rate of near-channel sediment erosion is much greater than historic rates (Figure 3), and are nearly four times greater than estimated accumulation rates in 1900. Since fine-grained sediments are readily mobilized during periods of high flows (Blann et al. 2009), the recent decades of higher sediment loss are believed to be largely attributed to increased river flows (Lenhart et al. 2011b; Schottler et al. 2013).
Incision points along the rivers and tributaries occur as the channels erode down through the largely fine-grained glacial deposits of the Laurentide ice sheet (Belmont et al. 2011). The incision points (knickpoints) continue to move upstream as the rivers downcut and channel gradients increase. This, combined with valley erosion, is increasing the sediment load to the Minnesota River as compared to pre-settlement processes (Wilcock 2009). Due to its geologic setting, the landscape in Southern Minnesota is naturally predisposed for high sediment erosion rates (Wilcock 2009). However, changes in land use over the last 150 years have contributed to an altered hydrologic regime. These alterations contribute to increased river flows that are accelerating near-stream erosion rates in excess of what occurred under pre-settlement conditions (Blann et al. 2009; Wilcock 2009; Schottler et al. 2013).
Figure 3. Whole-lake sediment accumulation rate (metric tons/year) for Lake Pepin based on cores collected in 1995 and 1996 (dark gray bars) and in 2008 (light gray bar). (Source: Schottler et al. 2010.)
Sediment Reduction Strategy • January 2015 Minnesota Pollution Control Agency
6

Call to action The Upper Mississippi River Basin Alliance has for decades considered sedimentation to be a problem in the Mississippi River downstream from the mouth of the Minnesota River. In 1992, Governor Arne Carlson set the goal of cleaning up the Minnesota River within 10 years, with an emphasis on reducing biological oxygen demand (BOD) and phosphorus. Significant water pollution reduction measures have been implemented over the past 20 years and consequently phosphorus and BOD reductions have been achieved, especially during low flow conditions. However, additional improvement in sediment and other parameters is still needed to meet the “fishable and swimmable” goals identified in the Clean Water Act in the Minnesota River Basin, the South Metro Mississippi River and Lake Pepin.
Section 303(d) of the federal Clean Water Act and U.S. Environmental Protection Agency’s (EPA's) Water Quality Planning and Management Regulations (40 CFR Part 130) require states to develop TMDLs for waterbodies that are not meeting water quality standards. The TMDL establishes the allowable loading of pollutants for a waterbody that will permit attainment of water quality standards. By following the TMDL process, states can establish water quality-based controls to reduce pollution and restore and maintain the quality of their water resources.
Within a year of TMDL approval by EPA, the state’s Clean Water Legacy Act requires the development of a TMDL Implementation Plan detailing the restoration activities needed to meet the approved TMDLs pollutant load allocations for point and nonpoint sources. In 2013, the state legislature added various accountability provisions to the Clean Water Legacy Act. These provisions defined a new Watershed Approach that includes development of a Watershed Restoration and Protection Strategy (WRAPS) for each major watershed. This approach facilitates a more comprehensive characterization of multiple waterbodies within a watershed (at the 8-digit HUC scale) than the previous TMDL implementation plans.
Because of the vast area covered within the Minnesota River Basin and its influence on the South Metro Mississippi River, the MPCA has developed this broader scale, basin-wide Sediment Reduction Strategy. This strategy establishes the foundation for a path to move toward achieving needed sediment reductions at all scales across the basin. Both the Sediment Reduction Strategy and the WRAPS can be used to inform local planning efforts.
Local plans, such as Local Water Management Plans, are required to include specific implementation information. This strategy and WRAPS can help facilitate local targeting and prioritization of projects and programs to reduce sediment and address other local water quality issues. WRAPS and local planning can include:
· sediment reduction strategies, initiatives, or actions · prioritization of sediment reduction activities within the watershed · timeframes for implementation · interim targets/milestones
A “Call to Action”
“State surface water quality program directors agree that, while significant strides have been made in reducing sediment loading to the Minnesota River basin, the current rate of progress will not result in adequate water quality protections.”
State-EPA Nutrient Innovations Task Group An Urgent Call to Action: Report of the State-EPA Nutrient Innovations Task Group August 2009
Sediment Reduction Strategy • January 2015 Minnesota Pollution Control Agency
7

This strategy differs from a WRAPS because it:
· covers a larger area than a WRAPS · provides higher level strategies · provides large-scale interim milestones or targets for sediment reduction goals This strategy is intended as a starting point that outlines general strategies and actions for watershed managers to use when developing WRAPS and individualized action plans that will meet their sediment reduction goals. We expect that this strategy will evolve through time as we gain a deeper understanding of our actions and their associated successes or failures in meeting our overall goal of improving water quality.
Ultimately, the intent is for WRAPS and local implementation plans to be designed to ensure that the needed reductions in pollutant loadings identified by the Minnesota River Basin and South Metro Mississippi River TMDLs will be achieved by providing:
· information on management measures and regulatory controls · timelines for implementation of management measures and attainment of water quality standards · a monitoring plan designed to determine the effectiveness of implementation actions · a description of adaptive management procedures This overall process is presented in Figure 4.
Figure 4. The process by which this Sediment Reduction Strategy relates to overall planning and implementation efforts.
Sediment Reduction Strategy • January 2015 Minnesota Pollution Control Agency
8

2. Total Maximum Daily Loads overview and interim milestones
Section 303(d) of the Clean Water Act requires that states publish a biennial list of waterbodies that are not meeting water quality standards. As mentioned in Section 1, waterbodies placed on this list are deemed impaired and require the development of a TMDL. The three major components of a TMDL cumulatively determine the maximum amount of a pollutant that a waterbody may receive in order to maintain water quality standards. Along with a margin of safety, a TMDL is composed of a wasteload allocation that accounts for point sources, a load allocation that accounts for non-point sources and natural background, and reserve capacity that allows for future growth (MPCA 2012a).
Multiple streams in the Minnesota River Basin as well as the South Metro Mississippi River have been identified as impaired due to high levels of turbidity. The following sections provide an overview of the draft Minnesota River Turbidity TMDL and the draft South Metro Mississippi River TSS TMDL.
Although these TMDLs are still awaiting EPA approval and the proposed targets may change, the pressing need to reduce sediment loading to improve water quality in these rivers will not change. For this reason, developing an overall strategy, conducting local planning efforts, and implementing actions that will reduce sediment loading in these impaired waters should not be delayed.
Minnesota River Basin turbidity TMDLs The Minnesota River Basin Turbidity TMDL Project specifically addresses 18 reaches, which are the lowest reaches of the tributaries and the main stem of the Minnesota River. While the TMDL Project area begins near Lac qui Parle Lake and ends near Jordan, Minnesota (MPCA 2011a), numerous other streams in the Minnesota River Basin are impaired for turbidity (Figure 5). Consequently, this Sediment Reduction Strategy applies broadly to all turbidity impairments in the Minnesota River Basin.
Figure 5. Streams in the Minnesota River Basin that are impaired for turbidity (Source: MPCA 2012a).
Sediment Reduction Strategy • January 2015 Minnesota Pollution Control Agency
9
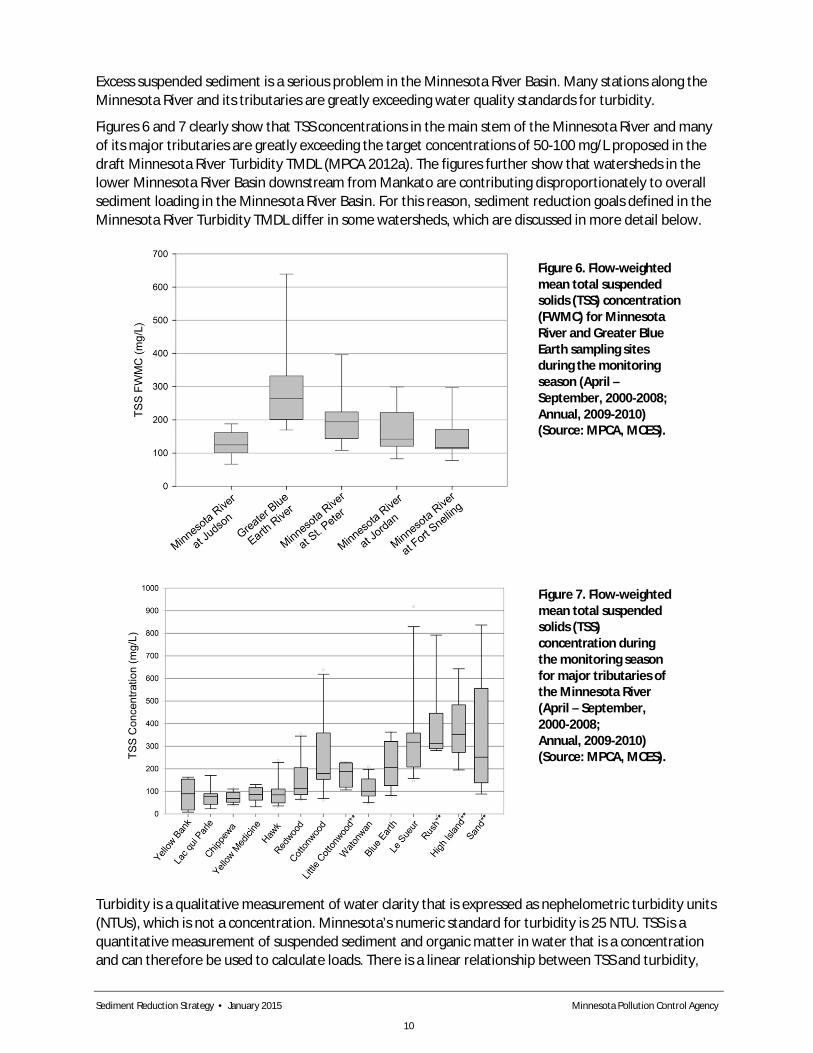
Figure 7. Flow-weighted mean total suspended solids (TSS) concentration during the monitoring season for major tributaries of the Minnesota River (April – September, 2000-2008; Annual, 2009-2010) (Source: MPCA, MCES).
Excess suspended sediment is a serious problem in the Minnesota River Basin. Many stations along the Minnesota River and its tributaries are greatly exceeding water quality standards for turbidity.
Figures 6 and 7 clearly show that TSS concentrations in the main stem of the Minnesota River and many of its major tributaries are greatly exceeding the target concentrations of 50-100 mg/L proposed in the draft Minnesota River Turbidity TMDL (MPCA 2012a). The figures further show that watersheds in the lower Minnesota River Basin downstream from Mankato are contributing disproportionately to overall sediment loading in the Minnesota River Basin. For this reason, sediment reduction goals defined in the Minnesota River Turbidity TMDL differ in some watersheds, which are discussed in more detail below.
Turbidity is a qualitative measurement of water clarity that is expressed as nephelometric turbidity units (NTUs), which is not a concentration. Minnesota’s numeric standard for turbidity is 25 NTU. TSS is a quantitative measurement of suspended sediment and organic matter in water that is a concentration and can therefore be used to calculate loads. There is a linear relationship between TSS and turbidity,
Figure 6. Flow-weighted mean total suspended solids (TSS) concentration (FWMC) for Minnesota River and Greater Blue Earth sampling sites during the monitoring season (April – September, 2000-2008; Annual, 2009-2010) (Source: MPCA, MCES).
Sediment Reduction Strategy • January 2015 Minnesota Pollution Control Agency
10

so a TSS equivalent or surrogate can be calculated using simple linear regression. The calculated TSS surrogate is the target TSS concentration that will meet the State’s turbidity standard (MPCA 2012a). The TSS targets established in the draft Minnesota River Turbidity TMDL range from 50 mg/L in the upper Minnesota River Basin to 100 mg/L in the lower part of the basin.
To meet the Minnesota River turbidity TMDL, an estimated 80-90% reduction from the current baseline sediment loading is needed. The magnitude of reductions needed points to just how big of a problem this is and how much effort will be needed to meet the necessary reductions. The types and levels of actions estimated to achieve various sediment load reductions for the Minnesota River Turbidity TMDL project is discussed in the following section.
The MPCA amended its water quality rules in 2014 to replace the turbidity standard with regionally-based TSS standards. The new rules will likely be approved by EPA in 2015. The proposed standard for the Minnesota River Basin is 65 mg/L TSS, met 90% of the time during the period April through September. The new TSS standard will change the reduction targets present in the draft Minnesota River Turbidity TMDL; however, the changes are expected to be small and the sediment reduction needs will remain extremely high in the Minnesota River Basin. A multiple decade implementation timeline in this strategy anticipates the need to adjust implementation strategies and measures in response to ongoing changes in the ultimate goals, better research and river monitoring.
South Metro Mississippi River Total Suspended Solids TMDL The South Metro Mississippi River TSS TMDL is based on a site-specific standard for TSS, which replaced the statewide turbidity standard for this reach. The goal is to meet a summer average (June 1 through September 30) of 32 mg/L TSS in at least five years over a 10-year period. The reduction needed to meet the South Metro Mississippi River TSS TMDL requires 50-60% reduction from baseline sediment loading to the South Metro Mississippi River from the Minnesota River Basin. The impaired reach (Figure 8) begins at River Mile 844 (at the confluence with the Minnesota River) and extends to River Mile 780 (upper Lake Pepin). Sediment loading to the South Metro Mississippi River is closely tied to streambank, bluff, and ravine erosion, and intensive agricultural activity in the Minnesota River Basin.
Figure 8. South Metro Mississippi River turbidity impairment (Source: MPCA 2012b).
Sediment Reduction Strategy • January 2015 Minnesota Pollution Control Agency
11
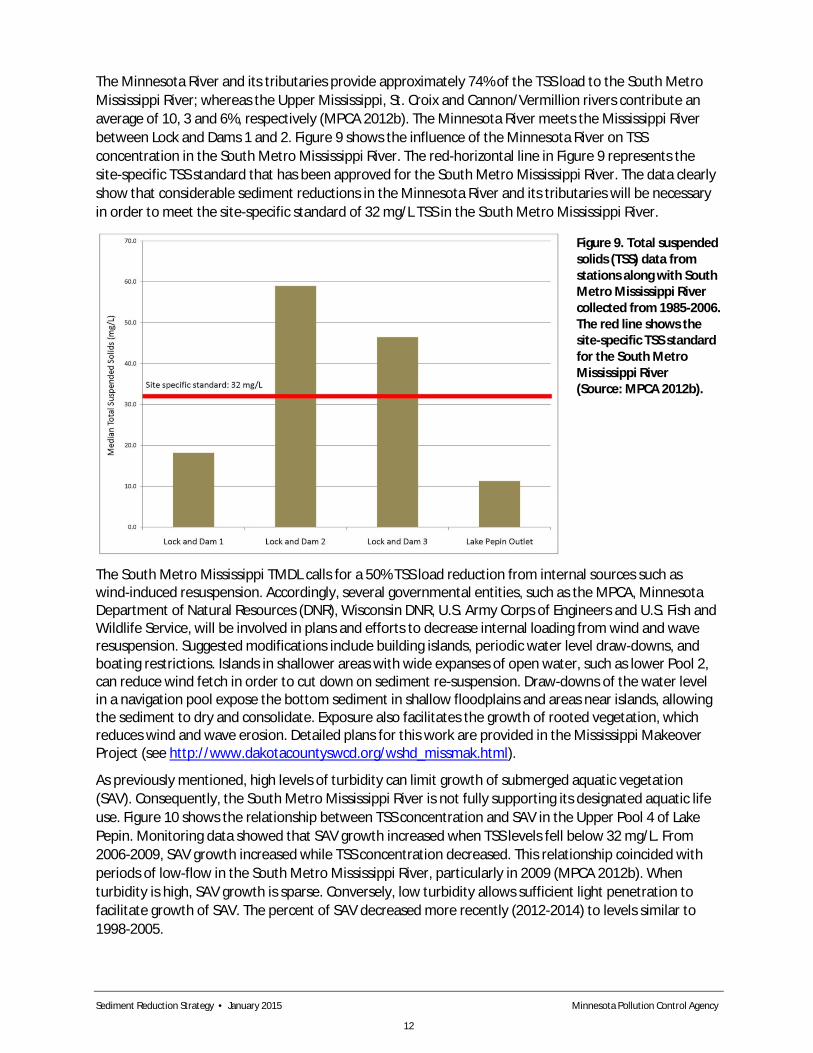
The Minnesota River and its tributaries provide approximately 74% of the TSS load to the South Metro Mississippi River; whereas the Upper Mississippi, St. Croix and Cannon/Vermillion rivers contribute an average of 10, 3 and 6%, respectively (MPCA 2012b). The Minnesota River meets the Mississippi River between Lock and Dams 1 and 2. Figure 9 shows the influence of the Minnesota River on TSS concentration in the South Metro Mississippi River. The red-horizontal line in Figure 9 represents the site-specific TSS standard that has been approved for the South Metro Mississippi River. The data clearly show that considerable sediment reductions in the Minnesota River and its tributaries will be necessary in order to meet the site-specific standard of 32 mg/L TSS in the South Metro Mississippi River.
The South Metro Mississippi TMDL calls for a 50% TSS load reduction from internal sources such as wind-induced resuspension. Accordingly, several governmental entities, such as the MPCA, Minnesota Department of Natural Resources (DNR), Wisconsin DNR, U.S. Army Corps of Engineers and U.S. Fish and Wildlife Service, will be involved in plans and efforts to decrease internal loading from wind and wave resuspension. Suggested modifications include building islands, periodic water level draw-downs, and boating restrictions. Islands in shallower areas with wide expanses of open water, such as lower Pool 2, can reduce wind fetch in order to cut down on sediment re-suspension. Draw-downs of the water level in a navigation pool expose the bottom sediment in shallow floodplains and areas near islands, allowing the sediment to dry and consolidate. Exposure also facilitates the growth of rooted vegetation, which reduces wind and wave erosion. Detailed plans for this work are provided in the Mississippi Makeover Project (see http://www.dakotacountyswcd.org/wshd_missmak.html).
As previously mentioned, high levels of turbidity can limit growth of submerged aquatic vegetation (SAV). Consequently, the South Metro Mississippi River is not fully supporting its designated aquatic life use. Figure 10 shows the relationship between TSS concentration and SAV in the Upper Pool 4 of Lake Pepin. Monitoring data showed that SAV growth increased when TSS levels fell below 32 mg/L. From 2006-2009, SAV growth increased while TSS concentration decreased. This relationship coincided with periods of low-flow in the South Metro Mississippi River, particularly in 2009 (MPCA 2012b). When turbidity is high, SAV growth is sparse. Conversely, low turbidity allows sufficient light penetration to facilitate growth of SAV. The percent of SAV decreased more recently (2012-2014) to levels similar to 1998-2005.
Figure 9. Total suspended solids (TSS) data from stations along with South Metro Mississippi River collected from 1985-2006. The red line shows the site-specific TSS standard for the South Metro Mississippi River (Source: MPCA 2012b).
Sediment Reduction Strategy • January 2015 Minnesota Pollution Control Agency
12

Downstream of Lake Pepin, the annual average TSS concentration is approximately 8 mg/L. Due to the trapping efficiency of the lake, this downstream value is far less than the long-term average concentration of 46 mg/L of TSS where the river enters Lake Pepin. Sediment core data shows that the volume of Lake Pepin has been reduced by 17% since 1830 as a result of sediment loading (Engstrom et al. 2009). If Lake Pepin fills in with sediment, then sediment loading to waters downstream of Pepin will substantially increase.
Minnesota River turbidity total maximum daily loads modeling scenarios A Minnesota River TMDL stakeholder advisory committee proposed land management practices and alternatives that could reduce sediment loading in the Minnesota River Basin. These proposed practices were used to inform a HSPF (Hydrologic Simulation Program – FORTRAN) model that was used when developing the Minnesota River Turbidity TMDL. To better understand the types of potential land use and land management alternatives that would achieve the necessary reductions in sediment loading, five different scenarios were evaluated during the modeling effort for the Minnesota River Basin Turbidity TMDL (Tetra Tech 2009). These five scenarios were chosen based on feedback from the stakeholder committee. Each scenario incrementally incorporated varying degrees of potential BMPs and land use changes. Scenarios 1 through 3 focused on management of soil and sediment erosion from upland sources using traditional, widely accepted techniques. The models predicted an 11% sediment reduction (from a 1993-2005 baseline) in the Minnesota River at Jordan with Scenario 3, indicating that full compliance with water quality standards would not be met if changes were only implemented to reduce upland erosion.
Scenario 4 incorporated larger scale efforts that included additional changes in land use and management practices, but still fell short of the sediment reductions needed to meet water quality standards. Scenario 5 was considerably more aggressive than the previous scenarios and is predicted to result in compliance with water quality standards. Scenarios 4 and 5 included the management options in Scenario 3, but also included a larger focus on water storage practices and drainage management aimed at controlling hydrology. Full scale implementation of the practices in Scenarios 4 and 5 would require drastic changes in policy or land use to meet the reductions.
Figure 10. Relationship between total suspended solids (TSS) and submerged aquatic vegetation (SAV) at Upper Pool 4 of the Mississippi River (Lake Pepin). Submersed aquatic vegetation was sampled at the main and side channels (Minnesota Department of Natural Resources graphic based on data from Long-Term Resource Monitoring Program of the U.S. Geological Survey – Excerpted from MPCA 2012b).
Sediment Reduction Strategy • January 2015 Minnesota Pollution Control Agency
13

Figure 11 provides a summary of the types and amount of management practices included in the model scenarios. It also lists the estimated sediment reduction that would occur with each scenario for the Minnesota River at Jordan. Additional information about the scenario modeling is included in the TMDL Scenario Report (Tetra Tech 2009) and the TMDL (MPCA 2012a). The estimated sediment loads for the baseline condition and Scenarios 3, 4, and 5 for the Minnesota River at Jordan are shown in Figure 12 along with the Sediment Strategy sediment reduction milestones and goals. Figures for the individual major watersheds in the Minnesota River Basin are located in Appendix A.
*Estimates for Minnesota River near Jordan.
Scenarios 1 & 2 - minimal change in sediment loading*
What Was Simulated?
- Current trends in land use and management or focus on minimal increases in perennial vegetation and crop residue
- Reduce sediment from ravines by 15%
- MS4s treat up to the first half-inch or inch of runoff
Scenario 3 - 11% reduction*
What Was Simulated?
Focus on upland sediment sources
- 20% of land in perennial vegetation
- Reduced tillage or no-till on all lands over 12% slope
- 75 percent of row cropland with slopes greater than 3% use crop residue of 30% or greater
- 75% of row cropland with cover crops to increase spring cover
- Reduce sediment from ravines by 30% through use of drop structures
- MS4s treat first inch of runoff
Scenario 4 - 48% reduction*
What Was Simulated?
- 20% of land in perennial vegetation
- 75% of row cropland with slopes greater than 3% use crop residue of 37.5% or greater
- 75% of row cropland Use of cover crops to increase spring cover
- MS4s treat first inch of runoff
- All surface tile inlets eliminated
Three important areas for additional focus included:
1) Reduce sediment loading from ravines and gullies by 40% in the Blue Earth and LeSueur; 30% elsewhere.
2) Water storage through a) controlled drainage on lands <1%; b) two-stage ditches; c) store runoff for 24 hrs or more.
3) Reductions in bank and bluff erosion.
Scenario 5 - 89% reduction* What Was Simulated?
- Scenario 4 practices
plus:
- Reduction of sediment from developed land outside of MS4 boundaries
- Channel stabilization and rehabilitation of bluff reaches.
- Rates of sediment supply from the bluffs were reduced by 25% by changing orientation of stream channel away from bluff faces
- Bluff, stream bank and channel erodibility greatly reduced
- Perennial vegetation enhanced from pasture to CRP
Figure 11. Alternative land use and management options used in the Minnesota River Basin TMDL model scenarios.
Sediment Reduction Strategy • January 2015 Minnesota Pollution Control Agency
14

The results from Scenarios 4 and 5 indicate that major changes in land management will be necessary to meet the reductions outlined in the TMDLs. The model scenarios provide an overview of the types of BMPs and other land management activities that when combined could adequately reduce the sediment loading to the Minnesota River. But the scenarios are not intended prescribe or limit the types of new activities to reduce the sediment loads. Ultimately, the local partners, land managers and land owners will need to make the decisions on what is most effective and appropriate for their jurisdictions and lands. Section 4 of this report presents general strategies and actions that should be considered as locally-tailored action strategies are developed at the county or watershed level.
It is important to note that modeling is a tool for simulating the anticipated effects of various types of practices or practice results at varying implementation scales so that evaluation of the anticipated effects of planned practices can be compared to needed target reductions. Modeled practices include a wide variety of options including, but not limited to, more perennial vegetation cover, buffer strips, water storage mechanisms, bank stabilization and cover crops, among others. The magnitude of estimated land management changes identified in the scenarios underscore the complexity of the problem and the challenge of finding feasible solutions.
Interim milestones The MPCA has outlined incremental goals for sediment reduction. These 2020, 2030, and 2040 interim milestones are included in Table 1. They are also included in Figure 12 to show the relationship between the modeled scenarios and reductions needed to approach water quality goals. The milestones were based on a consideration of needs identified in TMDLs and timeframes which would allow reduction goals to be met within a 15-25 year period from the present time.
Figure 12. Relationship between baseline sediment loading in the Minnesota River at Jordan, Minnesota, and the modeled scenarios with varying degrees of land use changes that will be needed to meet interim milestones and the final goal of a 90% reduction in sediment loading.
Sediment Reduction Strategy • January 2015 Minnesota Pollution Control Agency
15

Table 1. Summary of interim milestones and final goals for reducing sediment loading in the Minnesota River Basin, Upper Mississippi River and adjacent watersheds. Final estimated reduction targets are shown in red.
Basin/watershed Milestone 2020 2030 Goal 2040
Minnesota River 25% reduction 50% reduction* 90% reduction**
St. Croix 0 0 0
Upper Mississippi 10% reduction 20% reduction -
Cannon/Vermillion 25% reduction 50% reduction -
*The 50% reduction during normal flow conditions will meet South Metro Mississippi targets, if a 60% reduction is also achieved during high flow conditions. **A 90% reduction was estimated as needed to meet the TSS surrogate for the turbidity standard at the time of TMDL development.
The practices included in Scenario 3 are not sufficient to meet a 25% reduction; whereas the practices in Scenario 4 are almost sufficient to meet the 50% reduction target for 2030. To meet the 25% reduction milestone, a level of land management change between that in Scenario 3 and that in Scenario 4 will be needed. Since multiple combinations of land management changes scenarios can accomplish similar outcomes, the specific change scenarios are to be developed through local planning efforts. The practices associated with Scenario 5 meet the 90% sediment reduction needed to meet WQS by 2040.
Monitoring of BMPs and receiving waters will be conducted to evaluate progress towards sediment reduction and to thereby inform future actions. As WRAPS and subsequent local planning are developed in the major watersheds of the Minnesota River Basin, the interim milestones of the Sediment Strategy can be adopted and refined. Once interim targets are met, the need for additional BMPs can be evaluated in the effort to meet water quality standards through adaptive management. Beginning July 1, 2016, the Minnesota Clean Water Accountability Act requires annual reporting of progress made toward meeting implementation milestones and water quality goals in TMDLs and WRAPS.
Watershed planning efforts should be directed toward more specifically identifying the combinations of BMPs and adoption rates needed to meet initial milestone targets. The use of smaller, shorter-term interim targets can be helpful for planning and tracking implementation. Tracking the progress in meeting the interim targets can help facilitate adaptive management by providing “check-in points” to gauge implementation efforts on a shorter timeframe and provide the opportunity for adjustments in a timely manner.
In order to meet the targets for the South Metro Mississippi River TMDL, a 50% reduction in sediment loading from the Minnesota River Basin is necessary (60% during high flow conditions). While reaching this goal will be challenging, the progress made, successes of implemented actions, and additional efforts needed to meet the targets can be evaluated at the initial 2020 milestone. Although the water quality targets proposed in the Minnesota River Turbidity draft TMDL are not final, we currently know that significant sediment load reductions will be needed, both to support Minnesota River Basin aquatic life and to reduce sediment impacts on the South Metro Mississippi River. As activities associated with the Watershed Approach and this strategy progress, the understanding of the sources of sediments, mechanisms that drive erosion and transport, and the impact on aquatic life will continue to improve. This knowledge will then be used to inform the next cycle in achieving the rivers’ goals. This iterative process is an inherent component of this strategy.
Many of the on-the-ground actions to reduce sediment loading will also contribute to nutrient reduction. The cooperative nature of this Sediment Reduction Strategy and the Nutrient Reduction Strategy, which was recently developed by multiple organizations, is discussed in Section 4.
Sediment Reduction Strategy • January 2015 Minnesota Pollution Control Agency
16

3. Sources of sediment Sediment in the Minnesota River Basin and the South Metro Mississippi River is derived from multiple natural and anthropogenic sources. The glacial history of the Minnesota River Basin set the stage for large inputs of highly erodible sediments from the landscape. Erosion from field sources of sediment once exceeded erosion from non-field sources. Increased population growth and land use changes have altered hydrological cycles resulting in increased river flows and sediment erosion in many watersheds of the Minnesota River Basin. Currently, erosion from non-field sources is thought to exceed erosion from field sources (Schottler et al. 2010; Lenhart et al. 2013).
Some watersheds in the Minnesota River Basin contribute a disproportionate amount of sediment to the Minnesota River and ultimately to the South Metro Mississippi River and Lake Pepin (Figure 13). In fact, the Le Sueur Watershed contributes 24-30% of the total TSS load to the Minnesota River while only covering 7% of the watershed area in the Minnesota River Basin (Belmont et al. 2011; Gran et al. 2011). Recent sediment source investigation in the LeSueur indicated the following sources for this watershed: bluffs 57%, uplands 27%, ravines 9% and streambank channels and floodplains 8% (Gran et al., 2011). The fractions of sources vary by watershed.
Figure 13. TSS levels from the Minnesota River Watersheds (Source: MPCA 2012a).
Sediment Reduction Strategy • January 2015 Minnesota Pollution Control Agency
17

Targeted sediment reduction strategies in high sediment yielding watersheds (such as the LeSueur) may have the greatest initial impact on the mitigation of excessive sediment loading. It should be noted, however, that the gray watersheds in Figure 13 have not yet been fully assessed, so their relative contribution to total sediment loading is uncertain at this time. Through ongoing monitoring and assessment, we will learn more about their contributions and adapt management strategies accordingly. Implementation of sediment reduction strategies could become more important in those watersheds should they prove to contribute disproportionate amounts of sediments to the Minnesota River. Sediment delivery from upland and near-channel sources will be described in the following sections.
Upland sources Upland sources of sediment are largely the result of sheet, rill, and gully erosion occurring as water runs off over the land surface. The conversion of prairie grassland to agricultural land has significantly altered hydrological patterns in the landscape (Gran et al. 2011). Landscapes dominated by row-crop production can result in excessive soil loss via surface runoff (Shiptalo et al. 2013). The conversion of small grain fields to soybeans in the 1940s (Figure 14) increased the amount of field erosion due to the field surfaces being exposed and unprotected for longer periods of time (Schottler et al. 2013).
While conservation efforts to reduce soil erosion from fields have been successful, certain soil conservation practices have been removed or reduced in recent years. The relative magnitude of field erosion is always changing and these changes are often independent of government program oversight. Field (upland) sources contribute about 15-40% of the fine sediment (Schottler 2010), but the specific sources and pathways of sediment movement need to be better defined. Even in watersheds such as the LeSueur, which has considerable bluff erosion, upland sediment contributions are estimated to be as much as one-third of the sediment budget (Gran et al. 2011). Upland soil conservation practices need to be reassessed periodically to better understand progress related to this source.
Figure 14. Historical change in dominant crops grown in Blue Earth County, Minnesota (Source: Musser et al. 2009).
Sediment Reduction Strategy • January 2015 Minnesota Pollution Control Agency
18

Near-channel sources Using radioisotope fingerprinting techniques, Schottler et al. (2010) determined that non-field sources (i.e., near-channel sources) contribute approximately 60-85% of the fine sediment loading to the Minnesota River Basin. Although lateral channel migration occurs naturally as stream systems evolve, the rate and magnitude of near-channel erosion and widening in the main stem and tributaries of the Minnesota River Basin is unprecedented (Schottler et al 2010; Belmont et al. 2011; Lenhart et al. 2011a).
The highest sediment loading occurs during high flow periods. Non-field sources of sediment can be broadly grouped into three main categories of ravines, bluffs and streambanks (MPCA 2009a), and are briefly characterized below.
Ravines Ravines and gullies can be adjacent to the stream channel or positioned away from the channel (MCPA 2012a). Although ravines can be sediment sinks, they are typically net erosional (Gran et al. 2011). The capacity of ravines to store sediment is dependent upon the timing and magnitude of a storm event. Previously stored sediment may be washed away with heavy precipitation, while a subsequent storm may be less intense and deposit sediment on the surface (Gran et al. 2009). The influence of a given storm event depends largely on the ravine’s position in the landscape, as well as storm frequency, intensity, and duration.
Ravine erosion is most often driven hydraulically by overland flow (MPCA 2012a). Intense overland flow can concentrate into rills, gullies and ravines cause rapid erosion (Gran et al. 2009). Thus ravine erosion is affected by changes in hydrology. Increased flow as a function of changes in precipitation patterns or discharging tile drainage waters into ravines may also increase erosion rates in ravines. Increased frequency or intensity in precipitation events as well as expansions in artificial drainage systems are expected to contribute significantly to the total load and volume of sediment entering the Minnesota River from ravines (Gran et al. 2009).
Bluffs Bluffs are tall hill slopes that are commonly found along the incised portion of the Minnesota River and its tributaries. Varying in height and length, some bluffs may rise as much as 50 m and extend several hundred meters. Generally, bluffs are positioned along the tributary channel near the confluence with the main stem of the Minnesota River. They may also be positioned away from the stream channel near valley margins (MPCA 2009a; MPCA 2012a).
(Image: State of the Minnesota River Report 2008)
(Image: State of the Minnesota River Report 2008)
Sediment Reduction Strategy • January 2015 Minnesota Pollution Control Agency
19

Bluff erosion in the Minnesota River Basin is the result of three primary mechanisms: undercutting, sapping, and weathering (freeze-thaw cycles). Undercutting is a result of shear stress at the base of the bluff caused by river flow. This process reduces the strength of the bluff foundation forcing a failure of the bluff face with sediment slumping at the base of the bluff (Gran et al. 2011; MPCA 2012a; Kessler et al. 2013). Subsequent stream flows erode the slumped sediment (MPCA 2009a). Sapping occurs when groundwater flows through the bluff face, facilitating erosion of the bluff face below the seepage point. Over-saturated points of groundwater seepage on the bluff face may also result in mass failure (Gran et al. 2011). Freeze-thaw cycles result in localized areas of erosion that can weaken the bluff. Minimal amounts of moisture in the bluff can cause considerable expansion when frozen, leading to destabilization and slope failure. Freeze-thaw events at the base of the bluff increase the potential for undercutting to occur through destabilization. In the Minnesota River Basin, undercutting as a result of increased river flow is the dominant cause of bluff erosion, particularly during spring or flood events (Gran et al. 2011). More than half of the large bluffs in the Minnesota River Basin are located in the Blue Earth and Le Sueur Watersheds (MPCA 2009a).
Streambanks Streambanks are composed of depositional materials in the floodplain that generally run parallel to the stream. They are highly dynamic in space and time and can be sources of sediment during high flow periods as well as depositional areas at times of low and moderate flow. Under natural conditions, river channels migrate laterally, which result in erosional and depositional banks.
The potential for sediment mobilization and transport from streambanks increases dramatically under elevated flow regimes. Larger river systems are especially susceptible to streambank erosion as a result of the higher flows which can also maintain suspended solids for great distances (MPCA 2012a).
Land use and precipitation effects on river flow Several studies have shown that streamflows in many agricultural watersheds of the upper Midwest have increased, which contribute to streambank erosion and channel widening (Novotny and Stefan 2007; Schilling and Helmers 2008; Lenhart et al. 2011b). Average flows in the Minnesota River near Jordan, Minnesota have nearly doubled when comparing the periods 1935-1976 and 1977-2013 (Figure 15).
(Image: www.mnwaterconnection.com)
Sediment Reduction Strategy • January 2015 Minnesota Pollution Control Agency
20

The relationship between river flows and sediment loading is illustrated in Figure 16. The highest TSS loads occur during extremely high flows, illustrating the erosive potential and sediment transport capacity in higher river flow conditions as compared to low flow conditions.
0
2000
4000
6000
8000
10000
12000
14000
16000
18000
20000
1935
1939
1943
1947
1951
1955
1959
1963
1967
1971
1975
1979
1983
1987
1991
1995
1999
2003
2007
2011
Aver
age
Annu
al D
isch
arge
(cfs
) Minnesota River near Jordan Average Annual Discharge
Figure 15. Change in annual average river flow in the Minnesota River at Jordan, Minnesota, since 1935 (MPCA analysis of USGS data).
Figure 16. Load duration curve showing flows in Minnesota River at Jordan, Minnesota (Source: MPCA 2012a).
Sediment Reduction Strategy • January 2015 Minnesota Pollution Control Agency
21
The cause of increased river flows in the lower Minnesota River and its tributaries has been the center of debate in recent years. Several studies have been conducted to determine the cause of higher recent decade river flows compared to historical flows in the Minnesota River Basin. Novotny and Stefan (2007) found increases in summer peak flows and increased winter and summer baseflows in several major river basins in Minnesota, including the Minnesota River Basin. They evaluated data from United States Geological Survey (USGS) gage stations in the Minnesota River Basin from 1932-2002 and linked the observed changes in stream flows to precipitation patterns in Minnesota as a function of climate change. Specifically, they found increases in mean annual precipitation, earlier spring snowmelt, and increased frequency and intensity of precipitation events to be the likely drivers of the changes in historical flow patterns. Sekely et al. (2002) and Schottler et al. (2013) reported that the mean annual precipitation has increased in the region by approximately 15% since 1940, although Schottler et al. (2013) indicates this is predominantly due to increased post-June rainfall. Early season precipitation (when soil is most vulnerable to sheet/rill erosion) has been constant or decreased since 1940 in many watersheds of the Minnesota River Basin.
Other studies indicate that the observed increases in stream flows in southern Minnesota can also be attributed to post-European settlement changes in land use, particularly in association with agricultural practices. Some of these influential changes include wetland drainage, expansion of artificial drainage networks (resulting in loss of surface and subsurface water storage), and increased row crops. These land use changes have altered natural hydrological processes. Surface water storage in wetlands and ponds has decreased and estimated total annual evapotranspiration has also decreased from the cropping and drainage changes (Schilling and Helmers 2008; Schilling 2008; Lenhart et al. 2011a; Wang and Hejazi 2011; Schottler et al. 2013; Schilling et al. 2008).
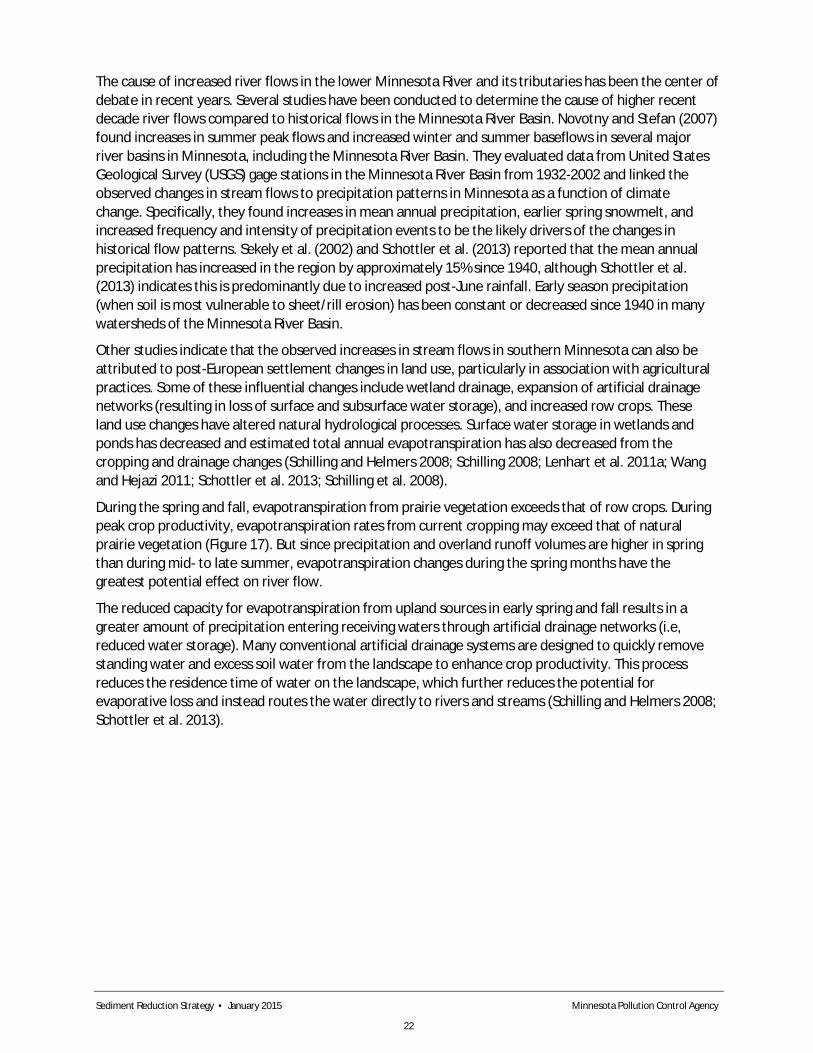
During the spring and fall, evapotranspiration from prairie vegetation exceeds that of row crops. During peak crop productivity, evapotranspiration rates from current cropping may exceed that of natural prairie vegetation (Figure 17). But since precipitation and overland runoff volumes are higher in spring than during mid- to late summer, evapotranspiration changes during the spring months have the greatest potential effect on river flow.
The reduced capacity for evapotranspiration from upland sources in early spring and fall results in a greater amount of precipitation entering receiving waters through artificial drainage networks (i.e, reduced water storage). Many conventional artificial drainage systems are designed to quickly remove standing water and excess soil water from the landscape to enhance crop productivity. This process reduces the residence time of water on the landscape, which further reduces the potential for evaporative loss and instead routes the water directly to rivers and streams (Schilling and Helmers 2008; Schottler et al. 2013).
Sediment Reduction Strategy • January 2015 Minnesota Pollution Control Agency
22

As discussed above, increased stream flows in the Minnesota River Basin have increased streambank erosion. Some researchers contend that near-channel sediment sources are influenced more by natural causes (i.e., glacial history and increased precipitation) rather than drainage practices (Gupta et al. 2011). Kessler et al. (2013) determined that rates of streambank erosion have remained consistent between pre-settlement and post-settlement periods, but that the number of actively eroding sites may have increased. In contrast, several studies have found that streams in the Minnesota River Basin are exhibiting erosion rates far in excess of pre-settlement rates of erosion (Blann et al. 2009; Belmont et al. 2011).
In a recent study, Lenhart et al. (2011a) concluded that the moderate increase in annual precipitation alone cannot explain the large increase in average annual streamflow in the Minnesota River Basin. Further, the researchers found a significant streamflow increase in agricultural watersheds in 1980-2009 as compared to the period of 1940-1979 (Lenhart et al. 2011a). These results are consistent with Schottler et al. (2013) findings where river flows in many south central Minnesota watersheds were significantly higher during the period 1975-2009 compared to the period of 1940-1974. However, they also found no significant difference in stream flows between the two time periods in several watersheds, suggesting that precipitation alone does not explain the difference (Schottler et al 2013). Tome and Schilling (2009) found that both agricultural land use and climate change have led to increased streamflows, but that since the 1970’s, climate change has been more influential in altering hydrology.
Changes in precipitation and land use both contribute to changing river flow, but it is likely their contributions are disproportionate across the watersheds in the Minnesota River Basin. Regardless of the exact cause of increased river flow, strategies that increase water residence time on the landscape will have a positive impact on controlling stream flows. Similarly, widespread expansion of water storage mechanisms will be particularly important in the future if increasing precipitation patterns continue with ongoing climate change. Decreasing unusually high river flows may be the most important action that will lead to sediment reduction in these watersheds. Managing hydrology may seem like an insurmountable goal and there is not a one-size-fits-all approach to addressing this problem.
Figure 17. Schematic differences in evapotranspiration among row-crops and prairie grass throughout the summer growing season (Source: Hay 2010).
Sediment Reduction Strategy • January 2015 Minnesota Pollution Control Agency
23

In some areas or watersheds, many small scale practices may achieve great reductions in sediment erosion through controlled hydrology, while in other areas a few larger scale actions may be needed. These actions and strategies will be discussed in Section 4. More study may enable greater precision and confidence concerning the attribution of factors affecting altered hydrology. Yet at this time, practical cost effective actions that reduce flows and increase water retention on the landscape should move forward.
Areas with greatest contributions to sediment loading Focusing on those areas with the greatest impact first can help maximize the impact of efforts and expenditures put forth. The findings of studies to-date and the ongoing research can be used to prioritize areas within the basin for implementation of additional management measures.
Multiple factors impact the degree of sediment erosion from a particular watershed. These factors include:
· precipitation patterns · land use and land cover · drainage · local geology · river slope These factors do not function independently, but rather the degree of interaction varies considerably within the Minnesota River Basin.
As discussed above, precipitation patterns are changing in Minnesota (Novotny and Stefan 2007), and the changes in frequency and intensity in precipitation events vary locally and regionally (Schottler et al. 2013). Despite similarities in land use in the Minnesota River Basin, there is significant variability across the basin in the density of surface and subsurface drainage systems. For example, agricultural land in south central Minnesota is more intensively “drained” than southwestern Minnesota due to the local soils and topography (Nieber et al. 2010).
As discussed in Section 1, there is also considerable variation in local geology across the basin due to the dynamic glacial history of the Minnesota River Basin. Geographic areas can be divided into an upper low-relief zone and a steeply-sloped incised area. The incised area creates “knickpoints” in the tributaries, which are points of a steep change in the channel gradient with corresponding erosional increases (Wilcock 2009; Belmont et al. 2011).
In smaller tributaries located in flatter regions above the knickpoint, field erosion and streambank erosion may be the largest sources of sediment (Nieber et al. 2010). In the region near or below the knickpoints, bluffs and ravines are thought to constitute the majority of the sediment (Gran et al. 2009). As demonstrated in Figure 18, the uplands in the Minnesota River Basin are relatively flat compared to the steep gradient at the knickpoint. The knickpoint in the LeSueur, Maple and Cobb Rivers begin 30 to 40 km from the mouth of the rivers (Figure 18).
Sediment Reduction Strategy • January 2015 Minnesota Pollution Control Agency
24

The cumulative impacts of the above factors can also have a significant influence on stream channel features, such as ravines, bluffs, and streambanks. While the percentage of sediment originating from fields versus channels varies by watershed, research indicates that erosion from near-channel sources is the main source of sediment to the Minnesota River (Schottler et al. 2010).
Detailed research on sediment budgets has been conducted in the Le Sueur Watershed with additional work underway within the Blue Earth Watershed. Together, these watersheds contribute as much as half of the fine sediment load to the Minnesota River, even though they account for only one-fifth of its drainage area. These watersheds also contain the majority of the bluffs in the basin and many large ravines (MPCA 2009b). As shown previously in Figure 13, watersheds in the lower Minnesota River Basin contribute disproportionately to the sediment load, indicating these areas may be most favorable for sediment reduction actions. However, it is important to note that the sediment load from the remaining watersheds also impacts local water quality and cannot be overlooked in the effort to reduce sediment loading within the Minnesota River Basin.
Figure 18. Longitudinal profiles of the Le Sueur, Maple, and Big Cobb Rivers showing the presence of a major knickpoint around 30-40 kilometers upstream from the mouth of the river (Source: Belmont et al. 2011).
Sediment Reduction Strategy • January 2015 Minnesota Pollution Control Agency
25

4. Sediment reduction options and strategies Implementing practices and infrastructure to control upland and near-channel sources of sediment will require large commitments of time and money by all levels of government, many nongovernmental organizations, and individuals. This document provides high level strategies intended to combine existing conservation efforts with additional practices into a framework that can be considered by programs and watershed planners aiming to reduce sediment contributions to the rivers.
This strategy does not include all details necessary to meet our final water quality goals. This section presents large-scale strategy direction for use in Minnesota’s Watershed Approach. Individual local planning and implementation efforts are necessary to adequately incorporate the landowner, geographic, source contributions, and available programs and practices into implementation plans that can effectively reduce sediment loading.
The MPCA expects that a combination of reduction strategies, simultaneously addressing reduction from upland and near-channel sources, will be most successful (MPCA 2012a). To make progress toward sediment reduction goals, planning and implementation must occur at individual watershed scales. In addition to identifying the loading capacity and necessary sediment reductions for each of the impaired rivers to achieve their water quality goals, the draft Minnesota River Turbidity and South Metro Mississippi River TSS TMDLs provided initial implementation frameworks (approaches) to meet the water quality standards. The initial strategies in these approaches were identified with stakeholder input during the TMDL development process (MPCA 2012a, MPCA 2012b). The HSPF Watershed modeling completed during the Minnesota River Turbidity TMDL project included five modeling scenarios designed to evaluate the potential sediment reductions possible under alternative implementation levels (see Section 2). Modeling at the 8-digit HUC scale does not provide the detail needed to identify specific implementation needs, but it does provide a general picture of the types and magnitude of practices and activities necessary to meet the water quality targets for the TMDL.
The modeling results indicated that extensive changes in land management practices, implementation of direct sediment control measures, and increases in the temporary storage of water are needed to meet the water goals of the TMDLs. A combination of implementation options, including sediment erosion control practices, hydrologic storage, and increases in the amount of vegetative cover, is expected to be necessary (MPCA 2012a). Specific implementation planning will be needed to identify the practices and activities best suited to individual watersheds based on sediment source, location, cost, practicality, and landowner needs and opportunities. Even though specific implementation information could not be gleaned from the modeling, the TMDL stakeholders did conclude that, regardless of scale, a significant, broad-based effort would be needed to meet the pollution reduction goals of the TMDL.
In addition to the stakeholder suggestions and feedback during the TMDL development process, additional stakeholder input was gathered during the development of this strategy through a series of interviews with scientists, environmental organizations, and agricultural industry representatives and a public notice and comment period.
Options for sediment reduction The options for sediment reduction vary depending on the source and magnitude of sediment eroding and moving into the rivers. Options available for controlling sediment getting into the rivers are described below by source categories.
Sediment Reduction Strategy • January 2015 Minnesota Pollution Control Agency
26
Point sources Point sources include: a) discharges from wastewater and water treatment facilities with permitted TSS limits and b) stormwater, which includes regulated MS4 entities and industrial and construction sites.
Wastewater and water treatment facilities Municipal and industrial wastewater treatment facilities, which include filter backwash discharges from drinking water treatment facilities and other types of discharges to surface waters, are required to have National Pollutant Discharge Elimination System (NPDES) permits. These permits include specific effluent limits designed to meet water quality standards along with monitoring and reporting requirements to ensure effluent limits are met. Facilities that discharge suspended solids usually have TSS effluent limits that limit the amount of solids discharged to ensure they meet the wasteload allocations in the draft TMDL. Compliance with TSS permit effluent limits provide for the attainment of facilities’ waste load allocations.
Municipal separate storm sewer systems Sediment erosion and movement into streams from stormwater in designated public conveyance systems is regulated by the Municipal Separate Sewer System (MS4) Stormwater Program. NPDES permits issued to MS4s require development and implementation of a stormwater pollution prevention program (SWPPP) to reduce discharge of pollutants from storm sewer systems to the maximum extent practicable. MS4s that are assigned a wasteload allocation in a TMDL may have to include additional information in their SWPPP to ensure that they meet their WLA targets. Additional information regarding the MS4 stormwater program is available at http://www.pca.state.mn.us/sbiza7c.
Industrial and construction stormwater In addition to stormwater discharges from MS4s, NPDES permits are required for certain industrial and construction activities that generate stormwater discharges. The NPDES permits require permittees to control pollutants in stormwater runoff by developing and following a SWPPP. Permit requirements and program information for industrial stormwater is available at http://www.pca.state.mn.us/enzqa74 and for construction stormwater at http://www.pca.state.mn.us/y3dqf96.
Nonpoint sources Nonpoint sources include upland and near-channel sources. To effectively reduce erosion from nonpoint sources, a balance of practices that keep the soil/sediment in place, temporarily store water, reduce surface and subsurface runoff volume and peak flows, and/or address near-channel sources will be needed. The magnitude, frequency and timing of erosional processes as well as the cost effectiveness of related solutions, will ultimately determine the balance of the selected practices in any one particular area of the basin.
Upland sources A wide range of BMPs have been developed to reduce sediment erosion and transport from upland areas. Several of these practices are noted below:
· grassed waterways · water and sediment basins · conservation cover easements · residue management through conservation or reduced tillage · forage and biomass planting · cover crops
Sediment Reduction Strategy • January 2015 Minnesota Pollution Control Agency
27
· contour cropping · strip cropping · open tile inlet controls – riser pipes or french drains · vegetated buffers on field edges and riparian areas
Near-channel sources Practices and actions for reducing near-channel sources of sediment include direct and indirect controls. Direct controls include such practices as limiting ravine erosion with a drop structure or energy dissipater, or controlling streambank or bluff erosion through stream channel restoration. Indirect controls will typically involve land management practices and structural practices designed to temporarily store water or shift runoff patterns by increasing evapotranspiration at critical times of the year. The temporary storage of water and a shift in runoff patterns are needed to reduce peak flows and extend the length of storm hydrographs, which in turn will reduce the erosive power of streamflow on streambanks and bluffs.
Sediment reduction strategies A large and sustained effort will be needed to accomplish the interim sediment reduction milestones and ultimately attain the full TMDL goals. The following strategies have been developed from the various stakeholder groups, watershed modeling and special study results. Given that point sources of sediment are regulated NPDES permit programs, the strategies in this document focus on the various nonpoint sources. As described previously, sediment reduction activities will need to include direct erosion control measures and flow reduction measures. This strategy document is intended to provide an overall direction and a set of approaches to consider as part of the WRAPS process and in the development of watershed implementation plans. The strategies include fairly specific recommendations for advancing ‘tried and true’ conservation practices, adoption of practices and activities that will reduce peak streamflows, continued research and development of prioritization tools and new approaches for reducing sediment in the rivers, and policy and program discussions.
Approaching the near-term target for reductions of sediment in the Minnesota River will require immediate planning and implementation of strategies and associated actions. Planning and implementation activities will need to consider where to focus practices and changes. Certain upland BMPs can reduce upland sediment sources and other upland BMPs can reduce sediment from near-channel sources by reducing water leaving fields (Figure 19). When selecting practices to promote, consideration should be given to costs per pound of sediment reduced, potential for achieving multiple benefits from single practices, and other factors.
Sediment Reduction Strategy • January 2015 Minnesota Pollution Control Agency
28

Upland
Sedi
men
t orig
inat
es
A. ₋ Sediment traps ₋ Reservoirs
B. ₋ Crop residue
management ₋ Buffers ₋ Water and sediment
control basins ₋ Waterways
Near- Channel
C. ₋ Infrastructure
repair and protection
₋ Armoring ₋ Diversions ₋ Stream
restoration ₋ Two-stage ditch
D. ₋ Water storage ₋ Water and sediment
control basins ₋ Cover crops and
perennial vegetation to increase ET and infiltration
₋ BMP location
Near-Channel Upland
Figure 19. How sediment reduction strategies can vary depending on the combination of where the sediment originates (near channel vs. upland) and where the BMPs are to be installed (near channel vs. upland).
The following strategies address the control of upland and near-channel sources of sediment to aid local, state, and federal efforts in planning, developing, and implementing suites of practices and actions that will reduce suspended sediment in the Minnesota River, its tributaries, and the Mississippi River below the confluence of the two rivers. The strategies are intended to aid in the development of watershed-specific planning and implementation efforts. With this in mind, individual watershed efforts should be developed to address the combination of local priorities and water quality needs downstream of the local waters.
Preserving infrastructure and addressing near-channel
sources directly Implementation of upland BMPs to
slow down and/or reduce the amount of water moving off uplands as a means to address near-channel
erosion.
Upland practices to reduce off-farm sediment transport include many of the conventional soil conservation practices. These practices overlap with many upland practices intended to reduce flows and thereby reduce near-channel erosion. Practices in
near-channel areas trap sediment that is eroded from upland areas. Cost can be greater than controls at the source.
Sediment Reduction Strategy • January 2015 Minnesota Pollution Control Agency
29

Reduce peak stream flow A priority initiative for this strategy is to reduce peak streamflow magnitude and duration. As noted previously, the cause of much near-channel erosion in the basin is high flows that exert erosional energy on streambanks and bluffs. Practices and activities designed to reduce the elevated flows are expected to address the cause of near-channel erosion more effectively than direct controls. For this reason, a flow reduction goal and strategy was developed.
The types of BMPs in quadrant D of Figure 19, can be used for reducing stream flow.
Flow reduction goals The streamflow reduction goals selected for this strategy include a magnitude and duration target. The flow magnitude goal is to reduce the two-year annual peak flow by 25% by 2030 (i.e. 24,850 cfs down to 18,640 cfs in the Minnesota River at Jordan). The flow duration goal is to decrease the number of days the two-year peak flow is exceeded by 25% by 2030 (i.e. average duration from 15 days down to 11 days and median duration from 4 days down to 3 days). The goals should be revisited routinely to account for changes in precipitation and progress in reducing near-channel erosion.
Corresponding flow reductions targets for two-year peak flow amounts and duration should also be established for each tributary of the Minnesota River Basin based on historical river flow data. These tributary flow reduction targets should be included in the development of watershed WRAPSs and revisions to this strategy.
Reductions in streamflow magnitude and duration can be achieved through temporary water storage on the land, desynchronizing the timing of flows from tributary watersheds, and increasing the amount of water that is evaporated and transpired in the watersheds. Each of these types of activities will involve some type of change in land use, cover, or management. Given that the use of hydrologic targets is relatively new, it is important to develop water storage goals and implementation options for individual watersheds. Implementation options include surface and subsurface storage, increasing organic matter content in soils of working lands (cropland), addition of perennial vegetation, and others. Recent modeling and research has provided a general direction in the types of activities needed and has aided in the development of specific BMPs; however, additional development and research is needed to identify and develop the most effective water storage practices. The Greater Blue Earth River
Continued Collaboration & Idea Development
The MPCA communicated with a number of individuals representing the agricultural, university, environmental, and governmental communities to develop this list of strategies and initiatives. It should be emphasized that the intent of this document is not to limit strategies to this list, but rather to initiate dialog among the various stakeholders, to generate ideas and initiate new sediment reduction efforts.
Feedback provided during the public comment period for this document included suggestions for involving additional groups in future conversations and planning efforts, which the MPCA will welcome. Comments also contained recommendations including suggested strategies and resources, some of which included: - Encouraging use of alternative drainage systems, such as
controlled drainage or sub-irrigation including requiring drainage authorities to promote conservation drainage systems
- Referencing existing resources such as the MDA Agricultural BMP Handbook for Minnesota as well as upcoming resources, such as the MDA-funded project: “Identifying Priority Management Zones for Best Management Practice Implementation for Impaired Watersheds.”, which provides a framework for targeting BMP implementation
- Incorporating residue and tillage management goals - Working with national legislators to adjust the national
Renewable Fuel Standard to shift to perennial biomass crops as a replacement for some of the corn grain now in the standard
- Conducting research to develop perennial grain crops adapted to southern Minnesota as replacing significant acreage of annual row crops with perennial grain crops would greatly reduce the excess spring runoff that has accelerated near-channel erosion
While not discussed in the strategy, other tools are also available, including other approaches allowed under the Clean Water Act, such as a Use Attainability Analysis or adoption of site-specific limits. The MPCA recognizes these are available long-term tools as part of the adaptive management approach.
Sediment Reduction Strategy • January 2015 Minnesota Pollution Control Agency
30

Collaborative for Sediment Source Reduction is one such effort that will provide information for the Greater Blue Earth River Watersheds. Consideration of downstream needs is especially important when incorporating hydrologic information in water planning efforts.
Funding alternatives Given the relatively new focus on managing stream flows through land management practices, sources of funding should be evaluated to ensure that funds are available and can be used in the design and implementation of various water storage options. Alternatives for funding include direct funds to drainage authorities and consideration of a Conservation Reserve Enhancement Program combining state and federal funds specifically for water storage.
Existing drainage law provisions One of the possible ways to reduce river flows during high flow periods is to temporarily store water that is otherwise rapidly routed to river systems. Smith and Holtman (2011) evaluated Minnesota’s drainage law and presented recommendations for better protecting both state’s surface waters and the rights of property owners to make beneficial use of their land through drainage. Minnesota Statute § 103E.015 was amended in 2014, in part, to integrate the Smith and Holtman (2011) recommendations into Minnesota’s drainage law. Drainage authorities now are asked to consider ways to reduce downstream peak flows and flooding.
The revisions and additions to the statute provide specific criteria for multipurpose water management that a drainage authority must consider before establishing a drainage project. The criteria are also to be used in the design and repair of drainage projects as noted in other sections of the statute. The additional criteria for drainage authorities include consideration of:
· measures to conserve, allocate, and use drainage waters for agriculture, stream flow augmentation, or other beneficial uses
· the present and anticipated land use within the drainage project or system, including compatibility of the project with local land use plans
· current and potential flooding characteristics of the property in the drainage project or system and downstream for 5-, 10-, 25-, and 50-year flood events, including adequacy of the outlet for the drainage project
· the effects of the proposed drainage project on wetlands · the effects of the proposed drainage project on water quality In addition to these criteria, a subdivision was added to direct drainage authorities to investigate the potential use of external sources of funding and technical assistance when incorporating the criteria into project designs and repair plans.
Multipurpose drainage includes drainage practices and designs that address agricultural needs, peak flow and flood damage reduction, erosion reduction, and water quality improvement in drainage systems from the field scale to the watershed scale. With increased attention toward multipurpose drainage, drainage authorities can play a key role in improving water quality. The “Drainage Tile Permitting” case study describes integrating efforts by the Red River Management Board and Red River Basin Watershed districts.
Sediment Reduction Strategy • January 2015 Minnesota Pollution Control Agency
31

Reduce soil erosion and transport from upland areas While near-channel erosion is the largest source of sediment to the Minnesota and Mississippi Rivers, upland erosion on tilled fields is the second largest source of sediment and is a source which has increased substantially since major changes to vegetation and land cover were made many decades ago. Therefore, this strategy also emphasizes the importance of upland BMPs to reduce upland sources of sediment (quadrant B in Figure 19).
Most of the upland BMPs to reduce sediment losses from cropland are consistent with existing Soil Health initiatives. This strategy integrates sediment retention objectives with a goal of restoring and maintaining soil health. Practices to improve water quality and soil health are both related to farm sustainability; and while water quality impacts generally show up downstream of the farm, soil health is more directly related to the sustained productivity of the soil on the farm itself. Integrating water quality and soil quality adds increased on-farm value to many of the practices used to mitigate nutrient loading. National initiatives are increasingly emphasizing the importance of soil health. In Minnesota, Natural Resources Conservation Service (NRCS) and Board of Water and Soil Resources’ (BWSR), along with the University of Minnesota, Minnesota Department of Agriculture (MDA) and other agencies, are working with agricultural and environmental organizations to include soil health as a conservation objective. The four principles to improving soil health include:
· keep the soil covered as much as possible · disturb the soil as little as possible · keep plants growing throughout the year to feed the soil · diversify as much as possible using crop rotation and cover crops
Case Study: Drainage Tile Permitting for Flow Management
The Red River Management Board approved a set of recommendations for the permitting of tile. These recommendations can be used by local Watershed Districts on a voluntary basis in the Red River Valley.
While Watershed Districts have the authority to permit all surface and subsurface agricultural drainage activities through state statutes (Minnesota Statutes 103D, 2011), Watershed Districts in the Red River Basin have independently developed rules for permitting.
The Red River Retention Authority’s Technical and Scientific Advisory Committee (BTSAC) developed a briefing paper (Water Management Options for Subsurface Drainage) that summarized examples of WD’s in the basin who have implemented such measures.
One Watershed District requires a permit for all private field drainage activity and regulates subsurface and surface drainage activity using a variety of management tools including maximum permissible drainage coefficients (tile capacity determined by soil type, tile size, spacing, and depth; surface drainage capacity determined by applicable methods), culvert sizing, and operating plans (C. Anderson, personal communication).
Some Watershed Districts require subsurface drainage permit applications, but no criteria or regulations are applied other than a request for information such as location and system design which is used to inform downstream landowners and/or the outlet ditch authority and determine if there are any concerns or opposition to the proposed project. Another Watershed District recently decided to limit the drainage coefficient for subsurface drainage permits to a ¼ inch per day.
For the complete paper see: http://www.bwsr.state.mn.us/drainage/BTSAC_FINAL_Breifing_Paper_2_4-5-2012.pdf
Sediment Reduction Strategy • January 2015 Minnesota Pollution Control Agency
32

Improved soil health will sustain soil productivity for future generations, absorb and hold rainwater for use during drier periods, filter and buffer nutrients and sediment from leaving the fields, increase crop productivity, and minimize the impacts that severe weather conditions can have on food production and environmental quality. Thus the benefits of making widespread changes to cropland management, as outlined in this strategy, extend beyond water quality improvement, and include protecting our soil productivity for future generations.
This strategy seeks to incorporate soil health promotion as an overarching educational emphasis. As we promote the BMPs needed for sediment reduction to waters, we should do so in concert with promoting soil health for long term food productivity and sustainability. By focusing attention on soil health and by providing education about the positive impact healthy soils can have on productivity and sustainability, Minnesota farmers will understand the multiple benefits of the BMPs to reduce sediment losses to waters.
Conservation programs such as EQIP and CRP are important to soil health. Conservation programs contribute to soil health by addressing some of the technical and financial risks associated with implementing practices that increase organic matter, water infiltration, water-holding capacity, and nutrient cycling.
Other important upland objectives include preventing gulley erosion and trapping sediment before it leaves the farm through the use of field buffers and structural controls in areas where runoff and off-site soil transport is occurring.
Install direct near-channel protection near infrastructure Direct controls of streambank and bluff erosion are typically quite expensive and only address small problem areas relative to the magnitude of all near-channel sources. The controls also will usually only address the symptoms and not the cause of the problems. However, direct controls will be important when infrastructure (roads, bridges, homes, and other buildings) is threatened. There may also be situations where a unique opportunity to eliminate a potential source of sediment may make an expensive project cost-effective.
Establish a sediment reduction task force and stakeholder workgroups The development of a task force would provide an avenue to continue the dialog begun during the development of this Strategy. A task force could be comprised of researchers, agency representatives and land managers to refine and further develop the strategies in this document, evaluate whether progress is being made, and evaluate and reassign priorities based on progress to date to improve sediment reduction efforts. The MCPA will evaluate the options of starting a new task force or folding the sediment reduction discussions into an existing group working on related issues.
The development of stakeholder workgroups can also serve as a way to collaboratively prioritize actions and initiatives at the local level. These workgroups should consist of interested people including farmers and other land owners/managers, commodity groups, agribusiness representatives, scientists/engineers from local SWCDs or counties as well as researchers and policy makers.
Coordinate implementation with nutrient reduction strategy A state-wide Nutrient Reduction Strategy was completed in 2014 (MPCA 2014). Given that the processes driving mobilization and transport of sediment and nutrients are interrelated, strategies and actions to reduce sediment loading will also help to mitigate nutrient loading and vice versa. Therefore, coordination
Sediment Reduction Strategy • January 2015 Minnesota Pollution Control Agency
33
of strategies and actions are mutually beneficial and will allow for optimization of limited resources. Initiatives that can help facilitate the integration of these two Strategies are identified below.
Integrate sediment reduction goals with local watershed planning efforts – Watershed Restoration and Protection Strategies (WRAPS) and locally led watershed based implementation plans (One Watershed One Plan) will be developed at the major watershed scale (8-digit HUC scale) as a part of the Watershed Approach. These documents should be developed to both protect and restore local water resources as well as to achieve downstream nutrient and sediment reductions. The Nutrient Reduction Strategy provides milestone reduction targets for nutrients and this document provides them for sediment.
Nutrient strategy BMPs – The nutrient strategy identifies the following categories of BMPs to reduce nutrient loading:
1. increasing fertilizer use efficiencies 2. increase and target living cover 3. field erosion control (for phosphorus reduction in the Nutrient Reduction Strategy) 4. drainage water retention for water quality treatment (for nitrogen reduction) and for control of
erosive flows Sediment reduction relies on the last three – living cover, field erosion control and storage.
For the Mississippi River, the Nutrient Reduction Strategy provides a goal of targeting and increasing 1.6 million acres of living cover. It also calls for 1.2 million acres of drainage water retention and treatment to achieve the phase I nitrogen milestone. These practices can also work well for sediment reduction if they involve hydrology management. Additionally, 4.5 million new acres of field erosion control are called for. This agrees with the Sediment Reduction Strategies objective of reducing sediment transport from upland areas.
Direct effective action toward implementation at the local level A watershed water quality model was used in the Minnesota River Turbidity TMDL (MPCA 2012a) to simulate the movement of water, sediment, and other pollutants in the basin, as previously described (see Figure 11). The results from the model scenarios found that to meet the turbidity standard:
1. a high level of change across the landscape is needed 2. water storage in the landscape is important for achieving reduction goals 3. key practices in the scenario included:
a. perennial vegetation b. controlled drainage on land with less than 1% slope c. temporarily store upland waters during the first 24-48 hours after a runoff event d. reducing ravine erosion
Again, it should be noted that a variety of BMP and land use change combinations may achieve the targets. The modeling effort demonstrated that a successful strategy needs to address both channel and upland loads and includes measures that reduce loading during large events (where upland loading is dominated by runoff from cropland) and other runoff events (where significant contributions come from impervious surfaces associated with developed land). Implementation of upland BMPs without addressing hydrology (flow reduction) will not meet sediment reduction goals.
Sediment Reduction Strategy • January 2015 Minnesota Pollution Control Agency
34

An expected outcome of Minnesota’s Watershed Approach includes strategies for sediment reduction which are tailored to major watersheds (Hydrologic Unit Code 8 scale [HUC8]) and local water resources. The WRAPS for each HUC8 watershed includes such elements as timelines, interim milestones, and responsible governmental units for achieving the needed pollutant reductions. A comprehensive water management plan (e.g., One Watershed One Plan) is locally developed, which further defines the more specific actions, measures, roles, and financing for accomplishing the water resource goals.
The WRAPS and associated comprehensive watershed management plan should be developed to not only have the goal of protecting and restoring water resources within the watershed, but to also contribute to sediment reductions needed for downstream waters such as Lake Pepin. For the WRAPS and watershed plans to achieve the downstream goals of this Strategy, aggregated watershed sediment reductions need to contribute to the overall milestones and goals.
River-specific sediment reduction estimates to achieve the 25% reduction milestone are outlined in Appendix A for many of the watersheds in the Minnesota River Basin based on previous HSPF modeling. Future updates to the HSPF modeling and monitoring results should be used to validate the reduction targets in Appendix A. Additionally, the flow reduction targets identified earlier in this strategy should be developed for specific HUC8 watersheds.
Since the feasibility of BMP implementation practicality varies according to local conditions, HUC8 watershed level reductions should also be guided by BMP implementation suitability in the watershed. Table 2 provides a framework that can be used at the local level to consider various combinations of reductions to achieve milestone reductions.
In each watershed, watershed modeling and local water planning should be used to develop the best BMP scenario for achieving the milestone reductions. Additional sediment reductions beyond the milestone goals will be needed in many watersheds to achieve final goals. Local plans to achieve those additional reductions should be developed after initial sediment reductions are achieved, so that continued progress can be made toward achieving TMDLs.
Sediment Reduction Strategy • January 2015 Minnesota Pollution Control Agency
35
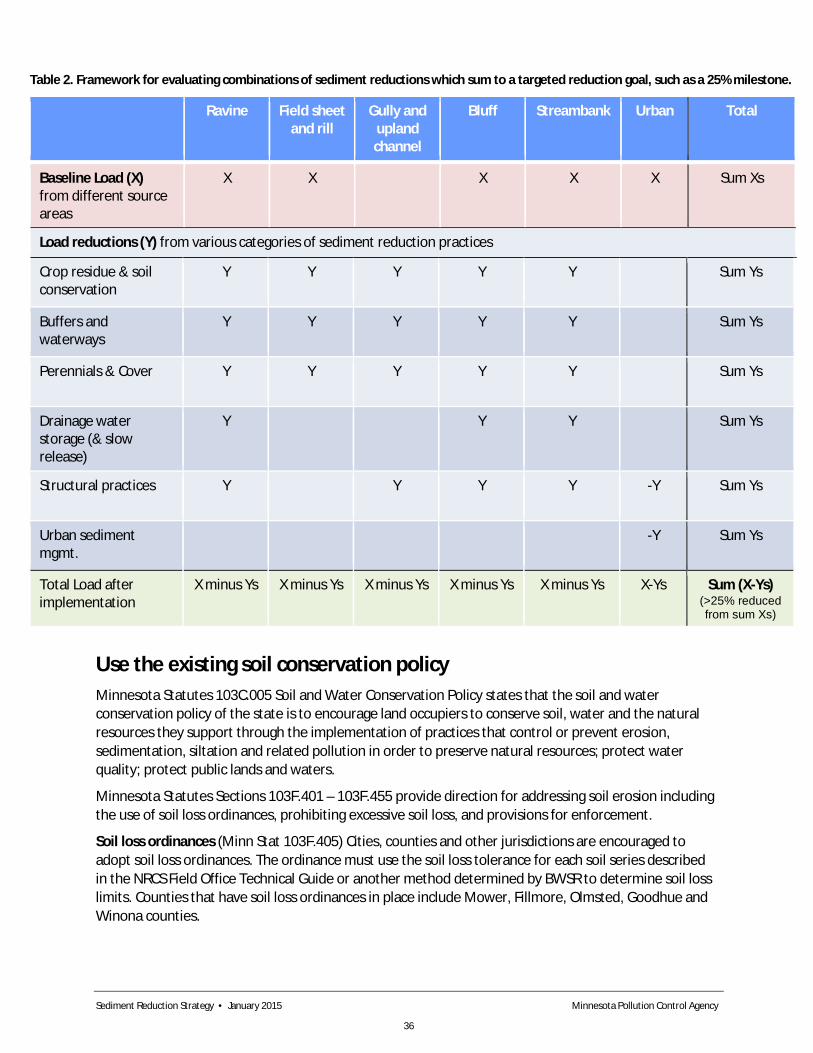
Table 2. Framework for evaluating combinations of sediment reductions which sum to a targeted reduction goal, such as a 25% milestone.
Ravine Field sheet and rill
Gully and upland channel
Bluff Streambank Urban Total
Baseline Load (X) from different source areas
X X X X X Sum Xs
Load reductions (Y) from various categories of sediment reduction practices
Crop residue & soil conservation
Y Y Y Y Y Sum Ys
Buffers and waterways
Y Y Y Y Y Sum Ys
Perennials & Cover Y Y Y Y Y Sum Ys
Drainage water storage (& slow release)
Y Y Y Sum Ys
Structural practices Y Y Y Y -Y Sum Ys
Urban sediment mgmt.
-Y Sum Ys
Total Load after implementation
X minus Ys X minus Ys X minus Ys X minus Ys X minus Ys X-Ys Sum (X-Ys) (>25% reduced from sum Xs)
Use the existing soil conservation policy Minnesota Statutes 103C.005 Soil and Water Conservation Policy states that the soil and water conservation policy of the state is to encourage land occupiers to conserve soil, water and the natural resources they support through the implementation of practices that control or prevent erosion, sedimentation, siltation and related pollution in order to preserve natural resources; protect water quality; protect public lands and waters.
Minnesota Statutes Sections 103F.401 – 103F.455 provide direction for addressing soil erosion including the use of soil loss ordinances, prohibiting excessive soil loss, and provisions for enforcement.
Soil loss ordinances (Minn Stat 103F.405) Cities, counties and other jurisdictions are encouraged to adopt soil loss ordinances. The ordinance must use the soil loss tolerance for each soil series described in the NRCS Field Office Technical Guide or another method determined by BWSR to determine soil loss limits. Counties that have soil loss ordinances in place include Mower, Fillmore, Olmsted, Goodhue and Winona counties.
Sediment Reduction Strategy • January 2015 Minnesota Pollution Control Agency
36
Excessive soil loss (Minn Stat 103F.415) – Subdivision 1. Prohibited activities. A person may not cause, conduct, contract for or authorize an activity that causes excessive soil loss. Subdivision 2. Agricultural land. A land occupier of agricultural land is not violating Subdivision 1 if the occupier is farming by methods that implement the best practicable conservation technology.
Enforcement (Minn Stat 103F.421) provides procedures for enforcement of the excessive soil loss language. Procedures include complaints, determination of soil loss, mediation, assistance, and penalties.
Subsequent sections of the statute address soil and water conservation district assistance, erosion control plans for development activities, and cost-share funding.
Learn from successes and failures at other large scale implementation efforts In 2010, EPA established a TMDL addressing sediment and nutrients impairing the Chesapeake Bay and its tidal tributaries. The development of the TMDL was prompted by the fact that the past 25 years of restoration efforts were still insufficient to make needed water quality improvements. While development of a TMDL at this scale was historic, just as significant was the approach to its implementation.
The political and legal conditions under which the Chesapeake Bay TMDL was developed and implemented is the result of several consent decrees, Memos of Understanding, lawsuits, and a presidential Executive Order. While this setting has resulted in more federal oversight, and consequently more accountability than what is currently experienced in Minnesota, a number of ideas and lessons learned can be gained from evaluating the Chesapeake Bay approach and other efforts to address large scale pollution problems.
Table 3 outlines the key Chesapeake Bay TMDL components and the benefits of such an approach.
Sediment Reduction Strategy • January 2015 Minnesota Pollution Control Agency
37

Component How it Works Benefits Target loads Establishes "Interim Target Loads" that meet 60% of the Final
Targets by 2017 and 100% of the Final target by 2025. Interim and Final Target Loads are further divided among a) smaller geographic areas (e.g., counties) and b) types of sources (e.g., WWTPs, MS4s, agriculture, etc.).
Provides goals at a local scale so that the shared responsibility is specifically identified, broken into more “manageable” pieces, and is clearer to everyone.
Current Capacity Analysis
Determines how much of the Interim and Final Targets can be achieved by 2017 with current state and local resources. Identifies the gap between what can be achieved with current resources, what needs to be achieved, and a strategy for closing any gaps.
Acknowledges the reality of limited resources up front in the planning process, quantifies it, and incorporates a process to mitigate the impact of limited resources.
Accountability Framework
Requires four elements: (1) Watershed Implementation Plans, (2) two-year milestones, (3) tracking and assessing progress, and (4) federal actions if insufficient progress is made.
(1) Watershed Implementation
Plans (WIP)
Identifies a set of specific actions that are capable of achieving the reductions necessary to meet target at the state, county, and sector scales. Includes sufficient detail for implementation efforts; commitments to strategies for achieving needed pollution reductions including specific controls; technologies; practices; and enhancements to policies, programs, authorities, and regulations needed to achieve goals. Includes a schedule by which key steps will be taken.
Documents the approaches used and the schedule by which goals will be met. Facilitates public involvement and the engagement of source sectors so that more realistic and cost effective approaches to pollution reduction are considered and implemented and there is more local buy-in.
(2) Two-year Milestones
Includes near-term implementation and program development activities submitted to EPA every two years. Serves as the basis by which EPA determines progress at the state and local scales.
Sets small steps that can be tracked incrementally and can be adjusted in a more timely fashion if needed.
(3) Tracking and Assessment
Occurs not only to inform EPA and state agencies of success in meeting goals and regulatory requirements (i.e., TMDL NPDES permit requirements), but to provide this information transparently to the public. An example of this can be seen at: http://stat.chesapeakebay.net/
Verifies the level of progress being made, facilitates public buy-in of pollutant reduction strategies, and provides context for its significant expense.
(4) Federal “consequences”
Includes EPA oversight on WIP implementation (including programs and permits) and taking action for insufficient effort or progress. Can include prohibiting new discharges, expanding regulatory requirements, redirecting EPA grants, etc.
Establishes consequences to states, and ultimately local entities (including non-regulated sources), for lack of effort to make progress.
Accounting for future growth
Requires states and local governments to develop an approach to address water pollution caused by new growth and development. Can be accomplished through approaches such as nutrient credit trading or paying a fee-in-lieu.
Requires continued assessment and implementation to prevent impacts from new sources not accounted for in original TMDL.
Adaptive management
Includes ongoing evaluation and collaboration on practices, policies, and programs impacting the Chesapeake Bay. Includes workgroups that address specific issue areas: http://www.chesapeakebay.net/groups/group/water_quality_goal_implementation_team Includes a “mid-point assessment” by EPA's watershed model being revised in 2017 and modifying load reduction targets based on new or updated data and information.
Incorporates flexibility into planning and implementation. The Chesapeake Bay Program continues to pursue further refinement of the TMDL to ensure its goals are based on the best available science and data. The CBP also coordinates communication and research to facilitate this process.
Table 3. Case Study: Chesapeake Bay TMDL
Sediment Reduction Strategy • January 2015 Minnesota Pollution Control Agency
38

Table 4. Example tools for prioritizing and targeting watershed restoration efforts.
Tool Description How can the tool be used? Notes
Identifying Priority
Management Zones for BMP
Implementation in Impaired Watersheds
A compilation of guidance and procedures for identifying critical pollutant source areas (CSAs) and delineating priority management zones for optimum placement of conservation measures based on source magnitude, hydrologic connectivity, and delivery mechanisms.
Supporting materials provide stepwise instruction for conservation technicians to perform GIS terrain and spatial analysis techniques that will pinpoint CSAs and allow for prioritization based on pollutant delivery potential. Case study summaries of desktop analyses, including integration of modeling/ monitoring/ indices, site evaluation protocols, and decision-support guidance are also provided to enable practitioners to further target and prioritize candidate areas for implementation of conservation practices in multiple regions of the state.
The process provides a scalable, streamlined approach for developing watershed restoration and protection strategies and methods for ranking vulnerable sites during funding applications.
Ecological Ranking Tool
(Environmental Benefit Index -
EBI)
Three GIS layers containing: soil erosion risk, water quality risk, and habitat quality. Locations on each layer are assigned a score from 0-100. The sum of all three layer scores (max of 300) is the EBI score. The higher the score, the higher the value in applying restoration or protection.
Any one of the three layers can be used separately or the sum of the layers (EBI) can be used to identify areas that are in line with local priorities. Raster calculator allows a user to make their own sum of the layers to better reflect local values.
GIS layers are available on the BWSR website.
Zonation A framework and software for large-scale spatial conservation prioritization; it is a decision support tool for conservation planning. This values-based model can be used to identify areas important for protection and restoration.
Zonation produces a hierarchical prioritization of the landscape based on the occurrence levels of features in sites (grid cells). It iteratively removes the least valuable remaining cell, accounting for connectivity and generalized complementarity in the process. The output of Zonation can be imported into GIS software for further analysis. Zonation can be run on very large data sets (with up to ~50 million grid cells).
The software allows balancing of alternative land uses, landscape condition and retention, and feature-specific connectivity responses. See http://ebmtoolsdatabase.org/tool/zonation
National Hydrography
Dataset & Watershed Boundary Dataset
NHD is a vector GIS layer that contains features such as lakes, ponds, streams, rivers, canals, dams and stream gages, including flow paths. The WBD is a companion vector GIS layer that contains watershed delineations.
General mapping and analysis of surface-water systems. These data has been used for: fisheries management, hydrologic modeling, environmental protection, and resource management. A specific application of the data set is to identify buffers around riparian areas.
The layers are available on the USGS website.
Light Detection and Ranging
(LiDAR)
Elevation data in a digital elevation model (DEM) GIS layer. Created from remote sensing technology that uses laser light to detect and measure surface features on the earth.
General mapping and analysis of elevation/terrain, such as for ravine and gully evaluation. These data have been used for: erosion analysis, water storage and flow analysis, siting and design of BMPs, wetland mapping, and flood control mapping. A specific application of the data set is to delineate small catchments.
The layers are available on the MN Geospatial Information website for most counties.
Hydrological Simulation Program –
FORTRAN (HSPF) Model
Simulation of watershed hydrology and water quality for both conventional and toxic organic pollutants from pervious and impervious land. Typically used in large watersheds (greater than 100 square miles).
Incorporates watershed-scale and non-point source models into a basin-scale analysis framework. Addresses runoff and constituent loading from pervious land surfaces, runoff and constituent loading from impervious land surfaces, and flow of water and transport/ transformation of chemical constituents in stream reaches. Used by MPCA at the 8-digit HUC scale. A number of other watershed models are also available.
Local or other partners can work with MPCA HSPF modelers to evaluate at the watershed scale: 1) the efficacy of different kinds or adoption rates of BMPs, and 2) effects of proposed or hypothetical land use changes.
Geographic Information
Systems
Can be used to identify points of interest for prioritization (e.g., stream bluffs susceptible to erosion; riparian stream corridors; areas identified by the soil erodibility index) and develop maps illustrating target areas and results of analysis [e.g., top 5% of EBI land areas; pollutant loading by subwatershed using a color-scale, green (low loading) to red (high loading)].
Tracking Systems
Tools (e.g., eLink and the tillage transect survey) can be used to track implementation practices.
The number of acres in conservation practices is tracked by watershed. Practices not captured by these systems will also be tracked (e.g., stream channel practices).
BWSR and the USDA are two of the agencies that keep this information.
Sediment Reduction Strategy • January 2015 Minnesota Pollution Control Agency
39

Use prioritization tools Because there are multiple sediment reduction opportunities within a watershed, narrowing down what practices to implement and where in the landscape to implement them is critical to effectively target efforts and efficiently use limited resources. Identification of priority areas in need of water quality improvement and protection is a primary goal of the WRAPS process. Multiple tools are available that can be used to identify areas of high sediment erosion as well as tracking efforts within a watershed, a few of which are highlighted in Table 4. Some of these tools could be integrated into the WRAPS approach as well as local watershed management plans. It is important to note that follow-up field reconnaissance will need to accompany some tools for validation of areas identified for erosion control actions. Subsequently, additional studies may be needed to determine the feasibility of selected actions.
Additional study priorities While a substantial amount of research and monitoring efforts have been conducted or are currently underway in the Minnesota River Basin and South Metro Mississippi River, additional research and monitoring are still needed. Data with greater spatial and temporal detail will provide a better understanding of the local drivers of sediment transport within the basins, which will help target and prioritize sediment reduction efforts through time.
Scientists, MPCA, and stakeholder groups have identified many priorities for further study. While not necessarily all-inclusive, a number of these priorities are outlined below:
Developing methods for reducing water flow in the Minnesota River Basin – Quantify how changes on the land will reduce flow in the Minnesota River and how that reduced flow will subsequently affect sediment transport in that river. Estimate the reduced river flows that can result from various levels of changes, including ways to store and slow-release drainage waters, ways to increase evapotranspiration through increased vegetative cover during spring and fall months, and reduce field runoff through soil and water conservation practices. Specifically develop scenarios for reducing river flow by 25%.
Reducing Erosion – Determine how much sediment losses to the Minnesota River can be reduced by additional soil and water conservation practices in the River Basin. Also determine the most cost-effective ways to use vegetation, structural BMPs and other practices to reduce bluff, ravine, and streambank erosion. Study the best combination of practices for achieving sediment reduction targets.
Identifying sediment sources and solutions in each watershed – Some uncertainty remains concerning the proportions of various sediment sources identified at the watershed scale (MPCA 2012a). Multiple factors are at play within the watersheds that contribute the most sediment. Because these factors can vary from site to site, watershed priorities may be site-specific and require localized implementation planning efforts.
The Cost of Making Progress
The MPCA recognizes there are costs and other economic considerations involved with erosion and sediment control. Considerations can include direct costs; costs associated with operation and maintenance; cost effectiveness (benefit compared to expenditures); and other less apparent costs, such as positive or negative environmental impact.
Some work, such as that included in MDA’s Agricultural BMP Handbook for Minnesota (2012), has been completed to date that assesses BMP costs. More work is needed; however, to facilitate implementation on many levels - from incorporating the most cost effective practices in local planning efforts to allowing for cost comparisons between practices at the site scale.
The MPCA will be supporting efforts to develop additional cost assessments in the coming year.
Sediment Reduction Strategy • January 2015 Minnesota Pollution Control Agency
40

Research conducted thus far has helped to define the upland vs. near-channel sources, but more work remains to provide additional certainty and prioritization of sources in each watershed (e.g. streambanks, bluffs, ravines, and uplands).
While man-made alterations within the basin, such as increases in impervious surfaces and artificial drainage, are often discussed, others need further investigation. For instance, additional research is needed to evaluate the impacts of man-made alterations to the river through wing dams, straightening, etc.
Continued gauging upstream and downstream of incised portions of key watersheds should help identify the magnitude of bluff and ravine contribution and to test methods for estimating the contribution from different sources within a watershed (Wilcock 2009). These gauges provide a high return in improved understanding of the magnitude, location, and mechanism of sediment supply in the Minnesota River Basin. Research could also include a complete inventory of ravines and bluffs for the incised portion of the Minnesota River Basin (Wilcock 2009).
Watershed-specific source evaluation tools should be developed to identify the combinations of practices and scale of adoption needed to achieve local sediment reduction targets and fair share reductions for downstream needs.
Studying program needs to support large scale adoption of changes – Continue to evaluate existing programmatic, funding, and technical capacity to fully implement basin and watershed strategies. This evaluation would identify gaps in current programs, funding and local capacity to achieve the needed BMP adoption.
Evaluating river monitoring trends and patterns – Study existing river monitoring data to estimate flow-adjusted trends and potential progress achieved during recent years. Use monitoring data to also pinpoint the combination of season, month, climate and other factors that are leading to the highest 20 to 30% sediment transport periods.
Developing radiometric fingerprinting of sediment sources – Radiometric fingerprinting of sediment is needed to continue the development of a thorough understanding of the sources and changes through time. The fingerprinting work should be done using current and future stream sediment monitoring along with lake sediment cores.
Monitoring at knickpoints – Monitoring above and below these features can help to identify sediment sources and constrain sediment loading. Monitoring the erosive features directly using ground-based LiDAR, fingerprinting, and/or field surveys provides significant benefits. Load monitoring at the watershed outlets alone is insufficient to identify and ultimately target the appropriate areas for sediment reducing BMPs. Hence there is a need to keep many of the intermediate monitoring stations in place. (MPCA 2012a)
Predicting which other landscape features will erode at high rates – Air photo analysis has identified bluffs that have eroded rapidly over the past 60 years, although this is not a guarantee that these bluffs will continue to erode at a high rate in the future (e.g., the bluff erosion may have resulted after only one or two large events). Further analysis is needed to indicate the combination of bluff composition, geometry, and aspect that are most likely to produce large erosion rates in the future as well as the hydrologic (seepage and undercutting) and thermal (freeze-thaw) conditions that accelerate bluff failure (Gran et al. 2011).
Extrapolating sediment budgets – Developing a basis for extrapolating sediment budgets from one watershed to another will help to better characterize sediment sources throughout the Minnesota River Basin (Wilcock 2009). Additionally, developing a sediment budget for the Minnesota River main stem will
Sediment Reduction Strategy • January 2015 Minnesota Pollution Control Agency
41

help to identify the magnitude of sediment storage and the factors that control changes in sediment storage and transport (Wilcock 2009).
Researching sediment transport – Additional research is needed regarding sediment transport in small and major tributaries to the Minnesota River as well as in the main stem. Additional tracking and research is needed on changes in sediment loading rates to waters downstream of Lake Pepin, to better understand the relationship between sediment loading to Lake Pepin and long term effects on downstream waters.
Evaluating the role of agricultural drainage – The role of tile and ditch drainage systems in changing stream hydrology and the erosive potential of Minnesota River tributaries should be studied further. Debate continues regarding the effects of tile drainage on high flows in the spring, summer, and fall. While tile drainage inherently increases the rate at which water is conveyed from the fields to the channel, the magnitude of this effect on peak and total runoff is poorly understood in large watersheds. Additional research is needed to explore the role of agricultural drainage in changing stream hydrology and the erosive potential of Minnesota River tributaries (MPCA 2012a) and the potential reductions in erosion and sediment from managing hydrology.
Understanding effects of drainage systems on wetlands and water quality – The drainage code currently requires drainage authority decisions to be based on quantitative weighing of benefits and costs to property owners. Only general considerations of “public benefits” are made, however. As discussed in Smith & Holtman (2011), better integrating decisions regarding drainage and in wetland/water quality protection would help reconcile sometimes competing needs. Because costs and benefits from wetland and water quality impacts are difficult to measure and quantify, Smith & Holtman (2011) recommend fostering work to improve the understanding of drainage system impacts on wetlands.
Reconciling differing methods used to measure erosion rates – A mass balance approach can be used to reconcile estimates of sediment erosion rates determined from different methods. Such methods include extrapolation of local erosion rates, comparing various fingerprinting methods, comparing physical measurements of erosion (terrestrial LiDAR, field surveys, etc.), and evaluating gauging records (MPCA 2009a).
Investigating storage and transport of the coarse-grained sediment fraction of total sediment in rivers – Work to date has focused on fine-grained sediment. A USGS report (Ellison et al. 2014) recently described differences between TSS which provides a measure of the fine portion of sediment and suspended sediment concentration that provides a measure of fine and sand sized sediment. The USGS has also begun bedload monitoring at select sites in Minnesota to evaluate the transport of sand-sized and larger particle sizes of sediment along the bottom of rivers.
Studying changes in near-channel loading – Gain a better understanding of how near-channel loading will change as recent increases in stream flows reach equilibrium. Once flows stabilize, channel widening should also stabilize along with near-channel sediment mobilization and transport. When will this happen, how large the decrease may be, and what a new baseline will be remains unclear.
Understanding lag times – A better of understanding of the lag times associated with the variety of implemented BMPs is needed. Understanding this lag time will be central to evaluating BMP effectiveness.
Evaluating methods for stabilizing ravines – Ravines are a major source of sediment and research is needed to evaluate and determine the best options for reducing sediment transport from these areas.
Research on these topics may be instrumental in allowing additional targeting of sediment reduction measures in areas causing the greatest impact. The results of these research efforts also may be used to adjust or adaptively manage sediment reduction efforts in the future.
Sediment Reduction Strategy • January 2015 Minnesota Pollution Control Agency
42

5. Civic engagement: A key strategy for restoring and protecting the Minnesota and South Metro Mississippi Rivers
As discussed in Section 2, the most significant source of sediment impacting water quality within the Minnesota River Basin and South Metro Mississippi River systems comes from nonpoint sources. Point sources can be addressed through federal and state regulation; however, nonpoint sources are addressed largely through local requirements or voluntary actions of citizens and landowners. Establishing expectations for those voluntary actions and tracking changes are not well supported currently.
While implementation of on the ground projects is often the first thing that comes to mind when planning pollutant reduction strategies, informing and involving groups such as stakeholders, the general public, and policy makers is often a key step. Civic engagement can involve a variety of approaches from facilitating dialog so stakeholders better understand the issues, to establishing focus groups so appropriate strategies can be identified at the local watershed level, to conducting demonstration projects of practices to facilitate acceptance and implementation.
While education is an important element of civic engagement, facilitating two-way communication with stakeholders, the public, and other officials is also essential. The complexities of the issues as well as the varying perspectives from which individuals view these issues, can impact the acceptance of needed actions, the willingness to implement the actions, and the ultimate success of making needed sediment reductions.
The scale of the sediment problem, and the effort needed to mitigate it, will require new solutions and strategies. These strategies will require public involvement that encourages and supports collaboration, transparency, and accountability of all the players involved. The success of this effort will also require public participation in the development of local watershed planning efforts as well as the implementation of needed sediment reduction activities.
Over the past several years, the MPCA has incorporated extensive stakeholder involvement in the development of both the Minnesota River and South Metro Mississippi River sediment TMDLs. This included the formation of Stakeholder Advisory Committees from members of a number of diverse groups representing agriculture, cities, watersheds organizations, local government and state agencies, and environmental organizations. These stakeholders identified a broad range of strategies to meet sediment reduction goals in these basins (MPCA 2012a).
Sediment Reduction Strategy • January 2015 Minnesota Pollution Control Agency
43
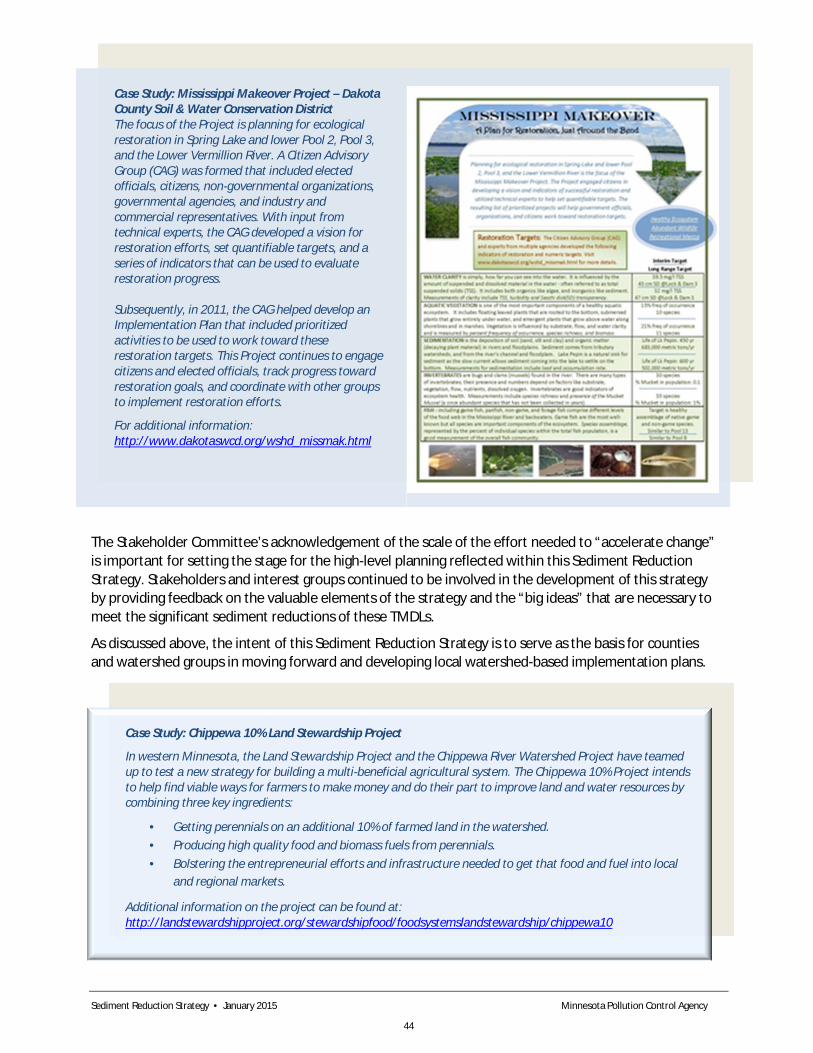
The Stakeholder Committee’s acknowledgement of the scale of the effort needed to “accelerate change” is important for setting the stage for the high-level planning reflected within this Sediment Reduction Strategy. Stakeholders and interest groups continued to be involved in the development of this strategy by providing feedback on the valuable elements of the strategy and the “big ideas” that are necessary to meet the significant sediment reductions of these TMDLs.
As discussed above, the intent of this Sediment Reduction Strategy is to serve as the basis for counties and watershed groups in moving forward and developing local watershed-based implementation plans.
Case Study: Chippewa 10% Land Stewardship Project
In western Minnesota, the Land Stewardship Project and the Chippewa River Watershed Project have teamed up to test a new strategy for building a multi-beneficial agricultural system. The Chippewa 10% Project intends to help find viable ways for farmers to make money and do their part to improve land and water resources by combining three key ingredients:
· Getting perennials on an additional 10% of farmed land in the watershed. · Producing high quality food and biomass fuels from perennials. · Bolstering the entrepreneurial efforts and infrastructure needed to get that food and fuel into local
and regional markets.
Additional information on the project can be found at: http://landstewardshipproject.org/stewardshipfood/foodsystemslandstewardship/chippewa10
Case Study: Mississippi Makeover Project – Dakota County Soil & Water Conservation District The focus of the Project is planning for ecological restoration in Spring Lake and lower Pool 2, Pool 3, and the Lower Vermillion River. A Citizen Advisory Group (CAG) was formed that included elected officials, citizens, non-governmental organizations, governmental agencies, and industry and commercial representatives. With input from technical experts, the CAG developed a vision for restoration efforts, set quantifiable targets, and a series of indicators that can be used to evaluate restoration progress. Subsequently, in 2011, the CAG helped develop an Implementation Plan that included prioritized activities to be used to work toward these restoration targets. This Project continues to engage citizens and elected officials, track progress toward restoration goals, and coordinate with other groups to implement restoration efforts.
For additional information: http://www.dakotaswcd.org/wshd_missmak.html
Sediment Reduction Strategy • January 2015 Minnesota Pollution Control Agency
44

Civic engagement will continue to be an important component of this watershed scale implementation planning. Counties and watershed groups are encouraged to actively seek out and utilize the general public and stakeholders in two-way communication from the earliest stages of the local watershed planning process. Many watersheds are already doing so. This approach will help illustrate that the public’s involvement is proactive and substantive, rather than reactive at the end of a process (MPCA 2009b).
Civic engagement is encouraged early in the process such as when specific sources of sediment have been identified and areas have been targeted for implementation activities (MPCA 2009b). This information can help steer civic engagement and subsequent planning and implementation efforts. For instance, rather than attempting to inform and change the behaviors of everyone in a watershed or subwatershed, residents or private entities owning properties or areas causing the greatest impacts could be targeted whenever possible (MPCA 2009b). Additionally, planning at this scale can include careful analysis of each unique watershed and its residents, which should provide greater potential for success when addressing both psychological and infrastructure barriers to behavioral changes (MPCA 2009b).
Civic engagement in the adaptive management framework An important (yet often overlooked) tool is implementation of an approach to evaluate and track improvements made as a result of civic engagement (MPCA 2009b). Tracking could involve measuring changes in both participation in planning activities as well as changes in individual behaviors. Improvements made (or issues identified) through civic engagement efforts can help steer future efforts so that continuous progress to sediment reduction is made.
An example of a tool for use with these efforts is the Civic Engagement model1 developed by the University of Minnesota Extension Service (UMN 2002). This resource is intended to be a helpful guide for local governments in designing their own unique civic engagement strategies during the implementation process and allowing for adaptive management to be practiced within water quality management. By integrating use of this model in watershed management, the goal is to:
· Create an awareness and understanding that meetings involving the public are opportunities to be designed and managed as civic engagement;
· Encourage planners to create a strategy of interconnected and synergistic civic engagement actions that are enabled and driven by data about the community rather than by hunches. Emphasize the need for evaluating civic engagement efforts using that data; and
· Adapt future actions and practices based on the results of this evaluation. People do not always act as expected and in some cases, civic engagement actions may not have been as effective as hoped, requiring plans to change and adapt as the learning process occurs. By recognizing the uniqueness of each watershed and tapping into an array of tools, resources, and technical and moral support to implement engagement activities, the ability to practice adaptive management and conduct authentic and appropriate civic engagement can be increased. This can lead to co-creation of ideas and strategies through discussion, reflection, and collaboration. If civic engagement efforts do not work as expected over time, this adaptive management provides the framework in which local agencies may decide to adapt their course of action.
1 For additional information on this resource see http://www.extension.umn.edu/community/civic-engagement/engage-citizens-decisions/.
Sediment Reduction Strategy • January 2015 Minnesota Pollution Control Agency
45

Case Study: Lake Pepin Friendship Tour
Clean up the River Environment (CURE), along with the Minnesota Ag Water Resources Coalition (MAWRC), the Minnesota River Board (MRB), the Minnesota River Watershed Alliance (MinnRivWa), the Cannon River Watershed Partnership (CRWP), and the Lake Pepin Legacy Alliance (LPLA), identified an approach to promote a shared vision and understanding about water quality issues affecting the Minnesota River and Lake Pepin. This approach included bringing farmers along the Minnesota River to Lake Pepin to see sediment impacts first hand. The “tour” also involved brining downstream environmental activists to farms in western Minnesota to see the issues faced by corn and soybean growers in the region.
Rather than focusing on the science and sides of the issues, the goal of the four day tour was to have the stakeholders first better understand one another, which could then set the stage for a conversation-focused dialog. Participants included citizens rather than those from governmental agencies as organizers wanted these stakeholders to work through these issues first to agree on a common ground and direction. A number of items were identified that participants felt they could collaborate on in the future including public education, water quality monitoring, and implementation of sediment reduction measures.
Additional information on the Friendship Tour can be found at: http://www.curemnriver.org/FriendshipTourSummary.pdf.
Case Study: Minnesota River Valley Ravine Stabilization Charrette (Emmons & Olivier Resources, Inc. 2011)
In 2011, the Scott WMO and the Minnesota River Basin invited professionals with experience in ravine erosion to a “design charrette” to address ravine management challenges. The two day event included the review and assessment of two ravine sites and a work session to brainstorm potential solutions and suggested approaches for ravine stabilization efforts.
The outcome of the charrette was a concept stabilization plan for the two study sites that identified best management practices and conceptual designs for stabilizing ravines. The plan was intended to be used as a foundation on which to implement several pilot projects in association with various partners.
For additional information see: http://www.co.scott.mn.us/ParksLibraryEnv/wmo/Documents/07feb11_Ravine_Stabilization_Charrette.pdf
Sediment Reduction Strategy • January 2015 Minnesota Pollution Control Agency
46

Case Study: Results from Focus Groups with Drainage Professionals around the State - Review of Conservation Drainage Practices and Designs in Minnesota (Lewandowski 2010)
Focus groups were held around the state in January-February 2010 to listen to people directly involved with designing, installing, and regulating agricultural drainage systems. Participants included engineers and agency hydrologists, farmers and contractors, and drainage authorities. The purpose of this study was to gain insight into how drainage professionals around the state think about “conservation drainage” practices. It is a study of the people most directly involved in implementing drainage, with the results intended for use by a broader group of all stakeholders interested in drainage and its impacts.
The findings from these focus groups include insight from participants on types of conservation drainage practices and their use as well as observations that can help in implementation (i.e., importance of stakeholder involvement, research needs, and opportunities for immediate action). For additional information see: http://wrc.umn.edu/prod/groups/cfans/@pub/@cfans/@wrc/documents/asset/cfans_asset_259636.pdf
Case Study: Le Sueur River Watershed Network Citizen Advisory Committee - Seven Steps toward Cleaner Water and River Health (MRDBC 2013)
The Water Resources Center at Minnesota State University Mankato along with other state agencies formed a partnership to develop an approach to engage citizens on water quality issues in the Le Sueur River Watershed. The ultimate goal of the partnership was to create a stakeholder-driven process to determine priorities and action steps that will lead to the restoration of the watershed.
While the University and state agencies provided the technical expertise and resources, civic leaders were the ones who engaged the broader community to develop a strategy for improving water quality. To accomplish this, a focus group was created to develop a set of recommendations for the public to consider. A series of informal meetings, potluck dinners, and a “Map Party” allowed citizens to gather, talk, and move beyond the extensive technical data and scientific research already gathered and find out what citizens want to do for their rivers.
A series of Le Sueur River Watershed Network Citizen Advisory Committee meetings from January through May 2013 resulted in the development of the Seven Steps toward Cleaner Water and River Health (draft 2013). Additional information on the Le Sueur River Watershed Network and the Seven Steps can be found at: http://mrbdc.mnsu.edu/sites/mrbdc.mnsu.edu/files/public/org/lesueur/nav_index.html and http://mrbdc.mnsu.edu/sites/mrbdc.mnsu.edu/files/public/org/lesueur/pdf/ls_recommendations.pdf.
Sediment Reduction Strategy • January 2015 Minnesota Pollution Control Agency
47

6. Monitoring, tracking, and adaptive management The management actions needed to reduce sediment loading in the Minnesota River Basin and South Metro Mississippi River will take time; will be expensive; and will require active participation from many different people, organizations, agencies, and policymakers. As discussed previously, the intent of this basin-scale Sediment Reduction Strategy is to form the foundation for the development of smaller scale watershed management plans. Once these plans are developed, assessing implementation success and progress within the watersheds will be critical for a number of reasons, including:
· informing stakeholders and policymakers of progress · understanding the benefits of the efforts being made · focusing future resources where they can provide the biggest benefit · adapting implementation efforts in response to knowledge gained Given the large number of sediment sources and the episodic nature of erosion, documenting success in reducing erosion will not be simple. Key elements needed to maximize lessons learned throughout implementation include:
· monitoring · tracking BMP adoption progress · adaptive management While these topics are addressed further below, Section 7 of the statewide Nutrient Reduction Strategy also discusses these topics. Because of the linkage between sediment and nutrients and the fact that many practices and programs directly (or indirectly) address both these constituents, it will be important to coordinate not only implementation, but evaluation of progress and additional efforts needed to attain goals.
Monitoring and trends Monitoring results and corresponding statistical trend analyses suggest recent improvements in sediment concentrations and loads. For example, a MPCA trend study of its “Minnesota Milestone” monitoring sites indicated that between 1995-2009, seasonally-adjusted total suspended sediment concentrations decreased by 51-61% at all four Minnesota River monitoring locations between Courtland and Fort Snelling (Christopherson 2014). In that same study, the Mississippi River at Lock and Dam #2 near Hastings showed a 44% decrease.
Using more robust data sets and statistical methods, Metropolitan Council Environmental Services found significant sediment load reductions in the Minnesota and Mississippi Rivers (draft findings – MCES, 2014). At Jordan, Minnesota sediment loads (flow adjusted) decreased by an estimated 34% between 1996-2013. At Lock and Dam #3 near Red Wing, sediment decreased 30% between 2003-2012.
As these data are preliminary, additional monitoring in these watersheds is needed to fully assess the trends and to determine if progress is being made toward compliance with water quality standards, improvements to submerged aquatic vegetation (SAV) growth in the South Metro Mississippi River and reducing infilling of Lake Pepin. The findings identified through the MPCA’s Monitoring & Assessment Program, as well as data collected through partnerships, can help make informed decisions that lead to efficient expenditures of limited human and capital resources.
Sediment Reduction Strategy • January 2015 Minnesota Pollution Control Agency
48

A comprehensive, well-planned monitoring program supports implementation by answering the following questions:
· Where do we stand today and how much further do we have to go?
· Where should we prioritize our efforts? · How effective are the implementation efforts? · How will we know when we get there? In order to implement a successful, adaptive management program, it is essential that monitoring efforts document not only management actions, but also the system response. Monitoring efforts, including those described below, can help focus implementation actions and increase confidence in progress being made.
Baseline monitoring – identifies the environmental condition of the waterbody to determine if water quality standards are met and identify temporal trends in water quality
Implementation monitoring – tracks implementation of sediment reduction practices using eLink or other tracking mechanisms
Flow monitoring – combined with water quality monitoring at the site allows for the calculation of pollutant loads
Effectiveness monitoring – determines whether or not a practice or combination of practices are effective in improving water quality
Trend monitoring – allows the statistical determination of whether or not water quality conditions are improving
Validation monitoring – validates the source analysis and linkage methods in sediment source tracking to provide additional certainty regarding study findings. For instance monitoring above and below knickpoints rather than just at the watershed outlet to help constrain and identify sediment sources.
While monitoring at tributary mouths or in the main stem can be effective in assessing the cumulative impact of implementation efforts within major watershed, it will not reflect the impact from a specific project or efforts at the sub-basin scale. Therefore, monitoring should also continue
on a more localized scale (i.e., targeted sub-basin, project-scale) to help understand the benefits gained and inform future decision-making on project selection.
The MPCA’s Watershed Pollutant Load Monitoring Network is designed to measure and compare regional differences and long-term trends in sediment and nutrients among Minnesota’s major rivers and streams. The program couples site-specific stream flow data from the USGS and Minnesota DNR gaging stations
Case Study: Effective Monitoring Techniques in the Le Sueur River Basin
Two monitoring techniques provide good reliability at reasonable cost. Stream gauging provides the most direct and reliable evidence of erosion rates from a watershed. Although gauging requires effort and expense, much of what we know about sediment sources in the MRB comes from stream gauging. Of particular value are streams with a gauge located above and below the tributary knick zones. Comparison of the loads at the upstream and downstream gauges helps differentiate between sediment delivered from the vast uplands versus near-channel sources in the knick zone and also allows us to track the sensitivity of near-channel sources to future changes in hydrology.
The other monitoring technique, sediment fingerprinting, include a number of methods (e.g., isotope tracers 10Be, 210Pb, and 137Cs) that have been demonstrated to provide a robust monitoring tool that very effectively supplements stream gauging.
Gauging provides a direct measure of sediment load. Fingerprinting provides an estimate of the proportion coming from upland fields. Gauges and fingerprint samples located above and below the knick zones measure the sediment increase from predominantly bluffs and ravines. Combining this information, a monitoring program can provide reliable, corroborating evidence of the system response to management actions. (Gran et al. 2011)
Sediment Reduction Strategy • January 2015 Minnesota Pollution Control Agency
49

with intensive water quality data sets to compute annual pollutant loads at over 200 stream and river monitoring sites across Minnesota. Monitoring sites span three ranges of scale: 1) Basin (Mississippi, Minnesota, Rainy, Red, St Croix rivers); 2) Major Watershed (8 digit HUCs); and 3) Subwatershed (drainage areas of approximately 300-500 mi2 within 8 digit HUCs). Water quality and flow data are collected and loads calculated on an annual time scale for the basin and major watershed sites. Subwatershed sites are only monitored during the open water season; pollutant loads for these sites are calculated seasonally.
Tracking progress The collection of monitoring data will be helpful in tracking the progress made in association with sediment reduction efforts. Assessment of these data; however, is essential in tracking progress toward sediment reduction goals. Data assessment can also support the adaptive management process and inform decisions for future sediment reduction efforts if expected progress is not being made.
Implementation tracking Quantitative tracking of each individual project is needed to document the changes taking place on the landscape, assess progress, and to identify areas where additional effort is needed.
As the benefits resulting from expenditures of public dollars have been undergoing heightened scrutiny, greater attention has been given to implementation tracking and improving ways in which it is used. Greater focus on implementation tracking will benefit the local planning efforts as progress is evaluated in a more comprehensive manner in the Minnesota River and the South Metro Mississippi River Basins.
One example of how implementation tracking is being used in Minnesota is through the BWSR geospatial database called eLINK. Entities receiving state funding for projects have been required to report project information in eLINK. The database has been an effective tool for state agencies and local governments to plan, evaluate, and track projects. Agencies and local governments in Minnesota should use eLINK to track projects relevant to these sediment TMDLs. It is important to emphasize that while other implementation tracking efforts are being developed, projects should continue to be documented to ensure comprehensive crediting of projects and for inclusion into such tracking mechanisms once finalized.
Another useful resource for implementation tracking is the Minnesota Agriculture BMP Assessment and Tracking Tool. Designed as an interactive online database to collect and share information on agricultural BMPs throughout Minnesota, there is also a Microsoft Access version that can be easily downloaded for offline use. The data gathered and summarized in this database provides useful information that can assist decision-makers and other stakeholders on the application and effectiveness of BMPs geared towards reducing pollutant loading in Minnesota.
Watershed Restoration and Protection Strategy:
A document summarizing scientific studies of a major watershed including the physical, chemical, and biological assessment of the water quality of the watershed; impairments and waterbodies in need of protection; biotic stressors and sources of pollution, both point and nonpoint; TMDLs for the impairments and an implementation table containing strategies and actions designed to achieve and maintain water quality standards.
Sediment Reduction Strategy • January 2015 Minnesota Pollution Control Agency
50
Adaptive management The water quality goals, sediment loads, and needed reductions presented in the TMDLs can be looked at as a snapshot of a waterbody based on the best data and available science at the time a TMDL is developed. While initial local implementation planning efforts will be based on this information, it is likely that new information will be obtained, new policies and practices will become available, and lessons will be learned, all of which can influence future implementation. Incorporating flexibility and adaptability within implementation planning will facilitate more efficient and cost effective sediment reduction planning efforts over time.
Adaptive management is an approach that allows implementation efforts to proceed based on current information, including any potential uncertainties, by allowing for adjustments in response to information gained over time. The adaptive management process often begins with the implementation of initial actions that have a relatively high degree of certainty associated with their water quality outcome. Future actions are then based on continued monitoring of the impaired segments and other locations in the basins to determine how the waterbodies respond to the actions taken.
Factors that may result in the need for an adaptive management process include:
· scale of impaired reaches and complexity of sediment loading within the basins · uncertainty in achieving final goals with initial (i.e., short term) local planning and implementation
efforts · time lag between ecosystem response and some sediment reduction activities · year-to-year variability in the monitoring results · need to focus on current sources of excess sediment as well as future impacts such as changing land
use patterns, zoning and ordinance changes, and climate change A key step of adaptive management is progress assessment, which includes evaluating implementation progress in response to updated information. Figure 20 provides a flow chart that describes an example of an adaptive progress assessment process.
Case Study: Root River Field to Stream Partnership
The Root River Field to Stream Partnership was initiated 2009 as a partnership between farmers, the Minnesota Department of Agriculture, Minnesota Agricultural Water Resource Center, The Nature Conservancy, Monsanto, Fillmore, Mower and Houston County Soil and Water Conservation Districts, and academic researchers.
The Project involves conducting intensive surface and groundwater monitoring at the edge of agricultural fields and at in-stream locations. The goal of these monitoring efforts is to:
· Help improve the understanding long-term trends and relationships between farming practices and water quality
· Determine how to accurately assign losses to non-point sources · Assess the sources of sediment and nutrient losses from agriculture in southeast Minnesota and
the amount of these pollutants delivered to the watershed outlet · Determine the effectiveness of agricultural BMPs. · Evaluate effective approaches for engaging farmers with respect to water quality issues
For additional information on this Project see: http://www.mda.state.mn.us/protecting/cleanwaterfund/onfarmprojects/rootriverpartnership.aspx
Sediment Reduction Strategy • January 2015 Minnesota Pollution Control Agency
51
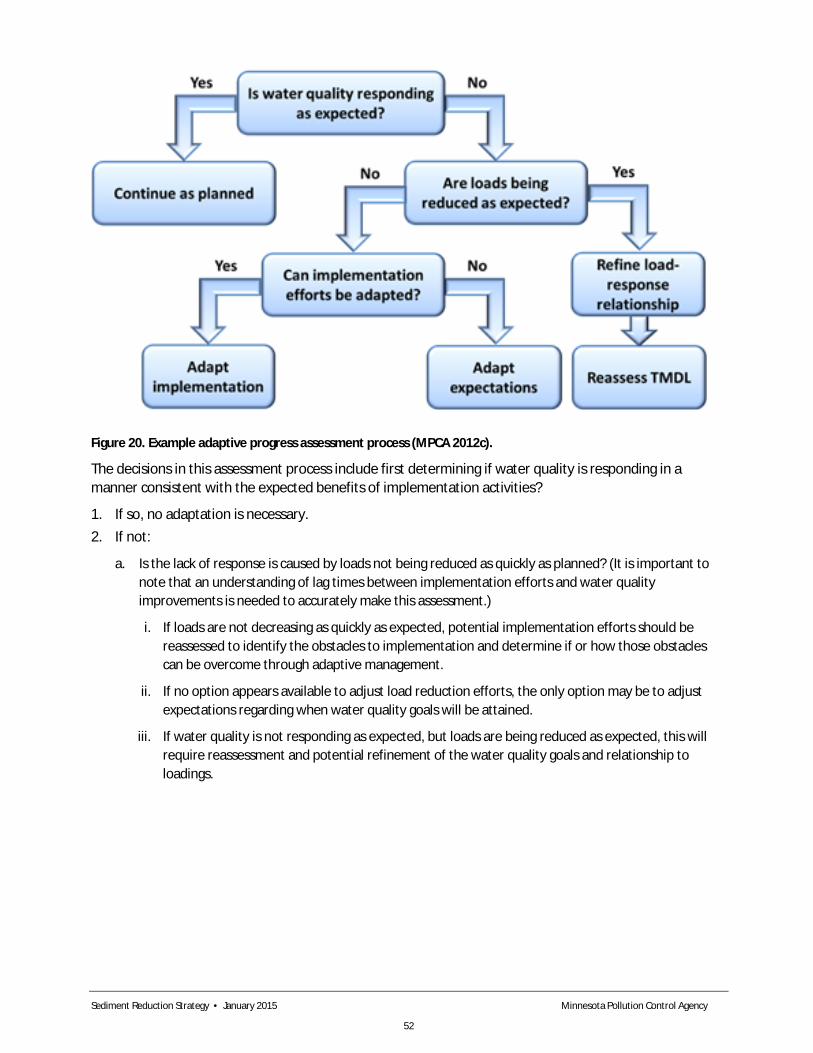
Figure 20. Example adaptive progress assessment process (MPCA 2012c).
The decisions in this assessment process include first determining if water quality is responding in a manner consistent with the expected benefits of implementation activities?
1. If so, no adaptation is necessary. 2. If not:
a. Is the lack of response is caused by loads not being reduced as quickly as planned? (It is important to note that an understanding of lag times between implementation efforts and water quality improvements is needed to accurately make this assessment.)
i. If loads are not decreasing as quickly as expected, potential implementation efforts should be reassessed to identify the obstacles to implementation and determine if or how those obstacles can be overcome through adaptive management.
ii. If no option appears available to adjust load reduction efforts, the only option may be to adjust expectations regarding when water quality goals will be attained.
iii. If water quality is not responding as expected, but loads are being reduced as expected, this will require reassessment and potential refinement of the water quality goals and relationship to loadings.
Sediment Reduction Strategy • January 2015 Minnesota Pollution Control Agency
52

References Anderson, J.P. and W.J. Craig. 1984. Growing Energy Crops on Minnesota’s Wetlands: The Land Use Perspective. University of Minnesota, Minneapolis, Minnesota. 95 pp.
Belmont P., K.B. Gran, S.P. Schottler, P.R. Wilcock, S.S.Day, C. Jennings, J.W. Lauer, E. Viparelli, J.K. Willenbring, D. Engstrom and G. Parker. 2011. Large shift in source of fine sediment in the Upper Mississippi River. Environmental Science and Technology 45: 8804-8810.
Blann K.L., J. L. Anderson, G.R. Sands and B. Vondracek. 2009. Effects of agricultural drainage on aquatic ecosystems: a review. Environmental Science and Technology 39:909-1001.
Christopherson, D. 2014. Water Quality Trends for Minnesota Rivers and Streams at Milestone Sites. Minnesota Pollution Control Agency. Document number: wq-s1-71. 56 pp.
Ellison, C.A., Savage, B.E., and Johnson, G.D., 2014, Suspended-sediment concentrations, loads, total suspended solids, turbidity, and particle-size fractions for selected rivers in Minnesota, 2007 through 2011: U.S. Geological Survey Scientific Investigations Report 2013–5205, 43 p., http://dx.doi.org/10.3133/sir20135205.
Emmons & Olivier Resources, Inc. 2011. Minnesota River Valley Ravine Stabilization Charrette. Sponsored by the Scott Watershed Management Organization and the Minnesota River Board. Final February 7, 2011. http://www.co.scott.mn.us/ParksLibraryEnv/wmo/Documents/07feb11_Ravine_Stabilization_Charrette.pdf.
Engstrom D.R., J.E. Almendinger and J.A. Wolin. 2009. Historical changes in sediment and phosphorus loading to the upper Mississippi River: mass-balance reconstructions from the sediments of Lake Pepin. Journal of Paleolimnology 41: 563-588.
EPA. 1991. Guidance for Water Quality-Based Decisions: The TMDL Process. EPA 440/4-91-001.
Gran K., P. Belmont, S. Day, C. Jennings, J. W. Lauer, E. Viparelli, P. Wilcock, and G.Parker. 2011. An Integrated Sediment Budget for the Le Sueur River Basin. Minnesota Pollution Control Agency, Minnesota Department of Agriculture, Minnesota State. http://www.pca.state.mn.us/index.php/view-document.html?gid=16202.
Gran, Karen, Patrick Belmont, Stephanie Day, Carrie Jennings, J. Wesley Lauer, Enrica Viparelli, Peter Wilcock, and Gary Parker. 2011. An Integrated Sediment Budget for the LeSueur River Basin. Final Report. June 2011. 128 pp.
Gran, K.B., Belmont, P., Day, S.S., Jennings, C., Johnson, A., Perg, L., and Wilcock, P.R. 2009. Geomorphic evolution of the Le Sueur River, Minnesota, USA, and implications for current sediment loading. in James, L.A., Rathburn, S.L., and Whittecar, G.R., eds. Management and Restoration of Fluvial Systems with Broad Historical Changes and Human Impacts: Geological Society of America Special Paper 451. http://specialpapers.gsapubs.org/content/451/119.abstract.
Gupta S., A. Kessler and H. Dolliver. 2011. Natural vs. anthropogenic factors affecting sediment production and transport from the Minnesota River Basin to Lake Pepin Report.
Hay, Chris. 2010. Agricultural Subsurface Drainage Systems: Fundamentals, Benefits and Impacts, and Design. Tri-State Agricultural Drainage Forum. Brookings, South Dakota. http://climate.sdstate.edu/water/2011DrainageForumPresentations/HayAgDrainageBasics.pdf.
Sediment Reduction Strategy • January 2015 Minnesota Pollution Control Agency
53

Kessler, A.C., S.C. Gupta, and M.K. Brown. 2013. Assessment of river bank erosion in Southern Minnesota rivers post European settlement. Geomorphology http://dx.doi.org/10.1016/j.geomorph.2013.07.006.
Lenhart, C.F., E.S. Verry, K.N. Brooks, and J.A. Magner. 2011a. Adjustment of prairie pothole streams to land-use, drainage and climate changes and consequences for turbidity impairment. River Research and Applications DOI: 10.1002/rra.1549.
Lenhart C.F., H. Peterson and J. Nieber. 2011b. Increased streamflow in agricultural watersheds of the Midwest: Implications for Management. Watershed Science Bulletin.Center for Watershed Protection, Elliot City, Maryland. 2(1): 25-31.
Lenhart, C., J. Nieber, and J. Ulrich. 2011c. Quantifying the impact of stream alteration and accelerated erosion on sediment and phosphorus load to the Minnesota River. Interim Progress Report to the Minnesota Corn Growers Association. http://www.mncorn.org/research/water-quality/quantifying-impact-stream-alteration-and-streambank-erosion-sediment-and (accessed 28 December 2013).
Lenhart, C.F., M.L. Titov, J.S. Ulrich, J.L. Nieber and B.J. Suppes. 2013. The role of hydrological alteration and riparian vegetation dynamics in channel evolution along the Lower Minnesota River. Transactions of the American Society of Agricultural and Biological Engineers 56(2): 549-561.
Lewandowski, Ann on behalf of the University of the Minnesota Water Resources Center. 2010. Review of Conservation Drainage Practices and Designs and Minnesota: Results from Focus Groups with Drainage Professionals around the State. Prepared for The Drainage Systems Management Education and Stakeholder Feedback Workshops Project. http://wrc.umn.edu/prod/groups/cfans/@pub/@cfans/@wrc/documents/asset/cfans_asset_259636.pdf.
MCES. 2014. Metropolitan Council Environmental Services. Personal communication with Hong Wang December 9, 2014. Preliminary findings.
Minnesota Board of Soil and Water Resources (BWSR). 2011. Redetermination of Benefits and Damages for Drainage Systems – An Overview Prepared in Collaboration with the Stakeholder Drainage for Drainage Authorities, Landowners and Others. http://www.bwsr.state.mn.us/drainage/DWG/Redetermination_of_Benefits_and_Damages_Brochure_Final_1-25-11.pdf.
Minnesota Department of Natural Resources (DNR). 2013. Status and Trends of Wetlands in Minnesota: Wetland Quantity Trends from 2006-2011. http://files.dnr.state.mn.us/eco/wetlands/wstmp_trend_report_2006-2011.pdf.
MPCA. 2008. Turbidity: Description, Impact on Water Quality, Sources, Measures – A General Overview. http://www.pca.state.mn.us/index.php/view-document.html?gid=7854 (Accessed: 30 December 2013).
MPCA. 2009a. Identifying sediment sources in the Minnesota River Basin. Water Quality/Basins 3.36. 2 pp. http://www.pca.state.mn.us/index.php/view-document.html?gid=8094.
MPCA. 2009b. Civic Engagement Work Group Issue Paper. Minnesota Clean Water Council. April 2009. http://www.pca.state.mn.us/index.php/view-document.html?gid=14896.
MPCA. 2011(a). Minnesota River Basin Total Maximum Daily Load Project for Turbidity.
MPCA. 2011(b). Revisiting the Minnesota River Assessment Project – An Evaluation of Fish and Invertebrate Community Progress. http://www.pca.state.mn.us/index.php/view-document.html?gid=15821.
Sediment Reduction Strategy • January 2015 Minnesota Pollution Control Agency
54
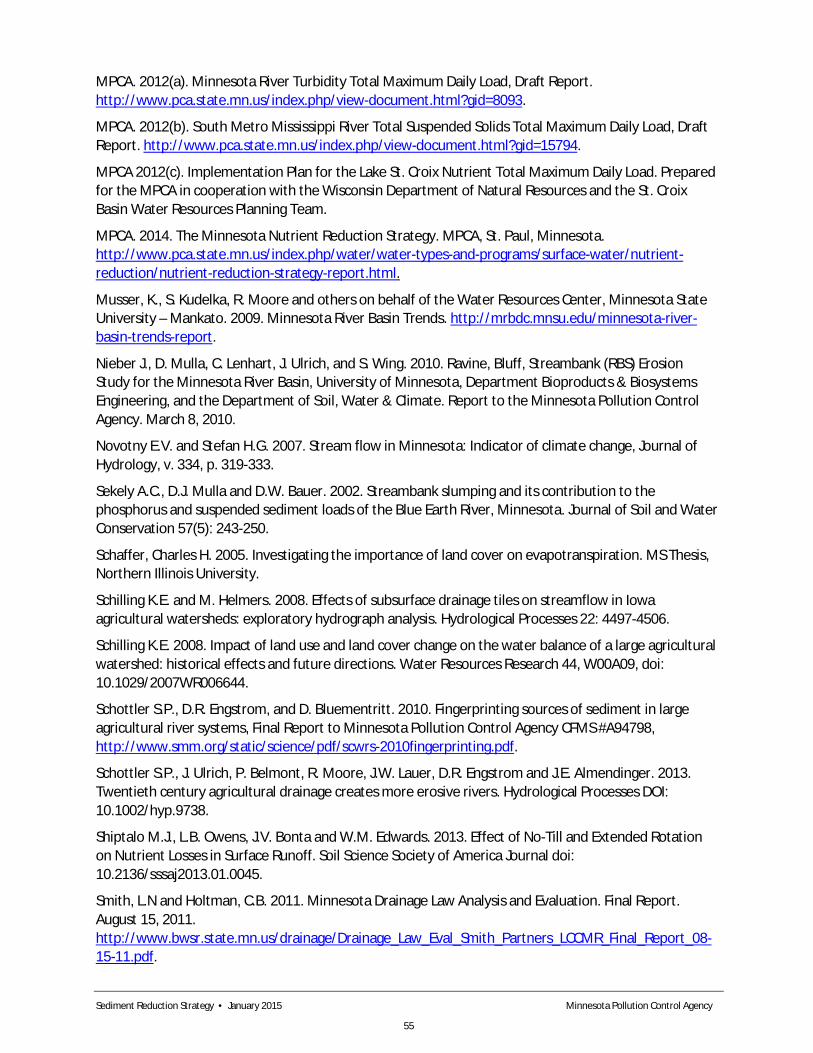
MPCA. 2012(a). Minnesota River Turbidity Total Maximum Daily Load, Draft Report. http://www.pca.state.mn.us/index.php/view-document.html?gid=8093.
MPCA. 2012(b). South Metro Mississippi River Total Suspended Solids Total Maximum Daily Load, Draft Report. http://www.pca.state.mn.us/index.php/view-document.html?gid=15794.
MPCA 2012(c). Implementation Plan for the Lake St. Croix Nutrient Total Maximum Daily Load. Prepared for the MPCA in cooperation with the Wisconsin Department of Natural Resources and the St. Croix Basin Water Resources Planning Team.
MPCA. 2014. The Minnesota Nutrient Reduction Strategy. MPCA, St. Paul, Minnesota. http://www.pca.state.mn.us/index.php/water/water-types-and-programs/surface-water/nutrient-reduction/nutrient-reduction-strategy-report.html.
Musser, K., S. Kudelka, R. Moore and others on behalf of the Water Resources Center, Minnesota State University – Mankato. 2009. Minnesota River Basin Trends. http://mrbdc.mnsu.edu/minnesota-river-basin-trends-report.
Nieber J., D. Mulla, C. Lenhart, J. Ulrich, and S. Wing. 2010. Ravine, Bluff, Streambank (RBS) Erosion Study for the Minnesota River Basin, University of Minnesota, Department Bioproducts & Biosystems Engineering, and the Department of Soil, Water & Climate. Report to the Minnesota Pollution Control Agency. March 8, 2010.
Novotny E.V. and Stefan H.G. 2007. Stream flow in Minnesota: Indicator of climate change, Journal of Hydrology, v. 334, p. 319-333.
Sekely A.C., D.J. Mulla and D.W. Bauer. 2002. Streambank slumping and its contribution to the phosphorus and suspended sediment loads of the Blue Earth River, Minnesota. Journal of Soil and Water Conservation 57(5): 243-250.
Schaffer, Charles H. 2005. Investigating the importance of land cover on evapotranspiration. MS Thesis, Northern Illinois University.
Schilling K.E. and M. Helmers. 2008. Effects of subsurface drainage tiles on streamflow in Iowa agricultural watersheds: exploratory hydrograph analysis. Hydrological Processes 22: 4497-4506.
Schilling K.E. 2008. Impact of land use and land cover change on the water balance of a large agricultural watershed: historical effects and future directions. Water Resources Research 44, W00A09, doi: 10.1029/2007WR006644.
Schottler S.P., D.R. Engstrom, and D. Bluementritt. 2010. Fingerprinting sources of sediment in large agricultural river systems, Final Report to Minnesota Pollution Control Agency CFMS #A94798, http://www.smm.org/static/science/pdf/scwrs-2010fingerprinting.pdf.
Schottler S.P., J. Ulrich, P. Belmont, R. Moore, J.W. Lauer, D.R. Engstrom and J.E. Almendinger. 2013. Twentieth century agricultural drainage creates more erosive rivers. Hydrological Processes DOI: 10.1002/hyp.9738.
Shiptalo M.J., L.B. Owens, J.V. Bonta and W.M. Edwards. 2013. Effect of No-Till and Extended Rotation on Nutrient Losses in Surface Runoff. Soil Science Society of America Journal doi: 10.2136/sssaj2013.01.0045.
Smith, L.N and Holtman, C.B. 2011. Minnesota Drainage Law Analysis and Evaluation. Final Report. August 15, 2011. http://www.bwsr.state.mn.us/drainage/Drainage_Law_Eval_Smith_Partners_LCCMR_Final_Report_08-15-11.pdf.
Sediment Reduction Strategy • January 2015 Minnesota Pollution Control Agency
55

State-EPA Nutrient Innovations Task Group. 2009. An Urgent Call to Action. Report on of the State-EPA Nutrient Innovations Task Group. http://water.epa.gov/scitech/swguidance/standards/criteria/nutrients/upload/2009_08_27_criteria_nutrient_nitgreport.pdf.
Tetra Tech. 2009. Minnesota River Basin Turbidity TMDL Scenario Report (Including information that supports the Lake Pepin Turbidity and Excess Nutrient TMDL). Prepared for the Minnesota Pollution Control Agency. 8 December 2009.
Tomer M.D. and K.E. Schilling. 2009. A simple approach to distinguish land-use and climate-change effects on watershed hydrology. Journal of Hydrology 376: 24-33.
Wang, D. and M. Hejazi. 2011. Quantifying the relative contribution of the climate and direct human impacts on mean annual streamflow in the contiguous United States. Water Resources Research 47: doi: 10.1029/2010WR010283.
Wilcock, PR, on behalf of the Minnesota River Sediment Colloquium Committee. 2009. Identifying sediment sources in the Minnesota River Basin, MPCA Report wq-b3-43, 16 pp. http://www.pca.state.mn.us/index.php/view-document.html?gid=8099.
UMN. 2002. University of Minnesota Extension. Minnesota River Basin Water Quality Overview. University, Mankato Water Resources Center, and United States Geological Survey, 2009, State of the Minnesota River: Summary of surface water quality monitoring 2000-2008. 42 pp.
Sediment Reduction Strategy • January 2015 Minnesota Pollution Control Agency
56
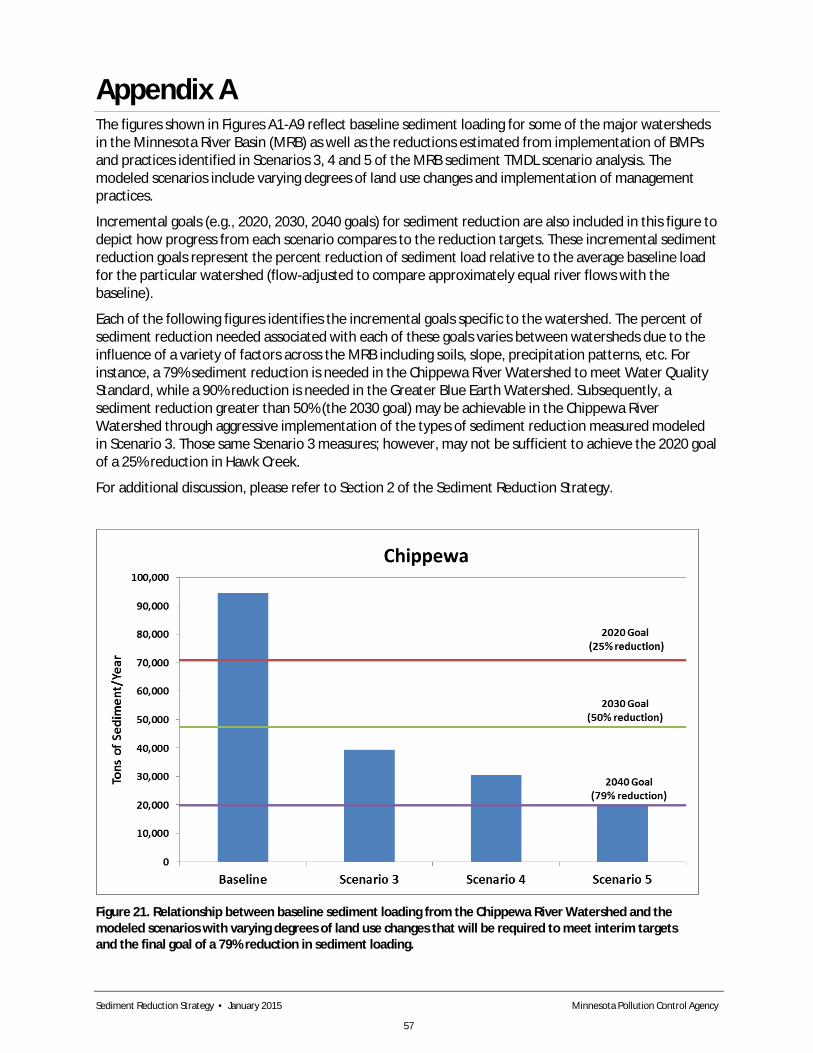
Appendix A The figures shown in Figures A1-A9 reflect baseline sediment loading for some of the major watersheds in the Minnesota River Basin (MRB) as well as the reductions estimated from implementation of BMPs and practices identified in Scenarios 3, 4 and 5 of the MRB sediment TMDL scenario analysis. The modeled scenarios include varying degrees of land use changes and implementation of management practices.
Incremental goals (e.g., 2020, 2030, 2040 goals) for sediment reduction are also included in this figure to depict how progress from each scenario compares to the reduction targets. These incremental sediment reduction goals represent the percent reduction of sediment load relative to the average baseline load for the particular watershed (flow-adjusted to compare approximately equal river flows with the baseline).
Each of the following figures identifies the incremental goals specific to the watershed. The percent of sediment reduction needed associated with each of these goals varies between watersheds due to the influence of a variety of factors across the MRB including soils, slope, precipitation patterns, etc. For instance, a 79% sediment reduction is needed in the Chippewa River Watershed to meet Water Quality Standard, while a 90% reduction is needed in the Greater Blue Earth Watershed. Subsequently, a sediment reduction greater than 50% (the 2030 goal) may be achievable in the Chippewa River Watershed through aggressive implementation of the types of sediment reduction measured modeled in Scenario 3. Those same Scenario 3 measures; however, may not be sufficient to achieve the 2020 goal of a 25% reduction in Hawk Creek.
For additional discussion, please refer to Section 2 of the Sediment Reduction Strategy.
Figure 21. Relationship between baseline sediment loading from the Chippewa River Watershed and the modeled scenarios with varying degrees of land use changes that will be required to meet interim targets and the final goal of a 79% reduction in sediment loading.
Sediment Reduction Strategy • January 2015 Minnesota Pollution Control Agency
57
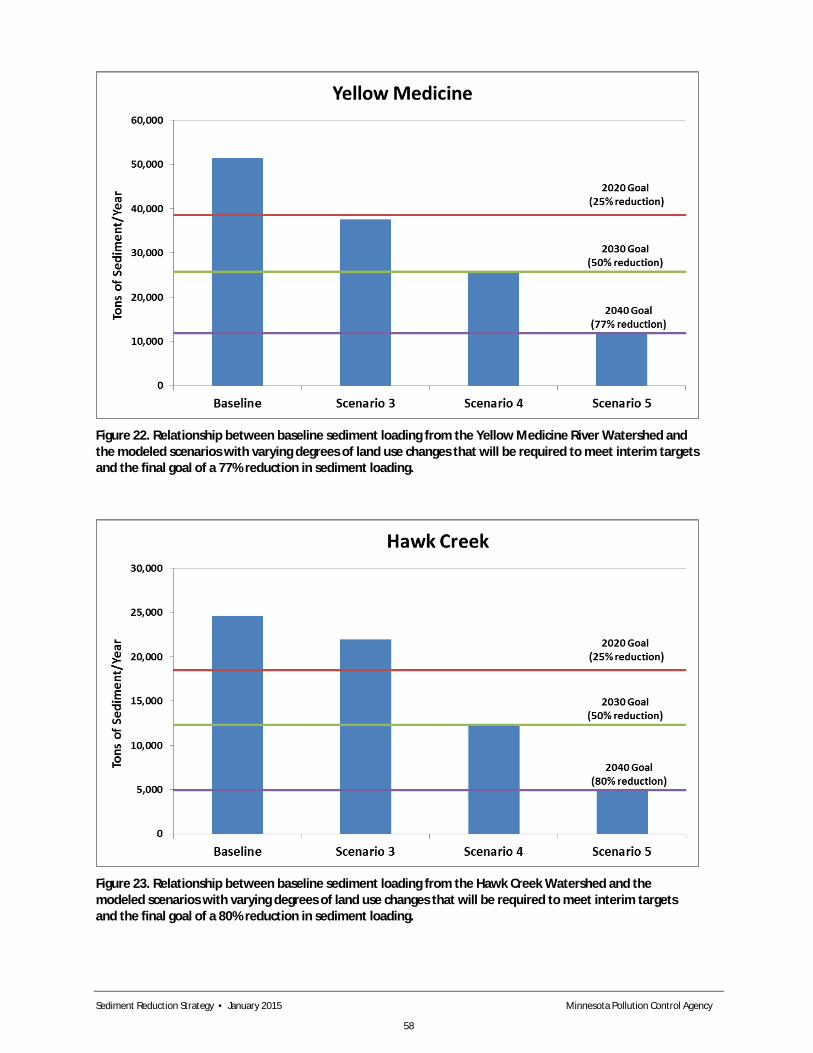
Figure 22. Relationship between baseline sediment loading from the Yellow Medicine River Watershed and the modeled scenarios with varying degrees of land use changes that will be required to meet interim targets and the final goal of a 77% reduction in sediment loading.
Figure 23. Relationship between baseline sediment loading from the Hawk Creek Watershed and the modeled scenarios with varying degrees of land use changes that will be required to meet interim targets and the final goal of a 80% reduction in sediment loading.
Sediment Reduction Strategy • January 2015 Minnesota Pollution Control Agency
58

Figure 24. Relationship between baseline sediment loading from the Redwood River Watershed and the modeled scenarios with varying degrees of land use changes that will be required to meet interim targets and the final goal of a 73% reduction in sediment loading.
Figure 25. Relationship between baseline sediment loading from the Cottonwood River Watershed and the modeled scenarios with varying degrees of land use changes that will be required to meet interim targets and the final goal of a 90% reduction in sediment loading.
Sediment Reduction Strategy • January 2015 Minnesota Pollution Control Agency
59
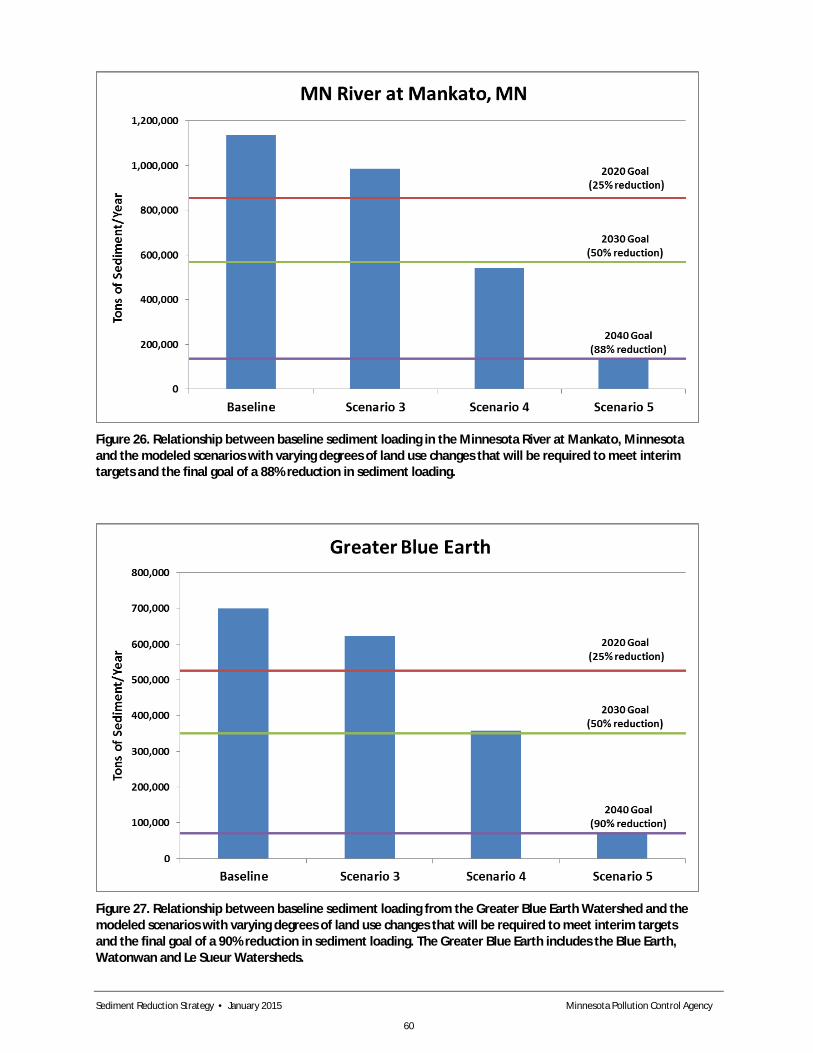
Figure 26. Relationship between baseline sediment loading in the Minnesota River at Mankato, Minnesota and the modeled scenarios with varying degrees of land use changes that will be required to meet interim targets and the final goal of a 88% reduction in sediment loading.
Figure 27. Relationship between baseline sediment loading from the Greater Blue Earth Watershed and the modeled scenarios with varying degrees of land use changes that will be required to meet interim targets and the final goal of a 90% reduction in sediment loading. The Greater Blue Earth includes the Blue Earth, Watonwan and Le Sueur Watersheds.
Sediment Reduction Strategy • January 2015 Minnesota Pollution Control Agency
60

Figure 28. Relationship between baseline sediment loading from the Watonwan River Watershed and the modeled scenarios with varying degrees of land use changes that will be required to meet interim targets and the final goal of a 80% reduction in sediment loading.
Figure 29. Relationship between baseline sediment loading from the Le Sueur River watershed and the modeled scenarios with varying degrees of land use changes that will be required to meet interim targets and the final goal of a 88% reduction in sediment loading.
Sediment Reduction Strategy • January 2015 Minnesota Pollution Control Agency
61