sediment discharge measurement and calculation
TRANSCRIPT

Sediment dischargemeasurement and calculation
Techniques for use at river gaugingstations
P Bolton
Tech Note OD/TN2September 1983


tr
Sediment discharge measurement andcalculation
Techniques for use at river gauging stations
P Bolton
Tech Note OD/TN2September 1983
E"R Wattingford
Address and Regislered Oflice: HR Watlingford Ltd. Howbery Park, Wallinglord, Oxon OX10 8BATef: + 44 (0)1491 835381 Fax:. + 44 (Ol1491 832233
R.g{$tcrcd In Endad No. 2562099. Hn Wallinglod is a wtplly M€d ilbridiary of HR Wallhgbrd Grdp Lld.

Abstract
The terms 'wash ioad', 'suspended bed material load'and 'bed load' are not clearly defined but, if applied withcare, provide a useful basis for sub-dividing the totaldischarge of sediment in a river for the purpose of measure-ment. The accuracy with which each of the three types ofsediment transport must be measured will depend on theirrelative magnitudes and on the purposes for which data arebeing collected. This paper contains a proposed programmeof measurements to be undertaken on a typical tropical river,one carrying appreciable wash load discharges and in whichthe suspended bed material discharges are large relative tothe bed load discharges, The purpose of the programme is toprovide data on the totai discharge of sediment in such a riverfor studies of catchment erosion or reservoir sedimentation.
In outline, the proposed proqramme is as follows:t) use an adequately calibrated turbidity monitor to providea continuous record of wash load concentrations;it) undertake a short intensive programme of pumpedsampling to provide information about the relationship bet-ween suspended bed material discharges and selectedhydraulic parameters (principally river level);iii) apply this relationship to recorded flow discharge data toprovide values of suspended bed material discharge over theperiod of available hydrological data; andiv) apply'empirical and theoretical methods to provide anestimate of the magnitude of the 'bed load' (includingunmeasured suspended bed material load close to the bed)relative to the measured suspended bed material load.
The theoretical basis for this proqramme is examined inthis paper. In particular, details of the assumptions made, andtheir implications, are provided, In addition, practical detailsof the field procedures and of the methods of analysis relatingto pumped sampling in such rivers are described.

Contents
I Review of sediment discharge measuringtechniques
l.l Introduction1.2 Wash load1.3 Suspended bed material load1.4 Bed load1.5 Practical consid.erations in the selection of
methods for sediment discharge measurement 6
Page
II235
2 The measurement of suspended bed materialload using pumped samplers
2.1 Selection of suitable gauging stations2.2 Sediment sampling using pumped samplers2.3 Technical and practical considerations in pumped
sampling
3 Procedures for calculating sediment dischargevalues from the results of a pumped sampling
B8
l0
u
3.13.23.33.43.53.63.73.83.9
l 4programme
Theoretical considerations 14Separation of pafiicle size fractions 17Determination of velocity profiles l7Preparation of sediment flux profiles tgCalculation of total sediment discharge in a vertical 2lDetermination of bed load discharge 22The 'total load' formula of Ackers and White 26The 'total load' formula of Engelund and Hansen 27Estimating sediment discharges over long periods 27
4 Summary of proposed sediment samplingprogrramme
5 Acknowled.gements
6 References
Data forms for use in the collection and analysis ofpumped samplesPumped sampling: field data recordPumped sampling: size analysis of sand particlesPumped sampling: summary of calculations
28
30
3l
I23

Contents (Cont'd)
Figures
I Typical record of river cross-section data
2 Derivation of sediment flux profile
3 Lrinear representation of data from Figs 2a and 2b
4 Typical sediment flux profiles for different particle sizes
5 Criteria for initial motion and suspension of sediment

c
c
c '
C
d
D
D".
F
g
i
List of symbolsA cross-sectional area at measuring stationA' coefficient in Ackers-White eguation
width of cross-section
sediment concentration at a point on cross-section (massper unit volume)
time averaged value of cturbulent component of ccoefficient in Ackers-White equation
depth of flow in a qiven vertical
representative particie size
dimensionless grain size = Dlg(r"- I)/v1ve
dimensionless fall velocity = w/lg.D (.y"-D]-%
acceleration due to gravity
water surface gradient
Von Karman constant (generally taken as 0.4)
coefficient in Ackers-White equation
coefficient in Ackers-White equation
total liquid discharge through cross-section
total sediment discharge through cross-section
gravimetric sediment flux at a point on cross-section
time averaged value of s
time averaged sediment discharge through a specifiedarea
T" water temperature
v flow velocity at a point on cross-sectionv time averaged value of vv' turbulent component of vva shear velocity : (g.d.i)% in wide open channels
il."" rne"n value of v in a verticalV mean velocity through entire cross-section
OQ.
S
S
b

w
X
vY
I S
v
e
fall velocity of particle of given size
mean sediment concentration in cross-section:.(ratio ofweight of sediment to weight of water)
distance upwards from river bed
dimensionless mobility number = v*2/[g.D (r,- l)]
parameter in expression for concentration distributionw/k.va
height of an element on the vertical (for numerical in-tegration)
specific gravity of sediment particles
kinematic viscosity of water
density of water

IntroductionI
l . lReview of sediment discharge measuring techniques
Over the past fifty years a large number of techniqueshave been developed for measuring and estimating the rate ofsediment transport* in rivers. In the USA, in particular, con-siderable effort has been given to the evaluation of suchtechniques with a view to their standardization but this work'has met with only partial success. On the one hand, the largenumber of variables which determine sediment transport rateslimits the extent to which simplifications and generalDationscan be appiied, On the other hand, unless such simplificationsand generalizations can be made, few countries could providethe necessary resources and personnel to sustain long-termprogrammes of data collection over a widespread network ofgauging stations.
In the present paper the factors which influence thechoice of sediment sampling technique are summarized, Forfurther details a largre number of references are available;see for example, Vanoni (1975). The techniques of pumpsampling offers a number of advantages over other samplingmethods and is applicable in a wide range of river conditions.Details are provided, in this paper, of a method by which con-tinuous records of sediment discharge data may be obtained,for certain gauging stations, from a short period of pumpsampler measurements in conjunction with continuous monitor-ing of turbidity.
In the measurement of sediment discharge a distinction isgenerally drawn between wash load and bed material load;although there is no widespread agrreement about the precisedefinition of these terms. Wash load comprises those particleswhich are not present in appreciable quantities in the materialof the river bed, The concentration of such particles in theflow at a given location and time is determined primarily bytheir rate of input to the river system, that is, by the erosion ofthe catchment upstream. Bed material load, the movement ofparticles which are found in the bed of the river, may be sub-divided into suspended bed material load and bed lilad. Theformer comprises particles which are lifted from the bed andare supported in the flow by turbulent eddies but which fromtime to time settle back to the bed; the latter comprises par-ticles which move by rolling or sliding in more-or-less perma-nent contact with, and supported by, the bed, In bothcateqories of bed material transport the magmitude of the sedi-ment discharge is determined primarily by the local hydraulicconditions in the channel at any given time, The difficulties
*In this paper the terms sediment transport rale and sedimentdischarge are used fairly loosely to refer to the total mass ofsediment particles, or particies of a specified size range, pass-mg a grven cross-section in a specified or implied time period.The term sediment flux is given a more precise definition: theinstantaneous or time averaged rate of sediment transport perunit area through a small element in a cross-section (units,kg/mz/s).lt is, thus, a measure of the intensity of sedimentdischarge through a point on a given cross-section.
I

Wash load 1.2
of obtaining a precise categorization of these three modes ofsediment transport are apparent in the above 'definitions'. Thecharacteristics of the three modes of transport are describedmore fully below. The principal methods of measuring theirmagrnitude are also outlined.
The most important characteristic of wash load is that,apart from small random variations, its concentration in theflow at a given location and time is uniform for all points onthe cross-section. Thus, provided that the concentration ofwash load particles can be determined at a singie point on agiven cross-section, an instantaneous value of the wash loadsediment discharge through that section can be readilycalcuiated as the product of the concentration and the meanflow discharge at the time of sampling. The flow dischargremay be obtained either directly, using a current meter, or in-directly using an existing stage-discharge relationship.
The measurement of wash ioad concentrations presentssome minor practical difficulties. In essence, the field work isextremely simple. A sample can be taken at any point in thecross-section; moreover, the sampling method is not critical.Thus, a hand.held bottle filled from the bank or from a boatprovides an adequate sample for analysis. For a true washload determination, however, the sample should contain noparticles of bed material, Since, under normal flow conditions,the concentration of suspended bed material particles at thewater surface is very low this condition is generally ensuredby takingr a surface sample. Nevertheless, it may benecessary in some situations to remove bed material particlesfrom the sample before the concentration of wash load par-ticles is determined. One way in which this may be done is bysieving out particles larger than a given size..Attempts have,therefore, been made to link wash load with a specific ranqeof particle sizes. As yet there is no concencus as to whetherthis can be achieved within the general 'definitions' of washload given above although most writers assume that wash loadlargely comprises the silt and clay fractions (all particles lessthan, say 63pm). The only reliable method of providing a con-tinuous record of wash load sediment discharge is by a con-tinuous programme of sampling since wash load is supplydependent and, therefore, cannot be correlated with otherhydraulic parameters such as river stage. For this reasonvarious automatic sampling systems have been developedwhich are capable of obtaining samples at specified intervals.Such systems require ready access to laboratory facilitiescapable of analysinq large numbers of samples,
The use of turbidity monitors provides an indirect methodof measuring wash load which is of particular benefit inremote areas where access to laboratory facilities is difficult.In addition, since the output can be recorded in digrital formby a data loggdng device, continuous automatic operation ispossible. Thus, provided that adequate precautions are takenin the calibration and operation of such monitors, a continuousrecord of sediment concentrations can be obtained. The prin-cipal difficulty in the use of turbidity monitors is that the
2

Suspended bedmaterial load 1.3
calibration is sensitive to particle size. In practice this is ad-vantageous for recording wash load by itself because, as Fish(1983) has shown, turbidity monitors are virtually insensitive tosand particles unless their concentration is very high. Thus,provided that the monitors are located in a part of the flowwhere suspended sand concentrations are low, an indicationof wash load concentration may be obtained. Fish (1983) pro-vides practical details of the calibration and use of turbiditymonitors.
In contrast to wash load particles, suspended bedmaterial particles are not uniformly distributed across a givencross-section of the flow: variations in sediment concentrationsoccur in both the vertical and horizontal directions, In the ver-tical direction concentration profiles occur which show max-imum vaiues close to the bed falling to small or negligiblevalues at the water surface (see Figure 2a). The differencebetween the maximum and minimum concentration in a givenprofile depends, amongst other factors, on the particle sizespresent. Por this reason, it is generally preferable to recordthe concentration of separate size fractions rather than thetotal concentration of suspended bed material. However, to dothis would require a sampling method which could provide asufficiently large sample, from a selected point on the cross-section, for accurate particle size analysis to be undertaken,Moreover, samples would be required at a sufficient numberof points to enable concentration profiles to be drawn in boththe horizontal and vertical directions. The difficulties of under-taking such a comprehensive programme of sampling on aregular basis and of undertaking the laboratory analysis of thesamples obtained are considerable. Few programmes have,in practice, achieved these objectives.
The different types of sampiing device which have beendeveloped for measuring suspended bed material transpofirates are described in various references; see, for example,Graf (i971), p 368-379.
The simplest cateqory of sampler is the instantaneoussampler. A device of this type encloses a volume of water at aselected location and allows it to be withdrarnm from the riverwithout contamination or loss for subsequent analysis, Suchsamples can give reliable values of sediment concentration ifthe sampler has been carefully desigrned. The sedimentdischarge can be calculated from velocity data obtained byusing a current meter at the same location, The principal dif-ficulty in using instantaneous samplers is that the sample sizeis generally small (typically l-2 litres). Since the concentra-tions of sand particles in various size fractions are, in mostcases, relatively small, accurate particle size analysis basedon such samples is difficult to achieve. Also, the values ofsediment concentration obtained will show fluctuations due tothe effects of turbulence in the river, Multiple sampling wouldbe necessary if a representative mean value were required.

The alternative category of sampler is the integratinglsampler. The principle of such samplers is that the flow entersin a controlied manner through a restricted opening or nozzle.The sample is, therefore, taken over a period which typicallyvaries from a few seconds to several minutes depending onsampler characteristics and flow conditions. In the majority ofcases the sampler is desigmed to ensure that its intake velocityis equal to that of the river flow at the selected location. Suchsamples may be used in one of two ways. A point-integrratedsample is one which is obtained by operating an integratingsampler at a single point in a cross-section, The sampler has avalve system to enable it to be lowered to the required posi-tion before sampling begins and to be sealed, once samplingrhas ceased, before being raised to the surface. Provided thatthe intake velocity is equal to the stream velocity the samplewiil provide a direct measure of the mean sediment dischargeat that point during the sampling period without the need tomeasure stream velocity. A minimum sampling period ofabout a minute would be necessary to eliminate the effect ofturbulent fluctuations, see Sub-Committee on Sedimentation(1963), p 50. A depth-integrated sample is one which is obtain-ed by lowering an integrrating sampler at a constant ratethrough the flow. The sampler may be immediately raisedonce the bed is reached, again at a constant rate, thusavoidinq the need for the provision of a valve system in thesampler. The sample obtained comprises the sedimentdischarged during equal time intervals at each level in theflow. It therefore provides a measure of the total sedimentdischarge through the vertical section during the period ofsamplinq. The mean discharge rate through the vertical maybe calculated from the mass of sediment collected and themean samplingr time, However, since the intake velocity maynot equal the stream velocity, due to the vertical componentprovided by the motion of the sampler, it is usual to determinethe mean flow velocity in the vertical by current meter and tomultiply it by the concentration of sediment in the sample toobtain the sediment discharge rate. A depth-integratingsampling procedure reduces the number of samples to beanalysed since only one sample per vertical is required. Onthe other hand the sampling interval at a given elevation onthe vertical is short. As a result, concentration fluctuations dueto turbulence in the river are not eliminated and repeatsamples may be necessary. Moreover, the results do notallow concentration profiies for different particle size-fractionsto be obtained.
As with the majority of instantaneous samplers the prin-cipal disadvantage of integrrating samplers is the smali size ofsample obtained. In addition, the limitations of various types ofsampler, particularly in respect of the flow conditions anddepths in which they will operate, together with certain prac-tical considerations of their operation restrict the sites in whichthey can be used. A Variation of the typical integratingsampler has been developed to overcome the first of theseproblems. In such samplers, of which the Delft bottle is an ex-ample, the sample passes from the intake nozzle into a wide
4

Bed load 1.4
chamber where the reduction in velocity causes sedimentpafiicles to settle out allowing sediment-free water to bedischarged. In this way sediment from a much larger sampleof water can be collected. In general the water does not re-main sufficiently long in the sampler for wash load particles tosettle out and it is, therefore, not necessary to make aseparate calculation of wash load if suspended bed materialload by itseif is required. However, as with other integratingsampiers, the accuracy of the result relies on several impor-tant assumptions about its mode of operation and extensivelaboratory tests are required to validate any results obtained.In the case of the DelTt bottle it has been found that its efficien-cy in trapping suspended sediment is a function of both parti-cle size and hydraulic conditions. It is, therefore, necessary toapply suitable correction factors to the results obtained,
Pumped sampling can be regarded as a variation on thetechnique of integrated samplinq. In a pumped sampler an in-take nozzie extraets a sample from the flow at a knovm loca-tion and in a controlled manner. A pump draws the samplefrom the nozzle to a container in which it is collected foranalysis or to a filter unit through which it is passed. Thesystem is, therefore, far more versatile than other integnatinglsamplers and, in particular, samples of almost any size can becollected if required, It is for this reason that HydraulicsResearch, Wallingford, has employed pumped samplingtechniques in many of its investigations of suspended bedmaterial transport rates in rivers and estuaries over the lastdecade, Further details of the technique are presented in Sec-tions 2.2 and 2.3, The procedure for caiculating suspendedbed material flux from the results of a sampling programme isdescribed in Sections 3.i-3,6,
Since the rate of transport of suspended bed material isgoverned by hydraulic processes the results of a samplingprogramme over a limited period may be used to investigatethe form of the relationship between sediment discharge andother known variables so that estimates of sediment dischargeover longer periods can be made from records of thosevariables. Such a procedure is described in Section 3.9
Of the three categories of sediment transport under con-sideration the measurement of bed load presents the greatestdifficulties, The problems arise partly from ambiguities in thedefinition of bed load and partly from the practical difficulty ofinvestigating processes which are occurring within a few parti-cle diameters of the river bed. A number of practical dif-ficulties, related to these basic problems, are likely to besigmificant in any programme of field measurements. Firstly, itis very difficult to assess the degree to which the presence ofa sampler disturbs the bed load transport processes. Second-ly, many samplers trap not only bed load but also somesuspended bed material load or stationary particles scoopedfrom the channel bed. Thirdly, the presence of bed forms af-fects certain types of sampler by preventinq them from lyingin a horizontal position in contact with the bed. Forthly, where
Practical consider-ations in the
selection of methodsfor sediment
dischargemeasurement
bed forms are present the rate of bed load transport varies ina longitudinal direction across the profile of the bed form and,therefore, care must be taken to ensure that samples takenrepresent the mean rate of transport. Fifthly, the position ofthe bed may undergo dramatic changes during the passage ofa flood, either in a lateral or vertical direction, which com-plicate bed load measurements. Sixthly in bed load transportthe velocity of particles is likely to be smaller than that of thesurrounding fluid, For this reason it is incorrect to determinethe transport rate from the product of sediment concentrationand flow velocity, Finally, bed load transport need not belimited to the top layer of particles on the bed; there may be aslow downstream movement of other particles iying deeperwithin the bed. Descriptions of different types of bed ioadsampler and discussions of their specific limitations may befound elsewhere; see, for example, Graf (1971), p 358-368.
It is beyond the scope of the present paper to discuss themethods of bed load measurement in any further detail. It isintended that the methods of sediment discharge measure-ment described in this paper should be applied only wherethe bed load transport rate is smali relative to the total load. Inqualitative terms, significant vaiues of bed load discharge arelikely to be associated with the following factors: low values ofsuspended bed materiai discharge; large sizes of bedmaterial, say, mean diameter greater than 2mm; uniformdischarges in which flood surgres do not carry a sigrnificantproportion of the annual total; and flow in wide shallow chan-nels in which turbuience is low. In quantitative terms,estimates of the rate of bed load discharge may be widelyvarying and, in many cases, meaningrless. The calculation oforder of magnitude values from 'total load' estimates based ontwo well known sediment transport formulae is described inSections 3.7 and 3.8, but such results require careful inter-pretation.
1.5 In view of the difficulties involved in measuring sedimenttransport rates in natural channels and the considerable ex-pense involved in undertaking elaborate programmes of sedi-ment transport measurement it is important that careful con-sideration be given to the objectives of any field investigationbefore its implementation. Ideally, one might first wish todetermine what level of accuracy would be tolerable in theresults if they are to be used for a given purpose and to selecta sampling procedure which would meet this requirement,Unfortunately, sediment sampling methods have not beenstudied in sufficient detail to provide a quantitative assessmentof their accuracy, The sampling efficiency of many differenttypes of sampler have been tested in laboratory flumes butthe results of such tests may not be applicable under the more

varied conditions found in natural rivers, In addition, the pro-blems of using a finite number of measurements to prediit thesediment discharge across an entire cross-section, includingthe region close to the bed, and to predict sedimentdischarge over a continuous period prevent reliable estimatesof the level of error from being made. Compared with otherhydrological and hydraulic parameters the level of error inmeasuring and estimating sediment transport rates is, in anycase, likely to be high. For example, in comparingrthe use ofsediment transport formulae for the estimation of sedimenttransport rates from hydraulic parameters, against measuredsqdiment transport rates over a variety of flow conditions,White, Miili and Crabbe (1973) found ihat, even with the mostreliable formula tested, the ratio of calculated to observedvalues lay outside the range 0,5 to 2.0 for over 30% of theirdata.
Although optimization of sediment discharge measure-ment and calculation procedures based on quantitativeassessments of error may not, at present, be possible, variousqualitative factors could have a considerable influence overthe choice of samplinq method depending on the purposes forwhich the data are required. Practical reasons for which sedi-ment discharge data may be required include the following:a) To predict rafes of reservoir sedimentationL,oss of capacity due to sediment accumulation may pose asigrnificant hazard to the future operation of a reservoir pro-ject. In order to assess the hydrologicai changes caused bysedimentation and to evaluate the economic costs of resultingrchanges in the output of a project, it is necessary to determinethe mean rate at which such loss of capacity is occurring.Measurements of sediment transport rates in tributary rfuers,undertaken for this purpose, should provide information onsedimentation rates and also identify the principal sedimentsource areas, Measurements can be restricted to those parti-cle sizes which would be deposited in the reservoir. Thus, incertain cases where the trap efficiency of the reservoir is low,it is adequate to monitor the suspended bed material and bedlo^ad transport rates. In other cases, where the large capacityof the reservoir ensures that a high proportion of sedimentparticles are trapped, measurement of wash load is also re-quired. Indeed, if initial investigations indicate that bed ioadand suspended bed material load together represent only asmall proportion of the wash load, even at high flows, the ac-curate determination of wash load becomes paramount.Under whatever conditions, the accuracy required of thesampling programme will depend on the rate at which sedi-ment accumulation is occurring in the reservoir and themagitude of the economic cost which such loss of capacityrepresents.
b) To determine rates of catchment erosionDetailed information about rates of soil erosion from specificcatchments is required in order to assess the factors which
2
fulection of suitablegau€nng stations 2.1
influence agricultural productivity and environmental conser-vation and to identify areas of particular erosion hazard. Forthis purpose it is desirable to monitor the total sedimentdischarge from a given catchment using techniques similar tothose applied to the measurement of sediment inflow to reser-voirs with hiqh trap efficiencies. Thus, as indicated above, it issufficient, in certain cases, simply to measure the wash load ifthis is knornm to constitute the bulk of the discharge, In othercases bed load and suspended bed material load must alsobe measured. Unfortunately, it is rarely possible to relaterates of catchment erosion directly to economic factors and itis, therefore, difficult to provide economic justification forundertaking an elaborate sampling programme for a catch-ment investigration, Nevertheless, the results of such work maybe of far-reaching importance in regiohs in which acceleratederosion would threaten the future livelihood of large popula-tions.
c) To provide information about channel morphology
Knowledge of the morphoiogrical behaviour of alluvial rivers isrequired when river regulation for flood control or navigationis undertaken or in the desigrn of engineerinq structures suchas bridgres. For these purposes, measurement of wash loadwili be unnecessary but accurate measurements of bed loadand suspended bed material load should be made. Field in-vestigations will be desigmed, primarily, to obtain sufficient in-formation to provide a reliable basis for calibrating anynumerical or physical models of the channel behaviour whichmay be undertaken, The cost of such investigations can fre-quently be included within the budget of a specific project,
The measurement of suspended bed material load usingpumped samplers
In any programme of sediment sampling in a river thechoice of grauging station has an important effect on the resultsobtained. Since in the measurement of sediment discharge thedistribution of flow velocity is important, gnridelines for theselection of liquid discharge gauging stations are relevant,see ISO 748 (1979). However, because sediment concentrationprofiles are very sensitive to unsteady flow conditions, evengreater care must be taken in the selection of the site than fora liquid discharge gauging station. The principal factors totake into consideration in the selection of a suitable gauqingstation are as follows:
a) The gauging station should be located at a point wherethe flow is uniform and unidirectional, that is, in a straight sec-tion of the river. For liquid discharge gauging stations it hasbeen suggested that the channel should be straight for adistance of at least five channel widths upstream of the stationand two widths downstream, see USDA (1979) p i7l. For sedi-ment gauging these distances should probably be increasedby a factor of two or three to ensure that stable concentration
profiles have been fully developed. Thus, ideally, in a riverlOm wide, a straight channel reach over 150m long would berequired, In practice this may be difficult to achieve.b) A straight channel reach is required not only to enableaccurate current metering to take place and to ensure that theconcentration profiles are fully developed but also to enableaccurate measurements to be made of the water surface gra-dient, This parameter is important in defining the hydrauliccharacteristics of the channel for theoretical analysis. Arealistic value of water surface grradient can only be obtainedif the channel is straight, free from constrictions such asbridge piers and free from rapids, jumps or sills. Water sur-face gnadient is measured either directly using an engineer'slevel and staff or by recording the difference in elevation oftwo accurately levelled gauge posts positioned a knowndistance apart along such a reach. Since, by these methods,elevation can only be read to the nearest Smm, a differencebetween upstream and downstream levels of over 50mmwould be required to give an erlror of under l0%. Thus, if themean gradient is, say 500 x 19-ti (0,05%), the horizontaldistance between the measuring sites must be at least i00m toprovide this level of accuracy,c) The sediment sampling site should not be immediatelydownstream of a major tributary or of an area of bank erosionsince in either case large inputs of sediment may occur which,for a considerable distance downstream, would be unevenlydistributed in the flow.d) The cross-section at which sampling takes place shouldhave a uniform shape and should not contain excessivegrowths of vegetation either at the banks or in the channel.e) In the past it has been recommended that natural reachesoi turbulent flow or artificially created turbulent flumes be us-ed for sediment measurements because the turbulence throwsbed load particles into suspension thereby making it un-necessary to determine separately bed load discharge andsuspended bed material discharge. This procedure has anumber of disadvantages and cannot be generally recom-mended for present purposes. Firstly, although bed materialparticles will be in suspension they will not be uniformlydistributed so that the labour of sampling at various levels inthe vertical and of computing the total dischargre is not reduc-ed. Secondiy, because the flow is very turbulent, samplingtimes must be increased to obtain mean values of concentra-tion. Moreover, the possibility of introducing significant errorsby calculating sediment flux as the product of mean velocityand mean concentration at a given point is increased, Thirdly,there may be a significant concentration gradient along theprincipal direction of flow in which case it would no longer becorrect to ignore this factor in the general equation of sedi-ment continuity which forms the basis of sediment dischargecalcglations, see Section 3.1. Finally, it is unlikely that areliable value of the water surface gradient can be obtainedfor a short turbulent reach of chann-el,
f) Although all the above considerations are important in theselection of sediment sampling sites, it is likely that two prac-tical considerations will overshaddow these in the final choiceof location. Firstly, it is of considerable advantage to use anestablished river gauging station not only because variousitems of equipment will already be deployed and thedischarge relationships will have been studied but alsobecause the hydrological records which have been collectedwill be used in the interpretation of the results of the sedimentmonitoring proqramme. Secondly, whether or not an existingrstation is used, accessibility will be an important factor to con-sider especially if largle numbers of samples have to betransported from the station to a laboratory elsewhere.
Sediment samplingusing pumped
samplers 2.2 The principle of pumped sampling is straight forward. Anozzle is introduced into the river flow at a predeterminedposition, This nozzle is connected by a pipe to a suction pumpwhich, when operated, draws water through the nozzle at aconstant rate. The required volume of the sample is collectedat the outlet of the pump, To sample at different points on across-section a sinqle nozzle may be moved between thepoints or, alternatively, a number of nozzles may be usedeach in a fixed location. Pumped samples have been used toprovide small bottie samples at regular intervals using anautomated system. The chief advantage of pumped samplers,however, is their ability to provide large samples from whichreliable values of sediment flux for different sand sized par-ticles can be obtained, Since large samples are difficult totransport it is preferable to filter the sample in the field or, atleast, to allow the sample to stand long enough for the sand tosettle out of suspension in order that the bulk of the water canbe decanted back into the river.
The following outline illustrates a possible sampling pro-cedure using a filter, comprising a large container whosebase is formed by 60rrm nylon mesh* suitably supported frombelow:
a) Attach the pump to the tube leading from the nozzle andbegin pumping. If the pump being used is not self-primingor the lift is too great for self-primingrto occur an alter-native method of priming may be required, see Section2.3 .
b) Allow the pump to run for a minute or so to flush traces ofprevious samples from the system and to establishuniform flow in the pipe. During this time the sample runsto waste.
c) Introduce the filter into the sample stream to collect thesediments and, at the same time, start timing with stopwatch A.
*Strictly speaking 63pm mesh should be used but nylon meshof this gauge is not commercially produced in the UK.
IO

d) Continue to collect the sediment until a sufficient quantityhas been obtained, The time for this will depend on themean sediment concentration in the stream as well as thedepth of sampling - sdrnples taken closer to the bed hav-ing higher concentrations than those near the surface.Sampling is likely to continue for at least five minutes.
e) While the sediment collection is proceedingr, measure therate of pumping using a container of known capacity anda second stop watch, B. A discharge measurement shouldbe made in this way two or three times during samplingand the mean value obtained. Together with the totalsampling time, from stop watch A, this mean pumpingrate wili provide a value of the total volume of water pass-ing througrh the filter, This, in turn, provides values ofsediment concentration from the mass of different particlesizes collected on the filter.
f) Also while the sediment collection is taking place collectbottle samples of the filtered water for subsequentanalysis in a laboratory to determine the wash load con-centration
g) If possible, a current meter should be positioned in theflow adjacent to the intake nozzle in order that the meanstream velocity during the period of sampling can bemeasured. If this is not possible, an estimate of velocitycan be obtained by other means, see Section 3,3.
h) Carefully transfer the collected sediment from the filter toa sample container for transport to the laboratory. Ifnecessary the particles should be flushed with clearwater from the filter to the container to ensure that noneare Ieft on the filter, The sample containers, together withthe botties containing filtered water for wash loadanalysis, must be clearly labelled and adequately sealedto ensure that the results can be identified correctly andthat no part of the sample is lost in transit.
Technical andpractical consider-ations in pumped
sampling 2.3 Although in outline the above pumped sampling pro-cedure is straight forward a number of technical and practicaldifficulties arise which must be fully considered if such a pro-gramme is to provide useful results:a) The velocity of flow in the pipe should be sufficiently highto prevent particles from falling out of suspension alonghorizontal sections of the pipe. For a given size of pipe thevelocity required depends on the concentration of sedimentand, to a lesser extent, on the size of particles beingttransported. Experimental work reported by Crickmore andAked (1975) suggests that with l3mm diameter pipe, providedthe line velocity exceeds lm/s, no sediment deposition willoccur. Their tests were, however, limited to particle sizesbelow 0.3mm and concentrations below 600ppm by weight.
l l

If larger particle sizes or, more importantly, higher concentra-tions than these are being sampled it may be necessary toconsider whether higher line velocities should be used.Similarly, if larger pipe. diameters are to be used a higher linevelocity may be required,
b) The filter should be sufficiently large to pass the samplevolume at the pumping rate selected even when the filter hascollected an appreciable quantity of sediment. If this is notpossible it will be necessary either to introduce a pressurefiitration system or to store the whole sample in a barrel forsubsequent filtration or until particles have settled out ofsuspension.
c) Care may be necessary in choosing the type and positionof the pump to be used. For a given pipe diameter the pump-inq rate needed to produce a line speed of over im,/s isreadily calculated, For example, using pipe of internaldiameter l3mm a pumping rate of jusf under 150 x I0-6m3/s,that is 9 l/min, gives a iine speed of over lm,/s. From pumpcharacteristics data supplied by the pump manufacturer themaximum head over which a given pump can produce thisdischarge can be found. In most cases, however, the pumpwill be capable of operating over a greater head as a forcepump than as a suction pump since, in suction, the pump islimited to a maximum pressure of one atmosphere. This limita-tion, rather than the pump capacity, generally provides theprincipal constraint in the desigm of a pumped samplingsystem. Thus, in any system, the maximum suction head whichcan be provided is less than l0m. This includes both the statichead, the difference in elevation between the lowest riverlevel and the Fumpr as well as the head loss due to friction inthe pipe. For PVC pipes of about 20mm internal diameter thefriction head loss is likely to be over 0,Im/m at line speedsabove lmls, If calculations indicate that a pump working insuction cannot provide the necessary lift and flow rate it willbe necessary to use submerged pumps located near the noz-zle, These also overcome another problem which arises withsuction pumps, that of priming the pumps at the start of eachsampling period. Even with self-priming equipment it issometimes necessary to provide an auxillary hand-operatedvacuum pump to fill the sampling pipe with water when thetotal head to be overcome is large.
d) It has always been considered that an important factor inthe design and operation of depth and point integratingsamplers is to ensure that the intake velocity of the samplethrough the nozzle is equal to the stream velocity, If this isachieved it eliminates the need to provide a separatemeasurement of stream velocity since this can be calculatedfrom the sample volume, nozzle diameter and sampiing time.It has also been suggested, see Nelson and Benedict (l'951),that unless the two velocities are similar the samplers will notprovide reliabie values of sediment concentration. The reasonfor this is that sampling at a velocity other than the streamvelocity causes streamlines to curve either inwards or out-wards in the vicinity of the nozzle. Larger particles fail to
T2

follow these streamlines with the result that if the intake veloci-ty is lower than the stream velocity the concentration of largerparticles in the sample is grreater than in the stream and if theintake velocity is higher their concentration is lower than inthe stream. In respect of pumped sampling, Crickmore andAked (1975) found that even with large differences betweenthe intake and stream velocities the effects of sediment con-centration are insigmificant. On this basis they concluded thatneither intake velocity nor noule orientation are critical for ac-curate pumped sampling. This conclusion enabied them toadopt a relatively simple sampling procedure without theneed to match the samplinglrate to the measured streamvelocity at each location, However, the results on which thisconclusion was based were obtained ffom flume tests per-formed on sediment with a maximum particle size of 0.25mm.It is unlikely to be true for particle sizes significantly iarger.On the other hand, the sampling characteristics of a given noz-zie can be assumed to be consistent so that, provided thesampling efficiency for different particles sizes has been ex-amined in the laboratory under different stream and intakevelocities, it would be possible to derive a set of coefficientswhich could be applied to measured concentrations of givenparticle sizes in order to obtain their true concentration.
e) In many cases the principal difficulties in undertakingsediment discharge measurements by pumped sampler arisein the desigm of apparatus for introducing the nozzles into theriver flow. Standard apparatus for current metering based onwading rods, cableways or boats, as appropriate, can beadapted for such work. However, the need for a shore-basedpump, when using hand-held wading rods or cableways, cailsfor long pipe runs and carefully co-ordinated operation, In thisrespect the use of a boat may be preferable provided that on-board pumping and filtration can be achieved. In deep fast-flowing rivers, where current metering would normally beundertaken by cableway or boat, the size of ballast weight touse with a pumped sampling nozzle would be rather largerthan that used with a current meter by itself. The reasons forthis are that the pipe from the nozzle increases the stream'sdrag on the apparatus and that wtth pumped sampling it iseven more important than with current metering that thesuspension cable should be as near as possible to the verticalin order that the height of the nozzle above the bed can be ac-curately determined. To overcome the difficulty of accuratelypositioning a nozzle and current meter within a few cen-timetres of a river bed different desigrns of 'bed frame' havebeen developed. These are open structures, resting on thebed and positioned using a boat mounted winch. Nozzles maybe rigidly attached to the frame or to a motor driven carriagewhich can be raised and lowered between the bed and thetop of the frame. The principal disadvantages of such framesare their weight, the difficulty of manipulating them from aboat and the possibility that, unless carefully desigmed, theframe will disturb the flow pattern in its vicinity, For sedimentdischarge measurements at a single site a further possibility
t3
ev
Theoreticalconsiderations 3.1
is to use a permanent structure fixed in the bed of the river.Such structures may be used in rivers which experiencemarked seasonal differences between low flow and high flowconditions; the installation could take place in the dry seasonand, provided that the structure has been adequately design-ed, samples could be obtained even in peak flood conditionswhen sampling from a boat would be hazardous if not impossi-ble. The disadvantages of fixed structures are that nozzles canonly be located in a relatively small number of predeterminedpositions, most probably in a single vertical section, and thatthere are considerable problems in designing a structurewhich can withstand the forces of drag and debris impactwhich arise in peak floods without modifying the nature of theriver bed during construction or causing local regions ofscour to occur in floods. As with bed frames, the influence ofthe structure on the hvdraulic behaviour of the river must beconsidered.
f) A more fundamental difficulty arises in the use of fixedstructures for the measurement of sediment discharge. InIaterally constricted alluvial channels dramatic changes mayoccur in the elevation of the bed duringr the course of a flood,Leopold, Wolman and Miller (1964), p 228-230, recorded bedscour of the order of 2m in the Colorado and San Juan riversas a result of flood discharges and indicated that far highervalues occur in some rivers. However, there is no theoreticalmethod currently available of estimating what the extent of thescour might be at a particular site. For this reason, previousrecords of channel behaviour in floods would be of con-siderable value in desigming a sediment sampling structure.Consideration of the effects of scour and deposition isnecessary not only in the desigm of the structure but also inthe interpretation of the results obtained since the calculationmethods described below require that the distance of thesampling nozzle above the bed be accurately known. In suchcircumstances it may be necessary to install an echosounderon the structure to record the local elevation of the bed. Thiswould also provide information about the movement of bedforms (ripples, dunes and antidunes) along the channel if asufficiently accurate system were used.
Procedures for calculating sediment discharge valuesfrom the results of a pumped sampling progrramme
In all standard procedures for calculating sedimentdischarge values from field data it is customary to apply twoimportant simplifications to the general equation of sedimentcontinuity in the channel. Firstly, it is assumed that a steadystate condition has been reached; that is, that at the selectedcross-section concentration and sediment flux values are notvarying with time. Clearly, these values do vary with time butthe rate of change is qenerally considered to be small and tohave a negligible effect on sediment discharge calculations.This assumption will be invalid in rivers which carry heavy
I4

sediment loads in short duration floods but even in such casesthe errors introduced by neglecting temporal variations maybe small compared with those which arise because of the dif-ficulties involved in undertaking any form of sampling undersuch conditions. Secondly, it is assumed that the concentrationgradient in the direction of flow is negligible. As indicatedabove, this assumption depends in part on the selection of thesampling station. In situations in which steady state conditionscannot be assumed to apply there may also be a significantconcentration grradient along the stream.
The motion of sediment particles in a river is generallydescribed by a single equation of continuity in the direction ofthe flow. Particles will, in reality, be continuously settling tothe bed, However, under the two foreqoing assumptions, theremoval of particles should be exactly matched by theirreplacement as a result of turbulent eddies which carry freshmaterial from the bed into the flow. Yet even in 'steady state'conditions, the flow velocity and sediment concentration at aspecific location will show short term fluctuations due to tur-bulence. These fluctuations add further complications in thecomputation of sediment flux, The effects are shownalgebraicly below.
Consider the water and sediment passingrthrough a smallelement, on the cross-section under study, and having instan-taneous velocity v and instantaneous sediment concentration,c (mass per unit volume). It is assumed that the water andsediment particles travel at the same velocity, an assumptionwhich is unlikeiy to be valid close to the bed. The instan-taneous sediment flux, s, per unit area, passingrthrougth theelement is given by:S = V , C
Writing velocity and concentration as their time averagedmean values, v and c, together with a varying turbulent com-ponent, v'and c', the instantaneous sediment flux is given by:s=(v+vXc+c)
Integrrating this expression over time to obtain the meansediment flux through the element qives:
s = v .c + J (v ' . c )d t + c . Jv 'd t + v . Jc 'd tBy definition the last two integrals both equal zero.
However, the integrral of v' . c'with respect to time is likely tohave a non-zero value unless the fluctuations in velocity andconcentration are exactly in phase with each other. Unfor-tunately, it is not at present possible to measure the fluctua-tions which occur in a natural river with sufficient accuracy toquantify the integrral although, in many cases, it is thought tobe relatively small, For this reason, most writers consider it tobe sufficiently accurate to calculate the steady state, timeaveraged, sediment flux through a small element as:S = V . C
l 5
This expression, which is widely used as the basis forsediment flux caiculation procedures, depends on the variousassumptions indicated above whose effects cannot, at present,be quantified. In the absence of further information it will alsobe used in the present paper.
Consider, next, a vertical element in the chosen cross-section of unit width and of height, d, (the flow depth). Withinthis element the value of s varies with the distance, y, from thebed of the channel. The total sediment load, S, passingthrough this element, on the same assumptions as above, isgiven by:
dS: [ * v .cdv
"Y^ i n
It should be stressed that it is the product of velocity andconcentration which is integrrated. The mean velocity, obtain-ed by integration of velocity over depth, is readily calculatedfrom the results of current meter measurements but to attemptto use this value to calculate sediment load by multiplying itby the mean concentration and depth is incorrect*. Pro-cedures by which S can be calculated are described in Sec-tions 3,3-3.5. Using pumped sampler measurements it ispreferable, although not essential, to consider the sedimentload in different particle size fractions. The manipulation offield data to separate the particle sizes is, therefore, describ-ed in Section 3.2,
So far the calculation procedures described have beenapplicable only to the calculation of the sediment load per unitwidth through a single vertical on the chosen cross-section. Inan initial pumped sampling programme it may be necessaryonly to sample in a single vertical in order to provide informa-tion about the relative magnitudes of the different modes oftransport, However, if a more precise evaluation of the totalload is required measurements will be required in severalverticals since significant changes in sediment flux are likelyto occur across the cross-section. It is beyond the scope of thepresent paper to discuss the number and location of addi-tional sampling verticals since this will depend on the specificcharacteristics of the cross-section under study and thedegree of accuracy required in the result. Further work is re-quired before such recommendations can be made. Where asingle vertical is used the value of its results for predicting thetotal sediment load in the cross-section will be enhanced if thesection is of fairiy uniform depth with steep banks and if thechosen vertical is located within the middle third of thd sec-tion,
*Such a procedure would be correct if the mean concentra-tion were obtained by using a depth-integrating sampler asdescribed above, The reason for this is that such devices pro-duce a sample with a "discharge weighted" mean concentra-tion as opposed to the "spatially weighted" mean concentra-tion which is obtained by integrating concentration overdepth.
I6

Separation of particlesize fractions 3.2
Determination ofvelocity profiles 3.3
The proposed sampling procedure requires considerationt9 be given to separate particle size fractions. The principaldivision to be made is between sand particles (> 63pm) andsilt and clay particles (< 63pm). Samples of the material pass-ing through a 63pm sieve are analysed to give the silt and clayconcentration. It has been assumed that this represents washload and is uniform across the flow. The assumption may beverified by comparing the concentrations obtained at differentnozzle locations and, if found to be valid, a sinqle mean valueof silt and clay concentration may be calculated from all thebottle samples obtained on each sampiinq occasion, see FormPl. This value should be used to verify simuitaneous turbiditymeasurements in order that future discharges of wash loadcan be based on a continuous turbidity record and a con-tinuous record of liquid discharges, To calculate the dailydischarge of wash ioad, mean concentration readings are ob-tained from the turbidity record at, say, hourly intervals. Meanriver gauge levels at the same intervals are obtained, using anautomatic chart recorder, and from these the liquiddischarges may be calculated using a previously determinedstage-discharge relationship. The dlscharge of wash load, in agiven interval, is then calculated as the product of correspon-ding values of mean concentration and mean liquid dischargle.The results are integrated over a twenty-four hour period toprovide a value of the daily discharge of wash load. It shouldbe noted that the choice of time interval has a major influenceon the accuracy of the final result. Where concentrations anddischarges are rapidly fluctuating it may be necessary toadopt an interval shorter than an hour whereas in more stableconditions longer intervals may be adequate. Trial calcula-tions will assist in choosing the appropriate interval in a givensituation.
The proposed procedure also requires the separation ofdifferent sand fractions, see Forms P2 and P3. For each posi-tion of the sampling nozzle in a griven vertical the concentra-tions of separate sand fractions are calculated by dividinEr thedry mass of particles of each size fraction by the total volumeof the sample. These values are used to produce concentra-tion profiles for the calculation of sediment flux values in agiven vertical as described below, However, in order to ob-tain these sediment flux values a velocity profile in the verticalis also required.
When pumped sampling is being undertaken from a boator cableway it is relatively simple to fix a current meter closeto each nozzle intake position and thereby obtain a directmeasurement of the time averaged velocity at each depthsampled. Such values may be used directly to calculate thesediment flux at each depth, see Form P3, or may be plottedas a velocity profiie for graphical analysis as describedbelow. However, in strong flow where it has been decided tolocate sampling nozzles on fixed structures which remain
T7

submerged for long periods it would not be practicable to at-tach current meters since access for inspection andmaintenance, especially during the highest floods, would beimpossible. In such cases it might be possible to measurevelocity head by using the sampling nozzles as Pitot tubesalthough care would be needed to ensure that misalignmentof the nozzles or increased fluid densities caused by highsediment concentrations did not lead to spurious results. Alter-natively, velocity profiles can be derived from theoretical con-siderations. The velocity distribution generally adopted is alog-normal relationship based on the Karman-Prandtl equationfor velocity distribution in a vertical for steady flow in a broadstraight channel over a rough bed. This gives the time averagf-ed velocity, v, at distance y above the bed, as:
Vaf = {^.o, +
o- iln (y/d) + 1l
where
Vl,,""is the mean of v over the depth;
va is the 'shear velocity' : 1g,d,i)%;i is the water surface gradient; and
k is the Von Karman constant = 0.4,
This equation has been found to provide qood correla-tions with observed velocity distributions in relatively clearflow under a wide variety of conditions although sigmificantdifferences have occurred in certain cases*. Furthermore, theequation cannot be applied close to the bed since it gives v =0 at a finite distance, yo, above the bed and increasingnegative values of v if y values less than y" are used. Never-theless, for the purposes of the present calculations the in-troduction of more complicated functions would not bejustifiable,
The procedure by which a velocity profile is obtainedfrom the Karman-Prandtl equation is as follows,
a) From the stage-discharge relationship for the gauginq sta-tion the total discharqe, Q, corresponding to the observedgauge reading, is caiculated.
b) From the cross-sectional profile of the station, see Fign:rel, the cross-sectional area, A,'of the flow at the observedgauge reading is measured.
*The presence of sediment is known to affect the proposedlog-normal relationship, see Yalin and Finlayson (1972), but theextent to which such changes would affect the calculated sedi-ment flux values for a given sediment concentration profilecannot at present be fully determined. It is, therefore, assum-ed that the effect can be ignored except close to the bed.
l8

Preparation ofsediment flux
profiles 3.4
c) The mean velocity, V, througrh the section is calculated asQ/A,It is assumed that this value may be used as thevalue of G."" in a verticai located towards the centre ofthe river provided that the section is sufficiently wide anduniform,
d) The value of va is computed from the depth and surfacegradient of the flow,
e) For selected values of y the corresponding values of vcan now be calculated using the equation above. If thevalues of y used are identical to those at which samplingnozzles are located the calculated velocities can berecorded on a single table alongside sediment concentra-tion values, see Form P3.
The calculation of sediment discharge rates from theresults of a pumped sampling proqramme is best undertakenby a combination of graphical and numerical methods as il-lustrated by Form P3, and Figures 2, 3 and 4. Figure 2c showsa typical profile of time averaged sediment flux values, s, ob-tained by multiplying time averaged concentrations, c, Figure2a, with time averaged velocities, v, Fignrre 2b, at each depth.In general it is not necessary to draw the concentration andvelocity profiles since the sediment flux profile can be deriv-ed directly from data on Form P3. However, sediment fluxprofiles are required for each particle size fraction greaterthan 63pm, see Figure 4.
A major problem in deriving total sediment dischargerates from sediment flux profiles is the difficulty of estimatingsediment flux values below the lowest level at which samplinghas occurred. Sediment concentrations increase very rapidlywith decreasing values of y and reach the limiting value cor-responding to loose-packed sand grains at the bed itself. Atthe same time, decreasing values of y produce decreasingvelocities which fall to zero when the bed is reached. The pro-duct of the two parameters gives rise to a sediment flux pro-file which has a maximum value close to the bed but falls tozero within the bed itself. Whether sediment flux is zero at y= 0, however, depends on the chosen definition of the datumfor the y axis, The choice of a suitable datum is complicatedboth by the bedforms which are present and by the move-ment of particles beneath the top layer of the bed. Thus, ifsediment flux has been measured to within 0.3m of the bed, asin Figure 4, there are considerable problems in predicting itsform between this level and the bed. Because of the rapidchanges which occur in sediment flux in this region it wouldbe most unwise to attempt to extrapolate the curves of Figrure4 by eye, The following analytical approach is offered as asounder basis for extrapolation despite its significant short-comings.
l o
a) It is assumed that the velocity profile adheres to theKarman-Prandtl equation in the region of extrapolation. Thus,if velocities have been measured directly, the available datamay be plotted on log{inear axes, see Fignrre 3b. On theseaxes the Karman-Prandtl equation results in a linear plot sothat a straight line fitted to the measured data can be used forextrapolation. Where velocities were not measured directlybut were computed following the procedure in Section 3.3,that same procedure may be used to obtain addition valuescloser to the bed. There are limits to how close to the bed theKarman-Prandtl equation may be applied. Firstly, as mention-ed above, the equation is physically unrealistic close to thebed since it gives negative velocities below a certain level, y,(y" = 0.5mm in the case of the data given in Figrure 3b).Secondly, the equation is valid only for clear water. Sigmificantdeviations from predicted velocities are likely to occur in theheavy sediment concentrations close to the bed, Thirdly,close to the bed sediment particles will not be travelling at thesame horizontal velocity as the water with the result that thesediment flux cannot be calculated using the stream velocity.(The point at which sigrnificant differences become apparentbetween horizontal velocities of sediment and water providesa possible boundary condition to distingruish bed load fromsuspended bed material load but it is not clear how this mightrelate to other 'definitions' of bed load, Moreover, the condi-tion cannot be ciearly defined, except in probabalistic terms,nor can it be readily measured in actual flow conditions).Finaily, if bed forms are present the value of y at which thisboundary occurs would vary with time as the bed forms movethrough the section,b) Of the various empirical and theoretical formulae prop-osed to describe concentration profiles the most widely usedis that based on diffusion theory. Unfortunately this theorydoes not enable absolute values of concentration to be com-puted but gives concentrations of particles of a given sizerelative to their known concentration c", at a distance y : gfrom the bed, as:
- rd-v a ;zc = c o \ ; - . d _ a /
where
t = w,/k ua depends on flow conditions and particle sze;and
w is the fall velocity of the sediment particles.
This relation gives a linear plot, on log-log axes, of(d-y)/y against c, see Figrure 3a. Again, the equation is notvalid close to the bed since fall velocity is no longer indepen-dent of concentration at high concentrations and the differen-tial equation for diffusion also becomes invalid close to aboundary, The equation has been compared with empiricaldata, for a minimum value of a = 0.05d, and has been found togive reasonably accurate results. This is generally taken as
20
Calculation of totalsediment discharge
in a vertical 3.5
the limiting value at which the theotetical relationship cansafely be applied (for the data in Figures 2, 3 and 4, 0.05 d :0.15m). To apply the relationship to field data a straight line isfitted to the data on a loglog plot and values of c extrapolatedfor the required values of y. Since the theoretical curve is be-ing used to extrapolate measured values it may be worthwhilestudyurq alternative distributions to determine whether theywould provide curves which fit the data as well or better thanthe one given above. In particular, there might be some meritin using the simpler relationship proposed by Lane and Kalin-ske (1942) which reduces to the formln (c/c") : -62 t(y/d) + alThe advantage of this formula, if it is found to fill measuredvalues sufficiently closely, is that it gives a linear relationshipwhen c/c"(ar simply O is plotted aqainst y/d on logr-normalaxes. This is easier to plot than the previous expression,However, for illustrative purposes the previous expression isused in the diagrams and discussion within this paper,
c) If direct evidence is available on the mean height ofripples or dunes on the bed this may be used to define thesafe limit to which velocity and concentration profiles be ex-trapolated. In all other circumstances the limit y : 0,05 dshould be used initially. The sediment flux profile should beextended from the lowest measured levei to this limit by ex-trapolation as described above, Values are obtained fromgraphs similar to those in Figure 3, recorded in the lower partof Form P3 and the calculated sediment flux values includedon the profiles, see Figures 2c and 4,
The sediment flux profiles for different particle sizesshould be integrated over y from the chosen minimum ievel,y-i,, to y = d to provide the total discharge per unit width ofeach particle size within the vertical. These values, togetherwith the previously calculated value for wash load discharqe,are recorded at the foot of Form P3. The integration may beperformed either by use of a planimeter or by numerical in-tegnation. A suitable method of numerical integration for thedata of Figure 2c is as follows:
a) The depth over which the integration is to be performedis split into an even number of equal elements; for exam-ple, eight.
Integration depth : d- ynrn : 3.05 - 0.15: 2,90m
Height of one element,6 : 2.90 = 8 = 0.3625m
b) The points marking the boundaries between theseelements are marked on the sediment flux profile andcorresponding values of s are noted.
y(m):
i lksr /mzls) : i .94; 1.03; 0.75; 0.55; 0.38; A.27;0.19; 0.14; 0.12
2 I

Determination of bedload discharge 3.6
c) The integnation is performed using Simpson's rule' If thevalues of s are referred to as q, s2.,....,s", the integral iscalculated as;
.d1J;,"=dy : t . d t(sr + s") t 4(s, + s-{ +..,. .+ s,-,)
+ 2(S, + Ss +. . . . . .+Sn_r)J
- 0'3-625 rt e4 + 0,r2) + 4(1.03 + O.ss + 0.zr + 0,r4)$
t ' t '^ ' "
+ 2(0.75 + 0,38 + 0,19)l: i.53 kg/m/s
Thus, the sediment discharge per unit width between y :0.ISm and the surface in the vertical represented in Figmre 2cis 1.53 kg/m/s.
Integrations performed as the profiles shown in Figure 4demonstrate the important influence which the unmeasuredzone has on the total sediment discharge. This influence ismost pronounced with the largest particle sizes. For example,the integrral between y : 0.i5m and y : 0,30m as a percen-tage of the total integrral from y = 0.I5m to the surface for thevarious particle size ranges were as follows:
0.067 - 0,074mm, I2o/o;0.074 - 0. I05mm, I4o/o',0.105 - 0, i45mm , 220/oi0,145 - 0,201mm,390/o;0.201 - 0.297mm,620/0.
Such figures indicate that, for large particle sizes, valuesbased on extrapolation into the unmeasured zone may bevery unreliable. This is related to the fact that bed loadtransport is of increasing siqnificance as particle size in-creases. Clearly, if the sediment discharge below the chosenlower limit of integration is large relative to that calculated inthe integration itself the sampiing and calculation proceduresproposed in this paper would be of limited value. It is,therefore necessary to develop some means of judging therelative magmitude of the bed load discharge,
The problem of determining what, exactly, constitutes thebed load has been discussed in Sections 1.1 and 1.4, For thepresent purposes the value required is not that correspondingto any theoretical or empirical definition of bed load butrather the fraction of the total load which has not been includ-ed in the measurements of wash ioad and suspended bedmaterial load described above, It is likely that this value willbe higher than the 'true bed load', however defined, becausethe arbitrary lower limit of integrration adopted in Section 3.4will, in most cases, exclude part of the suspended bedmaterial load from the calculation of S,
22

No method of estimating bed load has proved sufficientlyreliable even for order of magrnitude calculations, to be ad-vocated for general use, It is, therefore, advisable to apply anumber of different methods and to compare the results.Suitable methods may be categorised into three major groups.The first group includes various methods which do not pro-vide quantitative values of the bed load transport and are,therefore, referred to as qualitative methods. The secondgroup inciudes 'bed load' formulae which purport to providevaiues of bed load directly. The third group uses 'total load'formulae to provide values of bed load as the difference bet-ween calculated 'total load'* and measured suspended bedmaterial load.
A number of qualitatirre approaches to estimating the im-portance of bed load are described below:
a) An indication of whether bed load discharge is likely tobe important may be obtained from the generalcharacteristics of the river at the section under study,Relevant features are listed in Section 1.4.
b) A number of such characteristics have been incorporatedinto empirical tables for estimating the importance of bedload; see, for example, the classification prepared byMaddock which is presented by Vanoni (i975) p 348.
c) Measurements on the sediment flux profiles of Fignrre 4may indicate the conditions under which bed loadbecomes significant. For example, if the area of the rec-tangle in the unmeasured zone, formed by the co-ordinates of the lowest extrapolated point on each curveand the two axes, is expressed as a percentage of the in-tegral of s from y-;, to the surface the following values arefound for given particle sizes.0,067 - 0.074mm, ITo/oi0.074 - 0.105mm, 200/oi0 .105 - 0 .145mm,3Io /o i0.145 - 0.2iOmm, 490/o:0.210 - 0.297mm, I02o/0.
Althougrh this approach requires further investigation it isclear that with larger particle sizes, where the area of therectangle is comparable with that of the integral, 'bedload' discharge will be significant. Whether the total 'bedload' discharge is significant will then depend on therelative contribution of the larger particle sizes to the totalsediment load.
*The term 'total load' is misleading since it does not, in thecontext of such formulae, include the wash load.
23
d) Criteria have been proposed for determining thehydraulic conditions under which particles of a given sizewill begin to move as bed load and suspended load. Thepresentation of various criteria in grraphical form byWhite, Milli and Crabbe (1973), Vol 2, based on the workof Engelund, is shown in Figure 5. In this figure twocriteria for initial particle movement in the bed (indicatedby Y") and two criteria for the initiation of suspension (bas-ed on the dimensionless fall velocity, F, of the Rubeyequation) are shown on a plot of mobility number, Y,against dimensionless grain size, Dr,, where:
Y = v*z/le D (r,- l)l;
D"' = D[g (r"- I)/vzl%; and
D is a representative grain size,
7" is the specific gravity of the particles, and
v is the kinematic viscosity.
Values of z may be obtained using the Poiseuille expres-sion:
v(rnmz/s) = 1.79x l$/(l + 0.03368T" + 0.000221'1.2)
where T. is temperature in oC.
The criteria in Fignrre 5 may be applied by determiningthe values of Y and D' under observed flow conditions ata particular site using various bed material sizes. In thisway a series of points is obtained. These form a line, gra-dient : - 1.0, across the graph. From this Iine it is possi-ble to estimate the particle sizes at which bed loadtransport and suspended bed material transport wouldbegin, for the given flow conditions, and by comparingthese sizes with the results of analyses of bed materialsamples an indication of th.e relative importance of bedload and suspended bed material load is obtained, Thecalculation should then be repeated for different flowconditions,
e) Another possible criterion for establishinq whether bedload is likely to predominate for a given particle size is toconsider the curvature of its concentration profile asdefined by the parameter z : w/kvx. If w is gxpressed interms of the Rubey equation w : FlgD(7"- I)17'z then
z : F/kYh
This criterion can then be related to the expressionsshown in Figure 5, In particular, the upper criteria defin-ing the initiation of suspended bed material load given byY : 1.0F2 and Y : 0.7225F2 correspond to z = 2.50 and z: 2.94 respectively. From this it can be seen that asmaller value of z, say z < L,0, may be used to indicatethe point at which suspended load is likely topredominate over bed load, Further study of the transportprocesses would be required before such a value could
24
be used with confidence. Even then some means of ap-plying it to sediments of mixed size would be necessary.The use of 'bed load' formulae to provide quantitative
results is not, in greneral, recommended, At first sight such for-mulae appear to offer advantages over the use of 'total ioad'formulae because they provide values of bed load directlyrather than as the difference between the two numbers whichmay be considerably larger than the result. However, theyhave two major disadvantages. Firstly, since there is nogenerally accepted definition of what constitutes bed load thequantity calculated is unlikely to correspond to the 'definition'of bed load which is adopted in a qiven study. This will beespecially true with the method of sediment measurement pro-posed in this paper since 'bed load' has been rather arbitrari-ly defined as the part of the load which has not been includedas wash load or suspended bed material load. Secondly, thebed load formulae in common use have been shown, byWhite, Milli and Crabbe (i973), to give results which appearunrealistic when compared against measured sedimenttransport rates. The report referred to compared computedsediment transport rates with measured values of 'total load'.Thus, with formulae which are intended only for use in predic-ting bed load transport it would be expected that calculatedand observed values show close agreement only for data inwhich particle sizes are large; where 'total load'will largelycomprise bed load, For smaller particle sizes the calcuiated'bed load' should be less than the observed 'total load'. Of thelarge number of specifically 'bed load' formulae tested byWhite, Milli and Crabbe only the original Einstein bed loadformula of 1950 performed in this way, If a 'bed load' formulais to be used, therefore, this appears to be the one likely togive the most sensible results. However, in view of the pro-blems arising from the difficulty of defining bed load, the in-clusion of details of this formula in this report was not con-sidered worthwhile. Details may be seen in numerousreferences (see, for example, Graf (197i) p 139-i50). Careshould be taken to avoid confusion with the Einstein total loadformula, the Modified Einstein formula and the Einstein-Brownformula.
The use of 'total ioad' formulae as a means of estimatingbed load, for a measured suspended bed material load, offerssome improvement over the use of 'bed load' formulae.Nevertheless, this approach should be applied with extremecare since the most reliable 'total load' formulae are likely togive results which differ from the true values over the range+ 100% to -50%, Where the suspended bed material loadislarger than the bed load then the bed load is determined fromthe difference between two larger numbers. Computed valuesmay then differ by several orders of magnitude from the truevaiues, or may even be negative, as a result of errors in the'total load'. Where the bed load is larger than the suspendedbed material load the use of 'total load' formulae is likely togive more dependable resuits provided that the total load for-mulae are applicable in such conditions, Details of two 'totalload' formulae are given below.
z5
The 'total load'formula of Ackers
and White 3.7 Of the formulae tested by White, Milli and Crabbe (1973)the one which gave predicted sediment transport rates whichagreed closest with empirical data was that of Ackers andWhite. This formula relates a non-dimensional sedimenttransport parameter , G",,to a non-dimensional 'sediment
mobility' parameter, Fa,, ds follows:
Gr, = C(F",/A'- l)-
The formula is based on physical considerations but includescoefficients which are chosen to provide correlation with em-pirical results, For full details of the formula and its applicationsee Ackers and White (1973). A brief description of the rele-vant parameters is provided below within a structuredcalculation procedure.
a) Determine the value of D", for a 'typical' sample of bedmaterial such that:
D"' : D[g(r"- L)/v2]h
D, the representative grain size is based on the results of aparticle size analysis and is generally taken to be D35; that is,the diameter below which 35% of the sample, by weight, lies.
b) For D", > 60 take the values of the following coefficientsAS:
n :0 .0A ' :0 ,17m = 1 .5C = 0.025
For60 > Dr, > I
n - I - 0.56 logtoD,,A ' : 0 ,23 (D, ) -n + 0 . I4m :9 .66 /D" ,+1 .34logro C : 2.86 logro D", - (logro D")2 - 3,53
The coefficients n and A'have physical meaning, n relating tothe position within the transition zone between very large (D"'> 60) and very small (D"" ( 1) particle sizes and A'beinq theFroude number at initial motion.
c) The mobility number is calculated as
Ft g r -
lgD(r,- 1)lY'
v *I v r t -n'5.657 Iogro ( iOd/D)'
where V is the mean velocity through the cross-section.
Other parameters are defined elsewhere in this paper.
d) G' is calculated using the formula given at the beginningof Section 3.7.
e) The mean sediment concentration by weight in the cross-section is given as:
26

The 'total load'formula of
Engelund andHansen 3.8
Estimating sedimentdischarges over
long periods 3.9
x = Q-:-! 1I yCt
'V1 '
From this the total sediment discharge rate through the cross-section is gdven as:Q"=X,V.A,ewhere q is the density of water.
In view of the complexity of the Ackers and White for-mula preference is sometimes expressed for the formula ofEngelund and Hansen which performed only marginally lesswell in the tests undertaken by White, Milli and Crabbe. TheEngelund and Hansen formula may be expressed as
\ , 0,05 , ?" .V . v*3^ :_
d ,92 .D( r , - l ) ,In this case it is specified that the value to use for D is Duo, themedian particle diameter. The principal weakness of the for-mula, according to White, Milli and Crabbe, is that itoverestimates transport rates when dischargres are low.
The methods proposed in this paper for calculating thedischargles of suspended bed material load and bed load onthe basis of field measurements are intended for use in an in-tensive programme conducted over a relatively short period.It is intended that the results of this programme be used forestimating bed material discharqes over a long period on thebasis of available data, principally recorded gauge boardlevels. For this purpose a correlation should be sought bet-ween discharges calculated from the intensive programmeand gauge board levels. In investigating this relationship it isessential to specify whether instantaneous values ordaily/houriy mean values are to be used. If it is found that thecorrelation is poor alternative methods of prediction could betried. These migrht be based on various total load formulae.Strict application of such formulae would not normally bepossible since one of the parameters usually required, watersurface gradient, is not widely available unless levels fromtwo gauge boards, located close to each other, have beenrecorded. However, it may be possible to estimate suitablevalues on the basis of the field measurements undertaken.The degree of accuracy which should be sought in estimatingdischarge rates wili depend on the relative importance ofbed material discharge against wash load and on the pur-poses for which the data are resuired.
27

Summary of proposed sediment sampling progrramme
The following summary lists the principal components ofthe proposed methodology and indicates the sections in thispaper, or other references, in which further details are to befound.
t) Establish the objectives of the study and determinewhether the total sediment discharge is required orwhether one mode of transport, say bed ioad discharge,should be given priority. Also, if possible, determine thelevel of accuracy which would be required to fulfil theobjectives (Section 1.5), The following procedure appliesto situations in which the total sediment discharge is re-quired and bed load discharges are relatively small.
iD Select a suitable site at or close to a river gauging stationwhere a functioning water level recorder exists or couldbe installed (Section 2,1).
iii) Survey the chosen cross-section using the gauge boardzero as the datum for elevations (Figure l).
iv) Establish a reliable stage-discharge relationship for thecross-section by measuring the flow velocity at differentriver ievels. Standard current metering techniques shouldbe used for this althougth if high velocities are experienc-ed, the use of current meters may be difficult and hazar-dous. In such situations other methods, such as float track-ing, might be necessary. It should be noted that somesections show unstable stage-discharge relationships. Ifthe changes are long-term it may be adequate to re-determine the relationship periodicaily but if significantshort-term changes occur the site would not be suitablefor the proposed sampling programme,
v) Establish a continuous programme of wash load measure-ment by installinq a recording turbidity monitorpreferably on a near-by structure such as a bridge. Themonitor head should be located at a position in the flowsuch that it is as far from the bed as possible but will besubmerged at all times. It should also be protected fromlight. From initial observations an estimate of the max-imum concentration of wash load likely to occur in theriver is made. Using this value as the upper limit of theworking range, calibrate the monitor using samples ofIocal silt obtained, for example, from downstream reser-voir deposits. It is assumed that the sand concentration atthe head is low and that it will, therefore, have no effecton the turbidity monitor, Thus, only wash load concentra-tions will be recorded. If subsequent results from thepumped sampling programme indicate the possibility ofhigh sand concentrations around the head some adjust-ment to the calibration may be necessary. Similarly if theorganic content of the wash load is high simple calibrationprocedures may be inadequate. The turbidity monitormust be regularly maintained; once a week the head
28

vi)
should be checked for algae growth, and if necessarycleaned, and the batteries should be re-charged. Arecalibration should be undertaken once a month (Section1.2 and Fish (1983)). From the turbidity monitor record,wash load discharges may be calculated (Section 3.2).The values obtained may be verified against the results ofsimultaneous pumped sampling results.
Select a suitable method for locating pumped sampiingnozzles at several levels on one or more verticals in thechosen cross-section (Section 2.3). The nozzle positionsrelative to the bed should be accurately known; the noz-zle positions should be more closeiy spaced near the bedwhere the concentration gradient is grreatest. If possible,a method of measuring the flow velocity at each of thenozzle positions should be incorporated into the samplingprogramme. Pumped samples should be obtainedthrough the nozzles at fairly regular intervals for a periodof, say, three months (practical details are discussed inSections 2.2 and 2.3). It is necessary, for the success ofthe proposed method, for sampling to be undertakenunder the widest possible range ol hydraulic conditions,During periods of relatively constant discharge it wouldnot be worthwhile sampling more frequently than once aday but during flood peaks sampling should be under-taken more frequently. Using a single pump the samplingproqramme for a sinqle vertical will take about tenminutes per nozzle, that is, about an hour for six nozzles. ifthe flow is changing rapidly sigrnificant changes may haveoccurred in this period. In such circumstances accuratesampling can only be achieved by using additionalpumps to allow simultaneous sampling from severalnozzles. Samples are passed through a 63pm filter, theparticles retained on the filter being analysed for particlesize distribution and the material passing the filter beinganalysed to provide a value for the wash load concentra-tion (Section 3.2).
From the results of the particle size analysis prepare con-centration profile data for each selected particle size frac-tion in a given vertical. The profiles may be extendedbeiow the lowest measured level, if necessary, by fittingcurves based on theoretical distributions (Section 3.4). Asingle velocity profile is also prepared for each verticalon each sampling occasion. These profiles are derivedeither from direct flow measurements or from atheoretical relationship using a value for the mean veloci-ty obtained from the stage-discharge curve, Thetheoretical relationship is also used to provide values ofvelocity at ievels below the lowest measured in caseswhere direct measurements have been taken (Section3.3).
Sediment flux profiles are obtained by calculating theproduct of concentration and velocity at selected levels inthe vertical (Section 3.4 - the assumptions on which thiscalculation are based are discussed in Section 3.1). The
vii)
viii)
29
ix)
lowest level to which the concentration and velocity pro-files may be extrapolated may be determined fromknowledge of the bed forms or, as an initial limit, thevalue Y^ro = 0.05d may be used. The sediment dischargerates of given particle sizes through a vertical are obtain-ed by integrrating their respective sediment flux profilesbetween y-," and the surface (Section 3.5). The sum ofthese rates, together with the wash load, provides a valuefor the total discharge rate, above the ievel y-,,, in agriven verticai.
If nozzles are attached to fixed structures a study of thebehaviour of the river bed under different hydrauiic con-ditions should, if possible, be undertaken, This is becausethe presence of bed forms or the occurrence of large-scale changes in bed elevation during the passage offloods would change the distance from the bed of thesamplinq nozzles which, in turn, would have a significanteffect on the value obtained by integrating the sedimentflux profile, In addition samples should be taken of thebed material on several occasions duringrthe three monthsampling programme to provide information on sedimentsizes within the bed material.
Apply various qualitative tests to determine whether theunmeasured sediment load (includinq bed load) is likelyto be sigrnificant (Section 3.6). Attempt to estimate themagrnitude of this unmeasured discharge by calculatingthe 'total load' using formulae such as those of Ackersand White (Section 3.7) or Engelund and Hansen (Section3.8) and subtracting from this value the suspended bedmaterial discharge calculated from the measured sedi-ment flux profiles. (Wash load is not included in 'total
load' formulae). If bed load and unmeasured suspendedbed material load are found to comprise the bulk of thetotal, the sampling programme proposed in this papershould be abandoned and the use of alternative methodsfor measuring sediment transport rates, such as dunetracking, should be investigated,
Investigrate the correlation between the measuredsuspended bed material discharges and river gaugelevels in order to provide a basis for estimating sedimentdischarge values once the initial pumped sampling pro-gramme has been completed (Section 3.8). The accuracyrequired in the prediction of suspended bed materialdischarge rates wiil depend on their magnitude in rela-tion to the measured wash load discharqe rates and thepurposes for which the data are required.
Acknowledgements
This work was carried out in the Overseas DevelopmentUnit headed by Dr K Sanmuganathan with funds provided bythe British Overseas Development Administration, I amgrrateful to my colleagues at Hydraulics Research for the in-terest which they have shown in my work and the assistancewhich they have provided in preparing this paper. Inparticular I would iike to thank Dr K Sanmuganathan, Head
30
x)
xi)
of the Overseas Development Unit, for suggesting the generalframework of the paper and discussing with me severaltheoretical aspects; Mr T E Brabben for his constructive com-ments on the work and for reading the initial draft; Dr R Bet-tess for providing additional material and ideas on a numberof theoretical questions, and Mr I L Fish for making availableto me the results of his study of turbidity monitors.
References
ACKERS P and WHITE W R (1973). Sediment transpofi: newapproach and analysis. Proc. ASCE, Jl. Hydr, Div, 99 (HYl l),p 2041-60.
CRICKMORE M J and AKED R F (1975), Pumped samplers formeasuring sand transport in tidal waters. IERE Conf. on In-strumentation in Oceanography, Bangor, North Wales.FISH I L (1983). Partech turbidity monitors: calibration with siltand the effects of sand. Technical Note ODITN1, HydrauiicsResearch, Wallingford.
GRAF W H (t971), Hydraulics of sediment transport. McGraw-Hill, New York,
HARRISON A S and LIDICKER H C (1963). Computinssuspended sand loads from field measurements. Proc. Inter-Agency Sedimentation Conf., US Dept. Agric. Misc, Publ 970.INTERNATIONAL ORGANIZATION FOR STANDARDIZA-TION (1979), Liquid flow in open channels: velocity-areamethods, ISO 748, Also issued as BS 3680: Pan 3A: 1980,LANE E W and KALINSKE A A (1942). Engineering calcula-tions of suspended sediment. Trans. Am. Geophys. Union, 22,pp 603-7.
LEOPOLD L B, WOLMAN M G and MILLER J P (1964). Fluvialprocesses in geomorphologry, W H Freeman and Co., SanFrancisco.
NELSON M E and BENEDICT P C (1951). Measurement andanalysis of suspended sediment loads in streams. Trans.ASCE, 116, pp 891-918.SUB-COMMITTEE ON SEDIMENTATION (1963). Measure-ment and analysis of sediment loads in streams, Report 14,Determination of fluvial sediment discharge. US Inter-AgencyComm, on Water Resources.UNITED STATES DEPARTMENT OF AGRICULTURE (1979).Field manual for research in agricultural hydrology.Agriculture Handbook, No 224,VANONI V A (1975) (Ed). Sedimentation engineering. Manualsand reports on engineering practice No. 54, ASCE, New York.WHITE W R, MILLI H and CRABBE A D (1973). Sedimenttransport: an appraisal of available methods (2 vols). INT I19,
31

Hydraulics Research Station, Wallingford. See also Sedimenttransport theories: a review. Proc, ICE, 59 Part2 (i975), pp265-92.
YAITIN M S and FINLAYSON G D (1972). On the velocitydistribution of the flow carrying sediment in suspension, in HW Shen (ed) Sedimentation. Symp to honour Prof, H A Eins-tein, Colo, State Univ.
32
DDB 650449 10/85
Data forms for use in the collection and analysis of pumped samples


"oop
tto
C r {Fl l+l
o ENN
F
${oC F Io ( U
! i Orr r{i{ +,O t {o oP { >
6
c
otiNN
+Jrd
oh F lr t pr { ( dtJ F{O r {
Fl 6o >> q t
B t + |O r {
Fl
Ft{
o l oq r l os l t ol l vt r l
r l lE I
v lI
IqO H
0 r ^E o o
r l t r+J rl
Fd &$ EU ( do ots
v) -.H o (2 vfrf
EI
<t)
F]E
fdH
Xl
Bo oF] E
F{
o r OE >A
(,oo
oat
rlF
oo,a
o{
orJ6x
(,ov)
6<
&
oe,(u&c(do
o<
od
Asoo
t+{ Fdo xOJE E-ta
F{ llo> €
or { >o oU F Io q l
H
z
u)&frl oFE A Op F l dz H @
q)z 1 4 t rO F I Or-t dt s o o< q ) oC ) F {H ( / ) Ur r a t r l dH F-l +,F { p r f {
Fedo ( ^H
N cn
r { { @
Fl
o ao o
F I Oa . aF
d r io ( U
o l { oF l ( l l >r., !, (Ul J O $ {o E orrl
E.
cntrl=
Hv)
()
FI
ts&EEF{
xfrlF{
B
oE
| , a ad f {
t r t rr{ r{il..t l+{
IJ(0
{-l(d
+,t{rue,@
+J(U
zH
f:l&
g
o
D(.'
HHz
F{zr r 1 Qz &F{ C,o c )Fl FIfr] F
E l <A Hu i a
r { oU ) F lE t s IIrl l-{> t r {o. ( 9, z
( . ) Agerr1 Crlafrf AEH
8BF.r fu
&ts
v)M4
EF]&Fl
gtrlz
F1
()HFr&
zHHHa
dA
&E r I ]H >O H
t r r &
oao
Fl.A
c
oo(UIJor.l€F{
$+,F
NFlt{o
E
Fl
oo
F{
Eotrl,
otrP
li
fl
oo
Fl
Eoot{.Joo
oao
F{(,)oo6+.1t{ao
!o+JqtB
r.l!(d!U)
+J
u}r{tr
dl - -
rJ

lroFEtro
r{AEd
th
o0
oriaEqtat)
l|
o orl
o (t)( a hd F lE Qtrb , dt{'rJ O
trr { Oqt r+{+J (Uo pts
Io0
t r Eo q t
aE Eod Fr { O6 >! f {
o b 0t{
t|-{( o o(tto oE >
o>r i{l r ( aa
A5_
F
1A5-
F E q
f_A1 E
1 @
Fo
Fl
o3trda o
d oo d
o(tto r ,( U ( ' JEl o
Fh i {lr t+{A
(nHtn
Ff
z
tt{oF]H
a
F { u r :H F IZ Ai r c )
l{H Hz&r d <EF. :ooA ZF l <> ( , lF:a h ( )
ozC N H< U l F ft r l H Q rc n u t =& 1 1t r lF I u )
O Z r q!
EI F1
EH E& 6 0
El ..( a ( . 's a z& j 1
|t( n A
HE :F I C lp< aEH :HE :
:
l*1trHa
u)klFl. o {
. E
. ( A
. z
. o
. a a. v
. E l
. =
. I I 1
6 l . JA
& &E frl FllrO H f r lt 4 & C ,
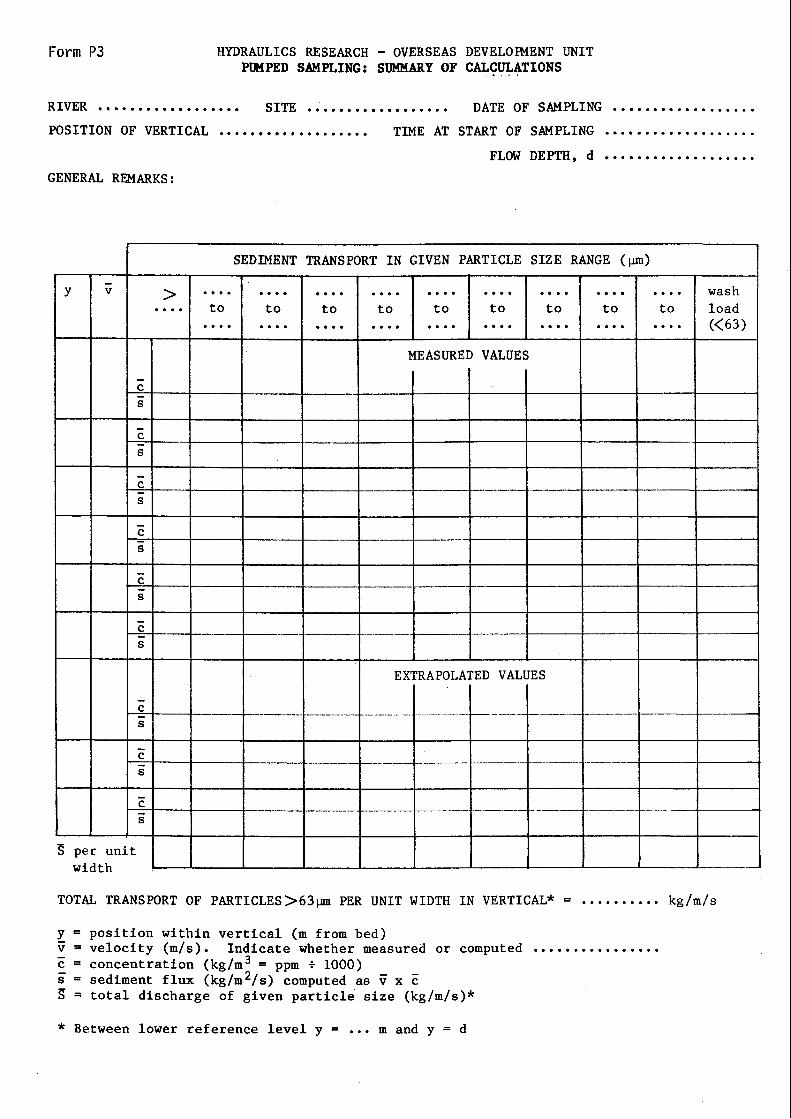
Form P3 IIYDRAULICS RESEARCHPTMPED SA}IPLING:
- OVERSEAS DEVELOR{ENT I]NITST'UI{ARY OF CALCT'LATIONS
RIVER SITE DATE OF SAMPLING
START OF SAMPLING
FLOI{ DEPTH, d
POSITION OF VERTICAL TIME AT
GENERAL REMARKS:
TOTAL TRANSPORT OF PARTICLES)63pn PER UNIT WIDTH IN VERTICAL* = kg/a/s
posiEion wlthin vert ical (n fron bed)veloci ty (n/s). Indicate whether measured or couputedconcenErat lon (kg/m3 = ppr + 1000)sediment f lux (kg/mz/s) conputed as v- x ctotal dlscharge of given part ic le size (kg/n/s)*
I=v =c - =6 '=$ =
SEDIIvTENT TRANSPORT IN GIVEN PARTICLE SIZE RANGE (pm)
wash
load(<63)
MEASURED VALUES
EXTRAPOLATED VALUES
per unitwldth
* Between lower reference level y = . . . m and y = d


Figures

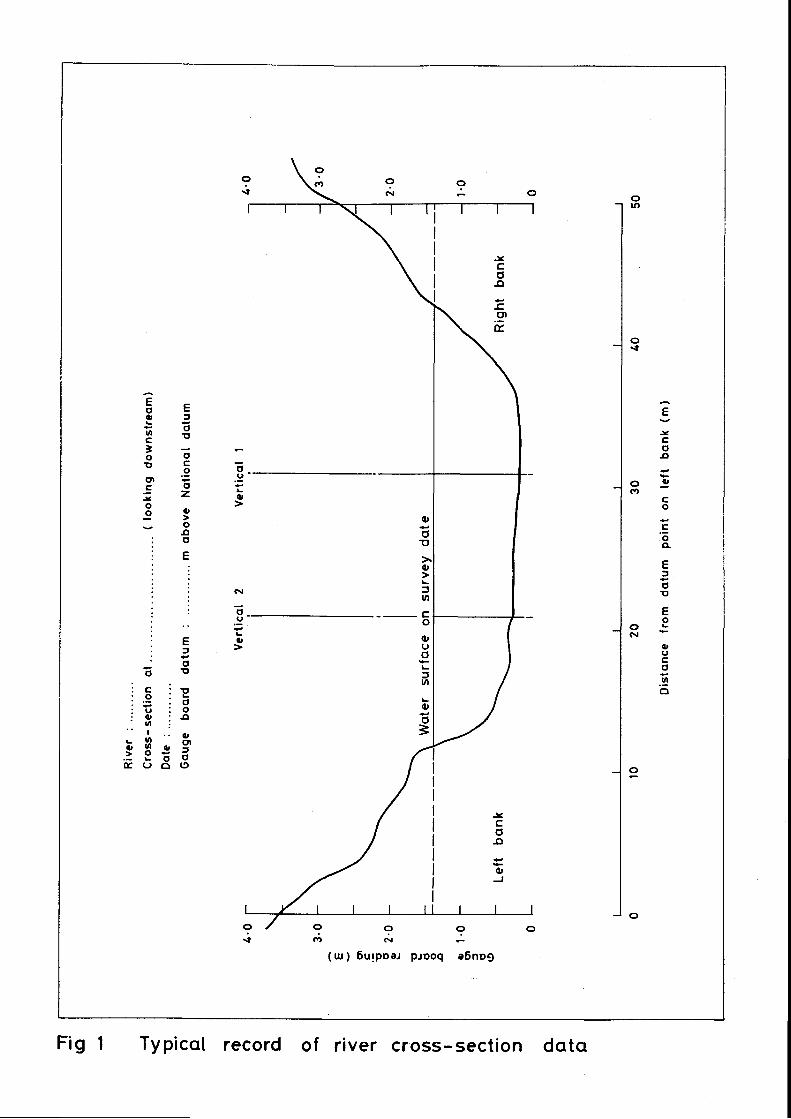
ot',
E
Jcoo
o 9(v)
co
toCL
EJ
oT'
Eo
( \ l e
c,(,co.3o
Jco-o
E.9&.
Jcolr
oJ
oo1l
c,
fo
- _ cooudL
Jo
oo=
9 9GI
( ul ) 6urpDeJ prooq .6nDg
o(,
o
ct.9
o
EtoI'
ocoozoooo
E
Eao
!,
!l
oott
octr=o('
e,oo
EooU|c'o
T'
ctl.sJo9
oc.9(,ooIoalo(-t
(,
&
dotoTypicol record of r iver cross-sect ionFig 1

a: E ON = o
l > o Nb.
'6
c,(,7oo-
EEroo:o
I
\f
o cr); , ( o
-c9bt: -xo .9
E( , J
' I pJ Co ooO C= o1 U l ' iC r LE O
E co o
!r-t C,; | nc t c 'o ( I I
on
o\ o
N =
9 E E; b .:
xr u r z
ocoE
!too
(,
=IJoo
oG'
o
oo
coo
couco()
oG'
9
o
I
.t
T
E
CD
IrJ
@
o
qPo
Yo
aItIIII
Irox
"/
s-'<'o<e;/'o/"/
o
o
o
I
iEgBq'EB: EE5 E 8. .sE
o( \ I E
o*
E
o
*E
x O
oat
oG'
o;
*- X_x_<_ x_x_r__*
E_r\..'i e -io
!8€ . g
lro: E
9!
oIJ
oLJo
oo=
Derivot ion of cr sediment f lux prof i te
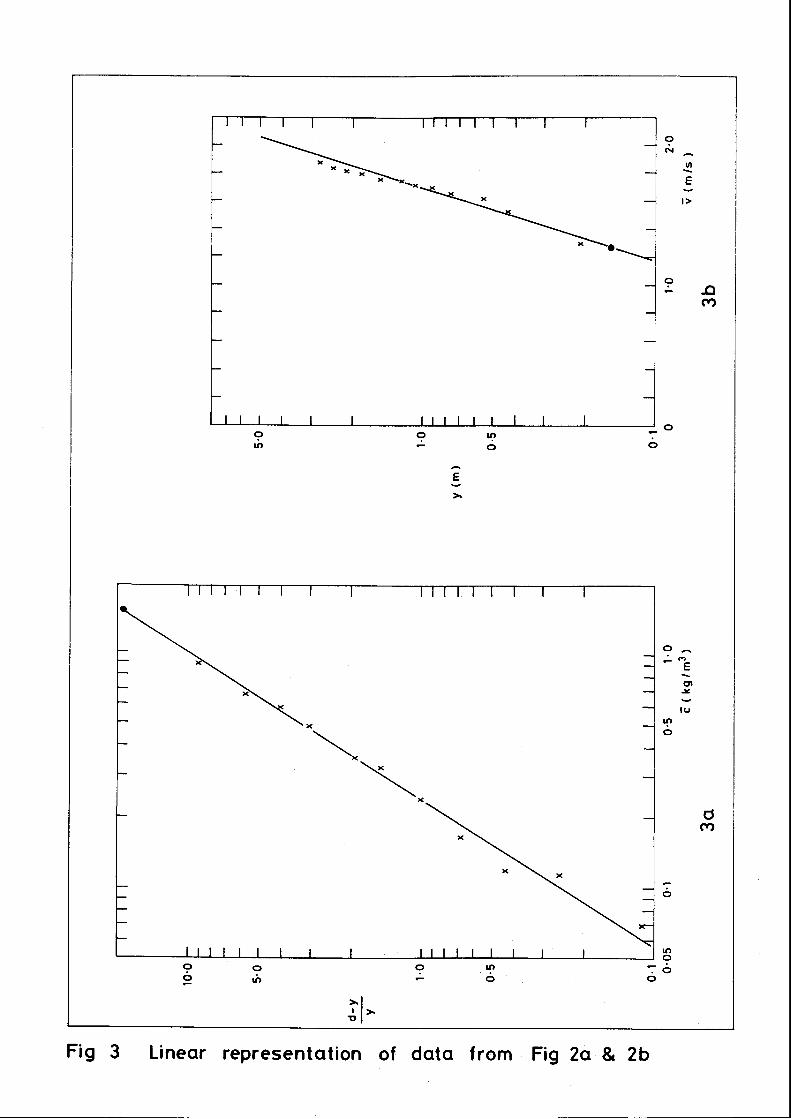
o ^- a o
Egl
J
l u
Po
ot;
? roo o
roooo
o
> l+l-
Fig 3 Lineor representotion of doto from Fig 2q & 2b

coot|.,o(,xf
coE
!toUI
o
E
coU|os,(J
<)
tiN
Eor
!
l o
I'.l
(t,
UIcoEa,t
e oc oo oE E
- o
5E
t t c ;a g---a;! i
c l
o3oEo ^r -e t t
E '55
E;9 o u r ( t O x . u l :: ' r i o . t = o i j ' :: b - ; c . r i i - 3Y 6 o ; a ; . E -
S ' t I I I l :
:F$P$F E;E o o 6 o o r o'; c'i
'i
E .- ;L o x
.oo o
s5o oo t n
e,(J
o
JU|
oo=
E
Fig I Typicol sediment f lux prof i tes for di f ferent port ic le sizes
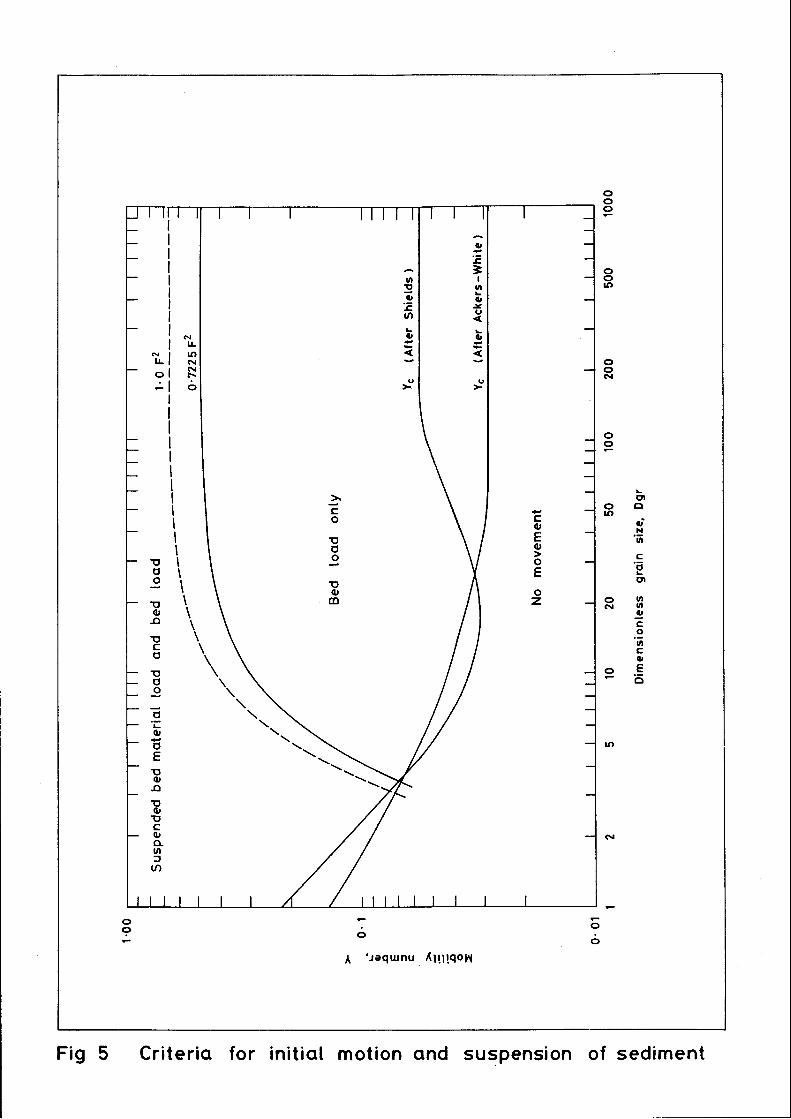
coEooEoz
oE=
Ioo
a(,
oNtI.ul(\Io
EC,3Eo.ct
lJcoEoo
c''iooET'o
ft
Eo
1Jcq,CLoJu)
U|Io
E.n
o
I
3co
!oI'tfodt
ctlo al'l
e;NIt
coct!
c! ulA l ? n
Ico|'co
o Ei5
A '.requrnu ,(utlqon
sedimentFig 5 Cri ter iq for in i t iot motion ond suspension of


This technical note is one of a series on topics related towater resources and irrigation, prepared by HydraulicsResearch, Wallingford, and funded by the British OverseasDevelopment Administration.
Others in the series include:
OD/TN I Partech turbidity monitors: calibration with siltand the effects of sandI L Fish, September l9B3