security metrics for the android ecosystem (pdf)drt24/papers/spsm-scoring.pdf · security metrics...
TRANSCRIPT
Security Metrics for the Android Ecosystem
Daniel R. Thomas Alastair R. BeresfordComputer Laboratory
University of CambridgeCambridge, United Kingdom
Andrew Rice
ABSTRACTThe security of Android depends on the timely delivery ofupdates to fix critical vulnerabilities. In this paper we mapthe complex network of players in the Android ecosystemwho must collaborate to provide updates, and determinethat inaction by some manufacturers and network operatorsmeans many handsets are vulnerable to critical vulnerabil-ities. We define the FUM security metric to rank the per-formance of device manufacturers and network operators,based on their provision of updates and exposure to criticalvulnerabilities. Using a corpus of 20 400 devices we showthat there is significant variability in the timely delivery ofsecurity updates across different device manufacturers andnetwork operators. This provides a comparison point forpurchasers and regulators to determine which device man-ufacturers and network operators provide security updatesand which do not. We find that on average 87.7% of An-droid devices are exposed to at least one of 11 known criticalvulnerabilities and, across the ecosystem as a whole, assigna FUM security score of 2.87 out of 10. In our data, Nexusdevices do considerably better than average with a score of5.17; and LG is the best manufacturer with a score of 3.97.
Categories and Subject DescriptorsSecurity and privacy [Systems security]: Operating sys-tems security—Mobile platform security ; Security and pri-vacy [Systems security]: Vulnerability management
General TermsSecurity, Measurement, Economics
KeywordsAndroid; updates; vulnerabilities; metrics; ecosystems
Permission to make digital or hard copies of all or part of this work for personal orclassroom use is granted without fee provided that copies are not made or distributedfor profit or commercial advantage and that copies bear this notice and the full citationon the first page. Copyrights for components of this work owned by others than theauthor(s) must be honored. Abstracting with credit is permitted. To copy otherwise, orrepublish, to post on servers or to redistribute to lists, requires prior specific permissionand/or a fee. Request permissions from [email protected]’15, October 12, 2015, Denver, Colorado, USA.Copyright is held by the owner/author(s). Publication rights licensed to ACM.ACM 978-1-4503-3819-6/15/10 ...$15.00.DOI: http://dx.doi.org/10.1145/2808117.2808118.
1. INTRODUCTIONAll large software systems today contain undiscovered se-
curity vulnerabilities. Once discovered, these flaws are of-ten exploited, and therefore the timely delivery of securityupdates is important to protect such systems, particularlywhen devices are connected to the Internet and thereforecan be exploited remotely. Manufactures and software com-panies have known about this issue for many years and areexpected to provide regular updates to protect their users.For example, Windows XP could be purchased for a one-off payment in October 2001 and received monthly securityupdates until support ended in April 2014.
Unfortunately something has gone wrong with the pro-vision of security updates in the Android market. Manysmartphones are sold on 12–24 month contracts, and yetour data shows few Android devices receive many securityupdates, with an overall average of just 1.26 updates peryear, leaving devices unpatched for long periods of time.
In order to improve our understanding, we need to knowmore about the Android ecosystem as a whole. It is a com-plex system with many parties involved in a long multi-stagepipeline [18]. We map and quantify the major players in thisspace who must collaborate to provide updates (§4) and de-termine that inaction (§5.3) by some of the manufacturersand network operators means many handsets are vulnerableto critical vulnerabilities. Understanding this ecosystem isall the more important because device manufacturers haveintroduced additional vulnerabilities in the past [17].
Corporate and public sector buyers are encouraged to pur-chase secure devices, but we have found little concrete guid-ance on the specific makes and models providing timely se-curity updates. For example, CESG, which advises the UKgovernment on how to secure its computer systems, recom-mends picking Android device models from device manu-factures that are good at promptly shipping security up-dates, but it does not state which device manufacturers theseare [5] and so far they have only certified one Android devicemodel [6]. Similarly, we are collaborating with a FTSE 100company who wish to know which devices are secure andwhich manufacturers provide updates.
The difficulty is that the market for Android security to-day is like the market for lemons: there is information asym-metry between the manufacturer, who knows whether thedevice is currently secure and will receive security updates,and the customer, who does not. To address the asymme-try, we develop a scoring system and provide numbers onthe historic performance of device models found in the De-vice Analyzer [29] project (§5). We propose three metrics: f

the proportion of running devices free from critical vulner-abilities over time; u the proportion of devices that run thelatest version of Android shipped to any device produced bythat device manufacturer; and m the mean number of out-standing vulnerabilities affecting devices not fixed on anydevice shipped by the device manufacturer. We then derivea composite FUM score which is hard to game (§5.7).
The FUM score enables corporate and public sector buy-ers, as well as individuals, to make more informed purchasingdecisions by reducing the information asymmetry. The FUMscore also supports better regulation, and indeed there is on-going legal action to force network operators to ship updatesfor security vulnerabilities [23]. We will continue to provideupdated versions of our FUM scores on our website [25].
In summary, the contributions of this paper are:
• We quantify the Android update process, providingconcrete numbers on the flow of updates and their la-tency (§4).
• We propose the FUM scoring metric to evaluate thesecurity of different instances of a platform (§5.1).
• We measure the security of Android against our scor-ing metric and compare different device manufactur-ers, device models and network operators to allow de-vice purchasers to differentiate between them based onsecurity (§5.2).
• We determine that the main update bottleneck lieswith manufacturers rather than Google, operators orusers (§5.3).
We indicate the uncertainty in our results by presentingthem ± one standard deviation and give results to 3 s.f., thisoccasionally results in ‘± 0’ when the standard deviation issmall. We explore systematic errors in §6.
2. THREAT MODELIn this paper we are concerned with vulnerabilities which
allow an attacker without physical access to the smartphoneto gain significant permissions (such as root-level access)which are not available to a standard app running on thedevice. We consider three attack vectors which can be usedas a starting point to launch an attack on a device.
The installation attack vector is used when a maliciousapp is installed on the device. Android devices can installapps through marketplaces such as the Google Play Store,email attachments, URLs and via the Android Debug Bridge(ADB). By default, many Android devices will only allowthe installation of apps from the Play Store, which auto-matically analyses apps, and quickly takes down apps thatare reported as malicious. However, alternative markets arealso popular, particularly in countries where the Play Storeis not available.
The dynamic code loading attack vector occurs when anexisting app downloads and executes new code at runtime.The most direct method is to upload a seemingly innocentapp to a marketplace that then dynamically loads maliciouscode, either as additional davik bytecode, as a native library,or by embedding an interpreter and executing received in-structions. Neither static nor dynamic analysis of this appwill uncover any malicious code, since it does not exist inthe app. The marketplace can try to detect explicit use of
dynamic code loading, however there are ways to dynami-cally load code which are hard to detect even on a platformsuch as iOS, which does not permit dynamic code loading.For example, a Return-Oriented Programming (ROP) at-tack on iOS is relatively easy if the attacker creates an appwith carefully crafted flaws [30].
The injection attack vector occurs when the attacker in-jects malicious code directly into existing code already run-ning on the handset. For example, the addJavascriptInter-face vulnerability (CVE-2012-6636) allows an attacker to in-ject JavaScript into HTTP traffic destined for the device andexecute arbitrary code with all the privileges of the app. Thefix for this vulnerability breaks backwards compatibility andrequires a two-sided fix. While the fix was released in De-cember 2012, by June 2015, 25.7% of handsets connectingto the Play Store were still vulnerable to this attack [27].
Security for the Android ecosystem can be deployed atthree levels: in an online marketplace, at app installationtime on the device, and during app execution. Google pro-vides its users with security in all these places: throughanalysis of apps by the Play Store, using the Verify Appsfeature on the smartphone at installation time, and by anapp sandbox on the smartphone during execution. The bestplace to prevent attacks is by sandboxing the app duringexecution, since all three attack vectors can be prevented atthis level, whereas not all users install apps exclusively viathe Play Store or enable Verify Apps. In addition, dynamiccode loading and injection attacks cannot be discovered atinstallation time and can be difficult for a marketplace todetect. Unfortunately, as we shall see, the security sandboxfor Android has known critical vulnerabilities on most de-vices. This does not mean these devices are attacked, butthat they are vulnerable. The likelihood of a successful at-tack then depends on what apps the user installs and wherefrom, as well as the computer networks the device is con-nected to and the actions the user takes whilst connected.
3. DATAWe use two sources of data to measure the security of An-
droid: (1) information on the critical vulnerabilities foundto affect particular versions of Android and (2) informationon the distribution of Android versions over time. These twodatasets can then be combined to determine the proportionof devices at risk of attack from specific vulnerabilities.
3.1 Critical vulnerabilitiesWe built a list of critical Android vulnerabilities for our
AndroidVulnerabilities.org (AVO) website [25]. The site con-tains 32 critical vulnerabilities such as root vulnerabilitiesthat do not require USB debugging to exploit. We havechosen 11 vulnerabilities as shown in Table 1 for our analy-sis in this paper. We selected these vulnerabilities since theyfit the attack vectors introduced in §2 and because they af-fect all Android devices regardless of manufacturer, and asa result our selected vulnerabilities will dominate any se-curity analysis of Android. Hence, with our chosen set ofvulnerabilities, our analysis represents a lower-bound on thevulnerability of devices in the Device Analyzer data.
Some critical vulnerabilities are not traditional kernel vul-nerabilities, but exploit the installation attack vector inour threat model. For example improper verification ofsignatures at installation time was discovered in February2013 [11] and meant that apps could pretend to be signed

Vulnerability How known Date CategoriesKillingInTheNameOf Fixed 2010-07-13 sys, kernexploid udev Discovered 2010-07-15 kernellevitator Discovered 2011-03-10 kernelGingerbreak Fixed 2011-04-18 systemzergRush Discovered 2011-10-06 systemAPK duplicate file Discovered 2013-02-18 signatureAPK unchecked name Discovered 2013-06-30 signatureAPK unsigned shorts Fixed 2013-07-03 signaturevold asec Fixed 2014-01-27 systemFake ID Fixed 2014-04-17 signatureTowelRoot Discovered 2014-05-03 kernel
Table 1: Critical vulnerabilities in Android
with system keys and hence be granted system privileges.On versions of Android below 4.1, malware could then useknown system-to-root escalation mechanisms. Regardless ofversion, this exposed an increased attack area and wouldalso provide the ability for malware to control all user inter-net traffic (via VPNs), brick the phone, remove and installapps, steal user credentials and read the screen. The differ-ent categories in which the vulnerabilities fall are shown inTable 1. The ‘signature’ vulnerabilities require an installa-tion attack, while ‘kernel’ and ‘system’ vulnerabilities canbe used together with an installation, dynamic code loadingor injection attack vector.
3.2 Device Analyzer dataWe use historical data collected by the Device Analyzer
project [29]. Device Analyzer collects data1 from study par-ticipants who install the Android app from the Play Store.Most study participants allow external researchers to accessthe subset of the device data needed for this analysis.
We extracted the build string and API version for eachdevice each day. The build string is a user-readable versionstring and the API version is a positive integer that increaseswhen new features are added to the API. Consequently se-curity (bug) fixes do not always result in a change in the APIversion. Fortunately most (99.9%) entries in these data havea build string of the form ‘x.y.z opaque marker’ and so it ispossible to extract the Android version number ‘x.y.z’. On alarge proportion of devices ‘opaque marker’ is a well definedbuild number2 however this is not universal.
Device Analyzer has collected data from 20 400 deviceswith a total of 1 330 000 device days. The majority of devicesonly contribute data for a short period of time, however 2 110devices have contributed data for more than 6 months. Weverify that the Device Analyzer data is representative in §6.
4. ANDROID ECOSYSTEMThere is a complex Android ecosystem that creates and
distributes updates which fix vulnerabilities. In this sectionwe describe how the Android ecosystem functions and howAndroid versions are produced, using Device Analyzer dataand by analysing the Android source code and upstreamprojects. We quantify the number of updates shipped byvarious entities in the ecosystem and the number of entities.
To understand how vulnerabilities in Android are fixed
1https://deviceanalyzer.cl.cam.ac.uk/collected.html2https://source.android.com/source/build-numbers.html
Upstream open source projects
other projects
(176)
59
6618
(301)
28
1 270
OpenSSL BouncyCastle
Google Hardwaredeveloper
Device(20 400)
(1 460)
Linux
Device manufacturer
Network operator
Figure 1: Flow of updates between participants in theAndroid ecosystem. Numbers on edges indicate updatesshipped between July 2011 and July 2015, those in bracketsrepresent number of such entities. Dotted arrows indicateflows where we can’t measure because no public data is avail-able.
Project # releases latency (days)linux 618 137± 48openssl 59 120± 55bouncycastle 6 239± 78
Table 2: Flow of updates from upstream projects into An-droid. Number of updates as in Figure 1, latency in daysbetween the upstream release and the release of the first An-droid version containing it, for all pairs of versions we havedata on.
we examine the Android update process, which we modelin Figure 1. There are five entities or groups that con-tribute towards Android updates: the network operators,the device manufacturers, the hardware developers, Googleand the upstream open source projects. Android buildson various open source projects, such as the Linux kernel,OpenSSL and BouncyCastle cryptography libraries. Con-sequently Android can include any compatible versions ofthose projects, including those that fix security vulnerabili-ties. Android also incorporates various drivers for differentbits of hardware. The Android platform is then built fromthese components by Google. The code for each Android re-lease or update is kept secret until after a binary release hasbeen published.3 Device manufacturers receive advancedaccess in order to prepare handsets. The network operatormay then make or request customisations and perform test-ing before shipping the update to the device. Sometimesdevice manufactures ship updates directly to the user with-out involving the network operator. Sometimes the devicemanufacturer and Google collaborate closely to make a par-
3https://source.android.com/source/code-lines.html
ticular phone, such as with Nexus devices and so Googleships directly to the device. Sometimes device manufactur-ers incorporate upstream open source project releases di-rectly, and sometimes incorrectly – for example previouswork has recorded evidence of broken nightly builds of sqlitein Android releases on some device models [29].
The numbers of devices (20 400), network operators (1 460)and device manufacturers (301) in Figure 1 come from theDevice Analyzer data. Device manufacturer and networkoperator counts were obtained by normalising the resultsreported by Android to Device Analyzer of the device man-ufacturer and active network operator. This normalisationis a manual task that involves removing invalid values (suchas ‘manufacturer’ or ‘airplane mode is on’), collating acrosscompany name changes (e.g. ‘lge’ to ‘LG’), normalising punc-tuation, removing extra strings sometimes added such as(‘(2g)’ or ‘communications’) and mapping some incorrectlyplaced model names back to their manufacturer. This nor-malisation is not perfect so these are likely overestimates onthe Device Analyzer data. We believe they nevertheless arelikely to underestimate the total number of device manufac-turers and network operators worldwide.
In Figure 1 the number of updates received by devices(1 270) is the number of different full version strings ob-served in Device Analyzer. The number of updates shippedby Google (28) is the number of Android versions reportedin Device Analyzer that affected more than 1% of devicesfor more than 10 days. This significance test is to removespurious versions recorded in Device Analyzer such as ‘5.2.0’in 2012 which had still not been released at time of writing.
We extracted data on the external projects used in An-droid and have included this and the scripts which generatedit in AVO. These scripts analysed the Android Open SourceProject’s source tree to examine the source code of each ofthe external projects to find the project version associatedwith each Android version tag on the repository. There are176 external open source projects in Android, contributing25 Million lines of code. We analysed the top 40 by linesof code (99.7% of the total) and were able to automaticallyextract the versions of those projects included in differentversions of Android for 28 of these (24.9% of the total). Wefound 72 distinct versions, a median of 2.0 and mean of2.57± 1.84 versions per project. Android rarely changes theversion of external projects it includes.
To compute the latency between upstream releases andthe release of the first version of Android containing thatrelease we scraped the release pages, to obtain the versionnumbers and release dates. This allows us to compute thelatency between an upstream project being released and itbeing included in Android; this is shown in Table 2. Theversions included in Android were about half a year old whenthe first version of Android containing it was released.
5. SECURITY METRICSTo allow buyers of Android devices to purchase those de-
vices with the best security, they need to know how differentdevice manufacturers, device models and network operatorscompare in terms of security. We propose a method to scorea device manufacturer, device model or network operatorbased on its historic performance at keeping devices up-to-date and fixing security vulnerabilities. We find that An-droid as a whole gets a score of 2.87 ± 0.0 out of 10, the
Dec 2011
Jun 2012
Dec 2012
Jun 2013
Dec 2013
Jun 2014
Dec 2014
Jun 20150.0
0.2
0.4
0.6
0.8
1.0
Pro
port
ion
insecure
mayb
e s
ecu
re
secure
zergRush APK duplicate file vold asec
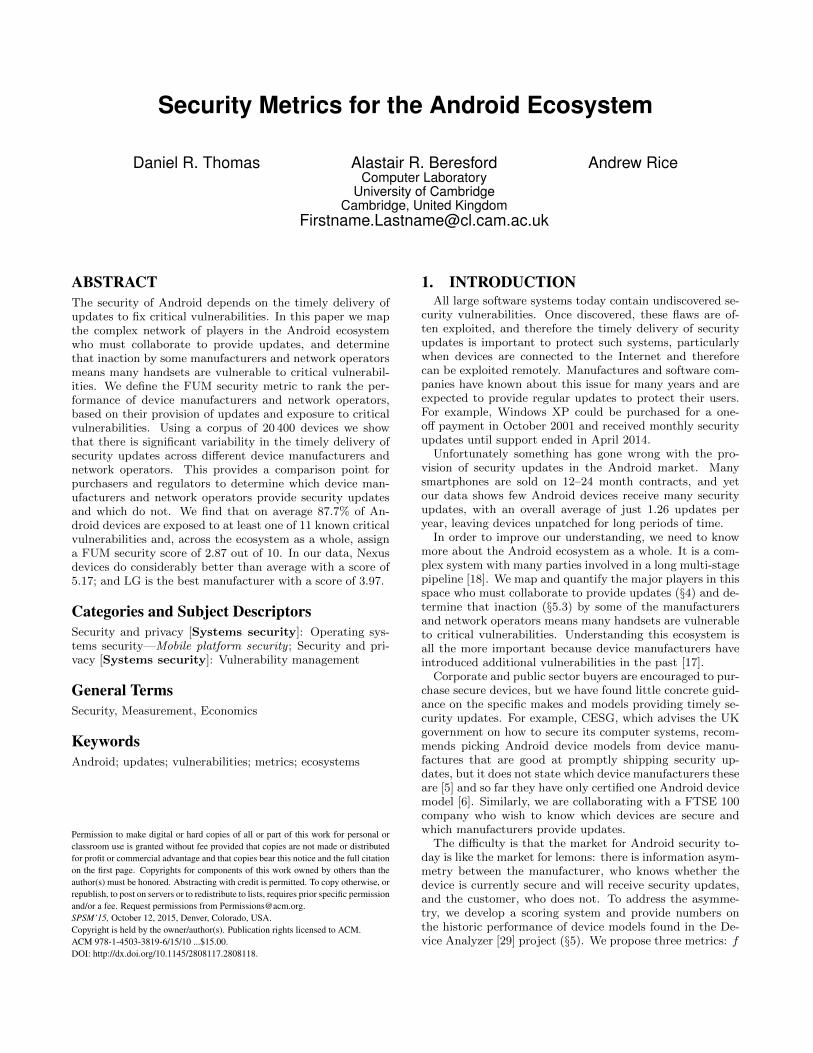
Figure 2: Proportion of devices running insecure, maybesecure and secure versions of Android. Table 1 lists the 11vulnerabilities used, the red vertical lines are caused by theirdiscovery and the most important are annotated.
highest scoring device manufacturer is LG (3.97± 0.0) andthe lowest scoring is walton (0.272± 0.007).
By combining data on critical vulnerabilities in Androidand the versions of Android running on devices we can de-termine which vulnerabilities each device was vulnerable toeach day. We consider a device is insecure if it is runninga vulnerable version of Android and the device has not re-ceived an update which might fix it; it is maybe secure ifit is running a vulnerable version but received an updatewhich could have fixed the vulnerability if it contained abackported fix; and it is secure if it is running a secure ver-sion. This allows us to plot Figure 2, initially all devices aremaybe secure (yellow) since Device Analyzer does not havehistorical data prior to May 2011. This means we cannotdistinguish between devices which are running a version ofAndroid which is known to be vulnerable from one whichmay have received a backported fix. This demonstrates theimportance of a longitudinal study: this type of analysisrequires years of data. Once zergRush was discovered in Oc-tober 2011 then most devices are recorded as insecure (red)as they were vulnerable. The remaining devices were alreadyrunning a version of Android which fixed the zergRush vul-nerability and are therefore marked as secure (green). FromOctober 2011 until the discovery of APK duplicate file inFebruary 2013 the graph shows progressive improvement asdevices are upgraded or replaced. This means more andmore devices are marked as secure because they are nowrunning a secure version of Android, or marked as maybesecure because they received an OS update that did not up-date to a known-good version of Android but which may stillhave included a backport of a fix, as the update was madeavailable after the vulnerability was disclosed. From Febru-ary 2013 onwards regular discovery of critical vulnerabilitiesensures that most devices are vulnerable. Ignoring devicesclassed as maybe secure, we find that on average 87.7±0.0%of devices were classed as insecure and 12.3% classified assecure between July 2011 and July 2015.
5.1 Method: The FUM scoreComputing how good a particular device manufacturer
or device model is from a security standpoint is difficultbecause it depends on a number of factors which are hardto observe, particularly on a large scale. Ideally, we wouldconsider both the prevalence of potential problems that werenot exploited and actual security failures. However, in the
Vulnerability first known Vulnerability first patched
Time
Sum of known but unpatched
0123
#unpatc
hed
vuln
erabilit
ies
0 0 01 1 1 112 2 22 2 2 2 2 2 23 3
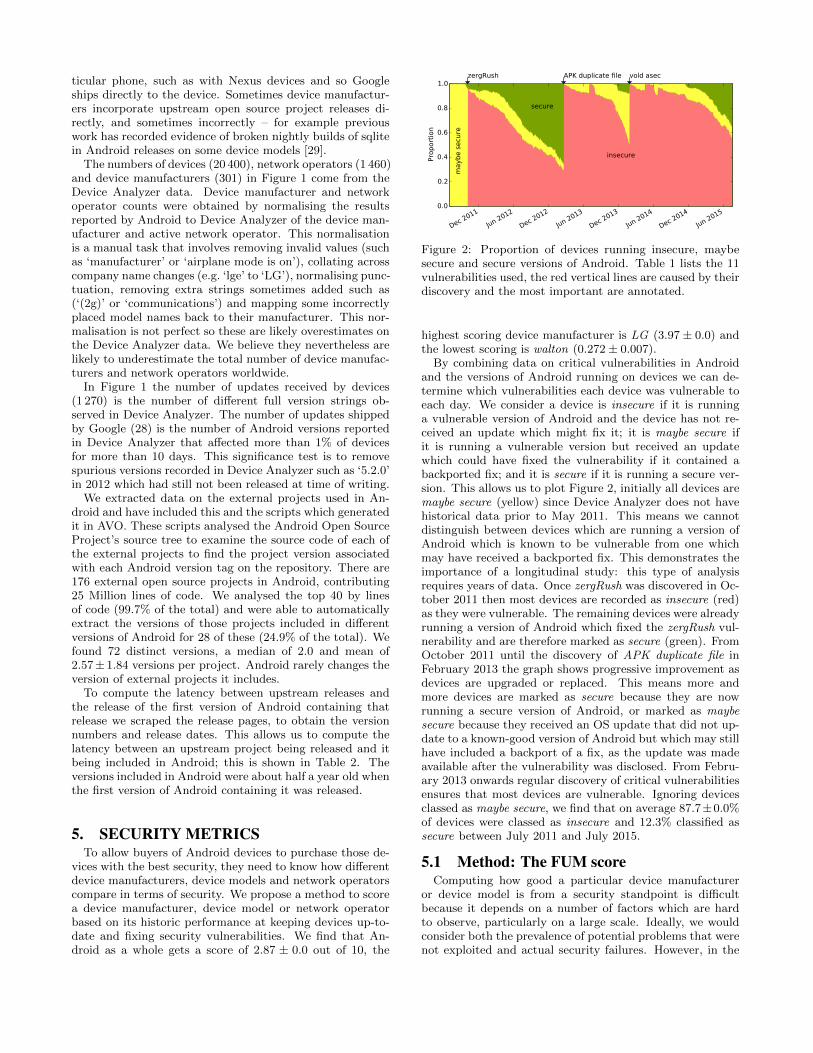
Figure 3: As vulnerabilities are discovered and patched thesum of known but unpatched vulnerabilities each day varies.From this we can calculate m = (0 × 3 + 1 × 5 + 2 × 10 +3 × 2)/20 = 1.55 For comparison VFD = 0.15 and MAV =2. Example based on the one given by Wright [32].
absence of such data we propose a scheme for assigning adevice a score out of ten based on data that can be observed,is based on previous metrics, and that we expect correlateswith the actual security of the devices.
The FUM score is computed from three components:
free f The proportion of running devices free from criticalvulnerabilities over time. This is equivalent to Acerand Jackson’s proposal to measure the security basedon the proportion of users with at least one unpatchedcritical vulnerability [1] and similar to the Vulnerabil-ity Free Days (VFD) score [32]. Unlike VFD, this isthe proportion of running devices which were free fromcritical vulnerabilities over time, rather than the num-ber of days which the device manufacturer was freefrom outstanding critical vulnerabilities, as that doesnot take account of the update process.
update u The proportion of devices that run the latest ver-sion of Android shipped to any device produced by thatdevice manufacturer. This is a measure of internal up-datedness, so a low score would mean many devices arebeing left behind. This assumes that newer versionsare better with stronger security. Historically, stepshave been taken to improve Android security in newerversions so this assumption should generally hold, butsometimes new updates introduce new vulnerabilities.
mean m The mean number of outstanding vulnerabilitiesaffecting devices not fixed on any device shipped bythe device manufacturer. This is related to the Me-dian Active Vulnerabilities (MAV) measure [32] but isthe mean rather than the median, since this gives acontinuous value. An example is given in Figure 3.
These three metrics f , u and m, together measure thesecurity of a platform with respect to known vulnerabilitiesand updates. f is a key measure of the direct risk to users asif there is any known but unfixed vulnerability then they arevulnerable. However it does not capture the increased riskcaused by there being multiple known vulnerabilities, whichgives an attacker more opportunities and increases the likeli-hood of a piece of malware having a matching exploit. Thisis captured by the m score, which measures the size of thedevice manufacturers queue of outstanding vulnerabilities
but does not take into account the update process or mea-sure the actual end user security. Neither of these metricscapture whether devices are being left behind and not beingkept up-to-date with the most recent (and hopefully mostsecure) version, which is captured by u.
We want to provide a score out of 10 as many other ratingsare given as a score out of 10. Since f is the most importantmetric we weight it more highly. Since m is an unboundedpositive real number, we map it into the range (0–1]. Thisgives us the FUM score:
FUM score = 4 · f + 3 · u+ 3 · 2
1 + em(1)
We can compute the uncertainty for f , u and m. f iscomputed by taking the total secure device days and divid-ing it by the total insecure and secure device days. Thetotal secure device days and total insecure device days areboth counting experiments and so their measurement erroris their square root [24]. u is computed by taking the sum ofthe proportions of devices running the most recent versioneach day, both the count of devices running the maximumversion and total count have square root uncertainties. m iscomputed by counting the number of vulnerabilities whichaffected that entity and which have not yet been fixed on anydevice we have observed from that entity every day and aver-aging time. However, it could be that the entity has releaseda fix to some devices but we have not yet observed a devicewith that fix. So the uncertainty in our measurement is theprobability of not having observed a fixed device if a fixeddevice existed. We assume that if the fix has been releasedthen at least 1.0% of devices have the fix. This represents atrade-off between a proportion so small that the fix has notreally been deployed and a reasonable estimate of the error.This gives an uncertainty of 0.99n where n is the number ofdevices contributing to that day’s data for each vulnerabilityoutstanding each day. The Python uncertainties librarywas used to propagate uncertainties through calculations.This does not capture systematic errors. For example, wedo not include manufacturer specific vulnerabilities, howeverwe expect that performance in fixing manufacturer specificvulnerabilities is strongly correlated with performance fixingvulnerabilities affecting all of Android.
5.2 Results: Security scoresOn average, between July 2011 and July 2015 we found
0.53±0.0 outstanding vulnerabilities not fixed on any deviceand 5.23± 0.0% of devices to run the most recent version ofAndroid. This gives a security score of 2.87± 0.0 out of 10.
However there are a wide variety of scores depending onthe source of the device. There is anecdotal evidence thatGoogle’s Nexus devices are better at getting updates thanother Android devices because Google makes the original up-dates and ships them to its devices.4 Table 3 shows that thisis the case with Nexus devices getting much better scoresthan non-Nexus devices.
Different device manufacturers have very different scores;Table 4 shows the scores for the 10 device manufacturerswith a significant presence in our data with LG (3.97± 0.0out of 10) scoring highest and walton (0.272 ± 0.007 outof 10) scoring lowest. Device manufacturers are considered
4http://www.howtogeek.com/139391/htg-explains-why-android-geeks-buy-nexus-devices/

significant if we have data from at least 100 devices and atleast 10 000 days of contributions. Additionally, for m andu we ignore the days with less than 20 devices contributingto that day’s score.
Even within device manufacturers, different models canhave very different update behaviours and hence security.Table 5 shows the results for the 18 device models whichhave a significant presence by the same metric with GalaxyNexus (4.71± 0.0 out of 10) scoring highest and SymphonyW68 (0.0001±0.0273 out of 10) scoring lowest. We can thentest whether this seems fair by comparing the version datafor the highest and lowest scoring models. Figure 4c showsthe full version distribution for Symphony W68, which weonly observe running one version. Figure 4b shows the fullversion distribution for HTC Desire HD A9191, which usedto be our worst model and for which we have more historicaldata; it shows it received one update at the beginning of2012, which was deployed fairly rapidly to most devices,but received no further updates. Figure 4a shows the sameinformation for Galaxy Nexus which received 49 differentversions, some of which were only deployed to small numbersof devices, but the distribution for all devices regularly andrapidly transitions from one version to another before endingup on ‘4.3 JWR66Y’. Both Galaxy Nexus and HTC DesireHD A9191 device models start off with the full version stringof ‘2.3.3 GRI40’ but the Galaxy Nexus receives many moreupdates over the same time period. Other models from thesame manufacturer with similar model names to HTC DesireHD A9191 do much better such as the Desire HD.
We also analysed the 14 network operators with a signif-icant presence in our data. Table 6 shows the results withO2 uk (3.87 ± 0.0 out of 10) scoring highest and banglalink(0.536± 0.018 out of 10) scoring lowest. However, the scoreof a network operator is affected by the manufacturers of thedevices which are in use on its network. This is in turn af-fected by both the device models a network operator offersto users and upon user’s choice of device models. Hence,having a worse score does not necessarily mean that a net-work operator is worse, it could be that its users all pickphones from a worse device manufacturer, for example, be-cause they were cheaper. A network operator could use datafrom this paper to exclude insecure devices from those of-fered to consumers. An added value analysis of networkoperators, which takes into account the device mix used byusers of that network operator, would make it possible to de-termine whether a network operator is making the situationbetter or worse by the way it ships updates to users. How-ever our sample size is too small to do that because while wehave significant numbers of devices for each of the 18 devicemodels (Table 5) and for each of the 14 network operators(Table 6), we would need a significant number of each modelin each network operator. Since the distribution of devicesis unlikely to be uniformly distributed across device modelsand network operators we estimate that 100 000 unique de-vices are required each day for at least a year. This is notan unobtainable number but it is two orders of magnitudemore than is available in Device Analyzer.
5.3 Update bottleneckIf update delays are due to the delay in manufacturers
providing the update rather than in operators supplying theupdate and users installing the update, we would expect theupdate behaviour of devices with the same device model to
manufacturer model operator nexus±σ 0.211 0.169 0.175 0.632u 0.297 0.804 0.618 1.0m 0.794 0.593 0.969 -1.0f 0.83 0.775 0.934 1.0weight u 0.939 0.996 0.991 1.0weight m 0.976 0.964 0.996 1.0equal 1.0 0.996 1.0 1.0
Table 7: Spearman Rank correlation coefficients for differentmetrics. The uncertainty is constant for each column butdoes not take into account the uncertainty in the score whichproduced the ranking.
be similar and rapid. We found that within 30 days of thefirst observation of a new version on a device, half of alldevices of that model have the new version (or a higher ver-sion) installed, and within 324 days 95% of devices have thenew version (or a higher version). This compares with theaverage rates of deployment for Android OS versions of 350days for half and 1 100 days for 95%. There is a variationbetween device models, with the update being distributedto most devices quickly and others having a much slowerroll out, but since some device models do update quicklythe bottleneck is unlikely to be with the user. Perhaps somedevice models are preferred by users who are more likely toinstall updates than others, however we do observe updatesbeing rolled out to device models quickly and user behaviouris not beyond the control of the device manufacturer. Theycould install updates automatically or pester the user intoinstalling them, and at least some of them do pester, silentautomatic updates do boost uptake [9].
5.4 Sensitivity of scoring metricTo evaluate whether the ranking of different manufactur-
ers is sensitive to the form of the scoring metric we computedthe normalised Spearman’s Rank correlation coefficient be-tween the lists ordered using different forms of the scoringmetric, this is shown in Table 7. In the table, the ‘equal’metric weights f , u and m equally rather than favouring fand makes little difference. Similarly weighting u or m morehighly rather than f makes little difference. While the f , uand m components do have some correlation with the over-all FUM score, the rankings produced vary substantially.Changing the scoring metric also impacts the scores givenfor each entity Table 8 shows the mean impact on the scores.This shows that m tends to drag down scores.
5.5 UtilitarianismFrom a utilitarian standpoint, while small manufacturers
like Symphony and Walton do badly on our scores, theydo not have as many customers as higher scoring manu-facturers. Hence the total risk to users from the higherscoring popular manufacturers is higher than the risk fromthe lower scoring unpopular manufacturers. We could nor-malise for market penetration and so give a score reflectingthe risk posed by that manufacturer’s performance, whichwould tend to decrease the difference between manufactur-ers in our current scoring. Since our scores are provided sothat customers can chose which devices to buy then it is themarginal risk to that individual of that device which is ofinterest rather than the aggregate risk to all users.

Name f u m score(out of 10)
nexus 0.39± 0.00 0.48± 0.00 0.56± 0.01 5.17± 0.02notnexus 0.10± 0.00 0.02± 0.00 0.53± 0.00 2.70± 0.00
Table 3: Security scores for nexus
Name f u m score(out of 10)
LG 0.22± 0.00 0.33± 0.00 0.62± 0.01 3.97± 0.02Motorola 0.18± 0.00 0.12± 0.00 0.71± 0.02 3.07± 0.02Samsung 0.13± 0.00 0.04± 0.00 0.61± 0.00 2.75± 0.00Sony 0.14± 0.00 0.19± 0.00 1.09± 0.02 2.63± 0.02HTC 0.14± 0.00 0.10± 0.00 0.87± 0.01 2.63± 0.02asus 0.20± 0.00 0.51± 0.01 6.01± 0.07 2.35± 0.02other 0.06± 0.00 0.05± 0.00 1.04± 0.01 1.97± 0.02alps 0.03± 0.00 0.19± 0.01 3.99± 0.08 0.80± 0.02Symphony 0.00± 0.00 0.08± 0.00 5.00± 0.05 0.30± 0.01walton 0.00± 0.00 0.09± 0.00 6.00± 0.08 0.27± 0.01
Table 4: Security scores for manufacturers
Name f u m score(out of 10)
Galaxy Nexus 0.50± 0.00 0.54± 0.01 1.53± 0.04 4.71± 0.04Nexus 4 0.30± 0.00 0.82± 0.01 6.06± 0.09 3.69± 0.04Nexus 7 0.26± 0.00 0.74± 0.01 5.92± 0.09 3.25± 0.04other 0.10± 0.00 0.14± 0.00 0.53± 0.00 3.03± 0.00Desire HD 0.08± 0.00 0.05± 0.00 0.38± 0.02 2.91± 0.04HTC Sensation 0.35± 0.00 0.01± 0.01 1.57± 0.05 2.44± 0.05GT-I9100 0.22± 0.00 0.02± 0.00 1.23± 0.02 2.27± 0.02HTC Desire S 0.02± 0.00 0.02± 0.00 1.00± 0.06 1.74± 0.07GT-N7000 0.25± 0.00 0.00± 0.00 2.52± 0.05 1.43± 0.02GT-P1000 0.01± 0.00 0.00± 0.01 1.79± 0.06 0.90± 0.05GT-I9300 0.13± 0.00 0.01± 0.00 6.23± 0.04 0.58± 0.01GT-I9505 0.03± 0.00 0.13± 0.00 6.82± 0.07 0.52± 0.01HTC Desire HD 0.00± 0.00 0.00± 0.01 3.03± 0.05 0.28± 0.03GT-N7100 0.06± 0.00 0.00± 0.01 6.93± 0.08 0.24± 0.02Symphony W68 0.00± 0.00 0.00± 0.01 11.00± 0.12 0.00± 0.03
Table 5: Security scores for models
Name f u m score(out of 10)
O2 uk 0.27± 0.00 0.12± 0.00 0.37± 0.02 3.87± 0.03T-Mobile 0.21± 0.00 0.18± 0.00 0.40± 0.01 3.81± 0.02Orange 0.22± 0.00 0.10± 0.00 0.36± 0.02 3.65± 0.04Sprint 0.18± 0.00 0.11± 0.00 0.43± 0.02 3.42± 0.033 0.20± 0.00 0.09± 0.00 0.47± 0.02 3.39± 0.03Vodafone uk 0.14± 0.00 0.13± 0.00 0.52± 0.03 3.17± 0.04AT&T 0.14± 0.00 0.08± 0.00 0.43± 0.02 3.13± 0.02unknown 0.11± 0.00 0.20± 0.00 0.84± 0.01 2.88± 0.02Verizon 0.19± 0.00 0.09± 0.00 0.82± 0.02 2.84± 0.02n Telenor 0.04± 0.00 0.12± 0.00 1.21± 0.02 1.89± 0.02Airtel 0.05± 0.00 0.03± 0.00 1.47± 0.03 1.41± 0.03Grameenphone 0.00± 0.00 0.04± 0.00 1.88± 0.02 0.94± 0.01Robi 0.00± 0.00 0.08± 0.00 2.07± 0.04 0.91± 0.03banglalink 0.00± 0.00 0.03± 0.00 2.56± 0.04 0.54± 0.02
Table 6: Security scores for operators

Aug 2011
Feb 2012
Aug 2012
Feb 2013
Aug 2013
Feb 2014
Aug 2014
Feb 2015
Aug 2011
Feb 2012
Aug 2012
Feb 2013
Aug 2013
Feb 2014
Aug 2014
Feb 20150.0
0.2
0.4
0.6
0.8
1.0
Pro
port
ion
2.3.3 GRI40
2.3.5 GRJ90
(b) HTC Desire HD A9191
4.4.4 KTU84Q
other
2.3
.4 G
RJ2
2
2.3.6 GINGERBREAD2.3.7 GRJ22
4.0.1 ITL41F
4.0
.2 IC
L5
3F
4.0.3 IML74K
4.0.4 ICL53F
4.0.4 IMM30B
4.0.4 IMM30D4.0.4 IMM76D
4.0.4 IMM76I
4.0.4 IMM76K
4.1 JRN84D
4.1
.1 JR
O0
3C
4.1.1 JRO03L
4.1.1 JRO03O
4.1.1 JRO03R
4.1.1 JRO03U
4.1.2 JZO54K
4.2 JOP40C
4.2.1 JOP40D
4.2.1 JOP40G
4.2
.2 JD
Q3
9
4.2.2 JDQ39E4.3 JLS36G
4.3 JSS15J
4.3 JSS15Q
4.3 JWR66V
4.3 JWR66Y
4.3 JWR67B
4.3.1 JLS36I
4.4.2 KOT49H
4.4.2 KVT49L
4.4.3 KTU84M
4.4.4 KTU84P
(a) Galaxy Nexus
1.0
0.8
0.6
0.4
0.2
0.0
Pro
port
ion
2.3
.3 G
RI4
0
Aug 2011
Feb 2012
Aug 2012
Feb 2013
Aug 2013
Feb 2014
Aug 2014
Feb 20150.0
0.2
0.4
0.6
0.8
1.0
Pro
port
ion
4.2.2 JDQ39
(c) Symphony W68
Figure 4: Full version distributions for the highest and lowest scoring models

manufacturer model operator nexusm −1.67± 2.25 −0.66± 2.54 −3.3± 1.3 −3.4± 1.8weight m −0.264± 0.277 −0.0991± 0.321 −0.461± 0.167 −0.488± 0.217equal −0.108± 0.062 −0.0367± 0.112 −0.146± 0.045 −0.165± 0.033weight u −0.0608± 0.122 −0.0112± 0.232 0.0242± 0.0808 −0.00596± 0.12u 0.367± 1.61 0.219± 2.12 1.55± 0.94 1.42± 1.48f 0.975± 0.564 0.331± 1.01 1.31± 0.41 1.48± 0.3
Table 8: Mean change in scores for different metrics
5.6 Scores over timeThe scoring metric as originally computed, is averaged
over the whole history of the device manufacturer, devicemodel or network operator, it gives equal weight to bothperiods years ago and to the last few months. If insteadwe take an exponential moving average of the daily scorefor days with more than 20 devices when there have beenat least 100 consecutive days of data with that many de-vices then we can plot how this score has changed over time.Equation 2 shows how the value for a particular day (vi) iscomputed from the previous day’s value and the input forthe current day (n) with an α of 1/100.
vi = vi−1(1− α) + nα (2)
Figure 5 shows this for manufacturers, device models, net-work operators and for Nexus and non-Nexus devices. Theseshow how the scores for different entities are different andchange over time, while there is correlated behaviour fordifferent entities (for instance, when new vulnerabilities af-fecting all Android are discovered), these lines still cross dueto the different behaviour of the entities. It also shows thatwe do not have sufficient data for all the entities all of thetime, resulting in gaps in the data. The clearest results arefor Figure 5d with a large gap between the scores for Nexusand non-Nexus devices across the whole data set.
5.7 Gaming the scoreIf the comparative data given here is used to influence
purchasing decisions then entities in the Android ecosystemmight try to game the score rather than genuinely improvesecurity. f is hard to game without doing a good job atsecurity but it doesn’t get any worse if there is already oneknown vulnerability and another is found. A high value ofu could be achieved by only ever shipping one version butthat would give low values for f and m (and not be at-tractive to new customers). A high value of m could beachieved by focusing on only one device at a time and en-suring that it gets updates but ignoring all others, but thatwould lower f and u. One way to influence our scores wouldbe to add additional devices to Device Analyzer, which havegood security, these would have to be real end user devicessince we could detect fake ones if they deviated from thebehaviour of real devices in Device Analyzer. This wouldincrease the size of our data set and would require providinggenuinely good security to some users. Some active attackslike blocking access to the Device Analyzer servers from themobile data network would not be effective as Device Ana-lyzer would retry on Wi-Fi. Other denial of service attackson the Device Analyzer servers might be effective but ille-gal. Some entities might be able to force the uninstallationof the app from all devices. Therefore, our score is secureagainst passive gaming attacks which change the measured
distribution, but would require active defence against activegaming attacks, which target the measurement devices.
6. COMPARISON WITH OTHER DATAWe compare the Device Analyzer data with three other
sources of data and find similar distributions which boundthe Device Analyzer data, indicating that it is likely to betypical. We have obtained comparable data on 5 290 de-vices from a multinational FTSE 100 company’s mobile de-vice management database, which includes company andemployee owned devices, and from 5 170 000 matching User-Agent headers on all HTTP traffic for 30% of Rwanda for aweek. We used the data from the FTSE 100 company for aweek in April 2015 and the User-Agent data was collectedin February 2015. Figure 6 shows the proportion of devicesrunning each Android OS version in the two comparison datasets and the comparable periods from Device Analyzer. Thegeneral pattern this shows is that in the FTSE data newerversions are more popular than in the Device Analyzer dataand that in the Rwanda data old versions are more popu-lar. Therefore the Device Analyzer data on OS versions isbounded by these two data sets.
Unfortunately, there is no ground truth of OS version in-formation. However, we have collated the API version infor-mation that Google has published most months since 2009.5
While API versions are too coarse grained to use for secu-rity update detection they are closely related to OS versions.If the Device Analyzer data on API versions are similar tothe Google data on API versions then the Device Analyzerdata on OS versions should be representative. We comparedthe data from Google and from Device Analyzer and theyare similar. We analysed the difference between the APIversion data from Device Analyzer and Google Play, nor-malising for days since the API version was released. Thisshows that the Device Analyzer data systematically overes-timates the prevalence of new API versions and underesti-mates the prevalence of old API versions. This means thatthe OS version information from Device Analyzer is likelyto be overestimating the prevalence of new OS versions andhence our results are likely to be conservative.
7. RELATED WORKWe assume updates make security better, however the up-
date process for apps, security fixes and OS upgrades alsoneeds to be secure. Unfortunately, package management sys-tems designed to provide secure updates have been found tocontain vulnerabilities [4] and many software update sys-tems fail to authenticate the connection between the device
5http://androidvulnerabilities.org/play/historicplaydashboard

2011-12
-01
2012-06
-01
2012-12
-01
2013-06
-01
2013-12
-01
2014-06
-01
2014-12
-01
2015-06
-010
1
2
3
4
5
6
7
8
HTC
LG
Motorola
Samsung
Sony
Symphony
alps
asus
other walton
(a) Device manufacturers
2011-12-01
2012-06-01
2012-12-01
2013-06-01
2013-12-01
2014-06-01
2014-12-01
2015-06-010
1
2
3
4
5
6
7
8
Desire HD
GT-I9100
GT-I9300
GT-I9505
GT-N7000
GT-N7100
GT-P1000
Galaxy Nexus
HTC Desire HD A9191
HTC Desire S
HTC Sensation Z710e
Nexus 4
Nexus 7
Symphony W68
other
(b) Device models
2011-12-01
2012-06-01
2012-12-01
2013-06-01
2013-12-01
2014-06-01
2014-12-01
2015-06-010
1
2
3
4
5
6
7
3
AT&T
Airtel
Grameenphone
O2 uk
Orange
Robi
Sprint
T-Mobile
Verizon
Vodafone uk
banglalink
n Telenor
unknown
(c) Network operators
2011-12
-01
2012-06
-01
2012-12
-01
2013-06
-01
2013-12
-01
2014-06
-01
2014-12
-01
2015-06
-010
1
2
3
4
5
6
7
8
9
nexus notnexus
(d) Nexus and non-Nexus devices
Figure 5: Security scores for device manufacturers, devicemodels, network operators and Nexus devices. 95% confi-dence intervals indicated.
1.0.0
2.3.3
2.3.4
2.3.5
2.3.6
3.2.0
3.2.1
4.0.3
4.0.4
4.1.1
4.1.2
4.2.1
4.2.2
4.3.0
4.3.1
4.4.2
4.4.3
4.4.4
5.0.0
5.0.1
5.0.2
5.1.0
Version
0.0
0.1
0.2
0.3
0.4
0.5
Proportion
ftse
ftse_da
ua
ua_da
Figure 6: Comparison between FTSE, User-Agent and thecorresponding Device Analyzer data, error bars indicate 95%confidence intervals.
and the update server or do not authenticate the down-loaded binaries [3]. Android does authenticate update bi-naries and Google Play downloads them over a secure con-nection [28]. In this paper we have analysed four criticalvulnerabilities in the Android app update mechanism: APKunsigned shorts, APK unchecked name, APK duplicate fileand Fake ID. Other work has demonstrated complex andsubtle errors exist in the Android app update process. Forexample, the process can be exploited to allow apps to gainprivilege through ‘Pileup’ vulnerabilities by registering fornew permissions before the update which creates that per-mission is installed [33].
We used Device Analyzer to record data on the OS ver-sions of Android installed on devices. Nappa et al. per-formed a similar analysis using WINE to record data on in-stalled versions of Windows client programs and used cleanedNVD data rather than AVO for vulnerability data. They didnot assign client applications scores [20].
We use User-Agent strings from Rwandan internet trafficto examine the version distribution of Android OS versions.User-Agent strings have been used to investigate the time-liness of web browser updates, with at most 80% of Fire-fox users running the most recent version [12]. The sameanalysis was used to show that Chrome’s use of silent up-dates seems to increase uptake of upgrades [8] with 97% ofusers running the latest version within 3 weeks of release.By way of comparison, Android’s update process is manual.The user is notified an update exists, but further action isrequired, including downloading the update and rebootingthe phone to enable installation. The phone must have suf-ficient charge to perform the update and the device itselfis rendered inoperable during the update process, two fac-tors that might prevent or delay the update process fromtaking place. In our data we are unable to determine whya device is not updated. It is possible that many updatesarrive at handsets, but are simply not installed. Anecdotalevidence suggests that it is the lack of updates rather thelack of installation, which is the major problem at present.

Our analysis in §5.3 supports this view. Nevertheless it isproblematic that an operating system update requires a re-boot. Chrome installs the new version side by side with theold one and switches the next time it is restarted. The sametechnique would be more difficult on phones with limitedstorage space (as many cheap Android phones have barelyenough space to install just the update) but is a plausibleimprovement for more high-end devices. Google is deployingthe same silent update technique through Google Play Ser-vices,6 which automatically installs updates for core Googlecomponents of Android, this bypasses the device manufac-turer and network operator.
As well as supplying security updates promptly, the im-pact of vulnerabilities can be reduced through security indepth. In this regard, iOS provides additional safeguardsbeyond those used in Android, including a pre-distributionreview, mandatory code-signing by the manufacturer, and(with the important exception of ROP-based attacks [30])the technical prohibition of dynamic code loading by an app.These features, combined with mandatory access controls,has resulted in a lower level of malware affecting iOS whencompared to Android [10].
There are continuing efforts to reduce the impact of crit-ical vulnerabilities, both in Android and elsewhere. SE-Android [22], which is included in Android from version4.1 [14], and fully enforcing from version 5.0 [15] claimedto prevent some root vulnerabilities and to reduce the im-pact of others. Capability based enforcement systems suchas Capsicum [31] substantially reduce the capabilities withwhich an exploit has to try and gain increased privilege andcould be included in Linux7 and hence Android.
Rather than fixing critical vulnerabilities, security can beobtained by detecting malicious apps and preventing theirinstallation or execution. Detection strategies include Risk-Ranker, which classified 3 281 out of 118 318 apps (2.8%)as risky of which 718 (22%) were malware and 322 (10%)were previously unknown malware, an infection rate of 0.6%across multiple markets [16]. DroidRanger also analysedapps finding 148 out of 182 823 apps (0.08%) to be mali-cious across multiple markets, of which 29 were previouslyunknown [35]. A common technique used by attackers isto include malicious code in repackaged popular apps. An-Darwin uses this insight to detect similar apps, and found169 out of 265 359 of all apps studied (0.06%) were mali-cious clones [7]. Other approaches have made further useof malware dependency graphs [19] or tried to extract fur-ther semantic information to avoid malware being able toavoid detection [34] but simpler approaches based on ex-tracting strings from the binaries can be more effective [2]in terms of false positives and false negatives. There is alack of ground truth data, a danger in training algorithmsbased on APK files that other algorithms have already foundwhich might lead to new malware being missed and Droid-Chameleon showed that existing AntiVirus apps could befooled by simple permutations of malicious APKs [21].
The percentage of Android devices running the currentversion (5.23%) is much less than the rate (> 90%) for Win-dows XP SP2 computers contacting the Microsoft updateservers [13]. A simple numerical comparison is unfair be-cause only one major OS version was considered in the Mi-
6http://lifehacker.com/why-google-play-services-are-now-more-important-than-an-9759701977https://github.com/google/capsicum-linux
crosoft analysis, and data was only collected from comput-ers that contacted the update server (this was the default).Later data demonstrates the difficulty of upgrading com-puters between major OS versions, with 27% of Windowscomputers running Windows XP in July 2014,8 four monthsafter Windows XP stopped receiving security updates.
8. CONCLUSIONThe security of Android depends on the timely delivery
of updates to fix critical vulnerabilities. Unfortunately fewdevices receive prompt updates, with an overall average of1.26 updates per year, leaving devices unpatched for longperiods. We showed that the bottleneck for the delivery ofupdates in the Android ecosystem rests with the manufac-turers, who fail to provide updates to fix critical vulnera-bilities. This arises in part because the market for Androidsecurity today is like the market for lemons: there is infor-mation asymmetry between the manufacturer, who knowswhether the device is currently secure and will receive up-dates, and the consumer, who does not.
Consequently there is little incentive for manufacturers toprovide updates. To address this issue we developed theFUM security metric to quantify and rank the performanceof device manufacturers and network operators, based ontheir provision of updates and exposure to critical vulner-abilities. The metric enables purchasers and regulators todetermine which device manufacturers and network opera-tors provide updates and which do not.
Using a corpus of 20 400 devices we demonstrated thatthere is significant variability in the timely delivery of secu-rity updates across different device manufacturers and net-work operators. We find that on average 87.7% of Androiddevices are exposed to at least one of 11 known critical vul-nerabilities and, across the ecosystem as a whole, assign aFUM security score of 2.87 out of 10. In our data, Nexusdevices do considerably better than average with a score of5.17; LG is the best manufacturer with a score of 3.97.
DatasetMuch of the raw and processed data and source code is avail-able, excluding that which might identify individuals [26].Data from Device Analyzer and AVO used in this paper isalready available. The Rwanda and FTSE data cannot bemade available.
AcknowledgementsThis work was supported by a Google focussed researchaward; and the EPSRC [grant number EP/P505445/1].Thanks to Sherif Akoush and Ripduman Sohan forsupplying the Rwanda data and to staff at the FTSE 100company for supplying their MDM data. Thanks to ouranonymous reviewers for their insightful comments;Richard Clayton, the mobile security reading group, AnilMadhavapeddy and Oliver Chick for reading early drafts;David Robertson for statistical advice; and Laurent Simon,Thomas Coudray, Adrian Taylor, Justin Case, Giant Puneand Khilan Gudka for reporting vulnerabilities.
8https://archive.today/PLGxn

References[1] Acer, M., and Jackson, C. Critical vulnerability in
browser security metrics. Web 2.0 Security & Privacy(W2SP) (2010).
[2] Arp, D., Spreitzenbarth, M., Malte, H., Gascon, H.,and Rieck, K. Drebin: Effective and ExplainableDetection of Android Malware in Your Pocket. In:Network and Distributed System Security (NDSS).Internet Society, San Diego, CA, USA, 02/2014, 23–26.isbn: 1891562355.
[3] Bellissimo, A., Burgess, J., and Fu, K. Secure softwareupdates: disappointments and new challenges. In:USENIX Hot Topics in Security. USENIX, 2006, 37–43.
[4] Cappos, J., and Samuel, J. Package managementsecurity. Tech. rep. University of Arizona, ComputerScience Department, 2008, 1–20.
[5] CESG End User Devices Security Guidance: Android4.2. 10/2013. url:https://www.gov.uk/government/publications/end-user-devices-security-guidance-android-42 (visitedon 2015-07-28).
[6] CESG Samsung Galaxy S6 & S6 Edge - CertificationDetails. 07/2015. url:http://www.cesg.gov.uk/servicecatalogue/Product-Assurance/CPA/Pages/Samsung-Galaxy-S6-and-S6-Edge-Certification-Details.aspx (visited on 2015-07-24).
[7] Crussell, J., Gibler, C., and Chen, H. AnDarwin:Scalable Detection of Semantically Similar AndroidApplications. In: Computer Security–ESORICS. SpringerBerlin Heidelberg, 2013, pp 182–199. isbn:978-3-642-40202-9.
[8] Duebendorfer, T., and Frei, S. Web browser securityupdate effectiveness. Lecture Notes in Computer Science(LNCS) 6027 LNCS (2010), 124–137. issn: 03029743.
[9] Duebendorfer, T., and Frei, S. Why silent updatesboost security. Tech. rep. April. ETH Zurich, 2009.
[10] Felt, A. P., Finifter, M., Chin, E., Hanna, S., andWagner, D. A survey of mobile malware in the wild.Proceedings of the 1st ACM workshop on Security andprivacy in smartphones and mobile devices. SPSM ’11 55(2011), 3.
[11] Forristal, J. Uncovering Android Master Key ThatMakes 99% of Devices Vulnerable. 03/2013. url:https://bluebox.com/technical/uncovering-android-master-key-that-makes-99-of-devices-vulnerable/(visited on 2015-04-08).
[12] Frei, S., Duebendorfer, T., and Plattner, B. Firefox(in)security update dynamics exposed. ACM SIGCOMMComputer Communication Review 39, 1 (2008), 16–22.
[13] Gkantsidis, C., Karagiannis, T., and Vojnovic, M.Planet scale software updates. ACM SIGCOMMComputer Communication Review 36 (2006), 423. issn:01464833.
[14] Google Jelly Bean version information. 2015. url:https://developer.android.com/about/versions/jelly-bean.html (visited on 2015-04-08).
[15] Google, and Ludwig, A. Android Security 2014 Year inReview. 04/2015. url: https://source.android.com/devices/tech/security/reports/Google_Android_Security_2014_Report_Final.pdf.
[16] Grace, M., Zhou, Y., Zhang, Q., Zou, S., and Jiang, X.RiskRanker: Scalable and Accurate Zero-day AndroidMalware Detection. In: Mobisys. 2012, 281–293. isbn:9781450313018.
[17] Grace, M., Zhou, Y., Wang, Z., and Jiang, X.Systematic detection of capability leaks in stock Androidsmartphones. Network and Distributed System SecuritySymposium (NDSS) (2012).
[18] HTC The anatomy of an Android OS update. 2013. url:http://www.htc.com/us/go/htc-software-updates-process/ (visited on 2015-06-03).
[19] Lindorfer, M., Neugschwandtner, M.,Weichselbaum, L., Fratantonio, Y., Veen, V. van der,and Platzer, C. ANDRUBIS - 1,000,000 Apps Later: AView on Current Android Malware Behaviors. In: BuildingAnalysis Datasets and Gathering Experience Returns forSecurity (BADGERS). Wroclaw, Poland, 09/2014.
[20] Nappa, A., Johnson, R., Bilge, L., Caballero, J., andDumitras, T. The Attack of the Clones : A Study of theImpact of Shared Code on Vulnerability Patching. IEEESymposium on Security and Privacy (2015), 692–708.
[21] Rastogi, V., Chen, Y., and Jiang, X. DroidChameleon:evaluating Android Anti-malware against TransformationAttacks. In: Symposium on Information, Computer andCommunications Security (ASIA CCS). March. ACM,2013, 329–334. isbn: 978-1-4503-1767-2.
[22] Smalley, S., and Craig, R. Security Enhanced (SE)Android: Bringing Flexible MAC to Android. Network andDistributed System Security Symposium (NDSS) (2013).
[23] Soghoian, C., and Wizner, B. ACLU FTC Androidupdates. 2013. url:http://www.aclu.org/files/assets/aclu_-_android_ftc_complaint_-_final.pdf.
[24] Taylor, J. R. An introduction to error analysis. 2nd ed.University Science Books Sausalito, California, 1997. isbn:093570275X.
[25] Thomas, D. R., and Beresford, A. R.AndroidVulnerabilities.org. 2015. url:http://androidvulnerabilities.org/.
[26] Thomas, D. R., Wagner, D. T., Beresford, A. R., andRice, A. Supporting data for: “Security metrics for theAndroid ecosystem”. 07/2015. url:https://www.repository.cam.ac.uk/handle/1810/249077(visited on 2015-07-27).
[27] Thomas, D. R., Beresford, A. R., Coudray, T.,Sutcliffe, T., and Taylor, A. The lifetime of AndroidAPI vulnerabilities: case study on the JavaScript-to-Javainterface. In: Security Protocols XXIII. Springer, 03/2015.
[28] Viennot, N., Garcia, E., and Nieh, J. A measurementstudy of Google Play. SIGMETRICS (2014).
[29] Wagner, D. T., Rice, A., and Beresford, A. R. DeviceAnalyzer: Large-scale mobile data collection. In:Sigmetrics, Big Data Workshop. ACM, Pittsburgh, PA,06/2013.
[30] Wang, T., Lu, K, Lu, L., Chung, S., and Lee, W. Jekyllon iOS: when benign apps become evil. USENIX SecuritySymposium (2013), 559–572.
[31] Watson, R. N. M., Anderson, J., Kennaway, K., andLaurie, B. Capsicum: practical capabilities for UNIX. In:USENIX Security Symposium. Vol. 46. 2. USENIXAssociation, 08/2010, 29–46.
[32] Wright, J. L. Software vulnerabilities: lifespans, metrics,and case study. PhD thesis. University of Idaho, 2014.
[33] Xing, L., Pan, X., Wang, R, Yuan, K., and Wang, X.Upgrading Your Android, Elevating My Malware:Privilege Escalation Through Mobile OS Updating. IEEESecurity and Privacy (2014).
[34] Zhang, M., Duan, Y., Yin, H., and Zhao, Z.Semantics-Aware Android Malware Classification UsingWeighted Contextual API Dependency Graphs. In: CCS.ACM, 2014. isbn: 9781450329576.
[35] Zhou, Y., Wang, Z., Zhou, W., and Jiang, X. Hey, you,get off of my market: Detecting malicious apps in officialand alternative Android markets. In: Network andDistributed System Security Symposium (NDSS). 2. SanDiego, CA, 02/2012.