securitization without risk...
TRANSCRIPT
Securitization Without Risk Transfer1
Viral V. Acharya2, Philipp Schnabl3, and Gustavo Suarez4
First draft: March 1, 2009
This draft: January 25, 2010
Abstract
We analyze asset-backed commercial paper conduits which played a central role in the early phase of the financial crisis of 2007-09. We document that commercial banks set up conduits to securitize assets while insuring the newly securitized assets using credit guarantees. The credit guarantees were structured to reduce bank capital requirements, while providing recourse to bank balance sheets for outside investors. Consistent with such recourse, we find that banks with more exposure to conduits had lower stock returns at the start of the financial crisis; that during the first year of the crisis, asset-backed commercial paper spreads increased and issuance fell, especially for conduits with weaker credit guarantees and riskier banks; and that losses from conduits mostly remained with banks rather than outside investors. These results suggest that banks used this form of securitization to concentrate, rather than disperse, financial risks in the banking sector while reducing their capital requirements.
1 Authors are grateful to Matt Richardson and faculty members at Stern School of Business, New York University for discussions on the topic and to research staff at Moody’s and Fitch Ratings for detailed answers to our queries. We thank David Skeie and Dennis Kuo for advice on bank call report data. We are also grateful to Christa Bouwman, Florian Heider, and Amit Seru (discussants) and seminar participants at the 2010 Meeting of the American Finance Association, the Stockholm Institute of Financial Research Conference on the Financial Crisis of 2007-09, the European Winter Finance Conference 2010, the European Central Bank, the Federal Reserve Banks of New York and Richmond, the University of Southern California, and the University of North Carolina at Chapel Hill. This paper represents the views of the authors and not necessarily those of the Federal Reserve System or its Board of Governors. 2 Viral V Acharya, Department of Finance, Stern School of Business, New York University, 44 West 4th Street, Room 9-84, New York, NY-10012, US. Tel: +1 212 998 0354, Fax: +1 212 995 4256, e-mail: [email protected]. Acharya is also a Research Affiliate of the Centre for Economic Policy Research (CEPR) and Research Associate in Corporate Finance at the National Bureau of Economic Research (NBER) and European Corporate Governance Institute (ECGI). 3 Philipp Schnabl, Department of Finance, Stern School of Business, New York University, 44 West 4th Street, Room 9-76, New York, NY-10012, US. Tel: +1 212 998 0356, Fax: +1 212 995 4256, e-mail: [email protected] 4 Gustavo A Suarez, Research & Statistics Division, Federal Reserve Board, 20th Street & Constitution Avenue, NW, Washington, DC-20551, US. Tel: +1 202 452 3011, Fax: +1 202 728-5887, email: [email protected]
-1-
Securitization was traditionally meant to transfer risks from the banking sector to
outside investors and thereby disperse financial risks across the economy. However, in
the period leading up to the financial crisis of 2007-09, banks increasingly devised
securitization methods that allowed them to concentrate risks on their balance sheets
which eventually led to the largest banking crisis since the Great Depression.
In this paper, we analyze one form of securitization, namely asset-backed
commercial paper conduits (henceforth, conduits), as an example of how banks exposed
themselves to such risks. Conduits are structured purpose vehicles set up by large banks.
Conduits typically hold medium- to long-term assets claims, such as mortgages, which
are financed by issuing short-term asset-backed commercial paper. Similar to regular
banks, conduits thus exhibit a significant maturity mismatch between assets and
liabilities.
As shown in Figure 1, before the financial crisis asset-backed commercial paper
was an important funding source for commercial banks growing from US$650 billion in
January 2004 to US$1.2 trillion in June 2007. However, the rise in asset-backed
commercial paper came to an abrupt end in August 2007. On August 9, 2007, the French
bank BNP Paribas halted withdrawals from three funds invested in mortgage-backed
securities and suspended calculation of net asset values.5 Even though defaults on
mortgages had been rising throughout 2007, the suspension of withdrawals had a
5 The announcement read: “[T]he complete evaporation of liquidity in certain market segments of the US securitization market has made it impossible to value certain assets fairly regardless of their quality or credit rating […] Asset-backed securities, mortgage loans, especially subprime loans, don't have any buyers […] Traders are reluctant to bid on securities backed by risky mortgages because they are difficult to sell on […] The situation is such that it is no longer possible to value fairly the underlying US ABS assets in the three above-mentioned funds.” (Source: “BNP Paribas Freezes Funds as Loan Losses Roil Markets,” Bloomberg.com, August 9, 2008).

-2-
profound effect on the asset-backed commercial paper market. Apparently investors in
asset-backed commercial paper, primarily money market funds, became concerned about
the collateral backing asset-backed commercial paper and stopped refinancing maturing
asset-backed commercial paper. As a result, as shown in Figure 2, the interest rate spread
of overnight asset-backed commercial paper over the Federal Funds rate increased from
10 basis points to 150 basis points within one day of the announcement. Subsequently,
the market experienced the modern-day equivalent of a bank run and asset-backed
commercial paper outstanding dropped from $1.2 trillion in August 2007 to $833 billion
in December 2007.
Our analysis shows that the crisis in the asset-backed commercial paper market
had a profoundly negative effect on commercial banks because banks had insured outside
investors in asset-backed commercial paper. The reason is that banks had provided credit
guarantees to conduits, which required banks to pay off maturing asset-backed
commercial paper independently of underlying asset values. These guarantees were
explicit legal commitments to repurchase maturing asset-backed commercial paper in
case of disruptions to liquidity in the market for such paper, not a voluntary form of
implicit recourse.6 The guarantees were mostly structured as “liquidity enhancements”, a
design that would help reduce their regulatory capital requirements to at most a tenth of
capital required to hold for on-balance sheet assets. For the majority of conduits, the
credit guarantees were strong enough to cover all possible losses of outside investors.
For a minority of conduits, the credit guarantees were weaker and required banks to cover
only a share of the losses.
6 However, there was some scope for implicit recourse in the case of weaker credit guarantees.
-3-
We establish these findings using a hand-collected panel dataset on the universe
of conduits from January 2001 to December 2008. We document and describe the
structure of the credit guarantees that effectively created recourse from conduits back to
bank balance sheets. We refer to conduits as securitization without risk transfer because
outside investors would suffer losses only if the credit guarantees provided by the banks
and the value of the conduit assets were both insufficient to repay the asset-backed
commercial paper. Hence, this form of securitization did not transfer the risks of the
securitized assets risk from banks to outside investors.
Consistent with the motive for setting up conduits being one of “regulatory
arbitrage”, we find that most credit guarantees were structured as liquidity enhancements
to avoid bank’s regulatory requirements while exposing banks to the same risks as on-
balance sheet financing. In fact, we show that conduit sponsors other than commercial
banks (which among financial institutions are subject to the most stringent capital
requirements) were far less likely to use such structures. Also, we note that banks based
in countries such as Spain and Portugal that do not allow such regulatory arbitrage do not
sponsor conduits. These results suggest, and indeed we document, that the effective
leverage of commercial banks was significantly larger than that implied by their on-
balance sheet leverage or their capitalization from a regulatory standpoint.
In our empirical analysis, we test whether conduits were a form of securitization
without significant risk transfer and find three main empirical results. First, we show that
commercial banks with larger exposure to conduits had larger declines in stock returns at
the start of the financial crisis on August 9, 2007. An increase in conduit exposure
(measured as the ratio of asset-backed commercial paper to bank equity) from 0% to
-4-
100% (e.g., moving from Wells Fargo to Citigroup) reduced stock returns by 1.5
percentage points in a three-day window around the start of the financial crisis. The
effect of conduit exposure on stock returns increases to 2.9 percentage points when we
expand the event-window to one month. The result is robust to using alternative
measures of conduit exposure and controlling for a large set of observable bank
characteristics. We also show that there is no relationship between conduit exposure and
stock returns in the pre-crisis period.
Second, we use a novel conduit-level data set to study daily issuances and spreads
of asset-backed commercial paper both before and during the financial crisis. We find
that conduits with weaker credit guarantees have a larger decline in issuances and a larger
increase in spreads after the start of the financial crisis. This finding is robust to
controlling for unobservable time-invariant conduit characteristics and unobservable
time-variant sponsor characteristics. We further find that the results are stronger for
riskier banks (as measured by credit default swap spreads), which suggests that the
differential effect across different types of credit guarantees is determined by the
financial strength of the sponsor and that credit guarantees are an important part of
conduits’ ability to issue asset-backed commercial paper after the start the financial crisis.
Third, we examine the extent of realized risk transfer by analyzing whether
investors could rely on the credit guarantees offered by financial institutions during the
crisis. We take the perspective of an investor that was holding asset-backed commercial
paper at the start of the crisis and examine whether the investor suffered losses by not
refinancing maturing asset-backed commercial paper. Using announcement data from
Moody’s Investors Services, we identify all conduits that defaulted on asset-backed
-5-
commercial paper in the period from January 2007 to December 2008. We find that all
investors in conduits with strong credit guarantees were repaid in full. We find that
investors in conduits with weak credit guarantees suffered small losses. In total, only
2.5% of asset-backed commercial paper outstanding as of July 2007 entered default in the
period from July 2007 to December 2008. Hence, most of the losses on conduit assets
remained with sponsoring banks. Assuming a loss rate of 10%, we estimate that
commercial banks suffered losses of $102 billion on conduit assets.
These results raise the question why banks used conduits for the purpose of
securitization. We note that asset-backed commercial paper is different from other forms
of securitization, such as mortgage-backed securities, in which most of assets’ credit risk
is transferred to other investors. Instead, conduits are similar to on-balance sheet
financing because the conduit assets’ credit risk effectively remains with the bank. The
main difference between on-balance sheet financing and financing via conduits is that
conduit assets are considered off- balance sheet for the purpose of capital regulation and
therefore banks need to hold far less regulatory capital against assets in conduits relative
to assets on the balance sheet.
Finally, we emphasize that all of our evidence on the performance and effects of
conduits is necessarily ex post. It is possible that ex ante the risks of credit guarantees
were ignored by bank management due to poor risk management that did not keep pace
with that of financial engineering, or ineffective corporate governance, or simply short-
termism – phenomena that may have been the result of deeper underlying causes such as
increased competition in banking activities, resulting erosion of margins and franchise
values, and the moral hazard due to government guarantees such as deposit insurance and

-6-
the too-big-to-fail doctrine. Investigating these underlying causes is an important
question for future work. It is to be noted, however, that the lack of ex-post risk transfer
coupled with the ex-ante structure of credit guarantees that allowed close to zero capital
requirements is highly suggestive of leverage-seeking or capital-reducing incentives on
parts of commercial banks.
The remainder of this paper is organized as follows. Section 2 presents the
related literature. Section 3 discusses the institutional background. Section 4 presents
the data and our main empirical results. Section 5 analyzes the incentives of banks to set
up conduits. Section 6 concludes.
2. Related literature
Gorton and Souleles (2005), Gorton (2008), Brunnermeier (2009), and
Kacperczyk and Schnabl (2009) provide examples of maturity transformation outside the
regulated banking sector. Our focus, in contrast to theirs, is to provide an in-depth
analysis of the structure of asset-backed commercial paper conduits: how risk transfer
was designed to take place through conduits and how it materialized and contributed to
the start of the financial crisis of 2007-09.
Ashcraft and Schuermann (2008) present a detailed description of the process of
securitization of subprime mortgages, of which conduits were one component. Nadauld
and Sherland (2008) study the securitization by investment banks of AAA-rated tranches
– “economic catastrophe bonds” as explained by Coval et al. (2008) – and argue that the
change in the SEC ruling regarding the capital requirements for investment banks spurred
them to engage in excessive securitization. Nadauld and Sherland (2008) view the banks
-7-
as warehousing these risks for further distribution whereas Shin (2009) argues that banks
were concentrating highly-leveraged risk exposures (given the low capital requirements)
by so doing.
Our view in this paper is more along the lines of Shin (2009), Acharya and
Richardson (2009), and Acharya and Schnabl (2009a), that banks were securitizing
without transferring risks to outside investors, and in particular, conduits were a way of
taking on systemic risk of the underlying pool of credit risks. In an analysis focused on
the economic causes of the increasing propensity of the financial sector to take such risks
(in one class of conduits – the “credit arbitrage” vehicles), Arteta et al. (2008) provide
evidence consistent with government-induced distortions and corporate governance
problems being the root causes (see also the arguments in Calomiris (2009)). Covitz et
al. (2009) use data on asset-backed commercial paper and show that the decline in
securitized assets was driven by both market-wide factors and program fundamentals.
Our results on the difficulty in rolling over asset-backed commercial paper and
the rise in their spreads are somewhat akin to the analysis of the run on the repo market
by Gorton and Metrick (2009). They document that a counterparty risk measure for the
banking sector as a whole, the “LIB-OIS” spread, explained over time the variation in the
credit spreads of a large number of securitized bonds and the rise in repo haircuts, that is,
the difference between the market value of an asset and its secured borrowing capacity.
However, there are important differences between our “laboratory” and theirs. While
conduits resemble repo transactions to some extent, the presence of explicit credit
guarantees in conduits establishes a direct linkage between the ability to issue
commercial paper and the guarantees provided by the sponsor. We can therefore test
-8-
directly for the impact of the guarantees on commercial paper issuance and spreads using
variation across and within conduit sponsors over time.
3. Institutional Background
3.1. Conduit Structure
Figure 3 illustrates the typical conduit structure. A conduit is set up by a
sponsoring financial institution (henceforth, sponsor). The sole purpose of a conduit is to
purchase and hold financial assets from a variety of asset sellers. The conduit finances
the assets by selling asset-backed commercial paper to outside investors such as money
market funds or local governments.
Conduits typically exhibit a significant maturity mismatch. Most of the conduit
assets are medium- to long-term assets with maturities of three to five years. Most of the
conduit liabilities are asset-backed commercial paper with a maturity of 30 days or less.
Conduits thus regularly roll over their liabilities and use proceeds from new issuances of
asset-backed commercial paper to pay off maturing asset-backed commercial paper.
Most conduits minimize their credit risk by holding a diversified portfolio of high
quality assets. Typically, they are restricted to purchasing AAA-rated assets or unrated
assets of similar quality. Some conduits exclusively purchase unrated assets originated
by their sponsoring financial institutions. Other conduits mostly purchase securitized
assets originated by other financial institutions. Many conduits combine the two
strategies by purchasing both securitized and unsecuritized assets from several financial
institutions.

-9-
Outside investors consider asset-backed commercial paper a safe investment for
three reasons. First, the pool of conduit assets is used as collateral to secure the asset-
backed commercial paper. Second, the conduit’s sponsor provides credit guarantees to
the conduit, which ensures that the sponsor repays maturing asset-backed commercial
paper in case the conduit is unable to repay itself. Third, asset-backed commercial paper
is very short-term, so that investors can easily liquidate their investment by not rolling
over maturing asset-backed commercial paper.
Conduits can generate significant risks for the sponsor. The sponsor’s credit
guarantees typically covers the conduit’s roll-over risk, which is the risk that a conduit
cannot refinance maturing commercial paper, possibly because of a deterioration of
conduit asset values. In that case, the sponsor has to assume the losses from lower asset
values, because under the credit guarantee sponsors are required to repurchase assets at
face value or repay asset-backed commercial paper at par value. In exchange, the
sponsor usually receives the entire conduit’s profit.
From an incentive perspective, the use of credit guarantees to align risk and
rewards within the sponsor is consistent with the optimal allocation of control rights
under asymmetric information. Sponsors often use conduits to purchase assets originated
by their customers or by themselves and may be better informed about asset quality than
outside investors. The use of credit guarantees thus avoids the incentive problem inherent
in other forms of securitization, in which the asset originator transfers most of the risks
associated with the assets to outside investors. Instead credit guarantees ensure that
sponsors have strong incentives to screen the conduit’s asset purchases (e.g. see
Ramakrishnan and Thakor (1984), Calomiris and Mason (2004) and Keys et al. (2009)).

-10-
The credit guarantees are also important because they ensure that asset-backed
commercial paper qualifies for the highest available rating from accredited national rating
agencies. In turn, the high ratings ensure that money market funds are legally permitted
to invest in asset-backed commercial paper (Kacperczyk and Schnabl (2009)).
Conduit sponsors use four different types of credit guarantees which provide
different level of insurance to outside investors. The four types of guarantees, ranked
from strongest to weakest, are full credit guarantees (“full credit”), full liquidity
guarantees (“full liquidity”), extendible notes guarantees (“extendible notes”), and
guarantees arranged via structured investment vehicles (“SIV”). We briefly describe the
structure of each credit guarantee.
Full credit guarantees are guarantees that require the sponsor to pay off maturing
asset-backed commercial paper independent of the conduit assets’ value. Full liquidity
guarantees are similar to full credit guarantees with the main difference being that the
sponsor only needs to pay off maturing asset-backed commercial paper if conduits assets
are not in default. In theory, full liquidity guarantees can expire before the asset-backed
commercial matures, namely if the conduit assets are in default. In practice, however,
full liquidity guarantees provide the same strength as full credit guarantees because the
definition of asset default is chosen such that the asset-backed commercial paper matures
before the assets are declared in default.
For example, default of unrated assets is usually a function of a slow-moving
variable such as a delinquency rate. Hence, if outside investors expect that conduits
assets may default in the future, they stop refinancing maturing asset-backed commercial
paper. As we show below, throughout the first year of the financial crisis, asset-backed
-11-
commercial paper supported by full liquidity guarantees was always repaid in full prior to
the expiration of the full liquidity guarantees.
Extendible notes guarantees are similar to full liquidity guarantees with the main
difference being that the conduit issuer has the discretion to extend maturing commercial
paper for a limited period of time (usually 60 days or less). By extending the maturity of
the commercial paper, it is more likely that the conduits assets are in default before the
commercial paper matures. From the investor’s viewpoint, extendible notes guarantees
are therefore riskier than full liquidity guarantees.
SIV guarantees are also similar to full liquidity guarantees with the main
difference being that SIV guarantees only cover a share of the conduit liabilities (usually
around 25%). In exchange, conduits with SIV guarantees issue longer-maturity debt such
as medium-term notes and subordinated capital. Since SIV guarantees only cover some
of a conduit’s liabilities, we consider SIV guarantees as providing partial insurance to
outside investors.
The partial retention of risk, as in the case of extendible notes and SIVs
guarantees, is consistent with security design models. In contrast, lack of any risk
transfer, as in the case of full credit and full liquidity conduits is at odds with such models
unless the underlying assets are mostly all of low quality, an unlikely scenario especially
when these conduits were set up. While the desire to get asset-backed commercial paper
to be rated highly could explain why sponsor banks provide substantial guarantees to
conduits, we explain below that reducing capital requirements explains why they are
primarily structured in the form of full liquidity guarantees.

-12-
3.2. Capital Requirements
Bank regulators have developed extensive regulation to deal with risks from off-
balance sheet exposure such as conduits. Since almost all conduits were sponsored by
banks based in the United States and European countries, we focus on bank regulation in
these countries.
In the United States, bank regulators historically made a distinction between full
credit and full liquidity guarantees. Full credit guarantees were considered to be
equivalent to on-balance sheet financing. Hence, assets covered by full credit guarantees
required the same regulatory capital charges as assets on the balance sheet. In contrast,
full liquidity guarantees were considered to be of lower risk and required no capital
charges.
In 2001, bank regulators in the United States started a formal review of its
regulatory treatment of full credit and full liquidity guarantees. The review was triggered
by the bankruptcy of the large energy company Enron, which had sponsored off-balance
sheet vehicles similar to conduits. In response, some observers suggested that conduits
should have capital charges similar to on-balance sheet financing, independent of whether
they were covered by full credit or full liquidity guarantees. Regulators discussed this
issue for two years and, as shown in Figure 1, total asset-backed commercial paper
remained stable during that period.
In late 2003, the Financial Accounting Standard Board issued a directive which
required commercial banks to consolidate special purpose vehicles in which it was the
main beneficiary. This new directive implied that sponsors had to consolidate conduits to
which they provided credit guarantees. In late 2004, a consortium of bank regulators,

-13-
namely the Office of the Comptroller of the Currency, the Federal Reserve Board, the
Federal Deposit Insurance Corporation, and the Office of Thrift Supervision, declared
asset-backed commercial paper conduits as being exempted from this directive. Under
the exemption, assets in conduits were not considered assets for the purpose of
calculating capital requirements. Instead, bank regulators required that banks had to hold
capital at a conversion factor of 10% against the amount covered by full liquidity
guarantees. This implied that regulatory charges for conduit assets were 90% lower than
regulatory charges for on-balance sheet financing (Gilliam (2005)). As shown in Figure
1, asset-backed commercial paper grew rapidly after the exemption was issued.
In Europe, most countries had similar capital requirements as in the United States
until 2004. Full credit guarantees had full regulatory charges, but full liquidity
guarantees had no capital charges. The only exceptions were Spain and Portugal which
required full capital charges for both full credit and full liquidity guarantees (Acharya and
Schnabl, 2009b).
The main difference between the United States and Europe was that European
banks started to adopt International Financial Reporting Standards (IFRS) in the early
2000s. IFRS, contrary to U.S. General Accepted Accounting Principles (GAAP), do not
recognize asset transfers to conduits as a true sale. As a result, European banks were
required to consolidate conduits on their balance sheets. However, most European
regulators did not update capital regulation following IFRS. Hence, for the purpose of
computing regulatory requirements and risk weighted assets, conduits were considered
off-balance sheet and European banks did not have to hold any capital against conduit
assets.
-14-
Another difference between the United States and European countries was that
European bank regulators were in the process of adopting the Basel II framework (U.S.
commercial banks were still operating under Basel I). Under the Basel II standardized
approach, the capital requirements for conduit assets increase from 0% to 20% relative to
on-balance sheet financing. Moreover, Basel II assumes lower risk weights for AAA-
rated securities, which reduces the level of regulatory charges for both off-balance sheet
and on-balance sheet financing. At the time of financial crisis, several European banks
had adopted Basel II rules, while others were still operating under Basel I. Importantly,
both Basel I and Basel II rules allowed for “regulatory arbitrage” of capital requirements,
although it was smaller under the new regime.
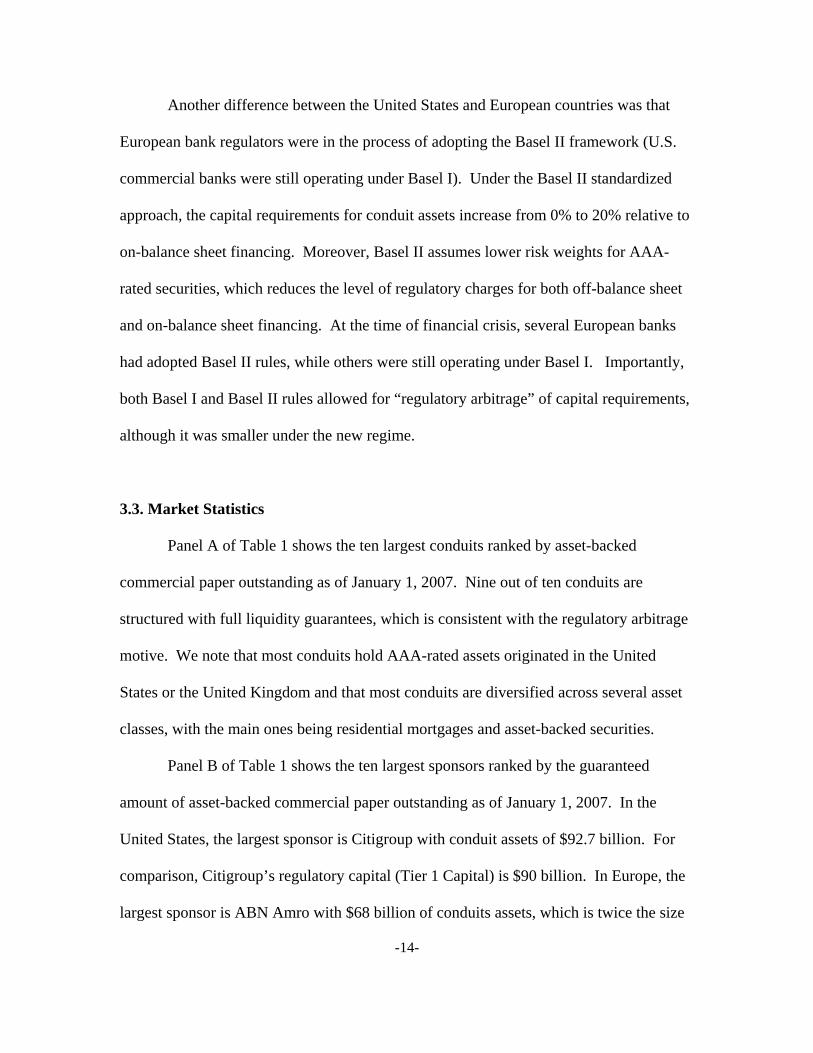
3.3. Market Statistics
Panel A of Table 1 shows the ten largest conduits ranked by asset-backed
commercial paper outstanding as of January 1, 2007. Nine out of ten conduits are
structured with full liquidity guarantees, which is consistent with the regulatory arbitrage
motive. We note that most conduits hold AAA-rated assets originated in the United
States or the United Kingdom and that most conduits are diversified across several asset
classes, with the main ones being residential mortgages and asset-backed securities.
Panel B of Table 1 shows the ten largest sponsors ranked by the guaranteed
amount of asset-backed commercial paper outstanding as of January 1, 2007. In the
United States, the largest sponsor is Citigroup with conduit assets of $92.7 billion. For
comparison, Citigroup’s regulatory capital (Tier 1 Capital) is $90 billion. In Europe, the
largest sponsor is ABN Amro with $68 billion of conduits assets, which is twice the size

-15-
of its regulatory capital (ABN Amro later merged with Royal Bank of Scotland). All
sponsors are large multinational banks based in the United States and European countries.
Table 2 provides summary statistics for all conduits authorized to issue asset-
backed commercial paper as of January 1, 2007. Panel A shows that there are 301
conduits with total paper outstanding of $1,236 billion. The average conduit size is $4.1
billion with a standard deviation of $5.1 billion. Regarding credit guarantees, 61% of
asset-backed commercial paper is covered by full liquidity guarantees, 13% is covered by
full credit guarantees, 18% is covered by extendible notes guarantees, and 7% is covered
by SIV guarantees.
The largest conduit type is multiseller conduits with $548 billion in asset-backed
commercial paper. Multiseller conduits purchase assets from more than one seller. The
assets are typically not securitized and the sellers are often clients of the sponsor. The
main asset types held by multiseller conduits are trade receivables (15%), securities
(12%), auto loans (11%), credit card receivables (10%), and commercial loans (9%). The
second-largest type is credit arbitrage conduits with $213 billion in asset-backed
commercial paper. Credit arbitrage conduits usually purchase securitized assets from
many sellers. The main asset types held by arbitrage conduits are residential mortgage
loans (26%), collateralized loan obligations and collateralized bond obligations (21%),
commercial mortgage loans (12%), and commercial loans (11%). The third-largest type is
single-seller conduits with $173 billion in asset-backed commercial paper. Single-seller
conduits are often used by mortgage originators to warehouse assets before they are
securitized. Most asset-backed commercial paper is issued in U.S. dollars ($922 billion)

-16-
and Euro ($219 billion). The remainder is issued in Yen, Australian dollars, and New
Zealand dollars.
Panel B of Table 2 presents summary statistics for all sponsors as of January 1,
2007. We define a sponsor as a single consolidated company and aggregate asset-backed
commercial paper at the holding level. In total, there are 127 sponsors, each of which, on
average, sponsors $9.7 billion of asset-backed commercial paper. The largest sponsor
type is commercial banks, which sponsor $911 billion of asset-backed commercial paper.
The second largest type is structured finance groups with $156 billion in asset-backed
commercial paper. Contrary to commercial banks, structured finance groups usually do
not have the financial resources to provide credit guarantees. Instead they purchase credit
guarantees from other financial institutions. Unfortunately our data do not contain
information to identify the provider of credit guarantees to conduits of structured finance
groups. Other large sponsor types are mortgage lenders ($76 billion), investment
managers ($18 billion) and investment banks ($11 billion).
In terms of location, the majority of conduits are sponsored by financial
institutions based in the United States with $491 billion of asset-backed commercial
paper. A large number of sponsors are based in Germany and the United Kingdom with
asset-backed commercial paper of $204 billion and $195 billion, respectively. The
remaining $347 billion are sponsored by financial institutions based in other countries,
including financial institutions based in Australia, Belgium, Canada, France, Netherlands,
and Japan.
In Table 3 we provide a breakdown of credit guarantees by sponsor type. We find
that more than 74% of conduits sponsored by commercial banks had full liquidity

-17-
guarantees. In contrast, 6% of conduits sponsored by structured finance groups had full
liquidity guarantees. Similarly, other sponsor types are also far less likely to provide full
liquidity guarantees to conduits. This evidence is consistent with the regulatory arbitrage
motive because, as described above, commercial banks has a stronger incentive to reduce
capital requirements using this specific structure, whereas the regulation typically does
not apply to other sponsor types.
We also note that the geographic distribution of sponsors is consistent with the
regulatory arbitrage motive. As mentioned above, bank regulators in Portugal and Spain
had the same capital requirements for assets on the balance sheet and conduit assets.
Interestingly, we find that banks located in these two countries do not sponsor asset-
backed commercial paper conduits.
4. Empirical Analysis
4.1. Data
We use several different data sources for the analysis in this paper. For the first
part of the empirical analysis, we use ratings reports from Moody’s Investors Service for
the period from January 2001 to March 2009. During this period, Moody’s Investors
Service rated 938 conduits. The rating reports are typically three to five pages and
contain information on conduit sponsor, conduit type, conduit assets, credit guarantees,
and a verbal description of the conduit. Moody’s Investors Service publishes the first
report when a conduit is first rated and subsequently updates the reports annually. For
some larger conduits, Moody’s Investors Service also publishes monthly monitoring
reports. Monthly reports are typically one page and comprise information on conduit

-18-
size, credit guarantees, and conduit assets. In addition, Investors Service publishes a
quarterly spreadsheet that summarizes basic information on all active conduits.
To construct our data set, we start with the universe of conduits collected from
Moody’s Investors Service’s quarterly spreadsheets. We merge conduits that have more
than one funding operation (79 out of 9536 observations). We drop asset-backed
commercial paper issued by collateralized debt obligations because their credit
guarantees are not comparable to the rest of the sample (292 out of 9536 observations).
For each conduit, we aggregate asset-backed commercial paper at level of the
consolidated financial company (e.g., we aggregate paper sponsored by Citibank South
Dakota and Citibank New York). We use data from Bankscope and Osiris to identify
sponsors. Once we identify a potential match, we verify the information using the
company website. If we cannot identify a sponsor via Bankscope or Osiris, we conduct
an internet search.
We construct a panel of the 300 largest banks as of January 2007 using the
Bankscope database. If a consolidated company and its subsidiaries have more than one
entry in Bankscope, we only keep the consolidated company. We use the ISIN identifier
to match Bankscope data to share price data and stock return data from Datastream. If a
bank does not have an ISIN identifier, we verify with the company website that the bank
is not listed on a stock exchange. We then match the Bankscope data to the Moody’s
Investors Service’s data.
For the second part of the empirical analysis, we use a proprietary data set on all
asset-backed commercial paper transactions conducted in the United States from January
2007 to February 2008. The data set contains 777,758 primary market transactions by
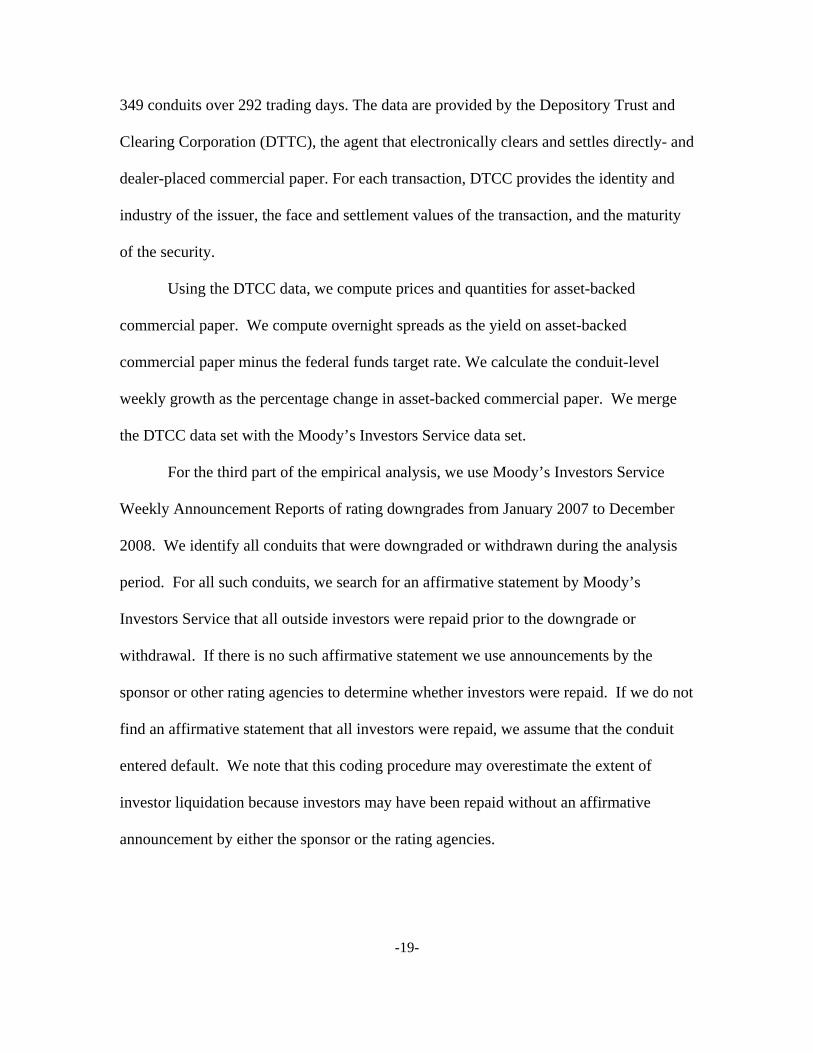
-19-
349 conduits over 292 trading days. The data are provided by the Depository Trust and
Clearing Corporation (DTTC), the agent that electronically clears and settles directly- and
dealer-placed commercial paper. For each transaction, DTCC provides the identity and
industry of the issuer, the face and settlement values of the transaction, and the maturity
of the security.
Using the DTCC data, we compute prices and quantities for asset-backed
commercial paper. We compute overnight spreads as the yield on asset-backed
commercial paper minus the federal funds target rate. We calculate the conduit-level
weekly growth as the percentage change in asset-backed commercial paper. We merge
the DTCC data set with the Moody’s Investors Service data set.
For the third part of the empirical analysis, we use Moody’s Investors Service
Weekly Announcement Reports of rating downgrades from January 2007 to December
2008. We identify all conduits that were downgraded or withdrawn during the analysis
period. For all such conduits, we search for an affirmative statement by Moody’s
Investors Service that all outside investors were repaid prior to the downgrade or
withdrawal. If there is no such affirmative statement we use announcements by the
sponsor or other rating agencies to determine whether investors were repaid. If we do not
find an affirmative statement that all investors were repaid, we assume that the conduit
entered default. We note that this coding procedure may overestimate the extent of
investor liquidation because investors may have been repaid without an affirmative
announcement by either the sponsor or the rating agencies.
-20-
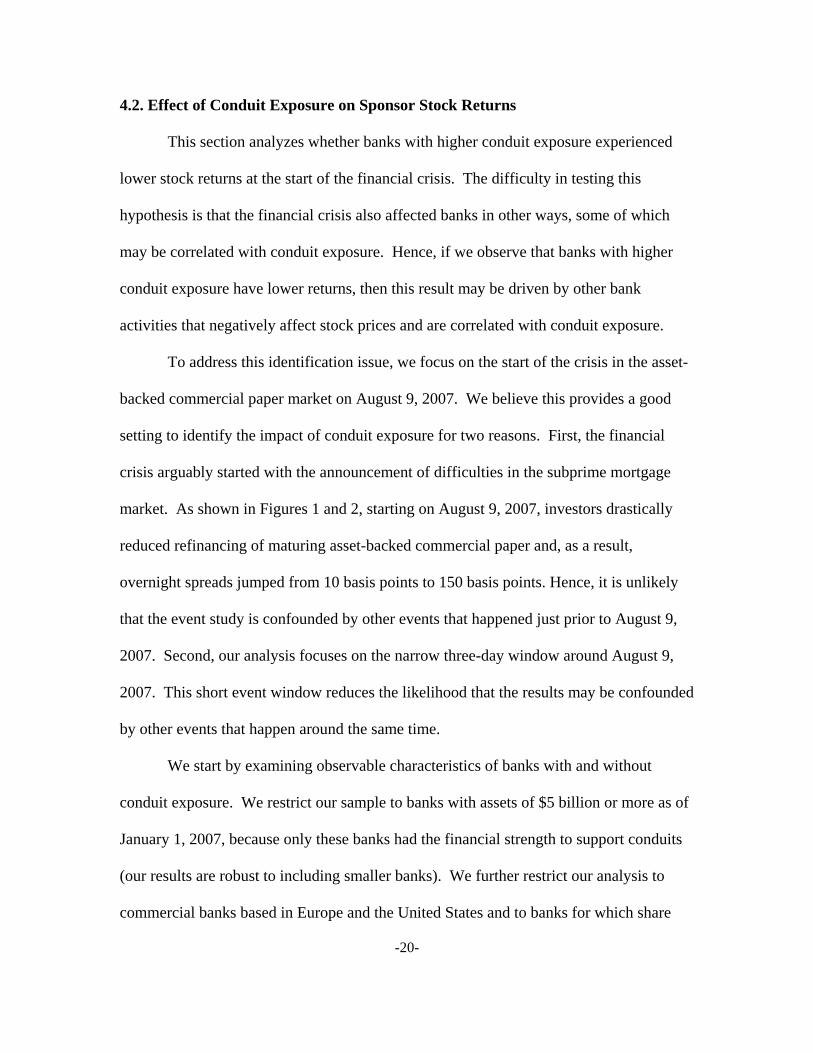
4.2. Effect of Conduit Exposure on Sponsor Stock Returns
This section analyzes whether banks with higher conduit exposure experienced
lower stock returns at the start of the financial crisis. The difficulty in testing this
hypothesis is that the financial crisis also affected banks in other ways, some of which
may be correlated with conduit exposure. Hence, if we observe that banks with higher
conduit exposure have lower returns, then this result may be driven by other bank
activities that negatively affect stock prices and are correlated with conduit exposure.
To address this identification issue, we focus on the start of the crisis in the asset-
backed commercial paper market on August 9, 2007. We believe this provides a good
setting to identify the impact of conduit exposure for two reasons. First, the financial
crisis arguably started with the announcement of difficulties in the subprime mortgage
market. As shown in Figures 1 and 2, starting on August 9, 2007, investors drastically
reduced refinancing of maturing asset-backed commercial paper and, as a result,
overnight spreads jumped from 10 basis points to 150 basis points. Hence, it is unlikely
that the event study is confounded by other events that happened just prior to August 9,
2007. Second, our analysis focuses on the narrow three-day window around August 9,
2007. This short event window reduces the likelihood that the results may be confounded
by other events that happen around the same time.
We start by examining observable characteristics of banks with and without
conduit exposure. We restrict our sample to banks with assets of $5 billion or more as of
January 1, 2007, because only these banks had the financial strength to support conduits
(our results are robust to including smaller banks). We further restrict our analysis to
commercial banks based in Europe and the United States and to banks for which share

-21-
price data is available. We choose this restriction because some countries outside the
United States and Europe (in particular Canada) allowed for differently structured credit
guarantees which are not comparable.
Table 4 shows the distribution of banks by conduit exposure. We measure
conduit exposure as asset-backed commercial paper outstanding relative to equity capital
as of January 1, 2007. We sort banks into three groups: banks without conduits, banks
with low conduit exposure, and banks with high conduit exposure. Consistent with our
main hypothesis, we find that stock returns were lower for banks with higher conduit
exposure. In fact, the data suggest that stock returns monotonically decrease in conduit
exposure.
Columns (3) and (4) of Table 4 show that banks with low conduit exposure and
banks with high conduit exposure are fairly similar in observable characteristic such as
total assets and equity. The main difference is that banks with low conduit exposure have
slightly higher equity ratios and slightly more short-term financing than banks with high
conduit exposure. Also, banks with low conduit exposure are more likely to be located in
the United States than banks with high conduit exposure.
To control for difference in observable characteristics, we estimate the baseline
specification:
where is the cumulative stock return of bank i computed over the three-day period
from August 8, 2007, to August 10, 2007, is bank i’s conduit exposure,
are bank i’s observable characteristics as of January 1, 2007, and is a bank-specific
-22-
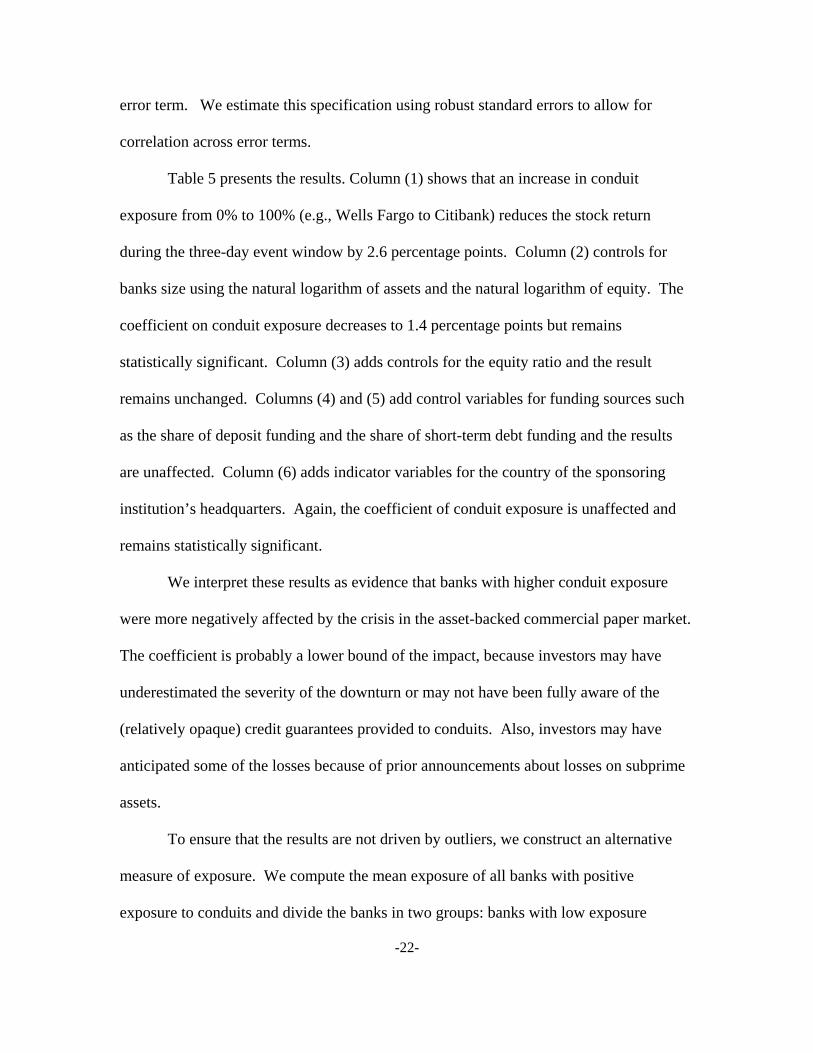
error term. We estimate this specification using robust standard errors to allow for
correlation across error terms.
Table 5 presents the results. Column (1) shows that an increase in conduit
exposure from 0% to 100% (e.g., Wells Fargo to Citibank) reduces the stock return
during the three-day event window by 2.6 percentage points. Column (2) controls for
banks size using the natural logarithm of assets and the natural logarithm of equity. The
coefficient on conduit exposure decreases to 1.4 percentage points but remains
statistically significant. Column (3) adds controls for the equity ratio and the result
remains unchanged. Columns (4) and (5) add control variables for funding sources such
as the share of deposit funding and the share of short-term debt funding and the results
are unaffected. Column (6) adds indicator variables for the country of the sponsoring
institution’s headquarters. Again, the coefficient of conduit exposure is unaffected and
remains statistically significant.
We interpret these results as evidence that banks with higher conduit exposure
were more negatively affected by the crisis in the asset-backed commercial paper market.
The coefficient is probably a lower bound of the impact, because investors may have
underestimated the severity of the downturn or may not have been fully aware of the
(relatively opaque) credit guarantees provided to conduits. Also, investors may have
anticipated some of the losses because of prior announcements about losses on subprime
assets.
To ensure that the results are not driven by outliers, we construct an alternative
measure of exposure. We compute the mean exposure of all banks with positive
exposure to conduits and divide the banks in two groups: banks with low exposure
-23-
(below mean) and banks with high exposure (above mean). We estimate the baseline
specification using indicator variables for banks with low exposure and bank with high
exposure and in unreported results find qualitatively and quantitatively similar effects.
We also drop outliers in terms of conduit exposure and banks with less than $50 billion in
assets and our results are qualitatively and qualitatively unchanged.
Our results rely on the identifying assumption that there is no omitted variable
that is correlated with conduit exposure and that directly affects stock returns. We think
this assumption is plausible because we use to a tight estimation window to isolate the
impact of the crisis in the asset-backed commercial paper market. To check the
robustness of this assumption, we also estimate the base-line specification for the pre-
period. We use the results from this estimation to assess whether conduit exposure is
correlated with the outcome variables in the absence of a disruption in the asset-backed
commercial paper market.
Table 6 presents the results using a window of 15 trading days before and 15
trading days after the event date. We compute the cumulative stock return in the three-
day window around each day and estimate the baseline specification using the full set of
controls. Column (2) reports the coefficients on conduit exposure and Column (3) reports
the standard errors of the coefficients. In the pre-period, all coefficients are close to zero
and statistically insignificant. Hence, there is no evidence that conduit exposure is
correlated with stock returns in absence of a disruption in the asset-backed commercial
paper market. In the post-period, we find five dates with a significant effect of conduit
exposure on stock returns. This finding suggests that stock returns of high exposure
banks were more correlated after the disruption in the asset-backed commercial paper
-24-
market. One possible interpretation of this result is that investors continued to revise
their expectation about the negative impact of conduit exposure after the start of the
financial crisis.
We also examine the relation of conduit exposure and stock returns in the months
prior to August 2007. For each month from January 2007 to August 2007, we estimate
the same set of regressions as in Table 4 including all controls. Table 7 present the
results. We find no statistically significant relationship between conduit exposure and
stock returns from January 2007 to July 2007. However, in the month of the crisis in the
asset-backed commercial paper market, August 2007, we find a negative and statistically
significant effect of conduit exposure on stock returns after controlling for the full set of
observables. The coefficient is twice as large as the coefficient in Table 4. Again, this
finding suggests that investors revised their expectation of the negative effect of conduit
exposure on stock returns upwards for several days after the start of the financial crisis.
However, we caution our interpretation because the estimation is over a longer event
window and therefore may be confounded by other factors.
4.3. Impact of Credit Guarantees on Spreads and Issuance
As shown in Figure 1, asset-backed commercial paper declined dramatically after
the start of the financial crisis on August 9, 2007. By the end of year, the asset-backed
commercial paper market was roughly 30 percent smaller than it was at its peak in July.
Importantly for our analysis, the extent of the decrease varied substantially by type of
credit guarantee. Figure 4 shows that asset-backed commercial paper covered by
extendible guarantees or SIV guarantees decreased significantly more than asset-backed

-25-
commercial paper covered by full credit and full liquidity guarantees. Similarly, Figure 5
shows that the overnight spread on asset-backed commercial paper covered by extendible
guarantees and SIV guarantees increased more than the spread on asset-backed
commercial paper covered by full credit and full liquidity guarantees.7
Our hypothesis is that credit guarantees (full credit or full liquidity) are necessary
for sponsor banks to obtain highest rating on ABCP of conduits. If this were true, then
conduits with such guarantees should face lower rollover risk during the crisis compared
to extendible notes and SIVs which had weaker guarantees. To test this impact of credit
guarantees more formally, we compute issuances and spreads of overnight asset-backed
commercial paper both before and after the start of the financial crisis.
We restrict our sample to the period from January 2007 to February 2008. We
choose this period because it captures the main decline in asset-backed commercial paper
but does not include later events that may confound our analysis (e.g., Bear Stearns
merger, Lehman bankruptcy). We restrict the sample to conduits sponsored by
commercial banks because we lack data on the provider of credit guarantees for other
conduits. We further restrict our sample to banks for which there is data on CDS spreads
(The main results are stronger if we include banks without CDS spreads).
Table 8 presents summary statistics for spreads and growth rates before and after
the start of the financial crisis. We find that asset-backed commercial paper decreased
for all categories after the start of the financial crisis, but the decrease is stronger for
conduits with weaker guarantees. For example, conduits with extendible notes
7 We focus on overnight spreads because most newly issued ABCP has maturities of 1 to 4 days. According to data from the Federal Reserve Board, roughly 60 percent of newly issued ABCP in the U.S. has maturities of one to four days prior to the crisis. Our results are similar when considering one-month spreads (one month is the second most frequent maturity after overnight).
-26-
guarantees went from a weekly growth rate of 0.2% before August 2007 to a negative
growth rate of 12.5% after August 2007; in contrast, conduits with full liquidity
guarantees went from a weekly growth rate of 0.01% before August 2007 to a negative
growth rate of 3.4% after August 2007.
Similarly, overnight spreads increased after the start of the financial crisis for all
types of guarantee, but it increased more for conduits with weaker guarantees. For
example, conduits with SIV guarantees went from paying the Federal Funds rate for
issuing overnight paper before the August 2007 to paying 72 basis points over the Federal
Funds rate after August 2007; by contrast, conduits with full liquidity guarantees went
from paying the Federal Funds rate before August 2007 to paying 43 basis points over the
Federal Funds rate after August 2007. 8
Next, we test whether the patterns on issuance and spreads by type of guarantee
are statistically significant and robust to controlling for unobservable sponsor and conduit
characteristics. Our baseline specification is:
where ∆ represents the log change in the face value of commercial paper outstanding
of conduit i in week t. is a fixed effect by type of guarantee. is an
indicator variable that equals one after the start of the crisis (after August 9, 2007) and
zero before the crisis. and represent fixed effects by sponsor and by
week, respectively. We also estimate regression in which we control for conduit fixed
effects and sponsor-time fixed effects .
8 We note that the summary statistics contain more observations for overnight spreads than growth rates because spreads are reported daily but growth rates are reported weekly. We further note that the summary statistics on overnight spreads comprise fewer conduits than the summary statistics for weekly growth rates because some conduits only issue commercial paper with maturities longer than overnight.
-27-
We are primarily interested in the coefficient on the interaction of and
, which captures the average change in the growth of commercial paper
outstanding by credit guarantee after the start of the financial crisis. We cluster standard
errors at the sponsor level to allow for the correlation of error terms within sponsors.
If the financial crisis makes investors more concerned about risks in conduits, we
expect the interactions between dummies for weaker guarantees and the indicator
to be more negative than those for stronger guarantees. Furthermore, if full credit and
full liquidity support provide the same level of protection for investors during the crisis,
we expect the interaction between the dummy for full credit support with the
dummy to be statistically insignificant. Together these hypotheses are aimed at
uncovering whether credit guarantees were important for outside investors to roll over
maturing asset-backed commercial paper.
Column (1) in Table 9 reports the results of estimating our baseline specification.
The significant coefficient on the interaction between the indicator and the
dummies for programs with extendible notes and SIVs suggest that asset-backed
commercial paper decreased more for conduits with weaker guarantees compared to
conduits with stronger guarantees. We note that we include sponsor fixed effects and
therefore we compare conduits with different guarantees for the same sponsor (i.e., we
control for time-invariant unobservable sponsor characteristics). As shown in column
(2), the results are similar when we replace sponsor-fixed effects with conduit-fixed
effects. The insignificant dummy on the interaction of the after dummy and full credit
guarantees suggests that full liquidity and full credit support are statistically
undistinguishable after the start of the financial crisis.

-28-
In Column (3), we add the full set of interactions of sponsor and time fixed effects
to the regression. Hence, the fixed effects control for all unobserved time variation at the
sponsor level and the coefficients are identified off only variation within a sponsor across
conduits at a given point in time. We find that the coefficients are similar in sign and
magnitude but not statistically significant. However, we find it reassuring that our results
yield very similar results after controlling for unobserved variation at the sponsor level.
An alternative measure of the strength of the guarantee is the riskiness of the
sponsor as measured, for example, by the sponsor CDS spread. We expect that the
decrease in asset-backed commercial paper of conduits with weaker credit guarantees is
more pronounced if the sponsor is risky. We test this hypothesis by adding sponsor CDS
spreads and their two-way interactions with the dummies for type of guarantee and the
indicator to the baseline specification.
Columns (4) to (6) of Table 9 report the results. We find a negative and
statistically significant effect on the interaction of sponsor CDS spreads with weaker
guarantees. This finding suggests that issuance is indeed determined by the strength of
the effective guarantee. We note that the result is robust to including conduit fixed
effects, sponsor fixed effects, and sponsor-time fixed effects.
We also estimate the impact of credit guarantees on overnight spreads of asset-
backed commercial paper. Again, our baseline specification is:
where is the overnight spread (1 to 4 days of maturity) over the Federal Funds
rate on new issues by conduit i on day t. All right-hand side variables have the same

-29-
interpretation as in the issuance regression, but time-dependent variables are now
measured daily.
Columns (1) to (3) of Table 10 show that, after controlling for sponsor fixed-
effects, conduit-fixed effects, and sponsor-time fixed effects, conduits with SIV
guarantees have significantly higher spreads after the start of the crisis than other credit
guarantees. We also find a positive effect for extendible note guarantees, but the
coefficients are not always statistically significant. Columns (4) to (6) add sponsor CDS
spreads and their two-way interactions. We find that the increase in spreads for
extendible guarantees and SIV guarantees is more pronounced for conduits with riskier
sponsors, as measured by the sponsor CDS spread. The insignificant dummy for full
credit support suggests that investors price full credit and full liquidity similarly after the
start of the financial crisis.
One possible concern with this analysis is that credit guarantees may be correlated
with unobservable characteristics that also affect spreads and issuance after the start of
the financial crisis. This may be the case if stronger credit guarantees cover assets which
perform better during the financial crisis. To the best of our knowledge, most conduits
were highly diversified but we cannot control directly for asset composition due to lack
of data. However, Moody’s Investors Service provides a classification according to
investment type, which groups conduits that follow similar investment strategies. In
particular, we want to use this classification to distinguish between conduits that invest
primarily in assets originated by their own clients (multiseller conduits) and conduits that
invest in securitized assets often originated by other banks (credit arbitrage conduits).
-30-
To ensure the robustness of our results, we therefore estimate the issuance and
spread regressions by conduit type. As shown in Table 2, multiseller conduits and credit
arbitrage conduits are the two largest conduit types and represent 62% of asset-backed
commercial paper outstanding as of January 2007. We estimate spreads and issuance
regressions separately. We note that multiseller conduits primarily use full liquidity, full
credit, and extendible notes guarantees and arbitrage conduits primarily use full liquidity
and SIV guarantees. We therefore focus our analysis on the main credit guarantees for
each conduit type.
We report the main result in Table 11. We focus on regressions with conduit
fixed effects and sponsor-time fixed effects. We do not report regression with sponsor
fixed effects because they yield qualitatively and quantitatively similar results as
regressions with conduit fixed effects. Similarly, we do not report results for regressions
with interactions of CDS prices because they yield similar results as above.9
For multiseller conduits, Columns (1) and (2) show that extendible notes conduits
experience a stronger decrease in commercial paper growth rates after the start of the
financial crisis than conduits with full liquidity guarantees or full credit guarantees. For
credit arbitrage conduits, Columns (3) and (4) show that conduits with SIV guarantees
have larger declines than conduits with full liquidity guarantees. Columns (5) to (8) find
similar results for the spread regressions. Among multiseller conduits, conduits with
extendible notes guarantees have larger spreads than conduits with full liquidity
guarantees or full credit guarantees and, among credit arbitrage conduits, conduits with
SIV guarantees have higher spreads than conduits with full liquidity guarantees after the
9 The results are available upon request from the authors.
-31-
start of the financial crisis. Most coefficients are statistically significant except in some
of the specifications with sponsor-time fixed effects. Overall, these results suggest the
effect of credit guarantees on issuance and spreads is robust for conduits with similar
investment strategies.
In summary, we find that after the start of the financial crisis conduits with
weaker guarantees decreased issuance more and paid higher spreads than conduits with
stronger guarantees. These patterns are stronger for weaker sponsors as measured by
CDS prices, suggesting that quantities and prices in the asset-backed commercial paper
market are indeed highly correlated with the strength of the sponsoring banks. Also, the
patterns suggest that the full credit guarantees and full liquidity guarantees were an
important part of rendering asset-backed commercial paper essentially risk-free from the
point of view of investors.
4.4. Realized Losses of Outside Investors
This section examines the extent of realized risk transfer by analyzing whether
investors were repaid after the start of the financial crisis. We take the perspective of an
investor that was holding asset-backed commercial paper at the start of the crisis and
examine whether the investor suffered losses by not refinancing maturing asset-backed
commercial paper. We test the performance of credit guarantees using Moody’s
Investors Service announcement data from January 2007 to December 2008. Since all
conduits are rated, Moody’s Investors Service always issues an announcement if a
conduit fails to pay off maturing paper or if a conduit exits the market.

-32-
Table 12 presents the results on the realized performance of credit guarantees.
Column (1) shows asset-backed commercial paper outstanding per credit guarantee in
July 2007. Columns (2) to (4) show the value-weighted percentage in three categories:
conduits that were closed down and repaid all maturing asset-backed commercial paper
before December 2008, conduits that remained active and repaid all maturing commercial
paper up to December 2008, and conduits that have failed to repay maturing asset-backed
commercial paper and entered default by December 2008.
The table shows that not a single conduit covered by full credit or full liquidity
guarantees defaulted by December 2008. In contrast, 7.4% of conduits covered by
extendible notes guarantees and 16.7% of conduits covered by SIV guarantees defaulted
by December 2008, respectively. Regarding the sponsor type, we find that conduits
sponsored by structured finance firms and mortgage companies were significantly more
likely to enter default than conduits sponsored by commercial banks. Overall, we note
that 97.5% of outside investors in asset-backed commercial paper were fully repaid.
We also estimate bank losses on conduits. Losses depend on the loss rate on
conduit assets and unfortunately there is no publicly available information with respect to
loss rates on these assets. The AAA-tranche of ABX-index suggests that the value of
collateralized mortgage obligations backed by subprime mortgages dropped by up to 60
percent in months after the start of the financial crisis. The losses on conduit assets are
likely to be significantly smaller because most conduits were diversified across asset
classes. We therefore assume more conservative loss rates of 5% and 15%. Under this
assumption, we estimate total losses on conduit assets of $68 billion and $204 billion,
respectively. The estimated losses for outside investors are $1.8 billion and $30.4 billion
-33-
respectively. Consistent with the lack of risk transfer, this analysis shows that most of
the losses were borne by sponsors rather than outside investors. However, the level of
the estimated losses is only suggestive because we lack the data to compute actual losses.
5. Benefits to banks of securitization without risk transfer
The empirical analysis shows that banks suffered significant losses because
conduits were unable to roll over maturing asset-backed commercial paper. This raises
the question of how large was the benefit to banks from by setting up conduits.
We can assess the benefits to banks by quantifying how much profit conduits
yielded to banks from an ex-ante perspective using a simple back-of-the-envelope
calculation. Assuming a risk weight of 100% for underlying assets, banks could avoid
capital requirements of roughly 8% by setting up conduits relative to on-balance sheet
financing. We assume that banks could finance debt at close to the riskless rate, which is
consistent with the rates paid on asset-backed commercial paper before the start of the
financial crisis. Further assuming an equity beta of one and a market risk premium of
5%, banks could reduce the cost of capital by 8%*5%=0.004 or 40 basis points by setting
up conduits relative to on-balance sheet financing.
It is difficult to estimate the profits generated by conduits because only a few
banks report revenues from conduits. For example, Deutsche Bank reports in its annual
report in December 2007 that conduits generated fees of Euro 6 million relative to a total
commitment of Euro 6.3 billion. Similarly, Bank of New York Mellon reports in
December 2006 revenues of $3 million relative to a commitment of $3.2 billion (Arteta et

-34-
al., 2008). Assuming that conduits have no costs and revenues are equal to profits, banks
earned about 10 basis points on conduit assets.
Comparing this cost and benefit of conduits, it seems clear that conduits would
not have been profitable if banks had been required to hold equity against their assets in
conduits. In fact, banks would have made a loss of 30 basis points on each dollar
invested. However, given that banks were not required to hold equity, they could earn a
“profit” of 10 basis points. Conduits were thus a relatively low-return activity but offered
a way for banks to attract money-market savings and increase bank size without
increasing regulatory capital.
Table 13 lists the 30 largest conduit sponsors. We find that missing capital - the
additional capital if conduit asset had been on bank balance sheet - was on average 6.1%
of total equity or about $68 billion in total across banks. This is not necessarily a large
amount of equity capital, but it masks considerable heterogeneity across banks as the
proportion of missing capital ranges from 1.7% to 79.9% of capital levels. The bank with
the largest exposure, Sachsen Landesbank, was the first large bank to be bailed out on 17
August 2007 because it was unable to provide the credit guarantees it had extended to its
conduits. Other banks with large exposure such as Westdeutsche Landesbank and ABN
Amro (later bought by Royal Bank of Scotland) also suffered large losses due to recourse
from conduits and had to be bailed out. Hence, for some smaller banks the conduit
activities were in fact large enough to wipe out the entire bank capital. For lager banks,
conduit activities were small enough to withstand the losses on conduit assets, but these
banks were weakened as the financial crisis continued.

-35-
In summary, we point out that an ex-ante capital requirement of 8% against
conduit assets would not have been sufficient to cover all possible losses from conduits
when the assets declined in value. However, the key observation is that a full capital
charge would have been sufficient to discourage banks from setting up conduits in the
first place.
6. Conclusion
In this paper we analyze asset-backed commercial paper conduits and show how
the structure of risk-sharing in these conduits implies recourse back to bank balance-
sheets. We find that outside investors who purchased asset-backed commercial paper had
little loss even when collateral backing the conduits deteriorated in quality, supporting
our main finding that conduits were a form of securitization without risk transfer. We
also find that the stock price deterioration of banks at the start of the financial crisis was
linked to the extent of their conduit exposure relative to equity capital. Once the crisis
broke out, asset-backed commercial paper spreads rose and issuance fell, and more so
where guarantees were weaker and sponsoring banks were weaker.
Our analysis makes it clear that from an economic standpoint conduits are
unregulated banks that operate in the shadow banking world, but with recourse to
regulated entities, mainly commercial banks, that have access to government safety net.
Our results also indicate that when these unregulated banks do not have such recourse
(extendible notes and SIVs), they struggle to survive a systemic crisis. While some may
interpret this finding to justify the accordance of government safety net to all those parts
of the shadow banking world that perform maturity mismatch like banks, the bigger

-36-
lesson in our view is that the shadow banking world needs to be brought under the
purview of prudential regulations.
In particular, the structure of credit guarantees to asset-backed commercial paper
conduits was designed by commercial banks precisely to arbitrage regulatory capital
requirements. Such possibilities – whereby government-insured banks effectively
operate at higher leverage by putting assets off-balance sheet but granting them recourse
– deserve regulatory scrutiny, especially when they operate at a scale that conduits did.
Regulation should either treat off-balance sheet activities with recourse as on-balance
sheet for capital requirement and accounting disclosure purposes, or, require that off-
balance sheet activities do not have recourse to bank balance sheets. The current
treatment appears to be a recipe for disaster, from the standpoint of transparency as well
as capital adequacy of the financial intermediation sector as a whole.
-37-
References
Acharya, Viral V. and Matthew Richardson, 2009. “Causes of the Financial Crisis”, Critical Review, 21(2–3), 195–210.
Acharya, Viral V. and Philipp Schnabl, 2009a. “How Banks Played the Leverage ‘Game’”, Chapter 2 in Acharya, Viral V. and Matthew Richardson (editors), 2009. “Restoring Financial Stability: How to Repair a Failed System”, New York University Stern School of Business, John Wiley & Sons. Acharya, Viral V. and Philipp Schnabl, 2009b. “Do Global Banks spread Global Imbalances? The Case of Asset-Backed Commercial Paper during the Financial Crisis of 2007-09”, Working Paper, New York University. Arteta, Carlos, Mark Carey, Ricardo Corrrea, and Jason Kotter, 2008, “Revenge of the Steamroller: ABCP as a Window on Risk Choices”, Working Paper, Board of Governors of the Federal Reserve. Ashcraft, Adam and Til Schuermann, 2008, “Understanding the Securitization of the Subprime Mortgage Credit”, Federal Reserve Bank of New York staff reports.
Brunnermeier, Markus, 2009. “Deciphering the Liquidity and Credit Crunch of 2007-08”, Journal of Economic Perspectives, 23(1), 77-100. Calomiris, Charles, 2009, “Financial Innovation, Regulation and Reform”, forthcoming, the Cato Journal. Calomiris, Charles and Joseph Mason, 2004, “Credit Card Securitization and Regulatory Arbitrage”, Journal of Financial Services Research 26(1), 5-27
Coval, Joshua, Jakub Jurek and Erik Stafford, 2009, “Economic Catastrophe Bonds,” forthcoming American Economic Review. Covitz, Daniel, Nellie Liang and Gustavo Suarez, 2009, “The Anatomy of a Financial Crisis: The Evolution of Panic-Driven Runs in the Asset-Backed Commercial Paper Market,” Working Paper, Board of Governors of the Federal Reserve. Gilliam, Lee, 2005, “Accounting Consolidation versus Capital Calculation: The Conflict Over Asset-Backed Commercial Paper Programs”, North Carolina Banking Institute Journal, Volume 9 Gorton, Gary, 2008, “The Panic of 2007”, Yale University working paper. Gorton, Gary and Andrew Metrick, 2009, Securitized Banking and the Run on Repo, Working Paper, Yale University.

-38-
Gorton, Gary and Nicholas S. Souleles, 2005, Special purpose vehicles and securitization, NBER Working Paper No. 11190.
Kacperczyk, Marcin and Philipp Schnabl, 2009, “When Safe Proved Risky: Commercial Paper during the Financial Crisis of 2007-2009”, Working Paper, New York University. Keys, Benjamin, Tanmoy Mukherjee, Amit Seru and Vikrant Vig, 2008. “Did Securitization Lead to Lax Screening? Evidence form Subprime Loans?” forthcoming, Quarterly Journal of Economics.
Nadauld, Taylor D. and Shane M. Sherlund, 2008. “The Role of the Securitization Process in the Expansion of Subprime Credit”, Working Paper, Ohio State University. Ramakrishnan, Ram T.S. and Anjan V. Thakor, Information reliability and a theory of financial intermediation, Review of Economic Studies, 51, 415–432
Shin, Hyun Song, 2009, “Securitization and Financial Stability” paper presented as the Economic Journal Lecture at the Royal Economic Society meeting, Warwick, March 2008.

Figure 1: Asset-backed Commercial Paper Outstanding This figure shows total asset-backed commercial paper outstanding in the U.S. market from January 2004 to April 2009. The figure is based on weekly data published by the Federal Reserve Board.
500
600
700
800
900
1000
1100
1200
1300
1/7/2004 1/7/2005 1/7/2006 1/7/2007 1/7/2008 1/7/2009
Billion

Figure 2: Asset-Backed Commercial Paper Spread This figure shows the spread of overnight asset-backed commercial paper over the Federal Funds rate from January 2007 to December 2008. The figure is based on market data published by the Federal Reserve Board.
‐1
0
1
2
3
4
5
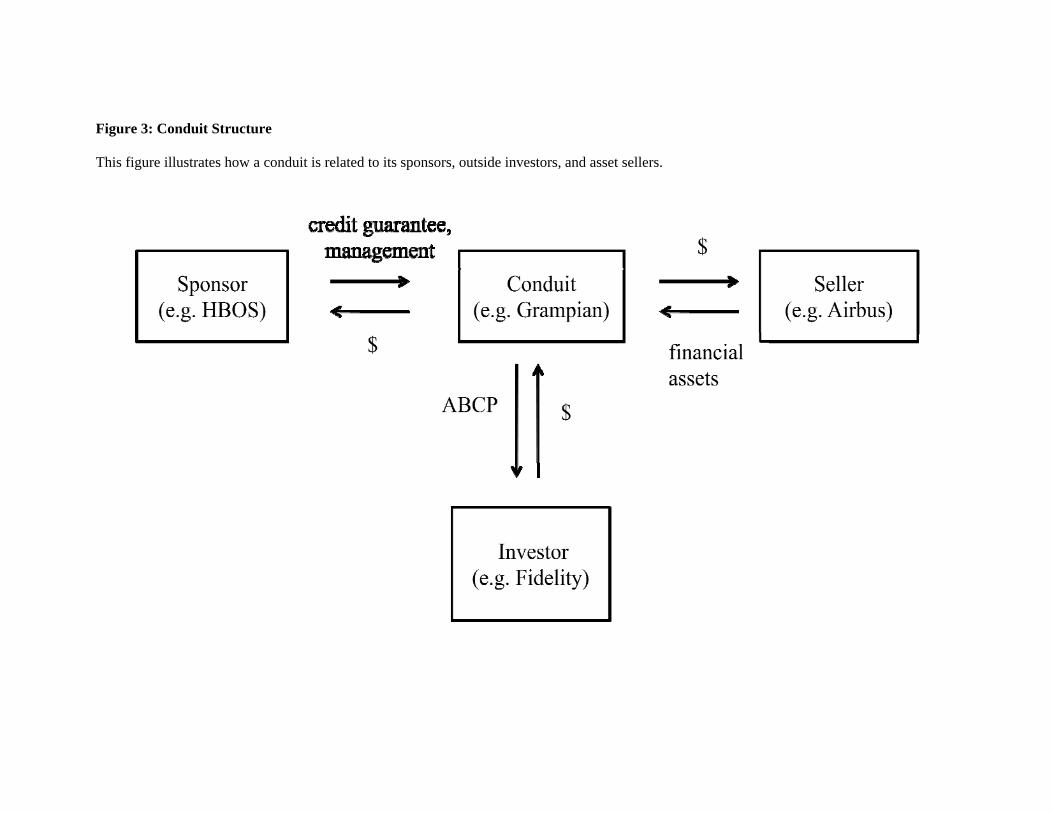
Figure 3: Conduit Structure This figure illustrates how a conduit is related to its sponsors, outside investors, and asset sellers.

Figure 4: Asset-backed Commercial Paper Outstanding by Credit Guarantee This figure shows total asset-backed commercial paper outstanding in the period from January 2004 to June 2009 by type of credit guarantee. The figure is based on quarterly data reports from Moody’s Investors Service.
0
100
200
300
400
500
600
700
800
900
1,000
1‐Jan
‐04
1‐M
ar‐04
1‐M
ay‐04
1‐Jul‐04
1‐Sep
‐04
1‐Nov‐04
1‐Jan
‐05
1‐M
ar‐05
1‐M
ay‐05
1‐Jul‐05
1‐Sep
‐05
1‐Nov‐05
1‐Jan
‐06
1‐M
ar‐06
1‐M
ay‐06
1‐Jul‐06
1‐Sep
‐06
1‐Nov‐06
1‐Jan
‐07
1‐M
ar‐07
1‐M
ay‐07
1‐Jul‐07
1‐Sep
‐07
1‐Nov‐07
1‐Jan
‐08
1‐M
ar‐08
1‐M
ay‐08
1‐Jul‐08
1‐Sep
‐08
1‐Nov‐08
1‐Jan
‐09
1‐M
ar‐09
Full Liquid
Full Credit
Extendible
SIV
USD billion

Figure 5: Asset-backed Commercial Paper Outstanding by Credit Guarantee This figure shows total asset-backed commercial paper outstanding from April 2007 to December 2007 by the type of credit guarantee (indexed to July 25=100). The figure is based on weekly data from DTCC and reports from Moody’s Investors Service.
0
20
40
60
80
100
120
4‐Apr‐07 4‐May‐07 4‐Jun‐07 4‐Jul‐07 4‐Aug‐07 4‐Sep‐07 4‐Oct‐07 4‐Nov‐07 4‐Dec‐07
Full credit support
Full liquidity
Extendible
SIV
Index (Jul 25 = 100)

Figure 6: Asset-backed Commercial Paper Spreads by Credit Guarantee
This figure shows the spread of overnight asset-backed commercial paper over the Federal Funds rate from July to September 2007 by type of credit guarantee. The figure is based on weekly data from DTCC and reports from Moody’s Investors Service.
‐0.20
0.00
0.20
0.40
0.60
0.80
1.00
1.20
1.40
4‐Jul‐07 4‐Aug‐07 4‐Sep‐07 4‐Oct‐07 4‐Nov‐07 4‐Dec‐07
Full credit support
Full liquidity
Extendible
SIV
Percentage points
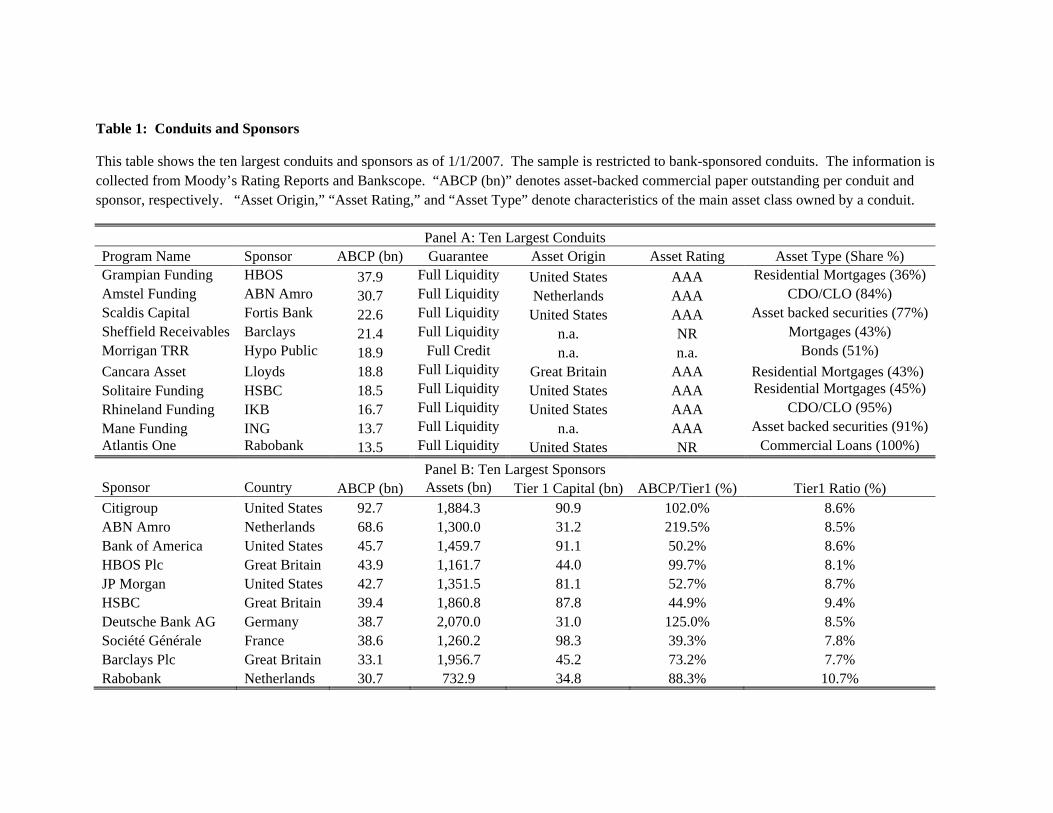
Table 1: Conduits and Sponsors
This table shows the ten largest conduits and sponsors as of 1/1/2007. The sample is restricted to bank-sponsored conduits. The information is collected from Moody’s Rating Reports and Bankscope. “ABCP (bn)” denotes asset-backed commercial paper outstanding per conduit and sponsor, respectively. “Asset Origin,” “Asset Rating,” and “Asset Type” denote characteristics of the main asset class owned by a conduit.
Panel A: Ten Largest Conduits Program Name Sponsor ABCP (bn) Guarantee Asset Origin Asset Rating Asset Type (Share %) Grampian Funding HBOS 37.9 Full Liquidity United States AAA Residential Mortgages (36%) Amstel Funding ABN Amro 30.7 Full Liquidity Netherlands AAA CDO/CLO (84%) Scaldis Capital Fortis Bank 22.6 Full Liquidity United States AAA Asset backed securities (77%)Sheffield Receivables Barclays 21.4 Full Liquidity n.a. NR Mortgages (43%) Morrigan TRR Hypo Public 18.9 Full Credit n.a. n.a. Bonds (51%)
Cancara Asset Lloyds 18.8 Full Liquidity Great Britain AAA Residential Mortgages (43%) Solitaire Funding HSBC 18.5 Full Liquidity United States AAA Residential Mortgages (45%)
Rhineland Funding IKB 16.7 Full Liquidity United States AAA CDO/CLO (95%)
Mane Funding ING 13.7 Full Liquidity n.a. AAA Asset backed securities (91%)Atlantis One Rabobank 13.5 Full Liquidity United States NR Commercial Loans (100%)
Panel B: Ten Largest Sponsors Sponsor Country ABCP (bn) Assets (bn) Tier 1 Capital (bn) ABCP/Tier1 (%) Tier1 Ratio (%) Citigroup United States 92.7 1,884.3 90.9 102.0% 8.6% ABN Amro Netherlands 68.6 1,300.0 31.2 219.5% 8.5% Bank of America United States 45.7 1,459.7 91.1 50.2% 8.6% HBOS Plc Great Britain 43.9 1,161.7 44.0 99.7% 8.1% JP Morgan United States 42.7 1,351.5 81.1 52.7% 8.7% HSBC Great Britain 39.4 1,860.8 87.8 44.9% 9.4% Deutsche Bank AG Germany 38.7 2,070.0 31.0 125.0% 8.5% Société Générale France 38.6 1,260.2 98.3 39.3% 7.8% Barclays Plc Great Britain 33.1 1,956.7 45.2 73.2% 7.7% Rabobank Netherlands 30.7 732.9 34.8 88.3% 10.7%
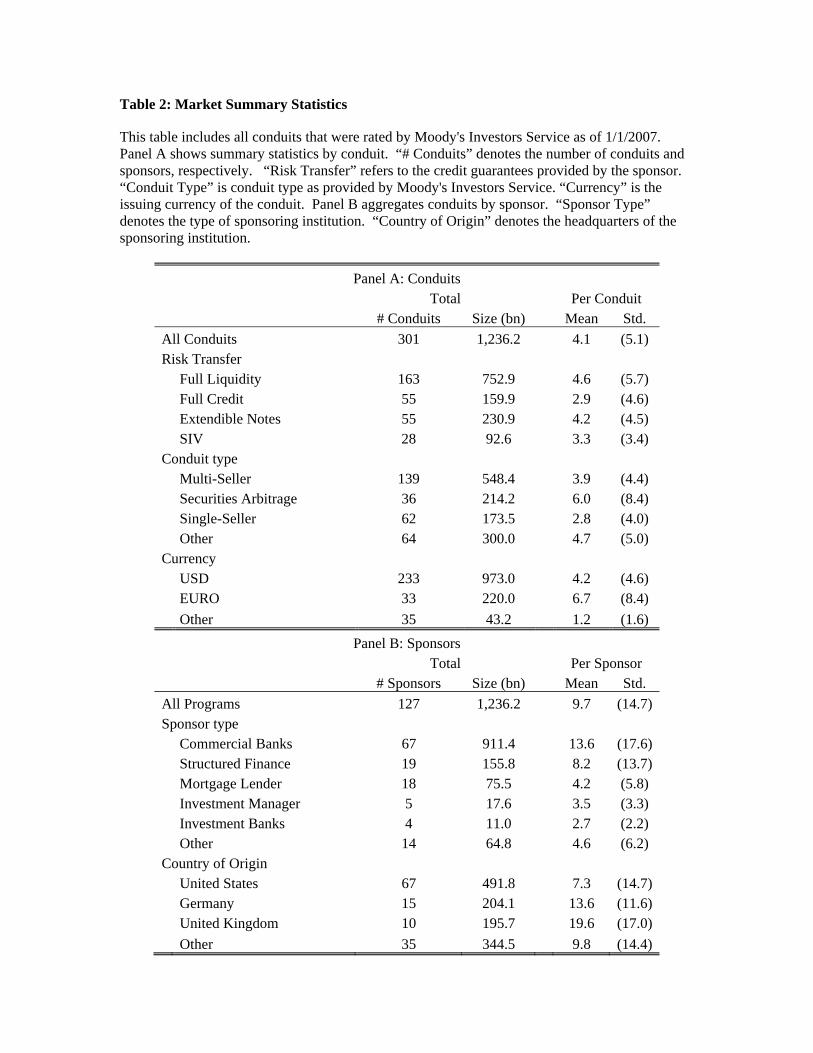
Table 2: Market Summary Statistics
This table includes all conduits that were rated by Moody's Investors Service as of 1/1/2007. Panel A shows summary statistics by conduit. “# Conduits” denotes the number of conduits and sponsors, respectively. “Risk Transfer” refers to the credit guarantees provided by the sponsor. “Conduit Type” is conduit type as provided by Moody's Investors Service. “Currency” is the issuing currency of the conduit. Panel B aggregates conduits by sponsor. “Sponsor Type” denotes the type of sponsoring institution. “Country of Origin” denotes the headquarters of the sponsoring institution.
Panel A: Conduits Total Per Conduit
# Conduits Size (bn) Mean Std.
All Conduits 301 1,236.2 4.1 (5.1) Risk Transfer
Full Liquidity 163 752.9 4.6 (5.7) Full Credit 55 159.9 2.9 (4.6) Extendible Notes 55 230.9 4.2 (4.5) SIV 28 92.6 3.3 (3.4)
Conduit type Multi-Seller 139 548.4 3.9 (4.4) Securities Arbitrage 36 214.2 6.0 (8.4) Single-Seller 62 173.5 2.8 (4.0) Other 64 300.0 4.7 (5.0)
Currency USD 233 973.0 4.2 (4.6) EURO 33 220.0 6.7 (8.4)
Other 35 43.2 1.2 (1.6)
Panel B: Sponsors Total Per Sponsor
# Sponsors Size (bn) Mean Std.
All Programs 127 1,236.2 9.7 (14.7) Sponsor type
Commercial Banks 67 911.4 13.6 (17.6) Structured Finance 19 155.8 8.2 (13.7) Mortgage Lender 18 75.5 4.2 (5.8) Investment Manager 5 17.6 3.5 (3.3) Investment Banks 4 11.0 2.7 (2.2) Other 14 64.8 4.6 (6.2)
Country of Origin United States 67 491.8 7.3 (14.7) Germany 15 204.1 13.6 (11.6) United Kingdom 10 195.7 19.6 (17.0)
Other 35 344.5 9.8 (14.4)

Table 3: Asset-backed Commercial Paper by Sponsor Type and Credit Guarantee This table includes all conduits that were rated by Moody's Investors Service as of 1/1/2007. The ‘Total’ shows total asset-backed commercial paper outstanding as of 1/1/2007 per type of sponsor. The ‘Credit Guarantee’ shows the breakdown of asset-backed commercial paper by type of credit guarantee.
Total Credit Guarantee # Sponsors Size (bn) Full Liquidity Full Credit Extendible SIV
Commercial Banks 64 911.4 74.2% 10.9% 8.6% 6.3%Structured Finance 19 155.8 7.0% 37.2% 34.7% 21.1%Mortgage Lender 18 75.5 14.3% 0.0% 82.8% 2.9%Investment Manager 5 17.6 0.0% 1.3% 98.7% 0.0%Investment Banks 4 11.0 54.9% 0.0% 45.1% 0.0%
Other 14 64.8 74.8% 2.3% 22.9% 0.0%

Table 4: Event Study Summary Statistics
This table shows summary statistics by conduit exposure. We sort banks in three groups: bank with no conduit exposure, banks with low conduit exposure, and banks with high conduit exposure. We restrict the sample to commercial banks that (i) are among the 300 largest financial institutions, (ii) are located in the Europe or the United States, and (iii) have share price data available. We measure ‘Stock Return’ as the total stock return in the three-day window from August 8,2007, to August 10, 2007, ‘Exposure’ is the asset-backed commercial paper outstanding relative to equity, ‘Log Assets’ is the natural logarithm of assets, ‘Log Equity’ is the natural logarithm of equity, ‘Equity Ratio’ is equity as share of assets, ‘Share Deposits’ is deposits as share of assets, and ‘Share Short-Term Debt’ is short-term debt as share of assets. All variables are measured as of January 1st, 2007. ‘United States’ is an indicator variable whether a bank is headquartered in the United States.
Conduit Exposure Sample:
All (1)
No (2)
Low (3)
High (4)
Stock return Aug 8th - Aug 10th -0.004 0.007 -0.028 -0.046 (0.052) (0.055) (0.024) (0.026)
Conduit Exposure 0.169 0.000 0.248 1.199 (0.532) 0.000 (0.131) (1.155)
Log(Assets) 3.961 3.154 6.379 6.325 (2.284) (1.987) (1.077) (1.280)
Log(Equity) 1.355 0.670 3.671 3.025 (2.043) (1.832) (0.877) (1.161)
Equity Ratio 0.091 0.101 0.076 0.043 (0.099) (0.111) (0.038) (0.026)
Share Deposits 0.602 0.63 0.530 0.504 (0.208) (0.223) (0.112) (0.145)
Share Short-Term Debt 0.073 0.050 0.122 0.167 (0.084) (0.050) (0.117) (0.129)
US Indicator Variable 0.542 0.613 0.400 0.250 (0.501) (0.490) (0.507) (0.452)
N 107 80 15 12

Table 5: Effect of Conduit Exposure on Stock Returns (August 8, 2007 – August 10, 2007) This table shows the effect of conduit exposure on stock return. We restrict the sample to commercial banks that (i) are among the 300 largest financial institutions (ii) are located in the Europe or the United States, and (iii) have share price data available. The dependent variable is the total stock return over the three-day period from August 8, 2007 to August 10, 2007. We measure ‘Conduit Exposure’ as asset-backed commercial paper relative to equity. Columns (2) to (6) include control variables for the ratio of short-term assets to debt, the ratio of equity to assets, log(Assets) and log(Equity). All control variables are measured as of January 1, 2007. Column (6) includes fixed effects for Germany, Great Britain, and the United States. Robust standard errors are in parentheses below coefficients. * significant at 5%; ** significant at 1%
Dependent Variable: Stock Return (1) (2) (3) (4) (5) (6)
Conduit Exposure -0.026 -0.014 -0.011 -0.013 -0.014 -0.015 (0.007)** (0.004)** (0.003)** (0.003)** (0.003)** (0.004)**
Log(Assets) -0.007 -0.022 -0.024 -0.027 0.005 (0.005) (0.008)** (0.008)** (0.009)** -0.015
Log(Equity) -0.004 0.012 0.013 0.015 -0.016 (0.007) (0.009) (0.009) (0.009) (0.015)
Equity-Assets Ratio -0.099 -0.103 -0.137 -0.006 (0.029)** (0.031)** (0.037)** (0.065)
Share Short Term Debt 0.066 0.063 0.039 (0.041) (0.041) (0.042)
Share Deposits -0.027 -0.017 (0.017) (0.026)
Constant 0.000 0.033 0.079 0.082 0.111 0.036 (0.005) (0.015)* (0.025)** (0.026)** (0.032)** (0.042)
Country FE N N N N N Y Observations 107 107 107 107 107 107
R-squared 0.068 0.277 0.289 0.297 0.303 0.359
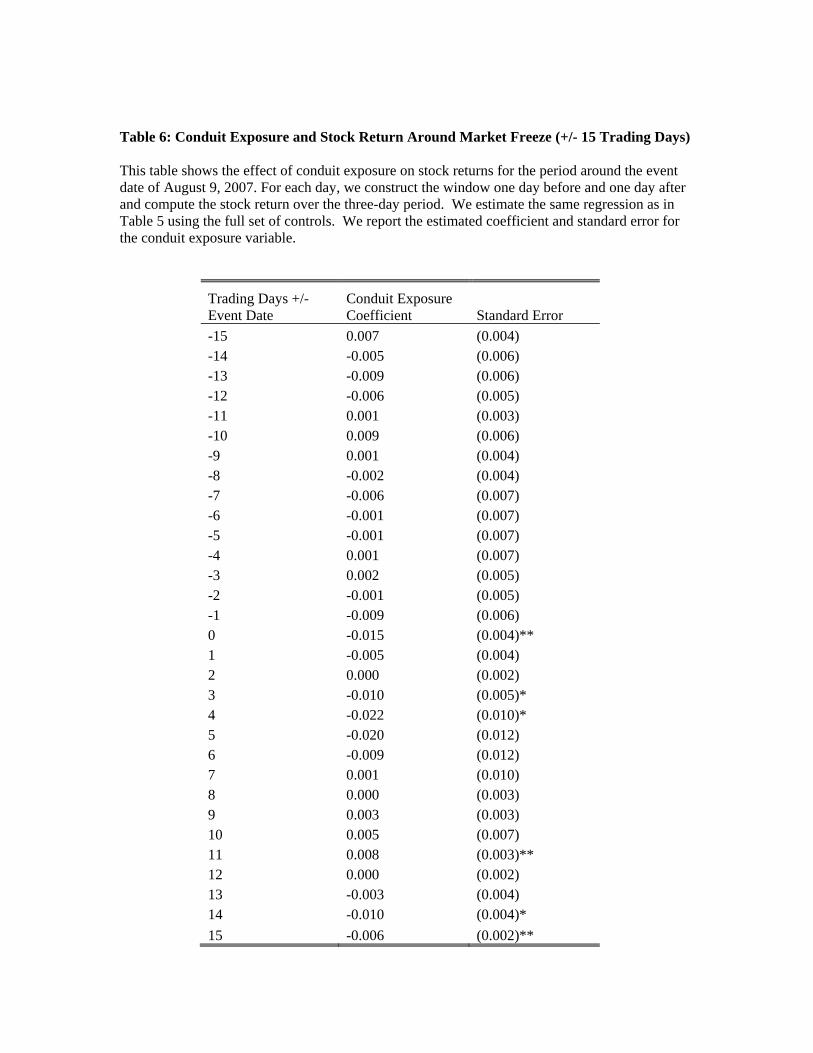
Table 6: Conduit Exposure and Stock Return Around Market Freeze (+/- 15 Trading Days) This table shows the effect of conduit exposure on stock returns for the period around the event date of August 9, 2007. For each day, we construct the window one day before and one day after and compute the stock return over the three-day period. We estimate the same regression as in Table 5 using the full set of controls. We report the estimated coefficient and standard error for the conduit exposure variable.
Trading Days +/- Event Date
Conduit Exposure Coefficient Standard Error
-15 0.007 (0.004) -14 -0.005 (0.006) -13 -0.009 (0.006) -12 -0.006 (0.005) -11 0.001 (0.003) -10 0.009 (0.006) -9 0.001 (0.004) -8 -0.002 (0.004) -7 -0.006 (0.007) -6 -0.001 (0.007) -5 -0.001 (0.007) -4 0.001 (0.007) -3 0.002 (0.005) -2 -0.001 (0.005) -1 -0.009 (0.006) 0 -0.015 (0.004)** 1 -0.005 (0.004) 2 0.000 (0.002) 3 -0.010 (0.005)* 4 -0.022 (0.010)* 5 -0.020 (0.012) 6 -0.009 (0.012) 7 0.001 (0.010) 8 0.000 (0.003) 9 0.003 (0.003) 10 0.005 (0.007) 11 0.008 (0.003)** 12 0.000 (0.002) 13 -0.003 (0.004) 14 -0.010 (0.004)*
15 -0.006 (0.002)**
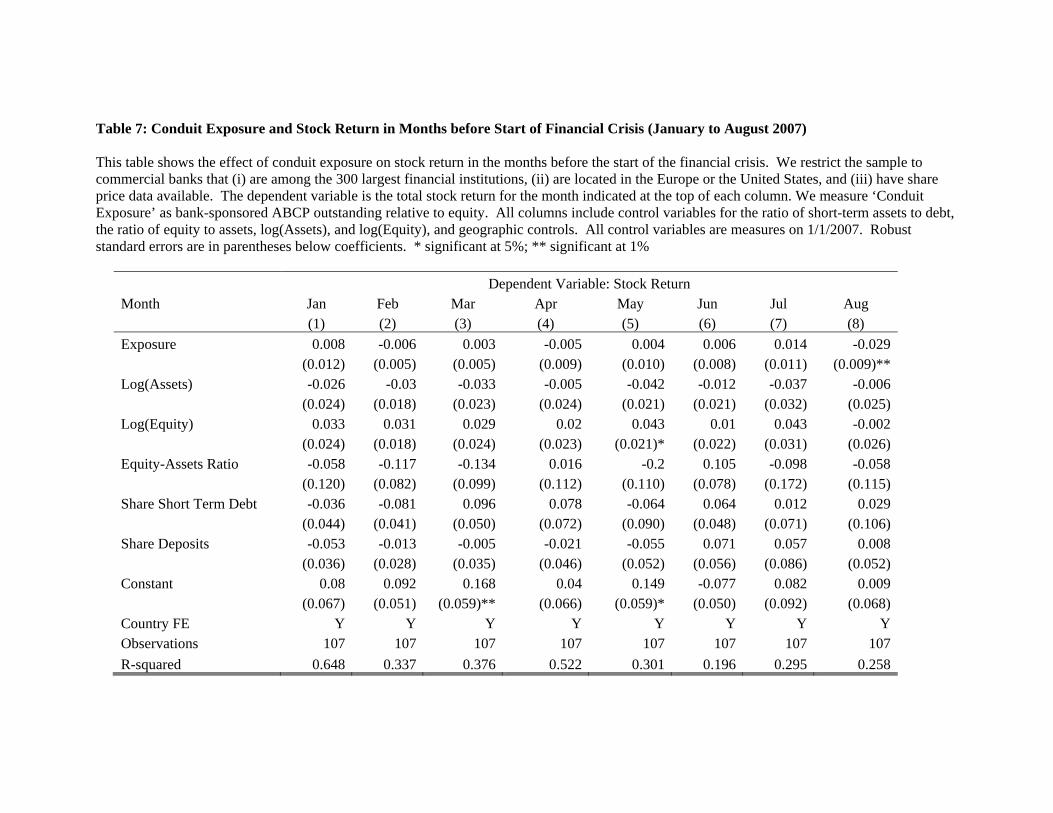
Table 7: Conduit Exposure and Stock Return in Months before Start of Financial Crisis (January to August 2007) This table shows the effect of conduit exposure on stock return in the months before the start of the financial crisis. We restrict the sample to commercial banks that (i) are among the 300 largest financial institutions, (ii) are located in the Europe or the United States, and (iii) have share price data available. The dependent variable is the total stock return for the month indicated at the top of each column. We measure ‘Conduit Exposure’ as bank-sponsored ABCP outstanding relative to equity. All columns include control variables for the ratio of short-term assets to debt, the ratio of equity to assets, log(Assets), and log(Equity), and geographic controls. All control variables are measures on 1/1/2007. Robust standard errors are in parentheses below coefficients. * significant at 5%; ** significant at 1%
Dependent Variable: Stock Return Month Jan Feb Mar Apr May Jun Jul Aug (1) (2) (3) (4) (5) (6) (7) (8)
Exposure 0.008 -0.006 0.003 -0.005 0.004 0.006 0.014 -0.029(0.012) (0.005) (0.005) (0.009) (0.010) (0.008) (0.011) (0.009)**
Log(Assets) -0.026 -0.03 -0.033 -0.005 -0.042 -0.012 -0.037 -0.006(0.024) (0.018) (0.023) (0.024) (0.021) (0.021) (0.032) (0.025)
Log(Equity) 0.033 0.031 0.029 0.02 0.043 0.01 0.043 -0.002(0.024) (0.018) (0.024) (0.023) (0.021)* (0.022) (0.031) (0.026)
Equity-Assets Ratio -0.058 -0.117 -0.134 0.016 -0.2 0.105 -0.098 -0.058(0.120) (0.082) (0.099) (0.112) (0.110) (0.078) (0.172) (0.115)
Share Short Term Debt -0.036 -0.081 0.096 0.078 -0.064 0.064 0.012 0.029(0.044) (0.041) (0.050) (0.072) (0.090) (0.048) (0.071) (0.106)
Share Deposits -0.053 -0.013 -0.005 -0.021 -0.055 0.071 0.057 0.008(0.036) (0.028) (0.035) (0.046) (0.052) (0.056) (0.086) (0.052)
Constant 0.08 0.092 0.168 0.04 0.149 -0.077 0.082 0.009(0.067) (0.051) (0.059)** (0.066) (0.059)* (0.050) (0.092) (0.068)
Country FE Y Y Y Y Y Y Y YObservations 107 107 107 107 107 107 107 107
R-squared 0.648 0.337 0.376 0.522 0.301 0.196 0.295 0.258
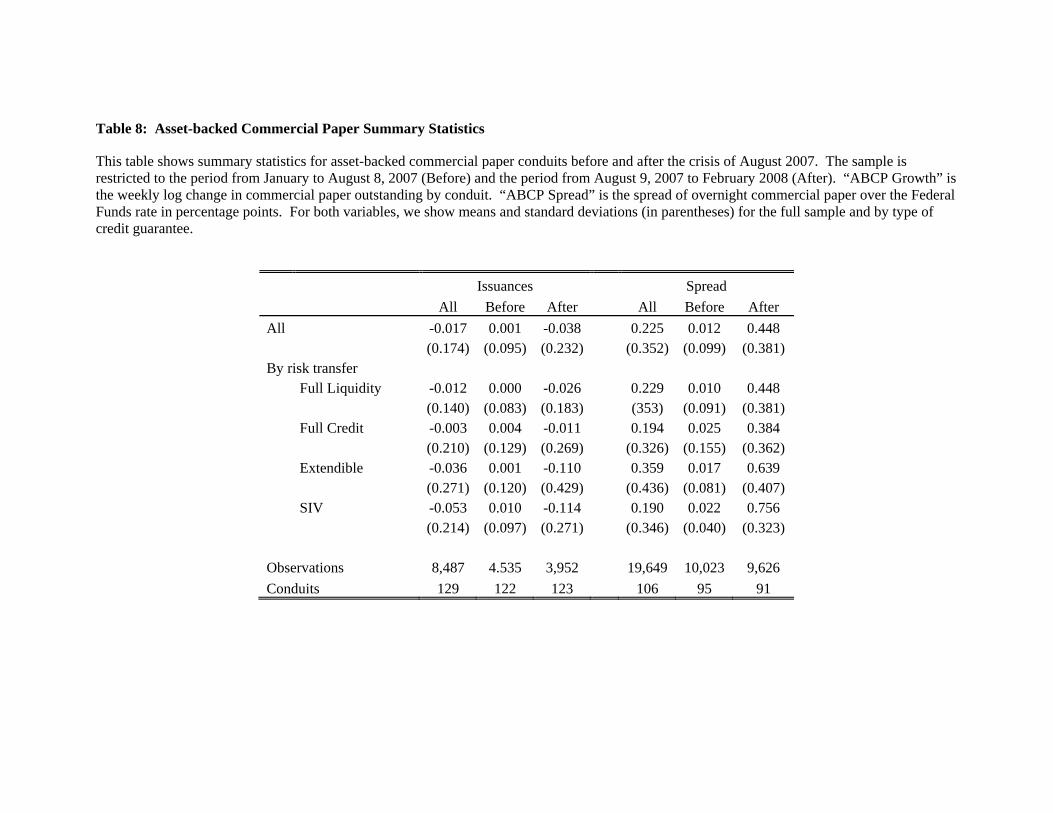
Table 8: Asset-backed Commercial Paper Summary Statistics
This table shows summary statistics for asset-backed commercial paper conduits before and after the crisis of August 2007. The sample is restricted to the period from January to August 8, 2007 (Before) and the period from August 9, 2007 to February 2008 (After). “ABCP Growth” is the weekly log change in commercial paper outstanding by conduit. “ABCP Spread” is the spread of overnight commercial paper over the Federal Funds rate in percentage points. For both variables, we show means and standard deviations (in parentheses) for the full sample and by type of credit guarantee.
Issuances Spread
All Before After All Before After
All -0.017 0.001 -0.038 0.225 0.012 0.448 (0.174) (0.095) (0.232) (0.352) (0.099) (0.381)
By risk transfer Full Liquidity -0.012 0.000 -0.026 0.229 0.010 0.448
(0.140) (0.083) (0.183) (353) (0.091) (0.381) Full Credit -0.003 0.004 -0.011 0.194 0.025 0.384
(0.210) (0.129) (0.269) (0.326) (0.155) (0.362) Extendible -0.036 0.001 -0.110 0.359 0.017 0.639
(0.271) (0.120) (0.429) (0.436) (0.081) (0.407) SIV -0.053 0.010 -0.114 0.190 0.022 0.756
(0.214) (0.097) (0.271) (0.346) (0.040) (0.323)
Observations 8,487 4.535 3,952 19,649 10,023 9,626
Conduits 129 122 123 106 95 91
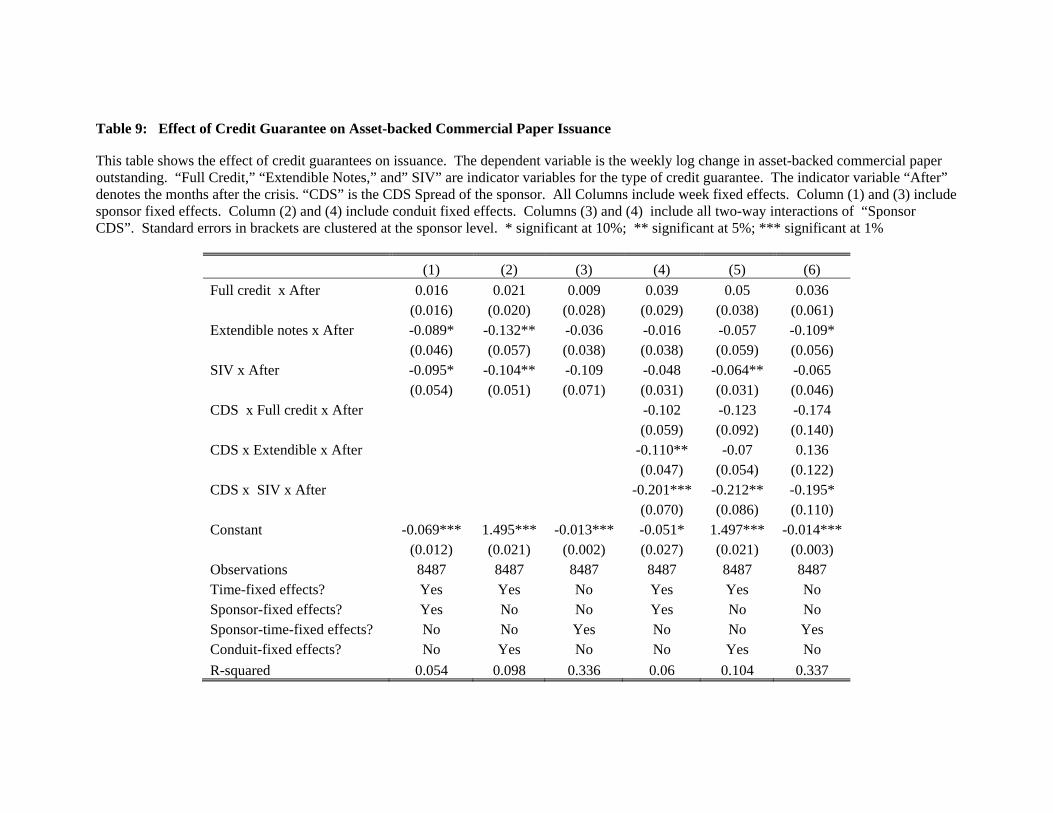
Table 9: Effect of Credit Guarantee on Asset-backed Commercial Paper Issuance This table shows the effect of credit guarantees on issuance. The dependent variable is the weekly log change in asset-backed commercial paper outstanding. “Full Credit,” “Extendible Notes,” and” SIV” are indicator variables for the type of credit guarantee. The indicator variable “After” denotes the months after the crisis. “CDS” is the CDS Spread of the sponsor. All Columns include week fixed effects. Column (1) and (3) include sponsor fixed effects. Column (2) and (4) include conduit fixed effects. Columns (3) and (4) include all two-way interactions of “Sponsor CDS”. Standard errors in brackets are clustered at the sponsor level. * significant at 10%; ** significant at 5%; *** significant at 1%
(1) (2) (3) (4) (5) (6)
Full credit x After 0.016 0.021 0.009 0.039 0.05 0.036 (0.016) (0.020) (0.028) (0.029) (0.038) (0.061) Extendible notes x After -0.089* -0.132** -0.036 -0.016 -0.057 -0.109* (0.046) (0.057) (0.038) (0.038) (0.059) (0.056) SIV x After -0.095* -0.104** -0.109 -0.048 -0.064** -0.065 (0.054) (0.051) (0.071) (0.031) (0.031) (0.046) CDS x Full credit x After -0.102 -0.123 -0.174 (0.059) (0.092) (0.140) CDS x Extendible x After -0.110** -0.07 0.136 (0.047) (0.054) (0.122) CDS x SIV x After -0.201*** -0.212** -0.195* (0.070) (0.086) (0.110) Constant -0.069*** 1.495*** -0.013*** -0.051* 1.497*** -0.014***
(0.012) (0.021) (0.002) (0.027) (0.021) (0.003) Observations 8487 8487 8487 8487 8487 8487 Time-fixed effects? Yes Yes No Yes Yes No Sponsor-fixed effects? Yes No No Yes No No Sponsor-time-fixed effects? No No Yes No No Yes Conduit-fixed effects? No Yes No No Yes No
R-squared 0.054 0.098 0.336 0.06 0.104 0.337
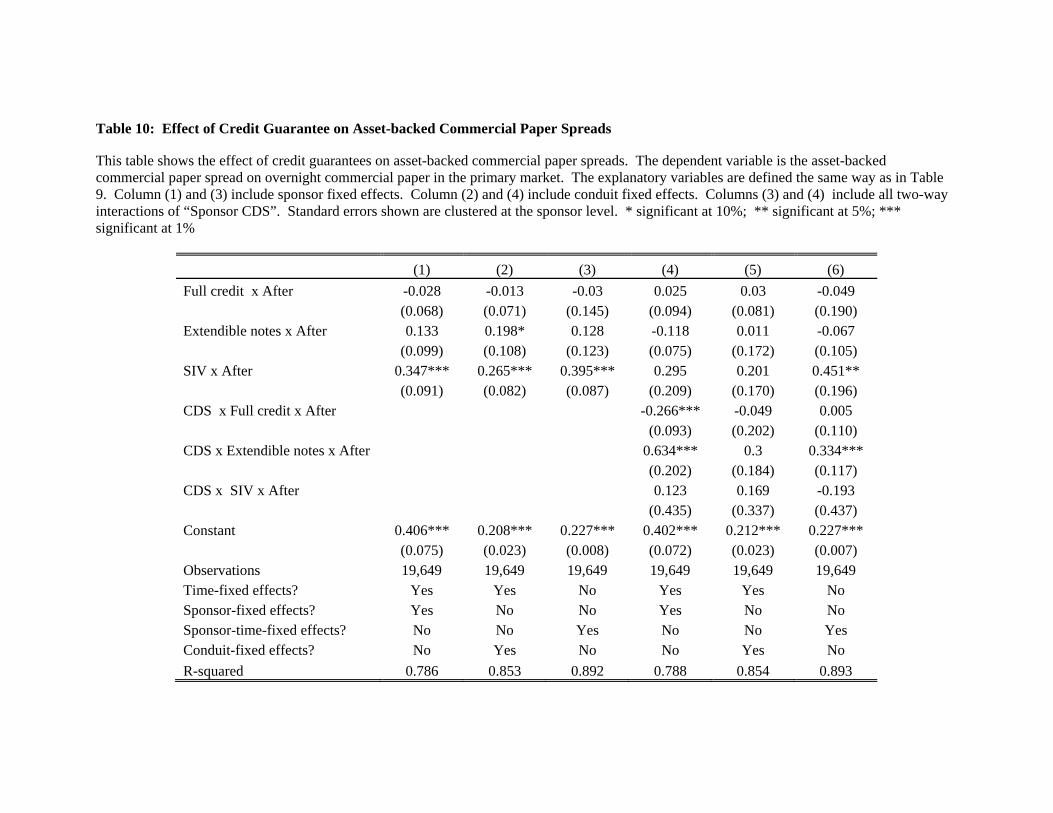
Table 10: Effect of Credit Guarantee on Asset-backed Commercial Paper Spreads This table shows the effect of credit guarantees on asset-backed commercial paper spreads. The dependent variable is the asset-backed commercial paper spread on overnight commercial paper in the primary market. The explanatory variables are defined the same way as in Table 9. Column (1) and (3) include sponsor fixed effects. Column (2) and (4) include conduit fixed effects. Columns (3) and (4) include all two-way interactions of “Sponsor CDS”. Standard errors shown are clustered at the sponsor level. * significant at 10%; ** significant at 5%; *** significant at 1%
(1) (2) (3) (4) (5) (6)
Full credit x After -0.028 -0.013 -0.03 0.025 0.03 -0.049 (0.068) (0.071) (0.145) (0.094) (0.081) (0.190) Extendible notes x After 0.133 0.198* 0.128 -0.118 0.011 -0.067 (0.099) (0.108) (0.123) (0.075) (0.172) (0.105) SIV x After 0.347*** 0.265*** 0.395*** 0.295 0.201 0.451** (0.091) (0.082) (0.087) (0.209) (0.170) (0.196) CDS x Full credit x After -0.266*** -0.049 0.005 (0.093) (0.202) (0.110) CDS x Extendible notes x After 0.634*** 0.3 0.334*** (0.202) (0.184) (0.117) CDS x SIV x After 0.123 0.169 -0.193 (0.435) (0.337) (0.437) Constant 0.406*** 0.208*** 0.227*** 0.402*** 0.212*** 0.227*** (0.075) (0.023) (0.008) (0.072) (0.023) (0.007) Observations 19,649 19,649 19,649 19,649 19,649 19,649 Time-fixed effects? Yes Yes No Yes Yes No Sponsor-fixed effects? Yes No No Yes No No Sponsor-time-fixed effects? No No Yes No No Yes Conduit-fixed effects? No Yes No No Yes No
R-squared 0.786 0.853 0.892 0.788 0.854 0.893
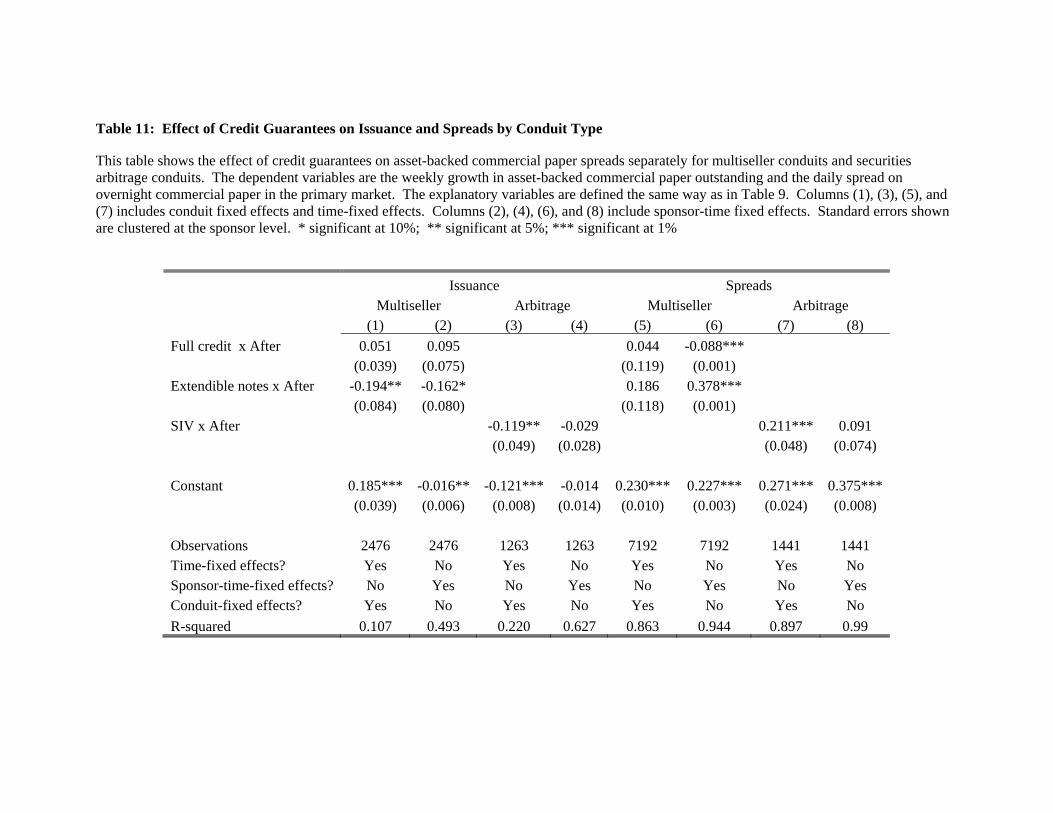
Table 11: Effect of Credit Guarantees on Issuance and Spreads by Conduit Type This table shows the effect of credit guarantees on asset-backed commercial paper spreads separately for multiseller conduits and securities arbitrage conduits. The dependent variables are the weekly growth in asset-backed commercial paper outstanding and the daily spread on overnight commercial paper in the primary market. The explanatory variables are defined the same way as in Table 9. Columns (1), (3), (5), and (7) includes conduit fixed effects and time-fixed effects. Columns (2), (4), (6), and (8) include sponsor-time fixed effects. Standard errors shown are clustered at the sponsor level. * significant at 10%; ** significant at 5%; *** significant at 1%
Issuance Spreads Multiseller Arbitrage Multiseller Arbitrage
(1) (2) (3) (4) (5) (6) (7) (8)
Full credit x After 0.051 0.095 0.044 -0.088*** (0.039) (0.075) (0.119) (0.001) Extendible notes x After -0.194** -0.162* 0.186 0.378*** (0.084) (0.080) (0.118) (0.001) SIV x After -0.119** -0.029 0.211*** 0.091 (0.049) (0.028) (0.048) (0.074)
Constant 0.185*** -0.016** -0.121*** -0.014 0.230*** 0.227*** 0.271*** 0.375*** (0.039) (0.006) (0.008) (0.014) (0.010) (0.003) (0.024) (0.008)
Observations 2476 2476 1263 1263 7192 7192 1441 1441 Time-fixed effects? Yes No Yes No Yes No Yes No Sponsor-time-fixed effects? No Yes No Yes No Yes No Yes Conduit-fixed effects? Yes No Yes No Yes No Yes No
R-squared 0.107 0.493 0.220 0.627 0.863 0.944 0.897 0.99

Table 12: Estimated Losses for Sponsors and Outside Investors
This table shows the ex-post risk transfer by credit guarantee. “Pre-crisis” denotes total asset-backed commercial paper outstanding as of 7/1/2007. Post-crisis denotes the value-weighted share that is “Active” (conduit continues to issue), “Repaid” (conduit closed and repaid investors), and “In Default” (Conduit closed and investor not repaid). “Estimated losses” estimates the losses of sponsor and outside investors assuming a recovery rate on conduit assets of 95% and 85%, respectively.
Pre-Crisis Post-Crisis Estimated Loss (bn)
Recovery Rate: 95% Recovery Rate 85%
ABCP (bn) Active Repaid In Default Sponsor Investor Sponsor Investor
All 1,395.5 76.6% 20.8% 2.5% 68.0 1.8 204.0 30.0Risk Transfer
Full Liquidity 844.0 87.9% 12.1% 0.0% 42.2 0.0 126.6 0.0Full Credit 204.2 70.9% 29.1% 0.0% 10.2 0.0 30.6 0.0Extendibles 243.1 47.0% 45.5% 7.4% 11.2 0.9 33.7 15.4SIV 104.1 65.7% 17.7% 16.6% 4.3 0.9 13.0 14.7
Sponsor Type Commercial Bank 1,035.6 83.0% 16.4% 0.6% 51.5 0.3 154.4 5.3Structured Finance 199.2 58.1% 36.4% 5.5% 9.4 0.6 28.2 9.4Mortgage Lender 60.2 44.5% 40.2% 15.3% 2.5 0.5 7.6 7.8
Other 100.4 63.3% 24.4% 8.9% 4.6 0.4 13.7 7.6
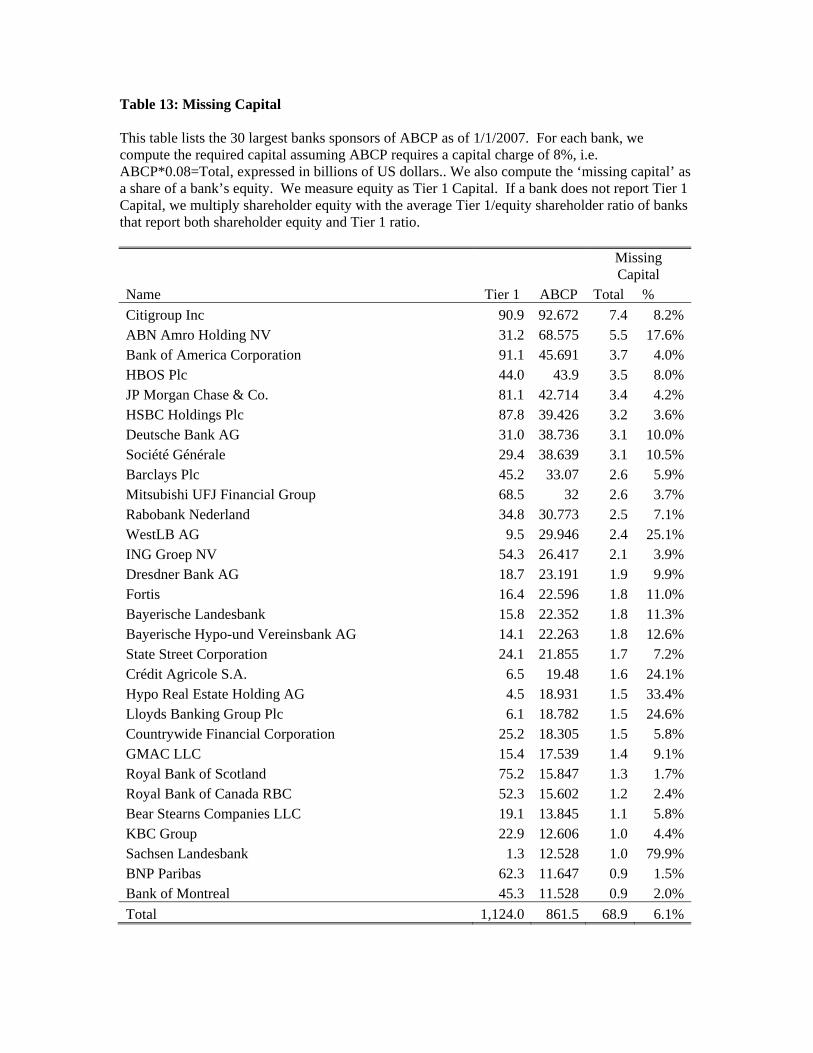
Table 13: Missing Capital This table lists the 30 largest banks sponsors of ABCP as of 1/1/2007. For each bank, we compute the required capital assuming ABCP requires a capital charge of 8%, i.e. ABCP*0.08=Total, expressed in billions of US dollars.. We also compute the ‘missing capital’ as a share of a bank’s equity. We measure equity as Tier 1 Capital. If a bank does not report Tier 1 Capital, we multiply shareholder equity with the average Tier 1/equity shareholder ratio of banks that report both shareholder equity and Tier 1 ratio.
Missing Capital
Name Tier 1 ABCP Total %
Citigroup Inc 90.9 92.672 7.4 8.2%ABN Amro Holding NV 31.2 68.575 5.5 17.6%Bank of America Corporation 91.1 45.691 3.7 4.0%HBOS Plc 44.0 43.9 3.5 8.0%JP Morgan Chase & Co. 81.1 42.714 3.4 4.2%HSBC Holdings Plc 87.8 39.426 3.2 3.6%Deutsche Bank AG 31.0 38.736 3.1 10.0%Société Générale 29.4 38.639 3.1 10.5%Barclays Plc 45.2 33.07 2.6 5.9%Mitsubishi UFJ Financial Group 68.5 32 2.6 3.7%Rabobank Nederland 34.8 30.773 2.5 7.1%WestLB AG 9.5 29.946 2.4 25.1%ING Groep NV 54.3 26.417 2.1 3.9%Dresdner Bank AG 18.7 23.191 1.9 9.9%Fortis 16.4 22.596 1.8 11.0%Bayerische Landesbank 15.8 22.352 1.8 11.3%Bayerische Hypo-und Vereinsbank AG 14.1 22.263 1.8 12.6%State Street Corporation 24.1 21.855 1.7 7.2%Crédit Agricole S.A. 6.5 19.48 1.6 24.1%Hypo Real Estate Holding AG 4.5 18.931 1.5 33.4%Lloyds Banking Group Plc 6.1 18.782 1.5 24.6%Countrywide Financial Corporation 25.2 18.305 1.5 5.8%GMAC LLC 15.4 17.539 1.4 9.1%Royal Bank of Scotland 75.2 15.847 1.3 1.7%Royal Bank of Canada RBC 52.3 15.602 1.2 2.4%Bear Stearns Companies LLC 19.1 13.845 1.1 5.8%KBC Group 22.9 12.606 1.0 4.4%Sachsen Landesbank 1.3 12.528 1.0 79.9%BNP Paribas 62.3 11.647 0.9 1.5%Bank of Montreal 45.3 11.528 0.9 2.0%
Total 1,124.0 861.5 68.9 6.1%