securing microbial quality of cheese brine with … microbial quality of cheese brine with...
TRANSCRIPT

Securing Microbial Quality Of Cheese BrineWith Microfiltration
Introduction
Salting by immersion in brine is widely used formany varieties of cheese worldwide.
Open brine pools or raceways systems are entrypoints for multiple sources of microbialcontamination, such as the water used to preparethe brine, the wet environment (splashes,condensate drops from walls and ceilings) andpotentially contaminated cheeses. Fat, curdparticles, plus the accumulation of proteins andother components from the cheese build up anutrient-rich environment for the salt-resistantmicroorganisms. Reused brine may then becomea reservoir of unwanted microorganisms, such asgas- or pigment-producing bacteria, yeast andmold, or salt-resistant pathogens, cross-contaminating the cheese and impacting its quality.
Reducing operating costs, minimizing water andenvironmental footprint is driving the need forextending the brine life for reuse. The control ofbrine quality has become essential to ensureconsistent daily production.
Brine plant configuration and treatment systems,can vary significantly to fit different performancetargets related to cheese type, end markets, plantand process environment. While UV lights andpasteurization equipment claim microbialdeactivation, filtration can provide clarification andmicrobial reduction or removal at the same time.Different systems and media from coarse filtrationdown to final membrane filtration are available.
Pall Microflow XL Brine microfiltration systems(Figure 1) efficiently combine constant turbidityreduction and reliable control of microbialcontamination levels over long automated operationcycles. They also demonstrate cost-effectiveoperation versus non filtration methods, reductionsof up to 50% in water usage and 30% in cleaningtime and chemicals compared to other membrane
systems, and satisfy the major drivers of the dairyindustry: brand protection, constant quality andcost reduction.
Microbial Challenge Tests in Brine
While microbial removal efficiency values arecommonly found to characterize final cartridgefilters, based on standard microorganisms in modelfluids, there is limited data established with typicalspoilage microorganisms in the respectiveapplication fluids and even less data for crossflowhollow fiber filters.
The purpose of this study is to establish removalefficiency data for Pall Microflow microfiltrationmembranes based on microbial challenge testsspecially designed for brine operating conditionsand typical contamination organisms. Challengetests with Brevundimonas diminuta, a standardmicroorganism commonly used for filter validation,were also included.
The study was composed of the following steps:
• Selecting microorganisms present in brine
• Defining growth conditions and characterizingchallenge microorganisms in brine
• Challenge tests under brine typical conditionswith lab scale hollow fiber modules
• Characterizing the removal efficiency by LogReduction Values (LRV) for 6 differentmicroorganisms
Selecting Microorganisms for theChallenge Tests
Various types of cheese microbial contaminationare reported in the literature, which involve bacteriaand yeast species. While some studies focus onthe presence of pathogenic bacteria linked toproduct recall, such as Listeria and its survival inbrine (1), most of them relate to bacteria or yeast
Tech
nica
l Bul
letin Ursula Brendel-Thimmel, Yvonne Schilz, Kai Unkelbach, Ralph Heusslein
Scientific and Laboratory Services, Pall Food and Beverage
Aline Sokol-CencettiGlobal Marketing, Dairy, Pall Food and Beverage

isolated from brine and involved in cheesedowngrades (2,3,4), such as late blowing defects insemi-hard cheese, color change in mozzarella andflavor deviation related to unbalanced presence ofbacteria and yeasts.
From microorganisms reported in cheese brine,Pseudomonas fluorescens, a water contaminantinvolved in mozzarella downgrades, Lactobacilluscasei, Debaryomyces hansenii, Kluyveromycesmarxianus, typical cheese microflora, also involvedin some downgrade cases were selected. Listeriamonocytogenes, one of the most dangerouspathogen, was included as a worst case scenarioorganism. Brevundimonas diminuta, which is notpresent in cheese processing, but commonly usedto qualify 0.2 μm filters under standard conditions(modified ASTM 838-05) was added to theprogram as a reference microorganism(5).
Defining Growth Conditions andCharacterizing ChallengeMicroorganisms
The first part of the study was designed to providegrowth curves, establishing the optimal harvestpoint for each microorganism and to evaluate theirviability in brine.
Growing the selected microorganisms inappropriate nutrient media and under definedconditions is a key factor to establish reliable data,as high cell counts are needed for challenge testsin order to reach a defined specific level inCFU/cm² of effective filter area. Furthermore thecells should be robust enough to survive wheninoculated into the 20% salt brine model, to avoidthat cellular stress generates a false response tothe challenge with an underestimatedcontamination level. Morphology and dimensionsof the cells were then measured by microscopy.
The growth curves (Figure 2), obtained from atleast 3 main cultures for each microorganism,show the typical 3 stages called lag, log andstationary stage. The colony count wasdetermined by dilution series and plating ontosuitable nutrient agars and the optical densitymeasured over a time period of minimum 20 hoursup to 50 hours. Colony counts, of up to 4.109
CFU/ml were reached corresponding to opticaldensities (measured at 546 nm) between 2 and 5depending on the microorganism.
For challenge testing, the microorganisms wereharvested in the late log- or early stationary stage,marked by the red arrow in Figure 2, in order toavoid a high number of dead cells challenging thefilter without being counted by the determination ofthe viable count on agar plates.
Viability of each test microorganism was testedover three hours after inoculation into brine, to
evaluate the impact of brine exposure during themicrobial challenge test. None of the testorganisms were influenced by the brine solutionduring the test, as shown in Figure 3.
The impact of inoculation into brine was alsoevaluated on cell dimensions, which is animportant parameter when challenging a filter.Reduction of the length, width or both for allmicroorganisms, from 1/6 up to 1/3 was observedfor all test organisms during the first hour in brine.Cell size after 1 hour, shown in Figure 4, remainedstable. Starting from this result, microorganismswere inoculated in brine one hour prior to thechallenge, enabling cells to adapt to the brine andget stable size during the 1-hour filtration run.
Microbial Challenge Test Under BrineTypical Conditions
The PVDF hollow fiber USP143 modules evaluatedin this study are small versions of the modulesused in the Pall Microflow XL Brine microfiltrationsystems.
The challenge tests were performed in aspecifically designed test set-up (Figure 5) enablingrealization of disinfecting, rinsing and filtrationsteps (Figure 6), with brine characteristics close toan industrial operation.
Challenge flowrate was set at the level of 37 L/m²h,an average flux obtained in cheese plants operatingPall Microflow XL Brine systems. The filtrationtemperature for the contaminated brine waschosen to a realistic value of 10°C. Direct filtrationmode was selected in order to control themicrobial concentration level in the feed stream for a precisely defined challenge test. A specificchallenge level in CFU/cm² could thus bedetermined, which is not possible in crossflowmode. Table 2 summarizes the test conditions.
Characterizing removal efficiency by LogReduction Values (LRV)6
Microbiological performance of filters is typicallyevaluated under defined laboratory conditions. Thisis done by challenging the filter under reproducibleconditions with certain microorganisms suspendedin a defined volume, at a defined concentrationwith a suitable flow of the suspension through thefilter. The specific conditions for the brine challengetests were described in the above paragraph.
The relationship between upstream and downstreamconcentration of microorganisms is measured andused to calculate the titer reduction. For conveniencethese usually very high numbers are expressed byindicating the Logarithmic Reduction Value (LRV),representing the common logarithm of the titerreduction. Log Reduction Values efficiently expressmicrobial performance of filters.

Log Reduction Values are linked to the concentrationin the feed stream, or challenge level. If the challengelevel is too low, the small number of microorganismsdownstream of the filter could limit the precisecalculation of titer reduction. In this case, sterileeffluent may be incorrectly interpreted as highperformance. Alternatively, if the calculation isperformed correctly with the theoretical limit of themethod a false low performance may be the result.
To provide a clear interpretation of the filterperformance, LRV is expressed together with thespecific challenge level per effective filter area inCFU/cm² and with the total colony count orabsence of microorganism in the total filtrate.
With each microorganism type, three hollow fibermodules type Pall US¨143 were tested out of 3different lots. In a first attempt, specific challengelevel was set to 105 CFU/cm² for the smallest testorganisms B.diminuta and P.fluorescens. Sincethese resulted in sterile filtrate, i.e. no colony countdownstream the filter, the challenge level wasraised to 107 CFU/cm² for all other test runs andorganisms.
High Performing Hollow FiberMicrofiltration
In this microbial performance study, Pall USP 143hollow fiber modules were tested with 5 typicalcheese brine contaminating microorganisms,under realistic dairy process conditions.
All tests showed that microorganisms wereefficiently removed at a challenge level of 107
CFU/cm² filtration surface area with LogReduction Values >10.4.
Although the microbial removal performance ofhollow fibers shown in this study cannot be directlycompared to sterilizing grade filter cartridgesoperated in direct mode, the removal efficiency ofwhich is correlated to integrity test values as aresult of the filter validation process, it is a goodindicator of the security level which can be broughtinto the brining process by Pall Microflow hollowfiber systems.
Benefits of Pall Microflow XL BrineSystems in Cheese Plants
The Pall USP 143 modules evaluated in this studyare small versions of the XL modules used in theMicroflow XL Brine microfiltration systems.
Typical performance of Pall Microflow XL Brinesystems is filtrate turbidity below 0.8 NTU,combined with high microbial reduction efficiency,when operated in crossflow mode. On sitemeasurements at soft cheese plants, showed highremoval performance, with typical microbial level inbrine of 102 to 105 CFU/mL and log reductionvalue (LRV) up to >5 on total microflora. Typicalturbidity of raw brine, filtrate and concentrate isshown in Figure 7.
The Pall Microflow technology is easy to integrateinto brining systems, with operating modesdesigned to match the various dairy requirementsrelated to cheese type and plant organization. Forexample, the system can operate in a “kidney loop”mode, continuously filtering 5 to 20 % of the totalbrine volume during cheese brining, thus continuouslyreducing suspended solids and microbial load, or inbatch mode e.g. filtering batch volumes overnight,for the highest microbial control level, such asrequested for soft and semi-soft cheese types.
Key features of the Pall Microflow XL Brine systeminclude:
• PVDF membranes with high mechanicalstrength for longer service life
• Backflush capability of the Microza* hollow fiber,maintaining a higher flux over a longer operatingcycle
• Hollow fiber membrane with a 1.4 mm openchannel for optimized cleaning
• On board cleaning / concentration tanks
• Automated chemical dosing for operator safety
• Water filtration, cleaning temperature control
• All product-wetted components in 316Lstainless steel
• Fully automated cycle programming forunattended operation and reduced labor anddowntime
The Pall Microflow technology platform is anadvanced solution for microbial contaminationcontrol, enabling dairies to perform clarification atlow operating costs while providing constant andhigh brine filtrate quality. It provides a reliableenvironmentally-friendly solution to extend the lifeof brine and prevent cheese quality downgrades,thus improving the cheese manufacturer’seconomics.
Total number of microorganisms influent to the filter
Number of colonies recorded on the downstream analysis discLRV = log
Bibliography and References1 Larson A.E., Johnson E.A., and Nelson J.H.; Survival of Listeria
monocytogenes in Commercial Cheese Brines; 1999; Journal of DairyScience, Volume 82, Issue 9, September 1999 , Pages 1860-1868
2 Cantoni C., Marchisio E., Galli M.; 2000; Blu-green coloration ofmozzarella cheese (Causa della colorazione blu-verde di mozzarella);Industrie Alimentari; v. 39(392) p. 586-588
3 Fleet G.H.; A review, Yeasts in dairy products; 1990; Journal ofApplied Biotechnology; 68;199-211
4 Wendorff W.L.; Brining Cheese, A comprehensive guide forcheesemakers; May 2010; Wisconsin Center for Dairy Research
5 Guidance for Industry: Sterile Drug Products Produced by AsepticProcessing- Current Good Manufacturing Practice, Sept.2004
6 Brendel-Thimmel U., Jaenchen R., Schlamp F., Sterilfiltration vonFlüssigkeiten und Gasen, Chemie Ingenieur Technik 2006,78, No.11,p.1655-1665

Figures and Tables
Figure 1: Pall Microflow XL Brine system
Table I: Selected strains and culture media
Strain DSMZ No. Other Collection No. Nutrient broth Nutrient media
Pseudomonas fluorescens 4358 NCDO 2085 NB TSA
Listeria monocytogenes 15675 NCTC 11994 TSB TSA
Lactobacillus casei 20011 — MRS MRS
Debaryomyces hansenii 70590 — YPB YPD
Kluyveromyces marxianus 5419 ATCC 8582 YPB YPD
Brevundimonas diminuta — ATCC 19146 — TSA
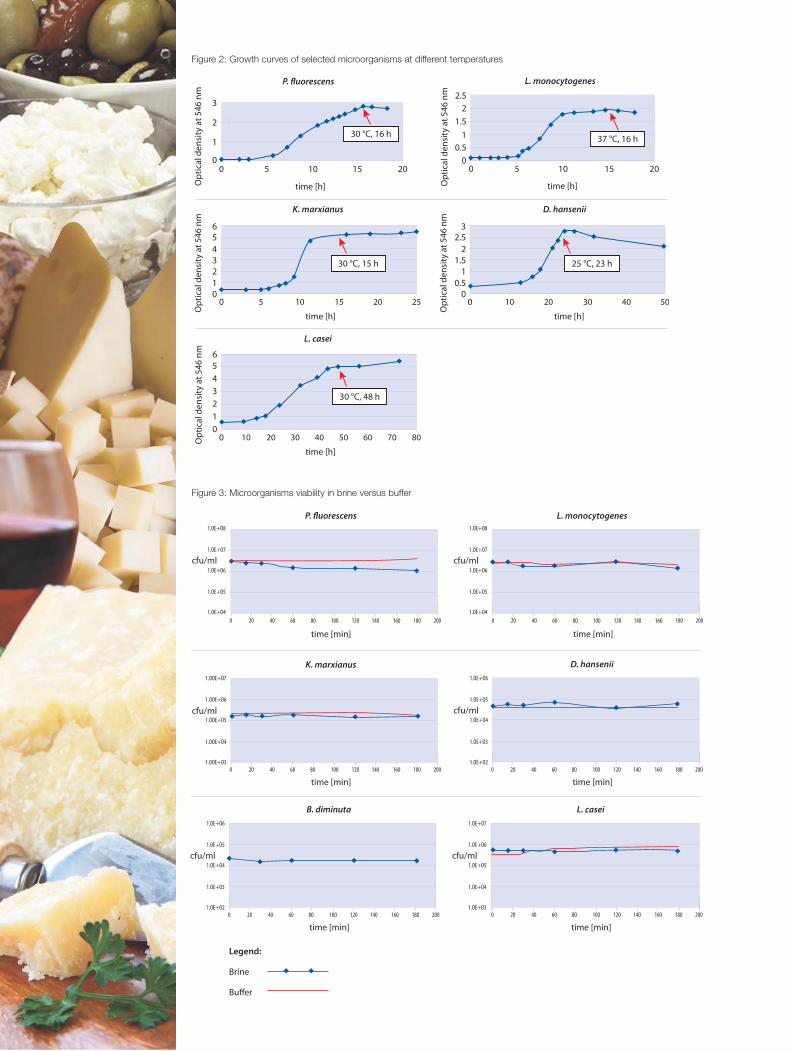
Figure 3: Microorganisms viability in brine versus buffer
0 20 40 60 80 100 120 140 160 180 200
1.OE+O4
1.OE+O5
1.OE+O6
1.OE+O7
1.OE+O8
time [min]
cfu/ml
1.OE+O4
1.OE+O5
1.OE+O6
1.OE+O7
1.OE+O8
cfu/ml
P. fluorescens L. monocytogenes
0 20 40 60 80 100 120 140 160 180 200
time [min]
0 20 40 60 80 100 120 140 160 180 200
1.OOE+O7
1.OOE+O6
1.OOE+O5
1.OOE+O4
1.OOE+O3
time [min]
cfu/ml
K. marxianus
0 20 40 60 80 100 120 140 160 180 200
time [min]
0 20 40 60 80 100 120 140 160 180 200
D. hansenii
cfu/ml
1.OE+O6
1.OE+O5
1.OE+O4
1.OE+O3
1.OE+O2
time [min]
0 20 40 60 80 100 120 140 160 180 200
B. diminuta
cfu/ml
1.OE+O6
1.OE+O5
1.OE+O4
1.OE+O3
1.OE+O2
Legend:
Brine
Buffer
time [min]
L. casei
cfu/ml
1.OE+O7
1.OE+O6
1.OE+O5
1.OE+O4
1.OE+O3
Figure 2: Growth curves of selected microorganisms at different temperatures
30 °C, 16 h
30 °C, 15 h
0
0 5 10 15 20 25
0
01
234
56
1
2
3
5 10 15 20
time [h]
time [h]
time [h]Op
tica
l de
nsi
ty a
t 5
46
nm
Op
tica
l de
nsi
ty a
t 5
46
nm
0
0.5
1
1.5
2
2.5
0 5 10 15 20
Op
tica
l de
nsi
ty a
t 5
46
nm
P. fluorescens
K. marxianus D. hansenii
L. monocytogenes
37 °C, 16 h
0 10 20 30 40 500
0.5
11.5
2
2.53
time [h]
Op
tica
l de
nsi
ty a
t 5
46
nm
0 10 20 30 40 60 70 80500
1
2
3
4
5
6
time [h]
Op
tica
l de
nsi
ty a
t 5
46
nm
L. casei
25 °C, 23 h
30 °C, 48 h

Figure 4: Microorganism cell dimensions in buffer and in brine
mean size in brine1.48 x 0.64 μm
0.5
1
1.5
2
2.5
3
3.5
0
P. fluorescens
size
[μ
m]
mean size in brine4.53 x 2.06 μm
2.0
4.0
6.0
8.0
10.0
0.0
K. marxianus
size
[μ
m]
in buffer length
in buffer width
in brine length
in brine width
mean size in brine1.44 x 0.71 μm
0.5
1.0
1.5
2.0
2.5
3.0
3.5
0.0
L. monocytogenes
size
[μ
m]
mean size in brine2.83 x 2.35 μm
1.0
2.0
3.0
4.0
5.0
0.0
D. hansenii
size
[μ
m]
mean size in brine2.68 x 0.66 μm
1.0
0.5
1.5
2.0
2.5
3.0
3.5
4.0
4.5
5.0
0.0
L. casei
size
[μ
m]
mean size in brine1.44 x 0.71 μm
0.2
0.4
0.6
0.8
1.0
0.0
B. diminuta
size
[μ
m]

Table II : Test conditions
Filter Pall crossflow module USP143
Effective filtration surface area 0.12 m²
Test flow rate 37 L/m²h in direct filtration mode
Filtration temperature 10 °C
Number of tests 3 different filter modules per challenge organism
2 to 3 challenge tests per filter module
Brine model solution 20 % NaCl + 0.1% CaCl2
pH adjusted at 4.6 – 4.8 with HCl
Volume filtered 4.5 L
Total filtrate sampled by control membranes for analysis
Figure 5: Challenge test set-up – Schematic description
Figure 6: Challenge test – Main Steps
1. Disinfection
2. Rinsing
3. Filtration
reservoir
disinfectant
tap water cold
tap water hot
MIC
RO
ZA
USP
143
Test module
Ste
rile
wat
er
filt
er
aseptic collectionof filtrate samples
Reservoir Brine1. sterile2. with test organisms
PI
PIPI
air filterpressurized air
Filter set-up disinfection
Filter rinse with 0.2 µm filtered water
Water displacement with brine and flowregulation
Filtration of challenge brineat 35 L/m2h (4.5 L/h)
(microorganisms inoculated 1 h before test to avoid salt stressed cells)
Filtrate collectionAnalysis of complete filtrate fractions
Filter set-up disinfection
Figure 7: Typical brine turbidity
Brine
Filtrate
Concentrate

Pall Food and Beverage
25 Harbor Park DrivePort Washington, NY 11050 +1 516 484 3600 telephone+1 866 905 7255 toll free US
© Copyright 2011, Pall Corporation. Pall, and SUPRAdisc are trademarks of Pall Corporation. ® Indicates a trademark registered in the USA. Filtration. Separation. Solution.SM and Total Fluid ManagementSM are service marks of Pall Corporation.
FBTBCBEN July 2011
Visit us on the Web at www.pall.com/foodandbev
Pall Corporation has offices and plants throughout the world. For Pall representativesin your area, please go to www.pall.com/contact
Please contact Pall Corporation to verify that the product conforms to your nationallegislation and/or regional regulatory requirements for water and food contact use.
Because of technological developments related to the products, systems, and/orservices described herein, the data and procedures are subject to change without notice.Please consult your Pall representative or visit www.pall.com to verify that thisinformation remains valid.
Contact Information
Aline Sokol-Cencetti
Global Marketing Manager, Pall Food and Beverage
E-mail: [email protected]
Table III: Microbial challenge test results on Pall USP 143 hollow fiber module
Module Organism CFU in total CFU / cm² CFU in total LRV
no. challenge filtrate
1 P. fluorescens 3.43E+08 2.86E+05 0 > 8.5
2 P. fluorescens 3.80E+08 3.17E+05 0 > 8.6
3 P. fluorescens 2.71E+08 2.26E+05 0 > 8.4
1 P. fluorescens 3.99E+10 3.33E+07 0 > 10.6
2 P. fluorescens 3.76E+10 3.13E+07 0 > 10.6
3 P. fluorescens 3.12E+10 2.60E+07 0 > 10.5
4 L. monocytogenes 8.55E+10 7.13E+07 0 > 10.9
5 L. monocytogenes 3.89E+10 3.24E+07 0 > 10.6
6 L. monocytogenes 8.24E+10 6.86E+07 0 > 10.9
4 L. casei 4.29E+10 3.57E+07 0 > 10.6
5 L. casei 5.36E+10 4.46E+07 0 > 10.7
6 L. casei 4.22E+10 3.51E+07 0 > 10.6
1 K. marxianus 2.62E+10 2.19E+07 0 > 10.4
2 K. marxianus 2.70E+10 2.25E+07 0 > 10.4
3 K. marxianus 2.52E+10 2.10E+07 0 > 10.4
1 D. hansenii 4.50E+10 3.75E+07 0 > 10.7
2 D. hansenii 4.73E+10 3.94E+07 0 > 10.7
3 D. hansenii 4.13E+10 3.44E+07 0 > 10.6
4 B. diminuta 2.12E+08 1.76E+05 0 > 8.3
4 B. diminuta 2.53E+10 2.11E+07 0 > 10.4
5 B. diminuta 3.42E+10 2.85E+07 0 > 10.5
6 B. diminuta 2.92E+10 2.43E+07 0 > 10.5