sectoral decarbonization approach (sda)
TRANSCRIPT

Sectoral Decarbonization Approach (SDA)Science-based Targets
Giel Linthorst, Programme leader Science-based Targets
23/02/2015

© ECOFYS | |
Sectoral Decarbonization Approach (SDA)
23/02/2015 Giel Linthorst, Programme leader Science-based Targets
• Develop by CDP, WRI and WWF
with Ecofys’ technical support
• Freely available methodology
that allows companies to set
emission reduction targets in line
with climate science
• Based on the least-cost modelled
2 oC scenario (2DS) developed by
the International Energy Agency
(IEA) as part of its publication,
Energy Technology Perspectives
2014© Science Based Targets. All Rights Reserved.

© ECOFYS | |
SDA – Development process
23/02/2015 Giel Linthorst, Programme leader Science-based Targets
Methodology
principles
Technical advisory group Technical consultantSteering committee
Draft
methodology
Stakeholder
workshops
Updated
methodology
Public
consultation
Finalize
methodology
January
2014
June
2014
October
2014
March
2015
© ECOFYS | |
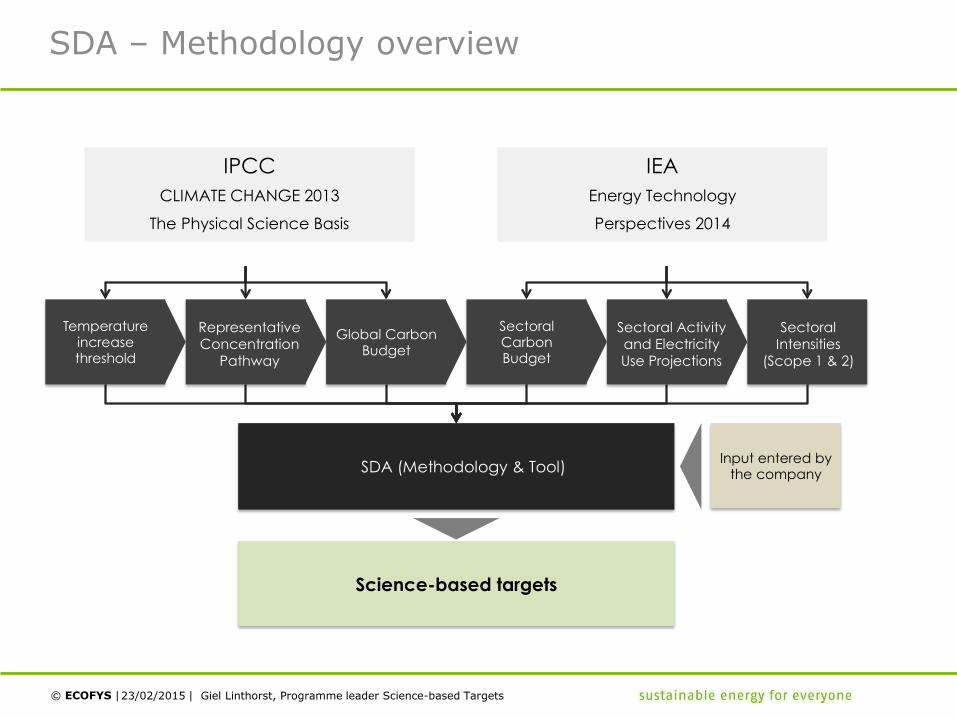
SDA Approach (Methodology & Tool) Input entered by
the company
Science-based targets
Representative Concentration
Pahway
Global Carbon Budget
Temperature increase threshold
Sectoral Carbon Budget
Sectoral Activity
Projections
Sectoral Intensity
SDA – Methodology overview
23/02/2015 Giel Linthorst, Programme leader Science-based Targets
Representative Concentration
Pathway
SDA (Methodology & Tool)
Sectoral Activity and Electricity Use Projections
SectoralIntensities
(Scope 1 & 2)
IPCC
CLIMATE CHANGE 2013
The Physical Science Basis
IEA
Energy Technology
Perspectives 2014

© ECOFYS | |
SDA – From global carbon budget to sectors
0
5
10
15
20
25
30
35
2010 2020 2030 2040 2050
Dir
ect
CO
2 e
mis
sio
ns (
GtC
O2)
Power generation Cement Iron and steel
Aluminium Chemicals and petrochemicals Pulp and paper
Other industry Light road passenger transport Heavy road passenger transport
Rail passenger transport Aviation passenger transport Other transport
Service buildings
Total carbon budget
1054 GtCO2
23/02/2015 Giel Linthorst, Programme leader Science-based Targets
© ECOFYS | |
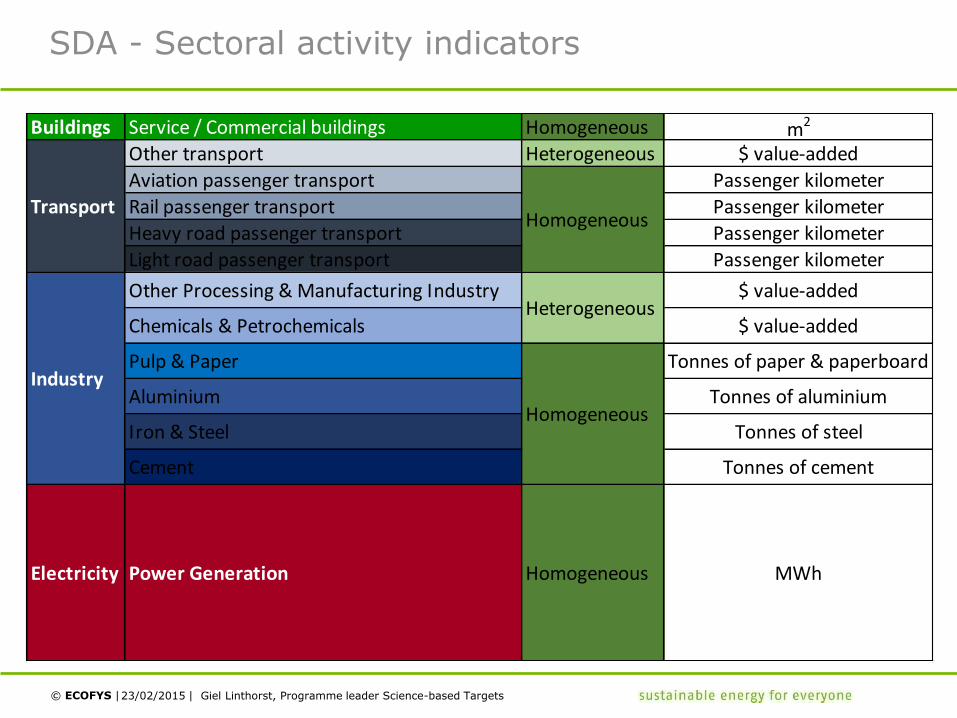
SDA - Sectoral activity indicators
23/02/2015 Giel Linthorst, Programme leader Science-based Targets
Buildings Service / Commercial buildings Homogeneous m2
Other transport Heterogeneous $ value-added
Aviation passenger transport Passenger kilometer
Rail passenger transport Passenger kilometer
Heavy road passenger transport Passenger kilometer
Light road passenger transport Passenger kilometer
Other Processing & Manufacturing Industry $ value-added
Chemicals & Petrochemicals $ value-added
Pulp & Paper Tonnes of paper & paperboard
Aluminium Tonnes of aluminium
Iron & Steel Tonnes of steel
Cement Tonnes of cement
Electricity Power Generation Homogeneous MWh
Transport
Industry
Homogeneous
Homogeneous
Heterogeneous
© ECOFYS | | 23/02/2015 Giel Linthorst, Programme leader Science-based Targets
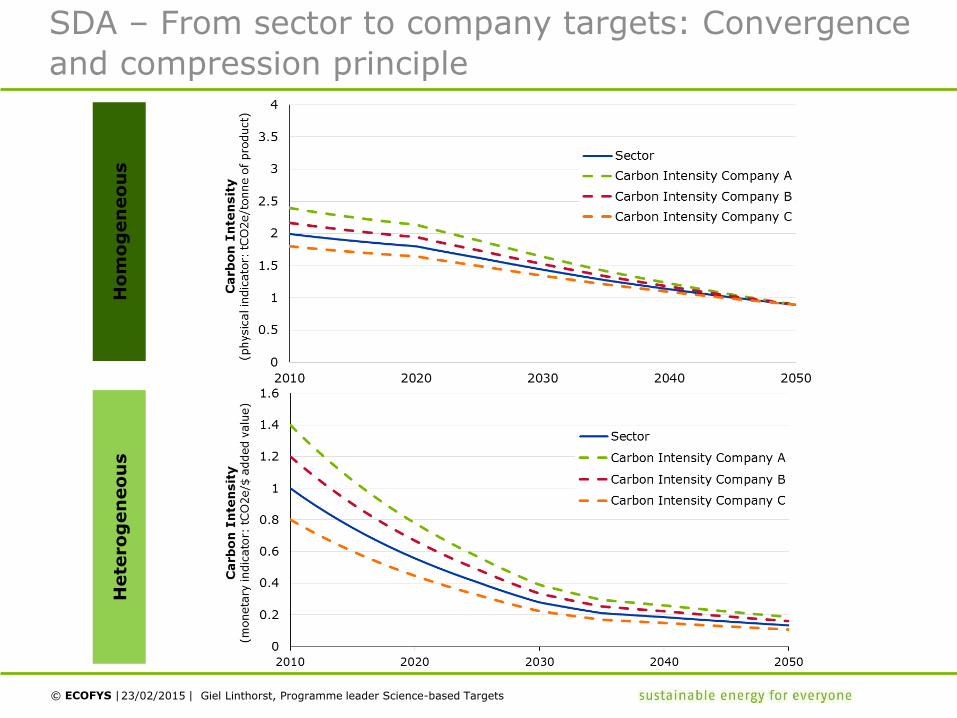
SDA – From sector to company targets: Convergence
and compression principle
Ho
mo
gen
eo
us
Hete
ro
gen
eo
us

© ECOFYS | |
IEA 2DS input
• Sector activity 2010-2050• Sector CO2 emissions 2010-
2050• Sector electricity use 2010-
2050
Company inputs
• Sector allocation• Base year• CO2e emissions (base year)• Electricity use (base year)• Activity (base year) • Expected activity growth• Target year(s)
Calculation Output
Scope 1 & Scope 2 company intensity
pathways
Scope 1+2 company absolute CO2 emission
target
Creating the company intensity pathway to 2050 based either on convergence or compression
Sector Scope 1 & Scope 2 CO2 emission intensity
pathways
Company base year CO2eemission intensity
1
2
3 4
5
6
7
SDA - Schematic overview of methodology
23/02/2015 Giel Linthorst, Programme leader Science-based Targets

© ECOFYS | |
SDA – Example: fictional beverage company
23/02/2015 Giel Linthorst, Programme leader Science-based Targets
> International beverage company
– $84 million gross profit in 2013
– Annual production of 1,1 billion juice packs
– Purchased paper: 50,000 tonnes
– Predicted annual activity growth of 3%
– Target year: 2020
> Emissions included in Science-based target setting:
– Scope 1 emissions from operational processes: 18,000 tonnes of CO2e
– Scope 1 emissions from own fleet: 10,000 tonnes of CO2e
– Scope 2 emissions from operational processes: 20,500 tonnes of CO2e
– Scope 3 emissions from logistics: 22,500 tonnes of CO2e
– Scope 3 emissions from purchased paper: 62,000 tonnes of CO2e
Scope 1 emissions operations
Scope 1 emissions fleet
Scope 2 emissions operations
Scope 3 emissions logistics
Scope 3 emissions paper
© u
ropek8 -
Foto
lia.c
om
© ECOFYS | |
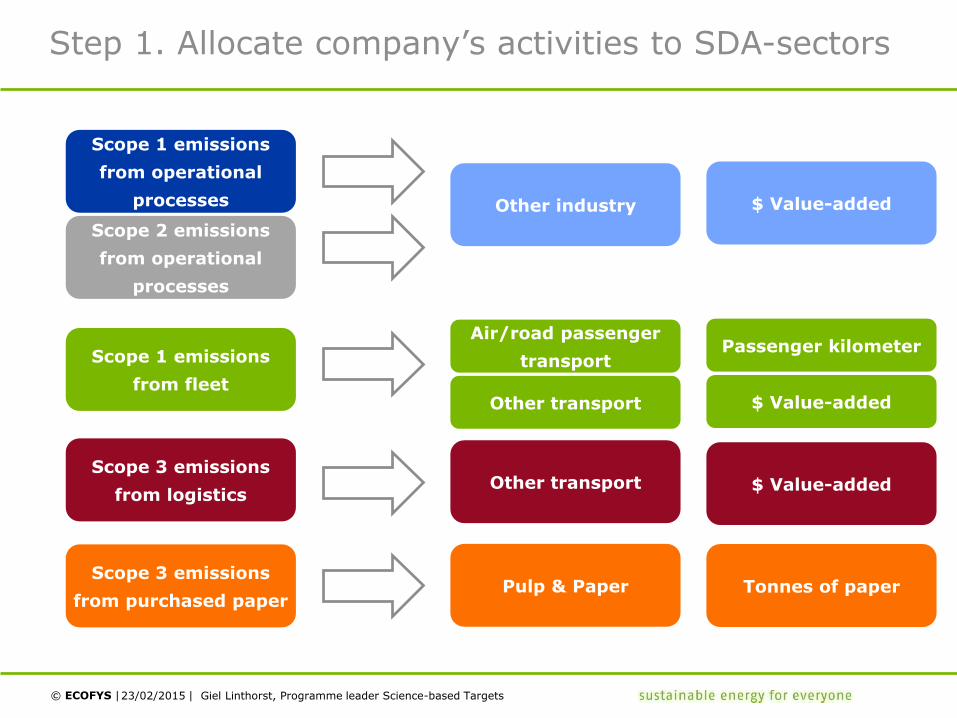
Step 1. Allocate company’s activities to SDA-sectors
23/02/2015 Giel Linthorst, Programme leader Science-based Targets
Scope 1 emissions
from operational
processes
Scope 1 emissions
from fleet
Scope 2 emissions
from operational
processes
Scope 3 emissions
from logistics
Scope 3 emissions
from purchased paper
Other industry $ Value-added
Air/road passenger
transport
Other transport
Passenger kilometer
$ Value-added
Other transport $ Value-added
Pulp & Paper Tonnes of paper

© ECOFYS | |
Step 2. Enter GHG data in the tool
23/02/2015 Giel Linthorst, Programme leader Science-based Targets
Sector 1 Company input Unit
Select sector 1: Other industry
Select subsector: Manufacture of beverages
Selected sector: Manufacture of beverages
Activities in base year: 84,000,000 $ value added (2013)
Annual activity growth rate: 3.00 % per year
Electricity use in base year: 42,500,000 kWh
Scope 1 emissions: 18,000 tonne CO2
Scope 2 emissions: 20,500 tonne CO2
Sector 2 Company input Unit
Select sector 2: Pulp and paper
Select subsector:
Selected sector: Pulp and paper
Activities in base year: 50,000 tonnes paper and cardboard
Annual activity growth rate: 3.00 % per year
Electricity use in base year: kWh
Scope 1 emissions: 37,000 tonne CO2
Scope 2 emissions: 25,000 tonne CO2
© ECOFYS | |
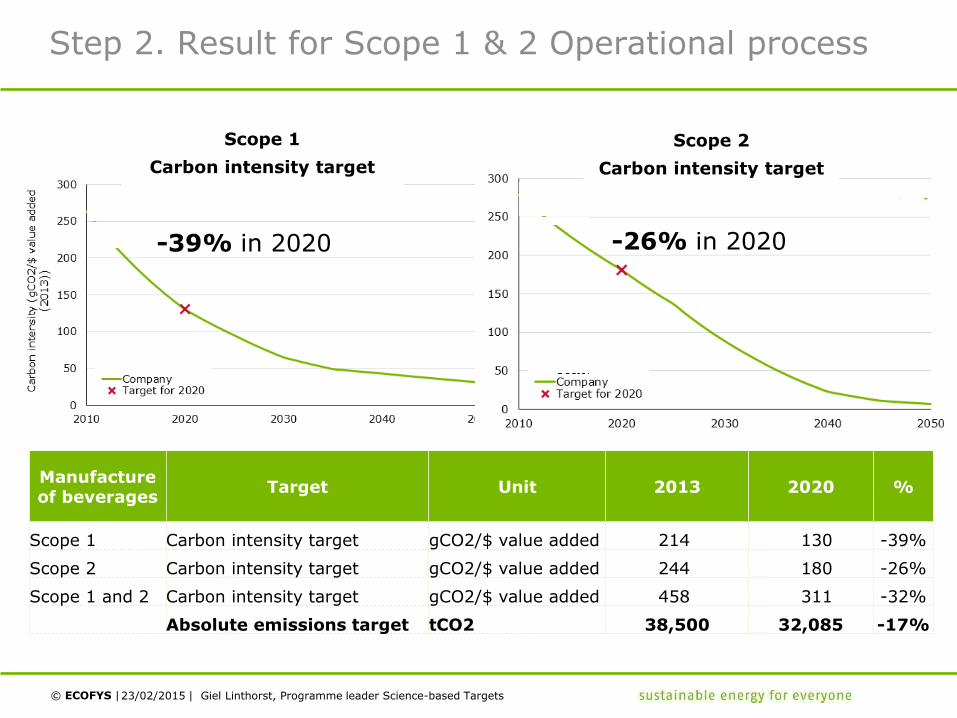
Step 2. Result for Scope 1 & 2 Operational process
23/02/2015 Giel Linthorst, Programme leader Science-based Targets
-39% in 2020 -26% in 2020
Manufacture of beverages
Target Unit 2013 2020 %
Scope 1 Carbon intensity target gCO2/$ value added 214 130 -39%
Scope 2 Carbon intensity target gCO2/$ value added 244 180 -26%
Scope 1 and 2 Carbon intensity target gCO2/$ value added 458 311 -32%
Absolute emissions target tCO2 38,500 32,085 -17%
Scope 1
Carbon intensity target
Scope 2
Carbon intensity target
© ECOFYS | |
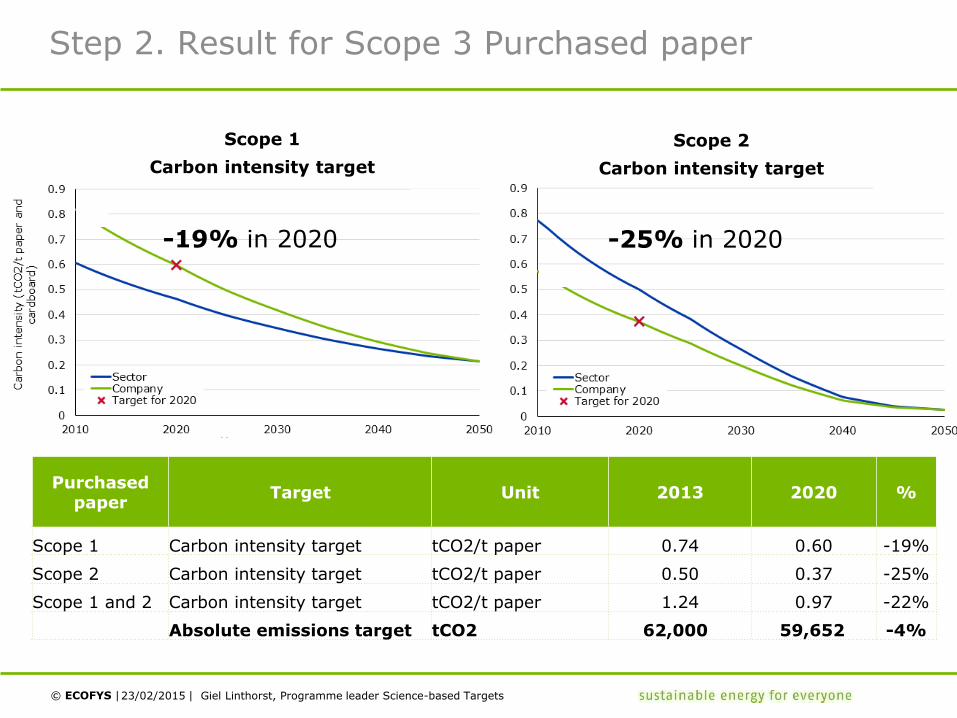
Step 2. Result for Scope 3 Purchased paper
23/02/2015 Giel Linthorst, Programme leader Science-based Targets
Scope 2 carbon intensity
-23% in 2020
Scope 1
Carbon intensity target
Scope 2
Carbon intensity target
Purchased paper
Target Unit 2013 2020 %
Scope 1 Carbon intensity target tCO2/t paper 0.74 0.60 -19%
Scope 2 Carbon intensity target tCO2/t paper 0.50 0.37 -25%
Scope 1 and 2 Carbon intensity target tCO2/t paper 1.24 0.97 -22%
Absolute emissions target tCO2 62,000 59,652 -4%
-19% in 2020 -25% in 2020-19% in 2020

© ECOFYS | |
SDA – Key characteristics
23/02/2015 Giel Linthorst, Programme leader Science-based Targets
1. The methodology is based on the best of science and a least-cost
modelled 2°C scenario (IEA 2DS)
2. The methodology combines sectoral emissions pathways with sectoral activity
projections from IEA 2DS to construct sectoral intensity pathways
3. Both carbon intensity and absolute targets can be set. The methodology
uses physical intensity indicators for homogenous sectors and monetary
intensity indicators ($ value added) for heterogeneous sectors
4. The methodology can be used to set scope 1 and 2 targets and to set targets
for a selection of scope 3 categories
5. The methodology is flexible to set targets for each year until 2050
6. The methodology will be improved continuously based on new insights

© ECOFYS | |
For more information, please contact:
> Giel Linthorst
Programme Leader Science Based Targets
www.ecofys.com
23/02/2015 Giel Linthorst, Programme leader Science-based Targets