sectoral collective bargaining, productivity and competitiveness: south … · · 2016-03-221...
TRANSCRIPT
1
SECTORAL COLLECTIVE BARGAINING, PRODUCTIVITY AND
COMPETITIVENESS: SOUTH AFRICA’S CLOTHING INDUSTRY
BETWEEN A ROCK AND A HARD PLACE
Shane Godfrey
Labour and Enterprise Policy Research Group
Institute of Development and Labour Law/Sociology Department
University of Cape Town
with
Trenton Elsley and Michelle Taal
Labour Research Service
Cape Town
7 March 2016

2
Table of contents
1. Introduction
2. Wage setting institutions: continuities and changes
3. The clothing sector in South Africa
3.1 Trade and industrial policy
3.2 Restructuring and the challenge of competitiveness
3.3 Sectoral bargaining, wages and employment
4. Productivity and wages
4.1 The problem with productivity as a measure
4.2 Measuring productivity in the clothing sector: the economist’s perspective
4.3 Measuring productivity in the clothing sector: the production manager’s
perspective
5. Linking productivity and wages
5.1 Linking productivity and wages in sector-level collective bargaining
5.2 Linking productivity and wages at enterprise level: five case studies
6. Conclusion: Is there a need for a new approach to collective bargaining?
3
1. Introduction
Conventional wisdom tells us that effective collective bargaining, whether at national,
sectoral or enterprise level, should ensure that rising productivity is accompanied by
increases in real wages. However, over the last two decades the growth in average real wages
has lagged the increase in average value-added per worker in most advanced industrialised
countries. One reason is shrinking trade union membership and declining union bargaining
power. Another reason is change to the institutional frameworks for collective bargaining.
Given that in most developing countries trade union membership is much lower and labour
market institutions much weaker than in developed countries, the trend with regard to
productivity and real wages is probably much worse.
South Africa is interesting because it is a country with the characteristics of both developed
and less developed countries that produce a complex mix of outcomes in the labour market.
Of the economically active population just over half is employed in the formal (developed)
economy, about a fifth in the informal (underdeveloped) economy, and about a quarter are
unemployed (excluding discouraged job seekers).1 Informal employment is therefore much
lower and unemployment higher than in many less developed countries. Furthermore, unlike
most developing countries, South Africa has a strong trade union movement and well-
established collective bargaining institutions, in practice restricted largely to the formal
economy. Organized labour was ostensibly strengthened in the wake of the country’s first
democratic elections in 1994 which resulted in extensive reforms to labour legislation, as well
as a more prominent political role for the Congress of South African Trade Unions
(COSATU).2
These developments would suggest a rising share for labour in any productivity gains over
the last two decades. But the reforms to labour market regulation ran parallel to the
introduction of a neo-liberal macroeconomic policy and industrial policy measures that were
initially more oriented to developing a knowledge economy than assisting low-tech, labour
intensive manufacturing. The intention was that there would be rapid economic growth that
would put the country onto a high productivity, high skill and high wage growth path. Strong
labour market institutions, including a new training dispensation, would ensure that the
benefits of economic growth would be more equitably distributed. The virtuous cycle of
growth and redistribution would make inroads into unemployment, inequality and poverty.
This has not been the case. Instead, economic growth has averaged less than 3% per annum,
unemployment has remained very high and inequality has worsened. Furthermore, over the
period 1982 to 2014 real wages have more or less remained level with productivity increases,
albeit with some fluctuations at certain points.(Burger, 2016: 4)
The most visible consequence of inadequate growth and redistribution has been rising social
unrest,3 including industrial action and worker protests, with increased levels of violence.
There is also a growing sense that South African workplaces have become as adversarial as
they were during the height of the struggle against apartheid and that the nascent social
partnership that was fostered after 1994 has broken down. The latter is reflected in the
ongoing assault on the rights established by the new labour legislation on the grounds that
1 Own calculations using the Labour Market Dynamics Survey 2014. 2 COSATU is the largest trade union federation and is in an alliance with the ruling African National Congress
and the South African Communist Party (i.e. the Tripartite Alliance). 3 The other major form of social unrest has been so-called service delivery protests in many townships across
South Africa, usually directed at local government.
4
they are restricting economic growth and job creation, and that real wages increases are
outstripping rises in productivity. The allegations of ‘rigidity’ and demands for ‘flexibility’
are not unique to South Africa, but the persistently high levels of unemployment and poverty
have sharpened the attacks on labour market regulation. One of the main targets of these
attacks has been the system of centralised, sector-level bargaining supported by the Labour
Relations Act, in particular the extension of agreements reached by bargaining councils.
2. Wage setting institutions: continuities and changes
In 1924 the first national legislation to regulate collective bargaining was introduced in South
Africa.4 It provided a framework for the voluntary establishment and registration of
centralized bargaining structures called industrial councils. The statute was followed a year
later by legislation to set wages and other employment conditions administratively in sectors
where there was little or no trade union organization or collective bargaining.5 This took the
form of wage determinations set through recommendations of a Wage Board. In these
respects South Africa more or less followed a ‘model’ being disseminated in the
Commonwealth early in the 20th century, although the country was exceptional in that the
statutory collective bargaining system excluded African workers.
The labour relations system that was introduced into South Africa was arguably geared to
regulate wages and working conditions for the emerging Fordist mode of production, i.e. it
was envisaged that industrial councils would be established at sector and national levels by
industrial trade unions representing mainly semi-skilled workers. At that time, however, craft
unions were still relatively powerful in South Africa and the exclusion of African workers
from the system reduced the number of semi-skilled and low-skilled employees it covered.
The industrial councils that emerged were therefore dominated by craft unions representing
skilled white workers. One consequence was the development of an extremely wide gap
between the wages of skilled (predominantly White) workers, on the one hand, and semi-
skilled and low-skilled (predominantly Africa) workers on the other hand. Another
consequence was that the goal of a system of national sector-wide industrial councils was not
achieved.
By the early 1970s there were about a hundred industrial councils and 75 wage
determinations. Most industrial councils were established along local or regional lines,
covering sectors or only parts of sectors. Similarly, wage determinations issued by the
Department of Labour covered sectors or sub-sectors in a number of districts or provinces,
with only a few covering the entire country. There were, furthermore, large sectors and
regions that were not covered by either an industrial council or a wage determination.6 The
result was a patchwork system of wage regulation comprising centralised collective
bargaining structures at various levels and wage determinations issued administratively.
In 1979 and the early 1980s significant reforms were made to the labour statutes, including
the partial de-racialisation of the system.7 African workers could form trade unions that could
4 Industrial Conciliation Act, 11 of 1924. 5 Wage Act, 27 of 1925. 6 Importantly, the public sector was excluded from the system, as were the farming and domestic worker
(private household) sectors, both of which had large numbers of employees paid very low wages. 7 Trade unions could remain registered or could register for particular racial groups. The labour side of most
industrial councils therefore continued to be divided along racial lines.

5
represent them in industrial council negotiations and existing trade unions could admit
African workers as members. Furthermore, a statute setting basic conditions of employment –
excluding a minimum wage - for employees not covered by industrial councils was
introduced in 1983. It operated in tandem with the Wage Act, which continued to set sectoral
wages administratively via wage determinations. The wage-setting system therefore remained
somewhat fragmented. After COSATU was established in 1985 it put its weight behind a
demand for a much more coherent system of national industrial councils, to be achieved if
necessary by legislation. However, despite its affiliates becoming the dominant trade union
parties on many industrial councils, COSATU was able to effect only limited changes to the
patchwork system of councils that had developed.
In 1994 the new democratically-elected government moved quickly to revamp the legislative
framework for labour market regulation. New labour statutes were introduced over a period
of about four years under the rubric of ‘regulated flexibility’, the term that sought to capture
the balancing act that the legislation aimed to achieve between redress and redistribution
through improved and expanded workers’ rights and the promotion of efficiency,
international competitiveness and economic growth. The new statutes included the Labour
Relations Act, 66 of 1995; the Basic Conditions of Employment Act, 75 of 1997; the
Employment Equity Act, 55 of 1998; and the Skills Development Act, 97 of 1998.
Although there were extensive reforms to the labour relations system as a whole, there was
significant continuity with regard to the collective bargaining system and the administrative
determination of minimum standards. COSATU’s demand for legislative compulsion to
reconstruct the industrial council system had been rejected and the new Labour Relations Act
(LRA) provided an enabling framework for voluntary centralised bargaining. Industrial
councils were renamed bargaining councils and almost all the existing industrial councils
were registered as bargaining councils under the new Act.8 The Minister of Labour continued
to have some discretion to extend collective agreements reached at bargaining councils,
although the new statute limited that discretion somewhat and sought to make the exemption
systems of councils more transparent.9
The Basic Conditions of Employment Act (BCEA),which repealed the 1983 Act and the 1957
Wage Act, provides a floor of minimum standards, albeit with the addition of some new
standards and the improvement of others, while also greatly expanding the number of
workers under its protection.10 Some changes were made to the process for setting wages in
poorly organised sectors, but much the same system of administered wages through
determinations (the Act changed the name from wage determinations to sectoral
determinations) continued. Transitional arrangements saw the old wage determinations
remain in effect until they were converted into sectoral determinations by an amendment to
the Act in 2002.11(Du Toit et al, 2006: 34-36)
South Africa was therefore reintegrated into the global economy with a set of wage-setting
mechanisms that were arguably designed for an import substituting industrialization strategy
and mass manufacturing, i.e. a Fordist mode of production. It was a time when these types of
wage-setting institutions were being undermined by restructuring in most advanced
8 At that point there were 81 industrial councils.(Standing et al, 1996: 151. 9 Each bargaining council is obliged to have a procedure whereby employers may apply for exemption from
some or all provisions of a bargaining council agreement. 10 It includes the farming and domestic worker sectors. 11 At that point there were only 19 wage determinations.(Standing et al, 1996: 145.

6
industrialised countries, while many developing countries were pursuing export-oriented
industrialization, usually on the basis of a comparative labour cost advantage. In the study of
the clothing sector we explore the question of the appropriateness of the wage-setting
mechanisms in more detail.
3. The clothing sector in South Africa
3.1 Trade and industrial policy
From its earliest beginnings the South African clothing sector focused on supplying the
domestic market. The domestic focus was strengthened by economic sanctions against the
country in the 1980s. By the early 1990s the sector sourced the majority of its fabric from
local textile mills, supplied 93% of local clothing demand, and exported only a small
proportion of total output.(October, 1996: 6) The domestic orientation made clothing
manufacturers dependent on the country’s retail sector. Initially the latter sector comprised
many relatively small independent firms, but it became increasingly concentrated in the latter
half of the 20th century: by the end of the century five retailers accounted for over 70% of
formal clothing sales in the country.(Vlok, 2006: 228; Morris and Reed, 2008: 10) These
retailers have come to exercise immense power in the value chain, especially since local
manufacturers had not had much success in finding markets outside the country.
In 1994 a major change took place. The apartheid government made commitments as part of
the Uruguay round of GATT to reform its tariff system. This commitment marked a change
from a combination of import control and export promotion to tariff liberalisation and an
export-oriented growth path. It was, furthermore, a commitment that the newly-elected ANC
government upheld.
The clothing industry had moved early in attempting to get ready for the challenges, mainly
because of the efforts of the trade union, SACTWU, which saw the establishment of the
Swart Commission in 1992.12 The Commission was a multi-partite body that had a brief to
plan a way forward for the clothing and textile industries. SACTWU wanted to use the
Commission to create a development plan that would encompass tariffs as well as policies
regarding investment, technology, productivity, employment and labour relations across both
the textile and clothing sectors.(Hirschsohn et al, 2000: 117-118)
There was a great deal of urgency at the time. The Swart Commission noted that the clothing
sector needed “(t)echnology upgrading, skills development, improved process management
systems, international specialization and dynamic marketing efforts” (1994: i). The ISI policy
had meant that “(c)ompetition was restricted and levels of efficiency were almost certainly
low by international standards”, while “aggregate levels of specialisation within the sector
was extremely low.”(Gibbon, 2002: 15). The industry, furthermore, lacked “capital,
technology and innovation”, had “high labour and management costs in relation to output”,
and its domestic-market focus meant it “was never able to achieve economies of
scale”.(Barnes, 2005: 7) The sector needed to move fast to become internationally
competitive and export oriented, and to achieve labour-absorbing growth. Clothing exports
would need to target high-priced market segments and niches, while small clothing firms and
“cottage industries within the informal sector” would need support to assist them to
12 The Commission was also known as the Panel and the Task Group.

7
formalise.(Swart Commission, 1994: iii, 7, 9) The only issue on which the Commission could
not reach consensus was the schedule for tariff reductions.
The ANC government opted for a phase-down of tariffs somewhere between the two
schedules proposed by different interest groups in the Commission: tariffs would reduce over
eight years with an end-rate of 40% in 2002. However, government rejected almost all the
other recommendations made by the Swart Commission, including the supply-side measures.
These had been seen as a critical counterweight to the tariff phase-down that would help the
clothing industry to increase its competitiveness. The only concession to the sector was to the
introduction of the Duty Credit Certificate (DCC) scheme.13 The end result was an industrial
policy that consisted primarily of tariff reductions and one programme to incentivise
exports.(Hirschsohn et al, 2000: 118-120; Gibbon, 2002: 16)
The commitments to the WTO were part of a neo-liberal shift in policy that was expressed
most explicitly in the Growth, Employment and Redistribution (GEAR) macroeconomic
strategy, which was markedly at odds with the policy direction suggested by the new labour
legislation being introduced at the same time. The industrial policy that followed was
strongly influenced by GEAR, with its objective of “employment creating international
competitiveness.”(Black and Roberts, 2009: 211-212)
Neither macroeconomic policy or the various industrial policies and measures to improve
competitiveness and export performance had much to offer the clothing industry. The focus
was instead on knowledge-intensive activities, advanced technology, infrastructure, and
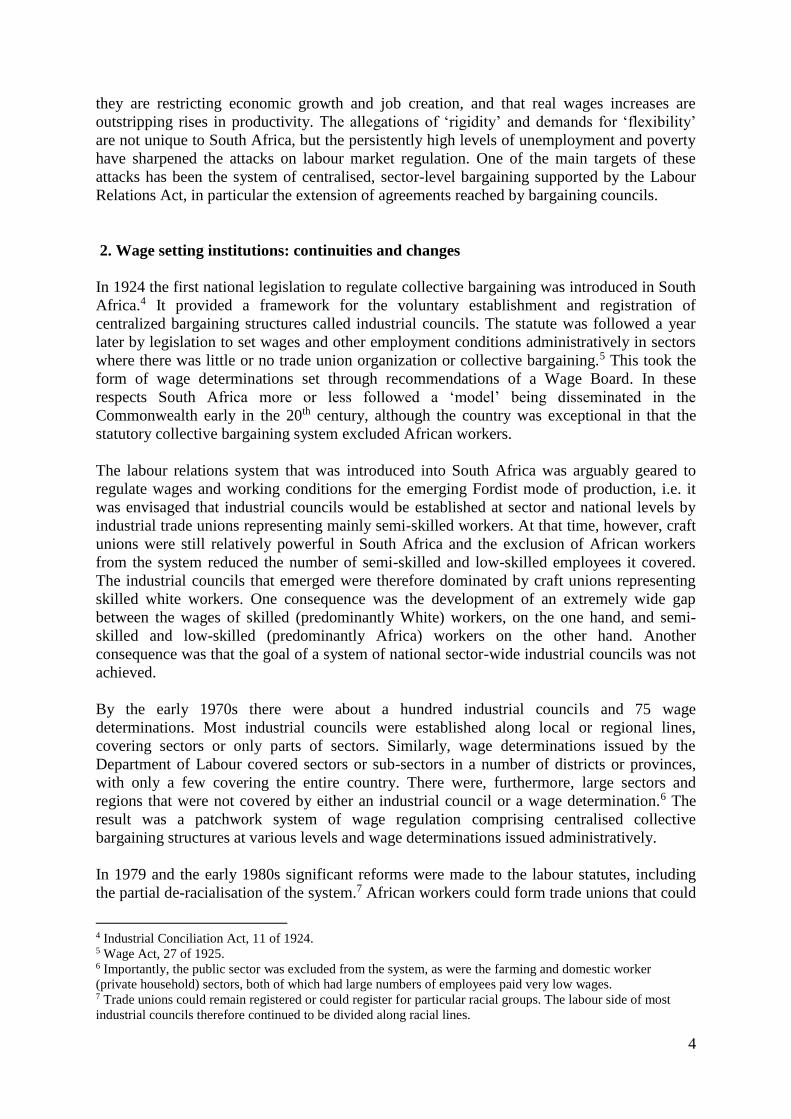
broad rather than sector-specific programmes.(Ibid 214-215) Restructuring in the clothing
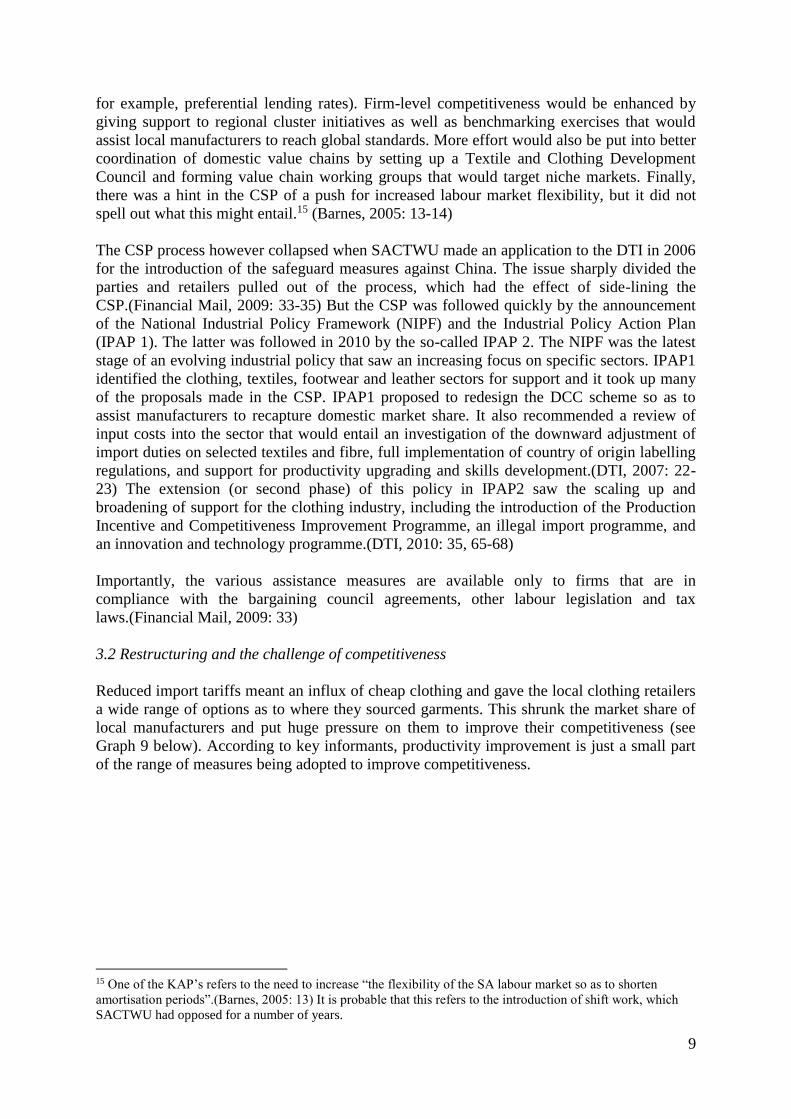
industry has therefore largely been driven by the phase-down of tariffs. This can be seen most
visibly in the rapid increase in clothing imports displayed in Graph 5. China dominated the
imports.(Morris and Reed, 2008: 12-13, 16-17; Vlok, 2006: 231; Staritz, 2010: 11) Exports
by local manufacturers did not off-set the share of the domestic market that they had lost to
imports: after a brief upsurge in the early 2000s, when the value of the Rand dropped steeply,
the quantity and value of exports has declined and is now almost negligible.
13 The DCC scheme encouraged exports by providing a rebate on duty on imports in proportion to the amount
exported. The scheme initially backfired because it allowed clothing manufacturers to sell any rebates they
earned, without restricting to whom the rebates could be sold. Retailers bought rebates at a discounted rate and
used them to import garments, thereby reducing demand for locally-produced clothing. The DCC scheme was
replaced in 2005 by the Interim Development Programme (IDP), which lasted until early 2007. From the second
year of its operation it provided that rebates could be sold only to other manufacturers.(Barnes, 2005: 9-10)
8
(Source: BM Analysts)
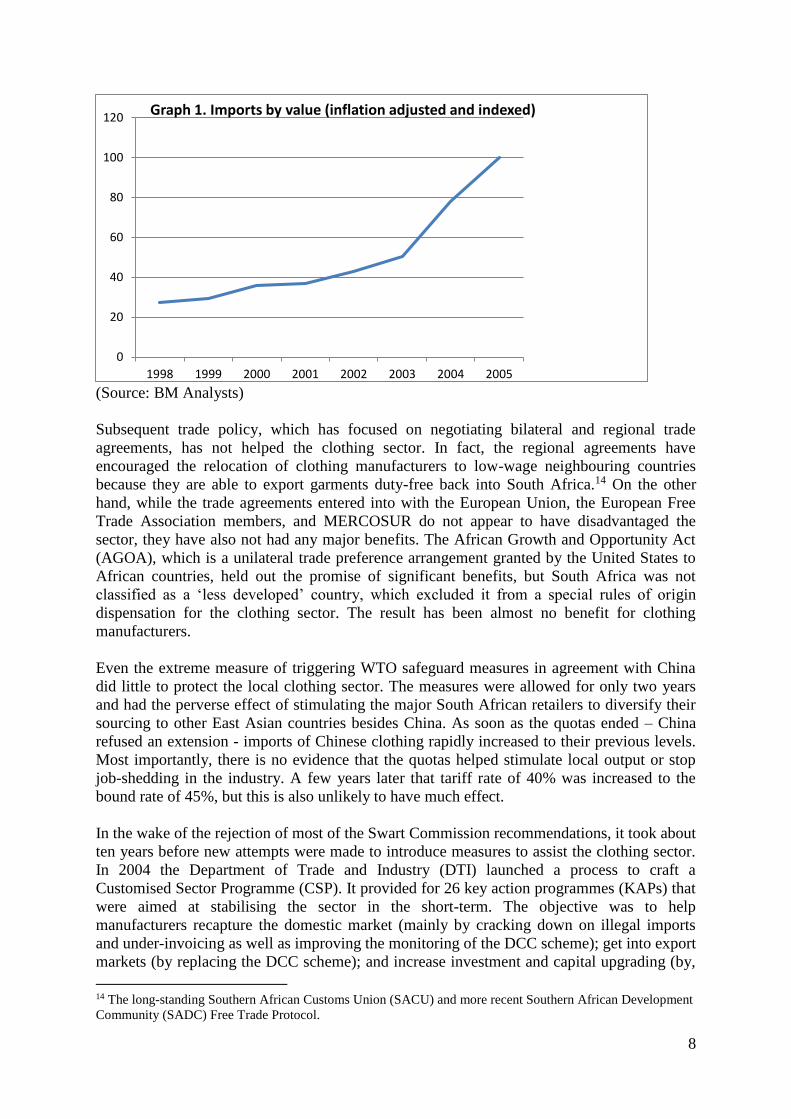
Subsequent trade policy, which has focused on negotiating bilateral and regional trade
agreements, has not helped the clothing sector. In fact, the regional agreements have
encouraged the relocation of clothing manufacturers to low-wage neighbouring countries
because they are able to export garments duty-free back into South Africa.14 On the other
hand, while the trade agreements entered into with the European Union, the European Free
Trade Association members, and MERCOSUR do not appear to have disadvantaged the
sector, they have also not had any major benefits. The African Growth and Opportunity Act
(AGOA), which is a unilateral trade preference arrangement granted by the United States to
African countries, held out the promise of significant benefits, but South Africa was not
classified as a ‘less developed’ country, which excluded it from a special rules of origin
dispensation for the clothing sector. The result has been almost no benefit for clothing
manufacturers.
Even the extreme measure of triggering WTO safeguard measures in agreement with China
did little to protect the local clothing sector. The measures were allowed for only two years
and had the perverse effect of stimulating the major South African retailers to diversify their
sourcing to other East Asian countries besides China. As soon as the quotas ended – China
refused an extension - imports of Chinese clothing rapidly increased to their previous levels.
Most importantly, there is no evidence that the quotas helped stimulate local output or stop
job-shedding in the industry. A few years later that tariff rate of 40% was increased to the
bound rate of 45%, but this is also unlikely to have much effect.
In the wake of the rejection of most of the Swart Commission recommendations, it took about
ten years before new attempts were made to introduce measures to assist the clothing sector.
In 2004 the Department of Trade and Industry (DTI) launched a process to craft a
Customised Sector Programme (CSP). It provided for 26 key action programmes (KAPs) that
were aimed at stabilising the sector in the short-term. The objective was to help
manufacturers recapture the domestic market (mainly by cracking down on illegal imports
and under-invoicing as well as improving the monitoring of the DCC scheme); get into export
markets (by replacing the DCC scheme); and increase investment and capital upgrading (by,
14 The long-standing Southern African Customs Union (SACU) and more recent Southern African Development
Community (SADC) Free Trade Protocol.
0
20
40
60
80
100
120
1998 1999 2000 2001 2002 2003 2004 2005
Graph 1. Imports by value (inflation adjusted and indexed)
9
for example, preferential lending rates). Firm-level competitiveness would be enhanced by
giving support to regional cluster initiatives as well as benchmarking exercises that would
assist local manufacturers to reach global standards. More effort would also be put into better
coordination of domestic value chains by setting up a Textile and Clothing Development
Council and forming value chain working groups that would target niche markets. Finally,
there was a hint in the CSP of a push for increased labour market flexibility, but it did not
spell out what this might entail.15 (Barnes, 2005: 13-14)
The CSP process however collapsed when SACTWU made an application to the DTI in 2006
for the introduction of the safeguard measures against China. The issue sharply divided the
parties and retailers pulled out of the process, which had the effect of side-lining the
CSP.(Financial Mail, 2009: 33-35) But the CSP was followed quickly by the announcement
of the National Industrial Policy Framework (NIPF) and the Industrial Policy Action Plan
(IPAP 1). The latter was followed in 2010 by the so-called IPAP 2. The NIPF was the latest
stage of an evolving industrial policy that saw an increasing focus on specific sectors. IPAP1
identified the clothing, textiles, footwear and leather sectors for support and it took up many
of the proposals made in the CSP. IPAP1 proposed to redesign the DCC scheme so as to
assist manufacturers to recapture domestic market share. It also recommended a review of
input costs into the sector that would entail an investigation of the downward adjustment of
import duties on selected textiles and fibre, full implementation of country of origin labelling
regulations, and support for productivity upgrading and skills development.(DTI, 2007: 22-
23) The extension (or second phase) of this policy in IPAP2 saw the scaling up and
broadening of support for the clothing industry, including the introduction of the Production
Incentive and Competitiveness Improvement Programme, an illegal import programme, and
an innovation and technology programme.(DTI, 2010: 35, 65-68)
Importantly, the various assistance measures are available only to firms that are in
compliance with the bargaining council agreements, other labour legislation and tax
laws.(Financial Mail, 2009: 33)
3.2 Restructuring and the challenge of competitiveness
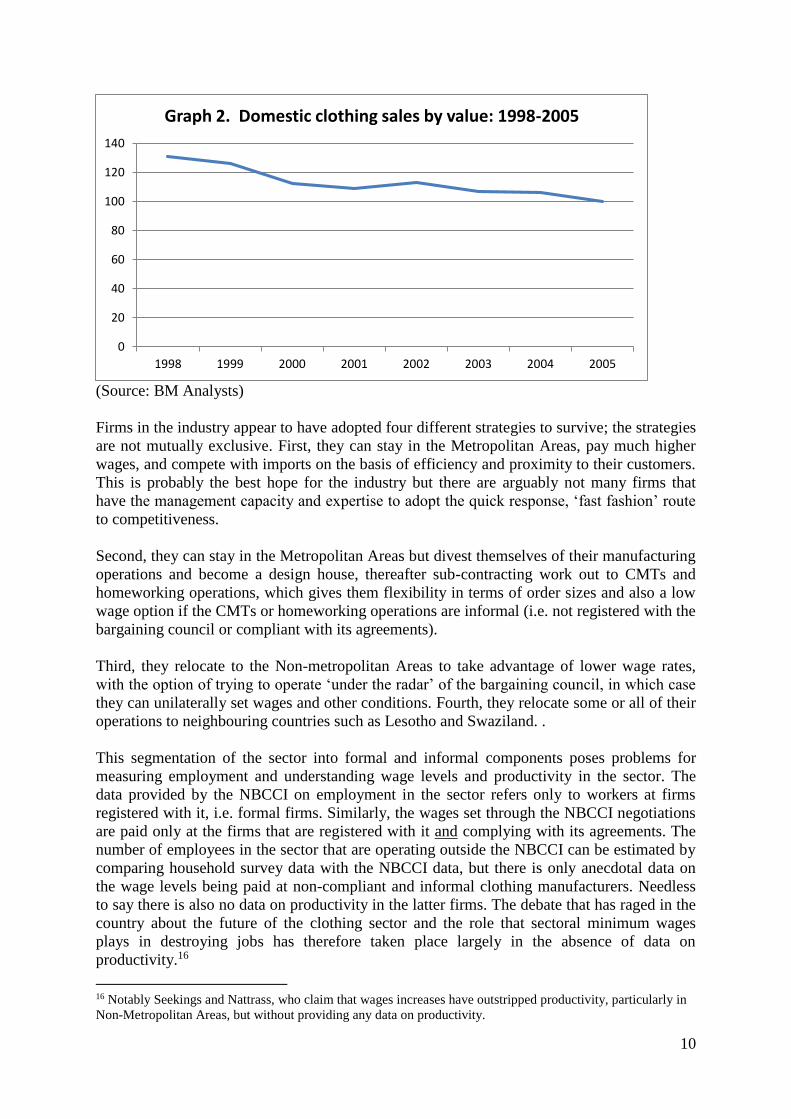
Reduced import tariffs meant an influx of cheap clothing and gave the local clothing retailers
a wide range of options as to where they sourced garments. This shrunk the market share of
local manufacturers and put huge pressure on them to improve their competitiveness (see
Graph 9 below). According to key informants, productivity improvement is just a small part
of the range of measures being adopted to improve competitiveness.
15 One of the KAP’s refers to the need to increase “the flexibility of the SA labour market so as to shorten
amortisation periods”.(Barnes, 2005: 13) It is probable that this refers to the introduction of shift work, which
SACTWU had opposed for a number of years.
10
(Source: BM Analysts)
Firms in the industry appear to have adopted four different strategies to survive; the strategies
are not mutually exclusive. First, they can stay in the Metropolitan Areas, pay much higher
wages, and compete with imports on the basis of efficiency and proximity to their customers.
This is probably the best hope for the industry but there are arguably not many firms that
have the management capacity and expertise to adopt the quick response, ‘fast fashion’ route
to competitiveness.
Second, they can stay in the Metropolitan Areas but divest themselves of their manufacturing
operations and become a design house, thereafter sub-contracting work out to CMTs and
homeworking operations, which gives them flexibility in terms of order sizes and also a low
wage option if the CMTs or homeworking operations are informal (i.e. not registered with the
bargaining council or compliant with its agreements).
Third, they relocate to the Non-metropolitan Areas to take advantage of lower wage rates,
with the option of trying to operate ‘under the radar’ of the bargaining council, in which case
they can unilaterally set wages and other conditions. Fourth, they relocate some or all of their
operations to neighbouring countries such as Lesotho and Swaziland. .
This segmentation of the sector into formal and informal components poses problems for
measuring employment and understanding wage levels and productivity in the sector. The
data provided by the NBCCI on employment in the sector refers only to workers at firms
registered with it, i.e. formal firms. Similarly, the wages set through the NBCCI negotiations
are paid only at the firms that are registered with it and complying with its agreements. The
number of employees in the sector that are operating outside the NBCCI can be estimated by
comparing household survey data with the NBCCI data, but there is only anecdotal data on
the wage levels being paid at non-compliant and informal clothing manufacturers. Needless
to say there is also no data on productivity in the latter firms. The debate that has raged in the
country about the future of the clothing sector and the role that sectoral minimum wages
plays in destroying jobs has therefore taken place largely in the absence of data on
productivity.16
16 Notably Seekings and Nattrass, who claim that wages increases have outstripped productivity, particularly in
Non-Metropolitan Areas, but without providing any data on productivity.
0
20
40
60
80
100
120
140
1998 1999 2000 2001 2002 2003 2004 2005
Graph 2. Domestic clothing sales by value: 1998-2005

11
The ‘winners’ in the story of the South African clothing sector are the big domestic retailers.
The country has historically had a relatively large local market that led to the growth of a
sophisticated and extremely concentrated retail sector. Just five retailers account for over
70% of all clothing sold in the country. Once trade liberalization took place and retailers
found alternative sources for products outside the country, the balance of power vis-à-vis
manufacturers shifted firmly in the retailers’ favour. The fact that local clothing
manufacturers have been unsuccessful in getting into export markets makes them entirely
dependent on the domestic market and puts them under the thumb of the major retailers.
Manufacturers are now price takers; there is very little room for negotiation with retailers or
the design houses that act for them. In the latter case prices are pushed even lower because
the design house must make its margin. The profit margin in clothing manufacture is
therefore very thin, especially when compared to the profits being earned by the retailers (see
further in section 5 below). The profit margin for the clothing sector is compared with
manufacturing as a whole in Graph 10 below.
(Statistics SA, P3002, Manufacturing Industry)
3.3 Sectoral bargaining, wages and employment
The clothing sector in South Africa differs from most other developing countries in that it is
very well organised by a single trade union. Trade union organisation has a long history in
the industry, as does centralised collective bargaining. Initially collective bargaining in the
sector took place in regional industrial councils. The agreements of the industrial councils
were generally extended to all employers and employees falling within their jurisdictions, i.e.
mainly urban and peri-urban areas in the major cities. In the early 1940s a wage
determination was issued that regulated clothing manufacturers in all areas of the country that
fell outside the jurisdiction of the regional industrial councils. The determination, however,
set significantly lower wages rates and inferior conditions to those in the industrial council
agreements, which meant that there was still some advantage to manufacturers if located in
rural areas.17 A pattern was therefore created early in the development of the industry that
saw wages and working conditions differing between the regional industrial councils, and
between the industrial councils and the wage determination.(Ibid 99) (Ibid 101, 105-106
(Table XII), 109)
17 A wage determination could be issued in terms of the Wage Act 5 of 1957 for sectors or areas where there
was limited trade union organization or collective bargaining.
1.20%2.10%
1%
2.70%
8%7%
8%
5%
0%
2%
4%
6%
8%
10%
2001 2005 2008 2011
Graph 3. Profit margins in manufacturing and the TCFL sector: 2001 - 2011
TCFL Total Manufacturing

12
The attractiveness of the lower wage areas increased significantly from the 1960s due to
government programmes that sought to encourage manufacturers across all sectors to locate
factories in so-called ‘decentralised areas’; in all cases these were rural areas. The main
motivation for these decentralisation programmes was to stop the migration of African
workers from rural to urban areas by creating jobs closer to their ‘homelands’. Over time the
decentralisation programme was extended and incentives were increased. Besides
encouraging local manufacturers to relocate, the programme also attracted a large number of
Taiwanese investors. Wages were extremely low in these areas; when the subsidy for wages
from the decentralised programme was applied labour costs became negligible. The scheme,
later renamed the Regional Industrial Development Programme (RIDP) ended only in 1996.
The clothing sector in South Africa therefore had a strong regional character. It was
organised by large regional unions and collective bargaining took place in regional industrial
councils. Manufacturers outside these regions had to comply with a wage determination.
However, wages moved up very slowly because the regional unions became bureaucratic and
passive. Collective bargaining increasingly became an annual formality that left wage levels
lagging well behind the rest of the manufacturing sector.(Ibid 99, 371-374) All this changed
as worker militancy rose during the 1980s, resulting in a series of mergers in the sector that
saw the establishment of SACTWU.18 The new union introduced a much more aggressive
approach to collective bargaining and after a protracted struggle forced a merger in 2002 of
the regional industrial councils into a national bargaining council.19 Because the national
bargaining council was able to get its agreements extended the entire country was covered by
the wages it set, making the sectoral determination redundant.20 This development assisted
the union to close the wage gaps between the major regions, and between urban and rural
areas, although, as Graph 6 shows, the differences are still quite significant.
18 It organises workers in the clothing, textile, footwear and leather sectors. 19 The council was registered in 2002 and a set of collective agreements now covers the clothing sector
nationally: one set of agreements covers specified Metropolitan Areas (this set of agreements mostly cover the
areas that had fallen within the old regional councils); one agreement covers Non-metropolitan Areas, but with
wage differentiation for two sets of non-metropolitan areas (this agreement replaced the sectoral determination
for the clothing industry); and one agreement covers certain ‘country’ areas in the Western Cape. 20 A sectoral determination had replaced the wage determination that had covered the clothing industry in the
areas falling outside the regional industrial council. The sectoral determination was withdrawn soon after the
national bargaining council was established.

13
(Own calculations from NBCCI collective agreements and Lesotho wage orders)
The above graph also shows the much lower wages paid in Lesotho (it should be noted that
the differential is actually greater because total labour costs in South Africa are considerably
higher because of benefit fund contributions, whereas there are no social benefit funds for
clothing workers in Lesotho).
The drive to increase wages and narrow differentials, however, came at the same time that
cheap imported clothing was flooding into the South African market. The result was that the
formal part of the industry shrunk in size and that many jobs shifted to the informal part of
the industry, many to home-based firms.21 The term ‘informal’, however, needs to be treated
with caution. The fact that the firms are in homes or small workshops that are not registered
with the bargaining council or complying with its agreements, does not mean that the firms
are producing clothes for ‘informal’ outlets. In fact, through intermediaries such as design
houses many of these small informal firms are supplying the formal retail sector, even some
of the major retailers.
21 In many cases the data on job loss refers just to the figures provided by the bargaining council. However, by
comparing these figures to the data obtained through household surveys one can see that overall employment in
the clothing sector has remained fairly stable. This shows that most of the jobs lost in formal firms, i.e. those
registered with the bargaining council, have been taken up in the informal part of the sector.
0
200
400
600
800
1000
1200
W Cape KZN E Cape N RegionW Cape (Country)FS & NCNon-metro (1)Non-metro (2)Lesotho
Wee
kly
wag
eGraph 4. Weekly wage rates for semi-skilled workers by region: 2013/4)
14
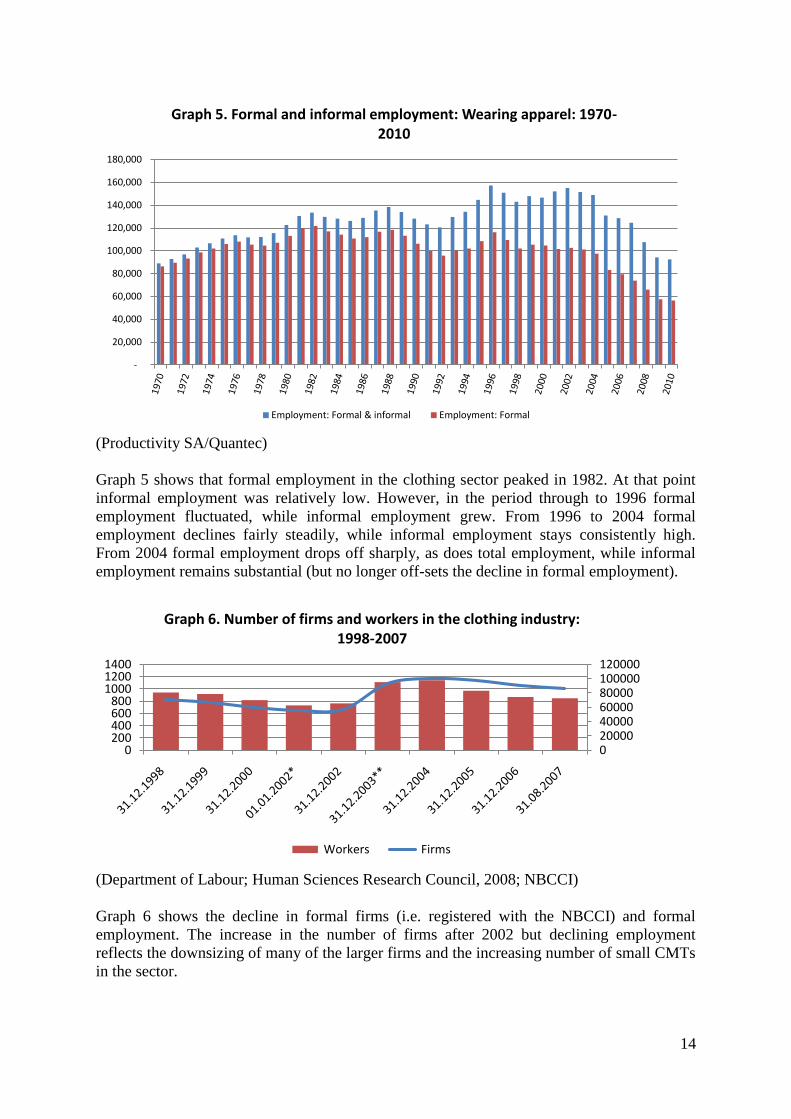
(Productivity SA/Quantec)
Graph 5 shows that formal employment in the clothing sector peaked in 1982. At that point
informal employment was relatively low. However, in the period through to 1996 formal
employment fluctuated, while informal employment grew. From 1996 to 2004 formal
employment declines fairly steadily, while informal employment stays consistently high.
From 2004 formal employment drops off sharply, as does total employment, while informal
employment remains substantial (but no longer off-sets the decline in formal employment).
(Department of Labour; Human Sciences Research Council, 2008; NBCCI)
Graph 6 shows the decline in formal firms (i.e. registered with the NBCCI) and formal
employment. The increase in the number of firms after 2002 but declining employment
reflects the downsizing of many of the larger firms and the increasing number of small CMTs
in the sector.
-
20,000
40,000
60,000
80,000
100,000
120,000
140,000
160,000
180,000
Graph 5. Formal and informal employment: Wearing apparel: 1970-2010
Employment: Formal & informal Employment: Formal
020000400006000080000100000120000
0200400600800
100012001400
Graph 6. Number of firms and workers in the clothing industry: 1998-2007
Workers Firms
15
Restructuring by firms has also seen manufacturing operations move to low wage areas in the
country (i.e. Non-Metropolitan Areas) and/or to neighbouring countries like Lesotho and
Swaziland. Or, as indicated above, firms have transformed themselves into design houses that
take orders from retailers but sub-contract out the manufacturing to small CMT operations in
urban areas (some of which are informal), or in the Non-Metropolitan Areas, or to the
factories in Lesotho and Swaziland. The result is that retailers can deny knowledge of where
their clothing is being manufactured, merely stating that they work with ‘suppliers’ that are
free to place the orders where they see fit, which is generally where they get the lowest
prices.
In recent years a variation on these processes has emerged, particularly in the KwaZulu-Natal
(KZN) province. The clothing sector in KZN had historically been quite dispersed, with a
large number of manufacturers having moved to rural areas outside the jurisdiction of the
industrial council, where they were also able to access ‘decentralisation’ benefits. However,
once the NBCCI was formed in 2002 it had its agreements extended to cover the entire
country. Many of these manufacturers therefore saw the decentralisation benefits disappear in
1996, followed by the repeal of the sectoral determination (previously the wage
determination) a few years later. They were now compelled to comply with higher, centrally
negotiated wages, without the benefit of a wage subsidy. The response by many was to not
comply with the NBCCI Non-Metro Areas agreement. So, a category of firm emerged that
was registered with the bargaining council but was refusing to comply with the council’s
agreement. The size of this new category of non-compliant employers is significant: in
September 2004, 71% firms and 52% of employees were in this category, while in August
2009, the figures were respectively 53% and 26%.22 The issue of non-compliance in the
clothing sector exploded into the limelight towards the end of 2010. This is discussed in more
detail in the case study on Newcastle manufacturers below.
4. Productivity and wages
4.1 Problems with productivity as a measure
The measurement of productivity is approached in quite different ways by economists and
industrial engineers or production managers. For economists productivity is an ex post facto
measure and it is usually economy-wide, i.e. it is the aggregation of value-added in the
economy. Economists are not usually interested in what has contributed to a rise or decline in
value-added; rather, they compare productivity with other measures, such as earnings,
inequality or poverty. What economists are interested in is what this comparison tells one
about the nature of the growth path of the economy. Industrial engineers and production
managers, on the other hand, are more concerned with productivity as an ex ante measure, i.e.
as a goal for an enterprise. Their real interest is in what changes they need to make to
improve productivity. The measurement of productivity tells them that their investment in
22 The data is taken from documentation for the Seventh Annual General Meeting of the National Bargaining
Council for the Clothing Industry (15 October 2009). It should be noted that the data on non-compliance
excludes unknown, unregistered firms and their employees, mainly because such firms are operating illegally
and nobody knows how many of them there are or how many workers they employ. If these figures were known
and were added to those of the registered but openly non-compliant firms then they would likely significantly
increase the level of non-compliance, if one goes on the estimates of key informants in the industry (e.g. the
Executive Director of AMSA estimates that unregistered firms are probably producing about 20% to 25% of all
clothing made in South Africa, and employ about the same proportion of all workers in the clothing sector
nationally).
16
technology, capital equipment and labour as well as how they are organized, is on the right
track.
While economists and industrial engineers might differ in the way the use productivity as a
measure, workers and managers usually see productivity in a quite different way. The quest
by managers to improve productivity directly impacts on the on-going effort-bargain between
management and workers as well as a potential trade-off between wage increases and job
losses.23 This is why, from a labour relations perspective, productivity is a highly contested
issue. Increasingly, however, enterprises and sectors are part of value chains. Value chain
analysis highlights the role of power between firms in the distribution of value along the
chain. The power exerted by certain firms in value chains results in value being distributed
disproportionately along chains, with the entities with the most power generally obtaining the
most value (or earning economic rents). This complicates the traditional approach to power in
relation to productivity, which depicts the main protagonists as labour and management or
employers. In fact, in the context of a value chain, an increase in productivity at an enterprise
can be swallowed up by the purchasing firm next up in the chain forcing unit prices down.
The enterprise therefore improves productivity but obtains no material benefit, which means
that there is no gain that can potentially be distributed to labour. If wages were to increase in
this situation it would probably mean that some workers lose their jobs.
A further complication arises in the context of the liberalized trade regime that currently
dominates the world. In the absence of tariff protection lower labour costs at competitor firms
in other countries can outweigh the higher productivity of a domestic firm. In such a case,
unless the wages of the domestic firm decline or it increases its productivity further, or both,
there will be job shedding. Similarly, shifts in the value of currency can easily wipe out any
competitive advantage that an enterprise might have obtained because of a productivity
improvement, either because imported material inputs have become much more expensive or
because the end product has become much more expensive
To a large extent productivity as a measure is rooted in a Fordist mode of production.
Productivity is a good measure of performance if you are churning out huge quantities of
standard project. But most manufacturers are not competing purely on economies of scale and
unit price. The modern manufacturer is competing amongst other things on quality, lead time,
on-time delivery, lower inventory levels, and smaller batch sizes, any one of which,
depending on the nature of the product and market, can have a much bigger impact on a
firm’s competitiveness than a productivity increase.
4.2 Measuring productivity in the clothing sector: the economist’s perspective
We noted above that over the period 1982 to 2014 productivity was in a one-to-one
relationship with real wages, i.e. on average across the period productivity increases had
equalled real wage increases.(Burger, 2016: 4) In the clothing sector, however, the declining
domestic market share and failure to get into export markets has gone along with rising
productivity, in particular labour productivity. This mirrors the steep decline in formal
employment in the sector (see Graph 5 above and Graph 7 below). It is important to
emphasise that in the graphs that follow productivity is being measured using formal
employment in the clothing sector.
23 Unless the enterprise obtains a greater market share as a result of a productivity improvement and lower unit
labour costs, retrenchments will probably follow a wage increase. In practice, this will probably mean rising
wages for some but unemployment for others.

17
(Productivity SA, Productivity Statistics 2010, 74)
Graph 8 compares labour productivity, real earnings and unit labour costs. As we have seen
in Graph 7 above, labour productivity increases steadily from 1970 to 2005, and then rises
very sharply between 2005 and 2010. Real earnings show a similar trend, although rising
more slowly in the 1970 to 2005 period. In both cases the very sharp increase must be linked
to the steep decline in employment, with real earnings for workers that remain rising fast for
the first time. The unit labour cost, which shows the share of labour cost in the value added
per unit, rises from 1970 to 2005, which is indicative of real wages remaining above labour
productivity. In 2005, however, labour productivity rises above real earnings, with the result
that the line for unit labour costs turns downward. It appears that from 2005 labour, despite
rising real earnings, is getting a decling share of value added.
(Productivity SA, with own calculations)
0
20
40
60
80
100
120
140
160
180
200
1970 1975 1980 1985 1990 1995 2000 2005 2010
Graph 7. Capital, labour and multifactor productivity: Clothing sector: 1970-2010 (2005 = 100)
Capitalproductivity
Labourproductivity
Multifactorproductivity
0
20
40
60
80
100
120
140
160
180
200
1970 1975 1980 1985 1990 1995 2000 2005 2010
Graph 8. Labour productivity, real earnings and unit labour costs: 1970-2010 (2005=100)
Labour productivity
Real earnings
Unit labour costs
18
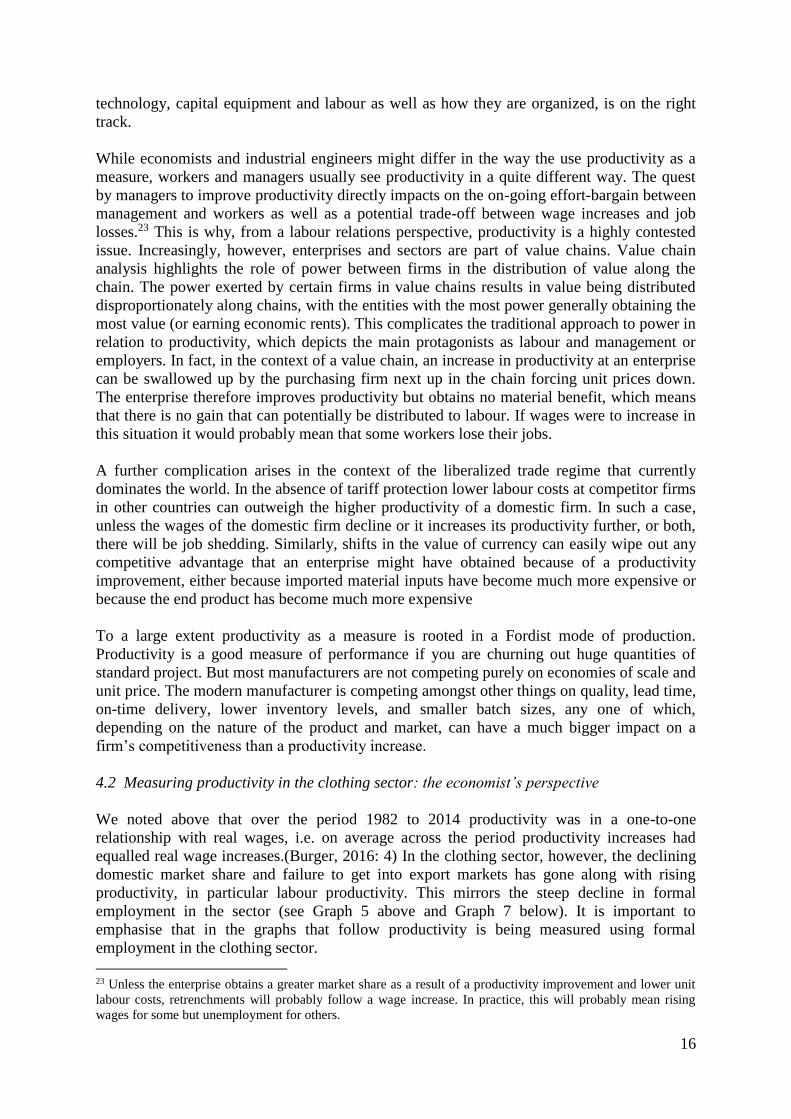
A similar picture emerges when one compares nominal earnings with labour productivity and
unit labour costs. Graph 9 (below) however emphasises the very low nominal wages that
were paid to formal clothing workers from 1970 through to 1985. In 1985 the union mergers
began that ultimately saw the formation of SACTWU in 1989; these developments impacted
significantly on collective bargaining, with the result that the rise in nominal earnings
increases more steeply to 2005. Thereafter labour productivity and nominal earnings
inccrease at the same rate. However, it is only after 2005 that wages rise well above the
inflation rate (see Graph 8 above).
The important point about the above graphs in relations to the informal sector of the clothing
industry is that the latter is excluded. The graphs therefore do not give an accurate picture of
productivity, earnings and unit labour costs. It is, furthermore, unclear how the date would
change if one could find a way of including the informal sector.
Taken together the graphs suggest a formal industry that has shrunk considerably, but which
is achieving higher labour productivity and equivalent real wage increases, although in real
terms wages show a slight decline as a share of value. This is consistent with the picture of a
clothing sector that has become sharply segmented into a relatively small formal sector that is
achieving greater competitiveness by working more closely with domestic retailers and a
large informal sector. We do have a rough idea of the number of employees in the informal
part of the sector, but do not have any data on output and productivity, and only anecdotal
accounts of wages. The sector is smaller than the formal sector but wages are much lower in
many cases. Competition appears to be largely on price and productivity is probably low due
to smaller orders and weak management systems. The case studies below give a view at the
workplace level of wages, productivity and competitiveness in the two sectors.
0
20
40
60
80
100
120
140
160
180
200
1970 1975 1980 1985 1990 1995 2000 2005 2010
Graph 9. Labour productivity, nominal earnings and unit labour costs: 1970-2010 (2005 = 100)
Labour productivity
Actual earnings
Unit labour costs

19
4.3 Measuring productivity in the clothing sector: the production manager’s perspective
The manufacture of clothing is labour intensive and labour productivity has always been
closely monitored. The standard minute value (SMV) for assembling a garment is the basis
for measuring the performance of production lines in all clothing factories, for production
scheduling, and for setting production incentive targets. It was also the basis for a
manufacturer costing a garment when quoting a price to a buyer, although this is less so the
case today given that retailers generally dictate the prices for orders. The standard minute
value entails breaking the manufacture of the garment down and assigning a time for every
operation. Adding these times together gives the SMV for the garment. There are some
universal minute values that are provided by various agencies or the factory can itself do a
test runs and time operations.
If the factory has 100 direct workers, a 10-hour day (600 minutes), and times a garment at 8.9
minutes from cutting, to assembly, to finishing and through to packing, it can work out that
operating at 100% efficiency, it should produce 6 741 garments in a day, and each worker
should be producing 67.4 garments a day. If one included the wage rate (or overall labour
cost of a worker) in the equation one would get a minute value for the garment and a unit
labour cost for the order. However, this would not take account of the fact that generally
employees cannot work at 100% for any length of time. So, the equation generally takes into
account a certain proportion of time for workers ‘relaxing’ as well as time for interruptions
due to workers needing to go to the toilet or because of delays in getting fabric or accessories
on time. The efficiency rate is therefore usually adjusted downwards to order to arrive at an
optimum efficiency for the particular factory (e.g. the aim would to produce 5 055 garments
per day; a 75% efficiency rate). This would be the rate that is used as the target for one or
more sewing lines working on a particular style and if there is a productivity incentive
scheme it will be the threshold above which the incentive kicks in. Over time managers learn
what the efficiency rate of their factory is, i.e. it might average at an efficiency rate of 65%
rather than regularly achieving the 75% optimum, or some lines are more efficient than
others.
When costing a garment the manufacturer would in the past use the standard minute value to
arrive at a costing and would then add in an amount for the fabric and accessories, overheads
and it profit margin; and then there would be some negotiation with the buyer. However, as
noted above, manufacturers are now generally given a price for an order on a ‘take it or leave
it’ basis. In a sense they are forced to work backwards from that price, working out what their
total daily operating cost is and calculating how long they will take to complete the order at
their prevailing efficiency level. If this produces a figure that this lower than the price or at a
break-even level they will take the order.(Godfrey, 2013: ??)
It is important to emphasise is that although the clothing industry is labour intensive the
labour cost component of garment prices is usually about 20% for a full package
manufacturer. This proportion is much higher for a CMT because a CMT is effectively just
selling labour, i.e. assembly; most other major costs, such as fabric and accessories, are borne
by the retailer or intermediary. However, shifts in the prices of fabric as well as other costs
such as factory rent, rates and taxes, electricity, transport of inputs and outputs, and import
and export charges can significantly outweigh any competitive advantage a manufacturer is
able to gain by improving the efficiency of direct labour. Furthermore, competition is being
exploited by powerful retailers to put constant downward pressure on prices, so that
manufacturers’ margins are being continually squeezed. Retailers are also reducing lead times

20
and the size of orders, and often change aspects of the style in mid-order. All of these factors
reduce the ability of manufacturers to improve their competitiveness.
It is for this reason that manufacturers will talk about the challenge to the sector as being to
improve ‘competitiveness’ rather than ‘efficiency’ or labour productivity. The survival of the
local clothing industry, including many semi-skilled jobs filled mainly by women, depends
on clothing manufacturers achieving improved competitiveness. But improved labour
productivity is only one part of their attempts to increase their competitiveness. Lean
manufacturing techniques, for example, can improve competitiveness by reducing the stock
of work in progress and raw material inventory levels without affecting productivity. Or
competitiveness might be sought by shifting to more complex products (more fashion-
oriented garments) and offering retailers much shorter lead times and quicker stock
replenishment (so-called ‘fast fashion’). Such a strategy might even lower labour productivity
while improving the competitiveness of the firm.
Two initiatives, the KwaZulu-Natal (KZN) Clothing Cluster and the Cape Town Clothing
Cluster, have been launched to assist manufacturers and retailers to introduce work class
manufacturing techniques and quick response mechanisms in order to achieve
competitiveness.24 In some cases the results have been impressive (see case studies below).
However, what is important about these initiatives is that employee efficiency or labour
productivity is only one facet of a range of measures to improve competitiveness.
The initiatives are being driven by a consultancy, BM Analysts, which provides detailed
reports on performance measures to participating firms, comparing their performance over a
number of years with the underwear sub-sector, South African CMT firms, and international
data. In the case of one firm the measure of employee efficiency, using 2004 as a base (i.e.
100), showed a sharp increase of 37% in 2005, a very slight decline to 2006, and then a
further increase of 5% in 2007. This performance was significantly better than the rising
trends shown for the underwear sub-sector, South African CMT firms, and the international
data. However, the increase has to be viewed in the context of improvements in turnover and
a rise in the number of employees, as well as declines in raw material stock, total inventory,
work in progress inventory, rejects, internal scrap, supplier return rate, average throughput
time, production time lost to style changeovers, production time lost to machine breakdowns,
and so on. It is unclear whether these performance improvements have resulted in increased
wages, but it is evident that existing jobs have been saved and some new jobs have been
created.
5. Linking productivity and wages
5.1 Linking productivity and wages in sector-level collective bargaining
Collective bargaining over any matter that will have an impact on labour costs must take
place at the NBCCI. A collective agreement negotiated at this forum may be extended by the
Minister of Labour to all clothing firms and employees. Given the crisis in the sector, the
employer parties at the NBCCI have sought to negotiate provisions for ‘flexibility’ in the
agreement. They have also introduced mechanisms to improve productivity. Some of the
measures have only an indirect link to wages (e.g. reducing absenteeism or introducing a
24 The union is not involved in these initiatives.
21
twilight shift), while others have sought to establish a direct link between wages and
productivity. The main challenge to making this link is that wages are negotiated at a sectoral
bargaining forum, i.e. the NBCCI, whereas the details of productivity schemes can only be
worked out at the enterprise level. Negotiations at the NBCCI have therefore focused on the
design of a framework for productivity schemes, with agreement on the details delegated to
managers and shop stewards at individual enterprises.
The main steps taken to date that will have an indirect impact on productivity are:
A memorandum of understanding on absenteeism that sought to promote a Code of
Best Practice toolkit to address high absenteeism
Provision for a twilight shift (i.e. a shift between 16.30 and 23.00)
The establishment of a new training and productivity body for the sector.
The measures that have sought to directly link productivity to wages, or a component of
wages, are as follows:
In 2008 a framework for productivity incentive schemes was introduced which
provided that that employers must pay 0.5% of the weekly wage into a dedicated bank
account, to be opened by the employer with a SACTWU shop steward as a co-
signatory. This would constitute the pool of money for the incentive scheme.
Employers and workers were given a limited period within which to agree on the
design of a productivity incentive scheme, including the incentives to be paid. If no
agreement was reached in the prescribed period the money in the bank account had to
be paid out to workers as wages. Productivity schemes had to include all workers and
could not have any provisions that would lead to a downward variation of working
conditions. The agreements in respect of the schemes had to be registered with the
NBCCI.
Agreements regarding productivity schemes were reached at only a few enterprises and at the
time research was conducted only two firms still had schemes in terms of this provision.
In 2011/12 a scheme was introduced to pay new employees (or those re-entering the
industry after a significant absence) a lower wage until their productivity improves.
New employees of firms in the Metro Areas would receive 70% of the minimum
wage rate and those at enterprises in the Non-Metro Areas would receive 80% of the
minimum wage.25 The scheme continuation of the scheme past March 2014 was
contingent upon employment at compliant employers in the industry increasing by at
least 15%. Progress towards this increase was benchmarked bi-annually.
The scheme barely got off the ground before it was superseded by the scheme below,
reportedly because it had created resentment amongst new entrants who had increased their
efficiency level to that of experienced workers but remained at the lower wage rate.
A productivity scheme for new workers that stipulated a wage of 80% of the
prescribed minimum for that job with the possibility of earning more based on
achieving productivity targets. It therefore sought to address the resentment caused by
25 New employees were defined as those with no previous working experience in the clothing sector or those
who had not been employed in the sector for at least three years.

22
the prior scheme, because new employees could earn the full wage if they met the
performance standards prescribed in the enterprise’s scheme.
An obvious challenge is that it is difficult to design the scheme in a way that applies only to
the new employees on the production floor and excluded other workers. It is also puzzling
why the scheme targeted only new employees and did not apply to existing employees.
Employers sought to deal with these anomalies in subsequent negotiations at the NBCCI.
They proposed that a new minimum wage for all jobs should be set at 80% of the existing
minimum wage, with the proviso that any existing employees paid above the new minimum
wage would not have their wage reduced. All workers would be able to participate in the
incentive scheme to earn above the minimum wage (or the wage they are earning), but there
would be no obligation to participate in the scheme. As with the earlier agreement,
management and shop stewards would have six months from the signing of the national
framework agreement to agree to the details of a scheme at the enterprise level. The sticking
point in the negotiations came with regard to the question of what would happen if agreement
could not be reached at the enterprise level, i.e. the minimum wage would fall by 20%
without there being any way workers could make it up. Employers were proposing that if
agreement could not be reached then the option of an incentive scheme would fall away, i.e.
the new 80% minimum wage would stay in place. It is understood that the union was pushing
for the wage to revert to 100% if no agreement could be reached on an incentive scheme
within six months. Given that the original proposal made the introduction of incentive
schemes at enterprises contingent on a national framework agreement being reached that
would set the incentive portion of the wage, failure to reach agreement at the NBCCI
effectively sunk the plan.
There seems to be consensus that the attempt to marry sector-level wage negotiations with
enterprise-level productivity agreements has not been a success. According to employers this
is mainly because shop stewards at the enterprise level either refuse to agree to such schemes
or make unrealistic demands regarding the incentives. The above measures introduced by the
NBCCI do not however preclude firms from attempting to introduce their own schemes, but
any proposed incentive scheme would need to be approved by shop stewards at an enterprise
if it was to have any chance of success.
5.2 Linking productivity and wages at enterprise level: five case studies
(a) Case study 1
ABC Clothing Manufacturers is a large firm in Cape Town that produces basic clothing for
the lower end of the market. It introduced the first incentive scheme initiated by the NBCCI
(see above). The union pushed for the incentive to be targeted at absenteeism, i.e. improved
attendance would attract an additional payment from the incentive account. Management,
however, was skeptical about the scheme because it was believed that 0.5% of the total wage
bill would not create a big enough pool to provide enough of an incentive to persuade
workers to change their behavior. Furthermore, as more and more employees qualified for the
payout due to improved attendance, the amount each received would decrease, further
reducing the incentive. The scheme was nevertheless implemented, but according to
management had no impact on absenteeism.
At about the same time management decided to introduce its own incentive scheme (not
linked to any provision in the bargaining council agreement). They brought in a consultancy
23
with expertise in incentives to assist them with the design and implementation of the scheme.
They decided on a ‘reward and recognition’ scheme that was aimed at bringing dignity into
the workplace. It focused on the performance of the production team or line rather than the
individual and targeted productivity and quality, with some flexibility to allow management
to shift the emphasis to one or the other as required. ABC advanced a relatively small amount
of money to fund the scheme.
The consultant started by meeting with shop stewards, emphasizing to them that although the
introduction of a scheme had been initiated by management it would be implemented and
administered by the consulting firm independently of management. The shop stewards stated
they would not oppose or promote the scheme but argued that workers should have a choice
as to whether to participate in it or not. The scheme was therefore made voluntary.
The consultant then met with workers. He stated that workers believed they had no hope of
promotion, of learning new skills or of earning more through working harder and they did not
trust of management. They had, he said, a “desolate world view”. They believed that only by
standing together could they make any gains. Nevertheless, about 85% of workers agreed to
participate in the scheme.
The key aspect of the scheme was that it would reward improvement, rather than focusing on
the achievement of targets, which are usually reached only by the top performers. The latter
employees, it was argued, would generally perform well with or without an incentive scheme.
The idea was therefore to focus the scheme on raising the performance of the ‘losers’ rather
than the ‘winners’, i.e. it had to give ‘losers’ the chance of being ‘winners’. By focusing on
improvement across all workers it was envisaged that about a third of the workforce would be
incentivized, i.e. recognized and rewarded.
Given that there was not a large pool of money with which to work, much of the initial thrust
of the scheme was on “symbolic recognition”. The scheme was launched at a ceremony at
which each participating worker made a pledge to improve. The consultant then introduced
pink and blue flags – pink for the top performers and blue for the top improvers – that were
awarded to the relevant teams monthly in a short ceremony. This meant that about one-third
of the factory would have a flag for about a month. The teams or lines in possession of the
flags were called the Dream Teams and their performance was further highlighted through
posters and various other notices. Furthermore, if a worker in a Dream Team had their
birthday in the month that her team or line held a flag, she would be given a scratch card,
which would range from ZAR20 airtime to a ZAR500 voucher for a meal at a popular
restaurant.
After the first year the results were sufficiently impressive for ABC to continue the scheme
and double the original budget. This allowed for a redesign of the scheme. The scheme was
re-launched and all workers had the opportunity to sign up to it or withdraw. The next step
was to provide all workers in the Dream Teams with scratch cards (not just those who were
having a birthday). In the course of the year further ‘soft’ recognition measures were
introduced, e.g. all the women got an SMS message on Mother’s Day.
Then the issue of the existing bargaining council sanctioned incentive scheme came up, i.e.
the one that provided 0.5% of the wage to be put into an incentive account (see above). In
light of the fact the scheme was not working management proposed to shop stewards that the
pool of money that had accumulated be added to the budget for the Dream Team scheme. The

24
shop stewards agreed and the incentive scheme continued into its third year – having
continued to improve performance - with an even bigger budget.
In the course of the third year, however, the scheme came to an abrupt halt. During that year
the wage negotiations at the NBCCI ran into difficulties, which resulted in a much more
adversarial climate developing at factories. In this context the shop stewards at ABC
demanded that the scheme be stopped and that the money that was funding the scheme be
paid out as a wage increment. Management stopped the scheme and has not tried to replace it
with anything new.
ABC manufacturing supplied data that spans the period during which the incentive scheme
was in operation (i.e. March 2009 to April 2012). The data records efficiency based on
finished and checked garments, and absenteeism, from nine months before the introduction of
the incentive scheme through to 15 months after the scheme ended. In addition, the
percentage of rejects and seconds is recorded from about half-way through the scheme until
15 months after the scheme ended. The data is presented in Graph 11 below.
(Data supplied by ABC Clothing Manufacturers)
The period when the productivity incentive scheme was in operation is represented by the
straight line set at 15%. Before the introduction of the scheme efficiency was fluctuating
wildly but had begun to stablise and improve when the scheme started. After the scheme was
implemented the trend line indicates steadily rising efficiency (from about 63% to over 75%),
with significantly reduced fluctuations. Efficiency dropped when the scheme ended and then
fluctuated at around 70%.
Graph 11 also shows that the productivity incentive scheme had a negligible impact on
quality, measured by rejects and seconds. The proportion of rejects and seconds remained
very low throughout the scheme as well as after the scheme ended. Similarly, there was little
or no impact on absenteeism. The trend line is straight at about 3.5% absenteeism with
0
10
20
30
40
50
60
70
80
90
Pe
rce
nta
ge
July 2008 to July 2013: Data recorded monthly
Graph 11. Impact on efficiency, quality and absenteesm of productivity incentive scheme: ABC Manufacturers
Efficiency
Rejects
Absenteeism
Incentive scheme
25
moderate fluctuation in the data around this level (related mainly to the seasons, with high
points in the middle of winter and lower absenteeism during the summer months.
Importantly, however, numerous other changes took place over the entire period reflected in
the graph: production lines changed over to different clothing styles, a new production
method was introduced, equipment had broken down, and strikes had taken place. The
changes all impacted on production and therefore on efficiency, which emphasises that the
productivity incentive scheme was not the only variable influencing the indicators measured
in Graph 14).
(b) Case study 2
XYZ Clothing Manufacturers started with six machinists about 25 years ago and currently
employs over 500 workers. It increased employment just about every year since its
establishment, during a period in which the rest of the clothing industry had shed thousands
of jobs. It has a very close relationship with one of the major retailers, which has clearly
benefitted the firm. It was a foundation member of the Cape Town Clothing Cluster and is
well advanced in introducing world class manufacturing techniques and offering a quick-
response option for retailers. As part of this process it measures a wide range of performance
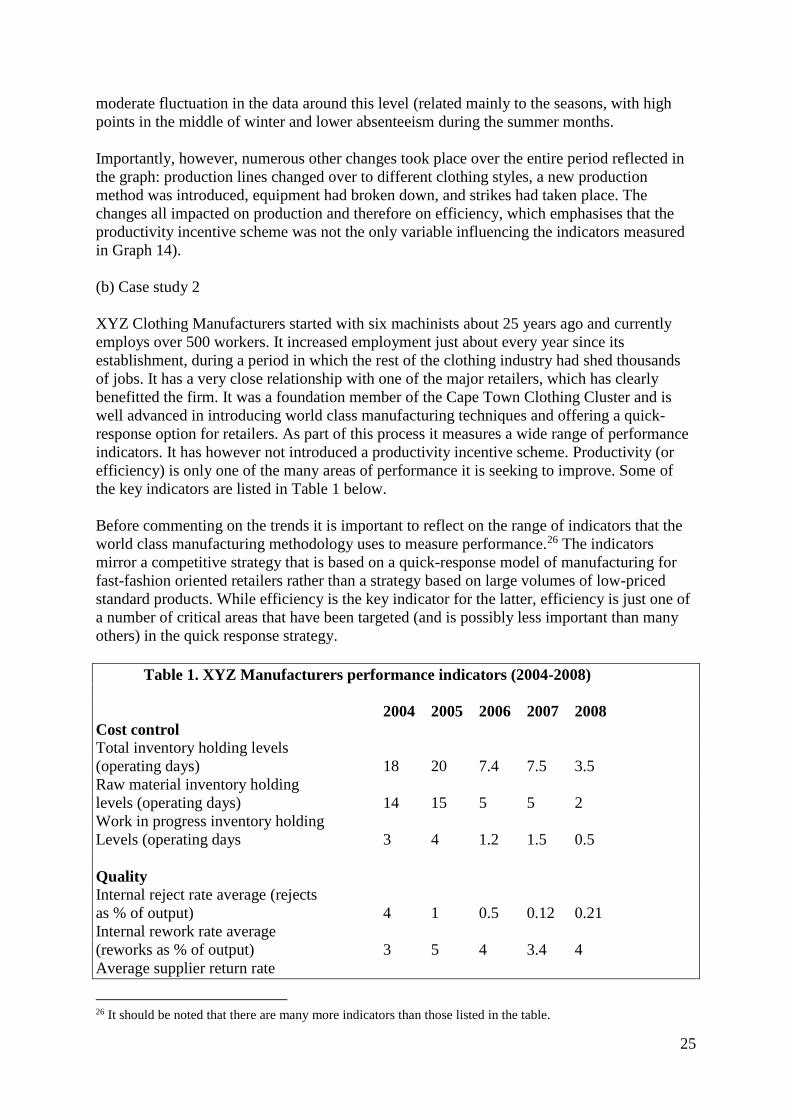
indicators. It has however not introduced a productivity incentive scheme. Productivity (or
efficiency) is only one of the many areas of performance it is seeking to improve. Some of
the key indicators are listed in Table 1 below.
Before commenting on the trends it is important to reflect on the range of indicators that the
world class manufacturing methodology uses to measure performance.26 The indicators
mirror a competitive strategy that is based on a quick-response model of manufacturing for
fast-fashion oriented retailers rather than a strategy based on large volumes of low-priced
standard products. While efficiency is the key indicator for the latter, efficiency is just one of
a number of critical areas that have been targeted (and is possibly less important than many
others) in the quick response strategy.
Table 1. XYZ Manufacturers performance indicators (2004-2008)
2004 2005 2006 2007 2008
Cost control
Total inventory holding levels
(operating days) 18 20 7.4 7.5 3.5
Raw material inventory holding
levels (operating days) 14 15 5 5 2
Work in progress inventory holding
Levels (operating days 3 4 1.2 1.5 0.5
Quality
Internal reject rate average (rejects
as % of output) 4 1 0.5 0.12 0.21
Internal rework rate average
(reworks as % of output) 3 5 4 3.4 4
Average supplier return rate
26 It should be noted that there are many more indicators than those listed in the table.
26
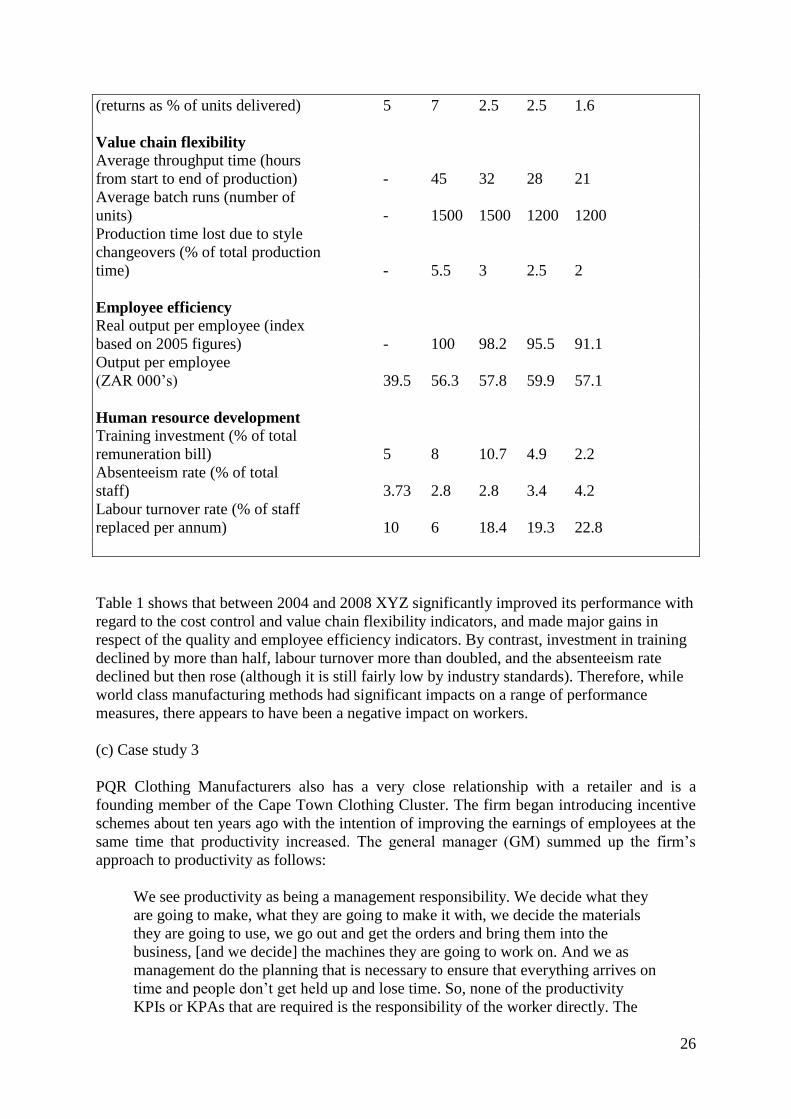
(returns as % of units delivered) 5 7 2.5 2.5 1.6
Value chain flexibility
Average throughput time (hours
from start to end of production) - 45 32 28 21
Average batch runs (number of
units) - 1500 1500 1200 1200
Production time lost due to style
changeovers (% of total production
time) - 5.5 3 2.5 2
Employee efficiency
Real output per employee (index
based on 2005 figures) - 100 98.2 95.5 91.1
Output per employee
(ZAR 000’s) 39.5 56.3 57.8 59.9 57.1
Human resource development
Training investment (% of total
remuneration bill) 5 8 10.7 4.9 2.2
Absenteeism rate (% of total
staff) 3.73 2.8 2.8 3.4 4.2
Labour turnover rate (% of staff
replaced per annum) 10 6 18.4 19.3 22.8
Table 1 shows that between 2004 and 2008 XYZ significantly improved its performance with
regard to the cost control and value chain flexibility indicators, and made major gains in
respect of the quality and employee efficiency indicators. By contrast, investment in training
declined by more than half, labour turnover more than doubled, and the absenteeism rate
declined but then rose (although it is still fairly low by industry standards). Therefore, while
world class manufacturing methods had significant impacts on a range of performance
measures, there appears to have been a negative impact on workers.
(c) Case study 3
PQR Clothing Manufacturers also has a very close relationship with a retailer and is a
founding member of the Cape Town Clothing Cluster. The firm began introducing incentive
schemes about ten years ago with the intention of improving the earnings of employees at the
same time that productivity increased. The general manager (GM) summed up the firm’s
approach to productivity as follows:
We see productivity as being a management responsibility. We decide what they
are going to make, what they are going to make it with, we decide the materials
they are going to use, we go out and get the orders and bring them into the
business, [and we decide] the machines they are going to work on. And we as
management do the planning that is necessary to ensure that everything arrives on
time and people don’t get held up and lose time. So, none of the productivity
KPIs or KPAs that are required is the responsibility of the worker directly. The
27
only thing they are responsible for, when they have been trained, is to get on with
doing their work, and they will do that gladly most of the time. If they have got
the right machine and have had the right training they will generally give you as
much as they can possibly give. We measure that down to the n’th degree in the
factory, there are targets set, etc. But if someone has to sit and wait for work,
nobody [i.e. no worker] can do anything about that. And unfortunately one of the
historic mantras of management is that ‘these people are lazy, they don’t want to
work and productivity is low’. But it is nothing to do with that; it is all about
management. We have set that down in our business, that if things go wrong it’s a
management problem. That is the starting point. So on that basis how can we
make sure when we are being very productive and getting everything out and
doing well, how do we make sure that the workers earning the lowest level of
income can also benefit.
Most workers at the firm are paid the minimum wage rate prescribed by the NBCCI, wages
the GM acknowledges “are not enough, nobody can survive on them.” Increasing workers’
wages, however, has to go along with raising productivity because the firm is competing
“with the rest of the world” for its survival. The latter is not just a throw-away line. Every
order the firm receives from the retailer for which it works has been first sent to the East (i.e.
China) to be “competitively quoted”. The firm is allowed to quote up to 10% more than the
competitive quote to take into account the cost of importing the garment (i.e. transport costs
and import duty). In fact, a 40% premium would be more realistic, but the retailer allows the
local manufacturer only a 10% increase on the price. Furthermore, even if PQR quotes a price
within the 10% limit it is not guaranteed it will get the order. The buyers of the retailer will
take into account other factors, such as how soon the order can be made by PQR compared to
competitors, before it contracts with PQR for the order. So, despite the close relationship
PQR has with the retailer, there are almost always negotiations with the buyer on the quoted
price and other performance requirements related to the order.
PQR has responded to the challenge of international competition by significantly improving
its efficiency over the last ten years and growing its market share: it has gone from supplying
25% of the retailer’s range (43 000 units) in 2004 to 70% (480 000 units) in 2013, which is
more than a 1000% plus increase in annual output.27 Over the same period employment at
PQR increased by only 25%.
In order to achieve the above improvements the firm has introduced a number of incentive
schemes, all of which it developed itself. Probably the most important is the time-off
incentive scheme. In terms of the scheme each team gets a weekly production target. To
achieve the target they have to work at over 80% efficiency. If the line reaches that target for
the week it is allowed off at 12.30 pm on Friday instead of 3.00 pm, but get the full weekly
wage. Everybody on the line will get off except workers who have been absent or late for
more than two hours in the week, or any workers who are facing disciplinary action. There is
no limit to how many lines can go off early or how many times a line may go off early; but
on average at least two of the eight lines are rewarded with time off on a Friday.
The GM of PQR Clothing Manufacturers states that the introduction of the scheme almost
immediately resulted in the efficiency rate rising from 60% to 85%. Since then it continued to
rise to 120%, directly as a result of the scheme. To put this into perspective, in 2004 the firm
27 At the same time the retailer has significantly expanded its footprint in the country.

28
was taking about 16 minutes to make a garment that it should have made in 10 minutes. It is
now making that same garment in eight minutes.
Overtime is also used as an incentive to improve performance and simultaneously give
workers more money. The firm works on the basis that some overtime is the norm, because
their weekly production planning aims at an output that exceeds their capacity. Overtime is
voluntary but most workers want to work a few hours overtime in a week to get extra money.
But overtime is linked to efficiency because a line can work overtime only if it is performing
at 80% efficiency or higher. If the lines are not performing at 80% efficiency and he needs
extra capacity he will contract out the work to CMTs. Workers cannot therefore create a need
to work overtime by working slowly; instead, overtime is a reward for performing well.
Another incentive scheme sees workers earning points over the year according to various
criteria such as absenteeism, disciplinary action, late coming, and so on. The GM has a
formula he applies to the accumulated points and uses it to identify the top 25 employees.
The firm buys 25 kitchen appliances in the price range from ZAR 250 to about ZAR 500, and
the employee with the most points is given first choice of an appliance, followed by the
person who is second, and on down the list until all the appliances have been taken.
PQR also benefits from the performance of the retailer with which it has a close relationship.
The retailer’s buying teams are given a bonus every quarter based on sales. In a particular
quarter this might be a bonus of 25% of salary. The percentage (e.g. 25%) is fed back to the
GM who translates it into a bonus for the entire factory, in which every employee shares in
proportion to their wage. Although it usually ends up not being a very big amount for each
workers, it can be significant when measured against a low weekly wage.
Underpinning the incentives schemes is rigorous management of absenteeism. Any person
that takes off from work has to fill in a detailed form regarding their absence, even if they
have a medical certificate. It is a process that the GM says is geared to make employees think
twice before they stay out of work. The result is an absenteeism rate that is under 3%, as
against an industry average that is reportedly over 5%.
The key to the success of the incentive schemes is probably to be found in the environment
within the firm, which the GM refers to as the firm’s “culture”. He explained that:
… culture is more important than anything. The role of culture in your business:
giving people recognition, appreciating them, making their work environment as
comfortable as possible, and absolute fairness in treatment across the board.
Everybody gets treated the same. Everybody gets an opportunity to have a say.
Development and training all the time. Everybody in this business has been
through some form of training in the last six months, in a class room, not just
learning on the job. Going through some form of lean awareness, teaching them
about what it is to save on waste, making them part of the problem solving. We
have a ‘lean team’ in the factory made up of workers and they will go to all the
different departments – they will come into my office and say “why is it in such a
mess… you’ve got a lot of waste lying around here”, and I have to go and answer
why. But it is really good and people feel really appreciated.
He went on to indicate the critical role that training and better communication had with
regard to productivity:

29
And the whole idea of training people and giving people more knowledge is an
absolute no-brainer, we just get better and better and better. As people get more
and more trained and more clever, and giving them input, they become more
productive because they start understanding. The more you talk to them.
In concluding the GM reiterated his view that it is the performance of management that is the
key to productivity:
But it is not just one thing, all these initiatives work together in making an
impact. But if I was asked what are the key things I would say: No. 1
management are responsible. Workers are not responsible, it is not their fault that
anything goes wrong, it’s management’s fault. Any manager who can accept that
responsibility is the first one who starts making things better. The ones who say
“they are lazy, they don’t want to listen and so on”, they are not going to get
anywhere. You need to manage a problem. If you have a problem, manage it and
it will get better. Put things in place, that is what management is about….. If you
see the workers sitting on the lines and talking, you have got to find out why. And
it is because they are waiting on work because some manager didn’t plan
something or didn’t plan better. It always gets back to a manager.
The Cape Town Clothing Cluster has also been an important factor. The GM states:
I think that without the Cluster we would have been down and gone, and probably
most of the rest of the industry. So the Cluster has made a massive difference in
our lives and I know many other companies they all say if we hadn’t gone this
route we would be down the tubes. So that has been a big shot in the arm.
The approach at PQR makes a stark contrast to what was found at factories in
Newcastle.
(d) Case studies of firms in Newcastle
Newcastle is a town in the KwaZulu-Natal midlands. It provides a microcosm of South
Africa’s industrial development path, skewed to capital intensive industry but relying on
labour intensive industry to create jobs for many low-skilled African workers that had been
the victims of apartheid policies. In the 1960s and 1970s African workers were displaced
from farm land around Newcastle through forced removals. A huge steel plant that was
located just outside the town in the 1970s did not create the number of jobs needed to soak up
surplus labour.28 The Newcastle municipality responded by seeking to attract Taiwanese
manufacturers to the area.(Seekings and Nattrass, 2013: 13-14) Taiwan was one of the few
countries with which the apartheid government had close relations, although the
municipality’s plans were contrary to central government policy at the time.(Hart, 2002: 2-4)
28 The location of the steel plant to Newcastle initially led to a boom, with manufacturing jobs growing from
5 023 in 1970 to 19 514 in 1982, but it did not create the number of jobs initially promised and later plans to
expand the plant did not materialise. Furthermore, many of the jobs that were created were highly skilled. It was
a major setback for the town, which had invested in roads, housing and other infrastructure in anticipation of the
expansion.

30
The strategy was launched at about the time that Taiwan was incentivising manufactures to
move offshore. This impetus, plus the very generous ‘decentralisation’ subsidies that the
apartheid government then provided to investors in rural areas (see above) and the low wages
in the region (covered by a wage determination), lead to a number of Taiwanese
manufacturers locating to Newcastle.(Hart, 2002: 2-4) The benefits on offer to the original
wave of Taiwanese manufacturers however dried up with the ending of the decentralisation
subsidy 1996 and the replacing of the wage determination with a collective agreement. These
changes hit the existing manufacturers hard but were particularly onerous for those
Taiwanese managers that had more recently set up their own firms as well as the second wave
of manufacturers that had started arriving from mainland China after 1994.29 It seems that
one of the main survival strategies adopted by many of these manufacturers was to ignore the
wages and other conditions prescribed in the NBCCI’s Non-Metro collective agreement.
The crisis in the clothing industry discussed above had created a real challenge to the NBCCI.
By 2010 it was facing mounting non-compliance by clothing firms throughout the country
but especially in KwaZulu-Natal. It responded by launching a campaign to more rigorously
enforce its agreements. A list was compiled of 385 non-compliant firms around the country,
with a large number in the interior of KZN. Legal steps were taken against the firms that
culminated in the serving of orders to attach assets of non-compliant firms. This was the
highpoint of the enforcement campaign. In many cases attachment of assets would result in
the closure of the firms, which would reportedly mean the loss of an estimated 20 000 to 25
000 jobs. Given the extremely high unemployment rate in rural areas, the enforcement
campaign brought to a head the trade-off between regulated employment and job creation.
When the enforcement campaign reached Newcastle over 100 non-compliant firms locked
out their employees in protest, temporarily laying off a reported 7500 workers. The action
was co-ordinated by the Newcastle Chinese Chamber of Commerce (NCCC), and most of the
protesting firms were Taiwanese and Chinese-owned. The stand-off was widely reported in
the press and provincial and national government ministers rushed in to broker a solution. It
was a slow process, during which a series of moratoriums were agreed with regard to the
NBCCI’s enforcement campaign. SACTWU remained adamant that working conditions
would not be compromised, whereas employers used the opportunity to push for a ‘new wage
model’ for the industry. The latter proposed that a portion of the weekly wage should be
determined by productivity. Ultimately agreement was reached to phase in compliance over
about 16 months, i.e. non-compliant firms would pay 70% of the minimum wage rate by 31
March 2011, rising to 90% of the minimum rate by 1 January 2012, and reaching full
compliance (100%) from 30 April 2012. However, once the enforcement exercise began
again it was found that many non-compliant firms were not meeting the thresholds.30
The open defiance of the NBCCI by the non-compliant Newcastle manufacturers undermined
its legitimacy as well as worsening its representivity in the sector. The non-compliant firms
do not belong to employers’ organisations that are party to the NBCCI.31 The rising number
29 Many of the immigrants from mainland China initially came as line or production managers and after a few
years started their own businesses. 30 ‘A big day for wages in the clothing industry’ Business Day 30 September 2010; ‘Minister faces court action
of clothing wages’ Business Report 17 June 2011; ‘High wages unravel Newcastle’s industry’ Mail & Guardian
July 22 to 28 2011. 31 In KZN the constitution of the employers’ organisation requires member firms to be compliant with the
bargaining council agreement. A firm that becomes non-compliant automatically ceases to be a member of the
employers’ organisation and at the same time becomes a non-party. This is not the case in all the regions but in
practice it is unlikely that non-compliant firms will be or remain a member of a party employers’ organisation.
31
of non-compliant but registered firms therefore reduces the representativity of the regional
employers’ organizations. Maintaining representativity is critical for the council’s ability to
have its collective agreements extended by the Minister of Labour to all clothing
manufacturers and employees in the sector. In 2011 the members of the employers’
organisations on the NBCCI employed only 49% of all the workers in the sector, whereas
SACTWU was comfortably representative with 84% of all employees.32 Because employer
representivity was below 50% the extension of the collective agreement reached by the
bargaining council was not automatic. In such cases the Minister of Labour has a discretion to
extend bargaining council agreements if she deems the employer and trade union parties to be
‘sufficiently representative’ (not defined in the Act) and that failure to extend the agreement
will undermine sector-level bargaining. In this case the Minister decided to extend the
agreement, but her decision was challenged in the KwaZulu-Natal High Court by five of the
Newcastle clothing manufacturers and a newly-established employers’ organisation, the
United Clothing and Textile Association (UCTA).33 Ultimately the case was decided in
favour of the manufacturers on a technical issue, although this was two years after the
relevant agreement had been replaced by a newer agreement, so the invalidity of the
extension had no real effect.34
Surprisingly, very little attention was paid to the role of the retailers and design houses in the
above saga. A SACTWU researcher, Etienne Vlok, was a lone voice when he responded to a
critique of the union and bargaining council by academics Nattrass and Seekings:
… it is telling that a retailer like Mr Price (which is cited by [Nattrass and
Seekings] as a company for whom Newcastle factories produce) has seen its
profits before tax increase by 107% between 2010 and 2012 alone (from R864m
to R1.8bn). The company's CEO, Stuart Bird, took home R10.8m at the end of the
32 The decision to extend an bargaining council agreement or not is based on two measures: total employees of
member firms of the party employers’ organisations as a proportion of all employees in the sector and party
trade union members as a proportion of all employees in the sector. If both proportions are above 50% the
Minister of Labour must extend the agreement, but if one or both proportions are below 50% the Minister has a
discretion to extend the agreement. 33 United Clothing and Textile Association & others v Minister of Labour & others 2013 (5) BCLR 589 (KZP).
The UCTA and the manufacturers relied on two alternative grounds: first, that the decision of the Minister to
extend the agreement offended the principle of legality; and second, that section 32 of the LRA (which
empowers the Minister to extend bargaining council agreements subject to certain conditions) be declared
unconstitutional on various grounds. 34 The legal challenge to the extension of the bargaining council agreement appears to be part of a wider
campaign. Four other cases have been launched to challenge the extension of bargaining council agreements. In
2011 the National Employers’ Association of South Africa (NEASA) challenged the extension of the Metal and
Engineering Bargaining Council’s agreement in the Johannesburg Labour Court. The grounds were that the
preconditions for extension in terms of section 32 of the LRA had not been met, and because the meeting of the
council at which it was resolved to request the Minister to extend the agreement was invalidly constituted.
NEASA was unsuccessful in this application but then challenged the extension of the same agreement by the
Minister of Labour on a number of grounds in a separate application. The court set aside the extension of the
agreement but suspended this order for four months to allow the Minister to properly meet the requirements of
section 32(3) of the LRA. More recently, NEASA obtained an urgent interdict in the Johannesburg Labour
Court against the Metal and Engineering Bargaining Council which prevents the council from requesting the
Minister of Labour to extend the 2014 agreement. The return date to hear arguments for final relief is 4
November 2014. The most important challenge, because it is aimed at the section in the LRA dealing with the
extension of agreements rather than a particular instance of extension, has been launched by the Free Market
Foundation against the Minister of Labour in the North Gauteng High Court (Case No. 13762/2013). The
application is for the court to find section 32(2) of the LRA unconstitutional and/or that the section should be
amended to remove the existing constraints on the exercise of the Minister’s discretion to extend bargaining
council agreements. The application is currently being heard.
32
2012 financial year. If the authors are so concerned about the apparent paper thin
margins of clothing factories in Newcastle, and about inequality, then why have
they not chosen to find ways to address the core of inequality which manifests so
starkly between the minimum wages of workers who make clothing and the
profits and salaries of CEOs who sell clothing.35
SACTWU and small manufacturers therefore continue to fight over the very low margin
received by the latter from retailers, but the retailers that largely determine those margins are
not at the bargaining table. Of course, the retailers will claim that they are independent of the
manufacturers and are free to agree on the terms of their contracts with manufacturers.
Furthermore, the retailers will argue that they do not actually deal with any of the
manufacturers, because they work through design houses or ‘suppliers’. But it is evident that
they know which manufacturers are producing their clothing and that they often have a close
working relationship with them, because they have quality controllers who visit the
manufacturers regularly. They check the quality of their orders while they are being produced
and also do a final check on completion of the order before it is dispatched. They will also
give technical advice to manufacturers so that any quality problems can be resolved. The
‘suppliers’ also have roving quality controllers that do quality checks at manufacturers. So,
these are seldom arms-length contracting relationships whatever the retailers may claim.
Manufacturers in Newcastle consistently report that the prices that they get from ‘suppliers’
have not increased in the last eight to ten years. They also state that there is seldom any room
for negotiating over the prices they are quoted. So, they are price-takers who are faced with a
‘take it or leave it’ option with regard to prices. If there is movement on the price it is usually
downwards. A scenario that was mentioned a number of times was of suppliers working their
way from factory to factory in Newcastle’s industrial area, beating down the price for an
order as they go. If it is in the quiet season desperate manufacturers will drop to break-even
or even below-cost prices just to get the orders and keep their factories running. One of the
manufacturers interviewed below stated that while the prices they received from ‘suppliers’
had not increased and productivity had not improved, wages and many other costs had gone
up. Another manufacturer, however, argued that productivity must have gone up, because if it
had not increased very few manufacturers in Newcastle would have survived. But he did not
have data that could provide evidence of an improvement in productivity.
The agreement to phase in compliance by stages, i.e. 70%, 90% and 100% (see above), has
created some confusion. Some manufacturers in Newcastle are still paying either 70% or 90%
of the prescribed minimum wage and claim to be compliant with an agreement that expired
over two years ago. In one case a manufacturer had given the Rand wage increases
determined at NBCCI negotiations for the last two years but off a base of 70%. They claim it
is difficult to get any clarity on this issue. One manufacturer noted that if you asked the
NBCCI, SACTWU and the Apparel Manufacturers of South Africa (the main employers’
organization) what the minimum wage rate was, you would get three different answers. The
confusion is compounded by the apparent reluctance to enforce full compliance at 100%
because of the earlier confrontation.
According to one manufacturer, the main objection to the wage rates determined by the
NBCCI was that the rates and the annual increases had no relationship to productivity. They
35 Ground Up, 14 February 2013, Wages in the clothing industry in South,
Africahttp://www.groundup.org.za/content/wages-clothing-industry-south-africa
33
therefore wanted the power to set wages for individuals according to their worth. If the faster
workers are paid the same as slow workers, they argue that there is a disincentive to work
fast. The NBCCI should therefore not focus on minimum wage rates but on average wages,
because this would take into account the wages earned by faster workers.
Not surprisingly, some manufacturers in Newcastle are using forms of piecework payment.
Piecework is not prohibited by the NBCCI but it is subject to regulation in the Non-Metro
Areas agreement. In terms of the agreement the total payment received by a worker being
paid by the piece cannot be below the minimum weekly wage applicable to the worker. So
piece work can only increase wages above the minimums set in the agreement.36 SACTWU
oppose the introduction of piecework at individual factories and have assisted members to
compel manufacturers to revert to time-based payment. But some factories are reportedly still
trying to pay by the piece and workers have apparently gone along with the practice because
they have been able to increase their earnings. It is unclear whether these manufacturers are
complying with the requirements regarding piecework in the Non-Metro Areas agreement.
Another aspect of the non-compliance saga in the industry that manifests in Newcastle is the
transformation of companies or close corporations into worker cooperatives in order to evade
the obligation to comply with labour legislation (including the bargaining council agreement).
This practice is particularly prevalent in KZN and it is reported that there are 15 clothing
cooperatives in Newcastle. It is not clear how many of these cooperatives are ‘real’ or bogus.
The Cooperatives Act37 was amended early in 2013 to close the loophole that has allowed
worker’s cooperatives to evade the main labour statutes but the amendments are not yet in
force.38 In the meantime worker cooperatives are being actively promoted by a number of
consultants as a way that clothing manufacturers can avoid the NBCCI agreement.
Newcastle case study 1
The owner of the firm is an immigrant from Taiwan who started it in 2004. Most of the
managers under him are from mainland China. The firm is a CMT that has a total of 270
employees, including management. Ninety-five percent of the employees are women. The
firm produces clothing for some of the major retailers but deals with design houses (referred
to as ‘suppliers’ in the industry) rather than directly with the retailers. The firm is unionized
and has two shop stewards.
The owner stated that he was currently paying 70% of the bargaining council wage rate as per
the agreement in this regard (see above regarding the confusion about the correct minimum
wage). He says he hears about increases in the NBCCI wage rates from the design houses, so
they are aware of the prescribed minimum wage rates, but they are not concerned about
whether he is compliant. In any event, he argues that the design houses must know that the
prices they are demanding could only be met by a manufacturer who is paying less than the
prescribed minimum wages.
36 Neither the Metro Areas Agreement (clause 7) nor the Non-Metro Areas Agreement (clause 18) prohibit
piecework but in both agreements an employee on piecework must receive at least the prescribed minimum
wage. 37 Act 14 of 2005. 38 Cooperatives Amendment Act, 6 of 2013. In terms of the Act members of workers cooperatives are excluded
from the definition of ‘employee’, except for the purposes of skills development and social security legislation.
The amendment effectively removes the exclusion and members of workers cooperatives are therefore classified
as ‘employees’ for the purposes of the LRA.

34
The owner emphasized that there is no negotiation of prices with design houses. They have to
accept the price they are quoted or turn down the work. He stated that between 70% and 80%
of the price (depending on the style) they are paid will go towards wages and salaries,
including his own salary. His profit margin will vary from zero to 5%. He does not know
what price the design house is getting from the retailer, because he does not know the cost of
the fabric, which is supplied by the design house. He also does not know the profit margin
being made by the design house. However, if he sees the final retail price of a garment in a
shop he can work out rough breakdown: a children’s top they had recently made for ZAR6.80
per garment was being sold for ZAR49.99, and he estimates that the design house was getting
about ZAR26.00 per garment from the retailer (which includes the cost of the fabric). The
manufacturer therefore got about 13% of the final selling price and the retailer’s mark-up was
just under 100%.
His approach to performance management is simple. He has calculated his total monthly
wage bill for five full production lines as well as all other monthly expenses and overheads; it
is an amount of about ZAR1 million. His target for each month is therefore to achieve a
monthly turnover of at least ZAR1 million. He translates this figure into a monthly turnover
target for each of the five production lines, which is then broken down into a daily turnover
target. Given the price of the garments they are producing, the daily target can be translated
into a daily unit target for each line and a target for each worker on the line. He complains,
however, that workers never reach this target, achieving at best 70%. There has been no
variation on this level of productivity since he started the firm.
At one point he tried to incentivize productivity. He paid each worker who achieved their
target ZAR10 or ZAR20, but he found that it incentivized workers only for two or three
months. By the third month they would lose interest and productivity would drop back to
previous levels. He claimed that changing to piecework is the only solution, but has not
introduced piecework; it is unclear whether he sees the requirements in the NBCCI
agreement as obstacles or whether he has been put off the idea because of opposition from
shop stewards and workers.39 So, he currently relies on warnings to underperforming workers
and has given authority to supervisors to dismiss workers who are too slow. But, he says,
supervisors live in the same community as workers and are easily intimidated, so they are too
scared to dismiss workers.
His conclusion harks back to colonial times: Africans are just very lazy. If he tells them that
they need to work faster because of a deadline they take no notice. Only some of the
employees are good workers, which is why he wants to change to piecework; it will reward
good workers and penalize those who work slowly. The only chance the South African
clothing industry has of surviving is if they are able to introduce piecework (presumably
unregulated by the NBCCI) and retailers are prepared to give CMTs higher prices.
Newcastle case study 2
The firm is a CMT that was started about eight years ago. It employs roughly 240 workers,
down from a peak of about 500 workers. It works exclusively for a design house that supplies
one of South Africa’s major retailers. The firm’s workers are all union members.
39 It is probable that when he talks of introducing piecework it is envisaged that it will be a system that does not
recognize a minimum wage. So he wants a system whereby faster workers will earn more but slower workers
could end up earning below the current minimum wage.

35
According to the owners there is very little room to negotiate prices with the design house. If
it is a relatively big order they might be able to squeeze a small increase in the price, because
not many of their competitors have the capacity to do big orders. But if the order is small they
are price takers. They do not know exactly what the design house’s mark-up is but they
believe that the retailer will usually sell a garment for double the cost price.
The firm pays 80% of the bargaining council wage rates. This, the owners allege, is in terms
of the agreement regarding non-compliant firms (see above). Previously they paid the
minimum wage and had an incentive scheme based on an hourly target, i.e. for every hour
that a worker hit the production target they would be paid a ZAR10 bonus. This meant a
worker could earn an extra ZAR90 per day if they hit the target consistently. However, they
have now introduced piecework, but only if the order is sufficiently large and the style
relatively simple. In such a case the owner will set a ‘fair piece rate’ and they will pay
according to the quantity produced, with the proviso that nobody will be paid below the 80%
minimum wage rate. The owner states that faster workers are able to earn up to ZAR900 per
week. It seems that slower workers tend to get weeded out of lines by pressure from faster
workers.
The preference for piecework clearly comes from the owner’s origins in China. Piecework,
according to him, accounts for much of China’s success: piecework was started in China in
1980, “and look where China is now”. He stated, with obvious approval, that in China you
get paid for what you do, and if you are absent from work you do not get paid and someone
takes your place on the line. By comparison, the approach in South Africa baffled him.
Workers in South Africa wanted to be paid for doing nothing, seemingly with the approval of
government. Again, the only solution is to pay by the piece.
(e) Analysis of the case studies
The approach to productivity is starkly different between the firms in Newcastle and those in
Cape Town. All the Cape Town firms (i.e. case studies 1, 2 and 3) are ‘full package’
manufacturers, have very close relations to one or other retailer, and are competing on a
number of factors in addition to price. The Cape Town firms are also participants in the Cape
Town Clothing Cluster and all appear to have benefitted significantly. The firms in Newcastle
are CMTs, do not deal directly with a retailer, compete only on price, and have a
management culture that sees workers as a cost rather than a resource. The fact that
employers are Taiwanese or Chinese and employees are African exacerbates the
adversarialism in their factories. The Cape Town firms have a chance of surviving the
challenge of cheap imports by exploiting their proximity to retailers and supplying smaller
orders on a quick response basis. The Newcastle firms appear to be surviving only because
they are able to exploit the confusion over the minimum wage to pay at 70% or 80% of the
Non-Metro Areas rate.
Five important points emerge from the case studies. First, the three firms in Cape Town either
retained jobs or created jobs while improving performance (including productivity), although
the number of jobs created is not large and the increase in jobs was much lower than the rise
in performance. One must nevertheless place this finding in the context of an industry that
has shed thousands of jobs over the last 10 to 15 years.

36
Second, the agreements reached at the NBCCI to incentivize productivity have failed. One of
the NBCCI’s schemes played a marginal role at one Cape Town firm and no role at the other
two firms. Instead, schemes initiated by management were critical for productivity
improvements. At two firms the schemes met little or no resistance from shop stewards and
the union, but at one firm shop stewards ended the management-initiated scheme in its third
year. The initial NBCCI scheme, not surprisingly, played little or no role at the Newcastle
firms, although later variations of the scheme might have been utilized because they created
loopholes for the payment of lower wages.
Third, successful productivity incentive schemes require management capability and
capacity. The managers in Newcastle firms do not appear to have either the capability or
capacity. Their approach to management appears to start from an assumption that employees
will work as hard and fast as they can for the firm, and will be satisfied with being paid a
wage the firm deems appropriate. When employees do not perform in line with this
expectation, managers become frustrated. Their resulting attempts at incentivizing workers
were crude. In fact, their view that piecework will be a panacea is founded on their inability
to effectively manage their staff to achieve better efficiencies. Payment by the piece would to
a large extent absolve them of responsibility for management of performance, passing this on
to workers themselves.
Fourth, the route to survival and job retention in the industry is to develop a quick response
relationship with retailers. This requires a much wider consideration of performance than just
productivity.
Fifth, the retail sector, through their intermediaries, is a key player in the Newcastle saga.
They present themselves as arms-length contractors for garments but in reality appear to be
deeply implicated in the low wages and poor working conditions prevalent in Newcastle. The
NBCCI, however, involves just clothing manufacturers and SACTWU. Unless the retail
sector is involved in the negotiation, in which some connection can be established between
wage rates and prices, the situation will continue.
6. Conclusion: Is there a need for a new approach to collective bargaining?
It was noted above that the major South African retailers have been the main beneficiaries of
trade liberalization (along with consumers) and the restructuring of the clothing value chain.
While the shrinking clothing sector has become ever more beholden to the local retailers,
whether in close quick-response relationships or supposedly arms-length relationships via
intermediaries, it has been the major clothing retailers that have made record profits.
CLOTHING RETAILER PROFITS BEFORE TAX (R’000) 2002 - 2005 2002 2003 Change 2004 Change 2005 Change
Edcon R 263 000 R 565 000 115% R 1 027 000 82% R 1 851 000 80%
Mr Price R 193 000 R 256 000 33% R 296 000 16% R 411 000 39%
Foschini R 283 000 R 513 000 81% R 753 000 47% R 1 141 000 52%
Truworths R 452 000 R 549 000 21% R 761 000 39% R 980 000 29%
Woolworths R 599 000 R 778 000 30% R 937 000 20% R 112 000 -88%
Average R 358 000 R 532 200 49% R 754 800 42% R 899 000 19%
Source: Etienne Vlok, The Textile and Clothing Industry in South Africa in: Herbert Jauch / Rudolf Traub-Merz (Eds.) The Future of the Textile and Clothing Industry in Sub-Saharan Africa Bonn: Friedrich-Ebert-Stiftung, 2006, p.240
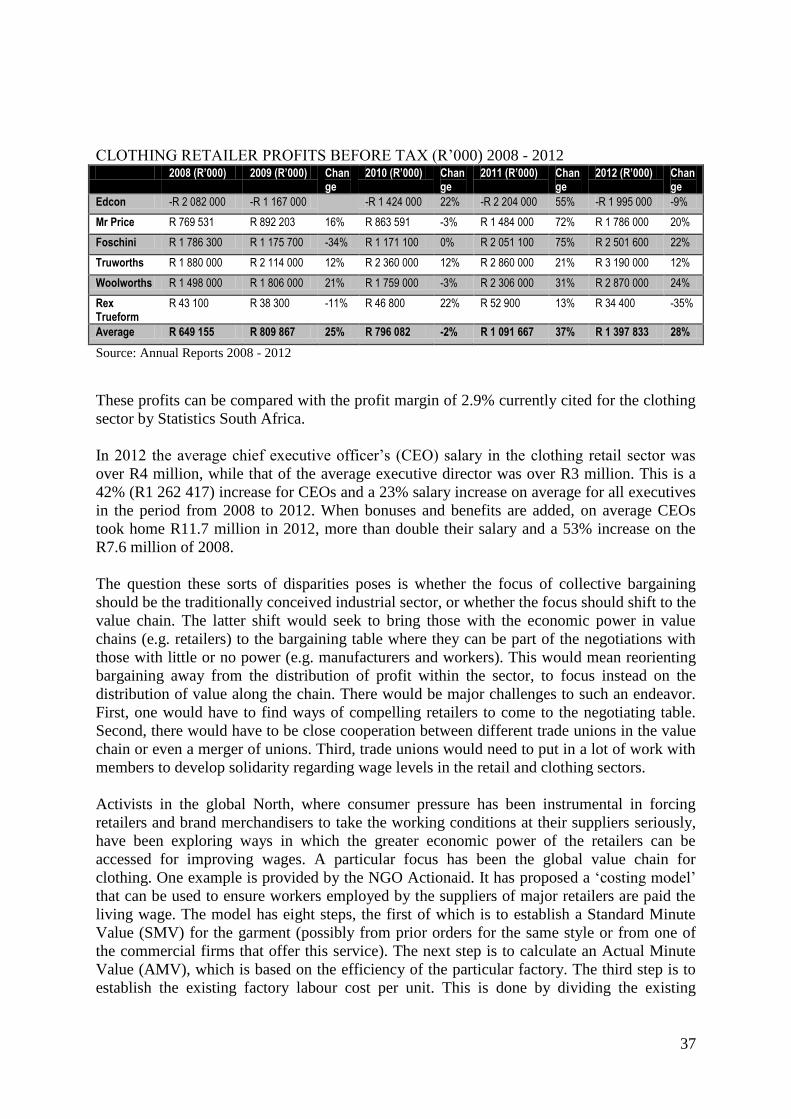
37
CLOTHING RETAILER PROFITS BEFORE TAX (R’000) 2008 - 2012 2008 (R’000) 2009 (R’000) Chan
ge 2010 (R’000) Chan
ge 2011 (R’000) Chan
ge 2012 (R’000) Chan
ge
Edcon -R 2 082 000 -R 1 167 000 -R 1 424 000 22% -R 2 204 000 55% -R 1 995 000 -9%
Mr Price R 769 531 R 892 203 16% R 863 591 -3% R 1 484 000 72% R 1 786 000 20%
Foschini R 1 786 300 R 1 175 700 -34% R 1 171 100 0% R 2 051 100 75% R 2 501 600 22%
Truworths R 1 880 000 R 2 114 000 12% R 2 360 000 12% R 2 860 000 21% R 3 190 000 12%
Woolworths R 1 498 000 R 1 806 000 21% R 1 759 000 -3% R 2 306 000 31% R 2 870 000 24%
Rex Trueform
R 43 100 R 38 300 -11% R 46 800 22% R 52 900 13% R 34 400 -35%
Average R 649 155 R 809 867 25% R 796 082 -2% R 1 091 667 37% R 1 397 833 28%
Source: Annual Reports 2008 - 2012
These profits can be compared with the profit margin of 2.9% currently cited for the clothing
sector by Statistics South Africa.
In 2012 the average chief executive officer’s (CEO) salary in the clothing retail sector was
over R4 million, while that of the average executive director was over R3 million. This is a
42% (R1 262 417) increase for CEOs and a 23% salary increase on average for all executives
in the period from 2008 to 2012. When bonuses and benefits are added, on average CEOs
took home R11.7 million in 2012, more than double their salary and a 53% increase on the
R7.6 million of 2008.
The question these sorts of disparities poses is whether the focus of collective bargaining
should be the traditionally conceived industrial sector, or whether the focus should shift to the
value chain. The latter shift would seek to bring those with the economic power in value
chains (e.g. retailers) to the bargaining table where they can be part of the negotiations with
those with little or no power (e.g. manufacturers and workers). This would mean reorienting
bargaining away from the distribution of profit within the sector, to focus instead on the
distribution of value along the chain. There would be major challenges to such an endeavor.
First, one would have to find ways of compelling retailers to come to the negotiating table.
Second, there would have to be close cooperation between different trade unions in the value
chain or even a merger of unions. Third, trade unions would need to put in a lot of work with
members to develop solidarity regarding wage levels in the retail and clothing sectors.
Activists in the global North, where consumer pressure has been instrumental in forcing
retailers and brand merchandisers to take the working conditions at their suppliers seriously,
have been exploring ways in which the greater economic power of the retailers can be
accessed for improving wages. A particular focus has been the global value chain for
clothing. One example is provided by the NGO Actionaid. It has proposed a ‘costing model’
that can be used to ensure workers employed by the suppliers of major retailers are paid the
living wage. The model has eight steps, the first of which is to establish a Standard Minute
Value (SMV) for the garment (possibly from prior orders for the same style or from one of
the commercial firms that offer this service). The next step is to calculate an Actual Minute
Value (AMV), which is based on the efficiency of the particular factory. The third step is to
establish the existing factory labour cost per unit. This is done by dividing the existing
38
weekly wage by the number the number of minutes in the working week, which gives a
minute value that is multiplied by the AMV to give a unit value.
The next step might mean consultations with unions. The step requires that a local living
wages is calculated. In the case of Asian countries the Asia Floor wage is a widely accepted
minimum living wage. The fifth step involves establishing the living wage rate per unit:
divide the living wage by the number of minutes in a week and multiply by the AMV. The
next step is to multiply the living wage unit labour cost by the number of units in the order.
The contract between the buyer and manufacturer must then stipulate that the additional
living wage amount will be paid as part of the total payment, but it is ring-fenced. The
manufacturer must notify workers of this amount, transfer the amount to the workers in a way
they agree to (and which is verifiable). The final step is to use this mechanism to encourage
workers to organise so that they can negotiate with management as to how the living wage
component is distributed.
Although this scheme clearly has clothing manufacture in Asian countries in mind, the
principles could easily be applied to South Africa, with the living wage being replaced by the
bargaining council minimum wage. Of course, retailers in South Africa would strongly resist
such a scheme and no leverage currently exists to force them into it. It is very unlikely that
consumers in South Africa will exert pressure on retailers in the way consumers in the global
North have done.
References
Actionaid. 2011. Eight steps towards a living wage: A costing model for clothing brands and
retailers. www.actionaid.org.uk
Anner M and J Bair and J Blasi. 2013. ‘Toward joint liability in global supply chains:
Addressing the root causes of labor violations in international subcontracting networks’.
Comarative Labor Law and Policy Journal, Vol. 35.
Bhorat H and P Lundall. 2002. Employment, Wages and Skills Development: Firm specific
effects – Evidence from Two Firm Surveys in South Africa. DPRU Working Paper No.
02/68, Development Policy Research Unit, University of Cape Town.
Business Times (Sunday Times). ‘Outgoing Truworths CEO cashes in R115m’. 31 August
2014.
Du Toit D and D Bosch, D Woolfrey, S Godfrey, C Cooper, GS Giles, C Bosch and J
Rossouw. 2006. Labour Relations Law: A Comprehensive Guide. LexisNexis Butterworths:
Durban.
Financial Mail. ‘Working, but still poor’. 4 October 2012.
Flanagan M. 2013. ‘The Flanarant: Unpicking the productivity myth’. Just Style.
Godfrey S. 2013. A study changes and continuities in the organization and regulation of work
with an empirical examination of the South African and Lesotho clothing/retail value chain.

39
Thesis submitted for the degree of Doctor of Philosophy, Department of Sociology,
University of Cape Town.
Hart G. 2002. Disabling Globalization: Places of Power in Post-Apartheid South Africa.
University of Natal Press: Pietermaritzburg.
Leibbrandt M and I Woolard, A Finn and J Argent. 2010. Trends in South African income
distribution and poverty since the fall of Apartheid. OECD Social, Employment and
Migration Working Papers No. 101 (January).
Mail & Guardian. ‘Productivity is our best currency’. September 10 to 16 2010.
Mail & Guardian. ‘As they sew so shall they reap’. November 2 to 8 2012.
Malikane C. 2013. ‘Productivity Myths and Realities’. Progressive Economics Network,
Economic Bulletin No 1. Alternative Information Development Centre: Cape Town.
Mead WR. 1990. The Low-Wage Challenge to Global Growth. Economic Policy Institute:
Washington.
Morris M and L Reed. 2008. A Sectoral Analysis of Skills Gaps and Shortages in the
Clothing and Textile Industry in South Africa. Report for the Human Sciences Research
Council: Pretoria.
Nathan Associates Inc. and Werner International. 2007. Factory-Level Value Chain Analysis
of Cambodia’s Apparel Industry. USAID.
Nathan Associates Inc. 2009. Cost Competitiveness of Pakistan’s Textiles and Apparel
Industry. USAID
National Productivity Institute. Productivity Statistics: 2005. National Productivity Institute:
Midrand.
O’Rourke Group Partners, LLC. 2011. Benchmarking the Competitiveness of Nicaragua’s
Apparel Industry. PRONicaragua.
Productivity SA. 2010. Productivity Statistics 2010. Productivity SA: Midrand.
Reddy N. 2013. ‘Real Wages and Labour’s Revolt’. Progressive Economics Network,
Economic Bulletin No 1. Alternative Information Development Centre: Cape Town.
Rudin J. 2013. ‘Productivity fallacy promoted by the media’. Progressive Economics
Network, Economic Bulletin No 1. Alternative Information Development Centre: Cape
Town.
Seekings J and N Nattrass. 2013. Job destruction in the South African Clothing Industry:
How an alliance of organized labour, the state and some firms is undermining labour-
intensive growth. CDE Focus. Centre for Development and Enterprise: Johannesburg.
40
Skinner Wickham. 1986. ‘The productivity paradox’. Harvard Business Review (July-
August)
Statistics South Africa, Quarterly Labour Force Survey, Quarter 2, 2014 (Statistical release
P0211).
Sunday Independent. ‘Walmart Gaps it on safety’. 2013.
Vlok E. 2006. ‘The textile and clothing industry in South Africa’ in H Jauch and R Traub-
Merz The Future of the Textile and Clothing Industry in Sub-Saharan Africa. Friedrich-
Ebert-Stiftung: Bonn.
Worker Rights Consortium. 2013. Global Wage Trends for Apparel Workers, 2001-2011.
www.americanprogress.org